UNITED STATES
SECURITIES AND EXCHANGE COMMISSION
Washington, D.C. 20549
FORMN-CSR
CERTIFIED SHAREHOLDER REPORT OF
REGISTERED MANAGEMENT INVESTMENT COMPANIES
Investment Company Act file number811-03732
MFS VARIABLE INSURANCE TRUST II
(Exact name of registrant as specified in charter)
111 Huntington Avenue, Boston, Massachusetts 02199
(Address of principal executive offices) (Zip code)
Christopher R. Bohane
Massachusetts Financial Services Company
111 Huntington Avenue
Boston, Massachusetts 02199
(Name and address of agents for service)
Registrant’s telephone number, including area code: (617)954-5000
Date of fiscal year end: December 31
Date of reporting period: December 31, 2019
Effective June 1, 2019, MFS International Value Portfolio, a series of the Registrant, was redesignated MFS International Intrinsic Value Portfolio.
| ITEM 1. | REPORTS TO STOCKHOLDERS. |
Annual Report
December 31, 2019

MFS® Blended Research® Core Equity Portfolio

MFS® Variable Insurance Trust II
Beginning on January 1, 2021, as permitted by regulations adopted by the U.S. Securities and Exchange Commission, the insurance company that offers your contract may determine that it will no longer send you paper copies of the fund’s annual and semiannual shareholder reports unless you specifically request paper copies from the insurance company or from your financial intermediary. Instead, the shareholder reports will be made available on a Web site (insurancefunds.mfs.com or other Web site of which you will be notified), and the insurance company will notify you by mail each time a report is posted and provide you with a Web site link to access the report. Instructions for requesting paper copies will be provided by your insurance company or financial intermediary.
If you already elected to receive shareholder reports by email, you will not be affected by this change and you need not take any action. If your insurance company or financial intermediary offers electronic delivery, you may elect to receive shareholder reports and other communications from the insurance company or financial intermediary by email by following the instructions provided by the insurance company or financial intermediary.
Beginning on January 1, 2019, you may elect to receive all future reports in paper free of charge from the insurance company or financial intermediary. You can inform the insurance company or financial intermediary that you wish to continue receiving paper copies of your shareholder reports by contacting your insurance company or financial intermediary. Your election to receive reports in paper will apply to all funds held in your account with your insurance company or financial intermediary.
CGS-ANN
MFS® Blended Research® Core Equity Portfolio
CONTENTS
The report is prepared for the general information of contract owners. It is authorized for distribution to prospective investors only when preceded or accompanied by a current prospectus.
NOT FDIC INSURED• MAY LOSE VALUE• NO BANK OR CREDIT UNION GUARANTEE• NOT A DEPOSIT• NOT INSURED BY ANY FEDERAL GOVERNMENT AGENCY OR NCUA/NCUSIF
MFS Blended Research Core Equity Portfolio
LETTER FROM THE EXECUTIVE CHAIR

Dear Contract Owners:
Slowing global growth, low inflation, and trade friction between the United States and China have been hallmarks of the past 12 months. After experiencing an uptick in market volatility in late 2018, markets steadied for most of 2019, thanks in large measure to the adoption of a dovish policy stance on the part of global central banks, focused on supporting economic growth. Negotiations aimed at a “phase one” trade deal between the U.S. and China bore fruit at the end of the period, boosting investor sentiment, while signs of stability emerging from the global manufacturing sector also lifted spirits. Uncertainty over Brexit, along with the ripple effects from the trade conflict, hampered business confidence and investment in the United Kingdom and Europe for much of the period, though investors expect greater clarity regarding Brexit as a result of December’s general election. The pro-Brexit Conservative Party won the election by a comfortable margin and set the stage for the U.K.’s departure from the EU at the end of January.
Markets expect the longest economic expansion in U.S. history will continue, albeit at a slower pace, as trade tensions recede. In an effort to prolong the expansion, the U.S. Federal Reserve lowered interest rates three times between July and October and the European Central Bank loosened policy in September. While the global monetary policy backdrop remains quite accommodative, signs of easing trade tensions and fading global recession fears led to improved market sentiment in late 2019 as investors grew less risk averse. In early 2020, an outbreak of coronavirus emanating from China reintroduced global growth fears, causing an uptick in volatility.
Here at MFS®, we aim to help our clients navigate the growing complexity of the markets and world economies. Our long-term investment philosophy and commitment to the responsible allocation of capital allow us to tune out the noise and uncover what we believe are the best, most durable investment opportunities in the market. Through our powerful global investment platform, we combine collective expertise, thoughtful risk management and long-term discipline to create sustainable value for investors.
Respectfully,

Robert J. Manning
Executive Chair
MFS Investment Management
February 14, 2020
The opinions expressed in this letter are subject to change and may not be relied upon for investment advice. No forecasts can be guaranteed.
1
MFS Blended Research Core Equity Portfolio
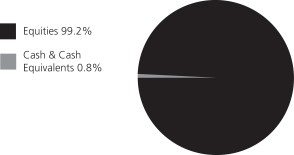
PORTFOLIO COMPOSITION
Portfolio structure
| | | | |
| Top ten holdings | | | | |
| Microsoft Corp. | | | 6.2% | |
| Apple, Inc. | | | 5.8% | |
| Johnson & Johnson | | | 2.8% | |
| Intel Corp. | | | 2.3% | |
| Mastercard, Inc., “A” | | | 2.3% | |
| Bank of America Corp. | | | 2.2% | |
| Facebook, Inc., “A” | | | 2.2% | |
| Alphabet, Inc., “A” | | | 2.2% | |
| Comcast Corp., “A” | | | 2.1% | |
| Citigroup, Inc. | | | 2.1% | |
| | | | |
| Equity sectors (k) | | | | |
| Technology | | | 29.2% | |
| Financial Services | | | 18.8% | |
| Health Care | | | 11.3% | |
| Consumer Staples | | | 6.1% | |
| Retailing | | | 5.3% | |
| Industrial Goods & Services | | | 5.1% | |
| Leisure | | | 4.9% | |
| Special Products & Services | | | 4.4% | |
| Utilities | | | 3.8% | |
| Energy | | | 3.3% | |
| Basic Materials | | | 2.2% | |
| Transportation | | | 2.0% | |
| Autos & Housing | | | 1.8% | |
| Communications | | | 1.0% | |
| (k) | The sectors set forth above and the associated portfolio composition are based on MFS’ own custom sector classification methodology. |
Cash & Cash Equivalents includes any cash, investments in money market funds, short-term securities, and other assets less liabilities. Please see the Statement of Assets and Liabilities for additional information related to the fund’s cash position and other assets and liabilities.
Percentages are based on net assets as of December 31, 2019.
The portfolio is actively managed and current holdings may be different.
2
MFS Blended Research Core Equity Portfolio
MANAGEMENT REVIEW
Summary of Results
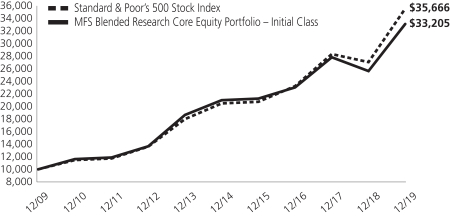
For the twelve months ended December 31, 2019, Initial Class shares of the MFS Blended Research Core Equity Portfolio (fund) provided a total return of 29.17%, while Service Class shares of the fund provided a total return of 28.87%. These compare with a return of 31.49% over the same period for the fund’s benchmark, the Standard & Poor’s 500 Stock Index (S&P 500 Index).
Market Environment
Fading fears of a near-term global recession, the announcement of a partial trade deal between the United States and China and the decline in uncertainty over Brexit helped bolster market sentiment late in the period. Changes in market sentiment, largely driven by uncertainty over the outcome of trade negotiations between the US and China, had contributed to periodic bouts of volatility during the reporting period. The global economy decelerated, led by weakness in China and Europe, although the pace of the slowdown moderated late in the period amid nascent signs of stabilization in the manufacturing sector.
The deteriorating global growth backdrop, along with declining inflationary pressures, prompted the US Federal Reserve to adopt a more dovish posture beginning in early 2019, resulting in the first interest rate cut in over a decade at the end of July, followed by additional cuts in September and October. The Fed’s actions led to a sharp decline in long-term interest rates during the period’s second half, causing the inversion of portions of the US Treasury yield curve for a time. Amid an improvement in risk sentiment in Q4 2019 and indications of a bottoming in growth and a potential upturn in activity, the Fed indicated in October that further rate cuts were unlikely unless the outlook for the economy materially worsened.
Globally, central banks have tilted more dovish as well, with the European Central Bank unveiling a package of easing measures, which included putting overnight rates deeper into negative territory, restarting its bond-buying program and lengthening the term of cheap loans to banks to three years from two. The central banks of India and Australia are among those that have cut rates several times in recent months, although China has been more cautious in increasing liquidity as it keeps trying to deleverage its economy, cutting rates only marginally.
Emerging markets experienced considerable volatility through the end of 2018, as tighter global financial conditions exposed structural weakness in some countries. Those conditions improved in 2019 as the Fed became more dovish. Notwithstanding the periodic headwinds on market sentiment from significant trade friction between the US and China over much of the year, emerging market hard currency debt and local rates benefited from relatively cheap valuations at the beginning of the period and easier global monetary conditions. These factors, plus the fading of certain global risk factors mentioned above, hastened spread tightening in the latter part of the period. At the same time, idiosyncratic risks spiked in some countries (e.g., Argentina and Lebanon), contributing to increased dispersion in performance among sovereign assets.
Detractors from Performance
Stock selection within both thehealth careandutilitiessectors detracted from performance relative to the S&P 500 Index. Within thehealth caresector, the fund’s overweight position in drug store operator Walgreens Boots Alliance (h), biotechnology company Biogen, and the timing of the fund’s ownership in shares of global pharmaceutical company Bristol-Myers Squibb and drugstore retailer CVS Health (h), held back relative returns. The share price of Walgreens Boots Alliance declined as concerns over lower prescription reimbursements, slower cost deflation of generic drugs and a weaker flu season appeared to have weighed on investor sentiment and resulted in management’s lower full-year guidance outlook. Within theutilitiessector, overweight positions in utility services provider Exelon and power generation company NRG Energy further weakened relative results. Shares of Exelon were largely flat during the period, with early price gains more than offset by weaker-than-expected natural gas prices, mild weather, especially in Texas, and the risk of import tariffs on uranium. Additionally, two of the firm’s senior executives resigned amid an ongoing federal investigation into potential corruption involving Illinois lobbying activities, which further pressured the stock price.
Elsewhere, the fund’s overweight positions in information technology company DXC Technology (h), brewery company Molson Coors Brewing and energy exploration and production company EOG Resources negatively affected relative performance. The share price of DXC Technology fell after the company reported disappointing earnings results and full-year guidance, as clients transitioned to the cloud at a faster rate than anticipated, which put pressure on its legacy IT business. An uncertain macroeconomic environment and foreign exchange headwinds also added to the stock price weakness. Additionally, the timing of the fund’s ownership in shares of storage facility operator Public Storage (h) also detracted from relative results.
Contributors to Performance
Stock selection in theretailing sector contributed to relative performance, led by the fund’s overweight position in retail giant Target. The share price of Target appreciated on the back of solid comparable-store sales and margin expansion. Gross margins expanded due to merchandising incentives and changes in product mix. Additionally, management raised its full-year 2019 guidance more than expected, which further supported the stock price.
3
MFS Blended Research Core Equity Portfolio
Management Review – continued
A combination of security selection and an underweight position in theenergy sector also boosted relative results. Here, the fund’s underweight position in integrated oil and gas company Exxon Mobil helped relative returns. Shares of Exxon, along with other energy companies, depreciated during the period as its net income lagged consensus expectations, owing to weakness in the company’s Downstream segment. Earnings in Exxon’s Chemicals segment were also lower than expected, due to lower margins, foreign exchange headwinds and higher expenses. Exxon’s management guided for continued narrow crude differentials, ongoing heavy maintenance requirements and continuing pressure on its chemicals margins, which further weakened the stock price.
In other sectors, the fund’s overweight positions in semiconductor and electronics engineering solutions provider Applied Materials, software giant Microsoft, information technology firm Leidos Holdings, food producer Tyson Foods (h), direct banking and payment services provider Discover Financial Services and diversified financial services firm Citigroup, boosted relative results. The share price of Applied Materials exhibited consistent progression during the period, owing to better-than-expected revenue growth in its semiconductor and services segments and strong demand for NAND flash memory. Additionally, an underweight position in insurance and investment firm Berkshire Hathaway, and not owning shares of pharmaceutical company Abbvie, also contributed to the fund’s relative performance. Despite positive absolute performance, the share price of Berkshire Hathaway lagged the benchmark during the period. Although the company’s results were broadly in line with market expectations, investors appeared to have responded negatively to Warren Buffet’s comment that the company was unlikely to make a significant acquisition during 2019, given current valuations for good businesses.
Respectfully,
Portfolio Manager(s)
Jim Fallon, Matt Krummell, Jonathan Sage, and Jed Stocks
| (h) | Security was not held in the portfolio at period end. |
The views expressed in this report are those of the portfolio manager(s) only through the end of the period of the report as stated on the cover and do not necessarily reflect the views of MFS or any other person in the MFS organization. These views are subject to change at any time based on market or other conditions, and MFS disclaims any responsibility to update such views. These views may not be relied upon as investment advice or an indication of trading intent on behalf of any MFS portfolio. References to specific securities are not recommendations of such securities, and may not be representative of any MFS portfolio’s current or future investments.
4
MFS Blended Research Core Equity Portfolio
PERFORMANCE SUMMARY THROUGH 12/31/19
The following chart illustrates the historical performance of the fund in comparison to its benchmark(s). Benchmarks are unmanaged and may not be invested in directly. Benchmark returns do not reflect any fees or expenses. The performance of other share classes will be greater than or less than that of the class depicted below. (See Notes to Performance Summary.)
Performance data shown represents past performance and is no guarantee of future results. Investment return and principal value fluctuate so your units, when sold, may be worth more or less than the original cost; current performance may be lower or higher than quoted. The performance shown does not reflect the deduction of taxes, if any, that a contract holder would pay on fund distributions or the redemption of contract units. The returns for the fund shown also do not reflect the deduction of expenses associated with variable products, such as mortality and expense risk charges, separate account charges, and sales charges imposed by the insurance company separate accounts. Such expenses would reduce the overall returns shown.
Growth of a Hypothetical $10,000 Investment
Total Returns through 12/31/19
Average annual total returns
| | | | | | | | | | | | |
| | | Share Class | | Class Inception Date | | 1-yr | | 5-yr | | 10-yr | | |
| | | Initial Class | | 11/14/86 | | 29.17% | | 9.56% | | 12.75% | | |
| | | Service Class | | 8/24/01 | | 28.87% | | 9.28% | | 12.47% | | |
| | | | |
| Comparative benchmark(s) | | | | | | | | |
| | | Standard & Poor’s 500 Stock Index (f) | | 31.49% | | 11.70% | | 13.56% | | |
| (f) | Source: FactSet Research Systems Inc. |
Benchmark Definition(s)
Standard & Poor’s 500 Stock Index – a market capitalization-weighted index of 500 widely held equity securities, designed to measure broad U.S. equity performance. “Standard & Poor’s®” and “S&P®” are registered trademarks of Standard & Poor’s Financial Services LLC (“S&P”) and Dow Jones is a registered trademark of Dow Jones Trademark Holdings LLC (“Dow Jones”) and have been licensed for use by S&P Dow Jones Indices LLC and sublicensed for certain purposes by Massachusetts Financial Services Company. The S&P 500® is a product of S&P Dow Jones Indices LLC, and has been licensed for use by Massachusetts Financial Services Company. Massachusetts Financial Services Company’s product(s) is not sponsored, endorsed, sold, or promoted by S&P Dow Jones Indices LLC, Dow Jones, S&P, or their respective affiliates, and neither S&P Dow Jones Indices LLC, Dow Jones, S&P, nor their respective affiliates make any representation regarding the advisability of investing in such product(s).
It is not possible to invest directly in an index.
Notes to Performance Summary
Average annual total return represents the average annual change in value for each share class for the periods presented.
Performance results reflect any applicable expense subsidies and waivers in effect during the periods shown. Without such subsidies and waivers the fund’s performance results would be less favorable. Please see the prospectus and financial statements for complete details. All results are historical and assume the reinvestment of any dividends and capital gains distributions.
5
MFS Blended Research Core Equity Portfolio
Performance Summary – continued
Performance results do not include adjustments made for financial reporting purposes in accordance with U.S. generally accepted accounting principles and may differ from amounts reported in the financial highlights.
From time to time the fund may receive proceeds from litigation settlements, without which performance would be lower.
6
MFS Blended Research Core Equity Portfolio
EXPENSE TABLE
Fund Expenses Borne by the Contract Holders during the Period,
July 1, 2019 through December 31, 2019
As a contract holder of the fund, you incur ongoing costs, including management fees; distribution and/or service(12b-1) fees; and other fund expenses. This example is intended to help you understand your ongoing costs (in dollars) of investing in the fund and to compare these costs with the ongoing costs of investing in other mutual funds.
The example is based on an investment of $1,000 invested at the beginning of the period and held for the entire period July 1, 2019 through December 31, 2019.
Actual Expenses
The first line for each share class in the following table provides information about actual account values and actual expenses. You may use the information in this line, together with the amount you invested, to estimate the expenses that you paid over the period. Simply divide your account value by $1,000 (for example, an $8,600 account value divided by $1,000 = 8.6), then multiply the result by the number in the first line under the heading entitled “Expenses Paid During Period” to estimate the expenses you paid on your account during this period.
Hypothetical Example for Comparison Purposes
The second line for each share class in the following table provides information about hypothetical account values and hypothetical expenses based on the fund’s actual expense ratio and an assumed rate of return of 5% per year before expenses, which is not the fund’s actual return. The hypothetical account values and expenses may not be used to estimate the actual ending account balance or expenses you paid for the period. You may use this information to compare the ongoing costs of investing in the fund and other funds. To do so, compare this 5% hypothetical example with the 5% hypothetical examples that appear in the shareholder reports of the other funds.
Please note that the expenses shown in the table are meant to highlight the fund’s ongoing costs only and do not take into account the fees and expenses imposed under the variable contracts through which your investment in the fund is made. Therefore, the second line for each share class in the table is useful in comparing ongoing costs associated with an investment in vehicles (such as the fund) which fund benefits under variable annuity and variable life insurance contracts and to qualified pension and retirement plans only, and will not help you determine the relative total costs of investing in the fund through variable annuity and variable life insurance contracts. If the fees and expenses imposed under the variable contracts were included, your costs would have been
higher.
| | | | | | | | | | | | | | | | | | |
| Share Class | | | | Annualized
Expense Ratio | | | Beginning
Account Value
7/01/19 | | | Ending Account Value
12/31/19 | | | Expenses Paid
During Period (p)
7/01/19-12/31/19 | |
| Initial Class | | Actual | | | 0.43% | | | | $1,000.00 | | | | $1,115.83 | | | | $2.29 | |
| | Hypothetical (h) | | | 0.43% | | | | $1,000.00 | | | | $1,023.04 | | | | $2.19 | |
| Service Class | | Actual | | | 0.68% | | | | $1,000.00 | | | | $1,114.38 | | | | $3.62 | |
| | Hypothetical (h) | | | 0.68% | | | | $1,000.00 | | | | $1,021.78 | | | | $3.47 | |
| (h) | 5% class return per year before expenses. |
| (p) | “Expenses Paid During Period” are equal to each class’s annualized expense ratio, as shown above, multiplied by the average account value over the period, multiplied by 184/365 (to reflect theone-half year period). |
7
MFS Blended Research Core Equity Portfolio
PORTFOLIO OF INVESTMENTS – 12/31/19
The Portfolio of Investments is a complete list of all securities owned by your fund. It is categorized by broad-based asset classes.
| | | | | | | | |
| | |
| Issuer | | Shares/Par | | | Value ($) | |
| COMMON STOCKS – 99.2% | | | | | | | | |
| Aerospace – 4.7% | | | | | | | | |
| Honeywell International, Inc. | | | 38,781 | | | $ | 6,864,237 | |
| Huntington Ingalls Industries, Inc. | | | 7,525 | | | | 1,887,872 | |
| L3Harris Technologies, Inc. | | | 31,806 | | | | 6,293,453 | |
| Leidos Holdings, Inc. | | | 67,130 | | | | 6,571,356 | |
| Lockheed Martin Corp. | | | 1,141 | | | | 444,282 | |
| | | | | | | | |
| | | | | | $ | 22,061,200 | |
| | | | | | | | |
| Airlines – 0.1% | | | | | |
| Delta Air Lines, Inc. | | | 9,182 | | | $ | 536,963 | |
| | | | | | | | |
| Alcoholic Beverages – 1.0% | | | | | |
| Molson Coors Brewing Co. | | | 87,350 | | | $ | 4,708,165 | |
| | | | | | | | |
| Apparel Manufacturers – 0.2% | | | | | |
| NIKE, Inc., “B” | | | 11,329 | | | $ | 1,147,741 | |
| | | | | | | | |
| Automotive – 1.9% | | | | | |
| Copart, Inc. (a) | | | 44,262 | | | $ | 4,025,186 | |
| Lear Corp. | | | 35,934 | | | | 4,930,145 | |
| | | | | | | | |
| | | | | | $ | 8,955,331 | |
| | | | | | | | |
| Biotechnology – 1.4% | | | | | |
| Biogen, Inc. (a) | | | 19,456 | | | $ | 5,773,179 | |
| Incyte Corp. (a) | | | 7,840 | | | | 684,589 | |
| | | | | | | | |
| | | | | | $ | 6,457,768 | |
| | | | | | | | |
| Business Services – 3.9% | | | | | |
| Fidelity National Information Services, Inc. | | | 48,138 | | | $ | 6,695,515 | |
| Fiserv, Inc. (a) | | | 61,330 | | | | 7,091,588 | |
| FleetCor Technologies, Inc. (a) | | | 1,489 | | | | 428,415 | |
| Global Payments, Inc. | | | 22,520 | | | | 4,111,251 | |
| | | | | | | | |
| | | | | | $ | 18,326,769 | |
| | | | | | | | |
| Cable TV – 2.9% | | | | | |
| Charter Communications, Inc., “A” (a) | | | 7,826 | | | $ | 3,796,236 | |
| Comcast Corp., “A” | | | 223,356 | | | | 10,044,319 | |
| | | | | | | | |
| | | | | | $ | 13,840,555 | |
| | | | | | | | |
| Chemicals – 0.9% | | | | | |
| CF Industries Holdings, Inc. | | | 9,466 | | | $ | 451,907 | |
| Eastman Chemical Co. | | | 46,373 | | | | 3,675,524 | |
| | | | | | | | |
| | | | | | $ | 4,127,431 | |
| | | | | | | | |
| Computer Software – 6.9% | | | | | |
| Adobe Systems, Inc. (a) | | | 4,552 | | | $ | 1,501,295 | |
| Microsoft Corp. | | | 185,184 | | | | 29,203,517 | |
| Veeva Systems, Inc. (a) | | | 14,052 | | | | 1,976,554 | |
| | | | | | | | |
| | | | | | $ | 32,681,366 | |
| | | | | | | | |
| Computer Software – Systems – 5.8% | |
| Apple, Inc. | | | 93,572 | | | $ | 27,477,418 | |
| | | | | | | | |
| Construction – 1.1% | | | | | |
| Mid-America Apartment Communities, Inc., | | | | | | | | |
| REIT | | | 19,712 | | | $ | 2,599,225 | |
| Toll Brothers, Inc. | | | 60,730 | | | | 2,399,442 | |
| | | | | | | | |
| | | | | | $ | 4,998,667 | |
| | | | | | | | |
| | | | | | | | |
| | |
Issuer | | Shares/Par | | | Value ($) | |
| COMMON STOCKS – continued | | | | | |
| Consumer Products – 1.2% | | | | | |
| Kimberly-Clark Corp. | | | 36,655 | | | $ | 5,041,895 | |
| Procter & Gamble Co. | | | 2,990 | | | | 373,451 | |
| | | | | | | | |
| | | | | | $ | 5,415,346 | |
| | | | | | | | |
| Electrical Equipment – 0.3% | | | | | | | | |
| AMETEK, Inc. | | | 13,308 | | | $ | 1,327,340 | |
| | | | | | | | |
| Electronics – 3.9% | | | | | |
| Applied Materials, Inc. | | | 123,419 | | | $ | 7,533,496 | |
| Intel Corp. | | | 184,242 | | | | 11,026,883 | |
| | | | | | | | |
| | | | | | $ | 18,560,379 | |
| | | | | | | | |
| Energy – Independent – 3.4% | | | | | |
| EOG Resources, Inc. | | | 53,433 | | | $ | 4,475,548 | |
| Phillips 66 | | | 28,199 | | | | 3,141,651 | |
| Pioneer Natural Resources Co. | | | 4,098 | | | | 620,314 | |
| Valero Energy Corp. | | | 68,034 | | | | 6,371,384 | |
| WPX Energy, Inc. (a) | | | 117,169 | | | | 1,609,902 | |
| | | | | | | | |
| | | | | | $ | 16,218,799 | |
| | | | | | | | |
| Energy – Integrated – 0.2% | | | | | |
| Exxon Mobil Corp. | | | 14,009 | | | $ | 977,548 | |
| | | | | | | | |
| Food & Beverages – 2.1% | | | | | | | | |
| Ingredion, Inc. | | | 23,463 | | | $ | 2,180,886 | |
| PepsiCo, Inc. | | | 58,150 | | | | 7,947,360 | |
| | | | | | | | |
| | | | | | $ | 10,128,246 | |
| | | | | | | | |
| General Merchandise – 1.2% | | | | | |
| Dollar General Corp. | | | 37,538 | | | $ | 5,855,177 | |
| | | | | | | | |
| Insurance – 3.9% | | | | | |
| Allstate Corp. | | | 19,701 | | | $ | 2,215,377 | |
| Berkshire Hathaway, Inc., “B” (a) | | | 13,759 | | | | 3,116,413 | |
| Hartford Financial Services Group, Inc. | | | 31,197 | | | | 1,895,842 | |
| MetLife, Inc. | | | 126,013 | | | | 6,422,883 | |
| Prudential Financial, Inc. | | | 51,393 | | | | 4,817,580 | |
| | | | | | | | |
| | | | | | $ | 18,468,095 | |
| | | | | | | | |
| Internet – 6.5% | | | | | | | | |
| Alphabet, Inc., “A” (a) | | | 7,598 | | | $ | 10,176,685 | |
| Alphabet, Inc., “C” (a) | | | 7,282 | | | | 9,736,180 | |
| Facebook, Inc., “A” (a) | | | 51,516 | | | | 10,573,659 | |
| | | | | | | | |
| | | | | | $ | 30,486,524 | |
| | | | | | | | |
| Leisure & Toys – 1.7% | | | | | | | | |
| Electronic Arts, Inc. (a) | | | 17,367 | | | $ | 1,867,126 | |
| Take-Two Interactive Software, Inc. (a) | | | 49,113 | | | | 6,012,905 | |
| | | | | | | | |
| | | | | | $ | 7,880,031 | |
| | | | | | | | |
| Machinery & Tools – 3.5% | | | | | | | | |
| AGCO Corp. | | | 66,146 | | | $ | 5,109,779 | |
| Cummins, Inc. | | | 15,522 | | | | 2,777,817 | |
| Dover Corp. | | | 4,086 | | | | 470,952 | |
| Eaton Corp. PLC | | | 75,307 | | | | 7,133,079 | |
8
MFS Blended Research Core Equity Portfolio
Portfolio of Investments – continued
| | | | | | | | |
| | |
| Issuer | | Shares/Par | | | Value ($) | |
| COMMON STOCKS – continued | | | | | |
| Machinery & Tools – continued | | | | | | | | |
| Ingersoll-Rand Co. PLC, “A” | | | 6,501 | | | $ | 864,113 | |
| | | | | | | | |
| | | | | | $ | 16,355,740 | |
| | | | | | | | |
| Major Banks – 4.6% | | | | | | | | |
| Bank of America Corp. | | | 300,872 | | | $ | 10,596,712 | |
| Comerica, Inc. | | | 19,155 | | | | 1,374,371 | |
| JPMorgan Chase & Co. | | | 18,723 | | | | 2,609,986 | |
| Morgan Stanley | | | 106,598 | | | | 5,449,290 | |
| Wells Fargo & Co. | | | 31,497 | | | | 1,694,539 | |
| | | | | | | | |
| | | | | | $ | 21,724,898 | |
| | | | | | | | |
| Medical & Health Technology & Services – 2.8% | |
| HCA Healthcare, Inc. | | | 47,788 | | | $ | 7,063,544 | |
| McKesson Corp. | | | 43,817 | | | | 6,060,768 | |
| | | | | | | | |
| | | | | | $ | 13,124,312 | |
| | | | | | | | |
| Medical Equipment – 2.6% | | | | | |
| Boston Scientific Corp. (a) | | | 63,747 | | | $ | 2,882,639 | |
| Medtronic PLC | | | 82,028 | | | | 9,306,077 | |
| | | | | | | | |
| | | | | | $ | 12,188,716 | |
| | | | | | | | |
| Other Banks & Diversified Financials – 6.2% | |
| Citigroup, Inc. | | | 124,165 | | | $ | 9,919,542 | |
| Discover Financial Services | | | 34,149 | | | | 2,896,518 | |
| Mastercard, Inc., “A” | | | 35,979 | | | | 10,742,970 | |
| Synchrony Financial | | | 135,744 | | | | 4,888,141 | |
| Visa, Inc., “A” | | | 3,699 | | | | 695,042 | |
| | | | | | | | |
| | | | | | $ | 29,142,213 | |
| | | | | | | | |
| Pharmaceuticals – 6.3% | | | | | |
| Bristol-Myers Squibb Co. | | | 7,286 | | | $ | 467,689 | |
| Eli Lilly & Co. | | | 59,847 | | | | 7,865,691 | |
| Johnson & Johnson | | | 89,106 | | | | 12,997,892 | |
| Pfizer, Inc. | | | 214,693 | | | | 8,411,672 | |
| | | | | | | | |
| | | | | | $ | 29,742,944 | |
| | | | | | | | |
| Railroad & Shipping – 1.7% | | | | | |
| Union Pacific Corp. | | | 45,081 | | | $ | 8,150,194 | |
| | | | | | | | |
| Real Estate – 1.4% | | | | | | | | |
| Medical Properties Trust, Inc., REIT | | | 44,970 | | | $ | 949,317 | |
| STORE Capital Corp., REIT | | | 154,598 | | | | 5,757,229 | |
| | | | | | | | |
| | | | | | $ | 6,706,546 | |
| | | | | | | | |
| Restaurants – 1.9% | | | | | |
| Chipotle Mexican Grill, Inc., “A” (a) | | | 2,710 | | | $ | 2,268,568 | |
| Starbucks Corp. | | | 77,327 | | | | 6,798,590 | |
| | | | | | | | |
| | | | | | $ | 9,067,158 | |
| | | | | | | | |
| Specialty Chemicals – 0.2% | | | | | | | | |
| DuPont de Nemours, Inc. | | | 14,321 | | | $ | 919,408 | |
| | | | | | | | |
| | | | | | | | |
| | |
| Issuer | | Shares/Par | | | Value ($) | |
| COMMON STOCKS – continued | | | | | |
| Specialty Stores – 4.3% | | | | | | | | |
| Amazon.com, Inc. (a) | | | 4,630 | | | $ | 8,555,499 | |
| Best Buy Co., Inc. | | | 20,475 | | | | 1,797,705 | |
| Costco Wholesale Corp. | | | 20,470 | | | | 6,016,542 | |
| Target Corp. | | | 32,145 | | | | 4,121,311 | |
| | | | | | | | |
| | | | | | $ | 20,491,057 | |
| | | | | | | | |
| Telecommunications – Wireless – 1.7% | |
| American Tower Corp., REIT | | | 34,810 | | | $ | 8,000,034 | |
| | | | | | | | |
| Telephone Services – 1.0% | | | | | |
| AT&T, Inc. | | | 11,098 | | | $ | 433,710 | |
| Verizon Communications, Inc. | | | 71,908 | | | | 4,415,151 | |
| | | | | | | | |
| | | | | | $ | 4,848,861 | |
| | | | | | | | |
| Tobacco – 1.6% | | | | | |
| Philip Morris International, Inc. | | | 86,103 | | | $ | 7,326,504 | |
| | | | | | | | |
| Utilities – Electric Power – 4.2% | | | | | |
| AES Corp. | | | 253,835 | | | $ | 5,051,317 | |
| Exelon Corp. | | | 150,800 | | | | 6,874,972 | |
| NRG Energy, Inc. | | | 118,156 | | | | 4,696,701 | |
| Vistra Energy Corp. | | | 143,200 | | | | 3,292,168 | |
| | | | | | | | |
| | | | | | $ | 19,915,158 | |
| | | | | | | | |
Total Common Stocks
(Identified Cost, $330,923,765) | | | | | | $ | 468,340,602 | |
| | | | | | | | |
| |
| INVESTMENT COMPANIES (h) – 0.8% | | | | | |
| Money Market Funds – 0.8% | | | | | | | | |
| MFS Institutional Money Market Portfolio, 1.7% (v) (Identified Cost, $3,668,557) | | | 3,668,643 | | | $ | 3,668,643 | |
| | | | | | | | |
OTHER ASSETS, LESS
LIABILITIES – 0.0% | | | | | | | 24,850 | |
| | | | | | | | |
| NET ASSETS – 100.0% | | | | | | $ | 472,034,095 | |
| | | | | | | | |
| (a) | | Non-income producing security. |
| (h) | | An affiliated issuer, which may be considered one in which the fund owns 5% or more of the outstanding voting securities, or a company which is under common control. At period end, the aggregate values of the fund’s investments in affiliated issuers and in unaffiliated issuers were $3,668,643 and $468,340,602, respectively. |
| (v) | | Affiliated issuer that is available only to investment companies managed by MFS. The rate quoted for the MFS Institutional Money Market Portfolio is the annualizedseven-day yield of the fund at period end. |
The following abbreviations are used in this report and are defined:
| REIT | | Real Estate Investment Trust |
See Notes to Financial Statements
9
MFS Blended Research Core Equity Portfolio
FINANCIAL STATEMENTS | STATEMENT OF ASSETS AND LIABILITIES
This statement represents your fund’s balance sheet, which details the assets and liabilities comprising the total value of the fund.
| | | | |
At 12/31/19 | | | | |
| |
Assets | | | | |
Investments in unaffiliated issuers, at value (identified cost, $330,923,765) | | | $468,340,602 | |
Investments in affiliated issuers, at value (identified cost, $3,668,557) | | | 3,668,643 | |
Cash | | | 3,466 | |
Receivables for | | | | |
Fund shares sold | | | 44,744 | |
Dividends | | | 436,607 | |
Other assets | | | 2,497 | |
Total assets | | | $472,496,559 | |
| |
Liabilities | | | | |
Payables for | | | | |
Fund shares reacquired | | | $374,599 | |
Payable to affiliates | | | | |
Investment adviser | | | 10,084 | |
Administrative services fee | | | 382 | |
Shareholder servicing costs | | | 30 | |
Distribution and/or service fees | | | 2,553 | |
Payable for independent Trustees’ compensation | | | 73 | |
Accrued expenses and other liabilities | | | 74,743 | |
Total liabilities | | | $462,464 | |
Net assets | | | $472,034,095 | |
| |
Net assets consist of | | | | |
Paid-in capital | | | $305,847,954 | |
Total distributable earnings (loss) | | | 166,186,141 | |
Net assets | | | $472,034,095 | |
Shares of beneficial interest outstanding | | | 8,931,003 | |
| | | | | | | | | | | | |
| | | |
| | | Net assets | | | Shares
outstanding | | | Net asset value
per share | |
Initial Class | | | $285,654,349 | | | | 5,383,662 | | | | $53.06 | |
Service Class | | | 186,379,746 | | | | 3,547,341 | | | | 52.54 | |
See Notes to Financial Statements
10
MFS Blended Research Core Equity Portfolio
FINANCIAL STATEMENTS | STATEMENT OF OPERATIONS
This statement describes how much your fund earned in investment income and accrued in expenses. It also describes any gains and/or losses generated by fund operations.
| | | | |
Year ended 12/31/19 | | | | |
| |
Net investment income (loss) | | | | |
Income | | | | |
Dividends | | | $8,997,162 | |
Dividends from affiliated issuers | | | 57,270 | |
Other | | | 20,060 | |
Income on securities loaned | | | 16,360 | |
Total investment income | | | $9,090,852 | |
Expenses | | | | |
Management fee | | | $1,800,895 | |
Distribution and/or service fees | | | 436,485 | |
Shareholder servicing costs | | | 8,243 | |
Administrative services fee | | | 71,228 | |
Independent Trustees’ compensation | | | 10,593 | |
Custodian fee | | | 21,852 | |
Shareholder communications | | | 19,793 | |
Audit and tax fees | | | 54,675 | |
Legal fees | | | 3,854 | |
Miscellaneous | | | 27,266 | |
Total expenses | | | $2,454,884 | |
Reduction of expenses by investment adviser | | | (43,936 | ) |
Net expenses | | | $2,410,948 | |
Net investment income (loss) | | | $6,679,904 | |
| |
Realized and unrealized gain (loss) | | | | |
Realized gain (loss) (identified cost basis) | | | | |
Unaffiliated issuers | | | $22,829,639 | |
Affiliated issuers | | | 324 | |
Net realized gain (loss) | | | $22,829,963 | |
Change in unrealized appreciation or depreciation | | | | |
Unaffiliated issuers | | | $84,416,987 | |
Affiliated issuers | | | 86 | |
Net unrealized gain (loss) | | | $84,417,073 | |
Net realized and unrealized gain (loss) | | | $107,247,036 | |
Change in net assets from operations | | | $113,926,940 | |
See Notes to Financial Statements
11
MFS Blended Research Core Equity Portfolio
FINANCIAL STATEMENTS | STATEMENTS OF CHANGES IN NET ASSETS
These statements describe the increases and/or decreases in net assets resulting from operations, any distributions, and any shareholder transactions.
| | | | | | | | |
| | | Year ended | |
| | | 12/31/19 | | | 12/31/18 | |
Change in net assets | | | | | | | | |
| | |
From operations | | | | | | | | |
Net investment income (loss) | | | $6,679,904 | | | | $6,265,566 | |
Net realized gain (loss) | | | 22,829,963 | | | | 33,514,844 | |
Net unrealized gain (loss) | | | 84,417,073 | | | | (73,329,128 | ) |
Change in net assets from operations | | | $113,926,940 | | | | $(33,548,718 | ) |
Total distributions to shareholders | | | $(40,137,054 | ) | | | $(47,187,077 | ) |
Change in net assets from fund share transactions | | | $(15,716,598 | ) | | | $(7,790,686 | ) |
Total change in net assets | | | $58,073,288 | | | | $(88,526,481 | ) |
| | |
Net assets | | | | | | | | |
At beginning of period | | | 413,960,807 | | | | 502,487,288 | |
At end of period | | | $472,034,095 | | | | $413,960,807 | |
See Notes to Financial Statements
12
MFS Blended Research Core Equity Portfolio
FINANCIAL STATEMENTS | FINANCIAL HIGHLIGHTS
The financial highlights table is intended to help you understand the fund’s financial performance for the past 5 years. Certain information reflects financial results for a single fund share. The total returns in the table represent the rate that an investor would have earned (or lost) on an investment in the fund share class (assuming reinvestment of all distributions) held for the entire period.
| | | | | | | | | | | | | | | | | | | | |
| Initial Class | | Year ended | |
| | | | | |
| | | 12/31/19 | | | 12/31/18 | | | 12/31/17 | | | 12/31/16 | | | 12/31/15 | |
| | | | | |
Net asset value, beginning of period | | | $45.29 | | | | $54.23 | | | | $46.62 | | | | $48.56 | | | | $53.50 | |
| | | | | |
| Income (loss) from investment operations | | | | | | | | | | | | | | | | | | | | |
Net investment income (loss) (d) | | | $0.80 | | | | $0.74 | | | | $0.68 | | | | $0.74 | (c) | | | $0.76 | |
Net realized and unrealized gain (loss) | | | 11.74 | | | | (4.12 | ) | | | 8.80 | | | | 3.24 | | | | (0.62 | ) |
Total from investment operations | | | $12.54 | | | | $(3.38 | ) | | | $9.48 | | | | $3.98 | | | | $0.14 | |
| | | | | |
| Less distributions declared to shareholders | | | | | | | | | | | | | | | | | | | | |
From net investment income | | | $(0.79 | ) | | | $(0.77 | ) | | | $(0.78 | ) | | | $(0.72 | ) | | | $(0.87 | ) |
From net realized gain | | | (3.98 | ) | | | (4.79 | ) | | | (1.09 | ) | | | (5.20 | ) | | | (4.21 | ) |
Total distributions declared to shareholders | | | $(4.77 | ) | | | $(5.56 | ) | | | $(1.87 | ) | | | $(5.92 | ) | | | $(5.08 | ) |
Net asset value, end of period (x) | | | $53.06 | | | | $45.29 | | | | $54.23 | | | | $46.62 | | | | $48.56 | |
Total return (%) (k)(r)(s)(x) | | | 29.17 | | | | (7.74 | ) | | | 20.76 | | | | 8.45 | (c) | | | 1.13 | |
| | | | | |
Ratios (%) (to average net assets)
and Supplemental data: | | | | | | | | | | | | | | | | | | | | |
Expenses before expense reductions (f) | | | 0.45 | | | | 0.45 | | | | 0.46 | | | | 0.49 | (c) | | | 0.60 | |
Expenses after expense reductions (f) | | | 0.44 | | | | 0.44 | | | | 0.45 | | | | 0.44 | (c) | | | 0.45 | |
Net investment income (loss) | | | 1.58 | | | | 1.39 | | | | 1.35 | | | | 1.56 | (c) | | | 1.45 | |
Portfolio turnover | | | 46 | | | | 54 | | | | 51 | | | | 49 | | | | 51 | |
Net assets at end of period (000 omitted) | | | $285,654 | | | | $256,439 | | | | $320,384 | | | | $306,368 | | | | $319,721 | |
| |
| Service Class | | Year ended | |
| | | | | |
| | | 12/31/19 | | | 12/31/18 | | | 12/31/17 | | | 12/31/16 | | | 12/31/15 | |
| | | | | |
Net asset value, beginning of period | | | $44.87 | | | | $53.79 | | | | $46.26 | | | | $48.26 | | | | $53.18 | |
| | | | | |
| Income (loss) from investment operations | | | | | | | | | | | | | | | | | | | | |
Net investment income (loss) (d) | | | $0.67 | | | | $0.61 | | | | $0.55 | | | | $0.61 | (c) | | | $0.62 | |
Net realized and unrealized gain (loss) | | | 11.64 | | | | (4.11 | ) | | | 8.73 | | | | 3.22 | | | | (0.61 | ) |
Total from investment operations | | | $12.31 | | | | $(3.50 | ) | | | $9.28 | | | | $3.83 | | | | $0.01 | |
| | | | | |
| Less distributions declared to shareholders | | | | | | | | | | | | | | | | | | | | |
From net investment income | | | $(0.66 | ) | | | $(0.63 | ) | | | $(0.66 | ) | | | $(0.63 | ) | | | $(0.72 | ) |
From net realized gain | | | (3.98 | ) | | | (4.79 | ) | | | (1.09 | ) | | | (5.20 | ) | | | (4.21 | ) |
Total distributions declared to shareholders | | | $(4.64 | ) | | | $(5.42 | ) | | | $(1.75 | ) | | | $(5.83 | ) | | | $(4.93 | ) |
Net asset value, end of period (x) | | | $52.54 | | | | $44.87 | | | | $53.79 | | | | $46.26 | | | | $48.26 | |
Total return (%) (k)(r)(s)(x) | | | 28.87 | | | | (7.99 | ) | | | 20.47 | | | | 8.17 | (c) | | | 0.87 | |
| | | | | |
Ratios (%) (to average net assets)
and Supplemental data: | | | | | | | | | | | | | | | | | | | | |
Expenses before expense reductions (f) | | | 0.70 | | | | 0.70 | | | | 0.71 | | | | 0.74 | (c) | | | 0.85 | |
Expenses after expense reductions (f) | | | 0.69 | | | | 0.69 | | | | 0.70 | | | | 0.69 | (c) | | | 0.70 | |
Net investment income (loss) | | | 1.33 | | | | 1.14 | | | | 1.10 | | | | 1.30 | (c) | | | 1.20 | |
Portfolio turnover | | | 46 | | | | 54 | | | | 51 | | | | 49 | | | | 51 | |
Net assets at end of period (000 omitted) | | | $186,380 | | | | $157,522 | | | | $182,103 | | | | $169,622 | | | | $143,427 | |
See Notes to Financial Statements
13
MFS Blended Research Core Equity Portfolio
Financial Highlights – continued
| (c) | Amount reflects aone-time reimbursement of expenses by the custodian (or former custodian) without which net investment income and performance would be lower and expenses would be higher. |
| (d) | Per share data is based on average shares outstanding. |
| (f) | Ratios do not reflect reductions from fees paid indirectly, if applicable. |
| (k) | The total return does not reflect expenses that apply to separate accounts. Inclusion of these charges would reduce the total return figures for all periods shown. |
| (r) | Certain expenses have been reduced without which performance would have been lower. |
| (s) | From time to time the fund may receive proceeds from litigation settlements, without which performance would be lower. |
| (x) | The net asset values and total returns have been calculated on net assets which include adjustments made in accordance with U.S. generally accepted accounting principles required at period end for financial reporting purposes. |
See Notes to Financial Statements
14
MFS Blended Research Core Equity Portfolio
NOTES TO FINANCIAL STATEMENTS
| (1) | | Business and Organization |
MFS Blended Research Core Equity Portfolio (the fund) is a diversified series of MFS Variable Insurance Trust II (the trust). The trust is organized as a Massachusetts business trust and is registered under the Investment Company Act of 1940, as amended, as anopen-end management investment company. The shareholders of each series of the trust are separate accounts of insurance companies, which offer variable annuity and/or life insurance products, and qualified retirement and pension plans.
The fund is an investment company and accordingly follows the investment company accounting and reporting guidance of the Financial Accounting Standards Board (FASB) Accounting Standards Codification Topic 946 Financial Services – Investment Companies.
| (2) | | Significant Accounting Policies |
General– The preparation of financial statements in conformity with U.S. generally accepted accounting principles requires management to make estimates and assumptions that affect the reported amounts of assets and liabilities, and disclosure of contingent assets and liabilities at the date of the financial statements and the reported amounts of increases and decreases in net assets from operations during the reporting period. Actual results could differ from those estimates. In the preparation of these financial statements, management has evaluated subsequent events occurring after the date of the fund’s Statement of Assets and Liabilities through the date that the financial statements were issued.
Balance Sheet Offsetting– The fund’s accounting policy with respect to balance sheet offsetting is that, absent an event of default by the counterparty or a termination of the agreement, the International Swaps and Derivatives Association (ISDA) Master Agreement, or similar agreement, does not result in an offset of reported amounts of financial assets and financial liabilities in the Statement of Assets and Liabilities across transactions between the fund and the applicable counterparty. The fund’s right to setoff may be restricted or prohibited by the bankruptcy or insolvency laws of the particular jurisdiction to which a specific master netting agreement counterparty is subject. Balance sheet offsetting disclosures, to the extent applicable to the fund, have been included in the fund’s Significant Accounting Policies note under the captions for each of the fund’sin-scope financial instruments and transactions.
Investment Valuations– Equity securities, including restricted equity securities, are generally valued at the last sale or official closing price on their primary market or exchange as provided by a third-party pricing service. Equity securities, for which there were no sales reported that day, are generally valued at the last quoted daily bid quotation on their primary market or exchange as provided by a third-party pricing service. Short-term instruments with a maturity at issuance of 60 days or less may be valued at amortized cost, which approximates market value.Open-end investment companies are generally valued at net asset value per share. Securities and other assets generally valued on the basis of information from a third-party pricing service may also be valued at a broker/dealer bid quotation. In determining values, third-party pricing services can utilize both transaction data and market information such as yield, quality, coupon rate, maturity, type of issue, trading characteristics, and other market data.
The Board of Trustees has delegated primary responsibility for determining or causing to be determined the value of the fund’s investments (including any fair valuation) to the adviser pursuant to valuation policies and procedures approved by the Board. If the adviser determines that reliable market quotations are not readily available, investments are valued at fair value as determined in good faith by the adviser in accordance with such procedures under the oversight of the Board of Trustees. Under the fund’s valuation policies and procedures, market quotations are not considered to be readily available for most types of debt instruments and floating rate loans and many types of derivatives. These investments are generally valued at fair value based on information from third-party pricing services. In addition, investments may be valued at fair value if the adviser determines that an investment’s value has been materially affected by events occurring after the close of the exchange or market on which the investment is principally traded (such as foreign exchange or market) and prior to the determination of the fund’s net asset value, or after the halt of trading of a specific security where trading does not resume prior to the close of the exchange or market on which the security is principally traded. Events that occur after foreign markets close (such as developments in foreign markets and significant movements in the U.S. markets) and prior to the determination of the fund’s net asset value may be deemed to have a material effect on the value of securities traded in foreign markets. Accordingly, the fund’s foreign equity securities may often be valued at fair value. The adviser generally relies on third-party pricing services or other information (such as the correlation with price movements of similar securities in the same or other markets; the type, cost and investment characteristics of the security; the business and financial condition of the issuer; and trading and other market data) to assist in determining whether to fair value and at what value to fair value an investment. The value of an investment for purposes of calculating the fund’s net asset value can differ depending on the source and method used to determine value. When fair valuation is used, the value of an investment used to determine the fund’s net asset value may differ from quoted or published prices for the same investment. There can be no assurance that the fund could obtain the fair value assigned to an investment if it were to sell the investment at the same time at which the fund determines its net asset value per share.
Various inputs are used in determining the value of the fund’s assets or liabilities. These inputs are categorized into three broad levels. In certain cases, the inputs used to measure fair value may fall into different levels of the fair value hierarchy. In such cases, an
15
MFS Blended Research Core Equity Portfolio
Notes to Financial Statements – continued
investment’s level within the fair value hierarchy is based on the lowest level of input that is significant to the fair value measurement. The fund’s assessment of the significance of a particular input to the fair value measurement in its entirety requires judgment, and considers factors specific to the investment. Level 1 includes unadjusted quoted prices in active markets for identical assets or liabilities. Level 2 includes other significant observable market-based inputs (including quoted prices for similar securities, interest rates, prepayment speed, and credit risk). Level 3 includes unobservable inputs, which may include the adviser’s own assumptions in determining the fair value of investments. The following is a summary of the levels used as of December 31, 2019 in valuing the fund’s assets or liabilities:
| | | | | | | | | | | | | | | | |
| Financial Instruments | | Level 1 | | | Level 2 | | | Level 3 | | | Total | |
| Equity Securities | | | $468,340,602 | | | | $— | | | | $— | | | | $468,340,602 | |
| Mutual Funds | | | 3,668,643 | | | | — | | | | — | | | | 3,668,643 | |
| Total | | | $472,009,245 | | | | $— | | | | $— | | | | $472,009,245 | |
For further information regarding security characteristics, see the Portfolio of Investments.
Security Loans– Under its Securities Lending Agency Agreement with the fund, State Street Bank and Trust Company, as lending agent, loans the securities of the fund to certain qualified institutions (the “Borrowers”) approved by the fund. Security loans can be terminated at the discretion of either the lending agent or the fund and the related securities must be returned within the earlier of the standard trade settlement period for such securities or within three business days. The loans are collateralized by cash and/or U.S. Treasury and federal agency obligations in an amount typically at least equal to the market value of the securities loaned. On loans collateralized by cash, the cash collateral is invested in a money market fund. The market value of the loaned securities is determined at the close of business of the fund and any additional required collateral is delivered to the fund on the next business day. The lending agent provides the fund with indemnification against Borrower default. In the event of Borrower default, the lending agent will, for the benefit of the fund, either purchase securities identical to those loaned or, when such purchase is commercially impracticable, pay the fund the market value of the loaned securities. In return, the lending agent assumes the fund’s rights to the related collateral. If the collateral value is less than the cost to purchase identical securities, the lending agent is responsible for the shortfall, but only to the extent that such shortfall is not due to a decline in collateral value resulting from collateral reinvestment for which the fund bears the risk of loss. A portion of the income generated upon investment of the collateral is remitted to the Borrowers, and the remainder is allocated between the fund and the lending agent. On loans collateralized by U.S. Treasury and/or federal agency obligations, a fee is received from the Borrower, and is allocated between the fund and the lending agent. Income from securities lending is separately reported in the Statement of Operations. The dividend and interest income earned on the securities loaned is accounted for in the same manner as other dividend and interest income. At December 31, 2019, there were no securities on loan or collateral outstanding.
Indemnifications– Under the fund’s organizational documents, its officers and Trustees may be indemnified against certain liabilities and expenses arising out of the performance of their duties to the fund. Additionally, in the normal course of business, the fund enters into agreements with service providers that may contain indemnification clauses. The fund’s maximum exposure under these agreements is unknown as this would involve future claims that may be made against the fund that have not yet occurred.
Investment Transactions and Income– Investment transactions are recorded on the trade date. Dividends received in cash are recorded on theex-dividend date. Certain dividends from foreign securities will be recorded when the fund is informed of the dividend if such information is obtained subsequent to theex-dividend date. Dividend payments received in additional securities are recorded on theex-dividend date in an amount equal to the value of the security on such date.
The fund may receive proceeds from litigation settlements. Any proceeds received from litigation involving portfolio holdings are reflected in the Statement of Operations in realized gain/loss if the security has been disposed of by the fund or in unrealized gain/loss if the security is still held by the fund. Any other proceeds from litigation not related to portfolio holdings are reflected as other income in the Statement of Operations.
Tax Matters and Distributions– The fund intends to qualify as a regulated investment company, as defined under Subchapter M of the Internal Revenue Code, and to distribute all of its taxable income, including realized capital gains. As a result, no provision for federal income tax is required. The fund’s federal tax returns, when filed, will remain subject to examination by the Internal Revenue Service for a three year period. Management has analyzed the fund’s tax positions taken on federal and state tax returns for all open tax years and does not believe that there are any uncertain tax positions that require recognition of a tax liability. Foreign taxes, if any, have been accrued by the fund in the accompanying financial statements in accordance with the applicable foreign tax law. Foreign income taxes may be withheld by certain countries in which the fund invests. Additionally, capital gains realized by the fund on securities issued in or by certain foreign countries may be subject to capital gains tax imposed by those countries.
Distributions to shareholders are recorded on theex-dividend date. Income and capital gain distributions are determined in accordance with income tax regulations, which may differ from U.S. generally accepted accounting principles. Certain capital accounts in the financial statements are periodically adjusted for permanent differences in order to reflect their tax character. These
16
MFS Blended Research Core Equity Portfolio
Notes to Financial Statements – continued
adjustments have no impact on net assets or net asset value per share. Temporary differences which arise from recognizing certain items of income, expense, gain or loss in different periods for financial statement and tax purposes will reverse at some time in the future.
Book/tax differences primarily relate to wash sale loss deferrals.
The tax character of distributions declared to shareholders for the last two fiscal years is as follows:
| | | | | | | | |
| | | Year ended
12/31/19 | | | Year ended
12/31/18 | |
| Ordinary income (including any short-term capital gains) | | | $6,265,015 | | | | $6,509,038 | |
| Long-term capital gains | | | 33,872,039 | | | | 40,678,039 | |
| Total distributions | | | $40,137,054 | | | | $47,187,077 | |
The federal tax cost and the tax basis components of distributable earnings were as follows:
| | | | |
| As of 12/31/19 | | | | |
| |
| Cost of investments | | | $335,062,573 | |
| Gross appreciation | | | 140,556,158 | |
| Gross depreciation | | | (3,609,486 | ) |
| Net unrealized appreciation (depreciation) | | | $136,946,672 | |
| |
| Undistributed ordinary income | | | 6,679,820 | |
| Undistributed long-term capital gain | | | 22,559,649 | |
Multiple Classes of Shares of Beneficial Interest– The fund offers multiple classes of shares, which differ in their respective distribution and/or service fees. The fund’s income, realized and unrealized gain (loss), and common expenses are allocated to shareholders based on the daily net assets of each class. Dividends are declared separately for each class. Differences in per share dividend rates are generally due to differences in separate class expenses. The fund’s distributions declared to shareholders as reported in the Statements of Changes in Net Assets are presented by class as follows:
| | | | | | | | |
| | |
| | | Year ended
12/31/19 | | | Year ended
12/31/18 | |
| Initial Class | | | $24,630,652 | | | | $29,770,885 | |
| Service Class | | | 15,506,402 | | | | 17,416,192 | |
| Total | | | $40,137,054 | | | | $47,187,077 | |
| (3) | | Transactions with Affiliates |
Investment Adviser– The fund has an investment advisory agreement with MFS to provide overall investment management and related administrative services and facilities to the fund. The management fee is computed daily and paid monthly at the following annual rates based on the fund’s average daily net assets:
| | | | |
| Up to $1 billion | | | 0.40% | |
| In excess of $1 billion and up to $2.5 billion | | | 0.375% | |
| In excess of $2.5 billion | | | 0.35% | |
MFS has agreed in writing to reduce its management fee by a specified amount if certain MFS mutual fund assets exceed thresholds agreed to by MFS and the fund’s Board of Trustees. For the year ended December 31, 2019, this management fee reduction amounted to $43,936, which is included in the reduction of total expenses in the Statement of Operations. The management fee incurred for the year ended December 31, 2019 was equivalent to an annual effective rate of 0.39% of the fund’s average daily net assets.
Distributor– MFS Fund Distributors, Inc. (MFD), a wholly-owned subsidiary of MFS, is the distributor of shares of the fund. The Trustees have adopted a distribution plan for the Service Class shares pursuant to Rule12b-1 under the Investment Company Act of 1940.
The fund’s distribution plan provides that the fund will pay MFD distribution and/or service fees equal to 0.25% per annum of its average daily net assets attributable to Service Class shares as partial consideration for services performed and expenses incurred by MFD and financial intermediaries (including participating insurance companies that invest in the fund to fund variable annuity and variable life insurance contracts, sponsors of qualified retirement and pension plans that invest in the fund, and affiliates of these participating insurance companies and plan sponsors) in connection with the sale and distribution of the Service Class shares. MFD may subsequently pay all, or a portion, of the distribution and/or service fees to financial intermediaries.
Shareholder Servicing Agent– MFS Service Center, Inc. (MFSC), a wholly-owned subsidiary of MFS, receives a fee from the fund for its services as shareholder servicing agent. For the year ended December 31, 2019, the fee was $7,641, which equated to
17
MFS Blended Research Core Equity Portfolio
Notes to Financial Statements – continued
0.0017% annually of the fund’s average daily net assets. MFSC also receives payment from the fund forout-of-pocket expenses paid by MFSC on behalf of the fund. For the year ended December 31, 2019, these costs amounted to $602.
Administrator– MFS provides certain financial, legal, shareholder communications, compliance, and other administrative services to the fund. Under an administrative services agreement, the fund reimburses MFS the costs incurred to provide these services. The fund is charged an annual fixed amount of $17,500 plus a fee based on average daily net assets. The administrative services fee incurred for the year ended December 31, 2019 was equivalent to an annual effective rate of 0.0158% of the fund’s average daily net assets.
Trustees’ and Officers’ Compensation– The fund pays compensation to independent Trustees in the form of a retainer, attendance fees, and additional compensation to Board and Committee chairpersons. The fund does not pay compensation directly to Trustees or officers of the fund who are also officers of the investment adviser, all of whom receive remuneration from MFS for their services to the fund. Certain officers and Trustees of the fund are officers or directors of MFS, MFD, and MFSC.
Other– This fund and certain other funds managed by MFS (the funds) had entered into a service agreement (the ISO Agreement) which provided for payment of fees solely by the funds to Tarantino LLC in return for the provision of services of an Independent Senior Officer (ISO) for the funds. Frank L. Tarantino served as the ISO and was an officer of the funds and the sole member of Tarantino LLC. Effective June 30, 2019, Mr. Tarantino retired from his position as ISO for the funds, and the ISO Agreement was terminated. For the year ended December 31, 2019, the fee paid by the fund under this agreement was $521 and is included in “Miscellaneous” expense in the Statement of Operations. MFS had agreed to bear all expenses associated with office space, other administrative support, and supplies provided to the ISO.
The fund invests in the MFS Institutional Money Market Portfolio which is managed by MFS and seeks current income consistent with preservation of capital and liquidity. This money market fund does not pay a management fee to MFS.
The adviser has voluntarily undertaken to reimburse the fund from its own resources on a quarterly basis for the cost of investment research embedded in the cost of the fund’s securities trades. This agreement may be rescinded at any time. For the year ended December 31, 2019, this reimbursement amounted to $19,977, which is included in “Other” income in the Statement of Operations.
For the year ended December 31, 2019, purchases and sales of investments, other than short-term obligations, aggregated $206,710,096 and $255,795,962, respectively.
| (5) | | Shares of Beneficial Interest |
The fund’s Declaration of Trust permits the Trustees to issue an unlimited number of full and fractional shares of beneficial interest. Transactions in fund shares were as follows:
| | | | | | | | | | | | | | | | |
| | | Year ended 12/31/19 | | | Year ended 12/31/18 | |
| | | | |
| | | Shares | | | Amount | | | Shares | | | Amount | |
| Shares sold | | | | | | | | | | | | | | | | |
Initial Class | | | 90,873 | | | | $4,602,196 | | | | 98,132 | | | | $5,079,123 | |
Service Class | | | 174,912 | | | | 8,792,619 | | | | 253,350 | | | | 13,012,309 | |
| | | 265,785 | | | | $13,394,815 | | | | 351,482 | | | | $18,091,432 | |
| | | | |
| Shares issued to shareholders in reinvestment of distributions | | | | | | | | | | | | | | | | |
Initial Class | | | 520,949 | | | | $24,244,989 | | | | 552,893 | | | | $29,330,972 | |
Service Class | | | 336,146 | | | | 15,506,402 | | | | 331,043 | | | | 17,416,192 | |
| | | 857,095 | | | | $39,751,391 | | | | 883,936 | | | | $46,747,164 | |
| | | | |
| Shares reacquired | | | | | | | | | | | | | | | | |
Initial Class | | | (890,900 | ) | | | $(45,210,245 | ) | | | (896,433 | ) | | | $(48,014,750 | ) |
Service Class | | | (474,065 | ) | | | (23,652,559 | ) | | | (459,784 | ) | | | (24,614,532 | ) |
| | | (1,364,965 | ) | | | $(68,862,804 | ) | | | (1,356,217 | ) | | | $(72,629,282 | ) |
| | | | |
| Net change | | | | | | | | | | | | | | | | |
Initial Class | | | (279,078 | ) | | | $(16,363,060 | ) | | | (245,408 | ) | | | $(13,604,655 | ) |
Service Class | | | 36,993 | | | | 646,462 | | | | 124,609 | | | | 5,813,969 | |
| | | (242,085 | ) | | | $(15,716,598 | ) | | | (120,799 | ) | | | $(7,790,686 | ) |
The fund and certain other funds managed by MFS participate in a $1.25 billion unsecured committed line of credit, subject to a $1 billion sublimit, provided by a syndicate of banks under a credit agreement. Borrowings may be made for temporary financing needs. Interest is charged to each fund, based on its borrowings, generally at a rate equal to the highest of one month LIBOR, the
18
MFS Blended Research Core Equity Portfolio
Notes to Financial Statements – continued
Federal Funds Effective Rate and the Overnight Bank Funding Rate, plus an agreed upon spread. A commitment fee, based on the average daily, unused portion of the committed line of credit, is allocated among the participating funds. In addition, the fund and other funds managed by MFS have established unsecured uncommitted borrowing arrangements with certain banks for temporary financing needs. Interest is charged to each fund, based on its borrowings, at rates equal to customary reference rates plus an agreed upon spread. For the year ended December 31, 2019, the fund’s commitment fee and interest expense were $2,442 and $0, respectively, and are included in “Miscellaneous” expense in the Statement of Operations.
| (7) | | Investments in Affiliated Issuers |
An affiliated issuer may be considered one in which the fund owns 5% or more of the outstanding voting securities, or a company which is under common control. For the purposes of this report, the following were affiliated issuers:
| | | | | | | | | | | | | | | | | | | | | | | | |
| Affiliated Issuers | | Beginning
Value | | | Purchases | | | Sales
Proceeds | | | Realized
Gain
(Loss) | | | Change in
Unrealized
Appreciation or
Depreciation | | | Ending
Value | |
| MFS Institutional Money Market Portfolio | | | $3,121,333 | | | | $51,957,919 | | | | $51,411,019 | | | | $324 | | | | $86 | | | | $3,668,643 | |
| | | | | | |
| Affiliated Issuers | | | | | | | | | | | | | | Dividend
Income | | | Capital Gain
Distributions | |
| MFS Institutional Money Market Portfolio | | | | | | | | | | | | | | | | | | | $57,270 | | | | $— | |
19
MFS Blended Research Core Equity Portfolio
REPORT OF INDEPENDENT REGISTERED PUBLIC ACCOUNTING FIRM
To the Board of Trustees of MFS Variable Insurance Trust II and the Shareholders of
MFS Blended Research Core Equity Portfolio:
Opinion on the Financial Statements and Financial Highlights
We have audited the accompanying statement of assets and liabilities of MFS Blended Research Core Equity Portfolio (the “Fund”), including the portfolio of investments, as of December 31, 2019, the related statement of operations for the year then ended, the statements of changes in net assets for each of the two years in the period then ended, the financial highlights for each of the five years in the period then ended, and the related notes. In our opinion, the financial statements and financial highlights present fairly, in all material respects, the financial position of the Fund as of December 31, 2019, and the results of its operations for the year then ended, the changes in its net assets for each of the two years in the period then ended, and the financial highlights for each of the five years in the period then ended, in conformity with accounting principles generally accepted in the United States of America.
Basis for Opinion
These financial statements and financial highlights are the responsibility of the Fund’s management. Our responsibility is to express an opinion on the Fund’s financial statements and financial highlights based on our audits. We are a public accounting firm registered with the Public Company Accounting Oversight Board (United States) (PCAOB) and are required to be independent with respect to the Fund in accordance with the U.S. federal securities laws and the applicable rules and regulations of the Securities and Exchange Commission and the PCAOB.
We conducted our audits in accordance with the standards of the PCAOB. Those standards require that we plan and perform the audit to obtain reasonable assurance about whether the financial statements and financial highlights are free of material misstatement, whether due to error or fraud. The Fund is not required to have, nor were we engaged to perform, an audit of its internal control over financial reporting. As part of our audits we are required to obtain an understanding of internal control over financial reporting but not for the purpose of expressing an opinion on the effectiveness of the Fund’s internal control over financial reporting. Accordingly, we express no such opinion.
Our audits included performing procedures to assess the risks of material misstatement of the financial statements and financial highlights, whether due to error or fraud, and performing procedures that respond to those risks. Such procedures included examining, on a test basis, evidence regarding the amounts and disclosures in the financial statements and financial highlights. Our audits also included evaluating the accounting principles used and significant estimates made by management, as well as evaluating the overall presentation of the financial statements and financial highlights. Our procedures included confirmation of securities owned as of December 31, 2019, by correspondence with the custodian. We believe that our audits provide a reasonable basis for our opinion.
DELOITTE & TOUCHE LLP
Boston, Massachusetts
February 14, 2020
We have served as the auditor of one or more of the MFS investment companies since 1924.
20
MFS Blended Research Core Equity Portfolio
TRUSTEES AND OFFICERS – IDENTIFICATION AND BACKGROUND
The Trustees and Officers of the Trust, as of February 1, 2020, are listed below, together with their principal occupations during the past five years. (Their titles may have varied during that period.) The address of each Trustee and Officer is 111 Huntington Avenue, Boston, Massachusetts 02199-7618.
| | | | | | | | | | |
Name, Age | | Position(s)
Held with Fund | | Trustee/Officer
Since (h) | | Number of MFS Funds
overseen by the
Trustee | | Principal Occupations
During the Past Five Years | | Other Directorships During the Past Five Years (j) |
| INTERESTED TRUSTEES |
Robert J. Manning (k)
(age 56) | | Trustee | | February 2004 | | 133 | | Massachusetts Financial Services Company, Executive Chairman (since January 2017); Director; Chairman of the Board; Chief Executive Officer (until 2015);Co-Chief Executive Officer(2015-2016) | | N/A |
| | | | | |
Robin A. Stelmach (k) (age 58) | | Trustee | | January 2014 | | 133 | | Massachusetts Financial Services Company, Vice Chair (since January 2017); Chief Operating Officer and Executive Vice President (until January 2017) | | N/A |
|
| INDEPENDENT TRUSTEES |
John P. Kavanaugh (age 65) | | Trustee and Chair of Trustees | | January 2009 | | 133 | | Private investor | | N/A |
| | | | | |
Steven E. Buller (age 68) | | Trustee | | February 2014 | | 133 | | Financial Accounting Standards Advisory Council, Chairman(2014-2015); Public Company Accounting Oversight Board, Standing Advisory Group, Member (until 2014); BlackRock, Inc. (investment management), Managing Director (until 2014), BlackRock Finco UK (investment management), Director (until 2014) | | N/A |
| | | | | |
John A. Caroselli (age 65) | | Trustee | | March 2017 | | 133 | | JC Global Advisors, LLC (management consulting), President (since 2015); First Capital Corporation (commercial finance), Executive Vice President (until 2015) | | N/A |
| | | | | |
Maureen R. Goldfarb (age 64) | | Trustee | | January 2009 | | 133 | | Private investor | | N/A |
| | | | | |
Peter D. Jones
(age 64) | | Trustee | | January 2019 | | 133 | | Franklin Templeton Distributors, Inc. (investment management), President (until 2015); Franklin Templeton Institutional, LLC (investment management), Chairman (until 2015) | | N/A |
| | | | | |
James W. Kilman, Jr.
(age 58) | | Trustee | | January 2019 | | 133 | | Burford Capital Limited (finance and investment management), Chief Financial Officer (since 2019); KielStrand Capital LLC (family office), Chief Executive Officer (since 2016); Morgan Stanley & Co. (financial services), Vice Chairman of Investment Banking,Co-Head of Diversified Financials Coverage – Financial Institutions Investment Banking Group (until 2016) | | Alpha-En Corporation, Director (2016-2019) |
21
MFS Blended Research Core Equity Portfolio
Trustees and Officers – continued
| | | | | | | | | | |
Name, Age | | Position(s)
Held with Fund | | Trustee/Officer
Since (h) | | Number of MFS Funds
overseen by the
Trustee | | Principal Occupations
During the Past Five Years | | Other Directorships During the Past Five Years (j) |
Clarence Otis, Jr. (age 63) | | Trustee | | March 2017 | | 133 | | Darden Restaurants, Inc., Chief Executive Officer (until 2014) | | VF Corporation, Director; Verizon Communications, Inc., Director; The Travelers Companies, Director; Federal Reserve Bank of Atlanta, Director (until 2015) |
| | | | | |
Maryanne L. Roepke (age 63) | | Trustee | | May 2014 | | 133 | | American Century Investments (investment management), Senior Vice President and Chief Compliance Officer (until 2014) | | N/A |
| | | | | |
Laurie J. Thomsen
(age 62) | | Trustee | | March 2005 | | 133 | | Private investor | | The Travelers Companies, Director; Dycom Industries, Inc., Director (since 2015) |
| | | | | | | | |
Name, Age | | Position(s)
Held with Fund | | Trustee/Officer
Since (h) | | Number of
MFS Funds
for which the
Person is an
Officer | | Principal Occupations During the Past Five Years |
| OFFICERS | | | | | | |
Christopher R. Bohane (k)
(age 46) | | Assistant Secretary and Assistant Clerk | | July 2005 | | 133 | | Massachusetts Financial Services Company, Vice President and Assistant General Counsel |
| | | | |
Kino Clark (k) (age 51) | | Assistant Treasurer | | January 2012 | | 133 | | Massachusetts Financial Services Company, Vice President |
| | | | |
John W. Clark, Jr. (k) (age 52) | | Assistant Treasurer | | April 2017 | | 133 | | Massachusetts Financial Services Company, Vice President (since March 2017); Deutsche Bank (financial services), Department Head – Treasurer’s Office (until February 2017) |
| | | | |
Thomas H. Connors (k) (age 60) | | Assistant Secretary and Assistant Clerk | | September 2012 | | 133 | | Massachusetts Financial Services Company, Vice President and Senior Counsel |
| | | | |
David L. DiLorenzo (k)
(age 51) | | President | | July 2005 | | 133 | | Massachusetts Financial Services Company, Senior Vice President |
| | | | |
Heidi W. Hardin (k) (age 52) | | Secretary and Clerk | | April 2017 | | 133 | | Massachusetts Financial Services Company, Executive Vice President and General Counsel (since March 2017); Harris Associates (investment management), General Counsel (from September 2015 to January 2017); Janus Capital Management LLC (investment management), Senior Vice President and General Counsel (until September 2015) |
| | | | |
Brian E. Langenfeld (k) (age 46) | | Assistant
Secretary and Assistant Clerk | | June 2006 | | 133 | | Massachusetts Financial Services Company, Vice President and Senior Counsel |
| | | | |
Amanda S. Mooradian (k) (age 40) | | Assistant
Secretary and Assistant Clerk | | September 2018 | | 133 | | Massachusetts Financial Services Company, Assistant Vice President and Counsel |
| | | | |
Susan A. Pereira (k)
(age 49) | | Assistant
Secretary and Assistant Clerk | | July 2005 | | 133 | | Massachusetts Financial Services Company, Vice President and Assistant General Counsel |
| | | | |
Kasey L. Phillips (k) (age 49) | | Assistant Treasurer | | September 2012 | | 133 | | Massachusetts Financial Services Company, Vice President |
| | | | |
Matthew A. Stowe (k) (age 45) | | Assistant Secretary and Assistant Clerk | | October 2014 | | 133 | | Massachusetts Financial Services Company, Vice President and Assistant General Counsel |
22
MFS Blended Research Core Equity Portfolio
Trustees and Officers – continued
| | | | | | | | |
Name, Age | | Position(s)
Held with Fund | | Trustee/Officer
Since (h) | | Number of
MFS Funds
for which the
Person is an
Officer | | Principal Occupations During the Past Five Years |
Martin J. Wolin (k) (age 52) | | Chief Compliance Officer | | July 2015 | | 133 | | Massachusetts Financial Services Company, Senior Vice President and Chief Compliance Officer (since July 2015); Mercer (financial service provider), Chief Risk and Compliance Officer, North America and Latin America (until June 2015) |
| | | | |
James O. Yost (k)
(age 59) | | Treasurer | | September 1990 | | 133 | | Massachusetts Financial Services Company, Senior Vice President |
| (h) | Date first appointed to serve as Trustee/officer of an MFS Fund. Each Trustee has served continuously since appointment unless indicated otherwise. For the period from December 15, 2004 until February 22, 2005, Mr. Manning served as Advisory Trustee. From January 2012 through December 2016, Messrs. DiLorenzo and Yost served as Treasurer and Deputy Treasurer of the Funds, respectively. |
| (j) | Directorships or trusteeships of companies required to report to the Securities and Exchange Commission (i.e., “public companies”). |
| (k) | “Interested person” of the Trust within the meaning of the Investment Company Act of 1940 (referred to as the 1940 Act), which is the principal federal law governing investment companies like the fund, as a result of a position with MFS. The address of MFS is 111 Huntington Avenue, Boston, Massachusetts 02199-7618. |
Each Trustee (other than Messrs. Jones and Kilman) has been elected by shareholders and each Trustee and Officer holds office until his or her successor is chosen and qualified or until his or her earlier death, resignation, retirement or removal. Messrs. Jones and Kilman became Trustees of the Funds on January 1, 2019. The Trust does not hold annual meetings for the purpose of electing Trustees, and Trustees are not elected for fixed terms. Under the terms of the Board’s retirement policy, an Independent Trustee shall retire at the end of the calendar year in which he or she reaches the earlier of 75 years of age or 15 years of service on the Board (or, in the case of any Independent Trustee who joined the Board prior to 2015, 20 years of service on the Board).
Messrs. Buller, Kilman and Otis and Ms. Roepke are members of the Trust’s Audit Committee.
Each of the Interested Trustees and certain Officers hold comparable officer positions with certain affiliates of MFS.
The Statement of Additional Information for a Fund includes further information about the Trustees and is available without charge upon request by calling1-800-225-2606.
| | |
Investment Adviser Massachusetts Financial Services Company 111 Huntington Avenue Boston, MA 02199-7618 | | Custodian State Street Bank and Trust Company 1 Lincoln Street Boston, MA 02111-2900 |
| |
Distributor MFS Fund Distributors, Inc. 111 Huntington Avenue Boston, MA 02199-7618 | | Independent Registered Public Accounting Firm Deloitte & Touche LLP 200 Berkeley Street Boston, MA 02116 |
| |
Portfolio Manager(s) Jim Fallon Matt Krummell Jonathan Sage Jed Stocks | | |
23
MFS Blended Research Core Equity Portfolio
BOARD REVIEW OF INVESTMENT ADVISORY AGREEMENT
MFS Blended Research Core Equity Portfolio
The Investment Company Act of 1940 requires that both the full Board of Trustees and a majority of the non-interested (“independent”) Trustees, voting separately, annually approve the continuation of the Fund’s investment advisory agreement with MFS. The Trustees consider matters bearing on the Fund and its advisory arrangements at their meetings throughout the year, including a review of performance data at each regular meeting. In addition, the independent Trustees met several times over the course of three months beginning in May and ending in July, 2019 (“contract review meetings”) for the specific purpose of considering whether to approve the continuation of the investment advisory agreement for the Fund and the other investment companies that the Board oversees (the “MFS Funds”). The independent Trustees were assisted in their evaluation of the Fund’s investment advisory agreement by independent legal counsel, from whom they received separate legal advice and with whom they met separately from MFS during various contract review meetings. The independent Trustees were also assisted in this process by the MFS Funds’ Independent Senior Officer, a senior officer appointed by and reporting to the independent Trustees.
In connection with their deliberations regarding the continuation of the investment advisory agreement, the Trustees, including the independent Trustees, considered such information and factors as they believed, in light of the legal advice furnished to them and their own business judgment, to be relevant. The investment advisory agreement for the Fund was considered separately, although the Trustees also took into account the common interests of all MFS Funds in their review. As described below, the Trustees considered the nature, quality, and extent of the various investment advisory, administrative, and shareholder services performed by MFS under the existing investment advisory agreement and other arrangements with the Fund.
In connection with their contract review meetings, the Trustees received and relied upon materials that included, among other items: (i) information provided by Broadridge Financial Solutions, Inc. (“Broadridge”), an independent third party, on the investment performance of the Fund for various time periods ended December 31, 2018 and the investment performance of a group of funds with substantially similar investment classifications/objectives (the “Broadridge performance universe”), (ii) information provided by Broadridge on the Fund’s advisory fees and other expenses and the advisory fees and other expenses of comparable funds identified by Broadridge as well as all other funds in the same investment classification/category (the “Broadridge expense group and universe”), (iii) information provided by MFS on the advisory fees of portfolios of other clients of MFS, including institutional separate accounts and other clients, (iv) information as to whether and to what extent applicable expense waivers, reimbursements or fee “breakpoints” are observed for the Fund, (v) information regarding MFS’ financial results and financial condition, including MFS’ and certain of its affiliates’ estimated profitability from services performed for the Fund and the MFS Funds as a whole, and compared to MFS’ institutional business, (vi) MFS’ views regarding the outlook for the mutual fund industry and the strategic business plans of MFS, (vii) descriptions of various functions performed by MFS for the Funds, such as compliance monitoring and portfolio trading practices, and (viii) information regarding the overall organization of MFS, including information about MFS’ senior management and other personnel providing investment advisory, administrative and other services to the Fund and the other MFS Funds. The comparative performance, fee and expense information prepared and provided by Broadridge was not independently verified and the independent Trustees did not independently verify any information provided to them by MFS.
The Trustees’ conclusion as to the continuation of the investment advisory agreement was based on a comprehensive consideration of all information provided to the Trustees and not the result of any single factor. Some of the factors that figured particularly in the Trustees’ deliberations are described below, although individual Trustees may have evaluated the information presented differently from one another, giving different weights to various factors. It is also important to recognize that the fee arrangements for the Fund and other MFS Funds are the result of years of review and discussion between the independent Trustees and MFS, that certain aspects of such arrangements may receive greater scrutiny in some years than in others, and that the Trustees’ conclusions may be based, in part, on their consideration of these same arrangements during the course of the year and in prior years.
Based on information provided by Broadridge and MFS, the Trustees reviewed the Fund’s total return investment performance as well as the Broadridge performance universe over various time periods. The Trustees placed particular emphasis on the total return performance of the Fund’s Initial Class shares in comparison to the performance of funds in its Broadridge performance universe over the five-year period ended December 31, 2018, which the Trustees believed was a long enough period to reflect differing market conditions. The total return performance of the Fund’s Initial Class shares was in the 4th quintile relative to the other funds in the universe for this five-year period (the 1st quintile being the best performers and the 5th quintile being the worst performers). The total return performance of the Fund’s Initial Class shares was in the 4th quintile for the one-year period and the 5th quintile for the three-year period ended December 31, 2018 relative to the Broadridge performance universe. Because of the passage of time, these performance results may differ from the performance results for more recent periods, including those shown elsewhere in this report.
The Trustees expressed continued concern to MFS about the substandard investment performance of the Fund and the Fund’s retail counterpart, MFS Blended Research Core Equity Fund, which has substantially similar investment strategies and experienced substantially similar investment performance as the Fund. In the course of their deliberations, the Trustees took into account information provided by MFS in connection with the contract review meetings, as well as during investment review meetings conducted with portfolio management personnel during the course of the year as to MFS’ efforts to improve the performance of the
24
MFS Blended Research Core Equity Portfolio
Board Review of Investment Advisory Agreement – continued
Fund and the Fund’s retail counterpart. In addition, the Trustees requested that they receive a separate update on the Fund’s retail counterpart at each of their regular meetings. After reviewing these and related factors, the Trustees concluded, within the context of their overall conclusions regarding the investment advisory agreement, that MFS’ responses and efforts and plans to improve investment performance were sufficient to support approval of the continuance of the investment advisory agreement for an additional one-year period, but that they would continue to closely monitor the performance of the Fund’s retail counterpart.
In assessing the reasonableness of the Fund’s advisory fee, the Trustees considered, among other information, the Fund’s advisory fee and the total expense ratio of the Fund’s Initial Class shares as a percentage of average daily net assets and the advisory fee and total expense ratios of the Broadridge expense group based on information provided by Broadridge. The Trustees considered that, according to the data provided by Broadridge (which takes into account any fee reductions or expense limitations that were in effect during the Fund’s last fiscal year), the Fund’s effective advisory fee rate and total expense ratio were each lower than the Broadridge expense group median.
The Trustees also considered the advisory fees charged by MFS to any institutional separate accounts advised by MFS (“separate accounts”) and unaffiliated investment companies for which MFS serves as subadviser (“subadvised funds”) that have comparable investment strategies to the Fund, if any. In comparing these fees, the Trustees considered information provided by MFS as to the generally broader scope of services provided by MFS to the Fund, as well as the more extensive regulatory burdens imposed on MFS in managing the Fund, in comparison to separate accounts and subadvised funds. The Trustees also considered the higher demands placed on MFS’ investment personnel and trading infrastructure as a result of the daily cash in-flows and out-flows of the Fund in comparison to separate accounts.
The Trustees also considered whether the Fund may benefit from any economies of scale in the management of the Fund in the event of growth in assets of the Fund and/or growth in assets of the MFS Funds as a whole. They noted that the Fund’s advisory fee rate schedule is subject to contractual breakpoints that reduce the Fund’s advisory fee rate on the Fund’s average daily net assets over $1 billion and $2.5 billion. The Trustees also noted that MFS has agreed in writing to waive a portion of the management fees of certain MFS Funds, including the Fund, if the total combined assets of certain funds within the MFS Funds’ complex increase above agreed upon thresholds (the “group fee waiver”), enabling the Fund’s shareholders to share in the benefits from any economies of scale at the complex level. The group fee waiver is reviewed and renewed annually between the Board and MFS. The Trustees concluded that the breakpoints and the group fee waiver were sufficient to allow the Fund to benefit from economies of scale as its assets and overall complex assets grow.
The Trustees also considered information prepared by MFS relating to MFS’ costs and profits with respect to the Fund, the MFS Funds considered as a group, and other investment companies and accounts advised by MFS, as well as MFS’ methodologies used to determine and allocate its costs to the MFS Funds, the Fund and other accounts and products for purposes of estimating profitability.
After reviewing these and other factors described herein, the Trustees concluded, within the context of their overall conclusions regarding the investment advisory agreement, that the advisory fees charged to the Fund represent reasonable compensation in light of the services being provided by MFS to the Fund.
In addition, the Trustees considered MFS’ resources and related efforts to continue to retain, attract and motivate capable personnel to serve the Fund. The Trustees also considered current and developing conditions in the financial services industry, including the presence of large and well-capitalized companies which are spending, and appear to be prepared to continue to spend, substantial sums to engage personnel and to provide services to competing investment companies. In this regard, the Trustees also considered the financial resources of MFS and its ultimate parent, Sun Life Financial Inc. The Trustees also considered the advantages and possible disadvantages to the Fund of having an adviser that also serves other investment companies as well as other accounts.
The Trustees also considered the nature, quality, cost, and extent of administrative, transfer agency, and distribution services provided to the Fund by MFS and its affiliates under agreements and plans other than the investment advisory agreement, including any 12b-1 fees the Fund pays to MFS Fund Distributors, Inc., an affiliate of MFS. The Trustees also considered the nature, extent and quality of certain other services MFS performs or arranges for on the Fund’s behalf, which may include securities lending programs, directed expense payment programs, class action recovery programs, and MFS’ interaction with third-party service providers, principally custodians and sub-custodians. The Trustees concluded that the various non-advisory services provided by MFS and its affiliates on behalf of the Fund were satisfactory.
The Trustees considered so-called “fall-out benefits” to MFS such as reputational value derived from serving as investment manager to the MFS Funds. The Trustees also considered that, effective January 3, 2018, MFS had discontinued its historic practice of obtaining investment research from portfolio brokerage commissions paid by certain MFS Funds and would thereafter directly pay for or voluntarily reimburse a Fund, if applicable, for the costs of external research acquired through the use of the Fund’s portfolio brokerage commissions.
Based on their evaluation of factors that they deemed to be material, including those factors described above, the Board of Trustees, including the independent Trustees, concluded that the Fund’s investment advisory agreement with MFS should be continued for an additional one-year period, commencing August 1, 2019.
25
MFS Blended Research Core Equity Portfolio
PROXY VOTING POLICIES AND INFORMATION
MFS votes proxies on behalf of the fund pursuant to proxy voting policies and procedures that are available without charge, upon request, by calling 1-800-225-2606, by visitingmfs.com/proxyvoting, or by visiting the SEC’s Web site athttp://www.sec.gov.
Information regarding how the fund voted proxies relating to portfolio securities during the most recent twelve-month period ended June 30 is available by August 31 of each year without charge by visitingmfs.com/proxyvoting, or by visiting the SEC’s Web site athttp://www.sec.gov.
QUARTERLY PORTFOLIO DISCLOSURE
The fund files a complete schedule of portfolio holdings with the SEC for the first and third quarters of each fiscal year as an exhibit to its reports on Form N-PORT. The fund’s Form N-PORT reports are available on the SEC’s website athttp://www.sec.gov.A shareholder can obtain the portfolio holdings report for the first and third quarters of the fund’s fiscal year atmfs.com/vit2 by choosing the fund’s name and then selecting the “Resources” tab and clicking on “Prospectus and Reports”.
FURTHER INFORMATION
From time to time, MFS may post important information about the fund or the MFS funds on the MFS web site (mfs.com). This information is available athttps://www.mfs.com/en-us/what-we-do/announcements.htmlor atmfs.com/vit2 by choosing the fund’s name.
INFORMATION ABOUT FUND CONTRACTS AND LEGAL CLAIMS
The fund has entered into contractual arrangements with an investment adviser, administrator, distributor, shareholder servicing agent, 529 program manager (if applicable), and custodian who each provide services to the fund. Unless expressly stated otherwise, shareholders are not parties to, or intended beneficiaries of these contractual arrangements, and these contractual arrangements are not intended to create any shareholder right to enforce them against the service providers or to seek any remedy under them against the service providers, either directly or on behalf of the fund.
Under the Trust’s By-Laws and Declaration of Trust, any claims asserted against or on behalf of the MFS Funds, including claims against Trustees and Officers, must be brought in state and federal courts located within the Commonwealth of Massachusetts.
FEDERAL TAX INFORMATION (unaudited)
The following information is provided pursuant to provisions of the Internal Revenue Code.
The fund designates $37,260,000 as capital gain dividends paid during the fiscal year.
For corporate shareholders, 100% of the ordinary income dividends paid during the fiscal year qualify for the corporate dividends received deduction.
26
rev. 3/16
| | | | |
| | | |
| FACTS | | WHAT DOES MFS DO WITH YOUR
PERSONAL INFORMATION? | |  |
| | |
| Why? | | Financial companies choose how they share your personal information. Federal law gives consumers the right to limit some but not all sharing. Federal law also requires us to tell you how we collect, share, and protect your personal information. Please read this notice carefully to understand what we do. |
| | |
| What? | | The types of personal information we collect and share depend on the product or service you have with us. This information can include: • Social Security number and account balances • Account transactions and transaction history • Checking account information and wire transfer instructions When you areno longer our customer, we continue to share your information as described in this notice. |
| | |
| How? | | All financial companies need to share customers’ personal information to run their everyday business. In the section below, we list the reasons financial companies can share their customers’ personal information; the reasons MFS chooses to share; and whether you can limit this sharing. |
| | | | |
Reasons we can share your
personal information | | Does MFS share? | | Can you limit this
sharing? |
For our everyday business purposes – such as to process your transactions, maintain your account(s), respond to court orders and legal investigations, or report to credit bureaus | | Yes | | No |
For our marketing purposes – to offer our products and services to you | | No | | We don’t share |
| For joint marketing with other financial companies | | No | | We don’t share |
For our affiliates’ everyday business purposes – information about your transactions and experiences | | No | | We don’t share |
For our affiliates’ everyday business purposes – information about your creditworthiness | | No | | We don’t share |
| For nonaffiliates to market to you | | No | | We don’t share |
| | |
| | |
| Questions? | | Call800-225-2606 or go tomfs.com. |
27
| | |
| Who we are |
| Who is providing this notice? | | MFS Funds, MFS Investment Management, MFS Institutional Advisors, Inc., and MFS Heritage Trust Company. |
| | |
| What we do |
| How does MFS protect my personal information? | | To protect your personal information from unauthorized access and use, we use security measures that comply with federal law. These measures include procedural, electronic, and physical safeguards for the protection of the personal information we collect about you. |
How does MFS
collect my personal information? | | We collect your personal information, for example, when you • open an account or provide account information • direct us to buy securities or direct us to sell your securities • make a wire transfer We also collect your personal information from others, such as credit bureaus, affiliates, or other companies. |
| Why can’t I limit all sharing? | | Federal law gives you the right to limit only • sharing for affiliates’ everyday business purposes – information about your creditworthiness • affiliates from using your information to market to you • sharing for nonaffiliates to market to you State laws and individual companies may give you additional rights to limit sharing. |
| | |
| Definitions |
| Affiliates | | Companies related by common ownership or control. They can be financial and nonfinancial companies. • MFS does not share personal information with affiliates, except for everyday business purposes as described on page one of this notice. |
| Nonaffiliates | | Companies not related by common ownership or control. They can be financial and nonfinancial companies. • MFS does not share with nonaffiliates so they can market to you. |
| Joint marketing | | A formal agreement between nonaffiliated financial companies that together market financial products or services to you. • MFS doesn’t jointly market. |
| | |
| Other important information |
| If you own an MFS product or receive an MFS service in the name of a third party such as a bank or broker-dealer, their privacy policy may apply to you instead of ours. |
28
Annual Report
December 31, 2019

MFS® Corporate Bond Portfolio

MFS® Variable Insurance Trust II
Beginning on January 1, 2021, as permitted by regulations adopted by the U.S. Securities and Exchange Commission, the insurance company that offers your contract may determine that it will no longer send you paper copies of the fund’s annual and semiannual shareholder reports unless you specifically request paper copies from the insurance company or from your financial intermediary. Instead, the shareholder reports will be made available on a Web site (insurancefunds.mfs.com or other Web site of which you will be notified), and the insurance company will notify you by mail each time a report is posted and provide you with a Web site link to access the report. Instructions for requesting paper copies will be provided by your insurance company or financial intermediary.
If you already elected to receive shareholder reports by email, you will not be affected by this change and you need not take any action. If your insurance company or financial intermediary offers electronic delivery, you may elect to receive shareholder reports and other communications from the insurance company or financial intermediary by email by following the instructions provided by the insurance company or financial intermediary.
Beginning on January 1, 2019, you may elect to receive all future reports in paper free of charge from the insurance company or financial intermediary. You can inform the insurance company or financial intermediary that you wish to continue receiving paper copies of your shareholder reports by contacting your insurance company or financial intermediary. Your election to receive reports in paper will apply to all funds held in your account with your insurance company or financial intermediary.
BDS-ANN
MFS® Corporate Bond Portfolio
CONTENTS
The report is prepared for the general information of contract owners. It is authorized for distribution to prospective investors only when preceded or accompanied by a current prospectus.
NOT FDIC INSURED• MAY LOSE VALUE• NO BANK OR CREDIT UNION GUARANTEE• NOT A DEPOSIT• NOT INSURED BY ANY FEDERAL GOVERNMENT AGENCY OR NCUA/NCUSIF
MFS Corporate Bond Portfolio
LETTER FROM THE EXECUTIVE CHAIR

Dear Contract Owners:
Slowing global growth, low inflation, and trade friction between the United States and China have been hallmarks of the past 12 months. After experiencing an uptick in market volatility in late 2018, markets steadied for most of 2019, thanks in large measure to the adoption of a dovish policy stance on the part of global central banks, focused on supporting economic growth. Negotiations aimed at a “phase one” trade deal between the U.S. and China bore fruit at the end of the period, boosting investor sentiment, while signs of stability emerging from the global manufacturing sector also lifted spirits. Uncertainty over Brexit, along with the ripple effects from the trade conflict, hampered business confidence and investment in the United Kingdom and Europe for much of the period, though investors expect greater clarity regarding Brexit as a result of December’s general election. The pro-Brexit Conservative Party won the election by a comfortable margin and set the stage for the U.K.’s departure from the EU at the end of January.
Markets expect the longest economic expansion in U.S. history will continue, albeit at a slower pace, as trade tensions recede. In an effort to prolong the expansion, the U.S. Federal Reserve lowered interest rates three times between July and October and the European Central Bank loosened policy in September. While the global monetary policy backdrop remains quite accommodative, signs of easing trade tensions and fading global recession fears led to improved market sentiment in late 2019 as investors grew less risk averse. In early 2020, an outbreak of coronavirus emanating from China reintroduced global growth fears, causing an uptick in volatility.
Here at MFS®, we aim to help our clients navigate the growing complexity of the markets and world economies. Our long-term investment philosophy and commitment to the responsible allocation of capital allow us to tune out the noise and uncover what we believe are the best, most durable investment opportunities in the market. Through our powerful global investment platform, we combine collective expertise, thoughtful risk management and long-term discipline to create sustainable value for investors.
Respectfully,

Robert J. Manning
Executive Chair
MFS Investment Management
February 14, 2020
The opinions expressed in this letter are subject to change and may not be relied upon for investment advice. No forecasts can be guaranteed.
1
MFS Corporate Bond Portfolio
PORTFOLIO COMPOSITION
Portfolio structure (i)
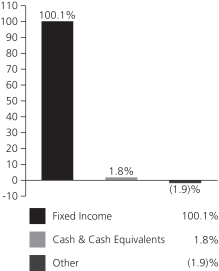
| | | | |
| Fixed income sectors (i) | | | | |
| Investment Grade Corporates | | | 82.3% | |
| High Yield Corporates | | | 8.6% | |
| U.S. Treasury Securities | | | 7.3% | |
| Municipal Bonds | | | 0.9% | |
| Emerging Markets Bonds | | | 0.8% | |
| Commercial Mortgage-Backed Securities | | | 0.1% | |
| Asset-Backed Securities | | | 0.1% | |
| Mortgage-Backed Securities (o) | | | 0.0% | |
| | | | |
| Composition including fixed income credit quality (a)(i) | |
| AA | | | 2.5% | |
| A | | | 21.5% | |
| BBB | | | 59.3% | |
| BB | | | 8.8% | |
| B | | | 0.6% | |
| C (o) | | | 0.0% | |
| D | | | 0.1% | |
| U.S. Government | | | 5.4% | |
| Federal Agencies (o) | | | 0.0% | |
| Not Rated | | | 1.9% | |
| Cash & Cash Equivalents | | | 1.8% | |
| Other | | | (1.9)% | |
| |
| Portfolio facts (i) | | | | |
| Average Duration (d) | | | 7.6 | |
| Average Effective Maturity (m) | | | 10.7 yrs. | |
| (a) | | For all securities other than those specifically described below, ratings are assigned to underlying securities utilizing ratings from Moody’s, Fitch, and Standard & Poor’s rating agencies and applying the following hierarchy: If all three agencies provide a rating, the middle rating (after dropping the highest and lowest ratings) is assigned; if two of the three agencies rate a security, the lower of the two is assigned. Ratings are shown in the S&P and Fitch scale (e.g., AAA). Securities rated BBB or higher are considered investment grade. All ratings are subject to change. U.S. Government includes securities issued by the U.S. Department of the Treasury. Federal Agencies includes rated and unrated U.S. Agency fixed-income securities, U.S. Agency mortgage-backed securities, and collateralized mortgage obligations of U.S. Agency mortgage-backed securities. Not Rated includes fixed income securities and fixed income derivatives, which have not been rated by any rating agency. The fund may or may not have held all of these instruments on this date. The fund is not rated by these agencies. |
| (d) | | Duration is a measure of how much a bond’s price is likely to fluctuate with general changes in interest rates, e.g., if rates rise 1.00%, a bond with a5-year duration is likely to lose about 5.00% of its value due to the interest rate move. |
| (i) | | For purposes of this presentation, the components include the value of securities, and reflect the impact of the equivalent exposure of derivative positions, if any. These amounts may be negative from time to time. Equivalent exposure is a calculated amount that translates the derivative position into a reasonable approximation of the amount of the underlying asset that the portfolio would have to hold at a given point in time to have the same price sensitivity that results from the portfolio’s ownership of the derivative contract. When dealing with derivatives, equivalent exposure is a more representative measure of the potential impact of a position on portfolio performance than value. The bond component will include any accrued interest amounts. |
| (m) | | In determining each instrument’s effective maturity for purposes of calculating the fund’s dollar-weighted average effective maturity, MFS uses the instrument’s stated maturity or, if applicable, an earlier date on which MFS believes it is probable that a maturity-shortening device (such as a put,pre-refunding or prepayment) will cause the instrument to be repaid. Such an earlier date can be substantially shorter than the instrument’s stated maturity. |
Where the fund holds convertible bonds, they are treated as part of the equity portion of the portfolio.
Cash & Cash Equivalents includes any cash, investments in money market funds, short-term securities, and other assets less liabilities. Please see the Statement of Assets and Liabilities for additional information related to the fund’s cash position and other assets and liabilities.
Other includes equivalent exposure from currency derivatives and/or any offsets to derivative positions and may be negative.
Percentages are based on net assets as of December 31, 2019.
The portfolio is actively managed and current holdings may be different.
2
MFS Corporate Bond Portfolio
MANAGEMENT REVIEW
Summary of Results
For the twelve months ended December 31, 2019, Initial Class shares of the MFS Corporate Bond Portfolio (fund) provided a total return of 14.65%, while Service Class shares of the fund provided a total return of 14.46%. These compare with a return of 13.80% over the same period for the fund’s benchmark, the Bloomberg Barclays U.S. Credit Bond Index.
Market Environment
Fading fears of a near-term global recession, the announcement of a partial trade deal between the United States and China and the decline in uncertainty over Brexit helped bolster market sentiment late in the period. Changes in market sentiment, largely driven by uncertainty over the outcome of trade negotiations between the US and China, had contributed to periodic bouts of volatility during the reporting period. The global economy decelerated, led by weakness in China and Europe, although the pace of the slowdown moderated late in the period amid nascent signs of stabilization in the manufacturing sector.
The deteriorating global growth backdrop, along with declining inflationary pressures, prompted the US Federal Reserve to adopt a more dovish posture beginning in early 2019, resulting in the first interest rate cut in over a decade at the end of July, followed by additional cuts in September and October. The Fed’s actions led to a sharp decline in long-term interest rates during the period’s second half, causing the inversion of portions of the US Treasury yield curve for a time. Amid an improvement in risk sentiment in Q4 2019 and indications of a bottoming in growth and a potential upturn in activity, the Fed indicated in October that further rate cuts were unlikely unless the outlook for the economy materially worsened.
Globally, central banks have tilted more dovish as well, with the European Central Bank unveiling a package of easing measures, which included putting overnight rates deeper into negative territory, restarting its bond-buying program and lengthening the term of cheap loans to banks to three years from two. The central banks of India and Australia are among those that have cut rates several times in recent months, although China has been more cautious in increasing liquidity as it keeps trying to deleverage its economy, cutting rates only marginally.
Emerging markets experienced considerable volatility through the end of 2018, as tighter global financial conditions exposed structural weakness in some countries. Those conditions improved in 2019 as the Fed became more dovish. Notwithstanding the periodic headwinds on market sentiment from significant trade friction between the US and China over much of the year, emerging market hard currency debt and local rates benefited from relatively cheap valuations at the beginning of the period and easier global monetary conditions. These factors, plus the fading of certain global risk factors mentioned above, hastened spread tightening in the latter part of the period. At the same time, idiosyncratic risks spiked in some countries (e.g., Argentina and Lebanon), contributing to increased dispersion in performance among sovereign assets.
Contributors to Performance
During the reporting period, the fund’sout-of-benchmark exposure to “BB” rated (r) bonds, and greater exposure to “BBB” rated securities, contributed to performance relative to the Bloomberg Barclays U.S. Credit Bond Index. Additionally, the fund’s lesser exposure to “AA”, “AAA” and “A” rated securities benefited relative returns. Favorable security selection within theconsumer cyclicals, electric, institutional bankingandtechnologysectors, notably within “BBB” rated securities, also bolstered relative results.
Detractors from Performance
The fund’s overweight allocation to theelectricsector,notably within “BBB” rated securities,held back relative performance over the reporting period. Yield curve (y) positioning, particularly the fund’s lesser exposure to shifts at the long end (centered around maturities of 10 or more years) of the yield curve, was another area of relative weakness.
Respectfully,
Portfolio Manager(s)
Alexander Mackey, Henry Peabody, and Robert Persons
Note to Shareholders: Effective December 31, 2019, Henry Peabody was added as a Portfolio Manager of the Fund.
| (r) | Bonds rated “BBB”, “Baa”, or higher are considered investment grade; bonds rated “BB”, “Ba”, or below are considerednon-investment grade. The source for bond quality ratings is Moody’s Investors Service, Standard & Poor’s and Fitch, Inc. and are applied using the following hierarchy: If all three agencies provide a rating, the middle rating (after dropping the highest and lowest ratings) is assigned; if two of the three agencies rate a security, the lower of the two is assigned. Ratings are shown in the S&P and Fitch scale (e.g., AAA). For securities which are not rated by any of the three agencies, the security is considered Not Rated. |
| (y) | A yield curve graphically depicts the yields of different maturity bonds of the same credit quality and type; a normal yield curve is upward sloping, with short-term rates lower than long-term rates. |
3
MFS Corporate Bond Portfolio
Management Review – continued
The views expressed in this report are those of the portfolio manager(s) only through the end of the period of the report as stated on the cover and do not necessarily reflect the views of MFS or any other person in the MFS organization. These views are subject to change at any time based on market or other conditions, and MFS disclaims any responsibility to update such views. These views may not be relied upon as investment advice or an indication of trading intent on behalf of any MFS portfolio. References to specific securities are not recommendations of such securities, and may not be representative of any MFS portfolio’s current or future investments.
4
MFS Corporate Bond Portfolio
PERFORMANCE SUMMARY THROUGH 12/31/19
The following chart illustrates the historical performance of the fund in comparison to its benchmark(s). Benchmarks are unmanaged and may not be invested in directly. Benchmark returns do not reflect any fees or expenses. The performance of other share classes will be greater than or less than that of the class depicted below. (See Notes to Performance Summary.)
Performance data shown represents past performance and is no guarantee of future results. Investment return and principal value fluctuate so your units, when sold, may be worth more or less than the original cost; current performance may be lower or higher than quoted. The performance shown does not reflect the deduction of taxes, if any, that a contract holder would pay on fund distributions or the redemption of contract units. The returns for the fund shown also do not reflect the deduction of expenses associated with variable products, such as mortality and expense risk charges, separate account charges, and sales charges imposed by the insurance company separate accounts. Such expenses would reduce the overall returns shown.
Growth of a Hypothetical $10,000 Investment
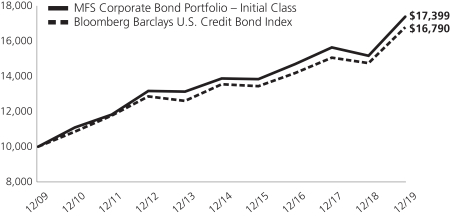
Total Returns through 12/31/19
Average annual total returns
| | | | | | | | | | | | |
| | | Share Class | | Class Inception Date | | 1-yr | | 5-yr | | 10-yr | | |
| | | Initial Class | | 5/06/98 | | 14.65% | | 4.62% | | 5.69% | | |
| | | Service Class | | 8/24/01 | | 14.46% | | 4.35% | | 5.43% | | |
| | | | |
| Comparative benchmark(s) | | | | | | | | |
| | | Bloomberg Barclays U.S. Credit Bond Index (f) | | 13.80% | | 4.39% | | 5.32% | | |
| (f) | Source: FactSet Research Systems Inc. |
Benchmark Definition(s)
Bloomberg Barclays U.S. Credit Bond Index – a market capitalization-weighted index that measures the performance of publicly issued, SEC-registered, U.S. corporate and specified foreign debentures and secured notes that meet specified maturity, liquidity, and quality requirements. BLOOMBERG® is a trademark and service mark of Bloomberg Finance L.P. and its affiliates (collectively “Bloomberg”). BARCLAYS® is a trademark and service mark of Barclays Bank Plc (collectively with its affiliates, “Barclays”), used under license. Bloomberg or Bloomberg’s licensors, including Barclays, own all proprietary rights in the Bloomberg Barclays Indices. Neither Bloomberg nor Barclays approves or endorses this material, or guarantees the accuracy or completeness of any information herein, or makes any warranty, express or implied, as to the results to be obtained therefrom, and, to the maximum extent allowed by law, neither shall have any liability or responsibility for injury or damages arising in connection therewith.
It is not possible to invest directly in an index.
Notes to Performance Summary
Average annual total return represents the average annual change in value for each share class for the periods presented.
Performance results reflect any applicable expense subsidies and waivers in effect during the periods shown. Without such subsidies and waivers the fund’s performance results would be less favorable. Please see the prospectus and financial statements for complete details. All results are historical and assume the reinvestment of any dividends and capital gains distributions.
5
MFS Corporate Bond Portfolio
Performance Summary – continued
Performance results do not include adjustments made for financial reporting purposes in accordance with U.S. generally accepted accounting principles and may differ from amounts reported in the financial highlights.
From time to time the fund may receive proceeds from litigation settlements, without which performance would be lower.
6
MFS Corporate Bond Portfolio
EXPENSE TABLE
Fund Expenses Borne by the Contract Holders during the Period,
July 1, 2019 through December 31, 2019
As a contract holder of the fund, you incur ongoing costs, including management fees; distribution and/or service(12b-1) fees; and other fund expenses. This example is intended to help you understand your ongoing costs (in dollars) of investing in the fund and to compare these costs with the ongoing costs of investing in other mutual funds.
The example is based on an investment of $1,000 invested at the beginning of the period and held for the entire period July 1, 2019 through December 31, 2019.
Actual Expenses
The first line for each share class in the following table provides information about actual account values and actual expenses. You may use the information in this line, together with the amount you invested, to estimate the expenses that you paid over the period. Simply divide your account value by $1,000 (for example, an $8,600 account value divided by $1,000 = 8.6), then multiply the result by the number in the first line under the heading entitled “Expenses Paid During Period” to estimate the expenses you paid on your account during this period.
Hypothetical Example for Comparison Purposes
The second line for each share class in the following table provides information about hypothetical account values and hypothetical expenses based on the fund’s actual expense ratio and an assumed rate of return of 5% per year before expenses, which is not the fund’s actual return. The hypothetical account values and expenses may not be used to estimate the actual ending account balance or expenses you paid for the period. You may use this information to compare the ongoing costs of investing in the fund and other funds. To do so, compare this 5% hypothetical example with the 5% hypothetical examples that appear in the shareholder reports of the other funds.
Please note that the expenses shown in the table are meant to highlight the fund’s ongoing costs only and do not take into account the fees and expenses imposed under the variable contracts through which your investment in the fund is made. Therefore, the second line for each share class in the table is useful in comparing ongoing costs associated with an investment in vehicles (such as the fund) which fund benefits under variable annuity and variable life insurance contracts and to qualified pension and retirement plans only, and will not help you determine the relative total costs of investing in the fund through variable annuity and variable life insurance contracts. If the fees and expenses imposed under the variable contracts were included, your costs would have been higher.
| | | | | | | | | | | | | | | | | | |
| Share Class | | | | Annualized
Expense Ratio | | | Beginning
Account Value
7/01/19 | | | Ending Account Value
12/31/19 | | | Expenses Paid
During Period (p)
7/01/19-12/31/19 | |
| Initial Class | | Actual | | | 0.63% | | | | $1,000.00 | | | | $1,041.48 | | | | $3.24 | |
| | Hypothetical (h) | | | 0.63% | | | | $1,000.00 | | | | $1,022.03 | | | | $3.21 | |
| Service Class | | Actual | | | 0.88% | | | | $1,000.00 | | | | $1,040.17 | | | | $4.53 | |
| | Hypothetical (h) | | | 0.88% | | | | $1,000.00 | | | | $1,020.77 | | | | $4.48 | |
| (h) | 5% class return per year before expenses. |
| (p) | “Expenses Paid During Period” are equal to each class’s annualized expense ratio, as shown above, multiplied by the average account value over the period, multiplied by 184/365 (to reflect theone-half year period). |
7
MFS Corporate Bond Portfolio
PORTFOLIO OF INVESTMENTS – 12/31/19
The Portfolio of Investments is a complete list of all securities owned by your fund. It is categorized by broad-based asset classes.
| | | | | | | | |
| | |
| Issuer | | Shares/Par | | | Value ($) | |
| BONDS – 97.2% | | | | | | | | |
| Aerospace – 3.6% | | | | | | | | |
| Huntington Ingalls Industries, Inc., 3.483%, 12/01/2027 | | $ | 630,000 | | | $ | 654,822 | |
| L3Harris Technologies, Inc., 3.85%, 6/15/2023 (n) | | | 1,083,000 | | | | 1,140,044 | |
L3Harris Technologies, Inc.,
2.9%, 12/15/2029 | | | 632,000 | | | | 641,069 | |
| Lockheed Martin Corp., 3.55%, 1/15/2026 | | | 964,000 | | | | 1,033,270 | |
Northrop Grumman Corp.,
2.55%, 10/15/2022 | | | 1,737,000 | | | | 1,762,407 | |
Northrop Grumman Corp.,
2.93%, 1/15/2025 | | | 1,488,000 | | | | 1,532,982 | |
| TransDigm, Inc., 6.25%, 3/15/2026 (n) | | | 1,109,000 | | | | 1,200,615 | |
| | | | | | | | |
| | | | | | $ | 7,965,209 | |
| | | | | | | | |
| Apparel Manufacturers – 0.4% | | | | | | | | |
| Tapestry, Inc., 4.125%, 7/15/2027 | | $ | 836,000 | | | $ | 853,595 | |
| | | | | | | | |
| Asset-Backed & Securitized – 0.1% | | | | | | | | |
| Bayview Financial Revolving Mortgage Loan Trust, FLR, 3.404% (LIBOR - 1mo. + 1.6%), 12/28/2040 (n) | | $ | 115,551 | | | $ | 115,988 | |
| Greenwich Capital Commercial Funding Corp., 5.619%, 7/10/2038 | | | 54,172 | | | | 54,473 | |
| JPMorgan Chase Commercial Mortgage Securities Corp., 5.784%, 7/15/2042 (n)(q) | | | 200,367 | | | | 136,163 | |
| Lehman Brothers Commercial Conduit Mortgage Trust, 0.947%, 2/18/2030 (i) | | | 22,504 | | | | 0 | |
| | | | | | | | |
| | | | | | $ | 306,624 | |
| | | | | | | | |
| Automotive – 2.4% | | | | | | | | |
| Allison Transmission, Inc., 5.875%, 6/01/2029 (n) | | $ | 717,000 | | | $ | 785,115 | |
| General Motors Co., 6.25%, 10/02/2043 | | | 1,257,000 | | | | 1,408,848 | |
| General Motors Financial Co., Inc., 4.35%, 1/17/2027 | | | 472,000 | | | | 495,685 | |
| Lear Corp., 3.8%, 9/15/2027 | | | 1,276,000 | | | | 1,287,410 | |
| ZF North America Capital, Inc., 4.75%, 4/29/2025 (n) | | | 1,153,000 | | | | 1,211,998 | |
| | | | | | | | |
| | | | | | $ | 5,189,056 | |
| | | | | | | | |
| Broadcasting – 0.8% | | | | | | | | |
| Discovery, Inc., 4.125%, 5/15/2029 | | $ | 373,000 | | | $ | 402,606 | |
| Fox Corp., 4.03%, 1/25/2024 (n) | | | 283,000 | | | | 301,524 | |
| Fox Corp., 5.476%, 1/25/2039 (n) | | | 708,000 | | | | 864,295 | |
| ViacomCBS, Inc., 4.375%, 3/15/2043 | | | 238,000 | | | | 251,700 | |
| | | | | | | | |
| | | | | | $ | 1,820,125 | |
| | | | | | | | |
| Brokerage & Asset Managers – 1.9% | | | | | | | | |
| Charles Schwab Corp., 3.85%, 5/21/2025 | | $ | 1,140,000 | | | $ | 1,234,172 | |
| E*TRADE Financial Corp., 2.95%, 8/24/2022 | | | 625,000 | | | | 636,414 | |
| Intercontinental Exchange, Inc., 3.75%, 12/01/2025 | | | 1,070,000 | | | | 1,151,639 | |
| TD Ameritrade Holding Corp., 3.3%, 4/01/2027 | | | 453,000 | | | | 474,006 | |
| | | | | | | | |
| | |
Issuer | | Shares/Par | | | Value ($) | |
| BONDS – continued | | | | | | | | |
| Brokerage & Asset Managers – continued | | | | | |
| TD Ameritrade Holding Corp., 2.75%, 10/01/2029 | | $ | 630,000 | | | $ | 629,457 | |
| | | | | | | | |
| | | | | | $ | 4,125,688 | |
| | | | | | | | |
| Building – 2.0% | | | | | | | | |
CRH America Finance, Inc.,
4.5%, 4/04/2048 (n) | | $ | 896,000 | | | $ | 975,341 | |
| Martin Marietta Materials, Inc., 4.25%, 7/02/2024 | | | 850,000 | | | | 909,335 | |
| Martin Marietta Materials, Inc., 3.45%, 6/01/2027 | | | 504,000 | | | | 515,340 | |
| Martin Marietta Materials, Inc., 3.5%, 12/15/2027 | | | 747,000 | | | | 774,741 | |
| Masco Corp., 4.45%, 4/01/2025 | | | 560,000 | | | | 609,493 | |
| Masco Corp., 4.375%, 4/01/2026 | | | 476,000 | | | | 513,931 | |
| | | | | | | | |
| | | | | | $ | 4,298,181 | |
| | | | | | | | |
| Business Services – 1.8% | | | | | | | | |
| Equinix, Inc., 2.625%, 11/18/2024 | | $ | 838,000 | | | $ | 839,559 | |
| Fidelity National Information Services, Inc., 3.5%, 4/15/2023 | | | 220,000 | | | | 228,912 | |
| Fidelity National Information Services, Inc., 3%, 8/15/2026 | | | 1,167,000 | | | | 1,206,367 | |
| Fiserv, Inc., 4.4%, 7/01/2049 | | | 711,000 | | | | 804,591 | |
| MSCI, Inc., 4%, 11/15/2029 (n) | | | 791,000 | | | | 801,876 | |
| | | | | | | | |
| | | | | | $ | 3,881,305 | |
| | | | | | | | |
| Cable TV – 2.8% | | | | | | | | |
| Charter Communications Operating LLC/Charter Communications Operating Capital Corp., 6.384%, 10/23/2035 | | $ | 505,000 | | | $ | 636,055 | |
Cox Communications, Inc.,
3.5%, 8/15/2027 (n) | | | 803,000 | | | | 838,818 | |
Cox Communications, Inc.,
4.6%, 8/15/2047 (n) | | | 332,000 | | | | 367,571 | |
Sirius XM Radio, Inc.,
5.375%, 7/15/2026 (n) | | | 353,000 | | | | 374,952 | |
| Sirius XM Radio, Inc., 5%, 8/01/2027 (n) | | | 594,000 | | | | 626,670 | |
| Time Warner Cable, Inc., 5%, 2/01/2020 | | | 354,000 | | | | 354,663 | |
| Time Warner Cable, Inc., 4.5%, 9/15/2042 | | | 955,000 | | | | 973,794 | |
| Time Warner Entertainment Co. LP, 8.375%, 7/15/2033 | | | 266,000 | | | | 372,493 | |
| Videotron Ltd., 5%, 7/15/2022 | | | 1,555,000 | | | | 1,640,525 | |
| | | | | | | | |
| | | | | | $ | 6,185,541 | |
| | | | | | | | |
| Chemicals – 0.3% | | | | | | | | |
| Sherwin-Williams Co., 4.5%, 6/01/2047 | | $ | 500,000 | | | $ | 566,381 | |
| | | | | | | | |
| Computer Software – 1.1% | | | | | | | | |
| Dell International LLC/EMC Corp., 4.9%, 10/01/2026 (n) | | $ | 1,456,000 | | | $ | 1,601,659 | |
| VeriSign, Inc., 4.625%, 5/01/2023 | | | 763,000 | | | | 775,208 | |
| | | | | | | | |
| | | | | | $ | 2,376,867 | |
| | | | | | | | |
8
MFS Corporate Bond Portfolio
Portfolio of Investments – continued
| | | | | | | | |
| | |
| Issuer | | Shares/Par | | | Value ($) | |
| BONDS – continued | | | | | | | | |
| Computer Software – Systems – 0.4% | | | | | |
| Apple, Inc., 4.375%, 5/13/2045 | | $ | 383,000 | | | $ | 462,779 | |
| Apple, Inc., 4.25%, 2/09/2047 | | | 319,000 | | | | 380,751 | |
| | | | | | | | |
| | | | | | $ | 843,530 | |
| | | | | | | | |
| Conglomerates – 1.3% | | | | | | | | |
| Roper Technologies, Inc., 4.2%, 9/15/2028 | | $ | 681,000 | | | $ | 745,424 | |
| Roper Technologies, Inc. , 2.95%, 9/15/2029 | | | 450,000 | | | | 453,919 | |
United Technologies Corp.,
4.125%, 11/16/2028 | | | 517,000 | | | | 581,915 | |
| Wabtec Corp., 4.95%, 9/15/2028 | | | 890,000 | | | | 978,506 | |
| | | | | | | | |
| | | | | | $ | 2,759,764 | |
| | | | | | | | |
| Consumer Products – 0.9% | | | | | | | | |
| Reckitt Benckiser Treasury Services PLC, 3%, 6/26/2027 (n) | | $ | 1,876,000 | | | $ | 1,920,406 | |
| | | | | | | | |
| Consumer Services – 3.9% | | | | | | | | |
| Booking Holdings, Inc., 3.65%, 3/15/2025 | | $ | 283,000 | | | $ | 302,300 | |
| Booking Holdings, Inc., 3.6%, 6/01/2026 | | | 1,761,000 | | | | 1,878,125 | |
| Booking Holdings, Inc., 3.55%, 3/15/2028 | | | 486,000 | | | | 517,261 | |
| Experian Finance PLC, 2.75%, 3/08/2030 (n) | | | 1,853,000 | | | | 1,822,764 | |
| IHS Markit Ltd., 3.625%, 5/01/2024 | | | 310,000 | | | | 322,106 | |
| IHS Markit Ltd., 4.25%, 5/01/2029 | | | 465,000 | | | | 501,093 | |
Service Corp. International,
5.125%, 6/01/2029 | | | 980,000 | | | | 1,041,250 | |
| Visa, Inc., 4.15%, 12/14/2035 | | | 1,413,000 | | | | 1,663,088 | |
| Western Union Co., 2.85%, 1/10/2025 | | | 495,000 | | | | 496,199 | |
| | | | | | | | |
| | | | | | $ | 8,544,186 | |
| | | | | | | | |
| Containers – 1.2% | | | | | | | | |
| Ball Corp., 4%, 11/15/2023 | | $ | 1,009,000 | | | $ | 1,059,450 | |
| Ball Corp., 5.25%, 7/01/2025 | | | 1,492,000 | | | | 1,661,715 | |
| | | | | | | | |
| | | | | | $ | 2,721,165 | |
| | | | | | | | |
| Electrical Equipment – 0.9% | | | | | | | | |
| Arrow Electronics, Inc., 3.875%, 1/12/2028 | | $ | 1,979,000 | | | $ | 2,025,473 | |
| | | | | | | | |
| Electronics – 3.2% | | | | | | | | |
| Broadcom Corp./Broadcom Cayman Finance Ltd., 3.875%, 1/15/2027 | | $ | 2,494,000 | | | $ | 2,587,916 | |
| Broadcom Corp./Broadcom Cayman Finance Ltd., 3.5%, 1/15/2028 | | | 976,000 | | | | 981,843 | |
| Broadcom, Inc., 4.25%, 4/15/2026 (n) | | | 1,267,000 | | | | 1,346,166 | |
| Sensata Technologies, Inc., 4.375%, 2/15/2030 (n) | | | 1,276,000 | | | | 1,300,780 | |
| Texas Instruments, Inc., 2.25%, 9/04/2029 | | | 519,000 | | | | 511,677 | |
| Tyco Electronics Group S.A., 3.5%, 2/03/2022 | | | 252,000 | | | | 259,092 | |
| | | | | | | | |
| | | | | | $ | 6,987,474 | |
| | | | | | | | |
| Emerging Market Quasi-Sovereign – 0.7% | | | | | |
| Petrobras Global Finance B.V. (Federative Republic of Brazil), 6.9%, 3/19/2049 | | $ | 1,414,000 | | | $ | 1,658,622 | |
| | | | | | | | |
| Energy – Integrated – 1.4% | | | | | | | | |
| Eni S.p.A., 4.75%, 9/12/2028 (n) | | $ | 761,000 | | | $ | 860,493 | |
| Eni S.p.A., 4.25%, 5/09/2029 (n) | | | 650,000 | | | | 712,852 | |
| | | | | | | | |
| | |
| Issuer | | Shares/Par | | | Value ($) | |
| BONDS – continued | | | | | | | | |
| Energy – Integrated – continued | | | | | | | | |
| Shell International Finance B.V., 3.75%, 9/12/2046 | | $ | 1,300,000 | | | $ | 1,425,002 | |
| | | | | | | | |
| | | | | | $ | 2,998,347 | |
| | | | | | | | |
| Financial Institutions – 1.8% | | | | | | | | |
AerCap Ireland Capital DAC,
3.65%, 7/21/2027 | | $ | 1,576,000 | | | $ | 1,622,141 | |
| AerCap Ireland Capital Ltd., 4.625%, 10/30/2020 | | | 227,000 | | | | 231,530 | |
AerCap Ireland Capital Ltd.,
4.875%, 1/16/2024 | | | 434,000 | | | | 470,140 | |
| Avolon Holdings Funding Ltd., 4.375%, 5/01/2026 (n) | | | 624,000 | | | | 659,131 | |
| International Lease Finance Corp., 5.875%, 8/15/2022 | | | 1,000,000 | | | | 1,088,971 | |
| | | | | | | | |
| | | | | | $ | 4,071,913 | |
| | | | | | | | |
| Food & Beverages – 3.0% | | | | | | | | |
| Anheuser-Busch InBev Worldwide, Inc., 4.375%, 4/15/2038 | | $ | 527,000 | | | $ | 590,615 | |
| Anheuser-Busch InBev Worldwide, Inc., 5.55%, 1/23/2049 | | | 566,000 | | | | 733,200 | |
Constellation Brands, Inc.,
4.25%, 5/01/2023 | | | 1,605,000 | | | | 1,704,960 | |
| Diageo Capital PLC, 2.375%, 10/24/2029 | | | 1,023,000 | | | | 1,007,805 | |
| JBS USA LLC/JBS USA Finance, Inc., 6.75%, 2/15/2028 (n) | | | 938,000 | | | | 1,036,499 | |
| JBS USA Lux S.A./JBS USA Finance, Inc., 6.5%, 4/15/2029 (n) | | | 714,000 | | | | 793,454 | |
| Tyson Foods, Inc., 4.5%, 6/15/2022 | | | 598,000 | | | | 629,401 | |
| | | | | | | | |
| | | | | | $ | 6,495,934 | |
| | | | | | | | |
| Gaming & Lodging – 2.3% | | | | | | | | |
GLP Capital LP/GLP Financing II, Inc.,
5.75%, 6/01/2028 | | $ | 1,365,000 | | | $ | 1,549,821 | |
GLP Capital LP/GLP Financing II, Inc.,
5.3%, 1/15/2029 | | | 319,000 | | | | 354,313 | |
Hilton Domestic Operating Co., Inc.,
4.875%, 1/15/2030 | | | 922,000 | | | | 976,771 | |
| Las Vegas Sands Corp., 3.9%, 8/08/2029 | | | 250,000 | | | | 260,743 | |
| Marriott International, Inc., 4%, 4/15/2028 | | | 1,749,000 | | | | 1,888,088 | |
| | | | | | | | |
| | | | | | $ | 5,029,736 | |
| | | | | | | | |
| Insurance – 0.7% | | | | | | | | |
American International Group, Inc.,
4.7%, 7/10/2035 | | $ | 1,010,000 | | | $ | 1,168,348 | |
American International Group, Inc.,
4.5%, 7/16/2044 | | | 367,000 | | | | 422,126 | |
| | | | | | | | |
| | | | | | $ | 1,590,474 | |
| | | | | | | | |
| Insurance – Health – 1.1% | | | | | | | | |
| Centene Corp., 4.625%, 12/15/2029 (n) | | $ | 383,000 | | | $ | 403,625 | |
| UnitedHealth Group, Inc., 4.625%, 7/15/2035 | | | 1,690,000 | | | | 2,048,553 | |
| | | | | | | | |
| | | | | | $ | 2,452,178 | |
| | | | | | | | |
9
MFS Corporate Bond Portfolio
Portfolio of Investments – continued
| | | | | | | | |
| | |
| Issuer | | Shares/Par | | | Value ($) | |
| BONDS – continued | | | | | | | | |
| Insurance – Property & Casualty – 3.7% | | | | | |
| Aon Corp., 3.75%, 5/02/2029 | | $ | 1,376,000 | | | $ | 1,472,786 | |
| Berkshire Hathaway, Inc., 2.75%, 3/15/2023 | | | 828,000 | | | | 848,538 | |
| Chubb INA Holdings, Inc., 2.3%, 11/03/2020 | | | 343,000 | | | | 344,199 | |
| Hartford Financial Services Group, Inc., 3.6%, 8/19/2049 | | | 874,000 | | | | 896,768 | |
Liberty Mutual Group, Inc.,
3.951%, 10/15/2050 (n) | | | 743,000 | | | | 770,248 | |
Marsh & McLennan Cos., Inc.,
4.8%, 7/15/2021 | | | 900,000 | | | | 932,372 | |
Marsh & McLennan Cos., Inc.,
3.5%, 6/03/2024 | | | 779,000 | | | | 817,731 | |
Marsh & McLennan Cos., Inc.,
4.75%, 3/15/2039 | | | 740,000 | | | | 892,546 | |
Marsh & McLennan Cos., Inc.,
4.35%, 1/30/2047 | | | 471,000 | | | | 540,944 | |
| Swiss Re Ltd., 4.25%, 12/06/2042 (n) | | | 468,000 | | | | 539,265 | |
| | | | | | | | |
| | | | | | $ | 8,055,397 | |
| | | | | | | | |
| Machinery & Tools – 0.7% | | | | | | | | |
| CNH Industrial Capital LLC, 4.2%, 1/15/2024 | | $ | 515,000 | | | $ | 545,168 | |
CNH Industrial Capital LLC,
3.85%, 11/15/2027 | | | 905,000 | | | | 943,789 | |
| | | | | | | | |
| | | | | | $ | 1,488,957 | |
| | | | | | | | |
| Major Banks – 13.4% | | | | | | | | |
| Bank of America Corp., 3.124% to 1/20/2022, FLR (LIBOR - 3mo. + 1.16%) to 1/20/2023 | | $ | 1,232,000 | | | $ | 1,256,265 | |
| Bank of America Corp., 3.004%, 12/20/2023 | | | 739,000 | | | | 756,809 | |
| Bank of America Corp., 4.125%, 1/22/2024 | | | 1,917,000 | | | | 2,061,841 | |
| Bank of America Corp., 4.2%, 8/26/2024 | | | 1,434,000 | | | | 1,539,234 | |
| Bank of America Corp., 3.419% to 12/20/2027, FLR (LIBOR - 3mo. + 1.04%) to 12/20/2028 | | | 351,000 | | | | 368,091 | |
| Bank of America Corp., 6.1%, 12/29/2049 | | | 1,420,000 | | | | 1,581,596 | |
| Bank of America Corp., 5.875%, 12/31/2059 | | | 936,000 | | | | 1,037,837 | |
| HSBC Holdings PLC, 4.375%, 11/23/2026 | | | 941,000 | | | | 1,018,522 | |
| JPMorgan Chase & Co., 4.5%, 1/24/2022 | | | 790,000 | | | | 829,245 | |
| JPMorgan Chase & Co., 3.25%, 9/23/2022 | | | 2,397,000 | | | | 2,478,743 | |
| JPMorgan Chase & Co., 3.125%, 1/23/2025 | | | 688,000 | | | | 717,775 | |
| JPMorgan Chase & Co., 3.54%, 5/01/2028 | | | 1,709,000 | | | | 1,813,743 | |
| JPMorgan Chase & Co., 3.964%, 11/15/2048 | | | 1,500,000 | | | | 1,697,418 | |
| JPMorgan Chase & Co., 3.897%, 1/23/2049 | | | 1,111,000 | | | | 1,246,277 | |
| JPMorgan Chase & Co., 6.75%, 1/29/2049 | | | 1,221,000 | | | | 1,378,814 | |
| Morgan Stanley, 4.431%, 1/23/2030 | | | 439,000 | | | | 495,874 | |
| PNC Bank N.A., 2.7%, 10/22/2029 | | | 675,000 | | | | 673,620 | |
| Royal Bank of Canada, 2.55%, 7/16/2024 | | | 2,936,000 | | | | 2,978,538 | |
| Sumitomo Mitsui Financial Group, Inc., 3.102%, 1/17/2023 | | | 1,861,000 | | | | 1,907,697 | |
| Wachovia Corp., 6.605%, 10/01/2025 | | | 1,270,000 | | | | 1,522,309 | |
| Wells Fargo & Co., 3.75%, 1/24/2024 | | | 1,037,000 | | | | 1,095,291 | |
| Wells Fargo & Co., 2.879%, 10/30/2030 | | | 1,050,000 | | | | 1,055,695 | |
| | | | | | | | |
| | | | | | $ | 29,511,234 | |
| | | | | | | | |
| | | | | | | | |
| | |
| Issuer | | Shares/Par | | | Value ($) | |
| BONDS – continued | | | | | | | | |
| Medical & Health Technology & Services – 4.5% | | | | | |
| Alcon, Inc., 3.8%, 9/23/2049 (n) | | $ | 247,000 | | | $ | 258,294 | |
| Becton, Dickinson and Co., 3.734%, 12/15/2024 | | | 161,000 | | | | 170,535 | |
| Becton, Dickinson and Co., 4.685%, 12/15/2044 | | | 847,000 | | | | 988,403 | |
Becton, Dickinson and Co.,
4.669%, 6/06/2047 | | | 955,000 | | | | 1,135,064 | |
| Cigna Corp., 4.125%, 11/15/2025 | | | 945,000 | | | | 1,024,468 | |
| HCA, Inc., 4.75%, 5/01/2023 | | | 910,000 | | | | 974,271 | |
| HCA, Inc., 5.25%, 6/15/2026 | | | 978,000 | | | | 1,094,678 | |
| HCA, Inc., 5.875%, 2/01/2029 | | | 472,000 | | | | 545,750 | |
| HCA, Inc., 5.125%, 6/15/2039 | | | 207,000 | | | | 228,449 | |
| IQVIA Holdings, Inc., 5%, 5/15/2027 (n) | | | 856,000 | | | | 905,524 | |
| Laboratory Corp. of America Holdings, 3.25%, 9/01/2024 | | | 917,000 | | | | 953,178 | |
| Laboratory Corp. of America Holdings, 4.7%, 2/01/2045 | | | 900,000 | | | | 1,010,515 | |
| Thermo Fisher Scientific, Inc., 2.95%, 9/19/2026 | | | 555,000 | | | | 570,164 | |
| | | | | | | | |
| | | | | | $ | 9,859,293 | |
| | | | | | | | |
| Medical Equipment – 1.1% | | | | | | | | |
| Abbott Laboratories, 4.75%, 11/30/2036 | | $ | 836,000 | | | $ | 1,043,356 | |
| Boston Scientific Corp., 3.75%, 3/01/2026 | | | 548,000 | | | | 586,831 | |
| Teleflex, Inc., 4.625%, 11/15/2027 | | | 125,000 | | | | 132,476 | |
| Zimmer Biomet Holdings, Inc., FLR, 2.652% (LIBOR - 3mo. + 0.75%), 3/19/2021 | | | 774,000 | | | | 774,076 | |
| | | | | | | | |
| | | | | | $ | 2,536,739 | |
| | | | | | | | |
| Metals & Mining – 0.4% | | | | | | | | |
Glencore Funding LLC,
4.125%, 5/30/2023 (n) | | $ | 863,000 | | | $ | 899,336 | |
| | | | | | | | |
| Midstream – 4.1% | | | | | | | | |
| APT Pipelines Ltd., 5%, 3/23/2035 (n) | | $ | 1,375,000 | | | $ | 1,551,871 | |
| Cheniere Energy, Inc., 4.5%, 10/01/2029 (n) | | | 312,000 | | | | 320,611 | |
| Cheniere Energy, Inc., 3.7%, 11/15/2029 (n) | | | 669,000 | | | | 682,234 | |
| Enterprise Products Operating LLC, 4.2%, 1/31/2050 | | | 724,000 | | | | 774,439 | |
| Kinder Morgan Energy Partners LP, 6.85%, 2/15/2020 | | | 370,000 | | | | 371,867 | |
| MPLX LP, 4.5%, 4/15/2038 | | | 744,000 | | | | 755,338 | |
| Plains All American Pipeline, 3.55%, 12/15/2029 | | | 715,000 | | | | 703,743 | |
Sabine Pass Liquefaction LLC,
5.625%, 4/15/2023 | | | 1,467,000 | | | | 1,595,778 | |
Sabine Pass Liquefaction LLC,
5.625%, 3/01/2025 | | | 133,000 | | | | 149,664 | |
Sabine Pass Liquefaction LLC,
5.875%, 6/30/2026 | | | 289,000 | | | | 331,612 | |
| Sabine Pass Liquefaction LLC, 5%, 3/15/2027 | | | 542,000 | | | | 596,018 | |
| Sabine Pass Liquefaction LLC, 4.2%, 3/15/2028 | | | 1,021,000 | | | | 1,081,040 | |
| | | | | | | | |
| | | | | | $ | 8,914,215 | |
| | | | | | | | |
10
MFS Corporate Bond Portfolio
Portfolio of Investments – continued
| | | | | | | | |
| | |
| Issuer | | Shares/Par | | | Value ($) | |
| BONDS – continued | | | | | | | | |
| Mortgage-Backed – 0.0% | | | | | | | | |
| Freddie Mac, 3.244%, 8/25/2027 | | $ | 69,000 | | | $ | 73,152 | |
| | | | | | | | |
| Municipals – 0.8% | | | | | | | | |
| New Jersey Economic Development Authority State Pension Funding Rev., “A”, 7.425%, 2/15/2029 | | $ | 1,500,000 | | | $ | 1,880,595 | |
| | | | | | | | |
| Natural Gas – Distribution – 3.1% | | | | | | | | |
| NiSource Finance Corp., 3.85%, 2/15/2023 | | $ | 1,106,000 | | | $ | 1,152,174 | |
| NiSource Finance Corp., 4.8%, 2/15/2044 | | | 761,000 | | | | 882,714 | |
| NiSource, Inc., 2.95%, 9/01/2029 | | | 1,371,000 | | | | 1,364,404 | |
| NiSource, Inc., 5.65%, 2/01/2045 | | | 475,000 | | | | 605,274 | |
| Sempra Energy, 3.25%, 6/15/2027 | | | 2,779,000 | | | | 2,858,833 | |
| | | | | | | | |
| | | | | | $ | 6,863,399 | |
| | | | | | | | |
| Network & Telecom – 1.5% | | | | | | | | |
| AT&T, Inc., 5.35%, 12/15/2043 | | $ | 685,000 | | | $ | 810,055 | |
| AT&T, Inc., 4.75%, 5/15/2046 | | | 1,136,000 | | | | 1,281,912 | |
| AT&T, Inc., 5.15%, 11/15/2046 | | | 445,000 | | | | 531,359 | |
| AT&T, Inc., 5.65%, 2/15/2047 | | | 452,000 | | | | 575,001 | |
| | | | | | | | |
| | | | | | $ | 3,198,327 | |
| | | | | | | | |
| Oils – 2.4% | | | | | | | | |
Marathon Petroleum Corp.,
4.75%, 9/15/2044 | | $ | 910,000 | | | $ | 997,651 | |
Marathon Petroleum Corp.,
4.5%, 4/01/2048 | | | 433,000 | | | | 459,349 | |
| Valero Energy Corp., 3.4%, 9/15/2026 | | | 1,601,000 | | | | 1,676,476 | |
| Valero Energy Corp., 4.9%, 3/15/2045 | | | 1,783,000 | | | | 2,053,107 | |
| | | | | | | | |
| | | | | | $ | 5,186,583 | |
| | | | | | | | |
| Other Banks & Diversified Financials – 1.0% | | | | | |
| Capital One Financial Corp., 3.75%, 4/24/2024 | | $ | 796,000 | | | $ | 837,670 | |
| Groupe BPCE S.A., 4.5%, 3/15/2025 (n) | | | 760,000 | | | | 818,437 | |
| Macquarie Bank Ltd. of London, 6.125% to 9/12/2025, FLR (Swap Rate - 5yr. + 4.332%) to 12/31/2165 (n) | | | 444,000 | | | | 459,540 | |
| | | | | | | | |
| | | | | | $ | 2,115,647 | |
| | | | | | | | |
| Pharmaceuticals – 0.8% | | | | | | | | |
| Elanco Animal Health, Inc., 4.9%, 8/28/2028 | | $ | 1,624,000 | | | $ | 1,765,092 | |
| | | | | | | | |
| Pollution Control – 1.1% | | | | | | | | |
| Republic Services, Inc., 5.25%, 11/15/2021 | | $ | 1,160,000 | | | $ | 1,230,099 | |
| Republic Services, Inc., 3.95%, 5/15/2028 | | | 1,100,000 | | | | 1,210,691 | |
| | | | | | | | |
| | | | | | $ | 2,440,790 | |
| | | | | | | | |
| Railroad & Shipping – 0.2% | | | | | | | | |
| Canadian Pacific Railway Co., 4.5%, 1/15/2022 | | $ | 400,000 | | | $ | 419,109 | |
| | | | | | | | |
| Real Estate – Retail – 0.6% | | | | | | | | |
| VEREIT Operating Partnership LP, REIT, 3.1%, 12/15/2029 | | $ | 1,317,000 | | | $ | 1,293,168 | |
| | | | | | | | |
| Retailers – 1.5% | | | | | | | | |
| Best Buy Co., Inc., 5.5%, 3/15/2021 | | $ | 31,000 | | | $ | 31,992 | |
| Best Buy Co., Inc., 4.45%, 10/01/2028 | | | 973,000 | | | | 1,066,536 | |
| | | | | | | | |
| | |
| Issuer | | Shares/Par | | | Value ($) | |
| BONDS – continued | | | | | | | | |
| Retailers – continued | | | | | | | | |
| Dollar Tree, Inc., 4%, 5/15/2025 | | $ | 874,000 | | | $ | 934,166 | |
| Dollar Tree, Inc., 4.2%, 5/15/2028 | | | 368,000 | | | | 394,285 | |
| Home Depot, Inc., 4.875%, 2/15/2044 | | | 760,000 | | | | 964,476 | |
| | | | | | | | |
| | | | | | $ | 3,391,455 | |
| | | | | | | | |
| Specialty Chemicals – 0.3% | | | | | | | | |
| Ecolab, Inc., 4.35%, 12/08/2021 | | $ | 656,000 | | | $ | 686,748 | |
| | | | | | | | |
| Telecommunications – Wireless – 3.0% | | | | | |
American Tower Corp., REIT,
3.5%, 1/31/2023 | | $ | 371,000 | | | $ | 384,409 | |
| American Tower Corp., REIT, 3%, 6/15/2023 | | | 1,049,000 | | | | 1,073,644 | |
| American Tower Corp., REIT, 4%, 6/01/2025 | | | 1,000,000 | | | | 1,069,860 | |
American Tower Corp., REIT,
3.6%, 1/15/2028 | | | 1,133,000 | | | | 1,189,168 | |
American Tower Corp., REIT,
3.8%, 8/15/2029 | | | 553,000 | | | | 590,396 | |
Crown Castle International Corp.,
5.25%, 1/15/2023 | | | 470,000 | | | | 510,336 | |
Crown Castle International Corp., 3.15%, 7/15/2023 | | | 878,000 | | | | 905,510 | |
Crown Castle International Corp.,
4.45%, 2/15/2026 | | | 338,000 | | | | 369,964 | |
Crown Castle International Corp.,
3.7%, 6/15/2026 | | | 533,000 | | | | 562,903 | |
| | | | | | | | |
| | | | | | $ | 6,656,190 | |
| | | | | | | | |
| Tobacco – 0.1% | | | | | | | | |
| Reynolds American, Inc., 3.25%, 6/12/2020 | | $ | 165,000 | | | $ | 165,751 | |
| | | | | | | | |
| Transportation – Services – 0.5% | | | | | | | | |
ERAC USA Finance LLC,
3.85%, 11/15/2024 (n) | | $ | 272,000 | | | $ | 287,744 | |
| ERAC USA Finance LLC, 7%, 10/15/2037 (n) | | | 421,000 | | | | 594,377 | |
| ERAC USA Finance LLC, 4.5%, 2/15/2045 (n) | | | 201,000 | | | | 221,073 | |
| | | | | | | | |
| | | | | | $ | 1,103,194 | |
| | | | | | | | |
| U.S. Treasury Obligations – 5.4% | | | | | | | | |
| U.S. Treasury Bonds, 3.5%, 2/15/2039 (f) | | $ | 5,277,000 | | | $ | 6,316,766 | |
| U.S. Treasury Bonds, 3%, 2/15/2048 | | | 4,877,300 | | | | 5,476,533 | |
| | | | | | | | |
| | | | | | $ | 11,793,299 | |
| | | | | | | | |
| Utilities – Electric Power – 7.0% | | | | | | | | |
Berkshire Hathaway Energy,
4.5%, 2/01/2045 | | $ | 597,000 | | | $ | 701,681 | |
| Duke Energy Corp., 3.75%, 9/01/2046 | | | 1,059,000 | | | | 1,092,031 | |
Duke Energy Progress LLC,
3.45%, 3/15/2029 | | | 582,000 | | | | 622,998 | |
| Emera U.S. Finance LP, 2.7%, 6/15/2021 | | | 330,000 | | | | 332,987 | |
| Emera U.S. Finance LP, 3.55%, 6/15/2026 | | | 378,000 | | | | 392,304 | |
Enel Finance International N.V.,
2.75%, 4/06/2023 (n) | | | 1,974,000 | | | | 1,986,972 | |
Enel Finance International N.V.,
2.65%, 9/10/2024 | | | 1,734,000 | | | | 1,738,264 | |
Enel Finance International N.V.,
3.625%, 5/25/2027 (n) | | | 471,000 | | | | 487,465 | |
Enel Finance International N.V.,
4.75%, 5/25/2047 (n) | | | 460,000 | | | | 516,536 | |
11
MFS Corporate Bond Portfolio
Portfolio of Investments – continued
| | | | | | | | |
| | |
| Issuer | | Shares/Par | | | Value ($) | |
| BONDS – continued | | | | | | | | |
| Utilities – Electric Power – continued | | | | | |
| Evergy, Inc., 2.9%, 9/15/2029 | | $ | 1,510,000 | | | $ | 1,500,658 | |
| Eversource Energy, 2.9%, 10/01/2024 | | | 991,000 | | | | 1,012,172 | |
| Exelon Corp., 3.497%, 6/01/2022 | | | 1,163,000 | | | | 1,193,903 | |
| FirstEnergy Corp., 3.9%, 7/15/2027 | | | 707,000 | | | | 755,404 | |
| NextEra Energy Capital Holdings, Inc., 3.15%, 4/01/2024 | | | 1,283,000 | | | | 1,329,498 | |
| PPL Capital Funding, Inc., 5%, 3/15/2044 | | | 590,000 | | | | 677,568 | |
| Southern Co., 2.95%, 7/01/2023 | | | 440,000 | | | | 451,060 | |
Virginia Electric & Power Co.,
2.875%, 7/15/2029 | | | 579,000 | | | | 592,473 | |
| | | | | | | | |
| | | | | | $ | 15,383,974 | |
| | | | | | | | |
Total Bonds
(Identified Cost, $198,872,247) | | | | | | $ | 213,349,418 | |
| | | | | | | | |
| | | | | | | | |
| | |
| Issuer | | Shares/Par | | | Value ($) | |
| INVESTMENT COMPANIES (h) – 2.0% | | | | | |
| Money Market Funds – 2.0% | | | | | |
| MFS Institutional Money Market Portfolio, 1.7% (v) (Identified Cost, $4,381,121) | | | 4,381,121 | | | $ | 4,381,121 | |
| | | | | | | | |
OTHER ASSETS, LESS
LIABILITIES – 0.8% | | | | | | | 1,816,682 | |
| | | | | | | | |
| NET ASSETS – 100.0% | | | | | | $ | 219,547,221 | |
| | | | | | | | |
| (f) | | All or a portion of the security has been segregated as collateral for open futures contracts. |
| (h) | | An affiliated issuer, which may be considered one in which the fund owns 5% or more of the outstanding voting securities, or a company which is under common control. At period end, the aggregate values of the fund’s investments in affiliated issuers and in unaffiliated issuers were $4,381,121 and $213,349,418, respectively. |
| (i) | | Interest only security for which the fund receives interest on notional principal (Par amount). Par amount shown is the notional principal and does not reflect the cost of the security. |
| (n) | | Securities exempt from registration under Rule 144A of the Securities Act of 1933. These securities may be sold in the ordinary course of business in transactions exempt from registration, normally to qualified institutional buyers. At period end, the aggregate value of these securities was $33,498,326, representing 15.3% of net assets. |
| (q) | | Interest received was less than stated coupon rate. |
| (v) | | Affiliated issuer that is available only to investment companies managed by MFS. The rate quoted for the MFS Institutional Money Market Portfolio is the annualizedseven-day yield of the fund at period end. |
The following abbreviations are used in this report and are defined:
| FLR | | Floating Rate. Interest rate resets periodically based on the parenthetically disclosed reference rate plus a spread (if any). Theperiod-end rate reported may not be the current rate. All reference rates are USD unless otherwise noted. |
| LIBOR | | London Interbank Offered Rate |
| REIT | | Real Estate Investment Trust |
Derivative Contracts at 12/31/19
Futures Contracts
| | | | | | | | | | | | | | | | | | | | | | | | |
| Description | | Long/
Short | | | Currency | | | Contracts | | | Notional
Amount | | | Expiration
Date | | | Value/
Unrealized
Appreciation
(Depreciation) | |
| Asset Derivatives | | | | | | | | | | | | | | | | | | | | | | | | |
| Interest Rate Futures | | | | | | | | | | | | | | | | | | | | | | | | |
| U.S. Treasury Note 10 yr | | | Short | | | | USD | | | | 100 | | | | $12,842,187 | | | | March - 2020 | | | | $135,232 | |
| U.S. Treasury Ultra Note 10 yr | | | Short | | | | USD | | | | 30 | | | | 4,221,094 | | | | March- 2020 | | | | 61,351 | |
| | | | | | | | | | | | | | | | | | | | | | | | |
| | | | | | | | | | | | | | | | | | | | | | | $196,583 | |
| | | | | | | | | | | | | | | | | | | | | | | | |
| Liability Derivatives | | | | | | | | | | | | | | | | | | | | | | | | |
| Interest Rate Futures | | | | | | | | | | | | | | | | | | | | | | | | |
| U.S. Treasury Note 2 yr | | | Long | | | | USD | | | | 80 | | | | $17,240,000 | | | | March - 2020 | | | | $(14,119 | ) |
| U.S. Treasury Ultra Bond | | | Long | | | | USD | | | | 22 | | | | 3,996,437 | | | | March - 2020 | | | | (154,564 | ) |
| | | | | | | | | | | | | | | | | | | | | | | | |
| | | | | | | | | | | | | | | | | | | | | | | $(168,683 | ) |
| | | | | | | | | | | | | | | | | | | | | | | | |
At December 31, 2019, the fund had liquid securities with an aggregate value of $94,566 to cover any collateral or margin obligations for certain derivative contracts.
See Notes to Financial Statements
12
MFS Corporate Bond Portfolio
FINANCIAL STATEMENTS | STATEMENT OF ASSETS AND LIABILITIES
This statement represents your fund’s balance sheet, which details the assets and liabilities comprising the total value of the fund.
| | | | |
At 12/31/19 | | | | |
| |
Assets | | | | |
Investments in unaffiliated issuers, at value (identified cost, $198,872,247) | | | $213,349,418 | |
Investments in affiliated issuers, at value (identified cost, $4,381,121) | | | 4,381,121 | |
Cash | | | 2,998 | |
Receivables for | | | | |
Fund shares sold | | | 5,175 | |
Interest | | | 2,237,931 | |
Other assets | | | 1,468 | |
Total assets | | | $219,978,111 | |
| |
Liabilities | | | | |
Payables for | | | | |
Net daily variation margin on open futures contracts | | | $5,577 | |
Fund shares reacquired | | | 347,531 | |
Payable to affiliates | | | | |
Investment adviser | | | 2,759 | |
Administrative services fee | | | 212 | |
Shareholder servicing costs | | | 14 | |
Distribution and/or service fees | | | 2,225 | |
Payable for independent Trustees’ compensation | | | 84 | |
Accrued expenses and other liabilities | | | 72,488 | |
Total liabilities | | | $430,890 | |
Net assets | | | $219,547,221 | |
| |
Net assets consist of | | | | |
Paid-in capital | | | $197,817,577 | |
Total distributable earnings (loss) | | | 21,729,644 | |
Net assets | | | $219,547,221 | |
Shares of beneficial interest outstanding | | | 18,577,026 | |
| | | | | | | | | | | | |
| | | |
| | | Net assets | | | Shares
outstanding | | | Net asset value
per share | |
Initial Class | | | $57,713,814 | | | | 4,834,631 | | | | $11.94 | |
Service Class | | | 161,833,407 | | | | 13,742,395 | | | | 11.78 | |
See Notes to Financial Statements
13
MFS Corporate Bond Portfolio
FINANCIAL STATEMENTS | STATEMENT OF OPERATIONS
This statement describes how much your fund earned in investment income and accrued in expenses. It also describes any gains and/or losses generated by fund operations.
| | | | |
Year ended 12/31/19 | | | | |
| |
Net investment income (loss) | | | | |
Income | | | | |
Interest | | | $8,641,436 | |
Dividends from affiliated issuers | | | 82,535 | |
Other | | | 48 | |
Total investment income | | | $8,724,019 | |
Expenses | | | | |
Management fee | | | $1,321,798 | |
Distribution and/or service fees | | | 405,852 | |
Shareholder servicing costs | | | 4,223 | |
Administrative services fee | | | 40,361 | |
Independent Trustees’ compensation | | | 10,146 | |
Custodian fee | | | 13,918 | |
Shareholder communications | | | 12,128 | |
Audit and tax fees | | | 75,704 | |
Legal fees | | | 1,900 | |
Miscellaneous | | | 31,601 | |
Total expenses | | | $1,917,631 | |
Reduction of expenses by investment adviser | | | (121,787 | ) |
Net expenses | | | $1,795,844 | |
Net investment income (loss) | | | $6,928,175 | |
| |
Realized and unrealized gain (loss) | | | | |
Realized gain (loss) (identified cost basis) | | | | |
Unaffiliated issuers | | | $2,687,286 | |
Affiliated issuers | | | 345 | |
Futures contracts | | | (106,208 | ) |
Net realized gain (loss) | | | $2,581,423 | |
Change in unrealized appreciation or depreciation | | | | |
Unaffiliated issuers | | | $20,170,803 | |
Affiliated issuers | | | (99 | ) |
Futures contracts | | | 27,900 | |
Net unrealized gain (loss) | | | $20,198,604 | |
Net realized and unrealized gain (loss) | | | $22,780,027 | |
Change in net assets from operations | | | $29,708,202 | |
See Notes to Financial Statements
14
MFS Corporate Bond Portfolio
FINANCIAL STATEMENTS | STATEMENTS OF CHANGES IN NET ASSETS
These statements describe the increases and/or decreases in net assets resulting from operations, any distributions, and any shareholder transactions.
| | | | | | | | |
| | | Year ended | |
| | | 12/31/19 | | | 12/31/18 | |
Change in net assets | | | | | | | | |
| | |
From operations | | | | | | | | |
Net investment income (loss) | | | $6,928,175 | | | | $7,734,863 | |
Net realized gain (loss) | | | 2,581,423 | | | | (982,075 | ) |
Net unrealized gain (loss) | | | 20,198,604 | | | | (15,069,804 | ) |
Change in net assets from operations | | | $29,708,202 | | | | $(8,317,016 | ) |
Total distributions to shareholders | | | $(8,024,012 | ) | | | $(9,639,419 | ) |
Change in net assets from fund share transactions | | | $(13,013,178 | ) | | | $(30,948,965 | ) |
Total change in net assets | | | $8,671,012 | | | | $(48,905,400 | ) |
| | |
Net assets | | | | | | | | |
At beginning of period | | | 210,876,209 | | | | 259,781,609 | |
At end of period | | | $219,547,221 | | | | $210,876,209 | |
See Notes to Financial Statements
15
MFS Corporate Bond Portfolio
FINANCIAL STATEMENTS | FINANCIAL HIGHLIGHTS
The financial highlights table is intended to help you understand the fund’s financial performance for the past 5 years. Certain information reflects financial results for a single fund share. The total returns in the table represent the rate that an investor would have earned (or lost) on an investment in the fund share class (assuming reinvestment of all distributions) held for the entire period.
| | | | | | | | | | | | | | | | | | | | |
| Initial Class | | Year ended | |
| | | | | |
| | | 12/31/19 | | | 12/31/18 | | | 12/31/17 | | | 12/31/16 | | | 12/31/15 | |
| | | | | |
Net asset value, beginning of period | | | $10.81 | | | | $11.64 | | | | $11.36 | | | | $11.16 | | | | $11.76 | |
| | | | | |
| Income (loss) from investment operations | | | | | | | | | | | | �� | | | | | | | | |
Net investment income (loss) (d) | | | $0.39 | | | | $0.38 | | | | $0.39 | | | | $0.41 | (c) | | | $0.42 | |
Net realized and unrealized gain (loss) | | | 1.19 | | | | (0.72 | ) | | | 0.33 | | | | 0.31 | | | | (0.46 | ) |
Total from investment operations | | | $1.58 | | | | $(0.34 | ) | | | $0.72 | | | | $0.72 | | | | $(0.04 | ) |
| | | | | |
| Less distributions declared to shareholders | | | | | | | | | | | | | | | | | | | | |
From net investment income | | | $(0.45 | ) | | | $(0.44 | ) | | | $(0.44 | ) | | | $(0.50 | ) | | | $(0.48 | ) |
From net realized gain | | | — | | | | (0.05 | ) | | | — | | | | (0.02 | ) | | | (0.08 | ) |
Total distributions declared to shareholders | | | $(0.45 | ) | | | $(0.49 | ) | | | $(0.44 | ) | | | $(0.52 | ) | | | $(0.56 | ) |
Net asset value, end of period (x) | | | $11.94 | | | | $10.81 | | | | $11.64 | | | | $11.36 | | | | $11.16 | |
Total return (%) (k)(r)(s)(x) | | | 14.65 | | | | (3.00 | ) | | | 6.39 | | | | 6.28 | (c) | | | (0.31 | ) |
| | | | | |
Ratios (%) (to average net assets)
and Supplemental data: | | | | | | | | | | | | | | | | | | | | |
Expenses before expense reductions (f) | | | 0.69 | | | | 0.68 | | | | 0.68 | | | | 0.65 | (c) | | | 0.68 | |
Expenses after expense reductions (f) | | | 0.63 | | | | 0.63 | | | | 0.63 | | | | 0.60 | (c) | | | 0.63 | |
Net investment income (loss) | | | 3.33 | | | | 3.44 | | | | 3.37 | | | | 3.52 | (c) | | | 3.64 | |
Portfolio turnover | | | 34 | | | | 32 | | | | 36 | | | | 31 | | | | 26 | |
Net assets at end of period (000 omitted) | | | $57,714 | | | | $56,506 | | | | $65,445 | | | | $66,858 | | | | $70,980 | |
| |
| Service Class | | Year ended | |
| | | | | |
| | | 12/31/19 | | | 12/31/18 | | | 12/31/17 | | | 12/31/16 | | | 12/31/15 | |
| | | | | |
Net asset value, beginning of period | | | $10.66 | | | | $11.49 | | | | $11.22 | | | | $11.03 | | | | $11.63 | |
| | | | | |
| Income (loss) from investment operations | | | | | | | | | | | | | | | | | | | | |
Net investment income (loss) (d) | | | $0.35 | | | | $0.35 | | | | $0.36 | | | | $0.37 | (c) | | | $0.39 | |
Net realized and unrealized gain (loss) | | | 1.19 | | | | (0.72 | ) | | | 0.32 | | | | 0.30 | | | | (0.46 | ) |
Total from investment operations | | | $1.54 | | | | $(0.37 | ) | | | $0.68 | | | | $0.67 | | | | $(0.07 | ) |
| | | | | |
| Less distributions declared to shareholders | | | | | | | | | | | | | | | | | | | | |
From net investment income | | | $(0.42 | ) | | | $(0.41 | ) | | | $(0.41 | ) | | | $(0.46 | ) | | | $(0.45 | ) |
From net realized gain | | | — | | | | (0.05 | ) | | | — | | | | (0.02 | ) | | | (0.08 | ) |
Total distributions declared to shareholders | | | $(0.42 | ) | | | $(0.46 | ) | | | $(0.41 | ) | | | $(0.48 | ) | | | $(0.53 | ) |
Net asset value, end of period (x) | | | $11.78 | | | | $10.66 | | | | $11.49 | | | | $11.22 | | | | $11.03 | |
Total return (%) (k)(r)(s)(x) | | | 14.46 | | | | (3.31 | ) | | | 6.11 | | | | 5.98 | (c) | | | (0.58 | ) |
| | | | | |
Ratios (%) (to average net assets)
and Supplemental data: | | | | | | | | | | | | | | | | | | | | |
Expenses before expense reductions (f) | | | 0.94 | | | | 0.93 | | | | 0.93 | | | | 0.90 | (c) | | | 0.93 | |
Expenses after expense reductions (f) | | | 0.88 | | | | 0.88 | | | | 0.88 | | | | 0.85 | (c) | | | 0.88 | |
Net investment income (loss) | | | 3.08 | | | | 3.18 | | | | 3.12 | | | | 3.27 | (c) | | | 3.39 | |
Portfolio turnover | | | 34 | | | | 32 | | | | 36 | | | | 31 | | | | 26 | |
Net assets at end of period (000 omitted) | | | $161,833 | | | | $154,370 | | | | $194,337 | | | | $188,440 | | | | $189,946 | |
See Notes to Financial Statements
16
MFS Corporate Bond Portfolio
Financial Highlights – continued
| (c) | Amount reflects aone-time reimbursement of expenses by the custodian (or former custodian) without which net investment income and performance would be lower and expenses would be higher. |
| (d) | Per share data is based on average shares outstanding. |
| (f) | Ratios do not reflect reductions from fees paid indirectly, if applicable. |
| (k) | The total return does not reflect expenses that apply to separate accounts. Inclusion of these charges would reduce the total return figures for all periods shown. |
| (r) | Certain expenses have been reduced without which performance would have been lower. |
| (s) | From time to time the fund may receive proceeds from litigation settlements, without which performance would be lower. |
| (x) | The net asset values and total returns have been calculated on net assets which include adjustments made in accordance with U.S. generally accepted accounting principles required at period end for financial reporting purposes. |
See Notes to Financial Statements
17
MFS Corporate Bond Portfolio
NOTES TO FINANCIAL STATEMENTS
| (1) | | Business and Organization |
MFS Corporate Bond Portfolio (the fund) is a diversified series of MFS Variable Insurance Trust II (the trust). The trust is organized as a Massachusetts business trust and is registered under the Investment Company Act of 1940, as amended, as anopen-end management investment company. The shareholders of each series of the trust are separate accounts of insurance companies, which offer variable annuity and/or life insurance products, and qualified retirement and pension plans.
The fund is an investment company and accordingly follows the investment company accounting and reporting guidance of the Financial Accounting Standards Board (FASB) Accounting Standards Codification Topic 946 Financial Services – Investment Companies.
| (2) | | Significant Accounting Policies |
General– The preparation of financial statements in conformity with U.S. generally accepted accounting principles requires management to make estimates and assumptions that affect the reported amounts of assets and liabilities, and disclosure of contingent assets and liabilities at the date of the financial statements and the reported amounts of increases and decreases in net assets from operations during the reporting period. Actual results could differ from those estimates. In the preparation of these financial statements, management has evaluated subsequent events occurring after the date of the fund’s Statement of Assets and Liabilities through the date that the financial statements were issued. The fund invests in foreign securities. Investments in foreign securities are vulnerable to the effects of changes in the relative values of the local currency and the U.S. dollar and to the effects of changes in each country’s market, economic, industrial, political, regulatory, geopolitical, and other conditions.
In March 2017, the FASB issued Accounting Standards Update2017-08, Receivables – Nonrefundable Fees and Other Costs (Subtopic310-20) – Premium Amortization on Purchased Callable Debt Securities (“ASU2017-08”). For callable debt securities purchased at a premium that have explicit,non-contingent call features and that are callable at fixed prices on preset dates,ASU 2017-08 requires the premium to be amortized to the earliest call date. The fund adopted ASU2017-08 as of the beginning of the reporting period on a modified retrospective basis. The adoption resulted in a change in accounting principle, since the fund had historically amortized such premiums to maturity for U.S. GAAP. As a result of the adoption, the fund recognized a cumulative effect adjustment that decreased the beginning of period cost of investments and increased the unrealized appreciation on investments by offsetting amounts. Adoption had no impact on the fund’s net assets or any prior period information presented in the financial statements. With respect to the fund’s results of operations, amortization of premium to first call date under ASU2017-08 accelerates amortization with the intent of more closely aligning the recognition of income on such bonds with the economics of the instrument.
Balance Sheet Offsetting– The fund’s accounting policy with respect to balance sheet offsetting is that, absent an event of default by the counterparty or a termination of the agreement, the International Swaps and Derivatives Association (ISDA) Master Agreement, or similar agreement, does not result in an offset of reported amounts of financial assets and financial liabilities in the Statement of Assets and Liabilities across transactions between the fund and the applicable counterparty. The fund’s right to setoff may be restricted or prohibited by the bankruptcy or insolvency laws of the particular jurisdiction to which a specific master netting agreement counterparty is subject. Balance sheet offsetting disclosures, to the extent applicable to the fund, have been included in the fund’s Significant Accounting Policies note under the captions for each of the fund’sin-scope financial instruments and transactions.
Investment Valuations– Debt instruments and floating rate loans, including restricted debt instruments, are generally valued at an evaluated or composite bid as provided by a third-party pricing service. Short-term instruments with a maturity at issuance of 60 days or less may be valued at amortized cost, which approximates market value. Futures contracts are generally valued at last posted settlement price on their primary exchange as provided by a third-party pricing service. Futures contracts for which there were no trades that day for a particular position are generally valued at the closing bid quotation on their primary exchange as provided by a third-party pricing service.Open-end investment companies are generally valued at net asset value per share. Securities and other assets generally valued on the basis of information from a third-party pricing service may also be valued at a broker/dealer bid quotation. In determining values, third-party pricing services can utilize both transaction data and market information such as yield, quality, coupon rate, maturity, type of issue, trading characteristics, and other market data. The values of foreign securities and other assets and liabilities expressed in foreign currencies are converted to U.S. dollars using the mean of bid and asked prices for rates provided by a third-party pricing service.
The Board of Trustees has delegated primary responsibility for determining or causing to be determined the value of the fund’s investments (including any fair valuation) to the adviser pursuant to valuation policies and procedures approved by the Board. If the adviser determines that reliable market quotations are not readily available, investments are valued at fair value as determined in good faith by the adviser in accordance with such procedures under the oversight of the Board of Trustees. Under the fund’s valuation policies and procedures, market quotations are not considered to be readily available for most types of debt instruments and floating rate loans and many types of derivatives. These investments are generally valued at fair value based on information from third-party pricing services. In addition, investments may be valued at fair value if the adviser determines that an investment’s value
18
MFS Corporate Bond Portfolio
Notes to Financial Statements – continued
has been materially affected by events occurring after the close of the exchange or market on which the investment is principally traded (such as foreign exchange or market) and prior to the determination of the fund’s net asset value, or after the halt of trading of a specific security where trading does not resume prior to the close of the exchange or market on which the security is principally traded. The adviser generally relies on third-party pricing services or other information (such as the correlation with price movements of similar securities in the same or other markets; the type, cost and investment characteristics of the security; the business and financial condition of the issuer; and trading and other market data) to assist in determining whether to fair value and at what value to fair value an investment. The value of an investment for purposes of calculating the fund’s net asset value can differ depending on the source and method used to determine value. When fair valuation is used, the value of an investment used to determine the fund’s net asset value may differ from quoted or published prices for the same investment. There can be no assurance that the fund could obtain the fair value assigned to an investment if it were to sell the investment at the same time at which the fund determines its net asset value per share.
Various inputs are used in determining the value of the fund’s assets or liabilities. These inputs are categorized into three broad levels. In certain cases, the inputs used to measure fair value may fall into different levels of the fair value hierarchy. In such cases, an investment’s level within the fair value hierarchy is based on the lowest level of input that is significant to the fair value measurement. The fund’s assessment of the significance of a particular input to the fair value measurement in its entirety requires judgment, and considers factors specific to the investment. Level 1 includes unadjusted quoted prices in active markets for identical assets or liabilities. Level 2 includes other significant observable market-based inputs (including quoted prices for similar securities, interest rates, prepayment speed, and credit risk). Level 3 includes unobservable inputs, which may include the adviser’s own assumptions in determining the fair value of investments. Other financial instruments are derivative instruments, such as futures contracts. The following is a summary of the levels used as of December 31, 2019 in valuing the fund’s assets or liabilities:
| | | | | | | | | | | | | | | | |
| Financial Instruments | | Level 1 | | | Level 2 | | | Level��3 | | | Total | |
| U.S. Treasury Bonds & U.S. Government Agencies & Equivalents | | | $— | | | | $11,793,299 | | | | $— | | | | $11,793,299 | |
| Non-U.S. Sovereign Debt | | | — | | | | 1,658,622 | | | | — | | | | 1,658,622 | |
| Municipal Bonds | | | — | | | | 1,880,595 | | | | — | | | | 1,880,595 | |
| U.S. Corporate Bonds | | | — | | | | 164,337,708 | | | | — | | | | 164,337,708 | |
| Residential Mortgage-Backed Securities | | | — | | | | 73,152 | | | | — | | | | 73,152 | |
| Commercial Mortgage-Backed Securities | | | — | | | | 190,636 | | | | — | | | | 190,636 | |
| Asset-Backed Securities (including CDOs) | | | — | | | | 115,988 | | | | — | | | | 115,988 | |
| Foreign Bonds | | | — | | | | 33,299,418 | | | | — | | | | 33,299,418 | |
| Mutual Funds | | | 4,381,121 | | | | — | | | | — | | | | 4,381,121 | |
| Total | | | $4,381,121 | | | | $213,349,418 | | | | $— | | | | $217,730,539 | |
| | | | |
| Other Financial Instruments | | | | | | | | | | | | |
| Futures Contracts – Assets | | | $196,583 | | | | $— | | | | $— | | | | $196,583 | |
| Futures Contracts – Liabilities | | | (168,683 | ) | | | — | | | | — | | | | (168,683 | ) |
For further information regarding security characteristics, see the Portfolio of Investments.
Derivatives– The fund uses derivatives primarily to increase or decrease exposure to a particular market or segment of the market, or security, to increase or decrease interest rate or currency exposure, or as alternatives to direct investments. Derivatives are used for hedging ornon-hedging purposes. While hedging can reduce or eliminate losses, it can also reduce or eliminate gains. When the fund uses derivatives as an investment to increase market exposure, or for hedging purposes, gains and losses from derivative instruments may be substantially greater than the derivative’s original cost.
The derivative instruments used by the fund during the period were futures contracts. Depending on the type of derivative, the fund may exit a derivative position by entering into an offsetting transaction with a counterparty or exchange, negotiating an agreement with the derivative counterparty, or novating the position to a third party. The fund may be unable to promptly close out a futures position in instances where the daily fluctuation in the price for that type of future exceeds the daily limit set by the exchange. The fund’s period end derivatives, as presented in the Portfolio of Investments and the associated Derivative Contract tables, generally are indicative of the volume of its derivative activity during the period.
The following table presents, by major type of derivative contract, the fair value, on a gross basis, of the asset and liability components of derivatives held by the fund at December 31, 2019 as reported in the Statement of Assets and Liabilities:
| | | | | | | | | | |
| | | | | Fair Value (a) | |
| Risk | | Derivative Contracts | | Asset Derivatives | | | Liability Derivatives | |
| Interest Rate | | Interest Rate Futures | | | $196,583 | | | | $(168,683 | ) |
| (a) | Values presented in this table for futures contracts correspond to the values reported in the fund’s Portfolio of Investments. Only the current day net variation margin for futures contracts is separately reported within the fund’s Statement of Assets and Liabilities. |
19
MFS Corporate Bond Portfolio
Notes to Financial Statements – continued
The following table presents, by major type of derivative contract, the realized gain (loss) on derivatives held by the fund for the year ended December 31, 2019 as reported in the Statement of Operations:
| | | | |
| Risk | | Futures
Contracts | |
| Interest Rate | | | $(106,208 | ) |
The following table presents, by major type of derivative contract, the change in unrealized appreciation or depreciation on derivatives held by the fund for the year ended December 31, 2019 as reported in the Statement of Operations:
| | | | |
| Risk | | Futures
Contracts | |
| Interest Rate | | | $27,900 | |
Derivative counterparty credit risk is managed through formal evaluation of the creditworthiness of all potential counterparties. On certain, but not all, uncleared derivatives, the fund attempts to reduce its exposure to counterparty credit risk whenever possible by entering into an ISDA Master Agreement on a bilateral basis. The ISDA Master Agreement gives each party to the agreement the right to terminate all transactions traded under such agreement if there is a specified deterioration in the credit quality of the other party. Upon an event of default or a termination of the ISDA Master Agreement, thenon-defaulting party has the right to close out all transactions traded under such agreement and to net amounts owed under each agreement to one net amount payable by one party to the other. This right to close out and net payments across all transactions traded under the ISDA Master Agreement could result in a reduction of the fund’s credit risk to such counterparty equal to any amounts payable by the fund under the applicable transactions, if any.
Collateral and margin requirements differ by type of derivative. For cleared derivatives (e.g., futures contracts, cleared swaps, and exchange-traded options), margin requirements are set by the clearing broker and the clearing house and collateral, in the form of cash or securities, is posted by the fund directly with the clearing broker. Collateral terms are counterparty agreement specific for uncleared derivatives (e.g., forward foreign currency exchange contracts, uncleared swap agreements, and uncleared options) and collateral, in the form of cash and securities, is held in segregated accounts with the fund’s custodian in connection with these agreements. For derivatives traded under an ISDA Master Agreement, which contains a collateral support annex, the collateral requirements are netted across all transactions traded under such counterparty-specific agreement and an amount is posted from one party to the other to collateralize such obligations. Cash that has been segregated or delivered to cover the fund’s collateral or margin obligations under derivative contracts, if any, will be reported separately in the Statement of Assets and Liabilities as restricted cash for uncleared derivatives and/or deposits with brokers for cleared derivatives. Securities pledged as collateral or margin for the same purpose, if any, are noted in the Portfolio of Investments. The fund may be required to make payments of interest on uncovered collateral or margin obligations with the broker. Any such payments are included in “Miscellaneous” expense in the Statement of Operations.
Futures Contracts– The fund entered into futures contracts which may be used to hedge against or obtain broad market exposure, interest rate exposure, currency exposure, or to manage duration. A futures contract represents a commitment for the future purchase or sale of an asset at a specified price on a specified date.
Upon entering into a futures contract, the fund is required to deposit with the broker, either in cash or securities, an initial margin in an amount equal to a specified percentage of the notional amount of the contract. Subsequent payments (variation margin) are made or received by the fund each day, depending on the daily fluctuations in the value of the contract, and are recorded for financial statement purposes as unrealized gain or loss by the fund until the contract is closed or expires at which point the gain or loss on futures contracts is realized.
The fund bears the risk of interest rates, exchange rates or securities prices moving unexpectedly, in which case, the fund may not achieve the anticipated benefits of the futures contracts and may realize a loss. While futures contracts may present less counterparty risk to the fund since the contracts are exchange traded and the exchange’s clearinghouse guarantees payments to the broker, there is still counterparty credit risk due to the insolvency of the broker. The fund’s maximum risk of loss due to counterparty credit risk is equal to the margin posted by the fund to the broker plus any gains or minus any losses on the outstanding futures contracts.
Indemnifications– Under the fund’s organizational documents, its officers and Trustees may be indemnified against certain liabilities and expenses arising out of the performance of their duties to the fund. Additionally, in the normal course of business, the fund enters into agreements with service providers that may contain indemnification clauses. The fund’s maximum exposure under these agreements is unknown as this would involve future claims that may be made against the fund that have not yet occurred.
Investment Transactions and Income– Investment transactions are recorded on the trade date. Interest income is recorded on the accrual basis. All premium and discount is amortized or accreted for financial statement purposes in accordance with U.S. generally accepted accounting principles. Interest payments received in additional securities are recorded on theex-interest date in an amount equal to the value of the security on such date.
20
MFS Corporate Bond Portfolio
Notes to Financial Statements – continued
The fund may receive proceeds from litigation settlements. Any proceeds received from litigation involving portfolio holdings are reflected in the Statement of Operations in realized gain/loss if the security has been disposed of by the fund or in unrealized gain/loss if the security is still held by the fund. Any other proceeds from litigation not related to portfolio holdings are reflected as other income in the Statement of Operations.
Tax Matters and Distributions– The fund intends to qualify as a regulated investment company, as defined under Subchapter M of the Internal Revenue Code, and to distribute all of its taxable income, including realized capital gains. As a result, no provision for federal income tax is required. The fund’s federal tax returns, when filed, will remain subject to examination by the Internal Revenue Service for a three year period. Management has analyzed the fund’s tax positions taken on federal and state tax returns for all open tax years and does not believe that there are any uncertain tax positions that require recognition of a tax liability. Foreign taxes, if any, have been accrued by the fund in the accompanying financial statements in accordance with the applicable foreign tax law. Foreign income taxes may be withheld by certain countries in which the fund invests. Additionally, capital gains realized by the fund on securities issued in or by certain foreign countries may be subject to capital gains tax imposed by those countries.
Distributions to shareholders are recorded on theex-dividend date. Income and capital gain distributions are determined in accordance with income tax regulations, which may differ from U.S. generally accepted accounting principles. Certain capital accounts in the financial statements are periodically adjusted for permanent differences in order to reflect their tax character. These adjustments have no impact on net assets or net asset value per share. Temporary differences which arise from recognizing certain items of income, expense, gain or loss in different periods for financial statement and tax purposes will reverse at some time in the future.
Book/tax differences primarily relate to amortization and accretion of debt securities.
The tax character of distributions declared to shareholders for the last two fiscal years is as follows:
| | | | | | | | |
| | | Year ended
12/31/19 | | | Year ended
12/31/18 | |
| Ordinary income (including any short-term capital gains) | | | $8,024,012 | | | | $9,320,203 | |
| Long-term capital gains | | | — | | | | 319,216 | |
| Total distributions | | | $8,024,012 | | | | $9,639,419 | |
The federal tax cost and the tax basis components of distributable earnings were as follows:
| | | | |
| As of 12/31/19 | | | | |
| |
| Cost of investments | | | $203,719,723 | |
| Gross appreciation | | | 14,267,684 | |
| Gross depreciation | | | (228,968 | ) |
| Net unrealized appreciation (depreciation) | | | $14,038,716 | |
| |
| Undistributed ordinary income | | | 7,391,476 | |
| Undistributed long-term capital gain | | | 299,452 | |
Multiple Classes of Shares of Beneficial Interest– The fund offers multiple classes of shares, which differ in their respective distribution and/or service fees. The fund’s income, realized and unrealized gain (loss), and common expenses are allocated to shareholders based on the daily net assets of each class. Dividends are declared separately for each class. Differences in per share dividend rates are generally due to differences in separate class expenses. The fund’s distributions declared to shareholders as reported in the Statements of Changes in Net Assets are presented by class as follows:
| | | | | | | | |
| | |
| | | Year ended
12/31/19 | | | Year ended
12/31/18 | |
| Initial Class | | | $2,204,366 | | | | $2,578,583 | |
| Service Class | | | 5,819,646 | | | | 7,060,836 | |
| Total | | | $8,024,012 | | | | $9,639,419 | |
| (3) | | Transactions with Affiliates |
Investment Adviser– The fund has an investment advisory agreement with MFS to provide overall investment management and related administrative services and facilities to the fund. The management fee is computed daily and paid monthly at the following annual rates based on the fund’s average daily net assets:
| | | | |
| Up to $1 billion | | | 0.60% | |
| In excess of $1 billion | | | 0.50% | |
MFS has agreed in writing to reduce its management fee by a specified amount if certain MFS mutual fund assets exceed thresholds agreed to by MFS and the fund’s Board of Trustees. For the year ended December 31, 2019, this management fee reduction
21
MFS Corporate Bond Portfolio
Notes to Financial Statements – continued
amounted to $21,493, which is included in the reduction of total expenses in the Statement of Operations. The management fee incurred for the year ended December 31, 2019 was equivalent to an annual effective rate of 0.59% of the fund’s average daily net assets.
The investment adviser has agreed in writing to pay a portion of the fund’s total annual operating expenses, excluding interest, taxes, extraordinary expenses, brokerage and transaction costs, and investment-related expenses, such that total annual operating expenses do not exceed 0.63% of average daily net assets for the Initial Class shares and 0.88% of average daily net assets for the Service Class shares. This written agreement will continue until modified by the fund’s Board of Trustees, but such agreement will continue at least until April 30, 2021. For the year ended December 31, 2019, this reduction amounted to $100,294, which is included in the reduction of total expenses in the Statement of Operations.
Distributor– MFS Fund Distributors, Inc. (MFD), a wholly-owned subsidiary of MFS, is the distributor of shares of the fund. The Trustees have adopted a distribution plan for the Service Class shares pursuant to Rule12b-1 under the Investment Company Act of 1940.
The fund’s distribution plan provides that the fund will pay MFD distribution and/or service fees equal to 0.25% per annum of its average daily net assets attributable to Service Class shares as partial consideration for services performed and expenses incurred by MFD and financial intermediaries (including participating insurance companies that invest in the fund to fund variable annuity and variable life insurance contracts, sponsors of qualified retirement and pension plans that invest in the fund, and affiliates of these participating insurance companies and plan sponsors) in connection with the sale and distribution of the Service Class shares. MFD may subsequently pay all, or a portion, of the distribution and/or service fees to financial intermediaries.
Shareholder Servicing Agent– MFS Service Center, Inc. (MFSC), a wholly-owned subsidiary of MFS, receives a fee from the fund for its services as shareholder servicing agent. For the year ended December 31, 2019, the fee was $3,948, which equated to 0.0018% annually of the fund’s average daily net assets. MFSC also receives payment from the fund forout-of-pocket expenses paid by MFSC on behalf of the fund. For the year ended December 31, 2019, these costs amounted to $275.
Administrator– MFS provides certain financial, legal, shareholder communications, compliance, and other administrative services to the fund. Under an administrative services agreement, the fund reimburses MFS the costs incurred to provide these services. The fund is charged an annual fixed amount of $17,500 plus a fee based on average daily net assets. The administrative services fee incurred for the year ended December 31, 2019 was equivalent to an annual effective rate of 0.0183% of the fund’s average daily net assets.
Trustees’ and Officers’ Compensation– The fund pays compensation to independent Trustees in the form of a retainer, attendance fees, and additional compensation to Board and Committee chairpersons. The fund does not pay compensation directly to Trustees or officers of the fund who are also officers of the investment adviser, all of whom receive remuneration from MFS for their services to the fund. Certain officers and Trustees of the fund are officers or directors of MFS, MFD, and MFSC.
Other– This fund and certain other funds managed by MFS (the funds) had entered into a service agreement (the ISO Agreement) which provided for payment of fees solely by the funds to Tarantino LLC in return for the provision of services of an Independent Senior Officer (ISO) for the funds. Frank L. Tarantino served as the ISO and was an officer of the funds and the sole member of Tarantino LLC. Effective June 30, 2019, Mr. Tarantino retired from his position as ISO for the funds, and the ISO Agreement was terminated. For the year ended December 31, 2019, the fee paid by the fund under this agreement was $260 and is included in “Miscellaneous” expense in the Statement of Operations. MFS had agreed to bear all expenses associated with office space, other administrative support, and supplies provided to the ISO.
The fund invests in the MFS Institutional Money Market Portfolio which is managed by MFS and seeks current income consistent with preservation of capital and liquidity. This money market fund does not pay a management fee to MFS.
For the year ended December 31, 2019, purchases and sales of investments, other than short-term obligations, were as follows:
| | | | | | | | |
| | | Purchases | | | Sales | |
| U.S. Government securities | | | $9,454,920 | | | | $14,615,812 | |
| Non-U.S. Government securities | | | $63,841,239 | | | | $75,182,926 | |
22
MFS Corporate Bond Portfolio
Notes to Financial Statements – continued
| (5) | | Shares of Beneficial Interest |
The fund’s Declaration of Trust permits the Trustees to issue an unlimited number of full and fractional shares of beneficial interest. Transactions in fund shares were as follows:
| | | | | | | | | | | | | | | | |
| | | Year ended 12/31/19 | | | Year ended 12/31/18 | |
| | | | |
| | | Shares | | | Amount | | | Shares | | | Amount | |
| Shares sold | | | | | | | | | | | | | | | | |
Initial Class | | | 202,825 | | | | $2,364,950 | | | | 126,159 | | | | $1,417,456 | |
Service Class | | | 1,370,646 | | | | 15,476,443 | | | | 1,113,987 | | | | 12,293,052 | |
| | | 1,573,471 | | | | $17,841,393 | | | | 1,240,146 | | | | $13,710,508 | |
| | | | |
| Shares issued to shareholders in reinvestment of distributions | | | | | | | | | | | | | | | | |
Initial Class | | | 184,930 | | | | $2,204,366 | | | | 236,784 | | | | $2,578,583 | |
Service Class | | | 494,447 | | | | 5,819,646 | | | | 656,822 | | | | 7,060,836 | |
| | | 679,377 | | | | $8,024,012 | | | | 893,606 | | | | $9,639,419 | |
| | | | |
| Shares reacquired | | | | | | | | | | | | | | | | |
Initial Class | | | (781,648 | ) | | | $(9,055,470 | ) | | | (756,941 | ) | | | $(8,379,096 | ) |
Service Class | | | (2,597,324 | ) | | | (29,823,113 | ) | | | (4,210,235 | ) | | | (45,919,796 | ) |
| | | (3,378,972 | ) | | | $(38,878,583 | ) | | | (4,967,176 | ) | | | $(54,298,892 | ) |
| | | | |
| Net change | | | | | | | | | | | | | | | | |
Initial Class | | | (393,893 | ) | | | $(4,486,154 | ) | | | (393,998 | ) | | | $(4,383,057 | ) |
Service Class | | | (732,231 | ) | | | (8,527,024 | ) | | | (2,439,426 | ) | | | (26,565,908 | ) |
| | | (1,126,124 | ) | | | $(13,013,178 | ) | | | (2,833,424 | ) | | | $(30,948,965 | ) |
The fund and certain other funds managed by MFS participate in a $1.25 billion unsecured committed line of credit, subject to a $1 billion sublimit, provided by a syndicate of banks under a credit agreement. Borrowings may be made for temporary financing needs. Interest is charged to each fund, based on its borrowings, generally at a rate equal to the highest of one month LIBOR, the Federal Funds Effective Rate and the Overnight Bank Funding Rate, plus an agreed upon spread. A commitment fee, based on the average daily, unused portion of the committed line of credit, is allocated among the participating funds. In addition, the fund and other funds managed by MFS have established unsecured uncommitted borrowing arrangements with certain banks for temporary financing needs. Interest is charged to each fund, based on its borrowings, at rates equal to customary reference rates plus an agreed upon spread. For the year ended December 31, 2019, the fund’s commitment fee and interest expense were $1,203 and $0, respectively, and are included in “Miscellaneous” expense in the Statement of Operations.
| (7) | | Investments in Affiliated Issuers |
An affiliated issuer may be considered one in which the fund owns 5% or more of the outstanding voting securities, or a company which is under common control. For the purposes of this report, the following were affiliated issuers:
| | | | | | | | | | | | | | | | | | | | | | | | |
| Affiliated Issuers | | Beginning
Value | | | Purchases | | | Sales
Proceeds | | | Realized
Gain
(Loss) | | | Change in
Unrealized
Appreciation or
Depreciation | | | Ending
Value | |
| MFS Institutional Money Market Portfolio | | | $3,006,790 | | | | $72,696,548 | | | | $71,322,463 | | | | $345 | | | | $(99 | ) | | | $4,381,121 | |
| | | | | | |
| Affiliated Issuers | | | | | | | | | | | | | | Dividend
Income | | | Capital Gain
Distributions | |
| MFS Institutional Money Market Portfolio | | | | | | | | | | | | | | | | | | | $82,535 | | | | $— | |
23
MFS Corporate Bond Portfolio
REPORT OF INDEPENDENT REGISTERED PUBLIC ACCOUNTING FIRM
To the Board of Trustees of MFS Variable Insurance Trust II and the Shareholders of
MFS Corporate Bond Portfolio:
Opinion on the Financial Statements and Financial Highlights
We have audited the accompanying statement of assets and liabilities of MFS Corporate Bond Portfolio (the “Fund”), including the portfolio of investments, as of December 31, 2019, the related statement of operations for the year then ended, the statements of changes in net assets for each of the two years in the period then ended, the financial highlights for each of the five years in the period then ended, and the related notes. In our opinion, the financial statements and financial highlights present fairly, in all material respects, the financial position of the Fund as of December 31, 2019, and the results of its operations for the year then ended, the changes in its net assets for each of the two years in the period then ended, and the financial highlights for each of the five years in the period then ended, in conformity with accounting principles generally accepted in the United States of America.
Basis for Opinion
These financial statements and financial highlights are the responsibility of the Fund’s management. Our responsibility is to express an opinion on the Fund’s financial statements and financial highlights based on our audits. We are a public accounting firm registered with the Public Company Accounting Oversight Board (United States) (PCAOB) and are required to be independent with respect to the Fund in accordance with the U.S. federal securities laws and the applicable rules and regulations of the Securities and Exchange Commission and the PCAOB.
We conducted our audits in accordance with the standards of the PCAOB. Those standards require that we plan and perform the audit to obtain reasonable assurance about whether the financial statements and financial highlights are free of material misstatement, whether due to error or fraud. The Fund is not required to have, nor were we engaged to perform, an audit of its internal control over financial reporting. As part of our audits we are required to obtain an understanding of internal control over financial reporting but not for the purpose of expressing an opinion on the effectiveness of the Fund’s internal control over financial reporting. Accordingly, we express no such opinion.
Our audits included performing procedures to assess the risks of material misstatement of the financial statements and financial highlights, whether due to error or fraud, and performing procedures that respond to those risks. Such procedures included examining, on a test basis, evidence regarding the amounts and disclosures in the financial statements and financial highlights. Our audits also included evaluating the accounting principles used and significant estimates made by management, as well as evaluating the overall presentation of the financial statements and financial highlights. Our procedures included confirmation of securities owned as of December 31, 2019, by correspondence with the custodian and brokers. We believe that our audits provide a reasonable basis for our opinion.
DELOITTE & TOUCHE LLP
Boston, Massachusetts
February 14, 2020
We have served as the auditor of one or more of the MFS investment companies since 1924.
24
MFS Corporate Bond Portfolio
TRUSTEES AND OFFICERS – IDENTIFICATION AND BACKGROUND
The Trustees and Officers of the Trust, as of February 1, 2020, are listed below, together with their principal occupations during the past five years. (Their titles may have varied during that period.) The address of each Trustee and Officer is 111 Huntington Avenue, Boston, Massachusetts 02199-7618.
| | | | | | | | | | |
Name, Age | | Position(s)
Held with Fund | | Trustee/Officer
Since (h) | | Number of MFS Funds
overseen by the
Trustee | | Principal Occupations
During the Past Five Years | | Other Directorships During the Past Five Years (j) |
| INTERESTED TRUSTEES |
Robert J. Manning (k)
(age 56) | | Trustee | | February 2004 | | 133 | | Massachusetts Financial Services Company, Executive Chairman (since January 2017); Director; Chairman of the Board; Chief Executive Officer (until 2015);Co-Chief Executive Officer(2015-2016) | | N/A |
| | | | | |
Robin A. Stelmach (k) (age 58) | | Trustee | | January 2014 | | 133 | | Massachusetts Financial Services Company, Vice Chair (since January 2017); Chief Operating Officer and Executive Vice President (until January 2017) | | N/A |
|
| INDEPENDENT TRUSTEES |
John P. Kavanaugh (age 65) | | Trustee and Chair of Trustees | | January 2009 | | 133 | | Private investor | | N/A |
| | | | | |
Steven E. Buller (age 68) | | Trustee | | February 2014 | | 133 | | Financial Accounting Standards Advisory Council, Chairman(2014-2015); Public Company Accounting Oversight Board, Standing Advisory Group, Member (until 2014); BlackRock, Inc. (investment management), Managing Director (until 2014), BlackRock Finco UK (investment management), Director (until 2014) | | N/A |
| | | | | |
John A. Caroselli (age 65) | | Trustee | | March 2017 | | 133 | | JC Global Advisors, LLC (management consulting), President (since 2015); First Capital Corporation (commercial finance), Executive Vice President (until 2015) | | N/A |
| | | | | |
Maureen R. Goldfarb (age 64) | | Trustee | | January 2009 | | 133 | | Private investor | | N/A |
| | | | | |
Peter D. Jones
(age 64) | | Trustee | | January 2019 | | 133 | | Franklin Templeton Distributors, Inc. (investment management), President (until 2015); Franklin Templeton Institutional, LLC (investment management), Chairman (until 2015) | | N/A |
| | | | | |
James W. Kilman, Jr.
(age 58) | | Trustee | | January 2019 | | 133 | | Burford Capital Limited (finance and investment management), Chief Financial Officer (since 2019); KielStrand Capital LLC (family office), Chief Executive Officer (since 2016); Morgan Stanley & Co. (financial services), Vice Chairman of Investment Banking,Co-Head of Diversified Financials Coverage – Financial Institutions Investment Banking Group (until 2016) | | Alpha-En Corporation, Director (2016-2019) |
25
MFS Corporate Bond Portfolio
Trustees and Officers – continued
| | | | | | | | | | |
Name, Age | | Position(s)
Held with Fund | | Trustee/Officer
Since (h) | | Number of MFS Funds
overseen by the
Trustee | | Principal Occupations
During the Past Five Years | | Other Directorships During the Past Five Years (j) |
Clarence Otis, Jr. (age 63) | | Trustee | | March 2017 | | 133 | | Darden Restaurants, Inc., Chief Executive Officer (until 2014) | | VF Corporation, Director; Verizon Communications, Inc., Director; The Travelers Companies, Director; Federal Reserve Bank of Atlanta, Director (until 2015) |
| | | | | |
Maryanne L. Roepke (age 63) | | Trustee | | May 2014 | | 133 | | American Century Investments (investment management), Senior Vice President and Chief Compliance Officer (until 2014) | | N/A |
| | | | | |
Laurie J. Thomsen
(age 62) | | Trustee | | March 2005 | | 133 | | Private investor | | The Travelers Companies, Director; Dycom Industries, Inc., Director (since 2015) |
| | | | | | | | |
Name, Age | | Position(s)
Held with Fund | | Trustee/Officer
Since (h) | | Number of
MFS Funds
for which the
Person is an
Officer | | Principal Occupations During the Past Five Years |
| OFFICERS | | | | | | |
Christopher R. Bohane (k)
(age 46) | | Assistant Secretary and Assistant Clerk | | July 2005 | | 133 | | Massachusetts Financial Services Company, Vice President and Assistant General Counsel |
| | | | |
Kino Clark (k) (age 51) | | Assistant Treasurer | | January 2012 | | 133 | | Massachusetts Financial Services Company, Vice President |
| | | | |
John W. Clark, Jr. (k) (age 52) | | Assistant Treasurer | | April 2017 | | 133 | | Massachusetts Financial Services Company, Vice President (since March 2017); Deutsche Bank (financial services), Department Head –Treasurer’s Office (until February 2017) |
| | | | |
Thomas H. Connors (k) (age 60) | | Assistant Secretary and Assistant Clerk | | September 2012 | | 133 | | Massachusetts Financial Services Company, Vice President and Senior Counsel |
| | | | |
David L. DiLorenzo (k)
(age 51) | | President | | July 2005 | | 133 | | Massachusetts Financial Services Company, Senior Vice President |
| | | | |
Heidi W. Hardin (k) (age 52) | | Secretary and Clerk | | April 2017 | | 133 | | Massachusetts Financial Services Company, Executive Vice President and General Counsel (since March 2017); Harris Associates (investment management), General Counsel (from September 2015 to January 2017); Janus Capital Management LLC (investment management), Senior Vice President and General Counsel (until September 2015) |
| | | | |
Brian E. Langenfeld (k) (age 46) | | Assistant
Secretary and Assistant Clerk | | June 2006 | | 133 | | Massachusetts Financial Services Company, Vice President and Senior Counsel |
| | | | |
Amanda S. Mooradian (k) (age 40) | | Assistant
Secretary and Assistant Clerk | | September 2018 | | 133 | | Massachusetts Financial Services Company, Assistant Vice President and Counsel |
| | | | |
Susan A. Pereira (k)
(age 49) | | Assistant
Secretary and Assistant Clerk | | July 2005 | | 133 | | Massachusetts Financial Services Company, Vice President and Assistant General Counsel |
| | | | |
Kasey L. Phillips (k) (age 49) | | Assistant Treasurer | | September 2012 | | 133 | | Massachusetts Financial Services Company, Vice President |
| | | | |
Matthew A. Stowe (k) (age 45) | | Assistant Secretary and Assistant Clerk | | October 2014 | | 133 | | Massachusetts Financial Services Company, Vice President and Assistant General Counsel |
26
MFS Corporate Bond Portfolio
Trustees and Officers – continued
| | | | | | | | |
Name, Age | | Position(s)
Held with Fund | | Trustee/Officer
Since (h) | | Number of
MFS Funds
for which the
Person is an
Officer | | Principal Occupations During the Past Five Years |
Martin J. Wolin (k) (age 52) | | Chief Compliance Officer | | July 2015 | | 133 | | Massachusetts Financial Services Company, Senior Vice President and Chief Compliance Officer (since July 2015); Mercer (financial service provider), Chief Risk and Compliance Officer, North America and Latin America (until June 2015) |
| | | | |
James O. Yost (k)
(age 59) | | Treasurer | | September 1990 | | 133 | | Massachusetts Financial Services Company, Senior Vice President |
| (h) | Date first appointed to serve as Trustee/officer of an MFS Fund. Each Trustee has served continuously since appointment unless indicated otherwise. For the period from December 15, 2004 until February 22, 2005, Mr. Manning served as Advisory Trustee. From January 2012 through December 2016, Messrs. DiLorenzo and Yost served as Treasurer and Deputy Treasurer of the Funds, respectively. |
| (j) | Directorships or trusteeships of companies required to report to the Securities and Exchange Commission (i.e., “public companies”). |
| (k) | “Interested person” of the Trust within the meaning of the Investment Company Act of 1940 (referred to as the 1940 Act), which is the principal federal law governing investment companies like the fund, as a result of a position with MFS. The address of MFS is 111 Huntington Avenue, Boston, Massachusetts 02199-7618. |
Each Trustee (other than Messrs. Jones and Kilman) has been elected by shareholders and each Trustee and Officer holds office until his or her successor is chosen and qualified or until his or her earlier death, resignation, retirement or removal. Messrs. Jones and Kilman became Trustees of the Funds on January 1, 2019. The Trust does not hold annual meetings for the purpose of electing Trustees, and Trustees are not elected for fixed terms. Under the terms of the Board’s retirement policy, an Independent Trustee shall retire at the end of the calendar year in which he or she reaches the earlier of 75 years of age or 15 years of service on the Board (or, in the case of any Independent Trustee who joined the Board prior to 2015, 20 years of service on the Board).
Messrs. Buller, Kilman and Otis and Ms. Roepke are members of the Trust’s Audit Committee.
Each of the Interested Trustees and certain Officers hold comparable officer positions with certain affiliates of MFS.
The Statement of Additional Information for a Fund includes further information about the Trustees and is available without charge upon request by calling1-800-225-2606.
| | |
Investment Adviser Massachusetts Financial Services Company 111 Huntington Avenue Boston, MA 02199-7618 | | Custodian State Street Bank and Trust Company 1 Lincoln Street Boston, MA 02111-2900 |
| |
Distributor MFS Fund Distributors, Inc. 111 Huntington Avenue Boston, MA 02199-7618 | | Independent Registered Public Accounting Firm Deloitte & Touche LLP 200 Berkeley Street Boston, MA 02116 |
| |
Portfolio Manager(s) Alexander Mackey Henry Peabody Robert Persons | | |
27
MFS Corporate Bond Portfolio
BOARD REVIEW OF INVESTMENT ADVISORY AGREEMENT
MFS Corporate Bond Portfolio
The Investment Company Act of 1940 requires that both the full Board of Trustees and a majority of thenon-interested (“independent”) Trustees, voting separately, annually approve the continuation of the Fund’s investment advisory agreement with MFS. The Trustees consider matters bearing on the Fund and its advisory arrangements at their meetings throughout the year, including a review of performance data at each regular meeting. In addition, the independent Trustees met several times over the course of three months beginning in May and ending in July, 2019 (“contract review meetings”) for the specific purpose of considering whether to approve the continuation of the investment advisory agreement for the Fund and the other investment companies that the Board oversees (the “MFS Funds”). The independent Trustees were assisted in their evaluation of the Fund’s investment advisory agreement by independent legal counsel, from whom they received separate legal advice and with whom they met separately from MFS during various contract review meetings. The independent Trustees were also assisted in this process by the MFS Funds’ Independent Senior Officer, a senior officer appointed by and reporting to the independent Trustees.
In connection with their deliberations regarding the continuation of the investment advisory agreement, the Trustees, including the independent Trustees, considered such information and factors as they believed, in light of the legal advice furnished to them and their own business judgment, to be relevant. The investment advisory agreement for the Fund was considered separately, although the Trustees also took into account the common interests of all MFS Funds in their review. As described below, the Trustees considered the nature, quality, and extent of the various investment advisory, administrative, and shareholder services performed by MFS under the existing investment advisory agreement and other arrangements with the Fund.
In connection with their contract review meetings, the Trustees received and relied upon materials that included, among other items: (i) information provided by Broadridge Financial Solutions, Inc. (“Broadridge”), an independent third party, on the investment performance of the Fund for various time periods ended December 31, 2018 and the investment performance of a group of funds with substantially similar investment classifications/objectives (the “Broadridge performance universe”), (ii) information provided by Broadridge on the Fund’s advisory fees and other expenses and the advisory fees and other expenses of comparable funds identified by Broadridge as well as all other funds in the same investment classification/category (the “Broadridge expense group and universe”), (iii) information provided by MFS on the advisory fees of portfolios of other clients of MFS, including institutional separate accounts and other clients, (iv) information as to whether and to what extent applicable expense waivers, reimbursements or fee “breakpoints” are observed for the Fund, (v) information regarding MFS’ financial results and financial condition, including MFS’ and certain of its affiliates’ estimated profitability from services performed for the Fund and the MFS Funds as a whole, and compared to MFS’ institutional business, (vi) MFS’ views regarding the outlook for the mutual fund industry and the strategic business plans of MFS, (vii) descriptions of various functions performed by MFS for the Funds, such as compliance monitoring and portfolio trading practices, and (viii) information regarding the overall organization of MFS, including information about MFS’ senior management and other personnel providing investment advisory, administrative and other services to the Fund and the other MFS Funds. The comparative performance, fee and expense information prepared and provided by Broadridge was not independently verified and the independent Trustees did not independently verify any information provided to them by MFS.
The Trustees’ conclusion as to the continuation of the investment advisory agreement was based on a comprehensive consideration of all information provided to the Trustees and not the result of any single factor. Some of the factors that figured particularly in the Trustees’ deliberations are described below, although individual Trustees may have evaluated the information presented differently from one another, giving different weights to various factors. It is also important to recognize that the fee arrangements for the Fund and other MFS Funds are the result of years of review and discussion between the independent Trustees and MFS, that certain aspects of such arrangements may receive greater scrutiny in some years than in others, and that the Trustees’ conclusions may be based, in part, on their consideration of these same arrangements during the course of the year and in prior years.
Based on information provided by Broadridge and MFS, the Trustees reviewed the Fund’s total return investment performance as well as the Broadridge performance universe over various time periods. The Trustees placed particular emphasis on the total return performance of the Fund’s Initial Class shares in comparison to the performance of funds in its Broadridge performance universe over the five-year period ended December 31, 2018, which the Trustees believed was a long enough period to reflect differing market conditions. The total return performance of the Fund’s Initial Class shares was in the 2nd quintile relative to the other funds in the universe for this five-year period (the 1st quintile being the best performers and the 5th quintile being the worst performers). The total return performance of the Fund’s Initial Class shares was in the 4th quintile for theone-year period and the 2nd quintile for thethree-year period ended December 31, 2018 relative to the Broadridge performance universe. Because of the passage of time, these performance results may differ from the performance results for more recent periods, including those shown elsewhere in this report.
In the course of their deliberations, the Trustees took into account information provided by MFS in connection with the contract review meetings, as well as during investment review meetings conducted with portfolio management personnel during the course of the year regarding the Fund’s performance. After reviewing these and related factors, the Trustees concluded, within the context of their overall conclusions regarding the investment advisory agreement, that they were satisfied with MFS’ responses and efforts relating to investment performance.
28
MFS Corporate Bond Portfolio
Board Review of Investment Advisory Agreement – continued
In assessing the reasonableness of the Fund’s advisory fee, the Trustees considered, among other information, the Fund’s advisory fee and the total expense ratio of the Fund’s Initial Class shares as a percentage of average daily net assets and the advisory fee and total expense ratios of the Broadridge expense group based on information provided by Broadridge. The Trustees considered that MFS currently observes an expense limitation for the Fund, which may not be changed without the Trustees’ approval. The Trustees also considered that, according to the data provided by Broadridge (which takes into account any fee reductions or expense limitations that were in effect during the Fund’s last fiscal year), the Fund’s effective advisory fee rate and total expense ratio were each approximately at the Broadridge expense group median.
The Trustees also considered the advisory fees charged by MFS to any institutional separate accounts advised by MFS (“separate accounts”) and unaffiliated investment companies for which MFS serves as subadviser (“subadvised funds”) that have comparable investment strategies to the Fund, if any. In comparing these fees, the Trustees considered information provided by MFS as to the generally broader scope of services provided by MFS to the Fund, as well as the more extensive regulatory burdens imposed on MFS in managing the Fund, in comparison to separate accounts and subadvised funds. The Trustees also considered the higher demands placed on MFS’ investment personnel and trading infrastructure as a result of the daily cashin-flows andout-flows of the Fund in comparison to separate accounts.
The Trustees also considered whether the Fund may benefit from any economies of scale in the management of the Fund in the event of growth in assets of the Fund and/or growth in assets of the MFS Funds as a whole. They noted that the Fund’s advisory fee rate schedule is subject to a contractual breakpoint that reduces the Fund’s advisory fee rate on average daily net assets over $1 billion. The Trustees also noted that MFS has agreed in writing to waive a portion of the management fees of certain MFS Funds, including the Fund, if the total combined assets of certain funds within the MFS Funds’ complex increase above agreed upon thresholds (the “group fee waiver”), enabling the Fund’s shareholders to share in the benefits from any economies of scale at the complex level. The group fee waiver is reviewed and renewed annually between the Board and MFS. The Trustees concluded that the breakpoint and the group fee waiver were sufficient to allow the Fund to benefit from economies of scale as its assets and overall complex assets grow.
The Trustees also considered information prepared by MFS relating to MFS’ costs and profits with respect to the Fund, the MFS Funds considered as a group, and other investment companies and accounts advised by MFS, as well as MFS’ methodologies used to determine and allocate its costs to the MFS Funds, the Fund and other accounts and products for purposes of estimating profitability.
After reviewing these and other factors described herein, the Trustees concluded, within the context of their overall conclusions regarding the investment advisory agreement, that the advisory fees charged to the Fund represent reasonable compensation in light of the services being provided by MFS to the Fund.
In addition, the Trustees considered MFS’ resources and related efforts to continue to retain, attract and motivate capable personnel to serve the Fund. The Trustees also considered current and developing conditions in the financial services industry, including the presence of large and well-capitalized companies which are spending, and appear to be prepared to continue to spend, substantial sums to engage personnel and to provide services to competing investment companies. In this regard, the Trustees also considered the financial resources of MFS and its ultimate parent, Sun Life Financial Inc. The Trustees also considered the advantages and possible disadvantages to the Fund of having an adviser that also serves other investment companies as well as other accounts.
The Trustees also considered the nature, quality, cost, and extent of administrative, transfer agency, and distribution services provided to the Fund by MFS and its affiliates under agreements and plans other than the investment advisory agreement, including any12b-1 fees the Fund pays to MFS Fund Distributors, Inc., an affiliate of MFS. The Trustees also considered the nature, extent and quality of certain other services MFS performs or arranges for on the Fund’s behalf, which may include securities lending programs, directed expense payment programs, class action recovery programs, and MFS’ interaction with third-party service providers, principally custodians andsub-custodians. The Trustees concluded that the variousnon-advisory services provided by MFS and its affiliates on behalf of the Fund were satisfactory.
The Trustees consideredso-called“fall-out benefits” to MFS such as reputational value derived from serving as investment manager to the MFS Funds. The Trustees also considered that, effective January 3, 2018, MFS had discontinued its historic practice of obtaining investment research from portfolio brokerage commissions paid by certain MFS Funds and would thereafter directly pay for or voluntarily reimburse a Fund, if applicable, for the costs of external research acquired through the use of the Fund’s portfolio brokerage commissions.
Based on their evaluation of factors that they deemed to be material, including those factors described above, the Board of Trustees, including the independent Trustees, concluded that the Fund’s investment advisory agreement with MFS should be continued for an additionalone-year period, commencing August 1, 2019.
29
MFS Corporate Bond Portfolio
PROXY VOTING POLICIES AND INFORMATION
MFS votes proxies on behalf of the fund pursuant to proxy voting policies and procedures that are available without charge, upon request, by calling 1-800-225-2606, by visitingmfs.com/proxyvoting, or by visiting the SEC’s Web site athttp://www.sec.gov.
Information regarding how the fund voted proxies relating to portfolio securities during the most recent twelve-month period ended June 30 is available by August 31 of each year without charge by visitingmfs.com/proxyvoting, or by visiting the SEC’s Web site athttp://www.sec.gov.
QUARTERLY PORTFOLIO DISCLOSURE
The fund files a complete schedule of portfolio holdings with the SEC for the first and third quarters of each fiscal year as an exhibit to its reports on Form N-PORT. The fund’s Form N-PORT reports are available on the SEC’s website athttp://www.sec.gov. A shareholder can obtain the portfolio holdings report for the first and third quarters of the fund’s fiscal year atmfs.com/vit2 by choosing the fund’s name and then selecting the “Resources” tab and clicking on “Prospectus and Reports”.
FURTHER INFORMATION
From time to time, MFS may post important information about the fund or the MFS funds on the MFS web site (mfs.com). This information is available athttps://www.mfs.com/en-us/what-we-do/announcements.htmlor atmfs.com/vit2 by choosing the fund’s name.
INFORMATION ABOUT FUND CONTRACTS AND LEGAL CLAIMS
The fund has entered into contractual arrangements with an investment adviser, administrator, distributor, shareholder servicing agent, 529 program manager (if applicable), and custodian who each provide services to the fund. Unless expressly stated otherwise, shareholders are not parties to, or intended beneficiaries of these contractual arrangements, and these contractual arrangements are not intended to create any shareholder right to enforce them against the service providers or to seek any remedy under them against the service providers, either directly or on behalf of the fund.
Under the Trust’s By-Laws and Declaration of Trust, any claims asserted against or on behalf of the MFS Funds, including claims against Trustees and Officers, must be brought in state and federal courts located within the Commonwealth of Massachusetts.
30
rev. 3/16
| | | | |
| | | |
| FACTS | | WHAT DOES MFS DO WITH YOUR
PERSONAL INFORMATION? | |  |
| | |
| Why? | | Financial companies choose how they share your personal information. Federal law gives consumers the right to limit some but not all sharing. Federal law also requires us to tell you how we collect, share, and protect your personal information. Please read this notice carefully to understand what we do. |
| | |
| What? | | The types of personal information we collect and share depend on the product or service you have with us. This information can include: • Social Security number and account balances • Account transactions and transaction history • Checking account information and wire transfer instructions When you areno longer our customer, we continue to share your information as described in this notice. |
| | |
| How? | | All financial companies need to share customers’ personal information to run their everyday business. In the section below, we list the reasons financial companies can share their customers’ personal information; the reasons MFS chooses to share; and whether you can limit this sharing. |
| | | | |
Reasons we can share your
personal information | | Does MFS share? | | Can you limit this
sharing? |
For our everyday business purposes – such as to process your transactions, maintain your account(s), respond to court orders and legal investigations, or report to credit bureaus | | Yes | | No |
For our marketing purposes – to offer our products and services to you | | No | | We don’t share |
| For joint marketing with other financial companies | | No | | We don’t share |
For our affiliates’ everyday business purposes – information about your transactions and experiences | | No | | We don’t share |
For our affiliates’ everyday business purposes – information about your creditworthiness | | No | | We don’t share |
| For nonaffiliates to market to you | | No | | We don’t share |
| | |
| | |
| Questions? | | Call800-225-2606 or go tomfs.com. |
31
| | |
| Who we are |
| Who is providing this notice? | | MFS Funds, MFS Investment Management, MFS Institutional Advisors, Inc., and MFS Heritage Trust Company. |
| | |
| What we do |
| How does MFS protect my personal information? | | To protect your personal information from unauthorized access and use, we use security measures that comply with federal law. These measures include procedural, electronic, and physical safeguards for the protection of the personal information we collect about you. |
How does MFS
collect my personal information? | | We collect your personal information, for example, when you • open an account or provide account information • direct us to buy securities or direct us to sell your securities • make a wire transfer We also collect your personal information from others, such as credit bureaus, affiliates, or other companies. |
| Why can’t I limit all sharing? | | Federal law gives you the right to limit only • sharing for affiliates’ everyday business purposes – information about your creditworthiness • affiliates from using your information to market to you • sharing for nonaffiliates to market to you State laws and individual companies may give you additional rights to limit sharing. |
| | |
| Definitions |
| Affiliates | | Companies related by common ownership or control. They can be financial and nonfinancial companies. • MFS does not share personal information with affiliates, except for everyday business purposes as described on page one of this notice. |
| Nonaffiliates | | Companies not related by common ownership or control. They can be financial and nonfinancial companies. • MFS does not share with nonaffiliates so they can market to you. |
| Joint marketing | | A formal agreement between nonaffiliated financial companies that together market financial products or services to you. • MFS doesn’t jointly market. |
| | |
| Other important information |
| If you own an MFS product or receive an MFS service in the name of a third party such as a bank or broker-dealer, their privacy policy may apply to you instead of ours. |
32
Annual Report
December 31, 2019

MFS® Core Equity Portfolio

MFS® Variable Insurance Trust II
Beginning on January 1, 2021, as permitted by regulations adopted by the U.S. Securities and Exchange Commission, the insurance company that offers your contract may determine that it will no longer send you paper copies of the fund’s annual and semiannual shareholder reports unless you specifically request paper copies from the insurance company or from your financial intermediary. Instead, the shareholder reports will be made available on a Web site (insurancefunds.mfs.com or other Web site of which you will be notified), and the insurance company will notify you by mail each time a report is posted and provide you with a Web site link to access the report. Instructions for requesting paper copies will be provided by your insurance company or financial intermediary.
If you already elected to receive shareholder reports by email, you will not be affected by this change and you need not take any action. If your insurance company or financial intermediary offers electronic delivery, you may elect to receive shareholder reports and other communications from the insurance company or financial intermediary by email by following the instructions provided by the insurance company or financial intermediary.
Beginning on January 1, 2019, you may elect to receive all future reports in paper free of charge from the insurance company or financial intermediary. You can inform the insurance company or financial intermediary that you wish to continue receiving paper copies of your shareholder reports by contacting your insurance company or financial intermediary. Your election to receive reports in paper will apply to all funds held in your account with your insurance company or financial intermediary.
RGS-ANN
MFS® Core Equity Portfolio
CONTENTS
The report is prepared for the general information of contract owners. It is authorized for distribution to prospective investors only when preceded or accompanied by a current prospectus.
NOT FDIC INSURED• MAY LOSE VALUE• NO BANK OR CREDIT UNION GUARANTEE• NOT A DEPOSIT• NOT INSURED BY ANY FEDERAL GOVERNMENT AGENCY OR NCUA/NCUSIF
MFS Core Equity Portfolio
LETTER FROM THE EXECUTIVE CHAIR

Dear Contract Owners:
Slowing global growth, low inflation, and trade friction between the United States and China have been hallmarks of the past 12 months. After experiencing an uptick in market volatility in late 2018, markets steadied for most of 2019, thanks in large measure to the adoption of a dovish policy stance on the part of global central banks, focused on supporting economic growth. Negotiations aimed at a “phase one” trade deal between the U.S. and China bore fruit at the end of the period, boosting investor sentiment, while signs of stability emerging from the global manufacturing sector also lifted spirits. Uncertainty over Brexit, along with the ripple effects from the trade conflict, hampered business confidence and investment in the United Kingdom and Europe for much of the period, though investors expect greater clarity regarding Brexit as a result of December’s general election. The pro-Brexit Conservative Party won the election by a comfortable margin and set the stage for the U.K.’s departure from the EU at the end of January.
Markets expect the longest economic expansion in U.S. history will continue, albeit at a slower pace, as trade tensions recede. In an effort to prolong the expansion, the U.S. Federal Reserve lowered interest rates three times between July and October and the European Central Bank loosened policy in September. While the global monetary policy backdrop remains quite accommodative, signs of easing trade tensions and fading global recession fears led to improved market sentiment in late 2019 as investors grew less risk averse. In early 2020, an outbreak of coronavirus emanating from China reintroduced global growth fears, causing an uptick in volatility.
Here at MFS®, we aim to help our clients navigate the growing complexity of the markets and world economies. Our long-term investment philosophy and commitment to the responsible allocation of capital allow us to tune out the noise and uncover what we believe are the best, most durable investment opportunities in the market. Through our powerful global investment platform, we combine collective expertise, thoughtful risk management and long-term discipline to create sustainable value for investors.
Respectfully,

Robert J. Manning
Executive Chair
MFS Investment Management
February 14, 2020
The opinions expressed in this letter are subject to change and may not be relied upon for investment advice. No forecasts can be guaranteed.
1
MFS Core Equity Portfolio
PORTFOLIO COMPOSITION
Portfolio structure
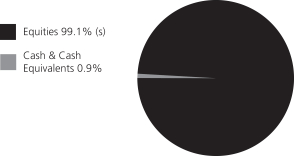
| | | | |
| Top ten holdings | | | | |
| Apple, Inc. | | | 4.9% | |
| Microsoft Corp. | | | 3.4% | |
| Alphabet, Inc., “A” | | | 3.1% | |
| Amazon.com, Inc. | | | 3.0% | |
| Johnson & Johnson | | | 2.1% | |
| American Tower Corp., REIT | | | 2.1% | |
| Mastercard, Inc., “A” | | | 2.1% | |
| Aon PLC | | | 2.0% | |
| Facebook, Inc., “A” | | | 2.0% | |
| Chevron Corp. | | | 1.6% | |
| | | | |
| Global equity sectors (k) | | | | |
| Technology | | | 26.0% | |
| Financial Services | | | 17.7% | |
| Health Care (s) | | | 14.4% | |
| Capital Goods | | | 12.8% | |
| Consumer Cyclicals | | | 12.2% | |
| Energy | | | 7.3% | |
| Consumer Staples | | | 5.1% | |
| Telecommunications and Cable Television (s) | | | 3.6% | |
| (k) | The sectors set forth above and the associated portfolio composition are based on MFS’ own custom sector classification methodology. |
| (s) | Includes securities sold short. |
Cash & Cash Equivalents includes any cash, investments in money market funds, short-term securities, and other assets less liabilities. Please see the Statement of Assets and Liabilities for additional information related to the fund’s cash position and other assets and liabilities.
Percentages are based on net assets as of December 31, 2019.
The portfolio is actively managed and current holdings may be different.
2
MFS Core Equity Portfolio
MANAGEMENT REVIEW
Summary of Results
For the twelve months ended December 31, 2019, Initial Class shares of the MFS Core Equity Portfolio (fund) provided a total return of 33.19%, while Service Class shares of the fund provided a total return of 32.87%. These compare with a return of 31.02% over the same period for the fund’s benchmark, the Russell 3000® Index.
Market Environment
Fading fears of a near-term global recession, the announcement of a partial trade deal between the United States and China and the decline in uncertainty over Brexit helped bolster market sentiment late in the period. Changes in market sentiment, largely driven by uncertainty over the outcome of trade negotiations between the US and China, had contributed to periodic bouts of volatility during the reporting period. The global economy decelerated, led by weakness in China and Europe, although the pace of the slowdown moderated late in the period amid nascent signs of stabilization in the manufacturing sector.
The deteriorating global growth backdrop, along with declining inflationary pressures, prompted the US Federal Reserve to adopt a more dovish posture beginning in early 2019, resulting in the first interest rate cut in over a decade at the end of July, followed by additional cuts in September and October. The Fed’s actions led to a sharp decline in long-term interest rates during the period’s second half, causing the inversion of portions of the US Treasury yield curve for a time. Amid an improvement in risk sentiment in Q4 2019 and indications of a bottoming in growth and a potential upturn in activity, the Fed indicated in October that further rate cuts were unlikely unless the outlook for the economy materially worsened.
Globally, central banks have tilted more dovish as well, with the European Central Bank unveiling a package of easing measures, which included putting overnight rates deeper into negative territory, restarting its bond-buying program and lengthening the term of cheap loans to banks to three years from two. The central banks of India and Australia are among those that have cut rates several times in recent months, although China has been more cautious in increasing liquidity as it keeps trying to deleverage its economy, cutting rates only marginally.
Emerging markets experienced considerable volatility through the end of 2018, as tighter global financial conditions exposed structural weakness in some countries. Those conditions improved in 2019 as the Fed became more dovish. Notwithstanding the periodic headwinds on market sentiment from significant trade friction between the US and China over much of the year, emerging market hard currency debt and local rates benefited from relatively cheap valuations at the beginning of the period and easier global monetary conditions. These factors, plus the fading of certain global risk factors mentioned above, hastened spread tightening in the latter part of the period. At the same time, idiosyncratic risks spiked in some countries (e.g., Argentina and Lebanon), contributing to increased dispersion in performance among sovereign assets.
Contributors to Performance
Security selection in thefinancial services sector benefited the fund’s performance relative to the Russell 3000® Index. Within this sector, not holding shares of investment conglomerate Berkshire Hathaway, and the fund’s overweight positions in payment processing company Mastercard, risk management and human capital consulting services provider Aon and diversified financial services firm Citigroup benefited relative performance. Holding shares of global alternative asset manager Blackstone Group (b) further supported relative results. The stock price of Blackstone Group appreciated as the company delivered solid financial results during the period, driven by strong growth infee-related earnings. Blackstone Group also showed growth in assets under management, with solid performance across most of its asset groups. Additionally, Blackstone Group’s decision to convert from a limited partnership structure to a C corporation broadened the firm’s potential ownership pool and further supported its share price performance.
Security selection and, to a lesser extent, an overweight position in thetechnology sector, bolstered relative returns, led by the fund’s overweight position in computer and personal electronics maker Apple. The stock price of Apple advanced during the period as the company’s revenues came in higher than expected, driven by strong growth in its wearable technology and services segments.
Security selection in theconsumer cyclicals sector also aided relative performance. Within this sector, there were no individual stocks that were among the fund’s largest relative contributors during the period.
Elsewhere, the fund’s overweight positions in cell tower operator American Tower and animal health products manufacturer Zoetis, and not holding shares of integrated oil and gas company Exxon Mobil, benefited relative returns. Additionally, the fund’s short position in health care facilities services provider Healthcare Services Group also helped relative results.
Detractors from Performance
Security selection in thehealth care sector detracted from relative performance during the reporting period. Within this sector, the fund’s overweight positions in pharmaceutical giant Pfizer, animal health products manufacturer Elanco Animal Health and global health services provider Cigna held back relative returns. The stock price of Elanco Animal Health came under pressure as investors
3
MFS Core Equity Portfolio
Management Review – continued
appeared to have responded negatively to the company’s announcement that it would acquire Bayer’s animal health business. Additionally, the timing of the fund’s ownership in shares of biotechnology company Biogen (h) hurt relative results.
Elsewhere, the fund’s overweight positions in electronic brokerage firm TD Ameritrade (h), discount variety store operator Dollar Tree, information technology company DXC Technology, information technology education company Pluralsight and integrated energy company Chevron detracted from relative returns. The stock price of TD Ameritrade weakened during the period, as lower interest rates were a headwind for its revenue and operating margins, and news of the company’s decision to offer zero-commission fees on equity trades appeared to have weighed on investor sentiment. In addition, not holding shares of global financial services firm JPMorgan Chase held back relative performance.
Respectfully,
Portfolio Manager(s)
Joseph MacDougall
| (b) | Security is not a benchmark constituent. |
| (h) | Security was not held in the portfolio at period end. |
The views expressed in this report are those of the portfolio manager(s) only through the end of the period of the report as stated on the cover and do not necessarily reflect the views of MFS or any other person in the MFS organization. These views are subject to change at any time based on market or other conditions, and MFS disclaims any responsibility to update such views. These views may not be relied upon as investment advice or an indication of trading intent on behalf of any MFS portfolio. References to specific securities are not recommendations of such securities, and may not be representative of any MFS portfolio’s current or future investments.
4
MFS Core Equity Portfolio
PERFORMANCE SUMMARY THROUGH 12/31/19
The following chart illustrates the historical performance of the fund in comparison to its benchmark(s). Benchmarks are unmanaged and may not be invested in directly. Benchmark returns do not reflect any fees or expenses. The performance of other share classes will be greater than or less than that of the class depicted below. (See Notes to Performance Summary.)
Performance data shown represents past performance and is no guarantee of future results. Investment return and principal value fluctuate so your units, when sold, may be worth more or less than the original cost; current performance may be lower or higher than quoted. The performance shown does not reflect the deduction of taxes, if any, that a contract holder would pay on fund distributions or the redemption of contract units. The returns for the fund shown also do not reflect the deduction of expenses associated with variable products, such as mortality and expense risk charges, separate account charges, and sales charges imposed by the insurance company separate accounts. Such expenses would reduce the overall returns shown.
Growth of a Hypothetical $10,000 Investment
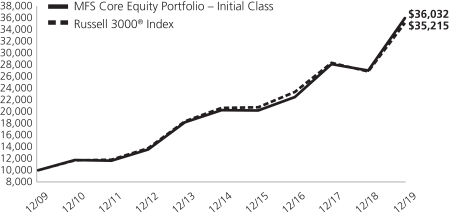
Total Returns through 12/31/19
Average annual total returns
| | | | | | | | | | | | |
| | | Share Class | | Class Inception Date | | 1-yr | | 5-yr | | 10-yr | | |
| | | Initial Class | | 5/12/97 | | 33.19% | | 12.19% | | 13.68% | | |
| | | Service Class | | 8/24/01 | | 32.87% | | 11.91% | | 13.39% | | |
| | | | |
| Comparative benchmark(s) | | | | | | | | |
| | | Russell 3000® Index (f) | | 31.02% | | 11.24% | | 13.42% | | |
| (f) | Source: FactSet Research Systems Inc. |
Benchmark Definition(s)
Russell 3000® Index – constructed to provide a comprehensive barometer for the 3,000 largest U.S. companies based on total market capitalization, which represents approximately 98% of the investable U.S. equity market. Frank Russell Company (“Russell”) is the source and owner of the trademarks, service marks, and copyrights related to the Russell Indexes. Russell® is a trademark of Frank Russell Company. Neither Russell nor its licensors accept any liability for any errors or omissions in the Russell Indexes and/or Russell ratings or underlying data and no party may rely on any Russell Indexes and/or Russell ratings and/or underlying data contained in this document. No further distribution of Russell Data is permitted without Russell’s express written consent. Russell does not promote, sponsor, or endorse the content of this document.
It is not possible to invest directly in an index.
Notes to Performance Summary
Average annual total return represents the average annual change in value for each share class for the periods presented.
Performance results reflect any applicable expense subsidies and waivers in effect during the periods shown. Without such subsidies and waivers the fund’s performance results would be less favorable. Please see the prospectus and financial statements for complete details. All results are historical and assume the reinvestment of any dividends and capital gains distributions.
Performance results do not include adjustments made for financial reporting purposes in accordance with U.S. generally accepted accounting principles and may differ from amounts reported in the financial highlights.
From time to time the fund may receive proceeds from litigation settlements, without which performance would be lower.
5
MFS Core Equity Portfolio
EXPENSE TABLE
Fund Expenses Borne by the Contract Holders during the Period,
July 1, 2019 through December 31, 2019
As a contract holder of the fund, you incur ongoing costs, including management fees; distribution and/or service(12b-1) fees; and other fund expenses. This example is intended to help you understand your ongoing costs (in dollars) of investing in the fund and to compare these costs with the ongoing costs of investing in other mutual funds.
The example is based on an investment of $1,000 invested at the beginning of the period and held for the entire period July 1, 2019 through December 31, 2019.
Actual Expenses
The first line for each share class in the following table provides information about actual account values and actual expenses. You may use the information in this line, together with the amount you invested, to estimate the expenses that you paid over the period. Simply divide your account value by $1,000 (for example, an $8,600 account value divided by $1,000 = 8.6), then multiply the result by the number in the first line under the heading entitled “Expenses Paid During Period” to estimate the expenses you paid on your account during this period.
Hypothetical Example for Comparison Purposes
The second line for each share class in the following table provides information about hypothetical account values and hypothetical expenses based on the fund’s actual expense ratio and an assumed rate of return of 5% per year before expenses, which is not the fund’s actual return. The hypothetical account values and expenses may not be used to estimate the actual ending account balance or expenses you paid for the period. You may use this information to compare the ongoing costs of investing in the fund and other funds. To do so, compare this 5% hypothetical example with the 5% hypothetical examples that appear in the shareholder reports of the other funds.
Please note that the expenses shown in the table are meant to highlight the fund’s ongoing costs only and do not take into account the fees and expenses imposed under the variable contracts through which your investment in the fund is made. Therefore, the second line for each share class in the table is useful in comparing ongoing costs associated with an investment in vehicles (such as the fund) which fund benefits under variable annuity and variable life insurance contracts and to qualified pension and retirement plans only, and will not help you determine the relative total costs of investing in the fund through variable annuity and variable life insurance contracts. If the fees and expenses imposed under the variable contracts were included, your costs would have been higher.
| | | | | | | | | | | | | | | | | | |
| Share Class | | | | Annualized
Expense Ratio | | | Beginning
Account Value
7/01/19 | | | Ending Account Value
12/31/19 | | | Expenses Paid
During Period (p)
7/01/19-12/31/19 | |
| Initial Class | | Actual | | | 0.86% | | | | $1,000.00 | | | | $1,100.88 | | | | $4.55 | |
| | Hypothetical (h) | | | 0.86% | | | | $1,000.00 | | | | $1,020.87 | | | | $4.38 | |
| Service Class | | Actual | | | 1.11% | | | | $1,000.00 | | | | $1,099.48 | | | | $5.87 | |
| | Hypothetical (h) | | | 1.11% | | | | $1,000.00 | | | | $1,019.61 | | | | $5.65 | |
| (h) | 5% class return per year before expenses. |
| (p) | “Expenses Paid During Period” are equal to each class’s annualized expense ratio, as shown above, multiplied by the average account value over the period, multiplied by 184/365 (to reflect theone-half year period). |
Notes to Expense Table
Expense ratios include 0.03% of investment related expenses from short sales (See Note 2 of the Notes to Financial Statements) that are outside of the expense limitation arrangement (See Note 3 of the Notes to Financial Statements).
6
MFS Core Equity Portfolio
PORTFOLIO OF INVESTMENTS – 12/31/19
The Portfolio of Investments is a complete list of all securities owned by your fund. It is categorized by broad-based asset classes.
| | | | | | | | |
| Issuer | | Shares/Par | | | Value ($) | |
| COMMON STOCKS – 99.5% | | | | | | | | |
| Aerospace – 3.5% | | | | | | | | |
| CACI International, Inc., “A” (a) | | | 2,509 | | | $ | 627,225 | |
| Curtiss-Wright Corp. | | | 2,794 | | | | 393,646 | |
| Honeywell International, Inc. | | | 12,095 | | | | 2,140,815 | |
| Huntington Ingalls Industries, Inc. | | | 2,344 | | | | 588,063 | |
| L3Harris Technologies, Inc. | | | 3,629 | | | | 718,070 | |
| Northrop Grumman Corp. | | | 3,170 | | | | 1,090,385 | |
| United Technologies Corp. | | | 13,504 | | | | 2,022,359 | |
| | | | | | | | |
| | | | | | $ | 7,580,563 | |
| | | | | | | | |
| Alcoholic Beverages – 0.3% | | | | | | | | |
| Constellation Brands, Inc., “A” | | | 3,597 | | | $ | 682,531 | |
| | | | | | | | |
| Apparel Manufacturers – 0.3% | | | | | | | | |
| Under Amour, Inc., “C” (a) | | | 27,842 | | | $ | 534,010 | |
| | | | | | | | |
| Automotive – 0.7% | | | | | | | | |
| Copart, Inc. (a) | | | 6,049 | | | $ | 550,096 | |
| IAA, Inc. (a) | | | 4,945 | | | | 232,712 | |
| Lear Corp. | | | 3,351 | | | | 459,757 | |
| Stoneridge, Inc. (a) | | | 9,441 | | | | 276,810 | |
| | | | | | | | |
| | | | | | $ | 1,519,375 | |
| | | | | | | | |
| Biotechnology – 0.4% | | | | | | | | |
| Adaptive Biotechnologies Corp. (a) | | | 3,855 | | | $ | 115,342 | |
| Illumina, Inc. (a) | | | 1,895 | | | | 628,647 | |
| | | | | | | | |
| | | | | | $ | 743,989 | |
| | | | | | | | |
| Broadcasting – 0.5% | | | | | | | | |
| Netflix, Inc. (a) | | | 3,121 | | | $ | 1,009,862 | |
| | | | | | | | |
| Brokerage & Asset Managers – 1.8% | | | | | | | | |
| Blackstone Group, Inc. | | | 9,195 | | | $ | 514,368 | |
| Charles Schwab Corp. | | | 57,126 | | | | 2,716,913 | |
| CME Group, Inc. | | | 3,053 | | | | 612,798 | |
| | | | | | | | |
| | | | | | $ | 3,844,079 | |
| | | | | | | | |
| Business Services – 3.8% | | | | | | | | |
| Accenture PLC, “A” | | | 3,266 | | | $ | 687,722 | |
| Amdocs Ltd. | | | 7,869 | | | | 568,063 | |
| Clarivate Analytics PLC (a) | | | 47,930 | | | | 805,224 | |
| DXC Technology Co. | | | 7,557 | | | | 284,068 | |
| Fidelity National Information Services, Inc. | | | 8,168 | | | | 1,136,087 | |
| Fiserv, Inc. (a) | | | 8,533 | | | | 986,671 | |
| FleetCor Technologies, Inc. (a) | | | 3,289 | | | | 946,311 | |
| Global Payments, Inc. | | | 6,631 | | | | 1,210,555 | |
| Verisk Analytics, Inc., “A” | | | 10,233 | | | | 1,528,196 | |
| | | | | | | | |
| | | | | | $ | 8,152,897 | |
| | | | | | | | |
| Cable TV – 1.1% | | | | | | | | |
| Altice USA, Inc., “A” (a) | | | 17,882 | | | $ | 488,894 | |
| Charter Communications, Inc., “A” (a) | | | 3,959 | | | | 1,920,432 | |
| | | | | | | | |
| | | | | | $ | 2,409,326 | |
| | | | | | | | |
| | | | | | | | |
| | |
| Issuer | | Shares/Par | | | Value ($) | |
| COMMON STOCKS – continued | | | | | |
| Chemicals – 0.4% | | | | | | | | |
| FMC Corp. | | | 6,622 | | | $ | 661,008 | |
| Ingevity Corp. (a) | | | 3,379 | | | | 295,257 | |
| | | | | | | | |
| | | | | | $ | 956,265 | |
| | | | | | | | |
| Computer Software – 7.1% | | | | | | | | |
| Adobe Systems, Inc. (a) | | | 8,599 | | | $ | 2,836,036 | |
| Black Knight, Inc. (a) | | | 8,932 | | | | 575,935 | |
| Cadence Design Systems, Inc. (a) | | | 11,564 | | | | 802,079 | |
| DocuSign, Inc. (a) | | | 7,381 | | | | 547,006 | |
| Microsoft Corp. | | | 46,113 | | | | 7,272,020 | |
| Salesforce.com, Inc. (a) | | | 19,421 | | | | 3,158,632 | |
| | | | | | | | |
| | | | | | $ | 15,191,708 | |
| | | | | | | | |
| Computer Software – Systems – 6.4% | | | | | |
| Apple, Inc. (s) | | | 36,044 | | | $ | 10,584,321 | |
| EPAM Systems, Inc. (a) | | | 2,926 | | | | 620,780 | |
| Pluralsight, Inc., “A” (a) | | | 17,170 | | | | 295,496 | |
| Rapid7, Inc. (a) | | | 10,682 | | | | 598,406 | |
| ServiceNow, Inc. (a) | | | 3,168 | | | | 894,390 | |
| Square, Inc., “A” (a) | | | 3,749 | | | | 234,537 | |
| Zebra Technologies Corp., “A” (a) | | | 1,735 | | | | 443,188 | |
| | | | | | | | |
| | | | | | $ | 13,671,118 | |
| | | | | | | | |
| Construction – 1.6% | | | | | | | | |
| Masco Corp. | | | 34,605 | | | $ | 1,660,694 | |
| Toll Brothers, Inc. | | | 29,371 | | | | 1,160,448 | |
| Vulcan Materials Co. | | | 4,086 | | | | 588,343 | |
| | | | | | | | |
| | | | | | $ | 3,409,485 | |
| | | | | | | | |
| Consumer Products – 1.5% | | | | | | | | |
| Colgate-Palmolive Co. | | | 13,752 | | | $ | 946,688 | |
| Energizer Holdings, Inc. | | | 2,851 | | | | 143,177 | |
| Kimberly-Clark Corp. | | | 6,423 | | | | 883,484 | |
| Procter & Gamble Co. | | | 9,155 | | | | 1,143,459 | |
| | | | | | | | |
| | | | | | $ | 3,116,808 | |
| | | | | | | | |
| Consumer Services – 0.9% | | | | | | | | |
| Booking Holdings, Inc. (a) | | | 438 | | | $ | 899,534 | |
| Bright Horizons Family Solutions, Inc. (a) | | | 3,537 | | | | 531,576 | |
| Grand Canyon Education, Inc. (a) | | | 5,994 | | | | 574,165 | |
| | | | | | | | |
| | | | | | $ | 2,005,275 | |
| | | | | | | | |
| Containers – 0.1% | | | | | | | | |
| Sealed Air Corp. | | | 7,648 | | | $ | 304,620 | |
| | | | | | | | |
| Electrical Equipment – 2.0% | | | | | | | | |
| AMETEK, Inc. | | | 15,717 | | | $ | 1,567,613 | |
| Fortive Corp. | | | 12,406 | | | | 947,694 | |
| HD Supply Holdings, Inc. (a) | | | 15,262 | | | | 613,838 | |
| Sensata Technologies Holding PLC (a) | | | 13,487 | | | | 726,545 | |
| TE Connectivity Ltd. | | | 4,127 | | | | 395,532 | |
| | | | | | | | |
| | | | | | $ | 4,251,222 | |
| | | | | | | | |
7
MFS Core Equity Portfolio
Portfolio of Investments – continued
| | | | | | | | |
| | |
| Issuer | | Shares/Par | | | Value ($) | |
| COMMON STOCKS – continued | | | | | |
| Electronics – 3.1% | | | | | | | | |
| Analog Devices, Inc. | | | 12,268 | | | $ | 1,457,929 | |
| Applied Materials, Inc. | | | 4,664 | | | | 284,691 | |
| Marvell Technology Group Ltd. | | | 30,121 | | | | 800,014 | |
| Mellanox Technologies Ltd. (a) | | | 2,341 | | | | 274,318 | |
| Monolithic Power Systems, Inc. | | | 1,675 | | | | 298,183 | |
| nLIGHT, Inc. (a) | | | 7,841 | | | | 159,015 | |
| NXP Semiconductors N.V. | | | 8,616 | | | | 1,096,472 | |
| Silicon Laboratories, Inc. (a) | | | 2,568 | | | | 297,837 | |
| Texas Instruments, Inc. | | | 14,844 | | | | 1,904,337 | |
| | | | | | | | |
| | | | | | $ | 6,572,796 | |
| | | | | | | | |
| Energy – Independent – 1.6% | | | | | | | | |
| ConocoPhillips | | | 16,339 | | | $ | 1,062,525 | |
| Diamondback Energy, Inc. | | | 4,866 | | | | 451,857 | |
| Pioneer Natural Resources Co. | | | 3,544 | | | | 536,455 | |
| Valero Energy Corp. | | | 13,949 | | | | 1,306,324 | |
| | | | | | | | |
| | | | | | $ | 3,357,161 | |
| | | | | | | | |
| Energy – Integrated – 1.6% | | | | | | | | |
| Chevron Corp. | | | 27,891 | | | $ | 3,361,144 | |
| | | | | | | | |
| Engineering – Construction – 0.2% | | | | | | | | |
| KBR, Inc. | | | 17,232 | | | $ | 525,576 | |
| | | | | | | | |
| Entertainment – 0.1% | | | | | | | | |
| World Wrestling Entertainment, Inc., “A” | | | 3,329 | | | $ | 215,952 | |
| | | | | | | | |
| Food & Beverages – 2.7% | | | | | | | | |
| Archer Daniels Midland Co. | | | 13,189 | | | $ | 611,310 | |
| Coca-Cola Co. | | | 7,915 | | | | 438,095 | |
| Coca-Cola European Partners PLC | | | 7,524 | | | | 382,821 | |
| Hostess Brands, Inc. (a) | | | 25,869 | | | | 376,136 | |
| J.M. Smucker Co. | | | 3,301 | | | | 343,733 | |
| Mondelez International, Inc. | | | 26,254 | | | | 1,446,071 | |
| Nomad Foods Ltd. (a) | | | 9,757 | | | | 218,264 | |
| PepsiCo, Inc. | | | 14,966 | | | | 2,045,403 | |
| | | | | | | | |
| | | | | | $ | 5,861,833 | |
| | | | | | | | |
| Gaming & Lodging – 1.0% | | | | | | | | |
| Marriott International, Inc., “A” | | | 9,285 | | | $ | 1,406,028 | |
| Wyndham Hotels & Resorts, Inc. | | | 12,504 | | | | 785,376 | |
| | | | | | | | |
| | | | | | $ | 2,191,404 | |
| | | | | | | | |
| General Merchandise – 1.5% | | | | | | | | |
| Dollar General Corp. | | | 9,508 | | | $ | 1,483,058 | |
| Dollar Tree, Inc. (a) | | | 13,986 | | | | 1,315,383 | |
| Ollie’s Bargain Outlet Holdings, Inc. (a) | | | 7,289 | | | | 476,045 | |
| | | | | | | | |
| | | | | | $ | 3,274,486 | |
| | | | | | | | |
| Health Maintenance Organizations – 1.7% | | | | | |
| Cigna Corp. | | | 10,117 | | | $ | 2,068,825 | |
| Humana, Inc. | | | 4,278 | | | | 1,567,973 | |
| | | | | | | | |
| | | | | | $ | 3,636,798 | |
| | | | | | | | |
| Insurance – 4.2% | | | | | | | | |
| Aon PLC | | | 20,566 | | | $ | 4,283,692 | |
| Assurant, Inc. | | | 6,907 | | | | 905,370 | |
| Chubb Ltd. | | | 9,452 | | | | 1,471,298 | |
| | | | | | | | |
| | |
| Issuer | | Shares/Par | | | Value ($) | |
| COMMON STOCKS – continued | | | | | |
| Insurance – continued | | | | | | | | |
| Everest Re Group Ltd. | | | 1,490 | | | $ | 412,492 | |
| Hartford Financial Services Group, Inc. | | | 13,836 | | | | 840,814 | |
| MetLife, Inc. | | | 12,750 | | | | 649,867 | |
| Reinsurance Group of America, Inc. | | | 2,649 | | | | 431,946 | |
| | | | | | | | |
| | | | | | $ | 8,995,479 | |
| | | | | | | | |
| Internet – 5.1% | | | | | |
| Alphabet, Inc., “A” (a)(s) | | | 4,966 | | | $ | 6,651,411 | |
| Facebook, Inc., “A” (a) | | | 20,796 | | | | 4,268,379 | |
| | | | | | | | |
| | | | | | $ | 10,919,790 | |
| | | | | | | | |
| Leisure & Toys – 0.8% | | | | | |
| Brunswick Corp. | | | 6,714 | | | $ | 402,706 | |
| Electronic Arts, Inc. (a) | | | 12,132 | | | | 1,304,311 | |
| | | | | | | | |
| | | | | | $ | 1,707,017 | |
| | | | | | | | |
| Machinery & Tools – 1.3% | | | | | |
| Flowserve Corp. | | | 12,536 | | | $ | 623,917 | |
| IDEX Corp. | | | 2,662 | | | | 457,864 | |
| ITT, Inc. | | | 6,562 | | | | 484,997 | |
| Roper Technologies, Inc. | | | 3,346 | | | | 1,185,254 | |
| | | | | | | | |
| | | | | | $ | 2,752,032 | |
| | | | | | | | |
| Major Banks – 2.4% | | | | | |
| Goldman Sachs Group, Inc. | | | 13,096 | | | $ | 3,011,163 | |
| PNC Financial Services Group, Inc. | | | 9,644 | | | | 1,539,472 | |
| State Street Corp. | | | 8,659 | | | | 684,927 | |
| | | | | | | | |
| | | | | | $ | 5,235,562 | |
| | | | | | | | |
| Medical & Health Technology & Services – 1.6% | |
| Guardant Health, Inc. (a) | | | 1,268 | | | $ | 99,082 | |
| HCA Healthcare, Inc. | | | 6,755 | | | | 998,457 | |
| HealthEquity, Inc. (a) | | | 7,906 | | | | 585,597 | |
| ICON PLC (a) | | | 3,828 | | | | 659,297 | |
| McKesson Corp. | | | 4,367 | | | | 604,043 | |
| Premier, Inc., “A” (a) | | | 11,731 | | | | 444,370 | |
| | | | | | | | |
| | | | | | $ | 3,390,846 | |
| | | | | | | | |
| Medical Equipment – 4.4% | | | | | |
| Becton, Dickinson and Co. | | | 5,143 | | | $ | 1,398,742 | |
| Boston Scientific Corp. (a) | | | 33,705 | | | | 1,524,140 | |
| Danaher Corp. | | | 5,871 | | | | 901,081 | |
| Envista Holdings Corp. (a) | | | 10,852 | | | | 321,653 | |
| Masimo Corp. (a) | | | 3,576 | | | | 565,223 | |
| Medtronic PLC | | | 23,116 | | | | 2,622,510 | |
| PerkinElmer, Inc. | | | 12,331 | | | | 1,197,340 | |
| STERIS PLC | | | 3,072 | | | | 468,234 | |
| West Pharmaceutical Services, Inc. | | | 2,687 | | | | 403,937 | |
| | | | | | | | |
| | | | | | $ | 9,402,860 | |
| | | | | | | | |
| Natural Gas – Pipeline – 0.4% | | | | | |
| Enterprise Products Partners LP | | | 18,241 | | | $ | 513,666 | |
| Equitrans Midstream Corp. | | | 28,091 | | | | 375,296 | |
| | | | | | | | |
| | | | | | $ | 888,962 | |
| | | | | | | | |
8
MFS Core Equity Portfolio
Portfolio of Investments – continued
| | | | | | | | |
| | |
| Issuer | | Shares/Par | | | Value ($) | |
| COMMON STOCKS – continued | | | | | |
| Network & Telecom – 0.6% | | | | | |
| Equinix, Inc., REIT | | | 1,341 | | | $ | 782,742 | |
| Interxion Holding N.V. (a) | | | 5,750 | | | | 481,907 | |
| | | | | | | | |
| | | | | | $ | 1,264,649 | |
| | | | | | | | |
| Oil Services – 0.5% | | | | | |
| Cactus, Inc., “A” | | | 5,955 | | | $ | 204,376 | |
| Core Laboratories N.V. (l) | | | 7,963 | | | | 299,966 | |
| Patterson-UTI Energy, Inc. | | | 43,943 | | | | 461,401 | |
| | | | | | | | |
| | | | | | $ | 965,743 | |
| | | | | | | | |
| Other Banks & Diversified Financials – 6.7% | | | | | |
| Bank OZK | | | 19,921 | | | $ | 607,690 | |
| Citigroup, Inc. | | | 39,876 | | | | 3,185,693 | |
| Mastercard, Inc., “A” | | | 14,939 | | | | 4,460,636 | |
| Prosperity Bancshares, Inc. | | | 3,200 | | | | 230,048 | |
| SVB Financial Group (a) | | | 1,146 | | | | 287,692 | |
| Truist Financial Corp. | | | 48,397 | | | | 2,725,719 | |
| U.S. Bancorp | | | 33,483 | | | | 1,985,207 | |
| Wintrust Financial Corp. | | | 12,062 | | | | 855,196 | |
| | | | | | | | |
| | | | | | $ | 14,337,881 | |
| | | | | | | | |
| Pharmaceuticals – 6.6% | | | | | | | | |
| Elanco Animal Health, Inc. (a) | | | 51,006 | | | $ | 1,502,127 | |
| Eli Lilly & Co. | | | 19,783 | | | | 2,600,080 | |
| Johnson & Johnson | | | 31,122 | | | | 4,539,766 | |
| Pfizer, Inc. | | | 67,175 | | | | 2,631,916 | |
| Zoetis, Inc. | | | 22,017 | | | | 2,913,950 | |
| | | | | | | | |
| | | | | | $ | 14,187,839 | |
| | | | | | | | |
| Pollution Control – 0.3% | | | | | | | | |
| Waste Connections, Inc. | | | 6,436 | | | $ | 584,324 | |
| | | | | | | | |
| Railroad & Shipping – 1.3% | | | | | | | | |
| Canadian National Railway Co. | | | 15,606 | | | $ | 1,411,563 | |
| Canadian Pacific Railway Ltd. | | | 5,668 | | | | 1,445,056 | |
| | | | | | | | |
| | | | | | $ | 2,856,619 | |
| | | | | | | | |
| Real Estate – 2.5% | | | | | | | | |
| EPR Properties, REIT | | | 13,336 | | | $ | 942,055 | |
| Industrial Logistics Properties Trust, REIT | | | 36,707 | | | | 822,971 | |
| Lexington Realty Trust, REIT | | | 18,372 | | | | 195,111 | |
| Medical Properties Trust, Inc., REIT | | | 57,005 | | | | 1,203,376 | |
| STORE Capital Corp., REIT | | | 24,578 | | | | 915,285 | |
| Sun Communities, Inc., REIT | | | 2,043 | | | | 306,654 | |
| W.P. Carey, Inc., REIT | | | 12,887 | | | | 1,031,475 | |
| | | | | | | | |
| | | | | | $ | 5,416,927 | |
| | | | | | | | |
| Restaurants – 1.2% | | | | | | | | |
| Starbucks Corp. | | | 21,370 | | | $ | 1,878,850 | |
| U.S. Foods Holding Corp. (a) | | | 18,381 | | | | 769,980 | |
| | | | | | | | |
| | | | | | $ | 2,648,830 | |
| | | | | | | | |
| Specialty Chemicals – 1.0% | | | | | | | | |
| Corteva, Inc. | | | 24,346 | | | $ | 719,668 | |
| DuPont de Nemours, Inc. | | | 15,106 | | | | 969,805 | |
| Univar Solutions, Inc. (a) | | | 16,079 | | | | 389,755 | |
| | | | | | | | |
| | | | | | $ | 2,079,228 | |
| | | | | | | | |
| | | | | | | | |
| | |
| Issuer | | Shares/Par | | | Value ($) | |
| COMMON STOCKS – continued | | | | | |
| Specialty Stores – 5.9% | | | | | | | | |
| Amazon.com, Inc. (a)(s) | | | 3,511 | | | $ | 6,487,766 | |
| Burlington Stores, Inc. (a) | | | 4,085 | | | | 931,502 | |
| Chewy, Inc., “A” (a)(l) | | | 6,141 | | | | 178,089 | |
| Costco Wholesale Corp. | | | 3,626 | | | | 1,065,754 | |
| Ross Stores, Inc. | | | 9,778 | | | | 1,138,355 | |
| Target Corp. | | | 14,066 | | | | 1,803,402 | |
| Tractor Supply Co. | | | 10,886 | | | | 1,017,188 | |
| | | | | | | | |
| | | | | | $ | 12,622,056 | |
| | | | | | | | |
| Telecommunications – Wireless – 2.1% | | | | | |
| American Tower Corp., REIT | | | 19,712 | | | $ | 4,530,212 | |
| | | | | | | | |
| Telephone Services – 0.6% | | | | | |
| Verizon Communications, Inc. | | | 19,684 | | | $ | 1,208,598 | |
| | | | | | | | |
| Tobacco – 0.6% | | | | | |
| Philip Morris International, Inc. | | | 13,759 | | | $ | 1,170,753 | |
| | | | | | | | |
| Trucking – 0.4% | | | | | |
| Forward Air Corp. | | | 6,747 | | | $ | 471,953 | |
| Schneider National, Inc. | | | 18,477 | | | | 403,168 | |
| | | | | | | | |
| | | | | | $ | 875,121 | |
| | | | | | | | |
| Utilities – Electric Power – 3.1% | | | | | |
| American Electric Power Co., Inc. | | | 10,225 | | | $ | 966,365 | |
| CenterPoint Energy, Inc. | | | 17,835 | | | | 486,361 | |
| CMS Energy Corp. | | | 12,447 | | | | 782,170 | |
| Duke Energy Corp. | | | 2,372 | | | | 216,350 | |
| Evergy, Inc. | | | 11,902 | | | | 774,701 | |
| Exelon Corp. | | | 17,624 | | | | 803,478 | |
| NextEra Energy, Inc. | | | 5,965 | | | | 1,444,484 | |
| Southern Co. | | | 6,252 | | | | 398,252 | |
| Xcel Energy, Inc. | | | 13,458 | | | | 854,448 | |
| | | | | | | | |
| | | | | | $ | 6,726,609 | |
| | | | | | | | |
Total Common Stocks
(Identified Cost, $142,204,741) | | | | | | $ | 213,148,220 | |
| | | | | | | | |
|
| CONVERTIBLE PREFERRED STOCKS – 0.1% | |
| Natural Gas – Distribution – 0.1% | | | | | |
| South Jersey Industries, Inc., 7.25% | | | 4,166 | | | $ | 216,257 | |
| | | | | | | | |
| Utilities – Electric Power – 0.0% | | | | | |
| American Electric Power Co., Inc., 6.125% | | | 1,150 | | | $ | 62,250 | |
| | | | | | | | |
| Total Convertible Preferred Stocks (Identified Cost, $265,800) | | | | | | $ | 278,507 | |
| | | | | | | | |
| |
| INVESTMENT COMPANIES (h) – 0.9% | | | | | |
| Money Market Funds – 0.9% | | | | | |
| MFS Institutional Money Market Portfolio, 1.7% (v) (Identified Cost, $1,972,617) | | | 1,972,595 | | | $ | 1,972,595 | |
| | | | | | | | |
|
| COLLATERAL FOR SECURITIES LOANED – 0.1% | |
| State Street Navigator Securities Lending Government Money Market Portfolio, 1.58% (j) (Identified Cost, $70,325) | | | 70,325 | | | $ | 70,325 | |
| | | | | | | | |
9
MFS Core Equity Portfolio
Portfolio of Investments – continued
| | | | | | | | |
| | |
| Issuer | | Shares/Par | | | Value ($) | |
| SECURITIES SOLD SHORT – (0.6)% | |
| Medical & Health Technology & Services – (0.3)% | |
| Healthcare Services Group, Inc. | | | (22,511 | ) | | $ | (547,468 | ) |
| | | | | | | | |
| Telecommunications – Wireless – (0.2)% | | | | | |
| Crown Castle International Corp., REIT | | | (3,720 | ) | | $ | (528,798 | ) |
| | | | | | | | |
| Trucking – (0.1)% | | | | | |
| XPO Logistics, Inc. | | | (1,913 | ) | | $ | (152,466 | ) |
| | | | | | | | |
| Total Securities Sold Short (Proceeds Received, $1,218,659) | �� | | | | | $ | (1,228,732 | ) |
| | | | | | | | |
OTHER ASSETS, LESS
LIABILITIES – (0.0)% | | | | | | | (8,694 | ) |
| | | | | | | | |
| NET ASSETS – 100.0% | | | | | | $ | 214,232,221 | |
| | | | | | | | |
| (a) | | Non-income producing security. |
| (h) | | An affiliated issuer, which may be considered one in which the fund owns 5% or more of the outstanding voting securities, or a company which is under common control. At period end, the aggregate values of the fund’s investments in affiliated issuers and in unaffiliated issuers were $1,972,595 and $213,497,052, respectively. |
| (j) | | The rate quoted is the annualizedseven-day yield of the fund at period end. |
| (l) | | A portion of this security is on loan. See Note 2 for additional information. |
| (s) | | Security or a portion of the security was pledged to cover collateral requirements for securities sold short. |
| (v) | | Affiliated issuer that is available only to investment companies managed by MFS. The rate quoted for the MFS Institutional Money Market Portfolio is the annualizedseven-day yield of the fund at period end. |
The following abbreviations are used in this report and are defined:
| REIT | | Real Estate Investment Trust |
At December 31, 2019, the fund had cash collateral of $159,126 and other liquid securities with an aggregate value of $2,610,718 to cover any collateral or margin obligations for securities sold short. Restricted cash and/or deposits with brokers in the Statement of Assets and Liabilities are comprised of cash collateral.
See Notes to Financial Statements
10
MFS Core Equity Portfolio
FINANCIAL STATEMENTS | STATEMENT OF ASSETS AND LIABILITIES
This statement represents your fund’s balance sheet, which details the assets and liabilities comprising the total value of the fund.
| | | | |
At 12/31/19 | | | | |
| |
Assets | | | | |
Investments in unaffiliated issuers, at value, including $211,338 of securities on loan (identified cost, $142,540,866) | | | $213,497,052 | |
Investments in affiliated issuers, at value (identified cost, $1,972,617) | | | 1,972,595 | |
Deposits with brokers for | | | | |
Securities sold short | | | 159,126 | |
Receivables for | | | | |
Fund shares sold | | | 11,802 | |
Interest and dividends | | | 201,436 | |
Other assets | | | 1,404 | |
Total assets | | | $215,843,415 | |
| |
Liabilities | | | | |
Payables for | | | | |
Securities sold short, at value (proceeds received, $1,218,659) | | | $1,228,732 | |
Fund shares reacquired | | | 232,642 | |
Collateral for securities loaned, at value (c) | | | 70,325 | |
Payable to affiliates | | | | |
Investment adviser | | | 8,689 | |
Administrative services fee | | | 207 | |
Shareholder servicing costs | | | 30 | |
Distribution and/or service fees | | | 641 | |
Payable for independent Trustees’ compensation | | | 47 | |
Accrued expenses and other liabilities | | | 69,881 | |
Total liabilities | | | $1,611,194 | |
Net assets | | | $214,232,221 | |
| |
Net assets consist of | | | | |
Paid-in capital | | | $131,846,804 | |
Total distributable earnings (loss) | | | 82,385,417 | |
Net assets | | | $214,232,221 | |
Shares of beneficial interest outstanding | | | 8,658,822 | |
| | | | | | | | | | | | |
| | | |
| | | Net assets | | | Shares
outstanding | | | Net asset value
per share | |
Initial Class | | | $167,487,919 | | | | 6,750,946 | | | | $24.81 | |
Service Class | | | 46,744,302 | | | | 1,907,876 | | | | 24.50 | |
| (c) | Non-cash collateral is not included. |
See Notes to Financial Statements
11
MFS Core Equity Portfolio
FINANCIAL STATEMENTS | STATEMENT OF OPERATIONS
This statement describes how much your fund earned in investment income and accrued in expenses. It also describes any gains and/or losses generated by fund operations.
| | | | |
Year ended 12/31/19 | | | | |
| |
Net investment income (loss) | | | | |
Income | | | | |
Dividends | | | $3,220,773 | |
Other | | | 38,033 | |
Dividends from affiliated issuers | | | 35,379 | |
Income on securities loaned | | | 25,764 | |
Foreign taxes withheld | | | (7,193 | ) |
Total investment income | | | $3,312,756 | |
Expenses | | | | |
Management fee | | | $1,534,555 | |
Distribution and/or service fees | | | 113,310 | |
Shareholder servicing costs | | | 8,181 | |
Administrative services fee | | | 38,221 | |
Independent Trustees’ compensation | | | 5,262 | |
Custodian fee | | | 12,105 | |
Shareholder communications | | | 32,362 | |
Audit and tax fees | | | 57,156 | |
Legal fees | | | 1,788 | |
Dividend and interest expense on securities sold short | | | 67,715 | |
Interest expense and fees | | | 1,695 | |
Miscellaneous | | | 33,589 | |
Total expenses | | | $1,905,939 | |
Reduction of expenses by investment adviser | | | (19,947 | ) |
Net expenses | | | $1,885,992 | |
Net investment income (loss) | | | $1,426,764 | |
| |
Realized and unrealized gain (loss) | | | | |
Realized gain (loss) (identified cost basis) | | | | |
Unaffiliated issuers | | | $10,553,043 | |
Affiliated issuers | | | (347 | ) |
Securities sold short | | | (128,175 | ) |
Foreign currency | | | (801 | ) |
Net realized gain (loss) | | | $10,423,720 | |
Change in unrealized appreciation or depreciation | | | | |
Unaffiliated issuers | | | $45,867,623 | |
Affiliated issuers | | | (22 | ) |
Securities sold short | | | 168,804 | |
Translation of assets and liabilities in foreign currencies | | | 35 | |
Net unrealized gain (loss) | | | $46,036,440 | |
Net realized and unrealized gain (loss) | | | $56,460,160 | |
Change in net assets from operations | | | $57,886,924 | |
See Notes to Financial Statements
12
MFS Core Equity Portfolio
FINANCIAL STATEMENTS | STATEMENTS OF CHANGES IN NET ASSETS
These statements describe the increases and/or decreases in net assets resulting from operations, any distributions, and any shareholder transactions.
| | | | | | | | |
| | | Year ended | |
| | | 12/31/19 | | | 12/31/18 | |
Change in net assets | | | | | | | | |
| | |
From operations | | | | | | | | |
Net investment income (loss) | | | $1,426,764 | | | | $1,561,666 | |
Net realized gain (loss) | | | 10,423,720 | | | | 26,562,017 | |
Net unrealized gain (loss) | | | 46,036,440 | | | | (34,642,636 | ) |
Change in net assets from operations | | | $57,886,924 | | | | $(6,518,953 | ) |
Total distributions to shareholders | | | $(28,139,029 | ) | | | $(23,497,053 | ) |
Change in net assets from fund share transactions | | | $(1,702,049 | ) | | | $(1,288,330 | ) |
Total change in net assets | | | $28,045,846 | | | | $(31,304,336 | ) |
| | |
Net assets | | | | | | | | |
At beginning of period | | | 186,186,375 | | | | 217,490,711 | |
At end of period | | | $214,232,221 | | | | $186,186,375 | |
See Notes to Financial Statements
13
MFS Core Equity Portfolio
FINANCIAL STATEMENTS | FINANCIAL HIGHLIGHTS
The financial highlights table is intended to help you understand the fund’s financial performance for the past 5 years. Certain information reflects financial results for a single fund share. The total returns in the table represent the rate that an investor would have earned (or lost) on an investment in the fund share class (assuming reinvestment of all distributions) held for the entire period.
| | | | | | | | | | | | | | | | | | | | |
| Initial Class | | Year ended | |
| | | | | |
| | | 12/31/19 | | | 12/31/18 | | | 12/31/17 | | | 12/31/16 | | | 12/31/15 | |
| | | | | |
Net asset value, beginning of period | | | $21.68 | | | | $25.21 | | | | $21.67 | | | | $21.28 | | | | $23.40 | |
| | | | | |
| Income (loss) from investment operations | | | | | | | | | | | | | | | | | | | | |
Net investment income (loss) (d) | | | $0.18 | | | | $0.20 | | | | $0.17 | | | | $0.21 | (c) | | | $0.17 | |
Net realized and unrealized gain (loss) | | | 6.59 | | | | (0.78 | ) | | | 5.04 | | | | 2.16 | | | | (0.35 | ) |
Total from investment operations | | | $6.77 | | | | $(0.58 | ) | | | $5.21 | | | | $2.37 | | | | $(0.18 | ) |
| | | | | |
| Less distributions declared to shareholders | | | | | | | | | | | | | | | | | | | | |
From net investment income | | | $(0.21 | ) | | | $(0.18 | ) | | | $(0.23 | ) | | | $(0.17 | ) | | | $(0.13 | ) |
From net realized gain | | | (3.43 | ) | | | (2.77 | ) | | | (1.44 | ) | | | (1.81 | ) | | | (1.81 | ) |
Total distributions declared to shareholders | | | $(3.64 | ) | | | $(2.95 | ) | | | $(1.67 | ) | | | $(1.98 | ) | | | $(1.94 | ) |
Net asset value, end of period (x) | | | $24.81 | | | | $21.68 | | | | $25.21 | | | | $21.67 | | | | $21.28 | |
Total return (%) (k)(r)(s)(x) | | | 33.19 | | | | (3.83 | ) | | | 24.82 | | | | 11.38 | (c) | | | (0.21 | ) |
| | | | | |
Ratios (%) (to average net assets)
and Supplemental data: | | | | | | | | | | | | | | | | | | | | |
Expenses before expense reductions (f) | | | 0.88 | | | | 0.87 | | | | 0.87 | | | | 0.84 | (c) | | | 0.86 | |
Expenses after expense reductions (f) | | | 0.87 | | | | 0.86 | | | | 0.86 | | | | 0.82 | (c) | | | 0.85 | |
Net investment income (loss) | | | 0.75 | | | | 0.79 | | | | 0.72 | | | | 1.00 | (c) | | | 0.75 | |
Portfolio turnover | | | 37 | | | | 40 | | | | 39 | | | | 60 | | | | 50 | |
Net assets at end of period (000 omitted) | | | $167,488 | | | | $144,991 | | | | $171,038 | | | | $156,040 | | | | $156,450 | |
| | | | | |
| Supplemental Ratios (%): | | | | | | | | | | | | | | | | | | | | |
Ratios of expenses to average net assets after expense reductions excluding short sale expenses and interest expense and fees (f) | | | 0.83 | | | | 0.83 | | | | 0.84 | | | | 0.80 | (c) | | | 0.84 | |
See Notes to Financial Statements
14
MFS Core Equity Portfolio
Financial Highlights – continued
| | | | | | | | | | | | | | | | | | | | |
| Service Class | | Year ended | |
| | | | | |
| | | 12/31/19 | | | 12/31/18 | | | 12/31/17 | | | 12/31/16 | | | 12/31/15 | |
| | | | | |
Net asset value, beginning of period | | | $21.44 | | | | $24.96 | | | | $21.47 | | | | $21.10 | | | | $23.20 | |
| | | | | |
| Income (loss) from investment operations | | | | | | | | | | | | | | | | | | | | |
Net investment income (loss) (d) | | | $0.12 | | | | $0.14 | | | | $0.11 | | | | $0.16 | (c) | | | $0.11 | |
Net realized and unrealized gain (loss) | | | 6.51 | | | | (0.78 | ) | | | 4.99 | | | | 2.13 | | | | (0.33 | ) |
Total from investment operations | | | $6.63 | | | | $(0.64 | ) | | | $5.10 | | | | $2.29 | | | | $(0.22 | ) |
| | | | | |
| Less distributions declared to shareholders | | | | | | | | | | | | | | | | | | | | |
From net investment income | | | $(0.14 | ) | | | $(0.11 | ) | | | $(0.17 | ) | | | $(0.11 | ) | | | $(0.07 | ) |
From net realized gain | | | (3.43 | ) | | | (2.77 | ) | | | (1.44 | ) | | | (1.81 | ) | | | (1.81 | ) |
Total distributions declared to shareholders | | | $(3.57 | ) | | | $(2.88 | ) | | | $(1.61 | ) | | | $(1.92 | ) | | | $(1.88 | ) |
Net asset value, end of period (x) | | | $24.50 | | | | $21.44 | | | | $24.96 | | | | $21.47 | | | | $21.10 | |
Total return (%) (k)(r)(s)(x) | | | 32.87 | | | | (4.07 | ) | | | 24.50 | | | | 11.07 | (c) | | | (0.40 | ) |
| | | | | |
Ratios (%) (to average net assets)
and Supplemental data: | | | | | | | | | | | | | | | | | | | | |
Expenses before expense reductions (f) | | | 1.13 | | | | 1.12 | | | | 1.12 | | | | 1.09 | (c) | | | 1.11 | |
Expenses after expense reductions (f) | | | 1.12 | | | | 1.11 | | | | 1.11 | | | | 1.07 | (c) | | | 1.10 | |
Net investment income (loss) | | | 0.50 | | | | 0.54 | | | | 0.47 | | | | 0.75 | (c) | | | 0.50 | |
Portfolio turnover | | | 37 | | | | 40 | | | | 39 | | | | 60 | | | | 50 | |
Net assets at end of period (000 omitted) | | | $46,744 | | | | $41,195 | | | | $46,453 | | | | $42,883 | | | | $47,083 | |
| | | | | |
| Supplemental Ratios (%): | | | | | | | | | | | | | | | | | | | | |
Ratios of expenses to average net assets after expense reductions excluding short sale expenses and interest expense and fees (f) | | | 1.08 | | | | 1.08 | | | | 1.09 | | | | 1.06 | (c) | | | 1.09 | |
| (c) | Amount reflects aone-time reimbursement of expenses by the custodian (or former custodian) without which net investment income and performance would be lower and expenses would be higher. |
| (d) | Per share data is based on average shares outstanding. |
| (f) | Ratios do not reflect reductions from fees paid indirectly, if applicable. |
| (k) | The total return does not reflect expenses that apply to separate accounts. Inclusion of these charges would reduce the total return figures for all periods shown. |
| (r) | Certain expenses have been reduced without which performance would have been lower. |
| (s) | From time to time the fund may receive proceeds from litigation settlements, without which performance would be lower. Excluding the effect of the proceeds received from anon-recurring litigation settlement against Household International, Inc., the total return for the year ended December 31, 2017 would have been lower by approximately 0.78%. |
| (x) | The net asset values and total returns have been calculated on net assets which include adjustments made in accordance with U.S. generally accepted accounting principles required at period end for financial reporting purposes. |
See Notes to Financial Statements
15
MFS Core Equity Portfolio
NOTES TO FINANCIAL STATEMENTS
| (1) | | Business and Organization |
MFS Core Equity Portfolio (the fund) is a diversified series of MFS Variable Insurance Trust II (the trust). The trust is organized as a Massachusetts business trust and is registered under the Investment Company Act of 1940, as amended, as anopen-end management investment company. The shareholders of each series of the trust are separate accounts of insurance companies, which offer variable annuity and/or life insurance products, and qualified retirement and pension plans.
The fund is an investment company and accordingly follows the investment company accounting and reporting guidance of the Financial Accounting Standards Board (FASB) Accounting Standards Codification Topic 946 Financial Services – Investment Companies.
| (2) | | Significant Accounting Policies |
General – The preparation of financial statements in conformity with U.S. generally accepted accounting principles requires management to make estimates and assumptions that affect the reported amounts of assets and liabilities, and disclosure of contingent assets and liabilities at the date of the financial statements and the reported amounts of increases and decreases in net assets from operations during the reporting period. Actual results could differ from those estimates. In the preparation of these financial statements, management has evaluated subsequent events occurring after the date of the fund’s Statement of Assets and Liabilities through the date that the financial statements were issued.
Balance Sheet Offsetting – The fund’s accounting policy with respect to balance sheet offsetting is that, absent an event of default by the counterparty or a termination of the agreement, the International Swaps and Derivatives Association (ISDA) Master Agreement, or similar agreement, does not result in an offset of reported amounts of financial assets and financial liabilities in the Statement of Assets and Liabilities across transactions between the fund and the applicable counterparty. The fund’s right to setoff may be restricted or prohibited by the bankruptcy or insolvency laws of the particular jurisdiction to which a specific master netting agreement counterparty is subject. Balance sheet offsetting disclosures, to the extent applicable to the fund, have been included in the fund’s Significant Accounting Policies note under the captions for each of the fund’sin-scope financial instruments and transactions.
Investment Valuations – Equity securities, including restricted equity securities and equity securities sold short, are generally valued at the last sale or official closing price on their primary market or exchange as provided by a third-party pricing service. Equity securities, for which there were no sales reported that day, are generally valued at the last quoted daily bid quotation on their primary market or exchange as provided by a third-party pricing service. Equity securities sold short, for which there were no sales reported for that day, are generally valued at the last quoted daily ask quotation on their primary market or exchange as provided by a third-party pricing service. Short-term instruments with a maturity at issuance of 60 days or less may be valued at amortized cost, which approximates market value.Open-end investment companies are generally valued at net asset value per share. Securities and other assets generally valued on the basis of information from a third-party pricing service may also be valued at a broker/dealer bid quotation. In determining values, third-party pricing services can utilize both transaction data and market information such as yield, quality, coupon rate, maturity, type of issue, trading characteristics, and other market data. The values of foreign securities and other assets and liabilities expressed in foreign currencies are converted to U.S. dollars using the mean of bid and asked prices for rates provided by a third-party pricing service.
The Board of Trustees has delegated primary responsibility for determining or causing to be determined the value of the fund’s investments (including any fair valuation) to the adviser pursuant to valuation policies and procedures approved by the Board. If the adviser determines that reliable market quotations are not readily available, investments are valued at fair value as determined in good faith by the adviser in accordance with such procedures under the oversight of the Board of Trustees. Under the fund’s valuation policies and procedures, market quotations are not considered to be readily available for most types of debt instruments and floating rate loans and many types of derivatives. These investments are generally valued at fair value based on information from third-party pricing services. In addition, investments may be valued at fair value if the adviser determines that an investment’s value has been materially affected by events occurring after the close of the exchange or market on which the investment is principally traded (such as foreign exchange or market) and prior to the determination of the fund’s net asset value, or after the halt of trading of a specific security where trading does not resume prior to the close of the exchange or market on which the security is principally traded. Events that occur after foreign markets close (such as developments in foreign markets and significant movements in the U.S. markets) and prior to the determination of the fund’s net asset value may be deemed to have a material effect on the value of securities traded in foreign markets. Accordingly, the fund’s foreign equity securities may often be valued at fair value. The adviser generally relies on third-party pricing services or other information (such as the correlation with price movements of similar securities in the same or other markets; the type, cost and investment characteristics of the security; the business and financial condition of the issuer; and trading and other market data) to assist in determining whether to fair value and at what value to fair value an investment. The value of an investment for purposes of calculating the fund’s net asset value can differ depending on the source and method used to determine value. When fair valuation is used, the value of an investment used to determine the fund’s net asset
16
MFS Core Equity Portfolio
Notes to Financial Statements – continued
value may differ from quoted or published prices for the same investment. There can be no assurance that the fund could obtain the fair value assigned to an investment if it were to sell the investment at the same time at which the fund determines its net asset value per share.
Various inputs are used in determining the value of the fund’s assets or liabilities. These inputs are categorized into three broad levels. In certain cases, the inputs used to measure fair value may fall into different levels of the fair value hierarchy. In such cases, an investment’s level within the fair value hierarchy is based on the lowest level of input that is significant to the fair value measurement. The fund’s assessment of the significance of a particular input to the fair value measurement in its entirety requires judgment, and considers factors specific to the investment. Level 1 includes unadjusted quoted prices in active markets for identical assets or liabilities. Level 2 includes other significant observable market-based inputs (including quoted prices for similar securities, interest rates, prepayment speed, and credit risk). Level 3 includes unobservable inputs, which may include the adviser’s own assumptions in determining the fair value of investments. The following is a summary of the levels used as of December 31, 2019 in valuing the fund’s assets or liabilities:
| | | | | | | | | | | | | | | | |
| Financial Instruments | | Level 1 | | | Level 2 | | | Level 3 | | | Total | |
| Equity Securities | | | $213,426,727 | | | | $— | | | | $— | | | | $213,426,727 | |
| Mutual Funds | | | 2,042,920 | | | | — | | | | — | | | | 2,042,920 | |
| Total | | | $215,469,647 | | | | $— | | | | $— | | | | $215,469,647 | |
| Securities Sold Short | | | $(1,228,732 | ) | | | $— | | | | $— | | | | $(1,228,732 | ) |
For further information regarding security characteristics, see the Portfolio of Investments.
The following is a reconciliation of level 3 assets for which significant unobservable inputs were used to determine fair value. The table presents the activity of level 3 securities held at the beginning and the end of the period.
| | | | |
| |
| | | Equity Securities | |
| Balance as of 12/31/18 | | | $18,858 | |
Disposition of worthless securities | | | 0 | |
Realized gain (loss) | | | (18,858 | ) |
| Balance as of 12/31/19 | | | $— | |
Foreign Currency Translation – Purchases and sales of foreign investments, income, and expenses are converted into U.S. dollars based upon currency exchange rates prevailing on the respective dates of such transactions or on the reporting date for foreign denominated receivables and payables. Gains and losses attributable to foreign currency exchange rates on sales of securities are recorded for financial statement purposes as net realized gains and losses on investments. Gains and losses attributable to foreign exchange rate movements on receivables, payables, income and expenses are recorded for financial statement purposes as foreign currency transaction gains and losses. That portion of both realized and unrealized gains and losses on investments that results from fluctuations in foreign currency exchange rates is not separately disclosed.
Short Sales – The fund entered into short sales whereby it sells a security it does not own in anticipation of a decline in the value of that security. The fund will realize a gain if the security price decreases and a loss if the security price increases between the date of the short sale and the date on which the fund replaces the borrowed security. Losses from short sales can exceed the proceeds of the security sold; and they can also exceed the potential loss from an ordinary buy and sell transaction. The amount of any premium, dividends, or interest the fund may be required to pay in connection with a short sale will be recognized as a fund expense. During the year ended December 31, 2019, this expense amounted to $67,715. The fund segregates cash or marketable securities in an amount that, when combined with the amount of proceeds from the short sale deposited with the broker, at least equals the current market value of the security sold short.
Security Loans – Under its Securities Lending Agency Agreement with the fund, State Street Bank and Trust Company, as lending agent, loans the securities of the fund to certain qualified institutions (the “Borrowers”) approved by the fund. Security loans can be terminated at the discretion of either the lending agent or the fund and the related securities must be returned within the earlier of the standard trade settlement period for such securities or within three business days. The loans are collateralized by cash and/or U.S. Treasury and federal agency obligations in an amount typically at least equal to the market value of the securities loaned. On loans collateralized by cash, the cash collateral is invested in a money market fund. The market value of the loaned securities is determined at the close of business of the fund and any additional required collateral is delivered to the fund on the next business day. The lending agent provides the fund with indemnification against Borrower default. In the event of Borrower default, the lending agent will, for the benefit of the fund, either purchase securities identical to those loaned or, when such purchase is commercially impracticable, pay the fund the market value of the loaned securities. In return, the lending agent assumes the fund’s rights to the related collateral. If the collateral value is less than the cost to purchase identical securities, the lending agent is responsible for the shortfall, but only to the extent that such shortfall is not due to a decline in collateral value resulting from collateral reinvestment for which the fund bears the risk of loss. At period end, the fund had investment securities on loan, all of which were classified as equity securities in the fund’s Portfolio of Investments, with a fair value of $211,338. The fair value of the fund’s investment securities on
17
MFS Core Equity Portfolio
Notes to Financial Statements – continued
loan and a related liability of $70,325 for cash collateral received on securities loaned are both presented gross in the Statement of Assets and Liabilities. Additionally, these loans were collateralized by U.S. Treasury Obligations of $157,671 held by the lending agent. The collateral on securities loaned exceeded the value of securities on loan at period end. The liability for cash collateral for securities loaned is carried at fair value, which is categorized as level 2 within the fair value hierarchy. A portion of the income generated upon investment of the collateral is remitted to the Borrowers, and the remainder is allocated between the fund and the lending agent. On loans collateralized by U.S. Treasury and/or federal agency obligations, a fee is received from the Borrower, and is allocated between the fund and the lending agent. Income from securities lending is separately reported in the Statement of Operations. The dividend and interest income earned on the securities loaned is accounted for in the same manner as other dividend and interest income.
Indemnifications – Under the fund’s organizational documents, its officers and Trustees may be indemnified against certain liabilities and expenses arising out of the performance of their duties to the fund. Additionally, in the normal course of business, the fund enters into agreements with service providers that may contain indemnification clauses. The fund’s maximum exposure under these agreements is unknown as this would involve future claims that may be made against the fund that have not yet occurred.
Investment Transactions and Income – Investment transactions are recorded on the trade date. Dividends received in cash are recorded on theex-dividend date. Certain dividends from foreign securities will be recorded when the fund is informed of the dividend if such information is obtained subsequent to theex-dividend date. Dividend payments received in additional securities are recorded on theex-dividend date in an amount equal to the value of the security on such date.
The fund may receive proceeds from litigation settlements. Any proceeds received from litigation involving portfolio holdings are reflected in the Statement of Operations in realized gain/loss if the security has been disposed of by the fund or in unrealized gain/loss if the security is still held by the fund. Any other proceeds from litigation not related to portfolio holdings are reflected as other income in the Statement of Operations.
Tax Matters and Distributions – The fund intends to qualify as a regulated investment company, as defined under Subchapter M of the Internal Revenue Code, and to distribute all of its taxable income, including realized capital gains. As a result, no provision for federal income tax is required. The fund’s federal tax returns, when filed, will remain subject to examination by the Internal Revenue Service for a three year period. Management has analyzed the fund’s tax positions taken on federal and state tax returns for all open tax years and does not believe that there are any uncertain tax positions that require recognition of a tax liability. Foreign taxes, if any, have been accrued by the fund in the accompanying financial statements in accordance with the applicable foreign tax law. Foreign income taxes may be withheld by certain countries in which the fund invests. Additionally, capital gains realized by the fund on securities issued in or by certain foreign countries may be subject to capital gains tax imposed by those countries.
Distributions to shareholders are recorded on theex-dividend date. Income and capital gain distributions are determined in accordance with income tax regulations, which may differ from U.S. generally accepted accounting principles. Certain capital accounts in the financial statements are periodically adjusted for permanent differences in order to reflect their tax character. These adjustments have no impact on net assets or net asset value per share. Temporary differences which arise from recognizing certain items of income, expense, gain or loss in different periods for financial statement and tax purposes will reverse at some time in the future.
Book/tax differences primarily relate to wash sale loss deferrals.
The tax character of distributions declared to shareholders for the last two fiscal years is as follows:
| | | | | | | | |
| | | Year ended
12/31/19 | | | Year ended
12/31/18 | |
| Ordinary income (including any short-term capital gains) | | | $2,965,018 | | | | $6,671,036 | |
| Long-term capital gains | | | 25,174,011 | | | | 16,826,017 | |
| Total distributions | | | $28,139,029 | | | | $23,497,053 | |
The federal tax cost and the tax basis components of distributable earnings were as follows:
| | | | |
| As of 12/31/19 | | | | |
| |
| Cost of investments | | | $143,728,227 | |
| Gross appreciation | | | 72,822,418 | |
| Gross depreciation | | | (2,309,730 | ) |
| Net unrealized appreciation (depreciation) | | | $70,512,688 | |
| |
| Undistributed ordinary income | | | 3,900,983 | |
| Undistributed long-term capital gain | | | 7,858,941 | |
| Other temporary differences | | | 112,805 | |
Multiple Classes of Shares of Beneficial Interest– The fund offers multiple classes of shares, which differ in their respective distribution and/or service fees. The fund’s income, realized and unrealized gain (loss), and common expenses are allocated to
18
MFS Core Equity Portfolio
Notes to Financial Statements – continued
shareholders based on the daily net assets of each class. Dividends are declared separately for each class. Differences in per share dividend rates are generally due to differences in separate class expenses. The fund’s distributions declared to shareholders as reported in the Statements of Changes in Net Assets are presented by class as follows:
| | | | | | | | |
| | |
| | | Year ended
12/31/19 | | | Year ended
12/31/18 | |
| Initial Class | | | $21,988,555 | | | | $18,537,988 | |
| Service Class | | | 6,150,474 | | | | 4,959,065 | |
| Total | | | $28,139,029 | | | | $23,497,053 | |
| (3) | | Transactions with Affiliates |
Investment Adviser – The fund has an investment advisory agreement with MFS to provide overall investment management and related administrative services and facilities to the fund. The management fee is computed daily and paid monthly at the following annual rates based on the fund’s average daily net assets:
| | | | |
| Up to $1 billion | | | 0.75% | |
| In excess of $1 billion and up to $2.5 billion | | | 0.65% | |
| In excess of $2.5 billion | | | 0.60% | |
MFS has agreed in writing to reduce its management fee by a specified amount if certain MFS mutual fund assets exceed thresholds agreed to by MFS and the fund’s Board of Trustees. For the year ended December 31, 2019, this management fee reduction amounted to $19,947, which is included in the reduction of total expenses in the Statement of Operations. The management fee incurred for the year ended December 31, 2019 was equivalent to an annual effective rate of 0.74% of the fund’s average daily net assets.
The investment adviser has agreed in writing to pay a portion of the fund’s total annual operating expenses, excluding interest, taxes, extraordinary expenses, brokerage and transaction costs, and investment-related expenses (such as short sale dividend and interest expense incurred in connection with the fund’s investment activity), such that total annual operating expenses do not exceed 0.84% of average daily net assets for the Initial Class shares and 1.09% of average daily net assets for the Service Class shares. This written agreement will continue until modified by the fund’s Board of Trustees, but such agreement will continue at least until April 30, 2021. For the year ended December 31, 2019, the fund’s actual operating expenses did not exceed the limit and therefore, the investment adviser did not pay any portion of the fund’s expenses related to this agreement.
Distributor – MFS Fund Distributors, Inc. (MFD), a wholly-owned subsidiary of MFS, is the distributor of shares of the fund. The Trustees have adopted a distribution plan for the Service Class shares pursuant to Rule12b-1 under the Investment Company Act of 1940.
The fund’s distribution plan provides that the fund will pay MFD distribution and/or service fees equal to 0.25% per annum of its average daily net assets attributable to Service Class shares as partial consideration for services performed and expenses incurred by MFD and financial intermediaries (including participating insurance companies that invest in the fund to fund variable annuity and variable life insurance contracts, sponsors of qualified retirement and pension plans that invest in the fund, and affiliates of these participating insurance companies and plan sponsors) in connection with the sale and distribution of the Service Class shares. MFD may subsequently pay all, or a portion, of the distribution and/or service fees to financial intermediaries.
Shareholder Servicing Agent – MFS Service Center, Inc. (MFSC), a wholly-owned subsidiary of MFS, receives a fee from the fund for its services as shareholder servicing agent. For the year ended December 31, 2019, the fee was $7,679, which equated to 0.0038% annually of the fund’s average daily net assets. MFSC also receives payment from the fund forout-of-pocket expenses paid by MFSC on behalf of the fund. For the year ended December 31, 2019, these costs amounted to $502.
Administrator – MFS provides certain financial, legal, shareholder communications, compliance, and other administrative services to the fund. Under an administrative services agreement, the fund reimburses MFS the costs incurred to provide these services. The fund is charged an annual fixed amount of $17,500 plus a fee based on average daily net assets. The administrative services fee incurred for the year ended December 31, 2019 was equivalent to an annual effective rate of 0.0187% of the fund’s average daily net assets.
Trustees’ and Officers’ Compensation – The fund pays compensation to independent Trustees in the form of a retainer, attendance fees, and additional compensation to Board and Committee chairpersons. The fund does not pay compensation directly to Trustees or officers of the fund who are also officers of the investment adviser, all of whom receive remuneration from MFS for their services to the fund. Certain officers and Trustees of the fund are officers or directors of MFS, MFD, and MFSC.
Other – This fund and certain other funds managed by MFS (the funds) had entered into a service agreement (the ISO Agreement) which provided for payment of fees solely by the funds to Tarantino LLC in return for the provision of services of an Independent Senior Officer (ISO) for the funds. Frank L. Tarantino served as the ISO and was an officer of the funds and the sole member of Tarantino LLC. Effective June 30, 2019, Mr. Tarantino retired from his position as ISO for the funds, and the ISO Agreement was
19
MFS Core Equity Portfolio
Notes to Financial Statements – continued
terminated. For the year ended December 31, 2019, the fee paid by the fund under this agreement was $237 and is included in “Miscellaneous” expense in the Statement of Operations. MFS had agreed to bear all expenses associated with office space, other administrative support, and supplies provided to the ISO.
The fund invests in the MFS Institutional Money Market Portfolio which is managed by MFS and seeks current income consistent with preservation of capital and liquidity. This money market fund does not pay a management fee to MFS.
The fund is permitted to engage in purchase and sale transactions with funds and accounts for which MFS serves as investment adviser orsub-adviser (“cross-trades”) pursuant to a policy adopted by the Board of Trustees. This policy has been designed to ensure that cross-trades conducted by the fund comply with Rule17a-7 under the Investment Company Act of 1940. During the year ended December 31, 2019, the fund engaged in purchase and sale transactions pursuant to this policy, which amounted to $77,407 and $79,712, respectively. The sales transactions resulted in net realized gains (losses) of $10,948.
The adviser has voluntarily undertaken to reimburse the fund from its own resources on a quarterly basis for the cost of investment research embedded in the cost of the fund’s securities trades. This agreement may be rescinded at any time. For the year ended December 31, 2019, this reimbursement amounted to $13,365, which is included in “Other” income in the Statement of Operations.
For the year ended December 31, 2019, purchases and sales of investments, other than short sales and short-term obligations, aggregated $75,435,779 and $102,390,963, respectively.
| (5) | | Shares of Beneficial Interest |
The fund’s Declaration of Trust permits the Trustees to issue an unlimited number of full and fractional shares of beneficial interest. Transactions in fund shares were as follows:
| | | | | | | | | | | | | | | | |
| | | Year ended 12/31/19 | | | Year ended 12/31/18 | |
| | | | |
| | | Shares | | | Amount | | | Shares | | | Amount | |
| Shares sold | | | | | | | | | | | | | | | | |
Initial Class | | | 173,198 | | | | $4,231,121 | | | | 194,535 | | | | $4,980,452 | |
Service Class | | | 114,041 | | | | 2,743,994 | | | | 265,699 | | | | 6,551,910 | |
| | | 287,239 | | | | $6,975,115 | | | | 460,234 | | | | $11,532,362 | |
| | | | |
| Shares issued to shareholders in reinvestment of distributions | | | | | | | | | | | | | | | | |
Initial Class | | | 988,694 | | | | $21,988,555 | | | | 743,602 | | | | $18,537,988 | |
Service Class | | | 279,694 | | | | 6,150,474 | | | | 200,935 | | | | 4,959,065 | |
| | | 1,268,388 | | | | $28,139,029 | | | | 944,537 | | | | $23,497,053 | |
| | | | |
| Shares reacquired | | | | | | | | | | | | | | | | |
Initial Class | | | (1,099,951 | ) | | | $(26,894,741 | ) | | | (1,034,631 | ) | | | $(26,088,919 | ) |
Service Class | | | (407,368 | ) | | | (9,921,452 | ) | | | (406,173 | ) | | | (10,228,826 | ) |
| | | (1,507,319 | ) | | | $(36,816,193 | ) | | | (1,440,804 | ) | | | $(36,317,745 | ) |
| | | | |
| Net change | | | | | | | | | | | | | | | | |
Initial Class | | | 61,941 | | | | $(675,065 | ) | | | (96,494 | ) | | | $(2,570,479 | ) |
Service Class | | | (13,633 | ) | | | (1,026,984 | ) | | | 60,461 | | | | 1,282,149 | |
| | | 48,308 | | | | $(1,702,049 | ) | | | (36,033 | ) | | | $(1,288,330 | ) |
The fund and certain other funds managed by MFS participate in a $1.25 billion unsecured committed line of credit, subject to a $1 billion sublimit, provided by a syndicate of banks under a credit agreement. Borrowings may be made for temporary financing needs. Interest is charged to each fund, based on its borrowings, generally at a rate equal to the highest of one month LIBOR, the Federal Funds Effective Rate and the Overnight Bank Funding Rate, plus an agreed upon spread. A commitment fee, based on the average daily, unused portion of the committed line of credit, is allocated among the participating funds. In addition, the fund and other funds managed by MFS have established unsecured uncommitted borrowing arrangements with certain banks for temporary financing needs. Interest is charged to each fund, based on its borrowings, at rates equal to customary reference rates plus an agreed upon spread. For the year ended December 31, 2019, the fund’s commitment fee and interest expense were $1,110 and $0, respectively, and are included in “Interest expense and fees” in the Statement of Operations.
20
MFS Core Equity Portfolio
Notes to Financial Statements – continued
| (7) | | Investments in Affiliated Issuers |
An affiliated issuer may be considered one in which the fund owns 5% or more of the outstanding voting securities, or a company which is under common control. For the purposes of this report, the following were affiliated issuers:
| | | | | | | | | | | | | | | | | | | | | | | | |
| Affiliated Issuers | | Beginning
Value | | | Purchases | | | Sales
Proceeds | | | Realized
Gain
(Loss) | | | Change in
Unrealized
Appreciation or
Depreciation | | | Ending
Value | |
| MFS Institutional Money Market Portfolio | | | $2,863,869 | | | | $36,669,823 | | | | $37,560,728 | | | | $(347 | ) | | | $(22 | ) | | | $1,972,595 | |
| | | | | | |
| Affiliated Issuers | | | | | | | | | | | | | | Dividend
Income | | | Capital Gain
Distributions | |
| MFS Institutional Money Market Portfolio | | | | | | | | | | | | | | | | | | | $35,379 | | | | $— | |
21
MFS Core Equity Portfolio
REPORT OF INDEPENDENT REGISTERED PUBLIC ACCOUNTING FIRM
To the Board of Trustees of MFS Variable Insurance Trust II and the Shareholders of MFS Core Equity Portfolio:
Opinion on the Financial Statements and Financial Highlights
We have audited the accompanying statement of assets and liabilities of MFS Core Equity Portfolio (the “Fund”), including the portfolio of investments, as of December 31, 2019, the related statement of operations for the year then ended, the statements of changes in net assets for each of the two years in the period then ended, the financial highlights for each of the five years in the period then ended, and the related notes. In our opinion, the financial statements and financial highlights present fairly, in all material respects, the financial position of the Fund as of December 31, 2019, and the results of its operations for the year then ended, the changes in its net assets for each of the two years in the period then ended, and the financial highlights for each of the five years in the period then ended, in conformity with accounting principles generally accepted in the United States of America.
Basis for Opinion
These financial statements and financial highlights are the responsibility of the Fund’s management. Our responsibility is to express an opinion on the Fund’s financial statements and financial highlights based on our audits. We are a public accounting firm registered with the Public Company Accounting Oversight Board (United States) (PCAOB) and are required to be independent with respect to the Fund in accordance with the U.S. federal securities laws and the applicable rules and regulations of the Securities and Exchange Commission and the PCAOB.
We conducted our audits in accordance with the standards of the PCAOB. Those standards require that we plan and perform the audit to obtain reasonable assurance about whether the financial statements and financial highlights are free of material misstatement, whether due to error or fraud. The Fund is not required to have, nor were we engaged to perform, an audit of its internal control over financial reporting. As part of our audits we are required to obtain an understanding of internal control over financial reporting but not for the purpose of expressing an opinion on the effectiveness of the Fund’s internal control over financial reporting. Accordingly, we express no such opinion.
Our audits included performing procedures to assess the risks of material misstatement of the financial statements and financial highlights, whether due to error or fraud, and performing procedures that respond to those risks. Such procedures included examining, on a test basis, evidence regarding the amounts and disclosures in the financial statements and financial highlights. Our audits also included evaluating the accounting principles used and significant estimates made by management, as well as evaluating the overall presentation of the financial statements and financial highlights. Our procedures included confirmation of securities owned as of December 31, 2019, by correspondence with the custodian and brokers. We believe that our audits provide a reasonable basis for our opinion.
DELOITTE & TOUCHE LLP
Boston, Massachusetts
February 14, 2020
We have served as the auditor of one or more of the MFS investment companies since 1924.
22
MFS Core Equity Portfolio
TRUSTEES AND OFFICERS – IDENTIFICATION AND BACKGROUND
The Trustees and Officers of the Trust, as of February 1, 2020, are listed below, together with their principal occupations during the past five years. (Their titles may have varied during that period.) The address of each Trustee and Officer is 111 Huntington Avenue, Boston, Massachusetts 02199-7618.
| | | | | | | | | | |
Name, Age | | Position(s)
Held with Fund | | Trustee/Officer
Since (h) | | Number of MFS Funds
overseen by the
Trustee | | Principal Occupations
During the Past Five Years | | Other Directorships During the Past Five Years (j) |
| INTERESTED TRUSTEES |
Robert J. Manning (k)
(age 56) | | Trustee | | February 2004 | | 133 | | Massachusetts Financial Services Company, Executive Chairman (since January 2017); Director; Chairman of the Board; Chief Executive Officer (until 2015);Co-Chief Executive Officer(2015-2016) | | N/A |
| | | | | |
Robin A. Stelmach (k) (age 58) | | Trustee | | January 2014 | | 133 | | Massachusetts Financial Services Company, Vice Chair (since January 2017); Chief Operating Officer and Executive Vice President (until January 2017) | | N/A |
|
| INDEPENDENT TRUSTEES |
John P. Kavanaugh (age 65) | | Trustee and Chair of Trustees | | January 2009 | | 133 | | Private investor | | N/A |
| | | | | |
Steven E. Buller (age 68) | | Trustee | | February 2014 | | 133 | | Financial Accounting Standards Advisory Council, Chairman(2014-2015); Public Company Accounting Oversight Board, Standing Advisory Group, Member (until 2014); BlackRock, Inc. (investment management), Managing Director (until 2014), BlackRock Finco UK (investment management), Director (until 2014) | | N/A |
| | | | | |
John A. Caroselli (age 65) | | Trustee | | March 2017 | | 133 | | JC Global Advisors, LLC (management consulting), President (since 2015); First Capital Corporation (commercial finance), Executive Vice President (until 2015) | | N/A |
| | | | | |
Maureen R. Goldfarb (age 64) | | Trustee | | January 2009 | | 133 | | Private investor | | N/A |
| | | | | |
Peter D. Jones
(age 64) | | Trustee | | January 2019 | | 133 | | Franklin Templeton Distributors, Inc. (investment management), President (until 2015); Franklin Templeton Institutional, LLC (investment management), Chairman (until 2015) | | N/A |
| | | | | |
James W. Kilman, Jr.
(age 58) | | Trustee | | January 2019 | | 133 | | Burford Capital Limited (finance and investment management), Chief Financial Officer (since 2019); KielStrand Capital LLC (family office), Chief Executive Officer (since 2016); Morgan Stanley & Co. (financial services), Vice Chairman of Investment Banking,Co-Head of Diversified Financials Coverage – Financial Institutions Investment Banking Group (until 2016) | | Alpha-En Corporation, Director (2016-2019) |
23
MFS Core Equity Portfolio
Trustees and Officers – continued
| | | | | | | | | | |
Name, Age | | Position(s)
Held with Fund | | Trustee/Officer
Since (h) | | Number of MFS Funds
overseen by the
Trustee | | Principal Occupations
During the Past Five Years | | Other Directorships During the Past Five Years (j) |
Clarence Otis, Jr. (age 63) | | Trustee | | March 2017 | | 133 | | Darden Restaurants, Inc., Chief Executive Officer (until 2014) | | VF Corporation, Director; Verizon Communications, Inc., Director; The Travelers Companies, Director; Federal Reserve Bank of Atlanta, Director (until 2015) |
| | | | | |
Maryanne L. Roepke (age 63) | | Trustee | | May 2014 | | 133 | | American Century Investments (investment management), Senior Vice President and Chief Compliance Officer (until 2014) | | N/A |
| | | | | |
Laurie J. Thomsen
(age 62) | | Trustee | | March 2005 | | 133 | | Private investor | | The Travelers Companies, Director; Dycom Industries, Inc., Director (since 2015) |
| | | | | | | | |
Name, Age | | Position(s)
Held with Fund | | Trustee/Officer
Since (h) | | Number of
MFS Funds
for which the
Person is an
Officer | | Principal Occupations During the Past Five Years |
| OFFICERS | | | | | | |
Christopher R. Bohane (k)
(age 46) | | Assistant Secretary and Assistant Clerk | | July 2005 | | 133 | | Massachusetts Financial Services Company, Vice President and Assistant General Counsel |
| | | | |
Kino Clark (k) (age 51) | | Assistant Treasurer | | January 2012 | | 133 | | Massachusetts Financial Services Company, Vice President |
| | | | |
John W. Clark, Jr. (k) (age 52) | | Assistant Treasurer | | April 2017 | | 133 | | Massachusetts Financial Services Company, Vice President (since March 2017); Deutsche Bank (financial services), Department Head –Treasurer’s Office (until February 2017) |
| | | | |
Thomas H. Connors (k) (age 60) | | Assistant Secretary and Assistant Clerk | | September 2012 | | 133 | | Massachusetts Financial Services Company, Vice President and Senior Counsel |
| | | | |
David L. DiLorenzo (k)
(age 51) | | President | | July 2005 | | 133 | | Massachusetts Financial Services Company, Senior Vice President |
| | | | |
Heidi W. Hardin (k) (age 52) | | Secretary and Clerk | | April 2017 | | 133 | | Massachusetts Financial Services Company, Executive Vice President and General Counsel (since March 2017); Harris Associates (investment management), General Counsel (from September 2015 to January 2017); Janus Capital Management LLC (investment management), Senior Vice President and General Counsel (until September 2015) |
| | | | |
Brian E. Langenfeld (k) (age 46) | | Assistant
Secretary and Assistant Clerk | | June 2006 | | 133 | | Massachusetts Financial Services Company, Vice President and Senior Counsel |
| | | | |
Amanda S. Mooradian (k) (age 40) | | Assistant
Secretary and Assistant Clerk | | September 2018 | | 133 | | Massachusetts Financial Services Company, Assistant Vice President and Counsel |
| | | | |
Susan A. Pereira (k)
(age 49) | | Assistant
Secretary and Assistant Clerk | | July 2005 | | 133 | | Massachusetts Financial Services Company, Vice President and Assistant General Counsel |
| | | | |
Kasey L. Phillips (k) (age 49) | | Assistant Treasurer | | September 2012 | | 133 | | Massachusetts Financial Services Company, Vice President |
| | | | |
Matthew A. Stowe (k) (age 45) | | Assistant Secretary and Assistant Clerk | | October 2014 | | 133 | | Massachusetts Financial Services Company, Vice President and Assistant General Counsel |
24
MFS Core Equity Portfolio
Trustees and Officers – continued
| | | | | | | | |
Name, Age | | Position(s)
Held with Fund | | Trustee/Officer
Since (h) | | Number of
MFS Funds
for which the
Person is an
Officer | | Principal Occupations During the Past Five Years |
Martin J. Wolin (k) (age 52) | | Chief Compliance Officer | | July 2015 | | 133 | | Massachusetts Financial Services Company, Senior Vice President and Chief Compliance Officer (since July 2015); Mercer (financial service provider), Chief Risk and Compliance Officer, North America and Latin America (until June 2015) |
| | | | |
James O. Yost (k)
(age 59) | | Treasurer | | September 1990 | | 133 | | Massachusetts Financial Services Company, Senior Vice President |
| (h) | Date first appointed to serve as Trustee/officer of an MFS Fund. Each Trustee has served continuously since appointment unless indicated otherwise. For the period from December 15, 2004 until February 22, 2005, Mr. Manning served as Advisory Trustee. From January 2012 through December 2016, Messrs. DiLorenzo and Yost served as Treasurer and Deputy Treasurer of the Funds, respectively. |
| (j) | Directorships or trusteeships of companies required to report to the Securities and Exchange Commission (i.e., “public companies”). |
| (k) | “Interested person” of the Trust within the meaning of the Investment Company Act of 1940 (referred to as the 1940 Act), which is the principal federal law governing investment companies like the fund, as a result of a position with MFS. The address of MFS is 111 Huntington Avenue, Boston, Massachusetts 02199-7618. |
Each Trustee (other than Messrs. Jones and Kilman) has been elected by shareholders and each Trustee and Officer holds office until his or her successor is chosen and qualified or until his or her earlier death, resignation, retirement or removal. Messrs. Jones and Kilman became Trustees of the Funds on January 1, 2019. The Trust does not hold annual meetings for the purpose of electing Trustees, and Trustees are not elected for fixed terms. Under the terms of the Board’s retirement policy, an Independent Trustee shall retire at the end of the calendar year in which he or she reaches the earlier of 75 years of age or 15 years of service on the Board (or, in the case of any Independent Trustee who joined the Board prior to 2015, 20 years of service on the Board).
Messrs. Buller, Kilman and Otis and Ms. Roepke are members of the Trust’s Audit Committee.
Each of the Interested Trustees and certain Officers hold comparable officer positions with certain affiliates of MFS.
The Statement of Additional Information for a Fund includes further information about the Trustees and is available without charge upon request by calling1-800-225-2606.
| | |
Investment Adviser Massachusetts Financial Services Company 111 Huntington Avenue Boston, MA 02199-7618 | | Custodian State Street Bank and Trust Company 1 Lincoln Street Boston, MA 02111-2900 |
| |
Distributor MFS Fund Distributors, Inc. 111 Huntington Avenue Boston, MA 02199-7618 | | Independent Registered Public Accounting Firm Deloitte & Touche LLP 200 Berkeley Street Boston, MA 02116 |
| |
Portfolio Manager(s) Joseph MacDougall | | |
25
MFS Core Equity Portfolio
BOARD REVIEW OF INVESTMENT ADVISORY AGREEMENT
MFS Core Equity Portfolio
The Investment Company Act of 1940 requires that both the full Board of Trustees and a majority of thenon-interested (“independent”) Trustees, voting separately, annually approve the continuation of the Fund’s investment advisory agreement with MFS. The Trustees consider matters bearing on the Fund and its advisory arrangements at their meetings throughout the year, including a review of performance data at each regular meeting. In addition, the independent Trustees met several times over the course of three months beginning in May and ending in July, 2019 (“contract review meetings”) for the specific purpose of considering whether to approve the continuation of the investment advisory agreement for the Fund and the other investment companies that the Board oversees (the “MFS Funds”). The independent Trustees were assisted in their evaluation of the Fund’s investment advisory agreement by independent legal counsel, from whom they received separate legal advice and with whom they met separately from MFS during various contract review meetings. The independent Trustees were also assisted in this process by the MFS Funds’ Independent Senior Officer, a senior officer appointed by and reporting to the independent Trustees.
In connection with their deliberations regarding the continuation of the investment advisory agreement, the Trustees, including the independent Trustees, considered such information and factors as they believed, in light of the legal advice furnished to them and their own business judgment, to be relevant. The investment advisory agreement for the Fund was considered separately, although the Trustees also took into account the common interests of all MFS Funds in their review. As described below, the Trustees considered the nature, quality, and extent of the various investment advisory, administrative, and shareholder services performed by MFS under the existing investment advisory agreement and other arrangements with the Fund.
In connection with their contract review meetings, the Trustees received and relied upon materials that included, among other items: (i) information provided by Broadridge Financial Solutions, Inc. (“Broadridge”), an independent third party, on the investment performance of the Fund for various time periods ended December 31, 2018 and the investment performance of a group of funds with substantially similar investment classifications/objectives (the “Broadridge performance universe”), (ii) information provided by Broadridge on the Fund’s advisory fees and other expenses and the advisory fees and other expenses of comparable funds identified by Broadridge as well as all other funds in the same investment classification/category (the “Broadridge expense group and universe”), (iii) information provided by MFS on the advisory fees of portfolios of other clients of MFS, including institutional separate accounts and other clients, (iv) information as to whether and to what extent applicable expense waivers, reimbursements or fee “breakpoints” are observed for the Fund, (v) information regarding MFS’ financial results and financial condition, including MFS’ and certain of its affiliates’ estimated profitability from services performed for the Fund and the MFS Funds as a whole, and compared to MFS’ institutional business, (vi) MFS’ views regarding the outlook for the mutual fund industry and the strategic business plans of MFS, (vii) descriptions of various functions performed by MFS for the Funds, such as compliance monitoring and portfolio trading practices, and (viii) information regarding the overall organization of MFS, including information about MFS’ senior management and other personnel providing investment advisory, administrative and other services to the Fund and the other MFS Funds. The comparative performance, fee and expense information prepared and provided by Broadridge was not independently verified and the independent Trustees did not independently verify any information provided to them by MFS.
The Trustees’ conclusion as to the continuation of the investment advisory agreement was based on a comprehensive consideration of all information provided to the Trustees and not the result of any single factor. Some of the factors that figured particularly in the Trustees’ deliberations are described below, although individual Trustees may have evaluated the information presented differently from one another, giving different weights to various factors. It is also important to recognize that the fee arrangements for the Fund and other MFS Funds are the result of years of review and discussion between the independent Trustees and MFS, that certain aspects of such arrangements may receive greater scrutiny in some years than in others, and that the Trustees’ conclusions may be based, in part, on their consideration of these same arrangements during the course of the year and in prior years.
Based on information provided by Broadridge and MFS, the Trustees reviewed the Fund’s total return investment performance as well as the Broadridge performance universe over various time periods. The Trustees placed particular emphasis on the total return performance of the Fund’s Initial Class shares in comparison to the performance of funds in its Broadridge performance universe over the five-year period ended December 31, 2018, which the Trustees believed was a long enough period to reflect differing market conditions. The total return performance of the Fund’s Initial Class shares was in the 1st quintile relative to the other funds in the universe for this five-year period (the 1st quintile being the best performers and the 5th quintile being the worst performers). The total return performance of the Fund’s Initial Class shares was in the 1st quintile for each of theone- and three-year periods ended December 31, 2018 relative to the Broadridge performance universe. Because of the passage of time, these performance results may differ from the performance results for more recent periods, including those shown elsewhere in this report.
In the course of their deliberations, the Trustees took into account information provided by MFS in connection with the contract review meetings, as well as during investment review meetings conducted with portfolio management personnel during the course of the year regarding the Fund’s performance. After reviewing these and related factors, the Trustees concluded, within the context of their overall conclusions regarding the investment advisory agreement, that they were satisfied with MFS’ responses and efforts relating to investment performance.
26
MFS Core Equity Portfolio
Board Review of Investment Advisory Agreement – continued
In assessing the reasonableness of the Fund’s advisory fee, the Trustees considered, among other information, the Fund’s advisory fee and the total expense ratio of the Fund’s Initial Class shares as a percentage of average daily net assets and the advisory fee and total expense ratios of the Broadridge expense group based on information provided by Broadridge. The Trustees considered that MFS currently observes an expense limitation for the Fund, which may not be changed without the Trustees’ approval. The Trustees also considered that, according to the data provided by Broadridge (which takes into account any fee reductions or expense limitations that were in effect during the Fund’s last fiscal year), the Fund’s effective advisory fee rate and total expense ratio were each higher than the Broadridge expense group median.
The Trustees also considered the advisory fees charged by MFS to any institutional separate accounts advised by MFS (“separate accounts”) and unaffiliated investment companies for which MFS serves as subadviser (“subadvised funds”) that have comparable investment strategies to the Fund, if any. In comparing these fees, the Trustees considered information provided by MFS as to the generally broader scope of services provided by MFS to the Fund, as well as the more extensive regulatory burdens imposed on MFS in managing the Fund, in comparison to separate accounts and subadvised funds. The Trustees also considered the higher demands placed on MFS’ investment personnel and trading infrastructure as a result of the daily cashin-flows andout-flows of the Fund in comparison to separate accounts.
The Trustees also considered whether the Fund may benefit from any economies of scale in the management of the Fund in the event of growth in assets of the Fund and/or growth in assets of the MFS Funds as a whole. They noted that the Fund’s advisory fee rate schedule is subject to contractual breakpoints that reduce the Fund’s advisory fee rate on average daily net assets over $1 billion and $2.5 billion. The Trustees also noted that MFS has agreed in writing to waive a portion of the management fees of certain MFS Funds, including the Fund, if the total combined assets of certain funds within the MFS Funds’ complex increase above agreed upon thresholds (the “group fee waiver”), enabling the Fund’s shareholders to share in the benefits from any economies of scale at the complex level. The group fee waiver is reviewed and renewed annually between the Board and MFS. The Trustees concluded that the breakpoints and the group fee waiver were sufficient to allow the Fund to benefit from economies of scale as its assets and overall complex assets grow.
The Trustees also considered information prepared by MFS relating to MFS’ costs and profits with respect to the Fund, the MFS Funds considered as a group, and other investment companies and accounts advised by MFS, as well as MFS’ methodologies used to determine and allocate its costs to the MFS Funds, the Fund and other accounts and products for purposes of estimating profitability.
After reviewing these and other factors described herein, the Trustees concluded, within the context of their overall conclusions regarding the investment advisory agreement, that the advisory fees charged to the Fund represent reasonable compensation in light of the services being provided by MFS to the Fund.
In addition, the Trustees considered MFS’ resources and related efforts to continue to retain, attract and motivate capable personnel to serve the Fund. The Trustees also considered current and developing conditions in the financial services industry, including the presence of large and well-capitalized companies which are spending, and appear to be prepared to continue to spend, substantial sums to engage personnel and to provide services to competing investment companies. In this regard, the Trustees also considered the financial resources of MFS and its ultimate parent, Sun Life Financial Inc. The Trustees also considered the advantages and possible disadvantages to the Fund of having an adviser that also serves other investment companies as well as other accounts.
The Trustees also considered the nature, quality, cost, and extent of administrative, transfer agency, and distribution services provided to the Fund by MFS and its affiliates under agreements and plans other than the investment advisory agreement, including any12b-1 fees the Fund pays to MFS Fund Distributors, Inc., an affiliate of MFS. The Trustees also considered the nature, extent and quality of certain other services MFS performs or arranges for on the Fund’s behalf, which may include securities lending programs, directed expense payment programs, class action recovery programs, and MFS’ interaction with third-party service providers, principally custodians andsub-custodians. The Trustees concluded that the variousnon-advisory services provided by MFS and its affiliates on behalf of the Fund were satisfactory.
The Trustees consideredso-called“fall-out benefits” to MFS such as reputational value derived from serving as investment manager to the MFS Funds. The Trustees also considered that, effective January 3, 2018, MFS had discontinued its historic practice of obtaining investment research from portfolio brokerage commissions paid by certain MFS Funds and would thereafter directly pay for or voluntarily reimburse a Fund, if applicable, for the costs of external research acquired through the use of the Fund’s portfolio brokerage commissions.
Based on their evaluation of factors that they deemed to be material, including those factors described above, the Board of Trustees, including the independent Trustees, concluded that the Fund’s investment advisory agreement with MFS should be continued for an additionalone-year period, commencing August 1, 2019.
27
MFS Core Equity Portfolio
PROXY VOTING POLICIES AND INFORMATION
MFS votes proxies on behalf of the fund pursuant to proxy voting policies and procedures that are available without charge, upon request, by calling 1-800-225-2606, by visitingmfs.com/proxyvoting, or by visiting the SEC’s Web site athttp://www.sec.gov.
Information regarding how the fund voted proxies relating to portfolio securities during the most recent twelve-month period ended June 30 is available by August 31 of each year without charge by visitingmfs.com/proxyvoting, or by visiting the SEC’s Web site athttp://www.sec.gov.
QUARTERLY PORTFOLIO DISCLOSURE
The fund files a complete schedule of portfolio holdings with the SEC for the first and third quarters of each fiscal year as an exhibit to its reports on Form N-PORT. The fund’s Form N-PORT reports are available on the SEC’s website athttp://www.sec.gov. A shareholder can obtain the portfolio holdings report for the first and third quarters of the fund’s fiscal year atmfs.com/vit2 by choosing the fund’s name and then selecting the “Resources” tab and clicking on “Prospectus and Reports”.
FURTHER INFORMATION
From time to time, MFS may post important information about the fund or the MFS funds on the MFS web site (mfs.com). This information is available athttps://www.mfs.com/en-us/what-we-do/announcements.htmlor atmfs.com/vit2 by choosing the fund’s name.
INFORMATION ABOUT FUND CONTRACTS AND LEGAL CLAIMS
The fund has entered into contractual arrangements with an investment adviser, administrator, distributor, shareholder servicing agent, 529 program manager (if applicable), and custodian who each provide services to the fund. Unless expressly stated otherwise, shareholders are not parties to, or intended beneficiaries of these contractual arrangements, and these contractual arrangements are not intended to create any shareholder right to enforce them against the service providers or to seek any remedy under them against the service providers, either directly or on behalf of the fund.
Under the Trust’s By-Laws and Declaration of Trust, any claims asserted against or on behalf of the MFS Funds, including claims against Trustees and Officers, must be brought in state and federal courts located within the Commonwealth of Massachusetts.
FEDERAL TAX INFORMATION (unaudited)
The following information is provided pursuant to provisions of the Internal Revenue Code.
The fund designates $27,692,000 as capital gain dividends paid during the fiscal year.
For corporate shareholders, 89.09% of the ordinary income dividends paid during the fiscal year qualify for the corporate dividends received deduction.
28
rev. 3/16
| | | | |
| | | |
| FACTS | | WHAT DOES MFS DO WITH YOUR
PERSONAL INFORMATION? | |  |
| | |
| Why? | | Financial companies choose how they share your personal information. Federal law gives consumers the right to limit some but not all sharing. Federal law also requires us to tell you how we collect, share, and protect your personal information. Please read this notice carefully to understand what we do. |
| | |
| What? | | The types of personal information we collect and share depend on the product or service you have with us. This information can include: • Social Security number and account balances • Account transactions and transaction history • Checking account information and wire transfer instructions When you areno longer our customer, we continue to share your information as described in this notice. |
| | |
| How? | | All financial companies need to share customers’ personal information to run their everyday business. In the section below, we list the reasons financial companies can share their customers’ personal information; the reasons MFS chooses to share; and whether you can limit this sharing. |
| | | | |
Reasons we can share your
personal information | | Does MFS share? | | Can you limit this
sharing? |
For our everyday business purposes – such as to process your transactions, maintain your account(s), respond to court orders and legal investigations, or report to credit bureaus | | Yes | | No |
For our marketing purposes – to offer our products and services to you | | No | | We don’t share |
| For joint marketing with other financial companies | | No | | We don’t share |
For our affiliates’ everyday business purposes – information about your transactions and experiences | | No | | We don’t share |
For our affiliates’ everyday business purposes – information about your creditworthiness | | No | | We don’t share |
| For nonaffiliates to market to you | | No | | We don’t share |
| | |
| | |
| Questions? | | Call800-225-2606 or go tomfs.com. |
29
| | |
| Who we are |
| Who is providing this notice? | | MFS Funds, MFS Investment Management, MFS Institutional Advisors, Inc., and MFS Heritage Trust Company. |
| | |
| What we do |
| How does MFS protect my personal information? | | To protect your personal information from unauthorized access and use, we use security measures that comply with federal law. These measures include procedural, electronic, and physical safeguards for the protection of the personal information we collect about you. |
How does MFS
collect my personal information? | | We collect your personal information, for example, when you • open an account or provide account information • direct us to buy securities or direct us to sell your securities • make a wire transfer We also collect your personal information from others, such as credit bureaus, affiliates, or other companies. |
| Why can’t I limit all sharing? | | Federal law gives you the right to limit only • sharing for affiliates’ everyday business purposes – information about your creditworthiness • affiliates from using your information to market to you • sharing for nonaffiliates to market to you State laws and individual companies may give you additional rights to limit sharing. |
| | |
| Definitions |
| Affiliates | | Companies related by common ownership or control. They can be financial and nonfinancial companies. • MFS does not share personal information with affiliates, except for everyday business purposes as described on page one of this notice. |
| Nonaffiliates | | Companies not related by common ownership or control. They can be financial and nonfinancial companies. • MFS does not share with nonaffiliates so they can market to you. |
| Joint marketing | | A formal agreement between nonaffiliated financial companies that together market financial products or services to you. • MFS doesn’t jointly market. |
| | |
| Other important information |
| If you own an MFS product or receive an MFS service in the name of a third party such as a bank or broker-dealer, their privacy policy may apply to you instead of ours. |
30
Annual Report
December 31, 2019

MFS® Emerging Markets Equity Portfolio

MFS® Variable Insurance Trust II
Beginning on January 1, 2021, as permitted by regulations adopted by the U.S. Securities and Exchange Commission, the insurance company that offers your contract may determine that it will no longer send you paper copies of the fund’s annual and semiannual shareholder reports unless you specifically request paper copies from the insurance company or from your financial intermediary. Instead, the shareholder reports will be made available on a Web site (insurancefunds.mfs.com or other Web site of which you will be notified), and the insurance company will notify you by mail each time a report is posted and provide you with a Web site link to access the report. Instructions for requesting paper copies will be provided by your insurance company or financial intermediary.
If you already elected to receive shareholder reports by email, you will not be affected by this change and you need not take any action. If your insurance company or financial intermediary offers electronic delivery, you may elect to receive shareholder reports and other communications from the insurance company or financial intermediary by email by following the instructions provided by the insurance company or financial intermediary.
Beginning on January 1, 2019, you may elect to receive all future reports in paper free of charge from the insurance company or financial intermediary. You can inform the insurance company or financial intermediary that you wish to continue receiving paper copies of your shareholder reports by contacting your insurance company or financial intermediary. Your election to receive reports in paper will apply to all funds held in your account with your insurance company or financial intermediary.
FCE-ANN
MFS® Emerging Markets Equity Portfolio
CONTENTS
The report is prepared for the general information of contract owners. It is authorized for distribution to prospective investors only when preceded or accompanied by a current prospectus.
NOT FDIC INSURED• MAY LOSE VALUE• NO BANK OR CREDIT UNION GUARANTEE• NOT A DEPOSIT• NOT INSURED BY ANY FEDERAL GOVERNMENT AGENCY OR NCUA/NCUSIF
MFS Emerging Markets Equity Portfolio
LETTER FROM THE EXECUTIVE CHAIR

Dear Contract Owners:
Slowing global growth, low inflation, and trade friction between the United States and China have been hallmarks of the past 12 months. After experiencing an uptick in market volatility in late 2018, markets steadied for most of 2019, thanks in large measure to the adoption of a dovish policy stance on the part of global central banks, focused on supporting economic growth. Negotiations aimed at a “phase one” trade deal between the U.S. and China bore fruit at the end of the period, boosting investor sentiment, while signs of stability emerging from the global manufacturing sector also lifted spirits. Uncertainty over Brexit, along with the ripple effects from the trade conflict, hampered business confidence and investment in the United Kingdom and Europe for much of the period, though investors expect greater clarity regarding Brexit as a result of December’s general election. The pro-Brexit Conservative Party won the election by a comfortable margin and set the stage for the U.K.’s departure from the EU at the end of January.
Markets expect the longest economic expansion in U.S. history will continue, albeit at a slower pace, as trade tensions recede. In an effort to prolong the expansion, the U.S. Federal Reserve lowered interest rates three times between July and October and the European Central Bank loosened policy in September. While the global monetary policy backdrop remains quite accommodative, signs of easing trade tensions and fading global recession fears led to improved market sentiment in late 2019 as investors grew less risk averse. In early 2020, an outbreak of coronavirus emanating from China reintroduced global growth fears, causing an uptick in volatility.
Here at MFS®, we aim to help our clients navigate the growing complexity of the markets and world economies. Our long-term investment philosophy and commitment to the responsible allocation of capital allow us to tune out the noise and uncover what we believe are the best, most durable investment opportunities in the market. Through our powerful global investment platform, we combine collective expertise, thoughtful risk management and long-term discipline to create sustainable value for investors.
Respectfully,

Robert J. Manning
Executive Chair
MFS Investment Management
February 14, 2020
The opinions expressed in this letter are subject to change and may not be relied upon for investment advice. No forecasts can be guaranteed.
1
MFS Emerging Markets Equity Portfolio
PORTFOLIO COMPOSITION
Portfolio structure
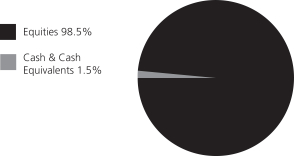
| | | | |
| Top ten holdings | | | | |
| Taiwan Semiconductor Manufacturing Co. Ltd. | | | 6.7% | |
| Samsung Electronics Co. Ltd. | | | 5.3% | |
| Tencent Holdings Ltd. | | | 5.3% | |
| Alibaba Group Holding Ltd., ADR | | | 3.7% | |
| Housing Development Finance Corp. Ltd. | | | 3.0% | |
| Yum China Holdings, Inc. | | | 2.8% | |
| LUKOIL PJSC, ADR | | | 2.5% | |
| AIA Group Ltd. | | | 2.4% | |
| Banco Bradesco S.A., ADR | | | 2.3% | |
| NAVER Corp. | | | 2.1% | |
| |
| GICS equity sectors (g) | | | | |
| Financials | | | 25.4% | |
| Information Technology | | | 16.7% | |
| Consumer Discretionary | | | 14.1% | |
| Communication Services | | | 12.0% | |
| Consumer Staples | | | 10.6% | |
| Industrials | | | 7.8% | |
| Energy | | | 4.6% | |
| Materials | | | 3.1% | |
| Real Estate | | | 1.9% | |
| Utilities | | | 1.4% | |
| Health Care | | | 0.9% | |
| | | | |
| Issuer country weightings (x) | | | | |
| China | | | 23.1% | |
| South Korea | | | 13.9% | |
| India | | | 9.5% | |
| Taiwan | | | 9.4% | |
| Brazil | | | 8.0% | |
| Hong Kong | | | 7.3% | |
| Russia | | | 5.5% | |
| South Africa | | | 3.8% | |
| Indonesia | | | 3.5% | |
| Other Countries | | | 16.0% | |
| |
| Currency exposure weightings (y) | | | | |
| Hong Kong Dollar | | | 19.0% | |
| South Korean Won | | | 13.9% | |
| Taiwan Dollar | | | 9.4% | |
| Indian Rupee | | | 8.6% | |
| Chinese Renminbi | | | 8.3% | |
| Brazilian Real | | | 8.0% | |
| United States Dollar | | | 6.3% | |
| Russian Ruble | | | 5.5% | |
| South African Rand | | | 3.8% | |
| Other Currencies | | | 17.2% | |
| (g) | The Global Industry Classification Standard (GICS®) was developed by and/or is the exclusive property of MSCI, Inc. and S&P Global Market Intelligence Inc. (“S&P Global Market Intelligence”). GICS is a service mark of MSCI and S&P Global Market Intelligence and has been licensed for use by MFS. |
| (x) | Represents the portfolio’s exposure to issuer countries as a percentage of the portfolio’s net assets. For purposes of this presentation, United States (included in Other Countries) includes Cash & Cash Equivalents. |
| (y) | Represents the portfolio’s exposure to a particular currency as a percentage of a portfolio’s net assets. For purposes of this presentation, United States Dollar includes Cash & Cash Equivalents. |
Cash & Cash Equivalents includes any cash, investments in money market funds, short-term securities, and other assets less liabilities. Please see the Statement of Assets and Liabilities for additional information related to the fund’s cash position and other assets and liabilities.
Percentages are based on net assets as of December 31, 2019.
The portfolio is actively managed and current holdings may be different.
2
MFS Emerging Markets Equity Portfolio
MANAGEMENT REVIEW
Summary of Results
For the twelve months ended December 31, 2019, Initial Class shares of the MFS Emerging Markets Equity Portfolio (fund) provided a total return of 20.52%, while Service Class shares of the fund provided a total return of 20.18%. These compare with a return of 18.42% over the same period for the fund’s benchmark, the MSCI Emerging Markets Index (net div).
Market Environment
Fading fears of a near-term global recession, the announcement of a partial trade deal between the United States and China and the decline in uncertainty over Brexit helped bolster market sentiment late in the period. Changes in market sentiment, largely driven by uncertainty over the outcome of trade negotiations between the US and China, had contributed to periodic bouts of volatility during the reporting period. The global economy decelerated, led by weakness in China and Europe, although the pace of the slowdown moderated late in the period amid nascent signs of stabilization in the manufacturing sector.
The deteriorating global growth backdrop, along with declining inflationary pressures, prompted the US Federal Reserve to adopt a more dovish posture beginning in early 2019, resulting in the first interest rate cut in over a decade at the end of July, followed by additional cuts in September and October. The Fed’s actions led to a sharp decline in long-term interest rates during the period’s second half, causing the inversion of portions of the US Treasury yield curve for a time. Amid an improvement in risk sentiment in Q4 2019 and indications of a bottoming in growth and a potential upturn in activity, the Fed indicated in October that further rate cuts were unlikely unless the outlook for the economy materially worsened.
Globally, central banks have tilted more dovish as well, with the European Central Bank unveiling a package of easing measures, which included putting overnight rates deeper into negative territory, restarting its bond-buying program and lengthening the term of cheap loans to banks to three years from two. The central banks of India and Australia are among those that have cut rates several times in recent months, although China has been more cautious in increasing liquidity as it keeps trying to deleverage its economy, cutting rates only marginally.
Emerging markets experienced considerable volatility through the end of 2018, as tighter global financial conditions exposed structural weakness in some countries. Those conditions improved in 2019 as the Fed became more dovish. Notwithstanding the periodic headwinds on market sentiment from significant trade friction between the US and China over much of the year, emerging market hard currency debt and local rates benefited from relatively cheap valuations at the beginning of the period and easier global monetary conditions. These factors, plus the fading of certain global risk factors mentioned above, hastened spread tightening in the latter part of the period. At the same time, idiosyncratic risks spiked in some countries (e.g., Argentina and Lebanon), contributing to increased dispersion in performance among sovereign assets.
Contributors to Performance
Security selection in thecommunication services,information technology andindustrialssectors was a primary factor that contributed to the fund’s performance relative to the MSCI Emerging Markets Index. Within thecommunication services sector, the fund’s overweight position in internet search engine and online computer games provider NAVER (South Korea) benefited relative returns. Shares of NAVER rose after the company reported operating profit results that were ahead of estimates, primarily due to solid revenue growth and the stabilization of key operating costs, including labor costs, as well as positively-received news of the spin-off of NAVER Pay. Finally, the announcement of the merger between NAVER-owned LINE and Softbank-owned Yahoo Japan further aided the stock price. Within theinformation technologysector, the fund’s holdings of software development services and information technology solutions provider Luxoft Holding (b)(h) (Switzerland), and its overweight position in semiconductor manufacturer Taiwan Semiconductor Manufacturing (Taiwan), aided relative results. Within theindustrialssector, the fund’s holdings of electronic power tools manufacturer Techtronic Industries (b) (Hong Kong) bolstered relative performance.
Stocks in other sectors that were among the fund’s top relative contributors included overweight positions in brewing company China Resources Beer Holdings (China), fast-food restaurant operator Yum China Holdings, integrated oil company LUKOIL PJSC (Russia), wine producer Kweichow Moutai (China), travel service provider Ctrip.Com (h) (China) and financial management firm E.Sun Financial Holding (Taiwan).
Detractors from Performance
Security selection in theconsumer discretionary sector detracted from relative performance during the reporting period. Here, an overweight position in motor vehicle company Mahindra & Mahindra (India) held back relative results.
Elsewhere, overweight positions in internet search provider Baidu (China), snack manufacturer Orion (South Korea), financial services provider Metropolitan Bank & Trust (Philippines), commercial vehicle finance services provider Shriram Transport Finance (India) and commercial banking services provider Public Bank Berhad (Malaysia) weighed on relative performance. The fund’s holdings of heavy machinery manufacturer Bharat Heavy Electricals (b) (India), supermarkets and convenient stores operator Dairy Farm International
3
MFS Emerging Markets Equity Portfolio
Management Review – continued
Holdings (b) (Hong Kong) and sealed container and kitchen utensils manufacturer Lock & Lock (b)(h) (South Korea) further held back relative returns. Not owning shares of strong-performing global energy company Gazprom (Russia) also weakened relative results.
Respectfully,
Portfolio Manager(s)
Jose Luis Garcia, Robert Lau, and Harry Purcell
| (b) | Security is not a benchmark constituent. |
| (h) | Security was not held in the portfolio at period end. |
The views expressed in this report are those of the portfolio manager(s) only through the end of the period of the report as stated on the cover and do not necessarily reflect the views of MFS or any other person in the MFS organization. These views are subject to change at any time based on market or other conditions, and MFS disclaims any responsibility to update such views. These views may not be relied upon as investment advice or an indication of trading intent on behalf of any MFS portfolio. References to specific securities are not recommendations of such securities, and may not be representative of any MFS portfolio’s current or future investments.
4
MFS Emerging Markets Equity Portfolio
PERFORMANCE SUMMARY THROUGH 12/31/19
The following chart illustrates the historical performance of the fund in comparison to its benchmark(s). Benchmarks are unmanaged and may not be invested in directly. Benchmark returns do not reflect any fees or expenses. The performance of other share classes will be greater than or less than that of the class depicted below. (See Notes to Performance Summary.)
Performance data shown represents past performance and is no guarantee of future results. Investment return and principal value fluctuate so your units, when sold, may be worth more or less than the original cost; current performance may be lower or higher than quoted. The performance shown does not reflect the deduction of taxes, if any, that a contract holder would pay on fund distributions or the redemption of contract units. The returns for the fund shown also do not reflect the deduction of expenses associated with variable products, such as mortality and expense risk charges, separate account charges, and sales charges imposed by the insurance company separate accounts. Such expenses would reduce the overall returns shown.
Growth of a Hypothetical $10,000 Investment
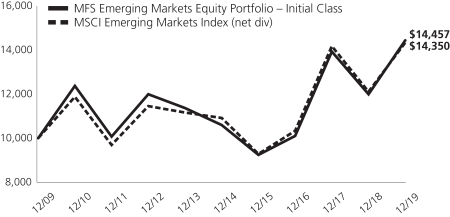
Total Returns through 12/31/19
Average annual total returns
| | | | | | | | | | | | |
| | | Share Class | | Class Inception Date | | 1-yr | | 5-yr | | 10-yr | | |
| | | Initial Class | | 6/05/96 | | 20.52% | | 6.39% | | 3.75% | | |
| | | Service Class | | 8/24/01 | | 20.18% | | 6.13% | | 3.50% | | |
| | | | |
| Comparative benchmark(s) | | | | | | | | |
| | | MSCI Emerging Markets Index (net div) (f) | | 18.42% | | 5.61% | | 3.68% | | |
| (f) | Source: FactSet Research Systems Inc. |
Benchmark Definition(s)
MSCI Emerging Markets Index (net div) – a market capitalization-weighted index that is designed to measure equity market performance in the global emerging markets. Morgan Stanley Capital International (“MSCI”) makes no express or implied warranties or representations and shall have no liability whatsoever with respect to any MSCI data contained herein. The MSCI data may not be further redistributed or used as a basis for other indices or any securities or financial products. This report is not approved, reviewed, or produced by MSCI.
It is not possible to invest directly in an index.
Notes to Performance Summary
Average annual total return represents the average annual change in value for each share class for the periods presented.
Performance results reflect any applicable expense subsidies and waivers in effect during the periods shown. Without such subsidies and waivers the fund’s performance results would be less favorable. Please see the prospectus and financial statements for complete details. All results are historical and assume the reinvestment of any dividends and capital gains distributions.
Performance results do not include adjustments made for financial reporting purposes in accordance with U.S. generally accepted accounting principles and may differ from amounts reported in the financial highlights.
From time to time the fund may receive proceeds from litigation settlements, without which performance would be lower.
5
MFS Emerging Markets Equity Portfolio
EXPENSE TABLE
Fund Expenses Borne by the Contract Holders during the Period,
July 1, 2019 through December 31, 2019
As a contract holder of the fund, you incur ongoing costs, including management fees; distribution and/or service(12b-1) fees; and other fund expenses. This example is intended to help you understand your ongoing costs (in dollars) of investing in the fund and to compare these costs with the ongoing costs of investing in other mutual funds.
The example is based on an investment of $1,000 invested at the beginning of the period and held for the entire period July 1, 2019 through December 31, 2019.
Actual Expenses
The first line for each share class in the following table provides information about actual account values and actual expenses. You may use the information in this line, together with the amount you invested, to estimate the expenses that you paid over the period. Simply divide your account value by $1,000 (for example, an $8,600 account value divided by $1,000 = 8.6), then multiply the result by the number in the first line under the heading entitled “Expenses Paid During Period” to estimate the expenses you paid on your account during this period.
Hypothetical Example for Comparison Purposes
The second line for each share class in the following table provides information about hypothetical account values and hypothetical expenses based on the fund’s actual expense ratio and an assumed rate of return of 5% per year before expenses, which is not the fund’s actual return. The hypothetical account values and expenses may not be used to estimate the actual ending account balance or expenses you paid for the period. You may use this information to compare the ongoing costs of investing in the fund and other funds. To do so, compare this 5% hypothetical example with the 5% hypothetical examples that appear in the shareholder reports of the other funds.
Please note that the expenses shown in the table are meant to highlight the fund’s ongoing costs only and do not take into account the fees and expenses imposed under the variable contracts through which your investment in the fund is made. Therefore, the second line for each share class in the table is useful in comparing ongoing costs associated with an investment in vehicles (such as the fund) which fund benefits under variable annuity and variable life insurance contracts and to qualified pension and retirement plans only, and will not help you determine the relative total costs of investing in the fund through variable annuity and variable life insurance contracts. If the fees and expenses imposed under the variable contracts were included, your costs would have been higher.
| | | | | | | | | | | | | | | | | | |
| Share Class | | | | Annualized
Expense Ratio | | | Beginning
Account Value
7/01/19 | | | Ending
Account Value
12/31/19 | | | Expenses Paid
During Period (p)
7/01/19-12/31/19 | |
| Initial Class | | Actual | | | 1.25% | | | | $1,000.00 | | | | $1,067.64 | | | | $6.51 | |
| | Hypothetical (h) | | | 1.25% | | | | $1,000.00 | | | | $1,018.90 | | | | $6.36 | |
| Service Class | | Actual | | | 1.50% | | | | $1,000.00 | | | | $1,066.72 | | | | $7.81 | |
| | Hypothetical (h) | | | 1.50% | | | | $1,000.00 | | | | $1,017.64 | | | | $7.63 | |
| (h) | 5% class return per year before expenses. |
| (p) | “Expenses Paid During Period” are equal to each class’s annualized expense ratio, as shown above, multiplied by the average account value over the period, multiplied by 184/365 (to reflect theone-half year period). |
Notes to Expense Table
Changes to the fund’s fee arrangements occurred during the six month period. Had these fee changes been in effect throughout the entire six month period, the annualized expense ratios, the actual expenses paid during the period, and the hypothetical expenses paid during the period would have been approximately 1.23%, $6.41, and $6.26 for Initial Class and 1.48%, $7.71, and $7.53 for Service Class, respectively. For further information about the fund’s fee arrangements and changes to those fee arrangements, please see Note 3 in the Notes to Financial Statements.
6
MFS Emerging Markets Equity Portfolio
PORTFOLIO OF INVESTMENTS – 12/31/19
The Portfolio of Investments is a complete list of all securities owned by your fund. It is categorized by broad-based asset classes.
| | | | | | | | |
| | |
| Issuer | | Shares/Par | | | Value ($) | |
| COMMON STOCKS – 98.5% | | | | | | | | |
| Alcoholic Beverages – 4.0% | | | | | |
| Ambev S.A., ADR | | | 156,740 | | | $ | 730,409 | |
| China Resources Beer Holdings Co. Ltd. | | | 132,000 | | | | 730,105 | |
| Kweichow Moutai Co. Ltd., “A” | | | 2,300 | | | | 390,614 | |
| | | | | | | | |
| | | | | | $ | 1,851,128 | |
| | | | | | | | |
| Automotive – 2.6% | | | | | |
| Hero MotoCorp Ltd. | | | 10,108 | | | $ | 345,965 | |
| Mahindra & Mahindra Ltd. | | | 48,366 | | | | 360,180 | |
| PT Astra International Tbk | | | 1,015,700 | | | | 504,453 | |
| | | | | | | | |
| | | | | | $ | 1,210,598 | |
| | | | | | | | |
| Brokerage & Asset Managers – 0.5% | | | | | |
| Moscow ExchangeMICEX-RTS | | | 128,167 | | | $ | 222,504 | |
| | | | | | | | |
| Business Services – 0.3% | | | | | |
| Tata Consultancy Services Ltd. | | | 5,428 | | | $ | 164,388 | |
| | | | | | | | |
| Computer Software – 0.5% | | | | | |
| Prosus N.V. (a) | | | 3,359 | | | $ | 250,671 | |
| | | | | | | | |
| Computer Software – Systems – 0.9% | | | | | |
| Linx S.A. | | | 47,300 | | | $ | 416,478 | |
| | | | | | | | |
| Construction – 2.2% | | | | | |
| PT Indocement Tunggal Prakarsa Tbk | | | 221,700 | | | $ | 303,825 | |
| Techtronic Industries Co. Ltd. | | | 91,000 | | | | 742,149 | |
| | | | | | | | |
| | | | | | $ | 1,045,974 | |
| | | | | | | | |
| Consumer Products – 0.5% | | | | | |
| Dabur India Ltd. | | | 37,635 | | | $ | 241,697 | |
| | | | | | | | |
| Consumer Services – 2.4% | | | | | |
| 51job, Inc., ADR (a) | | | 7,625 | | | $ | 647,363 | |
| MakeMyTrip Ltd. (a) | | | 19,736 | | | | 451,954 | |
| | | | | | | | |
| | | | | | $ | 1,099,317 | |
| | | | | | | | |
| Electrical Equipment – 2.0% | | | | | |
| Bharat Heavy Electricals Ltd. | | | 320,458 | | | $ | 195,072 | |
| LS Industrial Systems Co. Ltd. (a) | | | 15,871 | | | | 745,480 | |
| | | | | | | | |
| | | | | | $ | 940,552 | |
| | | | | | | | |
| Electronics – 14.0% | | | | | |
| ASM Pacific Technology Ltd. | | | 19,700 | | | $ | 273,292 | |
| Samsung Electronics Co. Ltd. | | | 51,841 | | | | 2,497,924 | |
| Silicon Motion Technology Corp., ADR | | | 11,732 | | | | 594,930 | |
| Taiwan Semiconductor Manufacturing Co. Ltd. | | | 285,258 | | | | 3,149,761 | |
| | | | | | | | |
| | | | | | $ | 6,515,907 | |
| | | | | | | | |
| Energy – Integrated – 3.4% | | | | | |
| LUKOIL PJSC, ADR | | | 11,636 | | | $ | 1,154,059 | |
| Petroleo Brasileiro S.A., ADR | | | 28,013 | | | | 446,527 | |
| | | | | | | | |
| | | | | | $ | 1,600,586 | |
| | | | | | | | |
| Food & Beverages – 5.1% | | | | | |
| AVI Ltd. | | | 73,250 | | | $ | 465,304 | |
| Fomento Economico Mexicano S.A.B. de C.V., ADR | | | 1,926 | | | | 182,026 | |
| | | | | | | | |
| | |
Issuer | | Shares/Par | | | Value ($) | |
| COMMON STOCKS – continued | | | | | | | | |
| Food & Beverages – continued | | | | | |
| Inner Mongolia Yili Industrial Group Co. Ltd., “A” | | | 42,800 | | | $ | 190,108 | |
| Orion Corp. (a) | | | 9,190 | | | | 838,381 | |
| Tingyi (Cayman Islands) Holding Corp. | | | 422,000 | | | | 720,275 | |
| | | | | | | | |
| | | | | | $ | 2,396,094 | |
| | | | | | | | |
| Food & Drug Stores – 0.3% | | | | | |
| Dairy Farm International Holdings Ltd. | | | 23,500 | | | $ | 134,185 | |
| | | | | | | | |
| Forest & Paper Products – 0.9% | | | | | |
| Suzano S.A. | | | 42,200 | | | $ | 416,262 | |
| | | | | | | | |
| Gaming & Lodging – 1.3% | | | | | |
| Genting Berhad | | | 422,600 | | | $ | 625,041 | |
| | | | | | | | |
| General Merchandise – 0.8% | | | | | |
| S.A.C.I. Falabella | | | 42,000 | | | $ | 181,025 | |
| Walmart de Mexico S.A.B. de C.V. | | | 65,240 | | | | 186,844 | |
| | | | | | | | |
| | | | | | $ | 367,869 | |
| | | | | | | | |
| Insurance – 3.9% | | | | | |
| AIA Group Ltd. | | | 104,600 | | | $ | 1,098,043 | |
| Samsung Fire & Marine Insurance Co. Ltd. (a) | | | 3,377 | | | | 711,055 | |
| | | | | | | | |
| | | | | | $ | 1,809,098 | |
| | | | | | | | |
| Internet – 13.0% | | | | | |
| Alibaba Group Holding Ltd., ADR (a) | | | 8,053 | | | $ | 1,708,041 | |
| Baidu, Inc., ADR (a) | | | 7,457 | | | | 942,565 | |
| NAVER Corp. (a) | | | 6,006 | | | | 968,584 | |
| Tencent Holdings Ltd. | | | 51,300 | | | | 2,472,733 | |
| | | | | | | | |
| | | | | | $ | 6,091,923 | |
| | | | | | | | |
| Machinery & Tools – 3.7% | | | | | |
| Doosan Bobcat, Inc. | | | 23,974 | | | $ | 709,869 | |
| Haitian International Holdings Ltd. | | | 242,000 | | | | 586,343 | |
| PT United Tractors Tbk | | | 292,600 | | | | 451,765 | |
| | | | | | | | |
| | | | | | $ | 1,747,977 | |
| | | | | | | | |
| Major Banks – 6.3% | | | | | |
| ABSA Group Ltd. | | | 72,654 | | | $ | 774,471 | |
| Banco Bradesco S.A., ADR | | | 119,158 | | | | 1,066,464 | |
| China Construction Bank | | | 1,016,670 | | | | 878,071 | |
| Industrial & Commercial Bank of China, “H” | | | 298,000 | | | | 229,457 | |
| | | | | | | | |
| | | | | | $ | 2,948,463 | |
| | | | | | | | |
| Metals & Mining – 0.9% | | | | | |
| Vale S.A., ADR | | | 33,555 | | | $ | 442,926 | |
| | | | | | | | |
| Network & Telecom – 1.5% | | | | | |
| VTech Holdings Ltd. | | | 69,000 | | | $ | 681,827 | |
| | | | | | | | |
| Oil Services – 0.2% | | | | | |
| Lamprell PLC (a) | | | 199,973 | | | $ | 103,040 | |
| | | | | | | | |
| Other Banks & Diversified Financials – 14.8% | | | | | |
| Abu Dhabi Commercial Bank | | | 99,849 | | | $ | 215,293 | |
| Bancolombia S.A., ADR | | | 4,721 | | | | 258,663 | |
| Credicorp Ltd. | | | 1,682 | | | | 358,485 | |
7
MFS Emerging Markets Equity Portfolio
Portfolio of Investments – continued
| | | | | | | | |
| | |
| Issuer | | Shares/Par | | | Value ($) | |
| COMMON STOCKS – continued | | | | | |
| Other Banks & Diversified Financials – continued | |
| E.Sun Financial Holding Co. Ltd. | | | 712,038 | | | $ | 662,703 | |
| Grupo Financiero Inbursa S.A. de C.V. | | | 287,681 | | | | 352,840 | |
| Housing Development Finance Corp. Ltd. | | | 41,570 | | | | 1,405,048 | |
| Kasikornbank Co. Ltd. | | | 95,200 | | | | 476,391 | |
| Komercni Banka A.S. | | | 10,248 | | | | 374,976 | |
| Metropolitan Bank & Trust Co. | | | 566,900 | | | | 742,136 | |
| Public Bank Berhad | | | 112,400 | | | | 534,178 | |
| Sberbank of Russia | | | 212,920 | | | | 873,927 | |
| Shriram Transport Finance Co. Ltd. | | | 39,084 | | | | 641,250 | |
| | | | | | | | |
| | | | | | $ | 6,895,890 | |
| | | | | | | | |
| Pharmaceuticals – 0.9% | | | | | |
| Genomma Lab Internacional S.A., “B” (a) | | | 436,492 | | | $ | 431,932 | |
| | | | | | | | |
| Real Estate – 2.0% | | | | | |
| Aldar Properties PJSC | | | 324,412 | | | $ | 190,771 | |
| Hang Lung Properties Ltd. | | | 221,000 | | | | 484,979 | |
| Multiplan Empreendimentos Imobiliarios S.A. | | | 28,638 | | | | 235,642 | |
| | | | | | | | |
| | | | | | $ | 911,392 | |
| | | | | | | | |
| Restaurants – 2.8% | | | | | |
| Yum China Holdings, Inc. | | | 26,897 | | | $ | 1,291,325 | |
| | | | | | | | |
| Specialty Chemicals – 0.6% | | | | | |
| PTT Global Chemical PLC | | | 150,700 | | | $ | 286,772 | |
| | | | | | | | |
| Specialty Stores – 0.6% | | | | | |
| Dufry AG | | | 3,020 | | | $ | 299,628 | |
| | | | | | | | |
| Telecommunications – Wireless – 0.7% | | | | | |
| Mobile TeleSystems PJSC, ADR | | | 29,994 | | | $ | 304,439 | |
| | | | | | | | |
| Telephone Services – 3.2% | | | | | |
| Helios Tower PLC (a) | | | 126,157 | | | $ | 264,030 | |
| Hellenic Telecommunications Organization S.A. | | | 27,479 | | | | 439,539 | |
| Naspers Ltd. | | | 3,359 | | | | 549,390 | |
| PT XL Axiata Tbk (a) | | | 993,700 | | | | 225,475 | |
| | | | | | | | |
| | | | | | $ | 1,478,434 | |
| | | | | | | | |
| | | | | | | | |
| | |
| Issuer | | Shares/Par | | | Value ($) | |
| COMMON STOCKS – continued | | | | | |
| Tobacco – 0.3% | | | | | |
| PT Hanjaya Mandala Sampoerna Tbk | | | 950,450 | | | $ | 143,774 | |
| | | | | | | | |
| Utilities – Electric Power – 1.4% | | | | | |
| CESC Ltd. | | | 49,754 | | | $ | 513,585 | |
| NTPC Ltd. | | | 77,908 | | | | 129,941 | |
| | | | | | | | |
| | | | | | $ | 643,526 | |
| | | | | | | | |
Total Common Stocks
(Identified Cost, $31,659,718) | | | | | | $ | 46,011,617 | |
| | | | | | | | |
| |
| INVESTMENT COMPANIES (h) – 1.0% | | | | | |
| Money Market Funds – 1.0% | | | | | |
| MFS Institutional Money Market Portfolio, 1.7% (v) (Identified Cost, $451,912) | | | 451,912 | | | $ | 451,912 | |
| | | | | | | | |
OTHER ASSETS, LESS
LIABILITIES – 0.5% | | | | | | | 217,839 | |
| | | | | | | | |
| NET ASSETS – 100.0% | | | | | | $ | 46,681,368 | |
| | | | | | | | |
| (a) | | Non-income producing security. |
| (h) | | An affiliated issuer, which may be considered one in which the fund owns 5% or more of the outstanding voting securities, or a company which is under common control. At period end, the aggregate values of the fund’s investments in affiliated issuers and in unaffiliated issuers were $451,912 and $46,011,617, respectively. |
| (v) | | Affiliated issuer that is available only to investment companies managed by MFS. The rate quoted for the MFS Institutional Money Market Portfolio is the annualizedseven-day yield of the fund at period end. |
The following abbreviations are used in this report and are defined:
| ADR | | American Depositary Receipt |
See Notes to Financial Statements
8
MFS Emerging Markets Equity Portfolio
FINANCIAL STATEMENTS | STATEMENT OF ASSETS AND LIABILITIES
This statement represents your fund’s balance sheet, which details the assets and liabilities comprising the total value of the fund.
| | | | |
At 12/31/19 | | | | |
| |
Assets | | | | |
Investments in unaffiliated issuers, at value (identified cost, $31,659,718) | | | $46,011,617 | |
Investments in affiliated issuers, at value (identified cost, $451,912) | | | 451,912 | |
Foreign currency, at value (identified cost, $11,262) | | | 11,207 | |
Receivables for | | | | |
Investments sold | | | 292,461 | |
Fund shares sold | | | 20,314 | |
Dividends | | | 101,999 | |
Receivable from investment adviser | | | 8,743 | |
Other assets | | | 533 | |
Total assets | | | $46,898,786 | |
| |
Liabilities | | | | |
Payable to custodian | | | $3,539 | |
Payables for | | | | |
Investments purchased | | | 36,125 | |
Fund shares reacquired | | | 46,050 | |
Payable to affiliates | | | | |
Administrative services fee | | | 96 | |
Shareholder servicing costs | | | 13 | |
Distribution and/or service fees | | | 352 | |
Payable for independent Trustees’ compensation | | | 4 | |
Deferred country tax expense payable | | | 21,752 | |
Accrued expenses and other liabilities | | | 109,487 | |
Total liabilities | | | $217,418 | |
Net assets | | | $46,681,368 | |
| |
Net assets consist of | | | | |
Paid-in capital | | | $30,132,207 | |
Total distributable earnings (loss) | | | 16,549,161 | |
Net assets | | | $46,681,368 | |
Shares of beneficial interest outstanding | | | 2,762,707 | |
| | | | | | | | | | | | |
| | | |
| | | Net assets | | | Shares
outstanding | | | Net asset value
per share | |
Initial Class | | | $21,065,382 | | | | 1,236,333 | | | | $17.04 | |
Service Class | | | 25,615,986 | | | | 1,526,374 | | | | 16.78 | |
See Notes to Financial Statements
9
MFS Emerging Markets Equity Portfolio
FINANCIAL STATEMENTS | STATEMENT OF OPERATIONS
This statement describes how much your fund earned in investment income and accrued in expenses. It also describes any gains and/or losses generated by fund operations.
| | | | |
Year ended 12/31/19 | | | | |
| |
Net investment income (loss) | | | | |
Income | | | | |
Dividends | | | $1,214,324 | |
Non-cash dividends | | | 291,946 | |
Dividends from affiliated issuers | | | 12,384 | |
Other | | | 5,264 | |
Income on securities loaned | | | 17 | |
Foreign taxes withheld | | | (123,226 | ) |
Total investment income | | | $1,400,709 | |
Expenses | | | | |
Management fee | | | $481,193 | |
Distribution and/or service fees | | | 61,948 | |
Shareholder servicing costs | | | 3,401 | |
Administrative services fee | | | 17,500 | |
Independent Trustees’ compensation | | | 1,377 | |
Custodian fee | | | 95,876 | |
Shareholder communications | | | 7,694 | |
Audit and tax fees | | | 75,152 | |
Legal fees | | | 390 | |
Miscellaneous | | | 28,312 | |
Total expenses | | | $772,843 | |
Reduction of expenses by investment adviser | | | (119,305 | ) |
Net expenses | | | $653,538 | |
Net investment income (loss) | | | $747,171 | |
| |
Realized and unrealized gain (loss) | | | | |
Realized gain (loss) (identified cost basis) | | | | |
Unaffiliated issuers | | | $2,331,594 | |
Affiliated issuers | | | (63 | ) |
Foreign currency | | | (12,611 | ) |
Net realized gain (loss) | | | $2,318,920 | |
Change in unrealized appreciation or depreciation | | | | |
Unaffiliated issuers (net of $3,688 decrease in deferred country tax) | | | $5,464,751 | |
Affiliated issuers | | | 1 | |
Translation of assets and liabilities in foreign currencies | | | (465 | ) |
Net unrealized gain (loss) | | | $5,464,287 | |
Net realized and unrealized gain (loss) | | | $7,783,207 | |
Change in net assets from operations | | | $8,530,378 | |
See Notes to Financial Statements
10
MFS Emerging Markets Equity Portfolio
FINANCIAL STATEMENTS | STATEMENTS OF CHANGES IN NET ASSETS
These statements describe the increases and/or decreases in net assets resulting from operations, any distributions, and any shareholder transactions.
| | | | | | | | |
| | | Year ended | |
| | | 12/31/19 | | | 12/31/18 | |
Change in net assets | | | | | | | | |
| | |
From operations | | | | | | | | |
Net investment income (loss) | | | $747,171 | | | | $276,402 | |
Net realized gain (loss) | | | 2,318,920 | | | | 2,579,877 | |
Net unrealized gain (loss) | | | 5,464,287 | | | | (10,326,119 | ) |
Change in net assets from operations | | | $8,530,378 | | | | $(7,469,840 | ) |
Total distributions to shareholders | | | $(1,657,028 | ) | | | $(118,016 | ) |
Change in net assets from fund share transactions | | | $(5,052,431 | ) | | | $(5,242,859 | ) |
Total change in net assets | | | $1,820,919 | | | | $(12,830,715 | ) |
| | |
Net assets | | | | | | | | |
At beginning of period | | | 44,860,449 | | | | 57,691,164 | |
At end of period | | | $46,681,368 | | | | $44,860,449 | |
See Notes to Financial Statements
11
MFS Emerging Markets Equity Portfolio
FINANCIAL STATEMENTS | FINANCIAL HIGHLIGHTS
The financial highlights table is intended to help you understand the fund’s financial performance for the past 5 years. Certain information reflects financial results for a single fund share. The total returns in the table represent the rate that an investor would have earned (or lost) on an investment in the fund share class (assuming reinvestment of all distributions) held for the entire period.
| | | | | | | | | | | | | | | | | | | | |
| Initial Class | | Year ended | |
| | | | | |
| | | 12/31/19 | | | 12/31/18 | | | 12/31/17 | | | 12/31/16 | | | 12/31/15 | |
| | | | | |
Net asset value, beginning of period | | | $14.75 | | | | $17.19 | | | | $12.59 | | | | $11.59 | | | | $13.46 | |
| | | | | |
| Income (loss) from investment operations | | | | | | | | | | | | | | | | | | | | |
Net investment income (loss) (d) | | | $0.28 | | | | $0.11 | | | | $0.06 | | | | $0.15 | (c) | | | $0.10 | |
Net realized and unrealized gain (loss) | | | 2.63 | | | | (2.49 | ) | | | 4.71 | | | | 0.93 | | | | (1.84 | ) |
Total from investment operations | | | $2.91 | | | | $(2.38 | ) | | | $4.77 | | | | $1.08 | | | | $(1.74 | ) |
| | | | | |
| Less distributions declared to shareholders | | | | | | | | | | | | | | | | | | | | |
From net investment income | | | $(0.11 | ) | | | $(0.06 | ) | | | $(0.17 | ) | | | $(0.08 | ) | | | $(0.13 | ) |
From net realized gain | | | (0.51 | ) | | | — | | | | — | | | | — | | | | — | |
Total distributions declared to shareholders | | | $(0.62 | ) | | | $(0.06 | ) | | | $(0.17 | ) | | | $(0.08 | ) | | | $(0.13 | ) |
Net asset value, end of period (x) | | | $17.04 | | | | $14.75 | | | | $17.19 | | | | $12.59 | | | | $11.59 | |
Total return (%) (k)(r)(s)(x) | | | 20.45 | | | | (13.89 | ) | | | 37.98 | | | | 9.28 | (c) | | | (12.89 | ) |
| | | | | |
Ratios (%) (to average net assets)
and Supplemental data: | | | | | | | | | | | | | | | | | | | | |
Expenses before expense reductions (f) | | | 1.55 | | | | 1.50 | | | | 1.53 | | | | 1.34 | (c) | | | 1.65 | |
Expenses after expense reductions (f) | | | 1.29 | | | | 1.37 | | | | 1.40 | | | | 1.13 | (c) | | | 1.40 | |
Net investment income (loss) | | | 1.76 | | | | 0.65 | | | | 0.41 | | | | 1.29 | (c) | | | 0.74 | |
Portfolio turnover | | | 21 | | | | 31 | | | | 27 | | | | 47 | | | | 51 | |
Net assets at end of period (000 omitted) | | | $21,065 | | | | $20,887 | | | | $28,026 | | | | $22,605 | | | | $25,665 | |
| |
| Service Class | | Year ended | |
| | | | | |
| | | 12/31/19 | | | 12/31/18 | | | 12/31/17 | | | 12/31/16 | | | 12/31/15 | |
| | | | | |
Net asset value, beginning of period | | | $14.53 | | | | $16.94 | | | | $12.41 | | | | $11.42 | | | | $13.24 | |
| | | | | |
| Income (loss) from investment operations | | | | | | | | | | | | | | | | | | | | |
Net investment income (loss) (d) | | | $0.24 | | | | $0.07 | | | | $0.02 | | | | $0.12 | (c) | | | $0.06 | |
Net realized and unrealized gain (loss) | | | 2.58 | | | | (2.46 | ) | | | 4.64 | | | | 0.91 | | | | (1.80 | ) |
Total from investment operations | | | $2.82 | | | | $(2.39 | ) | | | $4.66 | | | | $1.03 | | | | $(1.74 | ) |
| | | | | |
| Less distributions declared to shareholders | | | | | | | | | | | | | | | | | | | | |
From net investment income | | | $(0.06 | ) | | | $(0.02 | ) | | | $(0.13 | ) | | | $(0.04 | ) | | | $(0.08 | ) |
From net realized gain | | | (0.51 | ) | | | — | | | | — | | | | — | | | | — | |
Total distributions declared to shareholders | | | $(0.57 | ) | | | $(0.02 | ) | | | $(0.13 | ) | | | $(0.04 | ) | | | $(0.08 | ) |
Net asset value, end of period (x) | | | $16.78 | | | | $14.53 | | | | $16.94 | | | | $12.41 | | | | $11.42 | |
Total return (%) (k)(r)(s)(x) | | | 20.11 | | | | (14.13 | ) | | | 37.66 | | | | 9.04 | (c) | | | (13.08 | ) |
| | | | | |
Ratios (%) (to average net assets)
and Supplemental data: | | | | | | | | | | | | | | | | | | | | |
Expenses before expense reductions (f) | | | 1.80 | | | | 1.75 | | | | 1.78 | | | | 1.58 | (c) | | | 1.90 | |
Expenses after expense reductions (f) | | | 1.54 | | | | 1.62 | | | | 1.65 | | | | 1.37 | (c) | | | 1.65 | |
Net investment income (loss) | | | 1.52 | | | | 0.40 | | | | 0.16 | | | | 1.02 | (c) | | | 0.46 | |
Portfolio turnover | | | 21 | | | | 31 | | | | 27 | | | | 47 | | | | 51 | |
Net assets at end of period (000 omitted) | | | $25,616 | | | | $23,973 | | | | $29,665 | | | | $24,307 | | | | $25,678 | |
See Notes to Financial Statements
12
MFS Emerging Markets Equity Portfolio
Financial Highlights – continued
| (c) | Amount reflects aone-time reimbursement of expenses by the custodian (or former custodian) without which net investment income and performance would be lower and expenses would be higher. |
| (d) | Per share data is based on average shares outstanding. |
| (f) | Ratios do not reflect reductions from fees paid indirectly, if applicable. |
| (k) | The total return does not reflect expenses that apply to separate accounts. Inclusion of these charges would reduce the total return figures for all periods shown. |
| (r) | Certain expenses have been reduced without which performance would have been lower. |
| (s) | From time to time the fund may receive proceeds from litigation settlements, without which performance would be lower. |
| (x) | The net asset values and total returns have been calculated on net assets which include adjustments made in accordance with U.S. generally accepted accounting principles required at period end for financial reporting purposes. |
See Notes to Financial Statements
13
MFS Emerging Markets Equity Portfolio
NOTES TO FINANCIAL STATEMENTS
| (1) | | Business and Organization |
MFS Emerging Markets Equity Portfolio (the fund) is a diversified series of MFS Variable Insurance Trust II (the trust). The trust is organized as a Massachusetts business trust and is registered under the Investment Company Act of 1940, as amended, as anopen-end management investment company. The shareholders of each series of the trust are separate accounts of insurance companies, which offer variable annuity and/or life insurance products, and qualified retirement and pension plans.
The fund is an investment company and accordingly follows the investment company accounting and reporting guidance of the Financial Accounting Standards Board (FASB) Accounting Standards Codification Topic 946 Financial Services – Investment Companies.
| (2) | | Significant Accounting Policies |
General– The preparation of financial statements in conformity with U.S. generally accepted accounting principles requires management to make estimates and assumptions that affect the reported amounts of assets and liabilities, and disclosure of contingent assets and liabilities at the date of the financial statements and the reported amounts of increases and decreases in net assets from operations during the reporting period. Actual results could differ from those estimates. In the preparation of these financial statements, management has evaluated subsequent events occurring after the date of the fund’s Statement of Assets and Liabilities through the date that the financial statements were issued. The fund invests in foreign securities, including securities of emerging market issuers. Investments in foreign securities are vulnerable to the effects of changes in the relative values of the local currency and the U.S. dollar and to the effects of changes in each country’s market, economic, industrial, political, regulatory, geopolitical, and other conditions. Investments in emerging markets can involve additional and greater risks than the risks associated with investments in developed foreign markets. Emerging markets can have less developed markets, greater custody and operational risk, less developed legal, regulatory, and accounting systems, and greater political, social, and economic instability than developed markets.
Balance Sheet Offsetting – The fund’s accounting policy with respect to balance sheet offsetting is that, absent an event of default by the counterparty or a termination of the agreement, the International Swaps and Derivatives Association (ISDA) Master Agreement, or similar agreement, does not result in an offset of reported amounts of financial assets and financial liabilities in the Statement of Assets and Liabilities across transactions between the fund and the applicable counterparty. The fund’s right to setoff may be restricted or prohibited by the bankruptcy or insolvency laws of the particular jurisdiction to which a specific master netting agreement counterparty is subject. Balance sheet offsetting disclosures, to the extent applicable to the fund, have been included in the fund’s Significant Accounting Policies note under the captions for each of the fund’sin-scope financial instruments and transactions.
Investment Valuations – Equity securities, including restricted equity securities, are generally valued at the last sale or official closing price on their primary market or exchange as provided by a third-party pricing service. Equity securities, for which there were no sales reported that day, are generally valued at the last quoted daily bid quotation on their primary market or exchange as provided by a third-party pricing service. Short-term instruments with a maturity at issuance of 60 days or less may be valued at amortized cost, which approximates market value.Open-end investment companies are generally valued at net asset value per share. Securities and other assets generally valued on the basis of information from a third-party pricing service may also be valued at a broker/dealer bid quotation. In determining values, third-party pricing services can utilize both transaction data and market information such as yield, quality, coupon rate, maturity, type of issue, trading characteristics, and other market data. The values of foreign securities and other assets and liabilities expressed in foreign currencies are converted to U.S. dollars using the mean of bid and asked prices for rates provided by a third-party pricing service.
The Board of Trustees has delegated primary responsibility for determining or causing to be determined the value of the fund’s investments (including any fair valuation) to the adviser pursuant to valuation policies and procedures approved by the Board. If the adviser determines that reliable market quotations are not readily available, investments are valued at fair value as determined in good faith by the adviser in accordance with such procedures under the oversight of the Board of Trustees. Under the fund’s valuation policies and procedures, market quotations are not considered to be readily available for most types of debt instruments and floating rate loans and many types of derivatives. These investments are generally valued at fair value based on information from third-party pricing services. In addition, investments may be valued at fair value if the adviser determines that an investment’s value has been materially affected by events occurring after the close of the exchange or market on which the investment is principally traded (such as foreign exchange or market) and prior to the determination of the fund’s net asset value, or after the halt of trading of a specific security where trading does not resume prior to the close of the exchange or market on which the security is principally traded. Events that occur after foreign markets close (such as developments in foreign markets and significant movements in the U.S. markets) and prior to the determination of the fund’s net asset value may be deemed to have a material effect on the value of securities traded in foreign markets. Accordingly, the fund’s foreign equity securities may often be valued at fair value. The adviser
generally relies on third-party pricing services or other information (such as the correlation with price movements of similar securities in the same or other markets; the type, cost and investment characteristics of the security; the business and financial condition of the
14
MFS Emerging Markets Equity Portfolio
Notes to Financial Statements – continued
issuer; and trading and other market data) to assist in determining whether to fair value and at what value to fair value an investment. The value of an investment for purposes of calculating the fund’s net asset value can differ depending on the source and method used to determine value. When fair valuation is used, the value of an investment used to determine the fund’s net asset value may differ from quoted or published prices for the same investment. There can be no assurance that the fund could obtain the fair value assigned to an investment if it were to sell the investment at the same time at which the fund determines its net asset value per share.
Various inputs are used in determining the value of the fund’s assets or liabilities. These inputs are categorized into three broad levels. In certain cases, the inputs used to measure fair value may fall into different levels of the fair value hierarchy. In such cases, an investment’s level within the fair value hierarchy is based on the lowest level of input that is significant to the fair value measurement. The fund’s assessment of the significance of a particular input to the fair value measurement in its entirety requires judgment, and considers factors specific to the investment. Level 1 includes unadjusted quoted prices in active markets for identical assets or liabilities. Level 2 includes other significant observable market-based inputs (including quoted prices for similar securities, interest rates, prepayment speed, and credit risk). Level 3 includes unobservable inputs, which may include the adviser’s own assumptions in determining the fair value of investments. The following is a summary of the levels used as of December 31, 2019 in valuing the fund’s assets or liabilities:
| | | | | | | | | | | | | | | | |
| Financial Instruments | | Level 1 | | | Level 2 | | | Level 3 | | | Total | |
| Equity Securities: | | | | | | | | | | | | | | | | |
China | | | $10,787,000 | | | | $— | | | | $— | | | | $10,787,000 | |
South Korea | | | 2,518,020 | | | | 3,953,273 | | | | — | | | | 6,471,293 | |
India | | | 4,449,080 | | | | — | | | | — | | | | 4,449,080 | |
Taiwan | | | 4,407,394 | | | | — | | | | — | | | | 4,407,394 | |
Brazil | | | 3,754,708 | | | | — | | | | — | | | | 3,754,708 | |
Hong Kong | | | 3,414,475 | | | | — | | | | — | | | | 3,414,475 | |
Russia | | | 1,458,498 | | | | 1,096,431 | | | | — | | | | 2,554,929 | |
South Africa | | | 1,789,165 | | | | — | | | | — | | | | 1,789,165 | |
Indonesia | | | 673,074 | | | | 956,218 | | | | — | | | | 1,629,292 | |
Other Countries | | | 5,991,118 | | | | 763,163 | | | | — | | | | 6,754,281 | |
| Mutual Funds | | | 451,912 | | | | — | | | | — | | | | 451,912 | |
| Total | | | $39,694,444 | | | | $6,769,085 | | | | $— | | | | $46,463,529 | |
For further information regarding security characteristics, see the Portfolio of Investments.
Foreign Currency Translation– Purchases and sales of foreign investments, income, and expenses are converted into U.S. dollars based upon currency exchange rates prevailing on the respective dates of such transactions or on the reporting date for foreign denominated receivables and payables. Gains and losses attributable to foreign currency exchange rates on sales of securities are recorded for financial statement purposes as net realized gains and losses on investments. Gains and losses attributable to foreign exchange rate movements on receivables, payables, income and expenses are recorded for financial statement purposes as foreign currency transaction gains and losses. That portion of both realized and unrealized gains and losses on investments that results from fluctuations in foreign currency exchange rates is not separately disclosed.
Security Loans– Under its Securities Lending Agency Agreement with the fund, State Street Bank and Trust Company, as lending agent, loans the securities of the fund to certain qualified institutions (the “Borrowers”) approved by the fund. Security loans can be terminated at the discretion of either the lending agent or the fund and the related securities must be returned within the earlier of the standard trade settlement period for such securities or within three business days. The loans are collateralized by cash and/or U.S. Treasury and federal agency obligations in an amount typically at least equal to the market value of the securities loaned. On loans collateralized by cash, the cash collateral is invested in a money market fund. The market value of the loaned securities is determined at the close of business of the fund and any additional required collateral is delivered to the fund on the next business day. The lending agent provides the fund with indemnification against Borrower default. In the event of Borrower default, the lending agent will, for the benefit of the fund, either purchase securities identical to those loaned or, when such purchase is commercially impracticable, pay the fund the market value of the loaned securities. In return, the lending agent assumes the fund’s rights to the related collateral. If the collateral value is less than the cost to purchase identical securities, the lending agent is responsible for the shortfall, but only to the extent that such shortfall is not due to a decline in collateral value resulting from collateral reinvestment for which the fund bears the risk of loss. A portion of the income generated upon investment of the collateral is remitted to the Borrowers, and the remainder is allocated between the fund and the lending agent. On loans collateralized by U.S. Treasury and/or federal agency obligations, a fee is received from the Borrower, and is allocated between the fund and the lending agent. Income from securities lending is separately reported in the Statement of Operations. The dividend and interest income earned on the securities loaned is accounted for in the same manner as other dividend and interest income. At December 31, 2019, there were no securities on loan or collateral outstanding.
15
MFS Emerging Markets Equity Portfolio
Notes to Financial Statements – continued
Indemnifications – Under the fund’s organizational documents, its officers and Trustees may be indemnified against certain liabilities and expenses arising out of the performance of their duties to the fund. Additionally, in the normal course of business, the fund enters into agreements with service providers that may contain indemnification clauses. The fund’s maximum exposure under these agreements is unknown as this would involve future claims that may be made against the fund that have not yet occurred.
Investment Transactions and Income – Investment transactions are recorded on the trade date. Dividends received in cash are recorded on theex-dividend date. Certain dividends from foreign securities will be recorded when the fund is informed of the dividend if such information is obtained subsequent to theex-dividend date. Dividend payments received in additional securities are recorded on theex-dividend date in an amount equal to the value of the security on such date.
The fund may receive proceeds from litigation settlements. Any proceeds received from litigation involving portfolio holdings are reflected in the Statement of Operations in realized gain/loss if the security has been disposed of by the fund or in unrealized gain/loss if the security is still held by the fund. Any other proceeds from litigation not related to portfolio holdings are reflected as other income in the Statement of Operations.
Tax Matters and Distributions – The fund intends to qualify as a regulated investment company, as defined under Subchapter M of the Internal Revenue Code, and to distribute all of its taxable income, including realized capital gains. As a result, no provision for federal income tax is required. The fund’s federal tax returns, when filed, will remain subject to examination by the Internal Revenue Service for a three year period. Management has analyzed the fund’s tax positions taken on federal and state tax returns for all open tax years and does not believe that there are any uncertain tax positions that require recognition of a tax liability. Foreign taxes, if any, have been accrued by the fund in the accompanying financial statements in accordance with the applicable foreign tax law. Foreign income taxes may be withheld by certain countries in which the fund invests. Additionally, capital gains realized by the fund on securities issued in or by certain foreign countries may be subject to capital gains tax imposed by those countries.
Distributions to shareholders are recorded on theex-dividend date. Income and capital gain distributions are determined in accordance with income tax regulations, which may differ from U.S. generally accepted accounting principles. Certain capital accounts in the financial statements are periodically adjusted for permanent differences in order to reflect their tax character. These adjustments have no impact on net assets or net asset value per share. Temporary differences which arise from recognizing certain items of income, expense, gain or loss in different periods for financial statement and tax purposes will reverse at some time in the future.
Book/tax differences primarily relate to passive foreign investment companies, wash sale loss deferrals, and foreign taxes.
The tax character of distributions declared to shareholders for the last two fiscal years is as follows:
| | | | | | | | |
| | | Year ended
12/31/19 | | | Year ended
12/31/18 | |
| Ordinary income (including any short-term capital gains) | | | $231,002 | | | | $118,016 | |
| Long-term capital gains | | | 1,426,026 | | | | — | |
| Total distributions | | | $1,657,028 | | | | $118,016 | |
The federal tax cost and the tax basis components of distributable earnings were as follows:
| | | | |
| As of 12/31/19 | | | | |
| |
| Cost of investments | | | $33,489,730 | |
| Gross appreciation | | | 14,705,618 | |
| Gross depreciation | | | (1,731,819 | ) |
| Net unrealized appreciation (depreciation) | | | $12,973,799 | |
| |
| Undistributed ordinary income | | | 1,858,338 | |
| Undistributed long-term capital gain | | | 1,754,547 | |
| Other temporary differences | | | (37,523 | ) |
Multiple Classes of Shares of Beneficial Interest– The fund offers multiple classes of shares, which differ in their respective distribution and/or service fees. The fund’s income, realized and unrealized gain (loss), and common expenses are allocated to shareholders based on the daily net assets of each class. Dividends are declared separately for each class. Differences in per share dividend rates are generally due to differences in separate class expenses. The fund’s distributions declared to shareholders as reported in the Statements of Changes in Net Assets are presented by class as follows:
| | | | | | | | |
| | |
| | | Year ended
12/31/19 | | | Year ended
12/31/18 | |
| Initial Class | | | $771,534 | | | | $87,265 | |
| Service Class | | | 885,494 | | | | 30,751 | |
| Total | | | $1,657,028 | | | | $118,016 | |
16
MFS Emerging Markets Equity Portfolio
Notes to Financial Statements – continued
| (3) | | Transactions with Affiliates |
Investment Adviser– The fund has an investment advisory agreement with MFS to provide overall investment management and related administrative services and facilities to the fund. The management fee is computed daily and paid monthly at the following annual rates based on the fund’s average daily net assets:
| | | | |
| Up to $500 million | | | 1.05% | |
| In excess of $500 million | | | 1.00% | |
MFS has agreed in writing to reduce its management fee by a specified amount if certain MFS mutual fund assets exceed thresholds agreed to by MFS and the fund’s Board of Trustees. For the year ended December 31, 2019, this management fee reduction amounted to $4,471, which is included in the reduction of total expenses in the Statement of Operations. The management fee incurred for the year ended December 31, 2019 was equivalent to an annual effective rate of 1.04% of the fund’s average daily net assets.
For the period from January 1, 2019 through July 31, 2019, the investment adviser had agreed in writing to pay a portion of the fund’s total annual operating expenses, excluding interest, taxes, extraordinary expenses, brokerage and transaction costs, and investment-related expenses, such that total annual operating expenses did not exceed 1.33% of average daily net assets for the Initial Class shares and 1.58% of average daily net assets for the Service Class shares. This written agreement terminated on July 31, 2019. For the period from January 1, 2019 through July 31, 2019, this reduction amounted to $66,768, which is included in the reduction of total expenses in the Statement of Operations. Effective August 1, 2019, the investment adviser has agreed in writing to pay a portion of the fund’s total annual operating expenses, excluding interest, taxes, extraordinary expenses, brokerage and transaction costs, and investment-related expenses, such that total annual operating expenses do not exceed 1.23% of average daily net assets for the Initial Class shares and 1.48% of average daily net assets for the Service Class shares. This written agreement will continue until modified by the fund’s Board of Trustees, but such agreement will continue at least until April 30, 2021. For the period from August 1, 2019 through December 31, 2019, this reduction amounted to $48,066, which is included in the reduction of total expenses in the Statement of Operations.
Distributor– MFS Fund Distributors, Inc. (MFD), a wholly-owned subsidiary of MFS, is the distributor of shares of the fund. The Trustees have adopted a distribution plan for the Service Class shares pursuant to Rule12b-1 under the Investment Company Act of 1940.
The fund’s distribution plan provides that the fund will pay MFD distribution and/or service fees equal to 0.25% per annum of its average daily net assets attributable to Service Class shares as partial consideration for services performed and expenses incurred by MFD and financial intermediaries (including participating insurance companies that invest in the fund to fund variable annuity and variable life insurance contracts, sponsors of qualified retirement and pension plans that invest in the fund, and affiliates of these participating insurance companies and plan sponsors) in connection with the sale and distribution of the Service Class shares. MFD may subsequently pay all, or a portion, of the distribution and/or service fees to financial intermediaries.
Shareholder Servicing Agent– MFS Service Center, Inc. (MFSC), a wholly-owned subsidiary of MFS, receives a fee from the fund for its services as shareholder servicing agent. For the year ended December 31, 2019, the fee was $3,145, which equated to 0.0069% annually of the fund’s average daily net assets. MFSC also receives payment from the fund forout-of-pocket expenses paid by MFSC on behalf of the fund. For the year ended December 31, 2019, these costs amounted to $256.
Administrator – MFS provides certain financial, legal, shareholder communications, compliance, and other administrative services to the fund. Under an administrative services agreement, the fund reimburses MFS the costs incurred to provide these services. The fund is charged an annual fixed amount of $17,500 plus a fee based on average daily net assets. The administrative services fee incurred for the year ended December 31, 2019 was equivalent to an annual effective rate of 0.0382% of the fund’s average daily net assets.
Trustees’ and Officers’ Compensation – The fund pays compensation to independent Trustees in the form of a retainer, attendance fees, and additional compensation to Board and Committee chairpersons. The fund does not pay compensation directly to Trustees or officers of the fund who are also officers of the investment adviser, all of whom receive remuneration from MFS for their services to the fund. Certain officers and Trustees of the fund are officers or directors of MFS, MFD, and MFSC.
Other – This fund and certain other funds managed by MFS (the funds) had entered into a service agreement (the ISO Agreement) which provided for payment of fees solely by the funds to Tarantino LLC in return for the provision of services of an Independent Senior Officer (ISO) for the funds. Frank L. Tarantino served as the ISO and was an officer of the funds and the sole member of Tarantino LLC. Effective June 30, 2019, Mr. Tarantino retired from his position as ISO for the funds, and the ISO Agreement was terminated. For the year ended December 31, 2019, the fee paid by the fund under this agreement was $55 and is included in “Miscellaneous” expense in the Statement of Operations. MFS had agreed to bear all expenses associated with office space, other administrative support, and supplies provided to the ISO.
17
MFS Emerging Markets Equity Portfolio
Notes to Financial Statements – continued
The fund invests in the MFS Institutional Money Market Portfolio which is managed by MFS and seeks current income consistent with preservation of capital and liquidity. This money market fund does not pay a management fee to MFS.
The fund is permitted to engage in purchase and sale transactions with funds and accounts for which MFS serves as investment adviser orsub-adviser (“cross-trades”) pursuant to a policy adopted by the Board of Trustees. This policy has been designed to ensure that cross-trades conducted by the fund comply with Rule17a-7 under the Investment Company Act of 1940. During the year ended December 31, 2019, the fund engaged in purchase and sale transactions pursuant to this policy, which amounted to $93,659 and $136,613, respectively. The sales transactions resulted in net realized gains (losses) of $14,017.
The adviser has voluntarily undertaken to reimburse the fund from its own resources on a quarterly basis for the cost of investment research embedded in the cost of the fund’s securities trades. This agreement may be rescinded at any time. For the year ended December 31, 2019, this reimbursement amounted to $5,245, which is included in “Other” income in the Statement of Operations.
For the year ended December 31, 2019, purchases and sales of investments, other than short-term obligations, aggregated $9,617,420 and $16,193,764, respectively.
| (5) | | Shares of Beneficial Interest |
The fund’s Declaration of Trust permits the Trustees to issue an unlimited number of full and fractional shares of beneficial interest. Transactions in fund shares were as follows:
| | | | | | | | | | | | | | | | |
| | | Year ended 12/31/19 | | | Year ended 12/31/18 | |
| | | | |
| | | Shares | | | Amount | | | Shares | | | Amount | |
| Shares sold | | | | | | | | | | | | | | | | |
Initial Class | | | 45,254 | | | | $732,087 | | | | 59,189 | | | | $1,002,780 | |
Service Class | | | 189,058 | | | | 2,968,265 | | | | 398,376 | | | | 6,530,385 | |
| | | 234,312 | | | | $3,700,352 | | | | 457,565 | | | | $7,533,165 | |
| | | | |
| Shares issued to shareholders in reinvestment of distributions | | | | | | | | | | | | | | | | |
Initial Class | | | 52,736 | | | | $771,534 | | | | 5,241 | | | | $87,265 | |
Service Class | | | 61,407 | | | | 885,494 | | | | 1,874 | | | | 30,751 | |
| | | 114,143 | | | | $1,657,028 | | | | 7,115 | | | | $118,016 | |
| | | | |
| Shares reacquired | | | | | | | | | | | | | | | | |
Initial Class | | | (277,562 | ) | | | $(4,435,286 | ) | | | (278,563 | ) | | | $(4,678,515 | ) |
Service Class | | | (374,054 | ) | | | (5,974,525 | ) | | | (501,945 | ) | | | (8,215,525 | ) |
| | | (651,616 | ) | | | $(10,409,811 | ) | | | (780,508 | ) | | | $(12,894,040 | ) |
| | | | |
| Net change | | | | | | | | | | | | | | | | |
Initial Class | | | (179,572 | ) | | | $(2,931,665 | ) | | | (214,133 | ) | | | $(3,588,470 | ) |
Service Class | | | (123,589 | ) | | | (2,120,766 | ) | | | (101,695 | ) | | | (1,654,389 | ) |
| | | (303,161 | ) | | | $(5,052,431 | ) | | | (315,828 | ) | | | $(5,242,859 | ) |
The fund is one of several mutual funds in which certain MFS funds may invest. The MFS funds do not invest in the underlying funds for the purpose of exercising management or control. At the end of the period, the MFS Growth Allocation Portfolio was the owner of record of approximately 8% of the value of outstanding voting shares of the fund.
The fund and certain other funds managed by MFS participate in a $1.25 billion unsecured committed line of credit, subject to a $1 billion sublimit, provided by a syndicate of banks under a credit agreement. Borrowings may be made for temporary financing needs. Interest is charged to each fund, based on its borrowings, generally at a rate equal to the highest of one month LIBOR, the Federal Funds Effective Rate and the Overnight Bank Funding Rate, plus an agreed upon spread. A commitment fee, based on the average daily, unused portion of the committed line of credit, is allocated among the participating funds. In addition, the fund and other funds managed by MFS have established unsecured uncommitted borrowing arrangements with certain banks for temporary financing needs. Interest is charged to each fund, based on its borrowings, at rates equal to customary reference rates plus an agreed upon spread. For the year ended December 31, 2019, the fund’s commitment fee and interest expense were $250 and $0, respectively, and are included in “Miscellaneous” expense in the Statement of Operations.
18
MFS Emerging Markets Equity Portfolio
Notes to Financial Statements – continued
| (7) | | Investments in Affiliated Issuers |
An affiliated issuer may be considered one in which the fund owns 5% or more of the outstanding voting securities, or a company which is under common control. For the purposes of this report, the following were affiliated issuers:
| | | | | | | | | | | | | | | | | | | | | | | | |
| Affiliated Issuers | | Beginning
Value | | | Purchases | | | Sales
Proceeds | | | Realized
Gain
(Loss) | | | Change in
Unrealized
Appreciation or
Depreciation | | | Ending
Value | |
| MFS Institutional Money Market Portfolio | | | $364,115 | | | | $9,825,661 | | | | $9,737,802 | | | | $(63) | | | | $1 | | | | $451,912 | |
| | | | | | |
| Affiliated Issuers | | | | | | | | | | | | | | Dividend
Income | | | Capital Gain
Distributions | |
| MFS Institutional Money Market Portfolio | | | | | | | | | | | | | | | | | | | $12,384 | | | | $— | |
19
MFS Emerging Markets Equity Portfolio
REPORT OF INDEPENDENT REGISTERED PUBLIC ACCOUNTING FIRM
To the Board of Trustees of MFS Variable Insurance Trust II and the Shareholders of
MFS Emerging Markets Equity Portfolio:
Opinion on the Financial Statements and Financial Highlights
We have audited the accompanying statement of assets and liabilities of MFS Emerging Markets Equity Portfolio (the “Fund”), including the portfolio of investments, as of December 31, 2019, the related statement of operations for the year then ended, the statements of changes in net assets for each of the two years in the period then ended, the financial highlights for each of the five years in the period then ended, and the related notes. In our opinion, the financial statements and financial highlights present fairly, in all material respects, the financial position of the Fund as of December 31, 2019, and the results of its operations for the year then ended, the changes in its net assets for each of the two years in the period then ended, and the financial highlights for each of the five years in the period then ended, in conformity with accounting principles generally accepted in the United States of America.
Basis for Opinion
These financial statements and financial highlights are the responsibility of the Fund’s management. Our responsibility is to express an opinion on the Fund’s financial statements and financial highlights based on our audits. We are a public accounting firm registered with the Public Company Accounting Oversight Board (United States) (PCAOB) and are required to be independent with respect to the Fund in accordance with the U.S. federal securities laws and the applicable rules and regulations of the Securities and Exchange Commission and the PCAOB.
We conducted our audits in accordance with the standards of the PCAOB. Those standards require that we plan and perform the audit to obtain reasonable assurance about whether the financial statements and financial highlights are free of material misstatement, whether due to error or fraud. The Fund is not required to have, nor were we engaged to perform, an audit of its internal control over financial reporting. As part of our audits we are required to obtain an understanding of internal control over financial reporting but not for the purpose of expressing an opinion on the effectiveness of the Fund’s internal control over financial reporting. Accordingly, we express no such opinion.
Our audits included performing procedures to assess the risks of material misstatement of the financial statements and financial highlights, whether due to error or fraud, and performing procedures that respond to those risks. Such procedures included examining, on a test basis, evidence regarding the amounts and disclosures in the financial statements and financial highlights. Our audits also included evaluating the accounting principles used and significant estimates made by management, as well as evaluating the overall presentation of the financial statements and financial highlights. Our procedures included confirmation of securities owned as of December 31, 2019, by correspondence with the custodian and brokers; when replies were not received from brokers, we performed other auditing procedures. We believe that our audits provide a reasonable basis for our opinion.
DELOITTE & TOUCHE LLP
Boston, Massachusetts
February 14, 2020
We have served as the auditor of one or more of the MFS investment companies since 1924.
20
MFS Emerging Markets Equity Portfolio
TRUSTEES AND OFFICERS – IDENTIFICATION AND BACKGROUND
The Trustees and Officers of the Trust, as of February 1, 2020, are listed below, together with their principal occupations during the past five years. (Their titles may have varied during that period.) The address of each Trustee and Officer is 111 Huntington Avenue, Boston, Massachusetts 02199-7618.
| | | | | | | | | | |
Name, Age | | Position(s)
Held with Fund | | Trustee/Officer
Since (h) | | Number of MFS Funds
overseen by the
Trustee | | Principal Occupations
During the Past Five Years | | Other Directorships During the Past Five Years (j) |
| INTERESTED TRUSTEES |
Robert J. Manning (k)
(age 56) | | Trustee | | February 2004 | | 133 | | Massachusetts Financial Services Company, Executive Chairman (since January 2017); Director; Chairman of the Board; Chief Executive Officer (until 2015);Co-Chief Executive Officer(2015-2016) | | N/A |
| | | | | |
Robin A. Stelmach (k) (age 58) | | Trustee | | January 2014 | | 133 | | Massachusetts Financial Services Company, Vice Chair (since January 2017); Chief Operating Officer and Executive Vice President (until January 2017) | | N/A |
|
| INDEPENDENT TRUSTEES |
John P. Kavanaugh (age 65) | | Trustee and Chair of Trustees | | January 2009 | | 133 | | Private investor | | N/A |
| | | | | |
Steven E. Buller (age 68) | | Trustee | | February 2014 | | 133 | | Financial Accounting Standards Advisory Council, Chairman(2014-2015); Public Company Accounting Oversight Board, Standing Advisory Group, Member (until 2014); BlackRock, Inc. (investment management), Managing Director (until 2014), BlackRock Finco UK (investment management), Director (until 2014) | | N/A |
| | | | | |
John A. Caroselli (age 65) | | Trustee | | March 2017 | | 133 | | JC Global Advisors, LLC (management consulting), President (since 2015); First Capital Corporation (commercial finance), Executive Vice President (until 2015) | | N/A |
| | | | | |
Maureen R. Goldfarb (age 64) | | Trustee | | January 2009 | | 133 | | Private investor | | N/A |
| | | | | |
Peter D. Jones
(age 64) | | Trustee | | January 2019 | | 133 | | Franklin Templeton Distributors, Inc. (investment management), President (until 2015); Franklin Templeton Institutional, LLC (investment management), Chairman (until 2015) | | N/A |
| | | | | |
James W. Kilman, Jr.
(age 58) | | Trustee | | January 2019 | | 133 | | Burford Capital Limited (finance and investment management), Chief Financial Officer (since 2019); KielStrand Capital LLC (family office), Chief Executive Officer (since 2016); Morgan Stanley & Co. (financial services), Vice Chairman of Investment Banking,Co-Head of Diversified Financials Coverage – Financial Institutions Investment Banking Group (until 2016) | | Alpha-En Corporation, Director (2016-2019) |
21
MFS Emerging Markets Equity Portfolio
Trustees and Officers – continued
| | | | | | | | | | |
Name, Age | | Position(s)
Held with Fund | | Trustee/Officer
Since (h) | | Number of MFS Funds
overseen by the
Trustee | | Principal Occupations
During the Past Five Years | | Other Directorships During the Past Five Years (j) |
Clarence Otis, Jr. (age 63) | | Trustee | | March 2017 | | 133 | | Darden Restaurants, Inc., Chief Executive Officer (until 2014) | | VF Corporation, Director; Verizon Communications, Inc., Director; The Travelers Companies, Director; Federal Reserve Bank of Atlanta, Director (until 2015) |
| | | | | |
Maryanne L. Roepke (age 63) | | Trustee | | May 2014 | | 133 | | American Century Investments (investment management), Senior Vice President and Chief Compliance Officer (until 2014) | | N/A |
| | | | | |
Laurie J. Thomsen
(age 62) | | Trustee | | March 2005 | | 133 | | Private investor | | The Travelers Companies, Director; Dycom Industries, Inc., Director (since 2015) |
| | | | | | | | |
Name, Age | | Position(s)
Held with Fund | | Trustee/Officer
Since (h) | | Number of
MFS Funds
for which the
Person is an
Officer | | Principal Occupations During the Past Five Years |
| OFFICERS | | | | | | |
Christopher R. Bohane (k)
(age 46) | | Assistant Secretary and Assistant Clerk | | July 2005 | | 133 | | Massachusetts Financial Services Company, Vice President and Assistant General Counsel |
| | | | |
Kino Clark (k) (age 51) | | Assistant Treasurer | | January 2012 | | 133 | | Massachusetts Financial Services Company, Vice President |
| | | | |
John W. Clark, Jr. (k) (age 52) | | Assistant Treasurer | | April 2017 | | 133 | | Massachusetts Financial Services Company, Vice President (since March 2017); Deutsche Bank (financial services), Department Head –Treasurer’s Office (until February 2017) |
| | | | |
Thomas H. Connors (k) (age 60) | | Assistant Secretary and Assistant Clerk | | September 2012 | | 133 | | Massachusetts Financial Services Company, Vice President and Senior Counsel |
| | | | |
David L. DiLorenzo (k)
(age 51) | | President | | July 2005 | | 133 | | Massachusetts Financial Services Company, Senior Vice President |
| | | | |
Heidi W. Hardin (k) (age 52) | | Secretary and Clerk | | April 2017 | | 133 | | Massachusetts Financial Services Company, Executive Vice President and General Counsel (since March 2017); Harris Associates (investment management), General Counsel (from September 2015 to January 2017); Janus Capital Management LLC (investment management), Senior Vice President and General Counsel (until September 2015) |
| | | | |
Brian E. Langenfeld (k) (age 46) | | Assistant
Secretary and Assistant Clerk | | June 2006 | | 133 | | Massachusetts Financial Services Company, Vice President and Senior Counsel |
| | | | |
Amanda S. Mooradian (k) (age 40) | | Assistant
Secretary and Assistant Clerk | | September 2018 | | 133 | | Massachusetts Financial Services Company, Assistant Vice President and Counsel |
| | | | |
Susan A. Pereira (k)
(age 49) | | Assistant
Secretary and Assistant Clerk | | July 2005 | | 133 | | Massachusetts Financial Services Company, Vice President and Assistant General Counsel |
| | | | |
Kasey L. Phillips (k) (age 49) | | Assistant Treasurer | | September 2012 | | 133 | | Massachusetts Financial Services Company, Vice President |
| | | | |
Matthew A. Stowe (k) (age 45) | | Assistant Secretary and Assistant Clerk | | October 2014 | | 133 | | Massachusetts Financial Services Company, Vice President and Assistant General Counsel |
22
MFS Emerging Markets Equity Portfolio
Trustees and Officers – continued
| | | | | | | | |
Name, Age | | Position(s)
Held with Fund | | Trustee/Officer
Since (h) | | Number of
MFS Funds
for which the
Person is an
Officer | | Principal Occupations During the Past Five Years |
Martin J. Wolin (k) (age 52) | | Chief Compliance Officer | | July 2015 | | 133 | | Massachusetts Financial Services Company, Senior Vice President and Chief Compliance Officer (since July 2015); Mercer (financial service provider), Chief Risk and Compliance Officer, North America and Latin America (until June 2015) |
| | | | |
James O. Yost (k)
(age 59) | | Treasurer | | September 1990 | | 133 | | Massachusetts Financial Services Company, Senior Vice President |
| (h) | Date first appointed to serve as Trustee/officer of an MFS Fund. Each Trustee has served continuously since appointment unless indicated otherwise. For the period from December 15, 2004 until February 22, 2005, Mr. Manning served as Advisory Trustee. From January 2012 through December 2016, Messrs. DiLorenzo and Yost served as Treasurer and Deputy Treasurer of the Funds, respectively. |
| (j) | Directorships or trusteeships of companies required to report to the Securities and Exchange Commission (i.e., “public companies”). |
| (k) | “Interested person” of the Trust within the meaning of the Investment Company Act of 1940 (referred to as the 1940 Act), which is the principal federal law governing investment companies like the fund, as a result of a position with MFS. The address of MFS is 111 Huntington Avenue, Boston, Massachusetts 02199-7618. |
Each Trustee (other than Messrs. Jones and Kilman) has been elected by shareholders and each Trustee and Officer holds office until his or her successor is chosen and qualified or until his or her earlier death, resignation, retirement or removal. Messrs. Jones and Kilman became Trustees of the Funds on January 1, 2019. The Trust does not hold annual meetings for the purpose of electing Trustees, and Trustees are not elected for fixed terms. Under the terms of the Board’s retirement policy, an Independent Trustee shall retire at the end of the calendar year in which he or she reaches the earlier of 75 years of age or 15 years of service on the Board (or, in the case of any Independent Trustee who joined the Board prior to 2015, 20 years of service on the Board).
Messrs. Buller, Kilman and Otis and Ms. Roepke are members of the Trust’s Audit Committee.
Each of the Interested Trustees and certain Officers hold comparable officer positions with certain affiliates of MFS.
The Statement of Additional Information for a Fund includes further information about the Trustees and is available without charge upon request by calling1-800-225-2606.
| | |
Investment Adviser Massachusetts Financial Services Company 111 Huntington Avenue Boston, MA 02199-7618 | | Custodian State Street Bank and Trust Company 1 Lincoln Street Boston, MA 02111-2900 |
| |
Distributor MFS Fund Distributors, Inc. 111 Huntington Avenue Boston, MA 02199-7618 | | Independent Registered Public Accounting Firm Deloitte & Touche LLP 200 Berkeley Street Boston, MA 02116 |
| |
Portfolio Manager(s) Jose Luis Garcia Robert Lau Harry Purcell | | |
23
MFS Emerging Markets Equity Portfolio
BOARD REVIEW OF INVESTMENT ADVISORY AGREEMENT
MFS Emerging Markets Equity Portfolio
The Investment Company Act of 1940 requires that both the full Board of Trustees and a majority of thenon-interested (“independent”) Trustees, voting separately, annually approve the continuation of the Fund’s investment advisory agreement with MFS. The Trustees consider matters bearing on the Fund and its advisory arrangements at their meetings throughout the year, including a review of performance data at each regular meeting. In addition, the independent Trustees met several times over the course of three months beginning in May and ending in July, 2019 (“contract review meetings”) for the specific purpose of considering whether to approve the continuation of the investment advisory agreement for the Fund and the other investment companies that the Board oversees (the “MFS Funds”). The independent Trustees were assisted in their evaluation of the Fund’s investment advisory agreement by independent legal counsel, from whom they received separate legal advice and with whom they met separately from MFS during various contract review meetings. The independent Trustees were also assisted in this process by the MFS Funds’ Independent Senior Officer, a senior officer appointed by and reporting to the independent Trustees.
In connection with their deliberations regarding the continuation of the investment advisory agreement, the Trustees, including the independent Trustees, considered such information and factors as they believed, in light of the legal advice furnished to them and their own business judgment, to be relevant. The investment advisory agreement for the Fund was considered separately, although the Trustees also took into account the common interests of all MFS Funds in their review. As described below, the Trustees considered the nature, quality, and extent of the various investment advisory, administrative, and shareholder services performed by MFS under the existing investment advisory agreement and other arrangements with the Fund.
In connection with their contract review meetings, the Trustees received and relied upon materials that included, among other items: (i) information provided by Broadridge Financial Solutions, Inc. (“Broadridge”), an independent third party, on the investment performance of the Fund for various time periods ended December 31, 2018 and the investment performance of a group of funds with substantially similar investment classifications/objectives (the “Broadridge performance universe”), (ii) information provided by Broadridge on the Fund’s advisory fees and other expenses and the advisory fees and other expenses of comparable funds identified by Broadridge as well as all other funds in the same investment classification/category (the “Broadridge expense group and universe”), (iii) information provided by MFS on the advisory fees of portfolios of other clients of MFS, including institutional separate accounts and other clients, (iv) information as to whether and to what extent applicable expense waivers, reimbursements or fee “breakpoints” are observed for the Fund, (v) information regarding MFS’ financial results and financial condition, including MFS’ and certain of its affiliates’ estimated profitability from services performed for the Fund and the MFS Funds as a whole, and compared to MFS’ institutional business, (vi) MFS’ views regarding the outlook for the mutual fund industry and the strategic business plans of MFS, (vii) descriptions of various functions performed by MFS for the Funds, such as compliance monitoring and portfolio trading practices, and (viii) information regarding the overall organization of MFS, including information about MFS’ senior management and other personnel providing investment advisory, administrative and other services to the Fund and the other MFS Funds. The comparative performance, fee and expense information prepared and provided by Broadridge was not independently verified and the independent Trustees did not independently verify any information provided to them by MFS.
The Trustees’ conclusion as to the continuation of the investment advisory agreement was based on a comprehensive consideration of all information provided to the Trustees and not the result of any single factor. Some of the factors that figured particularly in the Trustees’ deliberations are described below, although individual Trustees may have evaluated the information presented differently from one another, giving different weights to various factors. It is also important to recognize that the fee arrangements for the Fund and other MFS Funds are the result of years of review and discussion between the independent Trustees and MFS, that certain aspects of such arrangements may receive greater scrutiny in some years than in others, and that the Trustees’ conclusions may be based, in part, on their consideration of these same arrangements during the course of the year and in prior years.
Based on information provided by Broadridge and MFS, the Trustees reviewed the Fund’s total return investment performance as well as the Broadridge performance universe over various time periods. The Trustees placed particular emphasis on the total return performance of the Fund’s Initial Class shares in comparison to the performance of funds in its Broadridge performance universe over the five-year period ended December 31, 2018, which the Trustees believed was a long enough period to reflect differing market conditions. The total return performance of the Fund’s Initial Class shares was in the 2nd quintile relative to the other funds in the universe for this five-year period (the 1st quintile being the best performers and the 5th quintile being the worst performers). The total return performance of the Fund’s Initial Class shares was in the 1st quintile for each of theone- and three-year periods ended December 31, 2018 relative to the Broadridge performance universe. Because of the passage of time, these performance results may differ from the performance results for more recent periods, including those shown elsewhere in this report.
In the course of their deliberations, the Trustees took into account information provided by MFS in connection with the contract review meetings, as well as during investment review meetings conducted with portfolio management personnel during the course of the year regarding the Fund’s performance. After reviewing these and related factors, the Trustees concluded, within the context of their overall conclusions regarding the investment advisory agreement, that they were satisfied with MFS’ responses and efforts relating to investment performance.
24
MFS Emerging Markets Equity Portfolio
Board Review of Investment Advisory Agreement – continued
In assessing the reasonableness of the Fund’s advisory fee, the Trustees considered, among other information, the Fund’s advisory fee and the total expense ratio of the Fund’s Initial Class shares as a percentage of average daily net assets and the advisory fee and total expense ratios of the Broadridge expense group based on information provided by Broadridge. The Trustees considered that MFS currently observes an expense limitation for the Fund, which may not be changed without the Trustees’ approval. The Trustees also considered that, according to the data provided by Broadridge (which takes into account any fee reductions or expense limitations that were in effect during the Fund’s last fiscal year), the Fund’s effective advisory fee rate was approximately at the Broadridge expense group median and the Fund’s total expense ratio was higher than the Broadridge expense group median. The Trustees also noted that MFS has agreed to further reduce such expense limitation for the Fund effective August 1, 2019, which may not be changed without the Trustees’ approval.
The Trustees also considered the advisory fees charged by MFS to any institutional separate accounts advised by MFS (“separate accounts”) and unaffiliated investment companies for which MFS serves as subadviser (“subadvised funds”) that have comparable investment strategies to the Fund, if any. In comparing these fees, the Trustees considered information provided by MFS as to the generally broader scope of services provided by MFS to the Fund, as well as the more extensive regulatory burdens imposed on MFS in managing the Fund, in comparison to separate accounts and subadvised funds. The Trustees also considered the higher demands placed on MFS’ investment personnel and trading infrastructure as a result of the daily cashin-flows andout-flows of the Fund in comparison to separate accounts.
The Trustees also considered whether the Fund may benefit from any economies of scale in the management of the Fund in the event of growth in assets of the Fund and/or growth in assets of the MFS Funds as a whole. They noted that the Fund’s advisory fee rate schedule is subject to a contractual breakpoint that reduces the Fund’s advisory fee rate on average daily net assets over $500 million. The Trustees also noted that MFS has agreed in writing to waive a portion of the management fees of certain MFS Funds, including the Fund, if the total combined assets of certain funds within the MFS Funds’ complex increase above agreed upon thresholds (the “group fee waiver”), enabling the Fund’s shareholders to share in the benefits from any economies of scale at the complex level. The group fee waiver is reviewed and renewed annually between the Board and MFS. The Trustees concluded that the breakpoint and the group fee waiver were sufficient to allow the Fund to benefit from economies of scale as its assets and overall complex assets grow.
The Trustees also considered information prepared by MFS relating to MFS’ costs and profits with respect to the Fund, the MFS Funds considered as a group, and other investment companies and accounts advised by MFS, as well as MFS’ methodologies used to determine and allocate its costs to the MFS Funds, the Fund and other accounts and products for purposes of estimating profitability.
After reviewing these and other factors described herein, the Trustees concluded, within the context of their overall conclusions regarding the investment advisory agreement, that the advisory fees charged to the Fund represent reasonable compensation in light of the services being provided by MFS to the Fund.
In addition, the Trustees considered MFS’ resources and related efforts to continue to retain, attract and motivate capable personnel to serve the Fund. The Trustees also considered current and developing conditions in the financial services industry, including the presence of large and well-capitalized companies which are spending, and appear to be prepared to continue to spend, substantial sums to engage personnel and to provide services to competing investment companies. In this regard, the Trustees also considered the financial resources of MFS and its ultimate parent, Sun Life Financial Inc. The Trustees also considered the advantages and possible disadvantages to the Fund of having an adviser that also serves other investment companies as well as other accounts.
The Trustees also considered the nature, quality, cost, and extent of administrative, transfer agency, and distribution services provided to the Fund by MFS and its affiliates under agreements and plans other than the investment advisory agreement, including any12b-1 fees the Fund pays to MFS Fund Distributors, Inc., an affiliate of MFS. The Trustees also considered the nature, extent and quality of certain other services MFS performs or arranges for on the Fund’s behalf, which may include securities lending programs, directed expense payment programs, class action recovery programs, and MFS’ interaction with third-party service providers, principally custodians andsub-custodians. The Trustees concluded that the variousnon-advisory services provided by MFS and its affiliates on behalf of the Fund were satisfactory.
The Trustees consideredso-called“fall-out benefits” to MFS such as reputational value derived from serving as investment manager to the MFS Funds. The Trustees also considered that, effective January 3, 2018, MFS had discontinued its historic practice of obtaining investment research from portfolio brokerage commissions paid by certain MFS Funds and would thereafter directly pay for or voluntarily reimburse a Fund, if applicable, for the costs of external research acquired through the use of the Fund’s portfolio brokerage commissions.
Based on their evaluation of factors that they deemed to be material, including those factors described above, the Board of Trustees, including the independent Trustees, concluded that the Fund’s investment advisory agreement with MFS should be continued for an additionalone-year period, commencing August 1, 2019.
25
MFS Emerging Markets Equity Portfolio
PROXY VOTING POLICIES AND INFORMATION
MFS votes proxies on behalf of the fund pursuant to proxy voting policies and procedures that are available without charge, upon request, by calling 1-800-225-2606, by visitingmfs.com/proxyvoting, or by visiting the SEC’s Web site athttp://www.sec.gov.
Information regarding how the fund voted proxies relating to portfolio securities during the most recent twelve-month period ended June 30 is available by August 31 of each year without charge by visitingmfs.com/proxyvoting, or by visiting the SEC’s Web site athttp://www.sec.gov.
QUARTERLY PORTFOLIO DISCLOSURE
The fund files a complete schedule of portfolio holdings with the SEC for the first and third quarters of each fiscal year as an exhibit to its reports on Form N-PORT. The fund’s Form N-PORT reports are available on the SEC’s website athttp://www.sec.gov. A shareholder can obtain the portfolio holdings report for the first and third quarters of the fund’s fiscal year atmfs.com/vit2 by choosing the fund’s name and then selecting the “Resources” tab and clicking on “Prospectus and Reports”.
FURTHER INFORMATION
From time to time, MFS may post important information about the fund or the MFS funds on the MFS web site (mfs.com). This information is available athttps://www.mfs.com/en-us/what-we-do/announcements.htmlor atmfs.com/vit2 by choosing the fund’s name.
INFORMATION ABOUT FUND CONTRACTS AND LEGAL CLAIMS
The fund has entered into contractual arrangements with an investment adviser, administrator, distributor, shareholder servicing agent, 529 program manager (if applicable), and custodian who each provide services to the fund. Unless expressly stated otherwise, shareholders are not parties to, or intended beneficiaries of these contractual arrangements, and these contractual arrangements are not intended to create any shareholder right to enforce them against the service providers or to seek any remedy under them against the service providers, either directly or on behalf of the fund.
Under the Trust’s By-Laws and Declaration of Trust, any claims asserted against or on behalf of the MFS Funds, including claims against Trustees and Officers, must be brought in state and federal courts located within the Commonwealth of Massachusetts.
FEDERAL TAX INFORMATION (unaudited)
The following information is provided pursuant to provisions of the Internal Revenue Code.
The fund designates $1,569,000 as capital gain dividends paid during the fiscal year.
For corporate shareholders, 6.65% of the ordinary income dividends paid during the fiscal year qualify for the corporate dividends received deduction.
Income derived from foreign sources was $1,487,849. The fund intends to pass through foreign tax credits of $116,164 for the fiscal year.
26
rev. 3/16
| | | | |
| | | |
| FACTS | | WHAT DOES MFS DO WITH YOUR
PERSONAL INFORMATION? | |  |
| | |
| Why? | | Financial companies choose how they share your personal information. Federal law gives consumers the right to limit some but not all sharing. Federal law also requires us to tell you how we collect, share, and protect your personal information. Please read this notice carefully to understand what we do. |
| | |
| What? | | The types of personal information we collect and share depend on the product or service you have with us. This information can include: • Social Security number and account balances • Account transactions and transaction history • Checking account information and wire transfer instructions When you areno longer our customer, we continue to share your information as described in this notice. |
| | |
| How? | | All financial companies need to share customers’ personal information to run their everyday business. In the section below, we list the reasons financial companies can share their customers’ personal information; the reasons MFS chooses to share; and whether you can limit this sharing. |
| | | | |
Reasons we can share your
personal information | | Does MFS share? | | Can you limit this
sharing? |
For our everyday business purposes – such as to process your transactions, maintain your account(s), respond to court orders and legal investigations, or report to credit bureaus | | Yes | | No |
For our marketing purposes – to offer our products and services to you | | No | | We don’t share |
| For joint marketing with other financial companies | | No | | We don’t share |
For our affiliates’ everyday business purposes – information about your transactions and experiences | | No | | We don’t share |
For our affiliates’ everyday business purposes – information about your creditworthiness | | No | | We don’t share |
| For nonaffiliates to market to you | | No | | We don’t share |
| | |
| | |
| Questions? | | Call800-225-2606 or go tomfs.com. |
27
| | |
| Who we are |
| Who is providing this notice? | | MFS Funds, MFS Investment Management, MFS Institutional Advisors, Inc., and MFS Heritage Trust Company. |
| | |
| What we do |
| How does MFS protect my personal information? | | To protect your personal information from unauthorized access and use, we use security measures that comply with federal law. These measures include procedural, electronic, and physical safeguards for the protection of the personal information we collect about you. |
How does MFS
collect my personal information? | | We collect your personal information, for example, when you • open an account or provide account information • direct us to buy securities or direct us to sell your securities • make a wire transfer We also collect your personal information from others, such as credit bureaus, affiliates, or other companies. |
| Why can’t I limit all sharing? | | Federal law gives you the right to limit only • sharing for affiliates’ everyday business purposes – information about your creditworthiness • affiliates from using your information to market to you • sharing for nonaffiliates to market to you State laws and individual companies may give you additional rights to limit sharing. |
| | |
| Definitions |
| Affiliates | | Companies related by common ownership or control. They can be financial and nonfinancial companies. • MFS does not share personal information with affiliates, except for everyday business purposes as described on page one of this notice. |
| Nonaffiliates | | Companies not related by common ownership or control. They can be financial and nonfinancial companies. • MFS does not share with nonaffiliates so they can market to you. |
| Joint marketing | | A formal agreement between nonaffiliated financial companies that together market financial products or services to you. • MFS doesn’t jointly market. |
| | |
| Other important information |
| If you own an MFS product or receive an MFS service in the name of a third party such as a bank or broker-dealer, their privacy policy may apply to you instead of ours. |
28
Annual Report
December 31, 2019

MFS® Global Governments Portfolio

MFS® Variable Insurance Trust II
Beginning on January 1, 2021, as permitted by regulations adopted by the U.S. Securities and Exchange Commission, the insurance company that offers your contract may determine that it will no longer send you paper copies of the fund’s annual and semiannual shareholder reports unless you specifically request paper copies from the insurance company or from your financial intermediary. Instead, the shareholder reports will be made available on a Web site (insurancefunds.mfs.com or other Web site of which you will be notified), and the insurance company will notify you by mail each time a report is posted and provide you with a Web site link to access the report. Instructions for requesting paper copies will be provided by your insurance company or financial intermediary.
If you already elected to receive shareholder reports by email, you will not be affected by this change and you need not take any action. If your insurance company or financial intermediary offers electronic delivery, you may elect to receive shareholder reports and other communications from the insurance company or financial intermediary by email by following the instructions provided by the insurance company or financial intermediary.
Beginning on January 1, 2019, you may elect to receive all future reports in paper free of charge from the insurance company or financial intermediary. You can inform the insurance company or financial intermediary that you wish to continue receiving paper copies of your shareholder reports by contacting your insurance company or financial intermediary. Your election to receive reports in paper will apply to all funds held in your account with your insurance company or financial intermediary.
WGS-ANN
MFS® Global Governments Portfolio
CONTENTS
The report is prepared for the general information of contract owners. It is authorized for distribution to prospective investors only when preceded or accompanied by a current prospectus.
NOT FDIC INSURED• MAY LOSE VALUE• NO BANK OR CREDIT UNION GUARANTEE• NOT A DEPOSIT• NOT INSURED BY ANY FEDERAL GOVERNMENT AGENCY OR NCUA/NCUSIF
MFS Global Governments Portfolio
LETTER FROM THE EXECUTIVE CHAIR

Dear Contract Owners:
Slowing global growth, low inflation, and trade friction between the United States and China have been hallmarks of the past 12 months. After experiencing an uptick in market volatility in late 2018, markets steadied for most of 2019, thanks in large measure to the adoption of a dovish policy stance on the part of global central banks, focused on supporting economic growth. Negotiations aimed at a “phase one” trade deal between the U.S. and China bore fruit at the end of the period, boosting investor sentiment, while signs of stability emerging from the global manufacturing sector also lifted spirits. Uncertainty over Brexit, along with the ripple effects from the trade conflict, hampered business confidence and investment in the United Kingdom and Europe for much of the period, though investors expect greater clarity regarding Brexit as a result of December’s general election. The pro-Brexit Conservative Party won the election by a comfortable margin and set the stage for the U.K.’s departure from the EU at the end of January.
Markets expect the longest economic expansion in U.S. history will continue, albeit at a slower pace, as trade tensions recede. In an effort to prolong the expansion, the U.S. Federal Reserve lowered interest rates three times between July and October and the European Central Bank loosened policy in September. While the global monetary policy backdrop remains quite accommodative, signs of easing trade tensions and fading global recession fears led to improved market sentiment in late 2019 as investors grew less risk averse. In early 2020, an outbreak of coronavirus emanating from China reintroduced global growth fears, causing an uptick in volatility.
Here at MFS®, we aim to help our clients navigate the growing complexity of the markets and world economies. Our long-term investment philosophy and commitment to the responsible allocation of capital allow us to tune out the noise and uncover what we believe are the best, most durable investment opportunities in the market. Through our powerful global investment platform, we combine collective expertise, thoughtful risk management and long-term discipline to create sustainable value for investors.
Respectfully,

Robert J. Manning
Executive Chair
MFS Investment Management
February 14, 2020
The opinions expressed in this letter are subject to change and may not be relied upon for investment advice. No forecasts can be guaranteed.
1
MFS Global Governments Portfolio
PORTFOLIO COMPOSITION
Portfolio structure (i)
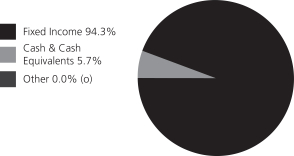
| | | | |
| Fixed income sectors (i) | | | | |
| U.S. Treasury Securities | | | 43.4% | |
| Non-U.S. Government Bonds | | | 42.7% | |
| Emerging Markets Bonds | | | 5.7% | |
| Mortgage-Backed Securities | | | 0.8% | |
| Commercial Mortgage-Backed Securities | | | 0.6% | |
| U.S. Government Agencies | | | 0.4% | |
| Municipal Bonds | | | 0.4% | |
| Collateralized Debt Obligations | | | 0.2% | |
| Investment Grade Corporates | | | 0.1% | |
|
| Composition including fixed income credit quality (a)(i) | |
| AAA | | | 6.4% | |
| AA | | | 10.8% | |
| A | | | 17.0% | |
| BBB | | | 7.8% | |
| BB | | | 5.0% | |
| U.S. Government | | | 43.4% | |
| Federal Agencies | | | 1.2% | |
| Not Rated | | | 2.7% | |
| Cash & Cash Equivalents | | | 5.7% | |
| Other (o) | | | 0.0% | |
| | | | |
| Portfolio facts (i) | | | | |
| Average Duration (d) | | | 8.4 | |
| Average Effective Maturity (m) | | | 10.8 yrs. | |
| |
| Issuer country weightings (i)(x) | | | | |
| United States | | | 51.6% | |
| Japan | | | 16.1% | |
| United Kingdom | | | 8.1% | |
| Italy | | | 5.2% | |
| Greece | | | 4.9% | |
| France | | | 3.9% | |
| Canada | | | 2.9% | |
| Spain | | | 2.1% | |
| Australia | | | 2.0% | |
| Other Countries | | | 3.2% | |
| |
| Currency exposure weightings (i)(y) | | | | |
| United States Dollar | | | 41.4% | |
| Euro | | | 27.0% | |
| Japanese Yen | | | 18.3% | |
| British Pound Sterling | | | 6.8% | |
| New Zealand Dollar | | | 1.5% | |
| Australian Dollar | | | 1.5% | |
| Canadian Dollar | | | 1.1% | |
| Mexican Peso | | | 0.8% | |
| Brazilian Real | | | 0.5% | |
| Other Currencies | | | 1.1% | |
| (a) | | For all securities other than those specifically described below, ratings are assigned to underlying securities utilizing ratings from Moody’s, Fitch, and Standard & Poor’s rating agencies and applying the following hierarchy: If all three agencies provide a rating, the middle rating (after dropping the highest and lowest ratings) is assigned; if two of the three agencies rate a security, the lower of the two is assigned. Ratings are shown in the S&P and Fitch scale (e.g., AAA). Securities rated BBB or higher are considered investment grade. All ratings are subject to change. U.S. Government includes securities issued by the U.S. Department of the Treasury. Federal Agencies includes rated and unrated U.S. Agency fixed-income securities, U.S. Agency mortgage-backed securities, and collateralized mortgage obligations of U.S. Agency mortgage-backed securities. Not Rated includes fixed income securities and fixed income derivatives, which have not been rated by any rating agency. The fund may or may not have held all of these instruments on this date. The fund is not rated by these agencies. |
| (d) | | Duration is a measure of how much a bond’s price is likely to fluctuate with general changes in interest rates, e.g., if rates rise 1.00%, a bond with a5-year duration is likely to lose about 5.00% of its value due to the interest rate move. |
| (i) | | For purposes of this presentation, the components include the value of securities, and reflect the impact of the equivalent exposure of derivative positions, if any. These amounts may be negative from time to time. Equivalent exposure is a calculated amount that translates the derivative position into a reasonable approximation of the amount of the underlying asset that the portfolio would have to hold at a given point in time to have the same price sensitivity that results from the portfolio’s ownership of the derivative contract. When dealing with derivatives, equivalent exposure is a more representative measure of the potential impact of a position on portfolio performance than value. The bond component will include any accrued interest amounts. |
| (m) | | In determining each instrument’s effective maturity for purposes of calculating the fund’s dollar-weighted average effective maturity, MFS uses the instrument’s stated maturity or, if applicable, an earlier date on which MFS believes it is probable that a maturity-shortening device (such as a put,pre-refunding or prepayment) will cause the instrument to be repaid. Such an earlier date can be substantially shorter than the instrument’s stated maturity. |
2
MFS Global Governments Portfolio
Portfolio Composition – continued
| (x) | | Represents the portfolio’s exposure to issuer countries as a percentage of a portfolio’s net assets. For purposes of this presentation, United States includes Cash & Cash Equivalents and Other. |
| (y) | | Represents the portfolio’s exposure to a particular currency as a percentage of a portfolio’s net assets. For purposes of this presentation, United States Dollar includes Cash & Cash Equivalents. |
Cash & Cash Equivalents includes any cash, investments in money market funds, short-term securities, and other assets less liabilities. Please see the Statement of Assets and Liabilities for additional information related to the fund’s cash position and other assets and liabilities.
Other includes equivalent exposure from currency derivatives and/or any offsets to derivative positions.
Percentages are based on net assets as of December 31, 2019.
The portfolio is actively managed and current holdings may be different.
3
MFS Global Governments Portfolio
MANAGEMENT REVIEW
Summary of Results
For the twelve months ended December 31, 2019, Initial Class shares of the MFS Global Governments Portfolio (fund) provided a total return of 6.08%, while Service Class shares of the fund provided a total return of 5.79%. These compare with a return of 6.02% for the fund’s benchmark, the JPMorgan Global Government Bond Index (Unhedged).
Market Environment
Fading fears of a near-term global recession, the announcement of a partial trade deal between the United States and China and the decline in uncertainty over Brexit helped bolster market sentiment late in the period. Changes in market sentiment, largely driven by uncertainty over the outcome of trade negotiations between the US and China, had contributed to periodic bouts of volatility during the reporting period. The global economy decelerated, led by weakness in China and Europe, although the pace of the slowdown moderated late in the period amid nascent signs of stabilization in the manufacturing sector.
The deteriorating global growth backdrop, along with declining inflationary pressures, prompted the US Federal Reserve to adopt a more dovish posture beginning in early 2019, resulting in the first interest rate cut in over a decade at the end of July, followed by additional cuts in September and October. The Fed’s actions led to a sharp decline in long-term interest rates during the period’s second half, causing the inversion of portions of the US Treasury yield curve for a time. Amid an improvement in risk sentiment in Q4 2019 and indications of a bottoming in growth and a potential upturn in activity, the Fed indicated in October that further rate cuts were unlikely unless the outlook for the economy materially worsened.
Globally, central banks have tilted more dovish as well, with the European Central Bank unveiling a package of easing measures, which included putting overnight rates deeper into negative territory, restarting its bond-buying program and lengthening the term of cheap loans to banks to three years from two. The central banks of India and Australia are among those that have cut rates several times in recent months, although China has been more cautious in increasing liquidity as it keeps trying to deleverage its economy, cutting rates only marginally.
Emerging markets experienced considerable volatility through the end of 2018, as tighter global financial conditions exposed structural weakness in some countries. Those conditions improved in 2019 as the Fed became more dovish. Notwithstanding the periodic headwinds on market sentiment from significant trade friction between the US and China over much of the year, emerging market hard currency debt and local rates benefited from relatively cheap valuations at the beginning of the period and easier global monetary conditions. These factors, plus the fading of certain global risk factors mentioned above, hastened spread tightening in the latter part of the period. At the same time, idiosyncratic risks spiked in some countries (e.g., Argentina and Lebanon), contributing to increased dispersion in performance among sovereign assets.
Factors Affecting Performance
Relative to the JPMorgan Global Government Bond Index (Unhedged), the fund’s currency exposure was a key detractor from performance, most notably its underweight exposures to both the euro and US dollar, and overweight exposure to the Norwegian krone. An underweight allocation to Italian-issued debt also weakened relative returns.
On the positive side, the fund’s longer relative duration (d) stance to the United States, Australian and New Zealand yield curves (y), where interest rates generally declined, strengthened relative performance. From an asset allocation perspective, the fund’sout-of-benchmark exposure to both Greek and Portuguese-issued bonds benefited relative performance, as both delivered returns that outpaced the benchmark.
Respectfully,
Portfolio Manager(s)
Robert Spector and Erik Weisman
Note to Shareholders: Effective September 1, 2019, Robert Spector was added as a Portfolio Manager of the Fund and Matt Ryan was removed as a Portfolio Manager of the Fund.
| (d) | Duration is a measure of how much a bond’s price is likely to fluctuate with general changes in interest rates, e.g., if rates rise 1.00%, a bond with a5-year duration is likely to lose about 5.00% of its value. |
| (y) | A yield curve graphically depicts the yields of different maturity bonds of the same credit quality and type; a normal yield curve is upward sloping, with short-term rates lower than long-term rates. |
The views expressed in this report are those of the portfolio manager(s) only through the end of the period of the report as stated on the cover and do not necessarily reflect the views of MFS or any other person in the MFS organization. These views are subject to change at any time based on market or other conditions, and MFS disclaims any responsibility to update such views. These views may not be relied upon as investment advice or an indication of trading intent on behalf of any MFS portfolio. References to specific securities are not recommendations of such securities, and may not be representative of any MFS portfolio’s current or future investments.
4
MFS Global Governments Portfolio
PERFORMANCE SUMMARY THROUGH 12/31/19
The following chart illustrates the historical performance of the fund in comparison to its benchmark(s). Benchmarks are unmanaged and may not be invested in directly. Benchmark returns do not reflect any fees or expenses. The performance of other share classes will be greater than or less than that of the class depicted below. (See Notes to Performance Summary.)
Performance data shown represents past performance and is no guarantee of future results. Investment return and principal value fluctuate so your units, when sold, may be worth more or less than the original cost; current performance may be lower or higher than quoted. The performance shown does not reflect the deduction of taxes, if any, that a contract holder would pay on fund distributions or the redemption of contract units. The returns for the fund shown also do not reflect the deduction of expenses associated with variable products, such as mortality and expense risk charges, separate account charges, and sales charges imposed by the insurance company separate accounts. Such expenses would reduce the overall returns shown.
Growth of a Hypothetical $10,000 Investment
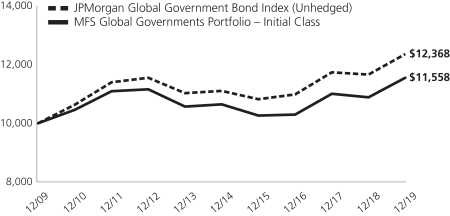
Total Returns through 12/31/19
Average annual total returns
| | | | | | | | | | | | |
| | | Share Class | | Class Inception Date | | 1-yr | | 5-yr | | 10-yr | | |
| | | Initial Class | | 5/16/88 | | 6.08% | | 1.64% | | 1.46% | | |
| | | Service Class | | 8/24/01 | | 5.79% | | 1.38% | | 1.20% | | |
| | | | |
| Comparative benchmark(s) | | | | | | | | |
| | | JPMorgan Global Government Bond Index (Unhedged) (f) | | 6.02% | | 2.16% | | 2.15% | | |
| (f) | Source: FactSet Research Systems Inc. |
Benchmark Definition(s)
JPMorgan Global Government Bond Index (Unhedged) – measures developed government bond markets around the world.
It is not possible to invest directly in an index.
Notes to Performance Summary
Average annual total return represents the average annual change in value for each share class for the periods presented.
Performance results reflect any applicable expense subsidies and waivers in effect during the periods shown. Without such subsidies and waivers the fund’s performance results would be less favorable. Please see the prospectus and financial statements for complete details. All results are historical and assume the reinvestment of any dividends and capital gains distributions.
Performance results do not include adjustments made for financial reporting purposes in accordance with U.S. generally accepted accounting principles and may differ from amounts reported in the financial highlights.
From time to time the fund may receive proceeds from litigation settlements, without which performance would be lower.
5
MFS Global Governments Portfolio
EXPENSE TABLE
Fund Expenses Borne by the Contract Holders during the Period,
July 1, 2019 through December 31, 2019
As a contract holder of the fund, you incur ongoing costs, including management fees; distribution and/or service(12b-1) fees; and other fund expenses. This example is intended to help you understand your ongoing costs (in dollars) of investing in the fund and to compare these costs with the ongoing costs of investing in other mutual funds.
The example is based on an investment of $1,000 invested at the beginning of the period and held for the entire period July 1, 2019 through December 31, 2019.
Actual Expenses
The first line for each share class in the following table provides information about actual account values and actual expenses. You may use the information in this line, together with the amount you invested, to estimate the expenses that you paid over the period. Simply divide your account value by $1,000 (for example, an $8,600 account value divided by $1,000 = 8.6), then multiply the result by the number in the first line under the heading entitled “Expenses Paid During Period” to estimate the expenses you paid on your account during this period.
Hypothetical Example for Comparison Purposes
The second line for each share class in the following table provides information about hypothetical account values and hypothetical expenses based on the fund’s actual expense ratio and an assumed rate of return of 5% per year before expenses, which is not the fund’s actual return. The hypothetical account values and expenses may not be used to estimate the actual ending account balance or expenses you paid for the period. You may use this information to compare the ongoing costs of investing in the fund and other funds. To do so, compare this 5% hypothetical example with the 5% hypothetical examples that appear in the shareholder reports of the other funds.
Please note that the expenses shown in the table are meant to highlight the fund’s ongoing costs only and do not take into account the fees and expenses imposed under the variable contracts through which your investment in the fund is made. Therefore, the second line for each share class in the table is useful in comparing ongoing costs associated with an investment in vehicles (such as the fund) which fund benefits under variable annuity and variable life insurance contracts and to qualified pension and retirement plans only, and will not help you determine the relative total costs of investing in the fund through variable annuity and variable life insurance contracts. If the fees and expenses imposed under the variable contracts were included, your costs would have been higher.
| | | | | | | | | | | | | | | | | | |
| Share Class | | | | Annualized
Expense Ratio | | | Beginning
Account Value
7/01/19 | | | Ending Account Value
12/31/19 | | | Expenses Paid
During Period (p)
7/01/19-12/31/19 | |
| Initial Class | | Actual | | | 0.87% | | | | $1,000.00 | | | | $1,002.61 | | | | $4.39 | |
| | Hypothetical (h) | | | 0.87% | | | | $1,000.00 | | | | $1,020.82 | | | | $4.43 | |
| Service Class | | Actual | | | 1.12% | | | | $1,000.00 | | | | $1,001.61 | | | | $5.65 | |
| | Hypothetical (h) | | | 1.12% | | | | $1,000.00 | | | | $1,019.56 | | | | $5.70 | |
| (h) | 5% class return per year before expenses. |
| (p) | “Expenses Paid During Period” are equal to each class’s annualized expense ratio, as shown above, multiplied by the average account value over the period, multiplied by 184/365 (to reflect theone-half year period). |
6
MFS Global Governments Portfolio
PORTFOLIO OF INVESTMENTS – 12/31/19
The Portfolio of Investments is a complete list of all securities owned by your fund. It is categorized by broad-based asset classes.
| | | | | | | | |
| | |
| Issuer | | Shares/Par | | | Value ($) | |
| BONDS – 93.7% | | | | | |
| Foreign Bonds – 48.1% | | | | | | | | |
| Australia – 2.0% | | | | | | | | |
| Commonwealth of Australia, 2.75%, 6/21/2035 | | AUD | 2,632,000 | | | $ | 2,131,493 | |
| Commonwealth of Australia, 3.25%, 6/21/2039 | | | 350,000 | | | | 304,065 | |
| Commonwealth of Australia, 3%, 3/21/2047 | | | 150,000 | | | | 127,518 | |
| | | | | | | | |
| | | | | | $ | 2,563,076 | |
| | | | | | | | |
| Belgium – 1.0% | | | | | | | | |
| Kingdom of Belgium, 1.25%, 4/22/2033 | | EUR | 520,000 | | | $ | 653,320 | |
| Kingdom of Belgium, 1.6%, 6/22/2047 | | | 495,000 | | | | 657,817 | |
| | | | | | | | |
| | | | | | $ | 1,311,137 | |
| | | | | | | | |
| Canada – 2.9% | | | | | | | | |
| Government of Canada, 2.75%, 6/01/2022 | | CAD | 4,200,000 | | | $ | 3,315,172 | |
| Government of Canada, 5.75%, 6/01/2033 | | | 250,000 | | | | 284,078 | |
| Government of Canada, 5%, 6/01/2037 | | | 125,000 | | | | 142,648 | |
| | | | | | | | |
| | | | | | $ | 3,741,898 | |
| | | | | | | | |
| France – 3.9% | | | | | | | | |
| Republic of France, 0.5%, 5/25/2029 | | EUR | 2,200,000 | | | $ | 2,565,808 | |
| Republic of France, 1.25%, 5/25/2036 | | | 1,150,000 | | | | 1,442,825 | |
| Republic of France, 3.25%, 5/25/2045 | | | 405,000 | | | | 712,002 | |
| Republic of France, 4%, 4/25/2055 | | | 140,000 | | | | 298,999 | |
| Republic of France, 1.75%, 5/25/2066 | | | 65,000 | | | | 90,920 | |
| | | | | | | | |
| | | | | | $ | 5,110,554 | |
| | | | | | | | |
| Germany – 0.3% | | | | | | | | |
| Federal Republic of Germany, 0.5%, 2/15/2028 | | EUR | 354,000 | | | $ | 423,186 | |
| | | | | | | | |
| Greece – 4.8% | | | | | | | | |
| Hellenic Republic (Republic of | | | | | | | | |
| Greece), 3.875%, 3/12/2029 | | EUR | 4,650,000 | | | $ | 6,282,547 | |
| | | | | | | | |
| Italy – 5.2% | | | | | | | | |
| Republic of Italy, 3.5%, 3/01/2030 | | EUR | 1,285,000 | | | $ | 1,726,583 | |
| Republic of Italy, 1.65%, 3/01/2032 | | | 1,430,000 | | | | 1,620,849 | |
| Republic of Italy, 2.45%, 9/01/2033 | | | 750,000 | | | | 915,065 | |
| Republic of Italy, 5%, 9/01/2040 | | | 1,248,000 | | | | 2,034,661 | |
| Republic of Italy, 3.25%, 9/01/2046 | | | 325,000 | | | | 430,399 | |
| | | | | | | | |
| | | | | | $ | 6,727,557 | |
| | | | | | | | |
| Japan – 16.1% | | | | | | | | |
| Government of Japan, 2.9%, 11/20/2030 | | JPY | 970,000,000 | | | $ | 11,722,221 | |
| Government of Japan, 2.4%, 3/20/2037 | | | 367,600,000 | | | | 4,630,363 | |
| Government of Japan, 2.3%, 3/20/2040 | | | 327,000,000 | | | | 4,196,001 | |
| Government of Japan, 1.8%, 3/20/2043 | | | 13,000,000 | | | | 158,809 | |
| Government of Japan, 0.8%, 6/20/2047 | | | 25,000,000 | | | | 254,841 | |
| | | | | | | | |
| | | | | | $ | 20,962,235 | |
| | | | | | | | |
| | | | | | | | |
| | |
| Issuer | | Shares/Par | | | Value ($) | |
| BONDS – continued | | | | | |
| Foreign Bonds – continued | | | | | | | | |
| Mexico – 0.8% | | | | | | | | |
| United Mexican States, 8.5%, 5/31/2029 | | MXN | 17,000,000 | | | $ | 1,000,741 | |
| | | | | | | | |
| Norway – 0.5% | | | | | | | | |
| City of Oslo, 1.6%, 5/05/2022 | | NOK | 6,000,000 | | | $ | 676,862 | |
| | | | | | | | |
| Portugal – 0.3% | | | | | | | | |
| Republic of Portugal, 4.1%, 2/15/2045 | | EUR | 256,000 | | | $ | 454,637 | |
| | | | | | | | |
| Spain – 2.0% | | | | | | | | |
| Kingdom of Spain, 4.7%, 7/30/2041 | | EUR | 395,000 | | | $ | 750,608 | |
| Kingdom of Spain, 5.15%, 10/31/2044 | | | 920,000 | | | | 1,907,387 | |
| | | | | | | | |
| | | | | | $ | 2,657,995 | |
| | | | | | | | |
| Sweden – 0.2% | | | | | | | | |
| Kingdom of Sweden, 0.75%, 11/12/2029 | | SEK | 2,500,000 | | | $ | 282,482 | |
| | | | | | | | |
| United Kingdom – 8.1% | | | | | | | | |
| United Kingdom Treasury, 1.5%, 7/22/2026 | | GBP | 2,000,000 | | | $ | 2,796,898 | |
| United Kingdom Treasury, 6%, 12/07/2028 | | | 1,065,000 | | | | 2,051,337 | |
| United Kingdom Treasury, 0.875%, 10/22/2029 | | | 1,275,000 | | | | 1,695,434 | |
| United Kingdom Treasury, 4.25%, 6/07/2032 | | | 471,000 | | | | 862,214 | |
| United Kingdom Treasury, 4.25%, 3/07/2036 | | | 438,000 | | | | 843,984 | |
| United Kingdom Treasury, 1.75%, 9/07/2037 | | | 300,000 | | | | 429,250 | |
| United Kingdom Treasury, 4.25%, 12/07/2040 | | | 127,000 | | | | 259,334 | |
| United Kingdom Treasury, 3.25%, 1/22/2044 | | | 330,000 | | | | 607,917 | |
| United Kingdom Treasury, 3.75%, 7/22/2052 | | | 239,000 | | | | 522,885 | |
| United Kingdom Treasury, 4%, 1/22/2060 | | | 80,000 | | | | 198,199 | |
| United Kingdom Treasury, 3.5%, 7/22/2068 | | | 100,000 | | | | 241,658 | |
| | | | | | | | |
| | | | | | $ | 10,509,110 | |
| | | | | | | | |
| Total Foreign Bonds | | | | | | $ | 62,704,017 | |
| | | | | | | | |
| U.S. Bonds – 45.6% | | | | | | | | |
| Asset-Backed & Securitized – 0.8% | | | | | |
| Cantor Commercial Real Estate,2019-CF3, “A4”, 3.005%, 1/15/2053 | | $ | 315,000 | | | $ | 322,643 | |
| Citigroup Commercial Mortgage Trust,2019-C7, “A4”, 3.102%, 12/15/2072 | | | 233,275 | | | | 241,005 | |
| Commercial Mortgage Pass-Through Certificates, 2019-BN24, “A3”, 2.96%, 11/15/2062 | | | 170,384 | | | | 174,531 | |
7
MFS Global Governments Portfolio
Portfolio of Investments – continued
| | | | | | | | |
| | |
| Issuer | | Shares/Par | | | Value ($) | |
| BONDS – continued | | | | | |
| U.S. Bonds – continued | | | | | | | | |
| Asset-Backed & Securitized – continued | | | | | |
| Galaxy CLO Ltd.,2018-29A, “A”, FLR, 2.7% (LIBOR - 3mo. + 0.79%), 11/15/2026 (n) | | $ | 231,622 | | | $ | 231,503 | |
| | | | | | | | |
| | | | | | $ | 969,682 | |
| | | | | | | | |
| Consumer Services – 0.1% | | | | | | | | |
| Conservation Fund, 3.474%, 12/15/2029 | | $ | 158,000 | | | $ | 157,291 | |
| | | | | | | | |
| Mortgage-Backed – 0.8% | | | | | | | | |
| Freddie Mac, 3.32%, 2/25/2023 | | $ | 5,000 | | | $ | 5,184 | |
| Freddie Mac, 3.117%, 6/25/2027 | | | 322,320 | | | | 338,807 | |
| Freddie Mac, 3.9%, 4/25/2028 | | | 300,000 | | | | 331,191 | |
| Freddie Mac, 4.06%, 10/25/2028 | | | 340,000 | | | | 379,939 | |
| | | | | | | | |
| | | | | | $ | 1,055,121 | |
| | | | | | | | |
| Municipals – 0.4% | | | | | | | | |
| Chicago, IL, “B”, 7.375%, 1/01/2033 | | $ | 165,000 | | | $ | 197,650 | |
| Michigan Finance Authority Hospital Rev. (Trinity Health Credit Group), 3.384%, 12/01/2040 | | | 285,000 | | | | 284,362 | |
| | | | | | | | |
| | | | | | $ | 482,012 | |
| | | | | | | | |
| U.S. Government Agencies and Equivalents – 0.4% | |
| Small Business Administration, 4.57%, 6/01/2025 | | $ | 3,148 | | | $ | 3,285 | |
| Small Business Administration, 5.09%, 10/01/2025 | | | 2,782 | | | | 2,907 | |
| Small Business Administration, 5.21%, 1/01/2026 | | | 41,561 | | | | 43,564 | |
| Small Business Administration, 2.22%, 3/01/2033 | | | 479,311 | | | | 474,821 | |
| | | | | | | | |
| | | | | | $ | 524,577 | |
| | | | | | | | |
| | | | | | | | |
| | |
| Issuer | | Shares/Par | | | Value ($) | |
| BONDS – continued | | | | | |
| U.S. Bonds – continued | | | | | | | | |
| U.S. Treasury Obligations – 43.1% | | | | | |
| U.S. Treasury Bonds, 1.375%, 8/31/2020 | | $ | 4,000,000 | | | $ | 3,993,202 | |
| U.S. Treasury Bonds, 2.25%, 2/15/2027 | | | 5,211,000 | | | | 5,350,900 | |
| U.S. Treasury Bonds, 4.5%, 8/15/2039 | | | 4,888,400 | | | | 6,626,721 | |
| U.S. Treasury Bonds, 2.75%, 11/15/2042 | | | 2,011,000 | | | | 2,143,514 | |
| U.S. Treasury Bonds, 3.625%, 2/15/2044 | | | 1,500,000 | | | | 1,841,127 | |
| U.S. Treasury Notes, 3.5%, 5/15/2020 | | | 10,355,000 | | | | 10,424,168 | |
| U.S. Treasury Notes, 2.625%, 5/15/2021 | | | 2,000,000 | | | | 2,027,181 | |
| U.S. Treasury Notes, 2.75%, 2/15/2024 | | | 3,790,000 | | | | 3,950,066 | |
| U.S. Treasury Notes, 2.125%, 5/15/2025 | | | 4,270,700 | | | | 4,354,336 | |
| U.S. Treasury Notes, 1.5%, 8/15/2026 | | | 6,720,000 | | | | 6,582,190 | |
| U.S. Treasury Notes, 2.875%, 5/15/2028 | | | 8,302,300 | | | | 8,930,392 | |
| | | | | | | | |
| | | | | | $ | 56,223,797 | |
| | | | | | | | |
| Total U.S. Bonds | | | | | | $ | 59,412,480 | |
| | | | | | | | |
Total Bonds
(Identified Cost, $117,447,756) | | | | | | $ | 122,116,497 | |
| | | | | | | | |
| |
| INVESTMENT COMPANIES (h) – 3.8% | | | | | |
| Money Market Funds – 3.8% | | | | | |
MFS Institutional Money Market Portfolio, 1.7% (v)
(Identified Cost, $4,935,688) | | | 4,936,006 | | | $ | 4,936,006 | |
| | | | | | | | |
OTHER ASSETS, LESS
LIABILITIES – 2.5% | | | | | | | 3,317,857 | |
| | | | | | | | |
| NET ASSETS – 100.0% | | | | | | $ | 130,370,360 | |
| | | | | | | | |
| (h) | | An affiliated issuer, which may be considered one in which the fund owns 5% or more of the outstanding voting securities, or a company which is under common control. At period end, the aggregate values of the fund’s investments in affiliated issuers and in unaffiliated issuers were $4,936,006 and $122,116,497, respectively. |
| (n) | | Securities exempt from registration under Rule 144A of the Securities Act of 1933. These securities may be sold in the ordinary course of business in transactions exempt from registration, normally to qualified institutional buyers. At period end, the aggregate value of these securities was $231,503, representing 0.2% of net assets. |
| (v) | | Affiliated issuer that is available only to investment companies managed by MFS. The rate quoted for the MFS Institutional Money Market Portfolio is the annualizedseven-day yield of the fund at period end. |
The following abbreviations are used in this report and are defined:
| CLO | | Collateralized Loan Obligation |
| FLR | | Floating Rate. Interest rate resets periodically based on the parenthetically disclosed reference rate plus a spread (if any). Theperiod-end rate reported may not be the current rate. All reference rates are USD unless otherwise noted. |
| LIBOR | | London Interbank Offered Rate |
Abbreviations indicate amounts shown in currencies other than the U.S. dollar. All amounts are stated in U.S. dollars unless otherwise indicated. A list of abbreviations is shown below:
8
MFS Global Governments Portfolio
Portfolio of Investments – continued
Derivative Contracts at 12/31/19
Forward Foreign Currency Exchange Contracts
| | | | | | | | | | | | | | | | | | | | | | | | |
Currency Purchased | | | Currency Sold | | Counterparty | | Settlement Date | | | Unrealized
Appreciation
(Depreciation) | |
| Asset Derivatives | | | | | | | | | | | | | | | | | | | | | |
| AUD | | | 471,000 | | | | | | | | USD | | | 325,501 | | Merrill Lynch International | | | 2/28/2020 | | | | $5,481 | |
| AUD | | | 1,050,000 | | | | | | | | USD | | | 729,728 | | Morgan Stanley Capital Services, Inc. | | | 2/28/2020 | | | | 8,130 | |
| AUD | | | 448,000 | | | | | | | | USD | | | 314,035 | | State Street Bank Corp. | | | 2/28/2020 | | | | 784 | |
| BRL | | | 2,676,000 | | | | | | | | USD | | | 657,155 | | JPMorgan Chase Bank N.A. | | | 2/04/2020 | | | | 7,460 | |
| CAD | | | 426,000 | | | | | | | | USD | | | 326,229 | | Brown Brothers Harriman | | | 2/28/2020 | | | | 1,901 | |
| CAD | | | 452,000 | | | | | | | | USD | | | 344,991 | | Morgan Stanley Capital Services, Inc. | | | 2/28/2020 | | | | 3,165 | |
| CAD | | | 1,879,071 | | | | | | | | USD | | | 1,432,615 | | UBS AG | | | 2/28/2020 | | | | 14,752 | |
| CLP | | | 497,965,000 | | | | | | | | USD | | | 655,951 | | JPMorgan Chase Bank N.A. | | | 1/21/2020 | | | | 6,454 | |
| DKK | | | 3,420,236 | | | | | | | | USD | | | 510,861 | | Merrill Lynch International | | | 2/28/2020 | | | | 4,528 | |
| EUR | | | 12,559,455 | | | | | | | | USD | | | 14,000,213 | | BNP Paribas S.A. | | | 2/28/2020 | | | | 136,937 | |
| EUR | | | 214,005 | | | | | | | | USD | | | 237,945 | | UBS AG | | | 2/28/2020 | | | | 2,942 | |
| JPY | | | 22,125,353 | | | | | | | | USD | | | 202,827 | | Barclays Bank PLC | | | 2/28/2020 | | | | 1,384 | |
| NZD | | | 2,994,330 | | | | | | | | USD | | | 1,964,580 | | Citibank N.A. | | | 2/28/2020 | | | | 52,760 | |
| SEK | | | 149,507 | | | | | | | | USD | | | 15,811 | | Deutsche Bank AG | | | 2/28/2020 | | | | 195 | |
| USD | | | 2,583,736 | | | | | | | | JPY | | | 280,000,000 | | State Street Bank Corp. | | | 1/06/2020 | | | | 6,773 | |
| | | | | | | | | | | | | | | | | | | | | | | | |
| | | | | | | | | | | | | | | | | | | | | | | $253,646 | |
| | | | | | | | | | | | | | | | | | | | | | | | |
| Liability Derivatives | | | | | | | | | | | | | |
| CAD | | | 426,000 | | | | | | | | USD | | | 328,684 | | State Street Bank Corp. | | | 2/28/2020 | | | | $(555 | ) |
| GBP | | | 329,000 | | | | | | | | USD | | | 439,814 | | Morgan Stanley Capital Services, Inc. | | | 2/28/2020 | | | | (3,343 | ) |
| JPY | | | 700,966,675 | | | | | | | | USD | | | 6,481,730 | | Deutsche Bank AG | | | 2/28/2020 | | | | (12,019 | ) |
| USD | | | 601,903 | | | | | | | | AUD | | | 872,000 | | Citibank N.A. | | | 2/28/2020 | | | | (10,871 | ) |
| USD | | | 1,317,405 | | | | | | | | AUD | | | 1,926,834 | | Merrill Lynch International | | | 2/28/2020 | | | | (36,624 | ) |
| USD | | | 4,708,402 | | | | | | | | CAD | | | 6,229,169 | | JPMorgan Chase Bank N.A. | | | 2/28/2020 | | | | (89,657 | ) |
| USD | | | 5,110 | | | | | | | | CHF | | | 5,000 | | Deutsche Bank AG | | | 2/28/2020 | | | | (76 | ) |
| USD | | | 749,757 | | | | | | | | EUR | | | 676,811 | | Deutsche Bank AG | | | 2/18/2020 | | | | (11,598 | ) |
| USD | | | 1,520,884 | | | | | | | | EUR | | | 1,357,697 | | Deutsche Bank AG | | | 2/28/2020 | | | | (7,364 | ) |
| USD | | | 149,778 | | | | | | | | EUR | | | 134,000 | | Morgan Stanley Capital Services, Inc. | | | 2/28/2020 | | | | (1,055 | ) |
| USD | | | 700,538 | | | | | | | | GBP | | | 534,236 | | Deutsche Bank AG | | | 2/28/2020 | | | | (8,211 | ) |
| USD | | | 1,466,127 | | | | | | | | GBP | | | 1,108,632 | | Merrill Lynch International | | | 2/28/2020 | | | | (4,649 | ) |
| USD | | | 652,853 | | | | | | | | JPY | | | 71,227,000 | | Barclays Bank PLC | | | 2/28/2020 | | | | (4,551 | ) |
| USD | | | 623,796 | | | | | | | | JPY | | | 68,106,000 | | Morgan Stanley Capital Services, Inc. | | | 2/28/2020 | | | | (4,802 | ) |
| USD | | | 635,229 | | | | | | | | NOK | | | 5,810,937 | | Merrill Lynch International | | | 2/28/2020 | | | | (26,794 | ) |
| | | | | | | | | | | | | | | | | | | | | | | | |
| | | | | | | | | | | | | | | | | | | | | | | $(222,169 | ) |
| | | | | | | | | | | | | | | | | | | | | | | | |
See Notes to Financial Statements
9
MFS Global Governments Portfolio
FINANCIAL STATEMENTS | STATEMENT OF ASSETS AND LIABILITIES
This statement represents your fund’s balance sheet, which details the assets and liabilities comprising the total value of the fund.
| | | | |
At 12/31/19 | | | | |
| |
Assets | | | | |
Investments in unaffiliated issuers, at value (identified cost, $117,447,756) | | | $122,116,497 | |
Investments in affiliated issuers, at value (identified cost, $4,935,688) | | | 4,936,006 | |
Foreign currency, at value (identified cost, $2,553,036) | | | 2,553,914 | |
Receivables for | | | | |
Forward foreign currency exchange contracts | | | 253,646 | |
Interest | | | 809,572 | |
Other assets | | | 1,052 | |
Total assets | | | $130,670,687 | |
| |
Liabilities | | | | |
Payables for | | | | |
Forward foreign currency exchange contracts | | | $222,169 | |
Fund shares reacquired | | | 3,939 | |
Payable to affiliates | | | | |
Investment adviser | | | 5,283 | |
Administrative services fee | | | 150 | |
Shareholder servicing costs | | | 4 | |
Distribution and/or service fees | | | 11 | |
Payable for independent Trustees’ compensation | | | 31 | |
Accrued expenses and other liabilities | | | 68,740 | |
Total liabilities | | | $300,327 | |
Net assets | | | $130,370,360 | |
| |
Net assets consist of | | | | |
Paid-in capital | | | $129,419,132 | |
Total distributable earnings (loss) | | | 951,228 | |
Net assets | | | $130,370,360 | |
Shares of beneficial interest outstanding | | | 12,171,852 | |
| | | | | | | | | | | | |
| | | |
| | | Net assets | | | Shares
outstanding | | | Net asset value
per share | |
Initial Class | | | $129,564,703 | | | | 12,095,144 | | | | $10.71 | |
Service Class | | | 805,657 | | | | 76,708 | | | | 10.50 | |
See Notes to Financial Statements
10
MFS Global Governments Portfolio
FINANCIAL STATEMENTS | STATEMENT OF OPERATIONS
This statement describes how much your fund earned in investment income and accrued in expenses. It also describes any gains and/or losses generated by fund operations.
| | | | |
Year ended 12/31/19 | | | | |
| |
Net investment income (loss) | | | | |
Income | | | | |
Interest | | | $2,237,934 | |
Dividends from affiliated issuers | | | 261,988 | |
Other | | | 34 | |
Foreign taxes withheld | | | (209 | ) |
Total investment income | | | $2,499,747 | |
Expenses | | | | |
Management fee | | | $997,644 | |
Distribution and/or service fees | | | 1,990 | |
Shareholder servicing costs | | | 1,141 | |
Administrative services fee | | | 28,660 | |
Independent Trustees’ compensation | | | 5,109 | |
Custodian fee | | | 23,058 | |
Shareholder communications | | | 4,596 | |
Audit and tax fees | | | 76,297 | |
Legal fees | | | 1,151 | |
Miscellaneous | | | 33,277 | |
Total expenses | | | $1,172,923 | |
Reduction of expenses by investment adviser | | | (12,977 | ) |
Net expenses | | | $1,159,946 | |
Net investment income (loss) | | | $1,339,801 | |
| |
Realized and unrealized gain (loss) | | | | |
Realized gain (loss) (identified cost basis) | | | | |
Unaffiliated issuers | | | $5,079,417 | |
Affiliated issuers | | | 330 | |
Forward foreign currency exchange contracts | | | (1,086,553 | ) |
Foreign currency | | | (793 | ) |
Net realized gain (loss) | | | $3,992,401 | |
Change in unrealized appreciation or depreciation | | | | |
Unaffiliated issuers | | | $2,717,039 | |
Affiliated issuers | | | 392 | |
Forward foreign currency exchange contracts | | | (22,458 | ) |
Translation of assets and liabilities in foreign currencies | | | 9,132 | |
Net unrealized gain (loss) | | | $2,704,105 | |
Net realized and unrealized gain (loss) | | | $6,696,506 | |
Change in net assets from operations | | | $8,036,307 | |
See Notes to Financial Statements
11
MFS Global Governments Portfolio
FINANCIAL STATEMENTS | STATEMENTS OF CHANGES IN NET ASSETS
These statements describe the increases and/or decreases in net assets resulting from operations, any distributions, and any shareholder transactions.
| | | | | | | | |
| | | Year ended | |
| | | 12/31/19 | | | 12/31/18 | |
Change in net assets | | | | | | | | |
| | |
From operations | | | | | | | | |
Net investment income (loss) | | | $1,339,801 | | | | $1,553,877 | |
Net realized gain (loss) | | | 3,992,401 | | | | 814,334 | |
Net unrealized gain (loss) | | | 2,704,105 | | | | (4,051,125 | ) |
Change in net assets from operations | | | $8,036,307 | | | | $(1,682,914 | ) |
Total distributions to shareholders | | | $(3,199,101 | ) | | | $(1,441,037 | ) |
Change in net assets from fund share transactions | | | $(10,300,438 | ) | | | $(21,728,577 | ) |
Total change in net assets | | | $(5,463,232 | ) | | | $(24,852,528 | ) |
| | |
Net assets | | | | | | | | |
| At beginning of period | | | 135,833,592 | | | | 160,686,120 | |
At end of period | | | $130,370,360 | | | | $135,833,592 | |
See Notes to Financial Statements
12
MFS Global Governments Portfolio
FINANCIAL STATEMENTS | FINANCIAL HIGHLIGHTS
The financial highlights table is intended to help you understand the fund’s financial performance for the past 5 years. Certain information reflects financial results for a single fund share. The total returns in the table represent the rate that an investor would have earned (or lost) on an investment in the fund share class (assuming reinvestment of all distributions) held for the entire period.
| | | | | | | | | | | | | | | | | | | | |
| Initial Class | | Year ended | |
| | | | | |
| | | 12/31/19 | | | 12/31/18 | | | 12/31/17 | | | 12/31/16 | | | 12/31/15 | |
| | | | | |
Net asset value, beginning of period | | | $10.34 | | | | $10.56 | | | | $9.87 | | | | $9.84 | | | | $10.47 | |
| | | | | |
| Income (loss) from investment operations | | | | | | | | | | | | | | | | | | | | |
Net investment income (loss) (d) | | | $0.11 | | | | $0.11 | | | | $0.08 | | | | $0.07 | (c) | | | $0.09 | |
Net realized and unrealized gain (loss) | | | 0.53 | | | | (0.23 | ) | | | 0.61 | | | | (0.04 | )(g) | | | (0.47 | ) |
Total from investment operations | | | $0.64 | | | | $(0.12 | ) | | | $0.69 | | | | $0.03 | | | | $(0.38 | ) |
| | | | | |
| Less distributions declared to shareholders | | | | | | | | | | | | | | | | | | | | |
From net investment income | | | $(0.27 | ) | | | $(0.10 | ) | | | $— | | | | $— | | | | $(0.25 | ) |
Net asset value, end of period (x) | | | $10.71 | | | | $10.34 | | | | $10.56 | | | | $9.87 | | | | $9.84 | |
Total return (%) (k)(r)(s)(x) | | | 6.08 | | | | (1.11 | ) | | | 6.99 | | | | 0.30 | (c) | | | (3.66 | ) |
| | | | | |
Ratios (%) (to average net assets)
and Supplemental data: | | | | | | | | | | | | | | | | | | | | |
Expenses before expense reductions (f) | | | 0.88 | | | | 0.87 | | | | 0.86 | | | | 0.83 | (c) | | | 0.85 | |
Expenses after expense reductions (f) | | | 0.87 | | | | 0.86 | | | | 0.85 | | | | 0.82 | (c) | | | 0.84 | |
Net investment income (loss) | | | 1.01 | | | | 1.05 | | | | 0.77 | | | | 0.66 | (c) | | | 0.92 | |
Portfolio turnover | | | 107 | | | | 79 | | | | 67 | | | | 75 | | | | 94 | |
Net assets at end of period (000 omitted) | | | $129,565 | | | | $135,008 | | | | $159,652 | | | | $162,211 | | | | $182,978 | |
| |
| Service Class | | Year ended | |
| | | | | |
| | | 12/31/19 | | | 12/31/18 | | | 12/31/17 | | | 12/31/16 | | | 12/31/15 | |
| | | | | |
Net asset value, beginning of period | | | $10.14 | | | | $10.34 | | | | $9.69 | | | | $9.69 | | | | $10.31 | |
| | | | | |
| Income (loss) from investment operations | | | | | | | | | | | | | | | | | | | | |
Net investment income (loss) (d) | | | $0.08 | | | | $0.08 | | | | $0.05 | | | | $0.04 | (c) | | | $0.07 | |
Net realized and unrealized gain (loss) | | | 0.51 | | | | (0.22 | ) | | | 0.60 | | | | (0.04 | )(g) | | | (0.46 | ) |
Total from investment operations | | | $0.59 | | | | $(0.14 | ) | | | $0.65 | | | | $0.00 | (w) | | | $(0.39 | ) |
| | | | | |
| Less distributions declared to shareholders | | | | | | | | | | | | | | | | | | | | |
From net investment income | | | $(0.23 | ) | | | $(0.06 | ) | | | $— | | | | $— | | | | $(0.23 | ) |
Net asset value, end of period (x) | | | $10.50 | | | | $10.14 | | | | $10.34 | | | | $9.69 | | | | $9.69 | |
Total return (%) (k)(r)(s)(x) | | | 5.79 | | | | (1.32 | ) | | | 6.71 | | | | 0.00 | (c)(w) | | | (3.86 | ) |
| | | | | |
Ratios (%) (to average net assets)
and Supplemental data: | | | | | | | | | | | | | | | | | | | | |
Expenses before expense reductions (f) | | | 1.13 | | | | 1.12 | | | | 1.11 | | | | 1.08 | (c) | | | 1.10 | |
Expenses after expense reductions (f) | | | 1.12 | | | | 1.11 | | | | 1.10 | | | | 1.07 | (c) | | | 1.09 | |
Net investment income (loss) | | | 0.76 | | | | 0.80 | | | | 0.52 | | | | 0.41 | (c) | | | 0.67 | |
Portfolio turnover | | | 107 | | | | 79 | | | | 67 | | | | 75 | | | | 94 | |
Net assets at end of period (000 omitted) | | | $806 | | | | $826 | | | | $1,034 | | | | $1,572 | | | | $1,586 | |
See Notes to Financial Statements
13
MFS Global Governments Portfolio
Financial Highlights – continued
| (c) | | Amount reflects aone-time reimbursement of expenses by the custodian (or former custodian) without which net investment income and performance would be lower and expenses would be higher. |
| (d) | | Per share data is based on average shares outstanding. |
| (f) | | Ratios do not reflect reductions from fees paid indirectly, if applicable. |
| (g) | | The per share amount varies from the net realized and unrealized gain/loss for the period because of the timing of sales of fund shares and the per share amount of realized and unrealized gains and losses at such time. |
| (k) | | The total return does not reflect expenses that apply to separate accounts. Inclusion of these charges would reduce the total return figures for all periods shown. |
| (r) | | Certain expenses have been reduced without which performance would have been lower. |
| (s) | | From time to time the fund may receive proceeds from litigation settlements, without which performance would be lower. |
| (w) | | Per share amount was less than $0.01 and total return or ratio was less than 0.01%, as applicable. |
| (x) | | The net asset values and total returns have been calculated on net assets which include adjustments made in accordance with U.S. generally accepted accounting principles required at period end for financial reporting purposes. |
See Notes to Financial Statements
14
MFS Global Governments Portfolio
NOTES TO FINANCIAL STATEMENTS
| (1) | | Business and Organization |
MFS Global Governments Portfolio (the fund) is anon-diversified series of MFS Variable Insurance Trust II (the trust). The trust is organized as a Massachusetts business trust and is registered under the Investment Company Act of 1940, as amended, as anopen-end management investment company. The shareholders of each series of the trust are separate accounts of insurance companies, which offer variable annuity and/or life insurance products, and qualified retirement and pension plans.
The fund is an investment company and accordingly follows the investment company accounting and reporting guidance of the Financial Accounting Standards Board (FASB) Accounting Standards Codification Topic 946 Financial Services – Investment Companies.
| (2) | | Significant Accounting Policies |
General– The preparation of financial statements in conformity with U.S. generally accepted accounting principles requires management to make estimates and assumptions that affect the reported amounts of assets and liabilities, and disclosure of contingent assets and liabilities at the date of the financial statements and the reported amounts of increases and decreases in net assets from operations during the reporting period. Actual results could differ from those estimates. In the preparation of these financial statements, management has evaluated subsequent events occurring after the date of the fund’s Statement of Assets and Liabilities through the date that the financial statements were issued. The fund invests in foreign securities. Investments in foreign securities are vulnerable to the effects of changes in the relative values of the local currency and the U.S. dollar and to the effects of changes in each country’s market, economic, industrial, political, regulatory, geopolitical, and other conditions.
Balance Sheet Offsetting– The fund’s accounting policy with respect to balance sheet offsetting is that, absent an event of default by the counterparty or a termination of the agreement, the International Swaps and Derivatives Association (ISDA) Master Agreement, or similar agreement, does not result in an offset of reported amounts of financial assets and financial liabilities in the Statement of Assets and Liabilities across transactions between the fund and the applicable counterparty. The fund’s right to setoff may be restricted or prohibited by the bankruptcy or insolvency laws of the particular jurisdiction to which a specific master netting agreement counterparty is subject. Balance sheet offsetting disclosures, to the extent applicable to the fund, have been included in the fund’s Significant Accounting Policies note under the captions for each of the fund’sin-scope financial instruments and transactions.
Investment Valuations– Debt instruments and floating rate loans, including restricted debt instruments, are generally valued at an evaluated or composite bid as provided by a third-party pricing service. Short-term instruments with a maturity at issuance of 60 days or less may be valued at amortized cost, which approximates market value. Forward foreign currency exchange contracts are generally valued at the mean of bid and asked prices for the time period interpolated from rates provided by a third-party pricing service for proximate time periods.Open-end investment companies are generally valued at net asset value per share. Securities and other assets generally valued on the basis of information from a third-party pricing service may also be valued at a broker/dealer bid quotation. In determining values, third-party pricing services can utilize both transaction data and market information such as yield, quality, coupon rate, maturity, type of issue, trading characteristics, and other market data. The values of foreign securities and other assets and liabilities expressed in foreign currencies are converted to U.S. dollars using the mean of bid and asked prices for rates provided by a third-party pricing service.
The Board of Trustees has delegated primary responsibility for determining or causing to be determined the value of the fund’s investments (including any fair valuation) to the adviser pursuant to valuation policies and procedures approved by the Board. If the adviser determines that reliable market quotations are not readily available, investments are valued at fair value as determined in good faith by the adviser in accordance with such procedures under the oversight of the Board of Trustees. Under the fund’s valuation policies and procedures, market quotations are not considered to be readily available for most types of debt instruments and floating rate loans and many types of derivatives. These investments are generally valued at fair value based on information from third-party pricing services. In addition, investments may be valued at fair value if the adviser determines that an investment’s value has been materially affected by events occurring after the close of the exchange or market on which the investment is principally traded (such as foreign exchange or market) and prior to the determination of the fund’s net asset value, or after the halt of trading of a specific security where trading does not resume prior to the close of the exchange or market on which the security is principally traded. The adviser generally relies on third-party pricing services or other information (such as the correlation with price movements of similar securities in the same or other markets; the type, cost and investment characteristics of the security; the business and financial condition of the issuer; and trading and other market data) to assist in determining whether to fair value and at what value to fair value an investment. The value of an investment for purposes of calculating the fund’s net asset value can differ depending on the source and method used to determine value. When fair valuation is used, the value of an investment used to determine the fund’s net asset value may differ from quoted or published prices for the same investment. There can be no assurance that the fund could obtain the fair value assigned to an investment if it were to sell the investment at the same time at which the fund determines its net asset value per share.
15
MFS Global Governments Portfolio
Notes to Financial Statements – continued
Various inputs are used in determining the value of the fund’s assets or liabilities. These inputs are categorized into three broad levels. In certain cases, the inputs used to measure fair value may fall into different levels of the fair value hierarchy. In such cases, an investment’s level within the fair value hierarchy is based on the lowest level of input that is significant to the fair value measurement. The fund’s assessment of the significance of a particular input to the fair value measurement in its entirety requires judgment, and considers factors specific to the investment. Level 1 includes unadjusted quoted prices in active markets for identical assets or liabilities. Level 2 includes other significant observable market-based inputs (including quoted prices for similar securities, interest rates, prepayment speed, and credit risk). Level 3 includes unobservable inputs, which may include the adviser’s own assumptions in determining the fair value of investments. Other financial instruments are derivative instruments, such as forward foreign currency exchange contracts. The following is a summary of the levels used as of December 31, 2019 in valuing the fund’s assets or liabilities:
| | | | | | | | | | | | | | | | |
| Financial Instruments | | Level 1 | | | Level 2 | | | Level 3 | | | Total | |
| U.S. Treasury Bonds & U.S. Government Agencies & Equivalents | | | $— | | | | $56,748,374 | | | | $— | | | | $56,748,374 | |
| Non-U.S. Sovereign Debt | | | — | | | | 62,027,155 | | | | — | | | | 62,027,155 | |
| Municipal Bonds | | | — | | | | 482,012 | | | | — | | | | 482,012 | |
| U.S. Corporate Bonds | | | — | | | | 157,291 | | | | — | | | | 157,291 | |
| Residential Mortgage-Backed Securities | | | — | | | | 1,055,121 | | | | — | | | | 1,055,121 | |
| Commercial Mortgage-Backed Securities | | | — | | | | 738,179 | | | | — | | | | 738,179 | |
| Asset-Backed Securities (including CDOs) | | | — | | | | 231,503 | | | | — | | | | 231,503 | |
| Foreign Bonds | | | — | | | | 676,862 | | | | — | | | | 676,862 | |
| Mutual Funds | | | 4,936,006 | | | | — | | | | — | | | | 4,936,006 | |
| Total | | | $4,936,006 | | | | $122,116,497 | | | | $— | | | | $127,052,503 | |
| | | | |
| Other Financial Instruments | | | | | | | | | | | | |
| Forward Foreign Currency Exchange Contracts – Assets | | | $— | | | | $253,646 | | | | $— | | | | $253,646 | |
| Forward Foreign Currency Exchange Contracts – Liabilities | | | — | | | | (222,169 | ) | | | — | | | | (222,169 | ) |
For further information regarding security characteristics, see the Portfolio of Investments.
Foreign Currency Translation– Purchases and sales of foreign investments, income, and expenses are converted into U.S. dollars based upon currency exchange rates prevailing on the respective dates of such transactions or on the reporting date for foreign denominated receivables and payables. Gains and losses attributable to foreign currency exchange rates on sales of securities are recorded for financial statement purposes as net realized gains and losses on investments. Gains and losses attributable to foreign exchange rate movements on receivables, payables, income and expenses are recorded for financial statement purposes as foreign currency transaction gains and losses. That portion of both realized and unrealized gains and losses on investments that results from fluctuations in foreign currency exchange rates is not separately disclosed.
Derivatives– The fund uses derivatives primarily to increase or decrease exposure to a particular market or segment of the market, or security, to increase or decrease interest rate or currency exposure, or as alternatives to direct investments. Derivatives are used for hedging ornon-hedging purposes. While hedging can reduce or eliminate losses, it can also reduce or eliminate gains. When the fund uses derivatives as an investment to increase market exposure, or for hedging purposes, gains and losses from derivative instruments may be substantially greater than the derivative’s original cost.
The derivative instruments used by the fund during the period were forward foreign currency exchange contracts. Depending on the type of derivative, the fund may exit a derivative position by entering into an offsetting transaction with a counterparty or exchange, negotiating an agreement with the derivative counterparty, or novating the position to a third party. The fund’s period end derivatives, as presented in the Portfolio of Investments and the associated Derivative Contract tables, generally are indicative of the volume of its derivative activity during the period.
The following table presents, by major type of derivative contract, the fair value, on a gross basis, of the asset and liability components of derivatives held by the fund at December 31, 2019 as reported in the Statement of Assets and Liabilities:
| | | | | | | | | | |
| | | | | Fair Value | |
| Risk | | Derivative Contracts | | Asset Derivatives | | | Liability Derivatives | |
| Foreign Exchange | | Forward Foreign Currency Exchange Contracts | | | $253,646 | | | | $(222,169 | ) |
The following table presents, by major type of derivative contract, the realized gain (loss) on derivatives held by the fund for the year ended December 31, 2019 as reported in the Statement of Operations:
| | | | |
| Risk | | Forward Foreign
Currency
Exchange
Contracts | |
| Foreign Exchange | | | $(1,086,553 | ) |
16
MFS Global Governments Portfolio
Notes to Financial Statements – continued
The following table presents, by major type of derivative contract, the change in unrealized appreciation or depreciation on derivatives held by the fund for the year ended December 31, 2019 as reported in the Statement of Operations:
| | | | |
| Risk | | Forward Foreign
Currency
Exchange
Contracts | |
| Foreign Exchange | | | $(22,458 | ) |
Derivative counterparty credit risk is managed through formal evaluation of the creditworthiness of all potential counterparties. On certain, but not all, uncleared derivatives, the fund attempts to reduce its exposure to counterparty credit risk whenever possible by entering into an ISDA Master Agreement on a bilateral basis. The ISDA Master Agreement gives each party to the agreement the right to terminate all transactions traded under such agreement if there is a specified deterioration in the credit quality of the other party. Upon an event of default or a termination of the ISDA Master Agreement, thenon-defaulting party has the right to close out all transactions traded under such agreement and to net amounts owed under each agreement to one net amount payable by one party to the other. This right to close out and net payments across all transactions traded under the ISDA Master Agreement could result in a reduction of the fund’s credit risk to such counterparty equal to any amounts payable by the fund under the applicable transactions, if any.
Collateral and margin requirements differ by type of derivative. For cleared derivatives (e.g., futures contracts, cleared swaps, and exchange-traded options), margin requirements are set by the clearing broker and the clearing house and collateral, in the form of cash or securities, is posted by the fund directly with the clearing broker. Collateral terms are counterparty agreement specific for uncleared derivatives (e.g., forward foreign currency exchange contracts, uncleared swap agreements, and uncleared options) and collateral, in the form of cash and securities, is held in segregated accounts with the fund’s custodian in connection with these agreements. For derivatives traded under an ISDA Master Agreement, which contains a collateral support annex, the collateral requirements are netted across all transactions traded under such counterparty-specific agreement and an amount is posted from one party to the other to collateralize such obligations. Cash that has been segregated or delivered to cover the fund’s collateral or margin obligations under derivative contracts, if any, will be reported separately in the Statement of Assets and Liabilities as restricted cash for uncleared derivatives and/or deposits with brokers for cleared derivatives. Securities pledged as collateral or margin for the same purpose, if any, are noted in the Portfolio of Investments. The fund may be required to make payments of interest on uncovered collateral or margin obligations with the broker. Any such payments are included in “Miscellaneous” expense in the Statement of Operations.
Forward Foreign Currency Exchange Contracts– The fund entered into forward foreign currency exchange contracts for the purchase or sale of a specific foreign currency at a fixed price on a future date. These contracts may be used to hedge the fund’s currency risk or fornon-hedging purposes. For hedging purposes, the fund may enter into contracts to deliver or receive foreign currency that the fund will receive from or use in its normal investment activities. The fund may also use contracts to hedge against declines in the value of foreign currency denominated securities due to unfavorable exchange rate movements. Fornon-hedging purposes, the fund may enter into contracts with the intent of changing the relative exposure of the fund’s portfolio of securities to different currencies to take advantage of anticipated exchange rate changes.
Forward foreign currency exchange contracts are adjusted by the daily exchange rate of the underlying currency and any unrealized gains or losses are recorded as a receivable or payable for forward foreign currency exchange contracts until the contract settlement date. On contract settlement date, any gain or loss on the contract is recorded as realized gains or losses on forward foreign currency exchange contracts.
Risks may arise upon entering into these contracts from unanticipated movements in the value of the contract and from the potential inability of counterparties to meet the terms of their contracts. Generally, the fund’s maximum risk due to counterparty credit risk is the unrealized gain on the contract due to the use of Continuous Linked Settlement, a multicurrency cash settlement system for the centralized settlement of foreign transactions. This risk is mitigated in cases where there is an ISDA Master Agreement between the fund and the counterparty providing for netting as described above and, where applicable, by the posting of collateral by the counterparty to the fund to cover the fund’s exposure to the counterparty under such ISDA Master Agreement.
Indemnifications– Under the fund’s organizational documents, its officers and Trustees may be indemnified against certain liabilities and expenses arising out of the performance of their duties to the fund. Additionally, in the normal course of business, the fund enters into agreements with service providers that may contain indemnification clauses. The fund’s maximum exposure under these agreements is unknown as this would involve future claims that may be made against the fund that have not yet occurred.
Investment Transactions and Income– Investment transactions are recorded on the trade date. Interest income is recorded on the accrual basis. All premium and discount is amortized or accreted for financial statement purposes in accordance with U.S. generally accepted accounting principles. Interest payments received in additional securities are recorded on theex-interest date in an amount equal to the value of the security on such date.
17
MFS Global Governments Portfolio
Notes to Financial Statements – continued
The fund may receive proceeds from litigation settlements. Any proceeds received from litigation involving portfolio holdings are reflected in the Statement of Operations in realized gain/loss if the security has been disposed of by the fund or in unrealized gain/loss if the security is still held by the fund. Any other proceeds from litigation not related to portfolio holdings are reflected as other income in the Statement of Operations.
Tax Matters and Distributions– The fund intends to qualify as a regulated investment company, as defined under Subchapter M of the Internal Revenue Code, and to distribute all of its taxable income, including realized capital gains. As a result, no provision for federal income tax is required. The fund’s federal tax returns, when filed, will remain subject to examination by the Internal Revenue Service for a three year period. Management has analyzed the fund’s tax positions taken on federal and state tax returns for all open tax years and does not believe that there are any uncertain tax positions that require recognition of a tax liability. Foreign taxes, if any, have been accrued by the fund in the accompanying financial statements in accordance with the applicable foreign tax law. Foreign income taxes may be withheld by certain countries in which the fund invests. Additionally, capital gains realized by the fund on securities issued in or by certain foreign countries may be subject to capital gains tax imposed by those countries.
Distributions to shareholders are recorded on theex-dividend date. Income and capital gain distributions are determined in accordance with income tax regulations, which may differ from U.S. generally accepted accounting principles. Certain capital accounts in the financial statements are periodically adjusted for permanent differences in order to reflect their tax character. These adjustments have no impact on net assets or net asset value per share. Temporary differences which arise from recognizing certain items of income, expense, gain or loss in different periods for financial statement and tax purposes will reverse at some time in the future.
Book/tax differences primarily relate to amortization and accretion of debt securities, wash sale loss deferrals, and straddle loss deferrals.
The tax character of distributions declared to shareholders for the last two fiscal years is as follows:
| | | | | | | | |
| | | Year ended
12/31/19 | | | Year ended
12/31/18 | |
| Ordinary income (including any short-term capital gains) | | | $3,199,101 | | | | $1,441,037 | |
The federal tax cost and the tax basis components of distributable earnings were as follows:
| | | | |
| As of 12/31/19 | | | | |
| |
| Cost of investments | | | $124,167,944 | |
| Gross appreciation | | | 4,059,724 | |
| Gross depreciation | | | (1,143,688 | ) |
| Net unrealized appreciation (depreciation) | | | $2,916,036 | |
| |
| Undistributed ordinary income | | | 1,658,736 | |
| Capital loss carryforwards | | | (3,629,961 | ) |
| Other temporary differences | | | 6,417 | |
As of December 31, 2019, the fund had capital loss carryforwards available to offset future realized gains. These net capital losses may be carried forward indefinitely and their character is retained as short-term and/or long-term losses. Such losses are characterized as follows:
| | | | |
| Short-Term | | | $(1,999,415 | ) |
| Long-Term | | | (1,630,546 | ) |
| Total | | | $(3,629,961 | ) |
Multiple Classes of Shares of Beneficial Interest– The fund offers multiple classes of shares, which differ in their respective distribution and/or service fees. The fund’s income, realized and unrealized gain (loss), and common expenses are allocated to shareholders based on the daily net assets of each class. Dividends are declared separately for each class. Differences in per share dividend rates are generally due to differences in separate class expenses. The fund’s distributions declared to shareholders as reported in the Statements of Changes in Net Assets are presented by class as follows:
| | | | | | | | |
| | |
| | | Year ended
12/31/19 | | | Year ended
12/31/18 | |
| Initial Class | | | $3,182,293 | | | | $1,435,695 | |
| Service Class | | | 16,808 | | | | 5,342 | |
| Total | | | $3,199,101 | | | | $1,441,037 | |
18
MFS Global Governments Portfolio
Notes to Financial Statements – continued
| (3) | | Transactions with Affiliates |
Investment Adviser– The fund has an investment advisory agreement with MFS to provide overall investment management and related administrative services and facilities to the fund. The management fee is computed daily and paid monthly at the following annual rates based on the fund’s average daily net assets:
| | | | |
| Up to $300 million | | | 0.75% | |
| In excess of $300 million and up to $1 billion | | | 0.675% | |
| In excess of $1 billion | | | 0.625% | |
MFS has agreed in writing to reduce its management fee by a specified amount if certain MFS mutual fund assets exceed thresholds agreed to by MFS and the fund’s Board of Trustees. For the year ended December 31, 2019, this management fee reduction amounted to $12,977, which is included in the reduction of total expenses in the Statement of Operations. The management fee incurred for the year ended December 31, 2019 was equivalent to an annual effective rate of 0.74% of the fund’s average daily net assets.
The investment adviser has agreed in writing to pay a portion of the fund’s total annual operating expenses, excluding interest, taxes, extraordinary expenses, brokerage and transaction costs, and investment-related expenses, such that total annual operating expenses do not exceed 1.00% of average daily net assets for the Initial Class shares and 1.25% of average daily net assets for the Service Class shares. This written agreement will continue until modified by the fund’s Board of Trustees, but such agreement will continue at least until April 30, 2021. For the year ended December 31, 2019, the fund’s actual operating expenses did not exceed the limit and therefore, the investment adviser did not pay any portion of the fund’s expenses related to this agreement.
Distributor– MFS Fund Distributors, Inc. (MFD), a wholly-owned subsidiary of MFS, is the distributor of shares of the fund. The Trustees have adopted a distribution plan for the Service Class shares pursuant to Rule12b-1 under the Investment Company Act of 1940.
The fund’s distribution plan provides that the fund will pay MFD distribution and/or service fees equal to 0.25% per annum of its average daily net assets attributable to Service Class shares as partial consideration for services performed and expenses incurred by MFD and financial intermediaries (including participating insurance companies that invest in the fund to fund variable annuity and variable life insurance contracts, sponsors of qualified retirement and pension plans that invest in the fund, and affiliates of these participating insurance companies and plan sponsors) in connection with the sale and distribution of the Service Class shares. MFD may subsequently pay all, or a portion, of the distribution and/or service fees to financial intermediaries.
Shareholder Servicing Agent– MFS Service Center, Inc. (MFSC), a wholly-owned subsidiary of MFS, receives a fee from the fund for its services as shareholder servicing agent. For the year ended December 31, 2019, the fee was $998, which equated to 0.0007% annually of the fund’s average daily net assets. MFSC also receives payment from the fund forout-of-pocket expenses paid by MFSC on behalf of the fund. For the year ended December 31, 2019, these costs amounted to $143.
Administrator– MFS provides certain financial, legal, shareholder communications, compliance, and other administrative services to the fund. Under an administrative services agreement, the fund reimburses MFS the costs incurred to provide these services. The fund is charged an annual fixed amount of $17,500 plus a fee based on average daily net assets. The administrative services fee incurred for the year ended December 31, 2019 was equivalent to an annual effective rate of 0.0215% of the fund’s average daily net assets.
Trustees’ and Officers’ Compensation– The fund pays compensation to independent Trustees in the form of a retainer, attendance fees, and additional compensation to Board and Committee chairpersons. The fund does not pay compensation directly to Trustees or officers of the fund who are also officers of the investment adviser, all of whom receive remuneration from MFS for their services to the fund. Certain officers and Trustees of the fund are officers or directors of MFS, MFD, and MFSC.
Other– This fund and certain other funds managed by MFS (the funds) had entered into a service agreement (the ISO Agreement) which provided for payment of fees solely by the funds to Tarantino LLC in return for the provision of services of an Independent Senior Officer (ISO) for the funds. Frank L. Tarantino served as the ISO and was an officer of the funds and the sole member of Tarantino LLC. Effective June 30, 2019, Mr. Tarantino retired from his position as ISO for the funds, and the ISO Agreement was terminated. For the year ended December 31, 2019, the fee paid by the fund under this agreement was $165 and is included in “Miscellaneous” expense in the Statement of Operations. MFS had agreed to bear all expenses associated with office space, other administrative support, and supplies provided to the ISO.
The fund invests in the MFS Institutional Money Market Portfolio which is managed by MFS and seeks current income consistent with preservation of capital and liquidity. This money market fund does not pay a management fee to MFS.
19
MFS Global Governments Portfolio
Notes to Financial Statements – continued
For the year ended December 31, 2019, purchases and sales of investments, other than short-term obligations, were as follows:
| | | | | | | | |
| | | Purchases | | | Sales | |
| U.S. Government securities | | | $43,807,443 | | | | $54,623,546 | |
| Non-U.S. Government securities | | | $85,188,120 | | | | $93,815,750 | |
| (5) | | Shares of Beneficial Interest |
The fund’s Declaration of Trust permits the Trustees to issue an unlimited number of full and fractional shares of beneficial interest. Transactions in fund shares were as follows:
| | | | | | | | | | | | | | | | |
| | | Year ended 12/31/19 | | | Year ended 12/31/18 | |
| | | | |
| | | Shares | | | Amount | | | Shares | | | Amount | |
| Shares sold | | | | | | | | | | | | | | | | |
Initial Class | | | 208,471 | | | | $2,210,929 | | | | 70,831 | | | | $740,148 | |
Service Class | | | 8,073 | | | | 85,405 | | | | 13,882 | | | | 144,462 | |
| | | 216,544 | | | | $2,296,334 | | | | 84,713 | | | | $884,610 | |
| | | | |
| Shares issued to shareholders in reinvestment of distributions | | | | | | | | | | | | | | | | |
Initial Class | | | 288,774 | | | | $3,182,293 | | | | 140,068 | | | | $1,435,695 | |
Service Class | | | 1,553 | | | | 16,808 | | | | 531 | | | | 5,342 | |
| | | 290,327 | | | | $3,199,101 | | | | 140,599 | | | | $1,441,037 | |
| | | | |
| Shares reacquired | | | | | | | | | | | | | | | | |
Initial Class | | | (1,455,554 | ) | | | $(15,647,362 | ) | | | (2,278,906 | ) | | | $(23,714,753 | ) |
Service Class | | | (14,339 | ) | | | (148,511 | ) | | | (32,954 | ) | | | (339,471 | ) |
| | | (1,469,893 | ) | | | $(15,795,873 | ) | | | (2,311,860 | ) | | | $(24,054,224 | ) |
| | | | |
| Net change | | | | | | | | | | | | | | | | |
Initial Class | | | (958,309 | ) | | | $(10,254,140 | ) | | | (2,068,007 | ) | | | $(21,538,910 | ) |
Service Class | | | (4,713 | ) | | | (46,298 | ) | | | (18,541 | ) | | | (189,667 | ) |
| | | (963,022 | ) | | | $(10,300,438 | ) | | | (2,086,548 | ) | | | $(21,728,577 | ) |
The fund is one of several mutual funds in which certain MFS funds may invest. The MFS funds do not invest in the underlying funds for the purpose of exercising management or control. At the end of the period, the MFS Moderate Allocation Portfolio, the MFS Conservative Allocation Portfolio, and the MFS Growth Allocation Portfolio were the owners of record of approximately 53%, 27%, and 10%, respectively, of the value of outstanding voting shares of the fund.
The fund and certain other funds managed by MFS participate in a $1.25 billion unsecured committed line of credit, subject to a $1 billion sublimit, provided by a syndicate of banks under a credit agreement. Borrowings may be made for temporary financing needs. Interest is charged to each fund, based on its borrowings, generally at a rate equal to the highest of one month LIBOR, the Federal Funds Effective Rate and the Overnight Bank Funding Rate, plus an agreed upon spread. A commitment fee, based on the average daily, unused portion of the committed line of credit, is allocated among the participating funds. In addition, the fund and other funds managed by MFS have established unsecured uncommitted borrowing arrangements with certain banks for temporary financing needs. Interest is charged to each fund, based on its borrowings, at rates equal to customary reference rates plus an agreed upon spread. For the year ended December 31, 2019, the fund’s commitment fee and interest expense were $732 and $0, respectively, and are included in “Miscellaneous” expense in the Statement of Operations.
| (7) | | Investments in Affiliated Issuers |
An affiliated issuer may be considered one in which the fund owns 5% or more of the outstanding voting securities, or a company which is under common control. For the purposes of this report, the following were affiliated issuers:
| | | | | | | | | | | | | | | | | | | | | | | | |
| Affiliated Issuers | | Beginning
Value | | | Purchases | | | Sales
Proceeds | | | Realized
Gain
(Loss) | | | Change in
Unrealized
Appreciation or
Depreciation | | | Ending
Value | |
| MFS Institutional Money Market Portfolio | | | $902,742 | | | | $80,226,789 | | | | $76,194,247 | | | | $330 | | | | $392 | | | | $4,936,006 | |
| | | | | | |
| Affiliated Issuers | | | | | | | | | | | | | | Dividend
Income | | | Capital Gain
Distributions | |
| MFS Institutional Money Market Portfolio | | | | | | | | | | | | | | | | | | | $261,988 | | | | $— | |
20
MFS Global Governments Portfolio
REPORT OF INDEPENDENT REGISTERED PUBLIC ACCOUNTING FIRM
To the Board of Trustees of MFS Variable Insurance Trust II and the Shareholders of MFS Global Governments Portfolio:
Opinion on the Financial Statements and Financial Highlights
We have audited the accompanying statement of assets and liabilities of MFS Global Governments Portfolio (the “Fund”), including the portfolio of investments, as of December 31, 2019, the related statement of operations for the year then ended, the statements of changes in net assets for each of the two years in the period then ended, the financial highlights for each of the five years in the period then ended, and the related notes. In our opinion, the financial statements and financial highlights present fairly, in all material respects, the financial position of the Fund as of December 31, 2019, and the results of its operations for the year then ended, the changes in its net assets for each of the two years in the period then ended, and the financial highlights for each of the five years in the period then ended, in conformity with accounting principles generally accepted in the United States of America.
Basis for Opinion
These financial statements and financial highlights are the responsibility of the Fund’s management. Our responsibility is to express an opinion on the Fund’s financial statements and financial highlights based on our audits. We are a public accounting firm registered with the Public Company Accounting Oversight Board (United States) (PCAOB) and are required to be independent with respect to the Fund in accordance with the U.S. federal securities laws and the applicable rules and regulations of the Securities and Exchange Commission and the PCAOB.
We conducted our audits in accordance with the standards of the PCAOB. Those standards require that we plan and perform the audit to obtain reasonable assurance about whether the financial statements and financial highlights are free of material misstatement, whether due to error or fraud. The Fund is not required to have, nor were we engaged to perform, an audit of its internal control over financial reporting. As part of our audits we are required to obtain an understanding of internal control over financial reporting but not for the purpose of expressing an opinion on the effectiveness of the Fund’s internal control over financial reporting. Accordingly, we express no such opinion.
Our audits included performing procedures to assess the risks of material misstatement of the financial statements and financial highlights, whether due to error or fraud, and performing procedures that respond to those risks. Such procedures included examining, on a test basis, evidence regarding the amounts and disclosures in the financial statements and financial highlights. Our audits also included evaluating the accounting principles used and significant estimates made by management, as well as evaluating the overall presentation of the financial statements and financial highlights. Our procedures included confirmation of securities owned as of December 31, 2019, by correspondence with the custodian and brokers. We believe that our audits provide a reasonable basis for our opinion.
DELOITTE & TOUCHE LLP
Boston, Massachusetts
February 14, 2020
We have served as the auditor of one or more of the MFS investment companies since 1924.
21
MFS Global Governments Portfolio
TRUSTEES AND OFFICERS – IDENTIFICATION AND BACKGROUND
The Trustees and Officers of the Trust, as of February 1, 2020, are listed below, together with their principal occupations during the past five years. (Their titles may have varied during that period.) The address of each Trustee and Officer is 111 Huntington Avenue, Boston, Massachusetts 02199-7618.
| | | | | | | | | | |
Name, Age | | Position(s)
Held with Fund | | Trustee/Officer
Since (h) | | Number of MFS Funds
overseen by the
Trustee | | Principal Occupations
During the Past Five Years | | Other Directorships During the Past Five Years (j) |
| INTERESTED TRUSTEES |
Robert J. Manning (k)
(age 56) | | Trustee | | February 2004 | | 133 | | Massachusetts Financial Services Company, Executive Chairman (since January 2017); Director; Chairman of the Board; Chief Executive Officer (until 2015);Co-Chief Executive Officer(2015-2016) | | N/A |
| | | | | |
Robin A. Stelmach (k) (age 58) | | Trustee | | January 2014 | | 133 | | Massachusetts Financial Services Company, Vice Chair (since January 2017); Chief Operating Officer and Executive Vice President (until January 2017) | | N/A |
|
| INDEPENDENT TRUSTEES |
John P. Kavanaugh (age 65) | | Trustee and Chair of Trustees | | January 2009 | | 133 | | Private investor | | N/A |
| | | | | |
Steven E. Buller (age 68) | | Trustee | | February 2014 | | 133 | | Financial Accounting Standards Advisory Council, Chairman(2014-2015); Public Company Accounting Oversight Board, Standing Advisory Group, Member (until 2014); BlackRock, Inc. (investment management), Managing Director (until 2014), BlackRock Finco UK (investment management), Director (until 2014) | | N/A |
| | | | | |
John A. Caroselli (age 65) | | Trustee | | March 2017 | | 133 | | JC Global Advisors, LLC (management consulting), President (since 2015); First Capital Corporation (commercial finance), Executive Vice President (until 2015) | | N/A |
| | | | | |
Maureen R. Goldfarb (age 64) | | Trustee | | January 2009 | | 133 | | Private investor | | N/A |
| | | | | |
Peter D. Jones
(age 64) | | Trustee | | January 2019 | | 133 | | Franklin Templeton Distributors, Inc. (investment management), President (until 2015); Franklin Templeton Institutional, LLC (investment management), Chairman (until 2015) | | N/A |
| | | | | |
James W. Kilman, Jr.
(age 58) | | Trustee | | January 2019 | | 133 | | Burford Capital Limited (finance and investment management), Chief Financial Officer (since 2019); KielStrand Capital LLC (family office), Chief Executive Officer (since 2016); Morgan Stanley & Co. (financial services), Vice Chairman of Investment Banking,Co-Head of Diversified Financials Coverage – Financial Institutions Investment Banking Group (until 2016) | | Alpha-En Corporation, Director (2016-2019) |
22
MFS Global Governments Portfolio
Trustees and Officers – continued
| | | | | | | | | | |
Name, Age | | Position(s)
Held with Fund | | Trustee/Officer
Since (h) | | Number of MFS Funds
overseen by the
Trustee | | Principal Occupations
During the Past Five Years | | Other Directorships During the Past Five Years (j) |
Clarence Otis, Jr. (age 63) | | Trustee | | March 2017 | | 133 | | Darden Restaurants, Inc., Chief Executive Officer (until 2014) | | VF Corporation, Director; Verizon Communications, Inc., Director; The Travelers Companies, Director; Federal Reserve Bank of Atlanta, Director (until 2015) |
| | | | | |
Maryanne L. Roepke (age 63) | | Trustee | | May 2014 | | 133 | | American Century Investments (investment management), Senior Vice President and Chief Compliance Officer (until 2014) | | N/A |
| | | | | |
Laurie J. Thomsen
(age 62) | | Trustee | | March 2005 | | 133 | | Private investor | | The Travelers Companies, Director; Dycom Industries, Inc., Director (since 2015) |
| | | | | | | | |
Name, Age | | Position(s)
Held with Fund | | Trustee/Officer
Since (h) | | Number of
MFS Funds
for which the
Person is an
Officer | | Principal Occupations During the Past Five Years |
| OFFICERS | | | | | | |
Christopher R. Bohane (k)
(age 46) | | Assistant Secretary and Assistant Clerk | | July 2005 | | 133 | | Massachusetts Financial Services Company, Vice President and Assistant General Counsel |
| | | | |
Kino Clark (k) (age 51) | | Assistant Treasurer | | January 2012 | | 133 | | Massachusetts Financial Services Company, Vice President |
| | | | |
John W. Clark, Jr. (k) (age 52) | | Assistant Treasurer | | April 2017 | | 133 | | Massachusetts Financial Services Company, Vice President (since March 2017); Deutsche Bank (financial services), Department Head –Treasurer’s Office (until February 2017) |
| | | | |
Thomas H. Connors (k) (age 60) | | Assistant Secretary and Assistant Clerk | | September 2012 | | 133 | | Massachusetts Financial Services Company, Vice President and Senior Counsel |
| | | | |
David L. DiLorenzo (k)
(age 51) | | President | | July 2005 | | 133 | | Massachusetts Financial Services Company, Senior Vice President |
| | | | |
Heidi W. Hardin (k) (age 52) | | Secretary and Clerk | | April 2017 | | 133 | | Massachusetts Financial Services Company, Executive Vice President and General Counsel (since March 2017); Harris Associates (investment management), General Counsel (from September 2015 to January 2017); Janus Capital Management LLC (investment management), Senior Vice President and General Counsel (until September 2015) |
| | | | |
Brian E. Langenfeld (k) (age 46) | | Assistant
Secretary and Assistant Clerk | | June 2006 | | 133 | | Massachusetts Financial Services Company, Vice President and Senior Counsel |
| | | | |
Amanda S. Mooradian (k) (age 40) | | Assistant
Secretary and Assistant Clerk | | September 2018 | | 133 | | Massachusetts Financial Services Company, Assistant Vice President and Counsel |
| | | | |
Susan A. Pereira (k)
(age 49) | | Assistant
Secretary and Assistant Clerk | | July 2005 | | 133 | | Massachusetts Financial Services Company, Vice President and Assistant General Counsel |
| | | | |
Kasey L. Phillips (k) (age 49) | | Assistant Treasurer | | September 2012 | | 133 | | Massachusetts Financial Services Company, Vice President |
| | | | |
Matthew A. Stowe (k) (age 45) | | Assistant Secretary and Assistant Clerk | | October 2014 | | 133 | | Massachusetts Financial Services Company, Vice President and Assistant General Counsel |
23
MFS Global Governments Portfolio
Trustees and Officers – continued
| | | | | | | | |
Name, Age | | Position(s)
Held with Fund | | Trustee/Officer
Since (h) | | Number of
MFS Funds
for which the
Person is an
Officer | | Principal Occupations During the Past Five Years |
Martin J. Wolin (k) (age 52) | | Chief Compliance Officer | | July 2015 | | 133 | | Massachusetts Financial Services Company, Senior Vice President and Chief Compliance Officer (since July 2015); Mercer (financial service provider), Chief Risk and Compliance Officer, North America and Latin America (until June 2015) |
| | | | |
James O. Yost (k)
(age 59) | | Treasurer | | September 1990 | | 133 | | Massachusetts Financial Services Company, Senior Vice President |
| (h) | Date first appointed to serve as Trustee/officer of an MFS Fund. Each Trustee has served continuously since appointment unless indicated otherwise. For the period from December 15, 2004 until February 22, 2005, Mr. Manning served as Advisory Trustee. From January 2012 through December 2016, Messrs. DiLorenzo and Yost served as Treasurer and Deputy Treasurer of the Funds, respectively. |
| (j) | Directorships or trusteeships of companies required to report to the Securities and Exchange Commission (i.e., “public companies”). |
| (k) | “Interested person” of the Trust within the meaning of the Investment Company Act of 1940 (referred to as the 1940 Act), which is the principal federal law governing investment companies like the fund, as a result of a position with MFS. The address of MFS is 111 Huntington Avenue, Boston, Massachusetts 02199-7618. |
Each Trustee (other than Messrs. Jones and Kilman) has been elected by shareholders and each Trustee and Officer holds office until his or her successor is chosen and qualified or until his or her earlier death, resignation, retirement or removal. Messrs. Jones and Kilman became Trustees of the Funds on January 1, 2019. The Trust does not hold annual meetings for the purpose of electing Trustees, and Trustees are not elected for fixed terms. Under the terms of the Board’s retirement policy, an Independent Trustee shall retire at the end of the calendar year in which he or she reaches the earlier of 75 years of age or 15 years of service on the Board (or, in the case of any Independent Trustee who joined the Board prior to 2015, 20 years of service on the Board).
Messrs. Buller, Kilman and Otis and Ms. Roepke are members of the Trust’s Audit Committee.
Each of the Interested Trustees and certain Officers hold comparable officer positions with certain affiliates of MFS.
The Statement of Additional Information for a Fund includes further information about the Trustees and is available without charge upon request by calling1-800-225-2606.
| | |
Investment Adviser Massachusetts Financial Services Company 111 Huntington Avenue Boston, MA 02199-7618 | | Custodian State Street Bank and Trust Company 1 Lincoln Street Boston, MA 02111-2900 |
| |
Distributor MFS Fund Distributors, Inc. 111 Huntington Avenue Boston, MA 02199-7618 | | Independent Registered Public Accounting Firm Deloitte & Touche LLP 200 Berkeley Street Boston, MA 02116 |
| |
Portfolio Manager(s) Robert Spector Erik Weisman | | |
24
MFS Global Governments Portfolio
BOARD REVIEW OF INVESTMENT ADVISORY AGREEMENT
MFS Global Governments Portfolio
The Investment Company Act of 1940 requires that both the full Board of Trustees and a majority of thenon-interested (“independent”) Trustees, voting separately, annually approve the continuation of the Fund’s investment advisory agreement with MFS. The Trustees consider matters bearing on the Fund and its advisory arrangements at their meetings throughout the year, including a review of performance data at each regular meeting. In addition, the independent Trustees met several times over the course of three months beginning in May and ending in July, 2019 (“contract review meetings”) for the specific purpose of considering whether to approve the continuation of the investment advisory agreement for the Fund and the other investment companies that the Board oversees (the “MFS Funds”). The independent Trustees were assisted in their evaluation of the Fund’s investment advisory agreement by independent legal counsel, from whom they received separate legal advice and with whom they met separately from MFS during various contract review meetings. The independent Trustees were also assisted in this process by the MFS Funds’ Independent Senior Officer, a senior officer appointed by and reporting to the independent Trustees.
In connection with their deliberations regarding the continuation of the investment advisory agreement, the Trustees, including the independent Trustees, considered such information and factors as they believed, in light of the legal advice furnished to them and their own business judgment, to be relevant. The investment advisory agreement for the Fund was considered separately, although the Trustees also took into account the common interests of all MFS Funds in their review. As described below, the Trustees considered the nature, quality, and extent of the various investment advisory, administrative, and shareholder services performed by MFS under the existing investment advisory agreement and other arrangements with the Fund.
In connection with their contract review meetings, the Trustees received and relied upon materials that included, among other items: (i) information provided by Broadridge Financial Solutions, Inc. (“Broadridge”), an independent third party, on the investment performance of the Fund for various time periods ended December 31, 2018 and the investment performance of a group of funds with substantially similar investment classifications/objectives (the “Broadridge performance universe”), (ii) information provided by Broadridge on the Fund’s advisory fees and other expenses and the advisory fees and other expenses of comparable funds identified by Broadridge as well as all other funds in the same investment classification/category (the “Broadridge expense group and universe”), (iii) information provided by MFS on the advisory fees of portfolios of other clients of MFS, including institutional separate accounts and other clients, (iv) information as to whether and to what extent applicable expense waivers, reimbursements or fee “breakpoints” are observed for the Fund, (v) information regarding MFS’ financial results and financial condition, including MFS’ and certain of its affiliates’ estimated profitability from services performed for the Fund and the MFS Funds as a whole, and compared to MFS’ institutional business, (vi) MFS’ views regarding the outlook for the mutual fund industry and the strategic business plans of MFS, (vii) descriptions of various functions performed by MFS for the Funds, such as compliance monitoring and portfolio trading practices, and (viii) information regarding the overall organization of MFS, including information about MFS’ senior management and other personnel providing investment advisory, administrative and other services to the Fund and the other MFS Funds. The comparative performance, fee and expense information prepared and provided by Broadridge was not independently verified and the independent Trustees did not independently verify any information provided to them by MFS.
The Trustees’ conclusion as to the continuation of the investment advisory agreement was based on a comprehensive consideration of all information provided to the Trustees and not the result of any single factor. Some of the factors that figured particularly in the Trustees’ deliberations are described below, although individual Trustees may have evaluated the information presented differently from one another, giving different weights to various factors. It is also important to recognize that the fee arrangements for the Fund and other MFS Funds are the result of years of review and discussion between the independent Trustees and MFS, that certain aspects of such arrangements may receive greater scrutiny in some years than in others, and that the Trustees’ conclusions may be based, in part, on their consideration of these same arrangements during the course of the year and in prior years.
Based on information provided by Broadridge and MFS, the Trustees reviewed the Fund’s total return investment performance as well as the Broadridge performance universe over various time periods. The Trustees placed particular emphasis on the total return performance of the Fund’s Initial Class shares in comparison to the performance of funds in its Broadridge performance universe over the five-year period ended December 31, 2018, which the Trustees believed was a long enough period to reflect differing market conditions. The total return performance of the Fund’s Initial Class shares was in the 4th quintile relative to the other funds in the universe for this five-year period (the 1st quintile being the best performers and the 5th quintile being the worst performers). The total return performance of the Fund’s Initial Class shares was in the 2nd quintile for theone-year period and the 4th quintile for the three-year period ended December 31, 2018 relative to the Broadridge performance universe. Because of the passage of time, these performance results may differ from the performance results for more recent periods, including those shown elsewhere in this report.
The Trustees expressed continued concern to MFS about the substandard investment performance of the Fund. In the course of their deliberations, the Trustees took into account information provided by MFS in connection with the contract review meetings, as well as during investment review meetings conducted with portfolio management personnel during the course of the year, as to MFS’ efforts to improve the Fund’s performance. In addition, the Trustees requested that they receive a separate update on the Fund’s
25
MFS Global Governments Portfolio
Board Review of Investment Advisory Agreement – continued
performance at each of their regular meetings. After reviewing these and related factors, the Trustees concluded, within the context of their overall conclusions regarding the investment advisory agreement, that MFS’ responses and efforts and plans to improve investment performance were sufficient to support approval of the continuance of the investment advisory agreement for an additionalone-year period, but that they would continue to closely monitor the performance of the Fund.
In assessing the reasonableness of the Fund’s advisory fee, the Trustees considered, among other information, the Fund’s advisory fee and the total expense ratio of the Fund’s Initial Class shares as a percentage of average daily net assets and the advisory fee and total expense ratios of the Broadridge expense group based on information provided by Broadridge. The Trustees considered that MFS currently observes an expense limitation for the Fund, which may not be changed without the Trustees’ approval. The Trustees also considered that, according to the data provided by Broadridge (which takes into account any fee reductions or expense limitations that were in effect during the Fund’s last fiscal year), the Fund’s effective advisory fee rate was higher than the Broadridge expense group median and the Fund’s total expense ratio was approximately at the Broadridge expense group median.
The Trustees also considered the advisory fees charged by MFS to any institutional separate accounts advised by MFS (“separate accounts”) and unaffiliated investment companies for which MFS serves as subadviser (“subadvised funds”) that have comparable investment strategies to the Fund, if any. In comparing these fees, the Trustees considered information provided by MFS as to the generally broader scope of services provided by MFS to the Fund, as well as the more extensive regulatory burdens imposed on MFS in managing the Fund, in comparison to separate accounts and subadvised funds. The Trustees also considered the higher demands placed on MFS’ investment personnel and trading infrastructure as a result of the daily cashin-flows andout-flows of the Fund in comparison to separate accounts.
The Trustees also considered whether the Fund may benefit from any economies of scale in the management of the Fund in the event of growth in assets of the Fund and/or growth in assets of the MFS Funds as a whole. They noted that the Fund’s advisory fee rate schedule is subject to contractual breakpoints that reduce the Fund’s advisory fee rate on average daily net assets over $300 million and $1 billion. The Trustees also noted that MFS has agreed in writing to waive a portion of the management fees of certain MFS Funds, including the Fund, if the total combined assets of certain funds within the MFS Funds’ complex increase above agreed upon thresholds (the “group fee waiver”), enabling the Fund’s shareholders to share in the benefits from any economies of scale at the complex level. The group fee waiver is reviewed and renewed annually between the Board and MFS. The Trustees concluded that the breakpoints and the group fee waiver were sufficient to allow the Fund to benefit from economies of scale as its assets and overall complex assets grow.
The Trustees also considered information prepared by MFS relating to MFS’ costs and profits with respect to the Fund, the MFS Funds considered as a group, and other investment companies and accounts advised by MFS, as well as MFS’ methodologies used to determine and allocate its costs to the MFS Funds, the Fund and other accounts and products for purposes of estimating profitability.
After reviewing these and other factors described herein, the Trustees concluded, within the context of their overall conclusions regarding the investment advisory agreement, that the advisory fees charged to the Fund represent reasonable compensation in light of the services being provided by MFS to the Fund.
In addition, the Trustees considered MFS’ resources and related efforts to continue to retain, attract and motivate capable personnel to serve the Fund. The Trustees also considered current and developing conditions in the financial services industry, including the presence of large and well-capitalized companies which are spending, and appear to be prepared to continue to spend, substantial sums to engage personnel and to provide services to competing investment companies. In this regard, the Trustees also considered the financial resources of MFS and its ultimate parent, Sun Life Financial Inc. The Trustees also considered the advantages and possible disadvantages to the Fund of having an adviser that also serves other investment companies as well as other accounts.
The Trustees also considered the nature, quality, cost, and extent of administrative, transfer agency, and distribution services provided to the Fund by MFS and its affiliates under agreements and plans other than the investment advisory agreement, including any12b-1 fees the Fund pays to MFS Fund Distributors, Inc., an affiliate of MFS. The Trustees also considered the nature, extent and quality of certain other services MFS performs or arranges for on the Fund’s behalf, which may include securities lending programs, directed expense payment programs, class action recovery programs, and MFS’ interaction with third-party service providers, principally custodians andsub-custodians. The Trustees concluded that the variousnon-advisory services provided by MFS and its affiliates on behalf of the Fund were satisfactory.
The Trustees consideredso-called“fall-out benefits” to MFS such as reputational value derived from serving as investment manager to the MFS Funds. The Trustees also considered that, effective January 3, 2018, MFS had discontinued its historic practice of obtaining investment research from portfolio brokerage commissions paid by certain MFS Funds and would thereafter directly pay for or voluntarily reimburse a Fund, if applicable, for the costs of external research acquired through the use of the Fund’s portfolio brokerage commissions.
Based on their evaluation of factors that they deemed to be material, including those factors described above, the Board of Trustees, including the independent Trustees, concluded that the Fund’s investment advisory agreement with MFS should be continued for an additionalone-year period, commencing August 1, 2019.
26
MFS Global Governments Portfolio
PROXY VOTING POLICIES AND INFORMATION
MFS votes proxies on behalf of the fund pursuant to proxy voting policies and procedures that are available without charge, upon request, by calling 1-800-225-2606, by visitingmfs.com/proxyvoting, or by visiting the SEC’s Web site athttp://www.sec.gov.
Information regarding how the fund voted proxies relating to portfolio securities during the most recent twelve-month period ended June 30 is available by August 31 of each year without charge by visitingmfs.com/proxyvoting, or by visiting the SEC’s Web site athttp://www.sec.gov.
QUARTERLY PORTFOLIO DISCLOSURE
The fund files a complete schedule of portfolio holdings with the SEC for the first and third quarters of each fiscal year as an exhibit to its reports on Form N-PORT. The fund’s Form N-PORT reports are available on the SEC’s website athttp://www.sec.gov.A shareholder can obtain the portfolio holdings report for the first and third quarters of the fund’s fiscal year atmfs.com/vit2 by choosing the fund’s name and then selecting the “Resources” tab and clicking on “Prospectus and Reports”.
FURTHER INFORMATION
From time to time, MFS may post important information about the fund or the MFS funds on the MFS web site (mfs.com). This information is available athttps://www.mfs.com/en-us/what-we-do/announcements.htmlor atmfs.com/vit2 by choosing the fund’s name.
INFORMATION ABOUT FUND CONTRACTS AND LEGAL CLAIMS
The fund has entered into contractual arrangements with an investment adviser, administrator, distributor, shareholder servicing agent, 529 program manager (if applicable), and custodian who each provide services to the fund. Unless expressly stated otherwise, shareholders are not parties to, or intended beneficiaries of these contractual arrangements, and these contractual arrangements are not intended to create any shareholder right to enforce them against the service providers or to seek any remedy under them against the service providers, either directly or on behalf of the fund.
Under the Trust’s By-Laws and Declaration of Trust, any claims asserted against or on behalf of the MFS Funds, including claims against Trustees and Officers, must be brought in state and federal courts located within the Commonwealth of Massachusetts.
27
rev. 3/16
| | | | |
| | | |
| FACTS | | WHAT DOES MFS DO WITH YOUR
PERSONAL INFORMATION? | |  |
| | |
| Why? | | Financial companies choose how they share your personal information. Federal law gives consumers the right to limit some but not all sharing. Federal law also requires us to tell you how we collect, share, and protect your personal information. Please read this notice carefully to understand what we do. |
| | |
| What? | | The types of personal information we collect and share depend on the product or service you have with us. This information can include: • Social Security number and account balances • Account transactions and transaction history • Checking account information and wire transfer instructions When you areno longer our customer, we continue to share your information as described in this notice. |
| | |
| How? | | All financial companies need to share customers’ personal information to run their everyday business. In the section below, we list the reasons financial companies can share their customers’ personal information; the reasons MFS chooses to share; and whether you can limit this sharing. |
| | | | |
Reasons we can share your
personal information | | Does MFS share? | | Can you limit this
sharing? |
For our everyday business purposes – such as to process your transactions, maintain your account(s), respond to court orders and legal investigations, or report to credit bureaus | | Yes | | No |
For our marketing purposes – to offer our products and services to you | | No | | We don’t share |
| For joint marketing with other financial companies | | No | | We don’t share |
For our affiliates’ everyday business purposes – information about your transactions and experiences | | No | | We don’t share |
For our affiliates’ everyday business purposes – information about your creditworthiness | | No | | We don’t share |
| For nonaffiliates to market to you | | No | | We don’t share |
| | |
| | |
| Questions? | | Call800-225-2606 or go tomfs.com. |
28
| | |
| Who we are |
| Who is providing this notice? | | MFS Funds, MFS Investment Management, MFS Institutional Advisors, Inc., and MFS Heritage Trust Company. |
| | |
| What we do |
| How does MFS protect my personal information? | | To protect your personal information from unauthorized access and use, we use security measures that comply with federal law. These measures include procedural, electronic, and physical safeguards for the protection of the personal information we collect about you. |
How does MFS
collect my personal information? | | We collect your personal information, for example, when you • open an account or provide account information • direct us to buy securities or direct us to sell your securities • make a wire transfer We also collect your personal information from others, such as credit bureaus, affiliates, or other companies. |
| Why can’t I limit all sharing? | | Federal law gives you the right to limit only • sharing for affiliates’ everyday business purposes – information about your creditworthiness • affiliates from using your information to market to you • sharing for nonaffiliates to market to you State laws and individual companies may give you additional rights to limit sharing. |
| | |
| Definitions |
| Affiliates | | Companies related by common ownership or control. They can be financial and nonfinancial companies. • MFS does not share personal information with affiliates, except for everyday business purposes as described on page one of this notice. |
| Nonaffiliates | | Companies not related by common ownership or control. They can be financial and nonfinancial companies. • MFS does not share with nonaffiliates so they can market to you. |
| Joint marketing | | A formal agreement between nonaffiliated financial companies that together market financial products or services to you. • MFS doesn’t jointly market. |
| | |
| Other important information |
| If you own an MFS product or receive an MFS service in the name of a third party such as a bank or broker-dealer, their privacy policy may apply to you instead of ours. |
29
Annual Report
December 31, 2019

MFS® Global Growth Portfolio

MFS® Variable Insurance Trust II
Beginning on January 1, 2021, as permitted by regulations adopted by the U.S. Securities and Exchange Commission, the insurance company that offers your contract may determine that it will no longer send you paper copies of the fund’s annual and semiannual shareholder reports unless you specifically request paper copies from the insurance company or from your financial intermediary. Instead, the shareholder reports will be made available on a Web site (insurancefunds.mfs.com or other Web site of which you will be notified), and the insurance company will notify you by mail each time a report is posted and provide you with a Web site link to access the report. Instructions for requesting paper copies will be provided by your insurance company or financial intermediary.
If you already elected to receive shareholder reports by email, you will not be affected by this change and you need not take any action. If your insurance company or financial intermediary offers electronic delivery, you may elect to receive shareholder reports and other communications from the insurance company or financial intermediary by email by following the instructions provided by the insurance company or financial intermediary.
Beginning on January 1, 2019, you may elect to receive all future reports in paper free of charge from the insurance company or financial intermediary. You can inform the insurance company or financial intermediary that you wish to continue receiving paper copies of your shareholder reports by contacting your insurance company or financial intermediary. Your election to receive reports in paper will apply to all funds held in your account with your insurance company or financial intermediary.
WGO-ANN
MFS® Global Growth Portfolio
CONTENTS
The report is prepared for the general information of contract owners. It is authorized for distribution to prospective investors only when preceded or accompanied by a current prospectus.
NOT FDIC INSURED• MAY LOSE VALUE• NO BANK OR CREDIT UNION GUARANTEE• NOT A DEPOSIT• NOT INSURED BY ANY FEDERAL GOVERNMENT AGENCY OR NCUA/NCUSIF
MFS Global Growth Portfolio
LETTER FROM THE EXECUTIVE CHAIR

Dear Contract Owners:
Slowing global growth, low inflation, and trade friction between the United States and China have been hallmarks of the past 12 months. After experiencing an uptick in market volatility in late 2018, markets steadied for most of 2019, thanks in large measure to the adoption of a dovish policy stance on the part of global central banks, focused on supporting economic growth. Negotiations aimed at a “phase one” trade deal between the U.S. and China bore fruit at the end of the period, boosting investor sentiment, while signs of stability emerging from the global manufacturing sector also lifted spirits. Uncertainty over Brexit, along with the ripple effects from the trade conflict, hampered business confidence and investment in the United Kingdom and Europe for much of the period, though investors expect greater clarity regarding Brexit as a result of December’s general election. The pro-Brexit Conservative Party won the election by a comfortable margin and set the stage for the U.K.’s departure from the EU at the end of January.
Markets expect the longest economic expansion in U.S. history will continue, albeit at a slower pace, as trade tensions recede. In an effort to prolong the expansion, the U.S. Federal Reserve lowered interest rates three times between July and October and the European Central Bank loosened policy in September. While the global monetary policy backdrop remains quite accommodative, signs of easing trade tensions and fading global recession fears led to improved market sentiment in late 2019 as investors grew less risk averse. In early 2020, an outbreak of coronavirus emanating from China reintroduced global growth fears, causing an uptick in volatility.
Here at MFS®, we aim to help our clients navigate the growing complexity of the markets and world economies. Our long-term investment philosophy and commitment to the responsible allocation of capital allow us to tune out the noise and uncover what we believe are the best, most durable investment opportunities in the market. Through our powerful global investment platform, we combine collective expertise, thoughtful risk management and long-term discipline to create sustainable value for investors.
Respectfully,

Robert J. Manning
Executive Chair
MFS Investment Management
February 14, 2020
The opinions expressed in this letter are subject to change and may not be relied upon for investment advice. No forecasts can be guaranteed.
1
MFS Global Growth Portfolio
PORTFOLIO COMPOSITION
Portfolio structure
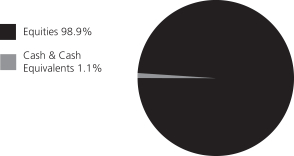
| | | | |
| Top ten holdings | | | | |
| Alphabet, Inc., “A” | | | 3.7% | |
| Microsoft Corp. | | | 3.4% | |
| Accenture PLC, “A” | | | 2.3% | |
| Nestle S.A. | | | 2.1% | |
| Marriott International, Inc., “A” | | | 2.0% | |
| Taiwan Semiconductor Manufacturing Co. Ltd., ADR | | | 2.0% | |
| Visa, Inc., “A” | | | 1.8% | |
| Aon PLC | | | 1.8% | |
| Apple, Inc. | | | 1.7% | |
| Union Pacific Corp. | | | 1.7% | |
| |
| GICS equity sectors (g) | | | | |
| Information Technology | | | 22.5% | |
| Consumer Discretionary | | | 15.2% | |
| Consumer Staples | | | 12.4% | |
| Health Care | | | 12.3% | |
| Industrials | | | 11.5% | |
| Communication Services | | | 9.5% | |
| Financials | | | 9.0% | |
| Materials | | | 6.5% | |
| | | | |
| Issuer country weightings (x) | | | | |
| United States | | | 62.3% | |
| Switzerland | | | 6.1% | |
| United Kingdom | | | 5.2% | |
| France | | | 4.2% | |
| China | | | 4.0% | |
| Germany | | | 3.4% | |
| Japan | | | 3.3% | |
| South Korea | | | 2.7% | |
| Taiwan | | | 2.0% | |
| Other Countries | | | 6.8% | |
| |
| Currency exposure weightings (y) | | | | |
| United States Dollar | | | 63.0% | |
| Euro | | | 8.4% | |
| British Pound Sterling | | | 6.5% | |
| Swiss Franc | | | 6.1% | |
| Chinese Renminbi | | | 3.9% | |
| Japanese Yen | | | 3.3% | |
| South Korean Won | | | 2.7% | |
| Taiwan Dollar | | | 2.0% | |
| Indian Rupee | | | 1.8% | |
| Other Currencies | | | 2.3% | |
| (g) | The Global Industry Classification Standard (GICS®) was developed by and/or is the exclusive property of MSCI, Inc. and S&P Global Market Intelligence Inc. (“S&P Global Market Intelligence”). GICS is a service mark of MSCI and S&P Global Market Intelligence and has been licensed for use by MFS. |
| (x) | Represents the portfolio’s exposure to issuer countries as a percentage of a portfolio’s net assets. For purposes of this presentation, United States includes Cash & Cash Equivalents. |
| (y) | Represents the portfolio’s exposure to a particular currency as a percentage of a portfolio’s net assets. For purposes of this presentation, United States Dollar includes Cash & Cash Equivalents. |
Cash & Cash Equivalents includes any cash, investments in money market funds, short-term securities, and other assets less liabilities. Please see the Statement of Assets and Liabilities for additional information related to the fund’s cash position and other assets and liabilities.
Percentages are based on net assets as of December 31, 2019.
The portfolio is actively managed and current holdings may be different.
2
MFS Global Growth Portfolio
MANAGEMENT REVIEW
Summary of Results
For the twelve months ended December 31, 2019, Initial Class shares of the MFS Global Growth Portfolio (fund) provided a total return of 36.01%, while Service Class shares of the fund provided a total return of 35.66%. These returns compare with a return of 32.72% over the same period for the fund’s benchmark, the MSCI All Country World Growth Index (net div).
Market Environment
Fading fears of a near-term global recession, the announcement of a partial trade deal between the United States and China and the decline in uncertainty over Brexit helped bolster market sentiment late in the period. Changes in market sentiment, largely driven by uncertainty over the outcome of trade negotiations between the US and China, had contributed to periodic bouts of volatility during the reporting period. The global economy decelerated, led by weakness in China and Europe, although the pace of the slowdown moderated late in the period amid nascent signs of stabilization in the manufacturing sector.
The deteriorating global growth backdrop, along with declining inflationary pressures, prompted the US Federal Reserve to adopt a more dovish posture beginning in early 2019, resulting in the first interest rate cut in over a decade at the end of July, followed by additional cuts in September and October. The Fed’s actions led to a sharp decline in long-term interest rates during the period’s second half, causing the inversion of portions of the US Treasury yield curve for a time. Amid an improvement in risk sentiment in Q4 2019 and indications of a bottoming in growth and a potential upturn in activity, the Fed indicated in October that further rate cuts were unlikely unless the outlook for the economy materially worsened.
Globally, central banks have tilted more dovish as well, with the European Central Bank unveiling a package of easing measures, which included putting overnight rates deeper into negative territory, restarting its bond-buying program and lengthening the term of cheap loans to banks to three years from two. The central banks of India and Australia are among those that have cut rates several times in recent months, although China has been more cautious in increasing liquidity as it keeps trying to deleverage its economy, cutting rates only marginally.
Emerging markets experienced considerable volatility through the end of 2018, as tighter global financial conditions exposed structural weakness in some countries. Those conditions improved in 2019 as the Fed became more dovish. Notwithstanding the periodic headwinds on market sentiment from significant trade friction between the US and China over much of the year, emerging market hard currency debt and local rates benefited from relatively cheap valuations at the beginning of the period and easier global monetary conditions. These factors, plus the fading of certain global risk factors mentioned above, hastened spread tightening in the latter part of the period. At the same time, idiosyncratic risks spiked in some countries (e.g., Argentina and Lebanon), contributing to increased dispersion in performance among sovereign assets.
Contributors to Performance
Security selection in theconsumer discretionary,financials andhealth care sectors contributed to performance relative to the MSCI All Country World Growth Index. Within theconsumer discretionary sector, overweight positions in luxury goods company LVMH Moet Hennessy Louis Vuitton (France) and sportswear and sports equipment manufacturer Adidas (Germany), as well not holding shares of internet retailer Amazon.com, lifted relative returns. The stock price of LVMH Moet Hennessy Louis Vuitton rose on the back of strong sales results, notably from its Fashion & Leather division. Within thefinancials sector, the timing of the fund’s ownership in shares of global alternative asset manager Blackstone Group, an overweight position in credit rating agency Moody’s, and not holding shares of insurance and investment firm Berkshire Hathaway, benefited relative results. The stock price of Blackstone Group rose as investors appeared to have reacted favorably to the company’s strong earnings reports that benefited from growth infee-related income and realized investment income. Additionally, Blackstone Group’s decision to convert from a limited partnership structure to a C corporation broadened the firm’s potential ownership pool and further supported its share price performance. Within thehealth care sector, the timing of the fund’s overweight position in shares of global health services provider Cigna also aided relative performance.
Elsewhere, the fund’s overweight positions in spirits producer Kweichow Moutai (China), semiconductor manufacturer Taiwan Semiconductor Manufacturing (Taiwan) and financial technology services provider Fiserv supported relative results. The stock price of Kweichow Moutai outperformed the benchmark on higher-than-expected profits, driven by sales of the company’s core Moutai brand and notably, the local spirit baijou.
Detractors from Performance
Security selection and, to a lesser extent, an underweight position in theinformation technology sector weakened relative performance over the reporting period. Notably, an underweight position in shares of computer and personal electronics maker Apple, and an overweight position in custom IT consulting and technology services provider Cognizant Technology Solutions, held back relative returns. The stock price of Apple advanced during the reporting period as the company’s revenues came in higher than expected, driven by stronger-than-expected demand in its wearable technology and services segments.
3
MFS Global Growth Portfolio
Management Review – continued
Stocks in other sectors that also negatively impacted relative results included overweight positions in internet search provider Baidu (China), household products manufacturer Reckitt Benckiser Group (United Kingdom), financial services company Credicorp (Peru), cosmetic product manufacturer KOSE (Japan), animal health services firm Elanco Animal Health (h) and electronic brokerage firm TD Ameritrade. A challenging macro environment contributed to the decline in the price of Baidu’s stock, as advertising revenue from both its search and news feed slowed, marketing expenses related to the promotion of the Baidu mobile application weighed on the company’s operating margins and projected revenue from its online video platform, iQiyi, was revised to be softer than originally expected. Not holding shares of strong-performing social media company Facebook, and holding shares of banking firm HDFC Bank (b) (India), further dampened relative returns.
Respectfully,
Portfolio Manager(s)
David Antonelli, Jeffrey Constantino, and Joseph Skorski
Note to Shareholders: Effective April 15, 2021, David Antonelli will be removed as a Portfolio Manager of the Fund.
| (b) | Security is not a benchmark constituent. |
| (h) | Security was not held in the portfolio at period end. |
The views expressed in this report are those of the portfolio manager(s) only through the end of the period of the report as stated on the cover and do not necessarily reflect the views of MFS or any other person in the MFS organization. These views are subject to change at any time based on market or other conditions, and MFS disclaims any responsibility to update such views. These views may not be relied upon as investment advice or an indication of trading intent on behalf of any MFS portfolio. References to specific securities are not recommendations of such securities, and may not be representative of any MFS portfolio’s current or future investments.
4
MFS Global Growth Portfolio
PERFORMANCE SUMMARY THROUGH 12/31/19
The following chart illustrates the historical performance of the fund in comparison to its benchmark(s). Benchmarks are unmanaged and may not be invested in directly. Benchmark returns do not reflect any fees or expenses. The performance of other share classes will be greater than or less than that of the class depicted below. (See Notes to Performance Summary.)
Performance data shown represents past performance and is no guarantee of future results. Investment return and principal value fluctuate so your units, when sold, may be worth more or less than the original cost; current performance may be lower or higher than quoted. The performance shown does not reflect the deduction of taxes, if any, that a contract holder would pay on fund distributions or the redemption of contract units. The returns for the fund shown also do not reflect the deduction of expenses associated with variable products, such as mortality and expense risk charges, separate account charges, and sales charges imposed by the insurance company separate accounts. Such expenses would reduce the overall returns shown.
Growth of a Hypothetical $10,000 Investment
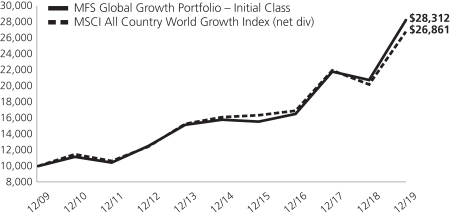
Total Returns through 12/31/19
Average annual total returns
| | | | | | | | | | | | |
| | | Share Class | | Class Inception Date | | 1-yr | | 5-yr | | 10-yr | | |
| | | Initial Class | | 11/16/93 | | 36.01% | | 12.30% | | 10.97% | | |
| | | Service Class | | 8/24/01 | | 35.66% | | 12.02% | | 10.69% | | |
| | | | |
| Comparative benchmark(s) | | | | | | | | |
| | | MSCI All Country World Growth Index (net div) (f) | | 32.72% | | 10.70% | | 10.39% | | |
| (f) | Source: FactSet Research Systems Inc. |
Benchmark Definition(s)
MSCI All Country World Growth Index (net div) – a market capitalization-weighted index that is designed to measure equity market performance for growth securities in the global developed and emerging markets. Morgan Stanley Capital International (“MSCI”) makes no express or implied warranties or representations and shall have no liability whatsoever with respect to any MSCI data contained herein. The MSCI data may not be further redistributed or used as a basis for other indices or any securities or financial products. This report is not approved, reviewed, or produced by MSCI.
It is not possible to invest directly in an index.
Notes to Performance Summary
Average annual total return represents the average annual change in value for each share class for the periods presented.
Performance results reflect any applicable expense subsidies and waivers in effect during the periods shown. Without such subsidies and waivers the fund’s performance results would be less favorable. Please see the prospectus and financial statements for complete details. All results are historical and assume the reinvestment of any dividends and capital gains distributions.
Performance results do not include adjustments made for financial reporting purposes in accordance with U.S. generally accepted accounting principles and may differ from amounts reported in the financial highlights.
From time to time the fund may receive proceeds from litigation settlements, without which performance would be lower.
5
MFS Global Growth Portfolio
EXPENSE TABLE
Fund Expenses Borne by the Contract Holders during the Period,
July 1, 2019 through December 31, 2019
As a contract holder of the fund, you incur ongoing costs, including management fees; distribution and/or service(12b-1) fees; and other fund expenses. This example is intended to help you understand your ongoing costs (in dollars) of investing in the fund and to compare these costs with the ongoing costs of investing in other mutual funds.
The example is based on an investment of $1,000 invested at the beginning of the period and held for the entire period July 1, 2019 through December 31, 2019.
Actual Expenses
The first line for each share class in the following table provides information about actual account values and actual expenses. You may use the information in this line, together with the amount you invested, to estimate the expenses that you paid over the period. Simply divide your account value by $1,000 (for example, an $8,600 account value divided by $1,000 = 8.6), then multiply the result by the number in the first line under the heading entitled “Expenses Paid During Period” to estimate the expenses you paid on your account during this period.
Hypothetical Example for Comparison Purposes
The second line for each share class in the following table provides information about hypothetical account values and hypothetical expenses based on the fund’s actual expense ratio and an assumed rate of return of 5% per year before expenses, which is not the fund’s actual return. The hypothetical account values and expenses may not be used to estimate the actual ending account balance or expenses you paid for the period. You may use this information to compare the ongoing costs of investing in the fund and other funds. To do so, compare this 5% hypothetical example with the 5% hypothetical examples that appear in the shareholder reports of the other funds.
Please note that the expenses shown in the table are meant to highlight the fund’s ongoing costs only and do not take into account the fees and expenses imposed under the variable contracts through which your investment in the fund is made. Therefore, the second line for each share class in the table is useful in comparing ongoing costs associated with an investment in vehicles (such as the fund) which fund benefits under variable annuity and variable life insurance contracts and to qualified pension and retirement plans only, and will not help you determine the relative total costs of investing in the fund through variable annuity and variable life insurance contracts. If the fees and expenses imposed under the variable contracts were included, your costs would have been higher.
| | | | | | | | | | | | | | | | | | |
| Share Class | | | | Annualized
Expense Ratio | | | Beginning
Account Value
7/01/19 | | | Ending
Account Value
12/31/19 | | | Expenses Paid
During Period (p)
7/01/19-12/31/19 | |
| Initial Class | | Actual | | | 1.00% | | | | $1,000.00 | | | | $1,117.46 | | | | $5.34 | |
| | Hypothetical (h) | | | 1.00% | | | | $1,000.00 | | | | $1,020.16 | | | | $5.09 | |
| Service Class | | Actual | | | 1.25% | | | | $1,000.00 | | | | $1,115.95 | | | | $6.67 | |
| | Hypothetical (h) | | | 1.25% | | | | $1,000.00 | | | | $1,018.90 | | | | $6.36 | |
| (h) | 5% class return per year before expenses. |
| (p) | “Expenses Paid During Period” are equal to each class’s annualized expense ratio, as shown above, multiplied by the average account value over the period, multiplied by 184/365 (to reflect theone-half year period). |
6
MFS Global Growth Portfolio
PORTFOLIO OF INVESTMENTS – 12/31/19
The Portfolio of Investments is a complete list of all securities owned by your fund. It is categorized by broad-based asset classes.
| | | | | | | | |
| | |
| Issuer | | Shares/Par | | | Value ($) | |
| COMMON STOCKS – 98.9% | | | | | |
| Aerospace – 1.0% | | | | | | | | |
| United Technologies Corp. | | | 3,476 | | | $ | 520,566 | |
| | | | | | | | |
| Airlines – 0.8% | | | | | | | | |
| Aena S.A. | | | 2,236 | | | $ | 427,635 | |
| | | | | | | | |
| Alcoholic Beverages – 3.8% | | | | | | | | |
| Ambev S.A., ADR | | | 91,577 | | | $ | 426,749 | |
| Diageo PLC | | | 12,474 | | | | 528,820 | |
| Kweichow Moutai Co. Ltd., “A” | | | 3,200 | | | | 543,463 | |
| Pernod Ricard S.A. | | | 3,029 | | | | 541,582 | |
| | | | | | | | |
| | | | | | $ | 2,040,614 | |
| | | | | | | | |
| Apparel Manufacturers – 6.2% | | | | | | | | |
| Adidas AG | | | 2,051 | | | $ | 666,716 | |
| Burberry Group PLC | | | 9,531 | | | | 278,376 | |
| Compagnie Financiere Richemont S.A. | | | 4,976 | | | | 391,067 | |
| LVMH Moet Hennessy Louis Vuitton SE | | | 1,819 | | | | 845,122 | |
| NIKE, Inc., “B” | | | 6,710 | | | | 679,790 | |
| VF Corp. | | | 4,210 | | | | 419,569 | |
| | | | | | | | |
| | | | | | $ | 3,280,640 | |
| | | | | | | | |
| Broadcasting – 0.3% | | | | | | | | |
| Walt Disney Co. | | | 1,225 | | | $ | 177,172 | |
| | | | | | | | |
| Brokerage & Asset Managers – 2.7% | | | | | | | | |
| Blackstone Group, Inc. | | | 10,986 | | | $ | 614,557 | |
| Charles Schwab Corp. | | | 15,335 | | | | 729,333 | |
| TD Ameritrade Holding Corp. | | | 1,803 | | | | 89,609 | |
| | | | | | | | |
| | | | | | $ | 1,433,499 | |
| | | | | | | | |
| Business Services – 10.3% | | | | | | | | |
| Accenture PLC, “A” | | | 5,731 | | | $ | 1,206,777 | |
| Brenntag AG | | | 4,642 | | | | 252,432 | |
| Cognizant Technology Solutions Corp., “A” | | | 10,642 | | | | 660,017 | |
| Compass Group PLC | | | 11,618 | | | | 290,856 | |
| Equifax, Inc. | | | 3,507 | | | | 491,401 | |
| Experian PLC | | | 10,471 | | | | 353,959 | |
| Fidelity National Information Services, Inc. | | | 6,155 | | | | 856,099 | |
| Fiserv, Inc. (a) | | | 5,981 | | | | 691,583 | |
| Intertek Group PLC | | | 3,224 | | | | 249,910 | |
| Verisk Analytics, Inc., “A” | | | 2,715 | | | | 405,458 | |
| | | | | | | | |
| | | | | | $ | 5,458,492 | |
| | | | | | | | |
| Cable TV – 1.5% | | | | | | | | |
| Comcast Corp., “A” | | | 17,952 | | | $ | 807,301 | |
| | | | | | | | |
| Chemicals – 1.4% | | | | | | | | |
| PPG Industries, Inc. | | | 5,467 | | | $ | 729,790 | |
| | | | | | | | |
| Computer Software – 3.4% | | | | | | | | |
| Microsoft Corp. | | | 11,433 | | | $ | 1,802,984 | |
| | | | | | | | |
| Computer Software – Systems – 1.7% | | | | | | | | |
| Apple, Inc. | | | 3,077 | | | $ | 903,561 | |
| | | | | | | | |
| Construction – 1.3% | | | | | | | | |
| Sherwin-Williams Co. | | | 1,179 | | | $ | 687,994 | |
| | | | | | | | |
| | | | | | | | |
| | |
| Issuer | | Shares/Par | | | Value ($) | |
| COMMON STOCKS – continued | | | | | |
| Consumer Products – 4.5% | | | | | | | | |
| Church & Dwight Co., Inc. | | | 3,664 | | | $ | 257,726 | |
| Colgate-Palmolive Co. | | | 6,384 | | | | 439,474 | |
| Estee Lauder Cos., Inc., “A” | | | 1,813 | | | | 374,457 | |
| KOSE Corp. | | | 2,100 | | | | 306,927 | |
| L’Oréal | | | 1,201 | | | | 355,651 | |
| Reckitt Benckiser Group PLC | | | 7,757 | | | | 629,750 | |
| | | | | | | | |
| | | | | | $ | 2,363,985 | |
| | | | | | | | |
| Electrical Equipment – 4.5% | | | | | | | | |
| Amphenol Corp., “A” | | | 6,316 | | | $ | 683,580 | |
| Fortive Corp. | | | 9,780 | | | | 747,094 | |
| Mettler-Toledo International, Inc. (a) | | | 531 | | | | 421,232 | |
| TE Connectivity Ltd. | | | 5,327 | | | | 510,540 | |
| | | | | | | | |
| | | | | | $ | 2,362,446 | |
| | | | | | | | |
| Electronics – 5.8% | | | | | | | | |
| Analog Devices, Inc. | | | 5,237 | | | $ | 622,365 | |
| Samsung Electronics Co. Ltd. | | | 13,474 | | | | 649,236 | |
| Taiwan Semiconductor Manufacturing Co. Ltd., ADR | | | 18,485 | | | | 1,073,979 | |
| Texas Instruments, Inc. | | | 5,584 | | | | 716,371 | |
| | | | | | | | |
| | | | | | $ | 3,061,951 | |
| | | | | | | | |
| Food & Beverages – 3.6% | | | | | | | | |
| Chr. Hansen Holding A.S. | | | 790 | | | $ | 62,779 | |
| Danone S.A. | | | 5,811 | | | | 481,695 | |
| Nestle S.A. | | | 10,044 | | | | 1,087,426 | |
| PepsiCo, Inc. | | | 2,223 | | | | 303,817 | |
| | | | | | | | |
| | | | | | $ | 1,935,717 | |
| | | | | | | | |
| Food & Drug Stores – 0.6% | | | | | | | | |
| Sundrug Co. Ltd. | | | 9,100 | | | $ | 328,872 | |
| | | | | | | | |
| Gaming & Lodging – 3.3% | | | | | | | | |
| Flutter Entertainment PLC | | | 5,321 | | | $ | 650,126 | |
| Marriott International, Inc., “A” | | | 7,136 | | | | 1,080,604 | |
| | | | | | | | |
| | | | | | $ | 1,730,730 | |
| | | | | | | | |
| General Merchandise – 1.3% | | | | | | | | |
| Dollarama, Inc. | | | 20,636 | | | $ | 709,241 | |
| | | | | | | | |
| Health Maintenance Organizations – 0.7% | | | | | |
| Cigna Corp. | | | 1,893 | | | $ | 387,100 | |
| | | | | | | | |
| Insurance – 2.7% | | | | | | | | |
| Aon PLC | | | 4,674 | | | $ | 973,547 | |
| Marsh & McLennan Cos., Inc. | | | 3,978 | | | | 443,189 | |
| | | | | | | | |
| | | | | | $ | 1,416,736 | |
| | | | | | | | |
| Internet – 8.1% | | | | | | | | |
| Alibaba Group Holding Ltd., ADR (a) | | | 3,889 | | | $ | 824,857 | |
| Alphabet, Inc., “A” (a) | | | 1,445 | | | | 1,935,419 | |
| Baidu, Inc., ADR (a) | | | 5,731 | | | | 724,398 | |
| NAVER Corp. (a) | | | 4,945 | | | | 797,477 | |
| | | | | | | | |
| | | | | | $ | 4,282,151 | |
| | | | | | | | |
7
MFS Global Growth Portfolio
Portfolio of Investments – continued
| | | | | | | | |
| | |
| Issuer | | Shares/Par | | | Value ($) | |
| COMMON STOCKS – continued | | | | | |
| Leisure & Toys – 1.1% | | | | | | | | |
| Electronic Arts, Inc. (a) | | | 5,583 | | | $ | 600,228 | |
| | | | | | | | |
| Machinery & Tools – 2.8% | | | | | | | | |
| Daikin Industries Ltd. | | | 4,700 | | | $ | 660,964 | |
| Nordson Corp. | | | 3,921 | | | | 638,496 | |
| Schindler Holding AG | | | 772 | | | | 196,390 | |
| | | | | | | | |
| | | | | | $ | 1,495,850 | |
| | | | | | | | |
| Medical Equipment – 7.5% | | | | | | | | |
| Abbott Laboratories | | | 7,777 | | | $ | 675,510 | |
| Becton, Dickinson and Co. | | | 3,109 | | | | 845,555 | |
| Danaher Corp. | | | 2,468 | | | | 378,789 | |
| Stryker Corp. | | | 2,592 | | | | 544,164 | |
| Thermo Fisher Scientific, Inc. | | | 2,478 | | | | 805,028 | |
| Waters Corp. (a) | | | 3,082 | | | | 720,109 | |
| | | | | | | | |
| | | | | | $ | 3,969,155 | |
| | | | | | | | |
| Other Banks & Diversified Financials – 5.6% | | | | | |
| Credicorp Ltd. | | | 1,680 | | | $ | 358,058 | |
| HDFC Bank Ltd. | | | 40,969 | | | | 730,149 | |
| Julius Baer Group Ltd. | | | 6,181 | | | | 318,885 | |
| Mastercard, Inc., “A” | | | 1,926 | | | | 575,084 | |
| Visa, Inc., “A” | | | 5,185 | | | | 974,262 | |
| | | | | | | | |
| | | | | | $ | 2,956,438 | |
| | | | | | | | |
| Pharmaceuticals – 3.3% | | | | | | | | |
| Bayer AG | | | 8,506 | | | $ | 694,693 | |
| Roche Holding AG | | | 2,705 | | | | 877,630 | |
| Zoetis, Inc. | | | 1,467 | | | | 194,157 | |
| | | | | | | | |
| | | | | | $ | 1,766,480 | |
| | | | | | | | |
| Printing & Publishing – 1.0% | | | | | | | | |
| Moody’s Corp. | | | 2,195 | | | $ | 521,115 | |
| | | | | | | | |
| Railroad & Shipping – 2.1% | | | | | | | | |
| Adani Ports and Special Economic Zone Ltd. | | | 47,699 | | | $ | 244,582 | |
| Union Pacific Corp. | | | 4,928 | | | | 890,933 | |
| | | | | | | | |
| | | | | | $ | 1,135,515 | |
| | | | | | | | |
| | | | | | | | |
| | |
| Issuer | | Shares/Par | | | Value ($) | |
| COMMON STOCKS – continued | | | | | |
| Restaurants – 0.9% | | | | | | | | |
| Starbucks Corp. | | | 5,249 | | | $ | 461,492 | |
| | | | | | | | |
| Specialty Chemicals – 3.7% | | | | | | | | |
| Croda International PLC | | | 6,546 | | | $ | 443,946 | |
| Ecolab, Inc. | | | 2,633 | | | | 508,143 | |
| Kansai Paint Co. Ltd. | | | 17,700 | | | | 432,598 | |
| Sika AG | | | 1,856 | | | | 348,743 | |
| Symrise AG | | | 2,021 | | | | 212,640 | |
| | | | | | | | |
| | | | | | $ | 1,946,070 | |
| | | | | | | | |
| Specialty Stores – 1.4% | | | | | | | | |
| TJX Cos., Inc. | | | 12,391 | | | $ | 756,594 | |
| | | | | | | | |
Total Common Stocks
(Identified Cost, $29,144,075) | | | | | | $ | 52,458,114 | |
| | | | | | | | |
| |
| INVESTMENT COMPANIES (h) – 1.0% | | | | | |
| Money Market Funds – 1.0% | | | | | |
| MFS Institutional Money Market Portfolio, 1.7% (v) (Identified Cost, $517,846) | | | 517,846 | | | $ | 517,846 | |
| | | | | | | | |
OTHER ASSETS, LESS
LIABILITIES – 0.1% | | | | | | | 43,713 | |
| | | | | | | | |
| NET ASSETS – 100.0% | | | | | | $ | 53,019,673 | |
| | | | | | | | |
| (a) | | Non-income producing security. |
| (h) | | An affiliated issuer, which may be considered one in which the fund owns 5% or more of the outstanding voting securities, or a company which is under common control. At period end, the aggregate values of the fund’s investments in affiliated issuers and in unaffiliated issuers were $517,846 and $52,458,114, respectively. |
| (v) | | Affiliated issuer that is available only to investment companies managed by MFS. The rate quoted for the MFS Institutional Money Market Portfolio is the annualizedseven-day yield of the fund at period end. |
The following abbreviations are used in this report and are defined:
| ADR | | American Depositary Receipt |
See Notes to Financial Statements
8
MFS Global Growth Portfolio
FINANCIAL STATEMENTS | STATEMENT OF ASSETS AND LIABILITIES
This statement represents your fund’s balance sheet, which details the assets and liabilities comprising the total value of the fund.
| | | | |
At 12/31/19 | | | | |
| |
Assets | | | | |
Investments in unaffiliated issuers, at value (identified cost, $29,144,075) | | | $52,458,114 | |
Investments in affiliated issuers, at value (identified cost, $517,846) | | | 517,846 | |
Receivables for | | | | |
Investments sold | | | 126,737 | |
Dividends | | | 92,033 | |
Receivable from investment adviser | | | 7,763 | |
Other assets | | | 610 | |
Total assets | | | $53,203,103 | |
| |
Liabilities | | | | |
Payables for | | | | |
Investments purchased | | | $63,591 | |
Fund shares reacquired | | | 39,171 | |
Payable to affiliates | | | | |
Administrative services fee | | | 98 | |
Shareholder servicing costs | | | 3 | |
Distribution and/or service fees | | | 29 | |
Payable for independent Trustees’ compensation | | | 1 | |
Deferred country tax expense payable | | | 15,704 | |
Accrued expenses and other liabilities | | | 64,833 | |
Total liabilities | | | $183,430 | |
Net assets | | | $53,019,673 | |
| |
Net assets consist of | | | | |
Paid-in capital | | | $24,840,183 | |
Total distributable earnings (loss) | | | 28,179,490 | |
Net assets | | | $53,019,673 | |
Shares of beneficial interest outstanding | | | 1,854,144 | |
| | | | | | | | | | | | |
| | | |
| | | Net assets | | | Shares
outstanding | | | Net asset value
per share | |
Initial Class | | | $50,911,063 | | | | 1,780,217 | | | | $28.60 | |
Service Class | | | 2,108,610 | | | | 73,927 | | | | 28.52 | |
See Notes to Financial Statements
9
MFS Global Growth Portfolio
FINANCIAL STATEMENTS | STATEMENT OF OPERATIONS
This statement describes how much your fund earned in investment income and accrued in expenses. It also describes any gains and/or losses generated by fund operations.
| | | | |
Year ended 12/31/19 | | | | |
| |
Net investment income (loss) | | | | |
Income | | | | |
Dividends | | | $800,938 | |
Dividends from affiliated issuers | | | 8,657 | |
Income on securities loaned | | | 3,882 | |
Other | | | 2,532 | |
Foreign taxes withheld | | | (50,136 | ) |
Total investment income | | | $765,873 | |
Expenses | | | | |
Management fee | | | $451,624 | |
Distribution and/or service fees | | | 4,831 | |
Shareholder servicing costs | | | 962 | |
Administrative services fee | | | 17,579 | |
Independent Trustees’ compensation | | | 1,382 | |
Custodian fee | | | 23,823 | |
Shareholder communications | | | 4,997 | |
Audit and tax fees | | | 76,332 | |
Legal fees | | | 434 | |
Miscellaneous | | | 28,764 | |
Total expenses | | | $610,728 | |
Reduction of expenses by investment adviser | | | (103,528 | ) |
Net expenses | | | $507,200 | |
Net investment income (loss) | | | $258,673 | |
| |
Realized and unrealized gain (loss) | | | | |
Realized gain (loss) (identified cost basis) | | | | |
Unaffiliated issuers (net of $1,475 country tax) | | | $4,793,503 | |
Affiliated issuers | | | 6 | |
Foreign currency | | | (3,001 | ) |
Net realized gain (loss) | | | $4,790,508 | |
Change in unrealized appreciation or depreciation | | | | |
Unaffiliated issuers (net of $11,728 increase in deferred country tax) | | | $10,253,932 | |
Translation of assets and liabilities in foreign currencies | | | 939 | |
Net unrealized gain (loss) | | | $10,254,871 | |
Net realized and unrealized gain (loss) | | | $15,045,379 | |
Change in net assets from operations | | | $15,304,052 | |
See Notes to Financial Statements
10
MFS Global Growth Portfolio
FINANCIAL STATEMENTS | STATEMENTS OF CHANGES IN NET ASSETS
These statements describe the increases and/or decreases in net assets resulting from operations, any distributions, and any shareholder transactions.
| | | | | | | | |
| | | Year ended | |
| | | 12/31/19 | | | 12/31/18 | |
Change in net assets | | | | | | | | |
| | |
From operations | | | | | | | | |
Net investment income (loss) | | | $258,673 | | | | $301,848 | |
Net realized gain (loss) | | | 4,790,508 | | | | 5,297,817 | |
Net unrealized gain (loss) | | | 10,254,871 | | | | (7,698,534 | ) |
Change in net assets from operations | | | $15,304,052 | | | | $(2,098,869 | ) |
Total distributions to shareholders | | | $(5,626,033 | ) | | | $(3,336,024 | ) |
Change in net assets from fund share transactions | | | $(2,331,561 | ) | | | $(6,308,369 | ) |
Total change in net assets | | | $7,346,458 | | | | $(11,743,262 | ) |
| | |
Net assets | | | | | | | | |
At beginning of period | | | 45,673,215 | | | | 57,416,477 | |
At end of period | | | $53,019,673 | | | | $45,673,215 | |
See Notes to Financial Statements
11
MFS Global Growth Portfolio
FINANCIAL STATEMENTS | FINANCIAL HIGHLIGHTS
The financial highlights table is intended to help you understand the fund’s financial performance for the past 5 years. Certain information reflects financial results for a single fund share. The total returns in the table represent the rate that an investor would have earned (or lost) on an investment in the fund share class (assuming reinvestment of all distributions) held for the entire period.
| | | | | | | | | | | | | | | | | | | | |
| Initial Class | | Year ended | |
| | | | | |
| | | 12/31/19 | | | 12/31/18 | | | 12/31/17 | | | 12/31/16 | | | 12/31/15 | |
| | | | | |
Net asset value, beginning of period | | | $23.72 | | | | $26.53 | | | | $21.00 | | | | $20.88 | | | | $22.45 | |
| | | | | |
| Income (loss) from investment operations | | | | | | | | | | | | | | | | | | | | |
Net investment income (loss) (d) | | | $0.14 | | | | $0.15 | | | | $0.13 | | | | $0.25 | (c) | | | $0.12 | |
Net realized and unrealized gain (loss) | | | 8.00 | | | | (1.23 | ) | | | 6.51 | | | | 1.08 | | | | (0.53 | ) |
Total from investment operations | | | $8.14 | | | | $(1.08 | ) | | | $6.64 | | | | $1.33 | | | | $(0.41 | ) |
| | | | | |
| Less distributions declared to shareholders | | | | | | | | | | | | | | | | | | | | |
From net investment income | | | $(0.16 | ) | | | $(0.14 | ) | | | $(0.27 | ) | | | $(0.13 | ) | | | $(0.22 | ) |
From net realized gain | | | (3.10 | ) | | | (1.59 | ) | | | (0.84 | ) | | | (1.08 | ) | | | (0.94 | ) |
Total distributions declared to shareholders | | | $(3.26 | ) | | | $(1.73 | ) | | | $(1.11 | ) | | | $(1.21 | ) | | | $(1.16 | ) |
Net asset value, end of period (x) | | | $28.60 | | | | $23.72 | | | | $26.53 | | | | $21.00 | | | | $20.88 | |
Total return (%) (k)(r)(s)(x) | | | 36.01 | | | | (4.83 | ) | | | 32.14 | | | | 6.07 | (c) | | | (1.54 | ) |
| | | | | |
Ratios (%) (to average net assets)
and Supplemental data: | | | | | | | | | | | | | | | | | | | | |
Expenses before expense reductions (f) | | | 1.21 | | | | 1.17 | | | | 1.17 | | | | 0.72 | (c) | | | 1.17 | |
Expenses after expense reductions (f) | | | 1.00 | | | | 1.00 | | | | 1.00 | | | | 0.55 | (c) | | | 1.01 | |
Net investment income (loss) | | | 0.53 | | | | 0.56 | | | | 0.55 | | | | 1.18 | (c) | | | 0.52 | |
Portfolio turnover | | | 22 | | | | 22 | | | | 21 | | | | 25 | | | | 26 | |
Net assets at end of period (000 omitted) | | | $50,911 | | | | $43,919 | | | | $54,886 | | | | $46,182 | | | | $48,932 | |
| |
| Service Class | | Year ended | |
| | | | | |
| | | 12/31/19 | | | 12/31/18 | | | 12/31/17 | | | 12/31/16 | | | 12/31/15 | |
| | | | | |
Net asset value, beginning of period | | | $23.65 | | | | $26.44 | | | | $20.94 | | | | $20.82 | | | | $22.38 | |
| | | | | |
| Income (loss) from investment operations | | | | | | | | | | | | | | | | | | | | |
Net investment income (loss) (d) | | | $0.07 | | | | $0.09 | | | | $0.07 | | | | $0.20 | (c) | | | $0.06 | |
Net realized and unrealized gain (loss) | | | 7.98 | | | | (1.24 | ) | | | 6.48 | | | | 1.08 | | | | (0.53 | ) |
Total from investment operations | | | $8.05 | | | | $(1.15 | ) | | | $6.55 | | | | $1.28 | | | | $(0.47 | ) |
| | | | | |
| Less distributions declared to shareholders | | | | | | | | | | | | | | | | | | | | |
From net investment income | | | $(0.08 | ) | | | $(0.05 | ) | | | $(0.21 | ) | | | $(0.08 | ) | | | $(0.15 | ) |
From net realized gain | | | (3.10 | ) | | | (1.59 | ) | | | (0.84 | ) | | | (1.08 | ) | | | (0.94 | ) |
Total distributions declared to shareholders | | | $(3.18 | ) | | | $(1.64 | ) | | | $(1.05 | ) | | | $(1.16 | ) | | | $(1.09 | ) |
Net asset value, end of period (x) | | | $28.52 | | | | $23.65 | | | | $26.44 | | | | $20.94 | | | | $20.82 | |
Total return (%) (k)(r)(s)(x) | | | 35.66 | | | | (5.06 | ) | | | 31.77 | | | | 5.85 | (c) | | | (1.82 | ) |
| | | | | |
Ratios (%) (to average net assets)
and Supplemental data: | | | | | | | | | | | | | | | | | | | | |
Expenses before expense reductions (f) | | | 1.46 | | | | 1.42 | | | | 1.42 | | | | 0.94 | (c) | | | 1.42 | |
Expenses after expense reductions (f) | | | 1.25 | | | | 1.25 | | | | 1.25 | | | | 0.77 | (c) | | | 1.26 | |
Net investment income (loss) | | | 0.26 | | | | 0.34 | | | | 0.31 | | | | 0.94 | (c) | | | 0.27 | |
Portfolio turnover | | | 22 | | | | 22 | | | | 21 | | | | 25 | | | | 26 | |
Net assets at end of period (000 omitted) | | | $2,109 | | | | $1,754 | | | | $2,530 | | | | $2,355 | | | | $2,031 | |
See Notes to Financial Statements
12
MFS Global Growth Portfolio
Financial Highlights – continued
| (c) | Amount reflects aone-time reimbursement of expenses by the custodian (or former custodian) without which net investment income and performance would be lower and expenses would be higher. Excluding the effect of the reimbursement of expenses, the total return for the year ended December 31, 2016 would have been approximately 0.55% lower. |
| (d) | Per share data is based on average shares outstanding. |
| (f) | Ratios do not reflect reductions from fees paid indirectly, if applicable. |
| (k) | The total return does not reflect expenses that apply to separate accounts. Inclusion of these charges would reduce the total return figures for all periods shown. |
| (r) | Certain expenses have been reduced without which performance would have been lower. |
| (s) | From time to time the fund may receive proceeds from litigation settlements, without which performance would be lower. |
| (x) | The net asset values and total returns have been calculated on net assets which include adjustments made in accordance with U.S. generally accepted accounting principles required at period end for financial reporting purposes. |
See Notes to Financial Statements
13
MFS Global Growth Portfolio
NOTES TO FINANCIAL STATEMENTS
| (1) | | Business and Organization |
MFS Global Growth Portfolio (the fund) is a diversified series of MFS Variable Insurance Trust II (the trust). The trust is organized as a Massachusetts business trust and is registered under the Investment Company Act of 1940, as amended, as anopen-end management investment company. The shareholders of each series of the trust are separate accounts of insurance companies, which offer variable annuity and/or life insurance products, and qualified retirement and pension plans.
The fund is an investment company and accordingly follows the investment company accounting and reporting guidance of the Financial Accounting Standards Board (FASB) Accounting Standards Codification Topic 946 Financial Services – Investment Companies.
| (2) | | Significant Accounting Policies |
General– The preparation of financial statements in conformity with U.S. generally accepted accounting principles requires management to make estimates and assumptions that affect the reported amounts of assets and liabilities, and disclosure of contingent assets and liabilities at the date of the financial statements and the reported amounts of increases and decreases in net assets from operations during the reporting period. Actual results could differ from those estimates. In the preparation of these financial statements, management has evaluated subsequent events occurring after the date of the fund’s Statement of Assets and Liabilities through the date that the financial statements were issued. The fund invests in foreign securities, including securities of emerging market issuers. Investments in foreign securities are vulnerable to the effects of changes in the relative values of the local currency and the U.S. dollar and to the effects of changes in each country’s market, economic, industrial, political, regulatory, geopolitical, and other conditions. Investments in emerging markets can involve additional and greater risks than the risks associated with investments in developed foreign markets. Emerging markets can have less developed markets, greater custody and operational risk, less developed legal, regulatory, and accounting systems, and greater political, social, and economic instability than developed markets.
Balance Sheet Offsetting– The fund’s accounting policy with respect to balance sheet offsetting is that, absent an event of default by the counterparty or a termination of the agreement, the International Swaps and Derivatives Association (ISDA) Master Agreement, or similar agreement, does not result in an offset of reported amounts of financial assets and financial liabilities in the Statement of Assets and Liabilities across transactions between the fund and the applicable counterparty. The fund’s right to setoff may be restricted or prohibited by the bankruptcy or insolvency laws of the particular jurisdiction to which a specific master netting agreement counterparty is subject. Balance sheet offsetting disclosures, to the extent applicable to the fund, have been included in the fund’s Significant Accounting Policies note under the captions for each of the fund’sin-scope financial instruments and transactions.
Investment Valuations– Equity securities, including restricted equity securities, are generally valued at the last sale or official closing price on their primary market or exchange as provided by a third-party pricing service. Equity securities, for which there were no sales reported that day, are generally valued at the last quoted daily bid quotation on their primary market or exchange as provided by a third-party pricing service. Short-term instruments with a maturity at issuance of 60 days or less may be valued at amortized cost, which approximates market value.Open-end investment companies are generally valued at net asset value per share. Securities and other assets generally valued on the basis of information from a third-party pricing service may also be valued at a broker/dealer bid quotation. In determining values, third-party pricing services can utilize both transaction data and market information such as yield, quality, coupon rate, maturity, type of issue, trading characteristics, and other market data. The values of foreign securities and other assets and liabilities expressed in foreign currencies are converted to U.S. dollars using the mean of bid and asked prices for rates provided by a third-party pricing service.
The Board of Trustees has delegated primary responsibility for determining or causing to be determined the value of the fund’s investments (including any fair valuation) to the adviser pursuant to valuation policies and procedures approved by the Board. If the adviser determines that reliable market quotations are not readily available, investments are valued at fair value as determined in good faith by the adviser in accordance with such procedures under the oversight of the Board of Trustees. Under the fund’s valuation policies and procedures, market quotations are not considered to be readily available for most types of debt instruments and floating rate loans and many types of derivatives. These investments are generally valued at fair value based on information from third-party pricing services. In addition, investments may be valued at fair value if the adviser determines that an investment’s value has been materially affected by events occurring after the close of the exchange or market on which the investment is principally traded (such as foreign exchange or market) and prior to the determination of the fund’s net asset value, or after the halt of trading of a specific security where trading does not resume prior to the close of the exchange or market on which the security is principally traded. Events that occur after foreign markets close (such as developments in foreign markets and significant movements in the U.S. markets) and prior to the determination of the fund’s net asset value may be deemed to have a material effect on the value of securities traded in foreign markets. Accordingly, the fund’s foreign equity securities may often be valued at fair value. The adviser
generally relies on third-party pricing services or other information (such as the correlation with price movements of similar securities in the same or other markets; the type, cost and investment characteristics of the security; the business and financial condition of the
14
MFS Global Growth Portfolio
Notes to Financial Statements – continued
issuer; and trading and other market data) to assist in determining whether to fair value and at what value to fair value an investment. The value of an investment for purposes of calculating the fund’s net asset value can differ depending on the source and method used to determine value. When fair valuation is used, the value of an investment used to determine the fund’s net asset value may differ from quoted or published prices for the same investment. There can be no assurance that the fund could obtain the fair value assigned to an investment if it were to sell the investment at the same time at which the fund determines its net asset value per share.
Various inputs are used in determining the value of the fund’s assets or liabilities. These inputs are categorized into three broad levels. In certain cases, the inputs used to measure fair value may fall into different levels of the fair value hierarchy. In such cases, an investment’s level within the fair value hierarchy is based on the lowest level of input that is significant to the fair value measurement. The fund’s assessment of the significance of a particular input to the fair value measurement in its entirety requires judgment, and considers factors specific to the investment. Level 1 includes unadjusted quoted prices in active markets for identical assets or liabilities. Level 2 includes other significant observable market-based inputs (including quoted prices for similar securities, interest rates, prepayment speed, and credit risk). Level 3 includes unobservable inputs, which may include the adviser’s own assumptions in determining the fair value of investments. The following is a summary of the levels used as of December 31, 2019 in valuing the fund’s assets or liabilities:
| | | | | | | | | | | | | | | | |
| Financial Instruments | | Level 1 | | | Level 2 | | | Level 3 | | | Total | |
| Equity Securities: | | | | | | | | | | | | | | | | |
United States | | | $32,459,735 | | | | $— | | | | $— | | | | $32,459,735 | |
Switzerland | | | 3,220,141 | | | | — | | | | — | | | | 3,220,141 | |
United Kingdom | | | 2,775,617 | | | | — | | | | — | | | | 2,775,617 | |
France | | | 2,224,050 | | | | — | | | | — | | | | 2,224,050 | |
China | | | 2,092,718 | | | | — | | | | — | | | | 2,092,718 | |
Germany | | | 1,826,481 | | | | — | | | | — | | | | 1,826,481 | |
Japan | | | — | | | | 1,729,361 | | | | — | | | | 1,729,361 | |
South Korea | | | 797,477 | | | | 649,236 | | | | — | | | | 1,446,713 | |
Taiwan | | | 1,073,979 | | | | — | | | | — | | | | 1,073,979 | |
Other Countries | | | 3,609,319 | | | | — | | | | — | | | | 3,609,319 | |
| Mutual Funds | | | 517,846 | | | | — | | | | — | | | | 517,846 | |
| Total | | | $50,597,363 | | | | $2,378,597 | | | | $— | | | | $52,975,960 | |
For further information regarding security characteristics, see the Portfolio of Investments.
Foreign Currency Translation– Purchases and sales of foreign investments, income, and expenses are converted into U.S. dollars based upon currency exchange rates prevailing on the respective dates of such transactions or on the reporting date for foreign denominated receivables and payables. Gains and losses attributable to foreign currency exchange rates on sales of securities are recorded for financial statement purposes as net realized gains and losses on investments. Gains and losses attributable to foreign exchange rate movements on receivables, payables, income and expenses are recorded for financial statement purposes as foreign currency transaction gains and losses. That portion of both realized and unrealized gains and losses on investments that results from fluctuations in foreign currency exchange rates is not separately disclosed.
Security Loans– Under its Securities Lending Agency Agreement with the fund, State Street Bank and Trust Company, as lending agent, loans the securities of the fund to certain qualified institutions (the “Borrowers”) approved by the fund. Security loans can be terminated at the discretion of either the lending agent or the fund and the related securities must be returned within the earlier of the standard trade settlement period for such securities or within three business days. The loans are collateralized by cash and/or U.S. Treasury and federal agency obligations in an amount typically at least equal to the market value of the securities loaned. On loans collateralized by cash, the cash collateral is invested in a money market fund. The market value of the loaned securities is determined at the close of business of the fund and any additional required collateral is delivered to the fund on the next business day. The lending agent provides the fund with indemnification against Borrower default. In the event of Borrower default, the lending agent will, for the benefit of the fund, either purchase securities identical to those loaned or, when such purchase is commercially impracticable, pay the fund the market value of the loaned securities. In return, the lending agent assumes the fund’s rights to the related collateral. If the collateral value is less than the cost to purchase identical securities, the lending agent is responsible for the shortfall, but only to the extent that such shortfall is not due to a decline in collateral value resulting from collateral reinvestment for which the fund bears the risk of loss. A portion of the income generated upon investment of the collateral is remitted to the Borrowers, and the remainder is allocated between the fund and the lending agent. On loans collateralized by U.S. Treasury and/or federal agency obligations, a fee is received from the Borrower, and is allocated between the fund and the lending agent. Income from securities lending is separately reported in the Statement of Operations. The dividend and interest income earned on the securities loaned is accounted for in the same manner as other dividend and interest income. At December 31, 2019, there were no securities on loan or collateral outstanding.
15
MFS Global Growth Portfolio
Notes to Financial Statements – continued
Indemnifications– Under the fund’s organizational documents, its officers and Trustees may be indemnified against certain liabilities and expenses arising out of the performance of their duties to the fund. Additionally, in the normal course of business, the fund enters into agreements with service providers that may contain indemnification clauses. The fund’s maximum exposure under these agreements is unknown as this would involve future claims that may be made against the fund that have not yet occurred.
Investment Transactions and Income– Investment transactions are recorded on the trade date. Dividends received in cash are recorded on theex-dividend date. Certain dividends from foreign securities will be recorded when the fund is informed of the dividend if such information is obtained subsequent to theex-dividend date. Dividend payments received in additional securities are recorded on theex-dividend date in an amount equal to the value of the security on such date.
The fund may receive proceeds from litigation settlements. Any proceeds received from litigation involving portfolio holdings are reflected in the Statement of Operations in realized gain/loss if the security has been disposed of by the fund or in unrealized gain/loss if the security is still held by the fund. Any other proceeds from litigation not related to portfolio holdings are reflected as other income in the Statement of Operations.
Tax Matters and Distributions– The fund intends to qualify as a regulated investment company, as defined under Subchapter M of the Internal Revenue Code, and to distribute all of its taxable income, including realized capital gains. As a result, no provision for federal income tax is required. The fund’s federal tax returns, when filed, will remain subject to examination by the Internal Revenue Service for a three year period. Management has analyzed the fund’s tax positions taken on federal and state tax returns for all open tax years and does not believe that there are any uncertain tax positions that require recognition of a tax liability. Foreign taxes, if any, have been accrued by the fund in the accompanying financial statements in accordance with the applicable foreign tax law. Foreign income taxes may be withheld by certain countries in which the fund invests. Additionally, capital gains realized by the fund on securities issued in or by certain foreign countries may be subject to capital gains tax imposed by those countries.
Distributions to shareholders are recorded on theex-dividend date. Income and capital gain distributions are determined in accordance with income tax regulations, which may differ from U.S. generally accepted accounting principles. Certain capital accounts in the financial statements are periodically adjusted for permanent differences in order to reflect their tax character. These adjustments have no impact on net assets or net asset value per share. Temporary differences which arise from recognizing certain items of income, expense, gain or loss in different periods for financial statement and tax purposes will reverse at some time in the future.
Book/tax differences primarily relate to wash sale loss deferrals.
The tax character of distributions declared to shareholders for the last two fiscal years is as follows:
| | | | | | | | |
| | | Year ended
12/31/19 | | | Year ended
12/31/18 | |
| Ordinary income (including any short-term capital gains) | | | $613,029 | | | | $701,022 | |
| Long-term capital gains | | | 5,013,004 | | | | 2,635,002 | |
| Total distributions | | | $5,626,033 | | | | $3,336,024 | |
The federal tax cost and the tax basis components of distributable earnings were as follows:
| | | | |
| As of 12/31/19 | | | | |
| |
| Cost of investments | | | $29,857,182 | |
| Gross appreciation | | | 23,406,810 | |
| Gross depreciation | | | (288,032 | ) |
| Net unrealized appreciation (depreciation) | | | $23,118,778 | |
| |
| Undistributed ordinary income | | | 568,214 | |
| Undistributed long-term capital gain | | | 4,491,547 | |
| Other temporary differences | | | 951 | |
Multiple Classes of Shares of Beneficial Interest– The fund offers multiple classes of shares, which differ in their respective distribution and/or service fees. The fund’s income, realized and unrealized gain (loss), and common expenses are allocated to shareholders based on the daily net assets of each class. Dividends are declared separately for each class. Differences in per share dividend rates are generally due to differences in separate class expenses. The fund’s distributions declared to shareholders as reported in the Statements of Changes in Net Assets are presented by class as follows:
| | | | | | | | |
| | |
| | | Year ended
12/31/19 | | | Year ended
12/31/18 | |
| Initial Class | | | $5,411,324 | | | | $3,216,550 | |
| Service Class | | | 214,709 | | | | 119,474 | |
| Total | | | $5,626,033 | | | | $3,336,024 | |
16
MFS Global Growth Portfolio
Notes to Financial Statements – continued
| (3) | | Transactions with Affiliates |
Investment Adviser– The fund has an investment advisory agreement with MFS to provide overall investment management and related administrative services and facilities to the fund. The management fee is computed daily and paid monthly at the following annual rates based on the fund’s average daily net assets:
| | | | |
| Up to $1 billion | | | 0.90% | |
| In excess of $1 billion and up to $2 billion | | | 0.75% | |
| In excess of $2 billion | | | 0.65% | |
MFS has agreed in writing to reduce its management fee by a specified amount if certain MFS mutual fund assets exceed thresholds agreed to by MFS and the fund’s Board of Trustees. For the year ended December 31, 2019, this management fee reduction amounted to $4,892, which is included in the reduction of total expenses in the Statement of Operations. The management fee incurred for the year ended December 31, 2019 was equivalent to an annual effective rate of 0.89% of the fund’s average daily net assets.
The investment adviser has agreed in writing to pay a portion of the fund’s total annual operating expenses, excluding interest, taxes, extraordinary expenses, brokerage and transaction costs, and investment-related expenses, such that total annual operating expenses do not exceed 1.00% of average daily net assets for the Initial Class shares and 1.25% of average daily net assets for the Service Class shares. This written agreement will continue until modified by the fund’s Board of Trustees, but such agreement will continue at least until April 30, 2021. For the year ended December 31, 2019, this reduction amounted to $98,636, which is included in the reduction of total expenses in the Statement of Operations.
Distributor– MFS Fund Distributors, Inc. (MFD), a wholly-owned subsidiary of MFS, is the distributor of shares of the fund. The Trustees have adopted a distribution plan for the Service Class shares pursuant to Rule12b-1 under the Investment Company Act of 1940.
The fund’s distribution plan provides that the fund will pay MFD distribution and/or service fees equal to 0.25% per annum of its average daily net assets attributable to Service Class shares as partial consideration for services performed and expenses incurred by MFD and financial intermediaries (including participating insurance companies that invest in the fund to fund variable annuity and variable life insurance contracts, sponsors of qualified retirement and pension plans that invest in the fund, and affiliates of these participating insurance companies and plan sponsors) in connection with the sale and distribution of the Service Class shares. MFD may subsequently pay all, or a portion, of the distribution and/or service fees to financial intermediaries.
Shareholder Servicing Agent– MFS Service Center, Inc. (MFSC), a wholly-owned subsidiary of MFS, receives a fee from the fund for its services as shareholder servicing agent. For the year ended December 31, 2019, the fee was $837, which equated to 0.0017% annually of the fund’s average daily net assets. MFSC also receives payment from the fund forout-of-pocket expenses paid by MFSC on behalf of the fund. For the year ended December 31, 2019, these costs amounted to $125.
Administrator– MFS provides certain financial, legal, shareholder communications, compliance, and other administrative services to the fund. Under an administrative services agreement, the fund reimburses MFS the costs incurred to provide these services. The fund is charged an annual fixed amount of $17,500 plus a fee based on average daily net assets. The administrative services fee incurred for the year ended December 31, 2019 was equivalent to an annual effective rate of 0.0350% of the fund’s average daily net assets.
Trustees’ and Officers’ Compensation– The fund pays compensation to independent Trustees in the form of a retainer, attendance fees, and additional compensation to Board and Committee chairpersons. The fund does not pay compensation directly to Trustees or officers of the fund who are also officers of the investment adviser, all of whom receive remuneration from MFS for their services to the fund. Certain officers and Trustees of the fund are officers or directors of MFS, MFD, and MFSC.
Other– This fund and certain other funds managed by MFS (the funds) had entered into a service agreement (the ISO Agreement) which provided for payment of fees solely by the funds to Tarantino LLC in return for the provision of services of an Independent Senior Officer (ISO) for the funds. Frank L. Tarantino served as the ISO and was an officer of the funds and the sole member of Tarantino LLC. Effective June 30, 2019, Mr. Tarantino retired from his position as ISO for the funds, and the ISO Agreement was terminated. For the year ended December 31, 2019, the fee paid by the fund under this agreement was $52 and is included in “Miscellaneous” expense in the Statement of Operations. MFS had agreed to bear all expenses associated with office space, other administrative support, and supplies provided to the ISO.
The fund invests in the MFS Institutional Money Market Portfolio which is managed by MFS and seeks current income consistent with preservation of capital and liquidity. This money market fund does not pay a management fee to MFS.
The fund is permitted to engage in purchase and sale transactions with funds and accounts for which MFS serves as investment adviser orsub-adviser (“cross-trades”) pursuant to a policy adopted by the Board of Trustees. This policy has been designed to ensure that cross-trades conducted by the fund comply with Rule17a-7 under the Investment Company Act of 1940. During the
17
MFS Global Growth Portfolio
Notes to Financial Statements – continued
year ended December 31, 2019, the fund engaged in sale transactions pursuant to this policy, which amounted to $32,680, respectively. The sales transactions resulted in net realized gains (losses) of $(4,734).
The adviser has voluntarily undertaken to reimburse the fund from its own resources on a quarterly basis for the cost of investment research embedded in the cost of the fund’s securities trades. This agreement may be rescinded at any time. For the year ended December 31, 2019, this reimbursement amounted to $2,513, which is included in “Other” income in the Statement of Operations.
For the year ended December 31, 2019, purchases and sales of investments, other than short-term obligations, aggregated $11,069,919 and $19,051,934, respectively.
| (5) | | Shares of Beneficial Interest |
The fund’s Declaration of Trust permits the Trustees to issue an unlimited number of full and fractional shares of beneficial interest. Transactions in fund shares were as follows:
| | | | | | | | | | | | | | | | |
| | | Year ended 12/31/19 | | | Year ended 12/31/18 | |
| | | | |
| | | Shares | | | Amount | | | Shares | | | Amount | |
| Shares sold | | | | | | | | | | | | | | | | |
Initial Class | | | 56,817 | | | | $1,564,798 | | | | 33,609 | | | | $889,691 | |
Service Class | | | 1,990 | | | | 55,816 | | | | 5,546 | | | | 148,393 | |
| | | 58,807 | | | | $1,620,614 | | | | 39,155 | | | | $1,038,084 | |
| | | | |
| Shares issued to shareholders in reinvestment of distributions | | | | | | | | | | | | | | | | |
Initial Class | | | 212,126 | | | | $5,411,324 | | | | 119,842 | | | | $3,216,550 | |
Service Class | | | 8,433 | | | | 214,709 | | | | 4,460 | | | | 119,474 | |
| | | 220,559 | | | | $5,626,033 | | | | 124,302 | | | | $3,336,024 | |
| | | | |
| Shares reacquired | | | | | | | | | | | | | | | | |
Initial Class | | | (340,514 | ) | | | $(9,290,250 | ) | | | (370,676 | ) | | | $(9,821,213 | ) |
Service Class | | | (10,678 | ) | | | (287,958 | ) | | | (31,503 | ) | | | (861,264 | ) |
| | | (351,192 | ) | | | $(9,578,208 | ) | | | (402,179 | ) | | | $(10,682,477 | ) |
| | | | |
| Net change | | | | | | | | | | | | | | | | |
Initial Class | | | (71,571 | ) | | | $(2,314,128 | ) | | | (217,225 | ) | | | $(5,714,972 | ) |
Service Class | | | (255 | ) | | | (17,433 | ) | | | (21,497 | ) | | | (593,397 | ) |
| | | (71,826 | ) | | | $(2,331,561 | ) | | | (238,722 | ) | | | $(6,308,369 | ) |
The fund and certain other funds managed by MFS participate in a $1.25 billion unsecured committed line of credit, subject to a $1 billion sublimit, provided by a syndicate of banks under a credit agreement. Borrowings may be made for temporary financing needs. Interest is charged to each fund, based on its borrowings, generally at a rate equal to the highest of one month LIBOR, the Federal Funds Effective Rate and the Overnight Bank Funding Rate, plus an agreed upon spread. A commitment fee, based on the average daily, unused portion of the committed line of credit, is allocated among the participating funds. In addition, the fund and other funds managed by MFS have established unsecured uncommitted borrowing arrangements with certain banks for temporary financing needs. Interest is charged to each fund, based on its borrowings, at rates equal to customary reference rates plus an agreed upon spread. For the year ended December 31, 2019, the fund’s commitment fee and interest expense were $273 and $0, respectively, and are included in “Miscellaneous” expense in the Statement of Operations.
| (7) | | Investments in Affiliated Issuers |
An affiliated issuer may be considered one in which the fund owns 5% or more of the outstanding voting securities, or a company which is under common control. For the purposes of this report, the following were affiliated issuers:
| | | | | | | | | | | | | | | | | | | | | | | | |
| Affiliated Issuers | | Beginning
Value | | | Purchases | | | Sales
Proceeds | | | Realized
Gain
(Loss) | | | Change in
Unrealized
Appreciation or
Depreciation | | | Ending
Value | |
| MFS Institutional Money Market Portfolio | | | $298,797 | | | | $10,389,384 | | | | $10,170,341 | | | | $6 | | | | $— | | | | $517,846 | |
| | | | | | |
| Affiliated Issuers | | | | | | | | | | | | | | Dividend
Income | | | Capital Gain
Distributions | |
| MFS Institutional Money Market Portfolio | | | | | | | | | | | | | | | | | | | $8,657 | | | | $— | |
18
MFS Global Growth Portfolio
REPORT OF INDEPENDENT REGISTERED PUBLIC ACCOUNTING FIRM
To the Board of Trustees of MFS Variable Insurance Trust II and the Shareholders of
MFS Global Growth Portfolio:
Opinion on the Financial Statements and Financial Highlights
We have audited the accompanying statement of assets and liabilities of MFS Global Growth Portfolio (the “Fund”), including the portfolio of investments, as of December 31, 2019, the related statement of operations for the year then ended, the statements of changes in net assets for each of the two years in the period then ended, the financial highlights for each of the five years in the period then ended, and the related notes. In our opinion, the financial statements and financial highlights present fairly, in all material respects, the financial position of the Fund as of December 31, 2019, and the results of its operations for the year then ended, the changes in its net assets for each of the two years in the period then ended, and the financial highlights for each of the five years in the period then ended, in conformity with accounting principles generally accepted in the United States of America.
Basis for Opinion
These financial statements and financial highlights are the responsibility of the Fund’s management. Our responsibility is to express an opinion on the Fund’s financial statements and financial highlights based on our audits. We are a public accounting firm registered with the Public Company Accounting Oversight Board (United States) (PCAOB) and are required to be independent with respect to the Fund in accordance with the U.S. federal securities laws and the applicable rules and regulations of the Securities and Exchange Commission and the PCAOB.
We conducted our audits in accordance with the standards of the PCAOB. Those standards require that we plan and perform the audit to obtain reasonable assurance about whether the financial statements and financial highlights are free of material misstatement, whether due to error or fraud. The Fund is not required to have, nor were we engaged to perform, an audit of its internal control over financial reporting. As part of our audits we are required to obtain an understanding of internal control over financial reporting but not for the purpose of expressing an opinion on the effectiveness of the Fund’s internal control over financial reporting. Accordingly, we express no such opinion.
Our audits included performing procedures to assess the risks of material misstatement of the financial statements and financial highlights, whether due to error or fraud, and performing procedures that respond to those risks. Such procedures included examining, on a test basis, evidence regarding the amounts and disclosures in the financial statements and financial highlights. Our audits also included evaluating the accounting principles used and significant estimates made by management, as well as evaluating the overall presentation of the financial statements and financial highlights. Our procedures included confirmation of securities owned as of December 31, 2019, by correspondence with the custodian and brokers; when replies were not received from brokers, we performed other auditing procedures. We believe that our audits provide a reasonable basis for our opinion.
DELOITTE & TOUCHE LLP
Boston, Massachusetts
February 14, 2020
We have served as the auditor of one or more of the MFS investment companies since 1924.
19
MFS Global Growth Portfolio
TRUSTEES AND OFFICERS – IDENTIFICATION AND BACKGROUND
The Trustees and Officers of the Trust, as of February 1, 2020, are listed below, together with their principal occupations during the past five years. (Their titles may have varied during that period.) The address of each Trustee and Officer is 111 Huntington Avenue, Boston, Massachusetts 02199-7618.
| | | | | | | | | | |
Name, Age | | Position(s)
Held with Fund | | Trustee/Officer
Since (h) | | Number of MFS Funds
overseen by the
Trustee | | Principal Occupations
During the Past Five Years | | Other Directorships During the Past Five Years (j) |
| INTERESTED TRUSTEES |
Robert J. Manning (k)
(age 56) | | Trustee | | February 2004 | | 133 | | Massachusetts Financial Services Company, Executive Chairman (since January 2017); Director; Chairman of the Board; Chief Executive Officer (until 2015);Co-Chief Executive Officer(2015-2016) | | N/A |
| | | | | |
Robin A. Stelmach (k) (age 58) | | Trustee | | January 2014 | | 133 | | Massachusetts Financial Services Company, Vice Chair (since January 2017); Chief Operating Officer and Executive Vice President (until January 2017) | | N/A |
|
| INDEPENDENT TRUSTEES |
John P. Kavanaugh (age 65) | | Trustee and Chair of Trustees | | January 2009 | | 133 | | Private investor | | N/A |
| | | | | |
Steven E. Buller (age 68) | | Trustee | | February 2014 | | 133 | | Financial Accounting Standards Advisory Council, Chairman(2014-2015); Public Company Accounting Oversight Board, Standing Advisory Group, Member (until 2014); BlackRock, Inc. (investment management), Managing Director (until 2014), BlackRock Finco UK (investment management), Director (until 2014) | | N/A |
| | | | | |
John A. Caroselli (age 65) | | Trustee | | March 2017 | | 133 | | JC Global Advisors, LLC (management consulting), President (since 2015); First Capital Corporation (commercial finance), Executive Vice President (until 2015) | | N/A |
| | | | | |
Maureen R. Goldfarb (age 64) | | Trustee | | January 2009 | | 133 | | Private investor | | N/A |
| | | | | |
Peter D. Jones
(age 64) | | Trustee | | January 2019 | | 133 | | Franklin Templeton Distributors, Inc. (investment management), President (until 2015); Franklin Templeton Institutional, LLC (investment management), Chairman (until 2015) | | N/A |
| | | | | |
James W. Kilman, Jr.
(age 58) | | Trustee | | January 2019 | | 133 | | Burford Capital Limited (finance and investment management), Chief Financial Officer (since 2019); KielStrand Capital LLC (family office), Chief Executive Officer (since 2016); Morgan Stanley & Co. (financial services), Vice Chairman of Investment Banking,Co-Head of Diversified Financials Coverage – Financial Institutions Investment Banking Group (until 2016) | | Alpha-En Corporation, Director (2016-2019) |
20
MFS Global Growth Portfolio
Trustees and Officers – continued
| | | | | | | | | | |
Name, Age | | Position(s)
Held with Fund | | Trustee/Officer
Since (h) | | Number of MFS Funds
overseen by the
Trustee | | Principal Occupations
During the Past Five Years | | Other Directorships During the Past Five Years (j) |
Clarence Otis, Jr. (age 63) | | Trustee | | March 2017 | | 133 | | Darden Restaurants, Inc., Chief Executive Officer (until 2014) | | VF Corporation, Director; Verizon Communications, Inc., Director; The Travelers Companies, Director; Federal Reserve Bank of Atlanta, Director (until 2015) |
| | | | | |
Maryanne L. Roepke (age 63) | | Trustee | | May 2014 | | 133 | | American Century Investments (investment management), Senior Vice President and Chief Compliance Officer (until 2014) | | N/A |
| | | | | |
Laurie J. Thomsen
(age 62) | | Trustee | | March 2005 | | 133 | | Private investor | | The Travelers Companies, Director; Dycom Industries, Inc., Director (since 2015) |
| | | | | | | | |
Name, Age | | Position(s)
Held with Fund | | Trustee/Officer
Since (h) | | Number of
MFS Funds
for which the
Person is an
Officer | | Principal Occupations During the Past Five Years |
| OFFICERS | | | | | | |
Christopher R. Bohane (k)
(age 46) | | Assistant Secretary and Assistant Clerk | | July 2005 | | 133 | | Massachusetts Financial Services Company, Vice President and Assistant General Counsel |
| | | | |
Kino Clark (k) (age 51) | | Assistant Treasurer | | January 2012 | | 133 | | Massachusetts Financial Services Company, Vice President |
| | | | |
John W. Clark, Jr. (k) (age 52) | | Assistant Treasurer | | April 2017 | | 133 | | Massachusetts Financial Services Company, Vice President (since March 2017); Deutsche Bank (financial services), Department Head –Treasurer’s Office (until February 2017) |
| | | | |
Thomas H. Connors (k) (age 60) | | Assistant Secretary and Assistant Clerk | | September 2012 | | 133 | | Massachusetts Financial Services Company, Vice President and Senior Counsel |
| | | | |
David L. DiLorenzo (k)
(age 51) | | President | | July 2005 | | 133 | | Massachusetts Financial Services Company, Senior Vice President |
| | | | |
Heidi W. Hardin (k) (age 52) | | Secretary and Clerk | | April 2017 | | 133 | | Massachusetts Financial Services Company, Executive Vice President and General Counsel (since March 2017); Harris Associates (investment management), General Counsel (from September 2015 to January 2017); Janus Capital Management LLC (investment management), Senior Vice President and General Counsel (until September 2015) |
| | | | |
Brian E. Langenfeld (k) (age 46) | | Assistant
Secretary and Assistant Clerk | | June 2006 | | 133 | | Massachusetts Financial Services Company, Vice President and Senior Counsel |
| | | | |
Amanda S. Mooradian (k) (age 40) | | Assistant
Secretary and Assistant Clerk | | September 2018 | | 133 | | Massachusetts Financial Services Company, Assistant Vice President and Counsel |
| | | | |
Susan A. Pereira (k)
(age 49) | | Assistant
Secretary and Assistant Clerk | | July 2005 | | 133 | | Massachusetts Financial Services Company, Vice President and Assistant General Counsel |
| | | | |
Kasey L. Phillips (k) (age 49) | | Assistant Treasurer | | September 2012 | | 133 | | Massachusetts Financial Services Company, Vice President |
| | | | |
Matthew A. Stowe (k) (age 45) | | Assistant Secretary and Assistant Clerk | | October 2014 | | 133 | | Massachusetts Financial Services Company, Vice President and Assistant General Counsel |
21
MFS Global Growth Portfolio
Trustees and Officers – continued
| | | | | | | | |
Name, Age | | Position(s)
Held with Fund | | Trustee/Officer
Since (h) | | Number of
MFS Funds
for which the
Person is an
Officer | | Principal Occupations During the Past Five Years |
Martin J. Wolin (k) (age 52) | | Chief Compliance Officer | | July 2015 | | 133 | | Massachusetts Financial Services Company, Senior Vice President and Chief Compliance Officer (since July 2015); Mercer (financial service provider), Chief Risk and Compliance Officer, North America and Latin America (until June 2015) |
| | | | |
James O. Yost (k)
(age 59) | | Treasurer | | September 1990 | | 133 | | Massachusetts Financial Services Company, Senior Vice President |
| (h) | Date first appointed to serve as Trustee/officer of an MFS Fund. Each Trustee has served continuously since appointment unless indicated otherwise. For the period from December 15, 2004 until February 22, 2005, Mr. Manning served as Advisory Trustee. From January 2012 through December 2016, Messrs. DiLorenzo and Yost served as Treasurer and Deputy Treasurer of the Funds, respectively. |
| (j) | Directorships or trusteeships of companies required to report to the Securities and Exchange Commission (i.e., “public companies”). |
| (k) | “Interested person” of the Trust within the meaning of the Investment Company Act of 1940 (referred to as the 1940 Act), which is the principal federal law governing investment companies like the fund, as a result of a position with MFS. The address of MFS is 111 Huntington Avenue, Boston, Massachusetts 02199-7618. |
Each Trustee (other than Messrs. Jones and Kilman) has been elected by shareholders and each Trustee and Officer holds office until his or her successor is chosen and qualified or until his or her earlier death, resignation, retirement or removal. Messrs. Jones and Kilman became Trustees of the Funds on January 1, 2019. The Trust does not hold annual meetings for the purpose of electing Trustees, and Trustees are not elected for fixed terms. Under the terms of the Board’s retirement policy, an Independent Trustee shall retire at the end of the calendar year in which he or she reaches the earlier of 75 years of age or 15 years of service on the Board (or, in the case of any Independent Trustee who joined the Board prior to 2015, 20 years of service on the Board).
Messrs. Buller, Kilman and Otis and Ms. Roepke are members of the Trust’s Audit Committee.
Each of the Interested Trustees and certain Officers hold comparable officer positions with certain affiliates of MFS.
The Statement of Additional Information for a Fund includes further information about the Trustees and is available without charge upon request by calling1-800-225-2606.
| | |
Investment Adviser Massachusetts Financial Services Company 111 Huntington Avenue Boston, MA 02199-7618 | | Custodian State Street Bank and Trust Company 1 Lincoln Street Boston, MA 02111-2900 |
| |
Distributor MFS Fund Distributors, Inc. 111 Huntington Avenue Boston, MA 02199-7618 | | Independent Registered Public Accounting Firm Deloitte & Touche LLP 200 Berkeley Street Boston, MA 02116 |
| |
Portfolio Manager(s) David Antonelli Jeffrey Constantino Joseph Skorski | | |
22
MFS Global Growth Portfolio
BOARD REVIEW OF INVESTMENT ADVISORY AGREEMENT
MFS Global Growth Portfolio
The Investment Company Act of 1940 requires that both the full Board of Trustees and a majority of thenon-interested (“independent”) Trustees, voting separately, annually approve the continuation of the Fund’s investment advisory agreement with MFS. The Trustees consider matters bearing on the Fund and its advisory arrangements at their meetings throughout the year, including a review of performance data at each regular meeting. In addition, the independent Trustees met several times over the course of three months beginning in May and ending in July, 2019 (“contract review meetings”) for the specific purpose of considering whether to approve the continuation of the investment advisory agreement for the Fund and the other investment companies that the Board oversees (the “MFS Funds”). The independent Trustees were assisted in their evaluation of the Fund’s investment advisory agreement by independent legal counsel, from whom they received separate legal advice and with whom they met separately from MFS during various contract review meetings. The independent Trustees were also assisted in this process by the MFS Funds’ Independent Senior Officer, a senior officer appointed by and reporting to the independent Trustees.
In connection with their deliberations regarding the continuation of the investment advisory agreement, the Trustees, including the independent Trustees, considered such information and factors as they believed, in light of the legal advice furnished to them and their own business judgment, to be relevant. The investment advisory agreement for the Fund was considered separately, although the Trustees also took into account the common interests of all MFS Funds in their review. As described below, the Trustees considered the nature, quality, and extent of the various investment advisory, administrative, and shareholder services performed by MFS under the existing investment advisory agreement and other arrangements with the Fund.
In connection with their contract review meetings, the Trustees received and relied upon materials that included, among other items: (i) information provided by Broadridge Financial Solutions, Inc. (“Broadridge”), an independent third party, on the investment performance of the Fund for various time periods ended December 31, 2018 and the investment performance of a group of funds with substantially similar investment classifications/objectives (the “Broadridge performance universe”), (ii) information provided by Broadridge on the Fund’s advisory fees and other expenses and the advisory fees and other expenses of comparable funds identified by Broadridge as well as all other funds in the same investment classification/category (the “Broadridge expense group and universe”), (iii) information provided by MFS on the advisory fees of portfolios of other clients of MFS, including institutional separate accounts and other clients, (iv) information as to whether and to what extent applicable expense waivers, reimbursements or fee “breakpoints” are observed for the Fund, (v) information regarding MFS’ financial results and financial condition, including MFS’ and certain of its affiliates’ estimated profitability from services performed for the Fund and the MFS Funds as a whole, and compared to MFS’ institutional business, (vi) MFS’ views regarding the outlook for the mutual fund industry and the strategic business plans of MFS, (vii) descriptions of various functions performed by MFS for the Funds, such as compliance monitoring and portfolio trading practices, and (viii) information regarding the overall organization of MFS, including information about MFS’ senior management and other personnel providing investment advisory, administrative and other services to the Fund and the other MFS Funds. The comparative performance, fee and expense information prepared and provided by Broadridge was not independently verified and the independent Trustees did not independently verify any information provided to them by MFS.
The Trustees’ conclusion as to the continuation of the investment advisory agreement was based on a comprehensive consideration of all information provided to the Trustees and not the result of any single factor. Some of the factors that figured particularly in the Trustees’ deliberations are described below, although individual Trustees may have evaluated the information presented differently from one another, giving different weights to various factors. It is also important to recognize that the fee arrangements for the Fund and other MFS Funds are the result of years of review and discussion between the independent Trustees and MFS, that certain aspects of such arrangements may receive greater scrutiny in some years than in others, and that the Trustees’ conclusions may be based, in part, on their consideration of these same arrangements during the course of the year and in prior years.
Based on information provided by Broadridge and MFS, the Trustees reviewed the Fund’s total return investment performance as well as the Broadridge performance universe over various time periods. The Trustees placed particular emphasis on the total return performance of the Fund’s Initial Class shares in comparison to the performance of funds in its Broadridge performance universe over the five-year period ended December 31, 2018, which the Trustees believed was a long enough period to reflect differing market conditions. The total return performance of the Fund’s Initial Class shares was in the 1st quintile relative to the other funds in the universe for this five-year period (the 1st quintile being the best performers and the 5th quintile being the worst performers). The total return performance of the Fund’s Initial Class shares was in the 1st quintile for each of theone- and three-year periods ended December 31, 2018 relative to the Broadridge performance universe. Because of the passage of time, these performance results may differ from the performance results for more recent periods, including those shown elsewhere in this report.
In the course of their deliberations, the Trustees took into account information provided by MFS in connection with the contract review meetings, as well as during investment review meetings conducted with portfolio management personnel during the course of the year regarding the Fund’s performance. After reviewing these and related factors, the Trustees concluded, within the context of their overall conclusions regarding the investment advisory agreement, that they were satisfied with MFS’ responses and efforts relating to investment performance.
23
MFS Global Growth Portfolio
Board Review of Investment Advisory Agreement – continued
In assessing the reasonableness of the Fund’s advisory fee, the Trustees considered, among other information, the Fund’s advisory fee and the total expense ratio of the Fund’s Initial Class shares as a percentage of average daily net assets and the advisory fee and total expense ratios of the Broadridge expense group based on information provided by Broadridge. The Trustees considered that MFS currently observes an expense limitation for the Fund, which may not be changed without the Trustees’ approval. The Trustees also considered that, according to the data provided by Broadridge (which takes into account any fee reductions or expense limitations that were in effect during the Fund’s last fiscal year), the Fund’s effective advisory fee rate was approximately at the Broadridge expense group median and the Fund’s total expense ratio was higher than the Broadridge expense group median.
The Trustees also considered the advisory fees charged by MFS to any institutional separate accounts advised by MFS (“separate accounts”) and unaffiliated investment companies for which MFS serves as subadviser (“subadvised funds”) that have comparable investment strategies to the Fund, if any. In comparing these fees, the Trustees considered information provided by MFS as to the generally broader scope of services provided by MFS to the Fund, as well as the more extensive regulatory burdens imposed on MFS in managing the Fund, in comparison to separate accounts and subadvised funds. The Trustees also considered the higher demands placed on MFS’ investment personnel and trading infrastructure as a result of the daily cashin-flows andout-flows of the Fund in comparison to separate accounts.
The Trustees also considered whether the Fund may benefit from any economies of scale in the management of the Fund in the event of growth in assets of the Fund and/or growth in assets of the MFS Funds as a whole. They noted that the Fund’s advisory fee rate schedule is subject to contractual breakpoints that reduce the Fund’s advisory fee rate on average daily net assets over $1 billion and $2 billion. The Trustees also noted that MFS has agreed in writing to waive a portion of the management fees of certain MFS Funds, including the Fund, if the total combined assets of certain funds within the MFS Funds’ complex increase above agreed upon thresholds (the “group fee waiver”), enabling the Fund’s shareholders to share in the benefits from any economies of scale at the complex level. The group fee waiver is reviewed and renewed annually between the Board and MFS. The Trustees concluded that the breakpoints and the group fee waiver were sufficient to allow the Fund to benefit from economies of scale as its assets and overall complex assets grow.
The Trustees also considered information prepared by MFS relating to MFS’ costs and profits with respect to the Fund, the MFS Funds considered as a group, and other investment companies and accounts advised by MFS, as well as MFS’ methodologies used to determine and allocate its costs to the MFS Funds, the Fund and other accounts and products for purposes of estimating profitability.
After reviewing these and other factors described herein, the Trustees concluded, within the context of their overall conclusions regarding the investment advisory agreement, that the advisory fees charged to the Fund represent reasonable compensation in light of the services being provided by MFS to the Fund.
In addition, the Trustees considered MFS’ resources and related efforts to continue to retain, attract and motivate capable personnel to serve the Fund. The Trustees also considered current and developing conditions in the financial services industry, including the presence of large and well-capitalized companies which are spending, and appear to be prepared to continue to spend, substantial sums to engage personnel and to provide services to competing investment companies. In this regard, the Trustees also considered the financial resources of MFS and its ultimate parent, Sun Life Financial Inc. The Trustees also considered the advantages and possible disadvantages to the Fund of having an adviser that also serves other investment companies as well as other accounts.
The Trustees also considered the nature, quality, cost, and extent of administrative, transfer agency, and distribution services provided to the Fund by MFS and its affiliates under agreements and plans other than the investment advisory agreement, including any12b-1 fees the Fund pays to MFS Fund Distributors, Inc., an affiliate of MFS. The Trustees also considered the nature, extent and quality of certain other services MFS performs or arranges for on the Fund’s behalf, which may include securities lending programs, directed expense payment programs, class action recovery programs, and MFS’ interaction with third-party service providers, principally custodians andsub-custodians. The Trustees concluded that the variousnon-advisory services provided by MFS and its affiliates on behalf of the Fund were satisfactory.
The Trustees consideredso-called“fall-out benefits” to MFS such as reputational value derived from serving as investment manager to the MFS Funds. The Trustees also considered that, effective January 3, 2018, MFS had discontinued its historic practice of obtaining investment research from portfolio brokerage commissions paid by certain MFS Funds and would thereafter directly pay for or voluntarily reimburse a Fund, if applicable, for the costs of external research acquired through the use of the Fund’s portfolio brokerage commissions.
Based on their evaluation of factors that they deemed to be material, including those factors described above, the Board of Trustees, including the independent Trustees, concluded that the Fund’s investment advisory agreement with MFS should be continued for an additionalone-year period, commencing August 1, 2019.
24
MFS Global Growth Portfolio
PROXY VOTING POLICIES AND INFORMATION
MFS votes proxies on behalf of the fund pursuant to proxy voting policies and procedures that are available without charge, upon request, by calling 1-800-225-2606, by visitingmfs.com/proxyvoting, or by visiting the SEC’s Web site athttp://www.sec.gov.
Information regarding how the fund voted proxies relating to portfolio securities during the most recent twelve-month period ended June 30 is available by August 31 of each year without charge by visitingmfs.com/proxyvoting, or by visiting the SEC’s Web site athttp://www.sec.gov.
QUARTERLY PORTFOLIO DISCLOSURE
The fund files a complete schedule of portfolio holdings with the SEC for the first and third quarters of each fiscal year as an exhibit to its reports on Form N-PORT. The fund’s Form N-PORT reports are available on the SEC’s website athttp://www.sec.gov. A shareholder can obtain the portfolio holdings report for the first and third quarters of the fund’s fiscal year atmfs.com/vit2 by choosing the fund’s name and then selecting the “Resources” tab and clicking on “Prospectus and Reports”.
FURTHER INFORMATION
From time to time, MFS may post important information about the fund or the MFS funds on the MFS web site (mfs.com). This information is available athttps://www.mfs.com/en-us/what-we-do/announcements.htmlor atmfs.com/vit2 by choosing the fund’s name.
INFORMATION ABOUT FUND CONTRACTS AND LEGAL CLAIMS
The fund has entered into contractual arrangements with an investment adviser, administrator, distributor, shareholder servicing agent, 529 program manager (if applicable), and custodian who each provide services to the fund. Unless expressly stated otherwise, shareholders are not parties to, or intended beneficiaries of these contractual arrangements, and these contractual arrangements are not intended to create any shareholder right to enforce them against the service providers or to seek any remedy under them against the service providers, either directly or on behalf of the fund.
Under the Trust’s By-Laws and Declaration of Trust, any claims asserted against or on behalf of the MFS Funds, including claims against Trustees and Officers, must be brought in state and federal courts located within the Commonwealth of Massachusetts.
FEDERAL TAX INFORMATION (unaudited)
The following information is provided pursuant to provisions of the Internal Revenue Code.
The fund designates $5,515,000 as capital gain dividends paid during the fiscal year.
For corporate shareholders, 54.77% of the ordinary income dividends paid during the fiscal year qualify for the corporate dividends received deduction.
25
rev. 3/16
| | | | |
| | | |
| FACTS | | WHAT DOES MFS DO WITH YOUR
PERSONAL INFORMATION? | |  |
| | |
| Why? | | Financial companies choose how they share your personal information. Federal law gives consumers the right to limit some but not all sharing. Federal law also requires us to tell you how we collect, share, and protect your personal information. Please read this notice carefully to understand what we do. |
| | |
| What? | | The types of personal information we collect and share depend on the product or service you have with us. This information can include: • Social Security number and account balances • Account transactions and transaction history • Checking account information and wire transfer instructions When you areno longer our customer, we continue to share your information as described in this notice. |
| | |
| How? | | All financial companies need to share customers’ personal information to run their everyday business. In the section below, we list the reasons financial companies can share their customers’ personal information; the reasons MFS chooses to share; and whether you can limit this sharing. |
| | | | |
Reasons we can share your
personal information | | Does MFS share? | | Can you limit this
sharing? |
For our everyday business purposes – such as to process your transactions, maintain your account(s), respond to court orders and legal investigations, or report to credit bureaus | | Yes | | No |
For our marketing purposes – to offer our products and services to you | | No | | We don’t share |
| For joint marketing with other financial companies | | No | | We don’t share |
For our affiliates’ everyday business purposes – information about your transactions and experiences | | No | | We don’t share |
For our affiliates’ everyday business purposes – information about your creditworthiness | | No | | We don’t share |
| For nonaffiliates to market to you | | No | | We don’t share |
| | |
| | |
| Questions? | | Call800-225-2606 or go tomfs.com. |
26
| | |
| Who we are |
| Who is providing this notice? | | MFS Funds, MFS Investment Management, MFS Institutional Advisors, Inc., and MFS Heritage Trust Company. |
| | |
| What we do |
| How does MFS protect my personal information? | | To protect your personal information from unauthorized access and use, we use security measures that comply with federal law. These measures include procedural, electronic, and physical safeguards for the protection of the personal information we collect about you. |
How does MFS
collect my personal information? | | We collect your personal information, for example, when you • open an account or provide account information • direct us to buy securities or direct us to sell your securities • make a wire transfer We also collect your personal information from others, such as credit bureaus, affiliates, or other companies. |
| Why can’t I limit all sharing? | | Federal law gives you the right to limit only • sharing for affiliates’ everyday business purposes – information about your creditworthiness • affiliates from using your information to market to you • sharing for nonaffiliates to market to you State laws and individual companies may give you additional rights to limit sharing. |
| | |
| Definitions |
| Affiliates | | Companies related by common ownership or control. They can be financial and nonfinancial companies. • MFS does not share personal information with affiliates, except for everyday business purposes as described on page one of this notice. |
| Nonaffiliates | | Companies not related by common ownership or control. They can be financial and nonfinancial companies. • MFS does not share with nonaffiliates so they can market to you. |
| Joint marketing | | A formal agreement between nonaffiliated financial companies that together market financial products or services to you. • MFS doesn’t jointly market. |
| | |
| Other important information |
| If you own an MFS product or receive an MFS service in the name of a third party such as a bank or broker-dealer, their privacy policy may apply to you instead of ours. |
27
Annual Report
December 31, 2019

MFS® Global Research Portfolio

MFS® Variable Insurance Trust II
Beginning on January 1, 2021, as permitted by regulations adopted by the U.S. Securities and Exchange Commission, the insurance company that offers your contract may determine that it will no longer send you paper copies of the fund’s annual and semiannual shareholder reports unless you specifically request paper copies from the insurance company or from your financial intermediary. Instead, the shareholder reports will be made available on a Web site (insurancefunds.mfs.com or other Web site of which you will be notified), and the insurance company will notify you by mail each time a report is posted and provide you with a Web site link to access the report. Instructions for requesting paper copies will be provided by your insurance company or financial intermediary.
If you already elected to receive shareholder reports by email, you will not be affected by this change and you need not take any action. If your insurance company or financial intermediary offers electronic delivery, you may elect to receive shareholder reports and other communications from the insurance company or financial intermediary by email by following the instructions provided by the insurance company or financial intermediary.
Beginning on January 1, 2019, you may elect to receive all future reports in paper free of charge from the insurance company or financial intermediary. You can inform the insurance company or financial intermediary that you wish to continue receiving paper copies of your shareholder reports by contacting your insurance company or financial intermediary. Your election to receive reports in paper will apply to all funds held in your account with your insurance company or financial intermediary.
RES-ANN
MFS® Global Research Portfolio
CONTENTS
The report is prepared for the general information of contract owners. It is authorized for distribution to prospective investors only when preceded or accompanied by a current prospectus.
NOT FDIC INSURED• MAY LOSE VALUE• NO BANK OR CREDIT UNION GUARANTEE• NOT A DEPOSIT• NOT INSURED BY ANY FEDERAL GOVERNMENT AGENCY OR NCUA/NCUSIF
MFS Global Research Portfolio
LETTER FROM THE EXECUTIVE CHAIR

Dear Contract Owners:
Slowing global growth, low inflation, and trade friction between the United States and China have been hallmarks of the past 12 months. After experiencing an uptick in market volatility in late 2018, markets steadied for most of 2019, thanks in large measure to the adoption of a dovish policy stance on the part of global central banks, focused on supporting economic growth. Negotiations aimed at a “phase one” trade deal between the U.S. and China bore fruit at the end of the period, boosting investor sentiment, while signs of stability emerging from the global manufacturing sector also lifted spirits. Uncertainty over Brexit, along with the ripple effects from the trade conflict, hampered business confidence and investment in the United Kingdom and Europe for much of the period, though investors expect greater clarity regarding Brexit as a result of December’s general election. The pro-Brexit Conservative Party won the election by a comfortable margin and set the stage for the U.K.’s departure from the EU at the end of January.
Markets expect the longest economic expansion in U.S. history will continue, albeit at a slower pace, as trade tensions recede. In an effort to prolong the expansion, the U.S. Federal Reserve lowered interest rates three times between July and October and the European Central Bank loosened policy in September. While the global monetary policy backdrop remains quite accommodative, signs of easing trade tensions and fading global recession fears led to improved market sentiment in late 2019 as investors grew less risk averse. In early 2020, an outbreak of coronavirus emanating from China reintroduced global growth fears, causing an uptick in volatility.
Here at MFS®, we aim to help our clients navigate the growing complexity of the markets and world economies. Our long-term investment philosophy and commitment to the responsible allocation of capital allow us to tune out the noise and uncover what we believe are the best, most durable investment opportunities in the market. Through our powerful global investment platform, we combine collective expertise, thoughtful risk management and long-term discipline to create sustainable value for investors.
Respectfully,

Robert J. Manning
Executive Chair
MFS Investment Management
February 14, 2020
The opinions expressed in this letter are subject to change and may not be relied upon for investment advice. No forecasts can be guaranteed.
1
MFS Global Research Portfolio
PORTFOLIO COMPOSITION
Portfolio structure

| | | | |
| Top ten holdings | | | | |
| Microsoft Corp. | | | 3.2% | |
| Alphabet, Inc., “A” | | | 2.3% | |
| Amazon.com, Inc. | | | 2.2% | |
| Salesforce.com, Inc. | | | 1.6% | |
| Facebook, Inc., “A” | | | 1.6% | |
| Fiserv, Inc. | | | 1.5% | |
| Mastercard, Inc., “A” | | | 1.5% | |
| Roche Holding AG | | | 1.5% | |
| Aon PLC | | | 1.4% | |
| AIA Group Ltd. | | | 1.3% | |
| |
| Global equity sectors (k) | | | | |
| Technology | | | 21.5% | |
| Financial Services | | | 19.9% | |
| Capital Goods | | | 16.2% | |
| Health Care | | | 11.6% | |
| Consumer Cyclicals | | | 11.3% | |
| Energy | | | 8.5% | |
| Consumer Staples | | | 6.4% | |
| Telecommunications/Cable Television | | | 4.1% | |
| | | | |
| Issuer country weightings (x) | | | | |
| United States | | | 60.2% | |
| France | | | 5.4% | |
| Switzerland | | | 5.0% | |
| Japan | | | 4.3% | |
| Germany | | | 3.1% | |
| Canada | | | 2.7% | |
| Hong Kong | | | 2.4% | |
| United Kingdom | | | 2.4% | |
| China | | | 1.9% | |
| Other Countries | | | 12.6% | |
| |
| Currency exposure weightings (y) | | | | |
| United States Dollar | | | 63.2% | |
| Euro | | | 13.8% | |
| Swiss Franc | | | 5.0% | |
| Japanese Yen | | | 4.3% | |
| Hong Kong Dollar | | | 3.4% | |
| British Pound Sterling | | | 2.8% | |
| Canadian Dollar | | | 2.1% | |
| Taiwan Dollar | | | 1.6% | |
| Indian Rupee | | | 1.0% | |
| Other Currencies | | | 2.8% | |
| (k) | The sectors set forth above and the associated portfolio composition are based on MFS’ own custom sector classification methodology. |
| (x) | Represents the portfolio’s exposure to issuer countries as a percentage of a portfolio’s net assets. For purposes of this presentation, United States includes Cash & Cash Equivalents. |
| (y) | Represents the portfolio’s exposure to a particular currency as a percentage of a portfolio’s net assets. For purposes of this presentation, United States Dollar includes Cash & Cash Equivalents. |
Cash & Cash Equivalents includes any cash, investments in money market funds, short-term securities, and other assets less liabilities. Please see the Statement of Assets and Liabilities for additional information related to the fund’s cash position and other assets and liabilities.
Percentages are based on net assets as of December 31, 2019.
The portfolio is actively managed and current holdings may be different.
2
MFS Global Research Portfolio
MANAGEMENT REVIEW
Summary of Results
For the twelve months ended December 31, 2019, Initial Class shares of the MFS Global Research Portfolio (fund) provided a total return of 31.96%, while Service Class shares of the fund provided a total return of 31.62%. These compare with a return of 26.60% over the same period for the fund’s benchmark, the MSCI All Country World Index (net div).
Market Environment
Fading fears of a near-term global recession, the announcement of a partial trade deal between the United States and China and the decline in uncertainty over Brexit helped bolster market sentiment late in the period. Changes in market sentiment, largely driven by uncertainty over the outcome of trade negotiations between the US and China, had contributed to periodic bouts of volatility during the reporting period. The global economy decelerated, led by weakness in China and Europe, although the pace of the slowdown moderated late in the period amid nascent signs of stabilization in the manufacturing sector.
The deteriorating global growth backdrop, along with declining inflationary pressures, prompted the US Federal Reserve to adopt a more dovish posture beginning in early 2019, resulting in the first interest rate cut in over a decade at the end of July, followed by additional cuts in September and October. The Fed’s actions led to a sharp decline in long-term interest rates during the period’s second half, causing the inversion of portions of the US Treasury yield curve for a time. Amid an improvement in risk sentiment in Q4 2019 and indications of a bottoming in growth and a potential upturn in activity, the Fed indicated in October that further rate cuts were unlikely unless the outlook for the economy materially worsened.
Globally, central banks have tilted more dovish as well, with the European Central Bank unveiling a package of easing measures, which included putting overnight rates deeper into negative territory, restarting its bond-buying program and lengthening the term of cheap loans to banks to three years from two. The central banks of India and Australia are among those that have cut rates several times in recent months, although China has been more cautious in increasing liquidity as it keeps trying to deleverage its economy, cutting rates only marginally.
Emerging markets experienced considerable volatility through the end of 2018, as tighter global financial conditions exposed structural weakness in some countries. Those conditions improved in 2019 as the Fed became more dovish. Notwithstanding the periodic headwinds on market sentiment from significant trade friction between the US and China over much of the year, emerging market hard currency debt and local rates benefited from relatively cheap valuations at the beginning of the period and easier global monetary conditions. These factors, plus the fading of certain global risk factors mentioned above, hastened spread tightening in the latter part of the period. At the same time, idiosyncratic risks spiked in some countries (e.g., Argentina and Lebanon), contributing to increased dispersion in performance among sovereign assets.
Contributors to Performance
Stock selection in thefinancial services,capital goods andconsumer cyclicals sectors lifted performance relative to the MSCI All Country World Index over the reporting period. Within thefinancial services sector, the timing of the fund’s ownership in shares of global alternative asset manager Blackstone Group, holdings of financial markets clearing and data services firm TMX Group (b)(h) (Canada), and overweight positions in debit and credit transaction processing company Mastercard and diversified financial services firm Citigroup (h), benefited relative returns. The stock price of Blackstone Group rose as investors appeared to have reacted favorably to strong earnings reports that benefited from growth infee-related income and realized investment income. Additionally, Blackstone Group’s decision to convert from a limited partnership structure to a C corporation broadened the firm’s potential ownership pool and further supported its share price performance. Within thecapital goods sector, an overweight position in shares of electrical distribution equipment manufacturer Schneider Electric (France) aided relative results as the company’s stock price advanced on strong demand in its energy management division, notably from North America. Within theconsumer cyclicals sector, overweight positions in retail giant Target and discount variety store operator Dollar General supported relative performance.
Stocks in other sectors that also positively impacted relative returns included overweight positions in electronic payment services company Global Payments, financial technology services provider Fiserv and semiconductor manufacturer Taiwan Semiconductor Manufacturing (Taiwan). The stock price of Taiwan Semiconductor Manufacturing overcame uncertainty surroundingUS-China trade negotiations, including a US ban on Huawei products, and rose on the back of strong earnings results that were driven by demand for its7-nanometer processing chips.
Detractors from Performance
Stock selection in thetechnology sector weakened relative performance over the reporting period. Notably, an underweight position in computer and personal electronics maker Apple, and an overweight position in information technology company DXC Technology (h), hindered relative returns. The stock price of Apple advanced during the reporting period as the company’s revenues came in higher than expected, driven by stronger-than-expected demand in its wearable technology and services segments.
3
MFS Global Research Portfolio
Management Review – continued
Elsewhere, the fund’s overweight positions in financial services company Credicorp (Peru), specialty materials, chemicals and agricultural products developer DuPont de Nemours, animal health services firm Elanco Animal Health, electricity provider CLP Holdings (Hong Kong), financial services provider AEON Financial Service (Japan), marine and inland terminal operator DP World (United Arab Emirates) and TD Ameritrade Holding further detracted from relative performance. The share price of AEON Financial Service declined, notably in May, as the company reported disappointing fiscal-year 2019 earnings results and guided to a weaker 2020, given uncertainty aroundUS-China trade negotiations. The timing of the fund’s position in biotechnology company Biogen (h) also held back relative returns.
Respectfully,
Portfolio Manager(s)
Akira Fuse and James Keating
Note to Shareholders: Effective December 31, 2019, Akira Fuse was added as a Portfolio Manager of the Fund and Joseph MacDougall was removed as a Portfolio Manager of the Fund.
| (b) | Security is not a benchmark constituent. |
| (h) | Security was not held in the portfolio at period end. |
The views expressed in this report are those of the portfolio manager(s) only through the end of the period of the report as stated on the cover and do not necessarily reflect the views of MFS or any other person in the MFS organization. These views are subject to change at any time based on market or other conditions, and MFS disclaims any responsibility to update such views. These views may not be relied upon as investment advice or an indication of trading intent on behalf of any MFS portfolio. References to specific securities are not recommendations of such securities, and may not be representative of any MFS portfolio’s current or future investments.
4
MFS Global Research Portfolio
PERFORMANCE SUMMARY THROUGH 12/31/19
The following chart illustrates the historical performance of the fund in comparison to its benchmark(s). Benchmarks are unmanaged and may not be invested in directly. Benchmark returns do not reflect any fees or expenses. The performance of other share classes will be greater than or less than that of the class depicted below. (See Notes to Performance Summary.)
Performance data shown represents past performance and is no guarantee of future results. Investment return and principal value fluctuate so your units, when sold, may be worth more or less than the original cost; current performance may be lower or higher than quoted. The performance shown does not reflect the deduction of taxes, if any, that a contract holder would pay on fund distributions or the redemption of contract units. The returns for the fund shown also do not reflect the deduction of expenses associated with variable products, such as mortality and expense risk charges, separate account charges, and sales charges imposed by the insurance company separate accounts. Such expenses would reduce the overall returns shown.
Growth of a Hypothetical $10,000 Investment
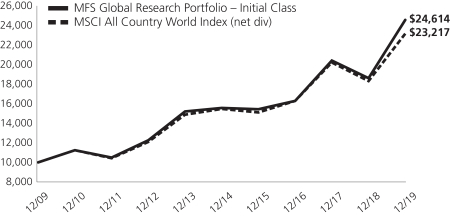
Total Returns through 12/31/19
Average annual total returns
| | | | | | | | | | | | |
| | | Share Class | | Class Inception Date | | 1-yr | | 5-yr | | 10-yr | | |
| | | Initial Class | | 11/07/94 | | 31.96% | | 9.57% | | 9.43% | | |
| | | Service Class | | 8/24/01 | | 31.62% | | 9.29% | | 9.15% | | |
| | | | |
Comparative benchmark(s) | | | | | | | | |
| | | MSCI All Country World Index (net div) (f) | | 26.60% | | 8.41% | | 8.79% | | |
| (f) | Source: FactSet Research Systems Inc. |
Benchmark Definition(s)
MSCI All Country World Index (net div) – a market capitalization-weighted index that is designed to measure equity market performance in the global developed and emerging markets. Morgan Stanley Capital International (“MSCI”) makes no express or implied warranties or representations and shall have no liability whatsoever with respect to any MSCI data contained herein. The MSCI data may not be further redistributed or used as a basis for other indices or any securities or financial products. This report is not approved, reviewed, or produced by MSCI.
It is not possible to invest directly in an index.
Notes to Performance Summary
Average annual total return represents the average annual change in value for each share class for the periods presented.
Performance results reflect any applicable expense subsidies and waivers in effect during the periods shown. Without such subsidies and waivers the fund’s performance results would be less favorable. Please see the prospectus and financial statements for complete details. All results are historical and assume the reinvestment of any dividends and capital gains distributions.
Performance results do not include adjustments made for financial reporting purposes in accordance with U.S. generally accepted accounting principles and may differ from amounts reported in the financial highlights.
From time to time the fund may receive proceeds from litigation settlements, without which performance would be lower.
5
MFS Global Research Portfolio
EXPENSE TABLE
Fund Expenses Borne by the Contract Holders during the Period,
July 1, 2019 through December 31, 2019
As a contract holder of the fund, you incur ongoing costs, including management fees; distribution and/or service(12b-1) fees; and other fund expenses. This example is intended to help you understand your ongoing costs (in dollars) of investing in the fund and to compare these costs with the ongoing costs of investing in other mutual funds.
The example is based on an investment of $1,000 invested at the beginning of the period and held for the entire period July 1, 2019 through December 31, 2019.
Actual Expenses
The first line for each share class in the following table provides information about actual account values and actual expenses. You may use the information in this line, together with the amount you invested, to estimate the expenses that you paid over the period. Simply divide your account value by $1,000 (for example, an $8,600 account value divided by $1,000 = 8.6), then multiply the result by the number in the first line under the heading entitled “Expenses Paid During Period” to estimate the expenses you paid on your account during this period.
Hypothetical Example for Comparison Purposes
The second line for each share class in the following table provides information about hypothetical account values and hypothetical expenses based on the fund’s actual expense ratio and an assumed rate of return of 5% per year before expenses, which is not the fund’s actual return. The hypothetical account values and expenses may not be used to estimate the actual ending account balance or expenses you paid for the period. You may use this information to compare the ongoing costs of investing in the fund and other funds. To do so, compare this 5% hypothetical example with the 5% hypothetical examples that appear in the shareholder reports of the other funds.
Please note that the expenses shown in the table are meant to highlight the fund’s ongoing costs only and do not take into account the fees and expenses imposed under the variable contracts through which your investment in the fund is made. Therefore, the second line for each share class in the table is useful in comparing ongoing costs associated with an investment in vehicles (such as the fund) which fund benefits under variable annuity and variable life insurance contracts and to qualified pension and retirement plans only, and will not help you determine the relative total costs of investing in the fund through variable annuity and variable life insurance contracts. If the fees and expenses imposed under the variable contracts were included, your costs would have been higher.
| | | | | | | | | | | | | | | | | | |
| Share Class | | | | Annualized
Expense Ratio | | | Beginning
Account Value
7/01/19 | | | Ending Account Value 12/31/19 | | | Expenses Paid
During Period (p)
7/01/19-12/31/19 | |
| Initial Class | | Actual | | | 0.85% | | | | $1,000.00 | | | | $1,095.62 | | | | $4.49 | |
| | Hypothetical (h) | | | 0.85% | | | | $1,000.00 | | | | $1,020.92 | | | | $4.33 | |
| Service Class | | Actual | | | 1.10% | | | | $1,000.00 | | | | $1,094.04 | | | | $5.81 | |
| | Hypothetical (h) | | | 1.10% | | | | $1,000.00 | | | | $1,019.66 | | | | $5.60 | |
| (h) | 5% class return per year before expenses. |
| (p) | “Expenses Paid During Period” are equal to each class’s annualized expense ratio, as shown above, multiplied by the average account value over the period, multiplied by 184/365 (to reflect theone-half year period). |
6
MFS Global Research Portfolio
PORTFOLIO OF INVESTMENTS – 12/31/19
The Portfolio of Investments is a complete list of all securities owned by your fund. It is categorized by broad-based asset classes.
| | | | | | | | |
| | |
| Issuer | | Shares/Par | | | Value ($) | |
| COMMON STOCKS – 99.5% | | | | | |
| Aerospace – 3.6% | | | | | | | | |
| Honeywell International, Inc. | | | 6,804 | | | $ | 1,204,308 | |
| Huntington Ingalls Industries, Inc. | | | 1,799 | | | | 451,333 | |
| L3Harris Technologies, Inc. | | | 1,631 | | | | 322,726 | |
| Northrop Grumman Corp. | | | 1,575 | | | | 541,753 | |
| United Technologies Corp. | | | 5,358 | | | | 802,414 | |
| | | | | | | | |
| | | | | | $ | 3,322,534 | |
| | | | | | | | |
| Alcoholic Beverages – 1.2% | | | | | | | | |
| Ambev S.A., ADR | | | 61,472 | | | $ | 286,459 | |
| China Resources Beer Holdings Co. Ltd. | | | 78,000 | | | | 431,426 | |
| Constellation Brands, Inc., “A” | | | 2,245 | | | | 425,989 | |
| | | | | | | | |
| | | | | | $ | 1,143,874 | |
| | | | | | | | |
| Apparel Manufacturers – 2.6% | | | | | | | | |
| Adidas AG | | | 2,330 | | | $ | 757,410 | |
| LVMH Moet Hennessy Louis Vuitton SE | | | 1,955 | | | | 908,309 | |
| NIKE, Inc., “B” | | | 7,509 | | | | 760,737 | |
| | | | | | | | |
| | | | | | $ | 2,426,456 | |
| | | | | | | | |
| Automotive – 0.3% | | | | | | | | |
| IAA, Inc. (a) | | | 5,673 | | | $ | 266,971 | |
| | | | | | | | |
| Brokerage & Asset Managers – 3.6% | | | | | | | | |
| Blackstone Group, Inc. | | | 10,268 | | | $ | 574,392 | |
| Charles Schwab Corp. | | | 21,751 | | | | 1,034,478 | |
| CME Group, Inc. | | | 2,870 | | | | 576,066 | |
| Euronext N.V. | | | 9,200 | | | | 749,722 | |
| TD Ameritrade Holding Corp. | | | 7,946 | | | | 394,916 | |
| | | | | | | | |
| | | | | | $ | 3,329,574 | |
| | | | | | | | |
| Business Services – 4.5% | | | | | | | | |
| Accenture PLC, “A” | | | 3,446 | | | $ | 725,624 | |
| Fidelity National Information Services, Inc. | | | 7,140 | | | | 993,103 | |
| Fiserv, Inc. (a) | | | 12,094 | | | | 1,398,429 | |
| Global Payments, Inc. | | | 5,788 | | | | 1,056,657 | |
| | | | | | | | |
| | | | | | $ | 4,173,813 | |
| | | | | | | | |
| Cable TV – 1.0% | | | | | | | | |
| Comcast Corp., “A” | | | 20,432 | | | $ | 918,827 | |
| | | | | | | | |
| Chemicals – 0.4% | | | | | | | | |
| FMC Corp. | | | 4,111 | | | $ | 410,360 | |
| | | | | | | | |
| Computer Software – 6.6% | | | | | | | | |
| Adobe Systems, Inc. (a) | | | 3,339 | | | $ | 1,101,235 | |
| Cadence Design Systems, Inc. (a) | | | 8,403 | | | | 582,832 | |
| Microsoft Corp. (s) | | | 18,838 | | | | 2,970,753 | |
| Salesforce.com, Inc. (a) | | | 9,314 | | | | 1,514,829 | |
| | | | | | | | |
| | | | | | $ | 6,169,649 | |
| | | | | | | | |
| Computer Software – Systems – 2.5% | | | | | | | | |
| Apple, Inc. | | | 1,918 | | | $ | 563,221 | |
| Constellation Software, Inc. | | | 748 | | | | 726,462 | |
| Fujitsu Ltd. | | | 6,100 | | | | 575,614 | |
| Square, Inc., “A” (a) | | | 3,537 | | | | 221,275 | |
| | | | | | | | |
| | |
| Issuer | | Shares/Par | | | Value ($) | |
| COMMON STOCKS – continued | | | | | |
| Computer Software – Systems – continued | | | | | |
| Zebra Technologies Corp., “A” (a) | | | 1,110 | | | $ | 283,538 | |
| | | | | | | | |
| | | | | | $ | 2,370,110 | |
| | | | | | | | |
| Construction – 3.2% | | | | | | | | |
| Masco Corp. | | | 13,859 | | | $ | 665,093 | |
| Sherwin-Williams Co. | | | 1,569 | | | | 915,574 | |
| Techtronic Industries Co. Ltd. | | | 56,500 | | | | 460,785 | |
| Toll Brothers, Inc. | | | 11,109 | | | | 438,917 | |
| Vulcan Materials Co. | | | 3,782 | | | | 544,570 | |
| | | | | | | | |
| | | | | | $ | 3,024,939 | |
| | | | | | | | |
| Consumer Products – 1.0% | | | | | | | | |
| Kao Corp. | | | 6,000 | | | $ | 494,868 | |
| Reckitt Benckiser Group PLC | | | 5,754 | | | | 467,137 | |
| | | | | | | | |
| | | | | | $ | 962,005 | |
| | | | | | | | |
| Consumer Services – 0.8% | | | | | | | | |
| 51job, Inc., ADR (a) | | | 3,856 | | | $ | 327,374 | |
| Booking Holdings, Inc. (a) | | | 205 | | | | 421,015 | |
| | | | | | | | |
| | | | | | $ | 748,389 | |
| | | | | | | | |
| Electrical Equipment – 2.0% | | | | | | | | |
| HD Supply Holdings, Inc. (a) | | | 10,990 | | | $ | 442,018 | |
| Schneider Electric SE | | | 9,803 | | | | 1,006,136 | |
| TE Connectivity Ltd. | | | 3,860 | | | | 369,942 | |
| | | | | | | | |
| | | | | | $ | 1,818,096 | |
| | | | | | | | |
| Electronics – 3.4% | | | | | | | | |
| Analog Devices, Inc. | | | 7,215 | | | $ | 857,431 | |
| NXP Semiconductors N.V. | | | 5,891 | | | | 749,689 | |
| Taiwan Semiconductor Manufacturing Co. Ltd. | | | 103,000 | | | | 1,137,305 | |
| Taiwan Semiconductor Manufacturing Co. Ltd., ADR | | | 6,463 | | | | 375,500 | |
| | | | | | | | |
| | | | | | $ | 3,119,925 | |
| | | | | | | | |
| Energy – Independent – 1.7% | | | | | | | | |
| ConocoPhillips | | | 11,522 | | | $ | 749,276 | |
| Oil Search Ltd. | | | 78,791 | | | | 400,864 | |
| Valero Energy Corp. | | | 4,830 | | | | 452,329 | |
| | | | | | | | |
| | | | | | $ | 1,602,469 | |
| | | | | | | | |
| Energy – Integrated – 2.2% | | | | | | | | |
| BP PLC | | | 116,982 | | | $ | 730,765 | |
| Galp Energia SGPS S.A., “B” | | | 39,177 | | | | 654,778 | |
| Suncor Energy, Inc. | | | 21,357 | | | | 699,976 | |
| | | | | | | | |
| | | | | | $ | 2,085,519 | |
| | | | | | | | |
| Food & Beverages – 3.2% | | | | | | | | |
| Danone S.A. | | | 5,896 | | | $ | 488,741 | |
| Mondelez International, Inc. | | | 12,144 | | | | 668,891 | |
| Nestle S.A. | | | 9,495 | | | | 1,027,987 | |
| PepsiCo, Inc. | | | 5,713 | | | | 780,796 | |
| | | | | | | | |
| | | | | | $ | 2,966,415 | |
| | | | | | | | |
7
MFS Global Research Portfolio
Portfolio of Investments – continued
| | | | | | | | |
| | |
| Issuer | | Shares/Par | | | Value ($) | |
| COMMON STOCKS – continued | | | | | |
| Gaming & Lodging – 1.1% | | | | | |
| Flutter Entertainment PLC | | | 3,207 | | | $ | 391,835 | |
| Marriott International, Inc., “A” | | | 4,364 | | | | 660,840 | |
| | | | | | | | |
| | | | | | $ | 1,052,675 | |
| | | | | | | | |
| General Merchandise – 0.6% | | | | | | | | |
| Dollar General Corp. | | | 3,871 | | | $ | 603,799 | |
| | | | | | | | |
| Health Maintenance Organizations – 0.7% | | | | | |
| Cigna Corp. | | | 2,960 | | | $ | 605,290 | |
| | | | | | | | |
| Insurance – 3.5% | | | | | | | | |
| AIA Group Ltd. | | | 119,200 | | | $ | 1,251,307 | |
| Aon PLC | | | 6,116 | | | | 1,273,902 | |
| Chubb Ltd. | | | 4,900 | | | | 762,734 | |
| | | | | | | | |
| | | | | | $ | 3,287,943 | |
| | | | | | | | |
| Internet – 4.6% | | | | | | | | |
| Alphabet, Inc., “A” (a)(s) | | | 1,579 | | | $ | 2,114,897 | |
| Facebook, Inc., “A” (a) | | | 7,280 | | | | 1,494,220 | |
| NAVER Corp. (a) | | | 3,919 | | | | 632,015 | |
| | | | | | | | |
| | | | | | $ | 4,241,132 | |
| | | | | | | | |
| Leisure & Toys – 0.6% | | | | | | | | |
| Electronic Arts, Inc. (a) | | | 5,472 | | | $ | 588,295 | |
| | | | | | | | |
| Machinery & Tools – 2.6% | | | | | | | | |
| Flowserve Corp. | | | 8,458 | | | $ | 420,955 | |
| GEA Group AG | | | 10,916 | | | | 360,967 | |
| Kubota Corp. | | | 27,100 | | | | 424,544 | |
| Roper Technologies, Inc. | | | 2,321 | | | | 822,168 | |
| Schindler Holding AG | | | 1,646 | | | | 418,728 | |
| | | | | | | | |
| | | | | | $ | 2,447,362 | |
| | | | | | | | |
| Major Banks – 3.8% | | | | | | | | |
| BNP Paribas | | | 17,830 | | | $ | 1,056,595 | |
| Goldman Sachs Group, Inc. | | | 5,066 | | | | 1,164,825 | |
| Mitsubishi UFJ Financial Group, Inc. | | | 109,000 | | | | 589,102 | |
| UBS Group AG | | | 54,443 | | | | 687,710 | |
| | | | | | | | |
| | | | | | $ | 3,498,232 | |
| | | | | | | | |
| Medical & Health Technology & Services – 0.9% | | | | | |
| ICON PLC (a) | | | 4,601 | | | $ | 792,430 | |
| | | | | | | | |
| Medical Equipment – 5.7% | | | | | | | | |
| Becton, Dickinson and Co. | | | 3,079 | | | $ | 837,396 | |
| Boston Scientific Corp. (a) | | | 16,341 | | | | 738,940 | |
| Danaher Corp. | | | 6,834 | | | | 1,048,882 | |
| EssilorLuxottica | | | 5,252 | | | | 800,021 | |
| Medtronic PLC | | | 10,281 | | | | 1,166,379 | |
| PerkinElmer, Inc. | | | 7,375 | | | | 716,113 | |
| | | | | | | | |
| | | | | | $ | 5,307,731 | |
| | | | | | | | |
| Natural Gas – Distribution – 0.5% | | | | | | | | |
| China Resources Gas Group Ltd. | | | 84,000 | | | $ | 461,379 | |
| | | | | | | | |
| Natural Gas – Pipeline – 0.5% | | | | | | | | |
| Enterprise Products Partners LP | | | 15,354 | | | $ | 432,369 | |
| | | | | | | | |
| Other Banks & Diversified Financials – 7.2% | | | | | |
| AEON Financial Service Co. Ltd. | | | 26,400 | | | $ | 415,243 | |
| Credicorp Ltd. | | | 3,597 | | | | 766,629 | |
| | | | | | | | |
| | |
| Issuer | | Shares/Par | | | Value ($) | |
| COMMON STOCKS – continued | | | | | |
| Other Banks & Diversified Financials – continued | | | | | |
| HDFC Bank Ltd. | | | 49,744 | | | $ | 886,536 | |
| Intesa Sanpaolo S.p.A. | | | 288,593 | | | | 760,244 | |
| Julius Baer Group Ltd. | | | 12,489 | | | | 644,323 | |
| KBC Group N.V. | | | 10,288 | | | | 773,876 | |
| Mastercard, Inc., “A” | | | 4,590 | | | | 1,370,528 | |
| Truist Financial Corp. | | | 19,051 | | | | 1,072,952 | |
| | | | | | | | |
| | | | | | $ | 6,690,331 | |
| | | | | | | | |
| Pharmaceuticals – 4.4% | | | | | | | | |
| Bayer AG | | | 8,774 | | | $ | 716,581 | |
| Elanco Animal Health, Inc. (a) | | | 11,627 | | | | 342,415 | |
| Roche Holding AG | | | 4,214 | | | | 1,367,220 | |
| Santen Pharmaceutical Co. Ltd. | | | 41,700 | | | | 795,091 | |
| Zoetis, Inc. | | | 6,533 | | | | 864,643 | |
| | | | | | | | |
| | | | | | $ | 4,085,950 | |
| | | | | | | | |
| Printing & Publishing – 0.4% | | | | | | | | |
| Wolters Kluwer N.V. | | | 4,867 | | | $ | 354,965 | |
| | | | | | | | |
| Railroad & Shipping – 0.9% | | | | | | | | |
| Canadian Pacific Railway Ltd. | | | 2,165 | | | $ | 551,967 | |
| DP World Ltd. | | | 19,439 | | | | 254,651 | |
| | | | | | | | |
| | | | | | $ | 806,618 | |
| | | | | | | | |
| Real Estate – 1.9% | | | | | | | | |
| LEG Immobilien AG | | | 8,830 | | | $ | 1,045,432 | |
| STORE Capital Corp., REIT | | | 19,330 | | | | 719,849 | |
| | | | | | | | |
| | | | | | $ | 1,765,281 | |
| | | | | | | | |
| Restaurants – 1.4% | | | | | | | | |
| Starbucks Corp. | | | 8,504 | | | $ | 747,672 | |
| Yum China Holdings, Inc. | | | 11,462 | | | | 550,290 | |
| | | | | | | | |
| | | | | | $ | 1,297,962 | |
| | | | | | | | |
| Specialty Chemicals – 3.2% | | | | | | | | |
| Akzo Nobel N.V. | | | 5,059 | | | $ | 514,353 | |
| Croda International PLC | | | 8,738 | | | | 592,607 | |
| DuPont de Nemours, Inc. | | | 7,514 | | | | 482,399 | |
| Linde PLC | | | 4,019 | | | | 860,148 | |
| Sika AG | | | 2,900 | | | | 544,911 | |
| | | | | | | | |
| | | | | | $ | 2,994,418 | |
| | | | | | | | |
| Specialty Stores – 3.7% | | | | | | | | |
| Amazon.com, Inc. (a)(s) | | | 1,086 | | | $ | 2,006,754 | |
| Burlington Stores, Inc. (a) | | | 2,348 | | | | 535,414 | |
| Target Corp. | | | 6,775 | | | | 868,623 | |
| | | | | | | | |
| | | | | | $ | 3,410,791 | |
| | | | | | | | |
| Telecommunications – Wireless – 2.0% | | | | | |
| Advanced Info Service Public Co. Ltd. | | | 74,200 | | | $ | 527,634 | |
| American Tower Corp., REIT | | | 2,937 | | | | 674,981 | |
| KDDI Corp. | | | 23,300 | | | | 693,170 | |
| | | | | | | | |
| | | | | | $ | 1,895,785 | |
| | | | | | | | |
| Telephone Services – 1.1% | | | | | | | | |
| Hellenic Telecommunications Organization S.A. | | | 31,388 | | | $ | 502,065 | |
| TELUS Corp. | | | 14,330 | | | | 554,859 | |
| | | | | | | | |
| | | | | | $ | 1,056,924 | |
| | | | | | | | |
8
MFS Global Research Portfolio
Portfolio of Investments – continued
| | | | | | | | |
| | |
| Issuer | | Shares/Par | | | Value ($) | |
| COMMON STOCKS – continued | | | | | |
| Tobacco – 0.9% | | | | | | | | |
| British American Tobacco PLC | | | 9,168 | | | $ | 392,431 | |
| Philip Morris International, Inc. | | | 5,464 | | | | 464,932 | |
| | | | | | | | |
| | | | | | $ | 857,363 | |
| | | | | | | | |
| Utilities – Electric Power – 3.5% | | | | | | | | |
| CLP Holdings Ltd. | | | 53,500 | | | $ | 562,305 | |
| CMS Energy Corp. | | | 15,581 | | | | 979,110 | |
| Iberdrola S.A. | | | 55,276 | | | | 569,188 | |
| NextEra Energy, Inc. | | | 3,123 | | | | 756,266 | |
| Orsted A.S. | | | 4,240 | | | | 438,521 | |
| | | | | | | | |
| | | | | | $ | 3,305,390 | |
| | | | | | | | |
Total Common Stocks
(Identified Cost, $68,764,218) | | | | | | $ | 92,700,340 | |
| | | | | | | | |
| |
| INVESTMENT COMPANIES (h) – 0.5% | | | | | |
| Money Market Funds – 0.5% | | | | | |
| MFS Institutional Money Market Portfolio, 1.7% (v) (Identified Cost, $458,273) | | | 458,273 | | | $ | 458,273 | |
| | | | | | | | |
OTHER ASSETS, LESS
LIABILITIES – 0.0% | | | | | | | 12,795 | |
| | | | | �� | | | |
| NET ASSETS – 100.0% | | | | | | $ | 93,171,408 | |
| | | | | | | | |
| (a) | | Non-income producing security. |
| (h) | | An affiliated issuer, which may be considered one in which the fund owns 5% or more of the outstanding voting securities, or a company which is under common control. At period end, the aggregate values of the fund’s investments in affiliated issuers and in unaffiliated issuers were $458,273 and $92,700,340, respectively. |
| (s) | | Security or a portion of the security was pledged to cover collateral requirements for certain derivative transactions. |
| (v) | | Affiliated issuer that is available only to investment companies managed by MFS. The rate quoted for the MFS Institutional Money Market Portfolio is the annualizedseven-day yield of the fund at period end. |
The following abbreviations are used in this report and are defined:
| ADR | | American Depositary Receipt |
| REIT | | Real Estate Investment Trust |
At December 31, 2019, the fund had cash collateral of $2,587 and other liquid securities with an aggregate value of $566,829 to cover any collateral or margin obligations for certain derivative contracts. Restricted cash and deposits with brokers in the Statement of Assets and Liabilities are comprised of cash collateral.
See Notes to Financial Statements
9
MFS Global Research Portfolio
FINANCIAL STATEMENTS | STATEMENT OF ASSETS AND LIABILITIES
This statement represents your fund’s balance sheet, which details the assets and liabilities comprising the total value of the fund.
| | | | |
At 12/31/19 | | | | |
| |
Assets | | | | |
Investments in unaffiliated issuers, at value (identified cost, $68,764,218) | | | $92,700,340 | |
Investments in affiliated issuers, at value (identified cost, $458,273) | | | 458,273 | |
Deposits with brokers | | | 2,587 | |
Receivables for | | | | |
Investments sold | | | 195,498 | |
Interest and dividends | | | 164,408 | |
Receivable from investment adviser | | | 5,940 | |
Other assets | | | 810 | |
Total assets | | | $93,527,856 | |
| |
Liabilities | | | | |
Payable to custodian | | | $5,644 | |
Payables for | | | | |
Investments purchased | | | 94,003 | |
Fund shares reacquired | | | 147,032 | |
Payable to affiliates | | | | |
Administrative services fee | | | 125 | |
Shareholder servicing costs | | | 4 | |
Distribution and/or service fees | | | 83 | |
Payable for independent Trustees’ compensation | | | 15 | |
Deferred country tax expense payable | | | 34,792 | |
Accrued expenses and other liabilities | | | 74,750 | |
Total liabilities | | | $356,448 | |
Net assets | | | $93,171,408 | |
| |
Net assets consist of | | | | |
Paid-in capital | | | $62,218,565 | |
Total distributable earnings (loss) | | | 30,952,843 | |
Net assets | | | $93,171,408 | |
Shares of beneficial interest outstanding | | | 2,895,518 | |
| | | | | | | | | | | | |
| | | |
| | | Net assets | | | Shares
outstanding | | | Net asset value
per share | |
Initial Class | | | $87,137,880 | | | | 2,707,344 | | | | $32.19 | |
Service Class | | | 6,033,528 | | | | 188,174 | | | | 32.06 | |
See Notes to Financial Statements
10
MFS Global Research Portfolio
FINANCIAL STATEMENTS | STATEMENT OF OPERATIONS
This statement describes how much your fund earned in investment income and accrued in expenses. It also describes any gains and/or losses generated by fund operations.
| | | | |
Year ended 12/31/19 | | | | |
| |
Net investment income (loss) | | | | |
Income | | | | |
Dividends | | | $2,033,922 | |
Dividends from affiliated issuers | | | 10,790 | |
Income on securities loaned | | | 8,691 | |
Other | | | 354 | |
Foreign taxes withheld | | | (112,464 | ) |
Total investment income | | | $1,941,293 | |
Expenses | | | | |
Management fee | | | $678,241 | |
Distribution and/or service fees | | | 14,877 | |
Shareholder servicing costs | | | 1,256 | |
Administrative services fee | | | 22,914 | |
Independent Trustees’ compensation | | | 3,096 | |
Custodian fee | | | 37,438 | |
Shareholder communications | | | 9,358 | |
Audit and tax fees | | | 63,420 | |
Legal fees | | | 778 | |
Miscellaneous | | | 34,110 | |
Total expenses | | | $865,488 | |
Reduction of expenses by investment adviser | | | (81,046 | ) |
Net expenses | | | $784,442 | |
Net investment income (loss) | | | $1,156,851 | |
| |
Realized and unrealized gain (loss) | | | | |
Realized gain (loss) (identified cost basis) | | | | |
Unaffiliated issuers (net of $12,614 country tax) | | | $5,830,413 | |
Affiliated issuers | | | (18 | ) |
Foreign currency | | | 874 | |
Net realized gain (loss) | | | $5,831,269 | |
Change in unrealized appreciation or depreciation | | | | |
Unaffiliated issuers (net of $30,895 increase in deferred country tax) | | | $17,805,852 | |
Affiliated issuers | | | 34 | |
Translation of assets and liabilities in foreign currencies | | | 3,306 | |
Net unrealized gain (loss) | | | $17,809,192 | |
Net realized and unrealized gain (loss) | | | $23,640,461 | |
Change in net assets from operations | | | $24,797,312 | |
See Notes to Financial Statements
11
MFS Global Research Portfolio
FINANCIAL STATEMENTS | STATEMENTS OF CHANGES IN NET ASSETS
These statements describe the increases and/or decreases in net assets resulting from operations, any distributions, and any shareholder transactions.
| | | | | | | | |
| | | Year ended | |
| | | 12/31/19 | | | 12/31/18 | |
Change in net assets | | | | | | | | |
| | |
From operations | | | | | | | | |
Net investment income (loss) | | | $1,156,851 | | | | $978,628 | |
Net realized gain (loss) | | | 5,831,269 | | | | 7,591,282 | |
Net unrealized gain (loss) | | | 17,809,192 | | | | (16,336,922 | ) |
Change in net assets from operations | | | $24,797,312 | | | | $(7,767,012 | ) |
Total distributions to shareholders | | | $(8,539,061 | ) | | | $(6,655,034 | ) |
Change in net assets from fund share transactions | | | $(5,951,007 | ) | | | $(8,459,434 | ) |
Total change in net assets | | | $10,307,244 | | | | $(22,881,480 | ) |
| | |
Net assets | | | | | | | | |
At beginning of period | | | 82,864,164 | | | | 105,745,644 | |
At end of period | | | $93,171,408 | | | | $82,864,164 | |
See Notes to Financial Statements
12
MFS Global Research Portfolio
FINANCIAL STATEMENTS | FINANCIAL HIGHLIGHTS
The financial highlights table is intended to help you understand the fund’s financial performance for the past 5 years. Certain information reflects financial results for a single fund share. The total returns in the table represent the rate that an investor would have earned (or lost) on an investment in the fund share class (assuming reinvestment of all distributions) held for the entire period.
| | | | | | | | | | | | | | | | | | | | |
| Initial Class | | Year ended | |
| | | | | |
| | | 12/31/19 | | | 12/31/18 | | | 12/31/17 | | | 12/31/16 | | | 12/31/15 | |
| | | | | |
Net asset value, beginning of period | | | $27.00 | | | | $31.74 | | | | $25.69 | | | | $24.63 | | | | $25.18 | |
| | | | | |
| Income (loss) from investment operations | | | | | | | | | | | | | | | | | | | | |
Net investment income (loss) (d) | | | $0.40 | | | | $0.32 | | | | $0.28 | | | | $0.41 | (c) | | | $0.25 | |
Net realized and unrealized gain (loss) | | | 7.88 | | | | (2.82 | ) | | | 6.24 | | | | 0.93 | | | | (0.47 | ) |
Total from investment operations | | | $8.28 | | | | $(2.50 | ) | | | $6.52 | | | | $1.34 | | | | $(0.22 | ) |
| | | | | |
| Less distributions declared to shareholders | | | | | | | | | | | | | | | | | | | | |
From net investment income | | | $(0.34 | ) | | | $(0.33 | ) | | | $(0.47 | ) | | | $(0.28 | ) | | | $(0.33 | ) |
From net realized gain | | | (2.75 | ) | | | (1.91 | ) | | | — | | | | — | | | | — | |
Total distributions declared to shareholders | | | $(3.09 | ) | | | $(2.24 | ) | | | $(0.47 | ) | | | $(0.28 | ) | | | $(0.33 | ) |
Net asset value, end of period (x) | | | $32.19 | | | | $27.00 | | | | $31.74 | | | | $25.69 | | | | $24.63 | |
Total return (%) (k)(r)(s)(x) | | | 31.96 | | | | (8.83 | ) | | | 25.51 | | | | 5.44 | (c) | | | (0.81 | ) |
| | | | | |
Ratios (%) (to average net assets)
and Supplemental data: | | | | | | | | | | | | | | | | | | | | |
Expenses before expense reductions (f) | | | 0.94 | | | | 0.93 | | | | 0.92 | | | | 0.78 | (c) | | | 0.92 | |
Expenses after expense reductions (f) | | | 0.85 | | | | 0.88 | | | | 0.92 | | | | 0.77 | (c) | | | 0.91 | |
Net investment income (loss) | | | 1.29 | | | | 1.01 | | | | 0.97 | | | | 1.64 | (c) | | | 0.98 | |
Portfolio turnover | | | 27 | | | | 22 | | | | 33 | | | | 40 | | | | 40 | |
Net assets at end of period (000 omitted) | | | $87,138 | | | | $77,345 | | | | $98,434 | | | | $91,281 | | | | $98,321 | |
| |
| Service Class | | Year ended | |
| | | | | |
| | | 12/31/19 | | | 12/31/18 | | | 12/31/17 | | | 12/31/16 | | | 12/31/15 | |
| | | | | |
Net asset value, beginning of period | | | $26.89 | | | | $31.61 | | | | $25.59 | | | | $24.52 | | | | $25.06 | |
| | | | | |
| Income (loss) from investment operations | | | | | | | | | | | | | | | | | | | | |
Net investment income (loss) (d) | | | $0.32 | | | | $0.24 | | | | $0.21 | | | | $0.34 | (c) | | | $0.19 | |
Net realized and unrealized gain (loss) | | | 7.85 | | | | (2.82 | ) | | | 6.20 | | | | 0.94 | | | | (0.47 | ) |
Total from investment operations | | | $8.17 | | | | $(2.58 | ) | | | $6.41 | | | | $1.28 | | | | $(0.28 | ) |
| | | | | |
| Less distributions declared to shareholders | | | | | | | | | | | | | | | | | | | | |
From net investment income | | | $(0.25 | ) | | | $(0.23 | ) | | | $(0.39 | ) | | | $(0.21 | ) | | | $(0.26 | ) |
From net realized gain | | | (2.75 | ) | | | (1.91 | ) | | | — | | | | — | | | | — | |
Total distributions declared to shareholders | | | $(3.00 | ) | | | $(2.14 | ) | | | $(0.39 | ) | | | $(0.21 | ) | | | $(0.26 | ) |
Net asset value, end of period (x) | | | $32.06 | | | | $26.89 | | | | $31.61 | | | | $25.59 | | | | $24.52 | |
Total return (%) (k)(r)(s)(x) | | | 31.62 | | | | (9.06 | ) | | | 25.17 | | | | 5.21 | (c) | | | (1.09 | ) |
| | | | | |
Ratios (%) (to average net assets)
and Supplemental data: | | | | | | | | | | | | | | | | | | | | |
Expenses before expense reductions (f) | | | 1.19 | | | | 1.18 | | | | 1.17 | | | | 1.03 | (c) | | | 1.17 | |
Expenses after expense reductions (f) | | | 1.10 | | | | 1.13 | | | | 1.17 | | | | 1.02 | (c) | | | 1.16 | |
Net investment income (loss) | | | 1.06 | | | | 0.76 | | | | 0.73 | | | | 1.39 | (c) | | | 0.74 | |
Portfolio turnover | | | 27 | | | | 22 | | | | 33 | | | | 40 | | | | 40 | |
Net assets at end of period (000 omitted) | | | $6,034 | | | | $5,519 | | | | $7,312 | | | | $7,415 | | | | $8,151 | |
See Notes to Financial Statements
13
MFS Global Research Portfolio
Financial Highlights – continued
| (c) | Amount reflects aone-time reimbursement of expenses by the custodian (or former custodian) without which net investment income and performance would be lower and expenses would be higher. |
| (d) | Per share data is based on average shares outstanding. |
| (f) | Ratios do not reflect reductions from fees paid indirectly, if applicable. |
| (k) | The total return does not reflect expenses that apply to separate accounts. Inclusion of these charges would reduce the total return figures for all periods shown. |
| (r) | Certain expenses have been reduced without which performance would have been lower. |
| (s) | From time to time the fund may receive proceeds from litigation settlements, without which performance would be lower. |
| (x) | The net asset values and total returns have been calculated on net assets which include adjustments made in accordance with U.S. generally accepted accounting principles required at period end for financial reporting purposes. |
See Notes to Financial Statements
14
MFS Global Research Portfolio
NOTES TO FINANCIAL STATEMENTS
| (1) | | Business and Organization |
MFS Global Research Portfolio (the fund) is a diversified series of MFS Variable Insurance Trust II (the trust). The trust is organized as a Massachusetts business trust and is registered under the Investment Company Act of 1940, as amended, as anopen-end management investment company. The shareholders of each series of the trust are separate accounts of insurance companies, which offer variable annuity and/or life insurance products, and qualified retirement and pension plans.
The fund is an investment company and accordingly follows the investment company accounting and reporting guidance of the Financial Accounting Standards Board (FASB) Accounting Standards Codification Topic 946 Financial Services – Investment Companies.
| (2) | | Significant Accounting Policies |
General– The preparation of financial statements in conformity with U.S. generally accepted accounting principles requires management to make estimates and assumptions that affect the reported amounts of assets and liabilities, and disclosure of contingent assets and liabilities at the date of the financial statements and the reported amounts of increases and decreases in net assets from operations during the reporting period. Actual results could differ from those estimates. In the preparation of these financial statements, management has evaluated subsequent events occurring after the date of the fund’s Statement of Assets and Liabilities through the date that the financial statements were issued. The fund invests in foreign securities. Investments in foreign securities are vulnerable to the effects of changes in the relative values of the local currency and the U.S. dollar and to the effects of changes in each country’s market, economic, industrial, political, regulatory, geopolitical, and other conditions.
Balance Sheet Offsetting– The fund’s accounting policy with respect to balance sheet offsetting is that, absent an event of default by the counterparty or a termination of the agreement, the International Swaps and Derivatives Association (ISDA) Master Agreement, or similar agreement, does not result in an offset of reported amounts of financial assets and financial liabilities in the Statement of Assets and Liabilities across transactions between the fund and the applicable counterparty. The fund’s right to setoff may be restricted or prohibited by the bankruptcy or insolvency laws of the particular jurisdiction to which a specific master netting agreement counterparty is subject. Balance sheet offsetting disclosures, to the extent applicable to the fund, have been included in the fund’s Significant Accounting Policies note under the captions for each of the fund’sin-scope financial instruments and transactions.
Investment Valuations– Equity securities, including restricted equity securities, are generally valued at the last sale or official closing price on their primary market or exchange as provided by a third-party pricing service. Equity securities, for which there were no sales reported that day, are generally valued at the last quoted daily bid quotation on their primary market or exchange as provided by a third-party pricing service. Short-term instruments with a maturity at issuance of 60 days or less may be valued at amortized cost, which approximates market value.Open-end investment companies are generally valued at net asset value per share. Securities and other assets generally valued on the basis of information from a third-party pricing service may also be valued at a broker/dealer bid quotation. In determining values, third-party pricing services can utilize both transaction data and market information such as yield, quality, coupon rate, maturity, type of issue, trading characteristics, and other market data. The values of foreign securities and other assets and liabilities expressed in foreign currencies are converted to U.S. dollars using the mean of bid and asked prices for rates provided by a third-party pricing service.
The Board of Trustees has delegated primary responsibility for determining or causing to be determined the value of the fund’s investments (including any fair valuation) to the adviser pursuant to valuation policies and procedures approved by the Board. If the adviser determines that reliable market quotations are not readily available, investments are valued at fair value as determined in good faith by the adviser in accordance with such procedures under the oversight of the Board of Trustees. Under the fund’s valuation policies and procedures, market quotations are not considered to be readily available for most types of debt instruments and floating rate loans and many types of derivatives. These investments are generally valued at fair value based on information from third-party pricing services. In addition, investments may be valued at fair value if the adviser determines that an investment’s value has been materially affected by events occurring after the close of the exchange or market on which the investment is principally traded (such as foreign exchange or market) and prior to the determination of the fund’s net asset value, or after the halt of trading of a specific security where trading does not resume prior to the close of the exchange or market on which the security is principally traded. Events that occur after foreign markets close (such as developments in foreign markets and significant movements in the U.S. markets) and prior to the determination of the fund’s net asset value may be deemed to have a material effect on the value of securities traded in foreign markets. Accordingly, the fund’s foreign equity securities may often be valued at fair value. The adviser generally relies on third-party pricing services or other information (such as the correlation with price movements of similar securities in the same or other markets; the type, cost and investment characteristics of the security; the business and financial condition of the issuer; and trading and other market data) to assist in determining whether to fair value and at what value to fair value an investment. The value of an investment for purposes of calculating the fund’s net asset value can differ depending on the source and method used to determine value. When fair valuation is used, the value of an investment used to determine the fund’s net asset
15
MFS Global Research Portfolio
Notes to Financial Statements – continued
value may differ from quoted or published prices for the same investment. There can be no assurance that the fund could obtain the fair value assigned to an investment if it were to sell the investment at the same time at which the fund determines its net asset value per share.
Various inputs are used in determining the value of the fund’s assets or liabilities. These inputs are categorized into three broad levels. In certain cases, the inputs used to measure fair value may fall into different levels of the fair value hierarchy. In such cases, an investment’s level within the fair value hierarchy is based on the lowest level of input that is significant to the fair value measurement. The fund’s assessment of the significance of a particular input to the fair value measurement in its entirety requires judgment, and considers factors specific to the investment. Level 1 includes unadjusted quoted prices in active markets for identical assets or liabilities. Level 2 includes other significant observable market-based inputs (including quoted prices for similar securities, interest rates, prepayment speed, and credit risk). Level 3 includes unobservable inputs, which may include the adviser’s own assumptions in determining the fair value of investments. The following is a summary of the levels used as of December 31, 2019 in valuing the fund’s assets or liabilities:
| | | | | | | | | | | | | | | | |
| Financial Instruments | | Level 1 | | | Level 2 | | | Level 3 | | | Total | |
| Equity Securities: | | | | | | | | | | | | | | | | |
United States | | | $55,601,308 | | | | $— | | | | $— | | | | $55,601,308 | |
France | | | 5,009,524 | | | | — | | | | — | | | | 5,009,524 | |
Switzerland | | | 4,690,879 | | | | — | | | | — | | | | 4,690,879 | |
Japan | | | — | | | | 3,987,632 | | | | — | | | | 3,987,632 | |
Germany | | | 2,880,390 | | | | — | | | | — | | | | 2,880,390 | |
Canada | | | 2,533,264 | | | | — | | | | — | | | | 2,533,264 | |
Hong Kong | | | 2,274,397 | | | | — | | | | — | | | | 2,274,397 | |
United Kingdom | | | 2,182,940 | | | | — | | | | — | | | | 2,182,940 | |
China | | | 1,770,469 | | | | — | | | | — | | | | 1,770,469 | |
Other Countries | | | 11,241,903 | | | | 527,634 | | | | — | | | | 11,769,537 | |
| Mutual Funds | | | 458,273 | | | | — | | | | — | | | | 458,273 | |
| Total | | | $88,643,347 | | | | $4,515,266 | | | | $— | | | | $93,158,613 | |
For further information regarding security characteristics, see the Portfolio of Investments.
Foreign Currency Translation– Purchases and sales of foreign investments, income, and expenses are converted into U.S. dollars based upon currency exchange rates prevailing on the respective dates of such transactions or on the reporting date for foreign denominated receivables and payables. Gains and losses attributable to foreign currency exchange rates on sales of securities are recorded for financial statement purposes as net realized gains and losses on investments. Gains and losses attributable to foreign exchange rate movements on receivables, payables, income and expenses are recorded for financial statement purposes as foreign currency transaction gains and losses. That portion of both realized and unrealized gains and losses on investments that results from fluctuations in foreign currency exchange rates is not separately disclosed.
Security Loans– Under its Securities Lending Agency Agreement with the fund, State Street Bank and Trust Company, as lending agent, loans the securities of the fund to certain qualified institutions (the “Borrowers”) approved by the fund. Security loans can be terminated at the discretion of either the lending agent or the fund and the related securities must be returned within the earlier of the standard trade settlement period for such securities or within three business days. The loans are collateralized by cash and/or U.S. Treasury and federal agency obligations in an amount typically at least equal to the market value of the securities loaned. On loans collateralized by cash, the cash collateral is invested in a money market fund. The market value of the loaned securities is determined at the close of business of the fund and any additional required collateral is delivered to the fund on the next business day. The lending agent provides the fund with indemnification against Borrower default. In the event of Borrower default, the lending agent will, for the benefit of the fund, either purchase securities identical to those loaned or, when such purchase is commercially impracticable, pay the fund the market value of the loaned securities. In return, the lending agent assumes the fund’s rights to the related collateral. If the collateral value is less than the cost to purchase identical securities, the lending agent is responsible for the shortfall, but only to the extent that such shortfall is not due to a decline in collateral value resulting from collateral reinvestment for which the fund bears the risk of loss. A portion of the income generated upon investment of the collateral is remitted to the Borrowers, and the remainder is allocated between the fund and the lending agent. On loans collateralized by U.S. Treasury and/or federal agency obligations, a fee is received from the Borrower, and is allocated between the fund and the lending agent. Income from securities lending is separately reported in the Statement of Operations. The dividend and interest income earned on the securities loaned is accounted for in the same manner as other dividend and interest income. At December 31, 2019, there were no securities on loan or collateral outstanding.
Indemnifications– Under the fund’s organizational documents, its officers and Trustees may be indemnified against certain liabilities and expenses arising out of the performance of their duties to the fund. Additionally, in the normal course of business, the
16
MFS Global Research Portfolio
Notes to Financial Statements – continued
fund enters into agreements with service providers that may contain indemnification clauses. The fund’s maximum exposure under these agreements is unknown as this would involve future claims that may be made against the fund that have not yet occurred.
Investment Transactions and Income– Investment transactions are recorded on the trade date. Interest income is recorded on the accrual basis. Dividends received in cash are recorded on theex-dividend date. Certain dividends from foreign securities will be recorded when the fund is informed of the dividend if such information is obtained subsequent to theex-dividend date. Dividend payments received in additional securities are recorded on theex-dividend date in an amount equal to the value of the security on such date.
The fund may receive proceeds from litigation settlements. Any proceeds received from litigation involving portfolio holdings are reflected in the Statement of Operations in realized gain/loss if the security has been disposed of by the fund or in unrealized gain/loss if the security is still held by the fund. Any other proceeds from litigation not related to portfolio holdings are reflected as other income in the Statement of Operations.
Tax Matters and Distributions– The fund intends to qualify as a regulated investment company, as defined under Subchapter M of the Internal Revenue Code, and to distribute all of its taxable income, including realized capital gains. As a result, no provision for federal income tax is required. The fund’s federal tax returns, when filed, will remain subject to examination by the Internal Revenue Service for a three year period. Management has analyzed the fund’s tax positions taken on federal and state tax returns for all open tax years and does not believe that there are any uncertain tax positions that require recognition of a tax liability. Foreign taxes, if any, have been accrued by the fund in the accompanying financial statements in accordance with the applicable foreign tax law. Foreign income taxes may be withheld by certain countries in which the fund invests. Additionally, capital gains realized by the fund on securities issued in or by certain foreign countries may be subject to capital gains tax imposed by those countries.
Distributions to shareholders are recorded on theex-dividend date. Income and capital gain distributions are determined in accordance with income tax regulations, which may differ from U.S. generally accepted accounting principles. Certain capital accounts in the financial statements are periodically adjusted for permanent differences in order to reflect their tax character. These adjustments have no impact on net assets or net asset value per share. Temporary differences which arise from recognizing certain items of income, expense, gain or loss in different periods for financial statement and tax purposes will reverse at some time in the future.
Book/tax differences primarily relate to partnership adjustments.
The tax character of distributions declared to shareholders for the last two fiscal years is as follows:
| | | | | | | | |
| | | Year ended
12/31/19 | | | Year ended
12/31/18 | |
| Ordinary income (including any short-term capital gains) | | | $1,089,055 | | | | $952,020 | |
| Long-term capital gains | | | 7,450,006 | | | | 5,703,014 | |
| Total distributions | | | $8,539,061 | | | | $6,655,034 | |
The federal tax cost and the tax basis components of distributable earnings were as follows:
| | | | |
| As of 12/31/19 | | | | |
| |
| Cost of investments | | | $69,354,679 | |
| Gross appreciation | | | 26,109,917 | |
| Gross depreciation | | | (2,305,983 | ) |
| Net unrealized appreciation (depreciation) | | | $23,803,934 | |
| |
| Undistributed ordinary income | | | 1,143,107 | |
| Undistributed long-term capital gain | | | 5,840,630 | |
| Other temporary differences | | | 165,172 | |
Multiple Classes of Shares of Beneficial Interest– The fund offers multiple classes of shares, which differ in their respective distribution and/or service fees. The fund’s income, realized and unrealized gain (loss), and common expenses are allocated to shareholders based on the daily net assets of each class. Dividends are declared separately for each class. Differences in per share dividend rates are generally due to differences in separate class expenses. The fund’s distributions declared to shareholders as reported in the Statements of Changes in Net Assets are presented by class as follows:
| | | | | | | | |
| | |
| | | Year ended
12/31/19 | | | Year ended
12/31/18 | |
| Initial Class | | | $8,002,822 | | | | $6,222,796 | |
| Service Class | | | 536,239 | | | | 432,238 | |
| Total | | | $8,539,061 | | | | $6,655,034 | |
17
MFS Global Research Portfolio
Notes to Financial Statements – continued
| (3) | | Transactions with Affiliates |
Investment Adviser– The fund has an investment advisory agreement with MFS to provide overall investment management and related administrative services and facilities to the fund. The management fee is computed daily and paid monthly at the following annual rates based on the fund’s average daily net assets:
| | | | |
| Up to $300 million | | | 0.75% | |
| In excess of $300 million | | | 0.675% | |
MFS has agreed in writing to reduce its management fee by a specified amount if certain MFS mutual fund assets exceed thresholds agreed to by MFS and the fund’s Board of Trustees. For the year ended December 31, 2019, this management fee reduction amounted to $8,815, which is included in the reduction of total expenses in the Statement of Operations. The management fee incurred for the year ended December 31, 2019 was equivalent to an annual effective rate of 0.74% of the fund’s average daily net assets.
The investment adviser has agreed in writing to pay a portion of the fund’s total annual operating expenses, excluding interest, taxes, extraordinary expenses, brokerage and transaction costs, and investment-related expenses, such that total annual operating expenses do not exceed 0.85% of average daily net assets for the Initial Class shares and 1.10% of average daily net assets for the Service Class shares. This written agreement will continue until modified by the fund’s Board of Trustees, but such agreement will continue at least until April 30, 2021. For the year ended December 31, 2019, this reduction amounted to $72,231, which is included in the reduction of total expenses in the Statement of Operations.
Distributor– MFS Fund Distributors, Inc. (MFD), a wholly-owned subsidiary of MFS, is the distributor of shares of the fund. The Trustees have adopted a distribution plan for the Service Class shares pursuant to Rule12b-1 under the Investment Company Act of 1940.
The fund’s distribution plan provides that the fund will pay MFD distribution and/or service fees equal to 0.25% per annum of its average daily net assets attributable to Service Class shares as partial consideration for services performed and expenses incurred by MFD and financial intermediaries (including participating insurance companies that invest in the fund to fund variable annuity and variable life insurance contracts, sponsors of qualified retirement and pension plans that invest in the fund, and affiliates of these participating insurance companies and plan sponsors) in connection with the sale and distribution of the Service Class shares. MFD may subsequently pay all, or a portion, of the distribution and/or service fees to financial intermediaries.
Shareholder Servicing Agent– MFS Service Center, Inc. (MFSC), a wholly-owned subsidiary of MFS, receives a fee from the fund for its services as shareholder servicing agent. For the year ended December 31, 2019, the fee was $1,152, which equated to 0.0013% annually of the fund’s average daily net assets. MFSC also receives payment from the fund forout-of-pocket expenses paid by MFSC on behalf of the fund. For the year ended December 31, 2019, these costs amounted to $104.
Administrator– MFS provides certain financial, legal, shareholder communications, compliance, and other administrative services to the fund. Under an administrative services agreement, the fund reimburses MFS the costs incurred to provide these services. The fund is charged an annual fixed amount of $17,500 plus a fee based on average daily net assets. The administrative services fee incurred for the year ended December 31, 2019 was equivalent to an annual effective rate of 0.0253% of the fund’s average daily net assets.
Trustees’ and Officers’ Compensation– The fund pays compensation to independent Trustees in the form of a retainer, attendance fees, and additional compensation to Board and Committee chairpersons. The fund does not pay compensation directly to Trustees or officers of the fund who are also officers of the investment adviser, all of whom receive remuneration from MFS for their services to the fund. Certain officers and Trustees of the fund are officers or directors of MFS, MFD, and MFSC.
Other– This fund and certain other funds managed by MFS (the funds) had entered into a service agreement (the ISO Agreement) which provided for payment of fees solely by the funds to Tarantino LLC in return for the provision of services of an Independent Senior Officer (ISO) for the funds. Frank L. Tarantino served as the ISO and was an officer of the funds and the sole member of Tarantino LLC. Effective June 30, 2019, Mr. Tarantino retired from his position as ISO for the funds, and the ISO Agreement was terminated. For the year ended December 31, 2019, the fee paid by the fund under this agreement was $106 and is included in “Miscellaneous” expense in the Statement of Operations. MFS had agreed to bear all expenses associated with office space, other administrative support, and supplies provided to the ISO.
The fund invests in the MFS Institutional Money Market Portfolio which is managed by MFS and seeks current income consistent with preservation of capital and liquidity. This money market fund does not pay a management fee to MFS.
The fund is permitted to engage in purchase and sale transactions with funds and accounts for which MFS serves as investment adviser orsub-adviser (“cross-trades”) pursuant to a policy adopted by the Board of Trustees. This policy has been designed to ensure that cross-trades conducted by the fund comply with Rule17a-7 under the Investment Company Act of 1940. During the year ended December 31, 2019, the fund engaged in sale transactions pursuant to this policy, which amounted to $66,929. The sales transactions resulted in net realized gains (losses) of $24,667.
18
MFS Global Research Portfolio
Notes to Financial Statements – continued
For the year ended December 31, 2019, purchases and sales of investments, other than short-term obligations, aggregated $23,778,165 and $37,090,071, respectively.
| (5) | | Shares of Beneficial Interest |
The fund’s Declaration of Trust permits the Trustees to issue an unlimited number of full and fractional shares of beneficial interest. Transactions in fund shares were as follows:
| | | | | | | | | | | | | | | | |
| | | Year ended 12/31/19 | | | Year ended 12/31/18 | |
| | | | |
| | | Shares | | | Amount | | | Shares | | | Amount | |
| Shares sold | | | | | | | | | | | | | | | | |
Initial Class | | | 12,717 | | | | $387,963 | | | | 21,167 | | | | $662,568 | |
Service Class | | | 9,028 | | | | 278,092 | | | | 13,000 | | | | 400,637 | |
| | | 21,745 | | | | $666,055 | | | | 34,167 | | | | $1,063,205 | |
| | | | |
| Shares issued to shareholders in reinvestment of distributions | | | | | | | | | | | | | | | | |
Initial Class | | | 277,010 | | | | $8,002,822 | | | | 199,449 | | | | $6,222,796 | |
Service Class | | | 18,619 | | | | 536,239 | | | | 13,898 | | | | 432,238 | |
| | | 295,629 | | | | $8,539,061 | | | | 213,347 | | | | $6,655,034 | |
| | | | |
| Shares reacquired | | | | | | | | | | | | | | | | |
Initial Class | | | (447,291 | ) | | | $(13,761,706 | ) | | | (457,412 | ) | | | $(14,510,661 | ) |
Service Class | | | (44,709 | ) | | | (1,394,417 | ) | | | (52,984 | ) | | | (1,667,012 | ) |
| | | (492,000 | ) | | | $(15,156,123 | ) | | | (510,396 | ) | | | $(16,177,673 | ) |
| | | | |
| Net change | | | | | | | | | | | | | | | | |
Initial Class | | | (157,564 | ) | | | $(5,370,921 | ) | | | (236,796 | ) | | | $(7,625,297 | ) |
Service Class | | | (17,062 | ) | | | (580,086 | ) | | | (26,086 | ) | | | (834,137 | ) |
| | | (174,626 | ) | | | $(5,951,007 | ) | | | (262,882 | ) | | | $(8,459,434 | ) |
The fund and certain other funds managed by MFS participate in a $1.25 billion unsecured committed line of credit, subject to a $1 billion sublimit, provided by a syndicate of banks under a credit agreement. Borrowings may be made for temporary financing needs. Interest is charged to each fund, based on its borrowings, generally at a rate equal to the highest of one month LIBOR, the Federal Funds Effective Rate and the Overnight Bank Funding Rate, plus an agreed upon spread. A commitment fee, based on the average daily, unused portion of the committed line of credit, is allocated among the participating funds. In addition, the fund and other funds managed by MFS have established unsecured uncommitted borrowing arrangements with certain banks for temporary financing needs. Interest is charged to each fund, based on its borrowings, at rates equal to customary reference rates plus an agreed upon spread. For the year ended December 31, 2019, the fund’s commitment fee and interest expense were $492 and $0, respectively, and are included in “Miscellaneous” expense in the Statement of Operations.
| (7) | | Investments in Affiliated Issuers |
An affiliated issuer may be considered one in which the fund owns 5% or more of the outstanding voting securities, or a company which is under common control. For the purposes of this report, the following were affiliated issuers:
| | | | | | | | | | | | | | | | | | | | | | | | |
| Affiliated Issuers | | Beginning
Value | | | Purchases | | | Sales
Proceeds | | | Realized
Gain
(Loss) | | | Change in
Unrealized
Appreciation or
Depreciation | | | Ending
Value | |
| MFS Institutional Money Market Portfolio | | | $503,401 | | | | $14,382,018 | | | | $14,427,162 | | | | $(18 | ) | | | $34 | | | | $458,273 | |
| | | | | | |
| Affiliated Issuers | | | | | | | | | | | | | | Dividend
Income | | | Capital Gain
Distributions | |
| MFS Institutional Money Market Portfolio | | | | | | | | | | | | | | | | | | | $10,790 | | | | $— | |
19
MFS Global Research Portfolio
REPORT OF INDEPENDENT REGISTERED PUBLIC ACCOUNTING FIRM
To the Board of Trustees of MFS Variable Insurance Trust II and the Shareholders of
MFS Global Research Portfolio:
Opinion on the Financial Statements and Financial Highlights
We have audited the accompanying statement of assets and liabilities of MFS Global Research Portfolio (the “Fund”), including the portfolio of investments, as of December 31, 2019, the related statement of operations for the year then ended, the statements of changes in net assets for each of the two years in the period then ended, the financial highlights for each of the five years in the period then ended, and the related notes. In our opinion, the financial statements and financial highlights present fairly, in all material respects, the financial position of the Fund as of December 31, 2019, and the results of its operations for the year then ended, the changes in its net assets for each of the two years in the period then ended, and the financial highlights for each of the five years in the period then ended, in conformity with accounting principles generally accepted in the United States of America.
Basis for Opinion
These financial statements and financial highlights are the responsibility of the Fund’s management. Our responsibility is to express an opinion on the Fund’s financial statements and financial highlights based on our audits. We are a public accounting firm registered with the Public Company Accounting Oversight Board (United States) (PCAOB) and are required to be independent with respect to the Fund in accordance with the U.S. federal securities laws and the applicable rules and regulations of the Securities and Exchange Commission and the PCAOB.
We conducted our audits in accordance with the standards of the PCAOB. Those standards require that we plan and perform the audit to obtain reasonable assurance about whether the financial statements and financial highlights are free of material misstatement, whether due to error or fraud. The Fund is not required to have, nor were we engaged to perform, an audit of its internal control over financial reporting. As part of our audits we are required to obtain an understanding of internal control over financial reporting but not for the purpose of expressing an opinion on the effectiveness of the Fund’s internal control over financial reporting. Accordingly, we express no such opinion.
Our audits included performing procedures to assess the risks of material misstatement of the financial statements and financial highlights, whether due to error or fraud, and performing procedures that respond to those risks. Such procedures included examining, on a test basis, evidence regarding the amounts and disclosures in the financial statements and financial highlights. Our audits also included evaluating the accounting principles used and significant estimates made by management, as well as evaluating the overall presentation of the financial statements and financial highlights. Our procedures included confirmation of securities owned as of December 31, 2019, by correspondence with the custodian and brokers; when replies were not received from brokers, we performed other auditing procedures. We believe that our audits provide a reasonable basis for our opinion.
DELOITTE & TOUCHE LLP
Boston, Massachusetts
February 14, 2020
We have served as the auditor of one or more of the MFS investment companies since 1924.
20
MFS Global Research Portfolio
TRUSTEES AND OFFICERS – IDENTIFICATION AND BACKGROUND
The Trustees and Officers of the Trust, as of February 1, 2020, are listed below, together with their principal occupations during the past five years. (Their titles may have varied during that period.) The address of each Trustee and Officer is 111 Huntington Avenue, Boston, Massachusetts 02199-7618.
| | | | | | | | | | |
Name, Age | | Position(s)
Held with Fund | | Trustee/Officer
Since (h) | | Number of MFS Funds
overseen by the
Trustee | | Principal Occupations
During the Past Five Years | | Other Directorships During the Past Five Years (j) |
| INTERESTED TRUSTEES |
Robert J. Manning (k)
(age 56) | | Trustee | | February 2004 | | 133 | | Massachusetts Financial Services Company, Executive Chairman (since January 2017); Director; Chairman of the Board; Chief Executive Officer (until 2015);Co-Chief Executive Officer(2015-2016) | | N/A |
| | | | | |
Robin A. Stelmach (k) (age 58) | | Trustee | | January 2014 | | 133 | | Massachusetts Financial Services Company, Vice Chair (since January 2017); Chief Operating Officer and Executive Vice President (until January 2017) | | N/A |
|
| INDEPENDENT TRUSTEES |
John P. Kavanaugh (age 65) | | Trustee and Chair of Trustees | | January 2009 | | 133 | | Private investor | | N/A |
| | | | | |
Steven E. Buller (age 68) | | Trustee | | February 2014 | | 133 | | Financial Accounting Standards Advisory Council, Chairman(2014-2015); Public Company Accounting Oversight Board, Standing Advisory Group, Member (until 2014); BlackRock, Inc. (investment management), Managing Director (until 2014), BlackRock Finco UK (investment management), Director (until 2014) | | N/A |
| | | | | |
John A. Caroselli (age 65) | | Trustee | | March 2017 | | 133 | | JC Global Advisors, LLC (management consulting), President (since 2015); First Capital Corporation (commercial finance), Executive Vice President (until 2015) | | N/A |
| | | | | |
Maureen R. Goldfarb (age 64) | | Trustee | | January 2009 | | 133 | | Private investor | | N/A |
| | | | | |
Peter D. Jones
(age 64) | | Trustee | | January 2019 | | 133 | | Franklin Templeton Distributors, Inc. (investment management), President (until 2015); Franklin Templeton Institutional, LLC (investment management), Chairman (until 2015) | | N/A |
| | | | | |
James W. Kilman, Jr.
(age 58) | | Trustee | | January 2019 | | 133 | | Burford Capital Limited (finance and investment management), Chief Financial Officer (since 2019); KielStrand Capital LLC (family office), Chief Executive Officer (since 2016); Morgan Stanley & Co. (financial services), Vice Chairman of Investment Banking,Co-Head of Diversified Financials Coverage – Financial Institutions Investment Banking Group (until 2016) | | Alpha-En Corporation, Director (2016-2019) |
21
MFS Global Research Portfolio
Trustees and Officers – continued
| | | | | | | | | | |
Name, Age | | Position(s)
Held with Fund | | Trustee/Officer
Since (h) | | Number of MFS Funds
overseen by the
Trustee | | Principal Occupations
During the Past Five Years | | Other Directorships During the Past Five Years (j) |
Clarence Otis, Jr. (age 63) | | Trustee | | March 2017 | | 133 | | Darden Restaurants, Inc., Chief Executive Officer (until 2014) | | VF Corporation, Director; Verizon Communications, Inc., Director; The Travelers Companies, Director; Federal Reserve Bank of Atlanta, Director (until 2015) |
| | | | | |
Maryanne L. Roepke (age 63) | | Trustee | | May 2014 | | 133 | | American Century Investments (investment management), Senior Vice President and Chief Compliance Officer (until 2014) | | N/A |
| | | | | |
Laurie J. Thomsen
(age 62) | | Trustee | | March 2005 | | 133 | | Private investor | | The Travelers Companies, Director; Dycom Industries, Inc., Director (since 2015) |
| | | | | | | | |
Name, Age | | Position(s)
Held with Fund | | Trustee/Officer
Since (h) | | Number of
MFS Funds
for which the
Person is an
Officer | | Principal Occupations During the Past Five Years |
| OFFICERS | | | | | | |
Christopher R. Bohane (k)
(age 46) | | Assistant Secretary and Assistant Clerk | | July 2005 | | 133 | | Massachusetts Financial Services Company, Vice President and Assistant General Counsel |
| | | | |
Kino Clark (k) (age 51) | | Assistant Treasurer | | January 2012 | | 133 | | Massachusetts Financial Services Company, Vice President |
| | | | |
John W. Clark, Jr. (k) (age 52) | | Assistant Treasurer | | April 2017 | | 133 | | Massachusetts Financial Services Company, Vice President (since March 2017); Deutsche Bank (financial services), Department Head –Treasurer’s Office (until February 2017) |
| | | | |
Thomas H. Connors (k) (age 60) | | Assistant Secretary and Assistant Clerk | | September 2012 | | 133 | | Massachusetts Financial Services Company, Vice President and Senior Counsel |
| | | | |
David L. DiLorenzo (k)
(age 51) | | President | | July 2005 | | 133 | | Massachusetts Financial Services Company, Senior Vice President |
| | | | |
Heidi W. Hardin (k) (age 52) | | Secretary and Clerk | | April 2017 | | 133 | | Massachusetts Financial Services Company, Executive Vice President and General Counsel (since March 2017); Harris Associates (investment management), General Counsel (from September 2015 to January 2017); Janus Capital Management LLC (investment management), Senior Vice President and General Counsel (until September 2015) |
| | | | |
Brian E. Langenfeld (k) (age 46) | | Assistant
Secretary and Assistant Clerk | | June 2006 | | 133 | | Massachusetts Financial Services Company, Vice President and Senior Counsel |
| | | | |
Amanda S. Mooradian (k) (age 40) | | Assistant
Secretary and Assistant Clerk | | September 2018 | | 133 | | Massachusetts Financial Services Company, Assistant Vice President and Counsel |
| | | | |
Susan A. Pereira (k)
(age 49) | | Assistant
Secretary and Assistant Clerk | | July 2005 | | 133 | | Massachusetts Financial Services Company, Vice President and Assistant General Counsel |
| | | | |
Kasey L. Phillips (k) (age 49) | | Assistant Treasurer | | September 2012 | | 133 | | Massachusetts Financial Services Company, Vice President |
| | | | |
Matthew A. Stowe (k) (age 45) | | Assistant Secretary and Assistant Clerk | | October 2014 | | 133 | | Massachusetts Financial Services Company, Vice President and Assistant General Counsel |
22
MFS Global Research Portfolio
Trustees and Officers – continued
| | | | | | | | |
Name, Age | | Position(s)
Held with Fund | | Trustee/Officer
Since (h) | | Number of
MFS Funds
for which the
Person is an
Officer | | Principal Occupations During the Past Five Years |
Martin J. Wolin (k) (age 52) | | Chief Compliance Officer | | July 2015 | | 133 | | Massachusetts Financial Services Company, Senior Vice President and Chief Compliance Officer (since July 2015); Mercer (financial service provider), Chief Risk and Compliance Officer, North America and Latin America (until June 2015) |
| | | | |
James O. Yost (k)
(age 59) | | Treasurer | | September 1990 | | 133 | | Massachusetts Financial Services Company, Senior Vice President |
| (h) | Date first appointed to serve as Trustee/officer of an MFS Fund. Each Trustee has served continuously since appointment unless indicated otherwise. For the period from December 15, 2004 until February 22, 2005, Mr. Manning served as Advisory Trustee. From January 2012 through December 2016, Messrs. DiLorenzo and Yost served as Treasurer and Deputy Treasurer of the Funds, respectively. |
| (j) | Directorships or trusteeships of companies required to report to the Securities and Exchange Commission (i.e., “public companies”). |
| (k) | “Interested person” of the Trust within the meaning of the Investment Company Act of 1940 (referred to as the 1940 Act), which is the principal federal law governing investment companies like the fund, as a result of a position with MFS. The address of MFS is 111 Huntington Avenue, Boston, Massachusetts 02199-7618. |
Each Trustee (other than Messrs. Jones and Kilman) has been elected by shareholders and each Trustee and Officer holds office until his or her successor is chosen and qualified or until his or her earlier death, resignation, retirement or removal. Messrs. Jones and Kilman became Trustees of the Funds on January 1, 2019. The Trust does not hold annual meetings for the purpose of electing Trustees, and Trustees are not elected for fixed terms. Under the terms of the Board’s retirement policy, an Independent Trustee shall retire at the end of the calendar year in which he or she reaches the earlier of 75 years of age or 15 years of service on the Board (or, in the case of any Independent Trustee who joined the Board prior to 2015, 20 years of service on the Board).
Messrs. Buller, Kilman and Otis and Ms. Roepke are members of the Trust’s Audit Committee.
Each of the Interested Trustees and certain Officers hold comparable officer positions with certain affiliates of MFS.
The Statement of Additional Information for a Fund includes further information about the Trustees and is available without charge upon request by calling1-800-225-2606.
| | |
Investment Adviser Massachusetts Financial Services Company 111 Huntington Avenue Boston, MA 02199-7618 | | Custodian State Street Bank and Trust Company 1 Lincoln Street Boston, MA 02111-2900 |
| |
Distributor MFS Fund Distributors, Inc. 111 Huntington Avenue Boston, MA 02199-7618 | | Independent Registered Public Accounting Firm Deloitte & Touche LLP 200 Berkeley Street Boston, MA 02116 |
| |
Portfolio Manager(s) Akira Fuse James Keating | | |
23
MFS Global Research Portfolio
BOARD REVIEW OF INVESTMENT ADVISORY AGREEMENT
MFS Global Research Portfolio
The Investment Company Act of 1940 requires that both the full Board of Trustees and a majority of the non-interested (“independent”) Trustees, voting separately, annually approve the continuation of the Fund’s investment advisory agreement with MFS. The Trustees consider matters bearing on the Fund and its advisory arrangements at their meetings throughout the year, including a review of performance data at each regular meeting. In addition, the independent Trustees met several times over the course of three months beginning in May and ending in July, 2019 (“contract review meetings”) for the specific purpose of considering whether to approve the continuation of the investment advisory agreement for the Fund and the other investment companies that the Board oversees (the “MFS Funds”). The independent Trustees were assisted in their evaluation of the Fund’s investment advisory agreement by independent legal counsel, from whom they received separate legal advice and with whom they met separately from MFS during various contract review meetings. The independent Trustees were also assisted in this process by the MFS Funds’ Independent Senior Officer, a senior officer appointed by and reporting to the independent Trustees.
In connection with their deliberations regarding the continuation of the investment advisory agreement, the Trustees, including the independent Trustees, considered such information and factors as they believed, in light of the legal advice furnished to them and their own business judgment, to be relevant. The investment advisory agreement for the Fund was considered separately, although the Trustees also took into account the common interests of all MFS Funds in their review. As described below, the Trustees considered the nature, quality, and extent of the various investment advisory, administrative, and shareholder services performed by MFS under the existing investment advisory agreement and other arrangements with the Fund.
In connection with their contract review meetings, the Trustees received and relied upon materials that included, among other items: (i) information provided by Broadridge Financial Solutions, Inc. (“Broadridge”), an independent third party, on the investment performance of the Fund for various time periods ended December 31, 2018 and the investment performance of a group of funds with substantially similar investment classifications/objectives (the “Broadridge performance universe”), (ii) information provided by Broadridge on the Fund’s advisory fees and other expenses and the advisory fees and other expenses of comparable funds identified by Broadridge as well as all other funds in the same investment classification/category (the “Broadridge expense group and universe”), (iii) information provided by MFS on the advisory fees of portfolios of other clients of MFS, including institutional separate accounts and other clients, (iv) information as to whether and to what extent applicable expense waivers, reimbursements or fee “breakpoints” are observed for the Fund, (v) information regarding MFS’ financial results and financial condition, including MFS’ and certain of its affiliates’ estimated profitability from services performed for the Fund and the MFS Funds as a whole, and compared to MFS’ institutional business, (vi) MFS’ views regarding the outlook for the mutual fund industry and the strategic business plans of MFS, (vii) descriptions of various functions performed by MFS for the Funds, such as compliance monitoring and portfolio trading practices, and (viii) information regarding the overall organization of MFS, including information about MFS’ senior management and other personnel providing investment advisory, administrative and other services to the Fund and the other MFS Funds. The comparative performance, fee and expense information prepared and provided by Broadridge was not independently verified and the independent Trustees did not independently verify any information provided to them by MFS.
The Trustees’ conclusion as to the continuation of the investment advisory agreement was based on a comprehensive consideration of all information provided to the Trustees and not the result of any single factor. Some of the factors that figured particularly in the Trustees’ deliberations are described below, although individual Trustees may have evaluated the information presented differently from one another, giving different weights to various factors. It is also important to recognize that the fee arrangements for the Fund and other MFS Funds are the result of years of review and discussion between the independent Trustees and MFS, that certain aspects of such arrangements may receive greater scrutiny in some years than in others, and that the Trustees’ conclusions may be based, in part, on their consideration of these same arrangements during the course of the year and in prior years.
Based on information provided by Broadridge and MFS, the Trustees reviewed the Fund’s total return investment performance as well as the Broadridge performance universe over various time periods. The Trustees placed particular emphasis on the total return performance of the Fund’s Initial Class shares in comparison to the performance of funds in its Broadridge performance universe over the five-year period ended December 31, 2018, which the Trustees believed was a long enough period to reflect differing market conditions. The total return performance of the Fund’s Initial Class shares was in the 4th quintile relative to the other funds in the universe for this five-year period (the 1st quintile being the best performers and the 5th quintile being the worst performers). The total return performance of the Fund’s Initial Class shares was in the 2nd quintile for each of the one- and three-year periods ended December 31, 2018 relative to the Broadridge performance universe. Because of the passage of time, these performance results may differ from the performance results for more recent periods, including those shown elsewhere in this report.
In the course of their deliberations, the Trustees took into account information provided by MFS in connection with the contract review meetings, as well as during investment review meetings conducted with portfolio management personnel during the course of the year regarding the Fund’s performance. The Trustees noted that although the Fund’s five-year performance was substandard relative to its Broadridge performance universe, the Trustees observed that the Fund’s one- and three-year performance as compared to its Broadridge performance universe improved for the period ended December 31, 2018, as compared to the prior year. After
24
MFS Global Research Portfolio
Board Review of Investment Advisory Agreement – continued
reviewing these and related factors, the Trustees concluded, within the context of their overall conclusions regarding the investment advisory agreement, that they were satisfied with MFS’ responses and efforts relating to investment performance.
In assessing the reasonableness of the Fund’s advisory fee, the Trustees considered, among other information, the Fund’s advisory fee and the total expense ratio of the Fund’s Initial Class shares as a percentage of average daily net assets and the advisory fee and total expense ratios of the Broadridge expense group based on information provided by Broadridge. The Trustees considered that, MFS currently observes an expense limitation for the Fund, which may not be changed without the Trustees’ approval. The Trustees also considered that, according to the data provided by Broadridge (which takes into account any fee reductions or expense limitations that were in effect during the Fund’s last fiscal year), the Fund’s effective advisory fee rate and total expense ratio were each approximately at the Broadridge expense group median.
The Trustees also considered the advisory fees charged by MFS to any institutional separate accounts advised by MFS (“separate accounts”) and unaffiliated investment companies for which MFS serves as subadviser (“subadvised funds”) that have comparable investment strategies to the Fund, if any. In comparing these fees, the Trustees considered information provided by MFS as to the generally broader scope of services provided by MFS to the Fund, as well as the more extensive regulatory burdens imposed on MFS in managing the Fund, in comparison to separate accounts and subadvised funds. The Trustees also considered the higher demands placed on MFS’ investment personnel and trading infrastructure as a result of the daily cash in-flows and out-flows of the Fund in comparison to separate accounts.
The Trustees also considered whether the Fund may benefit from any economies of scale in the management of the Fund in the event of growth in assets of the Fund and/or growth in assets of the MFS Funds as a whole. They noted that the Fund’s advisory fee rate schedule is subject to a contractual breakpoint that reduces the Fund’s advisory fee rate on average daily net assets over $300 million. The Trustees also noted that MFS has agreed in writing to waive a portion of the management fees of certain MFS Funds, including the Fund, if the total combined assets of certain funds within the MFS Funds’ complex increase above agreed upon thresholds (the “group fee waiver”), enabling the Fund’s shareholders to share in the benefits from any economies of scale at the complex level. The group fee waiver is reviewed and renewed annually between the Board and MFS. The Trustees concluded that the breakpoint and the group fee waiver were sufficient to allow the Fund to benefit from economies of scale as its assets and overall complex assets grow.
The Trustees also considered information prepared by MFS relating to MFS’ costs and profits with respect to the Fund, the MFS Funds considered as a group, and other investment companies and accounts advised by MFS, as well as MFS’ methodologies used to determine and allocate its costs to the MFS Funds, the Fund and other accounts and products for purposes of estimating profitability.
After reviewing these and other factors described herein, the Trustees concluded, within the context of their overall conclusions regarding the investment advisory agreement, that the advisory fees charged to the Fund represent reasonable compensation in light of the services being provided by MFS to the Fund.
In addition, the Trustees considered MFS’ resources and related efforts to continue to retain, attract and motivate capable personnel to serve the Fund. The Trustees also considered current and developing conditions in the financial services industry, including the presence of large and well-capitalized companies which are spending, and appear to be prepared to continue to spend, substantial sums to engage personnel and to provide services to competing investment companies. In this regard, the Trustees also considered the financial resources of MFS and its ultimate parent, Sun Life Financial Inc. The Trustees also considered the advantages and possible disadvantages to the Fund of having an adviser that also serves other investment companies as well as other accounts.
The Trustees also considered the nature, quality, cost, and extent of administrative, transfer agency, and distribution services provided to the Fund by MFS and its affiliates under agreements and plans other than the investment advisory agreement, including any 12b-1 fees the Fund pays to MFS Fund Distributors, Inc., an affiliate of MFS. The Trustees also considered the nature, extent and quality of certain other services MFS performs or arranges for on the Fund’s behalf, which may include securities lending programs, directed expense payment programs, class action recovery programs, and MFS’ interaction with third-party service providers, principally custodians and sub-custodians. The Trustees concluded that the various non-advisory services provided by MFS and its affiliates on behalf of the Fund were satisfactory.
The Trustees considered so-called “fall-out benefits” to MFS such as reputational value derived from serving as investment manager to the MFS Funds. The Trustees also considered that, effective January 3, 2018, MFS had discontinued its historic practice of obtaining investment research from portfolio brokerage commissions paid by certain MFS Funds and would thereafter directly pay for or voluntarily reimburse a Fund, if applicable, for the costs of external research acquired through the use of the Fund’s portfolio brokerage commissions.
Based on their evaluation of factors that they deemed to be material, including those factors described above, the Board of Trustees, including the independent Trustees, concluded that the Fund’s investment advisory agreement with MFS should be continued for an additional one-year period, commencing August 1, 2019.
25
MFS Global Research Portfolio
PROXY VOTING POLICIES AND INFORMATION
MFS votes proxies on behalf of the fund pursuant to proxy voting policies and procedures that are available without charge, upon request, by calling 1-800-225-2606, by visitingmfs.com/proxyvoting, or by visiting the SEC’s Web site athttp://www.sec.gov.
Information regarding how the fund voted proxies relating to portfolio securities during the most recent twelve-month period ended June 30 is available by August 31 of each year without charge by visitingmfs.com/proxyvoting, or by visiting the SEC’s Web site athttp://www.sec.gov.
QUARTERLY PORTFOLIO DISCLOSURE
The fund files a complete schedule of portfolio holdings with the SEC for the first and third quarters of each fiscal year as an exhibit to its reports on Form N-PORT. The fund’s Form N-PORT reports are available on the SEC’s website athttp://www.sec.gov.A shareholder can obtain the portfolio holdings report for the first and third quarters of the fund’s fiscal year atmfs.com/vit2 by choosing the fund’s name and then selecting the “Resources” tab and clicking on “Prospectus and Reports”.
FURTHER INFORMATION
From time to time, MFS may post important information about the fund or the MFS funds on the MFS web site (mfs.com). This information is available athttps://www.mfs.com/en-us/what-we-do/announcements.htmlor atmfs.com/vit2 by choosing the fund’s name.
INFORMATION ABOUT FUND CONTRACTS AND LEGAL CLAIMS
The fund has entered into contractual arrangements with an investment adviser, administrator, distributor, shareholder servicing agent, 529 program manager (if applicable), and custodian who each provide services to the fund. Unless expressly stated otherwise, shareholders are not parties to, or intended beneficiaries of these contractual arrangements, and these contractual arrangements are not intended to create any shareholder right to enforce them against the service providers or to seek any remedy under them against the service providers, either directly or on behalf of the fund.
Under the Trust’s By-Laws and Declaration of Trust, any claims asserted against or on behalf of the MFS Funds, including claims against Trustees and Officers, must be brought in state and federal courts located within the Commonwealth of Massachusetts.
FEDERAL TAX INFORMATION (unaudited)
The following information is provided pursuant to provisions of the Internal Revenue Code.
The fund designates $8,196,000 as capital gain dividends paid during the fiscal year.
For corporate shareholders, 55.83% of the ordinary income dividends paid during the fiscal year qualify for the corporate dividends received deduction.
26
rev. 3/16
| | | | |
| | | |
| FACTS | | WHAT DOES MFS DO WITH YOUR
PERSONAL INFORMATION? | |  |
| | |
| Why? | | Financial companies choose how they share your personal information. Federal law gives consumers the right to limit some but not all sharing. Federal law also requires us to tell you how we collect, share, and protect your personal information. Please read this notice carefully to understand what we do. |
| | |
| What? | | The types of personal information we collect and share depend on the product or service you have with us. This information can include: • Social Security number and account balances • Account transactions and transaction history • Checking account information and wire transfer instructions When you areno longer our customer, we continue to share your information as described in this notice. |
| | |
| How? | | All financial companies need to share customers’ personal information to run their everyday business. In the section below, we list the reasons financial companies can share their customers’ personal information; the reasons MFS chooses to share; and whether you can limit this sharing. |
| | | | |
Reasons we can share your
personal information | | Does MFS share? | | Can you limit this
sharing? |
For our everyday business purposes – such as to process your transactions, maintain your account(s), respond to court orders and legal investigations, or report to credit bureaus | | Yes | | No |
For our marketing purposes – to offer our products and services to you | | No | | We don’t share |
| For joint marketing with other financial companies | | No | | We don’t share |
For our affiliates’ everyday business purposes – information about your transactions and experiences | | No | | We don’t share |
For our affiliates’ everyday business purposes – information about your creditworthiness | | No | | We don’t share |
| For nonaffiliates to market to you | | No | | We don’t share |
| | |
| | |
| Questions? | | Call800-225-2606 or go tomfs.com. |
27
| | |
| Who we are |
| Who is providing this notice? | | MFS Funds, MFS Investment Management, MFS Institutional Advisors, Inc., and MFS Heritage Trust Company. |
| | |
| What we do |
| How does MFS protect my personal information? | | To protect your personal information from unauthorized access and use, we use security measures that comply with federal law. These measures include procedural, electronic, and physical safeguards for the protection of the personal information we collect about you. |
How does MFS
collect my personal information? | | We collect your personal information, for example, when you • open an account or provide account information • direct us to buy securities or direct us to sell your securities • make a wire transfer We also collect your personal information from others, such as credit bureaus, affiliates, or other companies. |
| Why can’t I limit all sharing? | | Federal law gives you the right to limit only • sharing for affiliates’ everyday business purposes – information about your creditworthiness • affiliates from using your information to market to you • sharing for nonaffiliates to market to you State laws and individual companies may give you additional rights to limit sharing. |
| | |
| Definitions |
| Affiliates | | Companies related by common ownership or control. They can be financial and nonfinancial companies. • MFS does not share personal information with affiliates, except for everyday business purposes as described on page one of this notice. |
| Nonaffiliates | | Companies not related by common ownership or control. They can be financial and nonfinancial companies. • MFS does not share with nonaffiliates so they can market to you. |
| Joint marketing | | A formal agreement between nonaffiliated financial companies that together market financial products or services to you. • MFS doesn’t jointly market. |
| | |
| Other important information |
| If you own an MFS product or receive an MFS service in the name of a third party such as a bank or broker-dealer, their privacy policy may apply to you instead of ours. |
28
Annual Report
December 31, 2019

MFS® Global Tactical Allocation Portfolio

MFS® Variable Insurance Trust II
Beginning on January 1, 2021, as permitted by regulations adopted by the U.S. Securities and Exchange Commission, the insurance company that offers your contract may determine that it will no longer send you paper copies of the fund’s annual and semiannual shareholder reports unless you specifically request paper copies from the insurance company or from your financial intermediary. Instead, the shareholder reports will be made available on a Web site (insurancefunds.mfs.com or other Web site of which you will be notified), and the insurance company will notify you by mail each time a report is posted and provide you with a Web site link to access the report. Instructions for requesting paper copies will be provided by your insurance company or financial intermediary.
If you already elected to receive shareholder reports by email, you will not be affected by this change and you need not take any action. If your insurance company or financial intermediary offers electronic delivery, you may elect to receive shareholder reports and other communications from the insurance company or financial intermediary by email by following the instructions provided by the insurance company or financial intermediary.
Beginning on January 1, 2019, you may elect to receive all future reports in paper free of charge from the insurance company or financial intermediary. You can inform the insurance company or financial intermediary that you wish to continue receiving paper copies of your shareholder reports by contacting your insurance company or financial intermediary. Your election to receive reports in paper will apply to all funds held in your account with your insurance company or financial intermediary.
WTS-ANN
MFS® Global Tactical Allocation Portfolio
CONTENTS
The report is prepared for the general information of contract owners. It is authorized for distribution to prospective investors only when preceded or accompanied by a current prospectus.
NOT FDIC INSURED• MAY LOSE VALUE• NO BANK OR CREDIT UNION GUARANTEE• NOT A DEPOSIT• NOT INSURED BY ANY FEDERAL GOVERNMENT AGENCY OR NCUA/NCUSIF
MFS Global Tactical Allocation Portfolio
LETTER FROM THE EXECUTIVE CHAIR

Dear Contract Owners:
Slowing global growth, low inflation, and trade friction between the United States and China have been hallmarks of the past 12 months. After experiencing an uptick in market volatility in late 2018, markets steadied for most of 2019, thanks in large measure to the adoption of a dovish policy stance on the part of global central banks, focused on supporting economic growth. Negotiations aimed at a “phase one” trade deal between the U.S. and China bore fruit at the end of the period, boosting investor sentiment, while signs of stability emerging from the global manufacturing sector also lifted spirits. Uncertainty over Brexit, along with the ripple effects from the trade conflict, hampered business confidence and investment in the United Kingdom and Europe for much of the period, though investors expect greater clarity regarding Brexit as a result of December’s general election. The pro-Brexit Conservative Party won the election by a comfortable margin and set the stage for the U.K.’s departure from the EU at the end of January.
Markets expect the longest economic expansion in U.S. history will continue, albeit at a slower pace, as trade tensions recede. In an effort to prolong the expansion, the U.S. Federal Reserve lowered interest rates three times between July and October and the European Central Bank loosened policy in September. While the global monetary policy backdrop remains quite accommodative, signs of easing trade tensions and fading global recession fears led to improved market sentiment in late 2019 as investors grew less risk averse. In early 2020, an outbreak of coronavirus emanating from China reintroduced global growth fears, causing an uptick in volatility.
Here at MFS®, we aim to help our clients navigate the growing complexity of the markets and world economies. Our long-term investment philosophy and commitment to the responsible allocation of capital allow us to tune out the noise and uncover what we believe are the best, most durable investment opportunities in the market. Through our powerful global investment platform, we combine collective expertise, thoughtful risk management and long-term discipline to create sustainable value for investors.
Respectfully,

Robert J. Manning
Executive Chair
MFS Investment Management
February 14, 2020
The opinions expressed in this letter are subject to change and may not be relied upon for investment advice. No forecasts can be guaranteed.
1
MFS Global Tactical Allocation Portfolio
PORTFOLIO COMPOSITION
Portfolio structure
| | | | | | | | | | | | | | | | | | |
| | | | | | | | Tactical Overlay (b) | | | | |
| | | | | Active Security Selection (a) | | | Long | | | Short | | | Net Market
Exposure (c) | |
| Fixed Income | | U.S. | | | 20.0% | | | | 42.3% | | | | (7.8)% | | | | 54.5% | |
| | Japan | | | 6.2% | | | | 8.2% | | | | 0.0% | | | | 14.4% | |
| | Europeex-U.K. | | | 5.9% | | | | 0.0% | | | | (0.3)% | | | | 5.6% | |
| | Emerging Markets | | | 5.2% | | | | 0.0% | | | | 0.0% | | | | 5.2% | |
| | Asia/Pacificex-Japan | | | 1.5% | | | | 2.1% | | | | 0.0% | | | | 3.6% | |
| | Supranational | | | 0.2% | | | | 0.0% | | | | 0.0% | | | | 0.2% | |
| | United Kingdom | | | 4.2% | | | | 0.0% | | | | (8.5)% | | | | (4.3)% | |
| | North Americaex-U.S. | | | 1.2% | | | | 0.0% | | | | (7.7)% | | | | (6.5)% | |
| | | Total | | | 44.4% | | | | 52.6% | | | | (24.3)% | | | | 72.7% | |
| Equity | | U.S. Large Cap | | | 17.5% | | | | 0.0% | | | | (1.3)% | | | | 16.2% | |
| | Europeex-U.K. | | | 7.0% | | | | 10.5% | | | | (1.8)% | | | | 15.7% | |
| | Japan | | | 2.9% | | | | 1.1% | | | | 0.0% | | | | 4.0% | |
| | United Kingdom | | | 1.9% | | | | 1.6% | | | | 0.0% | | | | 3.5% | |
| | Emerging Markets | | | 2.5% | | | | 6.6% | | | | (7.6)% | | | | 1.5% | |
| | North Americaex-U.S. | | | 1.4% | | | | 0.0% | | | | (1.6)% | | | | (0.2)% | |
| | Asia/Pacificex-Japan | | | 0.4% | | | | 0.6% | | | | (2.9)% | | | | (1.9)% | |
| | U.S. Small/Mid Cap | | | 1.3% | | | | 0.0% | | | | (3.7)% | | | | (2.4)% | |
| | | Total | | | 34.9% | | | | 20.4% | | | | (18.9)% | | | | 36.4% | |
| Real Estate-related | | Non-U.S. | | | 0.8% | | | | 0.0% | | | | 0.0% | | | | 0.8% | |
| | U.S. | | | 0.6% | | | | 0.0% | | | | 0.0% | | | | 0.6% | |
| | | Total | | | 1.4% | | | | 0.0% | | | | 0.0% | | | | 1.4% | |
| Cash | | Cash & Cash Equivalents (d) | | | | | | | | | | | | | | | 6.0% | |
| | Other (e) | | | | | | | | | | | | | | | (16.5)% | |
| | | Total | | | | | | | | | | | | | | | (10.5)% | |
| | Total Net Exposure Summary | | | | | | | | | | | | | | | 100.0% | |
| | | | | | | | |
| Strategic Allocation Targets & Net Exposure Ranges | |
| Asset Class | | | Target (w) | | | | Ranges (z) | |
| Equities | | | 35% | | | | 0 to 70% | |
| Fixed Income, Cash and Cash Equivalents | | | 65% | | | | 30 to 100% | |
| | | | |
| Top ten holdings (c) | | | | |
| USD Interest Rate Swap, Receive 1.63% – NOV 2021 | | | 26.5% | |
| USD Interest Rate Swap, Receive 1.58% – NOV 2024 | | | 11.0% | |
| Japan Government Bond 10 yr Future – MAR 2020 | | | 8.2% | |
| CAC 40 Index Future – JAN 2020 | | | 3.9% | |
| FTSE MIB Index Future – MAR 2020 | | | 3.8% | |
| Euro-Bund 10 yr Future – MAR 2020 | | | (3.6)% | |
| Euro-Bobl 5 yr Future – MAR 2020 | | | (4.0)% | |
| USD Interest Rate Swap, Pay 1.7% – NOV 2029 | | | (5.6)% | |
| Canadian Treasury Bond 10 yr Future – MAR 2020 | | | (7.7)% | |
| Long Gilt 10 yr Future – MAR 2020 | | | (8.5)% | |
| (a) | | Represents the actively managed portion of the portfolio and for purposes of this presentation, components include the value of securities, less any securities sold short. The bond component will include any accrued interest amounts. This also reflects the equivalent exposure of certain derivative positions. These amounts may be negative from time to time. |
| (b) | | Represents the tactical overlay portion of the portfolio which is how the fund manages its exposure to markets and currencies through the use of derivative positions. Percentages reflect the equivalent exposure of those derivative positions. |
| (c) | | For purposes of this presentation, the components include the value of securities, less any securities sold short, and reflect the impact of the equivalent exposure of all derivative positions. These amounts may be negative from time to time. The bond component will include any accrued interest amounts. |
2
MFS Global Tactical Allocation Portfolio
Portfolio Composition – continued
| (d) | | Cash & Cash Equivalents includes any cash, investments in money market funds, short term securities, and other assets less liabilities. Please see the Statement of Assets and Liabilities for additional information related to the fund’s cash position and other assets and liabilities. |
| (e) | | Other includes currency derivatives and/or the offsetting of the leverage produced by the fund’s derivative positions, including payables and/or receivables of the finance leg of interest rate swaps and the unrealized gain or loss in connection with forward currency exchange contracts. |
| (w) | | The strategic asset class allocations have been selected for investment over longer time periods. The actual strategic asset class weightings can deviate due to market movements and cash flows. |
| (z) | | The fund’s net exposures to the asset classes referenced will normally fall within these ranges after taking into account the tactical overlay. |
Equivalent exposure is a calculated amount that translates the derivative position into a reasonable approximation of the amount of the underlying asset that the portfolio would have to hold at a given point in time to have the same price sensitivity that results from the portfolio’s ownership of the derivative contract. When dealing with derivatives, equivalent exposure is a more representative measure of the potential impact of a position on portfolio performance than value. The value of derivatives may be different.
Where the fund holds convertible bonds, they are treated as part of the equity portion of the portfolio.
Percentages are based on net assets as of December 31, 2019.
The portfolio is actively managed and current holdings may be different.
3
MFS Global Tactical Allocation Portfolio
MANAGEMENT REVIEW
Summary of Results
For the twelve months ended December 31, 2019, Initial Class shares of the MFS Global Tactical Allocation Portfolio (fund) provided a total return of 14.58%, while Service Class shares of the fund provided a total return of 14.30%. These compare with a return of 6.84% over the same period for the fund’s benchmark, the Bloomberg Barclays Global Aggregate Bond Index. The fund’s other benchmarks, the MSCI World Index (net div) and the MFS Global Tactical Allocation Blended Index (“Blended Index”), generated total returns of 27.67% and 14.75%, respectively. The Blended Index reflects the blended returns of equity and fixed income indices, with percentage allocations to each index designed to resemble the strategic allocations of the fund. The market indices and related percentage allocations used to compile the Blended Index are set forth in the Performance Summary.
The fund’s investment objective is to seek total return. MFS seeks to achieve the fund’s objective by generating returns from a combination of (1) individual security selection of a combination of debt instruments and equity securities and (2) a tactical asset allocation overlay primarily using derivative instruments to manage the fund’s exposure to asset classes (e.g. equity and fixed income), markets (e.g. U.S. and foreign countries), and currencies (e.g. U.S. dollar and Japanese yen). Derivatives may include futures, forward contracts, options, swaps and certain complex structured securities.
Market Environment
Fading fears of a near-term global recession, the announcement of a partial trade deal between the United States and China and the decline in uncertainty over Brexit helped bolster market sentiment late in the period. Changes in market sentiment, largely driven by uncertainty over the outcome of trade negotiations between the US and China, had contributed to periodic bouts of volatility during the reporting period. The global economy decelerated, led by weakness in China and Europe, although the pace of the slowdown moderated late in the period amid nascent signs of stabilization in the manufacturing sector.
The deteriorating global growth backdrop, along with declining inflationary pressures, prompted the US Federal Reserve to adopt a more dovish posture beginning in early 2019, resulting in the first interest rate cut in over a decade at the end of July, followed by additional cuts in September and October. The Fed’s actions led to a sharp decline in long-term interest rates during the period’s second half, causing the inversion of portions of the US Treasury yield curve for a time. Amid an improvement in risk sentiment in Q4 2019 and indications of a bottoming in growth and a potential upturn in activity, the Fed indicated in October that further rate cuts were unlikely unless the outlook for the economy materially worsened.
Globally, central banks have tilted more dovish as well, with the European Central Bank unveiling a package of easing measures, which included putting overnight rates deeper into negative territory, restarting its bond-buying program and lengthening the term of cheap loans to banks to three years from two. The central banks of India and Australia are among those that have cut rates several times in recent months, although China has been more cautious in increasing liquidity as it keeps trying to deleverage its economy, cutting rates only marginally.
Emerging markets experienced considerable volatility through the end of 2018, as tighter global financial conditions exposed structural weakness in some countries. Those conditions improved in 2019 as the Fed became more dovish. Notwithstanding the periodic headwinds on market sentiment from significant trade friction between the US and China over much of the year, emerging market hard currency debt and local rates benefited from relatively cheap valuations at the beginning of the period and easier global monetary conditions. These factors, plus the fading of certain global risk factors mentioned above, hastened spread tightening in the latter part of the period. At the same time, idiosyncratic risks spiked in some countries (e.g., Argentina and Lebanon), contributing to increased dispersion in performance among sovereign assets.
Detractors from Performance
Within the equity portion of the fund, stock selection and, to a lesser extent, an overweight position in theconsumer staplessector held back performance relative to the MSCI World Index. Within this sector, the fund’s overweight positions in tobacco company Japan Tobacco (Japan) and chemical products company Henkel (Germany) detracted from relative results.
An underweight position and, to a lesser extent, stock selection in theinformation technologysector also hindered relative performance. Within this sector, not owning shares of computer and personal electronics maker Apple, and the timing of the fund’s ownership in shares of software giant Microsoft, weakened relative results.
Elsewhere, the fund’s overweight positions in pharmaceutical giant Pfizer, real estate company Deutsche Wohnen (Germany) and industrial conglomerate 3M dampened relative performance. Additionally, not holding shares of social networking service provider Facebook, and the fund’s holdings of oil and natural gas exploration and development company China Petroleum and Chemical (b) (China), further weighed on relative returns.
Within the fixed income portion of the fund, currency positioning detracted from performance relative to the Bloomberg Barclays Global Aggregate Bond Index. The fund’s greater exposure to both the Japanese yen and Norwegian krone, and its lesser exposure to the Canadian dollar, also weighed on relative results.
4
MFS Global Tactical Allocation Portfolio
Management Review – continued
Within the fund’s tactical overlay, a long exposure to both Hong Kong and the United Kingdom equity markets, via equity index futures, detracted from the fund’s performance. A long exposure to the fixed income market of Japan, via fixed income index futures, also held back results. From a currency perspective, the fund’s short exposure to the New Zealand dollar weighed on the fund’s performance.
Contributors to Performance
Within the equity portion of the fund, stock selection in theindustrialssector contributed to performance relative to the MSCI World Index. Within this sector, the fund’s overweight positions in electrical distribution equipment manufacturer Schneider Electric (France), airline operator Air Canada (Canada) and defense contractor Lockheed Martin bolstered relative results. In addition, the timing of the fund’s ownership in shares of aerospace company Boeing (h) aided relative performance.
Stock selection in thefinancialssector also supported relative returns. Within this sector, the fund’s overweight positions in risk management and human capital consulting services provider Aon and credit rating agency Moody’s helped relative results.
Elsewhere, holding shares of semiconductor manufacturer Taiwan Semiconductor Manufacturing (b) (Taiwan), and the fund’s overweight positions in management consulting, technology and outsourcing services provider Accenture, research and consulting firm Nomura Research Institute (Japan) and tobacco company Philip Morris, benefited relative returns.
Within the fixed income portion of the fund, yield curve (y) positioning, particularly the fund’s longer duration (d) stance in the US, euro and Australian yield curves, supported returns relative to the Bloomberg Barclays Global Aggregate Bond Index, as interest rates declined during the period. From a sector perspective, the fund’s security selection and underweight exposure to thetreasurysector contributed to relative results. Security selection and an overweight exposure to theindustrialssector also strengthened relative returns. From a credit quality perspective, security selection and an overweight exposure to “BBB” rated (r) bonds aided relative performance. Favorable security selection and an underweight exposure to both “A” and “AA” rated securities further benefited relative performance.
Within the fund’s tactical overlay, a short exposure to emerging equity markets helped the fund’s performance, most notably from the fund’s short exposure to South Africa and Korea. A short exposure to the fixed income markets of Canada and Germany also helped results. From a currency perspective, a long exposure to the Australian dollar benefited the fund’s performance.
Respectfully,
Portfolio Manager(s)
Nevin Chitkara, Pilar Gomez-Bravo, Steven Gorham, Andy Li, Vipin Narula, Ben Nastou, Henry Peabody, Robert Persons, Jonathan Sage, Natalie Shapiro, Robert Spector, and Erik Weisman
Note to Shareholders: Effective February 1, 2019, Andy Li was added as a Portfolio Manager of the Fund. Effective December 31, 2019, Henry Peabody was added as a Portfolio Manager of the Fund. Effective December 31, 2020, Nevin Chitkara will be removed as a Portfolio Manager of the Fund.
| (b) | Security is not a benchmark constituent. |
| (d) | Duration is a measure of how much a bond’s price is likely to fluctuate with general changes in interest rates, e.g., if rates rise 1.00%, a bond with a5-year duration is likely to lose about 5.00% of its value. |
| (h) | Security was not held in the portfolio at period end. |
| (r) | Bonds rated “BBB”, “Baa”, or higher are considered investment grade; bonds rated “BB”, “Ba”, or below are considerednon-investment grade. The sources for bond quality ratings are Moody’s Investors Service, Standard & Poor’s and Fitch, Inc. and are applied using the following hierarchy: If all three agencies provide a rating, the middle rating (after dropping the highest and lowest ratings) is assigned; if two of the three agencies rate a security, the lower of the two is assigned. Ratings are shown in the S&P and Fitch scale (e.g., AAA). For securities which are not rated by any of the three agencies, the security is considered Not Rated. |
| (y) | A yield curve graphically depicts the yields of different maturity bonds of the same credit quality and type; a normal yield curve is upward sloping, with short-term rates lower than long-term rates. |
The views expressed in this report are those of the portfolio manager(s) only through the end of the period of the report as stated on the cover and do not necessarily reflect the views of MFS or any other person in the MFS organization. These views are subject to change at any time based on market or other conditions, and MFS disclaims any responsibility to update such views. These views may not be relied upon as investment advice or an indication of trading intent on behalf of any MFS portfolio. References to specific securities are not recommendations of such securities, and may not be representative of any MFS portfolio’s current or future investments.
5
MFS Global Tactical Allocation Portfolio
PERFORMANCE SUMMARY THROUGH 12/31/19
The following chart illustrates the historical performance of the fund in comparison to its benchmark(s). Benchmarks are unmanaged and may not be invested in directly. Benchmark returns do not reflect any fees or expenses. The performance of other share classes will be greater than or less than that of the class depicted below. (See Notes to Performance Summary.)
Performance data shown represents past performance and is no guarantee of future results. Investment return and principal value fluctuate so your units, when sold, may be worth more or less than the original cost; current performance may be lower or higher than quoted. The performance shown does not reflect the deduction of taxes, if any, that a contract holder would pay on fund distributions or the redemption of contract units. The returns for the fund shown also do not reflect the deduction of expenses associated with variable products, such as mortality and expense risk charges, separate account charges, and sales charges imposed by the insurance company separate accounts. Such expenses would reduce the overall returns shown.
Growth of a Hypothetical $10,000 Investment
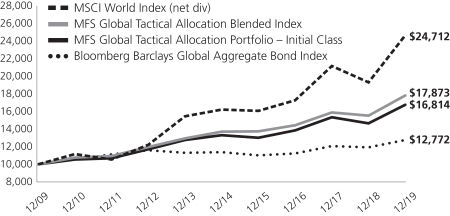
Total Returns through 12/31/19
Average annual total returns
| | | | | | | | | | | | |
| | | Share Class | | Class Inception Date | | 1-yr | | 5-yr | | 10-yr | | |
| | | Initial Class | | 11/07/94 | | 14.58% | | 4.73% | | 5.33% | | |
| | | Service Class | | 8/24/01 | | 14.30% | | 4.46% | | 5.07% | | |
| | | | |
| Comparative benchmark(s) | | | | | | | | |
| | | Bloomberg Barclays Global Aggregate Bond Index (f) | | 6.84% | | 2.31% | | 2.48% | | |
| | | MFS Global Tactical Allocation Blended Index (f)(w) | | 14.75% | | 5.39% | | 5.98% | | |
| | | Bloomberg Barclays Global Aggregate Bond Index Hedged (f) | | 8.22% | | 3.57% | | 4.08% | | |
| | | MSCI World Index (net div) (f) | | 27.67% | | 8.74% | | 9.47% | | |
| (f) | | Source: FactSet Research Systems Inc. |
| (w) | | As of December 31, 2019, MFS Global Tactical Allocation Blended Index (a custom index) was comprised of 35% MSCI World Index (net div), 54% Bloomberg Barclays Global Aggregate Bond Index Hedged, and 11% Bloomberg Barclays Global Aggregate Bond Index. |
Benchmark Definition(s)
Bloomberg Barclays Global Aggregate Bond Index – provides a broad-based measure of the global investment-grade fixed income markets. The three major components of this index are the U.S. Aggregate, the Pan-European Aggregate, and the Asian-Pacific Aggregate Indices. The index also includes Eurodollar and Euro-Yen corporate bonds, Canadian government, agency and corporate securities, and USD investment grade 144A securities.(b)
Bloomberg Barclays Global Aggregate Bond Index Hedged – provides a broad-based measure of the currency-hedged performance of global investment-grade fixed income markets. The three major components of this index are the U.S. Aggregate, thePan-European Aggregate, and the Asian-Pacific Aggregate Indices. The index also includes Eurodollar and Euro-Yen corporate bonds, Canadian government, agency and corporate securities, and USD investment grade 144A securities.(b)
MSCI World Index (net div) – a market capitalization-weighted index that is designed to measure equity market performance in the global developed markets. Morgan Stanley Capital International (“MSCI”) makes no express or implied warranties or representations
6
MFS Global Tactical Allocation Portfolio
Performance Summary – continued
and shall have no liability whatsoever with respect to any MSCI data contained herein. The MSCI data may not be further redistributed or used as a basis for other indices or any securities or financial products. This report is not approved, reviewed, or produced by MSCI.
It is not possible to invest directly in an index.
| (b) | BLOOMBERG® is a trademark and service mark of Bloomberg Finance L.P. and its affiliates (collectively “Bloomberg”). BARCLAYS® is a trademark and service mark of Barclays Bank Plc (collectively with its affiliates, “Barclays”), used under license. Bloomberg or Bloomberg’s licensors, including Barclays, own all proprietary rights in the Bloomberg Barclays Indices. Neither Bloomberg nor Barclays approves or endorses this material, or guarantees the accuracy or completeness of any information herein, or makes any warranty, express or implied, as to the results to be obtained therefrom, and, to the maximum extent allowed by law, neither shall have any liability or responsibility for injury or damages arising in connection therewith. |
Notes to Performance Summary
Average annual total return represents the average annual change in value for each share class for the periods presented.
Performance results reflect any applicable expense subsidies and waivers in effect during the periods shown. Without such subsidies and waivers the fund’s performance results would be less favorable. Please see the prospectus and financial statements for complete details. All results are historical and assume the reinvestment of any dividends and capital gains distributions.
Performance results do not include adjustments made for financial reporting purposes in accordance with U.S. generally accepted accounting principles and may differ from amounts reported in the financial highlights.
Performance information prior to February 8, 2010 reflects time periods when the fund (i) had a policy of investing between 40% and 75% of its assets in equity securities and at least 25% of its assets in fixed income senior securities and (ii) did not employ atactical asset allocation overlay. The funds investment policies and strategies changed effective February 8, 2010.
From time to time the fund may receive proceeds from litigation settlements, without which performance would be lower.
7
MFS Global Tactical Allocation Portfolio
EXPENSE TABLE
Fund Expenses Borne by the Contract Holders during the Period,
July 1, 2019 through December 31, 2019
As a contract holder of the fund, you incur ongoing costs, including management fees; distribution and/or service(12b-1) fees; and other fund expenses. This example is intended to help you understand your ongoing costs (in dollars) of investing in the fund and to compare these costs with the ongoing costs of investing in other mutual funds.
The example is based on an investment of $1,000 invested at the beginning of the period and held for the entire period July 1, 2019 through December 31, 2019.
Actual Expenses
The first line for each share class in the following table provides information about actual account values and actual expenses. You may use the information in this line, together with the amount you invested, to estimate the expenses that you paid over the period. Simply divide your account value by $1,000 (for example, an $8,600 account value divided by $1,000 = 8.6), then multiply the result by the number in the first line under the heading entitled “Expenses Paid During Period” to estimate the expenses you paid on your account during this period.
Hypothetical Example for Comparison Purposes
The second line for each share class in the following table provides information about hypothetical account values and hypothetical expenses based on the fund’s actual expense ratio and an assumed rate of return of 5% per year before expenses, which is not the fund’s actual return. The hypothetical account values and expenses may not be used to estimate the actual ending account balance or expenses you paid for the period. You may use this information to compare the ongoing costs of investing in the fund and other funds. To do so, compare this 5% hypothetical example with the 5% hypothetical examples that appear in the shareholder reports of the other funds.
Please note that the expenses shown in the table are meant to highlight the fund’s ongoing costs only and do not take into account the fees and expenses imposed under the variable contracts through which your investment in the fund is made. Therefore, the second line for each share class in the table is useful in comparing ongoing costs associated with an investment in vehicles (such as the fund) which fund benefits under variable annuity and variable life insurance contracts and to qualified pension and retirement plans only, and will not help you determine the relative total costs of investing in the fund through variable annuity and variable life insurance contracts. If the fees and expenses imposed under the variable contracts were included, your costs would have been higher.
| | | | | | | | | | | | | | | | | | |
| Share Class | | | | Annualized
Expense Ratio | | | Beginning
Account Value
7/01/19 | | | Ending
Account Value
12/31/19 | | | Expenses Paid
During Period (p)
7/01/19-12/31/19 | |
| Initial Class | | Actual | | | 0.79% | | | | $1,000.00 | | | | $1,043.47 | | | | $4.07 | |
| | Hypothetical (h) | | | 0.79% | | | | $1,000.00 | | | | $1,021.22 | | | | $4.02 | |
| Service Class | | Actual | | | 1.04% | | | | $1,000.00 | | | | $1,041.88 | | | | $5.35 | |
| | Hypothetical (h) | | | 1.04% | | | | $1,000.00 | | | | $1,019.96 | | | | $5.30 | |
| (h) | 5% class return per year before expenses. |
| (p) | “Expenses Paid During Period” are equal to each class’s annualized expense ratio, as shown above, multiplied by the average account value over the period, multiplied by 184/365 (to reflect theone-half year period). |
Notes to Expense Table
Expense ratios include 0.02% of interest expense on uncovered collateral or margin obligations with the broker (See Note 2 of the Notes to Financial Statements) that are outside of the expense limitation arrangement (See Note 3 of the Notes to Financial Statements).
8
MFS Global Tactical Allocation Portfolio
PORTFOLIO OF INVESTMENTS – 12/31/19
The Portfolio of Investments is a complete list of all securities owned by your fund. It is categorized by broad-based asset classes.
| | | | | | | | |
| | |
| Issuer | | Shares/Par | | | Value ($) | |
| BONDS – 58.3% | | | | | | | | |
| Aerospace – 0.3% | | | | | | | | |
| Huntington Ingalls Industries, Inc., 3.483%, 12/01/2027 | | $ | 370,000 | | | $ | 384,578 | |
| L3Harris Technologies, Inc., 3.85%, 6/15/2023 (n) | | | 555,000 | | | | 584,233 | |
| Lockheed Martin Corp., 3.55%, 1/15/2026 | | | 749,000 | | | | 802,821 | |
| | | | | | | | |
| | | | | | $ | 1,771,632 | |
| | | | | | | | |
| Apparel Manufacturers – 0.1% | | | | | |
| Tapestry, Inc., 4.125%, 7/15/2027 | | $ | 360,000 | | | $ | 367,577 | |
| | | | | | | | |
| Asset-Backed & Securitized – 2.3% | | | | | |
| Dryden Senior Loan Fund,2013-26A, “AR”, CLO, FLR, 2.9% (LIBOR - 3mo. + 0.9%), 4/15/2029 (n) | | $ | 1,292,000 | | | $ | 1,290,231 | |
| Dryden Senior Loan Fund,2018-55A, “A1”, CLO, FLR, 3.02% (LIBOR - 3mo. + 1.02%), 4/15/2031 (n) | | | 2,040,000 | | | | 2,025,744 | |
| Fort CRE LLC,2018-1A, “A1”, FLR, 3.135% (LIBOR - 1mo. + 1.35%), 11/16/2035 (n) | | | 584,500 | | | | 584,499 | |
| JPMBB Commercial Mortgage Securities Trust,2014-C26, 3.494%, 1/15/2048 | | | 2,570,000 | | | | 2,697,523 | |
| KKR Real Estate Financial Trust, Inc.,2018-FL1, “A”, FLR, 2.837% (LIBOR - 1mo. + 1.1%), 6/15/2036 (n) | | | 773,500 | | | | 774,708 | |
| Magnetite CLO Ltd.,2012-7A, “A1R2”, FLR, 2.8% (LIBOR - 3mo. + 0.8%), 1/15/2028 (n) | | | 1,398,000 | | | | 1,393,833 | |
| Morgan Stanley Capital I Trust,2017-H1, “A5”, 3.53%, 6/15/2050 | | | 659,762 | | | | 700,863 | |
| Octagon Investment Partners XVII Ltd.,2013-1A, “BR2”, FLR, 3.339% (LIBOR - 3mo. + 1.4%), 1/25/2031 (n) | | | 2,275,000 | | | | 2,228,540 | |
| Wells Fargo Commercial Mortgage Trust,2015-C28, “A4”, 3.54%, 5/15/2048 | | | 2,271,943 | | | | 2,397,466 | |
| | | | | | | | |
| | | | | | $ | 14,093,407 | |
| | | | | | | | |
| Automotive – 0.4% | | | | | | | | |
| Ferrari N.V., 1.5%, 3/16/2023 | | EUR | 450,000 | | | $ | 521,422 | |
| Ford Motor Credit Co. LLC, 1.514%, 2/17/2023 | | | 200,000 | | | | 226,361 | |
| General Motors Co., 6.75%, 4/01/2046 | | $ | 312,000 | | | | 366,221 | |
| Lear Corp., 3.8%, 9/15/2027 | | | 416,000 | | | | 419,720 | |
| Volkswagen Financial Services AG, 1.5%, 10/01/2024 | | EUR | 405,000 | | | | 471,570 | |
| | | | | | | | |
| | |
Issuer | | Shares/Par | | | Value ($) | |
| BONDS – continued | | | | | |
| Automotive – continued | | | | | | | | |
| Volkswagen International Finance N.V., 1.875%, 3/30/2027 | | EUR | 300,000 | | | $ | 355,853 | |
| Volkswagen Leasing GmbH, 1.5%, 6/19/2026 | | | 250,000 | | | | 290,128 | |
| | | | | | | | |
| | | | | | $ | 2,651,275 | |
| | | | | | | | |
| Broadcasting – 0.3% | | | | | | | | |
| Discovery, Inc., 4.125%, 5/15/2029 | | $ | 184,000 | | | $ | 198,605 | |
| MMS USA Financing, Inc., 1.75%, 6/13/2031 | | EUR | 900,000 | | | | 1,024,794 | |
| ViacomCBS, Inc., 4.375%, 3/15/2043 | | $ | 309,000 | | | | 326,786 | |
| WPP Finance 2016 Co., 1.375%, 3/20/2025 | | EUR | 330,000 | | | | 384,728 | |
| | | | | | | | |
| | | | | | $ | 1,934,913 | |
| | | | | | | | |
| Brokerage & Asset Managers – 0.5% | | | | | |
| E*TRADE Financial Corp., 2.95%, 8/24/2022 | | $ | 364,000 | | | $ | 370,647 | |
| Euroclear Investments S.A., 2.625%, 4/11/2048 | | EUR | 300,000 | | | | 366,493 | |
| Intercontinental Exchange, Inc., 3.75%, 12/01/2025 | | $ | 831,000 | | | | 894,403 | |
| Low Income Investment Fund, 3.386%, 7/01/2026 | | | 150,000 | | | | 151,237 | |
| Low Income Investment Fund, 3.711%, 7/01/2029 | | | 400,000 | | | | 409,531 | |
| TD Ameritrade Holding Corp., 2.95%, 4/01/2022 | | | 676,000 | | | | 690,795 | |
| | | | | | | | |
| | | | | | $ | 2,883,106 | |
| | | | | | | | |
| Building – 0.1% | | | | | | | | |
| Imerys S.A., 1.5%, 1/15/2027 | | EUR | 300,000 | | | $ | 344,132 | |
| Martin Marietta Materials, Inc., 3.45%, 6/01/2027 | | $ | 339,000 | | | | 346,627 | |
| | | | | | | | |
| | | | | | $ | 690,759 | |
| | | | | | | | |
| Business Services – 0.4% | | | | | | | | |
| Euronet Worldwide, Inc., 1.375%, 5/22/2026 | | EUR | 900,000 | | | $ | 1,003,147 | |
| Fidelity National Information Services, Inc., 3.875%, 6/05/2024 | | $ | 179,000 | | | | 190,360 | |
| Fidelity National Information Services, Inc., 2.602%, 5/21/2025 | | GBP | 100,000 | | | | 138,605 | |
| Fidelity National Information Services, Inc., 0.625%, 12/03/2025 | | EUR | 100,000 | | | | 112,882 | |
| Fidelity National Information Services, Inc., 3%, 8/15/2026 | | $ | 758,000 | | | | 783,570 | |
| Fidelity National Information Services, Inc., 1%, 12/03/2028 | | EUR | 150,000 | | | | 168,791 | |
| Fidelity National Information Services, Inc., 3.36%, 5/21/2031 | | GBP | 100,000 | | | | 145,043 | |
| Fiserv, Inc., 4.4%, 7/01/2049 | | $ | 164,000 | | | | 185,588 | |
| | | | | | | | |
| | | | | | $ | 2,727,986 | |
| | | | | | | | |
9
MFS Global Tactical Allocation Portfolio
Portfolio of Investments – continued
| | | | | | | | |
| | |
| Issuer | | Shares/Par | | | Value ($) | |
| BONDS – continued | | | | | | | | |
| Cable TV – 0.4% | | | | | | | | |
| Charter Communications Operating LLC/Charter Communications Operating Capital Corp., 6.384%, 10/23/2035 | | $ | 332,000 | | | $ | 418,159 | |
| Cox Communications, Inc., 3.25%, 12/15/2022 (n) | | | 498,000 | | | | 512,008 | |
| Eutelsat S.A., 2.25%, 7/13/2027 | | EUR | 700,000 | | | | 816,464 | |
| SES Global Americas Holdings GP, 5.3%, 3/25/2044 (n) | | $ | 313,000 | | | | 304,304 | |
| SES S.A., 1.625%, 3/22/2026 | | EUR | 250,000 | | | | 292,268 | |
| SES S.A., 0.875%, 11/04/2027 | | | 150,000 | | | | 164,143 | |
| | | | | | | | |
| | | | | | $ | 2,507,346 | |
| | | | | | | | |
| Chemicals – 0.2% | | | | | | | | |
| Sasol Financing (USA) LLC, 6.5%, 9/27/2028 | | $ | 300,000 | | | $ | 333,319 | |
| Sherwin-Williams Co., 3.8%, 8/15/2049 | | | 270,000 | | | | 274,352 | |
| Symrise AG, 1.25%, 11/29/2025 | | EUR | 323,000 | | | | 375,658 | |
| | | | | | | | |
| | | | | | $ | 983,329 | |
| | | | | | | | |
| Computer Software – 0.3% | | | | | | | | |
| Dassault Systemes S.A., 0.125%, 9/16/2026 | | EUR | 200,000 | | | $ | 221,393 | |
| Dell International LLC/EMC Corp., 4.9%, 10/01/2026 (n) | | $ | 749,000 | | | | 823,930 | |
| Microsoft Corp., 4.1%, 2/06/2037 | | | 824,000 | | | | 972,053 | |
| | | | | | | | |
| | | | | | $ | 2,017,376 | |
| | | | | | | | |
| Computer Software – Systems – 0.1% | | | | | |
| Apple, Inc., 4.5%, 2/23/2036 | | $ | 387,000 | | | $ | 469,277 | |
| | | | | | | | |
| Conglomerates – 0.4% | | | | | | | | |
| General Electric Co., 0.875%, 5/17/2025 | | EUR | 400,000 | | | $ | 450,764 | |
| Illinois Tool Works, Inc., 1%, 6/05/2031 | | | 260,000 | | | | 300,470 | |
| Roper Technologies, Inc., 2.95%, 9/15/2029 | | $ | 220,000 | | | | 221,916 | |
| United Technologies Corp., 3.65%, 8/16/2023 | | | 743,000 | | | | 782,699 | |
| Wabtec Corp., 4.95%, 9/15/2028 | | | 355,000 | | | | 390,303 | |
| | | | | | | | |
| | | | | | $ | 2,146,152 | |
| | | | | | | | |
| Consumer Products – 0.2% | | | | | | | | |
| Reckitt Benckiser Treasury Services PLC, 3.625%, 9/21/2023 (n) | | $ | 577,000 | | | $ | 600,771 | |
| Reckitt Benckiser Treasury Services PLC, 3%, 6/26/2027 (n) | | | 425,000 | | | | 435,060 | |
| | | | | | | | |
| | | | | | $ | 1,035,831 | |
| | | | | | | | |
| Consumer Services – 0.3% | | | | | | | | |
| Booking Holdings, Inc., 3.55%, 3/15/2028 | | $ | 356,000 | | | $ | 378,900 | |
| Experian Finance PLC, 4.25%, 2/01/2029 (n) | | | 692,000 | | | | 760,494 | |
| | | | | | | | |
| | |
| Issuer | | Shares/Par | | | Value ($) | |
| BONDS – continued | | | | | | | | |
| Consumer Services – continued | | | | | |
| ManpowerGroup, Inc., 1.75%, 6/22/2026 | | EUR | 400,000 | | | $ | 474,985 | |
| Visa, Inc., 3.65%, 9/15/2047 | | $ | 390,000 | | | | 439,640 | |
| | | | | | | | |
| | | | | | $ | 2,054,019 | |
| | | | | | | | |
| Containers – 0.0% | | | | | | | | |
| DS Smith PLC, 0.875%, 9/12/2026 | | EUR | 300,000 | | | $ | 330,578 | |
| | | | | | | | |
| Electronics – 0.2% | | | | | | | | |
| Broadcom Corp./Broadcom Cayman Finance Ltd., 3.875%, 1/15/2027 | | $ | 471,000 | | | $ | 488,737 | |
| Broadcom, Inc., 4.25%, 4/15/2026 (n) | | | 255,000 | | | | 270,933 | |
| Texas Instruments, Inc., 2.25%, 9/04/2029 | | | 567,000 | | | | 559,000 | |
| | | | | | | | |
| | | | | | $ | 1,318,670 | |
| | | | | | | | |
| Emerging Market Quasi-Sovereign – 1.3% | | | | | |
| CEZ A.S. (Czech Republic), 0.875%, 12/02/2026 | | EUR | 500,000 | | | $ | 557,894 | |
| Consorcio Transmantaro S.A. (Republic of Peru), 4.7%, 4/16/2034 (n) | | $ | 200,000 | | | | 219,752 | |
| Export-Import Bank of India, 3.375%, 8/05/2026 | | | 600,000 | | | | 609,806 | |
| Export-Import Bank of India, 3.875%, 2/01/2028 | | | 600,000 | | | | 626,902 | |
| MDGH - GMTN B.V. (United Arab Emirates), 2.5%, 11/07/2024 | | | 398,000 | | | | 398,995 | |
| NTPC Ltd. (Republic of India), 4.25%, 2/26/2026 | | | 400,000 | | | | 420,639 | |
| Power Finance Corp. Ltd. (Republic of India), 3.75%, 12/06/2027 | | | 450,000 | | | | 446,664 | |
| PT Pertamina (Persero) (Republic of Indonesia), 3.65%, 7/30/2029 | | | 550,000 | | | | 575,925 | |
| PT Pertamina (Persero) (Republic of Indonesia), 6%, 5/03/2042 (n) | | | 2,084,000 | | | | 2,540,357 | |
| State Bank of India (London), 4.375%, 1/24/2024 | | | 400,000 | | | | 421,224 | |
| State Grid Overseas Investment (2016) Ltd. (People’s Republic of China), 3.5%, 5/04/2027 | | | 1,007,000 | | | | 1,052,928 | |
| | | | | | | | |
| | | | | | $ | 7,871,086 | |
| | | | | | | | |
| Emerging Market Sovereign – 2.0% | | | | | |
| Oriental Republic of Uruguay, 4.375%, 1/23/2031 | | $ | 1,972,000 | | | $ | 2,204,696 | |
| Republic of Croatia, 1.125%, 6/19/2029 | | EUR | 2,050,000 | | | | 2,371,017 | |
| Republic of Hungary, 5.375%, 2/21/2023 | | $ | 1,972,000 | | | | 2,162,890 | |
| Republic of Indonesia, 7.5%, 6/15/2035 | | IDR | 11,400,000,000 | | | | 821,503 | |
| State of Qatar, 4%, 3/14/2029 (n) | | $ | 462,000 | | | | 515,594 | |
| United Mexican States, 8.5%, 5/31/2029 | | MXN | 62,600,000 | | | | 3,685,081 | |
| | | | | | | | |
| | | | | | $ | 11,760,781 | |
| | | | | | | | |
10
MFS Global Tactical Allocation Portfolio
Portfolio of Investments – continued
| | | | | | | | |
| | |
| Issuer | | Shares/Par | | | Value ($) | |
| BONDS – continued | | | | | | | | |
| Energy – Independent – 0.4% | | | | | | | | |
| Tengizchevroil Finance Co. International Ltd., 4%, 8/15/2026 (n) | | $ | 2,260,000 | | | $ | 2,370,012 | |
| | | | | | | | |
| Energy – Integrated – 0.3% | | | | | | | | |
| BP Capital Markets America, Inc., 3.41%, 2/11/2026 | | $ | 1,142,000 | | | $ | 1,215,583 | |
| Eni S.p.A., 4.25%, 5/09/2029 (n) | | | 321,000 | | | | 352,039 | |
| OMV AG, 1%, 7/03/2034 | | EUR | 180,000 | | | | 201,203 | |
| | | | | | | | |
| | | | | | $ | 1,768,825 | |
| | | | | | | | |
| Financial Institutions – 0.6% | | | | | | | | |
| AerCap Ireland Capital DAC, 3.65%, 7/21/2027 | | $ | 551,000 | | | $ | 567,132 | |
| Avolon Holdings Funding Ltd., 4.375%, 5/01/2026 (n) | | | 311,000 | | | | 328,509 | |
| GE Capital International Funding Co., 3.373%, 11/15/2025 | | | 959,000 | | | | 998,164 | |
| Grand City Properties S.A., 1.375%, 8/03/2026 | | EUR | 700,000 | | | | 810,622 | |
| Grand City Properties S.A., 2.5%, 10/24/2069 | | | 500,000 | | | | 578,590 | |
| LEG Immobilien AG, 0.875%, 11/28/2027 | | | 200,000 | | | | 224,340 | |
| | | | | | | | |
| | | | | | $ | 3,507,357 | |
| | | | | | | | |
| Food & Beverages – 0.4% | | | | | | | | |
| Anheuser-Busch InBev N.V., 1.5%, 4/18/2030 | | EUR | 400,000 | | | $ | 481,222 | |
| Anheuser-Busch InBev S.A., 1.65%, 3/28/2031 | | | 300,000 | | | | 366,393 | |
| Anheuser-Busch InBev Worldwide, Inc., 4.375%, 4/15/2038 | | $ | 201,000 | | | | 225,263 | |
| Anheuser-Busch InBev Worldwide, Inc., 5.55%, 1/23/2049 | | | 292,000 | | | | 378,259 | |
| Bacardi Ltd., 5.15%, 5/15/2038 (n) | | | 335,000 | | | | 377,735 | |
| Constellation Brands, Inc., 4.4%, 11/15/2025 | | | 586,000 | | | | 639,693 | |
| | | | | | | | |
| | | | | | $ | 2,468,565 | |
| | | | | | | | |
| Forest & Paper Products – 0.2% | | | | | |
| Celulosa Arauco y Constitucion, 4.2%, 1/29/2030 (n) | | $ | 200,000 | | | $ | 200,600 | |
| Suzano Austria GmbH, 6%, 1/15/2029 | | | 675,000 | | | | 761,062 | |
| | | | | | | | |
| | | | | | $ | 961,662 | |
| | | | | | | | |
| Gaming & Lodging – 0.0% | | | | | | | | |
| Las Vegas Sands Corp., 3.9%, 8/08/2029 | | $ | 216,000 | | | $ | 225,282 | |
| | | | | | | | |
| Industrial – 0.0% | | | | | | | | |
| Investor AB, 1.5%, 6/20/2039 | | EUR | 160,000 | | | $ | 188,134 | |
| | | | | | | | |
| Insurance – 0.5% | | | | | | | | |
| American International Group, Inc., 1.875%, 6/21/2027 | | EUR | 380,000 | | | $ | 455,789 | |
| Argentum Zurich Insurance, 3.5%, 10/01/2046 | | | 400,000 | | | | 517,597 | |
| | | | | | | | |
| | |
| Issuer | | Shares/Par | | | Value ($) | |
| BONDS – continued | | | | | | | | |
| Insurance – continued | | | | | |
| Aviva PLC, 3.875% to 7/03/2024, FLR (EUR Swap Rate - 5yr. + 3.48%) to 7/03/2044 | | EUR | 350,000 | | | $ | 437,743 | |
| CNP Assurances S.A., 2% to 7/27/2030, FLR (EURIBOR - 3mo. + 3%) to 7/27/2050 | | | 400,000 | | | | 452,994 | |
| La Mondiale, 4.375% to 10/24/2029, FLR (EUR Swap Rate - 5yr. + 4.411%) to 10/24/2060 | | | 500,000 | | | | 601,164 | |
| NN Group N.V., 4.625% to 4/08/2024, FLR (EURIBOR - 3mo. + 3.95%) to 4/08/2044 | | | 350,000 | | | | 451,000 | |
| | | | | | | | |
| | | | | | $ | 2,916,287 | |
| | | | | | | | |
| Insurance – Property & Casualty – 0.6% | | | | | |
| Berkshire Hathaway, Inc., 2.75%, 3/15/2023 | | $ | 636,000 | | | $ | 651,776 | |
| Berkshire Hathaway, Inc., 4.5%, 2/11/2043 | | | 400,000 | | | | 483,715 | |
| Chubb INA Holdings, Inc., 0.875%, 6/15/2027 | | EUR | 100,000 | | | | 114,226 | |
| Hartford Financial Services Group, Inc., 3.6%, 8/19/2049 | | $ | 429,000 | | | | 440,175 | |
| Marsh & McLennan Cos., Inc., 1.979%, 3/21/2030 | | EUR | 100,000 | | | | 122,451 | |
| Marsh & McLennan Cos., Inc., 4.35%, 1/30/2047 | | $ | 359,000 | | | | 412,312 | |
| Progressive Corp., 4.125%, 4/15/2047 | | | 476,000 | | | | 552,227 | |
| QBE Capital Funding III Ltd., 7.5% to 5/24/2021, FLR (GBP Swap Rate - 10yr. + 4.003%) to 5/24/2041 | | GBP | 400,000 | | | | 557,043 | |
| | | | | | | | |
| | | | | | $ | 3,333,925 | |
| | | | | | | | |
| International Market Quasi-Sovereign – 0.5% | | | | | |
| Electricite de France, 5.875% to 1/22/2029, FLR (GBP Swap Rate - 15yr. + 3.046%) to 1/22/2049, FLR (GBP Swap Rate - 15yr. + 3.796%) to 12/31/2165 | | GBP | 700,000 | | | $ | 1,013,683 | |
| Islandsbanki (Republic of Iceland), 1.125%, 1/19/2024 | | EUR | 680,000 | | | | 768,274 | |
| KFW German Government Development Bank, 1.125%, 6/15/2037 | | | 1,015,000 | | | | 1,270,562 | |
| Vattenfall AB (Kingdom of Sweden), 0.5%, 6/24/2026 | | | 100,000 | | | | 112,910 | |
| | | | | | | | |
| | | | | | $ | 3,165,429 | |
| | | | | | | | |
| International Market Sovereign – 19.0% | | | | | |
| Bundesrepublik Deutschland, 0.25%, 8/15/2028 | | EUR | 4,235,000 | | | $ | 4,962,883 | |
| Commonwealth of Australia, 2.75%, 6/21/2035 | | AUD | 5,749,000 | | | | 4,655,758 | |
| Federal Republic of Germany, 3.25%, 7/04/2042 | | EUR | 213,000 | | | | 399,502 | |
11
MFS Global Tactical Allocation Portfolio
Portfolio of Investments – continued
| | | | | | | | |
| | |
| Issuer | | Shares/Par | | | Value ($) | |
| BONDS – continued | | | | | | | | |
| International Market Sovereign – continued | | | | | |
| Federal Republic of Germany, 2.5%, 7/04/2044 | | EUR | 3,985,000 | | | $ | 6,858,432 | |
| Federal Republic of Germany, 2.5%, 8/15/2046 | | | 480,000 | | | | 843,805 | |
| Government of Australia, 2.25%, 5/21/2028 | | AUD | 3,285,000 | | | | 2,474,223 | |
| Government of Canada, 5.75%, 6/01/2033 | | CAD | 3,555,000 | | | | 4,039,595 | |
| Government of Japan, 1.8%, 9/20/2030 | | JPY | 1,052,700,000 | | | | 11,535,375 | |
| Government of Japan, 1.8%, 6/20/2031 | | | 1,092,100,000 | | | | 12,071,547 | |
| Government of Japan, 2.4%, 3/20/2037 | | | 239,050,000 | | | | 3,011,121 | |
| Government of Japan, 0.5%, 6/20/2038 | | | 426,100,000 | | | | 4,095,705 | |
| Government of Japan, 2.3%, 3/20/2040 | | | 382,200,000 | | | | 4,904,317 | |
| Kingdom of Spain, 1.95%, 7/30/2030 | | EUR | 2,255,000 | | | | 2,897,719 | |
| Kingdom of Spain, 1.85%, 7/30/2035 | | | 5,110,000 | | | | 6,555,662 | |
| Obrigacoes do Tesouro (Republic of Portugal), 2.25%, 4/18/2034 | | | 2,692,000 | | | | 3,606,328 | |
| Republic of France, 1.25%, 5/25/2036 | | | 3,430,000 | | | | 4,303,382 | |
| Republic of France, 1.5%, 5/25/2050 | | | 2,295,000 | | | | 2,967,897 | |
| Republic of Italy, 2.1%, 7/15/2026 | | | 5,055,000 | | | | 6,084,632 | |
| Republic of Italy, 4%, 2/01/2037 | | | 1,315,000 | | | | 1,896,158 | |
| Republic of Italy, 3.1%, 3/01/2040 | | | 3,830,000 | | | | 4,914,782 | |
| Republic of Italy, 3.45%, 3/01/2048 | | | 1,940,000 | | | | 2,646,302 | |
| Republic of Portugal, 4.1%, 4/15/2037 | | | 715,000 | | | | 1,193,309 | |
| United Kingdom Treasury, 1.625%, 10/22/2028 | | GBP | 4,820,000 | | | | 6,861,889 | |
| United Kingdom Treasury, 0.875%, 10/22/2029 | | | 6,380,000 | | | | 8,483,821 | |
| United Kingdom Treasury, 1.75%, 9/07/2037 | | | 1,250,000 | | | | 1,788,541 | |
| | | | | | | | |
| | | | | | $ | 114,052,685 | |
| | | | | | | | |
| Local Authorities – 0.6% | | | | | | | | |
| City of Oslo, 2.45%, 5/24/2023 | | NOK | 4,000,000 | | | $ | 459,001 | |
| City of Oslo, 2.05%, 10/31/2024 | | | 13,000,000 | | | | 1,472,034 | |
| Province of Alberta, 4.5%, 12/01/2040 | | CAD | 665,000 | | | | 663,448 | |
| Province of British Columbia, 2.3%, 6/18/2026 | | | 965,000 | | | | 751,557 | |
| | | | | | | | |
| | | | | | $ | 3,346,040 | |
| | | | | | | | |
| Machinery & Tools – 0.1% | | | | | | | | |
| CNH Industrial Capital LLC, 1.875%, 1/19/2026 | | EUR | 350,000 | | | $ | 413,658 | |
| | | | | | | | |
| Major Banks – 2.4% | | | | | | | | |
| Bank of America Corp., 2.625%, 4/19/2021 | | $ | 972,000 | | | $ | 981,087 | |
| | | | | | | | |
| | |
| Issuer | | Shares/Par | | | Value ($) | |
| BONDS – continued | | | | | | | | |
| Major Banks – continued | | | | | |
| Bank of America Corp., 3.5%, 4/19/2026 | | $ | 1,274,000 | | | $ | 1,353,599 | |
| Bankinter S.A., 0.875%, 7/08/2026 | | EUR | 400,000 | | | | 451,990 | |
| Barclays PLC, 3.125%, 1/17/2024 | | GBP | 350,000 | | | | 486,758 | |
| Credit Agricole S.A., 1.25%, 10/02/2024 | | | 300,000 | | | | 394,918 | |
| Credit Suisse Group AG, 1.25%, 7/17/2025 | | EUR | 400,000 | | | | 464,982 | |
| Credit Suisse Group AG, 1%, 6/24/2027 | | | 700,000 | | | | 801,969 | |
| Erste Group Bank AG, 0.875%, 5/22/2026 | | | 300,000 | | | | 344,209 | |
| Erste Group Bank AG, 1% to 6/10/2025, FLR (EUR ICE Swap Rate - 5yr. + 1.3%) to 6/10/2030 | | | 400,000 | | | | 446,215 | |
| HSBC Holdings PLC, 4.375%, 11/23/2026 | | $ | 743,000 | | | | 804,210 | |
| JPMorgan Chase & Co., 2.95%, 10/01/2026 | | | 1,647,000 | | | | 1,695,875 | |
| JPMorgan Chase & Co., 3.54%, 5/01/2028 | | | 745,000 | | | | 790,660 | |
| Lloyds Bank PLC, 0.5% to 11/12/2024, FLR (EUR Swap Rate - 1yr. + 0.85%) to 11/12/2025 | | EUR | 550,000 | | | | 615,349 | |
| Morgan Stanley, 3.95%, 4/23/2027 | | $ | 636,000 | | | | 681,621 | |
| Nationwide Building Society, 1.5%, 3/08/2026 | | EUR | 200,000 | | | | 234,717 | |
| Sumitomo Mitsui Financial Group, Inc., 0.465%, 5/30/2024 | | | 200,000 | | | | 225,601 | |
| Sumitomo Mitsui Financial Group, Inc., 3.544%, 1/17/2028 | | $ | 1,096,000 | | | | 1,158,684 | |
| Svenska Handelsbanken AB, 5.25%, 12/29/2049 | | | 606,000 | | | | 615,848 | |
| UBS Group Funding (Switzerland) AG, 2.859%, 8/15/2023 (n) | | | 300,000 | | | | 304,677 | |
| UniCredit S.p.A., 1.625% to 7/03/2024, FLR (EURIBOR - 3mo. + 1.9%) to 7/03/2025 | | EUR | 500,000 | | | | 574,395 | |
| UniCredito Italiano S.p.A., 6.572%, 1/14/2022 (n) | | $ | 362,000 | | | | 388,648 | |
| Wells Fargo & Co., 3.9%, 5/01/2045 | | | 487,000 | | | | 550,656 | |
| | | | | | | | |
| | | | | | $ | 14,366,668 | |
| | | | | | | | |
| Medical & Health Technology & Services – 0.8% | | | | | |
| Alcon, Inc., 3.8%, 9/23/2049 (n) | | $ | 200,000 | | | $ | 209,145 | |
| Becton, Dickinson and Co., 1.401%, 5/24/2023 | | EUR | 500,000 | | | | 580,064 | |
| Becton, Dickinson and Co., 3.734%, 12/15/2024 | | $ | 619,000 | | | | 655,660 | |
| Cigna Corp., 4.125%, 11/15/2025 | | | 510,000 | | | | 552,888 | |
| HCA, Inc., 5.125%, 6/15/2039 | | | 240,000 | | | | 264,868 | |
| Laboratory Corp. of America Holdings, 3.2%, 2/01/2022 | | | 1,025,000 | | | | 1,047,983 | |
| Medtronic Global Holdings S.C.A., 1.75%, 7/02/2049 | | EUR | 237,000 | | | | 259,758 | |
12
MFS Global Tactical Allocation Portfolio
Portfolio of Investments – continued
| | | | | | | | |
| | |
| Issuer | | Shares/Par | | | Value ($) | |
| BONDS – continued | | | | | | | | |
| Medical & Health Technology & Services – continued | |
| Northwell Healthcare, Inc., 4.26%, 11/01/2047 | | $ | 438,000 | | | $ | 469,741 | |
| Thermo Fisher Scientific, Inc., 2.95%, 9/19/2026 | | | 394,000 | | | | 404,765 | |
| Thermo Fisher Scientific, Inc., 0.875%, 10/01/2031 | | EUR | 200,000 | | | | 220,375 | |
| | | | | | | | |
| | | | | | $ | 4,665,247 | |
| | | | | | | | |
| Medical Equipment – 0.3% | | | | | | | | |
| Abbott Ireland Financing DAC, 1.5%, 9/27/2026 | | EUR | 350,000 | | | $ | 424,552 | |
| Abbott Ireland Financing DAC, 0.375%, 11/19/2027 | | | 200,000 | | | | 224,013 | |
| Boston Scientific Corp., 0.625%, 12/01/2027 | | | 150,000 | | | | 167,321 | |
| DH Europe Finance II S.à r.l., 0.45%, 3/18/2028 | | | 150,000 | | | | 166,194 | |
| DH Europe Finance II S.à r.l., 1.35%, 9/18/2039 | | | 200,000 | | | | 211,930 | |
| EssilorLuxottica S.A., 0.375%, 11/27/2027 | | | 200,000 | | | | 224,014 | |
| EssilorLuxottica S.A., 0.75%, 11/27/2031 | | | 200,000 | | | | 225,332 | |
| | | | | | | | |
| | | | | | $ | 1,643,356 | |
| | | | | | | | |
| Midstream – 0.8% | | | | | | | | |
| APT Pipelines Ltd., 5%, 3/23/2035 (n) | | $ | 705,000 | | | $ | 795,687 | |
| Cheniere Energy, Inc., 3.7%, 11/15/2029 (n) | | | 328,000 | | | | 334,489 | |
| GNL Quintero S.A., 4.634%, 7/31/2029 (n) | | | 1,420,000 | | | | 1,506,989 | |
| MPLX LP, 4.5%, 4/15/2038 | | | 449,000 | | | | 455,842 | |
| ONEOK, Inc., 4.95%, 7/13/2047 | | | 497,000 | | | | 546,464 | |
| Plains All American Pipeline, 3.55%, 12/15/2029 | | | 351,000 | | | | 345,474 | |
| Sabine Pass Liquefaction LLC, 4.2%, 3/15/2028 | | | 890,000 | | | | 942,336 | |
| | | | | | | | |
| | | | | | $ | 4,927,281 | |
| | | | | | | | |
| Mortgage-Backed – 7.2% | | | | | | | | |
Fannie Mae,
5%, 12/01/2020 - 8/01/2040 | | $ | 1,876,387 | | | $ | 2,069,412 | |
Fannie Mae,
4.5%, 7/01/2023 - 2/01/2046 | | | 6,677,662 | | | | 7,235,552 | |
| Fannie Mae, 2.5%, 10/01/2034 | | | 2,190,733 | | | | 2,209,313 | |
| Fannie Mae, 3%, 11/01/2034 | | | 1,829,854 | | | | 1,881,878 | |
Fannie Mae,
5.5%, 11/01/2036 - 4/01/2037 | | | 151,773 | | | | 170,272 | |
Fannie Mae,
6%, 9/01/2037 - 6/01/2038 | | | 261,511 | | | | 297,495 | |
Fannie Mae,
4%, 11/01/2040 - 2/01/2041 | | | 3,488,381 | | | | 3,740,626 | |
Fannie Mae,
3.5%, 5/01/2043 - 1/01/2047 | | | 3,259,889 | | | | 3,443,941 | |
| Freddie Mac, 4%, 7/01/2025 | | | 99,660 | | | | 103,991 | |
| | | | | | | | |
| | |
| Issuer | | Shares/Par | | | Value ($) | |
| BONDS – continued | | | | | | | | |
| Mortgage-Backed – continued | | | | | |
| Freddie Mac, 3.224%, 3/25/2027 | | $ | 4,000,000 | | | $ | 4,230,048 | |
| Freddie Mac, 3.286%, 11/25/2027 | | | 1,303,000 | | | | 1,384,174 | |
| Freddie Mac, 3.35%, 1/25/2028 | | | 2,001,000 | | | | 2,134,497 | |
| Freddie Mac, 3.6%, 1/25/2028 | | | 1,740,000 | | | | 1,885,579 | |
Freddie Mac,
3.9%, 4/25/2028 - 8/25/2028 | | | 2,980,000 | | | | 3,292,282 | |
Freddie Mac,
5.5%, 5/01/2034 - 7/01/2037 | | | 41,636 | | | | 46,794 | |
Freddie Mac,
5%, 10/01/2036 - 7/01/2041 | | | 681,170 | | | | 751,425 | |
Freddie Mac,
4.5%, 12/01/2039 - 5/01/2042 | | | 1,254,681 | | | | 1,362,840 | |
| Freddie Mac, 3.5%, 1/01/2047 | | | 1,248,747 | | | | 1,299,719 | |
| Ginnie Mae, 5%, 5/15/2040 | | | 118,365 | | | | 131,785 | |
Ginnie Mae,
3.5%, 6/20/2043 - 11/20/2049 | | | 2,836,017 | | | | 2,958,008 | |
| Ginnie Mae, 3%, 11/20/2049 | | | 2,219,808 | | | | 2,279,909 | |
| | | | | | | | |
| | | | | | $ | 42,909,540 | |
| | | | | | | | |
| Municipals – 0.3% | | | | | | | | |
| Commonwealth of Puerto Rico, Public Improvement,“C-7”, NATL, 6%, 7/01/2027 | | $ | 55,000 | | | $ | 56,722 | |
| Michigan Finance Authority Hospital Rev. (Trinity Health Credit Group), 3.384%, 12/01/2040 | | | 480,000 | | | | 478,925 | |
| New Jersey Economic Development Authority State Pension Funding Rev., “A”, NATL, 7.425%, 2/15/2029 | | | 421,000 | | | | 527,820 | |
| Oklahoma Development Finance Authority, Health System Rev. (OU Medicine Project), “C”, AGM, 4.65%, 8/15/2030 | | | 572,000 | | | | 648,185 | |
| Puerto Rico Electric Power Authority Rev., “PP”, NATL, 5%, 7/01/2022 | | | 245,000 | | | | 249,312 | |
| | | | | | | | |
| | | | | | $ | 1,960,964 | |
| | | | | | | | |
| Natural Gas – Distribution – 0.2% | | | | | |
| Infraestructura Energética Nova S.A.B. de C.V., 4.875%, 1/14/2048 | | $ | 500,000 | | | $ | 476,250 | |
| NiSource, Inc., 2.95%, 9/01/2029 | | | 674,000 | | | | 670,757 | |
| | | | | | | | |
| | | | | | $ | 1,147,007 | |
| | | | | | | | |
| Network & Telecom – 0.2% | | | | | | | | |
| AT&T, Inc., 4.75%, 5/15/2046 | | $ | 602,000 | | | $ | 679,323 | |
| Verizon Communications, Inc., 0.875%, 3/19/2032 | | EUR | 330,000 | | | | 364,438 | |
| | | | | | | | |
| | | | | | $ | 1,043,761 | |
| | | | | | | | |
| Oils – 0.3% | | | | | | | | |
| Marathon Petroleum Corp., 5.125%, 12/15/2026 | | $ | 390,000 | | | $ | 441,356 | |
| Neste Oyj, 1.5%, 6/07/2024 | | EUR | 500,000 | | | | 583,884 | |
| Phillips 66, 4.875%, 11/15/2044 | | $ | 795,000 | | | | 957,022 | |
| | | | | | | | |
| | | | | | $ | 1,982,262 | |
| | | | | | | | |
13
MFS Global Tactical Allocation Portfolio
Portfolio of Investments – continued
| | | | | | | | |
| | |
| Issuer | | Shares/Par | | | Value ($) | |
| BONDS – continued | | | | | | | | |
| Other Banks & Diversified Financials – 1.1% | | | | | |
| AIB Group PLC, 1.25%, 5/28/2024 | | EUR | 455,000 | | | $ | 524,597 | |
| Belfius Bank S.A., 0.375%, 2/13/2026 | | | 700,000 | | | | 773,495 | |
| BPCE S.A., 0.5%, 2/24/2027 | | | 200,000 | | | | 222,341 | |
| BPCE S.A., 5.25%, 4/16/2029 | | GBP | 400,000 | | | | 652,399 | |
| Commerzbank AG, 0.625%, 8/28/2024 | | EUR | 200,000 | | | | 227,374 | |
| Commerzbank AG, 4%, 3/23/2026 | | | 275,000 | | | | 347,251 | |
| Groupe BPCE S.A., 4.5%, 3/15/2025 (n) | | $ | 584,000 | | | | 628,904 | |
| ING Groep N.V., 1% to 11/13/2025, FLR (EUR Swap Rate - 5yr. + 1.2%) to 11/13/2030 | | EUR | 400,000 | | | | 447,083 | |
| Intesa Sanpaolo S.p.A., 5.25%, 1/28/2022 | | GBP | 450,000 | | | | 637,447 | |
| Intesa Sanpaolo S.p.A., 0.75%, 12/04/2024 | | EUR | 400,000 | | | | 450,574 | |
| KBC Group N.V., 0.5% to 12/03/2024, FLR (EUR Swap Rate - 5yr. + 1.1%) to 12/03/2029 | | | 200,000 | | | | 220,720 | |
| Macquarie Group Ltd., 1.25%, 3/05/2025 | | | 300,000 | | | | 346,356 | |
| UBS AG, 5.125%, 5/15/2024 | | $ | 866,000 | | | | 932,033 | |
| Virgin Money UK PLC, 4% to 9/03/2026, FLR (GBP Government Yield - 1yr. + 3.75%) to 9/03/2027 | | GBP | 330,000 | | | | 454,712 | |
| | | | | | | | |
| | | | | | $ | 6,865,286 | |
| | | | | | | | |
| Pharmaceuticals – 0.1% | | | | | | | | |
| Allergan Funding SCS, 2.625%, 11/15/2028 | | EUR | 320,000 | | | $ | 412,656 | |
| | | | | | | | |
| Real Estate – Office – 0.2% | | | | | | | | |
| Boston Properties, Inc., REIT, 3.125%, 9/01/2023 | | $ | 527,000 | | | $ | 543,532 | |
| Merlin Properties SOCIMI S.A., REIT, 1.875%, 11/02/2026 | | EUR | 350,000 | | | | 418,249 | |
| Merlin Properties SOCIMI S.A., REIT, 1.875%, 12/04/2034 | | | 200,000 | | | | 222,405 | |
| | | | | | | | |
| | | | | | $ | 1,184,186 | |
| | | | | | | | |
| Real Estate – Other – 0.1% | | | | | | | | |
| SELP Finance S.à r.l., 1.5%, 12/20/2026 | | EUR | 400,000 | | | $ | 459,529 | |
| | | | | | | | |
| Real Estate – Retail – 0.1% | | | | | | | | |
| VEREIT Operating Partnership LP, REIT, 3.1%, 12/15/2029 | | $ | 555,000 | | | $ | 544,957 | |
| | | | | | | | |
| Retailers – 0.2% | | | | | | | | |
| AA Bond Co. Ltd., 2.875%, 1/31/2022 | | GBP | 200,000 | | | $ | 262,854 | |
| AA Bond Co. Ltd., 2.75%, 7/31/2023 | | | 650,000 | | | | 822,364 | |
| | | | | | | | |
| | | | | | $ | 1,085,218 | |
| | | | | | | | |
| Supermarkets – 0.1% | | | | | | | | |
| Loblaw Cos. Ltd., 4.86%, 9/12/2023 | | CAD | 680,000 | | | $ | 563,265 | |
| | | | | | | | |
| | | | | | | | |
| | |
| Issuer | | Shares/Par | | | Value ($) | |
| BONDS – continued | | | | | | | | |
| Supranational – 0.2% | | | | | | | | |
| Banque Ouest Africaine de Developpement, 4.7%, 10/22/2031 | | $ | 375,000 | | | $ | 380,715 | |
| International Bank for Reconstruction and Development, 2.8%, 1/13/2021 | | AUD | 420,000 | | | | 299,672 | |
| International Bank for Reconstruction and Development, 4.25%, 6/24/2025 | | | 465,000 | | | | 373,265 | |
| | | | | | | | |
| | | | | | $ | 1,053,652 | |
| | | | | | | | |
| Telecommunications – Wireless – 1.0% | | | | | |
| American Tower Corp., REIT, 4.7%, 3/15/2022 | | $ | 327,000 | | | $ | 344,573 | |
| American Tower Corp., REIT, 3.5%, 1/31/2023 | | | 812,000 | | | | 841,348 | |
| Crown Castle International Corp., 2.25%, 9/01/2021 | | | 1,072,000 | | | | 1,074,831 | |
| Crown Castle International Corp., 3.7%, 6/15/2026 | | | 425,000 | | | | 448,844 | |
| Empresa Nacional de Telecomunicaciones S.A., 4.75%, 8/01/2026 (n) | | | 2,129,000 | | | | 2,251,580 | |
| Tele2 AB Co., 2.125%, 5/15/2028 | | EUR | 700,000 | | | | 850,494 | |
| | | | | | | | |
| | | | | | $ | 5,811,670 | |
| | | | | | | | |
| Tobacco – 0.2% | | | | | | | | |
| Altria Group, Inc., 1.7%, 6/15/2025 | | EUR | 230,000 | | | $ | 267,820 | |
| Imperial Brands Finance PLC, 1.375%, 1/27/2025 | | | 300,000 | | | | 345,026 | |
| Philip Morris International, Inc., 1.45%, 8/01/2039 | | | 500,000 | | | | 516,113 | |
| | | | | | | | |
| | | | | | $ | 1,128,959 | |
| | | | | | | | |
| Transportation – Services – 0.5% | | | | | |
| Adani Ports & Special Economic Zone Ltd., 4.375%, 7/03/2029 | | $ | 296,000 | | | $ | 306,421 | |
| ERAC USA Finance LLC, 7%, 10/15/2037 (n) | | | 574,000 | | | | 810,386 | |
| Heathrow Funding Ltd., 4.625%, 10/31/2046 | | GBP | 225,000 | | | | 421,375 | |
| Transurban Finance Co., 1.75%, 3/29/2028 | | EUR | 400,000 | | | | 480,221 | |
| Vinci S.A., 3.75%, 4/10/2029 (n) | | $ | 706,000 | | | | 769,555 | |
| | | | | | | | |
| | | | | | $ | 2,787,958 | |
| | | | | | | | |
| U.S. Government Agencies and Equivalents – 0.2% | |
| Small Business Administration, 5.31%, 5/01/2027 | | $ | 38,270 | | | $ | 40,794 | |
| Small Business Administration, 2.22%, 3/01/2033 | | | 1,061,729 | | | | 1,051,784 | |
| | | | | | | | |
| | | | | | $ | 1,092,578 | |
| | | | | | | | |
| U.S. Treasury Obligations – 7.2% | | | | | |
| U.S. Treasury Bonds, 3.5%, 2/15/2039 (f) | �� | $ | 8,185,000 | | | $ | 9,797,751 | |
| U.S. Treasury Bonds, 3.125%, 2/15/2043 | | | 7,216,000 | | | | 8,173,743 | |
14
MFS Global Tactical Allocation Portfolio
Portfolio of Investments – continued
| | | | | | | | |
| | |
| Issuer | | Shares/Par | | | Value ($) | |
| BONDS – continued | | | | | | | | |
| U.S. Treasury Obligations – continued | | | | | |
| U.S. Treasury Bonds, 2.25%, 8/15/2049 | | $ | 835,600 | | | $ | 809,618 | |
| U.S. Treasury Notes, 2%, 11/15/2026 (f) | | | 13,364,000 | | | | 13,502,940 | |
| U.S. Treasury Notes, 2.25%, 11/15/2027 (f) | | | 6,375,000 | | | | 6,547,819 | |
| U.S. Treasury Notes, 2.375%, 5/15/2029 | | | 4,400,000 | | | | 4,569,733 | |
| | | | | | | | |
| | | | | | $ | 43,401,604 | |
| | | | | | | | |
| Utilities – Electric Power – 1.6% | | | | | |
| Duke Energy Corp., 3.75%, 9/01/2046 | | $ | 665,000 | | | $ | 685,742 | |
| Emera U.S. Finance LP, 2.7%, 6/15/2021 | | | 376,000 | | | | 379,404 | |
| Emera U.S. Finance LP, 3.55%, 6/15/2026 | | | 430,000 | | | | 446,272 | |
| Enel Americas S.A., 4%, 10/25/2026 | | | 1,891,000 | | | | 1,957,204 | |
| Enel Finance International N.V., 0.375%, 6/17/2027 | | EUR | 150,000 | | | | 166,509 | |
| Enel Finance International N.V., 3.5%, 4/06/2028 (n) | | $ | 414,000 | | | | 423,284 | |
| Enel Finance International N.V., 4.75%, 5/25/2047 (n) | | | 343,000 | | | | 385,156 | |
| Engie Energia Chile S.A., 4.5%, 1/29/2025 (n) | | | 1,180,000 | | | | 1,250,640 | |
| Evergy, Inc., 2.9%, 9/15/2029 | | | 740,000 | | | | 735,422 | |
| Exelon Corp., 3.497%, 6/01/2022 | | | 406,000 | | | | 416,788 | |
| innogy Finance B.V., 4.75%, 1/31/2034 | | GBP | 300,000 | | | | 504,903 | |
| PPL Capital Funding, Inc., 5%, 3/15/2044 | | $ | 473,000 | | | | 543,203 | |
| Virginia Electric & Power Co., 3.5%, 3/15/2027 | | | 1,200,000 | | | | 1,282,240 | |
| Virginia Electric & Power Co., 2.875%, 7/15/2029 | | | 287,000 | | | | 293,678 | |
| | | | | | | | |
| | | | | | $ | 9,470,445 | |
| | | | | | | | |
| Utilities – Other – 0.0% | | | | | | | | |
Suez S.A., 1.625% to 9/12/2026, FLR (EUR ICE Swap Rate - 5yr. + 2.151%) to 9/12/2031, FLR (EUR ICE Swap Rate - 5yr. +
3.151%) to 9/12/2059 | | EUR | 200,000 | | | $ | 223,779 | |
| | | | | | | | |
Total Bonds
(Identified Cost, $339,520,396) | | | $ | 349,064,789 | |
| | | | | | | | |
| |
| COMMON STOCKS – 35.2% | | | | | |
| Aerospace – 1.2% | | | | | | | | |
| Honeywell International, Inc. | | | 14,857 | | | $ | 2,629,689 | |
| Lockheed Martin Corp. | | | 6,726 | | | | 2,618,970 | |
| Northrop Grumman Corp. | | | 2,068 | | | | 711,330 | |
| United Technologies Corp. | | | 7,206 | | | | 1,079,170 | |
| | | | | | | | |
| | | | | | $ | 7,039,159 | |
| | | | | | | | |
| | | | | | | | |
| | |
| Issuer | | Shares/Par | | | Value ($) | |
| COMMON STOCKS – continued | | | | | |
| Airlines – 0.2% | | | | | | | | |
| Air Canada (a) | | | 29,061 | | | $ | 1,085,633 | |
| | | | | | | | |
| Alcoholic Beverages – 0.8% | | | | | | | | |
| Diageo PLC | | | 31,187 | | | $ | 1,322,136 | |
| Heineken N.V. | | | 15,980 | | | | 1,701,419 | |
| Pernod Ricard S.A. | | | 9,205 | | | | 1,645,844 | |
| | | | | | | | |
| | | | | | $ | 4,669,399 | |
| | | | | | | | |
| Apparel Manufacturers – 0.2% | | | | | | | | |
| Compagnie Financiere Richemont S.A. | | | 12,936 | | | $ | 1,016,648 | |
| | | | | | | | |
| Automotive – 0.6% | | | | | | | | |
| Aptiv PLC | | | 9,595 | | | $ | 911,237 | |
| Copart, Inc. (a) | | | 2,191 | | | | 199,249 | |
| Lear Corp. | | | 3,966 | | | | 544,135 | |
| Magna International, Inc. | | | 30,464 | | | | 1,670,353 | |
| USS Co. Ltd. | | | 28,000 | | | | 528,751 | |
| | | | | | | | |
| | | | | | $ | 3,853,725 | |
| | | | | | | | |
| Biotechnology – 0.1% | | | | | | | | |
| Biogen, Inc. (a) | | | 1,424 | | | $ | 422,544 | |
| | | | | | | | |
| Broadcasting – 0.0% | | | | | | | | |
| Omnicom Group, Inc. | | | 3,106 | | | $ | 251,648 | |
| | | | | | | | |
| Brokerage & Asset Managers – 0.6% | | | | | |
| BlackRock, Inc. | | | 2,710 | | | $ | 1,362,317 | |
| Charles Schwab Corp. | | | 28,328 | | | | 1,347,280 | |
| Invesco Ltd. | | | 19,358 | | | | 348,057 | |
| TMX Group Ltd. | | | 5,975 | | | | 517,414 | |
| | | | | | | | |
| | | | | | $ | 3,575,068 | |
| | | | | | | | |
| Business Services – 2.6% | | | | | | | | |
| Accenture PLC, “A” | | | 15,392 | | | $ | 3,241,093 | |
| Bunzl PLC | | | 21,803 | | | | 596,377 | |
| CGI, Inc. (a) | | | 8,578 | | | | 717,856 | |
| Cognizant Technology Solutions Corp., “A” | | | 12,129 | | | | 752,241 | |
| Compass Group PLC | | | 80,723 | | | | 2,020,895 | |
| Equifax, Inc. | | | 7,246 | | | | 1,015,310 | |
| Experian PLC | | | 33,098 | | | | 1,118,838 | |
| Fidelity National Information Services, Inc. | | | 7,193 | | | | 1,000,474 | |
| Fiserv, Inc. (a) | | | 12,261 | | | | 1,417,739 | |
| Nomura Research Institute Ltd. | | | 53,800 | | | | 1,157,649 | |
| Secom Co. Ltd. | | | 18,200 | | | | 1,624,187 | |
| SGS S.A. | | | 161 | | | | 441,012 | |
| Thomson Reuters Corp. | | | 5,929 | | | | 424,516 | |
| | | | | | | | |
| | | | | | $ | 15,528,187 | |
| | | | | | | | |
| Cable TV – 0.5% | | | | | | | | |
| Comcast Corp., “A” (s) | | | 70,081 | | | $ | 3,151,543 | |
| | | | | | | | |
| Chemicals – 0.8% | | | | | | | | |
| 3M Co. | | | 10,910 | | | $ | 1,924,742 | |
| Givaudan S.A. | | | 257 | | | | 804,884 | |
| PPG Industries, Inc. | | | 16,726 | | | | 2,232,754 | |
| | | | | | | | |
| | | | | | $ | 4,962,380 | |
| | | | | | | | |
15
MFS Global Tactical Allocation Portfolio
Portfolio of Investments – continued
| | | | | | | | |
| | |
| Issuer | | Shares/Par | | | Value ($) | |
| COMMON STOCKS – continued | |
| Computer Software – 0.2% | | | | | | | | |
| Adobe Systems, Inc. (a) | | | 2,025 | | | $ | 667,865 | |
| Microsoft Corp. | | | 2,178 | | | | 343,471 | |
| | | | | | | | |
| | | | | | $ | 1,011,336 | |
| | | | | | | | |
| Computer Software – Systems – 0.7% | | | | | |
| Amadeus IT Group S.A. | | | 19,095 | | | $ | 1,559,293 | |
| Hitachi Ltd. | | | 42,800 | | | | 1,802,823 | |
| Hon Hai Precision Industry Co. Ltd. | | | 191,000 | | | | 578,537 | |
| | | | | | | | |
| | | | | | $ | 3,940,653 | |
| | | | | | | | |
| Construction – 0.5% | | | | | | | | |
| Sherwin-Williams Co. | | | 2,763 | | | $ | 1,612,321 | |
| Stanley Black & Decker, Inc. | | | 8,457 | | | | 1,401,663 | |
| | | | | | | | |
| | | | | | $ | 3,013,984 | |
| | | | | | | | |
| Consumer Products – 0.9% | | | | | | | | |
| Colgate-Palmolive Co. | | | 9,976 | | | $ | 686,748 | |
| Kao Corp. | | | 14,700 | | | | 1,212,426 | |
| Kimberly-Clark Corp. | | | 14,399 | | | | 1,980,582 | |
| Reckitt Benckiser Group PLC | | | 17,088 | | | | 1,387,285 | |
| | | | | | | | |
| | | | | | $ | 5,267,041 | |
| | | | | | | | |
| Containers – 0.2% | | | | | | | | |
| Amcor PLC | | | 93,821 | | | $ | 1,025,111 | |
| Amcor PLC | | | 42,544 | | | | 461,177 | |
| | | | | | | | |
| | | | | | $ | 1,486,288 | |
| | | | | | | | |
| Electrical Equipment – 1.3% | | | | | | | | |
| Johnson Controls International PLC | | | 29,694 | | | $ | 1,208,843 | |
| Legrand S.A. | | | 11,999 | | | | 977,682 | |
| OMRON Corp. | | | 6,900 | | | | 401,971 | |
| Schneider Electric SE | | | 43,531 | | | | 4,467,828 | |
| Spectris PLC | | | 13,042 | | | | 502,024 | |
| Yokogawa Electric Corp. | | | 22,600 | | | | 400,282 | |
| | | | | | | | |
| | | | | | $ | 7,958,630 | |
| | | | | | | | |
| Electronics – 2.4% | | | | | | | | |
| Analog Devices, Inc. | | | 11,132 | | | $ | 1,322,927 | |
| Hoya Corp. | | | 10,300 | | | | 983,445 | |
| Kyocera Corp. | | | 16,700 | | | | 1,138,047 | |
| NXP Semiconductors N.V. | | | 6,118 | | | | 778,577 | |
| Samsung Electronics Co. Ltd. | | | 27,320 | | | | 1,316,396 | |
| Taiwan Semiconductor Manufacturing Co. Ltd., ADR | | | 101,381 | | | | 5,890,236 | |
| Texas Instruments, Inc. | | | 21,278 | | | | 2,729,755 | |
| | | | | | | | |
| | | | | | $ | 14,159,383 | |
| | | | | | | | |
| Energy – Independent – 0.1% | | | | | | | | |
| Marathon Petroleum Corp. | | | 3,665 | | | $ | 220,816 | |
| Valero Energy Corp. | | | 3,664 | | | | 343,134 | |
| | | | | | | | |
| | | | | | $ | 563,950 | |
| | | | | | | | |
| Energy – Integrated – 1.2% | | | | | | | | |
| BP PLC | | | 81,782 | | | $ | 510,877 | |
| Chevron Corp. | | | 6,143 | | | | 740,293 | |
| China Petroleum & Chemical Corp. | | | 1,946,000 | | | | 1,171,251 | |
| Eni S.p.A. | | | 69,591 | | | | 1,080,822 | |
| | | | | | | | |
| | |
| Issuer | | Shares/Par | | | Value ($) | |
| COMMON STOCKS – continued | |
| Energy – Integrated – continued | | | | | | | | |
| Exxon Mobil Corp. | | | 20,713 | | | $ | 1,445,353 | |
| Galp Energia SGPS S.A., “B” | | | 40,254 | | | | 672,778 | |
| LUKOIL PJSC, ADR | | | 5,381 | | | | 533,688 | |
| Suncor Energy, Inc. | | | 34,883 | | | | 1,143,291 | |
| | | | | | | | |
| | | | | | $ | 7,298,353 | |
| | | | | | | | |
| Food & Beverages – 1.4% | | | | | | | | |
| Danone S.A. | | | 16,779 | | | $ | 1,390,872 | |
| General Mills, Inc. | | | 28,947 | | | | 1,550,401 | |
| J.M. Smucker Co. | | | 9,480 | | | | 987,153 | |
| Nestle S.A. | | | 35,511 | | | | 3,844,640 | |
| PepsiCo, Inc. | | | 2,924 | | | | 399,623 | |
| | | | | | | | |
| | | | | | $ | 8,172,689 | |
| | | | | | | | |
| Food & Drug Stores – 0.0% | | | | | | | | |
| Wesfarmers Ltd. | | | 9,679 | | | $ | 281,199 | |
| | | | | | | | |
| Gaming & Lodging – 0.1% | | | | | | | | |
| Marriott International, Inc., “A” | | | 3,222 | | | $ | 487,908 | |
| | | | | | | | |
| Health Maintenance Organizations – 0.3% | | | | | |
| Cigna Corp. | | | 9,047 | | | $ | 1,850,021 | |
| | | | | | | | |
| Insurance – 2.1% | | | | | | | | |
| Aon PLC | | | 16,478 | | | $ | 3,432,203 | |
| BB Seguridade Participacoes S.A. | | | 12,600 | | | | 118,085 | |
| Chubb Ltd. | | | 12,358 | | | | 1,923,646 | |
| Manulife Financial Corp. | | | 27,282 | | | | 553,813 | |
| Marsh & McLennan Cos., Inc. | | | 8,939 | | | | 995,894 | |
| MetLife, Inc. | | | 17,925 | | | | 913,637 | |
| Prudential Financial, Inc. | | | 4,561 | | | | 427,548 | |
| Samsung Fire & Marine Insurance Co. Ltd. (a) | | | 1,393 | | | | 293,308 | |
| Travelers Cos., Inc. | | | 13,031 | | | | 1,784,595 | |
| Zurich Insurance Group AG | | | 4,697 | | | | 1,927,236 | |
| | | | | | | | |
| | | | | | $ | 12,369,965 | |
| | | | | | | | |
| Machinery & Tools – 1.1% | | | | | | | | |
| AGCO Corp. | | | 3,678 | | | $ | 284,126 | |
| Eaton Corp. PLC | | | 30,380 | | | | 2,877,594 | |
| Illinois Tool Works, Inc. | | | 10,127 | | | | 1,819,113 | |
| Kubota Corp. | | | 80,200 | | | | 1,256,400 | |
| PT United Tractors Tbk | | | 124,200 | | | | 191,761 | |
| | | | | | | | |
| | | | | | $ | 6,428,994 | |
| | | | | | | | |
| Major Banks – 2.2% | | | | | | | | |
| ABSA Group Ltd. | | | 70,841 | | | $ | 755,145 | |
| Bank of New York Mellon Corp. | | | 23,463 | | | | 1,180,893 | |
| China Construction Bank | | | 1,445,000 | | | | 1,248,008 | |
| Goldman Sachs Group, Inc. | | | 5,474 | | | | 1,258,637 | |
| JPMorgan Chase & Co. (s) | | | 26,703 | | | | 3,722,398 | |
| PNC Financial Services Group, Inc. | | | 5,620 | | | | 897,121 | |
| Royal Bank of Canada | | | 7,352 | | | | 582,278 | |
| State Street Corp. | | | 11,463 | | | | 906,723 | |
| UBS Group AG | | | 121,742 | | | | 1,537,814 | |
| Wells Fargo & Co. | | | 20,673 | | | | 1,112,207 | |
| | | | | | | | |
| | | | | | $ | 13,201,224 | |
| | | | | | | | |
16
MFS Global Tactical Allocation Portfolio
Portfolio of Investments – continued
| | | | | | | | |
| | |
| Issuer | | Shares/Par | | | Value ($) | |
| COMMON STOCKS – continued | | | | | |
| Medical & Health Technology & Services – 0.4% | | | | | |
| HCA Healthcare, Inc. | | | 10,684 | | | $ | 1,579,202 | |
| McKesson Corp. | | | 3,267 | | | | 451,891 | |
| Sonic Healthcare Ltd. | | | 29,516 | | | | 595,495 | |
| | | | | | | | |
| | | | | | $ | 2,626,588 | |
| | | | | | | | |
| Medical Equipment – 1.3% | | | | | | | | |
| Abbott Laboratories | | | 14,728 | | | $ | 1,279,274 | |
| Becton, Dickinson and Co. | | | 3,232 | | | | 879,007 | |
| Danaher Corp. | | | 10,318 | | | | 1,583,607 | |
| EssilorLuxottica | | | 2,926 | | | | 445,708 | |
| Medtronic PLC | | | 21,734 | | | | 2,465,722 | |
| Thermo Fisher Scientific, Inc. | | | 2,810 | | | | 912,885 | |
| | | | | | | | |
| | | | | | $ | 7,566,203 | |
| | | | | | | | |
| Metals & Mining – 0.1% | | | | | | | | |
| MMC Norilsk Nickel PJSC, ADR | | | 5,100 | | | $ | 155,805 | |
| POSCO | | | 958 | | | | 195,184 | |
| Rio Tinto PLC | | | 9,291 | | | | 554,178 | |
| | | | | | | | |
| | | | | | $ | 905,167 | |
| | | | | | | | |
| Natural Gas – Pipeline – 0.2% | | | | | | | | |
| Enterprise Products Partners LP | | | 24,642 | | | $ | 693,919 | |
| EQM Midstream Partners LP | | | 14,609 | | | | 436,955 | |
| | | | | | | | |
| | | | | | $ | 1,130,874 | |
| | | | | | | | |
| Other Banks & Diversified Financials – 1.4% | | | | | |
| Citigroup, Inc. | | | 34,029 | | | $ | 2,718,577 | |
| DBS Group Holdings Ltd. | | | 62,300 | | | | 1,198,799 | |
| KBC Group N.V. | | | 9,885 | | | | 743,562 | |
| Komercni Banka A.S. | | | 2,361 | | | | 86,389 | |
| Sberbank of Russia PJSC, ADR | | | 22,268 | | | | 366,086 | |
| Truist Financial Corp. | | | 32,857 | | | | 1,850,506 | |
| U.S. Bancorp | | | 28,605 | | | | 1,695,990 | |
| | | | | | | | |
| | | | | | $ | 8,659,909 | |
| | | | | | | | |
| Pharmaceuticals – 3.7% | | | | | | | | |
| AbbVie, Inc. | | | 4,966 | | | $ | 439,690 | |
| Bayer AG | | | 33,632 | | | | 2,746,758 | |
| Bristol-Myers Squibb Co. | | | 16,439 | | | | 1,055,219 | |
| Eli Lilly & Co. | | | 12,000 | | | | 1,577,160 | |
| Johnson & Johnson | | | 25,193 | | | | 3,674,903 | |
| Novartis AG | | | 23,609 | | | | 2,241,855 | |
| Novo Nordisk A.S., “B” | | | 21,083 | | | | 1,223,645 | |
| Pfizer, Inc. | | | 72,864 | | | | 2,854,812 | |
| Roche Holding AG | | | 16,344 | | | | 5,302,765 | |
| Santen Pharmaceutical Co. Ltd. | | | 53,500 | | | | 1,020,081 | |
| | | | | | | | |
| | | | | | $ | 22,136,888 | |
| | | | | | | | |
| Printing & Publishing – 0.5% | | | | | | | | |
| Moody’s Corp. | | | 4,517 | | | $ | 1,072,381 | |
| RELX PLC | | | 41,771 | | | | 1,052,353 | |
| Wolters Kluwer N.V. | | | 14,082 | | | | 1,027,041 | |
| | | | | | | | |
| | | | | | $ | 3,151,775 | |
| | | | | | | | |
| Railroad & Shipping – 0.4% | | | | | | | | |
| Canadian National Railway Co. | | | 4,476 | | | $ | 404,854 | |
| Canadian Pacific Railway Ltd. | | | 1,792 | | | | 456,822 | |
| | | | | | | | |
| | |
| Issuer | | Shares/Par | | | Value ($) | |
| COMMON STOCKS – continued | | | | | |
| Railroad & Shipping – continued | | | | | | | | |
| Union Pacific Corp. | | | 7,904 | | | $ | 1,428,964 | |
| | | | | | | | |
| | | | | | $ | 2,290,640 | |
| | | | | | | | |
| Real Estate – 0.8% | | | | | | | | |
| Daito Trust Construction Co. Ltd. | | | 2,300 | | | $ | 284,857 | |
| Daiwa House Industry Co. Ltd. | | | 15,700 | | | | 486,410 | |
| Deutsche Wohnen SE | | | 32,148 | | | | 1,313,320 | |
| Grand City Properties S.A. | | | 16,232 | | | | 389,275 | |
| Longfor Properties Co. Ltd. | | | 52,000 | | | | 243,574 | |
| Medical Properties Trust, Inc., REIT | | | 13,349 | | | | 281,797 | |
| Public Storage, Inc., REIT | | | 1,362 | | | | 290,051 | |
| STORE Capital Corp., REIT | | | 13,461 | | | | 501,288 | |
| Unibail-Rodamco-Westfield, REIT | | | 4,560 | | | | 719,418 | |
| | | | | | | | |
| | | | | | $ | 4,509,990 | |
| | | | | | | | |
| Restaurants – 0.3% | | | | | | | | |
| Greggs PLC | | | 18,785 | | | $ | 571,802 | |
| Starbucks Corp. | | | 13,301 | | | | 1,169,424 | |
| U.S. Foods Holding Corp. (a) | | | 6,404 | | | | 268,264 | |
| | | | | | | | |
| | | | | | $ | 2,009,490 | |
| | | | | | | | |
| Specialty Chemicals – 0.5% | | | | | | | | |
| Akzo Nobel N.V. | | | 15,159 | | | $ | 1,541,229 | |
| Corteva, Inc. | | | 3,410 | | | | 100,799 | |
| DuPont de Nemours, Inc. | | | 3,410 | | | | 218,922 | |
| PTT Global Chemical PLC | | | 549,400 | | | | 1,045,472 | |
| | | | | | | | |
| | | | | | $ | 2,906,422 | |
| | | | | | | | |
| Specialty Stores – 0.4% | | | | | | | | |
| Dufry AG | | | 3,773 | | | $ | 374,337 | |
| Target Corp. | | | 16,887 | | | | 2,165,082 | |
| | | | | | | | |
| | | | | | $ | 2,539,419 | |
| | | | | | | | |
| Telecommunications – Wireless – 1.0% | | | | | |
| Advanced Info Service Public Co. Ltd. | | | 46,400 | | | $ | 329,949 | |
| KDDI Corp. | | | 146,500 | | | | 4,358,345 | |
| Vodafone Group PLC | | | 651,313 | | | | 1,266,141 | |
| | | | | | | | |
| | | | | | $ | 5,954,435 | |
| | | | | | | | |
| Telephone Services – 0.3% | | | | | | | | |
| Hellenic Telecommunications Organization S.A. | | | 6,955 | | | $ | 111,248 | |
| Koninklijke KPN N.V. | | | 100,514 | | | | 296,636 | |
| TELUS Corp. | | | 17,945 | | | | 694,832 | |
| TELUS Corp. | | | 6,315 | | | | 244,580 | |
| Verizon Communications, Inc. | | | 8,679 | | | | 532,891 | |
| | | | | | | | |
| | | | | | $ | 1,880,187 | |
| | | | | | | | |
| Tobacco – 0.8% | | | | | | | | |
| Imperial Tobacco Group PLC | | | 18,874 | | | $ | 467,259 | |
| Japan Tobacco, Inc. | | | 71,400 | | | | 1,591,728 | |
| Philip Morris International, Inc. (s) | | | 34,444 | | | | 2,930,840 | |
| | | | | | | | |
| | | | | | $ | 4,989,827 | |
| | | | | | | | |
| Utilities – Electric Power – 0.8% | | | | | | | | |
| Duke Energy Corp. | | | 16,634 | | | $ | 1,517,187 | |
| Exelon Corp. | | | 36,522 | | | | 1,665,038 | |
17
MFS Global Tactical Allocation Portfolio
Portfolio of Investments – continued
| | | | | | | | |
| | |
| Issuer | | Shares/Par | | | Value ($) | |
| COMMON STOCKS – continued | | | | | |
| Utilities – Electric Power – continued | | | | | |
| Iberdrola S.A. | | | 66,457 | | | $ | 684,321 | |
| Xcel Energy, Inc. | | | 11,601 | | | | 736,548 | |
| | | | | | | | |
| | | | | | $ | 4,603,094 | |
| | | | | | | | |
| Total Common Stocks (Identified Cost, $129,939,549) | | | | | | $ | 210,908,460 | |
| | | | | | | | |
| | |
| PREFERRED STOCKS – 0.4% | | | | | | | | |
| Consumer Products – 0.3% | | | | | | | | |
| Henkel AG & Co. KGaA | | | 15,477 | | | $ | 1,600,643 | |
| | | | | | | | |
| Electronics – 0.1% | | | | | | | | |
| Samsung Electronics Co. Ltd. | | | 13,017 | | | $ | 507,849 | |
| | | | | | | | |
| Total Preferred Stocks (Identified Cost, $1,201,167) | | | | | | $ | 2,108,492 | |
| | | | | | | | |
|
| CONVERTIBLE PREFERRED STOCKS – 0.1% | |
| Medical Equipment – 0.0% | | | | | | | | |
| Danaher Corp., 4.75% | | | 101 | | | $ | 119,083 | |
| | | | | | | | |
| Utilities – Electric Power – 0.1% | | | | | | | | |
| CenterPoint Energy, Inc., 7% | | | 7,938 | | | $ | 386,898 | |
| | | | | | | | |
Total Convertible Preferred Stocks
(Identified Cost, $510,174) | | | $ | 505,981 | |
| | | | | | | | |
| | | | | | | | |
| | |
| Issuer | | Shares/Par | | | Value ($) | |
| INVESTMENT COMPANIES (h) – 5.2% | | | | | |
| Money Market Funds – 5.2% | | | | | | | | |
MFS Institutional Money Market Portfolio, 1.7% (v)
(Identified Cost, $31,339,478) | | | 31,339,464 | | | $ | 31,339,464 | |
| | | | | | | | |
| | | | | | | | | | | | | | | | | | |
| | | | | |
Underlying/ Expiration
Date/Exercise
Price | | Put/
Call | | | Counter- party | | Notional
Amount | | | Par
Amount/
Number of
Contracts | | | | |
| PURCHASED OPTIONS – 0.0% | | | | | | | | | |
| Market Index Securities – 0.0% | | | | | | | | | |
| Russell 2000 Index – March 2020 @ $1,280 (Premiums Paid, $226,023) | | | Put | | | Goldman
Sachs
International | | $ | 23,358,560 | | | | 140 | | | $ | 30,100 | |
| | | | | | | | | | | | | | | | | | |
OTHER ASSETS, LESS
LIABILITIES – 0.8% | | | | | | | | 4,916,195 | |
| | | | | | | | | | | | | | | | | | |
| NET ASSETS – 100.0% | | | | | | | | | | $ | 598,873,481 | |
| | | | | | | | | | | | | | | | | | |
| (a) | | Non-income producing security. |
| (f) | | All or a portion of the security has been segregated as collateral for open futures contracts and cleared swap agreements. |
| (h) | | An affiliated issuer, which may be considered one in which the fund owns 5% or more of the outstanding voting securities, or a company which is under common control. At period end, the aggregate values of the fund’s investments in affiliated issuers and in unaffiliated issuers were $31,339,464 and $562,617,822, respectively. |
| (n) | | Securities exempt from registration under Rule 144A of the Securities Act of 1933. These securities may be sold in the ordinary course of business in transactions exempt from registration, normally to qualified institutional buyers. At period end, the aggregate value of these securities was $29,553,026, representing 4.9% of net assets. |
| (s) | | Security or a portion of the security was pledged to cover collateral requirements for certain derivative transactions. |
| (v) | | Affiliated issuer that is available only to investment companies managed by MFS. The rate quoted for the MFS Institutional Money Market Portfolio is the annualizedseven-day yield of the fund at period end. |
The following abbreviations are used in this report and are defined:
| ADR | | American Depositary Receipt |
| AGM | | Assured Guaranty Municipal |
| CLO | | Collateralized Loan Obligation |
| EURIBOR | | Euro Interbank Offered Rate |
| FLR | | Floating Rate. Interest rate resets periodically based on the parenthetically disclosed reference rate plus a spread (if any). Theperiod-end rate reported may not be the current rate. All reference rates are USD unless otherwise noted. |
| ICE | | Intercontinental Exchange |
| LIBOR | | London Interbank Offered Rate |
| NATL | | National Public Finance Guarantee Corp. |
| REIT | | Real Estate Investment Trust |
Abbreviations indicate amounts shown in currencies other than the U.S. dollar. All amounts are stated in U.S. dollars unless otherwise indicated. A list of abbreviations is shown below:
| CNH | | Chinese Yuan Renminbi (Offshore) |
18
MFS Global Tactical Allocation Portfolio
Portfolio of Investments – continued
Derivative Contracts at 12/31/19
Forward Foreign Currency Exchange Contracts
| | | | | | | | | | | | | | | | | | | | |
| Currency Purchased | | Currency Sold | | Counterparty | | Settlement Date | | | Unrealized
Appreciation
(Depreciation) | |
| Asset Derivatives | | | | | | | | | | | | |
| AUD | | | 13,782,548 | | | | | USD | | 9,475,984 | | JPMorgan Chase Bank N.A. | | | 2/12/2020 | | | | $205,593 | |
| CAD | | | 6,296,046 | | | | | USD | | 4,802,241 | | Deutsche Bank AG | | | 2/28/2020 | | | | 47,330 | |
| CAD | | | 21,162,794 | | | | | USD | | 16,005,259 | | JPMorgan Chase Bank N.A. | | | 2/12/2020 | | | | 294,949 | |
| CAD | | | 3,887,915 | | | | | USD | | 2,974,472 | | UBS AG | | | 2/28/2020 | | | | 20,221 | |
| CHF | | | 1,920,000 | | | | | USD | | 1,962,203 | | Deutsche Bank AG | | | 2/28/2020 | | | | 29,099 | |
| CHF | | | 2,744,373 | | | | | USD | | 2,782,000 | | JPMorgan Chase Bank N.A. | | | 2/12/2020 | | | | 61,102 | |
| CLP | | | 159,492,000 | | | | | USD | | 209,568 | | Barclays Bank PLC | | | 1/21/2020 | | | | 2,592 | |
| CLP | | | 1,480,125,000 | | | | | USD | | 1,900,032 | | Citibank N.A. | | | 1/10/2020 | | | | 68,625 | |
| CNH | | | 14,904,000 | | | | | USD | | 2,100,190 | | Barclays Bank PLC | | | 1/15/2020 | | | | 40,401 | |
| CNH | | | 10,391,000 | | | | | USD | | 1,482,019 | | HSBC Bank | | | 3/19/2020 | | | | 8,092 | |
| CNH | | | 48,562,000 | | | | | USD | | 6,850,084 | | JPMorgan Chase Bank N.A. | | | 1/15/2020 | | | | 124,647 | |
| CZK | | | 9,851,000 | | | | | USD | | 429,584 | | Morgan Stanley Capital Services, Inc. | | | 2/28/2020 | | | | 5,013 | |
| DKK | | | 6,419,079 | | | | | USD | | 958,782 | | Merrill Lynch International | | | 2/28/2020 | | | | 8,499 | |
| EUR | | | 606,581 | | | | | USD | | 676,165 | | BNP Paribas S.A. | | | 2/28/2020 | | | | 6,614 | |
| EUR | | | 184,922 | | | | | USD | | 206,165 | | Citibank N.A. | | | 2/28/2020 | | | | 1,988 | |
| EUR | | | 408,961 | | | | | USD | | 458,267 | | Deutsche Bank AG | | | 2/28/2020 | | | | 2,066 | |
| EUR | | | 2,860,508 | | | | | USD | | 3,186,000 | | JPMorgan Chase Bank N.A. | | | 2/12/2020 | | | | 30,620 | |
| EUR | | | 100,082 | | | | | USD | | 111,321 | | Merrill Lynch International | | | 2/28/2020 | | | | 1,332 | |
| EUR | | | 408,171 | | | | | USD | | 453,843 | | UBS AG | | | 2/28/2020 | | | | 5,602 | |
| GBP | | | 7,183,889 | | | | | USD | | 9,233,093 | | JPMorgan Chase Bank N.A. | | | 2/12/2020 | | | | 293,434 | |
| GBP | | | 140,000 | | | | | USD | | 185,268 | | UBS AG | | | 2/28/2020 | | | | 464 | |
| IDR | | | 61,342,734,000 | | | | | USD | | 4,372,566 | | JPMorgan Chase Bank N.A. | | | 1/17/2020 | | | | 40,613 | |
| ILS | | | 1,799,000 | | | | | USD | | 519,337 | | Merrill Lynch International | | | 2/28/2020 | | | | 3,120 | |
| JPY | | | 1,635,507,918 | | | | | USD | | 15,070,000 | | JPMorgan Chase Bank N.A. | | | 2/12/2020 | | | | 11,993 | |
| JPY | | | 70,106,061 | | | | | USD | | 644,486 | | State Street Bank Corp. | | | 2/28/2020 | | | | 2,572 | |
| KRW | | | 5,100,538,000 | | | | | USD | | 4,346,914 | | Barclays Bank PLC | | | 1/31/2020 | | | | 66,371 | |
| MXN | | | 59,608,560 | | | | | USD | | 3,074,746 | | JPMorgan Chase Bank N.A. | | | 2/28/2020 | | | | 51,717 | |
| NOK | | | 276,997,179 | | | | | USD | | 30,277,720 | | Goldman Sachs International | | | 2/12/2020 | | | | 1,278,589 | |
| NZD | | | 6,427,516 | | | | | USD | | 4,217,093 | | Citibank N.A. | | | 2/28/2020 | | | | 113,252 | |
| NZD | | | 17,724,633 | | | | | USD | | 11,544,000 | | Goldman Sachs International | | | 2/12/2020 | | | | 394,600 | |
| PLN | | | 3,554,931 | | | | | USD | | 920,774 | | HSBC Bank | | | 2/28/2020 | | | | 16,378 | |
| RUB | | | 42,540,000 | | | | | USD | | 657,085 | | JPMorgan Chase Bank N.A. | | | 1/27/2020 | | | | 26,821 | |
19
MFS Global Tactical Allocation Portfolio
Portfolio of Investments – continued
Forward Foreign Currency Exchange Contracts - continued
| | | | | | | | | | | | | | | | | | | | | | |
| Currency Purchased | | | Currency Sold | | Counterparty | | Settlement Date | | | Unrealized
Appreciation
(Depreciation) | |
| Asset Derivatives – continued | | | | | | | | |
| SEK | | | 15,023,573 | | | | | | | USD | | 1,588,762 | | Deutsche Bank AG | | | 2/28/2020 | | | | $19,558 | |
| SEK | | | 178,105,915 | | | | | | | USD | | 18,590,264 | | Goldman Sachs International | | | 2/12/2020 | | | | 462,009 | |
| SGD | | | 1,038,000 | | | | | | | USD | | 766,160 | | Citibank N.A. | | | 2/28/2020 | | | | 5,978 | |
| THB | | | 44,427,650 | | | | | | | USD | | 1,473,603 | | JPMorgan Chase Bank N.A. | | | 3/16/2020 | | | | 21,861 | |
| USD | | | 1,913,296 | | | | | | | INR | | 136,925,000 | | Goldman Sachs International | | | 1/30/2020 | | | | 218 | |
| | | | | | | | | | | | | | | | | | | | | | |
| | | | | | | | | | | | | | | | | | | | | $3,773,933 | |
| | | | | | | | | | | | | | | | | | | | | | |
| Liability Derivatives | | | | | | | | | | | | | | | | | | | |
| CLP | | | 680,477,000 | | | | | | | USD | | 907,000 | | Citibank N.A. | | | 1/21/2020 | | | | $(1,814 | ) |
| INR | | | 136,926,000 | | | | | | | USD | | 1,917,463 | | JPMorgan Chase Bank N.A. | | | 1/30/2020 | | | | (4,371 | ) |
| JPY | | | 2,878,838,161 | | | | | | | USD | | 26,620,169 | | Deutsche Bank AG | | | 2/28/2020 | | | | (49,361 | ) |
| NOK | | | 1,283,000 | | | | | | | USD | | 146,314 | | Goldman Sachs International | | | 2/28/2020 | | | | (146 | ) |
| SGD | | | 1,254,000 | | | | | | | USD | | 933,064 | | Citibank N.A. | | | 2/28/2020 | | | | (250 | ) |
| USD | | | 750,559 | | | | | | | AUD | | 1,094,000 | | HSBC Bank | | | 2/28/2020 | | | | (18,219 | ) |
| USD | | | 19,310,000 | | | | | | | AUD | | 28,273,570 | | JPMorgan Chase Bank N.A. | | | 2/12/2020 | | | | (550,824 | ) |
| USD | | | 3,399,766 | | | | | | | AUD | | 4,972,490 | | Merrill Lynch International | | | 2/28/2020 | | | | (94,514 | ) |
| USD | | | 4,242,000 | | | | | | | CAD | | 5,638,560 | | JPMorgan Chase Bank N.A. | | | 2/12/2020 | | | | (100,985 | ) |
| USD | | | 7,611,437 | | | | | | | CAD | | 10,069,855 | | JPMorgan Chase Bank N.A. | | | 2/28/2020 | | | | (144,936 | ) |
| USD | | | 32,525,729 | | | | | | | CHF | | 32,187,136 | | JPMorgan Chase Bank N.A. | | | 2/12/2020 | | | | (819,332 | ) |
| USD | | | 740,587 | | | | | | | DKK | | 4,986,301 | | JPMorgan Chase Bank N.A. | | | 2/12/2020 | | | | (9,948 | ) |
| USD | | | 455,982 | | | | | | | EUR | | 407,056 | | Deutsche Bank AG | | | 2/28/2020 | | | | (2,208 | ) |
| USD | | | 63,911,627 | | | | | | | EUR | | 57,597,553 | | Goldman Sachs International | | | 2/12/2020 | | | | (856,376 | ) |
| USD | | | 37,450,563 | | | | | | | EUR | | 33,753,842 | | JPMorgan Chase Bank N.A. | | | 2/12/2020 | | | | (505,372 | ) |
| USD | | | 751,214 | | | | | | | EUR | | 675,000 | | Merrill Lynch International | | | 2/28/2020 | | | | (8,579 | ) |
| USD | | | 373,372 | | | | | | | GBP | | 283,000 | | HSBC Bank | | | 2/28/2020 | | | | (2,072 | ) |
| USD | | | 23,397,000 | | | | | | | GBP | | 18,054,021 | | JPMorgan Chase Bank N.A. | | | 2/12/2020 | | | | (544,368 | ) |
| USD | | | 5,914,080 | | | | | | | GBP | | 4,472,013 | | Merrill Lynch International | | | 2/28/2020 | | | | (18,756 | ) |
| USD | | | 3,348,520 | | | | | | | IDR | | 47,592,511,000 | | Barclays Bank PLC | | | 1/31/2020 | | | | (71,050 | ) |
| USD | | | 380,094 | | | | | | | ILS | | 1,321,342 | | JPMorgan Chase Bank N.A. | | | 2/12/2020 | | | | (3,312 | ) |
| USD | | | 1,892,289 | | | | | | | JPY | | 206,335,000 | | Goldman Sachs International | | | 2/28/2020 | | | | (12,121 | ) |
| USD | | | 74,111,963 | | | | | | | JPY | | 8,045,928,171 | | JPMorgan Chase Bank N.A. | | | 2/12/2020 | | | | (84,335 | ) |
| USD | | | 4,019,312 | | | | | | | KRW | | 4,647,650,630 | | JPMorgan Chase Bank N.A. | | | 2/12/2020 | | | | (3,283 | ) |
| USD | | | 826,381 | | | | | | | MXN | | 15,812,875 | | Citibank N.A. | | | 2/28/2020 | | | | (3,003 | ) |
| USD | | | 2,020,797 | | | | | | | MXN | | 38,594,000 | | Goldman Sachs International | | | 2/28/2020 | | | | (3,455 | ) |
| USD | | | 2,855,000 | | | | | | | NOK | | 26,116,181 | | Goldman Sachs International | | | 2/12/2020 | | | | (120,230 | ) |
| USD | | | 1,487,011 | | | | | | | NOK | | 13,602,860 | | Merrill Lynch International | | | 2/28/2020 | | | | (62,722 | ) |
| USD | | | 24,986,484 | | | | | | | NZD | | 39,380,113 | | Goldman Sachs International | | | 2/12/2020 | | | | (1,538,377 | ) |
| USD | | | 912,055 | | | | | | | SGD | | 1,238,213 | | JPMorgan Chase Bank N.A. | | | 2/12/2020 | | | | (8,879 | ) |
| | | | | | | | | | | | | | | | | | | | | | |
| | | | | | | | | | | | | | | | | | | | | $(5,643,198 | ) |
| | | | | | | | | | | | | | | | | | | | | | |
Futures Contracts
| | | | | | | | | | | | | | | | | | | | | | | | |
| Description | | Long/
Short | | | Currency | | | Contracts | | | Notional
Amount | | | Expiration
Date | | | Value/Unrealized
Appreciation
(Depreciation) | |
| Asset Derivatives | | | | | | | | | | | | | | | | | | | | | | | | |
| Equity Futures | | | | | | | | | | | | | | | | | | | | | | | | |
| AEX 25 Index | | | Short | | | | EUR | | | | 79 | | | | $10,715,772 | | | | January - 2020 | | | | $86,855 | |
| BIST 30 Index | | | Long | | | | TRY | | | | 7,499 | | | | 17,811,543 | | | | February - 2020 | | | | 223,571 | |
| CAC 40 Index | | | Long | | | | EUR | | | | 349 | | | | 23,370,955 | | | | January - 2020 | | | | 24,584 | |
| FTSE 100 Index | | | Long | | | | GBP | | | | 97 | | | | 9,635,179 | | | | March - 2020 | | | | 19,723 | |
| FTSE MIB Index | | | Long | | | | EUR | | | | 174 | | | | 22,845,327 | | | | March - 2020 | | | | 17,204 | |
| FTSE/JSE Top 40 Index | | | Short | | | | ZAR | | | | 199 | | | | 7,297,330 | | | | March - 2020 | | | | 43,373 | |
| Hang Seng Index | | | Long | | | | HKD | | | | 18 | | | | 3,265,146 | | | | January - 2020 | | | | 19,077 | |
| MSCI Singapore Index | | | Short | | | | SGD | | | | 10 | | | | 276,218 | | | | January - 2020 | | | | 409 | |
20
MFS Global Tactical Allocation Portfolio
Portfolio of Investments – continued
Futures Contracts - continued
| | | | | | | | | | | | | | | | | | | | | | | | |
| Description | | Long/
Short | | | Currency | | | Contracts | | | Notional
Amount | | | Expiration
Date | | | Value/Unrealized
Appreciation
(Depreciation) | |
| Asset Derivatives – continued | | | | | | | | | | | | | | | | | | | | | | | | |
| Equity Futures – continued | | | | | | | | | | | | | | | | | | | | | | | | |
| NIFTY Index | | | Short | | | | USD | | | | 558 | | | | $13,665,420 | | | | January - 2020 | | | | $100,354 | |
| S&P/ASX 200 Index | | | Short | | | | AUD | | | | 147 | | | | 17,028,682 | | | | March - 2020 | | | | 401,041 | |
| | | | | | | | | | | | | | | | | | | | | | | | |
| | | | | | | | | | | | | | | | | | | | | | | $936,191 | |
| | | | | | | | | | | | | | | | | | | | | | | | |
| Interest Rate Futures | | | | | | | | | | | | | | | | | | | | | | | | |
| Canadian Treasury Bond 10 yr | | | Short | | | | CAD | | | | 435 | | | | $46,054,291 | | | | March - 2020 | | | | $582,242 | |
| Euro-Bobl 5 yr | | | Short | | | | EUR | | | | 161 | | | | 24,132,735 | | | | March - 2020 | | | | 113,409 | |
| Euro-Bund 10 yr | | | Short | | | | EUR | | | | 114 | | | | 21,801,203 | | | | March - 2020 | | | | 261,625 | |
| Euro-Buxl 30 yr | | | Short | | | | EUR | | | | 20 | | | | 4,450,457 | | | | March - 2020 | | | | 136,802 | |
| Long Gilt 10 yr | | | Short | | | | GBP | | | | 294 | | | | 51,163,621 | | | | March - 2020 | | | | 524,184 | |
| U.S. Treasury Bond | | | Short | | | | USD | | | | 54 | | | | 8,418,938 | | | | March - 2020 | | | | 218,437 | |
| U.S. Treasury Note 10 yr | | | Short | | | | USD | | | | 1 | | | | 128,422 | | | | March - 2020 | | | | 1,352 | |
| U.S. Treasury Note 5 yr | | | Short | | | | USD | | | | 97 | | | | 11,505,110 | | | | March - 2020 | | | | 48,348 | |
| U.S. Treasury Ultra Note 10 yr | | | Short | | | | USD | | | | 89 | | | | 12,522,578 | | | | March - 2020 | | | | 182,009 | |
| | | | | | | | | | | | | | | | | | | | | | | | |
| | | | | | | | | | | | | | | | | | | | | | | $2,068,408 | |
| | | | | | | | | | | | | | | | | | | | | | | | |
| | | | | | | | | | | | | | | | | | | | | | | $3,004,599 | |
| | | | | | | | | | | | | | | | | | | | | | | | |
| Liability Derivatives | | | | | | | | | | | | | | | | | | | | | | | | |
| Equity Futures | | | | | | | | | | | | | | | | | | | | | | | | |
| DAX Index | | | Long | | | | EUR | | | | 32 | | | | $11,886,879 | | | | March - 2020 | | | | $(118,915 | ) |
| Hang Seng China Enterprises Index | | | Short | | | | HKD | | | | 47 | | | | 3,381,011 | | | | January - 2020 | | | | (32,520 | ) |
| IBEX 35 Index | | | Long | | | | EUR | | | | 33 | | | | 3,527,005 | | | | January - 2020 | | | | (20,483 | ) |
| IBOV Index | | | Short | | | | BRL | | | | 156 | | | | 4,496,610 | | | | February - 2020 | | | | (86,091 | ) |
| KOSPI 200 Index | | | Short | | | | KRW | | | | 258 | | | | 16,398,239 | | | | March - 2020 | | | | (1,047,803 | ) |
| Mexican Bolsa Index | | | Long | | | | MXN | | | | 337 | | | | 7,884,098 | | | | March - 2020 | | | | (163,443 | ) |
| MSCI Taiwan Index | | | Long | | | | USD | | | | 300 | | | | 13,788,000 | | | | January - 2020 | | | | (32,850 | ) |
| OMX 30 Index | | | Long | | | | SEK | | | | 71 | | | | 1,340,391 | | | | January - 2020 | | | | (7,020 | ) |
| Russell 2000 Index | | | Short | | | | USD | | | | 257 | | | | 21,467,210 | | | | March - 2020 | | | | (435,534 | ) |
| S&P 500 Index | | | Short | | | | USD | | | | 49 | | | | 7,916,195 | | | | March - 2020 | | | | (208,785 | ) |
| S&P/TSX 60 Index | | | Short | | | | CAD | | | | 62 | | | | 9,667,521 | | | | March - 2020 | | | | (44,019 | ) |
| Topix Index | | | Long | | | | JPY | | | | 42 | | | | 6,606,311 | | | | March - 2020 | | | | (52,345 | ) |
| | | | | | | | | | | | | | | | | | | | | | | | |
| | | | | | | | | | | | | | | | | | | | | | | $(2,249,808 | ) |
| | | | | | | | | | | | | | | | | | | | | | | | |
| Interest Rate Futures | | | | | | | | | | | | | | | | | | | | | | | | |
| Australian Note 10 yr | | | Long | | | | AUD | | | | 124 | | | | $12,439,788 | | | | March - 2020 | | | | $(207,516 | ) |
| Japan Government Bond 10 yr | | | Long | | | | JPY | | | | 35 | | | | 49,020,293 | | | | March - 2020 | | | | (13,368 | ) |
| U.S. Treasury Note 2 yr | | | Long | | | | USD | | | | 43 | | | | 9,266,500 | | | | March - 2020 | | | | (7,589 | ) |
| U.S. Treasury Ultra Bond | | | Long | | | | USD | | | | 8 | | | | 1,453,250 | | | | March - 2020 | | | | (56,205 | ) |
| | | | | | | | | | | | | | | | | | | | | | | | |
| | | | | | | | | | | | | | | | | | | | | | | $(284,678 | ) |
| | | | | | | | | | | | | | | | | | | | | | | | |
| | | | | | | | | | | | | | | | | | | | | | | $(2,534,486 | ) |
| | | | | | | | | | | | | | | | | | | | | | | | |
21
MFS Global Tactical Allocation Portfolio
Portfolio of Investments – continued
Cleared Swap Agreements
| | | | | | | | | | | | | | | | | | | | | | |
Maturity Date | | Notional
Amount | | | Counterparty | | Cash Flows to Receive/ Frequency | | Cash Flows to Pay/ Frequency | | Unrealized
Appreciation
(Depreciation) | | | Net Unamortized
Upfront Payments
(Receipts) | | | Value | |
| Asset Derivatives | | | | | | | | | | | | | | | | | | | |
| Interest Rate Swaps | | | | | | | | | | | | | | | | | | | |
| 11/06/29 | | USD | 33,600,000 | | | centrally cleared | | 1.91% FLR(3-Month
LIBOR)/Quarterly | | 1.70%/Semi-annually | | | $588,666 | | | | $— | | | | $588,666 | |
| 11/06/49 | | USD | 13,102,083 | | | centrally cleared | | 1.91% FLR(3-Month
LIBOR)/Quarterly | | 1.89%/Semi-annually | | | 595,469 | | | | — | | | | 595,469 | |
| | | | | | | | | | | | | | | | | | | | | | |
| | | | | | | | | | | | | $1,184,135 | | | | $— | | | | $1,184,135 | |
| | | | | | | | | | | | | | | | | | | | | | |
| Liability Derivatives | | | | | | | | | | | | | | | | | | | |
| Interest Rate Swaps | | | | | | | | | | | | | | | | | | | |
| 11/06/21 | | USD | 158,585,877 | | | centrally cleared | | 1.63%/Semi-annually | | 1.91% FLR (3-Month LIBOR)/Quarterly | | | $(244,516 | ) | | | $— | | | | $(244,516 | ) |
| 11/07/21 | | USD | 17,115,000 | | | centrally cleared | | 1.66%/Semi-annually | | 1.91% FLR (3-Month LIBOR)/Quarterly | | | (16,938 | ) | | | — | | | | (16,938 | ) |
| 11/06/24 | | USD | 66,200,000 | | | centrally cleared | | 1.58%/Semi-annually | | 1.91% FLR (3-Month LIBOR)/Quarterly | | | (486,478 | ) | | | — | | | | (486,478 | ) |
| | | | | | | | | | | | | | | | | | | | | | |
| | | | | | | | | | | | | $(747,932 | ) | | | $— | | | | $(747,932 | ) |
| | | | | | | | | | | | | | | | | | | | | | |
Uncleared Swap Agreements
| | | | | | | | | | | | | | | | | | | | | | |
Maturity Date | | Notional
Amount | | | Counterparty | | Cash Flows to Receive/ Frequency | | Cash Flows to Pay/ Frequency | | Unrealized
Appreciation
(Depreciation) | | | Net Unamortized
Upfront Payments
(Receipts) | | | Value | |
| Asset Derivatives | | | | | | | | | | | | | | | | | | | |
| Credit Default Swaps | | | | | | | | | | | | | | | | | | | |
| 6/20/24 | | EUR | 500,000 | | | JPMorgan Chase Bank N.A. | | 5.00%/Quarterly | | (1) | | | $5,497 | | | | $90,513 | | | | $96,010 | |
| | | | | | | | | | | | | | | | | | | | | | |
| (1) | | Fund, as protection seller, to pay notional amount upon a defined credit event by Glencore PLC, 3.375%, 9/30/2020, a BBB rated bond. The fund entered into the contract to gain issuer exposure. |
The credit ratings presented here are an indicator of the current payment/performance risk of the related swap agreement, the reference obligation for which may be either a single security or, in the case of a credit default index, a basket of securities issued by corporate or sovereign issuers. Ratings are assigned to each reference security, including each individual security within a reference basket of securities, utilizing ratings from Moody’s, Fitch, and Standard & Poor’s rating agencies and applying the following hierarchy: If all three agencies provide a rating, the middle rating (after dropping the highest and lowest ratings) is assigned; if two of the three agencies rate a security, the lower of the two is assigned. Ratings are shown in the S&P and Fitch scale (e.g., AAA). The ratings for a credit default index are calculated by MFS as a weighted average of the external credit ratings of the individual securities that compose the index’s reference basket of securities.
At December 31, 2019, the fund had cash collateral of $2,416,460 and other liquid securities with an aggregate value of $18,603,213 to cover any collateral or margin obligations for certain derivative contracts. Restricted cash and/or deposits with brokers in the Statement of Assets and Liabilities are comprised of cash collateral.
See Notes to Financial Statements
22
MFS Global Tactical Allocation Portfolio
FINANCIAL STATEMENTS | STATEMENT OF ASSETS AND LIABILITIES
This statement represents your fund’s balance sheet, which details the assets and liabilities comprising the total value of the fund.
| | | | |
At 12/31/19 | | | | |
| |
Assets | | | | |
Investments in unaffiliated issuers, at value (identified cost, $471,397,309) | | | $562,617,822 | |
Investments in affiliated issuers, at value (identified cost, $31,339,478) | | | 31,339,464 | |
Cash | | | 161,792 | |
Foreign currency, at value (identified cost, $18,918) | | | 19,124 | |
Restricted cash for | | | | |
Uncleared derivatives | | | 1,642,000 | |
Deposits with brokers for | | | | |
Futures contracts | | | 764,368 | |
Purchased options | | | 10,092 | |
Receivables for | | | | |
Net daily variation margin on open cleared swap agreements | | | 115,656 | |
Forward foreign currency exchange contracts | | | 3,773,933 | |
Net daily variation margin on open futures contracts | | | 310,973 | |
Investments sold | | | 1,479,983 | |
Fund shares sold | | | 13 | |
Interest and dividends | | | 3,130,078 | |
Uncleared swaps, at value (net of unamortized premiums paid, $90,513) | | | 96,010 | |
Other assets | | | 3,270 | |
Total assets | | | $605,464,578 | |
| |
Liabilities | | | | |
Payables for | | | | |
Forward foreign currency exchange contracts | | | $5,643,198 | |
Net daily variation margin on open futures contracts | | | 57,358 | |
Fund shares reacquired | | | 708,473 | |
Payable to affiliates | | | | |
Investment adviser | | | 23,068 | |
Administrative services fee | | | 469 | |
Shareholder servicing costs | | | 25 | |
Distribution and/or service fees | | | 7,578 | |
Payable for independent Trustees’ compensation | | | 31 | |
Accrued expenses and other liabilities | | | 150,897 | |
Total liabilities | | | $6,591,097 | |
Net assets | | | $598,873,481 | |
| |
Net assets consist of | | | | |
Paid-in capital | | | $477,999,502 | |
Total distributable earnings (loss) | | | 120,873,979 | |
Net assets | | | $598,873,481 | |
Shares of beneficial interest outstanding | | | 38,407,897 | |
| | | | | | | | | | | | |
| | | |
| | | Net assets | | | Shares
outstanding | | | Net asset value
per share | |
Initial Class | | | $46,175,487 | | | | 2,912,209 | | | | $15.86 | |
Service Class | | | 552,697,994 | | | | 35,495,688 | | | | 15.57 | |
See Notes to Financial Statements
23
MFS Global Tactical Allocation Portfolio
FINANCIAL STATEMENTS | STATEMENT OF OPERATIONS
This statement describes how much your fund earned in investment income and accrued in expenses. It also describes any gains and/or losses generated by fund operations.
| | | | |
Year ended 12/31/19 | | | | |
| |
Net investment income (loss) | | | | |
Income | | | | |
Interest | | | $9,485,621 | |
Dividends | | | 6,806,296 | |
Dividends from affiliated issuers | | | 327,848 | |
Income on securities loaned | | | 24,983 | |
Other | | | 2,253 | |
Foreign taxes withheld | | | (461,240 | ) |
Total investment income | | | $16,185,761 | |
Expenses | | | | |
Management fee | | | $4,334,877 | |
Distribution and/or service fees | | | 1,405,366 | |
Shareholder servicing costs | | | 7,251 | |
Administrative services fee | | | 92,641 | |
Independent Trustees’ compensation | | | 17,436 | |
Custodian fee | | | 107,121 | |
Shareholder communications | | | 33,989 | |
Audit and tax fees | | | 86,495 | |
Legal fees | | | 5,150 | |
Miscellaneous | | | 274,810 | |
Total expenses | | | $6,365,136 | |
Reduction of expenses by investment adviser | | | (59,413 | ) |
Net expenses | | | $6,305,723 | |
Net investment income (loss) | | | $9,880,038 | |
| |
Realized and unrealized gain (loss) | | | | |
Realized gain (loss) (identified cost basis) | | | | |
Unaffiliated issuers (net of $864 country tax) | | | $31,119,760 | |
Affiliated issuers | | | (1,605 | ) |
Written options | | | 129,144 | |
Futures contracts | | | (4,321,882 | ) |
Swap agreements | | | (1,571,283 | ) |
Forward foreign currency exchange contracts | | | 580,448 | |
Foreign currency | | | (563,124 | ) |
Net realized gain (loss) | | | $25,371,458 | |
Change in unrealized appreciation or depreciation | | | | |
Unaffiliated issuers (net of $24,205 decrease in deferred country tax) | | | $43,309,333 | |
Affiliated issuers | | | (265 | ) |
Futures contracts | | | 1,939,485 | |
Swap agreements | | | 441,700 | |
Forward foreign currency exchange contracts | | | 620,120 | |
Translation of assets and liabilities in foreign currencies | | | 128,147 | |
Net unrealized gain (loss) | | | $46,438,520 | |
Net realized and unrealized gain (loss) | | | $71,809,978 | |
Change in net assets from operations | | | $81,690,016 | |
See Notes to Financial Statements
24
MFS Global Tactical Allocation Portfolio
FINANCIAL STATEMENTS | STATEMENTS OF CHANGES IN NET ASSETS
These statements describe the increases and/or decreases in net assets resulting from operations, any distributions, and any shareholder transactions.
| | | | | | | | |
| | | Year ended | |
| | | 12/31/19 | | | 12/31/18 | |
Change in net assets | | | | | | | | |
| | |
From operations | | | | | | | | |
Net investment income (loss) | | | $9,880,038 | | | | $11,065,268 | |
Net realized gain (loss) | | | 25,371,458 | | | | 23,197,631 | |
Net unrealized gain (loss) | | | 46,438,520 | | | | (66,871,760 | ) |
Change in net assets from operations | | | $81,690,016 | | | | $(32,608,861 | ) |
Total distributions to shareholders | | | $(29,426,518 | ) | | | $(33,921,546 | ) |
Change in net assets from fund share transactions | | | $(60,384,699 | ) | | | $(89,026,534 | ) |
Total change in net assets | | | $(8,121,201 | ) | | | $(155,556,941 | ) |
| | |
Net assets | | | | | | | | |
At beginning of period | | | 606,994,682 | | | | 762,551,623 | |
At end of period | | | $598,873,481 | | | | $606,994,682 | |
See Notes to Financial Statements
25
MFS Global Tactical Allocation Portfolio
FINANCIAL STATEMENTS | FINANCIAL HIGHLIGHTS
The financial highlights table is intended to help you understand the fund’s financial performance for the past 5 years. Certain information reflects financial results for a single fund share. The total returns in the table represent the rate that an investor would have earned (or lost) on an investment in the fund share class (assuming reinvestment of all distributions) held for the entire period.
| | | | | | | | | | | | | | | | | | | | |
| Initial Class | | Year ended | |
| | | | | |
| | | 12/31/19 | | | 12/31/18 | | | 12/31/17 | | | 12/31/16 | | | 12/31/15 | |
| | | | | |
Net asset value, beginning of period | | | $14.58 | | | | $16.11 | | | | $15.04 | | | | $14.92 | | | | $16.43 | |
| | | | | |
| Income (loss) from investment operations | | | | | | | | | | | | | | | | | | | | |
Net investment income (loss) (d) | | | $0.29 | | | | $0.29 | | | | $0.26 | | | | $0.29 | (c) | | | $0.29 | |
Net realized and unrealized gain (loss) | | | 1.80 | | | | (0.99 | ) | | | 1.36 | | | | 0.67 | | | | (0.66 | ) |
Total from investment operations | | | $2.09 | | | | $(0.70 | ) | | | $1.62 | | | | $0.96 | | | | $(0.37 | ) |
| | | | | |
| Less distributions declared to shareholders | | | | | | | | | | | | | | | | | | | | |
From net investment income | | | $(0.45 | ) | | | $(0.13 | ) | | | $(0.51 | ) | | | $— | | | | $(0.87 | ) |
From net realized gain | | | (0.36 | ) | | | (0.70 | ) | | | (0.04 | ) | | | (0.84 | ) | | | (0.27 | ) |
Total distributions declared to shareholders | | | $(0.81 | ) | | | $(0.83 | ) | | | $(0.55 | ) | | | $(0.84 | ) | | | $(1.14 | ) |
Net asset value, end of period (x) | | | $15.86 | | | | $14.58 | | | | $16.11 | | | | $15.04 | | | | $14.92 | |
Total return (%) (k)(r)(s)(x) | | | 14.58 | | | | (4.50 | ) | | | 10.83 | | | | 6.24 | (c) | | | (2.23 | ) |
| | | | | |
Ratios (%) (to average net assets)
and Supplemental data: | | | | | | | | | | | | | | | | | | | | |
Expenses before expense reductions (f) | | | 0.81 | | | | 0.81 | | | | 0.81 | | | | 0.79 | (c) | | | 0.76 | |
Expenses after expense reductions (f) | | | 0.80 | | | | 0.80 | | | | 0.80 | | | | 0.78 | (c) | | | 0.75 | |
Net investment income (loss) | | | 1.85 | | | | 1.83 | | | | 1.64 | | | | 1.88 | (c) | | | 1.80 | |
Portfolio turnover | | | 82 | | | | 86 | | | | 35 | | | | 38 | | | | 57 | |
Net assets at end of period (000 omitted) | | | $46,175 | | | | $47,517 | | | | $56,096 | | | | $58,053 | | | | $63,253 | |
| |
| Service Class | | Year ended | |
| | | | | |
| | | 12/31/19 | | | 12/31/18 | | | 12/31/17 | | | 12/31/16 | | | 12/31/15 | |
| | | | | |
Net asset value, beginning of period | | | $14.32 | | | | $15.84 | | | | $14.79 | | | | $14.72 | | | | $16.22 | |
| | | | | |
| Income (loss) from investment operations | | | | | | | | | | | | | | | | | | | | |
Net investment income (loss) (d) | | | $0.24 | | | | $0.24 | | | | $0.22 | | | | $0.25 | (c) | | | $0.25 | |
Net realized and unrealized gain (loss) | | | 1.77 | | | | (0.98 | ) | | | 1.34 | | | | 0.66 | | | | (0.66 | ) |
Total from investment operations | | | $2.01 | | | | $(0.74 | ) | | | $1.56 | | | | $0.91 | | | | $(0.41 | ) |
| | | | | |
| Less distributions declared to shareholders | | | | | | | | | | | | | | | | | | | | |
From net investment income | | | $(0.40 | ) | | | $(0.08 | ) | | | $(0.47 | ) | | | $— | | | | $(0.82 | ) |
From net realized gain | | | (0.36 | ) | | | (0.70 | ) | | | (0.04 | ) | | | (0.84 | ) | | | (0.27 | ) |
Total distributions declared to shareholders | | | $(0.76 | ) | | | $(0.78 | ) | | | $(0.51 | ) | | | $(0.84 | ) | | | $(1.09 | ) |
Net asset value, end of period (x) | | | $15.57 | | | | $14.32 | | | | $15.84 | | | | $14.79 | | | | $14.72 | |
Total return (%) (k)(r)(s)(x) | | | 14.30 | | | | (4.80 | ) | | | 10.58 | | | | 5.98 | (c) | | | (2.49 | ) |
| | | | | |
Ratios (%) (to average net assets)
and Supplemental data: | | | | | | | | | | | | | | | | | | | | |
Expenses before expense reductions (f) | | | 1.06 | | | | 1.06 | | | | 1.06 | | | | 1.04 | (c) | | | 1.01 | |
Expenses after expense reductions (f) | | | 1.05 | | | | 1.05 | | | | 1.05 | | | | 1.03 | (c) | | | 1.00 | |
Net investment income (loss) | | | 1.60 | | | | 1.58 | | | | 1.39 | | | | 1.63 | (c) | | | 1.55 | |
Portfolio turnover | | | 82 | | | | 86 | | | | 35 | | | | 38 | | | | 57 | |
Net assets at end of period (000 omitted) | | | $552,698 | | | | $559,478 | | | | $706,456 | | | | $733,775 | | | | $773,721 | |
See Notes to Financial Statements
26
MFS Global Tactical Allocation Portfolio
Financial Highlights – continued
| (c) | Amount reflects aone-time reimbursement of expenses by the custodian (or former custodian) without which net investment income and performance would be lower and expenses would be higher. |
| (d) | Per share data is based on average shares outstanding. |
| (f) | Ratios do not reflect reductions from fees paid indirectly, if applicable. |
| (k) | The total return does not reflect expenses that apply to separate accounts. Inclusion of these charges would reduce the total return figures for all periods shown. |
| (r) | Certain expenses have been reduced without which performance would have been lower. |
| (s) | From time to time the fund may receive proceeds from litigation settlements, without which performance would be lower. |
| (x) | The net asset values and total returns have been calculated on net assets which include adjustments made in accordance with U.S. generally accepted accounting principles required at period end for financial reporting purposes. |
See Notes to Financial Statements
27
MFS Global Tactical Allocation Portfolio
NOTES TO FINANCIAL STATEMENTS
| (1) | | Business and Organization |
MFS Global Tactical Allocation Portfolio (the fund) is a diversified series of MFS Variable Insurance Trust II (the trust). The trust is organized as a Massachusetts business trust and is registered under the Investment Company Act of 1940, as amended, as anopen-end management investment company. The shareholders of each series of the trust are separate accounts of insurance companies, which offer variable annuity and/or life insurance products, and qualified retirement and pension plans.
The fund is an investment company and accordingly follows the investment company accounting and reporting guidance of the Financial Accounting Standards Board (FASB) Accounting Standards Codification Topic 946 Financial Services – Investment Companies.
| (2) | | Significant Accounting Policies |
General– The preparation of financial statements in conformity with U.S. generally accepted accounting principles requires management to make estimates and assumptions that affect the reported amounts of assets and liabilities, and disclosure of contingent assets and liabilities at the date of the financial statements and the reported amounts of increases and decreases in net assets from operations during the reporting period. Actual results could differ from those estimates. In the preparation of these financial statements, management has evaluated subsequent events occurring after the date of the fund’s Statement of Assets and Liabilities through the date that the financial statements were issued. The fund invests in derivatives as part of its principal investment strategy. Derivatives can be highly volatile and involve risks in addition to the risks of the underlying indicators on which the derivative is based. Derivatives can involve leverage. The fund invests in foreign securities. Investments in foreign securities are vulnerable to the effects of changes in the relative values of the local currency and the U.S. dollar and to the effects of changes in each country’s market, economic, industrial, political, regulatory, geopolitical, and other conditions.
In March 2017, the FASB issued Accounting Standards Update2017-08, Receivables – Nonrefundable Fees and Other Costs (Subtopic310-20) – Premium Amortization on Purchased Callable Debt Securities (“ASU2017-08”). For callable debt securities purchased at a premium that have explicit,non-contingent call features and that are callable at fixed prices on preset dates,ASU 2017-08 requires the premium to be amortized to the earliest call date. The fund adopted ASU2017-08 as of the beginning of the reporting period on a modified retrospective basis. The adoption resulted in a change in accounting principle, since the fund had historically amortized such premiums to maturity for U.S. GAAP. As a result of the adoption, the fund recognized a cumulative effect adjustment that decreased the beginning of period cost of investments and increased the unrealized appreciation on investments by offsetting amounts. Adoption had no impact on the fund’s net assets or any prior period information presented in the financial statements. With respect to the fund’s results of operations, amortization of premium to first call date under ASU2017-08 accelerates amortization with the intent of more closely aligning the recognition of income on such bonds with the economics of the instrument.
Balance Sheet Offsetting– The fund’s accounting policy with respect to balance sheet offsetting is that, absent an event of default by the counterparty or a termination of the agreement, the International Swaps and Derivatives Association (ISDA) Master Agreement, or similar agreement, does not result in an offset of reported amounts of financial assets and financial liabilities in the Statement of Assets and Liabilities across transactions between the fund and the applicable counterparty. The fund’s right to setoff may be restricted or prohibited by the bankruptcy or insolvency laws of the particular jurisdiction to which a specific master netting agreement counterparty is subject. Balance sheet offsetting disclosures, to the extent applicable to the fund, have been included in the fund’s Significant Accounting Policies note under the captions for each of the fund’sin-scope financial instruments and transactions.
Investment Valuations– Equity securities, including restricted equity securities, are generally valued at the last sale or official closing price on their primary market or exchange as provided by a third-party pricing service. Equity securities, for which there were no sales reported that day, are generally valued at the last quoted daily bid quotation on their primary market or exchange as provided by a third-party pricing service. Debt instruments and floating rate loans, including restricted debt instruments, are generally valued at an evaluated or composite bid as provided by a third-party pricing service. Short-term instruments with a maturity at issuance of 60 days or less may be valued at amortized cost, which approximates market value. Exchange-traded options are generally valued at the last sale or official closing price on their primary exchange as provided by a third-party pricing service. Exchange-traded options for which there were no sales reported that day are generally valued at the last daily bid quotation on their primary exchange as provided by a third-party pricing service. For put options, the position may be valued at the last daily ask quotation if there are no trades reported during the day. Options not traded on an exchange are generally valued at a broker/dealer bid quotation. Foreign currency options are generally valued at valuations provided by a third-party pricing service. Futures contracts are generally valued at last posted settlement price on their primary exchange as provided by a third-party pricing service. Futures contracts for which there were no trades that day for a particular position are generally valued at the closing bid quotation on their primary exchange as provided by a third-party pricing service. Forward foreign currency exchange contracts are generally valued at the mean of bid and asked prices for the time period interpolated from rates provided by a third-party pricing service for proximate time periods. Swap agreements are generally valued using valuations provided by a third-party pricing service, which for cleared
28
MFS Global Tactical Allocation Portfolio
Notes to Financial Statements – continued
swaps includes an evaluation of any trading activity at the clearinghouses.Open-end investment companies are generally valued at net asset value per share. Securities and other assets generally valued on the basis of information from a third-party pricing service may also be valued at a broker/dealer bid quotation. In determining values, third-party pricing services can utilize both transaction data and market information such as yield, quality, coupon rate, maturity, type of issue, trading characteristics, and other market data. The values of foreign securities and other assets and liabilities expressed in foreign currencies are converted to U.S. dollars using the mean of bid and asked prices for rates provided by a third-party pricing service.
The Board of Trustees has delegated primary responsibility for determining or causing to be determined the value of the fund’s investments (including any fair valuation) to the adviser pursuant to valuation policies and procedures approved by the Board. If the adviser determines that reliable market quotations are not readily available, investments are valued at fair value as determined in good faith by the adviser in accordance with such procedures under the oversight of the Board of Trustees. Under the fund’s valuation policies and procedures, market quotations are not considered to be readily available for most types of debt instruments and floating rate loans and many types of derivatives. These investments are generally valued at fair value based on information from third-party pricing services. In addition, investments may be valued at fair value if the adviser determines that an investment’s value has been materially affected by events occurring after the close of the exchange or market on which the investment is principally traded (such as foreign exchange or market) and prior to the determination of the fund’s net asset value, or after the halt of trading of a specific security where trading does not resume prior to the close of the exchange or market on which the security is principally traded. Events that occur after foreign markets close (such as developments in foreign markets and significant movements in the U.S. markets) and prior to the determination of the fund’s net asset value may be deemed to have a material effect on the value of securities traded in foreign markets. Accordingly, the fund’s foreign equity securities may often be valued at fair value. The adviser generally relies on third-party pricing services or other information (such as the correlation with price movements of similar securities in the same or other markets; the type, cost and investment characteristics of the security; the business and financial condition of the issuer; and trading and other market data) to assist in determining whether to fair value and at what value to fair value an investment. The value of an investment for purposes of calculating the fund’s net asset value can differ depending on the source and method used to determine value. When fair valuation is used, the value of an investment used to determine the fund’s net asset value may differ from quoted or published prices for the same investment. There can be no assurance that the fund could obtain the fair value assigned to an investment if it were to sell the investment at the same time at which the fund determines its net asset value per share.
Various inputs are used in determining the value of the fund’s assets or liabilities. These inputs are categorized into three broad levels. In certain cases, the inputs used to measure fair value may fall into different levels of the fair value hierarchy. In such cases, an investment’s level within the fair value hierarchy is based on the lowest level of input that is significant to the fair value measurement. The fund’s assessment of the significance of a particular input to the fair value measurement in its entirety requires judgment, and considers factors specific to the investment. Level 1 includes unadjusted quoted prices in active markets for identical assets or liabilities. Level 2 includes other significant observable market-based inputs (including quoted prices for similar securities, interest rates, prepayment speed, and credit risk). Level 3 includes unobservable inputs, which may include the adviser’s own
29
MFS Global Tactical Allocation Portfolio
Notes to Financial Statements – continued
assumptions in determining the fair value of investments. Other financial instruments are derivative instruments, such as futures contracts, forward foreign currency exchange contracts, swap agreements, and written options. The following is a summary of the levels used as of December 31, 2019 in valuing the fund’s assets or liabilities:
| | | | | | | | | | | | | | | | |
| Financial Instruments | | Level 1 | | | Level 2 | | | Level 3 | | | Total | |
| Equity Securities: | | | | | | | | | | | | | | | | |
United States | | | $113,697,798 | | | | $30,100 | | | | $— | | | | $113,727,898 | |
Japan | | | 1,157,649 | | | | 17,089,753 | | | | — | | | | 18,247,402 | |
Switzerland | | | 17,491,191 | | | | — | | | | — | | | | 17,491,191 | |
United Kingdom | | | 11,370,165 | | | | — | | | | — | | | | 11,370,165 | |
France | | | 9,647,352 | | | | — | | | | — | | | | 9,647,352 | |
Canada | | | 8,496,242 | | | | — | | | | — | | | | 8,496,242 | |
Taiwan | | | 6,468,773 | | | | — | | | | — | | | | 6,468,773 | |
Germany | | | 6,049,996 | | | | — | | | | — | | | | 6,049,996 | |
Netherlands | | | 5,344,902 | | | | — | | | | — | | | | 5,344,902 | |
Other Countries | | | 13,122,501 | | | | 3,586,611 | | | | — | | | | 16,709,112 | |
| U.S. Treasury Bonds & U.S. Government Agencies & Equivalents | | | — | | | | 44,494,182 | | | | — | | | | 44,494,182 | |
| Non-U.S. Sovereign Debt | | | — | | | | 137,903,633 | | | | — | | | | 137,903,633 | |
| Municipal Bonds | | | — | | | | 1,960,964 | | | | — | | | | 1,960,964 | |
| U.S. Corporate Bonds | | | — | | | | 51,220,035 | | | | — | | | | 51,220,035 | |
| Residential Mortgage-Backed Securities | | | — | | | | 42,909,539 | | | | — | | | | 42,909,539 | |
| Commercial Mortgage-Backed Securities | | | — | | | | 7,155,058 | | | | — | | | | 7,155,058 | |
| Asset-Backed Securities (including CDOs) | | | — | | | | 8,023,566 | | | | — | | | | 8,023,566 | |
| Foreign Bonds | | | — | | | | 55,397,812 | | | | — | | | | 55,397,812 | |
| Mutual Funds | | | 31,339,464 | | | | — | | | | — | | | | 31,339,464 | |
| Total | | | $224,186,033 | | | | $369,771,253 | | | | $— | | | | $593,957,286 | |
| | | | |
| Other Financial Instruments | | | | | | | | | | | | |
| Futures Contracts – Assets | | | $3,004,599 | | | | $— | | | | $— | | | | $3,004,599 | |
| Futures Contracts – Liabilities | | | (1,434,338 | ) | | | (1,100,148 | ) | | | — | | | | (2,534,486 | ) |
| Forward Foreign Currency Exchange Contracts – Assets | | | — | | | | 3,773,933 | | | | — | | | | 3,773,933 | |
| Forward Foreign Currency Exchange Contracts – Liabilities | | | — | | | | (5,643,198 | ) | | | — | | | | (5,643,198 | ) |
| Swap Agreements – Assets | | | — | | | | 1,280,145 | | | | — | | | | 1,280,145 | |
| Swap Agreements – Liabilities | | | — | | | | (747,932 | ) | | | — | | | | (747,932 | ) |
For further information regarding security characteristics, see the Portfolio of Investments.
Inflation-Adjusted Debt Securities– The fund invests in inflation-adjusted debt securities issued by the U.S. Treasury. The fund also invests in inflation-adjusted debt securities issued by U.S. Government agencies and instrumentalities other than the U.S. Treasury and by other entities such as U.S. and foreign corporations and foreign governments. The principal value of these debt securities is adjusted through income according to changes in the Consumer Price Index or another general price or wage index. These debt securities typically pay a fixed rate of interest, but this fixed rate is applied to the inflation-adjusted principal amount. The principal paid at maturity of the debt security is typically equal to the inflation-adjusted principal amount, or the security’s original par value, whichever is greater. Other types of inflation-adjusted securities may use other methods to adjust for other measures of inflation.
Foreign Currency Translation– Purchases and sales of foreign investments, income, and expenses are converted into U.S. dollars based upon currency exchange rates prevailing on the respective dates of such transactions or on the reporting date for foreign denominated receivables and payables. Gains and losses attributable to foreign currency exchange rates on sales of securities are recorded for financial statement purposes as net realized gains and losses on investments. Gains and losses attributable to foreign exchange rate movements on receivables, payables, income and expenses are recorded for financial statement purposes as foreign currency transaction gains and losses. That portion of both realized and unrealized gains and losses on investments that results from fluctuations in foreign currency exchange rates is not separately disclosed.
Derivatives– The fund uses derivatives in an attempt to adjust exposure to markets, asset classes, and currencies based on the adviser’s assessment of the relative attractiveness of such markets, asset classes, and currencies. Derivatives are used to increase or decrease the fund’s exposure to markets, asset classes, or currencies resulting from the fund’s individual security selections, and to expose the fund to markets, asset classes, or currencies in which the fund’s individual security selection has resulted in little or no exposure. Derivatives are used for hedging ornon-hedging purposes. While hedging can reduce or eliminate losses, it can also reduce or eliminate gains. When the fund uses derivatives as an investment to increase or decrease market exposure, or for hedging purposes, gains and losses from derivative instruments may be substantially greater than the derivative’s original cost.
30
MFS Global Tactical Allocation Portfolio
Notes to Financial Statements – continued
The derivative instruments used by the fund during the period were written options, purchased options, futures contracts, forward foreign currency exchange contracts, and swap agreements. Depending on the type of derivative, the fund may exit a derivative position by entering into an offsetting transaction with a counterparty or exchange, negotiating an agreement with the derivative counterparty, or novating the position to a third party. The fund may be unable to promptly close out a futures position in instances where the daily fluctuation in the price for that type of future exceeds the daily limit set by the exchange. The fund’s period end derivatives, as presented in the Portfolio of Investments and the associated Derivative Contract tables, generally are indicative of the volume of its derivative activity during the period.
The following table presents, by major type of derivative contract, the fair value, on a gross basis, of the asset and liability components of derivatives held by the fund at December 31, 2019 as reported in the Statement of Assets and Liabilities:
| | | | | | | | | | |
| | | | | Fair Value (a) | |
| Risk | | Derivative Contracts | | Asset Derivatives | | | Liability Derivatives | |
| Interest Rate | | Interest Rate Futures | | | $2,068,408 | | | | $(284,678 | ) |
| Equity | | Equity Futures | | | 936,191 | | | | (2,249,808 | ) |
| Equity | | Purchased Equity Options | | | 30,100 | | | | — | |
| Foreign Exchange | | Forward Foreign Currency Exchange Contracts | | | 3,773,933 | | | | (5,643,198 | ) |
| Interst Rate | | Interest Rate Swaps | | | 1,184,135 | | | | (747,932 | ) |
| Credit | | Credit Default Swaps | | | 96,010 | | | | — | |
| Total | | | | | $8,088,777 | | | | $(8,925,616 | ) |
| (a) | The value of purchased options outstanding is included in investments in unaffiliated issuers, at value, within the fund’s Statement of Assets and Liabilities. Values presented in this table for futures contracts and cleared swap agreements correspond to the values reported in the fund’s Portfolio of Investments. Only the current day net variation margin for futures contracts and cleared swap agreements is separately reported within the fund’s Statement of Assets and Liabilities. |
The following table presents, by major type of derivative contract, the realized gain (loss) on derivatives held by the fund for the year ended December 31, 2019 as reported in the Statement of Operations:
| | | | | | | | | | | | | | | | | | | | |
| Risk | | Futures
Contracts | | | Swap
Agreements | | | Forward Foreign
Currency
Exchange
Contracts | | | Unaffiliated Issuers
(Purchased
Options) | | | Written Options | |
| Interest Rate | | | $(8,813,223 | ) | | | $(1,601,571 | ) | | | $— | | | | $— | | | | $— | |
| Foreign Exchange | | | — | | | | — | | | | 580,448 | | | | — | | | | — | |
| Equity | | | 4,491,341 | | | | — | | | | — | | | | (147,348 | ) | | | — | |
| Credit | | | — | | | | 30,288 | | | | — | | | | (226,239 | ) | | | 129,144 | |
| Total | | | $(4,321,882 | ) | | | $(1,571,283 | ) | | | $580,448 | | | | $(373,587 | ) | | | $129,144 | |
The following table presents, by major type of derivative contract, the change in unrealized appreciation or depreciation on derivatives held by the fund for the year ended December 31, 2019 as reported in the Statement of Operations:
| | | | | | | | | | | | | | | | |
| Risk | | Futures
Contracts | | | Swap
Agreements | | | Forward Foreign
Currency
Exchange
Contracts | | | Unaffiliated Issuers
(Purchased
Options) | |
| Interest Rate | | | $4,338,633 | | | | $436,203 | | | | $— | | | | $— | |
| Foreign Exchange | | | — | | | | — | | | | 620,120 | | | | — | |
| Equity | | | (2,399,148 | ) | | | — | | | | — | | | | (563,453 | ) |
| Credit | | | — | | | | 5,497 | | | | — | | | | — | |
| Total | | | $1,939,485 | | | | $441,700 | | | | $620,120 | | | | $(563,453 | ) |
Derivative counterparty credit risk is managed through formal evaluation of the creditworthiness of all potential counterparties. On certain, but not all, uncleared derivatives, the fund attempts to reduce its exposure to counterparty credit risk whenever possible by entering into an ISDA Master Agreement on a bilateral basis. The ISDA Master Agreement gives each party to the agreement the right to terminate all transactions traded under such agreement if there is a specified deterioration in the credit quality of the other party. Upon an event of default or a termination of the ISDA Master Agreement, thenon-defaulting party has the right to close out all transactions traded under such agreement and to net amounts owed under each agreement to one net amount payable by one party to the other. This right to close out and net payments across all transactions traded under the ISDA Master Agreement could result in a reduction of the fund’s credit risk to such counterparty equal to any amounts payable by the fund under the applicable transactions, if any.
31
MFS Global Tactical Allocation Portfolio
Notes to Financial Statements – continued
Collateral and margin requirements differ by type of derivative. For cleared derivatives (e.g., futures contracts, cleared swaps, and exchange-traded options), margin requirements are set by the clearing broker and the clearing house and collateral, in the form of cash or securities, is posted by the fund directly with the clearing broker. Collateral terms are counterparty agreement specific for uncleared derivatives (e.g., forward foreign currency exchange contracts, uncleared swap agreements, and uncleared options) and collateral, in the form of cash and securities, is held in segregated accounts with the fund’s custodian in connection with these agreements. For derivatives traded under an ISDA Master Agreement, which contains a collateral support annex, the collateral requirements are netted across all transactions traded under such counterparty-specific agreement and an amount is posted from one party to the other to collateralize such obligations. Cash that has been segregated or delivered to cover the fund’s collateral or margin obligations under derivative contracts, if any, will be reported separately in the Statement of Assets and Liabilities as restricted cash for uncleared derivatives and/or deposits with brokers for cleared derivatives. Securities pledged as collateral or margin for the same purpose, if any, are noted in the Portfolio of Investments. The fund may be required to make payments of interest on uncovered collateral or margin obligations with the broker. Any such payments are included in “Miscellaneous” expense in the Statement of Operations.
The following table presents the fund’s derivative assets and liabilities (by type) on a gross basis as of December 31, 2019:
| | | | | | | | |
| Gross Amounts of: | | Derivative Assets | | | Derivative Liabilities | |
| Future Contracts (a) | | | $310,973 | | | | $(57,358 | ) |
| Swaps, at value | | | 96,010 | | | | — | |
| Cleared Swaps Agreements (a) | | | 115,656 | | | | — | |
| Forward Foreign Currency Exchange Contracts | | | 3,773,933 | | | | (5,643,198 | ) |
| Purchased Options | | | 30,100 | | | | — | |
| Total Gross Amount of Derivative Assets and Liabilities Presented in the Statement of Assets & Liabilities | | | $4,326,672 | | | | $(5,700,556 | ) |
Less: Derivatives Assets and Liabilities Not Subject to a Master Netting Agreement or Similar Arrangement | | | 510,054 | | | | (77,649 | ) |
| Total Gross Amount of Derivative Assets and Liabilities Subject to a Master Netting Agreement or Similar Arrangement | | | $3,816,618 | | | | $(5,622,907 | ) |
| (a) | The amount presented here represents the fund’s current day net variation margin for futures contracts and for cleared swap agreements. This amount, which is recognized within the fund’s Statement of Assets and Liabilities, differs from the fair value of the futures contracts and cleared swap agreements which is presented in the tables that follow the fund’s Portfolio of Investments. |
The following table presents (by counterparty) the fund’s derivative assets net of amounts available for offset under Master Netting Agreements (or similar arrangements) and net of the related collateral held by the fund at December 31, 2019:
| | | | | | | | | | | | | | | | | | | | |
| | | | | | Amounts Not Offset in the
Statement of Assets & Liabilities | |
| | | | | |
| | | Gross Amount of
Derivative Assets Subject to
a Master Netting
Agreement (or Similar
Arrangement) by
Counterparty | | | Financial
Instruments
Available
for Offset | | | Financial
Instruments
Collateral
Received (b) | | | Cash Collateral
Received (b) | | | Net Amount of
Derivative Assets by
Counterparty | |
| Barclays Bank PLC | | | $109,364 | | | | $(71,051 | ) | | | $— | | | | $— | | | | $38,313 | |
| BNP Paribas S.A. | | | 6,614 | | | | — | | | | — | | | | — | | | | 6,614 | |
| Citibank N.A. | | | 189,843 | | | | (5,067 | ) | | | — | | | | — | | | | 184,776 | |
| Deutsche Bank AG | | | 98,054 | | | | (51,568 | ) | | | — | | | | — | | | | 46,486 | |
| Goldman Sachs International | | | 2,135,416 | | | | (2,135,416 | ) | | | — | | | | — | | | | — | |
| JPMorgan Chase Bank N.A. | | | 1,259,362 | | | | (1,259,362 | ) | | | — | | | | — | | | | — | |
| Merrill Lynch International | | | 12,952 | | | | (12,952 | ) | | | — | | | | — | | | | — | |
| Morgan Stanley Capital Services, Inc. | | | 5,013 | | | | — | | | | — | | | | — | | | | 5,013 | |
| Total | | | $3,816,618 | | | | $(3,535,416 | ) | | | $— | | | | $— | | | | $281,202 | |
32
MFS Global Tactical Allocation Portfolio
Notes to Financial Statements – continued
The following table presents (by counterparty) the fund’s derivative liabilities net of amounts available for offset under Master Netting Agreements (or similar arrangements) and net of the related collateral pledged by the fund at December 31, 2019:
| | | | | | | | | | | | | | | | | | | | |
| | | | | | Amounts Not Offset in the
Statement of Assets & Liabilities | |
| | | | | |
| | | Gross Amounts of
Derivative Liabilities Subject
to a Master Netting
Agreement (or Similar
Arrangement) by
Counterparty | | | Financial
Instruments
Available
for Offset | | | Financial
Instruments
Collateral
Pledged (b) | | | Cash Collateral
Pledged (b) | | | Net Amount of
Derivative Liabilities by
Counterparty | |
| Barclays Bank PLC | | | $(71,051 | ) | | | $71,051 | | | | $— | | | | $— | | | | $— | |
| Citibank N.A. | | | (5,067 | ) | | | 5,067 | | | | — | | | | — | | | | — | |
| Deutsche Bank AG | | | (51,568 | ) | | | 51,568 | | | | — | | | | — | | | | — | |
| Goldman Sachs International | | | (2,530,705 | ) | | | 2,135,416 | | | | — | | | | 380,000 | | | | (15,289 | ) |
| JPMorgan Chase Bank N.A. | | | (2,779,945 | ) | | | 1,259,362 | | | | — | | | | 1,262,000 | | | | (258,583 | ) |
| Merrill Lynch International | | | (184,571 | ) | | | 12,952 | | | | — | | | | — | | | | (171,619 | ) |
| Total | | | $(5,622,907 | ) | | | $3,535,416 | | | | $— | | | | $1,642,000 | | | | $(445,491 | ) |
| (b) | The amount presented here may be less than the total amount of collateral (received)/pledged as the excess collateral (received)/pledged is not shown for purposes of this presentation. |
Written Options– In exchange for a premium, the fund wrote call options on securities for which it anticipated the price would decline and also wrote put options on securities for which it anticipated the price would increase. At the time the option was written, the fund believed the premium received exceeded the potential loss that could result from adverse price changes in the options’ underlying securities. In a written option, the fund as the option writer grants the buyer the right to purchase from, or sell to, the fund a specified number of shares or units of a particular security, currency or index at a specified price within a specified period of time.
The premium received is initially recorded as a liability in the Statement of Assets and Liabilities. The option is subsequentlymarked-to-market daily with the difference between the premium received and the market value of the written option being recorded as unrealized appreciation or depreciation. When a written option expires, the fund realizes a gain equal to the amount of the premium received. The difference between the premium received and the amount paid on effecting a closing transaction is considered a realized gain or loss. When a written call option is exercised, the premium received is offset against the proceeds to determine the realized gain or loss. When a written put option is exercised, the premium reduces the cost basis of the security purchased by the fund.
At the initiation of the written option contract, for exchange traded options, the fund is required to deposit securities or cash as collateral with the custodian for the benefit of the broker or directly with the clearing broker, based on the type of option. For uncleared options, the fund may post collateral subject to the terms of an ISDA Master Agreement as generally described above if the market value of the options contract moves against it. The fund, as writer of an option, may have no control over whether the underlying securities may be sold (call) or purchased (put) and, as a result, bears the market risk of an unfavorable change in the price of the securities underlying the written option. Losses from writing options can exceed the premium received and can exceed the potential loss from an ordinary buy and sell transaction. Although the fund’s market risk may be significant, the maximum counterparty credit risk to the fund is equal to the market value of any collateral posted to the broker. For uncleared options, this risk is mitigated in cases where there is an ISDA Master Agreement between the fund and the counterparty providing for netting as described above.
Purchased Options– The fund purchased call and put options for a premium. Purchased call and put options entitle the holder to buy and sell a specified number of shares or units of a particular security, currency or index at a specified price at a specified date or within a specified period of time. Purchasing call options may hedge against an anticipated increase in the dollar cost of securities or currency to be acquired or increase the fund’s exposure to an underlying instrument. Purchasing put options may hedge against an anticipated decline in the value of portfolio securities or currency or decrease the fund’s exposure to an underlying instrument.
The premium paid is initially recorded as an investment in the Statement of Assets and Liabilities. That investment is subsequentlymarked-to-market daily with the difference between the premium paid and the market value of the purchased option being recorded as unrealized appreciation or depreciation. Premiums paid for purchased call and put options which have expired are treated as realized losses on investments in the Statement of Operations. Upon the exercise or closing of a purchased call option, the premium paid is added to the cost of the security or financial instrument purchased. Upon the exercise or closing of a purchased put option, the premium paid is offset against the proceeds on the sale of the underlying security or financial instrument in order to determine the realized gain or loss on investments.
Whether or not the option is exercised, the fund’s maximum risk of loss from purchasing an option is the amount of premium paid. All option contracts involve credit risk if the counterparty to the option contract fails to perform. For uncleared options, this risk is
33
MFS Global Tactical Allocation Portfolio
Notes to Financial Statements – continued
mitigated in cases where there is an ISDA Master Agreement between the fund and the counterparty providing for netting as described above and, where applicable, by the posting of collateral by the counterparty to the fund to cover the fund’s exposure to the counterparty under such ISDA Master Agreement.
Futures Contracts– The fund entered into futures contracts which may be used to hedge against or obtain broad market exposure, interest rate exposure, currency exposure, or to manage duration. A futures contract represents a commitment for the future purchase or sale of an asset at a specified price on a specified date.
Upon entering into a futures contract, the fund is required to deposit with the broker, either in cash or securities, an initial margin in an amount equal to a specified percentage of the notional amount of the contract. Subsequent payments (variation margin) are made or received by the fund each day, depending on the daily fluctuations in the value of the contract, and are recorded for financial statement purposes as unrealized gain or loss by the fund until the contract is closed or expires at which point the gain or loss on futures contracts is realized.
The fund bears the risk of interest rates, exchange rates or securities prices moving unexpectedly, in which case, the fund may not achieve the anticipated benefits of the futures contracts and may realize a loss. While futures contracts may present less counterparty risk to the fund since the contracts are exchange traded and the exchange’s clearinghouse guarantees payments to the broker, there is still counterparty credit risk due to the insolvency of the broker. The fund’s maximum risk of loss due to counterparty credit risk is equal to the margin posted by the fund to the broker plus any gains or minus any losses on the outstanding futures contracts.
Forward Foreign Currency Exchange Contracts– The fund entered into forward foreign currency exchange contracts for the purchase or sale of a specific foreign currency at a fixed price on a future date. These contracts may be used to hedge the fund’s currency risk or fornon-hedging purposes. For hedging purposes, the fund may enter into contracts to deliver or receive foreign currency that the fund will receive from or use in its normal investment activities. The fund may also use contracts to hedge against declines in the value of foreign currency denominated securities due to unfavorable exchange rate movements. Fornon-hedging purposes, the fund may enter into contracts with the intent of changing the relative exposure of the fund’s portfolio of securities to different currencies to take advantage of anticipated exchange rate changes.
Forward foreign currency exchange contracts are adjusted by the daily exchange rate of the underlying currency and any unrealized gains or losses are recorded as a receivable or payable for forward foreign currency exchange contracts until the contract settlement date. On contract settlement date, any gain or loss on the contract is recorded as realized gains or losses on forward foreign currency exchange contracts.
Risks may arise upon entering into these contracts from unanticipated movements in the value of the contract and from the potential inability of counterparties to meet the terms of their contracts. Generally, the fund’s maximum risk due to counterparty credit risk is the unrealized gain on the contract due to the use of Continuous Linked Settlement, a multicurrency cash settlement system for the centralized settlement of foreign transactions. This risk is mitigated in cases where there is an ISDA Master Agreement between the fund and the counterparty providing for netting as described above and, where applicable, by the posting of collateral by the counterparty to the fund to cover the fund’s exposure to the counterparty under such ISDA Master Agreement.
Swap Agreements– During the period the fund entered into swap agreements. Swap agreements generally involve a periodic exchange of cash payments on a net basis, at specified intervals or upon the occurrence of specified events, between the fund and a counterparty. Certain swap agreements may be entered into as a bilateral contract (“uncleared swaps”) while others are required to be centrally cleared (“cleared swaps”). In a cleared swap transaction, the ultimate counterparty to the transaction is a clearinghouse (the “clearinghouse”). The contract is transferred and accepted by the clearinghouse immediately following execution of the swap contract with an executing broker. Thereafter, throughout the term of the cleared swap, the fund interfaces indirectly with the clearinghouse through a clearing broker and has counterparty risk to the clearing broker as well.
Both cleared and uncleared swap agreements are marked to market daily. The value of uncleared swap agreements is reported in the Statement of Assets and Liabilities as “Uncleared swaps, at value” which includes any related interest accruals to be paid or received by the fund. For cleared swaps, payments (variation margin) are made or received by the fund each day, depending on the daily fluctuations in the value of the cleared swap, such that only the current day net receivable or payable for variation margin is reported in the Statement of Assets and Liabilities.
For both cleared and uncleared swaps, the periodic exchange of net cash payments, at specified intervals or upon the occurrence of specified events as stipulated by the agreement, is recorded as realized gain or loss on swap agreements in the Statement of Operations. Premiums paid or received at the inception of the agreements are amortized using the effective interest method over the term of the agreement as realized gain or loss on swap agreements in the Statement of Operations. A liquidation payment received or made upon early termination is recorded as a realized gain or loss on swap agreements in the Statement of Operations. The change in unrealized appreciation or depreciation on swap agreements in the Statement of Operations reflects the aggregate change over the reporting period in the value of swaps net of any unamortized premiums paid or received.
34
MFS Global Tactical Allocation Portfolio
Notes to Financial Statements – continued
Risks related to swap agreements include the possible lack of a liquid market, unfavorable market and interest rate movements of the underlying instrument and the failure of the counterparty to perform under the terms of the agreements. The fund’s maximum risk of loss from counterparty credit risk is the discounted net value of the cash flows to be received from/paid to the counterparty over the contract’s remaining life, to the extent that the amount is positive. To address counterparty risk, uncleared swap agreements are limited to only highly-rated counterparties. Risk is further reduced by having an ISDA Master Agreement between the fund and the counterparty providing for netting as described above and, where applicable, by the posting of collateral by the counterparty to the fund to cover the fund’s exposure to the counterparty under such ISDA Master Agreement. The fund’s counterparty risk due to cleared swaps is mitigated by the fact that the clearinghouse is the true counterparty to the transaction and the regulatory requirement safeguards in the event of a clearing broker bankruptcy.
The fund entered into interest rate swap agreements in order to manage its exposure to interest or foreign exchange rate fluctuations. Interest rate swap agreements involve the periodic exchange of cash flows, between the fund and a counterparty, based on the difference between two interest rates applied to a notional principal amount. The two interest rates exchanged may either be a fixed rate and a floating rate or two floating rates based on different indices.
The fund entered into credit default swap agreements in order to manage its exposure to the market or certain sectors of the market, to reduce its credit risk exposure to defaults of corporate and sovereign issuers or to create exposure to corporate or sovereign issuers to which it is not otherwise exposed. In a credit default swap agreement, the protection buyer can make an upfront payment and will make a stream of payments to the protection seller based on a fixed percentage applied to the agreement notional amount in exchange for the right to receive a specified return upon the occurrence of a defined credit event on the reference obligation (which may be either a single security or a basket of securities issued by corporate or sovereign issuers) and, with respect to the cases where physical settlement applies, the delivery by the buyer to the seller of a defined deliverable obligation. Although agreement-specific, credit events generally consist of a combination of the following: bankruptcy, failure to pay, restructuring, obligation acceleration, obligation default, or repudiation/moratorium, each as defined in the 2003 ISDA Credit Derivatives Definitions as amended by the relevant agreement. Restructuring is generally not applicable when the reference obligation is issued by a North American corporation and obligation acceleration, obligation default, or repudiation/moratorium are generally only applicable when the reference obligation is issued by a sovereign entity or an entity in an emerging country. Upon determination of the final price for the deliverable obligation (or upon delivery of the deliverable obligation in the case of physical settlement), the difference between the value of the deliverable obligation and the swap agreement’s notional amount is recorded as realized gain or loss on swap agreements in the Statement of Operations.
Credit default swap agreements are considered to have credit-risk-related contingent features since they trigger payment by the protection seller to the protection buyer upon the occurrence of a defined credit event. The maximum amount of future, undiscounted payments that the fund, as protection seller, could be required to make is equal to the swap agreement’s notional amount. The protection seller’s payment obligation would be offset to the extent of the value of the agreement’s deliverable obligation. At December 31, 2019, the fund did not hold any credit default swap agreements at an unrealized loss where it is the protection seller. The fund’s maximum risk of loss from counterparty risk, either as the protection seller or as the protection buyer, is the fair value of the agreement.
Security Loans– Under its Securities Lending Agency Agreement with the fund, State Street Bank and Trust Company, as lending agent, loans the securities of the fund to certain qualified institutions (the “Borrowers”) approved by the fund. Security loans can be terminated at the discretion of either the lending agent or the fund and the related securities must be returned within the earlier of the standard trade settlement period for such securities or within three business days. The loans are collateralized by cash and/or U.S. Treasury and federal agency obligations in an amount typically at least equal to the market value of the securities loaned. On loans collateralized by cash, the cash collateral is invested in a money market fund. The market value of the loaned securities is determined at the close of business of the fund and any additional required collateral is delivered to the fund on the next business day. The lending agent provides the fund with indemnification against Borrower default. In the event of Borrower default, the lending agent will, for the benefit of the fund, either purchase securities identical to those loaned or, when such purchase is commercially impracticable, pay the fund the market value of the loaned securities. In return, the lending agent assumes the fund’s rights to the related collateral. If the collateral value is less than the cost to purchase identical securities, the lending agent is responsible for the shortfall, but only to the extent that such shortfall is not due to a decline in collateral value resulting from collateral reinvestment for which the fund bears the risk of loss. A portion of the income generated upon investment of the collateral is remitted to the Borrowers, and the remainder is allocated between the fund and the lending agent. On loans collateralized by U.S. Treasury and/or federal agency obligations, a fee is received from the Borrower, and is allocated between the fund and the lending agent. Income from securities lending is separately reported in the Statement of Operations. The dividend and interest income earned on the securities loaned is accounted for in the same manner as other dividend and interest income. At December 31, 2019, there were no securities on loan or collateral outstanding.
35
MFS Global Tactical Allocation Portfolio
Notes to Financial Statements – continued
Indemnifications– Under the fund’s organizational documents, its officers and Trustees may be indemnified against certain liabilities and expenses arising out of the performance of their duties to the fund. Additionally, in the normal course of business, the fund enters into agreements with service providers that may contain indemnification clauses. The fund’s maximum exposure under these agreements is unknown as this would involve future claims that may be made against the fund that have not yet occurred.
Investment Transactions and Income– Investment transactions are recorded on the trade date. Interest income is recorded on the accrual basis. All premium and discount is amortized or accreted for financial statement purposes in accordance with U.S. generally accepted accounting principles. Inflation-indexed bonds are fixed-income securities whose principal value is periodically adjusted upward or downward based on the rate of inflation. Interest is accrued based on the principal value, which is adjusted for inflation. Any increase or decrease in the principal amount of an inflation-indexed bond is generally recorded as an increase or decrease in interest income, respectively, even though the adjusted principal is not received until maturity. Dividends received in cash are recorded on theex-dividend date. Certain dividends from foreign securities will be recorded when the fund is informed of the dividend if such information is obtained subsequent to theex-dividend date. Dividend and interest payments received in additional securities are recorded on theex-dividend orex-interest date in an amount equal to the value of the security on such date.
The fund may receive proceeds from litigation settlements. Any proceeds received from litigation involving portfolio holdings are reflected in the Statement of Operations in realized gain/loss if the security has been disposed of by the fund or in unrealized gain/loss if the security is still held by the fund. Any other proceeds from litigation not related to portfolio holdings are reflected as other income in the Statement of Operations.
The fund invests a significant portion of its assets in asset-backed and/or mortgage-backed securities. For these securities, the value of the debt instrument also depends on the credit quality and adequacy of the underlying assets or collateral as well as whether there is a security interest in the underlying assets or collateral. Enforcing rights, if any, against the underlying assets or collateral may be difficult. U.S. Government securities not supported as to the payment of principal or interest by the U.S. Treasury, such as those issued by Fannie Mae, Freddie Mac, and the Federal Home Loan Banks, are subject to greater credit risk than are U.S. Government securities supported by the U.S. Treasury, such as those issued by Ginnie Mae.
The fund purchased or sold debt securities on a when-issued or delayed delivery basis, or in a “To Be Announced” (TBA) or “forward commitment” transaction with delivery or payment to occur at a later date beyond the normal settlement period. When the fund sells securities on a when-issued, delayed delivery, or forward commitment basis, the fund typically owns or has the right to acquire securities equivalent in kind and amount to the delivered securities. At the time a fund enters into a commitment to purchase or sell a security, the transaction is recorded and the value of the security acquired or sold is reflected in the fund’s net asset value. The price of such security and the date that the security will be delivered and paid for are fixed at the time the transaction is negotiated. The value of the security may vary with market fluctuations. No interest accrues to the fund until payment takes place. At the time that a fund enters into this type of transaction, the fund is required to have sufficient cash and/or liquid securities to cover its commitments. Losses may arise due to changes in the value of the underlying securities prior to settlement date or if the counterparty does not perform under the contract’s terms, or if the issuer does not issue the securities due to political, economic or other factors.
To mitigate the counterparty credit risk on TBA securities and other types of forward settling mortgage-backed securities, the fund whenever possible enters into a Master Securities Forward Transaction Agreement (“MSFTA”) on a bilateral basis with each of the counterparties with whom it undertakes a significant volume of transactions. The MSFTA gives each party to the agreement the right to terminate all transactions traded under such agreement if there is a specified deterioration in the credit quality of the other party. Upon an event of default or a termination of the MSFTA, thenon-defaulting party has the right to close out all transactions traded under such agreement and to net amounts owed under each transaction to one net amount payable by one party to the other. This right to close out and net payments across all transactions traded under the MSFTA could result in a reduction of the fund’s credit risk to such counterparty equal to any amounts payable by the fund under the applicable transactions, if any.
For mortgage-backed securities traded under a MSFTA, the collateral and margining requirements are contract specific. Collateral amounts across all transactions traded under such agreement are netted and an amount is posted from one party to the other to collateralize such obligations. Cash that has been pledged to cover the fund’s collateral or margin obligations under a MSFTA, if any, will be reported separately on the Statement of Assets and Liabilities as restricted cash. Securities pledged as collateral or margin for the same purpose, if any, are noted in the Portfolio of Investments.
Tax Matters and Distributions– The fund intends to qualify as a regulated investment company, as defined under Subchapter M of the Internal Revenue Code, and to distribute all of its taxable income, including realized capital gains. As a result, no provision for federal income tax is required. The fund’s federal tax returns, when filed, will remain subject to examination by the Internal Revenue Service for a three year period. Management has analyzed the fund’s tax positions taken on federal and state tax returns for all open tax years and does not believe that there are any uncertain tax positions that require recognition of a tax liability. Foreign taxes, if any, have been accrued by the fund in the accompanying financial statements in accordance with the applicable foreign tax law.
36
MFS Global Tactical Allocation Portfolio
Notes to Financial Statements – continued
Foreign income taxes may be withheld by certain countries in which the fund invests. Additionally, capital gains realized by the fund on securities issued in or by certain foreign countries may be subject to capital gains tax imposed by those countries.
Distributions to shareholders are recorded on theex-dividend date. Income and capital gain distributions are determined in accordance with income tax regulations, which may differ from U.S. generally accepted accounting principles. Certain capital accounts in the financial statements are periodically adjusted for permanent differences in order to reflect their tax character. These adjustments have no impact on net assets or net asset value per share. Temporary differences which arise from recognizing certain items of income, expense, gain or loss in different periods for financial statement and tax purposes will reverse at some time in the future.
Book/tax differences primarily relate to amortization and accretion of debt securities, wash sale loss deferrals, straddle loss deferrals, and derivative transactions.
The tax character of distributions declared to shareholders for the last two fiscal years is as follows:
| | | | | | | | |
| | | Year ended
12/31/19 | | | Year ended
12/31/18 | |
| Ordinary income (including any short-term capital gains) | | | $15,531,343 | | | | $16,001,318 | |
| Long-term capital gains | | | 13,895,175 | | | | 17,920,228 | |
| Total distributions | | | $29,426,518 | | | | $33,921,546 | |
The federal tax cost and the tax basis components of distributable earnings were as follows:
| | | | |
| As of 12/31/19 | | | | |
| |
| Cost of investments | | | $506,815,564 | |
| Gross appreciation | | | 91,131,698 | |
| Gross depreciation | | | (4,856,915 | ) |
| Net unrealized appreciation (depreciation) | | | $86,274,783 | |
| |
| Undistributed ordinary income | | | 27,067,006 | |
| Undistributed long-term capital gain | | | 7,450,443 | |
| Other temporary differences | | | 81,747 | |
Multiple Classes of Shares of Beneficial Interest– The fund offers multiple classes of shares, which differ in their respective distribution and/or service fees. The fund’s income, realized and unrealized gain (loss), and common expenses are allocated to shareholders based on the daily net assets of each class. Dividends are declared separately for each class. Differences in per share dividend rates are generally due to differences in separate class expenses. The fund’s distributions declared to shareholders as reported in the Statements of Changes in Net Assets are presented by class as follows:
| | | | | | | | |
| | |
| | | Year ended
12/31/19 | | | Year ended
12/31/18 | |
| Initial Class | | | $2,333,315 | | | | $2,676,464 | |
| Service Class | | | 27,093,203 | | | | 31,245,082 | |
| Total | | | $29,426,518 | | | | $33,921,546 | |
| (3) | | Transactions with Affiliates |
Investment Adviser– The fund has an investment advisory agreement with MFS to provide overall investment management and related administrative services and facilities to the fund. The management fee is computed daily and paid monthly at the following annual rates based on the fund’s average daily net assets:
| | | | |
| Up to $300 million | | | 0.75% | |
| In excess of $300 million and up to $2.5 billion | | | 0.675% | |
| In excess of $2.5 billion | | | 0.65% | |
MFS has agreed in writing to reduce its management fee by a specified amount if certain MFS mutual fund assets exceed thresholds agreed to by MFS and the fund’s Board of Trustees. For the year ended December 31, 2019, this management fee reduction amounted to $59,413, which is included in the reduction of total expenses in the Statement of Operations. The management fee incurred for the year ended December 31, 2019 was equivalent to an annual effective rate of 0.70% of the fund’s average daily net assets.
The investment adviser has agreed in writing to pay a portion of the fund’s total annual operating expenses, excluding interest, taxes, extraordinary expenses, brokerage and transaction costs, and investment-related expenses, such that total annual operating expenses do not exceed 0.90% of average daily net assets for the Initial Class shares and 1.15% of average daily net assets for the Service Class shares. This written agreement will continue until modified by the fund’s Board of Trustees, but such agreement will continue at least until April 30, 2021. For the year ended December 31, 2019, the fund’s actual operating expenses did not exceed the limit and therefore, the investment adviser did not pay any portion of the fund’s expenses related to this agreement.
37
MFS Global Tactical Allocation Portfolio
Notes to Financial Statements – continued
Distributor– MFS Fund Distributors, Inc. (MFD), a wholly-owned subsidiary of MFS, is the distributor of shares of the fund. The Trustees have adopted a distribution plan for the Service Class shares pursuant to Rule12b-1 under the Investment Company Act of 1940.
The fund’s distribution plan provides that the fund will pay MFD distribution and/or service fees equal to 0.25% per annum of its average daily net assets attributable to Service Class shares as partial consideration for services performed and expenses incurred by MFD and financial intermediaries (including participating insurance companies that invest in the fund to fund variable annuity and variable life insurance contracts, sponsors of qualified retirement and pension plans that invest in the fund, and affiliates of these participating insurance companies and plan sponsors) in connection with the sale and distribution of the Service Class shares. MFD may subsequently pay all, or a portion, of the distribution and/or service fees to financial intermediaries.
Shareholder Servicing Agent– MFS Service Center, Inc. (MFSC), a wholly-owned subsidiary of MFS, receives a fee from the fund for its services as shareholder servicing agent. For the year ended December 31, 2019, the fee was $7,026, which equated to 0.0012% annually of the fund’s average daily net assets. MFSC also receives payment from the fund forout-of-pocket expenses paid by MFSC on behalf of the fund. For the year ended December 31, 2019, these costs amounted to $225.
Administrator– MFS provides certain financial, legal, shareholder communications, compliance, and other administrative services to the fund. Under an administrative services agreement, the fund reimburses MFS the costs incurred to provide these services. The fund is charged an annual fixed amount of $17,500 plus a fee based on average daily net assets. The administrative services fee incurred for the year ended December 31, 2019 was equivalent to an annual effective rate of 0.0152% of the fund’s average daily net assets.
Trustees’ and Officers’ Compensation– The fund pays compensation to independent Trustees in the form of a retainer, attendance fees, and additional compensation to Board and Committee chairpersons. The fund does not pay compensation directly to Trustees or officers of the fund who are also officers of the investment adviser, all of whom receive remuneration from MFS for their services to the fund. Certain officers and Trustees of the fund are officers or directors of MFS, MFD, and MFSC.
Other– This fund and certain other funds managed by MFS (the funds) had entered into a service agreement (the ISO Agreement) which provided for payment of fees solely by the funds to Tarantino LLC in return for the provision of services of an Independent Senior Officer (ISO) for the funds. Frank L. Tarantino served as the ISO and was an officer of the funds and the sole member of Tarantino LLC. Effective June 30, 2019, Mr. Tarantino retired from his position as ISO for the funds, and the ISO Agreement was terminated. For the year ended December 31, 2019, the fee paid by the fund under this agreement was $801 and is included in “Miscellaneous” expense in the Statement of Operations. MFS had agreed to bear all expenses associated with office space, other administrative support, and supplies provided to the ISO.
The fund invests in the MFS Institutional Money Market Portfolio which is managed by MFS and seeks current income consistent with preservation of capital and liquidity. This money market fund does not pay a management fee to MFS.
The fund is permitted to engage in purchase and sale transactions with funds and accounts for which MFS serves as investment adviser orsub-adviser (“cross-trades”) pursuant to a policy adopted by the Board of Trustees. This policy has been designed to ensure that cross-trades conducted by the fund comply with Rule17a-7 under the Investment Company Act of 1940. During the year ended December 31, 2019, the fund engaged in purchase and sale transactions pursuant to this policy, which amounted to $272,383 and $2,112,173, respectively. The sales transactions resulted in net realized gains (losses) of $169,209.
For the year ended December 31, 2019, purchases and sales of investments, other than purchased option transactions andshort-term obligations, were as follows:
| | | | | | | | |
| | | Purchases | | | Sales | |
| U.S. Government securities | | | $133,441,138 | | | | $158,447,111 | |
| Non-U.S. Government securities | | | $347,549,188 | | | | $410,969,486 | |
| (5) | | Shares of Beneficial Interest |
The fund’s Declaration of Trust permits the Trustees to issue an unlimited number of full and fractional shares of beneficial interest. Transactions in fund shares were as follows:
| | | | | | | | | | | | | | | | |
| | | Year ended 12/31/19 | | | Year ended 12/31/18 | |
| | | | |
| | | Shares | | | Amount | | | Shares | | | Amount | |
| Shares sold | | | | | | | | | | | | | | | | |
Initial Class | | | 95,554 | | | | $1,481,687 | | | | 80,272 | | | | $1,254,421 | |
Service Class | | | 176,097 | | | | 2,697,085 | | | | 437,166 | | | | 6,748,306 | |
| | | 271,651 | | | | $4,178,772 | | | | 517,438 | | | | $8,002,727 | |
38
MFS Global Tactical Allocation Portfolio
Notes to Financial Statements – continued
| | | | | | | | | | | | | | | | |
| | | Year ended 12/31/19 | | | Year ended 12/31/18 | |
| | | | |
| | | Shares | | | Amount | | | Shares | | | Amount | |
| Shares issued to shareholders in reinvestment of distributions | | | | | | | | | | | | | | | | |
Initial Class | | | 153,609 | | | | $2,333,315 | | | | 177,720 | | | | $2,676,464 | |
Service Class | | | 1,814,682 | | | | 27,093,203 | | | | 2,109,729 | | | | 31,245,082 | |
| | | 1,968,291 | | | | $29,426,518 | | | | 2,287,449 | | | | $33,921,546 | |
| | | | |
| Shares reacquired | | | | | | | | | | | | | | | | |
Initial Class | | | (597,095 | ) | | | $(9,219,482 | ) | | | (479,270 | ) | | | $(7,461,633 | ) |
Service Class | | | (5,563,506 | ) | | | (84,770,507 | ) | | | (8,081,155 | ) | | | (123,489,174 | ) |
| | | (6,160,601 | ) | | | $(93,989,989 | ) | | | (8,560,425 | ) | | | $(130,950,807 | ) |
| | | | |
| Net change | | | | | | | | | | | | | | | | |
Initial Class | | | (347,932 | ) | | | $(5,404,480 | ) | | | (221,278 | ) | | | $(3,530,748 | ) |
Service Class | | | (3,572,727 | ) | | | (54,980,219 | ) | | | (5,534,260 | ) | | | (85,495,786 | ) |
| | | (3,920,659 | ) | | | $(60,384,699 | ) | | | (5,755,538 | ) | | | $(89,026,534 | ) |
The fund and certain other funds managed by MFS participate in a $1.25 billion unsecured committed line of credit, subject to a $1 billion sublimit, provided by a syndicate of banks under a credit agreement. Borrowings may be made for temporary financing needs. Interest is charged to each fund, based on its borrowings, generally at a rate equal to the highest of one month LIBOR, the Federal Funds Effective Rate and the Overnight Bank Funding Rate, plus an agreed upon spread. A commitment fee, based on the average daily, unused portion of the committed line of credit, is allocated among the participating funds. In addition, the fund and other funds managed by MFS have established unsecured uncommitted borrowing arrangements with certain banks for temporary financing needs. Interest is charged to each fund, based on its borrowings, at rates equal to customary reference rates plus an agreed upon spread. For the year ended December 31, 2019, the fund’s commitment fee and interest expense were $3,336 and $0, respectively, and are included in “Miscellaneous” expense in the Statement of Operations.
| (7) | | Investments in Affiliated Issuers |
An affiliated issuer may be considered one in which the fund owns 5% or more of the outstanding voting securities, or a company which is under common control. For the purposes of this report, the following were affiliated issuers:
| | | | | | | | | | | | | | | | | | | | | | | | |
| Affiliated Issuers | | Beginning
Value | | | Purchases | | | Sales
Proceeds | | | Realized
Gain
(Loss) | | | Change in
Unrealized
Appreciation or
Depreciation | | | Ending
Value | |
| MFS Institutional Money Market Portfolio | | | $24,746,728 | | | | $250,876,245 | | | | $244,281,639 | | | | $(1,605 | ) | | | $(265 | ) | | | $31,339,464 | |
| | | | | | |
| Affiliated Issuers | | | | | | | | | | | | | | Dividend
Income | | | Capital Gain
Distributions | |
| MFS Institutional Money Market Portfolio | | | | | | | | | | | | $327,848 | | | | $— | |
39
MFS Global Tactical Allocation Portfolio
REPORT OF INDEPENDENT REGISTERED PUBLIC ACCOUNTING FIRM
To the Board of Trustees of MFS Variable Insurance Trust II and the Shareholders of
MFS Global Tactical Allocation Portfolio:
Opinion on the Financial Statements and Financial Highlights
We have audited the accompanying statement of assets and liabilities of MFS Global Tactical Allocation Portfolio (the “Fund”), including the portfolio of investments, as of December 31, 2019, the related statement of operations for the year then ended, the statements of changes in net assets for each of the two years in the period then ended, the financial highlights for each of the five years in the period then ended, and the related notes. In our opinion, the financial statements and financial highlights present fairly, in all material respects, the financial position of the Fund as of December 31, 2019, and the results of its operations for the year then ended, the changes in its net assets for each of the two years in the period then ended, and the financial highlights for each of the five years in the period then ended, in conformity with accounting principles generally accepted in the United States of America.
Basis for Opinion
These financial statements and financial highlights are the responsibility of the Fund’s management. Our responsibility is to express an opinion on the Fund’s financial statements and financial highlights based on our audits. We are a public accounting firm registered with the Public Company Accounting Oversight Board (United States) (PCAOB) and are required to be independent with respect to the Fund in accordance with the U.S. federal securities laws and the applicable rules and regulations of the Securities and Exchange Commission and the PCAOB.
We conducted our audits in accordance with the standards of the PCAOB. Those standards require that we plan and perform the audit to obtain reasonable assurance about whether the financial statements and financial highlights are free of material misstatement, whether due to error or fraud. The Fund is not required to have, nor were we engaged to perform, an audit of its internal control over financial reporting. As part of our audits we are required to obtain an understanding of internal control over financial reporting but not for the purpose of expressing an opinion on the effectiveness of the Fund’s internal control over financial reporting. Accordingly, we express no such opinion.
Our audits included performing procedures to assess the risks of material misstatement of the financial statements and financial highlights, whether due to error or fraud, and performing procedures that respond to those risks. Such procedures included examining, on a test basis, evidence regarding the amounts and disclosures in the financial statements and financial highlights. Our audits also included evaluating the accounting principles used and significant estimates made by management, as well as evaluating the overall presentation of the financial statements and financial highlights. Our procedures included confirmation of securities owned as of December 31, 2019, by correspondence with the custodian and brokers. We believe that our audits provide a reasonable basis for our opinion.
DELOITTE & TOUCHE LLP
Boston, Massachusetts
February 14, 2020
We have served as the auditor of one or more of the MFS investment companies since 1924.
40
MFS Global Tactical Allocation Portfolio
TRUSTEES AND OFFICERS – IDENTIFICATION AND BACKGROUND
The Trustees and Officers of the Trust, as of February 1, 2020, are listed below, together with their principal occupations during the past five years. (Their titles may have varied during that period.) The address of each Trustee and Officer is 111 Huntington Avenue, Boston, Massachusetts 02199-7618.
| | | | | | | | | | |
Name, Age | | Position(s)
Held with Fund | | Trustee/Officer
Since (h) | | Number of MFS Funds
overseen by the
Trustee | | Principal Occupations
During the Past Five Years | | Other Directorships During the Past Five Years (j) |
| INTERESTED TRUSTEES |
Robert J. Manning (k)
(age 56) | | Trustee | | February 2004 | | 133 | | Massachusetts Financial Services Company, Executive Chairman (since January 2017); Director; Chairman of the Board; Chief Executive Officer (until 2015);Co-Chief Executive Officer(2015-2016) | | N/A |
| | | | | |
Robin A. Stelmach (k) (age 58) | | Trustee | | January 2014 | | 133 | | Massachusetts Financial Services Company, Vice Chair (since January 2017); Chief Operating Officer and Executive Vice President (until January 2017) | | N/A |
|
| INDEPENDENT TRUSTEES |
John P. Kavanaugh (age 65) | | Trustee and Chair of Trustees | | January 2009 | | 133 | | Private investor | | N/A |
| | | | | |
Steven E. Buller (age 68) | | Trustee | | February 2014 | | 133 | | Financial Accounting Standards Advisory Council, Chairman(2014-2015); Public Company Accounting Oversight Board, Standing Advisory Group, Member (until 2014); BlackRock, Inc. (investment management), Managing Director (until 2014), BlackRock Finco UK (investment management), Director (until 2014) | | N/A |
| | | | | |
John A. Caroselli (age 65) | | Trustee | | March 2017 | | 133 | | JC Global Advisors, LLC (management consulting), President (since 2015); First Capital Corporation (commercial finance), Executive Vice President (until 2015) | | N/A |
| | | | | |
Maureen R. Goldfarb (age 64) | | Trustee | | January 2009 | | 133 | | Private investor | | N/A |
| | | | | |
Peter D. Jones
(age 64) | | Trustee | | January 2019 | | 133 | | Franklin Templeton Distributors, Inc. (investment management), President (until 2015); Franklin Templeton Institutional, LLC (investment management), Chairman (until 2015) | | N/A |
| | | | | |
James W. Kilman, Jr.
(age 58) | | Trustee | | January 2019 | | 133 | | Burford Capital Limited (finance and investment management), Chief Financial Officer (since 2019); KielStrand Capital LLC (family office), Chief Executive Officer (since 2016); Morgan Stanley & Co. (financial services), Vice Chairman of Investment Banking,Co-Head of Diversified Financials Coverage – Financial Institutions Investment Banking Group (until 2016) | | Alpha-En Corporation, Director (2016-2019) |
41
MFS Global Tactical Allocation Portfolio
Trustees and Officers – continued
| | | | | | | | | | |
Name, Age | | Position(s)
Held with Fund | | Trustee/Officer
Since (h) | | Number of MFS Funds
overseen by the
Trustee | | Principal Occupations
During the Past Five Years | | Other Directorships During the Past Five Years (j) |
Clarence Otis, Jr. (age 63) | | Trustee | | March 2017 | | 133 | | Darden Restaurants, Inc., Chief Executive Officer (until 2014) | | VF Corporation, Director; Verizon Communications, Inc., Director; The Travelers Companies, Director; Federal Reserve Bank of Atlanta, Director (until 2015) |
| | | | | |
Maryanne L. Roepke (age 63) | | Trustee | | May 2014 | | 133 | | American Century Investments (investment management), Senior Vice President and Chief Compliance Officer (until 2014) | | N/A |
| | | | | |
Laurie J. Thomsen
(age 62) | | Trustee | | March 2005 | | 133 | | Private investor | | The Travelers Companies, Director; Dycom Industries, Inc., Director (since 2015) |
| | | | | | | | |
Name, Age | | Position(s)
Held with Fund | | Trustee/Officer
Since (h) | | Number of
MFS Funds
for which the
Person is an
Officer | | Principal Occupations During the Past Five Years |
| OFFICERS | | | | | | |
Christopher R. Bohane (k)
(age 46) | | Assistant Secretary and Assistant Clerk | | July 2005 | | 133 | | Massachusetts Financial Services Company, Vice President and Assistant General Counsel |
| | | | |
Kino Clark (k) (age 51) | | Assistant Treasurer | | January 2012 | | 133 | | Massachusetts Financial Services Company, Vice President |
| | | | |
John W. Clark, Jr. (k) (age 52) | | Assistant Treasurer | | April 2017 | | 133 | | Massachusetts Financial Services Company, Vice President (since March 2017); Deutsche Bank (financial services), Department Head –Treasurer’s Office (until February 2017) |
| | | | |
Thomas H. Connors (k) (age 60) | | Assistant Secretary and Assistant Clerk | | September 2012 | | 133 | | Massachusetts Financial Services Company, Vice President and Senior Counsel |
| | | | |
David L. DiLorenzo (k)
(age 51) | | President | | July 2005 | | 133 | | Massachusetts Financial Services Company, Senior Vice President |
| | | | |
Heidi W. Hardin (k) (age 52) | | Secretary and Clerk | | April 2017 | | 133 | | Massachusetts Financial Services Company, Executive Vice President and General Counsel (since March 2017); Harris Associates (investment management), General Counsel (from September 2015 to January 2017); Janus Capital Management LLC (investment management), Senior Vice President and General Counsel (until September 2015) |
| | | | |
Brian E. Langenfeld (k) (age 46) | | Assistant
Secretary and Assistant Clerk | | June 2006 | | 133 | | Massachusetts Financial Services Company, Vice President and Senior Counsel |
| | | | |
Amanda S. Mooradian (k) (age 40) | | Assistant
Secretary and Assistant Clerk | | September 2018 | | 133 | | Massachusetts Financial Services Company, Assistant Vice President and Counsel |
| | | | |
Susan A. Pereira (k)
(age 49) | | Assistant
Secretary and Assistant Clerk | | July 2005 | | 133 | | Massachusetts Financial Services Company, Vice President and Assistant General Counsel |
| | | | |
Kasey L. Phillips (k) (age 49) | | Assistant Treasurer | | September 2012 | | 133 | | Massachusetts Financial Services Company, Vice President |
| | | | |
Matthew A. Stowe (k) (age 45) | | Assistant Secretary and Assistant Clerk | | October 2014 | | 133 | | Massachusetts Financial Services Company, Vice President and Assistant General Counsel |
42
MFS Global Tactical Allocation Portfolio
Trustees and Officers – continued
| | | | | | | | |
Name, Age | | Position(s)
Held with Fund | | Trustee/Officer
Since (h) | | Number of
MFS Funds
for which the
Person is an
Officer | | Principal Occupations During the Past Five Years |
Martin J. Wolin (k) (age 52) | | Chief Compliance Officer | | July 2015 | | 133 | | Massachusetts Financial Services Company, Senior Vice President and Chief Compliance Officer (since July 2015); Mercer (financial service provider), Chief Risk and Compliance Officer, North America and Latin America (until June 2015) |
| | | | |
James O. Yost (k)
(age 59) | | Treasurer | | September 1990 | | 133 | | Massachusetts Financial Services Company, Senior Vice President |
| (h) | Date first appointed to serve as Trustee/officer of an MFS Fund. Each Trustee has served continuously since appointment unless indicated otherwise. For the period from December 15, 2004 until February 22, 2005, Mr. Manning served as Advisory Trustee. From January 2012 through December 2016, Messrs. DiLorenzo and Yost served as Treasurer and Deputy Treasurer of the Funds, respectively. |
| (j) | Directorships or trusteeships of companies required to report to the Securities and Exchange Commission (i.e., “public companies”). |
| (k) | “Interested person” of the Trust within the meaning of the Investment Company Act of 1940 (referred to as the 1940 Act), which is the principal federal law governing investment companies like the fund, as a result of a position with MFS. The address of MFS is 111 Huntington Avenue, Boston, Massachusetts 02199-7618. |
Each Trustee (other than Messrs. Jones and Kilman) has been elected by shareholders and each Trustee and Officer holds office until his or her successor is chosen and qualified or until his or her earlier death, resignation, retirement or removal. Messrs. Jones and Kilman became Trustees of the Funds on January 1, 2019. The Trust does not hold annual meetings for the purpose of electing Trustees, and Trustees are not elected for fixed terms. Under the terms of the Board’s retirement policy, an Independent Trustee shall retire at the end of the calendar year in which he or she reaches the earlier of 75 years of age or 15 years of service on the Board (or, in the case of any Independent Trustee who joined the Board prior to 2015, 20 years of service on the Board).
Messrs. Buller, Kilman and Otis and Ms. Roepke are members of the Trust’s Audit Committee.
Each of the Interested Trustees and certain Officers hold comparable officer positions with certain affiliates of MFS.
The Statement of Additional Information for a Fund includes further information about the Trustees and is available without charge upon request by calling1-800-225-2606.
| | |
Investment Adviser Massachusetts Financial Services Company 111 Huntington Avenue Boston, MA 02199-7618 | | Custodian State Street Bank and Trust Company 1 Lincoln Street Boston, MA 02111-2900 |
| |
Distributor MFS Fund Distributors, Inc. 111 Huntington Avenue Boston, MA 02199-7618 | | Independent Registered Public Accounting Firm Deloitte & Touche LLP 200 Berkeley Street Boston, MA 02116 |
| |
Portfolio Manager(s) Nevin Chitkara Pilar Gomez-Bravo Steven Gorham Andy Li Vipin Narula Ben Nastou Henry Peabody Robert Persons Jonathan Sage Natalie Shapiro Robert Spector Erik Weisman | | |
43
MFS Global Tactical Allocation Portfolio
BOARD REVIEW OF INVESTMENT ADVISORY AGREEMENT
MFS Global Tactical Allocation Portfolio
The Investment Company Act of 1940 requires that both the full Board of Trustees and a majority of thenon-interested (“independent”) Trustees, voting separately, annually approve the continuation of the Fund’s investment advisory agreement with MFS. The Trustees consider matters bearing on the Fund and its advisory arrangements at their meetings throughout the year, including a review of performance data at each regular meeting. In addition, the independent Trustees met several times over the course of three months beginning in May and ending in July, 2019 (“contract review meetings”) for the specific purpose of considering whether to approve the continuation of the investment advisory agreement for the Fund and the other investment companies that the Board oversees (the “MFS Funds”). The independent Trustees were assisted in their evaluation of the Fund’s investment advisory agreement by independent legal counsel, from whom they received separate legal advice and with whom they met separately from MFS during various contract review meetings. The independent Trustees were also assisted in this process by the MFS Funds’ Independent Senior Officer, a senior officer appointed by and reporting to the independent Trustees.
In connection with their deliberations regarding the continuation of the investment advisory agreement, the Trustees, including the independent Trustees, considered such information and factors as they believed, in light of the legal advice furnished to them and their own business judgment, to be relevant. The investment advisory agreement for the Fund was considered separately, although the Trustees also took into account the common interests of all MFS Funds in their review. As described below, the Trustees considered the nature, quality, and extent of the various investment advisory, administrative, and shareholder services performed by MFS under the existing investment advisory agreement and other arrangements with the Fund.
In connection with their contract review meetings, the Trustees received and relied upon materials that included, among other items: (i) information provided by Broadridge Financial Solutions, Inc. (“Broadridge”), an independent third party, on the investment performance of the Fund for various time periods ended December 31, 2018 and the investment performance of a group of funds with substantially similar investment classifications/objectives (the “Broadridge performance universe”), (ii) information provided by Broadridge on the Fund’s advisory fees and other expenses and the advisory fees and other expenses of comparable funds identified by Broadridge as well as all other funds in the same investment classification/category (the “Broadridge expense group and universe”), (iii) information provided by MFS on the advisory fees of portfolios of other clients of MFS, including institutional separate accounts and other clients, (iv) information as to whether and to what extent applicable expense waivers, reimbursements or fee “breakpoints” are observed for the Fund, (v) information regarding MFS’ financial results and financial condition, including MFS’ and certain of its affiliates’ estimated profitability from services performed for the Fund and the MFS Funds as a whole, and compared to MFS’ institutional business, (vi) MFS’ views regarding the outlook for the mutual fund industry and the strategic business plans of MFS, (vii) descriptions of various functions performed by MFS for the Funds, such as compliance monitoring and portfolio trading practices, and (viii) information regarding the overall organization of MFS, including information about MFS’ senior management and other personnel providing investment advisory, administrative and other services to the Fund and the other MFS Funds. The comparative performance, fee and expense information prepared and provided by Broadridge was not independently verified and the independent Trustees did not independently verify any information provided to them by MFS.
The Trustees’ conclusion as to the continuation of the investment advisory agreement was based on a comprehensive consideration of all information provided to the Trustees and not the result of any single factor. Some of the factors that figured particularly in the Trustees’ deliberations are described below, although individual Trustees may have evaluated the information presented differently from one another, giving different weights to various factors. It is also important to recognize that the fee arrangements for the Fund and other MFS Funds are the result of years of review and discussion between the independent Trustees and MFS, that certain aspects of such arrangements may receive greater scrutiny in some years than in others, and that the Trustees’ conclusions may be based, in part, on their consideration of these same arrangements during the course of the year and in prior years.
Based on information provided by Broadridge and MFS, the Trustees reviewed the Fund’s total return investment performance as well as the Broadridge performance universe over various time periods. The Trustees placed particular emphasis on the total return performance of the Fund’s Initial Class shares in comparison to the performance of funds in its Broadridge performance universe over the five-year period ended December 31, 2018, which the Trustees believed was a long enough period to reflect differing market conditions. The total return performance of the Fund’s Initial Class shares was in the 3rd quintile relative to the other funds in the universe for this five-year period (the 1st quintile being the best performers and the 5th quintile being the worst performers). The total return performance of the Fund’s Initial Class shares was in the 5th quintile for theone-year period and the 2nd quintile for thethree-year period ended December 31, 2018 relative to the Broadridge performance universe. Because of the passage of time, these performance results may differ from the performance results for more recent periods, including those shown elsewhere in this report.
In the course of their deliberations, the Trustees took into account information provided by MFS in connection with the contract review meetings, as well as during investment review meetings conducted with portfolio management personnel during the course of the year regarding the Fund’s performance. After reviewing these and related factors, the Trustees concluded, within the context of their overall conclusions regarding the investment advisory agreement, that they were satisfied with MFS’ responses and efforts relating to investment performance.
44
MFS Global Tactical Allocation Portfolio
Board Review of Investment Advisory Agreement – continued
In assessing the reasonableness of the Fund’s advisory fee, the Trustees considered, among other information, the Fund’s advisory fee and the total expense ratio of the Fund’s Initial Class shares as a percentage of average daily net assets and the advisory fee and total expense ratios of the Broadridge expense group based on information provided by Broadridge. The Trustees considered that MFS currently observes an expense limitation for the Fund, which may not be changed without the Trustees’ approval. The Trustees also considered that, according to the data provided by Broadridge (which takes into account any fee reductions or expense limitations that were in effect during the Fund’s last fiscal year), the Fund’s effective advisory fee rate was approximately at the Broadridge expense group median and the Fund’s total expense ratio was higher than the Broadridge expense group median.
The Trustees also considered the advisory fees charged by MFS to any institutional separate accounts advised by MFS (“separate accounts”) and unaffiliated investment companies for which MFS serves as subadviser (“subadvised funds”) that have comparable investment strategies to the Fund, if any. In comparing these fees, the Trustees considered information provided by MFS as to the generally broader scope of services provided by MFS to the Fund, as well as the more extensive regulatory burdens imposed on MFS in managing the Fund, in comparison to separate accounts and subadvised funds. The Trustees also considered the higher demands placed on MFS’ investment personnel and trading infrastructure as a result of the daily cashin-flows andout-flows of the Fund in comparison to separate accounts.
The Trustees also considered whether the Fund may benefit from any economies of scale in the management of the Fund in the event of growth in assets of the Fund and/or growth in assets of the MFS Funds as a whole. They noted that the Fund’s advisory fee rate schedule is subject to contractual breakpoints that reduce the Fund’s advisory fee rate on average daily net assets over $300 million and $2.5 billion. The Trustees also noted that MFS has agreed in writing to waive a portion of the management fees of certain MFS Funds, including the Fund, if the total combined assets of certain funds within the MFS Funds’ complex increase above agreed upon thresholds (the “group fee waiver”), enabling the Fund’s shareholders to share in the benefits from any economies of scale at the complex level. The group fee waiver is reviewed and renewed annually between the Board and MFS. The Trustees concluded that the breakpoints and the group fee waiver were sufficient to allow the Fund to benefit from economies of scale as its assets and overall complex assets grow.
The Trustees also considered information prepared by MFS relating to MFS’ costs and profits with respect to the Fund, the MFS Funds considered as a group, and other investment companies and accounts advised by MFS, as well as MFS’ methodologies used to determine and allocate its costs to the MFS Funds, the Fund and other accounts and products for purposes of estimating profitability.
After reviewing these and other factors described herein, the Trustees concluded, within the context of their overall conclusions regarding the investment advisory agreement, that the advisory fees charged to the Fund represent reasonable compensation in light of the services being provided by MFS to the Fund.
In addition, the Trustees considered MFS’ resources and related efforts to continue to retain, attract and motivate capable personnel to serve the Fund. The Trustees also considered current and developing conditions in the financial services industry, including the presence of large and well-capitalized companies which are spending, and appear to be prepared to continue to spend, substantial sums to engage personnel and to provide services to competing investment companies. In this regard, the Trustees also considered the financial resources of MFS and its ultimate parent, Sun Life Financial Inc. The Trustees also considered the advantages and possible disadvantages to the Fund of having an adviser that also serves other investment companies as well as other accounts.
The Trustees also considered the nature, quality, cost, and extent of administrative, transfer agency, and distribution services provided to the Fund by MFS and its affiliates under agreements and plans other than the investment advisory agreement, including any12b-1 fees the Fund pays to MFS Fund Distributors, Inc., an affiliate of MFS. The Trustees also considered the nature, extent and quality of certain other services MFS performs or arranges for on the Fund’s behalf, which may include securities lending programs, directed expense payment programs, class action recovery programs, and MFS’ interaction with third-party service providers, principally custodians andsub-custodians. The Trustees concluded that the variousnon-advisory services provided by MFS and its affiliates on behalf of the Fund were satisfactory.
The Trustees consideredso-called“fall-out benefits” to MFS such as reputational value derived from serving as investment manager to the MFS Funds. The Trustees also considered that, effective January 3, 2018, MFS had discontinued its historic practice of obtaining investment research from portfolio brokerage commissions paid by certain MFS Funds and would thereafter directly pay for or voluntarily reimburse a Fund, if applicable, for the costs of external research acquired through the use of the Fund’s portfolio brokerage commissions.
Based on their evaluation of factors that they deemed to be material, including those factors described above, the Board of Trustees, including the independent Trustees, concluded that the Fund’s investment advisory agreement with MFS should be continued for an additionalone-year period, commencing August 1, 2019.
45
MFS Global Tactical Allocation Portfolio
PROXY VOTING POLICIES AND INFORMATION
MFS votes proxies on behalf of the fund pursuant to proxy voting policies and procedures that are available without charge, upon request, by calling 1-800-225-2606, by visitingmfs.com/proxyvoting, or by visiting the SEC’s Web site athttp://www.sec.gov.
Information regarding how the fund voted proxies relating to portfolio securities during the most recent twelve-month period ended June 30 is available by August 31 of each year without charge by visitingmfs.com/proxyvoting, or by visiting the SEC’s Web site athttp://www.sec.gov.
QUARTERLY PORTFOLIO DISCLOSURE
The fund files a complete schedule of portfolio holdings with the SEC for the first and third quarters of each fiscal year as an exhibit to its reports on Form N-PORT. The fund’s Form N-PORT reports are available on the SEC’s website athttp://www.sec.gov.A shareholder can obtain the portfolio holdings report for the first and third quarters of the fund’s fiscal year atmfs.com/vit2 by choosing the fund’s name and then selecting the “Resources” tab and clicking on “Prospectus and Reports”.
FURTHER INFORMATION
From time to time, MFS may post important information about the fund or the MFS funds on the MFS web site (mfs.com). This information is available athttps://www.mfs.com/en-us/what-we-do/announcements.htmlor atmfs.com/vit2 by choosing the fund’s name.
INFORMATION ABOUT FUND CONTRACTS AND LEGAL CLAIMS
The fund has entered into contractual arrangements with an investment adviser, administrator, distributor, shareholder servicing agent, 529 program manager (if applicable), and custodian who each provide services to the fund. Unless expressly stated otherwise, shareholders are not parties to, or intended beneficiaries of these contractual arrangements, and these contractual arrangements are not intended to create any shareholder right to enforce them against the service providers or to seek any remedy under them against the service providers, either directly or on behalf of the fund.
Under the Trust’s By-Laws and Declaration of Trust, any claims asserted against or on behalf of the MFS Funds, including claims against Trustees and Officers, must be brought in state and federal courts located within the Commonwealth of Massachusetts.
FEDERAL TAX INFORMATION (unaudited)
The following information is provided pursuant to provisions of the Internal Revenue Code.
The fund designates $15,285,000 as capital gain dividends paid during the fiscal year.
For corporate shareholders, 18.04% of the ordinary income dividends paid during the fiscal year qualify for the corporate dividends received deduction.
46
rev. 3/16
| | | | |
| | | |
| FACTS | | WHAT DOES MFS DO WITH YOUR
PERSONAL INFORMATION? | |  |
| | |
| Why? | | Financial companies choose how they share your personal information. Federal law gives consumers the right to limit some but not all sharing. Federal law also requires us to tell you how we collect, share, and protect your personal information. Please read this notice carefully to understand what we do. |
| | |
| What? | | The types of personal information we collect and share depend on the product or service you have with us. This information can include: • Social Security number and account balances • Account transactions and transaction history • Checking account information and wire transfer instructions When you areno longer our customer, we continue to share your information as described in this notice. |
| | |
| How? | | All financial companies need to share customers’ personal information to run their everyday business. In the section below, we list the reasons financial companies can share their customers’ personal information; the reasons MFS chooses to share; and whether you can limit this sharing. |
| | | | |
Reasons we can share your
personal information | | Does MFS share? | | Can you limit this
sharing? |
For our everyday business purposes – such as to process your transactions, maintain your account(s), respond to court orders and legal investigations, or report to credit bureaus | | Yes | | No |
For our marketing purposes – to offer our products and services to you | | No | | We don’t share |
| For joint marketing with other financial companies | | No | | We don’t share |
For our affiliates’ everyday business purposes – information about your transactions and experiences | | No | | We don’t share |
For our affiliates’ everyday business purposes – information about your creditworthiness | | No | | We don’t share |
| For nonaffiliates to market to you | | No | | We don’t share |
| | |
| | |
| Questions? | | Call800-225-2606 or go tomfs.com. |
47
| | |
| Who we are |
| Who is providing this notice? | | MFS Funds, MFS Investment Management, MFS Institutional Advisors, Inc., and MFS Heritage Trust Company. |
| | |
| What we do |
| How does MFS protect my personal information? | | To protect your personal information from unauthorized access and use, we use security measures that comply with federal law. These measures include procedural, electronic, and physical safeguards for the protection of the personal information we collect about you. |
How does MFS
collect my personal information? | | We collect your personal information, for example, when you • open an account or provide account information • direct us to buy securities or direct us to sell your securities • make a wire transfer We also collect your personal information from others, such as credit bureaus, affiliates, or other companies. |
| Why can’t I limit all sharing? | | Federal law gives you the right to limit only • sharing for affiliates’ everyday business purposes – information about your creditworthiness • affiliates from using your information to market to you • sharing for nonaffiliates to market to you State laws and individual companies may give you additional rights to limit sharing. |
| | |
| Definitions |
| Affiliates | | Companies related by common ownership or control. They can be financial and nonfinancial companies. • MFS does not share personal information with affiliates, except for everyday business purposes as described on page one of this notice. |
| Nonaffiliates | | Companies not related by common ownership or control. They can be financial and nonfinancial companies. • MFS does not share with nonaffiliates so they can market to you. |
| Joint marketing | | A formal agreement between nonaffiliated financial companies that together market financial products or services to you. • MFS doesn’t jointly market. |
| | |
| Other important information |
| If you own an MFS product or receive an MFS service in the name of a third party such as a bank or broker-dealer, their privacy policy may apply to you instead of ours. |
48
Annual Report
December 31, 2019

MFS® Government Securities Portfolio

MFS® Variable Insurance Trust II
Beginning on January 1, 2021, as permitted by regulations adopted by the U.S. Securities and Exchange Commission, the insurance company that offers your contract may determine that it will no longer send you paper copies of the fund’s annual and semiannual shareholder reports unless you specifically request paper copies from the insurance company or from your financial intermediary. Instead, the shareholder reports will be made available on a Web site (insurancefunds.mfs.com or other Web site of which you will be notified), and the insurance company will notify you by mail each time a report is posted and provide you with a Web site link to access the report. Instructions for requesting paper copies will be provided by your insurance company or financial intermediary.
If you already elected to receive shareholder reports by email, you will not be affected by this change and you need not take any action. If your insurance company or financial intermediary offers electronic delivery, you may elect to receive shareholder reports and other communications from the insurance company or financial intermediary by email by following the instructions provided by the insurance company or financial intermediary.
Beginning on January 1, 2019, you may elect to receive all future reports in paper free of charge from the insurance company or financial intermediary. You can inform the insurance company or financial intermediary that you wish to continue receiving paper copies of your shareholder reports by contacting your insurance company or financial intermediary. Your election to receive reports in paper will apply to all funds held in your account with your insurance company or financial intermediary.
GSS-ANN
MFS® Government Securities Portfolio
CONTENTS
The report is prepared for the general information of contract owners. It is authorized for distribution to prospective investors only when preceded or accompanied by a current prospectus.
NOT FDIC INSURED• MAY LOSE VALUE• NO BANK OR CREDIT UNION GUARANTEE• NOT A DEPOSIT• NOT INSURED BY ANY FEDERAL GOVERNMENT AGENCY OR NCUA/NCUSIF
MFS Government Securities Portfolio
LETTER FROM THE EXECUTIVE CHAIR

Dear Contract Owners:
Slowing global growth, low inflation, and trade friction between the United States and China have been hallmarks of the past 12 months. After experiencing an uptick in market volatility in late 2018, markets steadied for most of 2019, thanks in large measure to the adoption of a dovish policy stance on the part of global central banks, focused on supporting economic growth. Negotiations aimed at a “phase one” trade deal between the U.S. and China bore fruit at the end of the period, boosting investor sentiment, while signs of stability emerging from the global manufacturing sector also lifted spirits. Uncertainty over Brexit, along with the ripple effects from the trade conflict, hampered business confidence and investment in the United Kingdom and Europe for much of the period, though investors expect greater clarity regarding Brexit as a result of December’s general election. The pro-Brexit Conservative Party won the election by a comfortable margin and set the stage for the U.K.’s departure from the EU at the end of January.
Markets expect the longest economic expansion in U.S. history will continue, albeit at a slower pace, as trade tensions recede. In an effort to prolong the expansion, the U.S. Federal Reserve lowered interest rates three times between July and October and the European Central Bank loosened policy in September. While the global monetary policy backdrop remains quite accommodative, signs of easing trade tensions and fading global recession fears led to improved market sentiment in late 2019 as investors grew less risk averse. In early 2020, an outbreak of coronavirus emanating from China reintroduced global growth fears, causing an uptick in volatility.
Here at MFS®, we aim to help our clients navigate the growing complexity of the markets and world economies. Our long-term investment philosophy and commitment to the responsible allocation of capital allow us to tune out the noise and uncover what we believe are the best, most durable investment opportunities in the market. Through our powerful global investment platform, we combine collective expertise, thoughtful risk management and long-term discipline to create sustainable value for investors.
Respectfully,

Robert J. Manning
Executive Chair
MFS Investment Management
February 14, 2020
The opinions expressed in this letter are subject to change and may not be relied upon for investment advice. No forecasts can be guaranteed.
1
MFS Government SecuritiesPortfolio
PORTFOLIO COMPOSITION
Portfolio structure (i)
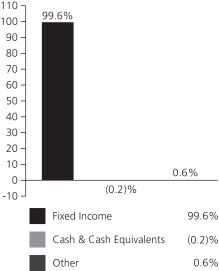
| | | | |
| Fixed income sectors (i) | | | | |
| Mortgage-Backed Securities | | | 57.5% | |
| U.S. Treasury Securities | | | 23.1% | |
| U.S. Government Agencies | | | 8.7% | |
| Commercial Mortgage-Backed Securities | | | 3.2% | |
| Investment Grade Corporates | | | 2.4% | |
| Collateralized Debt Obligations | | | 1.9% | |
| Municipal Bonds | | | 1.7% | |
| Asset-Backed Securities | | | 0.8% | |
| Non-U.S. Government Bonds | | | 0.3% | |
| | | | |
| Composition including fixed income credit quality (a)(i) | |
| AAA | | | 5.2% | |
| AA | | | 1.6% | |
| A | | | 2.3% | |
| BBB | | | 1.2% | |
| U.S. Government | | | 23.7% | |
| Federal Agencies | | | 66.2% | |
| Not Rated | | | (0.6)% | |
| Cash & Cash Equivalents | | | (0.2)% | |
| Other | | | 0.6% | |
| |
| Portfolio facts (i) | | | | |
| Average Duration (d) | | | 5.1 | |
| Average Effective Maturity (m) | | | 7.0 yrs. | |
| (a) | | For all securities other than those specifically described below, ratings are assigned to underlying securities utilizing ratings from Moody’s, Fitch, and Standard & Poor’s rating agencies and applying the following hierarchy: If all three agencies provide a rating, the middle rating (after dropping the highest and lowest ratings) is assigned; if two of the three agencies rate a security, the lower of the two is assigned. Ratings are shown in the S&P and Fitch scale (e.g., AAA). Securities rated BBB or higher are considered investment grade. All ratings are subject to change. U.S. Government includes securities issued by the U.S. Department of the Treasury. Federal Agencies includes rated and unrated U.S. Agency fixed-income securities, U.S. Agency mortgage-backed securities, and collateralized mortgage obligations of U.S. Agency mortgage-backed securities. Not Rated includes fixed income securities and fixed income derivatives, which have not been rated by any rating agency. The fund may or may not have held all of these instruments on this date. The fund is not rated by these agencies. |
| (d) | | Duration is a measure of how much a bond’s price is likely to fluctuate with general changes in interest rates, e.g., if rates rise 1.00%, a bond with a5-year duration is likely to lose about 5.00% of its value due to the interest rate move. |
| (i) | | For purposes of this presentation, the components include the value of securities, and reflect the impact of the equivalent exposure of derivative positions, if any. These amounts may be negative from time to time. Equivalent exposure is a calculated amount that translates the derivative position into a reasonable approximation of the amount of the underlying asset that the portfolio would have to hold at a given point in time to have the same price sensitivity that results from the portfolio’s ownership of the derivative contract. When dealing with derivatives, equivalent exposure is a more representative measure of the potential impact of a position on portfolio performance than value. The bond component will include any accrued interest amounts. |
| (m) | | In determining each instrument’s effective maturity for purposes of calculating the fund’s dollar-weighted average effective maturity, MFS uses the instrument’s stated maturity or, if applicable, an earlier date on which MFS believes it is probable that a maturity-shortening device (such as a put,pre-refunding or prepayment) will cause the instrument to be repaid. Such an earlier date can be substantially shorter than the instrument’s stated maturity. |
| Where | | the fund holds convertible bonds, they are treated as part of the equity portion of the portfolio. |
Cash & Cash Equivalents includes any cash, investments in money market funds, short-term securities, and other assets less liabilities. Please see the Statement of Assets and Liabilities for additional information related to the fund’s cash position and other assets and liabilities.
From time to time Cash & Cash Equivalents may be negative due to timing of cash receipts and disbursements.
Other includes equivalent exposure from currency derivatives and/or any offsets to derivative positions.
Percentages are based on net assets as of December 31, 2019.
The portfolio is actively managed and current holdings may be different.
2
MFS Government SecuritiesPortfolio
MANAGEMENT REVIEW
Summary of Results
For the twelve months ended December 31, 2019, Initial Class shares of the MFS Government Securities Portfolio (fund) provided a total return of 6.53%, while Service Class shares of the fund provided a total return of 6.35%. These compare with a return of 6.63% over the same period for the fund’s benchmark, the Bloomberg Barclays U.S. Government/Mortgage Bond Index.
Market Environment
Fading fears of a near-term global recession, the announcement of a partial trade deal between the United States and China and the decline in uncertainty over Brexit helped bolster market sentiment late in the period. Changes in market sentiment, largely driven by uncertainty over the outcome of trade negotiations between the US and China, had contributed to periodic bouts of volatility during the reporting period. The global economy decelerated, led by weakness in China and Europe, although the pace of the slowdown moderated late in the period amid nascent signs of stabilization in the manufacturing sector.
The deteriorating global growth backdrop, along with declining inflationary pressures, prompted the US Federal Reserve to adopt a more dovish posture beginning in early 2019, resulting in the first interest rate cut in over a decade at the end of July, followed by additional cuts in September and October. The Fed’s actions led to a sharp decline in long-term interest rates during the period’s second half, causing the inversion of portions of the US Treasury yield curve for a time. Amid an improvement in risk sentiment in Q4 2019 and indications of a bottoming in growth and a potential upturn in activity, the Fed indicated in October that further rate cuts were unlikely unless the outlook for the economy materially worsened.
Globally, central banks have tilted more dovish as well, with the European Central Bank unveiling a package of easing measures, which included putting overnight rates deeper into negative territory, restarting its bond-buying program and lengthening the term of cheap loans to banks to three years from two. The central banks of India and Australia are among those that have cut rates several times in recent months, although China has been more cautious in increasing liquidity as it keeps trying to deleverage its economy, cutting rates only marginally.
Emerging markets experienced considerable volatility through the end of 2018, as tighter global financial conditions exposed structural weakness in some countries. Those conditions improved in 2019 as the Fed became more dovish. Notwithstanding the periodic headwinds on market sentiment from significant trade friction between the US and China over much of the year, emerging market hard currency debt and local rates benefited from relatively cheap valuations at the beginning of the period and easier global monetary conditions. These factors, plus the fading of certain global risk factors mentioned above, hastened spread tightening in the latter part of the period. At the same time, idiosyncratic risks spiked in some countries (e.g., Argentina and Lebanon), contributing to increased dispersion in performance among sovereign assets.
Factors Affecting Performance
Relative to the Bloomberg Barclays U.S. Government/Mortgage Bond Index, the fund’s security selection within both thetreasuryandgovernment-related agencies sectors detracted from performance. The fund’sout-of-benchmark exposure to both thecollateralized mortgage obligation (CMO)andasset-backed security (ABS) sectors also weakened relative returns.
On the positive side, the fund’sout-of-benchmark exposure to both thecommercial mortgage-backed securities (CMBS) andindustrialssectors, and its lesser relative exposure to the treasury sector, contributed to relative performance. Additionally, security selection within themortgage-backed securities (MBS) sector further benefited relative results.
Respectfully,
Portfolio Manager(s)
Geoffrey Schechter and Jake Stone
The views expressed in this report are those of the portfolio manager(s) only through the end of the period of the report as stated on the cover and do not necessarily reflect the views of MFS or any other person in the MFS organization. These views are subject to change at any time based on market or other conditions, and MFS disclaims any responsibility to update such views. These views may not be relied upon as investment advice or an indication of trading intent on behalf of any MFS portfolio. References to specific securities are not recommendations of such securities, and may not be representative of any MFS portfolio’s current or future investments.
3
MFS Government SecuritiesPortfolio
PERFORMANCE SUMMARY THROUGH 12/31/19
The following chart illustrates the historical performance of the fund in comparison to its benchmark(s). Benchmarks are unmanaged and may not be invested in directly. Benchmark returns do not reflect any fees or expenses. The performance of other share classes will be greater than or less than that of the class depicted below. (See Notes to Performance Summary.)
Performance data shown represents past performance and is no guarantee of future results. Investment return and principal value fluctuate so your units, when sold, may be worth more or less than the original cost; current performance may be lower or higher than quoted. The performance shown does not reflect the deduction of taxes, if any, that a contract holder would pay on fund distributions or the redemption of contract units. The returns for the fund shown also do not reflect the deduction of expenses associated with variable products, such as mortality and expense risk charges, separate account charges, and sales charges imposed by the insurance company separate accounts. Such expenses would reduce the overall returns shown.
Growth of a Hypothetical $10,000 Investment
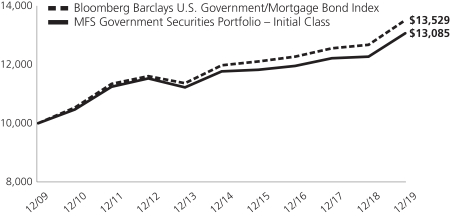
Total Returns through 12/31/19
Average annual total returns
| | | | | | | | | | | | |
| | | Share Class | | Class Inception Date | | 1-yr | | 5-yr | | 10-yr | | |
| | | Initial Class | | 6/12/85 | | 6.53% | | 2.12% | | 2.73% | | |
| | | Service Class | | 8/24/01 | | 6.35% | | 1.87% | | 2.47% | | |
| | | | |
| Comparative benchmark(s) | | | | | | | | |
| | | Bloomberg Barclays U.S. Government/Mortgage Bond Index (f) | | 6.63% | | 2.45% | | 3.07% | | |
| (f) | Source: FactSet Research Systems Inc. |
Benchmark Definition(s)
Bloomberg Barclays U.S. Government/Mortgage Bond Index – measures debt issued by the U.S. Government, and its agencies, as well as mortgage-backed pass-through securities of Ginnie Mae (GNMA), Fannie Mae (FNMA), and Freddie Mac (FHLMC). BLOOMBERG® is a trademark and service mark of Bloomberg Finance L.P. and its affiliates (collectively “Bloomberg”). BARCLAYS® is a trademark and service mark of Barclays Bank Plc (collectively with its affiliates, “Barclays”), used under license. Bloomberg or Bloomberg’s licensors, including Barclays, own all proprietary rights in the Bloomberg Barclays Indices. Neither Bloomberg nor Barclays approves or endorses this material, or guarantees the accuracy or completeness of any information herein, or makes any warranty, express or implied, as to the results to be obtained therefrom, and, to the maximum extent allowed by law, neither shall have any liability or responsibility for injury or damages arising in connection therewith.
It is not possible to invest directly in an index.
Notes to Performance Summary
Average annual total return represents the average annual change in value for each share class for the periods presented.
Performance results reflect any applicable expense subsidies and waivers in effect during the periods shown. Without such subsidies and waivers the fund’s performance results would be less favorable. Please see the prospectus and financial statements for complete details. All results are historical and assume the reinvestment of any dividends and capital gains distributions.
4
MFS Government SecuritiesPortfolio
Performance Summary – continued
Performance results do not include adjustments made for financial reporting purposes in accordance with U.S. generally accepted accounting principles and may differ from amounts reported in the financial highlights.
From time to time the fund may receive proceeds from litigation settlements, without which performance would be lower.
5
MFS Government SecuritiesPortfolio
EXPENSE TABLE
Fund Expenses Borne by the Contract Holders during the Period,
July 1, 2019 through December 31, 2019
As a contract holder of the fund, you incur ongoing costs, including management fees; distribution and/or service(12b-1) fees; and other fund expenses. This example is intended to help you understand your ongoing costs (in dollars) of investing in the fund and to compare these costs with the ongoing costs of investing in other mutual funds.
The example is based on an investment of $1,000 invested at the beginning of the period and held for the entire period July 1, 2019 through December 31, 2019.
Actual Expenses
The first line for each share class in the following table provides information about actual account values and actual expenses. You may use the information in this line, together with the amount you invested, to estimate the expenses that you paid over the period. Simply divide your account value by $1,000 (for example, an $8,600 account value divided by $1,000 = 8.6), then multiply the result by the number in the first line under the heading entitled “Expenses Paid During Period” to estimate the expenses you paid on your account during this period.
Hypothetical Example for Comparison Purposes
The second line for each share class in the following table provides information about hypothetical account values and hypothetical expenses based on the fund’s actual expense ratio and an assumed rate of return of 5% per year before expenses, which is not the fund’s actual return. The hypothetical account values and expenses may not be used to estimate the actual ending account balance or expenses you paid for the period. You may use this information to compare the ongoing costs of investing in the fund and other funds. To do so, compare this 5% hypothetical example with the 5% hypothetical examples that appear in the shareholder reports of the other funds.
Please note that the expenses shown in the table are meant to highlight the fund’s ongoing costs only and do not take into account the fees and expenses imposed under the variable contracts through which your investment in the fund is made. Therefore, the second line for each share class in the table is useful in comparing ongoing costs associated with an investment in vehicles (such as the fund) which fund benefits under variable annuity and variable life insurance contracts and to qualified pension and retirement plans only, and will not help you determine the relative total costs of investing in the fund through variable annuity and variable life insurance contracts. If the fees and expenses imposed under the variable contracts were included, your costs would have been higher.
| | | | | | | | | | | | | | | | | | |
| Share Class | | | | Annualized
Expense Ratio | | | Beginning
Account Value
7/01/19 | | | Ending Account Value
12/31/19 | | | Expenses Paid
During Period (p)
7/01/19-12/31/19 | |
| Initial Class | | Actual | | | 0.58% | | | | $1,000.00 | | | | $1,015.51 | | | | $2.95 | |
| | Hypothetical (h) | | | 0.58% | | | | $1,000.00 | | | | $1,022.28 | | | | $2.96 | |
| Service Class | | Actual | | | 0.83% | | | | $1,000.00 | | | | $1,014.30 | | | | $4.21 | |
| | Hypothetical (h) | | | 0.83% | | | | $1,000.00 | | | | $1,021.02 | | | | $4.23 | |
| (h) | 5% class return per year before expenses. |
| (p) | “Expenses Paid During Period” are equal to each class’s annualized expense ratio, as shown above, multiplied by the average account value over the period, multiplied by 184/365 (to reflect theone-half year period). |
6
MFS Government Securities Portfolio
PORTFOLIO OF INVESTMENTS – 12/31/19
The Portfolio of Investments is a complete list of all securities owned by your fund. It is categorized by broad-based asset classes.
| | | | | | | | |
| | |
| Issuer | | Shares/Par | | | Value ($) | |
| BONDS – 99.7% | | | | | | | | |
| Asset-Backed & Securitized – 5.9% | | | | | |
| ALM Loan Funding, CLO,2015-12A, “A1R2”, FLR, 2.89% (LIBOR - 3mo. + 0.89%), 4/16/2027 (n) | | $ | 862,321 | | | $ | 861,996 | |
| Cantor Commercial Real Estate,2019-CF3, “A4”, 3.005%, 1/15/2053 | | | 1,120,000 | | | | 1,147,173 | |
| Chesapeake Funding II LLC,2018-1A, “A1”, 3.04%, 4/15/2030 (n) | | | 746,062 | | | | 754,413 | |
| Chesapeake Funding II LLC,2018-3A, “A1”, 3.39%, 1/15/2031 (n) | | | 1,425,949 | | | | 1,449,452 | |
| Citigroup Commercial Mortgage Trust,2019-C7, “A4”, 3.102%, 12/15/2072 | | | 403,746 | | | | 417,126 | |
| Citigroup Commercial Mortgage Trust,2019-XA, “C7”, 1.009%, 12/15/2072 (i)(n) | | | 3,240,000 | | | | 227,112 | |
| Commercial Mortgage Pass-Through Certificates, 2019-BN24, “A3”, 2.96%, 11/15/2062 | | | 868,184 | | | | 889,317 | |
| Commercial Mortgage Trust,2015-DC1, “A5”, 3.35%, 2/10/2048 | | | 1,536,000 | | | | 1,598,946 | |
| Commercial Mortgage Trust, 2017-COR2, “A3”, 3.51%, 9/10/2050 | | | 1,414,455 | | | | 1,497,537 | |
| CSAIL Commercial Mortgage Trust,2015-C2, “A4”, 3.504%, 6/15/2057 | | | 144,366 | | | | 150,865 | |
| DLL Securitization Trust,2019-DA1, “A2”, 2.79%, 11/22/2021 (n) | | | 1,421,313 | | | | 1,425,778 | |
| Dryden Senior Loan Fund,2018-55A, “A1”, CLO, FLR, 3.02% (LIBOR - 3mo. + 1.02%), 4/15/2031 (n) | | | 1,537,212 | | | | 1,526,470 | |
| GS Mortgage Securities Trust, 2015-GC30, “A4”, 3.382%, 5/10/2050 | | | 1,965,000 | | | | 2,055,312 | |
| GS Mortgage Securities Trust, 2015-GC32, “A2”, 3.062%, 7/10/2048 | | | 1,180,000 | | | | 1,181,835 | |
| Loomis, Sayles & Co., CLO, “A2”, FLR, 3.4% (LIBOR - 3mo. + 1.4%), 4/15/2028 (n) | | | 1,489,774 | | | | 1,479,784 | |
| Madison Park Funding Ltd.,2014-13A, “BR2”, FLR, 3.465% (LIBOR - 3mo. + 1.5%), 4/19/2030 (n) | | | 1,572,067 | | | | 1,555,944 | |
| Morgan Stanley Bank of America Merrill Lynch Trust,2017-C34, “A4”, 3.536%, 11/15/2052 | | | 415,862 | | | | 442,769 | |
| Morgan Stanley Capital I Trust,2018-H4, “XA”, 0.864%, 12/15/2051 (i) | | | 6,251,230 | | | | 393,465 | |
| Neuberger Berman CLO Ltd., FLR, 2.8% (LIBOR - 3mo. + 0.8%), 1/15/2028 (n) | | | 540,000 | | | | 539,630 | |
| Symphony CLO Ltd.,2016-17A, “BR”, FLR, 3.2% (LIBOR - 3mo. + 1.2%), 4/15/2028 (n) | | | 1,332,260 | | | | 1,334,376 | |
| TICP CLO Ltd.,2018-13R, “A”, FLR, 2.805% (LIBOR - 3mo. + 0.8%), 4/20/2028 (n) | | | 1,261,352 | | | | 1,254,980 | |
| UBS Commercial Mortgage Trust,2017-C1, “A4”, 3.544%, 11/15/2050 | | | 1,521,000 | | | | 1,617,135 | |
| | | | | | | | |
| | |
Issuer | | Shares/Par | | | Value ($) | |
| BONDS – continued | | | | | | | | |
| Asset-Backed & Securitized – continued | | | | | |
| Wells Fargo Commercial Mortgage Trust,2015-C28, “A4”, 3.54%, 5/15/2048 | | $ | 1,937,516 | | | $ | 2,044,562 | |
| Wells Fargo Commercial Mortgage Trust, 2015-NXS1, “A5”, 3.148%, 5/15/2048 | | | 918,829 | | | | 951,927 | |
| Wells Fargo Commercial Mortgage Trust,2018-C48, “XA”, 0.953%, 1/15/2052 (i)(n) | | | 3,735,305 | | | | 260,577 | |
| | | | | | | | |
| | | | | | $ | 27,058,481 | |
| | | | | | | | |
| Automotive – 0.2% | | | | | | | | |
| Volkswagen Group of America Co., 2.7%, 9/26/2022 (n) | | $ | 801,000 | | | $ | 809,724 | |
| | | | | | | | |
| Chemicals – 0.2% | | | | | |
| Sherwin Williams Co., 2.75%, 6/01/2022 | | $ | 753,000 | | | $ | 765,833 | |
| | | | | | | | |
| Consumer Products – 0.3% | | | | | |
| Reckitt Benckiser Treasury Services PLC, 2.75%, 6/26/2024 (n) | | $ | 1,311,000 | | | $ | 1,336,056 | |
| | | | | | | | |
| Consumer Services – 0.1% | | | | | |
| Conservation Fund, 3.474%, 12/15/2029 | | $ | 563,000 | | | $ | 560,476 | |
| | | | | | | | |
| Major Banks – 0.1% | | | | | |
| UBS Group Funding (Switzerland) AG, 3.491%, 5/23/2023 (n) | | $ | 565,000 | | | $ | 581,195 | |
| | | | | | | | |
| Medical & Health Technology & Services – 0.7% | | | | | |
| CommonSpirit Health, 2.76%, 10/01/2024 | | $ | 898,000 | | | $ | 905,521 | |
| Montefiore Obligated Group, 5.246%, 11/01/2048 | | | 2,012,000 | | | | 2,327,158 | |
| | | | | | | | |
| | | | | | $ | 3,232,679 | |
| | | | | | | | |
| Mortgage-Backed – 57.3% | | | | | | | | |
| Fannie Mae, 4.5%, 7/01/2020 - 6/01/2044 | | $ | 13,170,331 | | | $ | 14,274,864 | |
| Fannie Mae, 4.14%, 8/01/2020 | | | 402,365 | | | | 402,973 | |
| Fannie Mae, 5%, 12/01/2020 - 3/01/2041 | | | 4,321,751 | | | | 4,747,001 | |
| Fannie Mae, 6%, 2/01/2021 - 7/01/2037 | | | 729,061 | | | | 823,861 | |
| Fannie Mae, 2.56%, 10/01/2021 | | | 222,141 | | | | 223,690 | |
| Fannie Mae, 2.67%, 3/01/2022 | | | 424,555 | | | | 430,197 | |
| Fannie Mae, 5.5%, 5/01/2022 - 3/01/2038 | | | 6,732,498 | | | | 7,553,053 | |
| Fannie Mae, 2.152%, 1/25/2023 | | | 1,457,768 | | | | 1,458,275 | |
| Fannie Mae, 2.73%, 4/01/2023 | | | 481,123 | | | | 490,188 | |
| Fannie Mae, 2.41%, 5/01/2023 | | | 607,227 | | | | 612,874 | |
| Fannie Mae, 2.55%, 5/01/2023 | | | 522,194 | | | | 529,318 | |
| Fannie Mae, 2.59%, 5/01/2023 | | | 333,433 | | | | 338,406 | |
| Fannie Mae, 3.5%, 5/25/2025 - 1/01/2047 | | | 22,938,736 | | | | 23,975,921 | |
| Fannie Mae, 2.28%, 11/01/2026 | | | 256,929 | | | | 256,096 | |
| Fannie Mae, 2.672%, 12/25/2026 | | | 1,032,000 | | | | 1,049,841 | |
| Fannie Mae, 3.146%, 3/25/2028 | | | 1,276,000 | | | | 1,333,988 | |
| Fannie Mae, 4%, 3/25/2028 - 2/01/2045 | | | 27,341,773 | | | | 29,251,544 | |
| Fannie Mae, 3%, 11/01/2028 - 5/25/2053 | | | 17,979,935 | | | | 18,469,289 | |
| Fannie Mae, 6.5%, 9/01/2031 - 10/01/2037 | | | 644,815 | | | | 723,690 | |
| Fannie Mae, 3.5%, 12/25/2031 (i) | | | 113,624 | | | | 10,604 | |
| Fannie Mae, 3%, 2/25/2033 (i) | | | 627,170 | | | | 73,976 | |
| Fannie Mae, 2%, 10/25/2040 - 4/25/2046 | | | 1,588,326 | | | | 1,575,138 | |
| Fannie Mae, 1.75%, 10/25/2041 | | | 1,870,921 | | | | 1,844,131 | |
7
MFS Government Securities Portfolio
Portfolio of Investments – continued
| | | | | | | | |
| | |
| Issuer | | Shares/Par | | | Value ($) | |
| BONDS – continued | | | | | | | | |
| Mortgage-Backed – continued | | | | | |
| Fannie Mae, TBA,2.5%, 1/16/2035 - 2/18/2035 | | $ | 2,200,000 | | | $ | 2,218,389 | |
| Fannie Mae, TBA,3%, 1/16/2035 - 1/25/2050 | | | 7,495,279 | | | | 7,632,643 | |
| Fannie Mae, TBA, 3.5%, 1/16/2035 | | | 3,075,000 | | | | 3,186,845 | |
| Freddie Mac, 4.251%, 1/25/2020 | | | 91,157 | | | | 91,002 | |
| Freddie Mac, 2.313%, 3/25/2020 | | | 617,698 | | | | 616,913 | |
| Freddie Mac, 4.224%, 3/25/2020 | | | 1,100,490 | | | | 1,100,067 | |
| Freddie Mac, 5%, 4/01/2020 - 6/01/2040 | | | 1,114,539 | | | | 1,223,486 | |
| Freddie Mac, 3.808%, 8/25/2020 | | | 966,974 | | | | 971,929 | |
| Freddie Mac, 3.034%, 10/25/2020 | | | 1,289,289 | | | | 1,294,741 | |
| Freddie Mac, 6%, 5/01/2021 - 10/01/2038 | | | 2,037,133 | | | | 2,289,765 | |
| Freddie Mac, 5.5%, 5/01/2022 - 6/01/2041 | | | 1,503,692 | | | | 1,688,581 | |
| Freddie Mac,4.5%, 11/01/2022 - 5/01/2042 | | | 2,309,087 | | | | 2,500,025 | |
| Freddie Mac, 2.51%, 11/25/2022 | | | 2,326,000 | | | | 2,357,137 | |
| Freddie Mac, 3.32%, 2/25/2023 | | | 1,993,000 | | | | 2,066,314 | |
| Freddie Mac, 3.25%, 4/25/2023 | | | 3,500,000 | | | | 3,623,009 | |
| Freddie Mac, 3.3%, 4/25/2023 | | | 1,997,044 | | | | 2,074,116 | |
| Freddie Mac, 3.06%, 7/25/2023 | | | 1,286,000 | | | | 1,327,795 | |
| Freddie Mac, 0.879%, 4/25/2024 (i) | | | 16,492,239 | | | | 496,621 | |
| Freddie Mac, 0.606%, 7/25/2024 (i) | | | 17,521,347 | | | | 418,662 | |
| Freddie Mac, 3.064%, 8/25/2024 | | | 1,703,107 | | | | 1,766,339 | |
| Freddie Mac, 2.67%, 12/25/2024 | | | 3,924,000 | | | | 4,018,562 | |
| Freddie Mac, 2.811%, 1/25/2025 | | | 3,025,000 | | | | 3,115,027 | |
| Freddie Mac, 3.329%, 5/25/2025 | | | 3,082,000 | | | | 3,255,135 | |
| Freddie Mac, 4%, 7/01/2025 - 4/01/2044 | | | 2,124,317 | | | | 2,250,087 | |
| Freddie Mac, 3.01%, 7/25/2025 | | | 904,000 | | | | 940,988 | |
| Freddie Mac,3.5%, 1/15/2027 - 10/25/2058 | | | 30,393,494 | | | | 31,828,939 | |
| Freddie Mac, 0.577%, 7/25/2027 (i) | | | 29,938,883 | | | | 1,165,979 | |
| Freddie Mac, 0.434%, 8/25/2027 (i) | | | 25,010,961 | | | | 736,845 | |
| Freddie Mac, 3.187%, 9/25/2027 | | | 3,000,000 | | | | 3,168,233 | |
| Freddie Mac, 0.29%, 1/25/2028 (i) | | | 42,752,096 | | | | 990,788 | |
| Freddie Mac, 0.302%, 1/25/2028 (i) | | | 17,605,160 | | | | 417,728 | |
| Freddie Mac, 0.134%, 2/25/2028 (i) | | | 49,831,305 | | | | 607,568 | |
| Freddie Mac,2.5%, 3/15/2028 - 11/01/2031 | | | 415,005 | | | | 420,671 | |
| Freddie Mac, 0.119%, 4/25/2028 (i) | | | 32,018,317 | | | | 365,223 | |
| Freddie Mac, 3%, 6/15/2028 - 2/25/2059 | | | 22,054,670 | | | | 22,670,266 | |
| Freddie Mac, 3.926%, 7/25/2028 | | | 1,854,000 | | | | 2,052,921 | |
| Freddie Mac, 4.06%, 10/25/2028 | | | 1,788,000 | | | | 1,998,032 | |
| Freddie Mac, 1.089%, 7/25/2029 (i) | | | 4,436,228 | | | | 394,985 | |
| Freddie Mac, 1.27%, 8/25/2029 (i) | | | 7,726,925 | | | | 716,145 | |
| Freddie Mac, 0.756%, 11/25/2029 (i) | | | 17,080,000 | | | | 929,427 | |
| Freddie Mac, 6.5%, 8/01/2032 - 5/01/2037 | | | 390,098 | | | | 439,391 | |
| Freddie Mac, 5.5%, 2/15/2036 (i) | | | 165,404 | | | | 32,412 | |
| Freddie Mac, 4.5%, 12/15/2040 (i) | | | 84,339 | | | | 7,943 | |
| Ginnie Mae, 2.5%, 7/20/2032 - 6/20/2042 | | | 620,000 | | | | 611,430 | |
| Ginnie Mae, 5.5%, 7/15/2033 - 1/20/2042 | | | 1,362,412 | | | | 1,524,040 | |
| Ginnie Mae, 4%, 5/16/2039 - 10/20/2049 | | | 4,763,093 | | | | 4,977,549 | |
| Ginnie Mae, 4.5%, 8/15/2039 - 9/20/2041 | | | 3,665,969 | | | | 3,994,719 | |
| Ginnie Mae, 3.5%, 10/20/2041 (i) | | | 288,460 | | | | 29,401 | |
| Ginnie Mae, 3.5%, 12/15/2041 - 6/20/2043 | | | 4,625,125 | | | | 4,878,490 | |
| Ginnie Mae, 4%, 8/16/2042 (i) | | | 308,519 | | | | 50,165 | |
| | | | | | | | |
| | |
| Issuer | | Shares/Par | | | Value ($) | |
| BONDS – continued | | | | | | | | |
| Mortgage-Backed – continued | | | | | |
| Ginnie Mae, 3%, 4/20/2045 - 2/20/2048 | | $ | 9,440,036 | | | $ | 9,724,394 | |
| Ginnie Mae, 5.87%, 4/20/2058 | | | 17,709 | | | | 19,935 | |
| Ginnie Mae, 0.66%, 2/16/2059 (i) | | | 2,204,114 | | | | 124,803 | |
| Ginnie Mae, TBA, 4%, 1/15/2050 | | | 1,475,000 | | | | 1,526,592 | |
| Ginnie Mae, TBA,3%, 1/21/2050 - 3/23/2050 | | | 3,450,000 | | | | 3,539,656 | |
| Ginnie Mae, TBA, 3.5%, 1/21/2050 | | | 2,250,000 | | | | 2,318,482 | |
| | | | | | | | |
| | | | | | $ | 265,236,248 | |
| | | | | | | | |
| Municipals – 1.6% | | | | | |
| Michigan Finance Authority Hospital Rev. (Trinity Health Credit Group), 3.384%, 12/01/2040 | | $ | 825,000 | | | $ | 823,152 | |
| New Jersey Economic Development Authority State Pension Funding Rev., Capital Appreciation, “B”, 0%, 2/15/2023 | | | 4,114,000 | | | | 3,813,637 | |
| Philadelphia, PA, School District, “A”, 5.995%, 9/01/2030 | | | 960,000 | | | | 1,201,277 | |
| University of California Rev. (Build America Bonds), 5.77%, 5/15/2043 | | | 1,345,000 | | | | 1,782,555 | |
| | | | | | | | |
| | | | | | $ | 7,620,621 | |
| | | | | | | | |
| Other Banks & Diversified Financials – 0.2% | | | | | |
| ING Groep N.V., 3.15%, 3/29/2022 | | $ | 800,000 | | | $ | 817,822 | |
| | | | | | | | |
| Supranational – 0.3% | | | | | |
| Inter-American Development Bank, 4.375%, 1/24/2044 | | $ | 1,093,000 | | | $ | 1,437,743 | |
| | | | | | | | |
| Tobacco – 0.3% | | | | | |
| B.A.T Capital Corp., 2.764%, 8/15/2022 | | $ | 1,283,000 | | | $ | 1,301,272 | |
| | | | | | | | |
| U.S. Government Agencies and Equivalents – 8.7% | |
| AID-Tunisia, 2.452%, 7/24/2021 | | $ | 1,444,000 | | | $ | 1,441,080 | |
| AID-Ukraine, 1.847%, 5/29/2020 | | | 1,135,000 | | | | 1,136,135 | |
| Federal Home Loan Bank, 2.375%, 3/30/2020 | | | 5,500,000 | | | | 5,510,488 | |
| Federal Home Loan Bank, 2.625%, 12/10/2021 | | | 4,800,000 | | | | 4,889,155 | |
| Federal Home Loan Bank, 3%, 12/10/2021 | | | 20,500,000 | | | | 21,038,220 | |
| Private Export Funding Corp., 2.25%, 3/15/2020 | | | 594,000 | | | | 594,614 | |
| Private Export Funding Corp., 2.3%, 9/15/2020 | | | 770,000 | | | | 773,620 | |
| Small Business Administration, 6.35%, 4/01/2021 | | | 17,581 | | | | 17,807 | |
| Small Business Administration, 6.34%, 5/01/2021 | | | 26,704 | | | | 27,163 | |
| Small Business Administration, 6.44%, 6/01/2021 | | | 37,850 | | | | 38,705 | |
| Small Business Administration, 6.625%, 7/01/2021 | | | 60,426 | | | | 61,262 | |
| Small Business Administration, 6.07%, 3/01/2022 | | | 43,510 | | | | 44,301 | |
| Small Business Administration, 4.98%, 11/01/2023 | | | 73,240 | | | | 76,448 | |
| Small Business Administration, 4.77%, 4/01/2024 | | | 179,188 | | | | 185,550 | |
8
MFS Government Securities Portfolio
Portfolio of Investments – continued
| | | | | | | | |
| | |
| Issuer | | Shares/Par | | | Value ($) | |
| BONDS – continued | | | | | | | | |
| U.S. Government Agencies and Equivalents – continued | |
| Small Business Administration, 5.52%, 6/01/2024 | | $ | 75,001 | | | $ | 78,877 | |
| Small Business Administration, 4.99%, 9/01/2024 | | | 14,993 | | | | 15,567 | |
| Small Business Administration, 5.11%, 4/01/2025 | | | 117,680 | | | | 122,832 | |
| Small Business Administration, 2.21%, 2/01/2033 | | | 728,729 | | | | 721,189 | |
| Small Business Administration, 2.22%, 3/01/2033 | | | 1,209,888 | | | | 1,198,555 | |
| Small Business Administration, 3.15%, 7/01/2033 | | | 1,197,166 | | | | 1,228,565 | |
| Small Business Administration, 3.16%, 8/01/2033 | | | 622,375 | | | | 639,044 | |
| Small Business Administration, 3.62%, 9/01/2033 | | | 414,579 | | | | 434,216 | |
| | | | | | | | |
| | | | | | $ | 40,273,393 | |
| | | | | | | | |
| U.S. Treasury Obligations ��� 23.5% | | | | | |
| U.S. Treasury Bonds, 7.875%, 2/15/2021 | | $ | 177,000 | | | $ | 189,058 | |
| U.S. Treasury Bonds, 6.25%, 8/15/2023 | | | 2,891,000 | | | | 3,356,404 | |
| U.S. Treasury Bonds, 6%, 2/15/2026 | | | 2,699,000 | | | | 3,357,507 | |
| U.S. Treasury Bonds, 6.75%, 8/15/2026 | | | 1,862,000 | | | | 2,436,506 | |
| U.S. Treasury Bonds, 6.375%, 8/15/2027 | | | 326,000 | | | | 430,954 | |
| U.S. Treasury Bonds, 4.5%, 8/15/2039 | | | 1,287,500 | | | | 1,745,336 | |
| U.S. Treasury Bonds, 3.125%, 2/15/2043 | | | 8,176,700 | | | | 9,261,951 | |
| U.S. Treasury Bonds, 2.875%, 5/15/2043 | | | 13,519,500 | | | | 14,710,579 | |
| | | | | | | | |
| | |
Issuer | | Shares/Par | | | Value ($) | |
| BONDS – continued | | | | | | | | |
| U.S. Treasury Obligations – continued | |
| U.S. Treasury Bonds, 2.5%, 2/15/2045 | | $ | 21,059,000 | | | $ | 21,460,149 | |
| U.S. Treasury Bonds, 2.875%, 11/15/2046 | | | 2,917,000 | | | | 3,195,865 | |
| U.S. Treasury Notes, 2.375%, 3/15/2021 | | | 3,744,000 | | | | 3,776,146 | |
| U.S. Treasury Notes, 1.75%, 5/15/2022 | | | 6,594,000 | | | | 6,615,505 | |
| U.S. Treasury Notes, 2.5%, 8/15/2023 (f) | | | 13,918,000 | | | | 14,324,770 | |
| U.S. Treasury Notes, 2.5%, 5/15/2024 | | | 5,385,000 | | | | 5,567,184 | |
| U.S. Treasury Notes, 2.875%, 7/31/2025 | | | 5,161,000 | | | | 5,467,345 | |
| U.S. Treasury Notes, 2%, 8/15/2025 | | | 438,000 | | | | 443,537 | |
| U.S. Treasury Notes, 2.625%, 12/31/2025 | | | 2,800,000 | | | | 2,933,482 | |
| U.S. Treasury Notes, 2%, 11/15/2026 | | | 2,982,000 | | | | 3,013,003 | |
| U.S. Treasury Notes, 2.875%, 5/15/2028 | | | 6,000,000 | | | | 6,453,917 | |
| | | | | | | | |
| | | | | | $ | 108,739,198 | |
| | | | | | | | |
| Utilities – Electric Power – 0.3% | | | | | |
| Enel Finance International N.V., 2.875%, 5/25/2022 (n) | | $ | 1,518,000 | | | $ | 1,536,894 | |
| | | | | | | | |
Total Bonds
(Identified Cost, $446,038,292) | | | | | | $ | 461,307,635 | |
| | | | | | | | |
| |
| INVESTMENT COMPANIES (h) – 1.3% | | | | | |
| Money Market Funds – 1.3% | | | | | |
| MFS Institutional Money Market Portfolio, 1.7% (v) (Identified Cost, $6,152,047) | | | 6,152,047 | | | $ | 6,152,047 | |
| | | | | | | | |
OTHER ASSETS, LESS
LIABILITIES – (1.0)% | | | | | | | (4,844,559 | ) |
| | | | | | | | |
| NET ASSETS – 100.0% | | | | | | $ | 462,615,123 | |
| | | | | | | | |
| (f) | | All or a portion of the security has been segregated as collateral for open futures contracts. |
| (h) | | An affiliated issuer, which may be considered one in which the fund owns 5% or more of the outstanding voting securities, or a company which is under common control. At period end, the aggregate values of the fund’s investments in affiliated issuers and in unaffiliated issuers were $6,152,047 and $461,307,635, respectively. |
| (i) | | Interest only security for which the fund receives interest on notional principal (Par amount). Par amount shown is the notional principal and does not reflect the cost of the security. |
| (n) | | Securities exempt from registration under Rule 144A of the Securities Act of 1933. These securities may be sold in the ordinary course of business in transactions exempt from registration, normally to qualified institutional buyers. At period end, the aggregate value of these securities was $16,934,381, representing 3.7% of net assets. |
| (v) | | Affiliated issuer that is available only to investment companies managed by MFS. The rate quoted for the MFS Institutional Money Market Portfolio is the annualizedseven-day yield of the fund at period end. |
The following abbreviations are used in this report and are defined:
| CLO | | Collateralized Loan Obligation |
| FLR | | Floating Rate. Interest rate resets periodically based on the parenthetically disclosed reference rate plus a spread (if any). Theperiod-end rate reported may not be the current rate. All reference rates are USD unless otherwise noted. |
| LIBOR | | London Interbank Offered Rate |
Abbreviations indicate amounts shown in currencies other than the U.S. dollar. All amounts are stated in U.S. dollars unless otherwise indicated. A list of abbreviations is shown below:
Derivative Contracts at 12/31/19
Forward Foreign Currency Exchange Contracts
| | | | | | | | | | | | | | | | | | | | | | | | |
| Currency Purchased | | | Currency Sold | | Counterparty | | Settlement Date
| | | Unrealized
Appreciation (Depreciation) | |
| Asset Derivatives | | | | | | | | | | | | | | | | | | | | | |
| USD | | | 13,841,444 | | | | | | | | JPY | | | 1,500,000,000 | | State Street Bank Corp. | | | 1/06/2020 | | | | $36,280 | |
| | | | | | | | | | | | | | | | | | | | | | | | |
9
MFS Government Securities Portfolio
Portfolio of Investments – continued
Futures Contracts
| | | | | | | | | | | | | | | | | | | | | | | | |
| Description | | Long/
Short | | | Currency | | | Contracts | | | Notional
Amount | | | Expiration
Date | | | Value/
Unrealized
Appreciation
(Depreciation) | |
| Asset Derivatives | | | | | | | | | | | | | | | | | | | | | | | | |
| Interest Rate Futures | | | | | | | | | | | | | | | | | | | | | | | | |
| U.S. Treasury Bond | | | Short | | | | USD | | | | 52 | | | | $8,107,125 | | | | March - 2020 | | | | $210,347 | |
| U.S. Treasury Note 5 yr | | | Short | | | | USD | | | | 65 | | | | 7,709,609 | | | | March - 2020 | | | | 32,397 | |
| | | | | | | | | | | | | | | | | | | | | | | | |
| | | | | | | | | | | | | | | | | | | | | | | $242,744 | |
| | | | | | | | | | | | | | | | | | | | | | | | |
| Liability Derivatives | | | | | | | | | | | | | | | | | | | | | | | | |
| Interest Rate Futures | | | | | | | | | | | | | | | | | | | | | | | | |
| U.S. Treasury Note 10 yr | | | Long | | | | USD | | | | 30 | | | | $3,852,656 | | | | March - 2020 | | | | $(30,703 | ) |
| U.S. Treasury Note 2 yr | | | Long | | | | USD | | | | 21 | | | | 4,525,500 | | | | March - 2020 | | | | (3,706 | ) |
| U.S. Treasury Ultra Note 10 yr | | | Long | | | | USD | | | | 33 | | | | 4,643,203 | | | | March - 2020 | | | | (67,914 | ) |
| | | | | | | | | | | | | | | | | | | | | | | | |
| | | | | | | | | | | | | | | | | | | | | | | $(102,323 | ) |
| | | | | | | | | | | | | | | | | | | | | | | | |
At December 31, 2019, the fund had liquid securities with an aggregate value of $129,683 to cover any collateral or margin obligations for certain derivative contracts.
See Notes to Financial Statements
10
MFS Government Securities Portfolio
FINANCIAL STATEMENTS | STATEMENT OF ASSETS AND LIABILITIES
This statement represents your fund’s balance sheet, which details the assets and liabilities comprising the total value of the fund.
| | | | |
At 12/31/19 | | | | |
| |
Assets | | | | |
Investments in unaffiliated issuers, at value (identified cost, $446,038,292) | | | $461,307,635 | |
Investments in affiliated issuers, at value (identified cost, $6,152,047) | | | 6,152,047 | |
Foreign currency, at value (identified cost, $13,808,976) | | | 13,805,163 | |
Receivables for | | | | |
Forward foreign currency exchange contracts | | | 36,280 | |
Net daily variation margin on open futures contracts | | | 11,415 | |
Investments sold on an extended settlement basis | | | 4,416,579 | |
Interest | | | 2,039,860 | |
Other assets | | | 2,559 | |
Total assets | | | $487,771,538 | |
| |
Liabilities | | | | |
Payables for | | | | |
Investments purchased on an extended settlement basis | | | $24,865,645 | |
Fund shares reacquired | | | 181,235 | |
Payable to affiliates | | | | |
Investment adviser | | | 18,637 | |
Administrative services fee | | | 377 | |
Shareholder servicing costs | | | 14 | |
Distribution and/or service fees | | | 2,255 | |
Payable for independent Trustees’ compensation | | | 61 | |
Accrued expenses and other liabilities | | | 88,191 | |
Total liabilities | | | $25,156,415 | |
Net assets | | | $462,615,123 | |
| |
Net assets consist of | | | | |
Paid-in capital | | | $466,028,719 | |
Total distributable earnings (loss) | | | (3,413,596 | ) |
Net assets | | | $462,615,123 | |
Shares of beneficial interest outstanding | | | 37,230,661 | |
| | | | | | | | | | | | |
| | | |
| | | Net assets | | | Shares
outstanding | | | Net asset value
per share | |
Initial Class | | | $298,414,095 | | | | 23,966,381 | | | | $12.45 | |
Service Class | | | 164,201,028 | | | | 13,264,280 | | | | 12.38 | |
See Notes to Financial Statements
11
MFS Government Securities Portfolio
FINANCIAL STATEMENTS | STATEMENT OF OPERATIONS
This statement describes how much your fund earned in investment income and accrued in expenses. It also describes any gains and/or losses generated by fund operations.
| | | | |
Year ended 12/31/19 | | | | |
| |
Net investment income (loss) | | | | |
Income | | | | |
Interest | | | $14,579,149 | |
Dividends from affiliated issuers | | | 140,720 | |
Other | | | 3,275 | |
Total investment income | | | $14,723,144 | |
Expenses | | | | |
Management fee | | | $2,606,824 | |
Distribution and/or service fees | | | 422,571 | |
Shareholder servicing costs | | | 4,159 | |
Administrative services fee | | | 74,494 | |
Independent Trustees’ compensation | | | 10,613 | |
Custodian fee | | | 26,817 | |
Shareholder communications | | | 28,606 | |
Audit and tax fees | | | 63,725 | |
Legal fees | | | 4,037 | |
Miscellaneous | | | 40,139 | |
Total expenses | | | $3,281,985 | |
Reduction of expenses by investment adviser | | | (104,966 | ) |
Net expenses | | | $3,177,019 | |
Net investment income (loss) | | | $11,546,125 | |
| |
Realized and unrealized gain (loss) | | | | |
Realized gain (loss) (identified cost basis) | | | | |
Unaffiliated issuers | | | $436,279 | |
Affiliated issuers | | | (1,024 | ) |
Futures contracts | | | (1,134,538 | ) |
Forward foreign currency exchange contracts | | | 3,697 | |
Net realized gain (loss) | | | $(695,586 | ) |
| Change in unrealized appreciation or depreciation | | | | |
Unaffiliated issuers | | | $18,939,693 | |
Futures contracts | | | 263,076 | |
Forward foreign currency exchange contracts | | | 36,280 | |
Translation of assets and liabilities in foreign currencies | | | (3,813 | ) |
Net unrealized gain (loss) | | | $19,235,236 | |
Net realized and unrealized gain (loss) | | | $18,539,650 | |
Change in net assets from operations | | | $30,085,775 | |
See Notes to Financial Statements
12
MFS Government Securities Portfolio
FINANCIAL STATEMENTS | STATEMENTS OF CHANGES IN NET ASSETS
These statements describe the increases and/or decreases in net assets resulting from operations, any distributions, and any shareholder transactions.
| | | | | | | | |
| | | Year ended | |
| | | 12/31/19 | | | 12/31/18 | |
Change in net assets | | | | | | | | |
| | |
From operations | | | | | | | | |
Net investment income (loss) | | | $11,546,125 | | | | $12,522,612 | |
Net realized gain (loss) | | | (695,586 | ) | | | (2,245,384 | ) |
Net unrealized gain (loss) | | | 19,235,236 | | | | (9,703,493 | ) |
Change in net assets from operations | | | $30,085,775 | | | | $573,735 | |
Total distributions to shareholders | | | $(13,609,001 | ) | | | $(16,541,275 | ) |
Change in net assets from fund share transactions | | | $(36,187,602 | ) | | | $(78,202,132 | ) |
Total change in net assets | | | $(19,710,828 | ) | | | $(94,169,672 | ) |
| | |
Net assets | | | | | | | | |
At beginning of period | | | 482,325,951 | | | | 576,495,623 | |
At end of period | | | $462,615,123 | | | | $482,325,951 | |
See Notes to Financial Statements
13
MFS Government Securities Portfolio
FINANCIAL STATEMENTS | FINANCIAL HIGHLIGHTS
The financial highlights table is intended to help you understand the fund’s financial performance for the past 5 years. Certain information reflects financial results for a single fund share. The total returns in the table represent the rate that an investor would have earned (or lost) on an investment in the fund share class (assuming reinvestment of all distributions) held for the entire period.
| | | | | | | | | | | | | | | | | | | | |
| Initial Class | | Year ended | |
| | | | | |
| | | 12/31/19 | | | 12/31/18 | | | 12/31/17 | | | 12/31/16 | | | 12/31/15 | |
| | | | | |
Net asset value, beginning of period | | | $12.04 | | | | $12.39 | | | | $12.51 | | | | $12.72 | | | | $13.02 | |
| | | | | |
| Income (loss) from investment operations | | | | | | | | | | | | | | | | | | | | |
Net investment income (loss) (d) | | | $0.31 | | | | $0.30 | | | | $0.31 | | | | $0.31 | (c) | | | $0.27 | |
Net realized and unrealized gain (loss) | | | 0.48 | | | | (0.25 | ) | | | (0.03 | ) | | | (0.17 | ) | | | (0.21 | ) |
Total from investment operations | | | $0.79 | | | | $0.05 | | | | $0.28 | | | | $0.14 | | | | $0.06 | |
| | | | | |
| Less distributions declared to shareholders | | | | | | | | | | | | | | | | | | | | |
From net investment income | | | $(0.38 | ) | | | $(0.40 | ) | | | $(0.40 | ) | | | $(0.35 | ) | | | $(0.36 | ) |
Net asset value, end of period (x) | | | $12.45 | | | | $12.04 | | | | $12.39 | | | | $12.51 | | | | $12.72 | |
Total return (%) (k)(r)(s)(x) | | | 6.53 | | | | 0.47 | | | | 2.22 | | | | 1.04 | (c) | | | 0.47 | |
| | | | | |
Ratios (%) (to average net assets)
and Supplemental data: | | | | | | | | | | | | | | | | | | | | |
Expenses before expense reductions (f) | | | 0.60 | | | | 0.60 | | | | 0.60 | | | | 0.57 | (c) | | | 0.60 | |
Expenses after expense reductions (f) | | | 0.58 | | | | 0.59 | | | | 0.60 | | | | 0.56 | (c) | | | 0.59 | |
Net investment income (loss) | | | 2.53 | | | | 2.45 | | | | 2.45 | | | | 2.40 | (c) | | | 2.09 | |
Portfolio turnover | | | 47 | | | | 35 | | | | 24 | | | | 48 | | | | 81 | |
Net assets at end of period (000 omitted) | | | $298,414 | | | | $310,387 | | | | $364,445 | | | | $388,457 | | | | $424,025 | |
| |
| Service Class | | Year ended | |
| | | | | |
| | | 12/31/19 | | | 12/31/18 | | | 12/31/17 | | | 12/31/16 | | | 12/31/15 | |
| | | | | |
Net asset value, beginning of period | | | $11.96 | | | | $12.31 | | | | $12.42 | | | | $12.64 | | | | $12.93 | |
| | | | | |
| Income (loss) from investment operations | | | | | | | | | | | | | | | | | | | | |
Net investment income (loss) (d) | | | $0.28 | | | | $0.26 | | | | $0.27 | | | | $0.28 | (c) | | | $0.24 | |
Net realized and unrealized gain (loss) | | | 0.48 | | | | (0.24 | ) | | | (0.02 | ) | | | (0.18 | ) | | | (0.21 | ) |
Total from investment operations | | | $0.76 | | | | $0.02 | | | | $0.25 | | | | $0.10 | | | | $0.03 | |
| | | | | |
| Less distributions declared to shareholders | | | | | | | | | | | | | | | | | | | | |
From net investment income | | | $(0.34 | ) | | | $(0.37 | ) | | | $(0.36 | ) | | | $(0.32 | ) | | | $(0.32 | ) |
Net asset value, end of period (x) | | | $12.38 | | | | $11.96 | | | | $12.31 | | | | $12.42 | | | | $12.64 | |
Total return (%) (k)(r)(s)(x) | | | 6.35 | | | | 0.17 | | | | 2.03 | | | | 0.68 | (c) | | | 0.26 | |
| | | | | |
Ratios (%) (to average net assets)
and Supplemental data: | | | | | | | | | | | | | | | | | | | | |
Expenses before expense reductions (f) | | | 0.85 | | | | 0.85 | | | | 0.85 | | | | 0.82 | (c) | | | 0.85 | |
Expenses after expense reductions (f) | | | 0.83 | | | | 0.84 | | | | 0.85 | | | | 0.81 | (c) | | | 0.84 | |
Net investment income (loss) | | | 2.27 | | | | 2.20 | | | | 2.20 | | | | 2.15 | (c) | | | 1.84 | |
Portfolio turnover | | | 47 | | | | 35 | | | | 24 | | | | 48 | | | | 81 | |
Net assets at end of period (000 omitted) | | | $164,201 | | | | $171,938 | | | | $212,050 | | | | $236,831 | | | | $256,958 | |
See Notes to Financial Statements
14
MFS Government Securities Portfolio
Financial Highlights – continued
| (c) | Amount reflects aone-time reimbursement of expenses by the custodian (or former custodian) without which net investment income and performance would be lower and expenses would be higher. |
| (d) | Per share data is based on average shares outstanding. |
| (f) | Ratios do not reflect reductions from fees paid indirectly, if applicable. |
| (k) | The total return does not reflect expenses that apply to separate accounts. Inclusion of these charges would reduce the total return figures for all periods shown. |
| (r) | Certain expenses have been reduced without which performance would have been lower. |
| (s) | From time to time the fund may receive proceeds from litigation settlements, without which performance would be lower. |
| (x) | The net asset values and total returns have been calculated on net assets which include adjustments made in accordance with U.S. generally accepted accounting principles required at period end for financial reporting purposes. |
See Notes to Financial Statements
15
MFS Government Securities Portfolio
NOTES TO FINANCIAL STATEMENTS
| (1) | | Business and Organization |
MFS Government Securities Portfolio (the fund) is a diversified series of MFS Variable Insurance Trust II (the trust). The trust is organized as a Massachusetts business trust and is registered under the Investment Company Act of 1940, as amended, as anopen-end management investment company. The shareholders of each series of the trust are separate accounts of insurance companies, which offer variable annuity and/or life insurance products, and qualified retirement and pension plans.
The fund is an investment company and accordingly follows the investment company accounting and reporting guidance of the Financial Accounting Standards Board (FASB) Accounting Standards Codification Topic 946 Financial Services – Investment Companies.
| (2) | | Significant Accounting Policies |
General– The preparation of financial statements in conformity with U.S. generally accepted accounting principles requires management to make estimates and assumptions that affect the reported amounts of assets and liabilities, and disclosure of contingent assets and liabilities at the date of the financial statements and the reported amounts of increases and decreases in net assets from operations during the reporting period. Actual results could differ from those estimates. In the preparation of these financial statements, management has evaluated subsequent events occurring after the date of the fund’s Statement of Assets and Liabilities through the date that the financial statements were issued.
Balance Sheet Offsetting– The fund’s accounting policy with respect to balance sheet offsetting is that, absent an event of default by the counterparty or a termination of the agreement, the International Swaps and Derivatives Association (ISDA) Master Agreement, or similar agreement, does not result in an offset of reported amounts of financial assets and financial liabilities in the Statement of Assets and Liabilities across transactions between the fund and the applicable counterparty. The fund’s right to setoff may be restricted or prohibited by the bankruptcy or insolvency laws of the particular jurisdiction to which a specific master netting agreement counterparty is subject. Balance sheet offsetting disclosures, to the extent applicable to the fund, have been included in the fund’s Significant Accounting Policies note under the captions for each of the fund’sin-scope financial instruments and transactions.
Investment Valuations– Debt instruments and floating rate loans, including restricted debt instruments, are generally valued at an evaluated or composite bid as provided by a third-party pricing service. Debt instruments sold short are generally valued at an evaluated or composite mean as provided by a third-party pricing service. Short-term instruments with a maturity at issuance of 60 days or less may be valued at amortized cost, which approximates market value. Futures contracts are generally valued at last posted settlement price on their primary exchange as provided by a third-party pricing service. Futures contracts for which there were no trades that day for a particular position are generally valued at the closing bid quotation on their primary exchange as provided by a third-party pricing service. Forward foreign currency exchange contracts are generally valued at the mean of bid and asked prices for the time period interpolated from rates provided by a third-party pricing service for proximate time periods.Open-end investment companies are generally valued at net asset value per share. Securities and other assets generally valued on the basis of information from a third-party pricing service may also be valued at a broker/dealer bid quotation. In determining values, third-party pricing services can utilize both transaction data and market information such as yield, quality, coupon rate, maturity, type of issue, trading characteristics, and other market data.
The Board of Trustees has delegated primary responsibility for determining or causing to be determined the value of the fund’s investments (including any fair valuation) to the adviser pursuant to valuation policies and procedures approved by the Board. If the adviser determines that reliable market quotations are not readily available, investments are valued at fair value as determined in good faith by the adviser in accordance with such procedures under the oversight of the Board of Trustees. Under the fund’s valuation policies and procedures, market quotations are not considered to be readily available for most types of debt instruments and floating rate loans and many types of derivatives. These investments are generally valued at fair value based on information from third-party pricing services. In addition, investments may be valued at fair value if the adviser determines that an investment’s value has been materially affected by events occurring after the close of the exchange or market on which the investment is principally traded (such as foreign exchange or market) and prior to the determination of the fund’s net asset value, or after the halt of trading of a specific security where trading does not resume prior to the close of the exchange or market on which the security is principally traded. The adviser generally relies on third-party pricing services or other information (such as the correlation with price movements of similar securities in the same or other markets; the type, cost and investment characteristics of the security; the business and financial condition of the issuer; and trading and other market data) to assist in determining whether to fair value and at what value to fair value an investment. The value of an investment for purposes of calculating the fund’s net asset value can differ depending on the source and method used to determine value. When fair valuation is used, the value of an investment used to determine the fund’s net asset value may differ from quoted or published prices for the same investment. There can be no assurance that the fund could obtain the fair value assigned to an investment if it were to sell the investment at the same time at which the fund determines its net asset value per share.
16
MFS Government Securities Portfolio
Notes to Financial Statements – continued
Various inputs are used in determining the value of the fund’s assets or liabilities. These inputs are categorized into three broad levels. In certain cases, the inputs used to measure fair value may fall into different levels of the fair value hierarchy. In such cases, an investment’s level within the fair value hierarchy is based on the lowest level of input that is significant to the fair value measurement. The fund’s assessment of the significance of a particular input to the fair value measurement in its entirety requires judgment, and considers factors specific to the investment. Level 1 includes unadjusted quoted prices in active markets for identical assets or liabilities. Level 2 includes other significant observable market-based inputs (including quoted prices for similar securities, interest rates, prepayment speed, and credit risk). Level 3 includes unobservable inputs, which may include the adviser’s own assumptions in determining the fair value of investments. Other financial instruments are derivative instruments, such as futures contracts and forward foreign currency exchange contracts. The following is a summary of the levels used as of December 31, 2019 in valuing the fund’s assets or liabilities:
| | | | | | | | | | | | | | | | |
| Financial Instruments | | Level 1 | | | Level 2 | | | Level 3 | | | Total | |
| U.S. Treasury Bonds & U.S. Government Agencies & Equivalents | | | $— | | | | $149,012,591 | | | | $— | | | | $149,012,591 | |
| Non-U.S. Sovereign Debt | | | — | | | | 1,437,743 | | | | — | | | | 1,437,743 | |
| Municipal Bonds | | | — | | | | 7,620,621 | | | | — | | | | 7,620,621 | |
| U.S. Corporate Bonds | | | — | | | | 4,558,988 | | | | — | | | | 4,558,988 | |
| Residential Mortgage-Backed Securities | | | — | | | | 265,236,248 | | | | — | | | | 265,236,248 | |
| Commercial Mortgage-Backed Securities | | | — | | | | 14,875,658 | | | | — | | | | 14,875,658 | |
| Asset-Backed Securities (including CDOs) | | | — | | | | 12,182,823 | | | | — | | | | 12,182,823 | |
| Foreign Bonds | | | — | | | | 6,382,963 | | | | — | | | | 6,382,963 | |
| Mutual Funds | | | 6,152,047 | | | | — | | | | — | | | | 6,152,047 | |
| Total | | | $6,152,047 | | | | $461,307,635 | | | | $— | | | | $467,459,682 | |
| | | | |
| Other Financial Instruments | | | | | | | | | | | | |
| Futures Contracts – Assets | | | $242,744 | | | | $— | | | | $— | | | | $242,744 | |
| Futures Contracts – Liabilities | | | (102,323 | ) | | | — | | | | — | | | | (102,323 | ) |
| Forward Foreign Currency Exchange Contracts – Assets | | | — | | | | 36,280 | | | | — | | | | 36,280 | |
For further information regarding security characteristics, see the Portfolio of Investments.
Inflation-Adjusted Debt Securities– The fund invests in inflation-adjusted debt securities issued by the U.S. Treasury. The principal value of these debt securities is adjusted through income according to changes in the Consumer Price Index. These debt securities typically pay a fixed rate of interest, but this fixed rate is applied to the inflation-adjusted principal amount. The principal paid at maturity of the debt security is typically equal to the inflation-adjusted principal amount, or the security’s original par value, whichever is greater. Other types of inflation-adjusted securities may use other methods to adjust for other measures of inflation.
Derivatives– The fund uses derivatives primarily to increase or decrease exposure to a particular market or segment of the market, or security, to increase or decrease interest rate or currency exposure, or as alternatives to direct investments. Derivatives are used for hedging ornon-hedging purposes. While hedging can reduce or eliminate losses, it can also reduce or eliminate gains. When the fund uses derivatives as an investment to increase market exposure, or for hedging purposes, gains and losses from derivative instruments may be substantially greater than the derivative’s original cost.
The derivative instruments used by the fund during the period were futures contracts and forward foreign currency exchange contracts. Depending on the type of derivative, the fund may exit a derivative position by entering into an offsetting transaction with a counterparty or exchange, negotiating an agreement with the derivative counterparty, or novating the position to a third party. The fund may be unable to promptly close out a futures position in instances where the daily fluctuation in the price for that type of future exceeds the daily limit set by the exchange. The fund’s period end derivatives, as presented in the Portfolio of Investments and the associated Derivative Contract tables, generally are indicative of the volume of its derivative activity during the period.
The following table presents, by major type of derivative contract, the fair value, on a gross basis, of the asset and liability components of derivatives held by the fund at December 31, 2019 as reported in the Statement of Assets and Liabilities:
| | | | | | | | | | |
| | | | | Fair Value (a) | |
| Risk | | Derivative Contracts | | Asset Derivatives | | | Liability Derivatives | |
| Interest Rate | | Interest Rate Futures | | | $242,744 | | | | $(102,323 | ) |
| Foreign Exchange | | Forward Foreign Currency Exchange Contracts | | | 36,280 | | | | — | |
| (a) | Values presented in this table for futures contracts correspond to the values reported in the fund’s Portfolio of Investments. Only the current day net variation margin for futures contracts is separately reported within the fund’s Statement of Assets and Liabilities. |
17
MFS Government Securities Portfolio
Notes to Financial Statements – continued
The following table presents, by major type of derivative contract, the realized gain (loss) on derivatives held by the fund for the year ended December 31, 2019 as reported in the Statement of Operations:
| | | | | | | | |
| Risk | | Futures Contracts | | | Forward Foreign
Currency
Exchange
Contracts | |
| Interest Rate | | | $(1,134,538 | ) | | | $— | |
| Foreign Exchange | | | — | | | | 3,697 | |
| Total | | | $(1,134,538 | ) | | | $3,697 | |
The following table presents, by major type of derivative contract, the change in unrealized appreciation or depreciation on derivatives held by the fund for the year ended December 31, 2019 as reported in the Statement of Operations:
| | | | | | | | |
| Risk | | Futures Contracts | | | Forward Foreign
Currency
Exchange Contracts | |
| Interest Rate | | | $263,076 | | | | $— | |
| Foreign Exchange | | | — | | | | 36,280 | |
| Total | | | $263,076 | | | | $36,280 | |
Derivative counterparty credit risk is managed through formal evaluation of the creditworthiness of all potential counterparties. On certain, but not all, uncleared derivatives, the fund attempts to reduce its exposure to counterparty credit risk whenever possible by entering into an ISDA Master Agreement on a bilateral basis. The ISDA Master Agreement gives each party to the agreement the right to terminate all transactions traded under such agreement if there is a specified deterioration in the credit quality of the other party. Upon an event of default or a termination of the ISDA Master Agreement, thenon-defaulting party has the right to close out all transactions traded under such agreement and to net amounts owed under each agreement to one net amount payable by one party to the other. This right to close out and net payments across all transactions traded under the ISDA Master Agreement could result in a reduction of the fund’s credit risk to such counterparty equal to any amounts payable by the fund under the applicable transactions, if any.
Collateral and margin requirements differ by type of derivative. For cleared derivatives (e.g., futures contracts, cleared swaps, and exchange-traded options), margin requirements are set by the clearing broker and the clearing house and collateral, in the form of cash or securities, is posted by the fund directly with the clearing broker. Collateral terms are counterparty agreement specific for uncleared derivatives (e.g., forward foreign currency exchange contracts, uncleared swap agreements, and uncleared options) and collateral, in the form of cash and securities, is held in segregated accounts with the fund’s custodian in connection with these agreements. For derivatives traded under an ISDA Master Agreement, which contains a collateral support annex, the collateral requirements are netted across all transactions traded under such counterparty-specific agreement and an amount is posted from one party to the other to collateralize such obligations. Cash that has been segregated or delivered to cover the fund’s collateral or margin obligations under derivative contracts, if any, will be reported separately in the Statement of Assets and Liabilities as restricted cash for uncleared derivatives and/or deposits with brokers for cleared derivatives. Securities pledged as collateral or margin for the same purpose, if any, are noted in the Portfolio of Investments. The fund may be required to make payments of interest on uncovered collateral or margin obligations with the broker. Any such payments are included in “Miscellaneous” expense in the Statement of Operations.
Futures Contracts– The fund entered into futures contracts which may be used to hedge against or obtain broad market exposure, interest rate exposure, or to manage duration. A futures contract represents a commitment for the future purchase or sale of an asset at a specified price on a specified date.
Upon entering into a futures contract, the fund is required to deposit with the broker, either in cash or securities, an initial margin in an amount equal to a specified percentage of the notional amount of the contract. Subsequent payments (variation margin) are made or received by the fund each day, depending on the daily fluctuations in the value of the contract, and are recorded for financial statement purposes as unrealized gain or loss by the fund until the contract is closed or expires at which point the gain or loss on futures contracts is realized.
The fund bears the risk of interest rates or securities prices moving unexpectedly, in which case, the fund may not achieve the anticipated benefits of the futures contracts and may realize a loss. While futures contracts may present less counterparty risk to the fund since the contracts are exchange traded and the exchange’s clearinghouse guarantees payments to the broker, there is still counterparty credit risk due to the insolvency of the broker. The fund’s maximum risk of loss due to counterparty credit risk is equal to the margin posted by the fund to the broker plus any gains or minus any losses on the outstanding futures contracts.
18
MFS Government Securities Portfolio
Notes to Financial Statements – continued
Forward Foreign Currency Exchange Contracts– The fund entered into forward foreign currency exchange contracts for the purchase or sale of a specific foreign currency at a fixed price on a future date. These contracts may be used to hedge the fund’s currency risk or fornon-hedging purposes. For hedging purposes, the fund may enter into contracts to deliver or receive foreign currency that the fund will receive from or use in its normal investment activities. The fund may also use contracts to hedge against declines in the value of foreign currency denominated securities due to unfavorable exchange rate movements. Fornon-hedging purposes, the fund may enter into contracts with the intent of changing the relative exposure of the fund’s portfolio of securities to different currencies to take advantage of anticipated exchange rate changes.
Forward foreign currency exchange contracts are adjusted by the daily exchange rate of the underlying currency and any unrealized gains or losses are recorded as a receivable or payable for forward foreign currency exchange contracts until the contract settlement date. On contract settlement date, any gain or loss on the contract is recorded as realized gains or losses on forward foreign currency exchange contracts.
Risks may arise upon entering into these contracts from unanticipated movements in the value of the contract and from the potential inability of counterparties to meet the terms of their contracts. Generally, the fund’s maximum risk due to counterparty credit risk is the unrealized gain on the contract due to the use of Continuous Linked Settlement, a multicurrency cash settlement system for the centralized settlement of foreign transactions. This risk is mitigated in cases where there is an ISDA Master Agreement between the fund and the counterparty providing for netting as described above and, where applicable, by the posting of collateral by the counterparty to the fund to cover the fund’s exposure to the counterparty under such ISDA Master Agreement.
TBA Dollar Roll Transactions– The fund enters into TBA dollar roll transactions in which the fund sells TBA mortgage-backed securities to financial institutions and simultaneously agrees to repurchase similar (same issuer, type and coupon) securities at a later date at an agreed-upon price. During the period between the sale and repurchase, the fund will not be entitled to receive interest and principal payments on the securities sold. The fund accounts for dollar roll transactions as purchases and sales and realizes gains and losses on these transactions. TBA dollar roll transactions involve the risk that the market value of the securities that the fund is required to purchase may decline below the agreed upon repurchase price of those securities.
Indemnifications– Under the fund’s organizational documents, its officers and Trustees may be indemnified against certain liabilities and expenses arising out of the performance of their duties to the fund. Additionally, in the normal course of business, the fund enters into agreements with service providers that may contain indemnification clauses. The fund’s maximum exposure under these agreements is unknown as this would involve future claims that may be made against the fund that have not yet occurred.
Investment Transactions and Income– Investment transactions are recorded on the trade date. Interest income is recorded on the accrual basis. All premium and discount is amortized or accreted for financial statement purposes in accordance with U.S. generally accepted accounting principles. Some securities may be purchased on a “when-issued” or “forward delivery” basis, which means that the securities will be delivered to the fund at a future date, usually beyond customary settlement time. Inflation-indexed bonds are fixed-income securities whose principal value is periodically adjusted upward or downward based on the rate of inflation. Interest is accrued based on the principal value, which is adjusted for inflation. Any increase or decrease in the principal amount of an inflation-indexed bond is generally recorded as an increase or decrease in interest income, respectively, even though the adjusted principal is not received until maturity. Interest payments received in additional securities are recorded on theex-interest date in an amount equal to the value of the security on such date.
The fund may receive proceeds from litigation settlements. Any proceeds received from litigation involving portfolio holdings are reflected in the Statement of Operations in realized gain/loss if the security has been disposed of by the fund or in unrealized gain/loss if the security is still held by the fund. Any other proceeds from litigation not related to portfolio holdings are reflected as other income in the Statement of Operations.
The fund invests a significant portion of its assets in asset-backed and/or mortgage-backed securities. For these securities, the value of the debt instrument also depends on the credit quality and adequacy of the underlying assets or collateral as well as whether there is a security interest in the underlying assets or collateral. Enforcing rights, if any, against the underlying assets or collateral may be difficult. U.S. Government securities not supported as to the payment of principal or interest by the U.S. Treasury, such as those issued by Fannie Mae, Freddie Mac, and the Federal Home Loan Banks, are subject to greater credit risk than are U.S. Government securities supported by the U.S. Treasury, such as those issued by Ginnie Mae.
The fund purchased or sold debt securities on a when-issued or delayed delivery basis, or in a “To Be Announced” (TBA) or “forward commitment” transaction with delivery or payment to occur at a later date beyond the normal settlement period. When the fund sells securities on a when-issued, delayed delivery, or forward commitment basis, the fund typically owns or has the right to acquire securities equivalent in kind and amount to the delivered securities. At the time a fund enters into a commitment to purchase or sell a security, the transaction is recorded and the value of the security acquired or sold is reflected in the fund’s net asset value. The price of such security and the date that the security will be delivered and paid for are fixed at the time the transaction is negotiated. The value of the security may vary with market fluctuations. TBA securities resulting from these transactions are included in the
19
MFS Government Securities Portfolio
Notes to Financial Statements – continued
Portfolio of Investments. TBA purchase (sale) commitments are held at carrying amount, which approximates fair value and are categorized as level 2 within the fair value hierarchy and included in Investments purchased or sold on an extended settlement basis in the Statement of Assets and Liabilities. No interest accrues to the fund until payment takes place. At the time that a fund enters into this type of transaction, the fund is required to have sufficient cash and/or liquid securities to cover its commitments. Losses may arise due to changes in the value of the underlying securities prior to settlement date or if the counterparty does not perform under the contract’s terms, or if the issuer does not issue the securities due to political, economic or other factors.
To mitigate the counterparty credit risk on TBA securities and other types of forward settling mortgage-backed securities, the fund whenever possible enters into a Master Securities Forward Transaction Agreement (“MSFTA”) on a bilateral basis with each of the counterparties with whom it undertakes a significant volume of transactions. The MSFTA gives each party to the agreement the right to terminate all transactions traded under such agreement if there is a specified deterioration in the credit quality of the other party. Upon an event of default or a termination of the MSFTA, thenon-defaulting party has the right to close out all transactions traded under such agreement and to net amounts owed under each transaction to one net amount payable by one party to the other. This right to close out and net payments across all transactions traded under the MSFTA could result in a reduction of the fund’s credit risk to such counterparty equal to any amounts payable by the fund under the applicable transactions, if any.
For mortgage-backed securities traded under a MSFTA, the collateral and margining requirements are contract specific. Collateral amounts across all transactions traded under such agreement are netted and an amount is posted from one party to the other to collateralize such obligations. Cash that has been pledged to cover the fund’s collateral or margin obligations under a MSFTA, if any, will be reported separately on the Statement of Assets and Liabilities as restricted cash. Securities pledged as collateral or margin for the same purpose, if any, are noted in the Portfolio of Investments.
Tax Matters and Distributions– The fund intends to qualify as a regulated investment company, as defined under Subchapter M of the Internal Revenue Code, and to distribute all of its taxable income, including realized capital gains. As a result, no provision for federal income tax is required. The fund’s federal tax returns, when filed, will remain subject to examination by the Internal Revenue Service for a three year period. Management has analyzed the fund’s tax positions taken on federal and state tax returns for all open tax years and does not believe that there are any uncertain tax positions that require recognition of a tax liability. Foreign taxes, if any, have been accrued by the fund in the accompanying financial statements in accordance with the applicable foreign tax law. Foreign income taxes may be withheld by certain countries in which the fund invests. Additionally, capital gains realized by the fund on securities issued in or by certain foreign countries may be subject to capital gains tax imposed by those countries.
Distributions to shareholders are recorded on theex-dividend date. Income and capital gain distributions are determined in accordance with income tax regulations, which may differ from U.S. generally accepted accounting principles. Certain capital accounts in the financial statements are periodically adjusted for permanent differences in order to reflect their tax character. These adjustments have no impact on net assets or net asset value per share. Temporary differences which arise from recognizing certain items of income, expense, gain or loss in different periods for financial statement and tax purposes will reverse at some time in the future.
Book/tax differences primarily relate to amortization and accretion of debt securities and wash sale loss deferrals.
The tax character of distributions declared to shareholders for the last two fiscal years is as follows:
| | | | | | | | |
| | | Year ended
12/31/19 | | | Year ended
12/31/18 | |
| Ordinary income (including any short-term capital gains) | | | $13,609,001 | | | | $16,541,275 | |
The federal tax cost and the tax basis components of distributable earnings were as follows:
| | | | |
| As of 12/31/19 | | | | |
| |
| Cost of investments | | | $455,540,181 | |
| Gross appreciation | | | 12,827,879 | |
| Gross depreciation | | | (731,677 | ) |
| Net unrealized appreciation (depreciation) | | | $12,096,202 | |
| |
| Undistributed ordinary income | | | 12,347,430 | |
| Capital loss carryforwards | | | (27,853,415 | ) |
| Other temporary differences | | | (3,813 | ) |
As of December 31, 2019, the fund had capital loss carryforwards available to offset future realized gains. These net capital losses may be carried forward indefinitely and their character is retained as short-term and/or long-term losses. Such losses are characterized as follows:
| | | | |
| Short-Term | | | $(6,136,343 | ) |
| Long-Term | | | (21,717,072 | ) |
| Total | | | $(27,853,415 | ) |
20
MFS Government Securities Portfolio
Notes to Financial Statements – continued
Multiple Classes of Shares of Beneficial Interest– The fund offers multiple classes of shares, which differ in their respective distribution and/or service fees. The fund’s income, realized and unrealized gain (loss), and common expenses are allocated to shareholders based on the daily net assets of each class. Dividends are declared separately for each class. Differences in per share dividend rates are generally due to differences in separate class expenses. The fund’s distributions declared to shareholders as reported in the Statements of Changes in Net Assets are presented by class as follows:
| | | | | | | | |
| | |
| | | Year ended
12/31/19 | | | Year ended
12/31/18 | |
| Initial Class | | | $9,062,869 | | | | $10,880,020 | |
| Service Class | | | 4,546,132 | | | | 5,661,255 | |
| Total | | | $13,609,001 | | | | $16,541,275 | |
| (3) | | Transactions with Affiliates |
Investment Adviser– The fund has an investment advisory agreement with MFS to provide overall investment management and related administrative services and facilities to the fund. The management fee is computed daily and paid monthly at the following annual rates based on the fund’s average daily net assets:
| | | | |
| Up to $1 billion | | | 0.55% | |
| In excess of $1 billion | | | 0.50% | |
MFS has agreed in writing to reduce its management fee by a specified amount if certain MFS mutual fund assets exceed thresholds agreed to by MFS and the fund’s Board of Trustees. For the year ended December 31, 2019, this management fee reduction amounted to $46,018, which is included in the reduction of total expenses in the Statement of Operations. The management fee incurred for the year ended December 31, 2019 was equivalent to an annual effective rate of 0.54% of the fund’s average daily net assets.
The investment adviser has agreed in writing to pay a portion of the fund’s total annual operating expenses, excluding interest, taxes, extraordinary expenses, brokerage and transaction costs, and investment-related expenses, such that total annual operating expenses do not exceed 0.58% of average daily net assets for the Initial Class shares and 0.83% of average daily net assets for the Service Class shares. This written agreement will continue until modified by the fund’s Board of Trustees, but such agreement will continue at least until April 30, 2021. For the year ended December 31, 2019, this reduction amounted to $58,948, which is included in the reduction of total expenses in the Statement of Operations.
Distributor– MFS Fund Distributors, Inc. (MFD), a wholly-owned subsidiary of MFS, is the distributor of shares of the fund. The Trustees have adopted a distribution plan for the Service Class shares pursuant to Rule12b-1 under the Investment Company Act of 1940.
The fund’s distribution plan provides that the fund will pay MFD distribution and/or service fees equal to 0.25% per annum of its average daily net assets attributable to Service Class shares as partial consideration for services performed and expenses incurred by MFD and financial intermediaries (including participating insurance companies that invest in the fund to fund variable annuity and variable life insurance contracts, sponsors of qualified retirement and pension plans that invest in the fund, and affiliates of these participating insurance companies and plan sponsors) in connection with the sale and distribution of the Service Class shares. MFD may subsequently pay all, or a portion, of the distribution and/or service fees to financial intermediaries.
Shareholder Servicing Agent– MFS Service Center, Inc. (MFSC), a wholly-owned subsidiary of MFS, receives a fee from the fund for its services as shareholder servicing agent. For the year ended December 31, 2019, the fee was $3,810, which equated to 0.0008% annually of the fund’s average daily net assets. MFSC also receives payment from the fund forout-of-pocket expenses paid by MFSC on behalf of the fund. For the year ended December 31, 2019, these costs amounted to $349.
Administrator– MFS provides certain financial, legal, shareholder communications, compliance, and other administrative services to the fund. Under an administrative services agreement, the fund reimburses MFS the costs incurred to provide these services. The fund is charged an annual fixed amount of $17,500 plus a fee based on average daily net assets. The administrative services fee incurred for the year ended December 31, 2019 was equivalent to an annual effective rate of 0.0157% of the fund’s average daily net assets.
Trustees’ and Officers’ Compensation– The fund pays compensation to independent Trustees in the form of a retainer, attendance fees, and additional compensation to Board and Committee chairpersons. The fund does not pay compensation directly to Trustees or officers of the fund who are also officers of the investment adviser, all of whom receive remuneration from MFS for their services to the fund. Certain officers and Trustees of the fund are officers or directors of MFS, MFD, and MFSC.
Other– This fund and certain other funds managed by MFS (the funds) had entered into a service agreement (the ISO Agreement) which provided for payment of fees solely by the funds to Tarantino LLC in return for the provision of services of an Independent Senior Officer (ISO) for the funds. Frank L. Tarantino served as the ISO and was an officer of the funds and the sole member of
21
MFS Government Securities Portfolio
Notes to Financial Statements – continued
Tarantino LLC. Effective June 30, 2019, Mr. Tarantino retired from his position as ISO for the funds, and the ISO Agreement was terminated. For the year ended December 31, 2019, the fee paid by the fund under this agreement was $567 and is included in “Miscellaneous” expense in the Statement of Operations. MFS had agreed to bear all expenses associated with office space, other administrative support, and supplies provided to the ISO.
The fund invests in the MFS Institutional Money Market Portfolio which is managed by MFS and seeks current income consistent with preservation of capital and liquidity. This money market fund does not pay a management fee to MFS.
For the year ended December 31, 2019, purchases and sales of investments, other than TBA committments and short-term obligations, were as follows:
| | | | | | | | |
| | | Purchases | | | Sales | |
| U.S. Government securities | | | $209,270,135 | | | | $236,277,402 | |
| Non-U.S. Government securities | | | $13,694,223 | | | | $23,863,799 | |
| (5) | | Shares of Beneficial Interest |
The fund’s Declaration of Trust permits the Trustees to issue an unlimited number of full and fractional shares of beneficial interest. Transactions in fund shares were as follows:
| | | | | | | | | | | | | | | | |
| | | Year ended 12/31/19 | | | Year ended 12/31/18 | |
| | | | |
| | | Shares | | | Amount | | | Shares | | | Amount | |
| Shares sold | | | | | | | | | | | | | | | | |
Initial Class | | | 537,053 | | | | $6,670,977 | | | | 420,018 | | | | $5,061,750 | |
Service Class | | | 1,006,833 | | | | 12,339,768 | | | | 642,376 | | | | 7,707,935 | |
| | | 1,543,886 | | | | $19,010,745 | | | | 1,062,394 | | | | $12,769,685 | |
| | | | |
| Shares issued to shareholders in reinvestment of distributions | | | | | | | | | | | | | | | | |
Initial Class | | | 720,419 | | | | $9,062,869 | | | | 916,598 | | | | $10,880,020 | |
Service Class | | | 363,110 | | | | 4,546,132 | | | | 479,361 | | | | 5,661,255 | |
| | | 1,083,529 | | | | $13,609,001 | | | | 1,395,959 | | | | $16,541,275 | |
| | | | |
| Shares reacquired | | | | | | | | | | | | | | | | |
Initial Class | | | (3,080,526 | ) | | | $(38,269,007 | ) | | | (4,972,729 | ) | | | $(59,818,993 | ) |
Service Class | | | (2,477,843 | ) | | | (30,538,341 | ) | | | (3,978,973 | ) | | | (47,694,099 | ) |
| | | (5,558,369 | ) | | | $(68,807,348 | ) | | | (8,951,702 | ) | | | $(107,513,092 | ) |
| | | | |
| Net change | | | | | | | | | | | | | | | | |
Initial Class | | | (1,823,054 | ) | | | $(22,535,161 | ) | | | (3,636,113 | ) | | | $(43,877,223 | ) |
Service Class | | | (1,107,900 | ) | | | (13,652,441 | ) | | | (2,857,236 | ) | | | (34,324,909 | ) |
| | | (2,930,954 | ) | | | $(36,187,602 | ) | | | (6,493,349 | ) | | | $(78,202,132 | ) |
The fund is one of several mutual funds in which certain MFS funds may invest. The MFS funds do not invest in the underlying funds for the purpose of exercising management or control. At the end of the period, the MFS Moderate Allocation Portfolio and the MFS Conservative Allocation Portfolio were the owners of record of approximately 30% and 9%, respectively, of the value of outstanding voting shares of the fund.
The fund and certain other funds managed by MFS participate in a $1.25 billion unsecured committed line of credit, subject to a $1 billion sublimit, provided by a syndicate of banks under a credit agreement. Borrowings may be made for temporary financing needs. Interest is charged to each fund, based on its borrowings, generally at a rate equal to the highest of one month LIBOR, the Federal Funds Effective Rate and the Overnight Bank Funding Rate, plus an agreed upon spread. A commitment fee, based on the average daily, unused portion of the committed line of credit, is allocated among the participating funds. In addition, the fund and other funds managed by MFS have established unsecured uncommitted borrowing arrangements with certain banks for temporary financing needs. Interest is charged to each fund, based on its borrowings, at rates equal to customary reference rates plus an agreed upon spread. For the year ended December 31, 2019, the fund’s commitment fee and interest expense were $2,603 and $0, respectively, and are included in “Miscellaneous” expense in the Statement of Operations.
22
MFS Government Securities Portfolio
Notes to Financial Statements – continued
| (7) | | Investments in Affiliated Issuers |
An affiliated issuer may be considered one in which the fund owns 5% or more of the outstanding voting securities, or a company which is under common control. For the purposes of this report, the following were affiliated issuers:
| | | | | | | | | | | | | | | | | | | | | | | | |
| Affiliated Issuers | | Beginning
Value | | | Purchases | | | Sales
Proceeds | | | Realized
Gain
(Loss) | | | Change in
Unrealized
Appreciation or
Depreciation | | | Ending
Value | |
| MFS Institutional Money Market Portfolio | | | $26,672 | | | | $126,331,476 | | | | $120,205,077 | | | | $(1,024 | ) | | | $— | | | | $6,152,047 | |
| | | | | | |
| Affiliated Issuers | | | | | | | | | | | | | | Dividend
Income | | | Capital Gain
Distributions | |
| MFS Institutional Money Market Portfolio | | | | | | | | | | | | | | | | | | | $140,720 | | | | $— | |
23
MFS Government Securities Portfolio
REPORT OF INDEPENDENT REGISTERED PUBLIC ACCOUNTING FIRM
To the Board of Trustees of MFS Variable Insurance Trust II and the Shareholders of MFS Government Securities Portfolio:
Opinion on the Financial Statements and Financial Highlights
We have audited the accompanying statement of assets and liabilities of MFS Government Securities Portfolio (the “Fund”), including the portfolio of investments, as of December 31, 2019, the related statement of operations for the year then ended, the statements of changes in net assets for each of the two years in the period then ended, the financial highlights for each of the five years in the period then ended, and the related notes. In our opinion, the financial statements and financial highlights present fairly, in all material respects, the financial position of the Fund as of December 31, 2019, and the results of its operations for the year then ended, the changes in its net assets for each of the two years in the period then ended, and the financial highlights for each of the five years in the period then ended, in conformity with accounting principles generally accepted in the United States of America.
Basis for Opinion
These financial statements and financial highlights are the responsibility of the Fund’s management. Our responsibility is to express an opinion on the Fund’s financial statements and financial highlights based on our audits. We are a public accounting firm registered with the Public Company Accounting Oversight Board (United States) (PCAOB) and are required to be independent with respect to the Fund in accordance with the U.S. federal securities laws and the applicable rules and regulations of the Securities and Exchange Commission and the PCAOB.
We conducted our audits in accordance with the standards of the PCAOB. Those standards require that we plan and perform the audit to obtain reasonable assurance about whether the financial statements and financial highlights are free of material misstatement, whether due to error or fraud. The Fund is not required to have, nor were we engaged to perform, an audit of its internal control over financial reporting. As part of our audits we are required to obtain an understanding of internal control over financial reporting but not for the purpose of expressing an opinion on the effectiveness of the Fund’s internal control over financial reporting. Accordingly, we express no such opinion.
Our audits included performing procedures to assess the risks of material misstatement of the financial statements and financial highlights, whether due to error or fraud, and performing procedures that respond to those risks. Such procedures included examining, on a test basis, evidence regarding the amounts and disclosures in the financial statements and financial highlights. Our audits also included evaluating the accounting principles used and significant estimates made by management, as well as evaluating the overall presentation of the financial statements and financial highlights. Our procedures included confirmation of securities owned as of December 31, 2019, by correspondence with the custodian and brokers; when replies were not received from brokers, we performed other auditing procedures. We believe that our audits provide a reasonable basis for our opinion.
DELOITTE & TOUCHE LLP
Boston, Massachusetts
February 14, 2020
We have served as the auditor of one or more of the MFS investment companies since 1924.
24
MFS Government Securities Portfolio
TRUSTEES AND OFFICERS – IDENTIFICATION AND BACKGROUND
The Trustees and Officers of the Trust, as of February 1, 2020, are listed below, together with their principal occupations during the past five years. (Their titles may have varied during that period.) The address of each Trustee and Officer is 111 Huntington Avenue, Boston, Massachusetts 02199-7618.
| | | | | | | | | | |
Name, Age | | Position(s)
Held with Fund | | Trustee/Officer
Since (h) | | Number of MFS Funds
overseen by the
Trustee | | Principal Occupations
During the Past Five Years | | Other Directorships During the Past Five Years (j) |
| INTERESTED TRUSTEES |
Robert J. Manning (k)
(age 56) | | Trustee | | February 2004 | | 133 | | Massachusetts Financial Services Company, Executive Chairman (since January 2017); Director; Chairman of the Board; Chief Executive Officer (until 2015);Co-Chief Executive Officer(2015-2016) | | N/A |
| | | | | |
Robin A. Stelmach (k) (age 58) | | Trustee | | January 2014 | | 133 | | Massachusetts Financial Services Company, Vice Chair (since January 2017); Chief Operating Officer and Executive Vice President (until January 2017) | | N/A |
|
| INDEPENDENT TRUSTEES |
John P. Kavanaugh (age 65) | | Trustee and Chair of Trustees | | January 2009 | | 133 | | Private investor | | N/A |
| | | | | |
Steven E. Buller (age 68) | | Trustee | | February 2014 | | 133 | | Financial Accounting Standards Advisory Council, Chairman(2014-2015); Public Company Accounting Oversight Board, Standing Advisory Group, Member (until 2014); BlackRock, Inc. (investment management), Managing Director (until 2014), BlackRock Finco UK (investment management), Director (until 2014) | | N/A |
| | | | | |
John A. Caroselli (age 65) | | Trustee | | March 2017 | | 133 | | JC Global Advisors, LLC (management consulting), President (since 2015); First Capital Corporation (commercial finance), Executive Vice President (until 2015) | | N/A |
| | | | | |
Maureen R. Goldfarb (age 64) | | Trustee | | January 2009 | | 133 | | Private investor | | N/A |
| | | | | |
Peter D. Jones
(age 64) | | Trustee | | January 2019 | | 133 | | Franklin Templeton Distributors, Inc. (investment management), President (until 2015); Franklin Templeton Institutional, LLC (investment management), Chairman (until 2015) | | N/A |
| | | | | |
James W. Kilman, Jr.
(age 58) | | Trustee | | January 2019 | | 133 | | Burford Capital Limited (finance and investment management), Chief Financial Officer (since 2019); KielStrand Capital LLC (family office), Chief Executive Officer (since 2016); Morgan Stanley & Co. (financial services), Vice Chairman of Investment Banking,Co-Head of Diversified Financials Coverage – Financial Institutions Investment Banking Group (until 2016) | | Alpha-En Corporation, Director (2016-2019) |
25
MFS Government Securities Portfolio
Trustees and Officers – continued
| | | | | | | | | | |
Name, Age | | Position(s)
Held with Fund | | Trustee/Officer
Since (h) | | Number of MFS Funds
overseen by the
Trustee | | Principal Occupations
During the Past Five Years | | Other Directorships During the Past Five Years (j) |
Clarence Otis, Jr. (age 63) | | Trustee | | March 2017 | | 133 | | Darden Restaurants, Inc., Chief Executive Officer (until 2014) | | VF Corporation, Director; Verizon Communications, Inc., Director; The Travelers Companies, Director; Federal Reserve Bank of Atlanta, Director (until 2015) |
| | | | | |
Maryanne L. Roepke (age 63) | | Trustee | | May 2014 | | 133 | | American Century Investments (investment management), Senior Vice President and Chief Compliance Officer (until 2014) | | N/A |
| | | | | |
Laurie J. Thomsen
(age 62) | | Trustee | | March 2005 | | 133 | | Private investor | | The Travelers Companies, Director; Dycom Industries, Inc., Director (since 2015) |
| | | | | | | | |
Name, Age | | Position(s)
Held with Fund | | Trustee/Officer
Since (h) | | Number of
MFS Funds
for which the
Person is an
Officer | | Principal Occupations During the Past Five Years |
| OFFICERS | | | | | | |
Christopher R. Bohane (k)
(age 46) | | Assistant Secretary and Assistant Clerk | | July 2005 | | 133 | | Massachusetts Financial Services Company, Vice President and Assistant General Counsel |
| | | | |
Kino Clark (k) (age 51) | | Assistant Treasurer | | January 2012 | | 133 | | Massachusetts Financial Services Company, Vice President |
| | | | |
John W. Clark, Jr. (k) (age 52) | | Assistant Treasurer | | April 2017 | | 133 | | Massachusetts Financial Services Company, Vice President (since March 2017); Deutsche Bank (financial services), Department Head –Treasurer’s Office (until February 2017) |
| | | | |
Thomas H. Connors (k) (age 60) | | Assistant Secretary and Assistant Clerk | | September 2012 | | 133 | | Massachusetts Financial Services Company, Vice President and Senior Counsel |
| | | | |
David L. DiLorenzo (k)
(age 51) | | President | | July 2005 | | 133 | | Massachusetts Financial Services Company, Senior Vice President |
| | | | |
Heidi W. Hardin (k) (age 52) | | Secretary and Clerk | | April 2017 | | 133 | | Massachusetts Financial Services Company, Executive Vice President and General Counsel (since March 2017); Harris Associates (investment management), General Counsel (from September 2015 to January 2017); Janus Capital Management LLC (investment management), Senior Vice President and General Counsel (until September 2015) |
| | | | |
Brian E. Langenfeld (k) (age 46) | | Assistant
Secretary and Assistant Clerk | | June 2006 | | 133 | | Massachusetts Financial Services Company, Vice President and Senior Counsel |
| | | | |
Amanda S. Mooradian (k) (age 40) | | Assistant
Secretary and Assistant Clerk | | September 2018 | | 133 | | Massachusetts Financial Services Company, Assistant Vice President and Counsel |
| | | | |
Susan A. Pereira (k)
(age 49) | | Assistant
Secretary and Assistant Clerk | | July 2005 | | 133 | | Massachusetts Financial Services Company, Vice President and Assistant General Counsel |
| | | | |
Kasey L. Phillips (k) (age 49) | | Assistant Treasurer | | September 2012 | | 133 | | Massachusetts Financial Services Company, Vice President |
| | | | |
Matthew A. Stowe (k) (age 45) | | Assistant Secretary and Assistant Clerk | | October 2014 | | 133 | | Massachusetts Financial Services Company, Vice President and Assistant General Counsel |
26
MFS Government Securities Portfolio
Trustees and Officers – continued
| | | | | | | | |
Name, Age | | Position(s)
Held with Fund | | Trustee/Officer
Since (h) | | Number of
MFS Funds
for which the
Person is an
Officer | | Principal Occupations During the Past Five Years |
Martin J. Wolin (k) (age 52) | | Chief Compliance Officer | | July 2015 | | 133 | | Massachusetts Financial Services Company, Senior Vice President and Chief Compliance Officer (since July 2015); Mercer (financial service provider), Chief Risk and Compliance Officer, North America and Latin America (until June 2015) |
| | | | |
James O. Yost (k)
(age 59) | | Treasurer | | September 1990 | | 133 | | Massachusetts Financial Services Company, Senior Vice President |
| (h) | Date first appointed to serve as Trustee/officer of an MFS Fund. Each Trustee has served continuously since appointment unless indicated otherwise. For the period from December 15, 2004 until February 22, 2005, Mr. Manning served as Advisory Trustee. From January 2012 through December 2016, Messrs. DiLorenzo and Yost served as Treasurer and Deputy Treasurer of the Funds, respectively. |
| (j) | Directorships or trusteeships of companies required to report to the Securities and Exchange Commission (i.e., “public companies”). |
| (k) | “Interested person” of the Trust within the meaning of the Investment Company Act of 1940 (referred to as the 1940 Act), which is the principal federal law governing investment companies like the fund, as a result of a position with MFS. The address of MFS is 111 Huntington Avenue, Boston, Massachusetts 02199-7618. |
Each Trustee (other than Messrs. Jones and Kilman) has been elected by shareholders and each Trustee and Officer holds office until his or her successor is chosen and qualified or until his or her earlier death, resignation, retirement or removal. Messrs. Jones and Kilman became Trustees of the Funds on January 1, 2019. The Trust does not hold annual meetings for the purpose of electing Trustees, and Trustees are not elected for fixed terms. Under the terms of the Board’s retirement policy, an Independent Trustee shall retire at the end of the calendar year in which he or she reaches the earlier of 75 years of age or 15 years of service on the Board (or, in the case of any Independent Trustee who joined the Board prior to 2015, 20 years of service on the Board).
Messrs. Buller, Kilman and Otis and Ms. Roepke are members of the Trust’s Audit Committee.
Each of the Interested Trustees and certain Officers hold comparable officer positions with certain affiliates of MFS.
The Statement of Additional Information for a Fund includes further information about the Trustees and is available without charge upon request by calling1-800-225-2606.
| | |
Investment Adviser Massachusetts Financial Services Company 111 Huntington Avenue Boston, MA 02199-7618 | | Custodian State Street Bank and Trust Company 1 Lincoln Street Boston, MA 02111-2900 |
| |
Distributor MFS Fund Distributors, Inc. 111 Huntington Avenue Boston, MA 02199-7618 | | Independent Registered Public Accounting Firm Deloitte & Touche LLP 200 Berkeley Street Boston, MA 02116 |
| |
Portfolio Manager(s) Geoffrey Schechter Jake Stone | | |
27
MFS Government Securities Portfolio
BOARD REVIEW OF INVESTMENT ADVISORY AGREEMENT
MFS Government Securities Portfolio
The Investment Company Act of 1940 requires that both the full Board of Trustees and a majority of thenon-interested (“independent”) Trustees, voting separately, annually approve the continuation of the Fund’s investment advisory agreement with MFS. The Trustees consider matters bearing on the Fund and its advisory arrangements at their meetings throughout the year, including a review of performance data at each regular meeting. In addition, the independent Trustees met several times over the course of three months beginning in May and ending in July, 2019 (“contract review meetings”) for the specific purpose of considering whether to approve the continuation of the investment advisory agreement for the Fund and the other investment companies that the Board oversees (the “MFS Funds”). The independent Trustees were assisted in their evaluation of the Fund’s investment advisory agreement by independent legal counsel, from whom they received separate legal advice and with whom they met separately from MFS during various contract review meetings. The independent Trustees were also assisted in this process by the MFS Funds’ Independent Senior Officer, a senior officer appointed by and reporting to the independent Trustees.
In connection with their deliberations regarding the continuation of the investment advisory agreement, the Trustees, including the independent Trustees, considered such information and factors as they believed, in light of the legal advice furnished to them and their own business judgment, to be relevant. The investment advisory agreement for the Fund was considered separately, although the Trustees also took into account the common interests of all MFS Funds in their review. As described below, the Trustees considered the nature, quality, and extent of the various investment advisory, administrative, and shareholder services performed by MFS under the existing investment advisory agreement and other arrangements with the Fund.
In connection with their contract review meetings, the Trustees received and relied upon materials that included, among other items: (i) information provided by Broadridge Financial Solutions, Inc. (“Broadridge”), an independent third party, on the investment performance of the Fund for various time periods ended December 31, 2018 and the investment performance of a group of funds with substantially similar investment classifications/objectives (the “Broadridge performance universe”), (ii) information provided by Broadridge on the Fund’s advisory fees and other expenses and the advisory fees and other expenses of comparable funds identified by Broadridge as well as all other funds in the same investment classification/category (the “Broadridge expense group and universe”), (iii) information provided by MFS on the advisory fees of portfolios of other clients of MFS, including institutional separate accounts and other clients, (iv) information as to whether and to what extent applicable expense waivers, reimbursements or fee “breakpoints” are observed for the Fund, (v) information regarding MFS’ financial results and financial condition, including MFS’ and certain of its affiliates’ estimated profitability from services performed for the Fund and the MFS Funds as a whole, and compared to MFS’ institutional business, (vi) MFS’ views regarding the outlook for the mutual fund industry and the strategic business plans of MFS, (vii) descriptions of various functions performed by MFS for the Funds, such as compliance monitoring and portfolio trading practices, and (viii) information regarding the overall organization of MFS, including information about MFS’ senior management and other personnel providing investment advisory, administrative and other services to the Fund and the other MFS Funds. The comparative performance, fee and expense information prepared and provided by Broadridge was not independently verified and the independent Trustees did not independently verify any information provided to them by MFS.
The Trustees’ conclusion as to the continuation of the investment advisory agreement was based on a comprehensive consideration of all information provided to the Trustees and not the result of any single factor. Some of the factors that figured particularly in the Trustees’ deliberations are described below, although individual Trustees may have evaluated the information presented differently from one another, giving different weights to various factors. It is also important to recognize that the fee arrangements for the Fund and other MFS Funds are the result of years of review and discussion between the independent Trustees and MFS, that certain aspects of such arrangements may receive greater scrutiny in some years than in others, and that the Trustees’ conclusions may be based, in part, on their consideration of these same arrangements during the course of the year and in prior years.
Based on information provided by Broadridge and MFS, the Trustees reviewed the Fund’s total return investment performance as well as the Broadridge performance universe over various time periods. The Trustees placed particular emphasis on the total return performance of the Fund’s Initial Class shares in comparison to the performance of funds in its Broadridge performance universe over the five-year period ended December 31, 2018, which the Trustees believed was a long enough period to reflect differing market conditions. The total return performance of the Fund’s Initial Class shares was in the 2nd quintile relative to the other funds in the universe for this five-year period (the 1st quintile being the best performers and the 5th quintile being the worst performers). The total return performance of the Fund’s Initial Class shares was in the 3rd quintile for theone-year period and in the 2nd quintile for the three-year period ended December 31, 2018 relative to the Broadridge performance universe. Because of the passage of time, these performance results may differ from the performance results for more recent periods, including those shown elsewhere in this report.
In the course of their deliberations, the Trustees took into account information provided by MFS in connection with the contract review meetings, as well as during investment review meetings conducted with portfolio management personnel during the course of the year regarding the Fund’s performance. After reviewing these and related factors, the Trustees concluded, within the context of their overall conclusions regarding the investment advisory agreement, that they were satisfied with MFS’ responses and efforts relating to investment performance.
28
MFS Government Securities Portfolio
Board Review of Investment Advisory Agreement – continued
In assessing the reasonableness of the Fund’s advisory fee, the Trustees considered, among other information, the Fund’s advisory fee and the total expense ratio of the Fund’s Initial Class shares as a percentage of average daily net assets and the advisory fee and total expense ratios of the Broadridge expense group based on information provided by Broadridge. The Trustees considered that MFS currently observes an expense limitation for the Fund, which may not be changed without the Trustees’ approval. The Trustees also considered that, according to the data provided by Broadridge (which takes into account any fee reductions or expense limitations that were in effect during the Fund’s last fiscal year), the Fund’s effective advisory fee rate and total expense ratio were each higher than the Broadridge expense group median.
The Trustees also considered the advisory fees charged by MFS to any institutional separate accounts advised by MFS (“separate accounts”) and unaffiliated investment companies for which MFS serves as subadviser (“subadvised funds”) that have comparable investment strategies to the Fund, if any. In comparing these fees, the Trustees considered information provided by MFS as to the generally broader scope of services provided by MFS to the Fund, as well as the more extensive regulatory burdens imposed on MFS in managing the Fund, in comparison to separate accounts and subadvised funds. The Trustees also considered the higher demands placed on MFS’ investment personnel and trading infrastructure as a result of the daily cashin-flows andout-flows of the Fund in comparison to separate accounts.
The Trustees also considered whether the Fund may benefit from any economies of scale in the management of the Fund in the event of growth in assets of the Fund and/or growth in assets of the MFS Funds as a whole. They noted that the Fund’s advisory fee rate schedule is subject to a contractual breakpoint that reduces the Fund’s advisory fee rate on average daily net assets over $1 billion. The Trustees also noted that MFS has agreed in writing to waive a portion of the management fees of certain MFS Funds, including the Fund, if the total combined assets of certain funds within the MFS Funds’ complex increase above agreed upon thresholds (the “group fee waiver”), enabling the Fund’s shareholders to share in the benefits from any economies of scale at the complex level. The group fee waiver is reviewed and renewed annually between the Board and MFS. The Trustees concluded that the breakpoint and the group fee waiver were sufficient to allow the Fund to benefit from economies of scale as its assets and overall complex assets grow.
The Trustees also considered information prepared by MFS relating to MFS’ costs and profits with respect to the Fund, the MFS Funds considered as a group, and other investment companies and accounts advised by MFS, as well as MFS’ methodologies used to determine and allocate its costs to the MFS Funds, the Fund and other accounts and products for purposes of estimating profitability.
After reviewing these and other factors described herein, the Trustees concluded, within the context of their overall conclusions regarding the investment advisory agreement, that the advisory fees charged to the Fund represent reasonable compensation in light of the services being provided by MFS to the Fund.
In addition, the Trustees considered MFS’ resources and related efforts to continue to retain, attract and motivate capable personnel to serve the Fund. The Trustees also considered current and developing conditions in the financial services industry, including the presence of large and well-capitalized companies which are spending, and appear to be prepared to continue to spend, substantial sums to engage personnel and to provide services to competing investment companies. In this regard, the Trustees also considered the financial resources of MFS and its ultimate parent, Sun Life Financial Inc. The Trustees also considered the advantages and possible disadvantages to the Fund of having an adviser that also serves other investment companies as well as other accounts.
The Trustees also considered the nature, quality, cost, and extent of administrative, transfer agency, and distribution services provided to the Fund by MFS and its affiliates under agreements and plans other than the investment advisory agreement, including any12b-1 fees the Fund pays to MFS Fund Distributors, Inc., an affiliate of MFS. The Trustees also considered the nature, extent and quality of certain other services MFS performs or arranges for on the Fund’s behalf, which may include securities lending programs, directed expense payment programs, class action recovery programs, and MFS’ interaction with third-party service providers, principally custodians andsub-custodians. The Trustees concluded that the variousnon-advisory services provided by MFS and its affiliates on behalf of the Fund were satisfactory.
The Trustees consideredso-called“fall-out benefits” to MFS such as reputational value derived from serving as investment manager to the MFS Funds. The Trustees also considered that, effective January 3, 2018, MFS had discontinued its historic practice of obtaining investment research from portfolio brokerage commissions paid by certain MFS Funds and would thereafter directly pay for or voluntarily reimburse a Fund, if applicable, for the costs of external research acquired through the use of the Fund’s portfolio brokerage commissions.
Based on their evaluation of factors that they deemed to be material, including those factors described above, the Board of Trustees, including the independent Trustees, concluded that the Fund’s investment advisory agreement with MFS should be continued for an additionalone-year period, commencing August 1, 2019.
29
MFS Government Securities Portfolio
PROXY VOTING POLICIES AND INFORMATION
MFS votes proxies on behalf of the fund pursuant to proxy voting policies and procedures that are available without charge, upon request, by calling 1-800-225-2606, by visitingmfs.com/proxyvoting, or by visiting the SEC’s Web site athttp://www.sec.gov.
Information regarding how the fund voted proxies relating to portfolio securities during the most recent twelve-month period ended June 30 is available by August 31 of each year without charge by visitingmfs.com/proxyvoting, or by visiting the SEC’s Web site athttp://www.sec.gov.
QUARTERLY PORTFOLIO DISCLOSURE
The fund files a complete schedule of portfolio holdings with the SEC for the first and third quarters of each fiscal year or as an exhibit to its reports on Form N-PORT. The fund’s Form N-PORT reports are available on the SEC’s website athttp://www.sec.gov. A shareholder can obtain the portfolio holdings report for the first and third quarters of the fund’s fiscal year atmfs.com/vit2 by choosing the fund’s name and then selecting the “Resources” tab and clicking on “Prospectus and Reports”.
FURTHER INFORMATION
From time to time, MFS may post important information about the fund or the MFS funds on the MFS web site (mfs.com). This information is available athttps://www.mfs.com/en-us/what-we-do/announcements.htmlor atmfs.com/vit2 by choosing the fund’s name.
INFORMATION ABOUT FUND CONTRACTS AND LEGAL CLAIMS
The fund has entered into contractual arrangements with an investment adviser, administrator, distributor, shareholder servicing agent, 529 program manager (if applicable), and custodian who each provide services to the fund. Unless expressly stated otherwise, shareholders are not parties to, or intended beneficiaries of these contractual arrangements, and these contractual arrangements are not intended to create any shareholder right to enforce them against the service providers or to seek any remedy under them against the service providers, either directly or on behalf of the fund.
Under the Trust’s By-Laws and Declaration of Trust, any claims asserted against or on behalf of the MFS Funds, including claims against Trustees and Officers, must be brought in state and federal courts located within the Commonwealth of Massachusetts.
30
rev. 3/16
| | | | |
| | | |
| FACTS | | WHAT DOES MFS DO WITH YOUR
PERSONAL INFORMATION? | |  |
| | |
| Why? | | Financial companies choose how they share your personal information. Federal law gives consumers the right to limit some but not all sharing. Federal law also requires us to tell you how we collect, share, and protect your personal information. Please read this notice carefully to understand what we do. |
| | |
| What? | | The types of personal information we collect and share depend on the product or service you have with us. This information can include: • Social Security number and account balances • Account transactions and transaction history • Checking account information and wire transfer instructions When you areno longer our customer, we continue to share your information as described in this notice. |
| | |
| How? | | All financial companies need to share customers’ personal information to run their everyday business. In the section below, we list the reasons financial companies can share their customers’ personal information; the reasons MFS chooses to share; and whether you can limit this sharing. |
| | | | |
Reasons we can share your
personal information | | Does MFS share? | | Can you limit this
sharing? |
For our everyday business purposes – such as to process your transactions, maintain your account(s), respond to court orders and legal investigations, or report to credit bureaus | | Yes | | No |
For our marketing purposes – to offer our products and services to you | | No | | We don’t share |
| For joint marketing with other financial companies | | No | | We don’t share |
For our affiliates’ everyday business purposes – information about your transactions and experiences | | No | | We don’t share |
For our affiliates’ everyday business purposes – information about your creditworthiness | | No | | We don’t share |
| For nonaffiliates to market to you | | No | | We don’t share |
| | |
| | |
| Questions? | | Call800-225-2606 or go tomfs.com. |
31
| | |
| Who we are |
| Who is providing this notice? | | MFS Funds, MFS Investment Management, MFS Institutional Advisors, Inc., and MFS Heritage Trust Company. |
| | |
| What we do |
| How does MFS protect my personal information? | | To protect your personal information from unauthorized access and use, we use security measures that comply with federal law. These measures include procedural, electronic, and physical safeguards for the protection of the personal information we collect about you. |
How does MFS
collect my personal information? | | We collect your personal information, for example, when you • open an account or provide account information • direct us to buy securities or direct us to sell your securities • make a wire transfer We also collect your personal information from others, such as credit bureaus, affiliates, or other companies. |
| Why can’t I limit all sharing? | | Federal law gives you the right to limit only • sharing for affiliates’ everyday business purposes – information about your creditworthiness • affiliates from using your information to market to you • sharing for nonaffiliates to market to you State laws and individual companies may give you additional rights to limit sharing. |
| | |
| Definitions |
| Affiliates | | Companies related by common ownership or control. They can be financial and nonfinancial companies. • MFS does not share personal information with affiliates, except for everyday business purposes as described on page one of this notice. |
| Nonaffiliates | | Companies not related by common ownership or control. They can be financial and nonfinancial companies. • MFS does not share with nonaffiliates so they can market to you. |
| Joint marketing | | A formal agreement between nonaffiliated financial companies that together market financial products or services to you. • MFS doesn’t jointly market. |
| | |
| Other important information |
| If you own an MFS product or receive an MFS service in the name of a third party such as a bank or broker-dealer, their privacy policy may apply to you instead of ours. |
32
Annual Report
December 31, 2019

MFS® High Yield Portfolio

MFS® Variable Insurance Trust II
Beginning on January 1, 2021, as permitted by regulations adopted by the U.S. Securities and Exchange Commission, the insurance company that offers your contract may determine that it will no longer send you paper copies of the fund’s annual and semiannual shareholder reports unless you specifically request paper copies from the insurance company or from your financial intermediary. Instead, the shareholder reports will be made available on a Web site (insurancefunds.mfs.com or other Web site of which you will be notified), and the insurance company will notify you by mail each time a report is posted and provide you with a Web site link to access the report. Instructions for requesting paper copies will be provided by your insurance company or financial intermediary.
If you already elected to receive shareholder reports by email, you will not be affected by this change and you need not take any action. If your insurance company or financial intermediary offers electronic delivery, you may elect to receive shareholder reports and other communications from the insurance company or financial intermediary by email by following the instructions provided by the insurance company or financial intermediary.
Beginning on January 1, 2019, you may elect to receive all future reports in paper free of charge from the insurance company or financial intermediary. You can inform the insurance company or financial intermediary that you wish to continue receiving paper copies of your shareholder reports by contacting your insurance company or financial intermediary. Your election to receive reports in paper will apply to all funds held in your account with your insurance company or financial intermediary.
HYS-ANN
MFS® High Yield Portfolio
CONTENTS
The report is prepared for the general information of contract owners. It is authorized for distribution to prospective investors only when preceded or accompanied by a current prospectus.
NOT FDIC INSURED• MAY LOSE VALUE• NO BANK OR CREDIT UNION GUARANTEE• NOT A DEPOSIT• NOT INSURED BY ANY FEDERAL GOVERNMENT AGENCY OR NCUA/NCUSIF
MFS High Yield Portfolio
LETTER FROM THE EXECUTIVE CHAIR

Dear Contract Owners:
Slowing global growth, low inflation, and trade friction between the United States and China have been hallmarks of the past 12 months. After experiencing an uptick in market volatility in late 2018, markets steadied for most of 2019, thanks in large measure to the adoption of a dovish policy stance on the part of global central banks, focused on supporting economic growth. Negotiations aimed at a “phase one” trade deal between the U.S. and China bore fruit at the end of the period, boosting investor sentiment, while signs of stability emerging from the global manufacturing sector also lifted spirits. Uncertainty over Brexit, along with the ripple effects from the trade conflict, hampered business confidence and investment in the United Kingdom and Europe for much of the period, though investors expect greater clarity regarding Brexit as a result of December’s general election. The pro-Brexit Conservative Party won the election by a comfortable margin and set the stage for the U.K.’s departure from the EU at the end of January.
Markets expect the longest economic expansion in U.S. history will continue, albeit at a slower pace, as trade tensions recede. In an effort to prolong the expansion, the U.S. Federal Reserve lowered interest rates three times between July and October and the European Central Bank loosened policy in September. While the global monetary policy backdrop remains quite accommodative, signs of easing trade tensions and fading global recession fears led to improved market sentiment in late 2019 as investors grew less risk averse. In early 2020, an outbreak of coronavirus emanating from China reintroduced global growth fears, causing an uptick in volatility.
Here at MFS®, we aim to help our clients navigate the growing complexity of the markets and world economies. Our long-term investment philosophy and commitment to the responsible allocation of capital allow us to tune out the noise and uncover what we believe are the best, most durable investment opportunities in the market. Through our powerful global investment platform, we combine collective expertise, thoughtful risk management and long-term discipline to create sustainable value for investors.
Respectfully,

Robert J. Manning
Executive Chair
MFS Investment Management
February 14, 2020
The opinions expressed in this letter are subject to change and may not be relied upon for investment advice. No forecasts can be guaranteed.
1
MFS High Yield Portfolio
PORTFOLIO COMPOSITION
Portfolio structure (i)
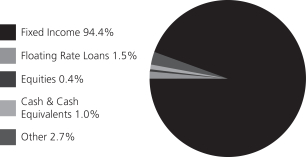
| | | | |
| Top five industries (i) | | | | |
| Cable TV | | | 9.3% | |
| Medical & Health Technology & Services | | | 7.5% | |
| Telecommunications – Wireless | | | 5.5% | |
| Building | | | 5.2% | |
| Gaming & Lodging | | | 5.1% | |
| | | | |
| Composition including fixed income credit quality (a)(i) | |
| BBB | | | 2.1% | |
| BB | | | 52.6% | |
| B | | | 33.2% | |
| CCC | | | 10.5% | |
| CC | | | 0.1% | |
| C (o) | | | 0.0% | |
| Not Rated | | | (2.6)% | |
| Non-Fixed Income | | | 0.4% | |
| Cash & Cash Equivalents | | | 1.0% | |
| Other | | | 2.7% | |
| |
| Portfolio facts (i) | | | | |
| Average Duration (d) | | | 2.6 | |
| Average Effective Maturity (m) | | | 3.2 yrs. | |
| (a) | | For all securities other than those specifically described below, ratings are assigned to underlying securities utilizing ratings from Moody’s, Fitch, and Standard & Poor’s rating agencies and applying the following hierarchy: If all three agencies provide a rating, the middle rating (after dropping the highest and lowest ratings) is assigned; if two of the three agencies rate a security, the lower of the two is assigned. Ratings are shown in the S&P and Fitch scale (e.g., AAA). Securities rated BBB or higher are considered investment grade. All ratings are subject to change. Not Rated includes fixed income securities and fixed income derivatives, which have not been rated by any rating agency.Non-Fixed Income includes any equity securities (including convertible bonds and equity derivatives) and/or commodity-linked derivatives. The fund may or may not have held all of these instruments on this date. The fund is not rated by these agencies. |
| (d) | | Duration is a measure of how much a bond’s price is likely to fluctuate with general changes in interest rates, e.g., if rates rise 1.00%, a bond with a5-year duration is likely to lose about 5.00% of its value due to the interest rate move. |
| (i) | | For purposes of this presentation, the components include the value of securities, and reflect the impact of the equivalent exposure of derivative positions, if any. These amounts may be negative from time to time. Equivalent exposure is a calculated amount that translates the derivative position into a reasonable approximation of the amount of the underlying asset that the portfolio would have to hold at a given point in time to have the same price sensitivity that results from the portfolio’s ownership of the derivative contract. When dealing with derivatives, equivalent exposure is a more representative measure of the potential impact of a position on portfolio performance than value. The bond component will include any accrued interest amounts. |
| (m) | | In determining each instrument’s effective maturity for purposes of calculating the fund’s dollar-weighted average effective maturity, MFS uses the instrument’s stated maturity or, if applicable, an earlier date on which MFS believes it is probable that a maturity-shortening device (such as a put,pre-refunding or prepayment) will cause the instrument to be repaid. Such an earlier date can be substantially shorter than the instrument’s stated maturity. |
Where the fund holds convertible bonds, they are treated as part of the equity portion of the portfolio.
Cash & Cash Equivalents includes any cash, investments in money market funds, short-term securities, and other assets less liabilities. Please see the Statement of Assets and Liabilities for additional information related to the fund’s cash position and other assets and liabilities.
Other includes equivalent exposure from currency derivatives and/or any offsets to derivative positions.
Percentages are based on net assets as of December 31, 2019.
The portfolio is actively managed and current holdings may be different.
2
MFS High Yield Portfolio
MANAGEMENT REVIEW
Summary of Results
For the twelve months ended December 31, 2019, Initial Class shares of the MFS High Yield Portfolio (fund) provided a total return of 14.81%, while Service Class shares of the fund provided a total return of 14.44%. These compare with a return of 14.32% over the same period for the fund’s benchmark, the Bloomberg Barclays U.S. High-Yield Corporate Bond 2% Issuer Capped Index.
Market Environment
Fading fears of a near-term global recession, the announcement of a partial trade deal between the United States and China and the decline in uncertainty over Brexit helped bolster market sentiment late in the period. Changes in market sentiment, largely driven by uncertainty over the outcome of trade negotiations between the US and China, had contributed to periodic bouts of volatility during the reporting period. The global economy decelerated, led by weakness in China and Europe, although the pace of the slowdown moderated late in the period amid nascent signs of stabilization in the manufacturing sector.
The deteriorating global growth backdrop, along with declining inflationary pressures, prompted the US Federal Reserve to adopt a more dovish posture beginning in early 2019, resulting in the first interest rate cut in over a decade at the end of July, followed by additional cuts in September and October. The Fed’s actions led to a sharp decline in long-term interest rates during the period’s second half, causing the inversion of portions of the US Treasury yield curve for a time. Amid an improvement in risk sentiment in Q4 2019 and indications of a bottoming in growth and a potential upturn in activity, the Fed indicated in October that further rate cuts were unlikely unless the outlook for the economy materially worsened.
Globally, central banks have tilted more dovish as well, with the European Central Bank unveiling a package of easing measures, which included putting overnight rates deeper into negative territory, restarting its bond-buying program and lengthening the term of cheap loans to banks to three years from two. The central banks of India and Australia are among those that have cut rates several times in recent months, although China has been more cautious in increasing liquidity as it keeps trying to deleverage its economy, cutting rates only marginally.
Emerging markets experienced considerable volatility through the end of 2018, as tighter global financial conditions exposed structural weakness in some countries. Those conditions improved in 2019 as the Fed became more dovish. Notwithstanding the periodic headwinds on market sentiment from significant trade friction between the US and China over much of the year, emerging market hard currency debt and local rates benefited from relatively cheap valuations at the beginning of the period and easier global monetary conditions. These factors, plus the fading of certain global risk factors mentioned above, hastened spread tightening in the latter part of the period. At the same time, idiosyncratic risks spiked in some countries (e.g., Argentina and Lebanon), contributing to increased dispersion in performance among sovereign assets.
Contributors to Performance
Relative to the Bloomberg Barclays U.S. High-Yield Corporate Bond 2% Issuer Capped Index, the fund’s bond selection within both theconsumernon-cyclical andenergy sectors supported relative performance. Asset allocation decisions further benefited relative results, led by an underweight exposure to the poor-performingenergy sector. From a quality perspective, the fund’s underweight exposure to “CCC” rated (r) bonds helped relative results.
The fund’s yield curve (y) positioning, particularly the fund’s lesser exposure to shifts in the long end (centered around maturities of 10 or more years) of the yield curve, was another area of relative strength.
Top individual contributors for the reporting period included overweight exposures to telecommunications company Altice (communications), hospital operator Regional Care/LifePoint Health (consumernon-cyclicals), polymers and chemicals company SPCM (basicindustry) and oil and natural gas company Parsley Energy (energy).
Detractors from Performance
The fund’s shorter duration (d) stance detracted from relative performance. An underweight exposure to thefinancial institutionssector also held back relative returns.
Top individual detractors for the reporting period included the fund’s overweight exposures to independent exploration and production companies Alta Mesa Resources (h) (energy), diamond miner Northwest Acquisitions ULC/Dominion Finco (basicindustry) and mobile telecommunication services provider Digicel International Finance (communications).
Respectfully,
Portfolio Manager(s)
David Cole and Michael Skatrud
3
MFS High Yield Portfolio
Management Review – continued
| (d) | Duration is a measure of how much a bond’s price is likely to fluctuate with general changes in interest rates, e.g., if rates rise 1.00%, a bond with a5-year duration is likely to lose about 5.00% of its value. |
| (h) | Security was not held in the portfolio at period end. |
| (r) | Bonds rated “BBB”, “Baa”, or higher are considered investment grade; bonds rated “BB”, “Ba”, or below are considerednon-investment grade. The sources for bond quality ratings are Moody’s Investors Service, Standard & Poor’s and Fitch, Inc. and are applied using the following hierarchy: If all three agencies provide a rating, the middle rating (after dropping the highest and lowest ratings) is assigned; if two of the three agencies rate a security, the lower of the two is assigned. Ratings are shown in the S&P and Fitch scale (e.g., AAA). For securities which are not rated by any of the three agencies, the security is considered Not Rated. |
| (y) | A yield curve graphically depicts the yields of different maturity bonds of the same credit quality and type; a normal yield curve is upward sloping, with short-term rates lower than long-term rates. |
The views expressed in this report are those of the portfolio manager(s) only through the end of the period of the report as stated on the cover and do not necessarily reflect the views of MFS or any other person in the MFS organization. These views are subject to change at any time based on market or other conditions, and MFS disclaims any responsibility to update such views. These views may not be relied upon as investment advice or an indication of trading intent on behalf of any MFS portfolio. References to specific securities are not recommendations of such securities, and may not be representative of any MFS portfolio’s current or future investments.
4
MFS High Yield Portfolio
PERFORMANCE SUMMARY THROUGH 12/31/19
The following chart illustrates the historical performance of the fund in comparison to its benchmark(s). Benchmarks are unmanaged and may not be invested in directly. Benchmark returns do not reflect any fees or expenses. The performance of other share classes will be greater than or less than that of the class depicted below. (See Notes to Performance Summary.)
Performance data shown represents past performance and is no guarantee of future results. Investment return and principal value fluctuate so your units, when sold, may be worth more or less than the original cost; current performance may be lower or higher than quoted. The performance shown does not reflect the deduction of taxes, if any, that a contract holder would pay on fund distributions or the redemption of contract units. The returns for the fund shown also do not reflect the deduction of expenses associated with variable products, such as mortality and expense risk charges, separate account charges, and sales charges imposed by the insurance company separate accounts. Such expenses would reduce the overall returns shown.
Growth of a Hypothetical $10,000 Investment
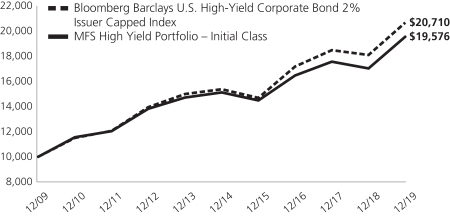
Total Returns through 12/31/19
Average annual total returns
| | | | | | | | | | | | |
| | | Share Class | | Class Inception Date | | 1-yr | | 5-yr | | 10-yr | | |
| | | Initial Class | | 6/12/85 | | 14.81% | | 5.29% | | 6.95% | | |
| | | Service Class | | 8/24/01 | | 14.44% | | 5.04% | | 6.66% | | |
| | | | |
Comparative benchmark(s) | | | | | | | | |
| | | Bloomberg Barclays U.S. High-Yield Corporate Bond 2% Issuer Capped Index (f) | | 14.32% | | 6.14% | | 7.55% | | |
| (f) | Source: FactSet Research Systems Inc. |
Benchmark Definition(s)
Bloomberg Barclays U.S. High-Yield Corporate Bond 2% Issuer Capped Index – a component of the Bloomberg Barclays U.S.High-Yield Corporate Bond Index, which measures performance of non-investment grade, fixed rate debt. The index limits the maximum exposure to any one issuer to 2%. BLOOMBERG® is a trademark and service mark of Bloomberg Finance L.P. and its affiliates (collectively “Bloomberg”). BARCLAYS® is a trademark and service mark of Barclays Bank Plc (collectively with its affiliates, “Barclays”), used under license. Bloomberg or Bloomberg’s licensors, including Barclays, own all proprietary rights in the Bloomberg Barclays Indices. Neither Bloomberg nor Barclays approves or endorses this material, or guarantees the accuracy or completeness of any information herein, or makes any warranty, express or implied, as to the results to be obtained therefrom, and, to the maximum extent allowed by law, neither shall have any liability or responsibility for injury or damages arising in connection therewith.
It is not possible to invest directly in an index.
Notes to Performance Summary
Average annual total return represents the average annual change in value for each share class for the periods presented.
Performance results reflect any applicable expense subsidies and waivers in effect during the periods shown. Without such subsidies and waivers the fund’s performance results would be less favorable. Please see the prospectus and financial statements for complete details. All results are historical and assume the reinvestment of any dividends and capital gains distributions.
5
MFS High Yield Portfolio
Performance Summary – continued
Performance results do not include adjustments made for financial reporting purposes in accordance with U.S. generally accepted accounting principles and may differ from amounts reported in the financial highlights.
From time to time the fund may receive proceeds from litigation settlements, without which performance would be lower.
6
MFS High Yield Portfolio
EXPENSE TABLE
Fund Expenses Borne by the Contract Holders during the Period,
July 1, 2019 through December 31, 2019
As a contract holder of the fund, you incur ongoing costs, including management fees; distribution and/or service(12b-1) fees; and other fund expenses. This example is intended to help you understand your ongoing costs (in dollars) of investing in the fund and to compare these costs with the ongoing costs of investing in other mutual funds.
The example is based on an investment of $1,000 invested at the beginning of the period and held for the entire period July 1, 2019 through December 31, 2019.
Actual Expenses
The first line for each share class in the following table provides information about actual account values and actual expenses. You may use the information in this line, together with the amount you invested, to estimate the expenses that you paid over the period. Simply divide your account value by $1,000 (for example, an $8,600 account value divided by $1,000 = 8.6), then multiply the result by the number in the first line under the heading entitled “Expenses Paid During Period” to estimate the expenses you paid on your account during this period.
Hypothetical Example for Comparison Purposes
The second line for each share class in the following table provides information about hypothetical account values and hypothetical expenses based on the fund’s actual expense ratio and an assumed rate of return of 5% per year before expenses, which is not the fund’s actual return. The hypothetical account values and expenses may not be used to estimate the actual ending account balance or expenses you paid for the period. You may use this information to compare the ongoing costs of investing in the fund and other funds. To do so, compare this 5% hypothetical example with the 5% hypothetical examples that appear in the shareholder reports of the other funds.
Please note that the expenses shown in the table are meant to highlight the fund’s ongoing costs only and do not take into account the fees and expenses imposed under the variable contracts through which your investment in the fund is made. Therefore, the second line for each share class in the table is useful in comparing ongoing costs associated with an investment in vehicles (such as the fund) which fund benefits under variable annuity and variable life insurance contracts and to qualified pension and retirement plans only, and will not help you determine the relative total costs of investing in the fund through variable annuity and variable life insurance contracts. If the fees and expenses imposed under the variable contracts were included, your costs would have been higher.
| | | | | | | | | | | | | | | | | | |
| Share Class | | | | Annualized
Expense Ratio | | | Beginning
Account Value
7/01/19 | | | Ending Account Value
12/31/19 | | | Expenses Paid
During Period (p)
7/01/19-12/31/19 | |
| Initial Class | | Actual | | | 0.72% | | | | $1,000.00 | | | | $1,045.14 | | | | $3.71 | |
| | Hypothetical (h) | | | 0.72% | | | | $1,000.00 | | | | $1,021.58 | | | | $3.67 | |
| Service Class | | Actual | | | 0.97% | | | | $1,000.00 | | | | $1,042.50 | | | | $4.99 | |
| | Hypothetical (h) | | | 0.97% | | | | $1,000.00 | | | | $1,020.32 | | | | $4.94 | |
| (h) | 5% class return per year before expenses. |
| (p) | “Expenses Paid During Period” are equal to each class’s annualized expense ratio, as shown above, multiplied by the average account value over the period, multiplied by 184/365 (to reflect theone-half year period). |
7
MFS High Yield Portfolio
PORTFOLIO OF INVESTMENTS – 12/31/19
The Portfolio of Investments is a complete list of all securities owned by your fund. It is categorized by broad-based asset classes.
| | | | | | | | |
| | |
| Issuer | | Shares/Par | | | Value ($) | |
| BONDS – 95.7% | | | | | | | | |
| Aerospace – 2.5% | | | | | |
| Bombardier, Inc., 7.5%, 3/15/2025 (n) | | $ | 1,503,000 | | | $ | 1,549,954 | |
| F-BrasileS.p.A./F-Brasile U.S. LLC, 7.375%, 8/15/2026 (n) | | | 1,070,000 | | | | 1,128,850 | |
| Moog, Inc., 4.25%, 12/15/2027 (n) | | | 2,000,000 | | | | 2,035,200 | |
| TransDigm, Inc., 6.5%, 7/15/2024 | | | 855,000 | | | | 881,804 | |
| TransDigm, Inc., 6.25%, 3/15/2026 (n) | | | 1,160,000 | | | | 1,255,828 | |
| TransDigm, Inc., 6.375%, 6/15/2026 | | | 1,000,000 | | | | 1,060,610 | |
| TransDigm, Inc., 5.5%, 11/15/2027 (n) | | | 1,145,000 | | | | 1,157,858 | |
| | | | | | | | |
| | | | | | $ | 9,070,104 | |
| | | | | | | | |
| Asset-Backed & Securitized – 0.0% | | | | | |
| CWCapital Cobalt Ltd., CDO, “F”, FLR, 3.235%, (0% cash or 3.235% PIK), (LIBOR - 3 mo. + 1.3%), 4/26/2050 (a)(n)(p) | | $ | 1,237,288 | | | $ | 124 | |
| | | | | | | | |
| Automotive – 2.3% | | | | | |
Allison Transmission, Inc.,
5%, 10/01/2024 (n) | | $ | 3,459,000 | | | $ | 3,541,151 | |
| Allison Transmission, Inc., 5.875%, 6/01/2029 (n) | | | 165,000 | | | | 180,675 | |
| Dana, Inc., 5.375%, 11/15/2027 | | | 511,000 | | | | 526,330 | |
| IAA Spinco, Inc., 5.5%, 6/15/2027 (n) | | | 1,375,000 | | | | 1,460,938 | |
| KAR Auction Services, Inc., 5.125%, 6/01/2025 (n) | | | 1,175,000 | | | | 1,222,000 | |
| Panther BR Aggregator 2 LP/Panther Finance Co., Inc., 8.5%, 5/15/2027 (n) | | | 1,565,000 | | | | 1,662,812 | |
| | | | | | | | |
| | | | | | $ | 8,593,906 | |
| | | | | | | | |
| Broadcasting – 3.7% | | | | | |
| Diamond Sports Group, LLC/Diamond | | | | | | | | |
| Sports Finance Co., 6.625%, 8/15/2027 (n) | | $ | 970,000 | | | $ | 943,325 | |
| iHeartCommunications, Inc., 6.375%, 5/01/2026 (n) | | | 640,000 | | | | 694,400 | |
| iHeartCommunications, Inc., 8.375%, 5/01/2027 | | | 680,000 | | | | 751,400 | |
| iHeartCommunications, Inc., 5.25%, 8/15/2027 (n) | | | 300,000 | | | | 313,890 | |
| Liberty Media Corp. - Liberty Formula One, 8.5%, 7/15/2029 | | | 300,000 | | | | 297,375 | |
| Lions Gate Capital Holding Co., 5.875%, 11/01/2024 | | | 395,000 | | | | 400,925 | |
| Match Group, Inc., 6.375%, 6/01/2024 | | | 1,430,000 | | | | 1,499,712 | |
| Match Group, Inc., 5%, 12/15/2027 (n) | | | 1,095,000 | | | | 1,141,537 | |
| National CineMedia, LLC, 5.875%, 4/15/2028 (n) | | | 790,000 | | | | 839,375 | |
| Netflix, Inc., 5.875%, 2/15/2025 | | | 1,865,000 | | | | 2,079,475 | |
| Netflix, Inc., 5.875%, 11/15/2028 | | | 905,000 | | | | 1,003,247 | |
Nexstar Escrow Corp.,
5.625%, 7/15/2027 (n) | | | 1,250,000 | | | | 1,317,250 | |
| WMG Acquisition Corp., 5%, 8/01/2023 (n) | | | 525,000 | | | | 536,813 | |
| WMG Acquisition Corp., 4.875%, 11/01/2024 (n) | | | 1,360,000 | | | | 1,407,600 | |
| | | | | | | | |
| | |
Issuer | | Shares/Par | | | Value ($) | |
| BONDS – continued | | | | | | | | |
| Broadcasting – continued | | | | | |
WMG Acquisition Corp.,
5.5%, 4/15/2026 (n) | | $ | 300,000 | | | $ | 315,750 | |
| | | | | | | | |
| | | | | | $ | 13,542,074 | |
| | | | | | | | |
| Brokerage & Asset Managers – 0.5% | | | | | |
| LPL Holdings, Inc., 4.625%, 11/15/2027 (n) | | $ | 1,910,000 | | | $ | 1,948,200 | |
| | | | | | | | |
| Building – 5.1% | | | | | |
| ABC Supply Co., Inc., 5.875%, 5/15/2026 (n) | | $ | 1,770,000 | | | $ | 1,880,625 | |
| ABC Supply Co., Inc., 4%, 1/15/2028 (n) | | | 1,840,000 | | | | 1,867,600 | |
Beacon Escrow Corp.,
4.875%, 11/01/2025 (n) | | | 1,218,000 | | | | 1,224,090 | |
| Beacon Roofing Supply, Inc., 4.5%, 11/15/2026 (n) | | | 550,000 | | | | 566,500 | |
| Core & Main LP, 8.625%, (8.625% cash or 9.375% PIK) 9/15/2024 (n)(p) | | | 490,000 | | | | 509,600 | |
| Core & Main LP, 6.125%, 8/15/2025 (n) | | | 945,000 | | | | 980,438 | |
| Cornerstone Building Brands, Inc., 8%, 4/15/2026 (n) | | | 730,000 | | | | 761,025 | |
| HD Supply, Inc., 5.375%, 10/15/2026 (n) | | | 1,570,000 | | | | 1,664,200 | |
| James Hardie International Finance Ltd., 4.75%, 1/15/2025 (n) | | | 810,000 | | | | 840,375 | |
| James Hardie International Finance Ltd., 5%, 1/15/2028 (n) | | | 935,000 | | | | 981,750 | |
| New Enterprise Stone & Lime Co., Inc., 10.125%, 4/01/2022 (n) | | | 680,000 | | | | 719,950 | |
| New Enterprise Stone & Lime Co., Inc., 6.25%, 3/15/2026 (n) | | | 997,000 | | | | 1,044,357 | |
Patrick Industries, Inc.,
7.5%, 10/15/2027 (n) | | | 635,000 | | | | 676,275 | |
| PriSo Acquisition Corp., 9%, 5/15/2023 (n) | | | 1,134,000 | | | | 1,122,660 | |
| Standard Industries, Inc., 5.375%, 11/15/2024 (n) | | | 965,000 | | | | 991,537 | |
Standard Industries, Inc.,
6%, 10/15/2025 (n) | | | 1,400,000 | | | | 1,471,750 | |
| Summit Materials LLC/Summit Materials Finance Co., 6.125%, 7/15/2023 | | | 1,575,000 | | | | 1,600,594 | |
| | | | | | | | |
| | | | | | $ | 18,903,326 | |
| | | | | | | | |
| Business Services – 2.7% | | | | | |
| Ascend Learning LLC, 6.875%, 8/01/2025 (z) | | $ | 1,325,000 | | | $ | 1,391,250 | |
| CDK Global, Inc., 4.875%, 6/01/2027 | | | 1,405,000 | | | | 1,484,031 | |
| Equinix, Inc., 5.875%, 1/15/2026 | | | 690,000 | | | | 732,270 | |
| Iron Mountain, Inc., REIT, 4.875%, 9/15/2027 (n) | | | 840,000 | | | | 867,300 | |
| MSCI, Inc., 5.75%, 8/15/2025 (n) | | | 995,000 | | | | 1,043,506 | |
| MSCI, Inc., 4.75%, 8/01/2026 (n) | | | 2,865,000 | | | | 3,001,088 | |
| Refinitiv U.S. Holdings, Inc., 8.25%, 11/15/2026 (n) | | | 520,000 | | | | 585,650 | |
| Verscend Escrow Corp., 9.75%, 8/15/2026 | | | 855,000 | | | | 935,156 | |
| | | | | | | | |
| | | | | | $ | 10,040,251 | |
| | | | | | | | |
8
MFS High Yield Portfolio
Portfolio of Investments – continued
| | | | | | | | |
| | |
| Issuer | | Shares/Par | | | Value ($) | |
| BONDS – continued | | | | | | | | |
| Cable TV – 8.9% | | | | | |
| Altice Financing S.A., 7.5%, 5/15/2026 (n) | | $ | 560,000 | | | $ | 602,000 | |
| CCO Holdings LLC/CCO Holdings Capital Corp., 5.75%, 1/15/2024 | | | 112,000 | | | | 113,960 | |
| CCO Holdings LLC/CCO Holdings Capital Corp., 5.375%, 5/01/2025 (n) | | | 415,000 | | | | 428,487 | |
| CCO Holdings LLC/CCO Holdings Capital Corp., 5.75%, 2/15/2026 (n) | | | 3,635,000 | | | | 3,834,998 | |
| CCO Holdings LLC/CCO Holdings Capital Corp., 5.875%, 5/01/2027 (n) | | | 2,135,000 | | | | 2,257,762 | |
| CCO Holdings LLC/CCO Holdings Capital Corp., 4.75%, 3/01/2030 (n) | | | 1,585,000 | | | | 1,616,748 | |
| CSC Holdings LLC, 5.5%, 5/15/2026 (n) | | | 1,340,000 | | | | 1,418,712 | |
| CSC Holdings LLC, 5.5%, 4/15/2027 (n) | | | 4,160,000 | | | | 4,467,216 | |
| DISH DBS Corp., 5.875%, 11/15/2024 | | | 760,000 | | | | 776,625 | |
Intelsat Connect Finance,
9.5%, 2/15/2023 (n) | | | 785,000 | | | | 549,264 | |
| Intelsat Jackson Holdings S.A., 5.5%, 8/01/2023 | | | 1,900,000 | | | | 1,632,176 | |
| LCPR Senior Secured Financing DAC, 6.75%, 10/15/2027 (n) | | | 960,000 | | | | 1,017,600 | |
Sirius XM Holdings, Inc.,
4.625%, 7/15/2024 (n) | | | 2,310,000 | | | | 2,425,500 | |
Sirius XM Holdings, Inc.,
5.5%, 7/01/2029 (n) | | | 810,000 | | | | 875,804 | |
Sirius XM Radio, Inc.,
4.625%, 5/15/2023 (n) | | | 670,000 | | | | 680,050 | |
Sirius XM Radio, Inc.,
5.375%, 4/15/2025 (n) | | | 745,000 | | | | 769,794 | |
| Telenet Finance Luxembourg S.A., 5.5%, 3/01/2028 (n) | | | 1,400,000 | | | | 1,494,500 | |
| Telesat Holdings, Inc., 6.5%, 10/15/2027 (n) | | | 1,025,000 | | | | 1,068,562 | |
| Videotron Ltd., 5.375%, 6/15/2024 (n) | | | 370,000 | | | | 407,000 | |
| Videotron Ltd., 5.125%, 4/15/2027 (n) | | | 3,030,000 | | | | 3,242,100 | |
| Virgin Media Finance PLC, 5.75%, 1/15/2025 (n) | | | 200,000 | | | | 205,750 | |
| Virgin Media Secured Finance PLC, 5.5%, 5/15/2029 (n) | | | 1,025,000 | | | | 1,085,219 | |
| Ziggo Bond Finance B.V., 5.875%, 1/15/2025 (n) | | | 1,830,000 | | | | 1,886,053 | |
| | | | | | | | |
| | | | | | $ | 32,855,880 | |
| | | | | | | | |
| Chemicals – 1.5% | | | | | |
| Axalta Coating Systems Co., 4.875%, 8/15/2024 (n) | | $ | 1,450,000 | | | $ | 1,500,750 | |
| Consolidated Energy Finance S.A., 6.875%, 6/15/2025 (n) | | | 1,235,000 | | | | 1,179,425 | |
| Element Solutions, Inc., 5.875%, 12/01/2025 (n) | | | 515,000 | | | | 538,819 | |
| SPCM S.A., 4.875%, 9/15/2025 (n) | | | 1,520,000 | | | | 1,580,800 | |
| Starfruit Finance Co./Starfruit U.S. Holding Co. LLC, 8%, 10/01/2026 (n) | | | 770,000 | | | | 816,200 | |
| | | | | | | | |
| | | | | | $ | 5,615,994 | |
| | | | | | | | |
| Computer Software – 0.7% | | | | | |
| VeriSign, Inc., 5.25%, 4/01/2025 | | $ | 1,645,000 | | | $ | 1,813,300 | |
| VeriSign, Inc., 4.75%, 7/15/2027 | | | 780,000 | | | | 822,900 | |
| | | | | | | | |
| | | | | | $ | 2,636,200 | |
| | | | | | | | |
| | | | | | | | |
| | |
| Issuer | | Shares/Par | | | Value ($) | |
| BONDS – continued | | | | | | | | |
| Computer Software – Systems – 2.6% | | | | | |
| CDW LLC/CDW Finance Corp., 4.25%, 4/01/2028 | | $ | 1,470,000 | | | $ | 1,541,663 | |
| Fair Isaac Corp., 5.25%, 5/15/2026 (n) | | | 2,225,000 | | | | 2,447,500 | |
| Fair Isaac Corp., 4%, 6/15/2028 (n) | | | 380,000 | | | �� | 382,850 | |
| JDA Software Group, Inc., 7.375%, 10/15/2024 (z) | | | 1,055,000 | | | | 1,095,881 | |
| Sabre GLBL, Inc., 5.375%, 4/15/2023 (n) | | | 2,160,000 | | | | 2,212,920 | |
| SS&C Technologies Holdings, Inc., 5.5%, 9/30/2027 (n) | | | 1,645,000 | | | | 1,756,037 | |
| | | | | | | | |
| | | | | | $ | 9,436,851 | |
| | | | | | | | |
| Conglomerates – 3.7% | | | | | |
Amsted Industries Co.,
5.625%, 7/01/2027 (n) | | $ | 1,325,000 | | | $ | 1,404,500 | |
BWX Technologies, Inc.,
5.375%, 7/15/2026 (n) | | | 1,995,000 | | | | 2,114,700 | |
| CFX Escrow Corp., 6.375%, 2/15/2026 (n) | | | 1,015,000 | | | | 1,106,350 | |
| EnerSys, 5%, 4/30/2023 (n) | | | 1,700,000 | | | | 1,780,750 | |
| EnerSys, 4.375%, 12/15/2027 (n) | | | 295,000 | | | | 291,342 | |
| Gates Global LLC, 6.25%, 1/15/2026 (n) | | | 1,170,000 | | | | 1,190,136 | |
| Granite Holdings U.S. Acquisition Co., 11%, 10/01/2027 (n) | | | 520,000 | | | | 526,500 | |
| MTS Systems Corp., 5.75%, 8/15/2027 (n) | | | 1,205,000 | | | | 1,259,225 | |
| Stevens Holding Co., Inc., 6.125%, 10/01/2026 (n) | | | 1,145,000 | | | | 1,250,912 | |
| TriMas Corp., 4.875%, 10/15/2025 (n) | | | 2,490,000 | | | | 2,564,700 | |
| | | | | | | | |
| | | | | | $ | 13,489,115 | |
| | | | | | | | |
| Construction – 1.2% | | | | | |
| Mattamy Group Corp., 6.5%, 10/01/2025 (n) | | $ | 1,405,000 | | | $ | 1,499,838 | |
Mattamy Group Corp.,
5.25%, 12/15/2027 (n) | | | 510,000 | | | | 530,400 | |
| Toll Brothers Finance Corp., 4.875%, 11/15/2025 | | | 965,000 | | | | 1,051,850 | |
| Toll Brothers Finance Corp., 4.35%, 2/15/2028 | | | 1,360,000 | | | | 1,417,800 | |
| | | | | | | | |
| | | | | | $ | 4,499,888 | |
| | | | | | | | |
| Consumer Products – 1.3% | | | | | |
| Coty, Inc., 6.5%, 4/15/2026 (n) | | $ | 805,000 | | | $ | 847,263 | |
Energizer Holdings, Inc.,
6.375%, 7/15/2026 (n) | | | 1,360,000 | | | | 1,448,400 | |
| Mattel, Inc., 6.75%, 12/31/2025 (n) | | | 640,000 | | | | 687,872 | |
| Mattel, Inc., 5.875%, 12/15/2027 (n) | | | 1,076,000 | | | | 1,133,835 | |
| Prestige Brands, Inc., 5.125%, 1/15/2028 (n) | | | 590,000 | | | | 618,025 | |
| | | | | | | | |
| | | | | | $ | 4,735,395 | |
| | | | | | | | |
| Consumer Services – 2.1% | | | | | |
| Allied Universal Holdco LLC, 9.75%, 7/15/2027 (z) | | $ | 930,000 | | | $ | 993,491 | |
Carriage Services, Inc.,
6.625%, 6/01/2026 (n) | | | 490,000 | | | | 521,850 | |
| Cimpress N.V., 7%, 6/15/2026 (n) | | | 1,230,000 | | | | 1,319,175 | |
| Frontdoor, Inc., 6.75%, 8/15/2026 (n) | | | 1,025,000 | | | | 1,117,250 | |
GWB-CR Security Corp.,
9.5%, 11/01/2027 (n) | | | 543,000 | | | | 579,653 | |
| NVA Holdings, Inc., 6.875%, 4/01/2026 (n) | | | 640,000 | | | | 692,000 | |
9
MFS High Yield Portfolio
Portfolio of Investments – continued
| | | | | | | | |
| | |
| Issuer | | Shares/Par | | | Value ($) | |
| BONDS – continued | | | | | | | | |
| Consumer Services – continued | | | | | |
| Photo Holdings Merger Sub, Inc., 8.5%, 10/01/2026 (n) | | $ | 195,000 | | | $ | 181,350 | |
| Realogy Group LLC, 9.375%, 4/01/2027 (n) | | | 1,050,000 | | | | 1,095,633 | |
ServiceMaster Co. LLC,
5.125%, 11/15/2024 (n) | | | 1,085,000 | | | | 1,125,687 | |
| | | | | | | | |
| | | | | | $ | 7,626,089 | |
| | | | | | | | |
| Containers – 3.5% | | | | | |
| ARD Finance S.A., 6.5%, (6.5% cash or 7.25% PIK) 6/30/2027 (n)(p) | | $ | 1,100,000 | | | $ | 1,137,345 | |
| Crown American LLC, 4.5%, 1/15/2023 | | | 1,112,000 | | | | 1,168,990 | |
| Crown Americas LLC/Crown Americas Capital Corp. V, 4.25%, 9/30/2026 | | | 1,880,000 | | | | 1,971,650 | |
| Crown Americas LLC/Crown Americas Capital Corp. VI, 4.75%, 2/01/2026 | | | 775,000 | | | | 818,594 | |
| Flex Acquisition Co., Inc., 6.875%, 1/15/2025 (n) | | | 1,100,000 | | | | 1,108,250 | |
| Reynolds Group, 5.75%, 10/15/2020 | | | 600,847 | | | | 601,598 | |
| Reynolds Group, 5.125%, 7/15/2023 (n) | | | 960,000 | | | | 982,800 | |
| Reynolds Group, 7%, 7/15/2024 (n) | | | 370,000 | | | | 382,488 | |
| Sealed Air Corp., 4.875%, 12/01/2022 (n) | | | 1,425,000 | | | | 1,508,719 | |
| Silgan Holdings, Inc., 4.75%, 3/15/2025 | | | 1,385,000 | | | | 1,416,162 | |
| Silgan Holdings, Inc., 4.125%, 2/01/2028 (n) | | | 580,000 | | | | 580,174 | |
| Trivium Packaging Finance B.V., 8.5%, 8/15/2027 (n) | | | 1,155,000 | | | | 1,284,937 | |
| | | | | | | | |
| | | | | | $ | 12,961,707 | |
| | | | | | | | |
| Electrical Equipment – 0.5% | | | | | |
| CommScope Technologies LLC, 6%, 6/15/2025 (n) | | $ | 775,000 | | | $ | 775,876 | |
| CommScope Technologies LLC, 5%, 3/15/2027 (n) | | | 1,185,000 | | | | 1,113,900 | |
| | | | | | | | |
| | | | | | $ | 1,889,776 | |
| | | | | | | | |
| Electronics – 1.8% | | | | | |
| Entegris, Inc., 4.625%, 2/10/2026 (n) | | $ | 1,460,000 | | | $ | 1,511,100 | |
| Qorvo, Inc., 5.5%, 7/15/2026 | | | 1,035,000 | | | | 1,102,275 | |
| Sensata Technologies B.V., 5.625%, 11/01/2024 (n) | | | 1,555,000 | | | | 1,729,938 | |
Sensata Technologies B.V.,
5%, 10/01/2025 (n) | | | 2,080,000 | | | | 2,259,400 | |
| | | | | | | | |
| | | | | | $ | 6,602,713 | |
| | | | | | | | |
| Energy – Independent – 2.6% | | | | | |
| Callon Petroleum Co., 6.375%, 7/01/2026 | | $ | 925,000 | | | $ | 938,510 | |
| Carrizo Oil & Gas, Inc., 8.25%, 7/15/2025 | | | 143,000 | | | | 146,218 | |
| CrownRock LP/CrownRock Finance, Inc., 5.625%, 10/15/2025 (n) | | | 1,120,000 | | | | 1,142,400 | |
| Highpoint Operating Corp., 7%, 10/15/2022 | | | 345,000 | | | | 327,750 | |
| Hilcorp Energy I/Hilcorp Finance Co., 5.75%, 10/01/2025 (n) | | | 242,400 | | | | 236,350 | |
| Jagged Peak Energy LLC, 5.875%, 5/01/2026 | | | 695,000 | | | | 717,574 | |
| Laredo Petroleum, Inc., 6.25%, 3/15/2023 | | | 305,500 | | | | 286,406 | |
| Magnolia Oil & Gas Operating LLC/Magnolia Oil & Gas Finance Corp., 6%, 8/01/2026 (n) | | | 905,000 | | | | 927,625 | |
| | | | | | | | |
| | |
| Issuer | | Shares/Par | | | Value ($) | |
| BONDS – continued | | | | | | | | |
| Energy – Independent – continued | | | | | |
| Montage Resources Corp., 8.875%, 7/15/2023 | | $ | 345,000 | | | $ | 318,262 | |
| Parsley Energy LLC/Parsley Finance Corp., 5.625%, 10/15/2027 (n) | | | 970,000 | | | | 1,025,775 | |
| QEP Resources, Inc., 5.625%, 3/01/2026 | | | 242,400 | | | | 236,401 | |
| Range Resources Corp., 4.875%, 5/15/2025 | | | 607,400 | | | | 519,327 | |
Sanchez Energy Corp.,
6.125%, 1/15/2023 (a)(d) | | | 1,180,000 | | | | 53,100 | |
| SM Energy Co., 6.75%, 9/15/2026 | | | 605,000 | | | | 592,900 | |
| Southwestern Energy Co., 6.2%, 1/23/2025 | | | 452,400 | | | | 414,941 | |
| Southwestern Energy Co., 7.5%, 4/01/2026 | | | 290,900 | | | | 269,082 | |
| WPX Energy, Inc., 5.75%, 6/01/2026 | | | 1,365,000 | | | | 1,457,137 | |
| | | | | | | | |
| | | | | | $ | 9,609,758 | |
| | | | | | | | |
| Entertainment – 1.5% | | | | | |
| Live Nation Entertainment, Inc., 4.875%, 11/01/2024 (n) | | $ | 545,000 | | | $ | 564,075 | |
| Live Nation Entertainment, Inc., 5.625%, 3/15/2026 (n) | | | 2,035,000 | | | | 2,167,275 | |
| Live Nation Entertainment, Inc., 4.75%, 10/15/2027 (n) | | | 290,000 | | | | 300,150 | |
| Six Flags Entertainment Corp., 4.875%, 7/31/2024 (n) | | | 2,395,000 | | | | 2,481,819 | |
| | | | | | | | |
| | | | | | $ | 5,513,319 | |
| | | | | | | | |
| Financial Institutions – 3.3% | | | | | |
| Avation Capital S.A., 6.5%, 5/15/2021 (n) | | $ | 635,000 | | | $ | 659,606 | |
| Avolon Holdings Funding Ltd., 5.125%, 10/01/2023 | | | 935,000 | | | | 1,007,818 | |
| Avolon Holdings Funding Ltd., 3.95%, 7/01/2024 (n) | | | 611,000 | | | | 636,723 | |
| Credit Acceptance Corp., 5.125%, 12/31/2024 (n) | | | 995,000 | | | | 1,033,268 | |
| Global Aircraft Leasing Co. Ltd., 6.5%, (6.5% cash or 7.25% PIK) 9/15/2024 (n)(p) | | | 2,287,000 | | | | 2,386,370 | |
| Nationstar Mortgage Holdings, Inc., 8.125%, 7/15/2023 (n) | | | 1,265,000 | | | | 1,339,028 | |
| OneMain Financial Corp., 6.875%, 3/15/2025 | | | 845,000 | | | | 961,187 | |
| OneMain Financial Corp., 7.125%, 3/15/2026 | | | 875,000 | | | | 1,011,675 | |
| Park Aerospace Holdings Ltd., 5.5%, 2/15/2024 (n) | | | 2,435,000 | | | | 2,673,411 | |
| Springleaf Finance Corp., 5.375%, 11/15/2029 | | | 410,000 | | | | 427,958 | |
| | | | | | | | |
| | | | | | $ | 12,137,044 | |
| | | | | | | | |
| Food & Beverages – 3.3% | | | | | |
| Cott Holdings, Inc., 5.5%, 4/01/2025 (n) | | $ | 1,405,000 | | | $ | 1,468,225 | |
| JBS USA LLC/JBS USA Finance, Inc., 6.75%, 2/15/2028 (n) | | | 2,090,000 | | | | 2,309,471 | |
| JBS USA Lux S.A./JBS USA Finance, Inc., 5.875%, 7/15/2024 (n) | | | 945,000 | | | | 972,405 | |
| Lamb Weston Holdings, Inc., 4.625%, 11/01/2024 (n) | | | 2,775,000 | | | | 2,944,968 | |
10
MFS High Yield Portfolio
Portfolio of Investments – continued
| | | | | | | | |
| | |
| Issuer | | Shares/Par | | | Value ($) | |
| BONDS – continued | | | | | | | | |
| Food & Beverages – continued | | | | | |
| Performance Food Group Co., 5.5%, 10/15/2027 (n) | | $ | 1,060,000 | | | $ | 1,132,875 | |
| Pilgrim’s Pride Corp., 5.75%, 3/15/2025 (n) | | | 495,000 | | | | 511,647 | |
| Pilgrim’s Pride Corp., 5.875%, 9/30/2027 (n) | | | 995,000 | | | | 1,075,844 | |
| U.S. Foods Holding Corp., 5.875%, 6/15/2024 (n) | | | 1,750,000 | | | | 1,802,500 | |
| | | | | | | | |
| | | | | | $ | 12,217,935 | |
| | | | | | | | |
| Gaming & Lodging – 5.1% | | | | | |
| CCM Merger, Inc., 6%, 3/15/2022 (n) | | $ | 1,220,000 | | | $ | 1,244,400 | |
| GLP Capital LP/GLP Financing II, Inc., 5.375%, 11/01/2023 | | | 625,000 | | | | 680,050 | |
| GLP Capital LP/GLP Financing II, Inc., 5.25%, 6/01/2025 | | | 1,245,000 | | | | 1,366,512 | |
| GLP Capital LP/GLP Financing II, Inc., 5.375%, 4/15/2026 | | | 585,000 | | | | 646,659 | |
| Hilton Domestic Operating Co., Inc., 5.125%, 5/01/2026 | | | 1,975,000 | | | | 2,078,687 | |
| Hilton Worldwide Finance LLC, 4.625%, 4/01/2025 | | | 1,645,000 | | | | 1,690,237 | |
| MGM Growth Properties LLC, 4.5%, 9/01/2026 | | | 1,760,000 | | | | 1,852,400 | |
Scientific Games Corp.,
8.25%, 3/15/2026 (n) | | | 1,190,000 | | | | 1,311,975 | |
| Scientific Games International, Inc., 7%, 5/15/2028 (n) | | | 490,000 | | | | 524,300 | |
VICI Properties LP, REIT,
4.25%, 12/01/2026 (n) | | | 1,705,000 | | | | 1,756,150 | |
| VICI Properties LP, REIT, 4.625%, 12/01/2029 (n) | | | 410,000 | | | | 428,450 | |
| Wyndham Hotels Group LLC, 5.375%, 4/15/2026 (n) | | | 2,775,000 | | | | 2,927,625 | |
| Wynn Las Vegas LLC/Wynn Las Vegas Capital Corp., 5.5%, 3/01/2025 (n) | | | 1,090,000 | | | | 1,167,663 | |
| Wynn Las Vegas LLC/Wynn Las Vegas Capital Corp., 5.25%, 5/15/2027 (n) | | | 920,000 | | | | 977,500 | |
| | | | | | | | |
| | | | | | $ | 18,652,608 | |
| | | | | | | | |
| Insurance – Health – 0.7% | | | | | |
| Centene Corp., 6.125%, 2/15/2024 | | $ | 750,000 | | | $ | 778,125 | |
| Centene Corp., 5.375%, 6/01/2026 (n) | | | 1,195,000 | | | | 1,268,194 | |
| Centene Corp., 4.25%, 12/15/2027 (n) | | | 705,000 | | | | 725,269 | |
| | | | | | | | |
| | | | | | $ | 2,771,588 | |
| | | | | | | | |
| Insurance – Property & Casualty – 0.9% | | | | | |
| Alliant Holdings Intermediate LLC, 6.75%, 10/15/2027 (z) | | $ | 990,000 | | | $ | 1,060,241 | |
| AssuredPartners, Inc., 7%, 8/15/2025 (z) | | | 655,000 | | | | 666,266 | |
| Hub International Ltd., 7%, 5/01/2026 (z) | | | 1,655,000 | | | | 1,750,162 | |
| | | | | | | | |
| | | | | | $ | 3,476,669 | |
| | | | | | | | |
| Major Banks – 1.2% | | | | | |
| Barclays PLC, 7.875%, 12/29/2049 | | $ | 1,110,000 | | | $ | 1,196,025 | |
Credit Suisse Group AG,
7.25%, 12/29/2049 (n) | | | 1,045,000 | | | | 1,166,481 | |
| | | | | | | | |
| | |
| Issuer | | Shares/Par | | | Value ($) | |
| BONDS – continued | | | | | | | | |
| Major Banks – continued | | | | | |
| UBS Group AG, 6.875% to 8/07/2025, FLR (Swap Rate - 5yr. + 4.59%) to 12/29/2049 | | $ | 1,745,000 | | | $ | 1,930,407 | |
| | | | | | | | |
| | | | | | $ | 4,292,913 | |
| | | | | | | | |
| Medical & Health Technology & Services – 7.2% | | | | | |
| Avantor, Inc., 9%, 10/01/2025 (n) | | $ | 2,015,000 | | | $ | 2,251,823 | |
| BCPE Cycle Merger Sub II, Inc., 10.625%, 7/15/2027 (n) | | | 540,000 | | | | 553,500 | |
| DaVita, Inc., 5%, 5/01/2025 | | | 1,375,000 | | | | 1,414,531 | |
| Encompass Health Corp., 5.75%, 9/15/2025 | | | 695,000 | | | | 728,013 | |
| Encompass Health Corp., 4.5%, 2/01/2028 | | | 420,000 | | | | 435,225 | |
| HCA, Inc., 7.5%, 2/15/2022 | | | 1,430,000 | | | | 1,580,150 | |
| HCA, Inc., 5.375%, 2/01/2025 | | | 3,260,000 | | | | 3,605,006 | |
| HCA, Inc., 5.875%, 2/15/2026 | | | 1,870,000 | | | | 2,126,433 | |
| HCA, Inc., 5.625%, 9/01/2028 | | | 340,000 | | | | 387,464 | |
| HealthSouth Corp., 5.125%, 3/15/2023 | | | 1,365,000 | | | | 1,388,887 | |
| HealthSouth Corp., 5.75%, 11/01/2024 | | | 288,000 | | | | 291,240 | |
| Heartland Dental LLC, 8.5%, 5/01/2026 (n) | | | 735,000 | | | | 752,456 | |
| IQVIA Holdings, Inc., 5%, 10/15/2026 (n) | | | 1,400,000 | | | | 1,477,000 | |
| IQVIA Holdings, Inc., 5%, 5/15/2027 (n) | | | 2,560,000 | | | | 2,708,109 | |
| MPH Acquisition Holdings LLC, 7.125%, 6/01/2024 (n) | | | 980,000 | | | | 948,150 | |
| Polaris, 8.5%, (8.5% cash or 8.5% PIK) 12/01/2022 (n)(p) | | | 565,000 | | | | 526,156 | |
| Regional Care/LifePoint Health, Inc., 9.75%, 12/01/2026 (n) | | | 1,380,000 | | | | 1,559,400 | |
| Team Health Holdings, Inc., 6.375%, 2/01/2025 (n) | | | 315,000 | | | | 210,263 | |
Tenet Healthcare Corp.,
4.875%, 1/01/2026 (n) | | | 1,355,000 | | | | 1,419,227 | |
| Tenet Healthcare Corp., 5.125%, 11/01/2027 (n) | | | 970,000 | | | | 1,024,562 | |
| West Street Merger Sub, Inc., 6.375%, 9/01/2025 (n) | | | 1,050,000 | | | | 1,047,375 | |
| | | | | | | | |
| | | | | | $ | 26,434,970 | |
| | | | | | | | |
| Medical Equipment – 1.0% | | | | | |
Hill-Rom Holdings, Inc.,
4.375%, 9/15/2027 (n) | | $ | 1,280,000 | | | $ | 1,316,800 | |
| Teleflex, Inc., 4.875%, 6/01/2026 | | | 785,000 | | | | 820,325 | |
| Teleflex, Inc., 4.625%, 11/15/2027 | | | 1,525,000 | | | | 1,616,210 | |
| | | | | | | | |
| | | | | | $ | 3,753,335 | |
| | | | | | | | |
| Metals & Mining – 3.5% | | | | | |
| Baffinland Iron Mines Corp./Baffinland | | | | | | | | |
| Iron Mines LP, 8.75%, 7/15/2026 (n) | | $ | 665,000 | | | $ | 669,987 | |
| Cleveland-Cliffs, Inc., 5.875%, 6/01/2027 (n) | | | 390,000 | | | | 374,400 | |
| Compass Minerals International, Inc., 6.75%, 12/01/2027 (n) | | | 785,000 | | | | 834,062 | |
| Freeport-McMoRan Copper & Gold, Inc., 5.4%, 11/14/2034 | | | 990,000 | | | | 1,037,025 | |
| Freeport-McMoRan, Inc., 5%, 9/01/2027 | | | 1,015,000 | | | | 1,065,750 | |
| Freeport-McMoRan, Inc., 5.25%, 9/01/2029 | | | 865,000 | | | | 926,674 | |
| Grinding Media,Inc./Moly-Cop AltaSteel Ltd., 7.375%, 12/15/2023 (n) | | | 530,000 | | | | 539,938 | |
| Harsco Corp., 5.75%, 7/31/2027 (n) | | | 1,030,000 | | | | 1,098,258 | |
11
MFS High Yield Portfolio
Portfolio of Investments – continued
| | | | | | | | |
| | |
| Issuer | | Shares/Par | | | Value ($) | |
| BONDS – continued | | | | | | | | |
| Metals & Mining – continued | | | | | |
Kaiser Aluminum Corp.,
4.625%, 3/01/2028 (n) | | $ | 1,905,000 | | | $ | 1,954,530 | |
| Northwest Acquisitions ULC/Dominion Finco, Inc., 7.125%, 11/01/2022 (n) | | | 1,045,000 | | | | 783,750 | |
| Novelis Corp., 5.875%, 9/30/2026 (n) | | | 1,715,000 | | | | 1,824,940 | |
| Petra Diamonds U.S. Treasury PLC, 7.25%, 5/01/2022 (n) | | | 200,000 | | | | 126,250 | |
| SunCoke Energy Partners LP/SunCoke Energy Partners Finance Corp., 7.5%, 6/15/2025 (n) | | | 465,000 | | | | 447,177 | |
TMS International Corp.,
7.25%, 8/15/2025 (n) | | | 1,345,000 | | | | 1,216,109 | |
| | | | | | | | |
| | | | | | $ | 12,898,850 | |
| | | | | | | | |
| Midstream – 2.4% | | | | | |
| Cheniere Energy Partners LP, 5.25%, 10/01/2025 | | $ | 2,790,000 | | | $ | 2,907,431 | |
| Cheniere Energy, Inc., 4.5%, 10/01/2029 (n) | | | 604,000 | | | | 620,670 | |
| Genesis Energy LP/Genesis Energy Finance Co., 6.25%, 5/15/2026 | | | 745,500 | | | | 711,953 | |
| Targa Resources Partners LP/Targa Resources Finance Corp., 5.25%, 5/01/2023 | | | 1,365,000 | | | | 1,378,650 | |
| Targa Resources Partners LP/Targa Resources Finance Corp., 5.125%, 2/01/2025 (n) | | | 875,000 | | | | 907,812 | |
| Targa Resources Partners LP/Targa Resources Finance Corp., 5.375%, 2/01/2027 | | | 1,410,000 | | | | 1,462,875 | |
| Targa Resources Partners LP/Targa Resources Finance Corp., 6.875%, 1/15/2029 (n) | | | 685,000 | | | | 760,350 | |
| | | | | | | | |
| | | | | | $ | 8,749,741 | |
| | | | | | | | |
| Network & Telecom – 0.4% | | | | | |
| C&W Senior Financing DAC, 6.875%, 9/15/2027 (n) | | $ | 655,000 | | | $ | 700,411 | |
| Zayo Group LLC/Zayo Capital, Inc., 5.75%, 1/15/2027 (n) | | | 850,000 | | | | 863,813 | |
| | | | | | | | |
| | | | | | $ | 1,564,224 | |
| | | | | | | | |
| Oil Services – 0.6% | | | | | |
| Apergy Corp., 6.375%, 5/01/2026 | | $ | 1,080,000 | | | $ | 1,139,400 | |
| Diamond Offshore Drill Co., 5.7%, 10/15/2039 | | | 910,000 | | | | 532,350 | |
| Ensign Drilling, Inc., 9.25%, 4/15/2024 (n) | | | 515,000 | | | | 486,031 | |
| | | | | | | | |
| | | | | | $ | 2,157,781 | |
| | | | | | | | |
| Oils – 0.8% | | | | | |
| Parkland Fuel Corp., 6%, 4/01/2026 (n) | | $ | 1,450,000 | | | $ | 1,531,635 | |
| PBF Holding Co. LLC/PBF Finance Corp., 7%, 11/15/2023 | | | 260,000 | | | | 269,750 | |
| PBF Holding Co. LLC/PBF Finance Corp., 7.25%, 6/15/2025 | | | 1,120,000 | | | | 1,195,600 | |
| | | | | | | | |
| | | | | | $ | 2,996,985 | |
| | | | | | | | |
| | | | | | | | |
| | |
| Issuer | | Shares/Par | | | Value ($) | |
| BONDS – continued | | | | | | | | |
| Pharmaceuticals – 1.6% | | | | | |
| Bausch Health Companies, Inc., 5.5%, 3/01/2023 (n) | | $ | 464,000 | | | $ | 466,320 | |
| Bausch Health Companies, Inc., 6.125%, 4/15/2025 (n) | | | 3,095,000 | | | | 3,197,847 | |
| Bausch Health Companies, Inc., 5%, 1/30/2028 (n) | | | 290,000 | | | | 297,653 | |
Eagle Holding Co. II LLC,
7.625%, 5/15/2022 (n) | | | 940,000 | | | | 954,796 | |
Eagle Holding Co. II LLC,
7.75%, 5/15/2022 (n) | | | 315,000 | | | | 319,845 | |
| Endo Finance LLC/Endo Finco, Inc., 5.375%, 1/15/2023 (n) | | | 820,000 | | | | 552,819 | |
| | | | | | | | |
| | | | | | $ | 5,789,280 | |
| | | | | | | | |
| Pollution Control – 0.8% | | | | | |
| Covanta Holding Corp., 5.875%, 3/01/2024 | | $ | 990,000 | | | $ | 1,018,463 | |
| Covanta Holding Corp., 6%, 1/01/2027 | | | 350,000 | | | | 369,250 | |
| GFL Environmental, Inc., 7%, 6/01/2026 (n) | | | 650,000 | | | | 686,660 | |
GFL Environmental, Inc.,
8.5%, 5/01/2027 (n) | | | 800,000 | | | | 880,000 | |
| | | | | | | | |
| | | | | | $ | 2,954,373 | |
| | | | | | | | |
| Printing & Publishing – 0.4% | | | | | |
| Nielsen Co. Lux S.à r.l., 5%, 2/01/2025 (n) | | $ | 315,000 | | | $ | 324,450 | |
| Nielsen Finance LLC, 5%, 4/15/2022 (n) | | | 1,120,000 | | | | 1,124,200 | |
| | | | | | | | |
| | | | | | $ | 1,448,650 | |
| | | | | | | | |
| Real Estate – Healthcare – 0.6% | | | | | |
| MPT Operating Partnership LP/MPT Financial Co., REIT, 5.25%, 8/01/2026 | | $ | 1,125,000 | | | $ | 1,188,495 | |
| MPT Operating Partnership LP/MPT Financial Co., REIT, 5%, 10/15/2027 | | | 960,000 | | | | 1,017,600 | |
| | | | | | | | |
| | | | | | $ | 2,206,095 | |
| | | | | | | | |
| Real Estate – Other – 0.7% | | | | | |
| Ryman Hospitality Properties, Inc., REIT, 5%, 4/15/2023 | | $ | 800,000 | | | $ | 816,000 | |
| Ryman Hospitality Properties, Inc., REIT, 4.75%, 10/15/2027 (n) | | | 1,556,000 | | | | 1,606,570 | |
| | | | | | | | |
| | | | | | $ | 2,422,570 | |
| | | | | | | | |
| Restaurants – 1.4% | | | | | |
| Golden Nugget, Inc., 6.75%, 10/15/2024 (n) | | $ | 1,205,000 | | | $ | 1,247,175 | |
KFC Holding Co./Pizza Hut Holdings LLC/Taco Bell of America LLC,
5.25%, 6/01/2026 (n) | | | 2,910,000 | | | | 3,070,050 | |
| Yum! Brands, Inc., 4.75%, 1/15/2030 (n) | | | 800,000 | | | | 838,000 | |
| | | | | | | | |
| | | | | | $ | 5,155,225 | |
| | | | | | | | |
| Retailers – 1.2% | | | | | |
| DriveTime Automotive Group, Inc., 8%, 6/01/2021 (n) | | $ | 1,115,000 | | | $ | 1,133,119 | |
EG Global Finance PLC,
6.75%, 2/07/2025 (n) | | | 645,000 | | | | 654,675 | |
EG Global Finance PLC,
8.5%, 10/30/2025 (n) | | | 335,000 | | | | 355,519 | |
12
MFS High Yield Portfolio
Portfolio of Investments – continued
| | | | | | | | |
| | |
| Issuer | | Shares/Par | | | Value ($) | |
| BONDS – continued | | | | | | | | |
| Retailers – continued | | | | | |
| L Brands, Inc., 5.25%, 2/01/2028 | | $ | 1,675,000 | | | $ | 1,587,062 | |
| Sally Beauty Holdings, Inc., 5.625%, 12/01/2025 | | | 580,000 | | | | 607,335 | |
| | | | | | | | |
| | | | | | $ | 4,337,710 | |
| | | | | | | | |
| Specialty Chemicals – 0.5% | | | | | |
| Koppers, Inc., 6%, 2/15/2025 (n) | | $ | 815,000 | | | $ | 853,713 | |
| Univar Solutions USA, Inc., 5.125%, 12/01/2027 (n) | | | 1,040,000 | | | | 1,085,531 | |
| | | | | | | | |
| | | | | | $ | 1,939,244 | |
| | | | | | | | |
| Specialty Stores – 0.6% | | | | | |
| Penske Automotive Group Co., 5.375%, 12/01/2024 | | $ | 910,000 | | | $ | 936,162 | |
| Penske Automotive Group Co., 5.5%, 5/15/2026 | | | 720,000 | | | | 754,200 | |
| PetSmart, Inc., 5.875%, 6/01/2025 (n) | | | 646,000 | | | | 658,113 | |
| | | | | | | | |
| | | | | | $ | 2,348,475 | |
| | | | | | | | |
| Supermarkets – 0.7% | | | | | |
| Albertsons Cos. LLC/Safeway, Inc., 6.625%, 6/15/2024 | | $ | 506,000 | | | $ | 529,610 | |
| Albertsons Cos. LLC/Safeway, Inc., 5.75%, 3/15/2025 | | | 805,000 | | | | 833,175 | |
| Albertsons Cos. LLC/Safeway, Inc., 4.625%, 1/15/2027 (n) | | | 1,025,000 | | | | 1,023,770 | |
| Albertsons Cos. LLC/Safeway, Inc., 5.875%, 2/15/2028 (n) | | | 80,000 | | | | 85,000 | |
| | | | | | | | |
| | | | | | $ | 2,471,555 | |
| | | | | | | | |
| Telecommunications – Wireless – 5.4% | | | | | |
| Altice France S.A., 7.375%, 5/01/2026 (n) | | $ | 1,625,000 | | | $ | 1,744,665 | |
| Altice France S.A., 8.125%, 2/01/2027 (n) | | | 1,285,000 | | | | 1,447,231 | |
| Altice France S.A., 5.5%, 1/15/2028 (n) | | | 405,000 | | | | 416,158 | |
Altice Luxembourg S.A.,
7.625%, 2/15/2025 (n) | | | 1,990,000 | | | | 2,069,600 | |
| Digicel International Finance Ltd., 8.75%, 5/25/2024 (n) | | | 530,000 | | | | 516,750 | |
| SBA Communications Corp., 4%, 10/01/2022 | | | 1,745,000 | | | | 1,777,719 | |
| SBA Communications Corp., 4.875%, 9/01/2024 | | | 1,725,000 | | | | 1,789,687 | |
| Sprint Corp., 7.875%, 9/15/2023 | | | 1,690,000 | | | | 1,864,628 | |
| Sprint Corp., 7.125%, 6/15/2024 | | | 3,020,000 | | | | 3,257,825 | |
| T-Mobile USA, Inc., 6.5%, 1/15/2024 | | | 630,000 | | | | 648,125 | |
| T-Mobile USA, Inc., 5.125%, 4/15/2025 | | | 1,040,000 | | | | 1,075,849 | |
| T-Mobile USA, Inc., 6.5%, 1/15/2026 | | | 965,000 | | | | 1,034,682 | |
| T-Mobile USA, Inc., 5.375%, 4/15/2027 | | | 1,980,000 | | | | 2,108,700 | |
| | | | | | | | |
| | | | | | $ | 19,751,619 | |
| | | | | | | | |
| Utilities – Electric Power – 2.7% | | | | | |
| Clearway Energy Operating LLC, 5.75%, 10/15/2025 | | $ | 2,750,000 | | | $ | 2,894,375 | |
| Clearway Energy Operating LLC, 4.75%, 3/15/2028 (n) | | | 465,000 | | | | 471,394 | |
| Drax Finco PLC, 6.625%, 11/01/2025 (n) | | | 1,020,000 | | | | 1,083,750 | |
| | | | | | | | |
| | |
| Issuer | | Shares/Par | | | Value ($) | |
| BONDS – continued | | | | | | | | |
| Utilities – Electric Power – continued | | | | | |
| NextEra Energy Operating Co., 4.25%, 9/15/2024 (n) | | $ | 1,910,000 | | | $ | 1,986,400 | |
| NextEra Energy Operating Co., 4.5%, 9/15/2027 (n) | | | 640,000 | | | | 667,200 | |
| NextEra Energy, Inc., 4.25%, 7/15/2024 (n) | | | 768,000 | | | | 799,680 | |
| TerraForm Global Operating LLC, 6.125%, 3/01/2026 (n) | | | 415,000 | | | | 431,600 | |
| Terraform Power Operating Co., 5%, 1/31/2028 (n) | | | 1,460,000 | | | | 1,543,672 | |
| | | | | | | | |
| | | | | | $ | 9,878,071 | |
| | | | | | | | |
Total Bonds
(Identified Cost, $343,401,170) | | | | | | $ | 352,378,180 | |
| | | | | | | | |
|
| FLOATING RATE LOANS (r) – 1.5% | |
| Broadcasting – 0.3% | | | | | |
| iHeartCommunications, Inc., Term Loan, 5.691%, 5/01/2026 | | $ | 275,073 | | | $ | 277,382 | |
| Nexstar Broadcasting, Inc., Term Loan B4, 9/18/2026 (o) | | | 335,160 | | | | 336,649 | |
| WMG Acquisition Corp., Term Loan F, 3.924%, 11/01/2023 (o) | | | 655,000 | | | | 657,968 | |
| | | | | | | | |
| | | | | | $ | 1,271,999 | |
| | | | | | | | |
| Cable TV – 0.1% | | | | | |
| CSC Holdings LLC, Term Loan B5, 4.239%, 4/15/2027 | | $ | 336,000 | | | $ | 337,260 | |
| | | | | | | | |
| Chemicals – 0.2% | | | | | |
| Axalta Coating Systems U.S. Holdings, Inc., Term Loan B3, 6/01/2024 (o) | | $ | 320,000 | | | $ | 320,440 | |
| Platform Specialty Products Corp., Term Loan, 1/30/2026 (o) | | | 336,000 | | | | 337,365 | |
| | | | | | | | |
| | | | | | $ | 657,805 | |
| | | | | | | | |
| Computer Software – Systems – 0.2% | | | | | |
| Sabre GLBL, Inc., Term Loan B, 3.799%, 2/22/2024 | | $ | 669,293 | | | $ | 672,639 | |
| SS&C Technologies, Inc., Term Loan B5, 4.049%, 4/16/2025 | | | 335,144 | | | | 337,239 | |
| | | | | | | | |
| | | | | | $ | 1,009,878 | |
| | | | | | | | |
| Conglomerates – 0.2% | | | | | |
| Gates Global LLC, Term Loan B2, 4.549%, 4/01/2024 | | $ | 710,345 | | | $ | 710,456 | |
| | | | | | | | |
| Food & Beverages – 0.1% | | | | | |
| U.S. Foods, Inc., Term Loan B, 3.549%, 6/27/2023 | | $ | 314,921 | | | $ | 315,652 | |
| | | | | | | | |
| Medical & Health Technology & Services – 0.2% | | | | | |
| DaVita, Inc., Term Loan B, 4.049%, 8/12/2026 | | $ | 335,160 | | | $ | 337,290 | |
| Jaguar Holding Company II, Term Loan, 8/18/2022 (o) | | | 335,122 | | | | 336,612 | |
| | | | | | | | |
| | | | | | $ | 673,902 | |
| | | | | | | | |
| Pharmaceuticals – 0.1% | | | | | |
| Bausch Health Companies, Inc., Term Loan B, 11/27/2025 (o) | | $ | 326,400 | | | $ | 328,195 | |
| | | | | | | | |
13
MFS High Yield Portfolio
Portfolio of Investments – continued
| | | | | | | | |
| | |
| Issuer | | Shares/Par | | | Value ($) | |
| FLOATING RATE LOANS (r) – continued | |
| Printing & Publishing – 0.1% | | | | | |
| Nielsen Finance LLC, Term Loan B4, 3.71%, 10/04/2023 | | $ | 336,000 | | | $ | 336,933 | |
| | | | | | | | |
Total Floating Rate Loans
(Identified Cost, $5,603,941) | | | | | | $ | 5,642,080 | |
| | | | | | | | |
| | |
| COMMON STOCKS – 0.2% | | | | | | | | |
| Construction – 0.1% | | | | | |
| ICA Tenedora, S.A. de C.V. (a) | | | 147,380 | | | $ | 281,956 | |
| | | | | | | | |
| Oil Services – 0.1% | | | | | | | | |
| LTRI Holdings LP (a)(u) | | | 1,115 | | | $ | 590,281 | |
| | | | | | | | |
Total Common Stocks
(Identified Cost, $663,681) | | | | | | $ | 872,237 | |
| | | | | | | | |
| |
| CONVERTIBLE BONDS – 0.2% | | | | | |
| Cable TV – 0.2% | | | | | | | | |
| DISH Network Corp., 3.375%, 8/15/2026 (Identified Cost, $519,737) | | $ | 570,000 | | | $ | 548,283 | |
| | | | | | | | |
| | | | | | | | | | | | | | | | |
| | | | |
| Issuer | | Strike
Price | | | First
Exercise | | | Shares/Par | | | Value ($) | |
| WARRANTS – 0.0% | | | | | | | | | | | | | |
| Forest & Paper Products – 0.0% | | | | | | | | | |
| Appvion Holdings Corp. - Tranche A (1 share for 1 warrant, Expiration 6/13/23) (a) | | $ | 27.17 | | | | 8/24/18 | | | | 670 | | | $ | 20 | |
| Appvion Holdings Corp. - Tranche B (1 share for 1 warrant, Expiration 6/13/23) (a) | | | 31.25 | | | | 8/24/18 | | | | 670 | | | | 7 | |
| | | | | | | | | | | | | | | | |
Total Warrants
(Identified Cost, $0) | | | | | | | | | | | $ | 27 | |
| | | | | | | | | | | | | | | | |
| |
| INVESTMENT COMPANIES (h) – 1.6% | | | | | |
| Money Market Funds – 1.6% | | | | | | | | | |
| MFS Institutional Money Market Portfolio, 1.7% (v) (Identified Cost, $5,852,157) | | | | 5,851,487 | | | $ | 5,851,487 | |
| | | | | | | | | | | | | | | | |
OTHER ASSETS, LESS
LIABILITIES – 0.8% | | | | | | | | 2,947,563 | |
| | | | | | | | | | | | | | | | |
| NET ASSETS – 100.0% | | | | | | | | | | | $ | 368,239,857 | |
| | | | | | | | | | | | | | | | |
| (a) | | Non-income producing security. |
| (h) | | An affiliated issuer, which may be considered one in which the fund owns 5% or more of the outstanding voting securities, or a company which is under common control. At period end, the aggregate values of the fund’s investments in affiliated issuers and in unaffiliated issuers were $5,851,487 and $359,440,807, respectively. |
| (n) | | Securities exempt from registration under Rule 144A of the Securities Act of 1933. These securities may be sold in the ordinary course of business in transactions exempt from registration, normally to qualified institutional buyers. At period end, the aggregate value of these securities was $240,883,185, representing 65.4% of net assets. |
| (o) | | All or a portion of this position has not settled. Upon settlement date, interest rates for unsettled amounts will be determined. The rate shown, if any, represents the weighted average coupon rate for settled amounts. |
| (p) | | Payment-in-kind (PIK) security for which interest income may be received in additional securities and/or cash. |
| (r) | | The remaining maturities of floating rate loans may be less than the stated maturities shown as a result of contractual or optional prepayments by the borrower. Such prepayments cannot be predicted with certainty. These loans may be subject to restrictions on resale. The interest rate shown represents the weighted average of the floating interest rates on settled contracts within the loan facility at period end, unless otherwise indicated. The floating interest rates on settled contracts are determined periodically by reference to a base lending rate and a spread. |
| (u) | | The security was valued using significant unobservable inputs and is considered level 3 under the fair value hierarchy. For further information about the fund’s level 3 holdings, please see Note 2 in the Notes to Financial Statements. |
| (v) | | Affiliated issuer that is available only to investment companies managed by MFS. The rate quoted for the MFS Institutional Money Market Portfolio is the annualizedseven-day yield of the fund at period end. |
| (z) | | Restricted securities are not registered under the Securities Act of 1933 and are subject to legal restrictions on resale. These securities generally may be resold in transactions exempt from registration or to the public if the securities are subsequently registered. Disposal of these securities may involve time-consuming negotiations and prompt sale at an acceptable price may be difficult. The fund holds the following restricted securities: |
| | | | | | | | | | |
| Restricted Securities | | Acquisition
Date | | Cost | | | Value | |
| | | |
| Alliant Holdings Intermediate LLC, 6.75%, 10/15/2027 | | 10/02/19-10/03/19 | | | $995,813 | | | | $1,060,241 | |
| | | |
| Allied Universal Holdco LLC, 9.75%, 7/15/2027 | | 6/27/19 | | | 923,827 | | | | 993,491 | |
| | | |
| Ascend Learning LLC, 6.875%, 8/01/2025 | | 2/13/19 | | | 1,283,899 | | | | 1,391,250 | |
| | | |
| AssuredPartners, Inc., 7%, 8/15/2025 | | 10/24/17-11/21/17 | | | 676,595 | | | | 666,266 | |
| | | |
| Hub International Ltd., 7%, 5/01/2026 | | 4/18/18-6/28/18 | | | 1,652,443 | | | | 1,750,162 | |
| | | |
| JDA Software Group, Inc., 7.375%, 10/15/2024 | | 10/05/16-6/19/17 | | | 1,087,499 | | | | 1,095,881 | |
| | | |
| Total Restricted Securities | | | | | | | | | $6,957,291 | |
| | | |
| % of Net assets | | | | | | | | | 1.9% | |
14
MFS High Yield Portfolio
Portfolio of Investments – continued
The following abbreviations are used in this report and are defined:
| CDO | | Collateralized Debt Obligation |
| FLR | | Floating Rate. Interest rate resets periodically based on the parenthetically disclosed reference rate plus a spread (if any). Theperiod-end rate reported may not be the current rate. All reference rates are USD unless otherwise noted. |
| LIBOR | | London Interbank Offered Rate |
| REIT | | Real Estate Investment Trust |
Abbreviations indicate amounts shown in currencies other than the U.S. dollar. All amounts are stated in U.S. dollars unless otherwise indicated. A list of abbreviations is shown below:
Derivative Contracts at 12/31/19
Forward Foreign Currency Exchange Contracts
| | | | | | | | | | | | | | | | | | | | |
| Currency Purchased | | Currency Sold | | Counterparty | | Settlement Date | | | Unrealized
Appreciation
(Depreciation) | |
| Asset Derivatives | | | | | | | | | | | | |
| EUR | | | 194,718 | | | | | USD | | 217,042 | | HSBC Bank | | | 2/28/2020 | | | | $2,136 | |
| | | | | | | | | | | | | | | | | | | | |
Futures Contracts
| | | | | | | | | | | | | | | | | | | | | | |
| Description | | Long/
Short | | | Currency | | | Contracts | | | Notional
Amount | | | Expiration
Date | | Value/
Unrealized
Appreciation
(Depreciation) | |
| Asset Derivatives | | | | | | | | | | | |
| Interest Rate Futures | | | | | | | | | | | |
| U.S. Treasury Note 5 yr | | | Short | | | | USD | | | | 82 | | | | $9,725,969 | | | March - 2020 | | | $40,871 | |
| | | | | | | | | | | | | | | | | | | | | | |
At December 31, 2019, the fund had cash collateral of $57,400 to cover any collateral or margin obligations for certain derivative contracts. Restricted cash and/or deposits with brokers in the Statement of Assets and Liabilities are comprised of cash collateral.
See Notes to Financial Statements
15
MFS High Yield Portfolio
FINANCIAL STATEMENTS | STATEMENT OF ASSETS AND LIABILITIES
This statement represents your fund’s balance sheet, which details the assets and liabilities comprising the total value of the fund.
| | | | |
At 12/31/19 | | | | |
| |
Assets | | | | |
Investments in unaffiliated issuers, at value (identified cost, $350,188,529) | | | $359,440,807 | |
Investments in affiliated issuers, at value (identified cost, $5,852,157) | | | 5,851,487 | |
Cash | | | 11,131 | |
Deposits with brokers for | | | | |
Futures contracts | | | 57,400 | |
Receivables for | | | | |
Forward foreign currency exchange contracts | | | 2,136 | |
Net daily variation margin on open futures contracts | | | 1,937 | |
Investments sold | | | 816 | |
Fund shares sold | | | 156,622 | |
Interest | | | 5,048,736 | |
Other assets | | | 2,178 | |
Total assets | | | $370,573,250 | |
| |
Liabilities | | | | |
Payables for | | | | |
Investments purchased | | | $1,994,921 | |
Fund shares reacquired | | | 210,958 | |
Payable to affiliates | | | | |
Investment adviser | | | 16,324 | |
Administrative services fee | | | 312 | |
Shareholder servicing costs | | | 25 | |
Distribution and/or service fees | | | 599 | |
Payable for independent Trustees’ compensation | | | 8 | |
Accrued expenses and other liabilities | | | 110,246 | |
Total liabilities | | | $2,333,393 | |
Net assets | | | $368,239,857 | |
| |
Net assets consist of | | | | |
Paid-in capital | | | $383,079,216 | |
Total distributable earnings (loss) | | | (14,839,359 | ) |
Net assets | | | $368,239,857 | |
Shares of beneficial interest outstanding | | | 64,440,417 | |
| | | | | | | | | | | | |
| | | |
| | | Net assets | | | Shares
outstanding | | | Net asset value
per share | |
Initial Class | | | $324,544,239 | | | | 56,711,705 | | | | $5.72 | |
Service Class | | | 43,695,618 | | | | 7,728,712 | | | | 5.65 | |
See Notes to Financial Statements
16
MFS High Yield Portfolio
FINANCIAL STATEMENTS | STATEMENT OF OPERATIONS
This statement describes how much your fund earned in investment income and accrued in expenses. It also describes any gains and/or losses generated by fund operations.
| | | | |
Year ended 12/31/19 | | | | |
| |
Net investment income (loss) | | | | |
Income | | | | |
Interest | | | $20,257,897 | |
Dividends from affiliated issuers | | | 213,241 | |
Dividends | | | 56,919 | |
Other | | | 21,464 | |
Total investment income | | | $20,549,521 | |
Expenses | | | | |
Management fee | | | $2,612,305 | |
Distribution and/or service fees | | | 112,525 | |
Shareholder servicing costs | | | 7,615 | |
Administrative services fee | | | 60,941 | |
Independent Trustees’ compensation | | | 10,367 | |
Custodian fee | | | 25,004 | |
Shareholder communications | | | 36,240 | |
Audit and tax fees | | | 80,070 | |
Legal fees | | | 13,921 | |
Miscellaneous | | | 43,236 | |
Total expenses | | | $3,002,224 | |
Reduction of expenses by investment adviser | | | (198,788 | ) |
Net expenses | | | $2,803,436 | |
Net investment income (loss) | | | $17,746,085 | |
| |
Realized and unrealized gain (loss) | | | | |
Realized gain (loss) (identified cost basis) | | | | |
Unaffiliated issuers | | | $(2,200,262 | ) |
Affiliated issuers | | | 751 | |
Futures contracts | | | (594,630 | ) |
Forward foreign currency exchange contracts | | | 205,831 | |
Foreign currency | | | 203 | |
Net realized gain (loss) | | | $(2,588,107 | ) |
Change in unrealized appreciation or depreciation | | | | |
Unaffiliated issuers | | | $36,110,980 | |
Affiliated issuers | | | 290 | |
Futures contracts | | | 196,998 | |
Forward foreign currency exchange contracts | | | (21,771 | ) |
Translation of assets and liabilities in foreign currencies | | | (250 | ) |
Net unrealized gain (loss) | | | $36,286,247 | |
Net realized and unrealized gain (loss) | | | $33,698,140 | |
Change in net assets from operations | | | $51,444,225 | |
See Notes to Financial Statements
17
MFS High Yield Portfolio
FINANCIAL STATEMENTS | STATEMENTS OF CHANGES IN NET ASSETS
These statements describe the increases and/or decreases in net assets resulting from operations, any distributions, and any shareholder transactions.
| | | | | | | | |
| | | Year ended | |
| | | 12/31/19 | | | 12/31/18 | |
Change in net assets | | | | | | | | |
| | |
From operations | | | | | | | | |
Net investment income (loss) | | | $17,746,085 | | | | $20,091,721 | |
Net realized gain (loss) | | | (2,588,107 | ) | | | (3,788,533 | ) |
Net unrealized gain (loss) | | | 36,286,247 | | | | (28,224,537 | ) |
Change in net assets from operations | | | $51,444,225 | | | | $(11,921,349 | ) |
Total distributions to shareholders | | | $(20,865,110 | ) | | | $(22,864,139 | ) |
Change in net assets from fund share transactions | | | $(27,715,069 | ) | | | $(42,731,313 | ) |
Total change in net assets | | | $2,864,046 | | | | $(77,516,801 | ) |
| | |
Net assets | | | | | | | | |
At beginning of period | | | 365,375,811 | | | | 442,892,612 | |
At end of period | | | $368,239,857 | | | | $365,375,811 | |
See Notes to Financial Statements
18
MFS High Yield Portfolio
FINANCIAL STATEMENTS | FINANCIAL HIGHLIGHTS
The financial highlights table is intended to help you understand the fund’s financial performance for the past 5 years. Certain information reflects financial results for a single fund share. The total returns in the table represent the rate that an investor would have earned (or lost) on an investment in the fund share class (assuming reinvestment of all distributions) held for the entire period.
| | | | | | | | | | | | | | | | | | | | |
| Initial Class | | Year ended | |
| | | | | |
| | | 12/31/19 | | | 12/31/18 | | | 12/31/17 | | | 12/31/16 | | | 12/31/15 | |
| | | | | |
Net asset value, beginning of period | | | $5.28 | | | | $5.77 | | | | $5.78 | | | | $5.43 | | | | $6.11 | |
| | | | | |
| Income (loss) from investment operations | | | | | | | | | | | | | | | | | | | | |
Net investment income (loss) (d) | | | $0.27 | | | | $0.28 | | | | $0.28 | | | | $0.32 | (c) | | | $0.33 | |
Net realized and unrealized gain (loss) | | | 0.50 | | | | (0.45 | ) | | | 0.10 | | | | 0.42 | | | | (0.57 | ) |
Total from investment operations | | | $0.77 | | | | $(0.17 | ) | | | $0.38 | | | | $0.74 | | | | $(0.24 | ) |
| | | | | |
| Less distributions declared to shareholders | | | | | | | | | | | | | | | | | | | | |
From net investment income | | | $(0.33 | ) | | | $(0.32 | ) | | | $(0.39 | ) | | | $(0.39 | ) | | | $(0.44 | ) |
Net asset value, end of period (x) | | | $5.72 | | | | $5.28 | | | | $5.77 | | | | $5.78 | | | | $5.43 | |
Total return (%) (k)(r)(s)(x) | | | 14.81 | | | | (3.08 | ) | | | 6.69 | | | | 13.82 | (c) | | | (4.22 | ) |
| | | | | |
Ratios (%) (to average net assets)
and Supplemental data: | | | | | | | | | | | | | | | | | | | | |
Expenses before expense reductions (f) | | | 0.77 | | | | 0.77 | | | | 0.78 | | | | 0.76 | (c) | | | 0.77 | |
Expenses after expense reductions (f) | | | 0.72 | | | | 0.72 | | | | 0.72 | | | | 0.70 | (c) | | | 0.72 | |
Net investment income (loss) | | | 4.78 | | | | 4.91 | | | | 4.78 | | | | 5.60 | (c) | | | 5.43 | |
Portfolio turnover | | | 59 | | | | 40 | | | | 49 | | | | 41 | | | | 33 | |
Net assets at end of period (000 omitted) | | | $324,544 | | | | $320,380 | | | | $384,393 | | | | $404,118 | | | | $419,474 | |
| |
| Service Class | | Year ended | |
| | | | | |
| | | 12/31/19 | | | 12/31/18 | | | 12/31/17 | | | 12/31/16 | | | 12/31/15 | |
| | | | | |
Net asset value, beginning of period | | | $5.22 | | | | $5.70 | | | | $5.72 | | | | $5.37 | | | | $6.04 | |
| | | | | |
| Income (loss) from investment operations | | | | | | | | | | | | | | | | | | | | |
Net investment income (loss) (d) | | | $0.25 | | | | $0.26 | | | | $0.26 | | | | $0.30 | (c) | | | $0.31 | |
Net realized and unrealized gain (loss) | | | 0.49 | | | | (0.43 | ) | | | 0.10 | | | | 0.43 | | | | (0.56 | ) |
Total from investment operations | | | $0.74 | | | | $(0.17 | ) | | | $0.36 | | | | $0.73 | | | | $(0.25 | ) |
| | | | | |
| Less distributions declared to shareholders | | | | | | | | | | | | | | | | | | | | |
From net investment income | | | $(0.31 | ) | | | $(0.31 | ) | | | $(0.38 | ) | | | $(0.38 | ) | | | $(0.42 | ) |
Net asset value, end of period (x) | | | $5.65 | | | | $5.22 | | | | $5.70 | | | | $5.72 | | | | $5.37 | |
Total return (%) (k)(r)(s)(x) | | | 14.44 | | | | (3.24 | ) | | | 6.31 | | | | 13.64 | (c) | | | (4.42 | ) |
| | | | | |
Ratios (%) (to average net assets)
and Supplemental data: | | | | | | | | | | | | | | | | | | | | |
Expenses before expense reductions (f) | | | 1.02 | | | | 1.02 | | | | 1.03 | | | | 1.02 | (c) | | | 1.02 | |
Expenses after expense reductions (f) | | | 0.97 | | | | 0.97 | | | | 0.97 | | | | 0.95 | (c) | | | 0.97 | |
Net investment income (loss) | | | 4.54 | | | | 4.66 | | | | 4.54 | | | | 5.36 | (c) | | | 5.18 | |
Portfolio turnover | | | 59 | | | | 40 | | | | 49 | | | | 41 | | | | 33 | |
Net assets at end of period (000 omitted) | | | $43,696 | | | | $44,995 | | | | $58,499 | | | | $69,189 | | | | $71,421 | |
| (c) | Amount reflects aone-time reimbursement of expenses by the custodian (or former custodian) without which net investment income and performance would be lower and expenses would be higher. |
| (d) | Per share data is based on average shares outstanding. |
| (f) | Ratios do not reflect reductions from fees paid indirectly, if applicable. |
| (k) | The total return does not reflect expenses that apply to separate accounts. Inclusion of these charges would reduce the total return figures for all periods shown. |
| (r) | Certain expenses have been reduced without which performance would have been lower. |
| (s) | From time to time the fund may receive proceeds from litigation settlements, without which performance would be lower. |
| (x) | The net asset values and total returns have been calculated on net assets which include adjustments made in accordance with U.S. generally accepted accounting principles required at period end for financial reporting purposes. |
See Notes to Financial Statements
19
MFS High Yield Portfolio
NOTES TO FINANCIAL STATEMENTS
| (1) | | Business and Organization |
MFS High Yield Portfolio (the fund) is a diversified series of MFS Variable Insurance Trust II (the trust). The trust is organized as a Massachusetts business trust and is registered under the Investment Company Act of 1940, as amended, as anopen-end management investment company. The shareholders of each series of the trust are separate accounts of insurance companies, which offer variable annuity and/or life insurance products, and qualified retirement and pension plans.
The fund is an investment company and accordingly follows the investment company accounting and reporting guidance of the Financial Accounting Standards Board (FASB) Accounting Standards Codification Topic 946 Financial Services – Investment Companies.
| (2) | | Significant Accounting Policies |
General– The preparation of financial statements in conformity with U.S. generally accepted accounting principles requires management to make estimates and assumptions that affect the reported amounts of assets and liabilities, and disclosure of contingent assets and liabilities at the date of the financial statements and the reported amounts of increases and decreases in net assets from operations during the reporting period. Actual results could differ from those estimates. In the preparation of these financial statements, management has evaluated subsequent events occurring after the date of the fund’s Statement of Assets and Liabilities through the date that the financial statements were issued. The fund invests in high-yield securities rated below investment grade. Investments in below investment grade quality securities can involve a substantially greater risk of default or can already be in default, and their values can decline significantly. Below investment grade quality securities tend to be more sensitive to adverse news about the issuer, or the market or economy in general, than higher quality debt instruments. The fund invests in foreign securities. Investments in foreign securities are vulnerable to the effects of changes in the relative values of the local currency and the U.S. dollar and to the effects of changes in each country’s market, economic, industrial, political, regulatory, geopolitical, and other conditions.
In March 2017, the FASB issued Accounting Standards Update2017-08, Receivables – Nonrefundable Fees and Other Costs (Subtopic310-20) – Premium Amortization on Purchased Callable Debt Securities (“ASU2017-08”). For callable debt securities purchased at a premium that have explicit,non-contingent call features and that are callable at fixed prices on preset dates,ASU 2017-08 requires the premium to be amortized to the earliest call date. The fund adopted ASU2017-08 as of the beginning of the reporting period on a modified retrospective basis. The adoption resulted in a change in accounting principle, since the fund had historically amortized such premiums to maturity for U.S. GAAP. As a result of the adoption, the fund recognized a cumulative effect adjustment that increased the beginning of period cost of investments and decreased the unrealized appreciation on investments by $253,952. Adoption had no impact on the fund’s net assets or any prior period information presented in the financial statements. With respect to the fund’s results of operations, amortization of premium to first call date under ASU2017-08 accelerates amortization with the intent of more closely aligning the recognition of income on such bonds with the economics of the instrument.
Balance Sheet Offsetting– The fund’s accounting policy with respect to balance sheet offsetting is that, absent an event of default by the counterparty or a termination of the agreement, the International Swaps and Derivatives Association (ISDA) Master Agreement, or similar agreement, does not result in an offset of reported amounts of financial assets and financial liabilities in the Statement of Assets and Liabilities across transactions between the fund and the applicable counterparty. The fund’s right to setoff may be restricted or prohibited by the bankruptcy or insolvency laws of the particular jurisdiction to which a specific master netting agreement counterparty is subject. Balance sheet offsetting disclosures, to the extent applicable to the fund, have been included in the fund’s Significant Accounting Policies note under the captions for each of the fund’sin-scope financial instruments and transactions.
Investment Valuations– Equity securities, including restricted equity securities, are generally valued at the last sale or official closing price on their primary market or exchange as provided by a third-party pricing service. Equity securities, for which there were no sales reported that day, are generally valued at the last quoted daily bid quotation on their primary market or exchange as provided by a third-party pricing service. Debt instruments and floating rate loans, including restricted debt instruments, are generally valued at an evaluated or composite bid as provided by a third-party pricing service. Short-term instruments with a maturity at issuance of 60 days or less may be valued at amortized cost, which approximates market value. Futures contracts are generally valued at last posted settlement price on their primary exchange as provided by a third-party pricing service. Futures contracts for which there were no trades that day for a particular position are generally valued at the closing bid quotation on their primary exchange as provided by a third-party pricing service. Forward foreign currency exchange contracts are generally valued at the mean of bid and asked prices for the time period interpolated from rates provided by a third-party pricing service for proximate time periods.Open-end investment companies are generally valued at net asset value per share. Securities and other assets generally valued on the basis of information from a third-party pricing service may also be valued at a broker/dealer bid quotation. In
determining values, third-party pricing services can utilize both transaction data and market information such as yield, quality,
20
MFS High Yield Portfolio
Notes to Financial Statements – continued
coupon rate, maturity, type of issue, trading characteristics, and other market data. The values of foreign securities and other assets and liabilities expressed in foreign currencies are converted to U.S. dollars using the mean of bid and asked prices for rates provided by a third-party pricing service.
The Board of Trustees has delegated primary responsibility for determining or causing to be determined the value of the fund’s investments (including any fair valuation) to the adviser pursuant to valuation policies and procedures approved by the Board. If the adviser determines that reliable market quotations are not readily available, investments are valued at fair value as determined in good faith by the adviser in accordance with such procedures under the oversight of the Board of Trustees. Under the fund’s valuation policies and procedures, market quotations are not considered to be readily available for most types of debt instruments and floating rate loans and many types of derivatives. These investments are generally valued at fair value based on information from third-party pricing services. In addition, investments may be valued at fair value if the adviser determines that an investment’s value has been materially affected by events occurring after the close of the exchange or market on which the investment is principally traded (such as foreign exchange or market) and prior to the determination of the fund’s net asset value, or after the halt of trading of a specific security where trading does not resume prior to the close of the exchange or market on which the security is principally traded. The adviser generally relies on third-party pricing services or other information (such as the correlation with price movements of similar securities in the same or other markets; the type, cost and investment characteristics of the security; the business and financial condition of the issuer; and trading and other market data) to assist in determining whether to fair value and at what value to fair value an investment. The value of an investment for purposes of calculating the fund’s net asset value can differ depending on the source and method used to determine value. When fair valuation is used, the value of an investment used to determine the fund’s net asset value may differ from quoted or published prices for the same investment. There can be no assurance that the fund could obtain the fair value assigned to an investment if it were to sell the investment at the same time at which the fund determines its net asset value per share.
Various inputs are used in determining the value of the fund’s assets or liabilities. These inputs are categorized into three broad levels. In certain cases, the inputs used to measure fair value may fall into different levels of the fair value hierarchy. In such cases, an investment’s level within the fair value hierarchy is based on the lowest level of input that is significant to the fair value measurement. The fund’s assessment of the significance of a particular input to the fair value measurement in its entirety requires judgment, and considers factors specific to the investment. Level 1 includes unadjusted quoted prices in active markets for identical assets or liabilities. Level 2 includes other significant observable market-based inputs (including quoted prices for similar securities, interest rates, prepayment speed, and credit risk). Level 3 includes unobservable inputs, which may include the adviser’s own assumptions in determining the fair value of investments. Other financial instruments are derivative instruments, such as futures contracts and forward foreign currency exchange contracts. The following is a summary of the levels used as of December 31, 2019 in valuing the fund’s assets or liabilities:
| | | | | | | | | | | | | | | | |
| Financial Instruments | | Level 1 | | | Level 2 | | | Level 3 | | | Total | |
| Equity Securities: | | | | | | | | | | | | | | | | |
United States | | | $— | | | | $27 | | | | $590,281 | | | | $590,308 | |
Mexico | | | — | | | | 281,956 | | | | — | | | | 281,956 | |
| U.S. Corporate Bonds | | | — | | | | 301,221,150 | | | | — | | | | 301,221,150 | |
| Asset-Backed Securities (including CDOs) | | | — | | | | 124 | | | | — | | | | 124 | |
| Foreign Bonds | | | — | | | | 51,705,189 | | | | — | | | | 51,705,189 | |
| Floating Rate Loans | | | — | | | | 5,642,080 | | | | — | | | | 5,642,080 | |
| Mutual Funds | | | 5,851,487 | | | | — | | | | — | | | | 5,851,487 | |
| Total | | | $5,851,487 | | | | $358,850,526 | | | | $590,281 | | | | $365,292,294 | |
| | | | |
| Other Financial Instruments | | | | | | | | | | | | |
| Futures Contracts – Assets | | | $40,871 | | | | $— | | | | $— | | | | $40,871 | |
| Forward Foreign Currency Exchange | | | | | | | | | | | | | | | | |
| Contracts – Assets | | | — | | | | 2,136 | | | | — | | | | 2,136 | |
For further information regarding security characteristics, see the Portfolio of Investments.
The following is a reconciliation of level 3 assets for which significant unobservable inputs were used to determine fair value. The table presents the activity of level 3 securities held at the beginning and the end of the period.
| | | | |
| |
| | | Equity
Securities | |
| Balance as of 12/31/18 | | | $991,703 | |
Change in unrealized appreciation or depreciation | | | (401,422 | ) |
| Balance as of 12/31/19 | | | $590,281 | |
The net change in unrealized appreciation or depreciation from investments held as level 3 at December 31, 2019 is $(401,422). At December 31, 2019, the fund held one level 3 security.
21
MFS High Yield Portfolio
Notes to Financial Statements – continued
Foreign Currency Translation– Purchases and sales of foreign investments, income, and expenses are converted into U.S. dollars based upon currency exchange rates prevailing on the respective dates of such transactions or on the reporting date for foreign denominated receivables and payables. Gains and losses attributable to foreign currency exchange rates on sales of securities are recorded for financial statement purposes as net realized gains and losses on investments. Gains and losses attributable to foreign exchange rate movements on receivables, payables, income and expenses are recorded for financial statement purposes as foreign currency transaction gains and losses. That portion of both realized and unrealized gains and losses on investments that results from fluctuations in foreign currency exchange rates is not separately disclosed.
Derivatives– The fund uses derivatives primarily to increase or decrease exposure to a particular market or segment of the market, or security, to increase or decrease interest rate exposure, or as alternatives to direct investments. Derivatives are used for hedging ornon-hedging purposes. While hedging can reduce or eliminate losses, it can also reduce or eliminate gains. When the fund uses derivatives as an investment to increase market exposure, or for hedging purposes, gains and losses from derivative instruments may be substantially greater than the derivative’s original cost.
The derivative instruments used by the fund during the period were futures contracts and forward foreign currency exchange contracts. Depending on the type of derivative, the fund may exit a derivative position by entering into an offsetting transaction with a counterparty or exchange, negotiating an agreement with the derivative counterparty, or novating the position to a third party. The fund may be unable to promptly close out a futures position in instances where the daily fluctuation in the price for that type of future exceeds the daily limit set by the exchange. The fund’s period end derivatives, as presented in the Portfolio of Investments and the associated Derivative Contract tables, generally are indicative of the volume of its derivative activity during the period.
The following table presents, by major type of derivative contract, the fair value, on a gross basis, of the asset and liability components of derivatives held by the fund at December 31, 2019 as reported in the Statement of Assets and Liabilities:
| | | | | | |
| | | | | Fair Value (a) | |
| Risk | | Derivative Contracts | | Asset Derivatives | |
| Interest Rate | | Interest Rate Futures | | | $40,871 | |
| Foreign Exchange | | Forward Foreign Currency Exchange Contracts | | | 2,136 | |
| Total | | | | | $43,007 | |
| (a) | Values presented in this table for futures contracts correspond to the values reported in the fund’s Portfolio of Investments. Only the current day net variation margin for futures contracts is separately reported within the fund’s Statement of Assets and Liabilities. |
The following table presents, by major type of derivative contract, the realized gain (loss) on derivatives held by the fund for the year ended December 31, 2019 as reported in the Statement of Operations:
| | | | | | | | |
| Risk | | Futures Contracts | | | Forward Foreign Currency
Exchange Contracts | |
| Interest Rate | | | $(594,630 | ) | | | $— | |
| Foreign Exchange | | | — | | | | 205,831 | |
| Total | | | $(594,630 | ) | | | $205,831 | |
The following table presents, by major type of derivative contract, the change in unrealized appreciation or depreciation on derivatives held by the fund for the year ended December 31, 2019 as reported in the Statement of Operations:
| | | | | | | | |
| Risk | | Futures Contracts | | | Forward Foreign Currency
Exchange Contracts | |
| Interest Rate | | | $196,998 | | | | $— | |
| Foreign Exchange | | | — | | | | (21,771 | ) |
| Total | | | $196,998 | | | | $(21,771 | ) |
Derivative counterparty credit risk is managed through formal evaluation of the creditworthiness of all potential counterparties. On certain, but not all, uncleared derivatives, the fund attempts to reduce its exposure to counterparty credit risk whenever possible by entering into an ISDA Master Agreement on a bilateral basis. The ISDA Master Agreement gives each party to the agreement the right to terminate all transactions traded under such agreement if there is a specified deterioration in the credit quality of the other party. Upon an event of default or a termination of the ISDA Master Agreement, thenon-defaulting party has the right to close out all transactions traded under such agreement and to net amounts owed under each agreement to one net amount payable by one
22
MFS High Yield Portfolio
Notes to Financial Statements – continued
party to the other. This right to close out and net payments across all transactions traded under the ISDA Master Agreement could result in a reduction of the fund’s credit risk to such counterparty equal to any amounts payable by the fund under the applicable transactions, if any.
Collateral and margin requirements differ by type of derivative. For cleared derivatives (e.g., futures contracts, cleared swaps, and exchange-traded options), margin requirements are set by the clearing broker and the clearing house and collateral, in the form of cash or securities, is posted by the fund directly with the clearing broker. Collateral terms are counterparty agreement specific for uncleared derivatives (e.g., forward foreign currency exchange contracts, uncleared swap agreements, and uncleared options) and collateral, in the form of cash and securities, is held in segregated accounts with the fund’s custodian in connection with these agreements. For derivatives traded under an ISDA Master Agreement, which contains a collateral support annex, the collateral requirements are netted across all transactions traded under such counterparty-specific agreement and an amount is posted from one party to the other to collateralize such obligations. Cash that has been segregated or delivered to cover the fund’s collateral or margin obligations under derivative contracts, if any, will be reported separately in the Statement of Assets and Liabilities as restricted cash for uncleared derivatives and/or deposits with brokers for cleared derivatives. Securities pledged as collateral or margin for the same purpose, if any, are noted in the Portfolio of Investments. The fund may be required to make payments of interest on uncovered collateral or margin obligations with the broker. Any such payments are included in “Miscellaneous” expense in the Statement of Operations.
Futures Contracts– The fund entered into futures contracts which may be used to hedge against or obtain broad market exposure, interest rate exposure, currency exposure, or to manage duration. A futures contract represents a commitment for the future purchase or sale of an asset at a specified price on a specified date.
Upon entering into a futures contract, the fund is required to deposit with the broker, either in cash or securities, an initial margin in an amount equal to a specified percentage of the notional amount of the contract. Subsequent payments (variation margin) are made or received by the fund each day, depending on the daily fluctuations in the value of the contract, and are recorded for financial statement purposes as unrealized gain or loss by the fund until the contract is closed or expires at which point the gain or loss on futures contracts is realized.
The fund bears the risk of interest rates, exchange rates or securities prices moving unexpectedly, in which case, the fund may not achieve the anticipated benefits of the futures contracts and may realize a loss. While futures contracts may present less counterparty risk to the fund since the contracts are exchange traded and the exchange’s clearinghouse guarantees payments to the broker, there is still counterparty credit risk due to the insolvency of the broker. The fund’s maximum risk of loss due to counterparty credit risk is equal to the margin posted by the fund to the broker plus any gains or minus any losses on the outstanding futures contracts.
Forward Foreign Currency Exchange Contracts– The fund entered into forward foreign currency exchange contracts for the purchase or sale of a specific foreign currency at a fixed price on a future date. These contracts may be used to hedge the fund’s currency risk or fornon-hedging purposes. For hedging purposes, the fund may enter into contracts to deliver or receive foreign currency that the fund will receive from or use in its normal investment activities. The fund may also use contracts to hedge against declines in the value of foreign currency denominated securities due to unfavorable exchange rate movements. Fornon-hedging purposes, the fund may enter into contracts with the intent of changing the relative exposure of the fund’s portfolio of securities to different currencies to take advantage of anticipated exchange rate changes.
Forward foreign currency exchange contracts are adjusted by the daily exchange rate of the underlying currency and any unrealized gains or losses are recorded as a receivable or payable for forward foreign currency exchange contracts until the contract settlement date. On contract settlement date, any gain or loss on the contract is recorded as realized gains or losses on forward foreign currency exchange contracts.
Risks may arise upon entering into these contracts from unanticipated movements in the value of the contract and from the potential inability of counterparties to meet the terms of their contracts. Generally, the fund’s maximum risk due to counterparty credit risk is the unrealized gain on the contract due to the use of Continuous Linked Settlement, a multicurrency cash settlement system for the centralized settlement of foreign transactions. This risk is mitigated in cases where there is an ISDA Master Agreement between the fund and the counterparty providing for netting as described above and, where applicable, by the posting of collateral by the counterparty to the fund to cover the fund’s exposure to the counterparty under such ISDA Master Agreement.
Loans and Other Direct Debt Instruments– The fund invests in loans and loan participations or other receivables. These investments may include standby financing commitments, including revolving credit facilities, which contractually obligate the fund to supply additional cash to the borrower on demand. The fund generally provides this financial support in order to preserve its existing investment or to obtain a more senior secured interest in the assets of the borrower. Loan participations involve a risk of insolvency of the lending bank or other financial intermediary.
Indemnifications– Under the fund’s organizational documents, its officers and Trustees may be indemnified against certain liabilities and expenses arising out of the performance of their duties to the fund. Additionally, in the normal course of business, the
23
MFS High Yield Portfolio
Notes to Financial Statements – continued
fund enters into agreements with service providers that may contain indemnification clauses. The fund’s maximum exposure under these agreements is unknown as this would involve future claims that may be made against the fund that have not yet occurred.
Investment Transactions and Income– Investment transactions are recorded on the trade date. Interest income is recorded on the accrual basis. All premium and discount is amortized or accreted for financial statement purposes in accordance with U.S. generally accepted accounting principles. The fund earns certain fees in connection with its floating rate loan purchasing activities. These fees are in addition to interest payments earned and may include amendment fees, commitment fees, facility fees, consent fees, and prepayment fees. Commitment fees are recorded on an accrual basis as income in the accompanying financial statements. Dividends received in cash are recorded on theex-dividend date. Certain dividends from foreign securities will be recorded when the fund is informed of the dividend if such information is obtained subsequent to theex-dividend date. Dividend and interest payments received in additional securities are recorded on theex-dividend orex-interest date in an amount equal to the value of the security on such date. Debt obligations may be placed on non-accrual status or set to accrue at a rate of interest less than the contractual coupon when the collection of all or a portion of interest has become doubtful. Interest income for those debt obligations may be further reduced by the write-off of the related interest receivables when deemed uncollectible.
The fund may receive proceeds from litigation settlements. Any proceeds received from litigation involving portfolio holdings are reflected in the Statement of Operations in realized gain/loss if the security has been disposed of by the fund or in unrealized gain/loss if the security is still held by the fund. Any other proceeds from litigation not related to portfolio holdings are reflected as other income in the Statement of Operations.
Legal fees and other related expenses incurred to preserve and protect the value of a security owned are added to the cost of the security; other legal fees are expensed. Capital infusions made directly to the security issuer, which are generallynon-recurring, incurred to protect or enhance the value of high-yield debt securities, are reported as additions to the cost basis of the security. Costs that are incurred to negotiate the terms or conditions of capital infusions or that are expected to result in a plan of reorganization are reported as realized losses. Ongoing costs incurred to protect or enhance an investment, or costs incurred to pursue other claims or legal actions, are expensed.
Tax Matters and Distributions– The fund intends to qualify as a regulated investment company, as defined under Subchapter M of the Internal Revenue Code, and to distribute all of its taxable income, including realized capital gains. As a result, no provision for federal income tax is required. The fund’s federal tax returns, when filed, will remain subject to examination by the Internal Revenue Service for a three year period. Management has analyzed the fund’s tax positions taken on federal and state tax returns for all open tax years and does not believe that there are any uncertain tax positions that require recognition of a tax liability. Foreign taxes, if any, have been accrued by the fund in the accompanying financial statements in accordance with the applicable foreign tax law. Foreign income taxes may be withheld by certain countries in which the fund invests. Additionally, capital gains realized by the fund on securities issued in or by certain foreign countries may be subject to capital gains tax imposed by those countries.
Distributions to shareholders are recorded on theex-dividend date. Income and capital gain distributions are determined in accordance with income tax regulations, which may differ from U.S. generally accepted accounting principles. Certain capital accounts in the financial statements are periodically adjusted for permanent differences in order to reflect their tax character. These adjustments have no impact on net assets or net asset value per share. Temporary differences which arise from recognizing certain items of income, expense, gain or loss in different periods for financial statement and tax purposes will reverse at some time in the future.
Book/tax differences primarily relate to amortization and accretion of debt securities.
The tax character of distributions declared to shareholders for the last two fiscal years is as follows:
| | | | | | | | |
| | | Year ended
12/31/19 | | | Year ended
12/31/18 | |
| Ordinary income (including any short-term capital gains) | | | $20,865,110 | | | | $22,864,139 | |
The federal tax cost and the tax basis components of distributable earnings were as follows:
| | | | |
| As of 12/31/19 | | | | |
| |
| Cost of investments | | | $357,298,830 | |
| Gross appreciation | | | 12,133,016 | |
| Gross depreciation | | | (4,096,545 | ) |
| Net unrealized appreciation (depreciation) | | | $8,036,471 | |
| |
| Undistributed ordinary income | | | 18,795,661 | |
| Capital loss carryforwards | | | (41,671,491 | ) |
24
MFS High Yield Portfolio
Notes to Financial Statements – continued
As of December 31, 2019, the fund had capital loss carryforwards available to offset future realized gains. These net capital losses may be carried forward indefinitely and their character is retained as short-term and/or long-term losses. Such losses are characterized as follows:
Multiple Classes of Shares of Beneficial Interest– The fund offers multiple classes of shares, which differ in their respective distribution and/or service fees. The fund’s income, realized and unrealized gain (loss), and common expenses are allocated to shareholders based on the daily net assets of each class. Dividends are declared separately for each class. Differences in per share dividend rates are generally due to differences in separate class expenses. The fund’s distributions declared to shareholders as reported in the Statements of Changes in Net Assets are presented by class as follows:
| | | | | | | | |
| | |
| | | Year ended
12/31/19 | | | Year ended
12/31/18 | |
| Initial Class | | | $18,456,699 | | | | $20,085,625 | |
| Service Class | | | 2,408,411 | | | | 2,778,514 | |
| Total | | | $20,865,110 | | | | $22,864,139 | |
| (3) | | Transactions with Affiliates |
Investment Adviser– The fund has an investment advisory agreement with MFS to provide overall investment management and related administrative services and facilities to the fund. The management fee is computed daily and paid monthly at the following annual rates based on the fund’s average daily net assets:
| | | | |
| Up to $1 billion | | | 0.70% | |
| In excess of $1 billion | | | 0.65% | |
MFS has agreed in writing to reduce its management fee by a specified amount if certain MFS mutual fund assets exceed thresholds agreed to by MFS and the fund’s Board of Trustees. For the year ended December 31, 2019, this management fee reduction amounted to $36,410, which is included in the reduction of total expenses in the Statement of Operations. The management fee incurred for the year ended December 31, 2019 was equivalent to an annual effective rate of 0.69% of the fund’s average daily net assets.
The investment adviser has agreed in writing to pay a portion of the fund’s total annual operating expenses, excluding interest, taxes, extraordinary expenses, brokerage and transaction costs, and investment-related expenses, such that total annual operating expenses do not exceed 0.72% of average daily net assets for the Initial Class shares and 0.97% of average daily net assets for the Service Class shares. This written agreement will continue until modified by the fund’s Board of Trustees, but such agreement will continue at least until April 30, 2021. For the year ended December 31, 2019, this reduction amounted to $162,378, which is included in the reduction of total expenses in the Statement of Operations.
Distributor– MFS Fund Distributors, Inc. (MFD), a wholly-owned subsidiary of MFS, is the distributor of shares of the fund. The Trustees have adopted a distribution plan for the Service Class shares pursuant to Rule12b-1 under the Investment Company Act of 1940.
The fund’s distribution plan provides that the fund will pay MFD distribution and/or service fees equal to 0.25% per annum of its average daily net assets attributable to Service Class shares as partial consideration for services performed and expenses incurred by MFD and financial intermediaries (including participating insurance companies that invest in the fund to fund variable annuity and variable life insurance contracts, sponsors of qualified retirement and pension plans that invest in the fund, and affiliates of these participating insurance companies and plan sponsors) in connection with the sale and distribution of the Service Class shares. MFD may subsequently pay all, or a portion, of the distribution and/or service fees to financial intermediaries.
Shareholder Servicing Agent– MFS Service Center, Inc. (MFSC), a wholly-owned subsidiary of MFS, receives a fee from the fund for its services as shareholder servicing agent. For the year ended December 31, 2019, the fee was $6,871, which equated to 0.0018% annually of the fund’s average daily net assets. MFSC also receives payment from the fund forout-of-pocket expenses paid by MFSC on behalf of the fund. For the year ended December 31, 2019, these costs amounted to $744.
Administrator– MFS provides certain financial, legal, shareholder communications, compliance, and other administrative services to the fund. Under an administrative services agreement, the fund reimburses MFS the costs incurred to provide these services. The fund is charged an annual fixed amount of $17,500 plus a fee based on average daily net assets. The administrative services fee incurred for the year ended December 31, 2019 was equivalent to an annual effective rate of 0.0163% of the fund’s average daily net assets.
Trustees’ and Officers’ Compensation– The fund pays compensation to independent Trustees in the form of a retainer, attendance fees, and additional compensation to Board and Committee chairpersons. The fund does not pay compensation directly to Trustees or officers of the fund who are also officers of the investment adviser, all of whom receive remuneration from MFS for their services to the fund. Certain officers and Trustees of the fund are officers or directors of MFS, MFD, and MFSC.
25
MFS High Yield Portfolio
Notes to Financial Statements – continued
Other– This fund and certain other funds managed by MFS (the funds) had entered into a service agreement (the ISO Agreement) which provided for payment of fees solely by the funds to Tarantino LLC in return for the provision of services of an Independent Senior Officer (ISO) for the funds. Frank L. Tarantino served as the ISO and was an officer of the funds and the sole member of Tarantino LLC. Effective June 30, 2019, Mr. Tarantino retired from his position as ISO for the funds, and the ISO Agreement was terminated. For the year ended December 31, 2019, the fee paid by the fund under this agreement was $442 and is included in “Miscellaneous” expense in the Statement of Operations. MFS had agreed to bear all expenses associated with office space, other administrative support, and supplies provided to the ISO.
The fund invests in the MFS Institutional Money Market Portfolio which is managed by MFS and seeks current income consistent with preservation of capital and liquidity. This money market fund does not pay a management fee to MFS.
For the year ended December 31, 2019, purchases and sales of investments, other than short-term obligations, aggregated $210,938,152 and $237,521,065, respectively.
| (5) | | Shares of Beneficial Interest |
The fund’s Declaration of Trust permits the Trustees to issue an unlimited number of full and fractional shares of beneficial interest. Transactions in fund shares were as follows:
| | | | | | | | | | | | | | | | |
| | | Year ended 12/31/19 | | | Year ended 12/31/18 | |
| | | | |
| | | Shares | | | Amount | | | Shares | | | Amount | |
| Shares sold | | | | | | | | | | | | | | | | |
Initial Class | | | 2,053,865 | | | | $11,580,419 | | | | 2,683,377 | | | | $15,262,881 | |
Service Class | | | 265,271 | | | | 1,483,768 | | | | 318,476 | | | | 1,796,833 | |
| | | 2,319,136 | | | | $13,064,187 | | | | 3,001,853 | | | | $17,059,714 | |
| | | | |
| Shares issued to shareholders in reinvestment of distributions | | | | | | | | | | | | | | | | |
Initial Class | | | 3,331,534 | | | | $18,456,699 | | | | 3,658,584 | | | | $20,085,625 | |
Service Class | | | 439,491 | | | | 2,408,411 | | | | 511,697 | | | | 2,778,514 | |
| | | 3,771,025 | | | | $20,865,110 | | | | 4,170,281 | | | | $22,864,139 | |
| | | | |
| Shares reacquired | | | | | | | | | | | | | | | | |
Initial Class | | | (9,345,642 | ) | | | $(52,708,332 | ) | | | (12,326,049 | ) | | | $(68,941,144 | ) |
Service Class | | | (1,599,874 | ) | | | (8,936,034 | ) | | | (2,472,313 | ) | | | (13,714,022 | ) |
| | | (10,945,516 | ) | | | $(61,644,366 | ) | | | (14,798,362 | ) | | | $(82,655,166 | ) |
| | | | |
| Net change | | | | | | | | | | | | | | | | |
Initial Class | | | (3,960,243 | ) | | | $(22,671,214 | ) | | | (5,984,088 | ) | | | $(33,592,638 | ) |
Service Class | | | (895,112 | ) | | | (5,043,855 | ) | | | (1,642,140 | ) | | | (9,138,675 | ) |
| | | (4,855,355 | ) | | | $(27,715,069 | ) | | | (7,626,228 | ) | | | $(42,731,313 | ) |
The fund is one of several mutual funds in which certain MFS funds may invest. The MFS funds do not invest in the underlying funds for the purpose of exercising management or control. At the end of the period, the MFS Moderate Allocation Portfolio, the MFS Conservative Allocation Portfolio, and the MFS Growth Allocation Portfolio were the owners of record of approximately 19%, 6%, and 5%, respectively, of the value of outstanding voting shares of the fund.
The fund and certain other funds managed by MFS participate in a $1.25 billion unsecured committed line of credit, subject to a $1 billion sublimit, provided by a syndicate of banks under a credit agreement. Borrowings may be made for temporary financing needs. Interest is charged to each fund, based on its borrowings, generally at a rate equal to the highest of one month LIBOR, the Federal Funds Effective Rate and the Overnight Bank Funding Rate, plus an agreed upon spread. A commitment fee, based on the average daily, unused portion of the committed line of credit, is allocated among the participating funds. In addition, the fund and other funds managed by MFS have established unsecured uncommitted borrowing arrangements with certain banks for temporary financing needs. Interest is charged to each fund, based on its borrowings, at rates equal to customary reference rates plus an agreed upon spread. For the year ended December 31, 2019, the fund’s commitment fee and interest expense were $2,046 and $0, respectively, and are included in “Miscellaneous” expense in the Statement of Operations.
26
MFS High Yield Portfolio
Notes to Financial Statements – continued
| (7) | | Investments in Affiliated Issuers |
An affiliated issuer may be considered one in which the fund owns 5% or more of the outstanding voting securities, or a company which is under common control. For the purposes of this report, the following were affiliated issuers:
| | | | | | | | | | | | | | | | | | | | | | | | |
| Affiliated Issuers | | Beginning
Value | | | Purchases | | | Sales Proceeds | | | Realized
Gain
(Loss) | | | Change in
Unrealized
Appreciation or
Depreciation | | | Ending
Value | |
| MFS Institutional Money Market Portfolio | | | $9,625,650 | | | | $104,687,543 | | | | $108,462,747 | | | | $751 | | | | $290 | | | | $5,851,487 | |
| | | | | | |
| Affiliated Issuers | | | | | | | | | | | | | | Dividend
Income | | | Capital Gain
Distributions | |
| MFS Institutional Money Market Portfolio | | | | | | | | | | | | | | | | | | | $213,241 | | | | $— | |
27
MFS High Yield Portfolio
REPORT OF INDEPENDENT REGISTERED PUBLIC ACCOUNTING FIRM
To the Board of Trustees of MFS Variable Insurance Trust II and the Shareholders of
MFS High Yield Portfolio:
Opinion on the Financial Statements and Financial Highlights
We have audited the accompanying statement of assets and liabilities of MFS High Yield Portfolio (the “Fund”), including the portfolio of investments, as of December 31, 2019, the related statement of operations for the year then ended, the statements of changes in net assets for each of the two years in the period then ended, the financial highlights for each of the five years in the period then ended, and the related notes. In our opinion, the financial statements and financial highlights present fairly, in all material respects, the financial position of the Fund as of December 31, 2019, and the results of its operations for the year then ended, the changes in its net assets for each of the two years in the period then ended, and the financial highlights for each of the five years in the period then ended, in conformity with accounting principles generally accepted in the United States of America.
Basis for Opinion
These financial statements and financial highlights are the responsibility of the Fund’s management. Our responsibility is to express an opinion on the Fund’s financial statements and financial highlights based on our audits. We are a public accounting firm registered with the Public Company Accounting Oversight Board (United States) (PCAOB) and are required to be independent with respect to the Fund in accordance with the U.S. federal securities laws and the applicable rules and regulations of the Securities and Exchange Commission and the PCAOB.
We conducted our audits in accordance with the standards of the PCAOB. Those standards require that we plan and perform the audit to obtain reasonable assurance about whether the financial statements and financial highlights are free of material misstatement, whether due to error or fraud. The Fund is not required to have, nor were we engaged to perform, an audit of its internal control over financial reporting. As part of our audits we are required to obtain an understanding of internal control over financial reporting but not for the purpose of expressing an opinion on the effectiveness of the Fund’s internal control over financial reporting. Accordingly, we express no such opinion.
Our audits included performing procedures to assess the risks of material misstatement of the financial statements and financial highlights, whether due to error or fraud, and performing procedures that respond to those risks. Such procedures included examining, on a test basis, evidence regarding the amounts and disclosures in the financial statements and financial highlights. Our audits also included evaluating the accounting principles used and significant estimates made by management, as well as evaluating the overall presentation of the financial statements and financial highlights. Our procedures included confirmation of securities owned as of December 31, 2019, by correspondence with the custodian and brokers; when replies were not received from brokers, we performed other auditing procedures. We believe that our audits provide a reasonable basis for our opinion.
DELOITTE & TOUCHE LLP
Boston, Massachusetts
February 14, 2020
We have served as the auditor of one or more of the MFS investment companies since 1924.
28
MFS High Yield Portfolio
TRUSTEES AND OFFICERS – IDENTIFICATION AND BACKGROUND
The Trustees and Officers of the Trust, as of February 1, 2020, are listed below, together with their principal occupations during the past five years. (Their titles may have varied during that period.) The address of each Trustee and Officer is 111 Huntington Avenue, Boston, Massachusetts 02199-7618.
| | | | | | | | | | |
Name, Age | | Position(s)
Held with Fund | | Trustee/Officer
Since (h) | | Number of MFS Funds
overseen by the
Trustee | | Principal Occupations
During the Past Five Years | | Other Directorships During the Past Five Years (j) |
| INTERESTED TRUSTEES |
Robert J. Manning (k)
(age 56) | | Trustee | | February 2004 | | 133 | | Massachusetts Financial Services Company, Executive Chairman (since January 2017); Director; Chairman of the Board; Chief Executive Officer (until 2015);Co-Chief Executive Officer(2015-2016) | | N/A |
| | | | | |
Robin A. Stelmach (k) (age 58) | | Trustee | | January 2014 | | 133 | | Massachusetts Financial Services Company, Vice Chair (since January 2017); Chief Operating Officer and Executive Vice President (until January 2017) | | N/A |
|
| INDEPENDENT TRUSTEES |
John P. Kavanaugh (age 65) | | Trustee and Chair of Trustees | | January 2009 | | 133 | | Private investor | | N/A |
| | | | | |
Steven E. Buller (age 68) | | Trustee | | February 2014 | | 133 | | Financial Accounting Standards Advisory Council, Chairman(2014-2015); Public Company Accounting Oversight Board, Standing Advisory Group, Member (until 2014); BlackRock, Inc. (investment management), Managing Director (until 2014), BlackRock Finco UK (investment management), Director (until 2014) | | N/A |
| | | | | |
John A. Caroselli (age 65) | | Trustee | | March 2017 | | 133 | | JC Global Advisors, LLC (management consulting), President (since 2015); First Capital Corporation (commercial finance), Executive Vice President (until 2015) | | N/A |
| | | | | |
Maureen R. Goldfarb (age 64) | | Trustee | | January 2009 | | 133 | | Private investor | | N/A |
| | | | | |
Peter D. Jones
(age 64) | | Trustee | | January 2019 | | 133 | | Franklin Templeton Distributors, Inc. (investment management), President (until 2015); Franklin Templeton Institutional, LLC (investment management), Chairman (until 2015) | | N/A |
| | | | | |
James W. Kilman, Jr.
(age 58) | | Trustee | | January 2019 | | 133 | | Burford Capital Limited (finance and investment management), Chief Financial Officer (since 2019); KielStrand Capital LLC (family office), Chief Executive Officer (since 2016); Morgan Stanley & Co. (financial services), Vice Chairman of Investment Banking,Co-Head of Diversified Financials Coverage – Financial Institutions Investment Banking Group (until 2016) | | Alpha-En Corporation, Director (2016-2019) |
29
MFS High Yield Portfolio
Trustees and Officers – continued
| | | | | | | | | | |
Name, Age | | Position(s)
Held with Fund | | Trustee/Officer
Since (h) | | Number of MFS Funds
overseen by the
Trustee | | Principal Occupations
During the Past Five Years | | Other Directorships During the Past Five Years (j) |
Clarence Otis, Jr. (age 63) | | Trustee | | March 2017 | | 133 | | Darden Restaurants, Inc., Chief Executive Officer (until 2014) | | VF Corporation, Director; Verizon Communications, Inc., Director; The Travelers Companies, Director; Federal Reserve Bank of Atlanta, Director (until 2015) |
| | | | | |
Maryanne L. Roepke (age 63) | | Trustee | | May 2014 | | 133 | | American Century Investments (investment management), Senior Vice President and Chief Compliance Officer (until 2014) | | N/A |
| | | | | |
Laurie J. Thomsen
(age 62) | | Trustee | | March 2005 | | 133 | | Private investor | | The Travelers Companies, Director; Dycom Industries, Inc., Director (since 2015) |
| | | | | | | | |
Name, Age | | Position(s)
Held with Fund | | Trustee/Officer
Since (h) | | Number of
MFS Funds
for which the
Person is an
Officer | | Principal Occupations During the Past Five Years |
| OFFICERS | | | | | | |
Christopher R. Bohane (k)
(age 46) | | Assistant Secretary and Assistant Clerk | | July 2005 | | 133 | | Massachusetts Financial Services Company, Vice President and Assistant General Counsel |
| | | | |
Kino Clark (k) (age 51) | | Assistant Treasurer | | January 2012 | | 133 | | Massachusetts Financial Services Company, Vice President |
| | | | |
John W. Clark, Jr. (k) (age 52) | | Assistant Treasurer | | April 2017 | | 133 | | Massachusetts Financial Services Company, Vice President (since March 2017); Deutsche Bank (financial services), Department Head –Treasurer’s Office (until February 2017) |
| | | | |
Thomas H. Connors (k) (age 60) | | Assistant Secretary and Assistant Clerk | | September 2012 | | 133 | | Massachusetts Financial Services Company, Vice President and Senior Counsel |
| | | | |
David L. DiLorenzo (k)
(age 51) | | President | | July 2005 | | 133 | | Massachusetts Financial Services Company, Senior Vice President |
| | | | |
Heidi W. Hardin (k) (age 52) | | Secretary and Clerk | | April 2017 | | 133 | | Massachusetts Financial Services Company, Executive Vice President and General Counsel (since March 2017); Harris Associates (investment management), General Counsel (from September 2015 to January 2017); Janus Capital Management LLC (investment management), Senior Vice President and General Counsel (until September 2015) |
| | | | |
Brian E. Langenfeld (k) (age 46) | | Assistant
Secretary and Assistant Clerk | | June 2006 | | 133 | | Massachusetts Financial Services Company, Vice President and Senior Counsel |
| | | | |
Amanda S. Mooradian (k) (age 40) | | Assistant
Secretary and Assistant Clerk | | September 2018 | | 133 | | Massachusetts Financial Services Company, Assistant Vice President and Counsel |
| | | | |
Susan A. Pereira (k)
(age 49) | | Assistant
Secretary and Assistant Clerk | | July 2005 | | 133 | | Massachusetts Financial Services Company, Vice President and Assistant General Counsel |
| | | | |
Kasey L. Phillips (k) (age 49) | | Assistant Treasurer | | September 2012 | | 133 | | Massachusetts Financial Services Company, Vice President |
| | | | |
Matthew A. Stowe (k) (age 45) | | Assistant Secretary and Assistant Clerk | | October 2014 | | 133 | | Massachusetts Financial Services Company, Vice President and Assistant General Counsel |
30
MFS High Yield Portfolio
Trustees and Officers – continued
| | | | | | | | |
Name, Age | | Position(s)
Held with Fund | | Trustee/Officer
Since (h) | | Number of
MFS Funds
for which the
Person is an
Officer | | Principal Occupations During the Past Five Years |
Martin J. Wolin (k) (age 52) | | Chief Compliance Officer | | July 2015 | | 133 | | Massachusetts Financial Services Company, Senior Vice President and Chief Compliance Officer (since July 2015); Mercer (financial service provider), Chief Risk and Compliance Officer, North America and Latin America (until June 2015) |
| | | | |
James O. Yost (k)
(age 59) | | Treasurer | | September 1990 | | 133 | | Massachusetts Financial Services Company, Senior Vice President |
| (h) | Date first appointed to serve as Trustee/officer of an MFS Fund. Each Trustee has served continuously since appointment unless indicated otherwise. For the period from December 15, 2004 until February 22, 2005, Mr. Manning served as Advisory Trustee. From January 2012 through December 2016, Messrs. DiLorenzo and Yost served as Treasurer and Deputy Treasurer of the Funds, respectively. |
| (j) | Directorships or trusteeships of companies required to report to the Securities and Exchange Commission (i.e., “public companies”). |
| (k) | “Interested person” of the Trust within the meaning of the Investment Company Act of 1940 (referred to as the 1940 Act), which is the principal federal law governing investment companies like the fund, as a result of a position with MFS. The address of MFS is 111 Huntington Avenue, Boston, Massachusetts 02199-7618. |
Each Trustee (other than Messrs. Jones and Kilman) has been elected by shareholders and each Trustee and Officer holds office until his or her successor is chosen and qualified or until his or her earlier death, resignation, retirement or removal. Messrs. Jones and Kilman became Trustees of the Funds on January 1, 2019. The Trust does not hold annual meetings for the purpose of electing Trustees, and Trustees are not elected for fixed terms. Under the terms of the Board’s retirement policy, an Independent Trustee shall retire at the end of the calendar year in which he or she reaches the earlier of 75 years of age or 15 years of service on the Board (or, in the case of any Independent Trustee who joined the Board prior to 2015, 20 years of service on the Board).
Messrs. Buller, Kilman and Otis and Ms. Roepke are members of the Trust’s Audit Committee.
Each of the Interested Trustees and certain Officers hold comparable officer positions with certain affiliates of MFS.
The Statement of Additional Information for a Fund includes further information about the Trustees and is available without charge upon request by calling1-800-225-2606.
| | |
Investment Adviser Massachusetts Financial Services Company 111 Huntington Avenue Boston, MA 02199-7618 | | Custodian State Street Bank and Trust Company 1 Lincoln Street Boston, MA 02111-2900 |
| |
Distributor MFS Fund Distributors, Inc. 111 Huntington Avenue Boston, MA 02199-7618 | | Independent Registered Public Accounting Firm Deloitte & Touche LLP 200 Berkeley Street Boston, MA 02116 |
| |
Portfolio Manager(s) David Cole Michael Skatrud | | |
31
MFS High Yield Portfolio
BOARD REVIEW OF INVESTMENT ADVISORY AGREEMENT
MFS High Yield Portfolio
The Investment Company Act of 1940 requires that both the full Board of Trustees and a majority of thenon-interested (“independent”) Trustees, voting separately, annually approve the continuation of the Fund’s investment advisory agreement with MFS. The Trustees consider matters bearing on the Fund and its advisory arrangements at their meetings throughout the year, including a review of performance data at each regular meeting. In addition, the independent Trustees met several times over the course of three months beginning in May and ending in July, 2019 (“contract review meetings”) for the specific purpose of considering whether to approve the continuation of the investment advisory agreement for the Fund and the other investment companies that the Board oversees (the “MFS Funds”). The independent Trustees were assisted in their evaluation of the Fund’s investment advisory agreement by independent legal counsel, from whom they received separate legal advice and with whom they met separately from MFS during various contract review meetings. The independent Trustees were also assisted in this process by the MFS Funds’ Independent Senior Officer, a senior officer appointed by and reporting to the independent Trustees.
In connection with their deliberations regarding the continuation of the investment advisory agreement, the Trustees, including the independent Trustees, considered such information and factors as they believed, in light of the legal advice furnished to them and their own business judgment, to be relevant. The investment advisory agreement for the Fund was considered separately, although the Trustees also took into account the common interests of all MFS Funds in their review. As described below, the Trustees considered the nature, quality, and extent of the various investment advisory, administrative, and shareholder services performed by MFS under the existing investment advisory agreement and other arrangements with the Fund.
In connection with their contract review meetings, the Trustees received and relied upon materials that included, among other items: (i) information provided by Broadridge Financial Solutions, Inc. (“Broadridge”), an independent third party, on the investment performance of the Fund for various time periods ended December 31, 2018 and the investment performance of a group of funds with substantially similar investment classifications/objectives (the “Broadridge performance universe”), (ii) information provided by Broadridge on the Fund’s advisory fees and other expenses and the advisory fees and other expenses of comparable funds identified by Broadridge as well as all other funds in the same investment classification/category (the “Broadridge expense group and universe”), (iii) information provided by MFS on the advisory fees of portfolios of other clients of MFS, including institutional separate accounts and other clients, (iv) information as to whether and to what extent applicable expense waivers, reimbursements or fee “breakpoints” are observed for the Fund, (v) information regarding MFS’ financial results and financial condition, including MFS’ and certain of its affiliates’ estimated profitability from services performed for the Fund and the MFS Funds as a whole, and compared to MFS’ institutional business, (vi) MFS’ views regarding the outlook for the mutual fund industry and the strategic business plans of MFS, (vii) descriptions of various functions performed by MFS for the Funds, such as compliance monitoring and portfolio trading practices, and (viii) information regarding the overall organization of MFS, including information about MFS’ senior management and other personnel providing investment advisory, administrative and other services to the Fund and the other MFS Funds. The comparative performance, fee and expense information prepared and provided by Broadridge was not independently verified and the independent Trustees did not independently verify any information provided to them by MFS.
The Trustees’ conclusion as to the continuation of the investment advisory agreement was based on a comprehensive consideration of all information provided to the Trustees and not the result of any single factor. Some of the factors that figured particularly in the Trustees’ deliberations are described below, although individual Trustees may have evaluated the information presented differently from one another, giving different weights to various factors. It is also important to recognize that the fee arrangements for the Fund and other MFS Funds are the result of years of review and discussion between the independent Trustees and MFS, that certain aspects of such arrangements may receive greater scrutiny in some years than in others, and that the Trustees’ conclusions may be based, in part, on their consideration of these same arrangements during the course of the year and in prior years.
Based on information provided by Broadridge and MFS, the Trustees reviewed the Fund’s total return investment performance as well as the Broadridge performance universe over various time periods. The Trustees placed particular emphasis on the total return performance of the Fund’s Initial Class shares in comparison to the performance of funds in its Broadridge performance universe over the five-year period ended December 31, 2018, which the Trustees believed was a long enough period to reflect differing market conditions. The total return performance of the Fund’s Initial Class shares was in the 3rd quintile relative to the other funds in the universe for this five-year period (the 1st quintile being the best performers and the 5th quintile being the worst performers). The total return performance of the Fund’s Initial Class shares was in the 3rd quintile for each of theone- and three-year periods ended December 31, 2018 relative to the Broadridge performance universe. Because of the passage of time, these performance results may differ from the performance results for more recent periods, including those shown elsewhere in this report.
In the course of their deliberations, the Trustees took into account information provided by MFS in connection with the contract review meetings, as well as during investment review meetings conducted with portfolio management personnel during the course of the year regarding the Fund’s performance. After reviewing these and related factors, the Trustees concluded, within the context of their overall conclusions regarding the investment advisory agreement, that they were satisfied with MFS’ responses and efforts relating to investment performance.
32
MFS High Yield Portfolio
Board Review of Investment Advisory Agreement – continued
In assessing the reasonableness of the Fund’s advisory fee, the Trustees considered, among other information, the Fund’s advisory fee and the total expense ratio of the Fund’s Initial Class shares as a percentage of average daily net assets and the advisory fee and total expense ratios of the Broadridge expense group based on information provided by Broadridge. The Trustees considered that MFS currently observes an expense limitation for the Fund, which may not be changed without the Trustees’ approval. The Trustees also considered that, according to the data provided by Broadridge (which takes into account any fee reductions or expense limitations that were in effect during the Fund’s last fiscal year), the Fund’s effective advisory fee rate was higher than the Broadridge expense group median and the Fund’s total expense ratio was approximately at the Broadridge expense group median.
The Trustees also considered the advisory fees charged by MFS to any institutional separate accounts advised by MFS (“separate accounts”) and unaffiliated investment companies for which MFS serves as subadviser (“subadvised funds”) that have comparable investment strategies to the Fund, if any. In comparing these fees, the Trustees considered information provided by MFS as to the generally broader scope of services provided by MFS to the Fund, as well as the more extensive regulatory burdens imposed on MFS in managing the Fund, in comparison to separate accounts and subadvised funds. The Trustees also considered the higher demands placed on MFS’ investment personnel and trading infrastructure as a result of the daily cashin-flows andout-flows of the Fund in comparison to separate accounts.
The Trustees also considered whether the Fund may benefit from any economies of scale in the management of the Fund in the event of growth in assets of the Fund and/or growth in assets of the MFS Funds as a whole. They noted that the Fund’s advisory fee rate schedule is subject to a contractual breakpoint that reduces the Fund’s advisory fee rate on average daily net assets over $1 billion. The Trustees also noted that MFS has agreed in writing to waive a portion of the management fees of certain MFS Funds, including the Fund, if the total combined assets of certain funds within the MFS Funds’ complex increase above agreed upon thresholds (the “group fee waiver”), enabling the Fund’s shareholders to share in the benefits from any economies of scale at the complex level. The group fee waiver is reviewed and renewed annually between the Board and MFS. The Trustees concluded that the breakpoint and the group fee waiver were sufficient to allow the Fund to benefit from economies of scale as its assets and overall complex assets grow.
The Trustees also considered information prepared by MFS relating to MFS’ costs and profits with respect to the Fund, the MFS Funds considered as a group, and other investment companies and accounts advised by MFS, as well as MFS’ methodologies used to determine and allocate its costs to the MFS Funds, the Fund and other accounts and products for purposes of estimating profitability.
After reviewing these and other factors described herein, the Trustees concluded, within the context of their overall conclusions regarding the investment advisory agreement, that the advisory fees charged to the Fund represent reasonable compensation in light of the services being provided by MFS to the Fund.
In addition, the Trustees considered MFS’ resources and related efforts to continue to retain, attract and motivate capable personnel to serve the Fund. The Trustees also considered current and developing conditions in the financial services industry, including the presence of large and well-capitalized companies which are spending, and appear to be prepared to continue to spend, substantial sums to engage personnel and to provide services to competing investment companies. In this regard, the Trustees also considered the financial resources of MFS and its ultimate parent, Sun Life Financial Inc. The Trustees also considered the advantages and possible disadvantages to the Fund of having an adviser that also serves other investment companies as well as other accounts.
The Trustees also considered the nature, quality, cost, and extent of administrative, transfer agency, and distribution services provided to the Fund by MFS and its affiliates under agreements and plans other than the investment advisory agreement, including any12b-1 fees the Fund pays to MFS Fund Distributors, Inc., an affiliate of MFS. The Trustees also considered the nature, extent and quality of certain other services MFS performs or arranges for on the Fund’s behalf, which may include securities lending programs, directed expense payment programs, class action recovery programs, and MFS’ interaction with third-party service providers, principally custodians andsub-custodians. The Trustees concluded that the variousnon-advisory services provided by MFS and its affiliates on behalf of the Fund were satisfactory.
The Trustees consideredso-called“fall-out benefits” to MFS such as reputational value derived from serving as investment manager to the MFS Funds. The Trustees also considered that, effective January 3, 2018, MFS had discontinued its historic practice of obtaining investment research from portfolio brokerage commissions paid by certain MFS Funds and would thereafter directly pay for or voluntarily reimburse a Fund, if applicable, for the costs of external research acquired through the use of the Fund’s portfolio brokerage commissions.
Based on their evaluation of factors that they deemed to be material, including those factors described above, the Board of Trustees, including the independent Trustees, concluded that the Fund’s investment advisory agreement with MFS should be continued for an additionalone-year period, commencing August 1, 2019.
33
MFS High Yield Portfolio
PROXY VOTING POLICIES AND INFORMATION
MFS votes proxies on behalf of the fund pursuant to proxy voting policies and procedures that are available without charge, upon request, by calling 1-800-225-2606, by visitingmfs.com/proxyvoting, or by visiting the SEC’s Web site athttp://www.sec.gov.
Information regarding how the fund voted proxies relating to portfolio securities during the most recent twelve-month period ended June 30 is available by August 31 of each year without charge by visitingmfs.com/proxyvoting, or by visiting the SEC’s Web site athttp://www.sec.gov.
QUARTERLY PORTFOLIO DISCLOSURE
The fund files a complete schedule of portfolio holdings with the SEC for the first and third quarters of each fiscal year as an exhibit to its reports on Form N-PORT. The fund’s Form N-PORT reports are available on the SEC’s website athttp://www.sec.gov. A shareholder can obtain the portfolio holdings report for the first and third quarters of the fund’s fiscal year atmfs.com/vit2 by choosing the fund’s name and then selecting the “Resources” tab and clicking on “Prospectus and Reports”.
FURTHER INFORMATION
From time to time, MFS may post important information about the fund or the MFS funds on the MFS web site (mfs.com). This information is available athttps://www.mfs.com/en-us/what-we-do/announcements.htmlor atmfs.com/vit2 by choosing the fund’s name.
INFORMATION ABOUT FUND CONTRACTS AND LEGAL CLAIMS
The fund has entered into contractual arrangements with an investment adviser, administrator, distributor, shareholder servicing agent, 529 program manager (if applicable), and custodian who each provide services to the fund. Unless expressly stated otherwise, shareholders are not parties to, or intended beneficiaries of these contractual arrangements, and these contractual arrangements are not intended to create any shareholder right to enforce them against the service providers or to seek any remedy under them against the service providers, either directly or on behalf of the fund.
Under the Trust’s By-Laws and Declaration of Trust, any claims asserted against or on behalf of the MFS Funds, including claims against Trustees and Officers, must be brought in state and federal courts located within the Commonwealth of Massachusetts.
34
rev. 3/16
| | | | |
| | | |
| FACTS | | WHAT DOES MFS DO WITH YOUR
PERSONAL INFORMATION? | |  |
| | |
| Why? | | Financial companies choose how they share your personal information. Federal law gives consumers the right to limit some but not all sharing. Federal law also requires us to tell you how we collect, share, and protect your personal information. Please read this notice carefully to understand what we do. |
| | |
| What? | | The types of personal information we collect and share depend on the product or service you have with us. This information can include: • Social Security number and account balances • Account transactions and transaction history • Checking account information and wire transfer instructions When you areno longer our customer, we continue to share your information as described in this notice. |
| | |
| How? | | All financial companies need to share customers’ personal information to run their everyday business. In the section below, we list the reasons financial companies can share their customers’ personal information; the reasons MFS chooses to share; and whether you can limit this sharing. |
| | | | |
Reasons we can share your
personal information | | Does MFS share? | | Can you limit this
sharing? |
For our everyday business purposes – such as to process your transactions, maintain your account(s), respond to court orders and legal investigations, or report to credit bureaus | | Yes | | No |
For our marketing purposes – to offer our products and services to you | | No | | We don’t share |
| For joint marketing with other financial companies | | No | | We don’t share |
For our affiliates’ everyday business purposes – information about your transactions and experiences | | No | | We don’t share |
For our affiliates’ everyday business purposes – information about your creditworthiness | | No | | We don’t share |
| For nonaffiliates to market to you | | No | | We don’t share |
| | |
| | |
| Questions? | | Call800-225-2606 or go tomfs.com. |
35
| | |
| Who we are |
| Who is providing this notice? | | MFS Funds, MFS Investment Management, MFS Institutional Advisors, Inc., and MFS Heritage Trust Company. |
| | |
| What we do |
| How does MFS protect my personal information? | | To protect your personal information from unauthorized access and use, we use security measures that comply with federal law. These measures include procedural, electronic, and physical safeguards for the protection of the personal information we collect about you. |
How does MFS
collect my personal information? | | We collect your personal information, for example, when you • open an account or provide account information • direct us to buy securities or direct us to sell your securities • make a wire transfer We also collect your personal information from others, such as credit bureaus, affiliates, or other companies. |
| Why can’t I limit all sharing? | | Federal law gives you the right to limit only • sharing for affiliates’ everyday business purposes – information about your creditworthiness • affiliates from using your information to market to you • sharing for nonaffiliates to market to you State laws and individual companies may give you additional rights to limit sharing. |
| | |
| Definitions |
| Affiliates | | Companies related by common ownership or control. They can be financial and nonfinancial companies. • MFS does not share personal information with affiliates, except for everyday business purposes as described on page one of this notice. |
| Nonaffiliates | | Companies not related by common ownership or control. They can be financial and nonfinancial companies. • MFS does not share with nonaffiliates so they can market to you. |
| Joint marketing | | A formal agreement between nonaffiliated financial companies that together market financial products or services to you. • MFS doesn’t jointly market. |
| | |
| Other important information |
| If you own an MFS product or receive an MFS service in the name of a third party such as a bank or broker-dealer, their privacy policy may apply to you instead of ours. |
36
Annual Report
December 31, 2019

MFS® International Growth Portfolio

MFS® Variable Insurance Trust II
Beginning on January 1, 2021, as permitted by regulations adopted by the U.S. Securities and Exchange Commission, the insurance company that offers your contract may determine that it will no longer send you paper copies of the fund’s annual and semiannual shareholder reports unless you specifically request paper copies from the insurance company or from your financial intermediary. Instead, the shareholder reports will be made available on a Web site (insurancefunds.mfs.com or other Web site of which you will be notified), and the insurance company will notify you by mail each time a report is posted and provide you with a Web site link to access the report. Instructions for requesting paper copies will be provided by your insurance company or financial intermediary.
If you already elected to receive shareholder reports by email, you will not be affected by this change and you need not take any action. If your insurance company or financial intermediary offers electronic delivery, you may elect to receive shareholder reports and other communications from the insurance company or financial intermediary by email by following the instructions provided by the insurance company or financial intermediary.
Beginning on January 1, 2019, you may elect to receive all future reports in paper free of charge from the insurance company or financial intermediary. You can inform the insurance company or financial intermediary that you wish to continue receiving paper copies of your shareholder reports by contacting your insurance company or financial intermediary. Your election to receive reports in paper will apply to all funds held in your account with your insurance company or financial intermediary.
FCI-ANN
MFS® International Growth Portfolio
CONTENTS
The report is prepared for the general information of contract owners. It is authorized for distribution to prospective investors only when preceded or accompanied by a current prospectus.
NOT FDIC INSURED• MAY LOSE VALUE• NO BANK OR CREDIT UNION GUARANTEE• NOT A DEPOSIT• NOT INSURED BY ANY FEDERAL GOVERNMENT AGENCY OR NCUA/NCUSIF
MFS International Growth Portfolio
LETTER FROM THE EXECUTIVE CHAIR

Dear Contract Owners:
Slowing global growth, low inflation, and trade friction between the United States and China have been hallmarks of the past 12 months. After experiencing an uptick in market volatility in late 2018, markets steadied for most of 2019, thanks in large measure to the adoption of a dovish policy stance on the part of global central banks, focused on supporting economic growth. Negotiations aimed at a “phase one” trade deal between the U.S. and China bore fruit at the end of the period, boosting investor sentiment, while signs of stability emerging from the global manufacturing sector also lifted spirits. Uncertainty over Brexit, along with the ripple effects from the trade conflict, hampered business confidence and investment in the United Kingdom and Europe for much of the period, though investors expect greater clarity regarding Brexit as a result of December’s general election. The pro-Brexit Conservative Party won the election by a comfortable margin and set the stage for the U.K.’s departure from the EU at the end of January.
Markets expect the longest economic expansion in U.S. history will continue, albeit at a slower pace, as trade tensions recede. In an effort to prolong the expansion, the U.S. Federal Reserve lowered interest rates three times between July and October and the European Central Bank loosened policy in September. While the global monetary policy backdrop remains quite accommodative, signs of easing trade tensions and fading global recession fears led to improved market sentiment in late 2019 as investors grew less risk averse. In early 2020, an outbreak of coronavirus emanating from China reintroduced global growth fears, causing an uptick in volatility.
Here at MFS®, we aim to help our clients navigate the growing complexity of the markets and world economies. Our long-term investment philosophy and commitment to the responsible allocation of capital allow us to tune out the noise and uncover what we believe are the best, most durable investment opportunities in the market. Through our powerful global investment platform, we combine collective expertise, thoughtful risk management and long-term discipline to create sustainable value for investors.
Respectfully,

Robert J. Manning
Executive Chair
MFS Investment Management
February 14, 2020
The opinions expressed in this letter are subject to change and may not be relied upon for investment advice. No forecasts can be guaranteed.
1
MFS International Growth Portfolio
PORTFOLIO COMPOSITION
Portfolio structure
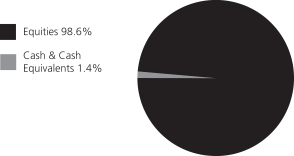
| | | | |
| Top ten holdings | | | | |
| Nestle S.A. | | | 5.0% | |
| Roche Holding AG | | | 4.5% | |
| Taiwan Semiconductor Manufacturing Co. Ltd., ADR | | | 4.2% | |
| SAP SE | | | 3.6% | |
| AIA Group Ltd. | | | 3.5% | |
| LVMH Moet Hennessy Louis Vuitton SE | | | 3.3% | |
| L’Oréal | | | 2.8% | |
| Danone S.A. | | | 2.4% | |
| Novartis AG | | | 2.4% | |
| Linde PLC | | | 2.3% | |
| |
| GICS equity sectors (g) | | | | |
| Consumer Staples | | | 20.0% | |
| Information Technology | | | 15.3% | |
| Industrials | | | 14.5% | |
| Health Care | | | 13.6% | |
| Consumer Discretionary | | | 11.4% | |
| Financials | | | 9.9% | |
| Materials | | | 9.8% | |
| Communication Services | | | 2.9% | |
| Energy | | | 0.9% | |
| Utilities | | | 0.3% | |
| | | | |
| Issuer country weightings (x) | | | | |
| France | | | 18.5% | |
| Switzerland | | | 12.8% | |
| United Kingdom | | | 10.0% | |
| Germany | | | 9.7% | |
| Japan | | | 8.5% | |
| United States | | | 6.8% | |
| Canada | | | 5.8% | |
| Taiwan | | | 4.5% | |
| China | | | 3.9% | |
| Other Countries | | | 19.5% | |
| |
| Currency exposure weightings (y) | | | | |
| Euro | | | 33.8% | |
| Swiss Franc | | | 12.8% | |
| British Pound Sterling | | | 10.9% | |
| Japanese Yen | | | 8.5% | |
| United States Dollar | | | 7.9% | |
| Taiwan Dollar | | | 4.5% | |
| Hong Kong Dollar | | | 4.3% | |
| Indian Rupee | | | 3.8% | |
| Canadian Dollar | | | 3.6% | |
| Other Currencies | | | 9.9% | |
| (g) | The Global Industry Classification Standard (GICS®) was developed by and/or is the exclusive property of MSCI, Inc. and S&P Global Market Intelligence Inc. (“S&P Global Market Intelligence”). GICS is a service mark of MSCI and S&P Global Market Intelligence and has been licensed for use by MFS. |
| (x) | Represents the portfolio’s exposure to issuer countries as a percentage of a portfolio’s net assets. For purposes of this presentation, United States includes Cash & Cash Equivalents. |
| (y) | Represents the portfolio’s exposure to a particular currency as a percentage of a portfolio’s net assets. For purposes of this presentation, United States Dollar includes Cash & Cash Equivalents. |
Cash & Cash Equivalents includes any cash, investments in money market funds, short-term securities, and other assets less liabilities. Please see the Statement of Assets and Liabilities for additional information related to the fund’s cash position and other assets and liabilities.
Percentages are based on net assets as of December 31, 2019.
The portfolio is actively managed and current holdings may be different.
2
MFS International Growth Portfolio
MANAGEMENT REVIEW
Summary of Results
For the twelve months ended December 31, 2019, Initial Class shares of the MFS International Growth Portfolio (fund) provided a total return of 27.30%, while Service Class shares of the fund provided a total return of 27.11%. These compare with a return of 27.34% over the same period for the fund’s benchmark, the MSCI All Country World(ex-US) Growth Index (net div).
Market Environment
Fading fears of a near-term global recession, the announcement of a partial trade deal between the United States and China and the decline in uncertainty over Brexit helped bolster market sentiment late in the period. Changes in market sentiment, largely driven by uncertainty over the outcome of trade negotiations between the US and China, had contributed to periodic bouts of volatility during the reporting period. The global economy decelerated, led by weakness in China and Europe, although the pace of the slowdown moderated late in the period amid nascent signs of stabilization in the manufacturing sector.
The deteriorating global growth backdrop, along with declining inflationary pressures, prompted the US Federal Reserve to adopt a more dovish posture beginning in early 2019, resulting in the first interest rate cut in over a decade at the end of July, followed by additional cuts in September and October. The Fed’s actions led to a sharp decline in long-term interest rates during the period’s second half, causing the inversion of portions of the US Treasury yield curve for a time. Amid an improvement in risk sentiment in Q4 2019 and indications of a bottoming in growth and a potential upturn in activity, the Fed indicated in October that further rate cuts were unlikely unless the outlook for the economy materially worsened.
Globally, central banks have tilted more dovish as well, with the European Central Bank unveiling a package of easing measures, which included putting overnight rates deeper into negative territory, restarting its bond-buying program and lengthening the term of cheap loans to banks to three years from two. The central banks of India and Australia are among those that have cut rates several times in recent months, although China has been more cautious in increasing liquidity as it keeps trying to deleverage its economy, cutting rates only marginally.
Emerging markets experienced considerable volatility through the end of 2018, as tighter global financial conditions exposed structural weakness in some countries. Those conditions improved in 2019 as the Fed became more dovish. Notwithstanding the periodic headwinds on market sentiment from significant trade friction between the US and China over much of the year, emerging market hard currency debt and local rates benefited from relatively cheap valuations at the beginning of the period and easier global monetary conditions. These factors, plus the fading of certain global risk factors mentioned above, hastened spread tightening in the latter part of the period. At the same time, idiosyncratic risks spiked in some countries (e.g., Argentina and Lebanon), contributing to increased dispersion in performance among sovereign assets.
Detractors from Performance
Stock selection in both thefinancials andhealth care sectors weakened performance relative to the MSCI All Country World(ex-US) Growth Index. Within thefinancials sector, holding shares of financial services provider AEON Financial Service (b) (Japan) and investment management and banking firm UBS (b)(h) (Switzerland) held back relative returns. The share price of AEON Financial Service declined, notably in May, as the company reported disappointing fiscal-year 2019 earnings results and guided to a weaker 2020 given the uncertainty aroundUS-China trade negotiations. Although security selection within thehealth care sector detracted from relative performance, there were no individual stocks within this sector that were among the fund’s top relative detractors.
Stocks in other sectors that also negatively impacted relative results included overweight positions in internet search provider Baidu (China), diversified industrial manufacturer Rolls-Royce Holdings (United Kingdom), online and mobile commerce company Alibaba Group Holding (China), marketing holding company ITC (India), wine and alcoholic beverage producer Pernod Ricard (France) and household products manufacturer Reckitt Benckiser Group (United Kingdom). A challenging macro environment contributed to the decline in the price of Baidu’s stock as advertising revenue from both its search and news feed slowed, marketing expenses related to the promotion of the Baidu mobile application weighed on the company’s operating margins and projected revenue from its online video platform, iQiyi, was revised to be softer than initially expected. Not holding shares of lithography systems manufacturer ASML (Netherlands), and holding shares of tobacco company Japan Tobacco (b) (Japan) further dampened relative returns.
During the reporting period, the fund’s relative currency exposure, resulting primarily from differences between the fund’s and the benchmark’s exposures to holdings of securities denominated in foreign currencies, was a modest detractor from relative performance. All of MFS’ investment decisions are driven by the fundamentals of each individual opportunity and as such, it is common for our funds to have different currency exposure than the benchmark.
Contributors to Performance
Stock selection in theconsumer discretionary sector was a primary factor that lifted relative performance over the reporting period. Notably, the fund’s overweight position in luxury goods company LVMH Moet Hennessy Louis Vuitton (France) aided relative returns as the stock price rose on the back of strong sales results, notably from its Fashion & Leather division.
3
MFS International Growth Portfolio
Management Review – continued
Security selection and, to a lesser extent, overweight positions in both thematerials andinformation technology sectors also benefited relative performance. Within thematerials sector, holding shares of industrial gas supplier Linde (b) (Germany) contributed to relative returns as the stock outperformed the benchmark on the back of robust organic sales growth and favorable pricing trends. Within theinformation technology sector, the fund’s overweight positions in semiconductor manufacturer Taiwan Semiconductor Manufacturing (Taiwan), system services provider OBIC (Japan) and enterprise applications company SAP (Germany), the timing of the fund’s position in shares of electronics company Hitachi (Japan), and holding shares of IT servicing firm Accenture (b) and software development services and information technology solutions provider Luxoft Holding (b)(h) (Switzerland), aided relative results. The stock price of Taiwan Semiconductor Manufacturing overcame uncertainty surroundingUS-China trade negotiations, including a US ban on Huawei products, and rose on the back of strong earnings results that were driven by demand for its7-nanometer processing chips.
Elsewhere, the fund’s overweight positions in electrical distribution equipment manufacturer Schneider Electric (France) and internet search engine and online computer games provider NAVER (South Korea) also helped relative returns.
Respectfully,
Portfolio Manager(s)
David Antonelli, Matthew Barrett, and Kevin Dwan
Note to Shareholders: Effective April 15, 2021, David Antonelli will be removed as a Portfolio Manager of the Fund.
| (b) | Security is not a benchmark constituent. |
| (h) | Security was not held in the portfolio at period end. |
The views expressed in this report are those of the portfolio manager(s) only through the end of the period of the report as stated on the cover and do not necessarily reflect the views of MFS or any other person in the MFS organization. These views are subject to change at any time based on market or other conditions, and MFS disclaims any responsibility to update such views. These views may not be relied upon as investment advice or an indication of trading intent on behalf of any MFS portfolio. References to specific securities are not recommendations of such securities, and may not be representative of any MFS portfolio’s current or future investments.
4
MFS International Growth Portfolio
PERFORMANCE SUMMARY THROUGH 12/31/19
The following chart illustrates the historical performance of the fund in comparison to its benchmark(s). Benchmarks are unmanaged and may not be invested in directly. Benchmark returns do not reflect any fees or expenses. The performance of other share classes will be greater than or less than that of the class depicted below. (See Notes to Performance Summary.)
Performance data shown represents past performance and is no guarantee of future results. Investment return and principal value fluctuate so your units, when sold, may be worth more or less than the original cost; current performance may be lower or higher than quoted. The performance shown does not reflect the deduction of taxes, if any, that a contract holder would pay on fund distributions or the redemption of contract units. The returns for the fund shown also do not reflect the deduction of expenses associated with variable products, such as mortality and expense risk charges, separate account charges, and sales charges imposed by the insurance company separate accounts. Such expenses would reduce the overall returns shown.
Growth of a Hypothetical $10,000 Investment
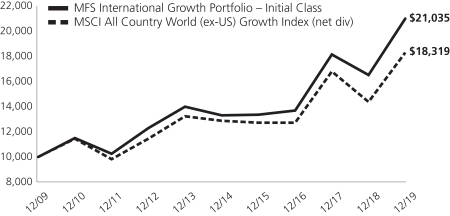
Total Returns through 12/31/19
Average annual total returns
| | | | | | | | | | | | |
| | | Share Class | | Class Inception Date | | 1-yr | | 5-yr | | 10-yr | | |
| | | Initial Class | | 6/03/96 | | 27.30% | | 9.57% | | 7.72% | | |
| | | Service Class | | 8/24/01 | | 27.11% | | 9.30% | | 7.46% | | |
| | | | |
| Comparative benchmark(s) | | | | | | | | |
| | | MSCI All Country World(ex-US) Growth Index (net div) (f) | | 27.34% | | 7.30% | | 6.24% | | |
| (f) | Source: FactSet Research Systems Inc. |
Benchmark Definition(s)
MSCI All Country World (ex-US) Growth Index (net div) – a market capitalization-weighted index that is designed to measure equity market performance for growth securities in the global developed and emerging markets, excluding the U.S. Morgan Stanley Capital International (“MSCI”) makes no express or implied warranties or representations and shall have no liability whatsoever with respect to any MSCI data contained herein. The MSCI data may not be further redistributed or used as a basis for other indices or any securities or financial products. This report is not approved, reviewed, or produced by MSCI.
It is not possible to invest directly in an index.
Notes to Performance Summary
Average annual total return represents the average annual change in value for each share class for the periods presented.
Performance results reflect any applicable expense subsidies and waivers in effect during the periods shown. Without such subsidies and waivers the fund’s performance results would be less favorable. Please see the prospectus and financial statements for complete details. All results are historical and assume the reinvestment of any dividends and capital gains distributions.
Performance results do not include adjustments made for financial reporting purposes in accordance with U.S. generally accepted accounting principles and may differ from amounts reported in the financial highlights.
From time to time the fund may receive proceeds from litigation settlements, without which performance would be lower.
5
MFS International Growth Portfolio
EXPENSE TABLE
Fund Expenses Borne by the Contract Holders during the Period,
July 1, 2019 through December 31, 2019
As a contract holder of the fund, you incur ongoing costs, including management fees; distribution and/or service(12b-1) fees; and other fund expenses. This example is intended to help you understand your ongoing costs (in dollars) of investing in the fund and to compare these costs with the ongoing costs of investing in other mutual funds.
The example is based on an investment of $1,000 invested at the beginning of the period and held for the entire period July 1, 2019 through December 31, 2019.
Actual Expenses
The first line for each share class in the following table provides information about actual account values and actual expenses. You may use the information in this line, together with the amount you invested, to estimate the expenses that you paid over the period. Simply divide your account value by $1,000 (for example, an $8,600 account value divided by $1,000 = 8.6), then multiply the result by the number in the first line under the heading entitled “Expenses Paid During Period” to estimate the expenses you paid on your account during this period.
Hypothetical Example for Comparison Purposes
The second line for each share class in the following table provides information about hypothetical account values and hypothetical expenses based on the fund’s actual expense ratio and an assumed rate of return of 5% per year before expenses, which is not the fund’s actual return. The hypothetical account values and expenses may not be used to estimate the actual ending account balance or expenses you paid for the period. You may use this information to compare the ongoing costs of investing in the fund and other funds. To do so, compare this 5% hypothetical example with the 5% hypothetical examples that appear in the shareholder reports of the other funds.
Please note that the expenses shown in the table are meant to highlight the fund’s ongoing costs only and do not take into account the fees and expenses imposed under the variable contracts through which your investment in the fund is made. Therefore, the second line for each share class in the table is useful in comparing ongoing costs associated with an investment in vehicles (such as the fund) which fund benefits under variable annuity and variable life insurance contracts and to qualified pension and retirement plans only, and will not help you determine the relative total costs of investing in the fund through variable annuity and variable life insurance contracts. If the fees and expenses imposed under the variable contracts were included, your costs would have been higher.
| | | | | | | | | | | | | | | | | | |
| Share Class | | | | Annualized
Expense Ratio | | | Beginning
Account Value
7/01/19 | | | Ending
Account Value
12/31/19 | | | Expenses Paid
During Period (p)
7/01/19-12/31/19 | |
| Initial Class | | Actual | | | 0.88% | | | | $1,000.00 | | | | $1,077.41 | | | | $4.61 | |
| | Hypothetical (h) | | | 0.88% | | | | $1,000.00 | | | | $1,020.77 | | | | $4.48 | |
| Service Class | | Actual | | | 1.13% | | | | $1,000.00 | | | | $1,077.00 | | | | $5.92 | |
| | Hypothetical (h) | | | 1.13% | | | | $1,000.00 | | | | $1,019.51 | | | | $5.75 | |
| (h) | 5% class return per year before expenses. |
| (p) | “Expenses Paid During Period” are equal to each class’s annualized expense ratio, as shown above, multiplied by the average account value over the period, multiplied by 184/365 (to reflect theone-half year period). |
6
MFS International Growth Portfolio
PORTFOLIO OF INVESTMENTS – 12/31/19
The Portfolio of Investments is a complete list of all securities owned by your fund. It is categorized by broad-based asset classes.
| | | | | | | | |
| | |
| Issuer | | Shares/Par | | | Value ($) | |
| COMMON STOCKS – 98.6% | | | | | |
| Aerospace – 1.1% | | | | | | | | |
| Rolls-Royce Holdings PLC | | | 172,805 | | | $ | 1,563,827 | |
| | | | | | | | |
| Airlines – 0.3% | | | | | | | | |
| Japan Airport Terminal Co. Ltd. | | | 9,100 | | | $ | 503,617 | |
| | | | | | | | |
| Alcoholic Beverages – 5.4% | | | | | | | | |
| Ambev S.A., ADR | | | 146,824 | | | $ | 684,200 | |
| China Resources Beer Holdings Co. Ltd. | | | 152,000 | | | | 840,728 | |
| Diageo PLC | | | 72,532 | | | | 3,074,908 | |
| Pernod Ricard S.A. | | | 18,276 | | | | 3,267,730 | |
| | | | | | | | |
| | | | | | $ | 7,867,566 | |
| | | | | | | | |
| Apparel Manufacturers – 5.2% | | | | | | | | |
| Burberry Group PLC | | | 37,766 | | | $ | 1,103,048 | |
| Kering S.A. | | | 2,562 | | | | 1,681,745 | |
| LVMH Moet Hennessy Louis Vuitton SE | | | 10,438 | | | | 4,849,579 | |
| | | | | | | | |
| | | | | | $ | 7,634,372 | |
| | | | | | | | |
| Business Services – 6.2% | | | | | | | | |
| Accenture PLC, “A” | | | 12,071 | | | $ | 2,541,790 | |
| Brenntag AG | | | 20,014 | | | | 1,088,362 | |
| Compass Group PLC | | | 54,027 | | | | 1,352,562 | |
| Experian PLC | | | 64,620 | | | | 2,184,401 | |
| Infosys Technologies Ltd., ADR | | | 101,070 | | | | 1,043,042 | |
| Intertek Group PLC | | | 11,844 | | | | 918,095 | |
| | | | | | | | |
| | | | | | $ | 9,128,252 | |
| | | | | | | | |
| Computer Software – 4.2% | | | | | | | | |
| OBIC Co. Ltd. | | | 7,300 | | | $ | 986,102 | |
| SAP SE | | | 38,671 | | | | 5,219,152 | |
| | | | | | | | |
| | | | | | $ | 6,205,254 | |
| | | | | | | | |
| Computer Software – Systems – 3.5% | | | | | |
| Amadeus IT Group S.A. | | | 18,346 | | | $ | 1,498,130 | |
| Hitachi Ltd. | | | 62,200 | | | | 2,619,991 | |
| NICE Systems Ltd., ADR (a) | | | 6,471 | | | | 1,003,975 | |
| | | | | | | | |
| | | | | | $ | 5,122,096 | |
| | | | | | | | |
| Construction – 0.8% | | | | | | | | |
| Toto Ltd. | | | 26,100 | | | $ | 1,099,929 | |
| | | | | | | | |
| Consumer Products – 5.4% | | | | | | | | |
| Kao Corp. | | | 14,000 | | | $ | 1,154,691 | |
| L’Oréal | | | 13,671 | | | | 4,048,377 | |
| Reckitt Benckiser Group PLC | | | 34,369 | | | | 2,790,238 | |
| | | | | | | | |
| | | | | | $ | 7,993,306 | |
| | | | | | | | |
| Consumer Services – 0.5% | | | | | | | | |
| 51job, Inc., ADR (a) | | | 8,470 | | | $ | 719,103 | |
| | | | | | | | |
| Containers – 0.5% | | | | | | | | |
| Brambles Ltd. | | | 88,482 | | | $ | 727,721 | |
| | | | | | | | |
| Electrical Equipment – 4.4% | | | | | | | | |
| Legrand S.A. | | | 9,996 | | | $ | 814,477 | |
| Mettler-Toledo International, Inc. (a) | | | 1,242 | | | | 985,254 | |
| Prysmian S.p.A. | | | 52,873 | | | | 1,274,521 | |
| | | | | | | | |
| | |
| Issuer | | Shares/Par | | | Value ($) | |
| COMMON STOCKS – continued | | | | | |
| Electrical Equipment – continued | | | | | |
| Schneider Electric SE | | | 32,588 | | | $ | 3,344,687 | |
| | | | | | | | |
| | | | | | $ | 6,418,939 | |
| | | | | | | | |
| Electronics – 5.2% | | | | | | | | |
| Delta Electronics, Inc. | | | 86,000 | | | $ | 434,633 | |
| Mellanox Technologies Ltd. (a) | | | 8,914 | | | | 1,044,542 | |
| Taiwan Semiconductor Manufacturing Co. Ltd., ADR | | | 105,288 | | | | 6,117,233 | |
| | | | | | | | |
| | | | | | $ | 7,596,408 | |
| | | | | | | | |
| Energy – Independent – 0.9% | | | | | | | | |
| Oil Search Ltd. | | | 250,013 | | | $ | 1,271,988 | |
| | | | | | | | |
| Food & Beverages – 7.4% | | | | | | | | |
| Danone S.A. | | | 42,946 | | | $ | 3,559,950 | |
| Nestle S.A. | | | 68,050 | | | | 7,367,513 | |
| | | | | | | | |
| | | | | | $ | 10,927,463 | |
| | | | | | | | |
| Gaming & Lodging – 0.9% | | | | | | | | |
| Flutter Entertainment PLC | | | 10,777 | | | $ | 1,316,746 | |
| | | | | | | | |
| General Merchandise – 0.3% | | | | | | | | |
| Walmart de Mexico S.A.B. de C.V. | | | 138,843 | | | $ | 397,638 | |
| | | | | | | | |
| Insurance – 3.5% | | | | | | | | |
| AIA Group Ltd. | | | 484,800 | | | $ | 5,089,209 | |
| | | | | | | | |
| Internet – 3.5% | | | | | | | | |
| Alibaba Group Holding Ltd., ADR (a) | | | 5,499 | | | $ | 1,166,338 | |
| Baidu, Inc., ADR (a) | | | 15,051 | | | | 1,902,446 | |
| NAVER Corp. (a) | | | 11,171 | | | | 1,801,541 | |
| Yandex N.V., “A” (a) | | | 4,918 | | | | 213,884 | |
| | | | | | | | |
| | | | | | $ | 5,084,209 | |
| | | | | | | | |
| Leisure & Toys – 0.7% | | | | | | | | |
| BANDAI NAMCO Holdings, Inc. | | | 17,000 | | | $ | 1,031,565 | |
| | | | | | | | |
| Machinery & Tools – 2.3% | | | | | | | | |
| GEA Group AG | | | 40,632 | | | $ | 1,343,607 | |
| Ritchie Bros. Auctioneers, Inc. | | | 48,901 | | | | 2,098,313 | |
| | | | | | | | |
| | | | | | $ | 3,441,920 | |
| | | | | | | | |
| Medical & Health Technology & Services – 1.2% | |
| Alcon, Inc. (a) | | | 6,715 | | | $ | 380,225 | |
| Fresenius Medical Care AG & Co. KGaA | | | 19,574 | | | | 1,448,228 | |
| | | | | | | | |
| | | | | | $ | 1,828,453 | |
| | | | | | | | |
| Medical Equipment – 4.2% | | | | | | | | |
| EssilorLuxottica | | | 20,853 | | | $ | 3,176,472 | |
| QIAGEN N.V. (a) | | | 30,626 | | | | 1,046,398 | |
| Terumo Corp. | | | 55,500 | | | | 1,960,790 | |
| | | | | | | | |
| | | | | | $ | 6,183,660 | |
| | | | | | | | |
| Natural Gas – Distribution – 0.3% | | | | | | | | |
| China Resources Gas Group Ltd. | | | 78,000 | | | $ | 428,423 | |
| | | | | | | | |
7
MFS International Growth Portfolio
Portfolio of Investments – continued
| | | | | | | | |
| | |
| Issuer | | Shares/Par | | | Value ($) | |
| COMMON STOCKS – continued | | | | | |
| Other Banks & Diversified Financials – 6.4% | | | | | |
| AEON Financial Service Co. Ltd. | | | 57,200 | | | $ | 899,693 | |
| Credicorp Ltd. | | | 3,901 | | | | 831,420 | |
| DBS Group Holdings Ltd. | | | 99,700 | | | | 1,918,463 | |
| Element Fleet Management Corp. | | | 124,765 | | | | 1,065,530 | |
| Grupo Financiero Banorte S.A. de C.V. | | | 216,607 | | | | 1,210,341 | |
| HDFC Bank Ltd. | | | 174,721 | | | | 3,113,874 | |
| Komercni Banka A.S. | | | 9,588 | | | | 350,826 | |
| | | | | | | | |
| | | | | | $ | 9,390,147 | |
| | | | | | | | |
| Pharmaceuticals – 9.6% | | | | | | | | |
| Bayer AG | | | 32,559 | | | $ | 2,659,125 | |
| Novartis AG | | | 36,924 | | | | 3,506,216 | |
| Novo Nordisk A.S., “B” | | | 23,316 | | | | 1,353,248 | |
| Roche Holding AG | | | 20,430 | | | | 6,628,456 | |
| | | | | | | | |
| | | | | | $ | 14,147,045 | |
| | | | | | | | |
| Precious Metals & Minerals – 1.4% | | | | | | | | |
| Agnico-Eagle Mines Ltd. | | | 19,098 | | | $ | 1,176,280 | |
| Franco-Nevada Corp. | | | 8,885 | | | | 917,477 | |
| | | | | | | | |
| | | | | | $ | 2,093,757 | |
| | | | | | | | |
| Railroad & Shipping – 2.5% | | | | | | | | |
| Adani Ports and Special Economic Zone Ltd. | | | 95,061 | | | $ | 487,437 | |
| Canadian National Railway Co. | | | 35,422 | | | | 3,203,920 | |
| | | | | | | | |
| | | | | | $ | 3,691,357 | |
| | | | | | | | |
| Restaurants – 0.4% | | | | | | | | |
| Yum China Holdings, Inc. | | | 13,480 | | | $ | 647,175 | |
| | | | | | | | |
| Specialty Chemicals – 8.3% | | | | | | | | |
| Akzo Nobel N.V. | | | 20,933 | | | $ | 2,128,277 | |
| Croda International PLC | | | 19,155 | | | | 1,299,083 | |
| Kansai Paint Co. Ltd. | | | 23,900 | | | | 584,129 | |
| L’Air Liquide S.A. | | | 17,391 | | | | 2,461,844 | |
| Linde PLC | | | 15,641 | | | | 3,347,492 | |
| Sika AG | | | 5,208 | | | | 978,585 | |
| Symrise AG | | | 13,802 | | | | 1,452,184 | |
| | | | | | | | |
| | | | | | $ | 12,251,594 | |
| | | | | | | | |
| | | | | | | | |
| | |
| Issuer | | Shares/Par | | | Value ($) | |
| COMMON STOCKS – continued | | | | | |
| Specialty Stores – 0.3% | | | | | | | | |
| Just Eat PLC (a) | | | 33,543 | | | $ | 370,910 | |
| | | | | | | | |
| Telecommunications – Wireless – 0.3% | |
| SoftBank Corp. | | | 9,800 | | | $ | 426,658 | |
| | | | | | | | |
| Tobacco – 1.5% | | | | | | | | |
| ITC Ltd. | | | 290,683 | | | $ | 968,018 | |
| Japan Tobacco, Inc. | | | 56,000 | | | | 1,248,414 | |
| | | | | | | | |
| | | | | | $ | 2,216,432 | |
| | | | | | | | |
Total Common Stocks
(Identified Cost, $80,900,994) | | | | | | $ | 144,816,739 | |
| | | | | | | | |
| |
| INVESTMENT COMPANIES (h) – 0.5% | | | | | |
| Money Market Funds – 0.5% | | | | | |
| MFS Institutional Money Market Portfolio, 1.7% (v) (Identified Cost, $677,102) | | | 677,119 | | | $ | 677,119 | |
| | | | | | | | |
OTHER ASSETS, LESS
LIABILITIES – 0.9% | | | | | | | 1,381,842 | |
| | | | | | | | |
| NET ASSETS – 100.0% | | | | | | $ | 146,875,700 | |
| | | | | | | | |
| (a) | | Non-income producing security. |
| (h) | | An affiliated issuer, which may be considered one in which the fund owns 5% or more of the outstanding voting securities, or a company which is under common control. At period end, the aggregate values of the fund’s investments in affiliated issuers and in unaffiliated issuers were $677,119 and $144,816,739, respectively. |
| (v) | | Affiliated issuer that is available only to investment companies managed by MFS. The rate quoted for the MFS Institutional Money Market Portfolio is the annualizedseven-day yield of the fund at period end. |
The following abbreviations are used in this report and are defined:
| ADR | | American Depositary Receipt |
See Notes to Financial Statements
8
MFS International Growth Portfolio
FINANCIAL STATEMENTS | STATEMENT OF ASSETS AND LIABILITIES
This statement represents your fund’s balance sheet, which details the assets and liabilities comprising the total value of the fund.
| | | | |
At 12/31/19 | | | | |
| |
Assets | | | | |
Investments in unaffiliated issuers, at value (identified cost, $80,900,994) | | | $144,816,739 | |
Investments in affiliated issuers, at value (identified cost, $677,102) | | | 677,119 | |
Foreign currency, at value (identified cost, $50,579) | | | 50,596 | |
Receivables for | | | | |
Investments sold | | | 707,939 | |
Fund shares sold | | | 323,653 | |
Interest and dividends | | | 719,882 | |
Receivable from investment adviser | | | 18,242 | |
Other assets | | | 1,093 | |
Total assets | | | $147,315,263 | |
| |
Liabilities | | | | |
Payables for | | | | |
Investments purchased | | | $81,036 | |
Fund shares reacquired | | | 217,703 | |
Payable to affiliates | | | | |
Administrative services fee | | | 162 | |
Shareholder servicing costs | | | 15 | |
Distribution and/or service fees | | | 471 | |
Payable for independent Trustees’ compensation | | | 25 | |
Deferred country tax expense payable | | | 44,038 | |
Accrued expenses and other liabilities | | | 96,113 | |
Total liabilities | | | $439,563 | |
Net assets | | | $146,875,700 | |
| |
Net assets consist of | | | | |
Paid-in capital | | | $80,263,191 | |
Total distributable earnings (loss) | | | 66,612,509 | |
Net assets | | | $146,875,700 | |
Shares of beneficial interest outstanding | | | 10,323,705 | |
| | | | | | | | | | | | |
| | | |
| | | Net assets | | | Shares
outstanding | | | Net asset value
per share | |
Initial Class | | | $112,259,432 | | | | 7,870,012 | | | | $14.26 | |
Service Class | | | 34,616,268 | | | | 2,453,693 | | | | 14.11 | |
See Notes to Financial Statements
9
MFS International Growth Portfolio
FINANCIAL STATEMENTS | STATEMENT OF OPERATIONS
This statement describes how much your fund earned in investment income and accrued in expenses. It also describes any gains and/or losses generated by fund operations.
| | | | |
Year ended 12/31/19 | | | | |
| |
Net investment income (loss) | | | | |
Income | | | | |
Dividends | | | $3,656,050 | |
Dividends from affiliated issuers | | | 17,280 | |
Income on securities loaned | | | 89 | |
Other | | | 23 | |
Foreign taxes withheld | | | (331,385 | ) |
Total investment income | | | $3,342,057 | |
Expenses | | | | |
Management fee | | | $1,276,308 | |
Distribution and/or service fees | | | 77,387 | |
Shareholder servicing costs | | | 3,446 | |
Administrative services fee | | | 29,817 | |
Independent Trustees’ compensation | | | 5,119 | |
Custodian fee | | | 68,334 | |
Shareholder communications | | | 6,979 | |
Audit and tax fees | | | 66,742 | |
Legal fees | | | 1,222 | |
Miscellaneous | | | 29,511 | |
Total expenses | | | $1,564,865 | |
Reduction of expenses by investment adviser | | | (237,951 | ) |
Net expenses | | | $1,326,914 | |
Net investment income (loss) | | | $2,015,143 | |
| |
Realized and unrealized gain (loss) | | | | |
Realized gain (loss) (identified cost basis) | | | | |
Unaffiliated issuers | | | $2,050,752 | |
Affiliated issuers | | | (25 | ) |
Foreign currency | | | (8,695 | ) |
Net realized gain (loss) | | | $2,042,032 | |
Change in unrealized appreciation or depreciation | | | | |
Unaffiliated issuers (net of $42,994 increase in deferred country tax) | | | $30,141,674 | |
Affiliated issuers | | | 17 | |
Translation of assets and liabilities in foreign currencies | | | 8,548 | |
Net unrealized gain (loss) | | | $30,150,239 | |
Net realized and unrealized gain (loss) | | | $32,192,271 | |
Change in net assets from operations | | | $34,207,414 | |
See Notes to Financial Statements
10
MFS International Growth Portfolio
FINANCIAL STATEMENTS | STATEMENTS OF CHANGES IN NET ASSETS
These statements describe the increases and/or decreases in net assets resulting from operations, any distributions, and any shareholder transactions.
| | | | | | | | |
| | | Year ended | |
| | | 12/31/19 | | | 12/31/18 | |
Change in net assets | | | | | | | | |
| | |
From operations | | | | | | | | |
Net investment income (loss) | | | $2,015,143 | | | | $1,668,996 | |
Net realized gain (loss) | | | 2,042,032 | | | | 15,697,610 | |
Net unrealized gain (loss) | | | 30,150,239 | | | | (30,584,499 | ) |
Change in net assets from operations | | | $34,207,414 | | | | $(13,217,893 | ) |
Total distributions to shareholders | | | $(17,055,112 | ) | | | $(14,569,147 | ) |
Change in net assets from fund share transactions | | | $(3,428,696 | ) | | | $804,364 | |
Total change in net assets | | | $13,723,606 | | | | $(26,982,676 | ) |
| | |
Net assets | | | | | | | | |
At beginning of period | | | 133,152,094 | | | | 160,134,770 | |
At end of period | | | $146,875,700 | | | | $133,152,094 | |
See Notes to Financial Statements
11
MFS International Growth Portfolio
FINANCIAL STATEMENTS | FINANCIAL HIGHLIGHTS
The financial highlights table is intended to help you understand the fund’s financial performance for the past 5 years. Certain information reflects financial results for a single fund share. The total returns in the table represent the rate that an investor would have earned (or lost) on an investment in the fund share class (assuming reinvestment of all distributions) held for the entire period.
| | | | | | | | | | | | | | | | | | | | |
| Initial Class | | Year ended | |
| | | | | |
| | | 12/31/19 | | | 12/31/18 | | | 12/31/17 | | | 12/31/16 | | | 12/31/15 | |
| | | | | |
Net asset value, beginning of period | | | $12.78 | | | | $15.50 | | | | $12.13 | | | | $12.57 | | | | $13.29 | |
| | | | | |
| Income (loss) from investment operations | | | | | | | | | | | | | | | | | | | | |
Net investment income (loss) (d) | | | $0.21 | | | | $0.17 | | | | $0.14 | | | | $0.17 | (c) | | | $0.13 | |
Net realized and unrealized gain (loss) | | | 3.07 | | | | (1.38 | ) | | | 3.77 | | | | 0.19 | | | | (0.11 | )(g) |
Total from investment operations | | | $3.28 | | | | $(1.21 | ) | | | $3.91 | | | | $0.36 | | | | $0.02 | |
| | | | | |
| Less distributions declared to shareholders | | | | | | | | | | | | | | | | | | | | |
From net investment income | | | $(0.18 | ) | | | $(0.16 | ) | | | $(0.20 | ) | | | $(0.15 | ) | | | $(0.22 | ) |
From net realized gain | | | (1.62 | ) | | | (1.35 | ) | | | (0.34 | ) | | | (0.65 | ) | | | (0.52 | ) |
Total distributions declared to shareholders | | | $(1.80 | ) | | | $(1.51 | ) | | | $(0.54 | ) | | | $(0.80 | ) | | | $(0.74 | ) |
Net asset value, end of period (x) | | | $14.26 | | | | $12.78 | | | | $15.50 | | | | $12.13 | | | | $12.57 | |
Total return (%) (k)(r)(s)(x) | | | 27.30 | | | | (9.02 | ) | | | 32.64 | | | | 2.49 | (c) | | | 0.32 | |
| | | | | |
Ratios (%) (to average net assets)
and Supplemental data: | | | | | | | | | | | | | | | | | | | | |
Expenses before expense reductions (f) | | | 1.05 | | | | 1.05 | | | | 1.05 | | | | 0.91 | (c) | | | 1.03 | |
Expenses after expense reductions (f) | | | 0.88 | | | | 0.97 | | | | 1.05 | | | | 0.91 | (c) | | | 1.03 | |
Net investment income (loss) | | | 1.49 | | | | 1.16 | | | | 0.96 | | | | 1.33 | (c) | | | 0.99 | |
Portfolio turnover | | | 7 | | | | 18 | | | | 10 | | | | 15 | | | | 22 | |
Net assets at end of period (000 omitted) | | | $112,259 | | | | $105,919 | | | | $130,591 | | | | $126,668 | | | | $138,482 | |
| |
| Service Class | | Year ended | |
| | | | | |
| | | 12/31/19 | | | 12/31/18 | | | 12/31/17 | | | 12/31/16 | | | 12/31/15 | |
| | | | | |
Net asset value, beginning of period | | | $12.65 | | | | $15.37 | | | | $12.03 | | | | $12.48 | | | | $13.19 | |
| | | | | |
| Income (loss) from investment operations | | | | | | | | | | | | | | | | | | | | |
Net investment income (loss) (d) | | | $0.16 | | | | $0.13 | | | | $0.10 | | | | $0.13 | (c) | | | $0.10 | |
Net realized and unrealized gain (loss) | | | 3.07 | | | | (1.38 | ) | | | 3.74 | | | | 0.18 | | | | (0.11 | )(g) |
Total from investment operations | | | $3.23 | | | | $(1.25 | ) | | | $3.84 | | | | $0.31 | | | | $(0.01 | ) |
| | | | | |
| Less distributions declared to shareholders | | | | | | | | | | | | | | | | | | | | |
From net investment income | | | $(0.15 | ) | | | $(0.12 | ) | | | $(0.16 | ) | | | $(0.11 | ) | | | $(0.18 | ) |
From net realized gain | | | (1.62 | ) | | | (1.35 | ) | | | (0.34 | ) | | | (0.65 | ) | | | (0.52 | ) |
Total distributions declared to shareholders | | | $(1.77 | ) | | | $(1.47 | ) | | | $(0.50 | ) | | | $(0.76 | ) | | | $(0.70 | ) |
Net asset value, end of period (x) | | | $14.11 | | | | $12.65 | | | | $15.37 | | | | $12.03 | | | | $12.48 | |
Total return (%) (k)(r)(s)(x) | | | 27.11 | | | | (9.30 | ) | | | 32.35 | | | | 2.15 | (c) | | | 0.10 | |
| | | | | |
Ratios (%) (to average net assets)
and Supplemental data: | | | | | | | | | | | | | | | | | | | | |
Expenses before expense reductions (f) | | | 1.30 | | | | 1.30 | | | | 1.30 | | | | 1.16 | (c) | | | 1.28 | |
Expenses after expense reductions (f) | | | 1.13 | | | | 1.22 | | | | 1.30 | | | | 1.16 | (c) | | | 1.28 | |
Net investment income (loss) | | | 1.18 | | | | 0.87 | | | | 0.70 | | | | 1.08 | (c) | | | 0.72 | |
Portfolio turnover | | | 7 | | | | 18 | | | | 10 | | | | 15 | | | | 22 | |
Net assets at end of period (000 omitted) | | | $34,616 | | | | $27,233 | | | | $29,544 | | | | $25,277 | | | | $26,144 | |
See Notes to Financial Statements
12
MFS International Growth Portfolio
Financial Highlights – continued
| (c) | Amount reflects aone-time reimbursement of expenses by the custodian (or former custodian) without which net investment income and performance would be lower and expenses would be higher. |
| (d) | Per share data is based on average shares outstanding. |
| (f) | Ratios do not reflect reductions from fees paid indirectly, if applicable. |
| (g) | The per share amount varies from the net realized and unrealized gain/loss for the period because of the timing of sales of fund shares and the per share amount of realized and unrealized gains and losses at such time. |
| (k) | The total return does not reflect expenses that apply to separate accounts. Inclusion of these charges would reduce the total return figures for all periods shown. |
| (r) | Certain expenses have been reduced without which performance would have been lower. |
| (s) | From time to time the fund may receive proceeds from litigation settlements, without which performance would be lower. |
| (x) | The net asset values and total returns have been calculated on net assets which include adjustments made in accordance with U.S. generally accepted accounting principles required at period end for financial reporting purposes. |
See Notes to Financial Statements
13
MFS International Growth Portfolio
NOTES TO FINANCIAL STATEMENTS
| (1) | | Business and Organization |
MFS International Growth Portfolio (the fund) is a diversified series of MFS Variable Insurance Trust II (the trust). The trust is organized as a Massachusetts business trust and is registered under the Investment Company Act of 1940, as amended, as anopen-end management investment company. The shareholders of each series of the trust are separate accounts of insurance companies, which offer variable annuity and/or life insurance products, and qualified retirement and pension plans.
The fund is an investment company and accordingly follows the investment company accounting and reporting guidance of the Financial Accounting Standards Board (FASB) Accounting Standards Codification Topic 946 Financial Services – Investment Companies.
| (2) | | Significant Accounting Policies |
General – The preparation of financial statements in conformity with U.S. generally accepted accounting principles requires management to make estimates and assumptions that affect the reported amounts of assets and liabilities, and disclosure of contingent assets and liabilities at the date of the financial statements and the reported amounts of increases and decreases in net assets from operations during the reporting period. Actual results could differ from those estimates. In the preparation of these financial statements, management has evaluated subsequent events occurring after the date of the fund’s Statement of Assets and Liabilities through the date that the financial statements were issued. The fund invests in foreign securities, including securities of emerging market issuers. Investments in foreign securities are vulnerable to the effects of changes in the relative values of the local currency and the U.S. dollar and to the effects of changes in each country’s market, economic, industrial, political, regulatory, geopolitical, and other conditions. Investments in emerging markets can involve additional and greater risks than the risks associated with investments in developed foreign markets. Emerging markets can have less developed markets, greater custody and operational risk, less developed legal, regulatory, and accounting systems, and greater political, social, and economic instability than developed markets.
Balance Sheet Offsetting– The fund’s accounting policy with respect to balance sheet offsetting is that, absent an event of default by the counterparty or a termination of the agreement, the International Swaps and Derivatives Association (ISDA) Master Agreement, or similar agreement, does not result in an offset of reported amounts of financial assets and financial liabilities in the Statement of Assets and Liabilities across transactions between the fund and the applicable counterparty. The fund’s right to setoff may be restricted or prohibited by the bankruptcy or insolvency laws of the particular jurisdiction to which a specific master netting agreement counterparty is subject. Balance sheet offsetting disclosures, to the extent applicable to the fund, have been included in the fund’s Significant Accounting Policies note under the captions for each of the fund’sin-scope financial instruments and transactions.
Investment Valuations– Equity securities, including restricted equity securities, are generally valued at the last sale or official closing price on their primary market or exchange as provided by a third-party pricing service. Equity securities, for which there were no sales reported that day, are generally valued at the last quoted daily bid quotation on their primary market or exchange as provided by a third-party pricing service. Short-term instruments with a maturity at issuance of 60 days or less may be valued at amortized cost, which approximates market value.Open-end investment companies are generally valued at net asset value per share. Securities and other assets generally valued on the basis of information from a third-party pricing service may also be valued at a broker/dealer bid quotation. In determining values, third-party pricing services can utilize both transaction data and market information such as yield, quality, coupon rate, maturity, type of issue, trading characteristics, and other market data. The values of foreign securities and other assets and liabilities expressed in foreign currencies are converted to U.S. dollars using the mean of bid and asked prices for rates provided by a third-party pricing service.
The Board of Trustees has delegated primary responsibility for determining or causing to be determined the value of the fund’s investments (including any fair valuation) to the adviser pursuant to valuation policies and procedures approved by the Board. If the adviser determines that reliable market quotations are not readily available, investments are valued at fair value as determined in good faith by the adviser in accordance with such procedures under the oversight of the Board of Trustees. Under the fund’s valuation policies and procedures, market quotations are not considered to be readily available for most types of debt instruments and floating rate loans and many types of derivatives. These investments are generally valued at fair value based on information from third-party pricing services. In addition, investments may be valued at fair value if the adviser determines that an investment’s value has been materially affected by events occurring after the close of the exchange or market on which the investment is principally traded (such as foreign exchange or market) and prior to the determination of the fund’s net asset value, or after the halt of trading of a specific security where trading does not resume prior to the close of the exchange or market on which the security is principally traded. Events that occur after foreign markets close (such as developments in foreign markets and significant movements in the U.S. markets) and prior to the determination of the fund’s net asset value may be deemed to have a material effect on the value of securities traded in foreign markets. Accordingly, the fund’s foreign equity securities may often be valued at fair value. The adviser generally relies on third-party pricing services or other information (such as the correlation with price movements of similar securities in the same or other markets; the type, cost and investment characteristics of the security; the business and financial condition of the
14
MFS International Growth Portfolio
Notes to Financial Statements – continued
issuer; and trading and other market data) to assist in determining whether to fair value and at what value to fair value an investment. The value of an investment for purposes of calculating the fund’s net asset value can differ depending on the source and method used to determine value. When fair valuation is used, the value of an investment used to determine the fund’s net asset value may differ from quoted or published prices for the same investment. There can be no assurance that the fund could obtain the fair value assigned to an investment if it were to sell the investment at the same time at which the fund determines its net asset value per share.
Various inputs are used in determining the value of the fund’s assets or liabilities. These inputs are categorized into three broad levels. In certain cases, the inputs used to measure fair value may fall into different levels of the fair value hierarchy. In such cases, an investment’s level within the fair value hierarchy is based on the lowest level of input that is significant to the fair value measurement. The fund’s assessment of the significance of a particular input to the fair value measurement in its entirety requires judgment, and considers factors specific to the investment. Level 1 includes unadjusted quoted prices in active markets for identical assets or liabilities. Level 2 includes other significant observable market-based inputs (including quoted prices for similar securities, interest rates, prepayment speed, and credit risk). Level 3 includes unobservable inputs, which may include the adviser’s own assumptions in determining the fair value of investments. The following is a summary of the levels used as of December 31, 2019 in valuing the fund’s assets or liabilities:
| | | | | | | | | | | | | | | | |
| Financial Instruments | | Level 1 | | | Level 2 | | | Level 3 | | | Total | |
| Equity Securities: | | | | | | | | | | | | | | | | |
France | | | $27,204,861 | | | | $— | | | | $— | | | | $27,204,861 | |
Switzerland | | | 18,860,995 | | | | — | | | | — | | | | 18,860,995 | |
United Kingdom | | | 14,657,072 | | | | — | | | | — | | | | 14,657,072 | |
Germany | | | 14,257,056 | | | | — | | | | — | | | | 14,257,056 | |
Japan | | | — | | | | 12,515,579 | | | | — | | | | 12,515,579 | |
Canada | | | 8,461,520 | | | | — | | | | — | | | | 8,461,520 | |
United States | | | 7,919,078 | | | | — | | | | — | | | | 7,919,078 | |
Taiwan | | | 6,551,866 | | | | — | | | | — | | | | 6,551,866 | |
China | | | 5,704,213 | | | | — | | | | — | | | | 5,704,213 | |
Other Countries | | | 28,684,499 | | | | — | | | | — | | | | 28,684,499 | |
| Mutual Funds | | | 677,119 | | | | — | | | | — | | | | 677,119 | |
| Total | | | $132,978,279 | | | | $12,515,579 | | | | $— | | | | $145,493,858 | |
For further information regarding security characteristics, see the Portfolio of Investments.
Foreign Currency Translation– Purchases and sales of foreign investments, income, and expenses are converted into U.S. dollars based upon currency exchange rates prevailing on the respective dates of such transactions or on the reporting date for foreign denominated receivables and payables. Gains and losses attributable to foreign currency exchange rates on sales of securities are recorded for financial statement purposes as net realized gains and losses on investments. Gains and losses attributable to foreign exchange rate movements on receivables, payables, income and expenses are recorded for financial statement purposes as foreign currency transaction gains and losses. That portion of both realized and unrealized gains and losses on investments that results from fluctuations in foreign currency exchange rates is not separately disclosed.
Security Loans– Under its Securities Lending Agency Agreement with the fund, State Street Bank and Trust Company, as lending agent, loans the securities of the fund to certain qualified institutions (the “Borrowers”) approved by the fund. Security loans can be terminated at the discretion of either the lending agent or the fund and the related securities must be returned within the earlier of the standard trade settlement period for such securities or within three business days. The loans are collateralized by cash and/or U.S. Treasury and federal agency obligations in an amount typically at least equal to the market value of the securities loaned. On loans collateralized by cash, the cash collateral is invested in a money market fund. The market value of the loaned securities is determined at the close of business of the fund and any additional required collateral is delivered to the fund on the next business day. The lending agent provides the fund with indemnification against Borrower default. In the event of Borrower default, the lending agent will, for the benefit of the fund, either purchase securities identical to those loaned or, when such purchase is commercially impracticable, pay the fund the market value of the loaned securities. In return, the lending agent assumes the fund’s rights to the related collateral. If the collateral value is less than the cost to purchase identical securities, the lending agent is responsible for the shortfall, but only to the extent that such shortfall is not due to a decline in collateral value resulting from collateral reinvestment for which the fund bears the risk of loss. A portion of the income generated upon investment of the collateral is remitted to the Borrowers, and the remainder is allocated between the fund and the lending agent. On loans collateralized by U.S. Treasury and/or federal agency obligations, a fee is received from the Borrower, and is allocated between the fund and the lending agent. Income from securities lending is separately reported in the Statement of Operations. The dividend and interest income earned on the securities loaned is accounted for in the same manner as other dividend and interest income. At December 31, 2019, there were no securities on loan or collateral outstanding.
15
MFS International Growth Portfolio
Notes to Financial Statements – continued
Indemnifications– Under the fund’s organizational documents, its officers and Trustees may be indemnified against certain liabilities and expenses arising out of the performance of their duties to the fund. Additionally, in the normal course of business, the fund enters into agreements with service providers that may contain indemnification clauses. The fund’s maximum exposure under these agreements is unknown as this would involve future claims that may be made against the fund that have not yet occurred.
Investment Transactions and Income– Investment transactions are recorded on the trade date. Dividends received in cash are recorded on theex-dividend date. Certain dividends from foreign securities will be recorded when the fund is informed of the dividend if such information is obtained subsequent to theex-dividend date. Dividend payments received in additional securities are recorded on theex-dividend date in an amount equal to the value of the security on such date.
The fund may receive proceeds from litigation settlements. Any proceeds received from litigation involving portfolio holdings are reflected in the Statement of Operations in realized gain/loss if the security has been disposed of by the fund or in unrealized gain/loss if the security is still held by the fund. Any other proceeds from litigation not related to portfolio holdings are reflected as other income in the Statement of Operations.
Tax Matters and Distributions– The fund intends to qualify as a regulated investment company, as defined under Subchapter M of the Internal Revenue Code, and to distribute all of its taxable income, including realized capital gains. As a result, no provision for federal income tax is required. The fund’s federal tax returns, when filed, will remain subject to examination by the Internal Revenue Service for a three year period. Management has analyzed the fund’s tax positions taken on federal and state tax returns for all open tax years and does not believe that there are any uncertain tax positions that require recognition of a tax liability. Foreign taxes, if any, have been accrued by the fund in the accompanying financial statements in accordance with the applicable foreign tax law. Foreign income taxes may be withheld by certain countries in which the fund invests. Additionally, capital gains realized by the fund on securities issued in or by certain foreign countries may be subject to capital gains tax imposed by those countries.
Distributions to shareholders are recorded on theex-dividend date. Income and capital gain distributions are determined in accordance with income tax regulations, which may differ from U.S. generally accepted accounting principles. Certain capital accounts in the financial statements are periodically adjusted for permanent differences in order to reflect their tax character. These adjustments have no impact on net assets or net asset value per share. Temporary differences which arise from recognizing certain items of income, expense, gain or loss in different periods for financial statement and tax purposes will reverse at some time in the future.
Book/tax differences primarily relate to wash sale loss deferrals.
The tax character of distributions declared to shareholders for the last two fiscal years is as follows:
| | | | | | | | |
| | | Year ended
12/31/19 | | | Year ended
12/31/18 | |
| Ordinary income (including any short-term capital gains) | | | $1,867,096 | | | | $2,194,070 | |
| Long-term capital gains | | | 15,188,016 | | | | 12,375,077 | |
| Total distributions | | | $17,055,112 | | | | $14,569,147 | |
The federal tax cost and the tax basis components of distributable earnings were as follows:
| | | | |
| As of 12/31/19 | | | | |
| |
| Cost of investments | | | $82,794,816 | |
| Gross appreciation | | | 65,427,864 | |
| Gross depreciation | | | (2,728,822 | ) |
| Net unrealized appreciation (depreciation) | | | $62,699,042 | |
| |
| Undistributed ordinary income | | | 2,431,143 | |
| Undistributed long-term capital gain | | | 1,492,573 | |
| Other temporary differences | | | (10,249 | ) |
Multiple Classes of Shares of Beneficial Interest– The fund offers multiple classes of shares, which differ in their respective distribution and/or service fees. The fund’s income, realized and unrealized gain (loss), and common expenses are allocated to shareholders based on the daily net assets of each class. Dividends are declared separately for each class. Differences in per share dividend rates are generally due to differences in separate class expenses. The fund’s distributions declared to shareholders as reported in the Statements of Changes in Net Assets are presented by class as follows:
| | | | | | | | |
| | |
| | | Year ended
12/31/19 | | | Year ended
12/31/18 | |
| Initial Class | | | $13,305,912 | | | | $11,588,850 | |
| Service Class | | | 3,749,200 | | | | 2,980,297 | |
| Total | | | $17,055,112 | | | | $14,569,147 | |
16
MFS International Growth Portfolio
Notes to Financial Statements – continued
| (3) | | Transactions with Affiliates |
Investment Adviser– The fund has an investment advisory agreement with MFS to provide overall investment management and related administrative services and facilities to the fund. The management fee is computed daily and paid monthly at the following annual rates based on the fund’s average daily net assets:
| | | | |
| Up to $1 billion | | | 0.90% | |
| In excess of $1 billion and up to $2 billion | | | 0.80% | |
| In excess of $2 billion | | | 0.70% | |
MFS has agreed in writing to reduce its management fee by a specified amount if certain MFS mutual fund assets exceed thresholds agreed to by MFS and the fund’s Board of Trustees. For the year ended December 31, 2019, this management fee reduction amounted to $13,835, which is included in the reduction of total expenses in the Statement of Operations. The management fee incurred for the year ended December 31, 2019 was equivalent to an annual effective rate of 0.89% of the fund’s average daily net assets.
The investment adviser has agreed in writing to pay a portion of the fund’s total annual operating expenses, excluding interest, taxes, extraordinary expenses, brokerage and transaction costs, and investment-related expenses, such that total annual operating expenses do not exceed 0.88% of average daily net assets for the Initial Class shares and 1.13% of average daily net assets for the Service Class shares. This written agreement will continue until modified by the fund’s Board of Trustees, but such agreement will continue at least until April 30, 2021. For the year ended December 31, 2019, this reduction amounted to $224,116, which is included in the reduction of total expenses in the Statement of Operations.
Distributor – MFS Fund Distributors, Inc. (MFD), a wholly-owned subsidiary of MFS, is the distributor of shares of the fund. The Trustees have adopted a distribution plan for the Service Class shares pursuant to Rule12b-1 under the Investment Company Act of 1940.
The fund’s distribution plan provides that the fund will pay MFD distribution and/or service fees equal to 0.25% per annum of its average daily net assets attributable to Service Class shares as partial consideration for services performed and expenses incurred by MFD and financial intermediaries (including participating insurance companies that invest in the fund to fund variable annuity and variable life insurance contracts, sponsors of qualified retirement and pension plans that invest in the fund, and affiliates of these participating insurance companies and plan sponsors) in connection with the sale and distribution of the Service Class shares. MFD may subsequently pay all, or a portion, of the distribution and/or service fees to financial intermediaries.
Shareholder Servicing Agent– MFS Service Center, Inc. (MFSC), a wholly-owned subsidiary of MFS, receives a fee from the fund for its services as shareholder servicing agent. For the year ended December 31, 2019, the fee was $3,112, which equated to 0.0022% annually of the fund’s average daily net assets. MFSC also receives payment from the fund forout-of-pocket expenses paid by MFSC on behalf of the fund. For the year ended December 31, 2019, these costs amounted to $334.
Administrator – MFS provides certain financial, legal, shareholder communications, compliance, and other administrative services to the fund. Under an administrative services agreement, the fund reimburses MFS the costs incurred to provide these services. The fund is charged an annual fixed amount of $17,500 plus a fee based on average daily net assets. The administrative services fee incurred for the year ended December 31, 2019 was equivalent to an annual effective rate of 0.0210% of the fund’s average daily net assets.
Trustees’ and Officers’ Compensation– The fund pays compensation to independent Trustees in the form of a retainer, attendance fees, and additional compensation to Board and Committee chairpersons. The fund does not pay compensation directly to Trustees or officers of the fund who are also officers of the investment adviser, all of whom receive remuneration from MFS for their services to the fund. Certain officers and Trustees of the fund are officers or directors of MFS, MFD, and MFSC.
Other– This fund and certain other funds managed by MFS (the funds) had entered into a service agreement (the ISO Agreement) which provided for payment of fees solely by the funds to Tarantino LLC in return for the provision of services of an Independent Senior Officer (ISO) for the funds. Frank L. Tarantino served as the ISO and was an officer of the funds and the sole member of Tarantino LLC. Effective June 30, 2019, Mr. Tarantino retired from his position as ISO for the funds, and the ISO Agreement was terminated. For the year ended December 31, 2019, the fee paid by the fund under this agreement was $166 and is included in “Miscellaneous” expense in the Statement of Operations. MFS had agreed to bear all expenses associated with office space, other administrative support, and supplies provided to the ISO.
The fund invests in the MFS Institutional Money Market Portfolio which is managed by MFS and seeks current income consistent with preservation of capital and liquidity. This money market fund does not pay a management fee to MFS.
The fund is permitted to engage in purchase and sale transactions with funds and accounts for which MFS serves as investment adviser orsub-adviser (“cross-trades”) pursuant to a policy adopted by the Board of Trustees. This policy has been designed to
17
MFS International Growth Portfolio
Notes to Financial Statements – continued
ensure that cross-trades conducted by the fund comply with Rule17a-7 under the Investment Company Act of 1940. During the year ended December 31, 2019, the fund engaged in purchase and sale transactions pursuant to this policy, which amounted to $3,549 and $258,561, respectively. The sales transactions resulted in net realized gains (losses) of $14,628.
For the year ended December 31, 2019, purchases and sales of investments, other than short-term obligations, aggregated $10,377,343 and $29,841,171, respectively.
| (5) | | Shares of Beneficial Interest |
The fund’s Declaration of Trust permits the Trustees to issue an unlimited number of full and fractional shares of beneficial interest. Transactions in fund shares were as follows:
| | | | | | | | | | | | | | | | |
| | | Year ended 12/31/19 | | | Year ended 12/31/18 | |
| | | | |
| | | Shares | | | Amount | | | Shares | | | Amount | |
| Shares sold | | | | | | | | | | | | | | | | |
Initial Class | | | 165,538 | | | | $2,306,343 | | | | 214,354 | | | | $3,094,484 | |
Service Class | | | 600,379 | | | | 8,346,422 | | | | 512,468 | | | | 7,721,161 | |
| | | 765,917 | | | | $10,652,765 | | | | 726,822 | | | | $10,815,645 | |
| | | | |
| Shares issued to shareholders in reinvestment of distributions | | | | | | | | | | | | | | | | |
Initial Class | | | 1,041,967 | | | | $13,305,912 | | | | 792,671 | | | | $11,588,850 | |
Service Class | | | 296,614 | | | | 3,749,200 | | | | 205,680 | | | | 2,980,297 | |
| | | 1,338,581 | | | | $17,055,112 | | | | 998,351 | | | | $14,569,147 | |
| | | | |
| Shares reacquired | | | | | | | | | | | | | | | | |
Initial Class | | | (1,627,974 | ) | | | $(22,814,367 | ) | | | (1,142,698 | ) | | | $(17,486,023 | ) |
Service Class | | | (595,546 | ) | | | (8,322,206 | ) | | | (488,312 | ) | | | (7,094,405 | ) |
| | | (2,223,520 | ) | | | $(31,136,573 | ) | | | (1,631,010 | ) | | | $(24,580,428 | ) |
| | | | |
| Net change | | | | | | | | | | | | | | | | |
Initial Class | | | (420,469 | ) | | | $(7,202,112 | ) | | | (135,673 | ) | | | $(2,802,689 | ) |
Service Class | | | 301,447 | | | | 3,773,416 | | | | 229,836 | | | | 3,607,053 | |
| | | (119,022 | ) | | | $(3,428,696 | ) | | | 94,163 | | | | $804,364 | |
The fund is one of several mutual funds in which certain MFS funds may invest. The MFS funds do not invest in the underlying funds for the purpose of exercising management or control. At the end of the period, the MFS Moderate Allocation Portfolio, the MFS Growth Allocation Portfolio, and the MFS Conservative Allocation Portfolio were the owners of record of approximately 29%, 12%, and 6%, respectively, of the value of outstanding voting shares of the fund.
The fund and certain other funds managed by MFS participate in a $1.25 billion unsecured committed line of credit, subject to a $1 billion sublimit, provided by a syndicate of banks under a credit agreement. Borrowings may be made for temporary financing needs. Interest is charged to each fund, based on its borrowings, generally at a rate equal to the highest of one month LIBOR, the Federal Funds Effective Rate and the Overnight Bank Funding Rate, plus an agreed upon spread. A commitment fee, based on the average daily, unused portion of the committed line of credit, is allocated among the participating funds. In addition, the fund and other funds managed by MFS have established unsecured uncommitted borrowing arrangements with certain banks for temporary financing needs. Interest is charged to each fund, based on its borrowings, at rates equal to customary reference rates plus an agreed upon spread. For the year ended December 31, 2019, the fund’s commitment fee and interest expense were $774 and $0, respectively, and are included in “Miscellaneous” expense in the Statement of Operations.
| (7) | | Investments in Affiliated Issuers |
An affiliated issuer may be considered one in which the fund owns 5% or more of the outstanding voting securities, or a company which is under common control. For the purposes of this report, the following were affiliated issuers:
| | | | | | | | | | | | | | | | | | | | | | | | |
| Affiliated Issuers | | Beginning
Value | | | Purchases | | | Sales
Proceeds | | | Realized
Gain (Loss) | | | Change in
Unrealized
Appreciation or
Depreciation | | | Ending
Value | |
| MFS Institutional Money Market Portfolio | | | $468,227 | | | | $21,886,742 | | | | $21,677,842 | | | | $(25 | ) | | | $17 | | | | $677,119 | |
| | | | | | |
| Affiliated Issuers | | | | | | | | | | | | | | Dividend
Income | | | Capital Gain
Distributions | |
| MFS Institutional Money Market Portfolio | | | | | | | | | | | | | | | | | | | $17,280 | | | | $— | |
18
MFS International Growth Portfolio
REPORT OF INDEPENDENT REGISTERED PUBLIC ACCOUNTING FIRM
To the Board of Trustees of MFS Variable Insurance Trust II and the Shareholders of MFS International Growth Portfolio:
Opinion on the Financial Statements and Financial Highlights
We have audited the accompanying statement of assets and liabilities of MFS International Growth Portfolio (the “Fund”), including the portfolio of investments, as of December 31, 2019, the related statement of operations for the year then ended, the statements of changes in net assets for each of the two years in the period then ended, the financial highlights for each of the five years in the period then ended, and the related notes. In our opinion, the financial statements and financial highlights present fairly, in all material respects, the financial position of the Fund as of December 31, 2019, and the results of its operations for the year then ended, the changes in its net assets for each of the two years in the period then ended, and the financial highlights for each of the five years in the period then ended, in conformity with accounting principles generally accepted in the United States of America.
Basis for Opinion
These financial statements and financial highlights are the responsibility of the Fund’s management. Our responsibility is to express an opinion on the Fund’s financial statements and financial highlights based on our audits. We are a public accounting firm registered with the Public Company Accounting Oversight Board (United States) (PCAOB) and are required to be independent with respect to the Fund in accordance with the U.S. federal securities laws and the applicable rules and regulations of the Securities and Exchange Commission and the PCAOB.
We conducted our audits in accordance with the standards of the PCAOB. Those standards require that we plan and perform the audit to obtain reasonable assurance about whether the financial statements and financial highlights are free of material misstatement, whether due to error or fraud. The Fund is not required to have, nor were we engaged to perform, an audit of its internal control over financial reporting. As part of our audits we are required to obtain an understanding of internal control over financial reporting but not for the purpose of expressing an opinion on the effectiveness of the Fund’s internal control over financial reporting. Accordingly, we express no such opinion.
Our audits included performing procedures to assess the risks of material misstatement of the financial statements and financial highlights, whether due to error or fraud, and performing procedures that respond to those risks. Such procedures included examining, on a test basis, evidence regarding the amounts and disclosures in the financial statements and financial highlights. Our audits also included evaluating the accounting principles used and significant estimates made by management, as well as evaluating the overall presentation of the financial statements and financial highlights. Our procedures included confirmation of securities owned as of December 31, 2019, by correspondence with the custodian and brokers; when replies were not received from brokers, we performed other auditing procedures. We believe that our audits provide a reasonable basis for our opinion.
DELOITTE & TOUCHE LLP
Boston, Massachusetts
February 14, 2020
We have served as the auditor of one or more of the MFS investment companies since 1924.
19
MFS International Growth Portfolio
TRUSTEES AND OFFICERS – IDENTIFICATION AND BACKGROUND
The Trustees and Officers of the Trust, as of February 1, 2020, are listed below, together with their principal occupations during the past five years. (Their titles may have varied during that period.) The address of each Trustee and Officer is 111 Huntington Avenue, Boston, Massachusetts 02199-7618.
| | | | | | | | | | |
Name, Age | | Position(s)
Held with Fund | | Trustee/Officer
Since (h) | | Number of MFS Funds
overseen by the
Trustee | | Principal Occupations
During the Past Five Years | | Other Directorships During the Past Five Years (j) |
| INTERESTED TRUSTEES |
Robert J. Manning (k)
(age 56) | | Trustee | | February 2004 | | 133 | | Massachusetts Financial Services Company, Executive Chairman (since January 2017); Director; Chairman of the Board; Chief Executive Officer (until 2015);Co-Chief Executive Officer(2015-2016) | | N/A |
| | | | | |
Robin A. Stelmach (k) (age 58) | | Trustee | | January 2014 | | 133 | | Massachusetts Financial Services Company, Vice Chair (since January 2017); Chief Operating Officer and Executive Vice President (until January 2017) | | N/A |
|
| INDEPENDENT TRUSTEES |
John P. Kavanaugh (age 65) | | Trustee and Chair of Trustees | | January 2009 | | 133 | | Private investor | | N/A |
| | | | | |
Steven E. Buller (age 68) | | Trustee | | February 2014 | | 133 | | Financial Accounting Standards Advisory Council, Chairman(2014-2015); Public Company Accounting Oversight Board, Standing Advisory Group, Member (until 2014); BlackRock, Inc. (investment management), Managing Director (until 2014), BlackRock Finco UK (investment management), Director (until 2014) | | N/A |
| | | | | |
John A. Caroselli (age 65) | | Trustee | | March 2017 | | 133 | | JC Global Advisors, LLC (management consulting), President (since 2015); First Capital Corporation (commercial finance), Executive Vice President (until 2015) | | N/A |
| | | | | |
Maureen R. Goldfarb (age 64) | | Trustee | | January 2009 | | 133 | | Private investor | | N/A |
| | | | | |
Peter D. Jones
(age 64) | | Trustee | | January 2019 | | 133 | | Franklin Templeton Distributors, Inc. (investment management), President (until 2015); Franklin Templeton Institutional, LLC (investment management), Chairman (until 2015) | | N/A |
| | | | | |
James W. Kilman, Jr.
(age 58) | | Trustee | | January 2019 | | 133 | | Burford Capital Limited (finance and investment management), Chief Financial Officer (since 2019); KielStrand Capital LLC (family office), Chief Executive Officer (since 2016); Morgan Stanley & Co. (financial services), Vice Chairman of Investment Banking,Co-Head of Diversified Financials Coverage – Financial Institutions Investment Banking Group (until 2016) | | Alpha-En Corporation, Director (2016-2019) |
20
MFS International Growth Portfolio
Trustees and Officers – continued
| | | | | | | | | | |
Name, Age | | Position(s)
Held with Fund | | Trustee/Officer
Since (h) | | Number of MFS Funds
overseen by the
Trustee | | Principal Occupations
During the Past Five Years | | Other Directorships During the Past Five Years (j) |
Clarence Otis, Jr. (age 63) | | Trustee | | March 2017 | | 133 | | Darden Restaurants, Inc., Chief Executive Officer (until 2014) | | VF Corporation, Director; Verizon Communications, Inc., Director; The Travelers Companies, Director; Federal Reserve Bank of Atlanta, Director (until 2015) |
| | | | | |
Maryanne L. Roepke (age 63) | | Trustee | | May 2014 | | 133 | | American Century Investments (investment management), Senior Vice President and Chief Compliance Officer (until 2014) | | N/A |
| | | | | |
Laurie J. Thomsen
(age 62) | | Trustee | | March 2005 | | 133 | | Private investor | | The Travelers Companies, Director; Dycom Industries, Inc., Director (since 2015) |
| | | | | | | | |
Name, Age | | Position(s)
Held with Fund | | Trustee/Officer
Since (h) | | Number of
MFS Funds
for which the
Person is an
Officer | | Principal Occupations During the Past Five Years |
| OFFICERS | | | | | | |
Christopher R. Bohane (k)
(age 46) | | Assistant Secretary and Assistant Clerk | | July 2005 | | 133 | | Massachusetts Financial Services Company, Vice President and Assistant General Counsel |
| | | | |
Kino Clark (k) (age 51) | | Assistant Treasurer | | January 2012 | | 133 | | Massachusetts Financial Services Company, Vice President |
| | | | |
John W. Clark, Jr. (k) (age 52) | | Assistant Treasurer | | April 2017 | | 133 | | Massachusetts Financial Services Company, Vice President (since March 2017); Deutsche Bank (financial services), Department Head –Treasurer’s Office (until February 2017) |
| | | | |
Thomas H. Connors (k) (age 60) | | Assistant Secretary and Assistant Clerk | | September 2012 | | 133 | | Massachusetts Financial Services Company, Vice President and Senior Counsel |
| | | | |
David L. DiLorenzo (k)
(age 51) | | President | | July 2005 | | 133 | | Massachusetts Financial Services Company, Senior Vice President |
| | | | |
Heidi W. Hardin (k) (age 52) | | Secretary and Clerk | | April 2017 | | 133 | | Massachusetts Financial Services Company, Executive Vice President and General Counsel (since March 2017); Harris Associates (investment management), General Counsel (from September 2015 to January 2017); Janus Capital Management LLC (investment management), Senior Vice President and General Counsel (until September 2015) |
| | | | |
Brian E. Langenfeld (k) (age 46) | | Assistant
Secretary and Assistant Clerk | | June 2006 | | 133 | | Massachusetts Financial Services Company, Vice President and Senior Counsel |
| | | | |
Amanda S. Mooradian (k) (age 40) | | Assistant
Secretary and Assistant Clerk | | September 2018 | | 133 | | Massachusetts Financial Services Company, Assistant Vice President and Counsel |
| | | | |
Susan A. Pereira (k)
(age 49) | | Assistant
Secretary and Assistant Clerk | | July 2005 | | 133 | | Massachusetts Financial Services Company, Vice President and Assistant General Counsel |
| | | | |
Kasey L. Phillips (k) (age 49) | | Assistant Treasurer | | September 2012 | | 133 | | Massachusetts Financial Services Company, Vice President |
| | | | |
Matthew A. Stowe (k) (age 45) | | Assistant Secretary and Assistant Clerk | | October 2014 | | 133 | | Massachusetts Financial Services Company, Vice President and Assistant General Counsel |
21
MFS International Growth Portfolio
Trustees and Officers – continued
| | | | | | | | |
Name, Age | | Position(s)
Held with Fund | | Trustee/Officer
Since (h) | | Number of
MFS Funds
for which the
Person is an
Officer | | Principal Occupations During the Past Five Years |
Martin J. Wolin (k) (age 52) | | Chief Compliance Officer | | July 2015 | | 133 | | Massachusetts Financial Services Company, Senior Vice President and Chief Compliance Officer (since July 2015); Mercer (financial service provider), Chief Risk and Compliance Officer, North America and Latin America (until June 2015) |
| | | | |
James O. Yost (k)
(age 59) | | Treasurer | | September 1990 | | 133 | | Massachusetts Financial Services Company, Senior Vice President |
| (h) | Date first appointed to serve as Trustee/officer of an MFS Fund. Each Trustee has served continuously since appointment unless indicated otherwise. For the period from December 15, 2004 until February 22, 2005, Mr. Manning served as Advisory Trustee. From January 2012 through December 2016, Messrs. DiLorenzo and Yost served as Treasurer and Deputy Treasurer of the Funds, respectively. |
| (j) | Directorships or trusteeships of companies required to report to the Securities and Exchange Commission (i.e., “public companies”). |
| (k) | “Interested person” of the Trust within the meaning of the Investment Company Act of 1940 (referred to as the 1940 Act), which is the principal federal law governing investment companies like the fund, as a result of a position with MFS. The address of MFS is 111 Huntington Avenue, Boston, Massachusetts 02199-7618. |
Each Trustee (other than Messrs. Jones and Kilman) has been elected by shareholders and each Trustee and Officer holds office until his or her successor is chosen and qualified or until his or her earlier death, resignation, retirement or removal. Messrs. Jones and Kilman became Trustees of the Funds on January 1, 2019. The Trust does not hold annual meetings for the purpose of electing Trustees, and Trustees are not elected for fixed terms. Under the terms of the Board’s retirement policy, an Independent Trustee shall retire at the end of the calendar year in which he or she reaches the earlier of 75 years of age or 15 years of service on the Board (or, in the case of any Independent Trustee who joined the Board prior to 2015, 20 years of service on the Board).
Messrs. Buller, Kilman and Otis and Ms. Roepke are members of the Trust’s Audit Committee.
Each of the Interested Trustees and certain Officers hold comparable officer positions with certain affiliates of MFS.
The Statement of Additional Information for a Fund includes further information about the Trustees and is available without charge upon request by calling1-800-225-2606.
| | |
Investment Adviser Massachusetts Financial Services Company 111 Huntington Avenue Boston, MA 02199-7618 | | Custodian State Street Bank and Trust Company 1 Lincoln Street Boston, MA 02111-2900 |
| |
Distributor MFS Fund Distributors, Inc. 111 Huntington Avenue Boston, MA 02199-7618 | | Independent Registered Public Accounting Firm Deloitte & Touche LLP 200 Berkeley Street Boston, MA 02116 |
| |
Portfolio Manager(s) David Antonelli Matthew Barrett Kevin Dwan | | |
22
MFS International Growth Portfolio
BOARD REVIEW OF INVESTMENT ADVISORY AGREEMENT
MFS International Growth Portfolio
The Investment Company Act of 1940 requires that both the full Board of Trustees and a majority of thenon-interested (“independent”) Trustees, voting separately, annually approve the continuation of the Fund’s investment advisory agreement with MFS. The Trustees consider matters bearing on the Fund and its advisory arrangements at their meetings throughout the year, including a review of performance data at each regular meeting. In addition, the independent Trustees met several times over the course of three months beginning in May and ending in July, 2019 (“contract review meetings”) for the specific purpose of considering whether to approve the continuation of the investment advisory agreement for the Fund and the other investment companies that the Board oversees (the “MFS Funds”). The independent Trustees were assisted in their evaluation of the Fund’s investment advisory agreement by independent legal counsel, from whom they received separate legal advice and with whom they met separately from MFS during various contract review meetings. The independent Trustees were also assisted in this process by the MFS Funds’ Independent Senior Officer, a senior officer appointed by and reporting to the independent Trustees.
In connection with their deliberations regarding the continuation of the investment advisory agreement, the Trustees, including the independent Trustees, considered such information and factors as they believed, in light of the legal advice furnished to them and their own business judgment, to be relevant. The investment advisory agreement for the Fund was considered separately, although the Trustees also took into account the common interests of all MFS Funds in their review. As described below, the Trustees considered the nature, quality, and extent of the various investment advisory, administrative, and shareholder services performed by MFS under the existing investment advisory agreement and other arrangements with the Fund.
In connection with their contract review meetings, the Trustees received and relied upon materials that included, among other items: (i) information provided by Broadridge Financial Solutions, Inc. (“Broadridge”), an independent third party, on the investment performance of the Fund for various time periods ended December 31, 2018 and the investment performance of a group of funds with substantially similar investment classifications/objectives (the “Broadridge performance universe”), (ii) information provided by Broadridge on the Fund’s advisory fees and other expenses and the advisory fees and other expenses of comparable funds identified by Broadridge as well as all other funds in the same investment classification/category (the “Broadridge expense group and universe”), (iii) information provided by MFS on the advisory fees of portfolios of other clients of MFS, including institutional separate accounts and other clients, (iv) information as to whether and to what extent applicable expense waivers, reimbursements or fee “breakpoints” are observed for the Fund, (v) information regarding MFS’ financial results and financial condition, including MFS’ and certain of its affiliates’ estimated profitability from services performed for the Fund and the MFS Funds as a whole, and compared to MFS’ institutional business, (vi) MFS’ views regarding the outlook for the mutual fund industry and the strategic business plans of MFS, (vii) descriptions of various functions performed by MFS for the Funds, such as compliance monitoring and portfolio trading practices, and (viii) information regarding the overall organization of MFS, including information about MFS’ senior management and other personnel providing investment advisory, administrative and other services to the Fund and the other MFS Funds. The comparative performance, fee and expense information prepared and provided by Broadridge was not independently verified and the independent Trustees did not independently verify any information provided to them by MFS.
The Trustees’ conclusion as to the continuation of the investment advisory agreement was based on a comprehensive consideration of all information provided to the Trustees and not the result of any single factor. Some of the factors that figured particularly in the Trustees’ deliberations are described below, although individual Trustees may have evaluated the information presented differently from one another, giving different weights to various factors. It is also important to recognize that the fee arrangements for the Fund and other MFS Funds are the result of years of review and discussion between the independent Trustees and MFS, that certain aspects of such arrangements may receive greater scrutiny in some years than in others, and that the Trustees’ conclusions may be based, in part, on their consideration of these same arrangements during the course of the year and in prior years.
Based on information provided by Broadridge and MFS, the Trustees reviewed the Fund’s total return investment performance as well as the Broadridge performance universe over various time periods. The Trustees placed particular emphasis on the total return performance of the Fund’s Initial Class shares in comparison to the performance of funds in its Broadridge performance universe over the five-year period ended December 31, 2018, which the Trustees believed was a long enough period to reflect differing market conditions. The total return performance of the Fund’s Initial Class shares was in the 1st quintile relative to the other funds in the universe for this five-year period (the 1st quintile being the best performers and the 5th quintile being the worst performers). The total return performance of the Fund’s Initial Class shares was in the 1st quintile for each of theone- and three-year periods ended December 31, 2018 relative to the Broadridge performance universe. Because of the passage of time, these performance results may differ from the performance results for more recent periods, including those shown elsewhere in this report.
In the course of their deliberations, the Trustees took into account information provided by MFS in connection with the contract review meetings, as well as during investment review meetings conducted with portfolio management personnel during the course of the year regarding the Fund’s performance. After reviewing these and related factors, the Trustees concluded, within the context of their overall conclusions regarding the investment advisory agreement, that they were satisfied with MFS’ responses and efforts relating to investment performance.
23
MFS International Growth Portfolio
Board Review of Investment Advisory Agreement – continued
In assessing the reasonableness of the Fund’s advisory fee, the Trustees considered, among other information, the Fund’s advisory fee and the total expense ratio of the Fund’s Initial Class shares as a percentage of average daily net assets and the advisory fee and total expense ratios of the Broadridge expense group based on information provided by Broadridge. The Trustees considered that MFS currently observes an expense limitation for the Fund, which may not be changed without the Trustee’s approval. The Trustees also considered that, according to the data provided by Broadridge (which takes into account any fee reductions or expense limitations that were in effect during the Fund’s last fiscal year), the Fund’s effective advisory fee rate was approximately at the Broadridge expense group median and the Fund’s total expense ratio was higher than the Broadridge expense group median.
The Trustees also considered the advisory fees charged by MFS to any institutional separate accounts advised by MFS (“separate accounts”) and unaffiliated investment companies for which MFS serves as subadviser (“subadvised funds”) that have comparable investment strategies to the Fund, if any. In comparing these fees, the Trustees considered information provided by MFS as to the generally broader scope of services provided by MFS to the Fund, as well as the more extensive regulatory burdens imposed on MFS in managing the Fund, in comparison to separate accounts and subadvised funds. The Trustees also considered the higher demands placed on MFS’ investment personnel and trading infrastructure as a result of the daily cashin-flows andout-flows of the Fund in comparison to separate accounts.
The Trustees also considered whether the Fund may benefit from any economies of scale in the management of the Fund in the event of growth in assets of the Fund and/or growth in assets of the MFS Funds as a whole. They noted that the Fund’s advisory fee rate schedule is subject to contractual breakpoints that reduce the Fund’s advisory fee rate on average daily net assets over $1 billion and $2 billion. The Trustees also noted that MFS has agreed in writing to waive a portion of the management fees of certain MFS Funds, including the Fund, if the total combined assets of certain funds within the MFS Funds’ complex increase above agreed upon thresholds (the “group fee waiver”), enabling the Fund’s shareholders to share in the benefits from any economies of scale at the complex level. The group fee waiver is reviewed and renewed annually between the Board and MFS. The Trustees concluded that the breakpoints and the group fee waiver were sufficient to allow the Fund to benefit from economies of scale as its assets and overall complex assets grow.
The Trustees also considered information prepared by MFS relating to MFS’ costs and profits with respect to the Fund, the MFS Funds considered as a group, and other investment companies and accounts advised by MFS, as well as MFS’ methodologies used to determine and allocate its costs to the MFS Funds, the Fund and other accounts and products for purposes of estimating profitability.
After reviewing these and other factors described herein, the Trustees concluded, within the context of their overall conclusions regarding the investment advisory agreement, that the advisory fees charged to the Fund represent reasonable compensation in light of the services being provided by MFS to the Fund.
In addition, the Trustees considered MFS’ resources and related efforts to continue to retain, attract and motivate capable personnel to serve the Fund. The Trustees also considered current and developing conditions in the financial services industry, including the presence of large and well-capitalized companies which are spending, and appear to be prepared to continue to spend, substantial sums to engage personnel and to provide services to competing investment companies. In this regard, the Trustees also considered the financial resources of MFS and its ultimate parent, Sun Life Financial Inc. The Trustees also considered the advantages and possible disadvantages to the Fund of having an adviser that also serves other investment companies as well as other accounts.
The Trustees also considered the nature, quality, cost, and extent of administrative, transfer agency, and distribution services provided to the Fund by MFS and its affiliates under agreements and plans other than the investment advisory agreement, including any12b-1 fees the Fund pays to MFS Fund Distributors, Inc., an affiliate of MFS. The Trustees also considered the nature, extent and quality of certain other services MFS performs or arranges for on the Fund’s behalf, which may include securities lending programs, directed expense payment programs, class action recovery programs, and MFS’ interaction with third-party service providers, principally custodians andsub-custodians. The Trustees concluded that the variousnon-advisory services provided by MFS and its affiliates on behalf of the Fund were satisfactory.
The Trustees consideredso-called“fall-out benefits” to MFS such as reputational value derived from serving as investment manager to the MFS Funds. The Trustees also considered that, effective January 3, 2018, MFS had discontinued its historic practice of obtaining investment research from portfolio brokerage commissions paid by certain MFS Funds and would thereafter directly pay for or voluntarily reimburse a Fund, if applicable, for the costs of external research acquired through the use of the Fund’s portfolio brokerage commissions.
Based on their evaluation of factors that they deemed to be material, including those factors described above, the Board of Trustees, including the independent Trustees, concluded that the Fund’s investment advisory agreement with MFS should be continued for an additionalone-year period, commencing August 1, 2019.
24
MFS International Growth Portfolio
PROXY VOTING POLICIES AND INFORMATION
MFS votes proxies on behalf of the fund pursuant to proxy voting policies and procedures that are available without charge, upon request, by calling 1-800-225-2606, by visitingmfs.com/proxyvoting, or by visiting the SEC’s Web site athttp://www.sec.gov.
Information regarding how the fund voted proxies relating to portfolio securities during the most recent twelve-month period ended June 30 is available by August 31 of each year without charge by visitingmfs.com/proxyvoting, or by visiting the SEC’s Web site athttp://www.sec.gov.
QUARTERLY PORTFOLIO DISCLOSURE
The fund files a complete schedule of portfolio holdings with the SEC for the first and third quarters of each fiscal year as an exhibit to its reports on Form N-PORT. The fund’s Form N-PORT reports are available on the SEC’s website athttp://www.sec.gov. A shareholder can obtain the portfolio holdings report for the first and third quarters of the fund’s fiscal year atmfs.com/vit2 by choosing the fund’s name and then selecting the “Resources” tab and clicking on “Prospectus and Reports”.
FURTHER INFORMATION
From time to time, MFS may post important information about the fund or the MFS funds on the MFS web site (mfs.com). This information is available athttps://www.mfs.com/en-us/what-we-do/announcements.htmlor atmfs.com/vit2 by choosing the fund’s name.
INFORMATION ABOUT FUND CONTRACTS AND LEGAL CLAIMS
The fund has entered into contractual arrangements with an investment adviser, administrator, distributor, shareholder servicing agent, 529 program manager (if applicable), and custodian who each provide services to the fund. Unless expressly stated otherwise, shareholders are not parties to, or intended beneficiaries of these contractual arrangements, and these contractual arrangements are not intended to create any shareholder right to enforce them against the service providers or to seek any remedy under them against the service providers, either directly or on behalf of the fund.
Under the Trust’s By-Laws and Declaration of Trust, any claims asserted against or on behalf of the MFS Funds, including claims against Trustees and Officers, must be brought in state and federal courts located within the Commonwealth of Massachusetts.
FEDERAL TAX INFORMATION (unaudited)
The following information is provided pursuant to provisions of the Internal Revenue Code.
The fund designates $16,707,000 as capital gain dividends paid during the fiscal year.
Income derived from foreign sources was $3,644,690. The fund intends to pass through foreign tax credits of $319,797 for the fiscal year.
25
rev. 3/16
| | | | |
| | | |
| FACTS | | WHAT DOES MFS DO WITH YOUR
PERSONAL INFORMATION? | |  |
| | |
| Why? | | Financial companies choose how they share your personal information. Federal law gives consumers the right to limit some but not all sharing. Federal law also requires us to tell you how we collect, share, and protect your personal information. Please read this notice carefully to understand what we do. |
| | |
| What? | | The types of personal information we collect and share depend on the product or service you have with us. This information can include: • Social Security number and account balances • Account transactions and transaction history • Checking account information and wire transfer instructions When you areno longer our customer, we continue to share your information as described in this notice. |
| | |
| How? | | All financial companies need to share customers’ personal information to run their everyday business. In the section below, we list the reasons financial companies can share their customers’ personal information; the reasons MFS chooses to share; and whether you can limit this sharing. |
| | | | |
Reasons we can share your
personal information | | Does MFS share? | | Can you limit this
sharing? |
For our everyday business purposes – such as to process your transactions, maintain your account(s), respond to court orders and legal investigations, or report to credit bureaus | | Yes | | No |
For our marketing purposes – to offer our products and services to you | | No | | We don’t share |
| For joint marketing with other financial companies | | No | | We don’t share |
For our affiliates’ everyday business purposes – information about your transactions and experiences | | No | | We don’t share |
For our affiliates’ everyday business purposes – information about your creditworthiness | | No | | We don’t share |
| For nonaffiliates to market to you | | No | | We don’t share |
| | |
| | |
| Questions? | | Call800-225-2606 or go tomfs.com. |
26
| | |
| Who we are |
| Who is providing this notice? | | MFS Funds, MFS Investment Management, MFS Institutional Advisors, Inc., and MFS Heritage Trust Company. |
| | |
| What we do |
| How does MFS protect my personal information? | | To protect your personal information from unauthorized access and use, we use security measures that comply with federal law. These measures include procedural, electronic, and physical safeguards for the protection of the personal information we collect about you. |
How does MFS
collect my personal information? | | We collect your personal information, for example, when you • open an account or provide account information • direct us to buy securities or direct us to sell your securities • make a wire transfer We also collect your personal information from others, such as credit bureaus, affiliates, or other companies. |
| Why can’t I limit all sharing? | | Federal law gives you the right to limit only • sharing for affiliates’ everyday business purposes – information about your creditworthiness • affiliates from using your information to market to you • sharing for nonaffiliates to market to you State laws and individual companies may give you additional rights to limit sharing. |
| | |
| Definitions |
| Affiliates | | Companies related by common ownership or control. They can be financial and nonfinancial companies. • MFS does not share personal information with affiliates, except for everyday business purposes as described on page one of this notice. |
| Nonaffiliates | | Companies not related by common ownership or control. They can be financial and nonfinancial companies. • MFS does not share with nonaffiliates so they can market to you. |
| Joint marketing | | A formal agreement between nonaffiliated financial companies that together market financial products or services to you. • MFS doesn’t jointly market. |
| | |
| Other important information |
| If you own an MFS product or receive an MFS service in the name of a third party such as a bank or broker-dealer, their privacy policy may apply to you instead of ours. |
27
Annual Report
December 31, 2019

MFS® International Intrinsic Value Portfolio
(formerly MFS® International Value Portfolio)

MFS® Variable Insurance Trust II
Beginning on January 1, 2021, as permitted by regulations adopted by the U.S. Securities and Exchange Commission, the insurance company that offers your contract may determine that it will no longer send you paper copies of the fund’s annual and semiannual shareholder reports unless you specifically request paper copies from the insurance company or from your financial intermediary. Instead, the shareholder reports will be made available on a Web site (insurancefunds.mfs.com or other Web site of which you will be notified), and the insurance company will notify you by mail each time a report is posted and provide you with a Web site link to access the report. Instructions for requesting paper copies will be provided by your insurance company or financial intermediary.
If you already elected to receive shareholder reports by email, you will not be affected by this change and you need not take any action. If your insurance company or financial intermediary offers electronic delivery, you may elect to receive shareholder reports and other communications from the insurance company or financial intermediary by email by following the instructions provided by the insurance company or financial intermediary.
Beginning on January 1, 2019, you may elect to receive all future reports in paper free of charge from the insurance company or financial intermediary. You can inform the insurance company or financial intermediary that you wish to continue receiving paper copies of your shareholder reports by contacting your insurance company or financial intermediary. Your election to receive reports in paper will apply to all funds held in your account with your insurance company or financial intermediary.
FCG-ANN
MFS® International Intrinsic Value Portfolio
(formerly MFS® International Value Portfolio)
CONTENTS
The report is prepared for the general information of contract owners. It is authorized for distribution to prospective investors only when preceded or accompanied by a current prospectus.
NOT FDIC INSURED• MAY LOSE VALUE• NO BANK OR CREDIT UNION GUARANTEE• NOT A DEPOSIT• NOT INSURED BY ANY FEDERAL GOVERNMENT AGENCY OR NCUA/NCUSIF
MFS International Intrinsic Value Portfolio
LETTER FROM THE EXECUTIVE CHAIR

Dear Contract Owners:
Slowing global growth, low inflation, and trade friction between the United States and China have been hallmarks of the past 12 months. After experiencing an uptick in market volatility in late 2018, markets steadied for most of 2019, thanks in large measure to the adoption of a dovish policy stance on the part of global central banks, focused on supporting economic growth. Negotiations aimed at a “phase one” trade deal between the U.S. and China bore fruit at the end of the period, boosting investor sentiment, while signs of stability emerging from the global manufacturing sector also lifted spirits. Uncertainty over Brexit, along with the ripple effects from the trade conflict, hampered business confidence and investment in the United Kingdom and Europe for much of the period, though investors expect greater clarity regarding Brexit as a result of December’s general election. The pro-Brexit Conservative Party won the election by a comfortable margin and set the stage for the U.K.’s departure from the EU at the end of January.
Markets expect the longest economic expansion in U.S. history will continue, albeit at a slower pace, as trade tensions recede. In an effort to prolong the expansion, the U.S. Federal Reserve lowered interest rates three times between July and October and the European Central Bank loosened policy in September. While the global monetary policy backdrop remains quite accommodative, signs of easing trade tensions and fading global recession fears led to improved market sentiment in late 2019 as investors grew less risk averse. In early 2020, an outbreak of coronavirus emanating from China reintroduced global growth fears, causing an uptick in volatility.
Here at MFS®, we aim to help our clients navigate the growing complexity of the markets and world economies. Our long-term investment philosophy and commitment to the responsible allocation of capital allow us to tune out the noise and uncover what we believe are the best, most durable investment opportunities in the market. Through our powerful global investment platform, we combine collective expertise, thoughtful risk management and long-term discipline to create sustainable value for investors.
Respectfully,

Robert J. Manning
Executive Chair
MFS Investment Management
February 14, 2020
The opinions expressed in this letter are subject to change and may not be relied upon for investment advice. No forecasts can be guaranteed.
1
MFS International Intrinsic Value Portfolio
PORTFOLIO COMPOSITION
Portfolio structure
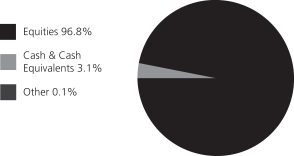
| | | | |
| Top ten holdings | | | | |
| Nestle S.A. | | | 5.3% | |
| Givaudan S.A. | | | 3.7% | |
| Cadence Design Systems, Inc. | | | 3.2% | |
| Pernod Ricard S.A. | | | 2.6% | |
| Taiwan Semiconductor Manufacturing Co. Ltd., ADR | | | 2.6% | |
| Diageo PLC | | | 2.5% | |
| Henkel AG & Co. KGaA | | | 2.4% | |
| Schneider Electric SE | | | 2.3% | |
| Amadeus IT Group S.A. | | | 2.3% | |
| Reckitt Benckiser Group PLC | | | 2.2% | |
| |
| GICS equity sectors (g) | | | | |
| Consumer Staples | | | 31.4% | |
| Information Technology | | | 24.6% | |
| Industrials | | | 17.7% | |
| Materials | | | 8.3% | |
| Financials | | | 3.9% | |
| Real Estate | | | 3.8% | |
| Consumer Discretionary | | | 3.5% | |
| Health Care | | | 3.3% | |
| Energy | | | 0.3% | |
| | | | |
| Issuer country weightings (x) | | | | |
| Japan | | | 19.6% | |
| United States | | | 15.3% | |
| Switzerland | | | 13.8% | |
| United Kingdom | | | 13.6% | |
| France | | | 13.3% | |
| Germany | | | 10.2% | |
| Taiwan | | | 2.6% | |
| Spain | | | 2.3% | |
| Canada | | | 2.2% | |
| Other Countries | | | 7.1% | |
| |
| Currency exposure weightings (y) | | | | |
| Euro | | | 29.5% | |
| United States Dollar | | | 19.2% | |
| Japanese Yen | | | 16.1% | |
| Swiss Franc | | | 13.8% | |
| British Pound Sterling | | | 13.6% | |
| Taiwan Dollar | | | 2.6% | |
| Canadian Dollar | | | 2.2% | |
| Danish Krone | | | 1.2% | |
| South Korean Won | | | 1.0% | |
| Other Currencies | | | 0.8% | |
| (g) | The Global Industry Classification Standard (GICS®) was developed by and/or is the exclusive property of MSCI, Inc. and S&P Global Market Intelligence Inc. (“S&P Global Market Intelligence”). GICS is a service mark of MSCI and S&P Global Market Intelligence and has been licensed for use by MFS. |
| (x) | Represents the portfolio’s exposure to issuer countries as a percentage of a portfolio’s net assets. For purposes of this presentation, United States includes Cash & Cash Equivalents and Other. |
| (y) | Represents the portfolio’s exposure to a particular currency as a percentage of a portfolio’s net assets. For purposes of this presentation, United States Dollar includes Cash & Cash Equivalents. |
Cash & Cash Equivalents includes any cash, investments in money market funds, short-term securities, and other assets less liabilities. Please see the Statement of Assets and Liabilities for additional information related to the fund’s cash position and other assets and liabilities.
Other includes equivalent exposure from currency derivatives and/or any offsets to derivative positions.
Percentages are based on net assets as of December 31, 2019.
The portfolio is actively managed and current holdings may be different.
2
MFS International Intrinsic Value Portfolio
MANAGEMENT REVIEW
Summary of Results
For the twelve months ended December 31, 2019, Initial Class shares of the MFS International Intrinsic Value Portfolio (fund) provided a total return of 25.94%, while Service Class shares of the fund provided a total return of 25.65%. These compare with a return of 16.09% over the same period for the fund’s benchmark, the MSCI EAFE Value Index (net div).
Market Environment
Fading fears of a near-term global recession, the announcement of a partial trade deal between the United States and China and the decline in uncertainty over Brexit helped bolster market sentiment late in the period. Changes in market sentiment, largely driven by uncertainty over the outcome of trade negotiations between the US and China, had contributed to periodic bouts of volatility during the reporting period. The global economy decelerated, led by weakness in China and Europe, although the pace of the slowdown moderated late in the period amid nascent signs of stabilization in the manufacturing sector.
The deteriorating global growth backdrop, along with declining inflationary pressures, prompted the US Federal Reserve to adopt a more dovish posture beginning in early 2019, resulting in the first interest rate cut in over a decade at the end of July, followed by additional cuts in September and October. The Fed’s actions led to a sharp decline in long-term interest rates during the period’s second half, causing the inversion of portions of the US Treasury yield curve for a time. Amid an improvement in risk sentiment in Q4 2019 and indications of a bottoming in growth and a potential upturn in activity, the Fed indicated in October that further rate cuts were unlikely unless the outlook for the economy materially worsened.
Globally, central banks have tilted more dovish as well, with the European Central Bank unveiling a package of easing measures, which included putting overnight rates deeper into negative territory, restarting its bond-buying program and lengthening the term of cheap loans to banks to three years from two. The central banks of India and Australia are among those that have cut rates several times in recent months, although China has been more cautious in increasing liquidity as it keeps trying to deleverage its economy, cutting rates only marginally.
Emerging markets experienced considerable volatility through the end of 2018, as tighter global financial conditions exposed structural weakness in some countries. Those conditions improved in 2019 as the Fed became more dovish. Notwithstanding the periodic headwinds on market sentiment from significant trade friction between the US and China over much of the year, emerging market hard currency debt and local rates benefited from relatively cheap valuations at the beginning of the period and easier global monetary conditions. These factors, plus the fading of certain global risk factors mentioned above, hastened spread tightening in the latter part of the period. At the same time, idiosyncratic risks spiked in some countries (e.g., Argentina and Lebanon), contributing to increased dispersion in performance among sovereign assets.
Contributors to Performance
Stock selection in theinformation technologysector contributed to performance relative to the MSCI EAFE Value Index. Within this sector, the fund’s holdings of integrated circuits and electronic devices developer Cadence Design Systems (b), semiconductor manufacturer Taiwan Semiconductor Manufacturing (b) (Taiwan), simulation software developer ANSYS (b), system services provider OBIC Co. (b) (Japan) and business system services company Nomura Research Institute (b) (Japan) aided relative results. The stock price of Cadence Design Systems advanced during the period, driven by strong revenue and operating margin results. In addition, the firm reported broad-based growth, notably from both its aerospace and defense segments, and raised its guidance for full-year 2019, which further supported the stock price.
Stock selection and, to a lesser extent, an overweight position in theindustrialssector also benefited relative performance. Within this sector, the fund’s overweight position in electrical distribution equipment manufacturer Schneider Electric (France), and holding shares of wiring devices and cable systems manufacturer Legrand (b) (France), helped relative results.
Stock selection in thematerialssector bolstered relative performance, led by the fund’s holdings of fragrance and flavor products manufacturer Givaudan (b) (Switzerland). The share price of Givaudan appreciated as the company reported solid financial results and continued to gain market share, driven by strong performance in its fragrance segment.
Elsewhere, the fund’s holdings of food company Nestle (b) (Switzerland), and not holding shares of global energy and petrochemicals company Royal Dutch Shell (United Kingdom), strengthened relative returns.
Detractors from Performance
Stock selection in thereal estatesector detracted from relative performance, led by the fund’s overweight position in real estate company Deutsche Wohnen (Germany). The share price of Deutsche Wohnen traded lower following news that the German government was looking to implement regulation that would not allow landlords to increase rents for the next five years.
An underweight position and stock selection in thehealth care sector also held back relative performance. Within this sector, holding shares of medical electronic equipment manufacturer Nihon Kohden (b) (Japan), and not holding shares of global pharma and
3
MFS International Intrinsic Value Portfolio
Management Review – continued
consumer healthcare products company GlaxoSmithKline (United Kingdom), weighed on relative results. The stock price of Nihon Kohden declined during the period due to the firm’s disappointing financial results, as weak domestic sales overshadowed strong international sales growth. A temporary halt to sales of physiological information monitors, to correct a minor connector defect, negatively affected the company’s domestic business results.
Stock selection in thefinancials sector hindered relative results. Not holding shares of strong-performing insurance products and services provider Zurich Insurance Group (Switzerland) held back relative performance.
Stocks in other sectors that were among the fund’s top relative detractors included the timing of the fund’s ownership in shares of consumer and chemical products company Henkel AG & Co. (Germany) and tobacco distributor British American Tobacco (h) (United Kingdom). Not owning shares of mining operator Rio Tinto (Australia) and electricity and gas distributor Enel (Italy), and the fund’s holdings of oil and gas reservoir management services company Core Laboratories (b) (Netherlands), further detracted from relative results.
The fund’s cash and/or cash equivalents position during the period was also a detractor from relative performance. Under normal market conditions, the fund strives to be fully invested and generally holds cash to buy new holdings and to provide liquidity. In a period when equity markets rose, as measured by the fund’s benchmark, holding cash hurt performance versus the benchmark, which has no cash position.
Respectfully,
Portfolio Manager(s)
Pablo De La Mata and Benjamin Stone
Note to Shareholders: Effective February 1, 2020, Philip Evans was added as a Portfolio Manager of the Fund. Effective April 15, 2022, Pablo De La Mata will be removed as a Portfolio Manager of the Fund.
| (b) | Security is not a benchmark constituent. |
| (h) | Security was not held in the portfolio at period end. |
The views expressed in this report are those of the portfolio manager(s) only through the end of the period of the report as stated on the cover and do not necessarily reflect the views of MFS or any other person in the MFS organization. These views are subject to change at any time based on market or other conditions, and MFS disclaims any responsibility to update such views. These views may not be relied upon as investment advice or an indication of trading intent on behalf of any MFS portfolio. References to specific securities are not recommendations of such securities, and may not be representative of any MFS portfolio’s current or future investments.
4
MFS International Intrinsic Value Portfolio
PERFORMANCE SUMMARY THROUGH 12/31/19
The following chart illustrates the historical performance of the fund in comparison to its benchmark(s). Benchmarks are unmanaged and may not be invested in directly. Benchmark returns do not reflect any fees or expenses. The performance of other share classes will be greater than or less than that of the class depicted below. (See Notes to Performance Summary.)
Performance data shown represents past performance and is no guarantee of future results. Investment return and principal value fluctuate so your units, when sold, may be worth more or less than the original cost; current performance may be lower or higher than quoted. The performance shown does not reflect the deduction of taxes, if any, that a contract holder would pay on fund distributions or the redemption of contract units. The returns for the fund shown also do not reflect the deduction of expenses associated with variable products, such as mortality and expense risk charges, separate account charges, and sales charges imposed by the insurance company separate accounts. Such expenses would reduce the overall returns shown.
Growth of a Hypothetical $10,000 Investment
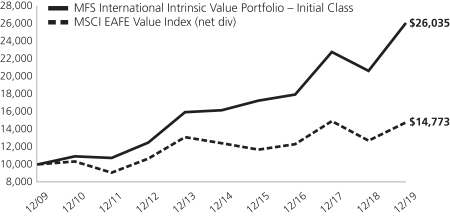
Total Returns through 12/31/19
Average annual total returns
| | | | | | | | | | | | |
| | | Share Class | | Class Inception Date | | 1-yr | | 5-yr | | 10-yr | | |
| | | Initial Class | | 10/02/95 | | 25.94% | | 9.97% | | 10.04% | | |
| | | Service Class | | 8/24/01 | | 25.65% | | 9.69% | | 9.77% | | |
| | | | |
Comparative benchmark(s) | | | | | | | | |
| | | MSCI EAFE Value Index (net div) (f) | | 16.09% | | 3.54% | | 3.98% | | |
| (f) | Source: FactSet Research Systems Inc. |
Benchmark Definition(s)
MSCI EAFE (Europe, Australasia, Far East) Value Index (net div) – a market capitalization-weighted index that is designed to measure equity market performance for value securities in the developed markets, excluding the U.S. and Canada. Morgan Stanley Capital International (“MSCI”) makes no express or implied warranties or representations and shall have no liability whatsoever with respect to any MSCI data contained herein. The MSCI data may not be further redistributed or used as a basis for other indices or any securities or financial products. This report is not approved, reviewed, or produced by MSCI.
It is not possible to invest directly in an index.
Notes to Performance Summary
Average annual total return represents the average annual change in value for each share class for the periods presented.
Performance results reflect any applicable expense subsidies and waivers in effect during the periods shown. Without such subsidies and waivers the fund’s performance results would be less favorable. Please see the prospectus and financial statements for complete details. All results are historical and assume the reinvestment of any dividends and capital gains distributions.
Performance results do not include adjustments made for financial reporting purposes in accordance with U.S. generally accepted accounting principles and may differ from amounts reported in the financial highlights.
From time to time the fund may receive proceeds from litigation settlements, without which performance would be lower.
5
MFS International Intrinsic Value Portfolio
EXPENSE TABLE
Fund Expenses Borne by the Contract Holders during the Period,
July 1, 2019 through December 31, 2019
As a contract holder of the fund, you incur ongoing costs, including management fees; distribution and/or service(12b-1) fees; and other fund expenses. This example is intended to help you understand your ongoing costs (in dollars) of investing in the fund and to compare these costs with the ongoing costs of investing in other mutual funds.
The example is based on an investment of $1,000 invested at the beginning of the period and held for the entire period July 1, 2019 through December 31, 2019.
Actual Expenses
The first line for each share class in the following table provides information about actual account values and actual expenses. You may use the information in this line, together with the amount you invested, to estimate the expenses that you paid over the period. Simply divide your account value by $1,000 (for example, an $8,600 account value divided by $1,000 = 8.6), then multiply the result by the number in the first line under the heading entitled “Expenses Paid During Period” to estimate the expenses you paid on your account during this period.
Hypothetical Example for Comparison Purposes
The second line for each share class in the following table provides information about hypothetical account values and hypothetical expenses based on the fund’s actual expense ratio and an assumed rate of return of 5% per year before expenses, which is not the fund’s actual return. The hypothetical account values and expenses may not be used to estimate the actual ending account balance or expenses you paid for the period. You may use this information to compare the ongoing costs of investing in the fund and other funds. To do so, compare this 5% hypothetical example with the 5% hypothetical examples that appear in the shareholder reports of the other funds.
Please note that the expenses shown in the table are meant to highlight the fund’s ongoing costs only and do not take into account the fees and expenses imposed under the variable contracts through which your investment in the fund is made. Therefore, the second line for each share class in the table is useful in comparing ongoing costs associated with an investment in vehicles (such as the fund) which fund benefits under variable annuity and variable life insurance contracts and to qualified pension and retirement plans only, and will not help you determine the relative total costs of investing in the fund through variable annuity and variable life insurance contracts. If the fees and expenses imposed under the variable contracts were included, your costs would have been higher.
| | | | | | | | | | | | | | | | | | |
| Share Class | | | | Annualized
Expense Ratio | | | Beginning
Account Value
7/01/19 | | | Ending
Account Value
12/31/19 | | | Expenses Paid
During Period (p)
7/01/19-12/31/19 | |
| Initial Class | | Actual | | | 0.90% | | | | $1,000.00 | | | | $1,075.83 | | | | $4.71 | |
| | Hypothetical (h) | | | 0.90% | | | | $1,000.00 | | | | $1,020.67 | | | | $4.58 | |
| Service Class | | Actual | | | 1.15% | | | | $1,000.00 | | | | $1,074.78 | | | | $6.01 | |
| | Hypothetical (h) | | | 1.15% | | | | $1,000.00 | | | | $1,019.41 | | | | $5.85 | |
| (h) | 5% class return per year before expenses. |
| (p) | “Expenses Paid During Period” are equal to each class’s annualized expense ratio, as shown above, multiplied by the average account value over the period, multiplied by 184/365 (to reflect theone-half year period). |
6
MFS International Intrinsic Value Portfolio
PORTFOLIO OF INVESTMENTS – 12/31/19
The Portfolio of Investments is a complete list of all securities owned by your fund. It is categorized by broad-based asset classes.
| | | | | | | | |
| | |
| Issuer | | Shares/Par | | | Value ($) | |
| COMMON STOCKS – 94.4% | | | | | | | | |
| Airlines – 0.7% | | | | | |
| Ryanair Holdings PLC, ADR (a) | | | 107,527 | | | $ | 9,420,440 | |
| | | | | | | | |
| Alcoholic Beverages – 6.7% | | | | | |
| Diageo PLC | | | 803,249 | | | $ | 34,052,791 | |
| Heineken N.V. | | | 205,350 | | | | 21,863,976 | |
| Pernod Ricard S.A. | | | 198,167 | | | | 35,432,056 | |
| | | | | | | | |
| | | | | | $ | 91,348,823 | |
| | | | | | | | |
| Apparel Manufacturers – 1.0% | | | | | |
| Compagnie Financiere Richemont S.A. | | | 108,306 | | | $ | 8,511,836 | |
| LVMH Moet Hennessy Louis Vuitton SE | | | 11,304 | | | | 5,251,930 | |
| | | | | | | | |
| | | | | | $ | 13,763,766 | |
| | | | | | | | |
| Automotive – 0.5% | | | | | |
| Compagnie Generale des Etablissements | | | | | | | | |
| Michelin | | | 37,415 | | | $ | 4,578,753 | |
| USS Co. Ltd. | | | 113,500 | | | | 2,143,328 | |
| | | | | | | | |
| | | | | | $ | 6,722,081 | |
| | | | | | | | |
| Biotechnology – 0.9% | | | | | |
| Novozymes A.S. | | | 246,918 | | | $ | 12,083,020 | |
| | | | | | | | |
| Brokerage & Asset Managers – 0.4% | | | | | |
| Euronext N.V. | | | 65,469 | | | $ | 5,335,167 | |
| | | | | | | | |
| Business Services – 9.2% | | | | | |
| Brenntag AG | | | 109,500 | | | $ | 5,954,611 | |
| Compass Group PLC | | | 847,949 | | | | 21,228,349 | |
| Experian PLC | | | 453,270 | | | | 15,322,243 | |
| Intertek Group PLC | | | 185,050 | | | | 14,344,258 | |
| Nomura Research Institute Ltd. | | | 684,600 | | | | 14,730,982 | |
| Rentokil Initial PLC | | | 612,057 | | | | 3,672,610 | |
| Secom Co. Ltd. | | | 183,900 | | | | 16,411,429 | |
| SGS S.A. | | | 7,487 | | | | 20,508,408 | |
| Sohgo Security Services Co. Ltd. | | | 110,600 | | | | 5,989,786 | |
| Thomson Reuters Corp. | | | 91,021 | | | | 6,511,063 | |
| | | | | | | | |
| | | | | | $ | 124,673,739 | |
| | | | | | | | |
| Chemicals – 3.7% | | | | | |
| Givaudan S.A. | | | 16,068 | | | $ | 50,322,492 | |
| | | | | | | | |
| Computer Software – 8.4% | | | | | |
| ANSYS, Inc. (a) | | | 112,785 | | | $ | 29,031,987 | |
| Cadence Design Systems, Inc. (a) | | | 622,727 | | | | 43,192,345 | |
| Dassault Systemes S.A. | | | 88,201 | | | | 14,498,933 | |
| OBIC Co. Ltd. | | | 113,200 | | | | 15,291,338 | |
| SAP SE | | | 77,276 | | | | 10,429,396 | |
| Wisetech Global Ltd. | | | 111,592 | | | | 1,830,097 | |
| | | | | | | | |
| | | | | | $ | 114,274,096 | |
| | | | | | | | |
| Computer Software – Systems – 2.5% | | | | | |
| Amadeus IT Group S.A. | | | 373,680 | | | $ | 30,514,618 | |
| Descartes Systems Group, Inc. (a) | | | 66,909 | | | | 2,859,689 | |
| | | | | | | | |
| | | | | | $ | 33,374,307 | |
| | | | | | | | |
| | | | | | | | |
| | |
| Issuer | | Shares/Par | | | Value ($) | |
| COMMON STOCKS – continued | | | | | | | | |
| Construction – 0.5% | | | | | |
| Geberit AG | | | 13,345 | | | $ | 7,490,188 | |
| | | | | | | | |
| Consumer Products – 10.6% | | | | | |
| Colgate-Palmolive Co. | | | 394,570 | | | $ | 27,162,199 | |
| Kao Corp. | | | 350,100 | | | | 28,875,539 | |
| Kobayashi Pharmaceutical Co. Ltd. | | | 199,100 | | | | 16,859,883 | |
| KOSE Corp. | | | 23,000 | | | | 3,361,577 | |
| L’Oréal | | | 94,438 | | | | 27,965,811 | |
| Reckitt Benckiser Group PLC | | | 365,062 | | | | 29,637,457 | |
| ROHTO Pharmaceutical Co. Ltd. | | | 336,500 | | | | 10,186,444 | |
| | | | | | | | |
| | | | | | $ | 144,048,910 | |
| | | | | | | | |
| Electrical Equipment – 7.1% | | | | | |
| IMI PLC | | | 831,539 | | | $ | 12,986,171 | |
| Legrand S.A. | | | 301,291 | | | | 24,549,277 | |
| OMRON Corp. | | | 221,700 | | | | 12,915,512 | |
| Schneider Electric SE | | | 309,351 | | | | 31,750,409 | |
| Spectris PLC | | | 232,473 | | | | 8,948,553 | |
| Yokogawa Electric Corp. | | | 254,400 | | | | 4,505,834 | |
| | | | | | | | |
| | | | | | $ | 95,655,756 | |
| | | | | | | | |
| Electronics – 9.9% | | | | | |
| Analog Devices, Inc. | | | 231,957 | | | $ | 27,565,770 | |
| DISCO Corp. | | | 16,700 | | | | 3,980,765 | |
| Halma PLC | | | 433,567 | | | | 12,152,246 | |
| Hirose Electric Co. Ltd. | | | 119,600 | | | | 15,289,898 | |
| Infineon Technologies AG | | | 451,503 | | | | 10,286,018 | |
| Samsung Electronics Co. Ltd. | | | 292,637 | | | | 14,100,519 | |
| Taiwan Semiconductor Manufacturing Co. Ltd., ADR | | | 608,506 | | | | 35,354,199 | |
| Texas Instruments, Inc. | | | 119,600 | | | | 15,343,484 | |
| | | | | | | | |
| | | | | | $ | 134,072,899 | |
| | | | | | | | |
| Engineering – Construction – 0.2% | | | | | |
| Wartsila Oyj Abp | | | 196,970 | | | $ | 2,176,271 | |
| | | | | | | | |
| Food & Beverages – 11.6% | | | | | |
| Chocoladefabriken Lindt & Sprungli AG | | | 192 | | | $ | 1,490,887 | |
| Danone S.A. | | | 317,415 | | | | 26,311,681 | |
| Ezaki Glico Co. Ltd. | | | 137,900 | | | | 6,136,125 | |
| ITO EN Ltd. | | | 330,500 | | | | 16,668,722 | |
| Kerry Group PLC | | | 131,425 | | | | 16,378,297 | |
| Nestle S.A. | | | 660,776 | | | | 71,539,687 | |
| Nissan Foods Holdings Co. Ltd. | | | 51,300 | | | | 3,807,921 | |
| Toyo Suisan Kaisha Ltd. | | | 365,300 | | | | 15,537,047 | |
| | | | | | | | |
| | | | | | $ | 157,870,367 | |
| | | | | | | | |
| Insurance – 1.0% | | | | | |
| Fairfax Financial Holdings Ltd. | | | 12,524 | | | $ | 5,880,700 | |
| Hiscox Ltd. | | | 405,264 | | | | 7,644,212 | |
| | | | | | | | |
| | | | | | $ | 13,524,912 | |
| | | | | | | | |
| Internet – 0.4% | | | | | |
| Wix.com Ltd. (a) | | | 42,549 | | | $ | 5,207,147 | |
| | | | | | | | |
7
MFS International Intrinsic Value Portfolio
Portfolio of Investments – continued
| | | | | | | | |
| | |
| Issuer | | Shares/Par | | | Value ($) | |
| COMMON STOCKS – continued | | | | | | | | |
| Machinery & Tools – 4.7% | | | | | |
| Epiroc AB, “A” | | | 175,904 | | | $ | 2,147,541 | |
| GEA Group AG | | | 290,218 | | | | 9,596,846 | |
| Misumi Group, Inc. | | | 102,300 | | | | 2,529,744 | |
| Nordson Corp. | | | 76,120 | | | | 12,395,381 | |
| Schindler Holding AG | | | 23,377 | | | | 5,946,908 | |
| SMC Corp. | | | 23,800 | | | | 10,879,179 | |
| Spirax Sarco Engineering PLC | | | 169,335 | | | | 19,940,368 | |
| | | | | | | | |
| | | | | | $ | 63,435,967 | |
| | | | | | | | |
| Major Banks – 1.2% | | | | | |
| Svenska Handelsbanken AB, “A” | | | 648,107 | | | $ | 6,981,801 | |
| UBS Group AG | | | 743,721 | | | | 9,394,492 | |
| | | | | | | | |
| | | | | | $ | 16,376,293 | |
| | | | | | | | |
| Medical Equipment – 2.8% | | | | | |
| Dentsply Sirona, Inc. | | | 99,215 | | | $ | 5,614,577 | |
| EssilorLuxottica | | | 32,990 | | | | 5,025,263 | |
| Nihon Kohden Corp. | | | 363,100 | | | | 10,099,601 | |
| Shimadzu Corp. | | | 190,900 | | | | 5,970,473 | |
| Terumo Corp. | | | 332,200 | | | | 11,736,480 | |
| | | | | | | | |
| | | | | | $ | 38,446,394 | |
| | | | | | | | |
| Oil Services – 0.3% | | | | | |
| Core Laboratories N.V. | | | 111,574 | | | $ | 4,202,993 | |
| | | | | | | | |
| Other Banks & Diversified Financials – 1.3% | | | | | |
| Chiba Bank Ltd. | | | 522,400 | | | $ | 3,003,701 | |
| Hachijuni Bank Ltd. | | | 512,500 | | | | 2,231,758 | |
| Julius Baer Group Ltd. | | | 74,951 | | | | 3,866,815 | |
| Jyske Bank A.S. (a) | | | 65,052 | | | | 2,373,836 | |
| Mebuki Financial Group, Inc. | | | 862,900 | | | | 2,201,628 | |
| North Pacific Bank Ltd. | | | 768,200 | | | | 1,711,851 | |
| Sydbank A.S. | | | 86,260 | | | | 1,810,180 | |
| | | | | | | | |
| | | | | | $ | 17,199,769 | |
| | | | | | | | |
| Pharmaceuticals – 1.3% | | | | | |
| Santen Pharmaceutical Co. Ltd. | | | 896,600 | | | $ | 17,095,408 | |
| | | | | | | | |
| | | | | | | | |
| | |
| Issuer | | Shares/Par | | | Value ($) | |
| COMMON STOCKS – continued | | | | | |
| Precious Metals & Minerals – 1.0% | | | | | |
| Agnico-Eagle Mines Ltd. | | | 87,260 | | | $ | 5,374,498 | |
| Franco-Nevada Corp. | | | 82,601 | | | | 8,529,489 | |
| | | | | | | | |
| | | | | | $ | 13,903,987 | |
| | | | | | | | |
| Real Estate – 3.8% | | | | | |
| Deutsche Wohnen SE | | | 511,146 | | | $ | 20,881,496 | |
| LEG Immobilien AG | | | 65,728 | | | | 7,781,895 | |
| TAG Immobilien AG | | | 240,518 | | | | 5,978,525 | |
| Vonovia SE | | | 324,006 | | | | 17,445,001 | |
| | | | | | | | |
| | | | | | $ | 52,086,917 | |
| | | | | | | | |
| Specialty Chemicals – 2.7% | | | | | |
| Croda International PLC | | | 61,607 | | | $ | 4,178,157 | |
| Kansai Paint Co. Ltd. | | | 245,700 | | | | 6,005,040 | |
| Sika AG | | | 40,976 | | | | 7,699,406 | |
| Symrise AG | | | 176,169 | | | | 18,535,702 | |
| | | | | | | | |
| | | | | | $ | 36,418,305 | |
| | | | | | | | |
| Specialty Stores – 0.0% | | | | | |
| Esprit Holdings Ltd. (a) | | | 1,561,273 | | | $ | 314,567 | |
| | | | | | | | |
Total Common Stocks
(Identified Cost, $906,250,491) | | | | | | $ | 1,280,844,981 | |
| | | | | | | | |
| |
| PREFERRED STOCKS – 2.4% | | | | | |
| Consumer Products – 2.4% | | | | | |
Henkel AG & Co. KGaA
(Identified Cost, $37,298,430) | | | 309,662 | | | $ | 32,025,472 | |
| | | | | | | | |
| |
| INVESTMENT COMPANIES (h) – 3.0% | | | | | |
| Money Market Funds – 3.0% | | | | | |
| MFS Institutional Money Market Portfolio, 1.7% (v) (Identified Cost, $40,473,045) | | | 40,476,769 | | | $ | 40,476,769 | |
| | | | | | | | |
OTHER ASSETS, LESS
LIABILITIES – 0.2% | | | | | | | 2,822,195 | |
| | | | | | | | |
| NET ASSETS – 100.0% | | | | | | $ | 1,356,169,417 | |
| | | | | | | | |
| (a) | | Non-income producing security. |
| (h) | | An affiliated issuer, which may be considered one in which the fund owns 5% or more of the outstanding voting securities, or a company which is under common control. At period end, the aggregate values of the fund’s investments in affiliated issuers and in unaffiliated issuers were $40,476,769 and $1,312,870,453, respectively. |
| (v) | | Affiliated issuer that is available only to investment companies managed by MFS. The rate quoted for the MFS Institutional Money Market Portfolio is the annualizedseven-day yield of the fund at period end. |
The following abbreviations are used in this report and are defined:
| ADR | | American Depositary Receipt |
Abbreviations indicate amounts shown in currencies other than the U.S. dollar. All amounts are stated in U.S. dollars unless otherwise indicated. A list of abbreviations is shown below:
Derivative Contracts at 12/31/19
Forward Foreign Currency Exchange Contracts
| | | | | | | | | | | | | | | | | | | | |
| Currency Purchased | | Currency Sold | | Counterparty | | Settlement Date | | | Unrealized
Appreciation
(Depreciation) | |
| Asset Derivatives | | | | | | | | | | | | |
| USD | | | 49,487,004 | | | | | JPY | | 5,203,656,000 | | JPMorgan Chase Bank N.A. | | | 2/21/2020 | | | | $1,477,283 | |
| | | | | | | | | | | | | | | | | | | | |
See Notes to Financial Statements
8
MFS International Intrinsic Value Portfolio
FINANCIAL STATEMENTS | STATEMENT OF ASSETS AND LIABILITIES
This statement represents your fund’s balance sheet, which details the assets and liabilities comprising the total value of the fund.
| | | | |
At 12/31/19 | | | | |
| |
Assets | | | | |
Investments in unaffiliated issuers, at value (identified cost, $943,548,921) | | | $1,312,870,453 | |
Investments in affiliated issuers, at value (identified cost, $40,473,045) | | | 40,476,769 | |
Receivables for | | | | |
Forward foreign currency exchange contracts | | | 1,477,283 | |
Investments sold | | | 976 | |
Fund shares sold | | | 942,963 | |
Dividends | | | 4,506,144 | |
Other assets | | | 6,243 | |
Total assets | | | $1,360,280,831 | |
| |
Liabilities | | | | |
Payables for | | | | |
Investments purchased | | | $190,382 | |
Fund shares reacquired | | | 3,636,469 | |
Payable to affiliates | | | | |
Investment adviser | | | 64,307 | |
Administrative services fee | | | 987 | |
Shareholder servicing costs | | | 72 | |
Distribution and/or service fees | | | 14,433 | |
Payable for independent Trustees’ compensation | | | 48 | |
Accrued expenses and other liabilities | | | 204,716 | |
Total liabilities | | | $4,111,414 | |
Net assets | | | $1,356,169,417 | |
| |
Net assets consist of | | | | |
Paid-in capital | | | $956,658,184 | |
Total distributable earnings (loss) | | | 399,511,233 | |
Net assets | | | $1,356,169,417 | |
Shares of beneficial interest outstanding | | | 45,859,793 | |
| | | | | | | | | | | | |
| | | |
| | | Net assets | | | Shares
outstanding | | | Net asset value
per share | |
Initial Class | | | $308,052,536 | | | | 10,288,697 | | | | $29.94 | |
Service Class | | | 1,048,116,881 | | | | 35,571,096 | | | | 29.47 | |
See Notes to Financial Statements
9
MFS International Intrinsic Value Portfolio
FINANCIAL STATEMENTS | STATEMENT OF OPERATIONS
This statement describes how much your fund earned in investment income and accrued in expenses. It also describes any gains and/or losses generated by fund operations.
| | | | |
Year ended 12/31/19 | | | | |
| |
Net investment income (loss) | | | | |
Income | | | | |
Dividends | | | $25,383,526 | |
Dividends from affiliated issuers | | | 820,151 | |
Income on securities loaned | | | 20,113 | |
Other | | | 206 | |
Foreign taxes withheld | | | (2,355,454 | ) |
Total investment income | | | $23,868,542 | |
Expenses | | | | |
Management fee | | | $11,189,302 | |
Distribution and/or service fees | | | 2,427,532 | |
Shareholder servicing costs | | | 19,072 | |
Administrative services fee | | | 181,551 | |
Independent Trustees’ compensation | | | 27,233 | |
Custodian fee | | | 181,550 | |
Shareholder communications | | | 55,303 | |
Audit and tax fees | | | 61,288 | |
Legal fees | | | 8,389 | |
Miscellaneous | | | 42,583 | |
Total expenses | | | $14,193,803 | |
Reduction of expenses by investment adviser | | | (284,266 | ) |
Net expenses | | | $13,909,537 | |
Net investment income (loss) | | | $9,959,005 | |
| |
Realized and unrealized gain (loss) | | | | |
Realized gain (loss) (identified cost basis) | | | | |
Unaffiliated issuers | | | $25,621,237 | |
Affiliated issuers | | | 3,678 | |
Forward foreign currency exchange contracts | | | 410,041 | |
Foreign currency | | | 75,795 | |
Net realized gain (loss) | | | $26,110,751 | |
Change in unrealized appreciation or depreciation | | | | |
Unaffiliated issuers | | | $251,148,222 | |
Affiliated issuers | | | 1,216 | |
Forward foreign currency exchange contracts | | | 543,356 | |
Translation of assets and liabilities in foreign currencies | | | 44,851 | |
Net unrealized gain (loss) | | | $251,737,645 | |
Net realized and unrealized gain (loss) | | | $277,848,396 | |
Change in net assets from operations | | | $287,807,401 | |
See Notes to Financial Statements
10
MFS International Intrinsic Value Portfolio
FINANCIAL STATEMENTS | STATEMENTS OF CHANGES IN NET ASSETS
These statements describe the increases and/or decreases in net assets resulting from operations, any distributions, and any shareholder transactions.
| | | | | | | | |
| | | Year ended | |
| | | 12/31/19 | | | 12/31/18 | |
Change in net assets | | | | | | | | |
| | |
From operations | | | | | | | | |
Net investment income (loss) | | | $9,959,005 | | | | $18,761,103 | |
Net realized gain (loss) | | | 26,110,751 | | | | 331,520,353 | |
Net unrealized gain (loss) | | | 251,737,645 | | | | (519,204,339 | ) |
Change in net assets from operations | | | $287,807,401 | | | | $(168,922,883 | ) |
Total distributions to shareholders | | | $(58,909,960 | ) | | | $(42,976,985 | ) |
Change in net assets from fund share transactions | | | $(13,250,059 | ) | | | $(693,239,677 | ) |
Total change in net assets | | | $215,647,382 | | | | $(905,139,545 | ) |
| | |
Net assets | | | | | | | | |
At beginning of period | | | 1,140,522,035 | | | | 2,045,661,580 | |
At end of period | | | $1,356,169,417 | | | | $1,140,522,035 | |
See Notes to Financial Statements
11
MFS International Intrinsic Value Portfolio
FINANCIAL STATEMENTS | FINANCIAL HIGHLIGHTS
The financial highlights table is intended to help you understand the fund’s financial performance for the past 5 years. Certain information reflects financial results for a single fund share. The total returns in the table represent the rate that an investor would have earned (or lost) on an investment in the fund share class (assuming reinvestment of all distributions) held for the entire period.
| | | | | | | | | | | | | | | | | | | | |
| Initial Class | | Year ended | |
| | | | | |
| | | 12/31/19 | | | 12/31/18 | | | 12/31/17 | | | 12/31/16 | | | 12/31/15 | |
| | | | | |
Net asset value, beginning of period | | | $25.02 | | | | $28.25 | | | | $22.57 | | | | $22.46 | | | | $21.73 | |
| | | | | |
| Income (loss) from investment operations | | | | | | | | | | | | | | | | | | | | |
Net investment income (loss) (d) | | | $0.28 | | | | $0.30 | | | | $0.29 | | | | $0.32 | (c) | | | $0.30 | |
Net realized and unrealized gain (loss) | | | 6.06 | | | | (2.91 | ) | | | 5.80 | | | | 0.64 | | | | 1.11 | |
Total from investment operations | | | $6.34 | | | | $(2.61 | ) | | | $6.09 | | | | $0.96 | | | | $1.41 | |
| | | | | |
| Less distributions declared to shareholders | | | | | | | | | | | | | | | | | | | | |
From net investment income | | | $(0.54 | ) | | | $(0.31 | ) | | | $(0.39 | ) | | | $(0.32 | ) | | | $(0.45 | ) |
From net realized gain | | | (0.88 | ) | | | (0.31 | ) | | | (0.02 | ) | | | (0.53 | ) | | | (0.23 | ) |
Total distributions declared to shareholders | | | $(1.42 | ) | | | $(0.62 | ) | | | $(0.41 | ) | | | $(0.85 | ) | | | $(0.68 | ) |
Net asset value, end of period (x) | | | $29.94 | | | | $25.02 | | | | $28.25 | | | | $22.57 | | | | $22.46 | |
Total return (%) (k)(r)(s)(x) | | | 25.94 | | | | (9.49 | ) | | | 27.14 | | | | 4.05 | (c) | | | 6.65 | |
| | | | | |
Ratios (%) (to average net assets)
and Supplemental data: | | | | | | | | | | | | | | | | | | | | |
Expenses before expense reductions (f) | | | 0.92 | | | | 0.91 | | | | 0.91 | | | | 0.91 | (c) | | | 0.93 | |
Expenses after expense reductions (f) | | | 0.90 | | | | 0.90 | | | | 0.90 | | | | 0.89 | (c) | | | 0.91 | |
Net investment income (loss) | | | 0.99 | | | | 1.08 | | | | 1.13 | | | | 1.41 | (c) | | | 1.33 | |
Portfolio turnover | | | 13 | | | | 16 | | | | 10 | | | | 17 | | | | 24 | |
Net assets at end of period (000 omitted) | | | $308,053 | | | | $282,244 | | | | $317,415 | | | | $238,192 | | | | $230,349 | |
| |
| Service Class | | Year ended | |
| | | | | |
| | | 12/31/19 | | | 12/31/18 | | | 12/31/17 | | | 12/31/16 | | | 12/31/15 | |
| | | | | |
Net asset value, beginning of period | | | $24.60 | | | | $27.80 | | | | $22.23 | | | | $22.13 | | | | $21.44 | |
| | | | | |
| Income (loss) from investment operations | | | | | | | | | | | | | | | | | | | | |
Net investment income (loss) (d) | | | $0.20 | | | | $0.27 | | | | $0.23 | | | | $0.26 | (c) | | | $0.25 | |
Net realized and unrealized gain (loss) | | | 5.97 | | | | (2.91 | ) | | | 5.70 | | | | 0.63 | | | | 1.07 | |
Total from investment operations | | | $6.17 | | | | $(2.64 | ) | | | $5.93 | | | | $0.89 | | | | $1.32 | |
| | | | | |
| Less distributions declared to shareholders | | | | | | | | | | | | | | | | | | | | |
From net investment income | | | $(0.42 | ) | | | $(0.25 | ) | | | $(0.34 | ) | | | $(0.26 | ) | | | $(0.40 | ) |
From net realized gain | | | (0.88 | ) | | | (0.31 | ) | | | (0.02 | ) | | | (0.53 | ) | | | (0.23 | ) |
Total distributions declared to shareholders | | | $(1.30 | ) | | | $(0.56 | ) | | | $(0.36 | ) | | | $(0.79 | ) | | | $(0.63 | ) |
Net asset value, end of period (x) | | | $29.47 | | | | $24.60 | | | | $27.80 | | | | $22.23 | | | | $22.13 | |
Total return (%) (k)(r)(s)(x) | | | 25.65 | | | | (9.72 | ) | | | 26.82 | | | | 3.84 | (c) | | | 6.32 | |
| | | | | |
Ratios (%) (to average net assets)
and Supplemental data: | | | | | | | | | | | | | | | | | | | | |
Expenses before expense reductions (f) | | | 1.17 | | | | 1.15 | | | | 1.16 | | | | 1.16 | (c) | | | 1.18 | |
Expenses after expense reductions (f) | | | 1.15 | | | | 1.14 | | | | 1.15 | | | | 1.14 | (c) | | | 1.16 | |
Net investment income (loss) | | | 0.72 | | | | 0.97 | | | | 0.89 | | | | 1.17 | (c) | | | 1.10 | |
Portfolio turnover | | | 13 | | | | 16 | | | | 10 | | | | 17 | | | | 24 | |
Net assets at end of period (000 omitted) | | | $1,048,117 | | | | $858,278 | | | | $1,728,247 | | | | $1,273,735 | | | | $1,124,133 | |
See Notes to Financial Statements
12
MFS International Intrinsic Value Portfolio
Financial Highlights – continued
| (c) | Amount reflects aone-time reimbursement of expenses by the custodian (or former custodian) without which net investment income and performance would be lower and expenses would be higher. |
| (d) | Per share data is based on average shares outstanding. |
| (f) | Ratios do not reflect reductions from fees paid indirectly, if applicable. |
| (k) | The total return does not reflect expenses that apply to separate accounts. Inclusion of these charges would reduce the total return figures for all periods shown. |
| (r) | Certain expenses have been reduced without which performance would have been lower. |
| (s) | From time to time the fund may receive proceeds from litigation settlements, without which performance would be lower. |
| (x) | The net asset values and total returns have been calculated on net assets which include adjustments made in accordance with U.S. generally accepted accounting principles required at period end for financial reporting purposes. |
See Notes to Financial Statements
13
MFS International Intrinsic Value Portfolio
NOTES TO FINANCIAL STATEMENTS
| (1) | | Business and Organization |
MFS International Intrinsic Value Portfolio (formerly MFS International Value Portfolio) (the fund) is a diversified series of MFS Variable Insurance Trust II (the trust). The trust is organized as a Massachusetts business trust and is registered under the Investment Company Act of 1940, as amended, as anopen-end management investment company. The shareholders of each series of the trust are separate accounts of insurance companies, which offer variable annuity and/or life insurance products, and qualified retirement and pension plans.
The fund is an investment company and accordingly follows the investment company accounting and reporting guidance of the Financial Accounting Standards Board (FASB) Accounting Standards Codification Topic 946 Financial Services – Investment Companies.
| (2) | | Significant Accounting Policies |
General– The preparation of financial statements in conformity with U.S. generally accepted accounting principles requires management to make estimates and assumptions that affect the reported amounts of assets and liabilities, and disclosure of contingent assets and liabilities at the date of the financial statements and the reported amounts of increases and decreases in net assets from operations during the reporting period. Actual results could differ from those estimates. In the preparation of these financial statements, management has evaluated subsequent events occurring after the date of the fund’s Statement of Assets and Liabilities through the date that the financial statements were issued. The fund invests in foreign securities. Investments in foreign securities are vulnerable to the effects of changes in the relative values of the local currency and the U.S. dollar and to the effects of changes in each country’s market, economic, industrial, political, regulatory, geopolitical, and other conditions.
Balance Sheet Offsetting– The fund’s accounting policy with respect to balance sheet offsetting is that, absent an event of default by the counterparty or a termination of the agreement, the International Swaps and Derivatives Association (ISDA) Master Agreement, or similar agreement, does not result in an offset of reported amounts of financial assets and financial liabilities in the Statement of Assets and Liabilities across transactions between the fund and the applicable counterparty. The fund’s right to setoff may be restricted or prohibited by the bankruptcy or insolvency laws of the particular jurisdiction to which a specific master netting agreement counterparty is subject. Balance sheet offsetting disclosures, to the extent applicable to the fund, have been included in the fund’s Significant Accounting Policies note under the captions for each of the fund’sin-scope financial instruments and transactions.
Investment Valuations– Equity securities, including restricted equity securities, are generally valued at the last sale or official closing price on their primary market or exchange as provided by a third-party pricing service. Equity securities, for which there were no sales reported that day, are generally valued at the last quoted daily bid quotation on their primary market or exchange as provided by a third-party pricing service. Short-term instruments with a maturity at issuance of 60 days or less may be valued at amortized cost, which approximates market value. Forward foreign currency exchange contracts are generally valued at the mean of bid and asked prices for the time period interpolated from rates provided by a third-party pricing service for proximate time periods.Open-end investment companies are generally valued at net asset value per share. Securities and other assets generally valued on the basis of information from a third-party pricing service may also be valued at a broker/dealer bid quotation. In determining values, third-party pricing services can utilize both transaction data and market information such as yield, quality, coupon rate, maturity, type of issue, trading characteristics, and other market data. The values of foreign securities and other assets and liabilities expressed in foreign currencies are converted to U.S. dollars using the mean of bid and asked prices for rates provided by a third-party pricing service.
The Board of Trustees has delegated primary responsibility for determining or causing to be determined the value of the fund’s investments (including any fair valuation) to the adviser pursuant to valuation policies and procedures approved by the Board. If the adviser determines that reliable market quotations are not readily available, investments are valued at fair value as determined in good faith by the adviser in accordance with such procedures under the oversight of the Board of Trustees. Under the fund’s valuation policies and procedures, market quotations are not considered to be readily available for most types of debt instruments and floating rate loans and many types of derivatives. These investments are generally valued at fair value based on information from third-party pricing services. In addition, investments may be valued at fair value if the adviser determines that an investment’s value has been materially affected by events occurring after the close of the exchange or market on which the investment is principally traded (such as foreign exchange or market) and prior to the determination of the fund’s net asset value, or after the halt of trading of a specific security where trading does not resume prior to the close of the exchange or market on which the security is principally traded. Events that occur after foreign markets close (such as developments in foreign markets and significant movements in the U.S. markets) and prior to the determination of the fund’s net asset value may be deemed to have a material effect on the value of securities traded in foreign markets. Accordingly, the fund’s foreign equity securities may often be valued at fair value. The adviser generally relies on third-party pricing services or other information (such as the correlation with price movements of similar securities
in the same or other markets; the type, cost and investment characteristics of the security; the business and financial condition of the issuer; and trading and other market data) to assist in determining whether to fair value and at what value to fair value an
14
MFS International Intrinsic Value Portfolio
Notes to Financial Statements – continued
investment. The value of an investment for purposes of calculating the fund’s net asset value can differ depending on the source and method used to determine value. When fair valuation is used, the value of an investment used to determine the fund’s net asset value may differ from quoted or published prices for the same investment. There can be no assurance that the fund could obtain the fair value assigned to an investment if it were to sell the investment at the same time at which the fund determines its net asset value per share.
Various inputs are used in determining the value of the fund’s assets or liabilities. These inputs are categorized into three broad levels. In certain cases, the inputs used to measure fair value may fall into different levels of the fair value hierarchy. In such cases, an investment’s level within the fair value hierarchy is based on the lowest level of input that is significant to the fair value measurement. The fund’s assessment of the significance of a particular input to the fair value measurement in its entirety requires judgment, and considers factors specific to the investment. Level 1 includes unadjusted quoted prices in active markets for identical assets or liabilities. Level 2 includes other significant observable market-based inputs (including quoted prices for similar securities, interest rates, prepayment speed, and credit risk). Level 3 includes unobservable inputs, which may include the adviser’s own assumptions in determining the fair value of investments. Other financial instruments are derivative instruments, such as forward foreign currency exchange contracts. The following is a summary of the levels used as of December 31, 2019 in valuing the fund’s assets or liabilities:
| | | | | | | | | | | | | | | | |
| Financial Instruments | | Level 1 | | | Level 2 | | | Level 3 | | | Total | |
| Equity Securities: | | | | | | | | | | | | | | | | |
Japan | | | $35,380,469 | | | | $230,776,524 | | | | $— | | | | $266,156,993 | |
Switzerland | | | 186,771,119 | | | | — | | | | — | | | | 186,771,119 | |
United Kingdom | | | 184,107,415 | | | | — | | | | — | | | | 184,107,415 | |
France | | | 180,699,280 | | | | — | | | | — | | | | 180,699,280 | |
United States | | | 164,508,736 | | | | — | | | | — | | | | 164,508,736 | |
Germany | | | 138,914,962 | | | | — | | | | — | | | | 138,914,962 | |
Taiwan | | | 35,354,199 | | | | — | | | | — | | | | 35,354,199 | |
Spain | | | 30,514,618 | | | | — | | | | — | | | | 30,514,618 | |
Canada | | | 29,155,439 | | | | — | | | | — | | | | 29,155,439 | |
Other Countries | | | 82,587,173 | | | | 14,100,519 | | | | — | | | | 96,687,692 | |
| Mutual Funds | | | 40,476,769 | | | | — | | | | — | | | | 40,476,769 | |
| Total | | | $1,108,470,179 | | | | $244,877,043 | | | | $— | | | | $1,353,347,222 | |
| | | | |
| Other Financial Instruments | | | | | | | | | | | | |
| Forward Foreign Currency Exchange Contracts – Assets | | | $— | | | | $1,477,283 | | | | $— | | | | $1,477,283 | |
For further information regarding security characteristics, see the Portfolio of Investments.
Foreign Currency Translation– Purchases and sales of foreign investments, income, and expenses are converted into U.S. dollars based upon currency exchange rates prevailing on the respective dates of such transactions or on the reporting date for foreign denominated receivables and payables. Gains and losses attributable to foreign currency exchange rates on sales of securities are recorded for financial statement purposes as net realized gains and losses on investments. Gains and losses attributable to foreign exchange rate movements on receivables, payables, income and expenses are recorded for financial statement purposes as foreign currency transaction gains and losses. That portion of both realized and unrealized gains and losses on investments that results from fluctuations in foreign currency exchange rates is not separately disclosed.
Derivatives– The fund uses derivatives primarily to increase or decrease exposure to a particular market or segment of the market, or security, to increase or decrease interest rate or currency exposure, or as alternatives to direct investments. Derivatives are used for hedging ornon-hedging purposes. While hedging can reduce or eliminate losses, it can also reduce or eliminate gains. When the fund uses derivatives as an investment to increase market exposure, or for hedging purposes, gains and losses from derivative instruments may be substantially greater than the derivative’s original cost.
The derivative instruments used by the fund during the period were forward foreign currency exchange contracts. Depending on the type of derivative, the fund may exit a derivative position by entering into an offsetting transaction with a counterparty or exchange, negotiating an agreement with the derivative counterparty, or novating the position to a third party. The fund’s period end derivatives, as presented in the Portfolio of Investments and the associated Derivative Contract tables, generally are indicative of the volume of its derivative activity during the period.
The following table presents, by major type of derivative contract, the fair value, on a gross basis, of the asset and liability components of derivatives held by the fund at December 31, 2019 as reported in the Statement of Assets and Liabilities:
| | | | | | |
| | | | | Fair Value | |
| Risk | | Derivative Contracts | | Asset Derivatives | |
| Foreign Exchange | | Forward Foreign Currency Exchange Contracts | | | $1,477,283 | |
15
MFS International Intrinsic Value Portfolio
Notes to Financial Statements – continued
The following table presents, by major type of derivative contract, the realized gain (loss) on derivatives held by the fund for the year ended December 31, 2019 as reported in the Statement of Operations:
| | | | |
| Risk | | Forward Foreign
Currency
Exchange
Contracts | |
| Foreign Exchange | | | $410,041 | |
The following table presents, by major type of derivative contract, the change in unrealized appreciation or depreciation on derivatives held by the fund for the year ended December 31, 2019 as reported in the Statement of Operations:
| | | | |
| Risk | | Forward Foreign
Currency
Exchange
Contracts | |
| Foreign Exchange | | | $543,356 | |
Derivative counterparty credit risk is managed through formal evaluation of the creditworthiness of all potential counterparties. On certain, but not all, uncleared derivatives, the fund attempts to reduce its exposure to counterparty credit risk whenever possible by entering into an ISDA Master Agreement on a bilateral basis. The ISDA Master Agreement gives each party to the agreement the right to terminate all transactions traded under such agreement if there is a specified deterioration in the credit quality of the other party. Upon an event of default or a termination of the ISDA Master Agreement, thenon-defaulting party has the right to close out all transactions traded under such agreement and to net amounts owed under each agreement to one net amount payable by one party to the other. This right to close out and net payments across all transactions traded under the ISDA Master Agreement could result in a reduction of the fund’s credit risk to such counterparty equal to any amounts payable by the fund under the applicable transactions, if any.
Collateral and margin requirements differ by type of derivative. For cleared derivatives (e.g., futures contracts, cleared swaps, and exchange-traded options), margin requirements are set by the clearing broker and the clearing house and collateral, in the form of cash or securities, is posted by the fund directly with the clearing broker. Collateral terms are counterparty agreement specific for uncleared derivatives (e.g., forward foreign currency exchange contracts, uncleared swap agreements, and uncleared options) and collateral, in the form of cash and securities, is held in segregated accounts with the fund’s custodian in connection with these agreements. For derivatives traded under an ISDA Master Agreement, which contains a collateral support annex, the collateral requirements are netted across all transactions traded under such counterparty-specific agreement and an amount is posted from one party to the other to collateralize such obligations. Cash that has been segregated or delivered to cover the fund’s collateral or margin obligations under derivative contracts, if any, will be reported separately in the Statement of Assets and Liabilities as restricted cash for uncleared derivatives and/or deposits with brokers for cleared derivatives. Securities pledged as collateral or margin for the same purpose, if any, are noted in the Portfolio of Investments. The fund may be required to make payments of interest on uncovered collateral or margin obligations with the broker. Any such payments are included in “Miscellaneous” expense in the Statement of Operations.
Forward Foreign Currency Exchange Contracts – The fund entered into forward foreign currency exchange contracts for the purchase or sale of a specific foreign currency at a fixed price on a future date. These contracts may be used to hedge the fund’s currency risk or fornon-hedging purposes. For hedging purposes, the fund may enter into contracts to deliver or receive foreign currency that the fund will receive from or use in its normal investment activities. The fund may also use contracts to hedge against declines in the value of foreign currency denominated securities due to unfavorable exchange rate movements. Fornon-hedging purposes, the fund may enter into contracts with the intent of changing the relative exposure of the fund’s portfolio of securities to different currencies to take advantage of anticipated exchange rate changes.
Forward foreign currency exchange contracts are adjusted by the daily exchange rate of the underlying currency and any unrealized gains or losses are recorded as a receivable or payable for forward foreign currency exchange contracts until the contract settlement date. On contract settlement date, any gain or loss on the contract is recorded as realized gains or losses on forward foreign currency exchange contracts.
Risks may arise upon entering into these contracts from unanticipated movements in the value of the contract and from the potential inability of counterparties to meet the terms of their contracts. Generally, the fund’s maximum risk due to counterparty credit risk is the unrealized gain on the contract due to the use of Continuous Linked Settlement, a multicurrency cash settlement system for the centralized settlement of foreign transactions. This risk is mitigated in cases where there is an ISDA Master Agreement between the fund and the counterparty providing for netting as described above and, where applicable, by the posting of collateral by the counterparty to the fund to cover the fund’s exposure to the counterparty under such ISDA Master Agreement.
16
MFS International Intrinsic Value Portfolio
Notes to Financial Statements – continued
Security Loans– Under its Securities Lending Agency Agreement with the fund, State Street Bank and Trust Company, as lending agent, loans the securities of the fund to certain qualified institutions (the “Borrowers”) approved by the fund. Security loans can be terminated at the discretion of either the lending agent or the fund and the related securities must be returned within the earlier of the standard trade settlement period for such securities or within three business days. The loans are collateralized by cash and/or U.S. Treasury and federal agency obligations in an amount typically at least equal to the market value of the securities loaned. On loans collateralized by cash, the cash collateral is invested in a money market fund. The market value of the loaned securities is determined at the close of business of the fund and any additional required collateral is delivered to the fund on the next business day. The lending agent provides the fund with indemnification against Borrower default. In the event of Borrower default, the lending agent will, for the benefit of the fund, either purchase securities identical to those loaned or, when such purchase is commercially impracticable, pay the fund the market value of the loaned securities. In return, the lending agent assumes the fund’s rights to the related collateral. If the collateral value is less than the cost to purchase identical securities, the lending agent is responsible for the shortfall, but only to the extent that such shortfall is not due to a decline in collateral value resulting from collateral reinvestment for which the fund bears the risk of loss. A portion of the income generated upon investment of the collateral is remitted to the Borrowers, and the remainder is allocated between the fund and the lending agent. On loans collateralized by U.S. Treasury and/or federal agency obligations, a fee is received from the Borrower, and is allocated between the fund and the lending agent. Income from securities lending is separately reported in the Statement of Operations. The dividend and interest income earned on the securities loaned is accounted for in the same manner as other dividend and interest income. At December 31, 2019, there were no securities on loan or collateral outstanding.
Indemnifications– Under the fund’s organizational documents, its officers and Trustees may be indemnified against certain liabilities and expenses arising out of the performance of their duties to the fund. Additionally, in the normal course of business, the fund enters into agreements with service providers that may contain indemnification clauses. The fund’s maximum exposure under these agreements is unknown as this would involve future claims that may be made against the fund that have not yet occurred.
Investment Transactions and Income– Investment transactions are recorded on the trade date. Interest income is recorded on the accrual basis. Dividends received in cash are recorded on theex-dividend date. Certain dividends from foreign securities will be recorded when the fund is informed of the dividend if such information is obtained subsequent to theex-dividend date. Dividend payments received in additional securities are recorded on theex-dividend date in an amount equal to the value of the security on such date.
The fund may receive proceeds from litigation settlements. Any proceeds received from litigation involving portfolio holdings are reflected in the Statement of Operations in realized gain/loss if the security has been disposed of by the fund or in unrealized gain/loss if the security is still held by the fund. Any other proceeds from litigation not related to portfolio holdings are reflected as other income in the Statement of Operations.
Tax Matters and Distributions– The fund intends to qualify as a regulated investment company, as defined under Subchapter M of the Internal Revenue Code, and to distribute all of its taxable income, including realized capital gains. As a result, no provision for federal income tax is required. The fund’s federal tax returns, when filed, will remain subject to examination by the Internal Revenue Service for a three year period. Management has analyzed the fund’s tax positions taken on federal and state tax returns for all open tax years and does not believe that there are any uncertain tax positions that require recognition of a tax liability. Foreign taxes, if any, have been accrued by the fund in the accompanying financial statements in accordance with the applicable foreign tax law. Foreign income taxes may be withheld by certain countries in which the fund invests. Additionally, capital gains realized by the fund on securities issued in or by certain foreign countries may be subject to capital gains tax imposed by those countries.
Distributions to shareholders are recorded on theex-dividend date. Income and capital gain distributions are determined in accordance with income tax regulations, which may differ from U.S. generally accepted accounting principles. Certain capital accounts in the financial statements are periodically adjusted for permanent differences in order to reflect their tax character. These adjustments have no impact on net assets or net asset value per share. Temporary differences which arise from recognizing certain items of income, expense, gain or loss in different periods for financial statement and tax purposes will reverse at some time in the future.
Book/tax differences primarily relate to wash sale loss deferrals and derivative transactions.
The tax character of distributions declared to shareholders for the last two fiscal years is as follows:
| | | | | | | | |
| | | Year ended
12/31/19 | | | Year ended
12/31/18 | |
| Ordinary income (including any short-term capital gains) | | | $21,217,617 | | | | $19,511,316 | |
| Long-term capital gains | | | 37,692,343 | | | | 23,465,669 | |
| Total distributions | | | $58,909,960 | | | | $42,976,985 | |
17
MFS International Intrinsic Value Portfolio
Notes to Financial Statements – continued
The federal tax cost and the tax basis components of distributable earnings were as follows:
| | | | |
| As of 12/31/19 | | | | |
| |
| Cost of investments | | | $993,381,078 | |
| Gross appreciation | | | 391,993,547 | |
| Gross depreciation | | | (30,550,120 | ) |
| Net unrealized appreciation (depreciation) | | | $361,443,427 | |
| |
| Undistributed ordinary income | | | 12,547,094 | |
| Undistributed long-term capital gain | | | 25,587,453 | |
| Other temporary differences | | | (66,741 | ) |
Multiple Classes of Shares of Beneficial Interest– The fund offers multiple classes of shares, which differ in their respective distribution and/or service fees. The fund’s income, realized and unrealized gain (loss), and common expenses are allocated to shareholders based on the daily net assets of each class. Dividends are declared separately for each class. Differences in per share dividend rates are generally due to differences in separate class expenses. The fund’s distributions declared to shareholders as reported in the Statements of Changes in Net Assets are presented by class as follows:
| | | | | | | | |
| | | Year ended
12/31/19 | | | Year ended
12/31/18 | |
| Initial Class | | | $14,425,226 | | | | $6,728,011 | |
| Service Class | | | 44,484,734 | | | | 36,248,974 | |
| Total | | | $58,909,960 | | | | $42,976,985 | |
| (3) | | Transactions with Affiliates |
Investment Adviser– The fund has an investment advisory agreement with MFS to provide overall investment management and related administrative services and facilities to the fund. The management fee is computed daily and paid monthly at the following annual rates based on the fund’s average daily net assets:
| | | | |
| Up to $1 billion | | | 0.90% | |
| In excess of $1 billion and up to $2 billion | | | 0.80% | |
| In excess of $2 billion | | | 0.70% | |
MFS has agreed in writing to reduce its management fee by a specified amount if certain MFS mutual fund assets exceed thresholds agreed to by MFS and the fund’s Board of Trustees. For the year ended December 31, 2019, this management fee reduction amounted to $124,260, which is included in the reduction of total expenses in the Statement of Operations. The management fee incurred for the year ended December 31, 2019 was equivalent to an annual effective rate of 0.87% of the fund’s average daily net assets.
The investment adviser has agreed in writing to pay a portion of the fund’s total annual operating expenses, excluding interest, taxes, extraordinary expenses, brokerage and transaction costs, and investment-related expenses, such that total annual operating expenses do not exceed 0.90% of average daily net assets for the Initial Class shares and 1.15% of average daily net assets for the Service Class shares. This written agreement will continue until modified by the fund’s Board of Trustees, but such agreement will continue at least until April 30, 2021. For the year ended December 31, 2019, this reduction amounted to $160,006, which is included in the reduction of total expenses in the Statement of Operations.
Distributor– MFS Fund Distributors, Inc. (MFD), a wholly-owned subsidiary of MFS, is the distributor of shares of the fund. The Trustees have adopted a distribution plan for the Service Class shares pursuant to Rule12b-1 under the Investment Company Act of 1940.
The fund’s distribution plan provides that the fund will pay MFD distribution and/or service fees equal to 0.25% per annum of its average daily net assets attributable to Service Class shares as partial consideration for services performed and expenses incurred by MFD and financial intermediaries (including participating insurance companies that invest in the fund to fund variable annuity and variable life insurance contracts, sponsors of qualified retirement and pension plans that invest in the fund, and affiliates of these participating insurance companies and plan sponsors) in connection with the sale and distribution of the Service Class shares. MFD may subsequently pay all, or a portion, of the distribution and/or service fees to financial intermediaries.
Shareholder Servicing Agent– MFS Service Center, Inc. (MFSC), a wholly-owned subsidiary of MFS, receives a fee from the fund for its services as shareholder servicing agent. For the year ended December 31, 2019, the fee was $17,767, which equated to 0.0014% annually of the fund’s average daily net assets. MFSC also receives payment from the fund forout-of-pocket expenses paid by MFSC on behalf of the fund. For the year ended December 31, 2019, these costs amounted to $1,305.
Administrator– MFS provides certain financial, legal, shareholder communications, compliance, and other administrative services to the fund. Under an administrative services agreement, the fund reimburses MFS the costs incurred to provide these services. The
18
MFS International Intrinsic Value Portfolio
Notes to Financial Statements – continued
fund is charged an annual fixed amount of $17,500 plus a fee based on average daily net assets. The administrative services fee incurred for the year ended December 31, 2019 was equivalent to an annual effective rate of 0.0142% of the fund’s average daily net assets.
Trustees’ and Officers’ Compensation– The fund pays compensation to independent Trustees in the form of a retainer, attendance fees, and additional compensation to Board and Committee chairpersons. The fund does not pay compensation directly to Trustees or officers of the fund who are also officers of the investment adviser, all of whom receive remuneration from MFS for their services to the fund. Certain officers and Trustees of the fund are officers or directors of MFS, MFD, and MFSC.
Other– This fund and certain other funds managed by MFS (the funds) had entered into a service agreement (the ISO Agreement) which provided for payment of fees solely by the funds to Tarantino LLC in return for the provision of services of an Independent Senior Officer (ISO) for the funds. Frank L. Tarantino served as the ISO and was an officer of the funds and the sole member of Tarantino LLC. Effective June 30, 2019, Mr. Tarantino retired from his position as ISO for the funds, and the ISO Agreement was terminated. For the year ended December 31, 2019, the fee paid by the fund under this agreement was $1,476 and is included in “Miscellaneous” expense in the Statement of Operations. MFS had agreed to bear all expenses associated with office space, other administrative support, and supplies provided to the ISO.
The fund invests in the MFS Institutional Money Market Portfolio which is managed by MFS and seeks current income consistent with preservation of capital and liquidity. This money market fund does not pay a management fee to MFS.
The fund is permitted to engage in purchase and sale transactions with funds and accounts for which MFS serves as investment adviser orsub-adviser (“cross-trades”) pursuant to a policy adopted by the Board of Trustees. This policy has been designed to ensure that cross-trades conducted by the fund comply with Rule17a-7 under the Investment Company Act of 1940. During the year ended December 31, 2019, the fund engaged in purchase and sale transactions pursuant to this policy, which amounted to $978,500 and $822,921, respectively. The sales transactions resulted in net realized gains (losses) of $115,434.
For the year ended December 31, 2019, purchases and sales of investments, other than short-term obligations, aggregated $158,553,125 and $227,530,758, respectively.
| (5) | | Shares of Beneficial Interest |
The fund’s Declaration of Trust permits the Trustees to issue an unlimited number of full and fractional shares of beneficial interest. Transactions in fund shares were as follows:
| | | | | | | | | | | | | | | | |
| | | Year ended 12/31/19 | | | Year ended 12/31/18 | |
| | | | |
| | | Shares | | | Amount | | | Shares | | | Amount | |
| Shares sold | | | | | | | | | | | | | | | | |
Initial Class | | | 1,272,961 | | | | $35,746,878 | | | | 1,807,723 | | | | $49,642,877 | |
Service Class | | | 4,881,451 | | | | 134,750,061 | | | | 9,068,135 | | | | 246,748,145 | |
| | | 6,154,412 | | | | $170,496,939 | | | | 10,875,858 | | | | $296,391,022 | |
| | | | |
| Shares issued to shareholders in reinvestment of distributions | | | | | | | | | | | | | | | | |
Initial Class | | | 513,152 | | | | $13,849,975 | | | | 227,591 | | | | $6,449,925 | |
Service Class | | | 1,672,987 | | | | 44,484,734 | | | | 1,299,712 | | | | 36,248,974 | |
| | | 2,186,139 | | | | $58,334,709 | | | | 1,527,303 | | | | $42,698,899 | |
| | | | |
| Shares reacquired | | | | | | | | | | | | | | | | |
Initial Class | | | (2,779,834 | ) | | | $(78,917,068 | ) | | | (1,988,524 | ) | | | $(55,464,604 | ) |
Service Class | | | (5,877,448 | ) | | | (163,164,639 | ) | | | (37,642,907 | ) | | | (976,864,994 | ) |
| | | (8,657,282 | ) | | | $(242,081,707 | ) | | | (39,631,431 | ) | | | $(1,032,329,598 | ) |
| | | | |
| Net change | | | | | | | | | | | | | | | | |
Initial Class | | | (993,721 | ) | | | $(29,320,215 | ) | | | 46,790 | | | | $628,198 | |
Service Class | | | 676,990 | | | | 16,070,156 | | | | (27,275,060 | ) | | | (693,867,875 | ) |
| | | (316,731 | ) | | | $(13,250,059 | ) | | | (27,228,270 | ) | | | $(693,239,677 | ) |
The fund is one of several mutual funds in which certain MFS funds may invest. The MFS funds do not invest in the underlying funds for the purpose of exercising management or control. At the end of the period, the MFS Moderate Allocation Portfolio, the MFS Growth Allocation Portfolio, and the MFS Conservative Allocation Portfolio were the owners of record of approximately 3%, 1%, and 1%, respectively, of the value of outstanding voting shares of the fund.
Effective at the close of business on October 16, 2017, the fund is closed to new investors subject to certain exceptions. Please see the fund’s prospectus for details.
19
MFS International Intrinsic Value Portfolio
Notes to Financial Statements – continued
The fund and certain other funds managed by MFS participate in a $1.25 billion unsecured committed line of credit, subject to a $1 billion sublimit, provided by a syndicate of banks under a credit agreement. Borrowings may be made for temporary financing needs. Interest is charged to each fund, based on its borrowings, generally at a rate equal to the highest of one month LIBOR, the Federal Funds Effective Rate and the Overnight Bank Funding Rate, plus an agreed upon spread. A commitment fee, based on the average daily, unused portion of the committed line of credit, is allocated among the participating funds. In addition, the fund and other funds managed by MFS have established unsecured uncommitted borrowing arrangements with certain banks for temporary financing needs. Interest is charged to each fund, based on its borrowings, at rates equal to customary reference rates plus an agreed upon spread. For the year ended December 31, 2019, the fund’s commitment fee and interest expense were $6,764 and $0, respectively, and are included in “Miscellaneous” expense in the Statement of Operations.
| (7) | | Investments in Affiliated Issuers |
An affiliated issuer may be considered one in which the fund owns 5% or more of the outstanding voting securities, or a company which is under common control. For the purposes of this report, the following were affiliated issuers:
| | | | | | | | | | | | | | | | | | | | | | | | |
| Affiliated Issuers | | Beginning
Value | | | Purchases | | | Sales Proceeds | | | Realized
Gain
(Loss) | | | Change in
Unrealized
Appreciation or
Depreciation | | | Ending
Value | |
| MFS Institutional Money Market Portfolio | | | $34,696,385 | | | | $191,250,949 | | | | $185,475,459 | | | | $3,678 | | | | $1,216 | | | | $40,476,769 | |
| | | | | | |
| Affiliated Issuers | | | | | | | | | | | | | | Dividend
Income | | | Capital Gain
Distributions | |
| MFS Institutional Money Market Portfolio | | | | | | | | | | | | | | | | | | | $820,151 | | | | $— | |
20
MFS International Intrinsic Value Portfolio
REPORT OF INDEPENDENT REGISTERED PUBLIC ACCOUNTING FIRM
To the Board of Trustees of MFS Variable Insurance Trust II and the Shareholders of MFS International Intrinsic Value Portfolio (formerly MFS International Value Portfolio):
Opinion on the Financial Statements and Financial Highlights
We have audited the accompanying statement of assets and liabilities of MFS International Intrinsic Value Portfolio (formerly MFS International Value Portfolio) (the “Fund”), including the portfolio of investments, as of December 31, 2019, the related statement of operations for the year then ended, the statements of changes in net assets for each of the two years in the period then ended, the financial highlights for each of the five years in the period then ended, and the related notes. In our opinion, the financial statements and financial highlights present fairly, in all material respects, the financial position of the Fund as of December 31, 2019, and the results of its operations for the year then ended, the changes in its net assets for each of the two years in the period then ended, and the financial highlights for each of the five years in the period then ended, in conformity with accounting principles generally accepted in the United States of America.
Basis for Opinion
These financial statements and financial highlights are the responsibility of the Fund’s management. Our responsibility is to express an opinion on the Fund’s financial statements and financial highlights based on our audits. We are a public accounting firm registered with the Public Company Accounting Oversight Board (United States) (PCAOB) and are required to be independent with respect to the Fund in accordance with the U.S. federal securities laws and the applicable rules and regulations of the Securities and Exchange Commission and the PCAOB.
We conducted our audits in accordance with the standards of the PCAOB. Those standards require that we plan and perform the audit to obtain reasonable assurance about whether the financial statements and financial highlights are free of material misstatement, whether due to error or fraud. The Fund is not required to have, nor were we engaged to perform, an audit of its internal control over financial reporting. As part of our audits we are required to obtain an understanding of internal control over financial reporting but not for the purpose of expressing an opinion on the effectiveness of the Fund’s internal control over financial reporting. Accordingly, we express no such opinion.
Our audits included performing procedures to assess the risks of material misstatement of the financial statements and financial highlights, whether due to error or fraud, and performing procedures that respond to those risks. Such procedures included examining, on a test basis, evidence regarding the amounts and disclosures in the financial statements and financial highlights. Our audits also included evaluating the accounting principles used and significant estimates made by management, as well as evaluating the overall presentation of the financial statements and financial highlights. Our procedures included confirmation of securities owned as of December 31, 2019, by correspondence with the custodian and brokers; when replies were not received from brokers, we performed other auditing procedures. We believe that our audits provide a reasonable basis for our opinion.
DELOITTE & TOUCHE LLP
Boston, Massachusetts
February 14, 2020
We have served as the auditor of one or more of the MFS investment companies since 1924.
21
MFS International Intrinsic Value Portfolio
TRUSTEES AND OFFICERS – IDENTIFICATION AND BACKGROUND
The Trustees and Officers of the Trust, as of February 1, 2020, are listed below, together with their principal occupations during the past five years. (Their titles may have varied during that period.) The address of each Trustee and Officer is 111 Huntington Avenue, Boston, Massachusetts 02199-7618.
| | | | | | | | | | |
Name, Age | | Position(s)
Held with Fund | | Trustee/Officer
Since (h) | | Number of MFS Funds
overseen by the
Trustee | | Principal Occupations
During the Past Five Years | | Other Directorships During the Past Five Years (j) |
| INTERESTED TRUSTEES |
Robert J. Manning (k)
(age 56) | | Trustee | | February 2004 | | 133 | | Massachusetts Financial Services Company, Executive Chairman (since January 2017); Director; Chairman of the Board; Chief Executive Officer (until 2015);Co-Chief Executive Officer(2015-2016) | | N/A |
| | | | | |
Robin A. Stelmach (k) (age 58) | | Trustee | | January 2014 | | 133 | | Massachusetts Financial Services Company, Vice Chair (since January 2017); Chief Operating Officer and Executive Vice President (until January 2017) | | N/A |
|
| INDEPENDENT TRUSTEES |
John P. Kavanaugh (age 65) | | Trustee and Chair of Trustees | | January 2009 | | 133 | | Private investor | | N/A |
| | | | | |
Steven E. Buller (age 68) | | Trustee | | February 2014 | | 133 | | Financial Accounting Standards Advisory Council, Chairman(2014-2015); Public Company Accounting Oversight Board, Standing Advisory Group, Member (until 2014); BlackRock, Inc. (investment management), Managing Director (until 2014), BlackRock Finco UK (investment management), Director (until 2014) | | N/A |
| | | | | |
John A. Caroselli (age 65) | | Trustee | | March 2017 | | 133 | | JC Global Advisors, LLC (management consulting), President (since 2015); First Capital Corporation (commercial finance), Executive Vice President (until 2015) | | N/A |
| | | | | |
Maureen R. Goldfarb (age 64) | | Trustee | | January 2009 | | 133 | | Private investor | | N/A |
| | | | | |
Peter D. Jones
(age 64) | | Trustee | | January 2019 | | 133 | | Franklin Templeton Distributors, Inc. (investment management), President (until 2015); Franklin Templeton Institutional, LLC (investment management), Chairman (until 2015) | | N/A |
| | | | | |
James W. Kilman, Jr.
(age 58) | | Trustee | | January 2019 | | 133 | | Burford Capital Limited (finance and investment management), Chief Financial Officer (since 2019); KielStrand Capital LLC (family office), Chief Executive Officer (since 2016); Morgan Stanley & Co. (financial services), Vice Chairman of Investment Banking,Co-Head of Diversified Financials Coverage – Financial Institutions Investment Banking Group (until 2016) | | Alpha-En Corporation, Director (2016-2019) |
22
MFS International Intrinsic Value Portfolio
Trustees and Officers – continued
| | | | | | | | | | |
Name, Age | | Position(s)
Held with Fund | | Trustee/Officer
Since (h) | | Number of MFS Funds
overseen by the
Trustee | | Principal Occupations
During the Past Five Years | | Other Directorships During the Past Five Years (j) |
Clarence Otis, Jr. (age 63) | | Trustee | | March 2017 | | 133 | | Darden Restaurants, Inc., Chief Executive Officer (until 2014) | | VF Corporation, Director; Verizon Communications, Inc., Director; The Travelers Companies, Director; Federal Reserve Bank of Atlanta, Director (until 2015) |
| | | | | |
Maryanne L. Roepke (age 63) | | Trustee | | May 2014 | | 133 | | American Century Investments (investment management), Senior Vice President and Chief Compliance Officer (until 2014) | | N/A |
| | | | | |
Laurie J. Thomsen
(age 62) | | Trustee | | March 2005 | | 133 | | Private investor | | The Travelers Companies, Director; Dycom Industries, Inc., Director (since 2015) |
| | | | | | | | |
Name, Age | | Position(s)
Held with Fund | | Trustee/Officer
Since (h) | | Number of
MFS Funds
for which the
Person is an
Officer | | Principal Occupations During the Past Five Years |
| OFFICERS | | | | | | |
Christopher R. Bohane (k)
(age 46) | | Assistant Secretary and Assistant Clerk | | July 2005 | | 133 | | Massachusetts Financial Services Company, Vice President and Assistant General Counsel |
| | | | |
Kino Clark (k) (age 51) | | Assistant Treasurer | | January 2012 | | 133 | | Massachusetts Financial Services Company, Vice President |
| | | | |
John W. Clark, Jr. (k) (age 52) | | Assistant Treasurer | | April 2017 | | 133 | | Massachusetts Financial Services Company, Vice President (since March 2017); Deutsche Bank (financial services), Department Head –Treasurer’s Office (until February 2017) |
| | | | |
Thomas H. Connors (k) (age 60) | | Assistant Secretary and Assistant Clerk | | September 2012 | | 133 | | Massachusetts Financial Services Company, Vice President and Senior Counsel |
| | | | |
David L. DiLorenzo (k)
(age 51) | | President | | July 2005 | | 133 | | Massachusetts Financial Services Company, Senior Vice President |
| | | | |
Heidi W. Hardin (k) (age 52) | | Secretary and Clerk | | April 2017 | | 133 | | Massachusetts Financial Services Company, Executive Vice President and General Counsel (since March 2017); Harris Associates (investment management), General Counsel (from September 2015 to January 2017); Janus Capital Management LLC (investment management), Senior Vice President and General Counsel (until September 2015) |
| | | | |
Brian E. Langenfeld (k) (age 46) | | Assistant
Secretary and Assistant Clerk | | June 2006 | | 133 | | Massachusetts Financial Services Company, Vice President and Senior Counsel |
| | | | |
Amanda S. Mooradian (k) (age 40) | | Assistant
Secretary and Assistant Clerk | | September 2018 | | 133 | | Massachusetts Financial Services Company, Assistant Vice President and Counsel |
| | | | |
Susan A. Pereira (k)
(age 49) | | Assistant
Secretary and Assistant Clerk | | July 2005 | | 133 | | Massachusetts Financial Services Company, Vice President and Assistant General Counsel |
| | | | |
Kasey L. Phillips (k) (age 49) | | Assistant Treasurer | | September 2012 | | 133 | | Massachusetts Financial Services Company, Vice President |
| | | | |
Matthew A. Stowe (k) (age 45) | | Assistant Secretary and Assistant Clerk | | October 2014 | | 133 | | Massachusetts Financial Services Company, Vice President and Assistant General Counsel |
23
MFS International Intrinsic Value Portfolio
Trustees and Officers – continued
| | | | | | | | |
Name, Age | | Position(s)
Held with Fund | | Trustee/Officer
Since (h) | | Number of
MFS Funds
for which the
Person is an
Officer | | Principal Occupations During the Past Five Years |
Martin J. Wolin (k) (age 52) | | Chief Compliance Officer | | July 2015 | | 133 | | Massachusetts Financial Services Company, Senior Vice President and Chief Compliance Officer (since July 2015); Mercer (financial service provider), Chief Risk and Compliance Officer, North America and Latin America (until June 2015) |
| | | | |
James O. Yost (k)
(age 59) | | Treasurer | | September 1990 | | 133 | | Massachusetts Financial Services Company, Senior Vice President |
| (h) | Date first appointed to serve as Trustee/officer of an MFS Fund. Each Trustee has served continuously since appointment unless indicated otherwise. For the period from December 15, 2004 until February 22, 2005, Mr. Manning served as Advisory Trustee. From January 2012 through December 2016, Messrs. DiLorenzo and Yost served as Treasurer and Deputy Treasurer of the Funds, respectively. |
| (j) | Directorships or trusteeships of companies required to report to the Securities and Exchange Commission (i.e., “public companies”). |
| (k) | “Interested person” of the Trust within the meaning of the Investment Company Act of 1940 (referred to as the 1940 Act), which is the principal federal law governing investment companies like the fund, as a result of a position with MFS. The address of MFS is 111 Huntington Avenue, Boston, Massachusetts 02199-7618. |
Each Trustee (other than Messrs. Jones and Kilman) has been elected by shareholders and each Trustee and Officer holds office until his or her successor is chosen and qualified or until his or her earlier death, resignation, retirement or removal. Messrs. Jones and Kilman became Trustees of the Funds on January 1, 2019. The Trust does not hold annual meetings for the purpose of electing Trustees, and Trustees are not elected for fixed terms. Under the terms of the Board’s retirement policy, an Independent Trustee shall retire at the end of the calendar year in which he or she reaches the earlier of 75 years of age or 15 years of service on the Board (or, in the case of any Independent Trustee who joined the Board prior to 2015, 20 years of service on the Board).
Messrs. Buller, Kilman and Otis and Ms. Roepke are members of the Trust’s Audit Committee.
Each of the Interested Trustees and certain Officers hold comparable officer positions with certain affiliates of MFS.
The Statement of Additional Information for a Fund includes further information about the Trustees and is available without charge upon request by calling1-800-225-2606.
| | |
Investment Adviser Massachusetts Financial Services Company 111 Huntington Avenue Boston, MA 02199-7618 | | Custodian State Street Bank and Trust Company 1 Lincoln Street Boston, MA 02111-2900 |
| |
Distributor MFS Fund Distributors, Inc. 111 Huntington Avenue Boston, MA 02199-7618 | | Independent Registered Public Accounting Firm Deloitte & Touche LLP 200 Berkeley Street Boston, MA 02116 |
| |
Portfolio Manager(s) Pablo De La Mata Benjamin Stone | | |
24
MFS International Intrinsic Value Portfolio
BOARD REVIEW OF INVESTMENT ADVISORY AGREEMENT
MFS International Intrinsic Value Portfolio
The Investment Company Act of 1940 requires that both the full Board of Trustees and a majority of thenon-interested (“independent”) Trustees, voting separately, annually approve the continuation of the Fund’s investment advisory agreement with MFS. The Trustees consider matters bearing on the Fund and its advisory arrangements at their meetings throughout the year, including a review of performance data at each regular meeting. In addition, the independent Trustees met several times over the course of three months beginning in May and ending in July, 2019 (“contract review meetings”) for the specific purpose of considering whether to approve the continuation of the investment advisory agreement for the Fund and the other investment companies that the Board oversees (the “MFS Funds”). The independent Trustees were assisted in their evaluation of the Fund’s investment advisory agreement by independent legal counsel, from whom they received separate legal advice and with whom they met separately from MFS during various contract review meetings. The independent Trustees were also assisted in this process by the MFS Funds’ Independent Senior Officer, a senior officer appointed by and reporting to the independent Trustees.
In connection with their deliberations regarding the continuation of the investment advisory agreement, the Trustees, including the independent Trustees, considered such information and factors as they believed, in light of the legal advice furnished to them and their own business judgment, to be relevant. The investment advisory agreement for the Fund was considered separately, although the Trustees also took into account the common interests of all MFS Funds in their review. As described below, the Trustees considered the nature, quality, and extent of the various investment advisory, administrative, and shareholder services performed by MFS under the existing investment advisory agreement and other arrangements with the Fund.
In connection with their contract review meetings, the Trustees received and relied upon materials that included, among other items: (i) information provided by Broadridge Financial Solutions, Inc. (“Broadridge”), an independent third party, on the investment performance of the Fund for various time periods ended December 31, 2018 and the investment performance of a group of funds with substantially similar investment classifications/objectives (the “Broadridge performance universe”), (ii) information provided by Broadridge on the Fund’s advisory fees and other expenses and the advisory fees and other expenses of comparable funds identified by Broadridge as well as all other funds in the same investment classification/category (the “Broadridge expense group and universe”), (iii) information provided by MFS on the advisory fees of portfolios of other clients of MFS, including institutional separate accounts and other clients, (iv) information as to whether and to what extent applicable expense waivers, reimbursements or fee “breakpoints” are observed for the Fund, (v) information regarding MFS’ financial results and financial condition, including MFS’ and certain of its affiliates’ estimated profitability from services performed for the Fund and the MFS Funds as a whole, and compared to MFS’ institutional business, (vi) MFS’ views regarding the outlook for the mutual fund industry and the strategic business plans of MFS, (vii) descriptions of various functions performed by MFS for the Funds, such as compliance monitoring and portfolio trading practices, and (viii) information regarding the overall organization of MFS, including information about MFS’ senior management and other personnel providing investment advisory, administrative and other services to the Fund and the other MFS Funds. The comparative performance, fee and expense information prepared and provided by Broadridge was not independently verified and the independent Trustees did not independently verify any information provided to them by MFS.
The Trustees’ conclusion as to the continuation of the investment advisory agreement was based on a comprehensive consideration of all information provided to the Trustees and not the result of any single factor. Some of the factors that figured particularly in the Trustees’ deliberations are described below, although individual Trustees may have evaluated the information presented differently from one another, giving different weights to various factors. It is also important to recognize that the fee arrangements for the Fund and other MFS Funds are the result of years of review and discussion between the independent Trustees and MFS, that certain aspects of such arrangements may receive greater scrutiny in some years than in others, and that the Trustees’ conclusions may be based, in part, on their consideration of these same arrangements during the course of the year and in prior years.
Based on information provided by Broadridge and MFS, the Trustees reviewed the Fund’s total return investment performance as well as the Broadridge performance universe over various time periods. The Trustees placed particular emphasis on the total return performance of the Fund’s Initial Class shares in comparison to the performance of funds in its Broadridge performance universe over the five-year period ended December 31, 2018, which the Trustees believed was a long enough period to reflect differing market conditions. The total return performance of the Fund’s Initial Class shares was in the 1st quintile relative to the other funds in the universe for this five-year period (the 1st quintile being the best performers and the 5th quintile being the worst performers). The total return performance of the Fund’s Initial Class shares was in the 1st quintile for each of theone- and three-year periods ended December 31, 2018 relative to the Broadridge performance universe. Because of the passage of time, these performance results may differ from the performance results for more recent periods, including those shown elsewhere in this report.
In the course of their deliberations, the Trustees took into account information provided by MFS in connection with the contract review meetings, as well as during investment review meetings conducted with portfolio management personnel during the course of the year regarding the Fund’s performance. After reviewing these and related factors, the Trustees concluded, within the context of their overall conclusions regarding the investment advisory agreement, that they were satisfied with MFS’ responses and efforts relating to investment performance.
25
MFS International Intrinsic Value Portfolio
Board Review of Investment Advisory Agreement – continued
In assessing the reasonableness of the Fund’s advisory fee, the Trustees considered, among other information, the Fund’s advisory fee and the total expense ratio of the Fund’s Initial Class shares as a percentage of average daily net assets and the advisory fee and total expense ratios of the Broadridge expense group based on information provided by Broadridge. The Trustees considered that MFS currently observes an expense limitation for the Fund, which may not be changed without the Trustees’ approval. The Trustees also considered that, according to the data provided by Broadridge (which takes into account any fee reductions or expense limitations that were in effect during the Fund’s last fiscal year), the Fund’s effective advisory fee rate and total expense ratio were each higher than the Broadridge expense group median.
The Trustees also considered the advisory fees charged by MFS to any institutional separate accounts advised by MFS (“separate accounts”) and unaffiliated investment companies for which MFS serves as subadviser (“subadvised funds”) that have comparable investment strategies to the Fund, if any. In comparing these fees, the Trustees considered information provided by MFS as to the generally broader scope of services provided by MFS to the Fund, as well as the more extensive regulatory burdens imposed on MFS in managing the Fund, in comparison to separate accounts and subadvised funds. The Trustees also considered the higher demands placed on MFS’ investment personnel and trading infrastructure as a result of the daily cashin-flows andout-flows of the Fund in comparison to separate accounts.
The Trustees also considered whether the Fund may benefit from any economies of scale in the management of the Fund in the event of growth in assets of the Fund and/or growth in assets of the MFS Funds as a whole. They noted that the Fund’s advisory fee rate schedule is subject to contractual breakpoints that reduce the Fund’s advisory fee rate on average daily net assets over $1 billion and $2 billion. The Trustees also noted that MFS has agreed in writing to waive a portion of the management fees of certain MFS Funds, including the Fund, if the total combined assets of certain funds within the MFS Funds’ complex increase above agreed upon thresholds (the “group fee waiver”), enabling the Fund’s shareholders to share in the benefits from any economies of scale at the complex level. The group fee waiver is reviewed and renewed annually between the Board and MFS. The Trustees concluded that the breakpoints and the group fee waiver were sufficient to allow the Fund to benefit from economies of scale as its assets and overall complex assets grow.
The Trustees also considered information prepared by MFS relating to MFS’ costs and profits with respect to the Fund, the MFS Funds considered as a group, and other investment companies and accounts advised by MFS, as well as MFS’ methodologies used to determine and allocate its costs to the MFS Funds, the Fund and other accounts and products for purposes of estimating profitability.
After reviewing these and other factors described herein, the Trustees concluded, within the context of their overall conclusions regarding the investment advisory agreement, that the advisory fees charged to the Fund represent reasonable compensation in light of the services being provided by MFS to the Fund.
In addition, the Trustees considered MFS’ resources and related efforts to continue to retain, attract and motivate capable personnel to serve the Fund. The Trustees also considered current and developing conditions in the financial services industry, including the presence of large and well-capitalized companies which are spending, and appear to be prepared to continue to spend, substantial sums to engage personnel and to provide services to competing investment companies. In this regard, the Trustees also considered the financial resources of MFS and its ultimate parent, Sun Life Financial Inc. The Trustees also considered the advantages and possible disadvantages to the Fund of having an adviser that also serves other investment companies as well as other accounts.
The Trustees also considered the nature, quality, cost, and extent of administrative, transfer agency, and distribution services provided to the Fund by MFS and its affiliates under agreements and plans other than the investment advisory agreement, including any12b-1 fees the Fund pays to MFS Fund Distributors, Inc., an affiliate of MFS. The Trustees also considered the nature, extent and quality of certain other services MFS performs or arranges for on the Fund’s behalf, which may include securities lending programs, directed expense payment programs, class action recovery programs, and MFS’ interaction with third-party service providers, principally custodians andsub-custodians. The Trustees concluded that the variousnon-advisory services provided by MFS and its affiliates on behalf of the Fund were satisfactory.
The Trustees consideredso-called“fall-out benefits” to MFS such as reputational value derived from serving as investment manager to the MFS Funds. The Trustees also considered that, effective January 3, 2018, MFS had discontinued its historic practice of obtaining investment research from portfolio brokerage commissions paid by certain MFS Funds and would thereafter directly pay for or voluntarily reimburse a Fund, if applicable, for the costs of external research acquired through the use of the Fund’s portfolio brokerage commissions.
Based on their evaluation of factors that they deemed to be material, including those factors described above, the Board of Trustees, including the independent Trustees, concluded that the Fund’s investment advisory agreement with MFS should be continued for an additionalone-year period, commencing August 1, 2019.
26
MFS International Intrinsic Value Portfolio
PROXY VOTING POLICIES AND INFORMATION
MFS votes proxies on behalf of the fund pursuant to proxy voting policies and procedures that are available without charge, upon request, by calling 1-800-225-2606, by visitingmfs.com/proxyvoting, or by visiting the SEC’s Web site athttp://www.sec.gov.
Information regarding how the fund voted proxies relating to portfolio securities during the most recent twelve-month period ended June 30 is available by August 31 of each year without charge by visitingmfs.com/proxyvoting, or by visiting the SEC’s Web site athttp://www.sec.gov.
QUARTERLY PORTFOLIO DISCLOSURE
The fund files a complete schedule of portfolio holdings with the SEC for the first and third quarters of each fiscal year as an exhibit to its reports on Form N-PORT. The fund’s Form N-PORT reports are available on the SEC’s website athttp://www.sec.gov. A shareholder can obtain the portfolio holdings report for the first and third quarters of the fund’s fiscal year atmfs.com/vit2 by choosing the fund’s name and then selecting the “Resources” tab and clicking on “Prospectus and Reports”.
FURTHER INFORMATION
From time to time, MFS may post important information about the fund or the MFS funds on the MFS web site (mfs.com). This information is available athttps://www.mfs.com/en-us/what-we-do/announcements.htmlor atmfs.com/vit2 by choosing the fund’s name.
INFORMATION ABOUT FUND CONTRACTS AND LEGAL CLAIMS
The fund has entered into contractual arrangements with an investment adviser, administrator, distributor, shareholder servicing agent, 529 program manager (if applicable), and custodian who each provide services to the fund. Unless expressly stated otherwise, shareholders are not parties to, or intended beneficiaries of these contractual arrangements, and these contractual arrangements are not intended to create any shareholder right to enforce them against the service providers or to seek any remedy under them against the service providers, either directly or on behalf of the fund.
Under the Trust’s By-Laws and Declaration of Trust, any claims asserted against or on behalf of the MFS Funds, including claims against Trustees and Officers, must be brought in state and federal courts located within the Commonwealth of Massachusetts.
FEDERAL TAX INFORMATION (unaudited)
The following information is provided pursuant to provisions of the Internal Revenue Code.
The fund designates $41,462,000 as capital gain dividends paid during the fiscal year.
For corporate shareholders, 10.05% of the ordinary income dividends paid during the fiscal year qualify for the corporate dividends received deduction.
Income derived from foreign sources was $23,628,145. The fund intends to pass through foreign tax credits of $2,294,336 for the fiscal year.
27
rev. 3/16
| | | | |
| | | |
| FACTS | | WHAT DOES MFS DO WITH YOUR
PERSONAL INFORMATION? | |  |
| | |
| Why? | | Financial companies choose how they share your personal information. Federal law gives consumers the right to limit some but not all sharing. Federal law also requires us to tell you how we collect, share, and protect your personal information. Please read this notice carefully to understand what we do. |
| | |
| What? | | The types of personal information we collect and share depend on the product or service you have with us. This information can include: • Social Security number and account balances • Account transactions and transaction history • Checking account information and wire transfer instructions When you areno longer our customer, we continue to share your information as described in this notice. |
| | |
| How? | | All financial companies need to share customers’ personal information to run their everyday business. In the section below, we list the reasons financial companies can share their customers’ personal information; the reasons MFS chooses to share; and whether you can limit this sharing. |
| | | | |
Reasons we can share your
personal information | | Does MFS share? | | Can you limit this
sharing? |
For our everyday business purposes – such as to process your transactions, maintain your account(s), respond to court orders and legal investigations, or report to credit bureaus | | Yes | | No |
For our marketing purposes – to offer our products and services to you | | No | | We don’t share |
| For joint marketing with other financial companies | | No | | We don’t share |
For our affiliates’ everyday business purposes – information about your transactions and experiences | | No | | We don’t share |
For our affiliates’ everyday business purposes – information about your creditworthiness | | No | | We don’t share |
| For nonaffiliates to market to you | | No | | We don’t share |
| | |
| | |
| Questions? | | Call800-225-2606 or go tomfs.com. |
28
| | |
| Who we are |
| Who is providing this notice? | | MFS Funds, MFS Investment Management, MFS Institutional Advisors, Inc., and MFS Heritage Trust Company. |
| | |
| What we do |
| How does MFS protect my personal information? | | To protect your personal information from unauthorized access and use, we use security measures that comply with federal law. These measures include procedural, electronic, and physical safeguards for the protection of the personal information we collect about you. |
How does MFS
collect my personal information? | | We collect your personal information, for example, when you • open an account or provide account information • direct us to buy securities or direct us to sell your securities • make a wire transfer We also collect your personal information from others, such as credit bureaus, affiliates, or other companies. |
| Why can’t I limit all sharing? | | Federal law gives you the right to limit only • sharing for affiliates’ everyday business purposes – information about your creditworthiness • affiliates from using your information to market to you • sharing for nonaffiliates to market to you State laws and individual companies may give you additional rights to limit sharing. |
| | |
| Definitions |
| Affiliates | | Companies related by common ownership or control. They can be financial and nonfinancial companies. • MFS does not share personal information with affiliates, except for everyday business purposes as described on page one of this notice. |
| Nonaffiliates | | Companies not related by common ownership or control. They can be financial and nonfinancial companies. • MFS does not share with nonaffiliates so they can market to you. |
| Joint marketing | | A formal agreement between nonaffiliated financial companies that together market financial products or services to you. • MFS doesn’t jointly market. |
| | |
| Other important information |
| If you own an MFS product or receive an MFS service in the name of a third party such as a bank or broker-dealer, their privacy policy may apply to you instead of ours. |
29
Annual Report
December 31, 2019

MFS® Massachusetts Investors Growth Stock Portfolio

MFS® Variable Insurance Trust II
Beginning on January 1, 2021, as permitted by regulations adopted by the U.S. Securities and Exchange Commission, the insurance company that offers your contract may determine that it will no longer send you paper copies of the fund’s annual and semiannual shareholder reports unless you specifically request paper copies from the insurance company or from your financial intermediary. Instead, the shareholder reports will be made available on a Web site (insurancefunds.mfs.com or other Web site of which you will be notified), and the insurance company will notify you by mail each time a report is posted and provide you with a Web site link to access the report. Instructions for requesting paper copies will be provided by your insurance company or financial intermediary.
If you already elected to receive shareholder reports by email, you will not be affected by this change and you need not take any action. If your insurance company or financial intermediary offers electronic delivery, you may elect to receive shareholder reports and other communications from the insurance company or financial intermediary by email by following the instructions provided by the insurance company or financial intermediary.
Beginning on January 1, 2019, you may elect to receive all future reports in paper free of charge from the insurance company or financial intermediary. You can inform the insurance company or financial intermediary that you wish to continue receiving paper copies of your shareholder reports by contacting your insurance company or financial intermediary. Your election to receive reports in paper will apply to all funds held in your account with your insurance company or financial intermediary.
MIS-ANN
MFS® Massachusetts Investors Growth Stock Portfolio
CONTENTS
The report is prepared for the general information of contract owners. It is authorized for distribution to prospective investors only when preceded or accompanied by a current prospectus.
NOT FDIC INSURED• MAY LOSE VALUE• NO BANK OR CREDIT UNION GUARANTEE• NOT A DEPOSIT• NOT INSURED BY ANY FEDERAL GOVERNMENT AGENCY OR NCUA/NCUSIF
MFS Massachusetts Investors Growth Stock Portfolio
LETTER FROM THE EXECUTIVE CHAIR

Dear Contract Owners:
Slowing global growth, low inflation, and trade friction between the United States and China have been hallmarks of the past 12 months. After experiencing an uptick in market volatility in late 2018, markets steadied for most of 2019, thanks in large measure to the adoption of a dovish policy stance on the part of global central banks, focused on supporting economic growth. Negotiations aimed at a “phase one” trade deal between the U.S. and China bore fruit at the end of the period, boosting investor sentiment, while signs of stability emerging from the global manufacturing sector also lifted spirits. Uncertainty over Brexit, along with the ripple effects from the trade conflict, hampered business confidence and investment in the United Kingdom and Europe for much of the period, though investors expect greater clarity regarding Brexit as a result of December’s general election. The pro-Brexit Conservative Party won the election by a comfortable margin and set the stage for the U.K.’s departure from the EU at the end of January.
Markets expect the longest economic expansion in U.S. history will continue, albeit at a slower pace, as trade tensions recede. In an effort to prolong the expansion, the U.S. Federal Reserve lowered interest rates three times between July and October and the European Central Bank loosened policy in September. While the global monetary policy backdrop remains quite accommodative, signs of easing trade tensions and fading global recession fears led to improved market sentiment in late 2019 as investors grew less risk averse. In early 2020, an outbreak of coronavirus emanating from China reintroduced global growth fears, causing an uptick in volatility.
Here at MFS®, we aim to help our clients navigate the growing complexity of the markets and world economies. Our long-term investment philosophy and commitment to the responsible allocation of capital allow us to tune out the noise and uncover what we believe are the best, most durable investment opportunities in the market. Through our powerful global investment platform, we combine collective expertise, thoughtful risk management and long-term discipline to create sustainable value for investors.
Respectfully,

Robert J. Manning
Executive Chair
MFS Investment Management
February 14, 2020
The opinions expressed in this letter are subject to change and may not be relied upon for investment advice. No forecasts can be guaranteed.
1
MFS Massachusetts Investors Growth Stock Portfolio
PORTFOLIO COMPOSITION
Portfolio structure

| | | | |
| Top ten holdings | | | | |
| Alphabet, Inc., “A” | | | 6.0% | |
| Microsoft Corp. | | | 5.3% | |
| Accenture PLC, “A” | | | 3.7% | |
| Apple, Inc. | | | 3.4% | |
| Visa, Inc., “A” | | | 3.3% | |
| Marriott International, Inc., “A” | | | 2.9% | |
| Aon PLC | | | 2.8% | |
| Texas Instruments, Inc. | | | 2.4% | |
| Thermo Fisher Scientific, Inc. | | | 2.4% | |
| Fidelity National Information Services, Inc. | | | 2.2% | |
| | | | |
| GICS equity sectors (g) | | | | |
| Information Technology | | | 30.8% | |
| Health Care | | | 15.4% | |
| Consumer Discretionary | | | 13.3% | |
| Communication Services | | | 10.0% | |
| Industrials | | | 9.2% | |
| Financials | | | 8.8% | |
| Consumer Staples | | | 6.6% | |
| Materials | | | 4.9% | |
| (g) | The Global Industry Classification Standard (GICS®) was developed by and/or is the exclusive property of MSCI, Inc. and S&P Global Market Intelligence Inc. (“S&P Global Market Intelligence”). GICS is a service mark of MSCI and S&P Global Market Intelligence and has been licensed for use by MFS. |
Cash & Cash Equivalents includes any cash, investments in money market funds, short-term securities, and other assets less liabilities. Please see the Statement of Assets and Liabilities for additional information related to the fund’s cash position and other assets and liabilities.
Percentages are based on net assets as of December 31, 2019.
The portfolio is actively managed and current holdings may be different.
2
MFS Massachusetts Investors Growth Stock Portfolio
MANAGEMENT REVIEW
Summary of Results
For the twelve months ended December 31, 2019, Initial Class shares of the MFS Massachusetts Investors Growth Stock Portfolio(fund) provided a total return of 39.95%, while Service Class shares of the fund provided a total return of 39.58%. These compare with a return of 36.39% over the same period for the fund’s benchmark, the Russell 1000® Growth Index.
Market Environment
Fading fears of a near-term global recession, the announcement of a partial trade deal between the United States and China and the decline in uncertainty over Brexit helped bolster market sentiment late in the period. Changes in market sentiment, largely driven by uncertainty over the outcome of trade negotiations between the US and China, had contributed to periodic bouts of volatility during the reporting period. The global economy decelerated, led by weakness in China and Europe, although the pace of the slowdown moderated late in the period amid nascent signs of stabilization in the manufacturing sector.
The deteriorating global growth backdrop, along with declining inflationary pressures, prompted the US Federal Reserve to adopt a more dovish posture beginning in early 2019, resulting in the first interest rate cut in over a decade at the end of July, followed by additional cuts in September and October. The Fed’s actions led to a sharp decline in long-term interest rates during the period’s second half, causing the inversion of portions of the US Treasury yield curve for a time. Amid an improvement in risk sentiment in Q4 2019 and indications of a bottoming in growth and a potential upturn in activity, the Fed indicated in October that further rate cuts were unlikely unless the outlook for the economy materially worsened.
Globally, central banks have tilted more dovish as well, with the European Central Bank unveiling a package of easing measures, which included putting overnight rates deeper into negative territory, restarting its bond-buying program and lengthening the term of cheap loans to banks to three years from two. The central banks of India and Australia are among those that have cut rates several times in recent months, although China has been more cautious in increasing liquidity as it keeps trying to deleverage its economy, cutting rates only marginally.
Emerging markets experienced considerable volatility through the end of 2018, as tighter global financial conditions exposed structural weakness in some countries. Those conditions improved in 2019 as the Fed became more dovish. Notwithstanding the periodic headwinds on market sentiment from significant trade friction between the US and China over much of the year, emerging market hard currency debt and local rates benefited from relatively cheap valuations at the beginning of the period and easier global monetary conditions. These factors, plus the fading of certain global risk factors mentioned above, hastened spread tightening in the latter part of the period. At the same time, idiosyncratic risks spiked in some countries (e.g., Argentina and Lebanon), contributing to increased dispersion in performance among sovereign assets.
Contributors to Performance
Security selection and, to a lesser extent, an underweight allocation to both theconsumer discretionary andhealth care sectors were primary contributors to the fund’s performance relative to the Russell 1000® Growth Index. Within theconsumer discretionary sector, not holding shares of internet retailer Amazon.com, and holding shares of luxury goods company LVMH Moet Hennessy Louis Vuitton (b) (France), benefited relative returns. The stock price of LVMH Moet Hennessy Louis Vuitton rose on the back of strong sales results, notably from its Fashion & Leather division. Within thehealth care sector, not holding shares of pharmaceutical company AbbVie and health insurance and Medicare/Medicaid provider UnitedHealth Group lifted relative returns. AbbVie’s stock price ended the period relatively unchanged, underperforming the benchmark, as sales of the company’s arthritis drug, Humira, were sluggish and investors appeared to have reacted unfavorably to the company’smid-period announcement that it would acquire competitor Allergan.
Stock selection in thefinancials sector further aided relative results. Notably, the fund’s holdings of global alternative asset manager Blackstone Group (b), and an overweight position in credit rating agency Moody’s, positively impacted relative returns. The stock price of Blackstone Group rose as investors appeared to have reacted favorably to the company’s strong earnings that benefited from growth in bothfee-related and realized investment income. Additionally, Blackstone Group’s decision to convert from a limited partnership structure to a C corporation broadened the firm’s potential ownership pool and further supported its share price performance.
Other top relative contributors during the period included not holding shares of aerospace company Boeing and network equipment company Cisco Systems, an overweight position in Accenture, and holding shares of semiconductor manufacturer Taiwan Semiconductor Manufacturing (b) (Taiwan). The stock price of Boeing underperformed over the reporting period as the company worked to respond to safety concerns that have grounded its 737 Max airliner globally.
Detractors from Performance
Stock selection and an underweight position in theinformation technology sector weighed on relative performance during the reporting period. Notably, an underweight position in computer and personal electronics maker Apple and software giant Microsoft,
3
MFS Massachusetts Investors Growth Stock Portfolio
Management Review – continued
an overweight position in custom IT consulting and technology services provider Cognizant Technology Solutions, and not holding shares of computer graphics processors maker NVIDIA, dampened relative results. The stock price of Apple advanced during the reporting period as the company’s revenues came in higher than expected, driven by stronger-than-expected demand in its wearable technology and services segments.
Security selection in thecommunication services sector also hindered relative returns. Within this sector, not holding social media company Facebook negatively impacted relative performance as the stock price outperformed the benchmark on the back of strong advertising revenues, robust active user growth and high user-engagement levels.
Stock selection and an overweight position in theconsumer staples sector were additional factors that detracted from relative performance. Within this sector, holding shares of household products manufacturer Reckitt Benckiser Group (b)(h) (United Kingdom), and an overweight position in global consumer products company Colgate-Palmolive, held back relative returns. Reckitt Benckiser Group’s stock price declined over the reporting period as investors appeared to have been disappointed with the company’s lackluster sales growth.
Stocks in other sectors that detracted from relative results included the timing of the fund’s positions in shares of animal health services firm Elanco Animal Health (h) and electronic brokerage firm TD Ameritrade Holding, and an overweight position in diversified industrial growth company Fortive.
Respectfully,
Portfolio Manager(s)
Jeffrey Constantino and Joseph Skorski
Note to Shareholders: Effective July 1, 2019, Joseph Skorski was added as a Portfolio Manager of the Fund.
| (b) | Security is not a benchmark constituent. |
| (h) | Security was not held in the portfolio at period end. |
The views expressed in this report are those of the portfolio manager(s) only through the end of the period of the report as stated on the cover and do not necessarily reflect the views of MFS or any other person in the MFS organization. These views are subject to change at any time based on market or other conditions, and MFS disclaims any responsibility to update such views. These views may not be relied upon as investment advice or an indication of trading intent on behalf of any MFS portfolio. References to specific securities are not recommendations of such securities, and may not be representative of any MFS portfolio’s current or future investments.
4
MFS Massachusetts Investors Growth Stock Portfolio
PERFORMANCE SUMMARY THROUGH 12/31/19
The following chart illustrates the historical performance of the fund in comparison to its benchmark(s). Benchmarks are unmanaged and may not be invested in directly. Benchmark returns do not reflect any fees or expenses. The performance of other share classes will be greater than or less than that of the class depicted below. (See Notes to Performance Summary.)
Performance data shown represents past performance and is no guarantee of future results. Investment return and principal value fluctuate so your units, when sold, may be worth more or less than the original cost; current performance may be lower or higher than quoted. The performance shown does not reflect the deduction of taxes, if any, that a contract holder would pay on fund distributions or the redemption of contract units. The returns for the fund shown also do not reflect the deduction of expenses associated with variable products, such as mortality and expense risk charges, separate account charges, and sales charges imposed by the insurance company separate accounts. Such expenses would reduce the overall returns shown.
Growth of a Hypothetical $10,000 Investment
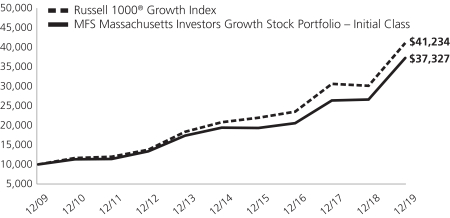
Total Returns through 12/31/19
Average annual total returns
| | | | | | | | | | | | |
| | | Share Class | | Class Inception Date | | 1-yr | | 5-yr | | 10-yr | | |
| | | Initial Class | | 5/06/98 | | 39.95% | | 13.93% | | 14.08% | | |
| | | Service Class | | 8/24/01 | | 39.58% | | 13.66% | | 13.79% | | |
| | | | |
| Comparative benchmark(s) | | | | | | | | |
| | | Russell 1000® Growth Index (f) | | 36.39% | | 14.63% | | 15.22% | | |
| (f) | Source: FactSet Research Systems Inc. |
Benchmark Definition(s)
Russell 1000® Growth Index – constructed to provide a comprehensive barometer for growth securities in the large-cap segment of the U.S. equity universe. Companies in this index generally have higher price-to-book ratios and higher forecasted growth values. Frank Russell Company (“Russell”) is the source and owner of the trademarks, service marks, and copyrights related to the Russell Indexes. Russell® is a trademark of Frank Russell Company. Neither Russell nor its licensors accept any liability for any errors or omissions in the Russell Indexes and/or Russell ratings or underlying data and no party may rely on any Russell Indexes and/or Russell ratings and/or underlying data contained in this document. No further distribution of Russell Data is permitted without Russell’s express written consent. Russell does not promote, sponsor, or endorse the content of this document.
It is not possible to invest directly in an index.
Notes to Performance Summary
Average annual total return represents the average annual change in value for each share class for the periods presented.
Performance results reflect any applicable expense subsidies and waivers in effect during the periods shown. Without such subsidies and waivers the fund’s performance results would be less favorable. Please see the prospectus and financial statements for complete details. All results are historical and assume the reinvestment of any dividends and capital gains distributions.
Performance results do not include adjustments made for financial reporting purposes in accordance with U.S. generally accepted accounting principles and may differ from amounts reported in the financial highlights.
From time to time the fund may receive proceeds from litigation settlements, without which performance would be lower.
5
MFS Massachusetts Investors Growth Stock Portfolio
EXPENSE TABLE
Fund Expenses Borne by the Contract Holders during the Period,
July 1, 2019 through December 31, 2019
As a contract holder of the fund, you incur ongoing costs, including management fees; distribution and/or service(12b-1) fees; and other fund expenses. This example is intended to help you understand your ongoing costs (in dollars) of investing in the fund and to compare these costs with the ongoing costs of investing in other mutual funds.
The example is based on an investment of $1,000 invested at the beginning of the period and held for the entire period July 1, 2019 through December 31, 2019.
Actual Expenses
The first line for each share class in the following table provides information about actual account values and actual expenses. You may use the information in this line, together with the amount you invested, to estimate the expenses that you paid over the period. Simply divide your account value by $1,000 (for example, an $8,600 account value divided by $1,000 = 8.6), then multiply the result by the number in the first line under the heading entitled “Expenses Paid During Period” to estimate the expenses you paid on your account during this period.
Hypothetical Example for Comparison Purposes
The second line for each share class in the following table provides information about hypothetical account values and hypothetical expenses based on the fund’s actual expense ratio and an assumed rate of return of 5% per year before expenses, which is not the fund’s actual return. The hypothetical account values and expenses may not be used to estimate the actual ending account balance or expenses you paid for the period. You may use this information to compare the ongoing costs of investing in the fund and other funds. To do so, compare this 5% hypothetical example with the 5% hypothetical examples that appear in the shareholder reports of the other funds.
Please note that the expenses shown in the table are meant to highlight the fund’s ongoing costs only and do not take into account the fees and expenses imposed under the variable contracts through which your investment in the fund is made. Therefore, the second line for each share class in the table is useful in comparing ongoing costs associated with an investment in vehicles (such as the fund) which fund benefits under variable annuity and variable life insurance contracts and to qualified pension and retirement plans only, and will not help you determine the relative total costs of investing in the fund through variable annuity and variable life insurance contracts. If the fees and expenses imposed under the variable contracts were included, your costs would have been higher.
| | | | | | | | | | | | | | | | | | |
| Share Class | | | | Annualized
Expense Ratio | | | Beginning
Account Value
7/01/19 | | | Ending Account Value
12/31/19 | | | Expenses Paid
During Period (p)
7/01/19-12/31/19 | |
| Initial Class | | Actual | | | 0.78% | | | | $1,000.00 | | | | $1,125.76 | | | | $4.18 | |
| | Hypothetical (h) | | | 0.78% | | | | $1,000.00 | | | | $1,021.27 | | | | $3.97 | |
| Service Class | | Actual | | | 1.03% | | | | $1,000.00 | | | | $1,124.70 | | | | $5.52 | |
| | Hypothetical (h) | | | 1.03% | | | | $1,000.00 | | | | $1,020.01 | | | | $5.24 | |
| (h) | 5% class return per year before expenses. |
| (p) | “Expenses Paid During Period” are equal to each class’s annualized expense ratio, as shown above, multiplied by the average account value over the period, multiplied by 184/365 (to reflect theone-half year period). |
6
MFS Massachusetts Investors Growth Stock Portfolio
PORTFOLIO OF INVESTMENTS – 12/31/19
The Portfolio of Investments is a complete list of all securities owned by your fund. It is categorized by broad-based asset classes.
| | | | | | | | |
| | |
| Issuer | | Shares/Par | | | Value ($) | |
| COMMON STOCKS – 99.0% | | | | | | | | |
| Aerospace – 1.4% | | | | | |
| United Technologies Corp. | | | 95,582 | | | $ | 14,314,360 | |
| | | | | | | | |
| Apparel Manufacturers – 5.1% | | | | | |
| Adidas AG | | | 15,110 | | | $ | 4,911,787 | |
| LVMH Moet Hennessy Louis Vuitton SE | | | 34,203 | | | | 15,890,992 | |
| NIKE, Inc., “B” | | | 187,029 | | | | 18,947,908 | |
| VF Corp. | | | 114,720 | | | | 11,432,995 | |
| | | | | | | | |
| | | | | | $ | 51,183,682 | |
| | | | | | | | |
| Broadcasting – 0.4% | | | | | |
| Walt Disney Co. | | | 29,122 | | | $ | 4,211,915 | |
| | | | | | | | |
| Brokerage & Asset Managers – 3.4% | | | | | |
| Blackstone Group, Inc. | | | 262,521 | | | $ | 14,685,425 | |
| Charles Schwab Corp. | | | 353,709 | | | | 16,822,400 | |
| TD Ameritrade Holding Corp. | | | 46,281 | | | | 2,300,166 | |
| | | | | | | | |
| | | | | | $ | 33,807,991 | |
| | | | | | | | |
| Business Services – 11.5% | | | | | |
| Accenture PLC, “A” | | | 178,126 | | | $ | 37,507,992 | |
| Cognizant Technology Solutions Corp., “A” | | | 250,161 | | | | 15,514,985 | |
| Equifax, Inc. | | | 94,387 | | | | 13,225,507 | |
| Fidelity National Information Services, Inc. | | | 156,486 | | | | 21,765,638 | |
| Fiserv, Inc. (a) | | | 145,426 | | | | 16,815,608 | |
| Verisk Analytics, Inc., “A” | | | 69,417 | | | | 10,366,735 | |
| | | | | | | | |
| | | | | | $ | 115,196,465 | |
| | | | | | | | |
| Cable TV – 2.0% | | | | | |
| Comcast Corp., “A” | | | 456,554 | | | $ | 20,531,233 | |
| | | | | | | | |
| Chemicals – 1.7% | | | | | |
| PPG Industries, Inc. | | | 127,602 | | | $ | 17,033,591 | |
| | | | | | | | |
| Computer Software – 5.3% | | | | | |
| Microsoft Corp. | | | 338,564 | | | $ | 53,391,543 | |
| | | | | | | | |
| Computer Software – Systems – 3.4% | | | | | |
| Apple, Inc. | | | 116,757 | | | $ | 34,285,693 | |
| | | | | | | | |
| Construction – 2.0% | | | | | |
| Sherwin-Williams Co. | | | 34,371 | | | $ | 20,056,853 | |
| | | | | | | | |
| Consumer Products – 4.1% | | | | | |
| Church & Dwight Co., Inc. | | | 130,074 | | | $ | 9,149,405 | |
| Colgate-Palmolive Co. | | | 254,466 | | | | 17,517,440 | |
| Estee Lauder Cos., Inc., “A” | | | 41,924 | | | | 8,658,983 | |
| L’Oréal | | | 20,824 | | | | 6,166,586 | |
| | | | | | | | |
| | | | | | $ | 41,492,414 | |
| | | | | | | | |
| Electrical Equipment – 6.1% | | | | | |
| Amphenol Corp., “A” | | | 155,126 | | | $ | 16,789,287 | |
| Fortive Corp. | | | 235,910 | | | | 18,021,165 | |
| Mettler-Toledo International, Inc. (a) | | | 14,766 | | | | 11,713,572 | |
| TE Connectivity Ltd. | | | 151,307 | | | | 14,501,263 | |
| | | | | | | | |
| | | | | | $ | 61,025,287 | |
| | | | | | | | |
| | | | | | | | |
| | |
Issuer | | Shares/Par | | | Value ($) | |
| COMMON STOCKS – continued | | | | | | | | |
| Electronics – 5.2% | | | | | |
| Analog Devices, Inc. | | | 126,594 | | | $ | 15,044,431 | |
| Taiwan Semiconductor Manufacturing Co. Ltd., ADR | | | 214,373 | | | | 12,455,071 | |
| Texas Instruments, Inc. | | | 189,782 | | | | 24,347,133 | |
| | | | | | | | |
| | | | | | $ | 51,846,635 | |
| | | | | | | | |
| Food & Beverages – 2.5% | | | | | |
| Nestle S.A. | | | 78,930 | | | $ | 8,545,449 | |
| PepsiCo, Inc. | | | 118,884 | | | | 16,247,876 | |
| | | | | | | | |
| | | | | | $ | 24,793,325 | |
| | | | | | | | |
| Gaming & Lodging – 2.9% | | | | | |
| Marriott International, Inc., “A” | | | 193,963 | | | $ | 29,371,817 | |
| | | | | | | | |
| General Merchandise – 0.4% | | | | | |
| Dollarama, Inc. | | | 132,897 | | | $ | 4,567,551 | |
| | | | | | | | |
| Health Maintenance Organizations – 0.9% | | | | | |
| Cigna Corp. | | | 46,362 | | | $ | 9,480,565 | |
| | | | | | | | |
| Insurance – 4.0% | | | | | |
| Aon PLC | | | 133,240 | | | $ | 27,752,560 | |
| Marsh & McLennan Cos., Inc. | | | 112,837 | | | | 12,571,170 | |
| | | | | | | | |
| | | | | | $ | 40,323,730 | |
| | | | | | | | |
| Internet – 7.9% | | | | | |
| Alibaba Group Holding Ltd., ADR (a) | | | 87,656 | | | $ | 18,591,837 | |
| Alphabet, Inc., “A” (a) | | | 45,343 | | | | 60,731,961 | |
| | | | | | | | |
| | | | | | $ | 79,323,798 | |
| | | | | | | | |
| Leisure & Toys – 1.5% | | | | | |
| Electronic Arts, Inc. (a) | | | 142,272 | | | $ | 15,295,663 | |
| | | | | | | | |
| Machinery & Tools – 1.5% | | | | | |
| Nordson Corp. | | | 95,614 | | | $ | 15,569,784 | |
| | | | | | | | |
| Medical Equipment – 10.6% | | | | | |
| Abbott Laboratories | | | 214,360 | | | $ | 18,619,310 | |
| Becton, Dickinson and Co. | | | 77,596 | | | | 21,103,784 | |
| Danaher Corp. | | | 77,226 | | | | 11,852,646 | |
| Stryker Corp. | | | 63,714 | | | | 13,376,117 | |
| Thermo Fisher Scientific, Inc. | | | 74,487 | | | | 24,198,592 | |
| Waters Corp. (a) | | | 73,497 | | | | 17,172,574 | |
| | | | | | | | |
| | | | | | $ | 106,323,023 | |
| | | | | | | | |
| Other Banks & Diversified Financials – 4.7% | | | | | |
| Mastercard, Inc., “A” | | | 44,925 | | | $ | 13,414,156 | |
| Visa, Inc., “A” | | | 178,957 | | | | 33,626,020 | |
| | | | | | | | |
| | | | | | $ | 47,040,176 | |
| | | | | | | | |
| Pharmaceuticals – 2.7% | | | | | |
| Eli Lilly & Co. | | | 77,539 | | | $ | 10,190,951 | |
| Roche Holding AG | | | 31,880 | | | | 10,343,376 | |
| Zoetis, Inc. | | | 49,345 | | | | 6,530,811 | |
| | | | | | | | |
| | | | | | $ | 27,065,138 | |
| | | | | | | | |
7
MFS Massachusetts Investors Growth Stock Portfolio
Portfolio of Investments – continued
| | | | | | | | |
| | |
| Issuer | | Shares/Par | | | Value ($) | |
| COMMON STOCKS – continued | | | | | |
| Printing & Publishing – 1.4% | | | | | |
| Moody’s Corp. | | | 59,691 | | | $ | 14,171,240 | |
| | | | | | | | |
| Railroad & Shipping – 2.1% | | | | | |
| Union Pacific Corp. | | | 115,470 | | | $ | 20,875,821 | |
| | | | | | | | |
| Restaurants – 1.1% | | | | | |
| Starbucks Corp. | | | 121,229 | | | $ | 10,658,454 | |
| | | | | | | | |
| Specialty Chemicals – 1.3% | | | | | |
| Ecolab, Inc. | | | 66,139 | | | $ | 12,764,166 | |
| | | | | | | | |
| Specialty Stores – 1.9% | | | | | |
| TJX Cos., Inc. | | | 313,448 | | | $ | 19,139,135 | |
| | | | | | | | |
Total Common Stocks
(Identified Cost, $508,783,758) | | | | | | $ | 995,141,048 | |
| | | | | | | | |
| |
| INVESTMENT COMPANIES (h) – 1.2% | | | | | |
| Money Market Funds – 1.2% | | | | | |
| MFS Institutional Money Market Portfolio, 1.7% (v) (Identified Cost, $11,991,157) | | | 11,991,157 | | | $ | 11,991,156 | |
| | | | | | | | |
OTHER ASSETS, LESS
LIABILITIES – (0.2)% | | | | | | | (1,535,154 | ) |
| | | | | | | | |
| NET ASSETS – 100.0% | | | | | | $ | 1,005,597,050 | |
| | | | | | | | |
| (a) | | Non-income producing security. |
| (h) | | An affiliated issuer, which may be considered one in which the fund owns 5% or more of the outstanding voting securities, or a company which is under common control. At period end, the aggregate values of the fund’s investments in affiliated issuers and in unaffiliated issuers were $11,991,156 and $995,141,048, respectively. |
| (v) | | Affiliated issuer that is available only to investment companies managed by MFS. The rate quoted for the MFS Institutional Money Market Portfolio is the annualizedseven-day yield of the fund at period end. |
The following abbreviations are used in this report and are defined:
| ADR | | American Depositary Receipt |
See Notes to Financial Statements
8
MFS Massachusetts Investors Growth Stock Portfolio
FINANCIAL STATEMENTS | STATEMENT OF ASSETS AND LIABILITIES
This statement represents your fund’s balance sheet, which details the assets and liabilities comprising the total value of the fund.
| | | | |
At 12/31/19 | | | | |
| |
Assets | | | | |
Investments in unaffiliated issuers, at value (identified cost, $508,783,758) | | | $995,141,048 | |
Investments in affiliated issuers, at value (identified cost, $11,991,157) | | | 11,991,156 | |
Receivables for | | | | |
Investments sold | | | 613,701 | |
Fund shares sold | | | 243,823 | |
Interest and dividends | | | 611,334 | |
Other assets | | | 4,630 | |
Total assets | | | $1,008,605,692 | |
| |
Liabilities | | | | |
Payables for | | | | |
Investments purchased | | | $1,530,339 | |
Fund shares reacquired | | | 1,307,938 | |
Payable to affiliates | | | | |
Investment adviser | | | 40,795 | |
Administrative services fee | | | 745 | |
Shareholder servicing costs | | | 63 | |
Distribution and/or service fees | | | 5,522 | |
Payable for independent Trustees’ compensation | | | 66 | |
Accrued expenses and other liabilities | | | 123,174 | |
Total liabilities | | | $3,008,642 | |
Net assets | | | $1,005,597,050 | |
| |
Net assets consist of | | | | |
Paid-in capital | | | $424,010,446 | |
Total distributable earnings (loss) | | | 581,586,604 | |
Net assets | | | $1,005,597,050 | |
Shares of beneficial interest outstanding | | | 44,787,481 | |
| | | | | | | | | | | | |
| | | |
| | | Net assets | | | Shares
outstanding | | | Net asset value
per share | |
Initial Class | | | $603,368,831 | | | | 26,724,564 | | | | $22.58 | |
Service Class | | | 402,228,219 | | | | 18,062,917 | | | | 22.27 | |
See Notes to Financial Statements
9
MFS Massachusetts Investors Growth Stock Portfolio
FINANCIAL STATEMENTS | STATEMENT OF OPERATIONS
This statement describes how much your fund earned in investment income and accrued in expenses. It also describes any gains and/or losses generated by fund operations.
| | | | |
Year ended 12/31/19 | | | | |
| |
Net investment income (loss) | | | | |
Income | | | | |
Dividends | | | $11,930,120 | |
Dividends from affiliated issuers | | | 149,833 | |
Income on securities loaned | | | 134,118 | |
Other | | | 32,611 | |
Foreign taxes withheld | | | (195,604 | ) |
Total investment income | | | $12,051,078 | |
Expenses | | | | |
Management fee | | | $6,990,748 | |
Distribution and/or service fees | | | 918,867 | |
Shareholder servicing costs | | | 17,139 | |
Administrative services fee | | | 135,614 | |
Independent Trustees’ compensation | | | 18,126 | |
Custodian fee | | | 49,958 | |
Shareholder communications | | | 74,150 | |
Audit and tax fees | | | 58,796 | |
Legal fees | | | 8,158 | |
Miscellaneous | | | 39,270 | |
Total expenses | | | $8,310,826 | |
Reduction of expenses by investment adviser | | | (90,865 | ) |
Net expenses | | | $8,219,961 | |
Net investment income (loss) | | | $3,831,117 | |
| |
Realized and unrealized gain (loss) | | | | |
Realized gain (loss) (identified cost basis) | | | | |
Unaffiliated issuers | | | $93,480,893 | |
Affiliated issuers | | | (1,273 | ) |
Foreign currency | | | 14,021 | |
Net realized gain (loss) | | | $93,493,641 | |
Change in unrealized appreciation or depreciation | | | | |
Unaffiliated issuers | | | $209,458,350 | |
Affiliated issuers | | | (1 | ) |
Translation of assets and liabilities in foreign currencies | | | 823 | |
Net unrealized gain (loss) | | | $209,459,172 | |
Net realized and unrealized gain (loss) | | | $302,952,813 | |
Change in net assets from operations | | | $306,783,930 | |
See Notes to Financial Statements
10
MFS Massachusetts Investors Growth Stock Portfolio
FINANCIAL STATEMENTS | STATEMENTS OF CHANGES IN NET ASSETS
These statements describe the increases and/or decreases in net assets resulting from operations, any distributions, and any shareholder transactions.
| | | | | | | | |
| | | Year ended | |
| | | 12/31/19 | | | 12/31/18 | |
Change in net assets | | | | | | | | |
| | |
From operations | | | | | | | | |
Net investment income (loss) | | | $3,831,117 | | | | $5,083,246 | |
Net realized gain (loss) | | | 93,493,641 | | | | 71,408,277 | |
Net unrealized gain (loss) | | | 209,459,172 | | | | (63,328,636 | ) |
Change in net assets from operations | | | $306,783,930 | | | | $13,162,887 | |
Total distributions to shareholders | | | $(77,028,659 | ) | | | $(57,933,374 | ) |
Change in net assets from fund share transactions | | | $(37,891,568 | ) | | | $(73,917,493 | ) |
Total change in net assets | | | $191,863,703 | | | | $(118,687,980 | ) |
| | |
Net assets | | | | | | | | |
At beginning of period | | | 813,733,347 | | | | 932,421,327 | |
At end of period | | | $1,005,597,050 | | | | $813,733,347 | |
See Notes to Financial Statements
11
MFS Massachusetts Investors Growth Stock Portfolio
FINANCIAL STATEMENTS | FINANCIAL HIGHLIGHTS
The financial highlights table is intended to help you understand the fund’s financial performance for the past 5 years. Certain information reflects financial results for a single fund share. The total returns in the table represent the rate that an investor would have earned (or lost) on an investment in the fund share class (assuming reinvestment of all distributions) held for the entire period.
| | | | | | | | | | | | | | | | | | | | |
| Initial Class | | Year ended | |
| | | | | |
| | | 12/31/19 | | | 12/31/18 | | | 12/31/17 | | | 12/31/16 | | | 12/31/15 | |
| | | | | |
Net asset value, beginning of period | | | $17.60 | | | | $18.60 | | | | $15.38 | | | | $16.38 | | | | $17.61 | |
| | | | | |
| Income (loss) from investment operations | | | | | | | | | | | | | | | | | | | | |
Net investment income (loss) (d) | | | $0.11 | | | | $0.13 | | | | $0.11 | | | | $0.11 | (c) | | | $0.10 | |
Net realized and unrealized gain (loss) | | | 6.71 | | | | 0.16 | | | | 4.16 | | | | 0.95 | | | | (0.21 | ) |
Total from investment operations | | | $6.82 | | | | $0.29 | | | | $4.27 | | | | $1.06 | | | | $(0.11 | ) |
| | | | | |
| Less distributions declared to shareholders | | | | | | | | | | | | | | | | | | | | |
From net investment income | | | $(0.13 | ) | | | $(0.12 | ) | | | $(0.12 | ) | | | $(0.10 | ) | | | $(0.09 | ) |
From net realized gain | | | (1.71 | ) | | | (1.17 | ) | | | (0.93 | ) | | | (1.96 | ) | | | (1.03 | ) |
Total distributions declared to shareholders | | | $(1.84 | ) | | | $(1.29 | ) | | | $(1.05 | ) | | | $(2.06 | ) | | | $(1.12 | ) |
Net asset value, end of period (x) | | | $22.58 | | | | $17.60 | | | | $18.60 | | | | $15.38 | | | | $16.38 | |
Total return (%) (k)(r)(s)(x) | | | 39.95 | | | | 0.81 | | | | 28.42 | | | | 6.08 | (c) | | | (0.12 | ) |
| | | | | |
Ratios (%) (to average net assets)
and Supplemental data: | | | | | | | | | | | | | | | | | | | | |
Expenses before expense reductions (f) | | | 0.79 | | | | 0.80 | | | | 0.81 | | | | 0.78 | (c) | | | 0.79 | |
Expenses after expense reductions (f) | | | 0.78 | | | | 0.79 | | | | 0.80 | | | | 0.77 | (c) | | | 0.79 | |
Net investment income (loss) | | | 0.51 | | | | 0.65 | | | | 0.66 | | | | 0.70 | (c) | | | 0.56 | |
Portfolio turnover | | | 22 | | | | 23 | | | | 21 | | | | 24 | | | | 27 | |
Net assets at end of period (000 omitted) | | | $603,369 | | | | $493,783 | | | | $562,471 | | | | $500,924 | | | | $537,645 | |
| |
| Service Class | | Year ended | |
| | | | | |
| | | 12/31/19 | | | 12/31/18 | | | 12/31/17 | | | 12/31/16 | | | 12/31/15 | |
| | | | | |
Net asset value, beginning of period | | | $17.38 | | | | $18.38 | | | | $15.21 | | | | $16.22 | | | | $17.48 | |
| | | | | |
| Income (loss) from investment operations | | | | | | | | | | | | | | | | | | | | |
Net investment income (loss) (d) | | | $0.05 | | | | $0.08 | | | | $0.07 | | | | $0.07 | (c) | | | $0.06 | |
Net realized and unrealized gain (loss) | | | 6.62 | | | | 0.16 | | | | 4.10 | | | | 0.94 | | | | (0.21 | ) |
Total from investment operations | | | $6.67 | | | | $0.24 | | | | $4.17 | | | | $1.01 | | | | $(0.15 | ) |
| | | | | |
| Less distributions declared to shareholders | | | | | | | | | | | | | | | | | | | | |
From net investment income | | | $(0.07 | ) | | | $(0.07 | ) | | | $(0.07 | ) | | | $(0.06 | ) | | | $(0.08 | ) |
From net realized gain | | | (1.71 | ) | | | (1.17 | ) | | | (0.93 | ) | | | (1.96 | ) | | | (1.03 | ) |
Total distributions declared to shareholders | | | $(1.78 | ) | | | $(1.24 | ) | | | $(1.00 | ) | | | $(2.02 | ) | | | $(1.11 | ) |
Net asset value, end of period (x) | | | $22.27 | | | | $17.38 | | | | $18.38 | | | | $15.21 | | | | $16.22 | |
Total return (%) (k)(r)(s)(x) | | | 39.58 | | | | 0.58 | | | | 28.10 | | | | 5.84 | (c) | | | (0.33 | ) |
| | | | | |
Ratios (%) (to average net assets)
and Supplemental data: | | | | | | | | | | | | | | | | | | | | |
Expenses before expense reductions (f) | | | 1.04 | | | | 1.05 | | | | 1.06 | | | | 1.03 | (c) | | | 1.04 | |
Expenses after expense reductions (f) | | | 1.03 | | | | 1.04 | | | | 1.05 | | | | 1.02 | (c) | | | 1.03 | |
Net investment income (loss) | | | 0.26 | | | | 0.40 | | | | 0.41 | | | | 0.45 | (c) | | | 0.35 | |
Portfolio turnover | | | 22 | | | | 23 | | | | 21 | | | | 24 | | | | 27 | |
Net assets at end of period (000 omitted) | | | $402,228 | | | | $319,950 | | | | $369,950 | | | | $328,673 | | | | $337,742 | |
See Notes to Financial Statements
12
MFS Massachusetts Investors Growth Stock Portfolio
Financial Highlights – continued
| (c) | Amount reflects aone-time reimbursement of expenses by the custodian (or former custodian) without which net investment income and performance would be lower and expenses would be higher. |
| (d) | Per share data is based on average shares outstanding. |
| (f) | Ratios do not reflect reductions from fees paid indirectly, if applicable. |
| (k) | The total return does not reflect expenses that apply to separate accounts. Inclusion of these charges would reduce the total return figures for all periods shown. |
| (r) | Certain expenses have been reduced without which performance would have been lower. |
| (s) | From time to time the fund may receive proceeds from litigation settlements, without which performance would be lower. |
| (x) | The net asset values and total returns have been calculated on net assets which include adjustments made in accordance with U.S. generally accepted accounting principles required at period end for financial reporting purposes. |
See Notes to Financial Statements
13
MFS Massachusetts Investors Growth Stock Portfolio
NOTES TO FINANCIAL STATEMENTS
| (1) | | Business and Organization |
MFS Massachusetts Investors Growth Stock Portfolio (the fund) is a diversified series of MFS Variable Insurance Trust II (the trust). The trust is organized as a Massachusetts business trust and is registered under the Investment Company Act of 1940, as amended, as an open-end management investment company. The shareholders of each series of the trust are separate accounts of insurance companies, which offer variable annuity and/or life insurance products, and qualified retirement and pension plans.
The fund is an investment company and accordingly follows the investment company accounting and reporting guidance of the Financial Accounting Standards Board (FASB) Accounting Standards Codification Topic 946 Financial Services – Investment Companies.
| (2) | | Significant Accounting Policies |
General – The preparation of financial statements in conformity with U.S. generally accepted accounting principles requires management to make estimates and assumptions that affect the reported amounts of assets and liabilities, and disclosure of contingent assets and liabilities at the date of the financial statements and the reported amounts of increases and decreases in net assets from operations during the reporting period. Actual results could differ from those estimates. In the preparation of these financial statements, management has evaluated subsequent events occurring after the date of the fund’s Statement of Assets and Liabilities through the date that the financial statements were issued.
Balance Sheet Offsetting – The fund’s accounting policy with respect to balance sheet offsetting is that, absent an event of default by the counterparty or a termination of the agreement, the International Swaps and Derivatives Association (ISDA) Master Agreement, or similar agreement, does not result in an offset of reported amounts of financial assets and financial liabilities in the Statement of Assets and Liabilities across transactions between the fund and the applicable counterparty. The fund’s right to setoff may be restricted or prohibited by the bankruptcy or insolvency laws of the particular jurisdiction to which a specific master netting agreement counterparty is subject. Balance sheet offsetting disclosures, to the extent applicable to the fund, have been included in the fund’s Significant Accounting Policies note under the captions for each of the fund’s in-scope financial instruments and transactions.
Investment Valuations – Equity securities, including restricted equity securities, are generally valued at the last sale or official closing price on their primary market or exchange as provided by a third-party pricing service. Equity securities, for which there were no sales reported that day, are generally valued at the last quoted daily bid quotation on their primary market or exchange as provided by a third-party pricing service. Short-term instruments with a maturity at issuance of 60 days or less may be valued at amortized cost, which approximates market value. Open-end investment companies are generally valued at net asset value per share. Securities and other assets generally valued on the basis of information from a third-party pricing service may also be valued at a broker/dealer bid quotation. In determining values, third-party pricing services can utilize both transaction data and market information such as yield, quality, coupon rate, maturity, type of issue, trading characteristics, and other market data. The values of foreign securities and other assets and liabilities expressed in foreign currencies are converted to U.S. dollars using the mean of bid and asked prices for rates provided by a third-party pricing service.
The Board of Trustees has delegated primary responsibility for determining or causing to be determined the value of the fund’s investments (including any fair valuation) to the adviser pursuant to valuation policies and procedures approved by the Board. If the adviser determines that reliable market quotations are not readily available, investments are valued at fair value as determined in good faith by the adviser in accordance with such procedures under the oversight of the Board of Trustees. Under the fund’s valuation policies and procedures, market quotations are not considered to be readily available for most types of debt instruments and floating rate loans and many types of derivatives. These investments are generally valued at fair value based on information from third-party pricing services. In addition, investments may be valued at fair value if the adviser determines that an investment’s value has been materially affected by events occurring after the close of the exchange or market on which the investment is principally traded (such as foreign exchange or market) and prior to the determination of the fund’s net asset value, or after the halt of trading of a specific security where trading does not resume prior to the close of the exchange or market on which the security is principally traded. Events that occur after foreign markets close (such as developments in foreign markets and significant movements in the U.S. markets) and prior to the determination of the fund’s net asset value may be deemed to have a material effect on the value of securities traded in foreign markets. Accordingly, the fund’s foreign equity securities may often be valued at fair value. The adviser generally relies on third-party pricing services or other information (such as the correlation with price movements of similar securities in the same or other markets; the type, cost and investment characteristics of the security; the business and financial condition of the issuer; and trading and other market data) to assist in determining whether to fair value and at what value to fair value an investment. The value of an investment for purposes of calculating the fund’s net asset value can differ depending on the source and method used to determine value. When fair valuation is used, the value of an investment used to determine the fund’s net asset value may differ from quoted or published prices for the same investment. There can be no assurance that the fund could obtain the fair value assigned to an investment if it were to sell the investment at the same time at which the fund determines its net asset value per share.
14
MFS Massachusetts Investors Growth Stock Portfolio
Notes to Financial Statements – continued
Various inputs are used in determining the value of the fund’s assets or liabilities. These inputs are categorized into three broad levels. In certain cases, the inputs used to measure fair value may fall into different levels of the fair value hierarchy. In such cases, an investment’s level within the fair value hierarchy is based on the lowest level of input that is significant to the fair value measurement. The fund’s assessment of the significance of a particular input to the fair value measurement in its entirety requires judgment, and considers factors specific to the investment. Level 1 includes unadjusted quoted prices in active markets for identical assets or liabilities. Level 2 includes other significant observable market-based inputs (including quoted prices for similar securities, interest rates, prepayment speed, and credit risk). Level 3 includes unobservable inputs, which may include the adviser’s own assumptions in determining the fair value of investments. The following is a summary of the levels used as of December 31, 2019 in valuing the fund’s assets or liabilities:
| | | | | | | | | | | | | | | | |
| Financial Instruments | | Level 1 | | | Level 2 | | | Level 3 | | | Total | |
| Equity Securities | | | $995,141,048 | | | | $— | | | | $— | | | | $995,141,048 | |
| Mutual Funds | | | 11,991,156 | | | | — | | | | — | | | | 11,991,156 | |
| Total | | | $1,007,132,204 | | | | $— | | | | $— | | | | $1,007,132,204 | |
For further information regarding security characteristics, see the Portfolio of Investments.
Foreign Currency Translation– Purchases and sales of foreign investments, income, and expenses are converted into U.S. dollars based upon currency exchange rates prevailing on the respective dates of such transactions or on the reporting date for foreign denominated receivables and payables. Gains and losses attributable to foreign currency exchange rates on sales of securities are recorded for financial statement purposes as net realized gains and losses on investments. Gains and losses attributable to foreign exchange rate movements on receivables, payables, income and expenses are recorded for financial statement purposes as foreign currency transaction gains and losses. That portion of both realized and unrealized gains and losses on investments that results from fluctuations in foreign currency exchange rates is not separately disclosed.
Security Loans– Under its Securities Lending Agency Agreement with the fund, State Street Bank and Trust Company, as lending agent, loans the securities of the fund to certain qualified institutions (the “Borrowers”) approved by the fund. Security loans can be terminated at the discretion of either the lending agent or the fund and the related securities must be returned within the earlier of the standard trade settlement period for such securities or within three business days. The loans are collateralized by cash and/or U.S. Treasury and federal agency obligations in an amount typically at least equal to the market value of the securities loaned. On loans collateralized by cash, the cash collateral is invested in a money market fund. The market value of the loaned securities is determined at the close of business of the fund and any additional required collateral is delivered to the fund on the next business day. The lending agent provides the fund with indemnification against Borrower default. In the event of Borrower default, the lending agent will, for the benefit of the fund, either purchase securities identical to those loaned or, when such purchase is commercially impracticable, pay the fund the market value of the loaned securities. In return, the lending agent assumes the fund’s rights to the related collateral. If the collateral value is less than the cost to purchase identical securities, the lending agent is responsible for the shortfall, but only to the extent that such shortfall is not due to a decline in collateral value resulting from collateral reinvestment for which the fund bears the risk of loss. A portion of the income generated upon investment of the collateral is remitted to the Borrowers, and the remainder is allocated between the fund and the lending agent. On loans collateralized by U.S. Treasury and/or federal agency obligations, a fee is received from the Borrower, and is allocated between the fund and the lending agent. Income from securities lending is separately reported in the Statement of Operations. The dividend and interest income earned on the securities loaned is accounted for in the same manner as other dividend and interest income. At December 31, 2019, there were no securities on loan or collateral outstanding.
Indemnifications– Under the fund’s organizational documents, its officers and Trustees may be indemnified against certain liabilities and expenses arising out of the performance of their duties to the fund. Additionally, in the normal course of business, the fund enters into agreements with service providers that may contain indemnification clauses. The fund’s maximum exposure under these agreements is unknown as this would involve future claims that may be made against the fund that have not yet occurred.
Investment Transactions and Income– Investment transactions are recorded on the trade date. Interest income is recorded on the accrual basis. Dividends received in cash are recorded on theex-dividend date. Certain dividends from foreign securities will be recorded when the fund is informed of the dividend if such information is obtained subsequent to theex-dividend date. Dividend payments received in additional securities are recorded on theex-dividend date in an amount equal to the value of the security on such date.
The fund may receive proceeds from litigation settlements. Any proceeds received from litigation involving portfolio holdings are reflected in the Statement of Operations in realized gain/loss if the security has been disposed of by the fund or in unrealized gain/loss if the security is still held by the fund. Any other proceeds from litigation not related to portfolio holdings are reflected as other income in the Statement of Operations.
Tax Matters and Distributions– The fund intends to qualify as a regulated investment company, as defined under Subchapter M of the Internal Revenue Code, and to distribute all of its taxable income, including realized capital gains. As a result, no provision for
15
MFS Massachusetts Investors Growth Stock Portfolio
Notes to Financial Statements – continued
federal income tax is required. The fund’s federal tax returns, when filed, will remain subject to examination by the Internal Revenue Service for a three year period. Management has analyzed the fund’s tax positions taken on federal and state tax returns for all open tax years and does not believe that there are any uncertain tax positions that require recognition of a tax liability. Foreign taxes, if any, have been accrued by the fund in the accompanying financial statements in accordance with the applicable foreign tax law. Foreign income taxes may be withheld by certain countries in which the fund invests. Additionally, capital gains realized by the fund on securities issued in or by certain foreign countries may be subject to capital gains tax imposed by those countries.
Distributions to shareholders are recorded on theex-dividend date. Income and capital gain distributions are determined in accordance with income tax regulations, which may differ from U.S. generally accepted accounting principles. Certain capital accounts in the financial statements are periodically adjusted for permanent differences in order to reflect their tax character. These adjustments have no impact on net assets or net asset value per share. Temporary differences which arise from recognizing certain items of income, expense, gain or loss in different periods for financial statement and tax purposes will reverse at some time in the future.
Book/tax differences primarily relate to wash sale loss deferrals.
The tax character of distributions declared to shareholders for the last two fiscal years is as follows:
| | | | | | | | |
| | | Year ended
12/31/19 | | | Year ended
12/31/18 | |
| Ordinary income (including any short-term capital gains) | | | $9,294,449 | | | | $9,646,280 | |
| Long-term capital gains | | | 67,734,210 | | | | 48,287,094 | |
| Total distributions | | | $77,028,659 | | | | $57,933,374 | |
The federal tax cost and the tax basis components of distributable earnings were as follows:
| | | | |
| As of 12/31/19 | | | | |
| |
| Cost of investments | | | $522,096,491 | |
| Gross appreciation | | | 485,106,609 | |
| Gross depreciation | | | (70,896 | ) |
| Net unrealized appreciation (depreciation) | | | $485,035,713 | |
| |
| Undistributed ordinary income | | | 10,045,884 | |
| Undistributed long-term capital gain | | | 86,504,202 | |
| Other temporary differences | | | 805 | |
Multiple Classes of Shares of Beneficial Interest– The fund offers multiple classes of shares, which differ in their respective distribution and/or service fees. The fund’s income, realized and unrealized gain (loss), and common expenses are allocated to shareholders based on the daily net assets of each class. Dividends are declared separately for each class. Differences in per share dividend rates are generally due to differences in separate class expenses. The fund’s distributions declared to shareholders as reported in the Statements of Changes in Net Assets are presented by class as follows:
| | | | | | | | |
| | |
| | | Year ended
12/31/19 | | | Year ended
12/31/18 | |
| Initial Class | | | $47,083,180 | | | | $35,522,610 | |
| Service Class | | | 29,945,479 | | | | 22,410,764 | |
| Total | | | $77,028,659 | | | | $57,933,374 | |
| (3) | | Transactions with Affiliates |
Investment Adviser– The fund has an investment advisory agreement with MFS to provide overall investment management and related administrative services and facilities to the fund. The management fee is computed daily and paid monthly at the following annual rates based on the fund’s average daily net assets:
| | | | |
| Up to $1 billion | | | 0.75% | |
| In excess of $1 billion | | | 0.65% | |
MFS has agreed in writing to reduce its management fee by a specified amount if certain MFS mutual fund assets exceed thresholds agreed to by MFS and the fund’s Board of Trustees. For the year ended December 31, 2019, this management fee reduction amounted to $90,865, which is included in the reduction of total expenses in the Statement of Operations. The management fee incurred for the year ended December 31, 2019 was equivalent to an annual effective rate of 0.74% of the fund’s average daily net assets.
The investment adviser has agreed in writing to pay a portion of the fund’s total annual operating expenses, excluding interest, taxes, extraordinary expenses, brokerage and transaction costs, and investment-related expenses, such that total annual operating expenses do not exceed 0.82% of average daily net assets for the Initial Class shares and 1.07% of average daily net assets for the
16
MFS Massachusetts Investors Growth Stock Portfolio
Notes to Financial Statements – continued
Service Class shares. This written agreement will continue until modified by the fund’s Board of Trustees, but such agreement will continue at least until April 30, 2021. For the year ended December 31, 2019, the fund’s actual operating expenses did not exceed the limit and therefore, the investment adviser did not pay any portion of the fund’s expenses related to this agreement.
Distributor– MFS Fund Distributors, Inc. (MFD), a wholly-owned subsidiary of MFS, is the distributor of shares of the fund. The Trustees have adopted a distribution plan for the Service Class shares pursuant to Rule12b-1 under the Investment Company Act of 1940.
The fund’s distribution plan provides that the fund will pay MFD distribution and/or service fees equal to 0.25% per annum of its average daily net assets attributable to Service Class shares as partial consideration for services performed and expenses incurred by MFD and financial intermediaries (including participating insurance companies that invest in the fund to fund variable annuity and variable life insurance contracts, sponsors of qualified retirement and pension plans that invest in the fund, and affiliates of these participating insurance companies and plan sponsors) in connection with the sale and distribution of the Service Class shares. MFD may subsequently pay all, or a portion, of the distribution and/or service fees to financial intermediaries.
Shareholder Servicing Agent– MFS Service Center, Inc. (MFSC), a wholly-owned subsidiary of MFS, receives a fee from the fund for its services as shareholder servicing agent. For the year ended December 31, 2019, the fee was $16,031, which equated to 0.0017% annually of the fund’s average daily net assets. MFSC also receives payment from the fund forout-of-pocket expenses paid by MFSC on behalf of the fund. For the year ended December 31, 2019, these costs amounted to $1,108.
Administrator– MFS provides certain financial, legal, shareholder communications, compliance, and other administrative services to the fund. Under an administrative services agreement, the fund reimburses MFS the costs incurred to provide these services. The fund is charged an annual fixed amount of $17,500 plus a fee based on average daily net assets. The administrative services fee incurred for the year ended December 31, 2019 was equivalent to an annual effective rate of 0.0145% of the fund’s average daily net assets.
Trustees’ and Officers’ Compensation– The fund pays compensation to independent Trustees in the form of a retainer, attendance fees, and additional compensation to Board and Committee chairpersons. The fund does not pay compensation directly to Trustees or officers of the fund who are also officers of the investment adviser, all of whom receive remuneration from MFS for their services to the fund. Certain officers and Trustees of the fund are officers or directors of MFS, MFD, and MFSC.
Other– This fund and certain other funds managed by MFS (the funds) had entered into a service agreement (the ISO Agreement) which provided for payment of fees solely by the funds to Tarantino LLC in return for the provision of services of an Independent Senior Officer (ISO) for the funds. Frank L. Tarantino served as the ISO and was an officer of the funds and the sole member of Tarantino LLC. Effective June 30, 2019, Mr. Tarantino retired from his position as ISO for the funds, and the ISO Agreement was terminated. For the year ended December 31, 2019, the fee paid by the fund under this agreement was $1,063 and is included in “Miscellaneous” expense in the Statement of Operations. MFS had agreed to bear all expenses associated with office space, other administrative support, and supplies provided to the ISO.
The fund invests in the MFS Institutional Money Market Portfolio which is managed by MFS and seeks current income consistent with preservation of capital and liquidity. This money market fund does not pay a management fee to MFS.
The fund is permitted to engage in purchase and sale transactions with funds and accounts for which MFS serves as investment adviser orsub-adviser (“cross-trades”) pursuant to a policy adopted by the Board of Trustees. This policy has been designed to ensure that cross-trades conducted by the fund comply with Rule17a-7 under the Investment Company Act of 1940. During the year ended December 31, 2019, the fund engaged in sale transactions pursuant to this policy, which amounted to $284,717. The sales transactions resulted in net realized gains (losses) of $35,336.
The adviser has voluntarily undertaken to reimburse the fund from its own resources on a quarterly basis for the cost of investment research embedded in the cost of the fund’s securities trades. This agreement may be rescinded at any time. For the year ended December 31, 2019, this reimbursement amounted to $32,465, which is included in “Other” income in the Statement of Operations.
For the year ended December 31, 2019, purchases and sales of investments, other than short-term obligations, aggregated $205,546,311 and $319,514,307, respectively.
17
MFS Massachusetts Investors Growth Stock Portfolio
Notes to Financial Statements – continued
| (5) | | Shares of Beneficial Interest |
The fund’s Declaration of Trust permits the Trustees to issue an unlimited number of full and fractional shares of beneficial interest. Transactions in fund shares were as follows:
| | | | | | | | | | | | | | | | |
| | | Year ended 12/31/19 | | | Year ended 12/31/18 | |
| | | | |
| | | Shares | | | Amount | | | Shares | | | Amount | |
| Shares sold | | | | | | | | | | | | | | | | |
Initial Class | | | 727,093 | | | | $15,422,380 | | | | 382,702 | | | | $7,410,077 | |
Service Class | | | 1,484,252 | | | | 30,568,543 | | | | 772,807 | | | | 14,681,490 | |
| | | 2,211,345 | | | | $45,990,923 | | | | 1,155,509 | | | | $22,091,567 | |
| | | | |
| Shares issued to shareholders in reinvestment of distributions | | | | | | | | | | | | | | | | |
Initial Class | | | 2,333,161 | | | | $47,083,180 | | | | 1,805,928 | | | | $35,522,610 | |
Service Class | | | 1,503,287 | | | | 29,945,479 | | | | 1,152,817 | | | | 22,410,764 | |
| | | 3,836,448 | | | | $77,028,659 | | | | 2,958,745 | | | | $57,933,374 | |
| | | | |
| Shares reacquired | | | | | | | | | | | | | | | | |
Initial Class | | | (4,390,381 | ) | | | $(91,905,899 | ) | | | (4,374,590 | ) | | | $(84,354,144 | ) |
Service Class | | | (3,334,851 | ) | | | (69,005,251 | ) | | | (3,641,613 | ) | | | (69,588,290 | ) |
| | | (7,725,232 | ) | | | $(160,911,150 | ) | | | (8,016,203 | ) | | | $(153,942,434 | ) |
| | | | |
| Net change | | | | | | | | | | | | | | | | |
Initial Class | | | (1,330,127 | ) | | | $(29,400,339 | ) | | | (2,185,960 | ) | | | $(41,421,457 | ) |
Service Class | | | (347,312 | ) | | | (8,491,229 | ) | | | (1,715,989 | ) | | | (32,496,036 | ) |
| | | (1,677,439 | ) | | | $(37,891,568 | ) | | | (3,901,949 | ) | | | $(73,917,493 | ) |
The fund and certain other funds managed by MFS participate in a $1.25 billion unsecured committed line of credit, subject to a $1 billion sublimit, provided by a syndicate of banks under a credit agreement. Borrowings may be made for temporary financing needs. Interest is charged to each fund, based on its borrowings, generally at a rate equal to the highest of one month LIBOR, the Federal Funds Effective Rate and the Overnight Bank Funding Rate, plus an agreed upon spread. A commitment fee, based on the average daily, unused portion of the committed line of credit, is allocated among the participating funds. In addition, the fund and other funds managed by MFS have established unsecured uncommitted borrowing arrangements with certain banks for temporary financing needs. Interest is charged to each fund, based on its borrowings, at rates equal to customary reference rates plus an agreed upon spread. For the year ended December 31, 2019, the fund’s commitment fee and interest expense were $5,038 and $0, respectively, and are included in “Miscellaneous” expense in the Statement of Operations.
| (7) | | Investments in Affiliated Issuers |
An affiliated issuer may be considered one in which the fund owns 5% or more of the outstanding voting securities, or a company which is under common control. For the purposes of this report, the following were affiliated issuers:
| | | | | | | | | | | | | | | | | | | | | | | | |
| Affiliated Issuers | | Beginning
Value | | | Purchases | | | Sales
Proceeds | | | Realized
Gain
(Loss) | | | Change in
Unrealized
Appreciation or
Depreciation | | | Ending
Value | |
| MFS Institutional Money Market Portfolio | | | $6,790,527 | | | | $174,668,437 | | | | $169,466,534 | | | | $(1,273 | ) | | | $(1 | ) | | | $11,991,156 | |
| | | | | | |
| Affiliated Issuers | | | | | | | | | | | | | | Dividend
Income | | | Capital Gain
Distributions | |
| MFS Institutional Money Market Portfolio | | | | | | | | | | | | | | | | | | | $149,833 | | | | $— | |
18
MFS Massachusetts Investors Growth Stock Portfolio
REPORT OF INDEPENDENT REGISTERED PUBLIC ACCOUNTING FIRM
To the Board of Trustees of MFS Variable Insurance Trust II and the Shareholders of MFS Massachusetts Investors Growth Stock Portfolio:
Opinion on the Financial Statements and Financial Highlights
We have audited the accompanying statement of assets and liabilities of MFS Massachusetts Investors Growth Stock Portfolio (the “Fund”), including the portfolio of investments, as of December 31, 2019, the related statement of operations for the year then ended, the statements of changes in net assets for each of the two years in the period then ended, the financial highlights for each of the five years in the period then ended, and the related notes. In our opinion, the financial statements and financial highlights present fairly, in all material respects, the financial position of the Fund as of December 31, 2019, and the results of its operations for the year then ended, the changes in its net assets for each of the two years in the period then ended, and the financial highlights for each of the five years in the period then ended, in conformity with accounting principles generally accepted in the United States of America.
Basis for Opinion
These financial statements and financial highlights are the responsibility of the Fund’s management. Our responsibility is to express an opinion on the Fund’s financial statements and financial highlights based on our audits. We are a public accounting firm registered with the Public Company Accounting Oversight Board (United States) (PCAOB) and are required to be independent with respect to the Fund in accordance with the U.S. federal securities laws and the applicable rules and regulations of the Securities and Exchange Commission and the PCAOB.
We conducted our audits in accordance with the standards of the PCAOB. Those standards require that we plan and perform the audit to obtain reasonable assurance about whether the financial statements and financial highlights are free of material misstatement, whether due to error or fraud. The Fund is not required to have, nor were we engaged to perform, an audit of its internal control over financial reporting. As part of our audits we are required to obtain an understanding of internal control over financial reporting but not for the purpose of expressing an opinion on the effectiveness of the Fund’s internal control over financial reporting. Accordingly, we express no such opinion.
Our audits included performing procedures to assess the risks of material misstatement of the financial statements and financial highlights, whether due to error or fraud, and performing procedures that respond to those risks. Such procedures included examining, on a test basis, evidence regarding the amounts and disclosures in the financial statements and financial highlights. Our audits also included evaluating the accounting principles used and significant estimates made by management, as well as evaluating the overall presentation of the financial statements and financial highlights. Our procedures included confirmation of securities owned as of December 31, 2019, by correspondence with the custodian and brokers; when replies were not received from brokers, we performed other auditing procedures. We believe that our audits provide a reasonable basis for our opinion.
DELOITTE & TOUCHE LLP
Boston, Massachusetts
February 14, 2020
We have served as the auditor of one or more of the MFS investment companies since 1924.
19
MFS Massachusetts Investors Growth Stock Portfolio
TRUSTEES AND OFFICERS – IDENTIFICATION AND BACKGROUND
The Trustees and Officers of the Trust, as of February 1, 2020, are listed below, together with their principal occupations during the past five years. (Their titles may have varied during that period.) The address of each Trustee and Officer is 111 Huntington Avenue, Boston, Massachusetts 02199-7618.
| | | | | | | | | | |
Name, Age | | Position(s)
Held with Fund | | Trustee/Officer
Since (h) | | Number of MFS Funds
overseen by the
Trustee | | Principal Occupations
During the Past Five Years | | Other Directorships During the Past Five Years (j) |
| INTERESTED TRUSTEES |
Robert J. Manning (k)
(age 56) | | Trustee | | February 2004 | | 133 | | Massachusetts Financial Services Company, Executive Chairman (since January 2017); Director; Chairman of the Board; Chief Executive Officer (until 2015);Co-Chief Executive Officer(2015-2016) | | N/A |
| | | | | |
Robin A. Stelmach (k) (age 58) | | Trustee | | January 2014 | | 133 | | Massachusetts Financial Services Company, Vice Chair (since January 2017); Chief Operating Officer and Executive Vice President (until January 2017) | | N/A |
|
| INDEPENDENT TRUSTEES |
John P. Kavanaugh (age 65) | | Trustee and Chair of Trustees | | January 2009 | | 133 | | Private investor | | N/A |
| | | | | |
Steven E. Buller (age 68) | | Trustee | | February 2014 | | 133 | | Financial Accounting Standards Advisory Council, Chairman(2014-2015); Public Company Accounting Oversight Board, Standing Advisory Group, Member (until 2014); BlackRock, Inc. (investment management), Managing Director (until 2014), BlackRock Finco UK (investment management), Director (until 2014) | | N/A |
| | | | | |
John A. Caroselli (age 65) | | Trustee | | March 2017 | | 133 | | JC Global Advisors, LLC (management consulting), President (since 2015); First Capital Corporation (commercial finance), Executive Vice President (until 2015) | | N/A |
| | | | | |
Maureen R. Goldfarb (age 64) | | Trustee | | January 2009 | | 133 | | Private investor | | N/A |
| | | | | |
Peter D. Jones
(age 64) | | Trustee | | January 2019 | | 133 | | Franklin Templeton Distributors, Inc. (investment management), President (until 2015); Franklin Templeton Institutional, LLC (investment management), Chairman (until 2015) | | N/A |
| | | | | |
James W. Kilman, Jr.
(age 58) | | Trustee | | January 2019 | | 133 | | Burford Capital Limited (finance and investment management), Chief Financial Officer (since 2019); KielStrand Capital LLC (family office), Chief Executive Officer (since 2016); Morgan Stanley & Co. (financial services), Vice Chairman of Investment Banking,Co-Head of Diversified Financials Coverage – Financial Institutions Investment Banking Group (until 2016) | | Alpha-En Corporation, Director (2016-2019) |
20
MFS Massachusetts Investors Growth Stock Portfolio
Trustees and Officers – continued
| | | | | | | | | | |
Name, Age | | Position(s)
Held with Fund | | Trustee/Officer
Since (h) | | Number of MFS Funds
overseen by the
Trustee | | Principal Occupations
During the Past Five Years | | Other Directorships During the Past Five Years (j) |
Clarence Otis, Jr. (age 63) | | Trustee | | March 2017 | | 133 | | Darden Restaurants, Inc., Chief Executive Officer (until 2014) | | VF Corporation, Director; Verizon Communications, Inc., Director; The Travelers Companies, Director; Federal Reserve Bank of Atlanta, Director (until 2015) |
| | | | | |
Maryanne L. Roepke (age 63) | | Trustee | | May 2014 | | 133 | | American Century Investments (investment management), Senior Vice President and Chief Compliance Officer (until 2014) | | N/A |
| | | | | |
Laurie J. Thomsen
(age 62) | | Trustee | | March 2005 | | 133 | | Private investor | | The Travelers Companies, Director; Dycom Industries, Inc., Director (since 2015) |
| | | | | | | | |
Name, Age | | Position(s)
Held with Fund | | Trustee/Officer
Since (h) | | Number of
MFS Funds
for which the
Person is an
Officer | | Principal Occupations During the Past Five Years |
| OFFICERS | | | | | | |
Christopher R. Bohane (k)
(age 46) | | Assistant Secretary and Assistant Clerk | | July 2005 | | 133 | | Massachusetts Financial Services Company, Vice President and Assistant General Counsel |
| | | | |
Kino Clark (k) (age 51) | | Assistant Treasurer | | January 2012 | | 133 | | Massachusetts Financial Services Company, Vice President |
| | | | |
John W. Clark, Jr. (k) (age 52) | | Assistant Treasurer | | April 2017 | | 133 | | Massachusetts Financial Services Company, Vice President (since March 2017); Deutsche Bank (financial services), Department Head –Treasurer’s Office (until February 2017) |
| | | | |
Thomas H. Connors (k) (age 60) | | Assistant Secretary and Assistant Clerk | | September 2012 | | 133 | | Massachusetts Financial Services Company, Vice President and Senior Counsel |
| | | | |
David L. DiLorenzo (k)
(age 51) | | President | | July 2005 | | 133 | | Massachusetts Financial Services Company, Senior Vice President |
| | | | |
Heidi W. Hardin (k) (age 52) | | Secretary and Clerk | | April 2017 | | 133 | | Massachusetts Financial Services Company, Executive Vice President and General Counsel (since March 2017); Harris Associates (investment management), General Counsel (from September 2015 to January 2017); Janus Capital Management LLC (investment management), Senior Vice President and General Counsel (until September 2015) |
| | | | |
Brian E. Langenfeld (k) (age 46) | | Assistant
Secretary and Assistant Clerk | | June 2006 | | 133 | | Massachusetts Financial Services Company, Vice President and Senior Counsel |
| | | | |
Amanda S. Mooradian (k) (age 40) | | Assistant
Secretary and Assistant Clerk | | September 2018 | | 133 | | Massachusetts Financial Services Company, Assistant Vice President and Counsel |
| | | | |
Susan A. Pereira (k)
(age 49) | | Assistant
Secretary and Assistant Clerk | | July 2005 | | 133 | | Massachusetts Financial Services Company, Vice President and Assistant General Counsel |
| | | | |
Kasey L. Phillips (k) (age 49) | | Assistant Treasurer | | September 2012 | | 133 | | Massachusetts Financial Services Company, Vice President |
| | | | |
Matthew A. Stowe (k) (age 45) | | Assistant Secretary and Assistant Clerk | | October 2014 | | 133 | | Massachusetts Financial Services Company, Vice President and Assistant General Counsel |
21
MFS Massachusetts Investors Growth Stock Portfolio
Trustees and Officers – continued
| | | | | | | | |
Name, Age | | Position(s)
Held with Fund | | Trustee/Officer
Since (h) | | Number of
MFS Funds
for which the
Person is an
Officer | | Principal Occupations During the Past Five Years |
Martin J. Wolin (k) (age 52) | | Chief Compliance Officer | | July 2015 | | 133 | | Massachusetts Financial Services Company, Senior Vice President and Chief Compliance Officer (since July 2015); Mercer (financial service provider), Chief Risk and Compliance Officer, North America and Latin America (until June 2015) |
| | | | |
James O. Yost (k)
(age 59) | | Treasurer | | September 1990 | | 133 | | Massachusetts Financial Services Company, Senior Vice President |
| (h) | Date first appointed to serve as Trustee/officer of an MFS Fund. Each Trustee has served continuously since appointment unless indicated otherwise. For the period from December 15, 2004 until February 22, 2005, Mr. Manning served as Advisory Trustee. From January 2012 through December 2016, Messrs. DiLorenzo and Yost served as Treasurer and Deputy Treasurer of the Funds, respectively. |
| (j) | Directorships or trusteeships of companies required to report to the Securities and Exchange Commission (i.e., “public companies”). |
| (k) | “Interested person” of the Trust within the meaning of the Investment Company Act of 1940 (referred to as the 1940 Act), which is the principal federal law governing investment companies like the fund, as a result of a position with MFS. The address of MFS is 111 Huntington Avenue, Boston, Massachusetts 02199-7618. |
Each Trustee (other than Messrs. Jones and Kilman) has been elected by shareholders and each Trustee and Officer holds office until his or her successor is chosen and qualified or until his or her earlier death, resignation, retirement or removal. Messrs. Jones and Kilman became Trustees of the Funds on January 1, 2019. The Trust does not hold annual meetings for the purpose of electing Trustees, and Trustees are not elected for fixed terms. Under the terms of the Board’s retirement policy, an Independent Trustee shall retire at the end of the calendar year in which he or she reaches the earlier of 75 years of age or 15 years of service on the Board (or, in the case of any Independent Trustee who joined the Board prior to 2015, 20 years of service on the Board).
Messrs. Buller, Kilman and Otis and Ms. Roepke are members of the Trust’s Audit Committee.
Each of the Interested Trustees and certain Officers hold comparable officer positions with certain affiliates of MFS.
The Statement of Additional Information for a Fund includes further information about the Trustees and is available without charge upon request by calling1-800-225-2606.
| | |
Investment Adviser Massachusetts Financial Services Company 111 Huntington Avenue Boston, MA 02199-7618 | | Custodian State Street Bank and Trust Company 1 Lincoln Street Boston, MA 02111-2900 |
| |
Distributor MFS Fund Distributors, Inc. 111 Huntington Avenue Boston, MA 02199-7618 | | Independent Registered Public Accounting Firm Deloitte & Touche LLP 200 Berkeley Street Boston, MA 02116 |
| |
Portfolio Manager(s) Jeffrey Constantino Joseph Skorski | | |
22
MFS Massachusetts Investors Growth Stock Portfolio
BOARD REVIEW OF INVESTMENT ADVISORY AGREEMENT
MFS Massachusetts Investors Growth Stock Portfolio
The Investment Company Act of 1940 requires that both the full Board of Trustees and a majority of thenon-interested (“independent”) Trustees, voting separately, annually approve the continuation of the Fund’s investment advisory agreement with MFS. The Trustees consider matters bearing on the Fund and its advisory arrangements at their meetings throughout the year, including a review of performance data at each regular meeting. In addition, the independent Trustees met several times over the course of three months beginning in May and ending in July, 2019 (“contract review meetings”) for the specific purpose of considering whether to approve the continuation of the investment advisory agreement for the Fund and the other investment companies that the Board oversees (the “MFS Funds”). The independent Trustees were assisted in their evaluation of the Fund’s investment advisory agreement by independent legal counsel, from whom they received separate legal advice and with whom they met separately from MFS during various contract review meetings. The independent Trustees were also assisted in this process by the MFS Funds’ Independent Senior Officer, a senior officer appointed by and reporting to the independent Trustees.
In connection with their deliberations regarding the continuation of the investment advisory agreement, the Trustees, including the independent Trustees, considered such information and factors as they believed, in light of the legal advice furnished to them and their own business judgment, to be relevant. The investment advisory agreement for the Fund was considered separately, although the Trustees also took into account the common interests of all MFS Funds in their review. As described below, the Trustees considered the nature, quality, and extent of the various investment advisory, administrative, and shareholder services performed by MFS under the existing investment advisory agreement and other arrangements with the Fund.
In connection with their contract review meetings, the Trustees received and relied upon materials that included, among other items: (i) information provided by Broadridge Financial Solutions, Inc. (“Broadridge”), an independent third party, on the investment performance of the Fund for various time periods ended December 31, 2018 and the investment performance of a group of funds with substantially similar investment classifications/objectives (the “Broadridge performance universe”), (ii) information provided by Broadridge on the Fund’s advisory fees and other expenses and the advisory fees and other expenses of comparable funds identified by Broadridge as well as all other funds in the same investment classification/category (the “Broadridge expense group and universe”), (iii) information provided by MFS on the advisory fees of portfolios of other clients of MFS, including institutional separate accounts and other clients, (iv) information as to whether and to what extent applicable expense waivers, reimbursements or fee “breakpoints” are observed for the Fund, (v) information regarding MFS’ financial results and financial condition, including MFS’ and certain of its affiliates’ estimated profitability from services performed for the Fund and the MFS Funds as a whole, and compared to MFS’ institutional business, (vi) MFS’ views regarding the outlook for the mutual fund industry and the strategic business plans of MFS, (vii) descriptions of various functions performed by MFS for the Funds, such as compliance monitoring and portfolio trading practices, and (viii) information regarding the overall organization of MFS, including information about MFS’ senior management and other personnel providing investment advisory, administrative and other services to the Fund and the other MFS Funds. The comparative performance, fee and expense information prepared and provided by Broadridge was not independently verified and the independent Trustees did not independently verify any information provided to them by MFS.
The Trustees’ conclusion as to the continuation of the investment advisory agreement was based on a comprehensive consideration of all information provided to the Trustees and not the result of any single factor. Some of the factors that figured particularly in the Trustees’ deliberations are described below, although individual Trustees may have evaluated the information presented differently from one another, giving different weights to various factors. It is also important to recognize that the fee arrangements for the Fund and other MFS Funds are the result of years of review and discussion between the independent Trustees and MFS, that certain aspects of such arrangements may receive greater scrutiny in some years than in others, and that the Trustees’ conclusions may be based, in part, on their consideration of these same arrangements during the course of the year and in prior years.
Based on information provided by Broadridge and MFS, the Trustees reviewed the Fund’s total return investment performance as well as the Broadridge performance universe over various time periods. The Trustees placed particular emphasis on the total return performance of the Fund’s Initial Class shares in comparison to the performance of funds in its Broadridge performance universe over the five-year period ended December 31, 2018, which the Trustees believed was a long enough period to reflect differing market conditions. The total return performance of the Fund’s Initial Class shares was in the 4th quintile relative to the other funds in the universe for this five-year period (the 1st quintile being the best performers and the 5th quintile being the worst performers). The total return performance of the Fund’s Initial Class shares was in the 2nd quintile for each of theone- and three-year periods ended December 31, 2018 relative to the Broadridge performance universe. Because of the passage of time, these performance results may differ from the performance results for more recent periods, including those shown elsewhere in this report.
In the course of their deliberations, the Trustees took into account information provided by MFS in connection with the contract review meetings, as well as during investment review meetings conducted with portfolio management personnel during the course of the year regarding the Fund’s performance. The Trustees noted that the total return performance (Class A shares) of the Fund’s retail counterpart, Massachusetts Investors Growth Stock Fund, which had substantially similar investment strategies was in the 3rd quintile relative to the other Funds in its Broadridge performance universe for the five-year period ended December 31, 2018.
23
MFS Massachusetts Investors Growth Stock Portfolio
Board Review of Investment Advisory Agreement – continued
After reviewing these and related factors, the Trustees concluded, within the context of their overall conclusions regarding the investment advisory agreement, that they were satisfied with MFS’ responses and efforts relating to investment performance.
In assessing the reasonableness of the Fund’s advisory fee, the Trustees considered, among other information, the Fund’s advisory fee and the total expense ratio of the Fund’s Initial Class shares as a percentage of average daily net assets and the advisory fee and total expense ratios of the Broadridge expense group based on information provided by Broadridge. The Trustees considered that MFS currently observes an expense limitation for the Fund, which may not be changed without the Trustees’ approval. The Trustees also considered that, according to the data provided by Broadridge (which takes into account any fee reductions or expense limitations that were in effect during the Fund’s last fiscal year), the Fund’s effective advisory fee rate was higher than the Broadridge expense group median and the Fund’s total expense ratio was approximately at the Broadridge expense group median.
The Trustees also considered the advisory fees charged by MFS to any institutional separate accounts advised by MFS (“separate accounts”) and unaffiliated investment companies for which MFS serves as subadviser (“subadvised funds”) that have comparable investment strategies to the Fund, if any. In comparing these fees, the Trustees considered information provided by MFS as to the generally broader scope of services provided by MFS to the Fund, as well as the more extensive regulatory burdens imposed on MFS in managing the Fund, in comparison to separate accounts and subadvised funds. The Trustees also considered the higher demands placed on MFS’ investment personnel and trading infrastructure as a result of the daily cashin-flows andout-flows of the Fund in comparison to separate accounts.
The Trustees also considered whether the Fund may benefit from any economies of scale in the management of the Fund in the event of growth in assets of the Fund and/or growth in assets of the MFS Funds as a whole. They noted that the Fund’s advisory fee rate schedule is subject to a contractual breakpoint that reduces the Fund’s advisory fee rate on average daily net assets over $1 billion. The Trustees also noted that MFS has agreed in writing to waive a portion of the management fees of certain MFS Funds, including the Fund, if the total combined assets of certain funds within the MFS Funds’ complex increase above agreed upon thresholds (the “group fee waiver”), enabling the Fund’s shareholders to share in the benefits from any economies of scale at the complex level. The group fee waiver is reviewed and renewed annually between the Board and MFS. The Trustees concluded that the breakpoint and the group fee waiver were sufficient to allow the Fund to benefit from economies of scale as its assets and overall complex assets grow.
The Trustees also considered information prepared by MFS relating to MFS’ costs and profits with respect to the Fund, the MFS Funds considered as a group, and other investment companies and accounts advised by MFS, as well as MFS’ methodologies used to determine and allocate its costs to the MFS Funds, the Fund and other accounts and products for purposes of estimating profitability.
After reviewing these and other factors described herein, the Trustees concluded, within the context of their overall conclusions regarding the investment advisory agreement, that the advisory fees charged to the Fund represent reasonable compensation in light of the services being provided by MFS to the Fund.
In addition, the Trustees considered MFS’ resources and related efforts to continue to retain, attract and motivate capable personnel to serve the Fund. The Trustees also considered current and developing conditions in the financial services industry, including the presence of large and well-capitalized companies which are spending, and appear to be prepared to continue to spend, substantial sums to engage personnel and to provide services to competing investment companies. In this regard, the Trustees also considered the financial resources of MFS and its ultimate parent, Sun Life Financial Inc. The Trustees also considered the advantages and possible disadvantages to the Fund of having an adviser that also serves other investment companies as well as other accounts.
The Trustees also considered the nature, quality, cost, and extent of administrative, transfer agency, and distribution services provided to the Fund by MFS and its affiliates under agreements and plans other than the investment advisory agreement, including any12b-1 fees the Fund pays to MFS Fund Distributors, Inc., an affiliate of MFS. The Trustees also considered the nature, extent and quality of certain other services MFS performs or arranges for on the Fund’s behalf, which may include securities lending programs, directed expense payment programs, class action recovery programs, and MFS’ interaction with third-party service providers, principally custodians andsub-custodians. The Trustees concluded that the variousnon-advisory services provided by MFS and its affiliates on behalf of the Fund were satisfactory.
The Trustees consideredso-called“fall-out benefits” to MFS such as reputational value derived from serving as investment manager to the MFS Funds. The Trustees also considered that, effective January 3, 2018, MFS had discontinued its historic practice of obtaining investment research from portfolio brokerage commissions paid by certain MFS Funds and would thereafter directly pay for or voluntarily reimburse a Fund, if applicable, for the costs of external research acquired through the use of the Fund’s portfolio brokerage commissions.
Based on their evaluation of factors that they deemed to be material, including those factors described above, the Board of Trustees, including the independent Trustees, concluded that the Fund’s investment advisory agreement with MFS should be continued for an additionalone-year period, commencing August 1, 2019.
24
MFS Massachusetts Investors Growth Stock Portfolio
PROXY VOTING POLICIES AND INFORMATION
MFS votes proxies on behalf of the fund pursuant to proxy voting policies and procedures that are available without charge, upon request, by calling 1-800-225-2606, by visitingmfs.com/proxyvoting, or by visiting the SEC’s Web site athttp://www.sec.gov.
Information regarding how the fund voted proxies relating to portfolio securities during the most recent twelve-month period ended June 30 is available by August 31 of each year without charge by visitingmfs.com/proxyvoting, or by visiting the SEC’s Web site athttp://www.sec.gov.
QUARTERLY PORTFOLIO DISCLOSURE
The fund files a complete schedule of portfolio holdings with the SEC for the first and third quarters of each fiscal year as an exhibit to its reports on Form N-PORT. The fund’s Form N-PORT reports are available on the SEC’s website athttp://www.sec.gov.A shareholder can obtain the portfolio holdings report for the first and third quarters of the fund’s fiscal year atmfs.com/vit2 by choosing the fund’s name and then selecting the “Resources” tab and clicking on “Prospectus and Reports”.
FURTHER INFORMATION
From time to time, MFS may post important information about the fund or the MFS funds on the MFS web site (mfs.com). This information is available athttps://www.mfs.com/en-us/what-we-do/announcements.htmlor atmfs.com/vit2 by choosing the fund’s name.
INFORMATION ABOUT FUND CONTRACTS AND LEGAL CLAIMS
The fund has entered into contractual arrangements with an investment adviser, administrator, distributor, shareholder servicing agent, 529 program manager (if applicable), and custodian who each provide services to the fund. Unless expressly stated otherwise, shareholders are not parties to, or intended beneficiaries of these contractual arrangements, and these contractual arrangements are not intended to create any shareholder right to enforce them against the service providers or to seek any remedy under them against the service providers, either directly or on behalf of the fund.
Under the Trust’s By-Laws and Declaration of Trust, any claims asserted against or on behalf of the MFS Funds, including claims against Trustees and Officers, must be brought in state and federal courts located within the Commonwealth of Massachusetts.
FEDERAL TAX INFORMATION (unaudited)
The following information is provided pursuant to provisions of the Internal Revenue Code.
The fund designates $74,508,000 as capital gain dividends paid during the fiscal year.
For corporate shareholders, 96.53% of the ordinary income dividends paid during the fiscal year qualify for the corporate dividends received deduction.
25
rev. 3/16
| | | | |
| | | |
| FACTS | | WHAT DOES MFS DO WITH YOUR
PERSONAL INFORMATION? | |  |
| | |
| Why? | | Financial companies choose how they share your personal information. Federal law gives consumers the right to limit some but not all sharing. Federal law also requires us to tell you how we collect, share, and protect your personal information. Please read this notice carefully to understand what we do. |
| | |
| What? | | The types of personal information we collect and share depend on the product or service you have with us. This information can include: • Social Security number and account balances • Account transactions and transaction history • Checking account information and wire transfer instructions When you areno longer our customer, we continue to share your information as described in this notice. |
| | |
| How? | | All financial companies need to share customers’ personal information to run their everyday business. In the section below, we list the reasons financial companies can share their customers’ personal information; the reasons MFS chooses to share; and whether you can limit this sharing. |
| | | | |
Reasons we can share your
personal information | | Does MFS share? | | Can you limit this
sharing? |
For our everyday business purposes – such as to process your transactions, maintain your account(s), respond to court orders and legal investigations, or report to credit bureaus | | Yes | | No |
For our marketing purposes – to offer our products and services to you | | No | | We don’t share |
| For joint marketing with other financial companies | | No | | We don’t share |
For our affiliates’ everyday business purposes – information about your transactions and experiences | | No | | We don’t share |
For our affiliates’ everyday business purposes – information about your creditworthiness | | No | | We don’t share |
| For nonaffiliates to market to you | | No | | We don’t share |
| | |
| | |
| Questions? | | Call800-225-2606 or go tomfs.com. |
26
| | |
| Who we are |
| Who is providing this notice? | | MFS Funds, MFS Investment Management, MFS Institutional Advisors, Inc., and MFS Heritage Trust Company. |
| | |
| What we do |
| How does MFS protect my personal information? | | To protect your personal information from unauthorized access and use, we use security measures that comply with federal law. These measures include procedural, electronic, and physical safeguards for the protection of the personal information we collect about you. |
How does MFS
collect my personal information? | | We collect your personal information, for example, when you • open an account or provide account information • direct us to buy securities or direct us to sell your securities • make a wire transfer We also collect your personal information from others, such as credit bureaus, affiliates, or other companies. |
| Why can’t I limit all sharing? | | Federal law gives you the right to limit only • sharing for affiliates’ everyday business purposes – information about your creditworthiness • affiliates from using your information to market to you • sharing for nonaffiliates to market to you State laws and individual companies may give you additional rights to limit sharing. |
| | |
| Definitions |
| Affiliates | | Companies related by common ownership or control. They can be financial and nonfinancial companies. • MFS does not share personal information with affiliates, except for everyday business purposes as described on page one of this notice. |
| Nonaffiliates | | Companies not related by common ownership or control. They can be financial and nonfinancial companies. • MFS does not share with nonaffiliates so they can market to you. |
| Joint marketing | | A formal agreement between nonaffiliated financial companies that together market financial products or services to you. • MFS doesn’t jointly market. |
| | |
| Other important information |
| If you own an MFS product or receive an MFS service in the name of a third party such as a bank or broker-dealer, their privacy policy may apply to you instead of ours. |
27
Annual Report
December 31, 2019

MFS® Research International Portfolio

MFS® Variable Insurance Trust II
Beginning on January 1, 2021, as permitted by regulations adopted by the U.S. Securities and Exchange Commission, the insurance company that offers your contract may determine that it will no longer send you paper copies of the fund’s annual and semiannual shareholder reports unless you specifically request paper copies from the insurance company or from your financial intermediary. Instead, the shareholder reports will be made available on a Web site (insurancefunds.mfs.com or other Web site of which you will be notified), and the insurance company will notify you by mail each time a report is posted and provide you with a Web site link to access the report. Instructions for requesting paper copies will be provided by your insurance company or financial intermediary.
If you already elected to receive shareholder reports by email, you will not be affected by this change and you need not take any action. If your insurance company or financial intermediary offers electronic delivery, you may elect to receive shareholder reports and other communications from the insurance company or financial intermediary by email by following the instructions provided by the insurance company or financial intermediary.
Beginning on January 1, 2019, you may elect to receive all future reports in paper free of charge from the insurance company or financial intermediary. You can inform the insurance company or financial intermediary that you wish to continue receiving paper copies of your shareholder reports by contacting your insurance company or financial intermediary. Your election to receive reports in paper will apply to all funds held in your account with your insurance company or financial intermediary.
RSS-ANN
MFS® Research International Portfolio
CONTENTS
The report is prepared for the general information of contract owners. It is authorized for distribution to prospective investors only when preceded or accompanied by a current prospectus.
NOT FDIC INSURED• MAY LOSE VALUE• NO BANK OR CREDIT UNION GUARANTEE• NOT A DEPOSIT• NOT INSURED BY ANY FEDERAL GOVERNMENT AGENCY OR NCUA/NCUSIF
MFS Research International Portfolio
LETTER FROM THE EXECUTIVE CHAIR

Dear Contract Owners:
Slowing global growth, low inflation, and trade friction between the United States and China have been hallmarks of the past 12 months. After experiencing an uptick in market volatility in late 2018, markets steadied for most of 2019, thanks in large measure to the adoption of a dovish policy stance on the part of global central banks, focused on supporting economic growth. Negotiations aimed at a “phase one” trade deal between the U.S. and China bore fruit at the end of the period, boosting investor sentiment, while signs of stability emerging from the global manufacturing sector also lifted spirits. Uncertainty over Brexit, along with the ripple effects from the trade conflict, hampered business confidence and investment in the United Kingdom and Europe for much of the period, though investors expect greater clarity regarding Brexit as a result of December’s general election. The pro-Brexit Conservative Party won the election by a comfortable margin and set the stage for the U.K.’s departure from the EU at the end of January.
Markets expect the longest economic expansion in U.S. history will continue, albeit at a slower pace, as trade tensions recede. In an effort to prolong the expansion, the U.S. Federal Reserve lowered interest rates three times between July and October and the European Central Bank loosened policy in September. While the global monetary policy backdrop remains quite accommodative, signs of easing trade tensions and fading global recession fears led to improved market sentiment in late 2019 as investors grew less risk averse. In early 2020, an outbreak of coronavirus emanating from China reintroduced global growth fears, causing an uptick in volatility.
Here at MFS®, we aim to help our clients navigate the growing complexity of the markets and world economies. Our long-term investment philosophy and commitment to the responsible allocation of capital allow us to tune out the noise and uncover what we believe are the best, most durable investment opportunities in the market. Through our powerful global investment platform, we combine collective expertise, thoughtful risk management and long-term discipline to create sustainable value for investors.
Respectfully,

Robert J. Manning
Executive Chair
MFS Investment Management
February 14, 2020
The opinions expressed in this letter are subject to change and may not be relied upon for investment advice. No forecasts can be guaranteed.
1
MFS Research International Portfolio
PORTFOLIO COMPOSITION
Portfolio structure

| | | | |
| Top ten holdings | | | | |
| Nestle S.A. | | | 3.2% | |
| Roche Holding AG | | | 3.0% | |
| Linde PLC | | | 2.4% | |
| Schneider Electric SE | | | 2.3% | |
| LVMH Moet Hennessy Louis Vuitton SE | | | 1.9% | |
| Novo Nordisk A.S., “B” | | | 1.9% | |
| AIA Group Ltd. | | | 1.9% | |
| BNP Paribas | | | 1.6% | |
| Santen Pharmaceutical Co. Ltd. | | | 1.5% | |
| Daikin Industries Ltd. | | | 1.5% | |
| |
| Global equity sectors (k) | | | | |
| Capital Goods | | | 22.8% | |
| Financial Services | | | 21.7% | |
| Technology | | | 11.5% | |
| Health Care | | | 11.4% | |
| Consumer Staples | | | 10.0% | |
| Consumer Cyclicals | | | 9.4% | |
| Energy | | | 8.7% | |
| Telecommunications/Cable Television | | | 3.8% | |
| | | | |
| Issuer country weightings (x) | | | | |
| Japan | | | 19.3% | |
| Switzerland | | | 13.8% | |
| France | | | 11.7% | |
| United Kingdom | | | 7.7% | |
| Germany | | | 7.6% | |
| United States | | | 6.7% | |
| Hong Kong | | | 4.4% | |
| Australia | | | 3.7% | |
| Netherlands | | | 3.1% | |
| Other Countries | | | 22.0% | |
| |
| Currency exposure weightings (y) | | | | |
| Euro | | | 33.6% | |
| Japanese Yen | | | 19.3% | |
| Swiss Franc | | | 13.8% | |
| British Pound Sterling | | | 7.5% | |
| United States Dollar | | | 6.3% | |
| Hong Kong Dollar | | | 4.8% | |
| Australian Dollar | | | 3.7% | |
| Danish Krone | | | 2.4% | |
| Canadian Dollar | | | 1.9% | |
| Other Currencies | | | 6.7% | |
| (k) | The sectors set forth above and the associated portfolio composition are based on MFS’ own custom sector classification methodology. |
| (x) | Represents the portfolio’s exposure to issuer countries as a percentage of a portfolio’s net assets. For purposes of this presentation, United States includes Cash & Cash Equivalents. |
| (y) | Represents the portfolio’s exposure to a particular currency as a percentage of a portfolio’s net assets. For purposes of this presentation, United States Dollar includes Cash & Cash Equivalents. |
Cash & Cash Equivalents includes any cash, investments in money market funds, short-term securities, and other assets less liabilities. Please see the Statement of Assets and Liabilities for additional information related to the fund’s cash position and other assets and liabilities.
Percentages are based on net assets as of December 31, 2019.
The portfolio is actively managed and current holdings may be different.
2
MFS Research International Portfolio
MANAGEMENT REVIEW
Summary of Results
For the twelve months ended December 31, 2019, Initial Class shares of the MFS Research International Portfolio (fund) provided a total return of 28.04%, while Service Class shares of the fund provided a total return of 27.67%. These compare with a return of 22.01% over the same period for the fund’s benchmark, the MSCI EAFE Index (net div).
Market Environment
Fading fears of a near-term global recession, the announcement of a partial trade deal between the United States and China and the decline in uncertainty over Brexit helped bolster market sentiment late in the period. Changes in market sentiment, largely driven by uncertainty over the outcome of trade negotiations between the US and China, had contributed to periodic bouts of volatility during the reporting period. The global economy decelerated, led by weakness in China and Europe, although the pace of the slowdown moderated late in the period amid nascent signs of stabilization in the manufacturing sector.
The deteriorating global growth backdrop, along with declining inflationary pressures, prompted the US Federal Reserve to adopt a more dovish posture beginning in early 2019, resulting in the first interest rate cut in over a decade at the end of July, followed by additional cuts in September and October. The Fed’s actions led to a sharp decline in long-term interest rates during the period’s second half, causing the inversion of portions of the US Treasury yield curve for a time. Amid an improvement in risk sentiment in Q4 2019 and indications of a bottoming in growth and a potential upturn in activity, the Fed indicated in October that further rate cuts were unlikely unless the outlook for the economy materially worsened.
Globally, central banks have tilted more dovish as well, with the European Central Bank unveiling a package of easing measures, which included putting overnight rates deeper into negative territory, restarting its bond-buying program and lengthening the term of cheap loans to banks to three years from two. The central banks of India and Australia are among those that have cut rates several times in recent months, although China has been more cautious in increasing liquidity as it keeps trying to deleverage its economy, cutting rates only marginally.
Emerging markets experienced considerable volatility through the end of 2018, as tighter global financial conditions exposed structural weakness in some countries. Those conditions improved in 2019 as the Fed became more dovish. Notwithstanding the periodic headwinds on market sentiment from significant trade friction between the US and China over much of the year, emerging market hard currency debt and local rates benefited from relatively cheap valuations at the beginning of the period and easier global monetary conditions. These factors, plus the fading of certain global risk factors mentioned above, hastened spread tightening in the latter part of the period. At the same time, idiosyncratic risks spiked in some countries (e.g., Argentina and Lebanon), contributing to increased dispersion in performance among sovereign assets.
Contributors to Performance
Stock selection in thecapital goodssector contributed to performance relative to the MSCI EAFE Index. Within this sector, the fund’s overweight position in electrical distribution equipment manufacturer Schneider Electric (France), and holding shares of industrial gas supplier Linde (b) (Germany), bolstered relative results. The stock price of Schneider Electric advanced, driven by better-than-expected organic sales growth, with particular strength in the company’s energy management business and the North American region.
Stock selection in thefinancial services sector also supported relative performance. Within this sector, holding shares of securities exchange, financial markets clearing and data services firm TMX Group (b) (Canada) and risk management and consulting services provider Aon (b) aided relative returns. The stock price of TMX Group appreciated as the company reported solid financial results, driven by strong secondary-capital issuance and related trading volumes. Not holding shares of banking and financial services company HSBC (United Kingdom) further benefited relative results.
Stock selection in both theconsumer cyclicalsandtelecommunications/cable television sectors bolstered relative performance. Within theconsumer cyclicalssector, an overweight position in luxury goods manufacturer LVMH Moet Hennessy Louis Vuitton (France) contributed to relative returns. Within thetelecommunications/cable television sector, there were no individual stocks that were among the fund’s largest relative contributors during the period.
Elsewhere, the fund’s positions in software engineering solutions and technology services provider EPAM Systems (b) and semiconductor manufacturer Taiwan Semiconductor Manufacturing (b) (Taiwan) strengthened relative results. An overweight position in business system services company Nomura Research Institute (Japan), and not holding shares of global energy and petrochemicals company Royal Dutch Shell (United Kingdom), also benefited relative returns.
Detractors from Performance
Individual stocks that were among the fund’s top relative detractors during the reporting period included not holding shares of lithography systems manufacturer ASML (Netherlands), and the fund’s overweight positions in financial services provider AIB Group (Ireland), parcel delivery services company Yamato Holdings (Japan), financial services provider AEON Financial Service (Japan),
3
MFS Research International Portfolio
Management Review – continued
automotive lighting systems manufacturer Koito Manufacturing (Japan), electricity provider CLP Holdings (Hong Kong) and investment management and banking firm UBS Group (Switzerland). The stock price of AIB Group declined during the period, on the back of higher-than-expected costs and increased capital demand. A lower interest rate environment also had an adverse effect on the firm’s net interest income figures, which further weighed on its share price. The stock price of Yamato Holdings depreciated as the company reported higher labor and repair costs and lowered its operating profit guidance due to a disruption in new order intake in its moving business, which reflected higher personnel and subcontracting expenses. The fund’s position in insurance company Hiscox (b) (United Kingdom) and custom IT consulting and technology services provider Cognizant Technology Solutions (b)(h) also hindered relative results.
The fund’s cash and/or cash equivalents position during the period was another detractor from relative performance. Under normal market conditions, the fund strives to be fully invested and generally holds cash to buy new holdings and to provide liquidity. In a period when equity markets appreciated, as measured by the fund’s benchmark, holding cash hurt performance versus the benchmark, which has no cash position.
Respectfully,
Portfolio Manager(s)
Victoria Higley and Camille Humphries Lee
Note to Shareholders: Effective March 31, 2019, Thomas Melendez was removed as a Portfolio Manager of the Fund. Effective April 30, 2019, Jose Luis Garcia was removed as a Portfolio Manager of the Fund.
| (b) | Security is not a benchmark constituent. |
| (h) | Security was not held in the portfolio at period end. |
The views expressed in this report are those of the portfolio manager(s) only through the end of the period of the report as stated on the cover and do not necessarily reflect the views of MFS or any other person in the MFS organization. These views are subject to change at any time based on market or other conditions, and MFS disclaims any responsibility to update such views. These views may not be relied upon as investment advice or an indication of trading intent on behalf of any MFS portfolio. References to specific securities are not recommendations of such securities, and may not be representative of any MFS portfolio’s current or future investments.
4
MFS Research International Portfolio
PERFORMANCE SUMMARY THROUGH 12/31/19
The following chart illustrates the historical performance of the fund in comparison to its benchmark(s). Benchmarks are unmanaged and may not be invested in directly. Benchmark returns do not reflect any fees or expenses. The performance of other share classes will be greater than or less than that of the class depicted below. (See Notes to Performance Summary.)
Performance data shown represents past performance and is no guarantee of future results. Investment return and principal value fluctuate so your units, when sold, may be worth more or less than the original cost; current performance may be lower or higher than quoted. The performance shown does not reflect the deduction of taxes, if any, that a contract holder would pay on fund distributions or the redemption of contract units. The returns for the fund shown also do not reflect the deduction of expenses associated with variable products, such as mortality and expense risk charges, separate account charges, and sales charges imposed by the insurance company separate accounts. Such expenses would reduce the overall returns shown.
Growth of a Hypothetical $10,000 Investment
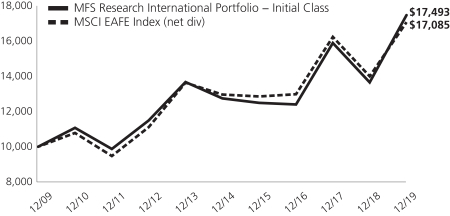
Total Returns through 12/31/19
Average annual total returns
| | | | | | | | | | | | |
| | | Share Class | | Class Inception Date | | 1-yr | | 5-yr | | 10-yr | | |
| | | Initial Class | | 5/06/98 | | 28.04% | | 6.55% | | 5.75% | | |
| | | Service Class | | 8/24/01 | | 27.67% | | 6.28% | | 5.49% | | |
| | | | |
| Comparative benchmark(s) | | | | | | | | |
| | | MSCI EAFE Index (net div) (f) | | 22.01% | | 5.67% | | 5.50% | | |
| (f) | Source: FactSet Research Systems Inc. |
Benchmark Definition(s)
MSCI EAFE (Europe, Australasia, Far East) Index (net div) – a market capitalization-weighted index that is designed to measure equity market performance in the developed markets, excluding the U.S. and Canada. Morgan Stanley Capital International (“MSCI”) makes no express or implied warranties or representations and shall have no liability whatsoever with respect to any MSCI data contained herein. The MSCI data may not be further redistributed or used as a basis for other indices or any securities or financial products. This report is not approved, reviewed, or produced by MSCI.
It is not possible to invest directly in an index.
Notes to Performance Summary
Average annual total return represents the average annual change in value for each share class for the periods presented.
Performance results reflect any applicable expense subsidies and waivers in effect during the periods shown. Without such subsidies and waivers the fund’s performance results would be less favorable. Please see the prospectus and financial statements for complete details. All results are historical and assume the reinvestment of any dividends and capital gains distributions.
Performance results do not include adjustments made for financial reporting purposes in accordance with U.S. generally accepted accounting principles and may differ from amounts reported in the financial highlights.
From time to time the fund may receive proceeds from litigation settlements, without which performance would be lower.
5
MFS Research International Portfolio
EXPENSE TABLE
Fund Expenses Borne by the Contract Holders during the Period,
July 1, 2019 through December 31, 2019
As a contract holder of the fund, you incur ongoing costs, including management fees; distribution and/or service(12b-1) fees; and other fund expenses. This example is intended to help you understand your ongoing costs (in dollars) of investing in the fund and to compare these costs with the ongoing costs of investing in other mutual funds.
The example is based on an investment of $1,000 invested at the beginning of the period and held for the entire period July 1, 2019 through December 31, 2019.
Actual Expenses
The first line for each share class in the following table provides information about actual account values and actual expenses. You may use the information in this line, together with the amount you invested, to estimate the expenses that you paid over the period. Simply divide your account value by $1,000 (for example, an $8,600 account value divided by $1,000 = 8.6), then multiply the result by the number in the first line under the heading entitled “Expenses Paid During Period” to estimate the expenses you paid on your account during this period.
Hypothetical Example for Comparison Purposes
The second line for each share class in the following table provides information about hypothetical account values and hypothetical expenses based on the fund’s actual expense ratio and an assumed rate of return of 5% per year before expenses, which is not the fund’s actual return. The hypothetical account values and expenses may not be used to estimate the actual ending account balance or expenses you paid for the period. You may use this information to compare the ongoing costs of investing in the fund and other funds. To do so, compare this 5% hypothetical example with the 5% hypothetical examples that appear in the shareholder reports of the other funds.
Please note that the expenses shown in the table are meant to highlight the fund’s ongoing costs only and do not take into account the fees and expenses imposed under the variable contracts through which your investment in the fund is made. Therefore, the second line for each share class in the table is useful in comparing ongoing costs associated with an investment in vehicles (such as the fund) which fund benefits under variable annuity and variable life insurance contracts and to qualified pension and retirement plans only, and will not help you determine the relative total costs of investing in the fund through variable annuity and variable life insurance contracts. If the fees and expenses imposed under the variable contracts were included, your costs would have been higher.
| | | | | | | | | | | | | | | | | | |
| Share Class | | | | Annualized
Expense Ratio | | | Beginning
Account Value
7/01/19 | | | Ending Account Value
12/31/19 | | | Expenses Paid
During Period (p)
7/01/19-12/31/19 | |
| Initial Class | | Actual | | | 0.96% | | | | $1,000.00 | | | | $1,091.86 | | | | $5.06 | |
| | Hypothetical (h) | | | 0.96% | | | | $1,000.00 | | | | $1,020.37 | | | | $4.89 | |
| Service Class | | Actual | | | 1.21% | | | | $1,000.00 | | | | $1,090.73 | | | | $6.38 | |
| | Hypothetical (h) | | | 1.21% | | | | $1,000.00 | | | | $1,019.11 | | | | $6.16 | |
| (h) | 5% class return per year before expenses. |
| (p) | “Expenses Paid During Period” are equal to each class’s annualized expense ratio, as shown above, multiplied by the average account value over the period, multiplied by 184/365 (to reflect theone-half year period). |
6
MFS Research International Portfolio
PORTFOLIO OF INVESTMENTS – 12/31/19
The Portfolio of Investments is a complete list of all securities owned by your fund. It is categorized by broad-based asset classes.
| | | | | | | | |
| | |
| Issuer | | Shares/Par | | | Value ($) | |
| COMMON STOCKS – 99.3% | | | | | |
| Airlines – 1.1% | | | | | | | | |
| Aena S.A. | | | 11,821 | | | $ | 2,260,764 | |
| Malaysia Airports Holdings Berhad | | | 395,000 | | | | 733,896 | |
| Ryanair Holdings PLC, ADR (a) | | | 20,992 | | | | 1,839,109 | |
| | | | | | | | |
| | | | | | $ | 4,833,769 | |
| | | | | | | | |
| Alcoholic Beverages – 0.4% | | | | | | | | |
| Ambev S.A., ADR | | | 359,717 | | | $ | 1,676,281 | |
| | | | | | | | |
| Apparel Manufacturers – 4.0% | | | | | | | | |
| Adidas AG | | | 17,507 | | | $ | 5,690,977 | |
| Compagnie Financiere Richemont S.A. | | | 47,152 | | | | 3,705,705 | |
| LVMH Moet Hennessy Louis Vuitton SE | | | 19,042 | | | | 8,847,068 | |
| | | | | | | | |
| | | | | | $ | 18,243,750 | |
| | | | | | | | |
| Automotive – 1.7% | | | | | | | | |
| Koito Manufacturing Co. Ltd. | | | 73,200 | | | $ | 3,387,937 | |
| USS Co. Ltd. | | | 231,400 | | | | 4,369,746 | |
| | | | | | | | |
| | | | | | $ | 7,757,683 | |
| | | | | | | | |
| Brokerage & Asset Managers – 2.3% | | | | | | | | |
| Euronext N.V. | | | 60,721 | | | $ | 4,948,245 | |
| Hong Kong Exchanges & Clearing Ltd. | | | 103,700 | | | | 3,366,926 | |
| TMX Group Ltd. | | | 23,275 | | | | 2,015,536 | |
| | | | | | | | |
| | | | | | $ | 10,330,707 | |
| | | | | | | | |
| Business Services – 0.6% | | | | | | | | |
| Nomura Research Institute Ltd. | | | 127,500 | | | $ | 2,743,500 | |
| | | | | | | | |
| Computer Software – 1.1% | | | | | | | | |
| Cadence Design Systems, Inc. (a) | | | 24,245 | | | $ | 1,681,633 | |
| Check Point Software Technologies Ltd. (a) | | | 31,811 | | | | 3,529,749 | |
| | | | | | | | |
| | | | | | $ | 5,211,382 | |
| | | | | | | | |
| Computer Software – Systems – 3.8% | | | | | |
| Amadeus IT Group S.A. | | | 58,467 | | | $ | 4,774,401 | |
| Constellation Software, Inc. | | | 2,408 | | | | 2,338,665 | |
| EPAM Systems, Inc. (a) | | | 9,623 | | | | 2,041,616 | |
| Fujitsu Ltd. | | | 33,300 | | | | 3,142,285 | |
| Hitachi Ltd. | | | 123,700 | | | | 5,210,496 | |
| | | | | | | | |
| | | | | | $ | 17,507,463 | |
| | | | | | | | |
| Conglomerates – 0.6% | | | | | | | | |
| Melrose Industries PLC | | | 813,635 | | | $ | 2,587,656 | |
| | | | | | | | |
| Construction – 2.0% | | | | | | | | |
| Techtronic Industries Co. Ltd. | | | 610,500 | | | $ | 4,978,925 | |
| Toto Ltd. | | | 103,900 | | | | 4,378,645 | |
| | | | | | | | |
| | | | | | $ | 9,357,570 | |
| | | | | | | | |
| Consumer Products – 3.3% | | | | | | | | |
| Kao Corp. | | | 54,700 | | | $ | 4,511,545 | |
| L’Oréal | | | 17,906 | | | | 5,302,482 | |
| Reckitt Benckiser Group PLC | | | 62,920 | | | | 5,108,143 | |
| | | | | | | | |
| | | | | | $ | 14,922,170 | |
| | | | | | | | |
| | | | | | | | |
| | |
| Issuer | | Shares/Par | | | Value ($) | |
| COMMON STOCKS – continued | | | | | |
| Consumer Services – 0.9% | | | | | | | | |
| 51job, Inc., ADR (a) | | | 25,889 | | | $ | 2,197,976 | |
| Carsales.com Ltd. | | | 58,819 | | | | 685,598 | |
| SEEK Ltd. | | | 72,572 | | | | 1,148,413 | |
| | | | | | | | |
| | | | | | $ | 4,031,987 | |
| | | | | | | | |
| Containers – 0.9% | | | | | | | | |
| Brambles Ltd. | | | 494,758 | | | $ | 4,069,142 | |
| | | | | | | | |
| Electrical Equipment – 3.4% | | | | | | | | |
| Legrand S.A. | | | 63,807 | | | $ | 5,199,012 | |
| Schneider Electric SE | | | 102,710 | | | | 10,541,697 | |
| | | | | | | | |
| | | | | | $ | 15,740,709 | |
| | | | | | | | |
| Electronics – 4.3% | | | | | | | | |
| Kyocera Corp. | | | 43,400 | | | $ | 2,957,559 | |
| Mellanox Technologies Ltd. (a) | | | 22,361 | | | | 2,620,262 | |
| NXP Semiconductors N.V. | | | 19,230 | | | | 2,447,210 | |
| Samsung Electronics Co. Ltd. | | | 70,839 | | | | 3,413,330 | |
| Silicon Motion Technology Corp., ADR | | | 45,678 | | | | 2,316,331 | |
| Taiwan Semiconductor Manufacturing Co. Ltd. | | | 532,804 | | | | 5,883,114 | |
| | | | | | | | |
| | | | | | $ | 19,637,806 | |
| | | | | | | | |
| Energy – Independent – 1.2% | | | | | | | | |
| Caltex Australia Ltd. | | | 148,982 | | | $ | 3,549,409 | |
| Oil Search Ltd. | | | 390,435 | | | | 1,986,411 | |
| | | | | | | | |
| | | | | | $ | 5,535,820 | |
| | | | | | | | |
| Energy – Integrated – 3.7% | | | | | | | | |
| BP PLC | | | 999,793 | | | $ | 6,245,519 | |
| Cairn Energy PLC (a) | | | 930,112 | | | | 2,525,654 | |
| Eni S.p.A. | | | 251,783 | | | | 3,910,456 | |
| Galp Energia SGPS S.A., “B” | | | 253,972 | | | | 4,244,718 | |
| | | | | | | | |
| | | | | | $ | 16,926,347 | |
| | | | | | | | |
| Food & Beverages – 4.3% | | | | | | | | |
| Danone S.A. | | | 58,342 | | | $ | 4,836,180 | |
| Nestle S.A. | | | 134,815 | | | | 14,595,904 | |
| | | | | | | | |
| | | | | | $ | 19,432,084 | |
| | | | | | | | |
| Food & Drug Stores – 0.5% | | | | | | | | |
| Sundrug Co. Ltd. | | | 58,900 | | | $ | 2,128,634 | |
| | | | | | | | |
| Gaming & Lodging – 0.4% | | | | | | | | |
| Flutter Entertainment PLC | | | 15,761 | | | $ | 1,925,696 | |
| | | | | | | | |
| Insurance – 6.1% | | | | | | | | |
| AIA Group Ltd. | | | 821,600 | | | $ | 8,624,781 | |
| Aon PLC | | | 32,080 | | | | 6,681,943 | |
| Hiscox Ltd. | | | 214,018 | | | | 4,036,872 | |
| Swiss Re Ltd. | | | 27,473 | | | | 3,085,674 | |
| Zurich Insurance Group AG | | | 13,044 | | | | 5,352,110 | |
| | | | | | | | |
| | | | | | $ | 27,781,380 | |
| | | | | | | | |
7
MFS Research International Portfolio
Portfolio of Investments – continued
| | | | | | | | |
| | |
| Issuer | | Shares/Par | | | Value ($) | |
| COMMON STOCKS – continued | | | | | |
| Internet – 1.2% | | | | | | | | |
| NAVER Corp. (a) | | | 18,273 | | | $ | 2,946,876 | |
| Scout24 AG | | | 35,535 | | | | 2,349,724 | |
| | | | | | | | |
| | | | | | $ | 5,296,600 | |
| | | | | | | | |
| Machinery & Tools – 5.1% | | | | | | | | |
| Daikin Industries Ltd. | | | 50,000 | | | $ | 7,031,531 | |
| GEA Group AG | | | 119,833 | | | | 3,962,603 | |
| Kubota Corp. | | | 316,700 | | | | 4,961,369 | |
| Ritchie Bros. Auctioneers, Inc. | | | 63,601 | | | | 2,729,081 | |
| Schindler Holding AG | | | 18,338 | | | | 4,665,029 | |
| | | | | | | | |
| | | | | | $ | 23,349,613 | |
| | | | | | | | |
| Major Banks – 4.1% | | | | | | | | |
| BNP Paribas | | | 125,175 | | | $ | 7,417,797 | |
| Mitsubishi UFJ Financial Group, Inc. | | | 977,900 | | | | 5,285,161 | |
| UBS Group AG | | | 488,594 | | | | 6,171,793 | |
| | | | | | | | |
| | | | | | $ | 18,874,751 | |
| | | | | | | | |
| Medical & Health Technology & Services – 0.6% | | | | | |
| Sonic Healthcare Ltd. | | | 131,207 | | | $ | 2,647,142 | |
| | | | | | | | |
| Medical Equipment – 2.4% | | | | | | | | |
| EssilorLuxottica | | | 42,448 | | | $ | 6,465,971 | |
| Terumo Corp. | | | 134,000 | | | | 4,734,161 | |
| | | | | | | | |
| | | | | | $ | 11,200,132 | |
| | | | | | | | |
| Natural Gas – Distribution – 0.4% | | | | | | | | |
| China Resources Gas Group Ltd. | | | 344,000 | | | $ | 1,889,455 | |
| | | | | | | | |
| Natural Gas – Pipeline – 1.0% | | | | | | | | |
| APA Group | | | 333,575 | | | $ | 2,598,357 | |
| Enbridge, Inc. | | | 47,239 | | | | 1,878,210 | |
| | | | | | | | |
| | | | | | $ | 4,476,567 | |
| | | | | | | | |
| Network & Telecom – 0.4% | | | | | | | | |
| LM Ericsson Telephone Co., “B” | | | 224,256 | | | $ | 1,952,769 | |
| | | | | | | | |
| Other Banks & Diversified Financials – 6.8% | | | | | |
| AEON Financial Service Co. Ltd. | | | 224,800 | | | $ | 3,535,857 | |
| AIB Group PLC | | | 1,114,559 | | | | 3,883,124 | |
| Bank Rakyat Indonesia | | | 1,999,000 | | | | 633,575 | |
| HDFC Bank Ltd. | | | 223,053 | | | | 3,975,246 | |
| Intesa Sanpaolo S.p.A. | | | 2,204,121 | | | | 5,806,343 | |
| Julius Baer Group Ltd. | | | 105,364 | | | | 5,435,859 | |
| KBC Group N.V. | | | 64,335 | | | | 4,839,356 | |
| Mastercard, Inc., “A” | | | 10,614 | | | | 3,169,234 | |
| | | | | | | | |
| | | | | | $ | 31,278,594 | |
| | | | | | | | |
| Pharmaceuticals – 8.4% | | | | | | | | |
| Bayer AG | | | 82,190 | | | $ | 6,712,537 | |
| Kyowa Kirin Co. Ltd. | | | 103,200 | | | | 2,424,793 | |
| Novo Nordisk A.S., “B” | | | 150,442 | | | | 8,731,569 | |
| Roche Holding AG | | | 41,707 | | | | 13,531,719 | |
| Santen Pharmaceutical Co. Ltd. | | | 370,000 | | | | 7,054,764 | |
| | | | | | | | |
| | | | | | $ | 38,455,382 | |
| | | | | | | | |
| | | | | | | | |
| | |
| Issuer | | Shares/Par | | | Value ($) | |
| COMMON STOCKS – continued | | | | | | | | |
| Printing & Publishing – 1.7% | | | | | | | | |
| RELX PLC | | | 106,701 | | | $ | 2,688,159 | |
| Wolters Kluwer N.V. | | | 68,039 | | | | 4,962,284 | |
| | | | | | | | |
| | | | | | $ | 7,650,443 | |
| | | | | | | | |
| Real Estate – 2.3% | | | | | | | | |
| Grand City Properties S.A. | | | 221,232 | | | $ | 5,305,574 | |
| LEG Immobilien AG | | | 45,729 | | | | 5,414,104 | |
| | | | | | | | |
| | | | | | $ | 10,719,678 | |
| | | | | | | | |
| Restaurants – 0.7% | | | | | | | | |
| Yum China Holdings, Inc. | | | 66,054 | | | $ | 3,171,253 | |
| | | | | | | | |
| Specialty Chemicals – 8.7% | | | | | |
| Akzo Nobel N.V. | | | 65,931 | | | $ | 6,703,263 | |
| Croda International PLC | | | 80,409 | | | | 5,453,299 | |
| Kansai Paint Co. Ltd. | | | 99,800 | | | | 2,439,166 | |
| Linde PLC | | | 51,972 | | | | 11,123,066 | |
| Nitto Denko Corp. | | | 58,500 | | | | 3,282,145 | |
| Sika AG | | | 28,648 | | | | 5,382,970 | |
| Symrise AG | | | 50,103 | | | | 5,271,610 | |
| | | | | | | | |
| | | | | | $ | 39,655,519 | |
| | | | | | | | |
| Specialty Stores – 0.2% | | | | | | | | |
| Dufry AG | | | 9,981 | | | $ | 990,262 | |
| | | | | | | | |
| Telecommunications – Wireless – 3.3% | | | | | |
| Advanced Info Service Public Co. Ltd. | | | 350,900 | | | $ | 2,495,237 | |
| KDDI Corp. | | | 174,100 | | | | 5,179,439 | |
| SoftBank Corp. | | | 107,900 | | | | 4,697,590 | |
| Tele2 AB, “B” | | | 172,442 | | | | 2,501,107 | |
| | | | | | | | |
| | | | | | $ | 14,873,373 | |
| | | | | | | | |
| Telephone Services – 0.6% | | | | | |
| Hellenic Telecommunications Organization S.A. | | | 167,248 | | | $ | 2,675,206 | |
| | | | | | | | |
| Tobacco – 2.1% | | | | | | | | |
| British American Tobacco PLC | | | 152,030 | | | $ | 6,507,559 | |
| Japan Tobacco, Inc. | | | 136,300 | | | | 3,038,550 | |
| | | | | | | | |
| | | | | | $ | 9,546,109 | |
| | | | | | | | |
| Trucking – 0.3% | | | | | | | | |
| Yamato Holdings Co. Ltd. | | | 89,800 | | | $ | 1,535,679 | |
| | | | | | | | |
| Utilities – Electric Power – 2.4% | | | | | |
| CLP Holdings Ltd. | | | 314,000 | | | $ | 3,300,258 | |
| Iberdrola S.A. | | | 522,105 | | | | 5,376,222 | |
| Orsted A.S. | | | 20,794 | | | | 2,150,614 | |
| | | | | | | | |
| | | | | | $ | 10,827,094 | |
| | | | | | | | |
Total Common Stocks
(Identified Cost, $383,733,986) | | | | | | $ | 453,447,157 | |
| | | | | | | | |
| |
| INVESTMENT COMPANIES (h) – 0.6% | | | | | |
| Money Market Funds – 0.6% | | | | | |
| MFS Institutional Money Market Portfolio, 1.7% (v) (Identified Cost, $2,690,556) | | | 2,690,276 | | | $ | 2,690,276 | |
| | | | | | | | |
OTHER ASSETS, LESS
LIABILITIES – 0.1% | | | | | | | 598,388 | |
| | | | | | | | |
| NET ASSETS – 100.0% | | | | | | $ | 456,735,821 | |
| | | | | | | | |
8
MFS Research International Portfolio
Portfolio of Investments – continued
| (a) | | Non-income producing security. |
| (h) | | An affiliated issuer, which may be considered one in which the fund owns 5% or more of the outstanding voting securities, or a company which is under common control. At period end, the aggregate values of the fund’s investments in affiliated issuers and in unaffiliated issuers were $2,690,276 and $453,447,157, respectively. |
| (v) | | Affiliated issuer that is available only to investment companies managed by MFS. The rate quoted for the MFS Institutional Money Market Portfolio is the annualizedseven-day yield of the fund at period end. |
The following abbreviations are used in this report and are defined:
| ADR | | American Depositary Receipt |
See Notes to Financial Statements
9
MFS Research International Portfolio
FINANCIAL STATEMENTS | STATEMENT OF ASSETS AND LIABILITIES
This statement represents your fund’s balance sheet, which details the assets and liabilities comprising the total value of the fund.
| | | | |
At 12/31/19 | | | | |
| |
Assets | | | | |
Investments in unaffiliated issuers, at value (identified cost, $383,733,986) | | | $453,447,157 | |
Investments in affiliated issuers, at value (identified cost, $2,690,556) | | | 2,690,276 | |
Foreign currency, at value (identified cost, $627,858) | | | 631,260 | |
Receivables for | | | | |
Investments sold | | | 169,749 | |
Fund shares sold | | | 32,027 | |
Interest and dividends | | | 1,549,489 | |
Other assets | | | 2,374 | |
Total assets | | | $458,522,332 | |
| |
Liabilities | | | | |
Payables for | | | | |
Investments purchased | | | $879,050 | |
Fund shares reacquired | | | 599,617 | |
Payable to affiliates | | | | |
Investment adviser | | | 11,553 | |
Administrative services fee | | | 373 | |
Shareholder servicing costs | | | 30 | |
Distribution and/or service fees | | | 1,379 | |
Payable for independent Trustees’ compensation | | | 34 | |
Deferred country tax expense payable | | | 138,731 | |
Accrued expenses and other liabilities | | | 155,744 | |
Total liabilities | | | $1,786,511 | |
Net assets | | | $456,735,821 | |
| |
Net assets consist of | | | | |
Paid-in capital | | | $365,700,299 | |
Total distributable earnings (loss) | | | 91,035,522 | |
Net assets | | | $456,735,821 | |
Shares of beneficial interest outstanding | | | 27,010,859 | |
| | | | | | | | | | | | |
| | | |
| | | Net assets | | | Shares
outstanding | | | Net asset value
per share | |
Initial Class | | | $356,291,281 | | | | 21,011,386 | | | | $16.96 | |
Service Class | | | 100,444,540 | | | | 5,999,473 | | | | 16.74 | |
See Notes to Financial Statements
10
MFS Research International Portfolio
FINANCIAL STATEMENTS | STATEMENT OF OPERATIONS
This statement describes how much your fund earned in investment income and accrued in expenses. It also describes any gains and/or losses generated by fund operations.
| | | | |
Year ended 12/31/19 | | | | |
| |
Net investment income (loss) | | | | |
Income | | | | |
Dividends | | | $13,103,767 | |
Dividends from affiliated issuers | | | 76,164 | |
Income on securities loaned | | | 11,358 | |
Other | | | 2,321 | |
Foreign taxes withheld | | | (1,129,683 | ) |
Total investment income | | | $12,063,927 | |
Expenses | | | | |
Management fee | | | $3,698,431 | |
Distribution and/or service fees | | | 187,166 | |
Shareholder servicing costs | | | 7,979 | |
Administrative services fee | | | 65,831 | |
Independent Trustees’ compensation | | | 10,462 | |
Custodian fee | | | 134,108 | |
Shareholder communications | | | 37,256 | |
Audit and tax fees | | | 62,881 | |
Legal fees | | | 3,530 | |
Miscellaneous | | | 33,473 | |
Total expenses | | | $4,241,117 | |
Reduction of expenses by investment adviser | | | (104,480 | ) |
Net expenses | | | $4,136,637 | |
Net investment income (loss) | | | $7,927,290 | |
| |
Realized and unrealized gain (loss) | | | | |
Realized gain (loss) (identified cost basis) | | | | |
Unaffiliated issuers (net of $40,589 country tax) | | | $14,224,846 | |
Affiliated issuers | | | 2,880 | |
Foreign currency | | | (40,633 | ) |
Net realized gain (loss) | | | $14,187,093 | |
Change in unrealized appreciation or depreciation | | | | |
Unaffiliated issuers (net of $116,279 increase in deferred country tax) | | | $78,758,011 | |
Affiliated issuers | | | 100 | |
Translation of assets and liabilities in foreign currencies | | | 18,257 | |
Net unrealized gain (loss) | | | $78,776,368 | |
Net realized and unrealized gain (loss) | | | $92,963,461 | |
Change in net assets from operations | | | $100,890,751 | |
See Notes to Financial Statements
11
MFS Research International Portfolio
FINANCIAL STATEMENTS | STATEMENTS OF CHANGES IN NET ASSETS
These statements describe the increases and/or decreases in net assets resulting from operations, any distributions, and any shareholder transactions.
| | | | | | | | |
| | | Year ended | |
| | | 12/31/19 | | | 12/31/18 | |
Change in net assets | | | | | | | | |
| | |
From operations | | | | | | | | |
Net investment income (loss) | | | $7,927,290 | | | | $5,966,858 | |
Net realized gain (loss) | | | 14,187,093 | | | | 17,686,976 | |
Net unrealized gain (loss) | | | 78,776,368 | | | | (82,712,215 | ) |
Change in net assets from operations | | | $100,890,751 | | | | $(59,058,381 | ) |
Total distributions to shareholders | | | $(23,093,143 | ) | | | $(16,070,335 | ) |
Change in net assets from fund share transactions | | | $9,763,597 | | | | $22,056,598 | |
Total change in net assets | | | $87,561,205 | | | | $(53,072,118 | ) |
| | |
Net assets | | | | | | | | |
At beginning of period | | | 369,174,616 | | | | 422,246,734 | |
At end of period | | | $456,735,821 | | | | $369,174,616 | |
See Notes to Financial Statements
12
MFS Research International Portfolio
FINANCIAL STATEMENTS | FINANCIAL HIGHLIGHTS
The financial highlights table is intended to help you understand the fund’s financial performance for the past 5 years. Certain information reflects financial results for a single fund share. The total returns in the table represent the rate that an investor would have earned (or lost) on an investment in the fund share class (assuming reinvestment of all distributions) held for the entire period.
| | | | | | | | | | | | | | | | | | | | |
| Initial Class | | Year ended | |
| | | | | |
| | | 12/31/19 | | | 12/31/18 | | | 12/31/17 | | | 12/31/16 | | | 12/31/15 | |
| | | | | |
Net asset value, beginning of period | | | $14.07 | | | | $17.05 | | | | $13.54 | | | | $13.85 | | | | $14.56 | |
| | | | | |
| Income (loss) from investment operations | | | | | | | | | | | | | | | | | | | | |
Net investment income (loss) (d) | | | $0.31 | | | | $0.25 | | | | $0.22 | | | | $0.25 | (c) | | | $0.24 | |
Net realized and unrealized gain (loss) | | | 3.51 | | | | (2.56 | ) | | | 3.59 | | | | (0.34 | ) | | | (0.52 | ) |
Total from investment operations | | | $3.82 | | | | $(2.31 | ) | | | $3.81 | | | | $(0.09 | ) | | | $(0.28 | ) |
| | | | | |
| Less distributions declared to shareholders | | | | | | | | | | | | | | | | | | | | |
From net investment income | | | $(0.24 | ) | | | $(0.25 | ) | | | $(0.30 | ) | | | $(0.22 | ) | | | $(0.30 | ) |
From net realized gain | | | (0.69 | ) | | | (0.42 | ) | | | — | | | | — | | | | (0.13 | ) |
Total distributions declared to shareholders | | | $(0.93 | ) | | | $(0.67 | ) | | | $(0.30 | ) | | | $(0.22 | ) | | | $(0.43 | ) |
Net asset value, end of period (x) | | | $16.96 | | | | $14.07 | | | | $17.05 | | | | $13.54 | | | | $13.85 | |
Total return (%) (k)(r)(s)(x) | | | 28.04 | | | | (14.12 | ) | | | 28.29 | | | | (0.70 | )(c) | | | (1.96 | ) |
| | | | | |
Ratios (%) (to average net assets)
and Supplemental data: | | | | | | | | | | | | | | | | | | | | |
Expenses before expense reductions (f) | | | 0.99 | | | | 0.98 | | | | 1.00 | | | | 0.95 | (c) | | | 1.00 | |
Expenses after expense reductions (f) | | | 0.96 | | | | 0.97 | | | | 0.99 | | | | 0.94 | (c) | | | 1.00 | |
Net investment income (loss) | | | 1.99 | | | | 1.51 | | | | 1.44 | | | | 1.87 | (c) | | | 1.61 | |
Portfolio turnover | | | 24 | | | | 25 | | | | 27 | | | | 41 | | | | 38 | |
Net assets at end of period (000 omitted) | | | $356,291 | | | | $302,386 | | | | $341,613 | | | | $318,753 | | | | $305,502 | |
| |
| Service Class | | Year ended | |
| | | | | |
| | | 12/31/19 | | | 12/31/18 | | | 12/31/17 | | | 12/31/16 | | | 12/31/15 | |
| | | | | |
Net asset value, beginning of period | | | $13.90 | | | | $16.84 | | | | $13.38 | | | | $13.68 | | | | $14.39 | |
| | | | | |
| Income (loss) from investment operations | | | | | | | | | | | | | | | | | | | | |
Net investment income (loss) (d) | | | $0.26 | | | | $0.21 | | | | $0.19 | | | | $0.21 | (c) | | | $0.20 | |
Net realized and unrealized gain (loss) | | | 3.47 | | | | (2.53 | ) | | | 3.52 | | | | (0.33 | ) | | | (0.51 | ) |
Total from investment operations | | | $3.73 | | | | $(2.32 | ) | | | $3.71 | | | | $(0.12 | ) | | | $(0.31 | ) |
| | | | | |
| Less distributions declared to shareholders | | | | | | | | | | | | | | | | | | | | |
From net investment income | | | $(0.20 | ) | | | $(0.20 | ) | | | $(0.25 | ) | | | $(0.18 | ) | | | $(0.27 | ) |
From net realized gain | | | (0.69 | ) | | | (0.42 | ) | | | — | | | | — | | | | (0.13 | ) |
Total distributions declared to shareholders | | | $(0.89 | ) | | | $(0.62 | ) | | | $(0.25 | ) | | | $(0.18 | ) | | | $(0.40 | ) |
Net asset value, end of period (x) | | | $16.74 | | | | $13.90 | | | | $16.84 | | | | $13.38 | | | | $13.68 | |
Total return (%) (k)(r)(s)(x) | | | 27.67 | | | | (14.32 | ) | | | 27.90 | | | | (0.91 | )(c) | | | (2.20 | ) |
| | | | | |
Ratios (%) (to average net assets)
and Supplemental data: | | | | | | | | | | | | | | | | | | | | |
Expenses before expense reductions (f) | | | 1.24 | | | | 1.23 | | | | 1.25 | | | | 1.20 | (c) | | | 1.25 | |
Expenses after expense reductions (f) | | | 1.21 | | | | 1.22 | | | | 1.24 | | | | 1.19 | (c) | | | 1.25 | |
Net investment income (loss) | | | 1.65 | | | | 1.27 | | | | 1.26 | | | | 1.58 | (c) | | | 1.36 | |
Portfolio turnover | | | 24 | | | | 25 | | | | 27 | | | | 41 | | | | 38 | |
Net assets at end of period (000 omitted) | | | $100,445 | | | | $66,789 | | | | $80,634 | | | | $83,138 | | | | $97,958 | |
See Notes to Financial Statements
13
MFS Research International Portfolio
Financial Highlights – continued
| (c) | Amount reflects aone-time reimbursement of expenses by the custodian (or former custodian) without which net investment income and performance would be lower and expenses would be higher. |
| (d) | Per share data is based on average shares outstanding. |
| (f) | Ratios do not reflect reductions from fees paid indirectly, if applicable. |
| (k) | The total return does not reflect expenses that apply to separate accounts. Inclusion of these charges would reduce the total return figures for all periods shown. |
| (r) | Certain expenses have been reduced without which performance would have been lower. |
| (s) | From time to time the fund may receive proceeds from litigation settlements, without which performance would be lower. |
| (x) | The net asset values and total returns have been calculated on net assets which include adjustments made in accordance with U.S. generally accepted accounting principles required at period end for financial reporting purposes. |
See Notes to Financial Statements
14
MFS Research International Portfolio
NOTES TO FINANCIAL STATEMENTS
| (1) | | Business and Organization |
MFS Research International Portfolio (the fund) is a diversified series of MFS Variable Insurance Trust II (the trust). The trust is organized as a Massachusetts business trust and is registered under the Investment Company Act of 1940, as amended, as anopen-end management investment company. The shareholders of each series of the trust are separate accounts of insurance companies, which offer variable annuity and/or life insurance products, and qualified retirement and pension plans.
The fund is an investment company and accordingly follows the investment company accounting and reporting guidance of the Financial Accounting Standards Board (FASB) Accounting Standards Codification Topic 946 Financial Services – Investment Companies.
| (2) | | Significant Accounting Policies |
General– The preparation of financial statements in conformity with U.S. generally accepted accounting principles requires management to make estimates and assumptions that affect the reported amounts of assets and liabilities, and disclosure of contingent assets and liabilities at the date of the financial statements and the reported amounts of increases and decreases in net assets from operations during the reporting period. Actual results could differ from those estimates. In the preparation of these financial statements, management has evaluated subsequent events occurring after the date of the fund’s Statement of Assets and Liabilities through the date that the financial statements were issued. The fund invests in foreign securities. Investments in foreign securities are vulnerable to the effects of changes in the relative values of the local currency and the U.S. dollar and to the effects of changes in each country’s market, economic, industrial, political, regulatory, geopolitical, and other conditions.
Balance Sheet Offsetting– The fund’s accounting policy with respect to balance sheet offsetting is that, absent an event of default by the counterparty or a termination of the agreement, the International Swaps and Derivatives Association (ISDA) Master Agreement, or similar agreement, does not result in an offset of reported amounts of financial assets and financial liabilities in the Statement of Assets and Liabilities across transactions between the fund and the applicable counterparty. The fund’s right to setoff may be restricted or prohibited by the bankruptcy or insolvency laws of the particular jurisdiction to which a specific master netting agreement counterparty is subject. Balance sheet offsetting disclosures, to the extent applicable to the fund, have been included in the fund’s Significant Accounting Policies note under the captions for each of the fund’sin-scope financial instruments and transactions.
Investment Valuations– Equity securities, including restricted equity securities, are generally valued at the last sale or official closing price on their primary market or exchange as provided by a third-party pricing service. Equity securities, for which there were no sales reported that day, are generally valued at the last quoted daily bid quotation on their primary market or exchange as provided by a third-party pricing service. Short-term instruments with a maturity at issuance of 60 days or less may be valued at amortized cost, which approximates market value.Open-end investment companies are generally valued at net asset value per share. Securities and other assets generally valued on the basis of information from a third-party pricing service may also be valued at a broker/dealer bid quotation. In determining values, third-party pricing services can utilize both transaction data and market information such as yield, quality, coupon rate, maturity, type of issue, trading characteristics, and other market data. The values of foreign securities and other assets and liabilities expressed in foreign currencies are converted to U.S. dollars using the mean of bid and asked prices for rates provided by a third-party pricing service.
The Board of Trustees has delegated primary responsibility for determining or causing to be determined the value of the fund’s investments (including any fair valuation) to the adviser pursuant to valuation policies and procedures approved by the Board. If the adviser determines that reliable market quotations are not readily available, investments are valued at fair value as determined in good faith by the adviser in accordance with such procedures under the oversight of the Board of Trustees. Under the fund’s valuation policies and procedures, market quotations are not considered to be readily available for most types of debt instruments and floating rate loans and many types of derivatives. These investments are generally valued at fair value based on information from third-party pricing services. In addition, investments may be valued at fair value if the adviser determines that an investment’s value has been materially affected by events occurring after the close of the exchange or market on which the investment is principally traded (such as foreign exchange or market) and prior to the determination of the fund’s net asset value, or after the halt of trading of a specific security where trading does not resume prior to the close of the exchange or market on which the security is principally traded. Events that occur after foreign markets close (such as developments in foreign markets and significant movements in the U.S. markets) and prior to the determination of the fund’s net asset value may be deemed to have a material effect on the value of securities traded in foreign markets. Accordingly, the fund’s foreign equity securities may often be valued at fair value. The adviser generally relies on third-party pricing services or other information (such as the correlation with price movements of similar securities in the same or other markets; the type, cost and investment characteristics of the security; the business and financial condition of the issuer; and trading and other market data) to assist in determining whether to fair value and at what value to fair value an investment. The value of an investment for purposes of calculating the fund’s net asset value can differ depending on the source and method used to determine value. When fair valuation is used, the value of an investment used to determine the fund’s net asset
15
MFS Research International Portfolio
Notes to Financial Statements – continued
value may differ from quoted or published prices for the same investment. There can be no assurance that the fund could obtain the fair value assigned to an investment if it were to sell the investment at the same time at which the fund determines its net asset value per share.
Various inputs are used in determining the value of the fund’s assets or liabilities. These inputs are categorized into three broad levels. In certain cases, the inputs used to measure fair value may fall into different levels of the fair value hierarchy. In such cases, an investment’s level within the fair value hierarchy is based on the lowest level of input that is significant to the fair value measurement. The fund’s assessment of the significance of a particular input to the fair value measurement in its entirety requires judgment, and considers factors specific to the investment. Level 1 includes unadjusted quoted prices in active markets for identical assets or liabilities. Level 2 includes other significant observable market-based inputs (including quoted prices for similar securities, interest rates, prepayment speed, and credit risk). Level 3 includes unobservable inputs, which may include the adviser’s own assumptions in determining the fair value of investments. The following is a summary of the levels used as of December 31, 2019 in valuing the fund’s assets or liabilities:
| | | | | | | | | | | | | | | | |
| Financial Instruments | | Level 1 | | | Level 2 | | | Level 3 | | | Total | |
| Equity Securities: | | | | | | | | | | | | | | | | |
Japan | | | $2,743,500 | | | | $85,287,052 | | | | $— | | | | $88,030,552 | |
Switzerland | | | 62,917,025 | | | | — | | | | — | | | | 62,917,025 | |
France | | | 53,558,452 | | | | — | | | | — | | | | 53,558,452 | |
United Kingdom | | | 35,152,861 | | | | — | | | | — | | | | 35,152,861 | |
Germany | | | 34,707,129 | | | | — | | | | — | | | | 34,707,129 | |
United States | | | 27,317,754 | | | | — | | | | — | | | | 27,317,754 | |
Hong Kong | | | 20,270,890 | | | | — | | | | — | | | | 20,270,890 | |
Australia | | | 16,684,472 | | | | — | | | | — | | | | 16,684,472 | |
Netherlands | | | 14,112,757 | | | | — | | | | — | | | | 14,112,757 | |
Other Countries | | | 94,786,698 | | | | 5,908,567 | | | | — | | | | 100,695,265 | |
| Mutual Funds | | | 2,690,276 | | | | — | | | | — | | | | 2,690,276 | |
| Total | | | $364,941,814 | | | | $91,195,619 | | | | $— | | | | $456,137,433 | |
For further information regarding security characteristics, see the Portfolio of Investments.
Foreign Currency Translation– Purchases and sales of foreign investments, income, and expenses are converted into U.S. dollars based upon currency exchange rates prevailing on the respective dates of such transactions or on the reporting date for foreign denominated receivables and payables. Gains and losses attributable to foreign currency exchange rates on sales of securities are recorded for financial statement purposes as net realized gains and losses on investments. Gains and losses attributable to foreign exchange rate movements on receivables, payables, income and expenses are recorded for financial statement purposes as foreign currency transaction gains and losses. That portion of both realized and unrealized gains and losses on investments that results from fluctuations in foreign currency exchange rates is not separately disclosed.
Security Loans– Under its Securities Lending Agency Agreement with the fund, State Street Bank and Trust Company, as lending agent, loans the securities of the fund to certain qualified institutions (the “Borrowers”) approved by the fund. Security loans can be terminated at the discretion of either the lending agent or the fund and the related securities must be returned within the earlier of the standard trade settlement period for such securities or within three business days. The loans are collateralized by cash and/or U.S. Treasury and federal agency obligations in an amount typically at least equal to the market value of the securities loaned. On loans collateralized by cash, the cash collateral is invested in a money market fund. The market value of the loaned securities is determined at the close of business of the fund and any additional required collateral is delivered to the fund on the next business day. The lending agent provides the fund with indemnification against Borrower default. In the event of Borrower default, the lending agent will, for the benefit of the fund, either purchase securities identical to those loaned or, when such purchase is commercially impracticable, pay the fund the market value of the loaned securities. In return, the lending agent assumes the fund’s rights to the related collateral. If the collateral value is less than the cost to purchase identical securities, the lending agent is responsible for the shortfall, but only to the extent that such shortfall is not due to a decline in collateral value resulting from collateral reinvestment for which the fund bears the risk of loss. A portion of the income generated upon investment of the collateral is remitted to the Borrowers, and the remainder is allocated between the fund and the lending agent. On loans collateralized by U.S. Treasury and/or federal agency obligations, a fee is received from the Borrower, and is allocated between the fund and the lending agent. Income from securities lending is separately reported in the Statement of Operations. The dividend and interest income earned on the securities loaned is accounted for in the same manner as other dividend and interest income. At December 31, 2019, there were no securities on loan or collateral outstanding.
Indemnifications– Under the fund’s organizational documents, its officers and Trustees may be indemnified against certain liabilities and expenses arising out of the performance of their duties to the fund. Additionally, in the normal course of business, the
16
MFS Research International Portfolio
Notes to Financial Statements – continued
fund enters into agreements with service providers that may contain indemnification clauses. The fund’s maximum exposure under these agreements is unknown as this would involve future claims that may be made against the fund that have not yet occurred.
Investment Transactions and Income– Investment transactions are recorded on the trade date. Dividends received in cash are recorded on theex-dividend date. Certain dividends from foreign securities will be recorded when the fund is informed of the dividend if such information is obtained subsequent to theex-dividend date. Dividend payments received in additional securities are recorded on theex-dividend date in an amount equal to the value of the security on such date.
The fund may receive proceeds from litigation settlements. Any proceeds received from litigation involving portfolio holdings are reflected in the Statement of Operations in realized gain/loss if the security has been disposed of by the fund or in unrealized gain/loss if the security is still held by the fund. Any other proceeds from litigation not related to portfolio holdings are reflected as other income in the Statement of Operations.
Tax Matters and Distributions– The fund intends to qualify as a regulated investment company, as defined under Subchapter M of the Internal Revenue Code, and to distribute all of its taxable income, including realized capital gains. As a result, no provision for federal income tax is required. The fund’s federal tax returns, when filed, will remain subject to examination by the Internal Revenue Service for a three year period. Management has analyzed the fund’s tax positions taken on federal and state tax returns for all open tax years and does not believe that there are any uncertain tax positions that require recognition of a tax liability. Foreign taxes, if any, have been accrued by the fund in the accompanying financial statements in accordance with the applicable foreign tax law. Foreign income taxes may be withheld by certain countries in which the fund invests. Additionally, capital gains realized by the fund on securities issued in or by certain foreign countries may be subject to capital gains tax imposed by those countries.
Distributions to shareholders are recorded on theex-dividend date. Income and capital gain distributions are determined in accordance with income tax regulations, which may differ from U.S. generally accepted accounting principles. Certain capital accounts in the financial statements are periodically adjusted for permanent differences in order to reflect their tax character. These adjustments have no impact on net assets or net asset value per share. Temporary differences which arise from recognizing certain items of income, expense, gain or loss in different periods for financial statement and tax purposes will reverse at some time in the future.
Book/tax differences primarily relate to passive foreign investment companies and wash sale loss deferrals.
The tax character of distributions declared to shareholders for the last two fiscal years is as follows:
| | | | | | | | |
| | | Year ended
12/31/19 | | | Year ended
12/31/18 | |
| Ordinary income (including any short-term capital gains) | | | $5,844,027 | | | | $10,715,230 | |
| Long-term capital gains | | | 17,249,116 | | | | 5,355,105 | |
| Total distributions | | | $23,093,143 | | | | $16,070,335 | |
The federal tax cost and the tax basis components of distributable earnings were as follows:
| | | | |
| As of 12/31/19 | | | | |
| |
| Cost of investments | | | $387,463,967 | |
| Gross appreciation | | | 86,609,117 | |
| Gross depreciation | | | (17,935,651 | ) |
| Net unrealized appreciation (depreciation) | | | $68,673,466 | |
| |
| Undistributed ordinary income | | | 8,551,564 | |
| Undistributed long-term capital gain | | | 13,852,333 | |
| Other temporary differences | | | (41,841 | ) |
Multiple Classes of Shares of Beneficial Interest– The fund offers multiple classes of shares, which differ in their respective distribution and/or service fees. The fund’s income, realized and unrealized gain (loss), and common expenses are allocated to shareholders based on the daily net assets of each class. Dividends are declared separately for each class. Differences in per share dividend rates are generally due to differences in separate class expenses. The fund’s distributions declared to shareholders as reported in the Statements of Changes in Net Assets are presented by class as follows:
| | | | | | | | |
| | |
| | | Year ended
12/31/19 | | | Year ended
12/31/18 | |
| Initial Class | | | $19,244,674 | | | | $13,435,679 | |
| Service Class | | | 3,848,469 | | | | 2,634,656 | |
| Total | | | $23,093,143 | | | | $16,070,335 | |
17
MFS Research International Portfolio
Notes to Financial Statements – continued
| (3) | | Transactions with Affiliates |
Investment Adviser– The fund has an investment advisory agreement with MFS to provide overall investment management and related administrative services and facilities to the fund. The management fee is computed daily and paid monthly at the following annual rates based on the fund’s average daily net assets:
| | | | |
| Up to $1 billion | | | 0.90% | |
| In excess of $1 billion and up to $2 billion | | | 0.80% | |
| In excess of $2 billion | | | 0.70% | |
MFS has agreed in writing to reduce its management fee by a specified amount if certain MFS mutual fund assets exceed thresholds agreed to by MFS and the fund’s Board of Trustees. For the year ended December 31, 2019, this management fee reduction amounted to $40,103, which is included in the reduction of total expenses in the Statement of Operations. The management fee incurred for the year ended December 31, 2019 was equivalent to an annual effective rate of 0.89% of the fund’s average daily net assets.
The investment adviser has agreed in writing to pay a portion of the fund’s total annual operating expenses, excluding interest, taxes, extraordinary expenses, brokerage and transaction costs, and investment-related expenses, such that total annual operating expenses do not exceed 0.96% of average daily net assets for the Initial Class shares and 1.21% of average daily net assets for the Service Class shares. This written agreement will continue until modified by the fund’s Board of Trustees, but such agreement will continue at least until April 30, 2021. For the year ended December 31, 2019, this reduction amounted to $64,377, which is included in the reduction of total expenses in the Statement of Operations.
Distributor– MFS Fund Distributors, Inc. (MFD), a wholly-owned subsidiary of MFS, is the distributor of shares of the fund. The Trustees have adopted a distribution plan for the Service Class shares pursuant to Rule12b-1 under the Investment Company Act of 1940.
The fund’s distribution plan provides that the fund will pay MFD distribution and/or service fees equal to 0.25% per annum of its average daily net assets attributable to Service Class shares as partial consideration for services performed and expenses incurred by MFD and financial intermediaries (including participating insurance companies that invest in the fund to fund variable annuity and variable life insurance contracts, sponsors of qualified retirement and pension plans that invest in the fund, and affiliates of these participating insurance companies and plan sponsors) in connection with the sale and distribution of the Service Class shares. MFD may subsequently pay all, or a portion, of the distribution and/or service fees to financial intermediaries.
Shareholder Servicing Agent– MFS Service Center, Inc. (MFSC), a wholly-owned subsidiary of MFS, receives a fee from the fund for its services as shareholder servicing agent. For the year ended December 31, 2019, the fee was $7,166, which equated to 0.0017% annually of the fund’s average daily net assets. MFSC also receives payment from the fund forout-of-pocket expenses paid by MFSC on behalf of the fund. For the year ended December 31, 2019, these costs amounted to $813.
Administrator– MFS provides certain financial, legal, shareholder communications, compliance, and other administrative services to the fund. Under an administrative services agreement, the fund reimburses MFS the costs incurred to provide these services. The fund is charged an annual fixed amount of $17,500 plus a fee based on average daily net assets. The administrative services fee incurred for the year ended December 31, 2019 was equivalent to an annual effective rate of 0.0160% of the fund’s average daily net assets.
Trustees’ and Officers’ Compensation– The fund pays compensation to independent Trustees in the form of a retainer, attendance fees, and additional compensation to Board and Committee chairpersons. The fund does not pay compensation directly to Trustees or officers of the fund who are also officers of the investment adviser, all of whom receive remuneration from MFS for their services to the fund. Certain officers and Trustees of the fund are officers or directors of MFS, MFD, and MFSC.
Other– This fund and certain other funds managed by MFS (the funds) had entered into a service agreement (the ISO Agreement) which provided for payment of fees solely by the funds to Tarantino LLC in return for the provision of services of an Independent Senior Officer (ISO) for the funds. Frank L. Tarantino served as the ISO and was an officer of the funds and the sole member of Tarantino LLC. Effective June 30, 2019, Mr. Tarantino retired from his position as ISO for the funds, and the ISO Agreement was terminated. For the year ended December 31, 2019, the fee paid by the fund under this agreement was $469 and is included in “Miscellaneous” expense in the Statement of Operations. MFS had agreed to bear all expenses associated with office space, other administrative support, and supplies provided to the ISO.
The fund invests in the MFS Institutional Money Market Portfolio which is managed by MFS and seeks current income consistent with preservation of capital and liquidity. This money market fund does not pay a management fee to MFS.
The fund is permitted to engage in purchase and sale transactions with funds and accounts for which MFS serves as investment adviser orsub-adviser (“cross-trades”) pursuant to a policy adopted by the Board of Trustees. This policy has been designed to ensure that cross-trades conducted by the fund comply with Rule17a-7 under the Investment Company Act of 1940. During the
18
MFS Research International Portfolio
Notes to Financial Statements – continued
year ended December 31, 2019, the fund engaged in purchase and sale transactions pursuant to this policy, which amounted to $638,380 and $217,208, respectively. The sales transactions resulted in net realized gains (losses) of $77,878.
For the year ended December 31, 2019, purchases and sales of investments, other than short-term obligations, aggregated $97,482,927 and $100,056,180, respectively.
| (5) | | Shares of Beneficial Interest |
The fund’s Declaration of Trust permits the Trustees to issue an unlimited number of full and fractional shares of beneficial interest. Transactions in fund shares were as follows:
| | | | | | | | | | | | | | | | |
| | | Year ended 12/31/19 | | �� | Year ended 12/31/18 | |
| | | | |
| | | Shares | | | Amount | | | Shares | | | Amount | |
| Shares sold | | | | | | | | | | | | | | | | |
Initial Class | | | 1,441,948 | | | | $22,641,397 | | | | 2,518,504 | | | | $40,932,805 | |
Service Class | | | 1,882,650 | | | | 30,008,553 | | | | 915,577 | | | | 14,411,304 | |
| | | 3,324,598 | | | | $52,649,950 | | | | 3,434,081 | | | | $55,344,109 | |
| | | | |
| Shares issued to shareholders in reinvestment of distributions | | | | | | | | | | | | | | | | |
Initial Class | | | 1,288,994 | | | | $19,244,674 | | | | 816,759 | | | | $13,435,679 | |
Service Class | | | 260,913 | | | | 3,848,469 | | | | 161,933 | | | | 2,634,656 | |
| | | 1,549,907 | | | | $23,093,143 | | | | 978,692 | | | | $16,070,335 | |
| | | | |
| Shares reacquired | | | | | | | | | | | | | | | | |
Initial Class | | | (3,206,510 | ) | | | $(51,132,710 | ) | | | (1,888,605 | ) | | | $(31,993,445 | ) |
Service Class | | | (948,381 | ) | | | (14,846,786 | ) | | | (1,061,519 | ) | | | (17,364,401 | ) |
| | | (4,154,891 | ) | | | $(65,979,496 | ) | | | (2,950,124 | ) | | | $(49,357,846 | ) |
| | | | |
| Net change | | | | | | | | | | | | | | | | |
Initial Class | | | (475,568 | ) | | | $(9,246,639 | ) | | | 1,446,658 | | | | $22,375,039 | |
Service Class | | | 1,195,182 | | | | 19,010,236 | | | | 15,991 | | | | (318,441 | ) |
| | | 719,614 | | | | $9,763,597 | | | | 1,462,649 | | | | $22,056,598 | |
The fund is one of several mutual funds in which certain MFS funds may invest. The MFS funds do not invest in the underlying funds for the purpose of exercising management or control. At the end of the period, the MFS Moderate Allocation Portfolio, the MFS Growth Allocation Portfolio, and the MFS Conservative Allocation Portfolio were the owners of record of approximately 22%, 7%, and 4%, respectively, of the value of outstanding voting shares of the fund.
The fund and certain other funds managed by MFS participate in a $1.25 billion unsecured committed line of credit, subject to a $1 billion sublimit, provided by a syndicate of banks under a credit agreement. Borrowings may be made for temporary financing needs. Interest is charged to each fund, based on its borrowings, generally at a rate equal to the highest of one month LIBOR, the Federal Funds Effective Rate and the Overnight Bank Funding Rate, plus an agreed upon spread. A commitment fee, based on the average daily, unused portion of the committed line of credit, is allocated among the participating funds. In addition, the fund and other funds managed by MFS have established unsecured uncommitted borrowing arrangements with certain banks for temporary financing needs. Interest is charged to each fund, based on its borrowings, at rates equal to customary reference rates plus an agreed upon spread. For the year ended December 31, 2019, the fund’s commitment fee and interest expense were $2,207 and $0, respectively, and are included in “Miscellaneous” expense in the Statement of Operations.
| (7) | | Investments in Affiliated Issuers |
An affiliated issuer may be considered one in which the fund owns 5% or more of the outstanding voting securities, or a company which is under common control. For the purposes of this report, the following were affiliated issuers:
| | | | | | | | | | | | | | | | | | | | | | | | |
| Affiliated Issuers | | Beginning
Value | | | Purchases | | | Sales
Proceeds | | | Realized
Gain
(Loss) | | | Change in
Unrealized
Appreciation or
Depreciation | | | Ending
Value | |
| MFS Institutional Money Market Portfolio | | | $5,381,057 | | | | $89,075,386 | | | | $91,769,147 | | | | $2,880 | | | | $100 | | | | $2,690,276 | |
| | | | | | |
| Affiliated Issuers | | | | | | | | | | | | | | Dividend
Income | | | Capital Gain
Distributions | |
| MFS Institutional Money Market Portfolio | | | | | | | | | | | | | | | | | | | $76,164 | | | | $— | |
19
MFS Research International Portfolio
REPORT OF INDEPENDENT REGISTERED PUBLIC ACCOUNTING FIRM
To the Board of Trustees of MFS Variable Insurance Trust II and the Shareholders of
MFS Research International Portfolio:
Opinion on the Financial Statements and Financial Highlights
We have audited the accompanying statement of assets and liabilities of MFS Research International Portfolio (the “Fund”), including the portfolio of investments, as of December 31, 2019, the related statement of operations for the year then ended, the statements of changes in net assets for each of the two years in the period then ended, the financial highlights for each of the five years in the period then ended, and the related notes. In our opinion, the financial statements and financial highlights present fairly, in all material respects, the financial position of the Fund as of December 31, 2019, and the results of its operations for the year then ended, the changes in its net assets for each of the two years in the period then ended, and the financial highlights for each of the five years in the period then ended, in conformity with accounting principles generally accepted in the United States of America.
Basis for Opinion
These financial statements and financial highlights are the responsibility of the Fund’s management. Our responsibility is to express an opinion on the Fund’s financial statements and financial highlights based on our audits. We are a public accounting firm registered with the Public Company Accounting Oversight Board (United States) (PCAOB) and are required to be independent with respect to the Fund in accordance with the U.S. federal securities laws and the applicable rules and regulations of the Securities and Exchange Commission and the PCAOB.
We conducted our audits in accordance with the standards of the PCAOB. Those standards require that we plan and perform the audit to obtain reasonable assurance about whether the financial statements and financial highlights are free of material misstatement, whether due to error or fraud. The Fund is not required to have, nor were we engaged to perform, an audit of its internal control over financial reporting. As part of our audits we are required to obtain an understanding of internal control over financial reporting but not for the purpose of expressing an opinion on the effectiveness of the Fund’s internal control over financial reporting. Accordingly, we express no such opinion.
Our audits included performing procedures to assess the risks of material misstatement of the financial statements and financial highlights, whether due to error or fraud, and performing procedures that respond to those risks. Such procedures included examining, on a test basis, evidence regarding the amounts and disclosures in the financial statements and financial highlights. Our audits also included evaluating the accounting principles used and significant estimates made by management, as well as evaluating the overall presentation of the financial statements and financial highlights. Our procedures included confirmation of securities owned as of December 31, 2019, by correspondence with the custodian and brokers; when replies were not received from brokers, we performed other auditing procedures. We believe that our audits provide a reasonable basis for our opinion.
DELOITTE & TOUCHE LLP
Boston, Massachusetts
February 14, 2020
We have served as the auditor of one or more of the MFS investment companies since 1924.
20
MFS Research International Portfolio
TRUSTEES AND OFFICERS – IDENTIFICATION AND BACKGROUND
The Trustees and Officers of the Trust, as of February 1, 2020, are listed below, together with their principal occupations during the past five years. (Their titles may have varied during that period.) The address of each Trustee and Officer is 111 Huntington Avenue, Boston, Massachusetts 02199-7618.
| | | | | | | | | | |
Name, Age | | Position(s)
Held with Fund | | Trustee/Officer
Since (h) | | Number of MFS Funds
overseen by the
Trustee | | Principal Occupations
During the Past Five Years | | Other Directorships During the Past Five Years (j) |
| INTERESTED TRUSTEES |
Robert J. Manning (k)
(age 56) | | Trustee | | February 2004 | | 133 | | Massachusetts Financial Services Company, Executive Chairman (since January 2017); Director; Chairman of the Board; Chief Executive Officer (until 2015);Co-Chief Executive Officer(2015-2016) | | N/A |
| | | | | |
Robin A. Stelmach (k) (age 58) | | Trustee | | January 2014 | | 133 | | Massachusetts Financial Services Company, Vice Chair (since January 2017); Chief Operating Officer and Executive Vice President (until January 2017) | | N/A |
|
| INDEPENDENT TRUSTEES |
John P. Kavanaugh (age 65) | | Trustee and Chair of Trustees | | January 2009 | | 133 | | Private investor | | N/A |
| | | | | |
Steven E. Buller (age 68) | | Trustee | | February 2014 | | 133 | | Financial Accounting Standards Advisory Council, Chairman(2014-2015); Public Company Accounting Oversight Board, Standing Advisory Group, Member (until 2014); BlackRock, Inc. (investment management), Managing Director (until 2014), BlackRock Finco UK (investment management), Director (until 2014) | | N/A |
| | | | | |
John A. Caroselli (age 65) | | Trustee | | March 2017 | | 133 | | JC Global Advisors, LLC (management consulting), President (since 2015); First Capital Corporation (commercial finance), Executive Vice President (until 2015) | | N/A |
| | | | | |
Maureen R. Goldfarb (age 64) | | Trustee | | January 2009 | | 133 | | Private investor | | N/A |
| | | | | |
Peter D. Jones
(age 64) | | Trustee | | January 2019 | | 133 | | Franklin Templeton Distributors, Inc. (investment management), President (until 2015); Franklin Templeton Institutional, LLC (investment management), Chairman (until 2015) | | N/A |
| | | | | |
James W. Kilman, Jr.
(age 58) | | Trustee | | January 2019 | | 133 | | Burford Capital Limited (finance and investment management), Chief Financial Officer (since 2019); KielStrand Capital LLC (family office), Chief Executive Officer (since 2016); Morgan Stanley & Co. (financial services), Vice Chairman of Investment Banking,Co-Head of Diversified Financials Coverage – Financial Institutions Investment Banking Group (until 2016) | | Alpha-En Corporation, Director (2016-2019) |
21
MFS Research International Portfolio
Trustees and Officers – continued
| | | | | | | | | | |
Name, Age | | Position(s)
Held with Fund | | Trustee/Officer
Since (h) | | Number of MFS Funds
overseen by the
Trustee | | Principal Occupations
During the Past Five Years | | Other Directorships During the Past Five Years (j) |
Clarence Otis, Jr. (age 63) | | Trustee | | March 2017 | | 133 | | Darden Restaurants, Inc., Chief Executive Officer (until 2014) | | VF Corporation, Director; Verizon Communications, Inc., Director; The Travelers Companies, Director; Federal Reserve Bank of Atlanta, Director (until 2015) |
| | | | | |
Maryanne L. Roepke (age 63) | | Trustee | | May 2014 | | 133 | | American Century Investments (investment management), Senior Vice President and Chief Compliance Officer (until 2014) | | N/A |
| | | | | |
Laurie J. Thomsen
(age 62) | | Trustee | | March 2005 | | 133 | | Private investor | | The Travelers Companies, Director; Dycom Industries, Inc., Director (since 2015) |
| | | | | | | | |
Name, Age | | Position(s)
Held with Fund | | Trustee/Officer
Since (h) | | Number of
MFS Funds
for which the
Person is an
Officer | | Principal Occupations During the Past Five Years |
| OFFICERS | | | | | | |
Christopher R. Bohane (k)
(age 46) | | Assistant Secretary and Assistant Clerk | | July 2005 | | 133 | | Massachusetts Financial Services Company, Vice President and Assistant General Counsel |
| | | | |
Kino Clark (k) (age 51) | | Assistant Treasurer | | January 2012 | | 133 | | Massachusetts Financial Services Company, Vice President |
| | | | |
John W. Clark, Jr. (k) (age 52) | | Assistant Treasurer | | April 2017 | | 133 | | Massachusetts Financial Services Company, Vice President (since March 2017); Deutsche Bank (financial services), Department Head –Treasurer’s Office (until February 2017) |
| | | | |
Thomas H. Connors (k) (age 60) | | Assistant Secretary and Assistant Clerk | | September 2012 | | 133 | | Massachusetts Financial Services Company, Vice President and Senior Counsel |
| | | | |
David L. DiLorenzo (k)
(age 51) | | President | | July 2005 | | 133 | | Massachusetts Financial Services Company, Senior Vice President |
| | | | |
Heidi W. Hardin (k) (age 52) | | Secretary and Clerk | | April 2017 | | 133 | | Massachusetts Financial Services Company, Executive Vice President and General Counsel (since March 2017); Harris Associates (investment management), General Counsel (from September 2015 to January 2017); Janus Capital Management LLC (investment management), Senior Vice President and General Counsel (until September 2015) |
| | | | |
Brian E. Langenfeld (k) (age 46) | | Assistant
Secretary and Assistant Clerk | | June 2006 | | 133 | | Massachusetts Financial Services Company, Vice President and Senior Counsel |
| | | | |
Amanda S. Mooradian (k) (age 40) | | Assistant
Secretary and Assistant Clerk | | September 2018 | | 133 | | Massachusetts Financial Services Company, Assistant Vice President and Counsel |
| | | | |
Susan A. Pereira (k)
(age 49) | | Assistant
Secretary and Assistant Clerk | | July 2005 | | 133 | | Massachusetts Financial Services Company, Vice President and Assistant General Counsel |
| | | | |
Kasey L. Phillips (k) (age 49) | | Assistant Treasurer | | September 2012 | | 133 | | Massachusetts Financial Services Company, Vice President |
| | | | |
Matthew A. Stowe (k) (age 45) | | Assistant Secretary and Assistant Clerk | | October 2014 | | 133 | | Massachusetts Financial Services Company, Vice President and Assistant General Counsel |
22
MFS Research International Portfolio
Trustees and Officers – continued
| | | | | | | | |
Name, Age | | Position(s)
Held with Fund | | Trustee/Officer
Since (h) | | Number of
MFS Funds
for which the
Person is an
Officer | | Principal Occupations During the Past Five Years |
Martin J. Wolin (k) (age 52) | | Chief Compliance Officer | | July 2015 | | 133 | | Massachusetts Financial Services Company, Senior Vice President and Chief Compliance Officer (since July 2015); Mercer (financial service provider), Chief Risk and Compliance Officer, North America and Latin America (until June 2015) |
| | | | |
James O. Yost (k)
(age 59) | | Treasurer | | September 1990 | | 133 | | Massachusetts Financial Services Company, Senior Vice President |
| (h) | Date first appointed to serve as Trustee/officer of an MFS Fund. Each Trustee has served continuously since appointment unless indicated otherwise. For the period from December 15, 2004 until February 22, 2005, Mr. Manning served as Advisory Trustee. From January 2012 through December 2016, Messrs. DiLorenzo and Yost served as Treasurer and Deputy Treasurer of the Funds, respectively. |
| (j) | Directorships or trusteeships of companies required to report to the Securities and Exchange Commission (i.e., “public companies”). |
| (k) | “Interested person” of the Trust within the meaning of the Investment Company Act of 1940 (referred to as the 1940 Act), which is the principal federal law governing investment companies like the fund, as a result of a position with MFS. The address of MFS is 111 Huntington Avenue, Boston, Massachusetts 02199-7618. |
Each Trustee (other than Messrs. Jones and Kilman) has been elected by shareholders and each Trustee and Officer holds office until his or her successor is chosen and qualified or until his or her earlier death, resignation, retirement or removal. Messrs. Jones and Kilman became Trustees of the Funds on January 1, 2019. The Trust does not hold annual meetings for the purpose of electing Trustees, and Trustees are not elected for fixed terms. Under the terms of the Board’s retirement policy, an Independent Trustee shall retire at the end of the calendar year in which he or she reaches the earlier of 75 years of age or 15 years of service on the Board (or, in the case of any Independent Trustee who joined the Board prior to 2015, 20 years of service on the Board).
Messrs. Buller, Kilman and Otis and Ms. Roepke are members of the Trust’s Audit Committee.
Each of the Interested Trustees and certain Officers hold comparable officer positions with certain affiliates of MFS.
The Statement of Additional Information for a Fund includes further information about the Trustees and is available without charge upon request by calling1-800-225-2606.
| | |
Investment Adviser Massachusetts Financial Services Company 111 Huntington Avenue Boston, MA 02199-7618 | | Custodian State Street Bank and Trust Company 1 Lincoln Street Boston, MA 02111-2900 |
| |
Distributor MFS Fund Distributors, Inc. 111 Huntington Avenue Boston, MA 02199-7618 | | Independent Registered Public Accounting Firm Deloitte & Touche LLP 200 Berkeley Street Boston, MA 02116 |
| |
Portfolio Manager(s) Victoria Higley Camille Humphries Lee | | |
23
MFS Research International Portfolio
BOARD REVIEW OF INVESTMENT ADVISORY AGREEMENT
MFS Research International Portfolio
The Investment Company Act of 1940 requires that both the full Board of Trustees and a majority of thenon-interested (“independent”) Trustees, voting separately, annually approve the continuation of the Fund’s investment advisory agreement with MFS. The Trustees consider matters bearing on the Fund and its advisory arrangements at their meetings throughout the year, including a review of performance data at each regular meeting. In addition, the independent Trustees met several times over the course of three months beginning in May and ending in July, 2019 (“contract review meetings”) for the specific purpose of considering whether to approve the continuation of the investment advisory agreement for the Fund and the other investment companies that the Board oversees (the “MFS Funds”). The independent Trustees were assisted in their evaluation of the Fund’s investment advisory agreement by independent legal counsel, from whom they received separate legal advice and with whom they met separately from MFS during various contract review meetings. The independent Trustees were also assisted in this process by the MFS Funds’ Independent Senior Officer, a senior officer appointed by and reporting to the independent Trustees.
In connection with their deliberations regarding the continuation of the investment advisory agreement, the Trustees, including the independent Trustees, considered such information and factors as they believed, in light of the legal advice furnished to them and their own business judgment, to be relevant. The investment advisory agreement for the Fund was considered separately, although the Trustees also took into account the common interests of all MFS Funds in their review. As described below, the Trustees considered the nature, quality, and extent of the various investment advisory, administrative, and shareholder services performed by MFS under the existing investment advisory agreement and other arrangements with the Fund.
In connection with their contract review meetings, the Trustees received and relied upon materials that included, among other items: (i) information provided by Broadridge Financial Solutions, Inc. (“Broadridge”), an independent third party, on the investment performance of the Fund for various time periods ended December 31, 2018 and the investment performance of a group of funds with substantially similar investment classifications/objectives (the “Broadridge performance universe”), (ii) information provided by Broadridge on the Fund’s advisory fees and other expenses and the advisory fees and other expenses of comparable funds identified by Broadridge as well as all other funds in the same investment classification/category (the “Broadridge expense group and universe”), (iii) information provided by MFS on the advisory fees of portfolios of other clients of MFS, including institutional separate accounts and other clients, (iv) information as to whether and to what extent applicable expense waivers, reimbursements or fee “breakpoints” are observed for the Fund, (v) information regarding MFS’ financial results and financial condition, including MFS’ and certain of its affiliates’ estimated profitability from services performed for the Fund and the MFS Funds as a whole, and compared to MFS’ institutional business, (vi) MFS’ views regarding the outlook for the mutual fund industry and the strategic business plans of MFS, (vii) descriptions of various functions performed by MFS for the Funds, such as compliance monitoring and portfolio trading practices, and (viii) information regarding the overall organization of MFS, including information about MFS’ senior management and other personnel providing investment advisory, administrative and other services to the Fund and the other MFS Funds. The comparative performance, fee and expense information prepared and provided by Broadridge was not independently verified and the independent Trustees did not independently verify any information provided to them by MFS.
The Trustees’ conclusion as to the continuation of the investment advisory agreement was based on a comprehensive consideration of all information provided to the Trustees and not the result of any single factor. Some of the factors that figured particularly in the Trustees’ deliberations are described below, although individual Trustees may have evaluated the information presented differently from one another, giving different weights to various factors. It is also important to recognize that the fee arrangements for the Fund and other MFS Funds are the result of years of review and discussion between the independent Trustees and MFS, that certain aspects of such arrangements may receive greater scrutiny in some years than in others, and that the Trustees’ conclusions may be based, in part, on their consideration of these same arrangements during the course of the year and in prior years.
Based on information provided by Broadridge and MFS, the Trustees reviewed the Fund’s total return investment performance as well as the Broadridge performance universe over various time periods. The Trustees placed particular emphasis on the total return performance of the Fund’s Initial Class shares in comparison to the performance of funds in its Broadridge performance universe over the five-year period ended December 31, 2018, which the Trustees believed was a long enough period to reflect differing market conditions. The total return performance of the Fund’s Initial Class shares was in the 4th quintile relative to the other funds in the universe for this five-year period (the 1st quintile being the best performers and the 5th quintile being the worst performers). The total return performance of the Fund’s Initial Class shares was in the 3rd quintile for each of theone- and three-year periods ended December 31, 2018 relative to the Broadridge performance universe. Because of the passage of time, these performance results may differ from the performance results for more recent periods, including those shown elsewhere in this report.
In the course of their deliberations, the Trustees took into account information provided by MFS in connection with the contract review meetings, as well as during investment review meetings conducted with portfolio management personnel during the course of the year regarding the Fund’s performance. After reviewing these and related factors, the Trustees concluded, within the context of their overall conclusions regarding the investment advisory agreement, that they were satisfied with MFS’ responses and efforts relating to investment performance.
24
MFS Research International Portfolio
Board Review of Investment Advisory Agreement – continued
In assessing the reasonableness of the Fund’s advisory fee, the Trustees considered, among other information, the Fund’s advisory fee and the total expense ratio of the Fund’s Initial Class shares as a percentage of average daily net assets and the advisory fee and total expense ratios of the Broadridge expense group based on information provided by Broadridge. The Trustees considered that MFS currently observes an expense limitation for the Fund, which may not be changed without the Trustees’ approval. The Trustees also considered that, according to the data provided by Broadridge (which takes into account any fee reductions or expense limitations that were in effect during the Fund’s last fiscal year), the Fund’s effective advisory fee rate and total expense ratio were each approximately at the Broadridge expense group median.
The Trustees also considered the advisory fees charged by MFS to any institutional separate accounts advised by MFS (“separate accounts”) and unaffiliated investment companies for which MFS serves as subadviser (“subadvised funds”) that have comparable investment strategies to the Fund, if any. In comparing these fees, the Trustees considered information provided by MFS as to the generally broader scope of services provided by MFS to the Fund, as well as the more extensive regulatory burdens imposed on MFS in managing the Fund, in comparison to separate accounts and subadvised funds. The Trustees also considered the higher demands placed on MFS’ investment personnel and trading infrastructure as a result of the daily cashin-flows andout-flows of the Fund in comparison to separate accounts.
The Trustees also considered whether the Fund may benefit from any economies of scale in the management of the Fund in the event of growth in assets of the Fund and/or growth in assets of the MFS Funds as a whole. They noted that the Fund’s advisory fee rate schedule is subject to contractual breakpoints that reduce the Fund’s advisory fee rate on average daily net assets over $1 billion and $2 billion. The Trustees also noted that MFS has agreed in writing to waive a portion of the management fees of certain MFS Funds, including the Fund, if the total combined assets of certain funds within the MFS Funds’ complex increase above agreed upon thresholds (the “group fee waiver”), enabling the Fund’s shareholders to share in the benefits from any economies of scale at the complex level. The group fee waiver is reviewed and renewed annually between the Board and MFS. The Trustees concluded that the breakpoints and the group fee waiver were sufficient to allow the Fund to benefit from economies of scale as its assets and overall complex assets grow.
The Trustees also considered information prepared by MFS relating to MFS’ costs and profits with respect to the Fund, the MFS Funds considered as a group, and other investment companies and accounts advised by MFS, as well as MFS’ methodologies used to determine and allocate its costs to the MFS Funds, the Fund and other accounts and products for purposes of estimating profitability.
After reviewing these and other factors described herein, the Trustees concluded, within the context of their overall conclusions regarding the investment advisory agreement, that the advisory fees charged to the Fund represent reasonable compensation in light of the services being provided by MFS to the Fund.
In addition, the Trustees considered MFS’ resources and related efforts to continue to retain, attract and motivate capable personnel to serve the Fund. The Trustees also considered current and developing conditions in the financial services industry, including the presence of large and well-capitalized companies which are spending, and appear to be prepared to continue to spend, substantial sums to engage personnel and to provide services to competing investment companies. In this regard, the Trustees also considered the financial resources of MFS and its ultimate parent, Sun Life Financial Inc. The Trustees also considered the advantages and possible disadvantages to the Fund of having an adviser that also serves other investment companies as well as other accounts.
The Trustees also considered the nature, quality, cost, and extent of administrative, transfer agency, and distribution services provided to the Fund by MFS and its affiliates under agreements and plans other than the investment advisory agreement, including any12b-1 fees the Fund pays to MFS Fund Distributors, Inc., an affiliate of MFS. The Trustees also considered the nature, extent and quality of certain other services MFS performs or arranges for on the Fund’s behalf, which may include securities lending programs, directed expense payment programs, class action recovery programs, and MFS’ interaction with third-party service providers, principally custodians andsub-custodians. The Trustees concluded that the variousnon-advisory services provided by MFS and its affiliates on behalf of the Fund were satisfactory.
The Trustees consideredso-called“fall-out benefits” to MFS such as reputational value derived from serving as investment manager to the MFS Funds. The Trustees also considered that, effective January 3, 2018, MFS had discontinued its historic practice of obtaining investment research from portfolio brokerage commissions paid by certain MFS Funds and would thereafter directly pay for or voluntarily reimburse a Fund, if applicable, for the costs of external research acquired through the use of the Fund’s portfolio brokerage commissions.
Based on their evaluation of factors that they deemed to be material, including those factors described above, the Board of Trustees, including the independent Trustees, concluded that the Fund’s investment advisory agreement with MFS should be continued for an additionalone-year period, commencing August 1, 2019.
25
MFS Research International Portfolio
PROXY VOTING POLICIES AND INFORMATION
MFS votes proxies on behalf of the fund pursuant to proxy voting policies and procedures that are available without charge, upon request, by calling 1-800-225-2606, by visitingmfs.com/proxyvoting, or by visiting the SEC’s Web site athttp://www.sec.gov.
Information regarding how the fund voted proxies relating to portfolio securities during the most recent twelve-month period ended June 30 is available by August 31 of each year without charge by visitingmfs.com/proxyvoting, or by visiting the SEC’s Web site athttp://www.sec.gov.
QUARTERLY PORTFOLIO DISCLOSURE
The fund files a complete schedule of portfolio holdings with the SEC for the first and third quarters of each fiscal year as an exhibit to its reports on Form N-PORT. The fund’s Form N-PORT reports are available on the SEC’s website athttp://www.sec.gov.A shareholder can obtain the portfolio holdings report for the first and third quarters of the fund’s fiscal year atmfs.com/vit2 by choosing the fund’s name and then selecting the “Resources” tab and clicking on “Prospectus and Reports”.
FURTHER INFORMATION
From time to time, MFS may post important information about the fund or the MFS funds on the MFS web site (mfs.com). This information is available athttps://www.mfs.com/en-us/what-we-do/announcements.htmlor atmfs.com/vit2 by choosing the fund’s name.
INFORMATION ABOUT FUND CONTRACTS AND LEGAL CLAIMS
The fund has entered into contractual arrangements with an investment adviser, administrator, distributor, shareholder servicing agent, 529 program manager (if applicable), and custodian who each provide services to the fund. Unless expressly stated otherwise, shareholders are not parties to, or intended beneficiaries of these contractual arrangements, and these contractual arrangements are not intended to create any shareholder right to enforce them against the service providers or to seek any remedy under them against the service providers, either directly or on behalf of the fund.
Under the Trust’s By-Laws and Declaration of Trust, any claims asserted against or on behalf of the MFS Funds, including claims against Trustees and Officers, must be brought in state and federal courts located within the Commonwealth of Massachusetts.
FEDERAL TAX INFORMATION (unaudited)
The following information is provided pursuant to provisions of the Internal Revenue Code.
The fund designates $18,975,000 as capital gain dividends paid during the fiscal year.
Income derived from foreign sources was $13,027,512. The fund intends to pass through foreign tax credits of $1,092,450 for the fiscal year.
26
rev. 3/16
| | | | |
| | | |
| FACTS | | WHAT DOES MFS DO WITH YOUR
PERSONAL INFORMATION? | |  |
| | |
| Why? | | Financial companies choose how they share your personal information. Federal law gives consumers the right to limit some but not all sharing. Federal law also requires us to tell you how we collect, share, and protect your personal information. Please read this notice carefully to understand what we do. |
| | |
| What? | | The types of personal information we collect and share depend on the product or service you have with us. This information can include: • Social Security number and account balances • Account transactions and transaction history • Checking account information and wire transfer instructions When you areno longer our customer, we continue to share your information as described in this notice. |
| | |
| How? | | All financial companies need to share customers’ personal information to run their everyday business. In the section below, we list the reasons financial companies can share their customers’ personal information; the reasons MFS chooses to share; and whether you can limit this sharing. |
| | | | |
Reasons we can share your
personal information | | Does MFS share? | | Can you limit this
sharing? |
For our everyday business purposes – such as to process your transactions, maintain your account(s), respond to court orders and legal investigations, or report to credit bureaus | | Yes | | No |
For our marketing purposes – to offer our products and services to you | | No | | We don’t share |
| For joint marketing with other financial companies | | No | | We don’t share |
For our affiliates’ everyday business purposes – information about your transactions and experiences | | No | | We don’t share |
For our affiliates’ everyday business purposes – information about your creditworthiness | | No | | We don’t share |
| For nonaffiliates to market to you | | No | | We don’t share |
| | |
| | |
| Questions? | | Call800-225-2606 or go tomfs.com. |
27
| | |
| Who we are |
| Who is providing this notice? | | MFS Funds, MFS Investment Management, MFS Institutional Advisors, Inc., and MFS Heritage Trust Company. |
| | |
| What we do |
| How does MFS protect my personal information? | | To protect your personal information from unauthorized access and use, we use security measures that comply with federal law. These measures include procedural, electronic, and physical safeguards for the protection of the personal information we collect about you. |
How does MFS
collect my personal information? | | We collect your personal information, for example, when you • open an account or provide account information • direct us to buy securities or direct us to sell your securities • make a wire transfer We also collect your personal information from others, such as credit bureaus, affiliates, or other companies. |
| Why can’t I limit all sharing? | | Federal law gives you the right to limit only • sharing for affiliates’ everyday business purposes – information about your creditworthiness • affiliates from using your information to market to you • sharing for nonaffiliates to market to you State laws and individual companies may give you additional rights to limit sharing. |
| | |
| Definitions |
| Affiliates | | Companies related by common ownership or control. They can be financial and nonfinancial companies. • MFS does not share personal information with affiliates, except for everyday business purposes as described on page one of this notice. |
| Nonaffiliates | | Companies not related by common ownership or control. They can be financial and nonfinancial companies. • MFS does not share with nonaffiliates so they can market to you. |
| Joint marketing | | A formal agreement between nonaffiliated financial companies that together market financial products or services to you. • MFS doesn’t jointly market. |
| | |
| Other important information |
| If you own an MFS product or receive an MFS service in the name of a third party such as a bank or broker-dealer, their privacy policy may apply to you instead of ours. |
28
Annual Report
December 31, 2019

MFS® Strategic Income Portfolio

MFS® Variable Insurance Trust II
Beginning on January 1, 2021, as permitted by regulations adopted by the U.S. Securities and Exchange Commission, the insurance company that offers your contract may determine that it will no longer send you paper copies of the fund’s annual and semiannual shareholder reports unless you specifically request paper copies from the insurance company or from your financial intermediary. Instead, the shareholder reports will be made available on a Web site (insurancefunds.mfs.com or other Web site of which you will be notified), and the insurance company will notify you by mail each time a report is posted and provide you with a Web site link to access the report. Instructions for requesting paper copies will be provided by your insurance company or financial intermediary.
If you already elected to receive shareholder reports by email, you will not be affected by this change and you need not take any action. If your insurance company or financial intermediary offers electronic delivery, you may elect to receive shareholder reports and other communications from the insurance company or financial intermediary by email by following the instructions provided by the insurance company or financial intermediary.
Beginning on January 1, 2019, you may elect to receive all future reports in paper free of charge from the insurance company or financial intermediary. You can inform the insurance company or financial intermediary that you wish to continue receiving paper copies of your shareholder reports by contacting your insurance company or financial intermediary. Your election to receive reports in paper will apply to all funds held in your account with your insurance company or financial intermediary.
SIS-ANN
MFS® Strategic Income Portfolio
CONTENTS
The report is prepared for the general information of contract owners. It is authorized for distribution to prospective investors only when preceded or accompanied by a current prospectus.
NOT FDIC INSURED• MAY LOSE VALUE• NO BANK OR CREDIT UNION GUARANTEE• NOT A DEPOSIT• NOT INSURED BY ANY FEDERAL GOVERNMENT AGENCY OR NCUA/NCUSIF
MFS Strategic Income Portfolio
LETTER FROM THE EXECUTIVE CHAIR

Dear Contract Owners:
Slowing global growth, low inflation, and trade friction between the United States and China have been hallmarks of the past 12 months. After experiencing an uptick in market volatility in late 2018, markets steadied for most of 2019, thanks in large measure to the adoption of a dovish policy stance on the part of global central banks, focused on supporting economic growth. Negotiations aimed at a “phase one” trade deal between the U.S. and China bore fruit at the end of the period, boosting investor sentiment, while signs of stability emerging from the global manufacturing sector also lifted spirits. Uncertainty over Brexit, along with the ripple effects from the trade conflict, hampered business confidence and investment in the United Kingdom and Europe for much of the period, though investors expect greater clarity regarding Brexit as a result of December’s general election. The pro-Brexit Conservative Party won the election by a comfortable margin and set the stage for the U.K.’s departure from the EU at the end of January.
Markets expect the longest economic expansion in U.S. history will continue, albeit at a slower pace, as trade tensions recede. In an effort to prolong the expansion, the U.S. Federal Reserve lowered interest rates three times between July and October and the European Central Bank loosened policy in September. While the global monetary policy backdrop remains quite accommodative, signs of easing trade tensions and fading global recession fears led to improved market sentiment in late 2019 as investors grew less risk averse. In early 2020, an outbreak of coronavirus emanating from China reintroduced global growth fears, causing an uptick in volatility.
Here at MFS®, we aim to help our clients navigate the growing complexity of the markets and world economies. Our long-term investment philosophy and commitment to the responsible allocation of capital allow us to tune out the noise and uncover what we believe are the best, most durable investment opportunities in the market. Through our powerful global investment platform, we combine collective expertise, thoughtful risk management and long-term discipline to create sustainable value for investors.
Respectfully,

Robert J. Manning
Executive Chair
MFS Investment Management
February 14, 2020
The opinions expressed in this letter are subject to change and may not be relied upon for investment advice. No forecasts can be guaranteed.
1
MFS Strategic Income Portfolio
PORTFOLIO COMPOSITION
Portfolio structure at value (v)
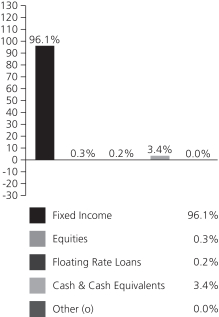
| | | | |
| Fixed income sectors (i) | | | | |
| Investment Grade Corporates | | | 33.4% | |
| Commercial Mortgage-Backed Securities | | | 20.4% | |
| U.S. Treasury Securities | | | 20.2% | |
| High Yield Corporates | | | 11.6% | |
| Collateralized Debt Obligations | | | 9.8% | |
| Emerging Markets Bonds | | | 8.4% | |
| Asset-Backed Securities | | | 3.7% | |
| Mortgage-Backed Securities | | | 3.0% | |
| Municipal Bonds | | | 2.3% | |
| Residential Mortgage-Backed Securities | | | 0.7% | |
| Non-U.S. Government Bonds | | | 0.6% | |
| U.S. Government Agencies | | | 0.2% | |
| Floating Rate Loans | | | 0.2% | |
Portfolio structure reflecting equivalent exposure of derivative positions (i)
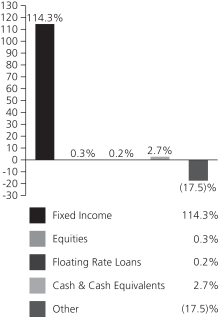
| | | | |
| Composition including fixed income credit quality (a)(i) | |
| AAA | | | 12.5% | |
| AA | | | 5.2% | |
| A | | | 19.0% | |
| BBB | | | 27.2% | |
| BB | | | 8.6% | |
| B | | | 7.1% | |
| CCC | | | 1.1% | |
| CC (o) | | | 0.0% | |
| C (o) | | | 0.0% | |
| D | | | 0.1% | |
| U.S. Government | | | 3.7% | |
| Federal Agencies | | | 3.2% | |
| Not Rated | | | 26.8% | |
| Non-Fixed Income | | | 0.3% | |
| Cash & Cash Equivalents | | | 2.7% | |
| Other | | | (17.5)% | |
|
| Portfolio facts (i) | |
| Average Duration (d) | | | 5.9 | |
| Average Effective Maturity (m) | | | 7.4 yrs. | |
2
MFS Strategic Income Portfolio
Portfolio Composition – continued
| (a) | | For all securities other than those specifically described below, ratings are assigned to underlying securities utilizing ratings from Moody’s, Fitch, and Standard & Poor’s rating agencies and applying the following hierarchy: If all three agencies provide a rating, the middle rating (after dropping the highest and lowest ratings) is assigned; if two of the three agencies rate a security, the lower of the two is assigned. Ratings are shown in the S&P and Fitch scale (e.g., AAA). Securities rated BBB or higher are considered investment grade. All ratings are subject to change. U.S. Government includes securities issued by the U.S. Department of the Treasury. Federal Agencies includes rated and unrated U.S. Agency fixed-income securities, U.S. Agency mortgage-backed securities, and collateralized mortgage obligations of U.S. Agency mortgage-backed securities. Not Rated includes fixed income securities and fixed income derivatives, which have not been rated by any rating agency.Non-Fixed Income includes any equity securities (including convertible bonds and equity derivatives) and/or commodity-linked derivatives. The fund may or may not have held all of these instruments on this date. The fund is not rated by these agencies. |
| (d) | | Duration is a measure of how much a bond’s price is likely to fluctuate with general changes in interest rates, e.g., if rates rise 1.00%, a bond with a5-year duration is likely to lose about 5.00% of its value due to the interest rate move. |
| (i) | | For purposes of this presentation, the components include the value of securities, and reflect the impact of the equivalent exposure of derivative positions, if any. These amounts may be negative from time to time. Equivalent exposure is a calculated amount that translates the derivative position into a reasonable approximation of the amount of the underlying asset that the portfolio would have to hold at a given point in time to have the same price sensitivity that results from the portfolio’s ownership of the derivative contract. When dealing with derivatives, equivalent exposure is a more representative measure of the potential impact of a position on portfolio performance than value. The bond component will include any accrued interest amounts. |
| (m) | | In determining each instrument’s effective maturity for purposes of calculating the fund’s dollar-weighted average effective maturity, MFS uses the instrument’s stated maturity or, if applicable, an earlier date on which MFS believes it is probable that a maturity-shortening device (such as a put,pre-refunding or prepayment) will cause the instrument to be repaid. Such an earlier date can be substantially shorter than the instrument’s stated maturity. |
| (v) | | For purposes of this presentation, market value of fixed income and/or equity derivatives, if any, is included in Cash & Cash Equivalents. |
Where the fund holds convertible bonds, they are treated as part of the equity portion of the portfolio.
The fund invests a portion of its assets in the MFS High Yield Pooled Portfolio. Percentages reflect exposure to the underlying holdings, including Cash & Cash Equivalents and Other, of the MFS High Yield Pooled Portfolio and not to the exposure from investing directly in the MFS High Yield Pooled Portfolio itself.
Cash & Cash Equivalents includes any cash, investments in money market funds, short-term securities, and other assets less liabilities. Please see the Statement of Assets and Liabilities for additional information related to the fund’s cash position and other assets and liabilities.
Other includes equivalent exposure from currency derivatives and/or any offsets to derivative positions and may be negative.
Percentages are based on net assets as of December 31, 2019.
The portfolio is actively managed and current holdings may be different.
3
MFS Strategic Income Portfolio
MANAGEMENT REVIEW
Summary of Results
For the twelve months ended December 31, 2019, Initial Class shares of the MFS Strategic Income Portfolio (fund) provided a total return of 11.60%, while Service Class shares of the fund provided a total return of 11.29%. These compare with a return of 8.72% over the same period for the fund’s benchmark, the Bloomberg Barclays U.S. Aggregate Bond Index.
Market Environment
Fading fears of a near-term global recession, the announcement of a partial trade deal between the United States and China and the decline in uncertainty over Brexit helped bolster market sentiment late in the period. Changes in market sentiment, largely driven by uncertainty over the outcome of trade negotiations between the US and China, had contributed to periodic bouts of volatility during the reporting period. The global economy decelerated, led by weakness in China and Europe, although the pace of the slowdown moderated late in the period amid nascent signs of stabilization in the manufacturing sector.
The deteriorating global growth backdrop, along with declining inflationary pressures, prompted the US Federal Reserve to adopt a more dovish posture beginning in early 2019, resulting in the first interest rate cut in over a decade at the end of July, followed by additional cuts in September and October. The Fed’s actions led to a sharp decline in long-term interest rates during the period’s second half, causing the inversion of portions of the US Treasury yield curve for a time. Amid an improvement in risk sentiment in Q4 2019 and indications of a bottoming in growth and a potential upturn in activity, the Fed indicated in October that further rate cuts were unlikely unless the outlook for the economy materially worsened.
Globally, central banks have tilted more dovish as well, with the European Central Bank unveiling a package of easing measures, which included putting overnight rates deeper into negative territory, restarting its bond-buying program and lengthening the term of cheap loans to banks to three years from two. The central banks of India and Australia are among those that have cut rates several times in recent months, although China has been more cautious in increasing liquidity as it keeps trying to deleverage its economy, cutting rates only marginally.
Emerging markets experienced considerable volatility through the end of 2018, as tighter global financial conditions exposed structural weakness in some countries. Those conditions improved in 2019 as the Fed became more dovish. Notwithstanding the periodic headwinds on market sentiment from significant trade friction between the US and China over much of the year, emerging market hard currency debt and local rates benefited from relatively cheap valuations at the beginning of the period and easier global monetary conditions. These factors, plus the fading of certain global risk factors mentioned above, hastened spread tightening in the latter part of the period. At the same time, idiosyncratic risks spiked in some countries (e.g., Argentina and Lebanon), contributing to increased dispersion in performance among sovereign assets.
Factors Affecting Performance
Relative to the Bloomberg Barclays U.S. Aggregate Bond Index, the fund’s greater exposure to theindustrials sector, particularly within both “B” and “BB” rated (r) bonds, contributed to performance. A greater exposure to thefinancial institutionssector also benefited relative results. Additionally, the fund’s underweight allocation to both thetreasury andagency fixed ratesectors further strengthened relative returns, as both sectors lagged the benchmark over the reporting period.
Conversely, the fund’s positioning along the yield curve (y) detracted from relative performance.
Respectfully,
Portfolio Manager(s)
Neeraj Arora, Philipp Burgener, David Cole, Alexander Mackey, Joshua Marston, Robert Persons, and Michael Skatrud
| (r) | Bonds rated “BBB”, “Baa”, or higher are considered investment grade; bonds rated “BB”, “Ba”, or below are considerednon-investment grade. The source for bond quality ratings is Moody’s Investors Service, Standard & Poor’s and Fitch, Inc. and are applied using the following hierarchy: If all three agencies provide a rating, the middle rating (after dropping the highest and lowest ratings) is assigned; if two of the three agencies rate a security, the lower of the two is assigned. Ratings are shown in the S&P and Fitch scale (e.g., AAA). For securities which are not rated by any of the three agencies, the security is considered Not Rated. |
| (y) | A yield curve graphically depicts the yields of different maturity bonds of the same credit quality and type; a normal yield curve is upward sloping, with short-term rates lower than long-term rates. |
The views expressed in this report are those of the portfolio manager(s) only through the end of the period of the report as stated on the cover and do not necessarily reflect the views of MFS or any other person in the MFS organization. These views are subject to change at any time based on market or other conditions, and MFS disclaims any responsibility to update such views. These views may not be relied upon as investment advice or an indication of trading intent on behalf of any MFS portfolio. References to specific securities are not recommendations of such securities, and may not be representative of any MFS portfolio’s current or future investments.
4
MFS Strategic Income Portfolio
PERFORMANCE SUMMARY THROUGH 12/31/19
The following chart illustrates the historical performance of the fund in comparison to its benchmark(s). Benchmarks are unmanaged and may not be invested in directly. Benchmark returns do not reflect any fees or expenses. The performance of other share classes will be greater than or less than that of the class depicted below. (See Notes to Performance Summary.)
Performance data shown represents past performance and is no guarantee of future results. Investment return and principal value fluctuate so your units, when sold, may be worth more or less than the original cost; current performance may be lower or higher than quoted. The performance shown does not reflect the deduction of taxes, if any, that a contract holder would pay on fund distributions or the redemption of contract units. The returns for the fund shown also do not reflect the deduction of expenses associated with variable products, such as mortality and expense risk charges, separate account charges, and sales charges imposed by the insurance company separate accounts. Such expenses would reduce the overall returns shown.
Growth of a Hypothetical $10,000 Investment
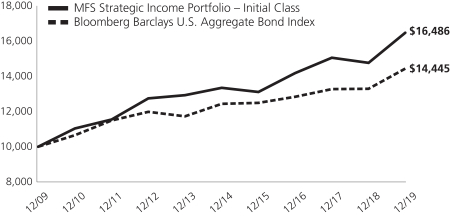
Total Returns through 12/31/19
Average annual total returns
| | | | | | | | | | | | |
| | | Share Class | | Class Inception Date | | 1-yr | | 5-yr | | 10-yr | | |
| | | Initial Class | | 5/06/98 | | 11.60% | | 4.30% | | 5.13% | | |
| | | Service Class | | 8/24/01 | | 11.29% | | 4.06% | | 4.87% | | |
| | | | |
| Comparative benchmark(s) | | | | | | | | |
| | | Bloomberg Barclays U.S. Aggregate Bond Index (f) | | 8.72% | | 3.05% | | 3.75% | | |
| (f) | Source: FactSet Research Systems Inc. |
Benchmark Definition(s)
Bloomberg Barclays U.S. Aggregate Bond Index – a market capitalization-weighted index that measures the performance of the U.S. investment-grade, fixed rate bond market, with index components for government and corporate securities, mortgage pass-through securities, and asset-backed securities with at least one year to final maturity. BLOOMBERG® is a trademark and service mark of Bloomberg Finance L.P. and its affiliates (collectively “Bloomberg”). BARCLAYS® is a trademark and service mark of Barclays Bank Plc (collectively with its affiliates, “Barclays”), used under license. Bloomberg or Bloomberg’s licensors, including Barclays, own all proprietary rights in the Bloomberg Barclays Indices. Neither Bloomberg nor Barclays approves or endorses this material, or guarantees the accuracy or completeness of any information herein, or makes any warranty, express or implied, as to the results to be obtained therefrom, and, to the maximum extent allowed by law, neither shall have any liability or responsibility for injury or damages arising in connection therewith.
It is not possible to invest directly in an index.
Notes to Performance Summary
Performance information prior to December 2, 2019 reflects time periods when the fund had (i) a policy permitting the fund to invest up to 100% of its assets in below investment grade quality debt instruments and (ii) a policy permitting the fund to invest in equity securities as a principal investment strategy. The fund’s investment policies and strategies changed effective December 2, 2019.
5
MFS Strategic Income Portfolio
Performance Summary – continued
Average annual total return represents the average annual change in value for each share class for the periods presented.
Performance results reflect any applicable expense subsidies and waivers in effect during the periods shown. Without such subsidies and waivers the fund’s performance results would be less favorable. Please see the prospectus and financial statements for complete details. All results are historical and assume the reinvestment of any dividends and capital gains distributions.
Performance results do not include adjustments made for financial reporting purposes in accordance with U.S. generally accepted accounting principles and may differ from amounts reported in the financial highlights.
From time to time the fund may receive proceeds from litigation settlements, without which performance would be lower.
6
MFS Strategic Income Portfolio
EXPENSE TABLE
Fund Expenses Borne by the Contract Holders during the Period,
July 1, 2019 through December 31, 2019
As a contract holder of the fund, you incur ongoing costs, including management fees; distribution and/or service(12b-1) fees; and other fund expenses. This example is intended to help you understand your ongoing costs (in dollars) of investing in the fund and to compare these costs with the ongoing costs of investing in other mutual funds.
In addition to the fees and expenses which the fund bears directly, the fund indirectly bears a pro rata share of the fees and expenses of the MFS High Yield Pooled Portfolio, an underlying MFS Pooled Portfolio in which the fund invests. MFS Pooled Portfolios are mutual funds advised by MFS that do not pay management fees to MFS but do incur investment and operating costs. If these transactional and indirect costs were included, your costs would have been higher.
The example is based on an investment of $1,000 invested at the beginning of the period and held for the entire period July 1, 2019 through December 31, 2019.
Actual Expenses
The first line for each share class in the following table provides information about actual account values and actual expenses. You may use the information in this line, together with the amount you invested, to estimate the expenses that you paid over the period. Simply divide your account value by $1,000 (for example, an $8,600 account value divided by $1,000 = 8.6), then multiply the result by the number in the first line under the heading entitled “Expenses Paid During Period” to estimate the expenses you paid on your account during this period.
Hypothetical Example for Comparison Purposes
The second line for each share class in the following table provides information about hypothetical account values and hypothetical expenses based on the fund’s actual expense ratio and an assumed rate of return of 5% per year before expenses, which is not the fund’s actual return. The hypothetical account values and expenses may not be used to estimate the actual ending account balance or expenses you paid for the period. You may use this information to compare the ongoing costs of investing in the fund and other funds. To do so, compare this 5% hypothetical example with the 5% hypothetical examples that appear in the shareholder reports of the other funds.
Please note that the expenses shown in the table are meant to highlight the fund’s ongoing costs only and do not take into account the fees and expenses imposed under the variable contracts through which your investment in the fund is made. Therefore, the second line for each share class in the table is useful in comparing ongoing costs associated with an investment in vehicles (such as the fund) which fund benefits under variable annuity and variable life insurance contracts and to qualified pension and retirement plans only, and will not help you determine the relative total costs of investing in the fund through variable annuity and variable life insurance contracts. If the fees and expenses imposed under the variable contracts were included, your costs would have been higher.
| | | | | | | | | | | | | | | | | | |
| Share Class | | | | Annualized
Expense Ratio | | | Beginning
Account Value
7/01/19 | | | Ending Account Value
12/31/19 | | | Expenses Paid
During Period (p)
7/01/19-12/31/19 | |
| Initial Class | | Actual | | | 0.76% | | | | $1,000.00 | | | | $1,030.33 | | | | $3.89 | |
| | Hypothetical (h) | | | 0.76% | | | | $1,000.00 | | | | $1,021.37 | | | | $3.87 | |
| Service Class | | Actual | | | 1.01% | | | | $1,000.00 | | | | $1,028.94 | | | | $5.17 | |
| | Hypothetical (h) | | | 1.01% | | | | $1,000.00 | | | | $1,020.11 | | | | $5.14 | |
| (h) | 5% class return per year before expenses. |
| (p) | “Expenses Paid During Period” are equal to each class’s annualized expense ratio, as shown above, multiplied by the average account value over the period, multiplied by 184/365 (to reflect theone-half year period). In addition to the fees and expenses which the fund bears directly, the fund indirectly bears a pro rata share of the fees and expenses of the underlying funds in which the fund invests. If these indirect costs were included, your costs would have been higher. |
Notes to Expense Table
Changes to the fund’s fee arrangements occurred during the six month period. Had these fee changes been in effect throughout the entire six month period, the annualized expense ratios, the actual expenses paid during the period, and the hypothetical expenses paid during the period would have been approximately 0.75%, $3.84, and $3.82 for Initial Class and 1.00%, $5.11, and $5.09 for Service Class, respectively. For further information about the fund’s fee arrangements and changes to those fee arrangements, please see Note 3 in the Notes to Financial Statements.
7
MFS Strategic Income Portfolio
PORTFOLIO OF INVESTMENTS – 12/31/19
The Portfolio of Investments is a complete list of all securities owned by your fund. It is categorized by broad-based asset classes.
| | | | | | | | |
| Issuer | | Shares/Par | | | Value ($) | |
| BONDS – 85.5% | | | | | | | | |
| Aerospace – 0.7% | | | | | |
| L3 Harris Technologies, Inc., 4.4%, 6/15/2028 (n) | | $ | 266,000 | | | $ | 296,198 | |
| | | | | | | | |
| Asset-Backed & Securitized – 34.5% | | | | | |
| Allegro CLO Ltd.,2014-1RA, “C”, FLR, 4.965% (LIBOR - 3mo. + 3%), 10/21/2028 (n) | | $ | 250,000 | | | $ | 249,370 | |
| Allegro CLO Ltd.,2015-1X, “CR”, FLR, 3.589% (LIBOR - 3mo. + 1.65%), 7/25/2027 (n) | | | 250,000 | | | | 244,113 | |
| ALM Loan Funding, CLO,2015-16A, “BR2”, FLR, 3.9% (LIBOR - 3mo. + 1.9%), 7/15/2027 (n) | | | 260,000 | | | | 257,594 | |
| Arbor Realty Trust, Inc., CLO,2018-FL1, “A”, FLR, 2.889% (LIBOR - 1mo. + 1.15%), 6/15/2028 (n) | | | 260,000 | | | | 260,162 | |
| Arbor Realty Trust, Inc., CLO,2019-FL1, “D”, FLR, 4.24% (LIBOR - 1mo. + 2.5%), 5/15/2037 (n) | | | 244,000 | | | | 244,153 | |
| AREIT CRE Trust, 2019-CRE3, “D”, FLR, 4.39% (LIBOR - 1mo. + 2.65%), 9/14/2036 (n) | | | 271,000 | | | | 270,933 | |
| Babson CLO Ltd.,2013-IIA, “BR”, FLR, 3.215% (LIBOR - 3mo. + 1.25%), 1/20/2028 (n) | | | 250,000 | | | | 245,323 | |
| Bancorp Commercial Mortgage Trust,2018-CRE3, “D”, FLR, 4.44% (LIBOR - 1mo. + 2.7%), 1/15/2033 (n) | | | 248,157 | | | | 250,325 | |
| Bancorp Commercial Mortgage Trust,2018-CRE4, “AS”, FLR, 2.839% (LIBOR - 1mo. + 1.1%), 9/15/2035 (n) | | | 250,000 | | | | 250,262 | |
| Bancorp Commercial Mortgage Trust,2018-CRE4, “D”, FLR, 3.839% (LIBOR - 1mo. + 2.1%), 9/15/2035 (n) | | | 200,000 | | | | 200,229 | |
| Bancorp Commercial Mortgage Trust,2019-CRE5, “D”, FLR, 4.089% (LIBOR - 1mo. + 2.35%), 3/15/2036 (n) | | | 280,000 | | | | 280,114 | |
| Bancorp Commercial Mortgage Trust,2019-CRE6, “D”, FLR, 4.065% (LIBOR - 1mo. + 2.54%), 9/15/2036 (n) | | | 265,000 | | | | 264,994 | |
| Bayview Financial Revolving Mortgage Loan Trust, FLR, 3.404% (LIBOR - 1mo. + 1.6%), 12/28/2040 (n) | | | 122,926 | | | | 123,392 | |
| BDS Ltd.,2018-FL2, “C”, FLR, 3.587% (LIBOR - 1mo. + 1.85%), 8/15/2035 (n) | | | 200,000 | | | | 200,000 | |
| BSPRT Ltd.,2019-FL5, “C”, FLR, 3.765% (LIBOR - 1mo. + 2%), 5/15/2029 (n) | | | 245,000 | | | | 244,092 | |
| Business Jet Securities LLC,2018-1, “C”, 7.748%, 2/15/2033 (n) | | | 59,857 | | | | 61,616 | |
| Cent CLO LP,2015-24A, “A2R”, FLR, 3.65% (LIBOR - 3mo. + 1.65%), 10/15/2026 (n) | | | 305,000 | | | | 303,864 | |
| Chesapeake Funding II LLC,2017-2A, “C”, 3.01%, 5/15/2029 (n) | | | 215,000 | | | | 216,306 | |
| | | | | | | | |
| | |
| Issuer | | Shares/Par | | | Value ($) | |
| BONDS – continued | | | | | | | | |
| Asset-Backed & Securitized – continued | | | | | |
| Citigroup Commercial Mortgage Trust,2016-P6, “A5”, 3.72%, 12/10/2049 | | $ | 257,000 | | | $ | 276,351 | |
| CLNC Ltd.,2019-FL1, “C”, FLR, 4.133% (LIBOR - 1mo. + 2.4%), 8/20/2035 (n) | | | 265,000 | | | | 265,166 | |
| Commercial Mortgage Pass-Through Certificates, 2017-BNK8, “A3”, 3.229%, 11/15/2050 | | | 250,000 | | | | 261,494 | |
| Commercial Mortgage Pass-Through Certificates, 2018-BNK10, “A5”, 3.688%, 2/15/2061 | | | 250,000 | | | | 269,491 | |
| Commercial Mortgage Pass-Through Certificates, 2019-BN24, “A3”, 2.96%, 11/15/2062 | | | 134,719 | | | | 137,998 | |
| Commercial Mortgage Trust,2015-PC1, “A5”, 3.902%, 7/10/2050 | | | 346,107 | | | | 368,310 | |
| Commercial Mortgage Trust, 2017-COR2, “A3”, 3.51%, 9/10/2050 | | | 250,000 | | | | 264,684 | |
| Crest Ltd., CDO, 7%, (0.001% cash or 7% PIK) 1/28/2040 (a)(p) | | | 625,075 | | | | 25,856 | |
| Cutwater Ltd.,2015-IA, “BR”, FLR, 3.8% (LIBOR - 3mo. + 1.8%), 1/15/2029 (n) | | | 250,000 | | | | 248,724 | |
| Drive Auto Receivables Trust,2017-1, “C”, 2.84%, 4/15/2022 | | | 3,004 | | | | 3,005 | |
| DT Auto Owner Trust,2018-2A, “C”, 3.67%, 3/15/2024 (n) | | | 82,000 | | | | 82,769 | |
| Exantas Capital Corp. CLO Ltd., 2018-RS06, “B”, FLR, 2.887% (LIBOR - 1mo. + 1.15%), 6/15/2035 (n) | | | 260,000 | | | | 259,187 | |
| Falcon Franchise Loan LLC, 9.49%, 1/05/2023 (n) | | | 3,749 | | | | 260 | |
| Figueroa CLO Ltd.,2014-1A, “DR”, FLR, 5.25% (LIBOR - 3mo. + 3.25%), 1/15/2027 (n) | | | 250,000 | | | | 250,313 | |
| Flagship CLO,2014-8A, “BRR”, FLR, 3.401% (LIBOR - 3mo. + 1.4%), 1/16/2026 (n) | | | 259,587 | | | | 258,219 | |
| Flatiron CLO Ltd.,2015-1A, “CR”, FLR, 3.901% (LIBOR - 3mo. + 1.9%), 4/15/2027 (n) | | | 260,000 | | | | 258,997 | |
| Galaxy CLO Ltd.,2018-29A, “C”, FLR, 3.589% (LIBOR - 3mo. + 1.68%), 11/15/2026 (n) | | | 250,000 | | | | 249,289 | |
| GMF Floorplan Owner Revolving Trust,2017-2, “C”, 2.63%, 7/15/2022 (n) | | | 260,000 | | | | 260,304 | |
| GS Mortgage Securities Trust, 2019-GSA1, “A4”, 3.047%, 11/10/2052 | | | 261,722 | | | | 268,608 | |
| Hunt CRE Ltd.,2018-FL2, “D”, FLR, 4.489% (LIBOR - 1mo. + 2.75%), 8/15/2028 (n) | | | 200,000 | | | | 200,000 | |
| Invitation Homes Trust, 2018-SFR1, “C”, FLR, 2.987% (LIBOR - 1mo. + 1.25%), 3/17/2037 (n) | | | 130,000 | | | | 129,682 | |
| Invitation Homes Trust, 2018-SFR2, “A”, FLR, 2.587% (LIBOR - 1mo. + 0.85%), 12/17/2036 (n) | | | 186,564 | | | | 185,854 | |
8
MFS Strategic Income Portfolio
Portfolio of Investments – continued
| | | | | | | | |
| | |
| Issuer | | Shares/Par | | | Value ($) | |
| BONDS – continued | | | | | | | | |
| Asset-Backed & Securitized – continued | | | | | |
| JPMorgan Chase Commercial Mortgage Securities Corp., 3.454%, 9/15/2050 | | $ | 134,136 | | | $ | 141,833 | |
| KKR Real Estate Financial Trust, Inc.,2018-FL1, “D”, FLR, 4.287% (LIBOR - 1mo. + 2.55%), 6/15/2036 (n) | | | 205,000 | | | | 205,769 | |
| Lehman Brothers Commercial Conduit Mortgage Trust, 0.947%, 2/18/2030 (i) | | | 4,791 | | | | 0 | |
| LoanCore Ltd., 2018-CRE1, “C”, FLR, 4.29% (LIBOR - 1mo. + 2.55%), 5/15/2028 (n) | | | 260,000 | | | | 260,785 | |
| LoanCore Ltd., 2018-CRE1, “C”, FLR, 3.689% (LIBOR - 1mo. + 1.95%), 4/15/2034 (n) | | | 243,500 | | | | 243,500 | |
| LoanCore Ltd., 2019-CRE2, “D”, FLR, 4.19% (LIBOR - 1mo. + 2.45%), 5/15/2036 (n) | | | 209,000 | | | | 208,873 | |
| Man GLG U.S. CLO2018-2 Ltd.,2018-2A, “BR”, FLR, 4.45% (LIBOR - 3mo. + 2.45%), 10/15/2028 | | | 250,000 | | | | 248,294 | |
| MF1 CLO Ltd.,2019-FL2, “A”, FLR, 4.142% (LIBOR - 1mo. + 2.35%), 12/25/2034 (n) | | | 259,000 | | | | 259,161 | |
| Morgan Stanley Bank of America Merrill Lynch Trust,2017-C34, “A4”, 3.536%, 11/15/2052 | | | 250,000 | | | | 266,175 | |
| Morgan Stanley Capital I Trust,2017-H1, “A5”, 3.53%, 6/15/2050 | | | 187,518 | | | | 199,200 | |
| Navistar Financial Dealer Note Master Owner Trust II,2018-1, FLR, 3.342% (LIBOR - 1mo. + 1.55%), 9/25/2023 (n) | | | 269,000 | | | | 269,395 | |
| Neuberger Berman CLO Ltd.,2015-19A, “A1R2”, FLR, 2.8% (LIBOR - 3mo. + 0.80%), 7/15/2027 (n) | | | 250,000 | | | | 249,569 | |
| Neuberger Berman CLO Ltd.,2016-21A, “CR”, FLR, 3.565% (LIBOR - 3mo. + 1.6%), 4/20/2027 (n) | | | 250,000 | | | | 241,208 | |
| NextGear Floorplan Master Owner Trust,2017-2A, “B”, 3.02%, 10/17/2022 (n) | | | 212,000 | | | | 213,121 | |
| NextGear Floorplan Master Owner Trust,2018-1A, “B”, 3.57%, 2/15/2023 (n) | | | 200,000 | | | | 202,265 | |
| Parallel Ltd.,2015-1A, “DR”, FLR, 4.515% (LIBOR - 3mo. + 2.55%), 7/20/2027 (n) | | | 250,000 | | | | 236,484 | |
| Race Point CLO Ltd.,2013-8A, “CR”, FLR, 4.398% (LIBOR - 3mo. + 2.5%), 2/20/2030 (n) | | | 300,000 | | | | 295,690 | |
| Santander Drive Auto Receivables Trust,2017-2, “C”, 2.79%, 8/15/2022 | | | 121,364 | | | | 121,557 | |
| Securitized Term Auto Receivable Trust2019-CRTA, “C”, 2.849%, 3/25/2026 (n) | | | 128,950 | | | | 128,722 | |
| UBS Commercial Mortgage Trust,2017-C1, “A4”, 3.544%, 11/15/2050 | | | 251,247 | | | | 267,127 | |
| UBS Commercial Mortgage Trust,2017-C7, “A4”, 3.679%, 12/15/2050 | | | 155,000 | | | | 166,460 | |
| UBS Commercial Mortgage Trust,2017-C8, “A4”, 3.983%, 2/15/2051 | | | 400,000 | | | | 438,141 | |
| UBS Commercial Mortgage Trust,2019-C17, “A4”, 2.921%, 9/15/2052 | | | 197,844 | | | | 200,849 | |
| Wells Fargo Commercial Mortgage Trust,2016-C34, “A4”, 3.096%, 6/15/2049 | | | 260,000 | | | | 267,417 | |
| | | | | | | | |
| | |
| Issuer | | Shares/Par | | | Value ($) | |
| BONDS – continued | | | | | | | | |
| Asset-Backed & Securitized – continued | | | | | |
| Wells Fargo Commercial Mortgage Trust,2017-C42, “A5”, 3.589%, 12/15/2050 | | $ | 510,000 | | | $ | 545,512 | |
| Wells Fargo Commercial Mortgage Trust,2017-RB1, “A4”, 3.374%, 3/15/2050 | | | 280,000 | | | | 294,934 | |
| Wells Fargo Commercial Mortgage Trust,2019-C54, “A4”, 3.146%, 12/15/2052 | | | 167,746 | | | | 173,609 | |
| West CLO Ltd.,2014-1A, “CR”, FLR, 5.003% (LIBOR - 3mo. + 3%), 7/18/2026 (n) | | | 260,000 | | | | 260,002 | |
| Wind River CLO Ltd.,2012-1A, “CR2”, FLR, 4.05% (LIBOR - 3mo. + 2.05%), 1/15/2026 (n) | | | 250,000 | | | | 249,999 | |
| | | | | | | | |
| | | | | | $ | 15,547,054 | |
| | | | | | | | |
| Brokerage & Asset Managers – 1.9% | | | | | |
| E*TRADE Financial Corp., 4.5%, 6/20/2028 | | $ | 292,000 | | | $ | 317,329 | |
| Raymond James Financial, 3.625%, 9/15/2026 | | | 220,000 | | | | 232,319 | |
| TD Ameritrade Holding Corp., 3.3%, 4/01/2027 | | | 304,000 | | | | 318,097 | |
| | | | | | | | |
| | | | | | $ | 867,745 | |
| | | | | | | | |
| Building – 0.8% | | | | | |
| Martin Marietta Materials, Inc., 4.25%, 7/02/2024 | | $ | 215,000 | | | $ | 230,008 | |
| Martin Marietta Materials, Inc., 3.5%, 12/15/2027 | | | 115,000 | | | | 119,271 | |
| | | | | | | | |
| | | | | | $ | 349,279 | |
| | | | | | | | |
| Business Services – 0.6% | | | | | |
| Equinix, Inc., 2.9%, 11/18/2026 | | $ | 259,000 | | | $ | 259,453 | |
| | | | | | | | |
| Cable TV – 1.1% | | | | | |
| Comcast Corp., 4.15%, 10/15/2028 | | $ | 266,000 | | | $ | 299,220 | |
| Time Warner Cable, Inc., 4.5%, 9/15/2042 | | | 183,000 | | | | 186,601 | |
| | | | | | | | |
| | | | | | $ | 485,821 | |
| | | | | | | | |
| Computer Software – 0.6% | | | | | |
| Dell Investments LLC/EMC Corp., 5.3%, 10/01/2029 (n) | | $ | 224,000 | | | $ | 252,239 | |
| | | | | | | | |
| Computer Software – Systems – 0.7% | | | | | |
| Apple, Inc., 4.25%, 2/09/2047 | | $ | 250,000 | | | $ | 298,394 | |
| | | | | | | | |
| Conglomerates – 1.8% | | | | | |
| United Technologies Corp., 4.125%, 11/16/2028 | | $ | 444,000 | | | $ | 499,749 | |
| Wabtec Corp., 4.95%, 9/15/2028 | | | 304,000 | | | | 334,232 | |
| | | | | | | | |
| | | | | | $ | 833,981 | |
| | | | | | | | |
| Consumer Products – 1.5% | | | | | |
| Reckitt Benckiser Treasury Services | | | | | | | | |
| PLC, 3.625%, 9/21/2023 (n) | | $ | 259,000 | | | $ | 269,670 | |
| Reckitt Benckiser Treasury Services | | | | | | | | |
| PLC, 2.75%, 6/26/2024 (n) | | | 401,000 | | | | 408,664 | |
| | | | | | | | |
| | | | | | $ | 678,334 | |
| | | | | | | | |
| Consumer Services – 2.1% | | | | | |
| Booking Holdings, Inc., 3.55%, 3/15/2028 | | $ | 242,000 | | | $ | 257,566 | |
| Expedia Group, Inc., 3.25%, 2/15/2030 (n) | | | 300,000 | | | | 288,301 | |
9
MFS Strategic Income Portfolio
Portfolio of Investments – continued
| | | | | | | | |
| | |
| Issuer | | Shares/Par | | | Value ($) | |
| BONDS – continued | | | | | | | | |
| Consumer Services – continued | | | | | |
| Experian Finance PLC, 2.75%, 3/08/2030 (n) | | $ | 245,000 | | | $ | 241,002 | |
| Toll Road Investors Partnership II LP, | | | | | | | | |
| Capital Appreciation, 0%, 2/15/2026 (n) | | | 46,000 | | | | 34,196 | |
| Toll Road Investors Partnership II LP, | | | | | | | | |
| Capital Appreciation, 0%, 2/15/2029 (n) | | | 132,000 | | | | 83,996 | |
| Toll Road Investors Partnership II LP, | | | | | | | | |
| Capital Appreciation, 0%, 2/15/2031 (n) | | | 46,000 | | | | 26,361 | |
| | | | | | | | |
| | | | | | $ | 931,422 | |
| | | | | | | | |
| Electrical Equipment – 0.6% | | | | | |
| Arrow Electronics, Inc., 3.875%, 1/12/2028 | | $ | 280,000 | | | $ | 286,575 | |
| | | | | | | | |
| Electronics – 0.5% | | | | | |
| Broadcom Corp./Broadcom Cayman Finance Ltd., 3.5%, 1/15/2028 | | $ | 225,000 | | | $ | 226,347 | |
| | | | | | | | |
| Emerging Market Quasi-Sovereign – 2.6% | | | | | |
| Empresas Publicas de Medellin, 4.25%, 7/18/2029 (n) | | $ | 200,000 | | | $ | 207,841 | |
| KazTransGas JSC (Republic of Kazakhstan), 4.375%, 9/26/2027 | | | 200,000 | | | | 209,685 | |
| NAK Naftogaz Ukraine via Standard Bank London Holdings PLC, 7.625%, 11/08/2026 (n) | | | 200,000 | | | | 204,000 | |
| Petrobras Global Finance B.V. (Federative Republic of Brazil), 6.9%, 3/19/2049 | | | 102,000 | | | | 119,646 | |
| REC Ltd. (Republic of India), 3.875%, 7/07/2027 | | | 200,000 | | | | 198,913 | |
| Southern Gas Corridor CJSC (Republic of Azerbaijan), 6.875%, 3/24/2026 | | | 200,000 | | | | 236,848 | |
| | | | | | | | |
| | | | | | $ | 1,176,933 | |
| | | | | | | | |
| Emerging Market Sovereign – 3.1% | | | | | |
| Arab Republic of Egypt, 7.052%, 1/15/2032 (n) | | $ | 200,000 | | | $ | 209,544 | |
| Federative Republic of Brazil, 4.5%, 5/30/2029 | | | 200,000 | | | | 211,900 | |
| Government of Ukraine, GDP Linked Bond, 0%, 5/31/2040 | | | 131,000 | | | | 125,269 | |
| Ivory Coast, 5.875%, 10/17/2031 (n) | | EUR | 103,000 | | | | 119,948 | |
| Republic of Angola, 8%, 11/26/2029 (n) | | $ | 200,000 | | | | 213,091 | |
| Republic of Costa Rica, 6.125%, 2/19/2031 (n) | | | 200,000 | | | | 212,750 | |
| Republic of Montenegro, 2.55%, 10/03/2029 (n) | | EUR | 106,000 | | | | 117,860 | |
| Republic of Turkey, 5.6%, 11/14/2024 | | $ | 200,000 | | | | 203,458 | |
| | | | | | | | |
| | | | | | $ | 1,413,820 | |
| | | | | | | | |
| Energy – Independent – 0.3% | | | | | |
| Canadian Oil Sands Co., 4.5%, 4/01/2022 (n) | | $ | 118,000 | | | $ | 121,656 | |
| | | | | | | | |
| Energy – Integrated – 0.9% | | | | | |
| Eni S.p.A., 4%, 9/12/2023 (n) | | $ | 200,000 | | | $ | 210,839 | |
| Eni S.p.A., 4.25%, 5/09/2029 (n) | | | 200,000 | | | | 219,339 | |
| | | | | | | | |
| | | | | | $ | 430,178 | |
| | | | | | | | |
| | | | | | | | |
| | |
| Issuer | | Shares/Par | | | Value ($) | |
| BONDS – continued | | | | | | | | |
| Financial Institutions – 0.5% | | | | | |
| GE Capital International Funding Co., 4.418%, 11/15/2035 | | $ | 200,000 | | | $ | 212,955 | |
| | | | | | | | |
| Food & Beverages – 0.6% | | | | | |
| Anheuser-Busch InBev Worldwide, Inc., 4.439%, 10/06/2048 | | $ | 125,491 | | | $ | 140,622 | |
| Bacardi Ltd., 5.15%, 5/15/2038 (n) | | | 115,000 | | | | 129,671 | |
| | | | | | | | |
| | | | | | $ | 270,293 | |
| | | | | | | | |
| Gaming & Lodging – 0.6% | | | | | |
| GLP Capital LP/GLP Financing II, Inc., 4%, 1/15/2030 | | $ | 268,000 | | | $ | 273,548 | |
| | | | | | | | |
| Insurance – 0.8% | | | | | |
| American International Group, Inc., 3.9%, 4/01/2026 | | $ | 229,000 | | | $ | 245,224 | |
| American International Group, Inc., 4.7%, 7/10/2035 | | | 59,000 | | | | 68,250 | |
| American International Group, Inc., 4.5%, 7/16/2044 | | | 53,000 | | | | 60,961 | |
| | | | | | | | |
| | | | | | $ | 374,435 | |
| | | | | | | | |
| Insurance – Property & Casualty – 2.1% | | | | | |
| Allied World Assurance Co. Holdings Ltd., 4.35%, 10/29/2025 | | $ | 310,000 | | | $ | 326,992 | |
| Fairfax Financial Holdings Ltd., 4.85%, 4/17/2028 | | | 283,000 | | | | 308,001 | |
| Marsh & McLennan Cos., Inc., 4.2%, 3/01/2048 | | | 277,000 | | | | 314,289 | |
| | | | | | | | |
| | | | | | $ | 949,282 | |
| | | | | | | | |
| International Market Quasi-Sovereign – 0.6% | | | | | |
| Dexia Credit Local S.A. (Kingdom of Belgium), 2.25%, 2/18/2020 (n) | | $ | 270,000 | | | $ | 270,116 | |
| | | | | | | | |
| Machinery & Tools – 0.7% | | | | | |
| CNH Industrial Capital LLC, 4.2%, 1/15/2024 | | $ | 174,000 | | | $ | 184,192 | |
| CNH Industrial Capital LLC, 3.85%, 11/15/2027 | | | 145,000 | | | | 151,215 | |
| | | | | | | | |
| | | | | | $ | 335,407 | |
| | | | | | | | |
| Major Banks – 5.3% | | | | | |
| Bank of America Corp., 4.125%, 1/22/2024 | | $ | 136,000 | | | $ | 146,276 | |
| Bank of America Corp., 3.248%, 10/21/2027 | | | 656,000 | | | | 683,110 | |
| Bank of America Corp., 4.271% to 7/23/2028, FLR (LIBOR - 3mo. + 1.31%) to 7/23/2029 | | | 136,000 | | | | 150,971 | |
| Barclays PLC, 4.375%, 1/12/2026 | | | 200,000 | | | | 216,060 | |
| JPMorgan Chase & Co., 3.125%, 1/23/2025 | | | 325,000 | | | | 339,065 | |
| JPMorgan Chase & Co., 3.882% to 7/24/2037, FLR (LIBOR - 3mo. + 1.36%) to 7/24/2038 | | | 269,000 | | | | 297,040 | |
| UBS Group Funding (Switzerland) AG, 4.253%, 3/23/2028 (n) | | | 215,000 | | | | 234,864 | |
| Wells Fargo & Co., 3.196% to 6/17/2026, FLR (LIBOR - 3mo. + 1.17%) to 6/17/2027 | | | 317,000 | | | | 328,585 | |
| | | | | | | | |
| | | | | | $ | 2,395,971 | |
| | | | | | | | |
10
MFS Strategic Income Portfolio
Portfolio of Investments – continued
| | | | | | | | |
| | |
| Issuer | | Shares/Par | | | Value ($) | |
| BONDS – continued | | | | | | | | |
| Medical & Health Technology & Services – 1.0% | | | | | |
| Alcon Finance Corp., 2.75%, 9/23/2026 (n) | | $ | 200,000 | | | $ | 203,480 | |
| Toledo Hospital, 5.325%, 11/15/2028 | | | 239,000 | | | | 259,925 | |
| | | | | | | | |
| | | | | | $ | 463,405 | |
| | | | | | | | |
| Medical Equipment – 0.6% | | | | | |
| Abbott Laboratories, 4.75%, 11/30/2036 | | $ | 205,000 | | | $ | 255,847 | |
| | | | | | | | |
| Midstream – 1.3% | | | | | |
| Cheniere Energy, Inc., 3.7%, 11/15/2029 (n) | | $ | 263,000 | | | $ | 268,203 | |
| MPLX LP, 4.5%, 4/15/2038 | | | 309,000 | | | | 313,709 | |
| | | | | | | | |
| | | | | | $ | 581,912 | |
| | | | | | | | |
| Mortgage-Backed – 2.9% | | | | | |
| Fannie Mae, 5.5%, 3/01/2020 - 9/01/2034 | | $ | 9,883 | | | $ | 11,104 | |
| Fannie Mae, 6.5%, 4/01/2032 | | | 16,918 | | | | 19,057 | |
| Fannie Mae, 3%, 2/25/2033 | | | 60,943 | | | | 7,188 | |
| Fannie Mae, TBA,2.5%, 1/16/2035 - 2/18/2035 | | | 450,000 | | | | 453,767 | |
| Fannie Mae, TBA, 3.5%, 1/14/2050 | | | 225,000 | | | | 231,334 | |
| Freddie Mac, 4.224%, 3/25/2020 | | | 138,926 | | | | 138,873 | |
| Ginnie Mae, 3.5%, 12/20/2049 | | | 225,000 | | | | 233,068 | |
Ginnie Mae, TBA,
3%, 1/21/2050 - 3/23/2050 | | | 225,000 | | | | 230,859 | |
| | | | | | | | |
| | | | | | $ | 1,325,250 | |
| | | | | | | | |
| Municipals – 2.3% | | | | | |
| Bridgeview, IL, Stadium and Redevelopment Projects, 5.14%, 12/01/2036 | | $ | 195,000 | | | $ | 197,256 | |
| Chicago, IL, “B”, 7.375%, 1/01/2033 | | | 22,000 | | | | 26,353 | |
| New Jersey Economic Development Authority State Pension Funding Rev., “A”, 7.425%, 2/15/2029 | | | 177,000 | | | | 221,910 | |
| New Jersey Economic Development Authority State Pension Funding Rev., Capital Appreciation, “B”, 0%, 2/15/2023 | | | 350,000 | | | | 324,447 | |
| Puerto Rico Electric Power Authority Rev., “A”, 5%, 7/01/2042 (a)(d) | | | 5,000 | | | | 3,788 | |
| Puerto Rico Electric Power Authority Rev., “ZZ”, 5%, 7/01/2022 (a)(d) | | | 75,000 | | | | 55,500 | |
| Puerto Rico Sales Tax Financing Corp., Restructured Sales Tax Rev.,“2019A-1”, 4.55%, 7/01/2040 | | | 6,000 | | | | 6,212 | |
| Puerto Rico Sales Tax Financing Corp., Restructured Sales Tax Rev.,“2019A-1”, 4.75%, 7/01/2053 | | | 31,000 | | | | 32,365 | |
| Puerto Rico Sales Tax Financing Corp., Restructured Sales Tax Rev.,“2019A-1”, 5%, 7/01/2058 | | | 78,000 | | | | 82,760 | |
| Puerto Rico Sales Tax Financing Corp., Restructured Sales Tax Rev., Capital Appreciation,“2019A-1”, 0%, 7/01/2024 | | | 4,000 | | | | 3,511 | |
| Puerto Rico Sales Tax Financing Corp., Restructured Sales Tax Rev., Capital Appreciation,“2019A-1”, 0%, 7/01/2027 | | | 8,000 | | | | 6,388 | |
| Puerto Rico Sales Tax Financing Corp., Restructured Sales Tax Rev., Capital Appreciation,“2019A-1”, 0%, 7/01/2029 | | | 8,000 | | | | 5,936 | |
| | | | | | | | |
| | |
| Issuer | | Shares/Par | | | Value ($) | |
| BONDS – continued | | | | | | | | |
| Municipals – continued | | | | | |
| Puerto Rico Sales Tax Financing Corp., Restructured Sales Tax Rev., Capital Appreciation,“2019A-1”, 0%, 7/01/2031 | | $ | 10,000 | | | $ | 6,866 | |
| Puerto Rico Sales Tax Financing Corp., Restructured Sales Tax Rev., Capital Appreciation,“2019A-1”, 0%, 7/01/2033 | | | 11,000 | | | | 6,998 | |
| Puerto Rico Sales Tax Financing Corp., Restructured Sales Tax Rev., Capital Appreciation,“2019A-1”, 0%, 7/01/2046 | | | 108,000 | | | | 28,934 | |
| Puerto Rico Sales Tax Financing Corp., Restructured Sales Tax Rev., Capital Appreciation,“2019A-1”, 0%, 7/01/2051 | | | 88,000 | | | | 17,175 | |
| | | | | | | | |
| | | | | | $ | 1,026,399 | |
| | | | | | | | |
| Other Banks & Diversified Financials – 1.2% | | | | | |
| Bangkok Bank (Hong Kong), 3.733% to 9/25/2029, FLR (CMT - 5yr. + 1.9%) to 9/25/2034 (n) | | $ | 200,000 | | | $ | 202,189 | |
| BBVA USA, 2.875%, 6/29/2022 | | | 250,000 | | | | 253,451 | |
| JSC Kazkommertsbank, 5.5%, 12/21/2022 | | | 72,530 | | | | 73,013 | |
| | | | | | | | |
| | | | | | $ | 528,653 | |
| | | | | | | | |
| Pharmaceuticals – 0.4% | | | | | |
| Allergan Funding SCS, 3.8%, 3/15/2025 | | $ | 179,000 | | | $ | 187,936 | |
| | | | | | | | |
| Railroad & Shipping – 0.5% | | | | | |
| Lima Metro Line 2 Finance Ltd., 4.35%, 4/05/2036 (n) | | $ | 200,000 | | | $ | 211,750 | |
| | | | | | | | |
| Real Estate – Apartment – 0.6% | | | | | |
| Mid-America Apartments, 2.75%, 3/15/2030 | | $ | 259,000 | | | $ | 258,034 | |
| | | | | | | | |
| Real Estate – Retail – 0.6% | | | | | |
| VEREIT Operating Partnership LP, REIT, 3.1%, 12/15/2029 | | $ | 259,000 | | | $ | 254,313 | |
| | | | | | | | |
| Supranational – 0.8% | | | | | |
| Corporacion Andina de Fomento, 4.375%, 6/15/2022 | | $ | 340,000 | | | $ | 356,619 | |
| | | | | | | | |
| Telecommunications – Wireless – 1.1% | | | | | |
| American Tower Corp., REIT, 3.55%, 7/15/2027 | | $ | 358,000 | | | $ | 375,004 | |
| American Tower Corp., REIT, 3.6%, 1/15/2028 | | | 125,000 | | | | 131,197 | |
| | | | | | | | |
| | | | | | $ | 506,201 | |
| | | | | | | | |
| Transportation – Services – 0.6% | | | | | |
| ERAC USA Finance LLC, 3.8%, 11/01/2025 (n) | | $ | 267,000 | | | $ | 281,966 | |
| | | | | | | | |
| U.S. Government Agencies and Equivalents – 0.2% | |
| Small Business Administration, 6.35%, 4/01/2021 | | $ | 879 | | | $ | 890 | |
| Small Business Administration, 4.77%, 4/01/2024 | | | 13,752 | | | | 14,241 | |
| Small Business Administration, 4.99%, 9/01/2024 | | | 11,061 | | | | 11,484 | |
| Small Business Administration, 4.86%, 1/01/2025 | | | 14,357 | | | | 14,921 | |
11
MFS Strategic Income Portfolio
Portfolio of Investments – continued
| | | | | | | | |
| | |
| Issuer | | Shares/Par | | | Value ($) | |
| BONDS – continued | | | | | | | | |
| U.S. Government Agencies and Equivalents – continued | |
| Small Business Administration, 4.625%, 2/01/2025 | | $ | 20,133 | | | $ | 20,958 | |
| Small Business Administration, 5.11%, 8/01/2025 | | | 15,720 | | | | 16,477 | |
| | | | | | | | |
| | | | | | $ | 78,971 | |
| | | | | | | | |
| U.S. Treasury Obligations – 3.7% | | | | | |
| U.S. Treasury Bonds, 2.5%, 2/15/2045 (f) | | $ | 1,619,000 | | | $ | 1,649,840 | |
| | | | | | | | |
| Utilities – Electric Power – 2.2% | | | | | |
| Enel Finance International N.V., 3.625%, 5/25/2027 (n) | | $ | 280,000 | | | $ | 289,788 | |
| Enel Finance International N.V., 4.875%, 6/14/2029 (n) | | | 200,000 | | | | 225,522 | |
| FirstEnergy Corp., 4.85%, 7/15/2047 | | | 190,000 | | | | 225,349 | |
| Mong Duong Finance Holdings B.V., 5.125%, 5/07/2029 (n) | | | 250,000 | | | | 255,626 | |
| | | | | | | | |
| | | | | | $ | 996,285 | |
| | | | | | | | |
Total Bonds
(Identified Cost, $37,513,390) | | | | | | $ | 38,500,817 | |
| | | | | | | | |
| |
| COMMON STOCKS – 0.0% | | | | | |
| Energy – Independent – 0.0% | | | | | |
| Frontera Energy Corp. (Identified Cost, $106,984) | | | 1,188 | | | $ | 8,946 | |
| | | | | | | | |
| | | | | | | | |
| | |
| Issuer | | Shares/Par | | | Value ($) | |
| INVESTMENT COMPANIES (h) – 11.4% | | | | | |
| Bond Funds – 11.3% | | | | | |
| MFS High Yield Pooled Portfolio (v) | | | 541,474 | | | $ | 5,079,021 | |
| | | | | | | | |
| Money Market Funds – 0.1% | | | | | |
| MFS Institutional Money Market Portfolio, 1.7% (v) | | | 48,852 | | | $ | 48,852 | |
| | | | | | | | |
Total Investment Companies
(Identified Cost, $5,718,695) | | | | | | $ | 5,127,873 | |
| | | | | | | | |
| | | | | | | | | | | | | | | | | | |
| | | | | |
Underlying/
Expiration Date/Exercise
Price | | Put/
Call | | | Counter- party | | Notional
Amount | | | Par
Amount/
Number of
Contracts | | | | |
| PURCHASED OPTIONS – 0.0% | | | | | | | | | |
| Market Index Securities – 0.0% | | | | | | | | | |
| Markit CDX North America Investment Grade Index – March 2020 @ $72.5 (Premiums Paid, $18,450) | | | Put | | | Goldman
Sachs
International | | $ | 4,618,196 | | | $ | 4,500,000 | | | $ | 1,420 | |
| | | | | | | | | | | | | | | | | | |
OTHER ASSETS, LESS
LIABILITIES – 3.1% | | | | | | | | | | | 1,401,414 | |
| | | | | | | | | | | | | | | | | | |
| NET ASSETS – 100.0% | | | | | | | | | | $ | 45,040,470 | |
| | | | | | | | | | | | | | | | | | |
| (a) | | Non-income producing security. |
| (f) | | All or a portion of the security has been segregated as collateral for open futures contracts. |
| (h) | | An affiliated issuer, which may be considered one in which the fund owns 5% or more of the outstanding voting securities, or a company which is under common control. At period end, the aggregate values of the fund’s investments in affiliated issuers and in unaffiliated issuers were $5,127,873 and $38,511,183, respectively. |
| (i) | | Interest only security for which the fund receives interest on notional principal (Par amount). Par amount shown is the notional principal and does not reflect the cost of the security. |
| (n) | | Securities exempt from registration under Rule 144A of the Securities Act of 1933. These securities may be sold in the ordinary course of business in transactions exempt from registration, normally to qualified institutional buyers. At period end, the aggregate value of these securities was $16,650,819, representing 37.0% of net assets. |
| (p) | | Payment-in-kind (PIK) security for which interest income may be received in additional securities and/or cash. |
| (v) | | Affiliated issuer that is available only to investment companies managed by MFS. The rate quoted for the MFS Institutional Money Market Portfolio is the annualizedseven-day yield of the fund at period end. |
The following abbreviations are used in this report and are defined:
| CDO | | Collateralized Debt Obligation |
| CLO | | Collateralized Loan Obligation |
| CMT | | Constant Maturity Treasury |
| FLR | | Floating Rate. Interest rate resets periodically based on the parenthetically disclosed reference rate plus a spread (if any). Theperiod-end rate reported may not be the current rate. All reference rates are USD unless otherwise noted. |
| LIBOR | | London Interbank Offered Rate |
| REIT | | Real Estate Investment Trust |
Abbreviations indicate amounts shown in currencies other than the U.S. dollar. All amounts are stated in U.S. dollars unless otherwise indicated. A list of abbreviations is shown below:
12
MFS Strategic Income Portfolio
Portfolio of Investments – continued
Derivative Contracts at 12/31/19
Forward Foreign Currency Exchange Contracts
| | | | | | | | | | | | | | | | | | | | |
| Currency Purchased | | | | | Currency Sold | | Counterparty | | Settlement Date | | | Unrealized
Appreciation
(Depreciation) | |
| Asset Derivatives | | | | | | | | | | | | |
| USD | | | 2,214,631 | | | | | JPY | | 240,000,000 | | State Street Bank Corp. | | | 1/06/2020 | | | | $5,805 | |
| | | | | | | | | | | | | | | | | | | | |
| Liability Derivatives | | | | | | | | | | | | |
| USD | | | 262,992 | | | | | EUR | | 235,928 | | BNP Paribas S.A. | | | 2/28/2020 | | | | $(2,572 | ) |
| | | | | | | | | | | | | | | | | | | | |
Futures Contracts
| | | | | | | | | | | | | | | | | | | | |
| Description | | Long/
Short | | Currency | | | Contracts | | | Notional
Amount | | | Expiration
Date | | Value/Unrealized
Appreciation
(Depreciation) | |
| Asset Derivatives | | | | | | | | | | | | | | | |
| Interest Rate Futures | | | | | | | | | | | | | | | |
| U.S. Treasury Ultra Note 10 yr | | Short | | | USD | | | | 28 | | | | $3,939,687 | | | March - 2020 | | | $57,261 | |
| | | | | | | | | | | | | | | | | | | | |
| Liability Derivatives | | | | | | | | | | | | | | | |
| Interest Rate Futures | | | | | | | | | | | | | | | |
| U.S. Treasury Note 2 yr | | Long | | | USD | | | | 34 | | | | $7,327,000 | | | March - 2020 | | | $(4,198 | ) |
| U.S. Treasury Note 5 yr | | Long | | | USD | | | | 12 | | | | 1,423,312 | | | March - 2020 | | | (6,047 | ) |
| U.S. Treasury Ultra Bond | | Long | | | USD | | | | 15 | | | | 2,724,844 | | | March - 2020 | | | (94,216 | ) |
| | | | | | | | | | | | | | | | | | | | |
| | | | | | | | | | | | | | | | | | | $(104,461 | ) |
| | | | | | | | | | | | | | | | | | | | |
At December 31, 2019, the fund had liquid securities with an aggregate value of $65,219 to cover any collateral or margin obligations for certain derivative contracts.
See Notes to Financial Statements
13
MFS Strategic Income Portfolio
FINANCIAL STATEMENTS | STATEMENT OF ASSETS AND LIABILITIES
This statement represents your fund’s balance sheet, which details the assets and liabilities comprising the total value of the fund.
| | | | |
At 12/31/19 | | | | |
| |
Assets | | | | |
Investments in unaffiliated issuers, at value (identified cost, $37,638,824) | | | $38,511,183 | |
Investments in affiliated issuers, at value (identified cost, $5,718,695) | | | 5,127,873 | |
Cash | | | 4,386 | |
Foreign currency, at value (identified cost, $2,209,436) | | | 2,208,826 | |
Receivables for | | | | |
Forward foreign currency exchange contracts | | | 5,805 | |
Investments sold | | | 17,185 | |
Investments sold on an extended settlement basis | | | 51,279 | |
Fund shares sold | | | 14,618 | |
Interest | | | 251,520 | |
Receivable from investment adviser | | | 1,186 | |
Other assets | | | 538 | |
Total assets | | | $46,194,399 | |
| |
Liabilities | | | | |
Payables for | | | | |
Forward foreign currency exchange contracts | | | $2,572 | |
Net daily variation margin on open futures contracts | | | 11,184 | |
Investments purchased on an extended settlement basis | | | 968,104 | |
Fund shares reacquired | | | 105,068 | |
Payable to affiliates | | | | |
Administrative services fee | | | 96 | |
Shareholder servicing costs | | | 21 | |
Distribution and/or service fees | | | 87 | |
Payable for independent Trustees’ compensation | | | 3 | |
Accrued expenses and other liabilities | | | 66,794 | |
Total liabilities | | | $1,153,929 | |
Net assets | | | $45,040,470 | |
| |
Net assets consist of | | | | |
Paid-in capital | | | $43,727,048 | |
Total distributable earnings (loss) | | | 1,313,422 | |
Net assets | | | $45,040,470 | |
Shares of beneficial interest outstanding | | | 4,518,760 | |
| | | | | | | | | | | | |
| | | |
| | | Net assets | | | Shares
outstanding | | | Net asset value
per share | |
Initial Class | | | $38,669,809 | | | | 3,875,093 | | | | $9.98 | |
Service Class | | | 6,370,661 | | | | 643,667 | | | | 9.90 | |
See Notes to Financial Statements
14
MFS Strategic Income Portfolio
FINANCIAL STATEMENTS | STATEMENT OF OPERATIONS
This statement describes how much your fund earned in investment income and accrued in expenses. It also describes any gains and/or losses generated by fund operations.
| | | | |
Year ended 12/31/19 | | | | |
| |
Net investment income (loss) | | | | |
Income | | | | |
Interest | | | $1,413,039 | |
Dividends from affiliated issuers | | | 436,345 | |
Dividends | | | 1,283 | |
Other | | | 817 | |
Foreign taxes withheld | | | (172 | ) |
Total investment income | | | $1,851,312 | |
Expenses | | | | |
Management fee | | | $293,150 | |
Distribution and/or service fees | | | 16,145 | |
Shareholder servicing costs | | | 6,298 | |
Administrative services fee | | | 17,500 | |
Independent Trustees’ compensation | | | 1,357 | |
Custodian fee | | | 12,494 | |
Shareholder communications | | | 13,087 | |
Audit and tax fees | | | 79,681 | |
Legal fees | | | 980 | |
Miscellaneous | | | 33,205 | |
Total expenses | | | $473,897 | |
Reduction of expenses by investment adviser | | | (103,748 | ) |
Net expenses | | | $370,149 | |
Net investment income (loss) | | | $1,481,163 | |
| |
Realized and unrealized gain (loss) | | | | |
Realized gain (loss) (identified cost basis) | | | | |
Unaffiliated issuers | | | $681,083 | |
Affiliated issuers | | | (99,076 | ) |
Futures contracts | | | 289,680 | |
Swap agreements | | | (27,660 | ) |
Forward foreign currency exchange contracts | | | 17,355 | |
Foreign currency | | | 38,024 | |
Net realized gain (loss) | | | $899,406 | |
Change in unrealized appreciation or depreciation | | | | |
Unaffiliated issuers | | | $1,976,826 | |
Affiliated issuers | | | 697,342 | |
Futures contracts | | | (140,399 | ) |
Swap agreements | | | 6,904 | |
Forward foreign currency exchange contracts | | | 52,117 | |
Translation of assets and liabilities in foreign currencies | | | (45,054 | ) |
Net unrealized gain (loss) | | | $2,547,736 | |
Net realized and unrealized gain (loss) | | | $3,447,142 | |
Change in net assets from operations | | | $4,928,305 | |
See Notes to Financial Statements
15
MFS Strategic Income Portfolio
FINANCIAL STATEMENTS | STATEMENTS OF CHANGES IN NET ASSETS
These statements describe the increases and/or decreases in net assets resulting from operations, any distributions, and any shareholder transactions.
| | | | | | | | |
| | | Year ended | |
| | | 12/31/19 | | | 12/31/18 | |
Change in net assets | | | | | | | | |
| | |
From operations | | | | | | | | |
Net investment income (loss) | | | $1,481,163 | | | | $1,579,876 | |
Net realized gain (loss) | | | 899,406 | | | | (1,005,609 | ) |
Net unrealized gain (loss) | | | 2,547,736 | | | | (1,556,805 | ) |
Change in net assets from operations | | | $4,928,305 | | | | $(982,538 | ) |
Total distributions to shareholders | | | $(1,558,012 | ) | | | $(1,829,013 | ) |
Change in net assets from fund share transactions | | | $(3,054,588 | ) | | | $(2,160,371 | ) |
Total change in net assets | | | $315,705 | | | | $(4,971,922 | ) |
| | |
Net assets | | | | | | | | |
At beginning of period | | | 44,724,765 | | | | 49,696,687 | |
At end of period | | | $45,040,470 | | | | $44,724,765 | |
See Notes to Financial Statements
16
MFS Strategic Income Portfolio
FINANCIAL STATEMENTS | FINANCIAL HIGHLIGHTS
The financial highlights table is intended to help you understand the fund’s financial performance for the past 5 years. Certain information reflects financial results for a single fund share. The total returns in the table represent the rate that an investor would have earned (or lost) on an investment in the fund share class (assuming reinvestment of all distributions) held for the entire period.
| | | | | | | | | | | | | | | | | | | | |
| Initial Class | | Year ended | |
| | | | | |
| | | 12/31/19 | | | 12/31/18 | | | 12/31/17 | | | 12/31/16 | | | 12/31/15 | |
| | | | | |
Net asset value, beginning of period | | | $9.26 | | | | $9.84 | | | | $9.71 | | | | $9.25 | | | | $10.01 | |
| | | | | |
| Income (loss) from investment operations | | | | | | | | | | | | | | | | | | | | |
Net investment income (loss) (d) | | | $0.33 | | | | $0.33 | | | | $0.34 | | | | $0.40 | (c) | | | $0.37 | |
Net realized and unrealized gain (loss) | | | 0.74 | | | | (0.52 | ) | | | 0.26 | | | | 0.37 | | | | (0.55 | ) |
Total from investment operations | | | $1.07 | | | | $(0.19 | ) | | | $0.60 | | | | $0.77 | | | | $(0.18 | ) |
| | | | | |
| Less distributions declared to shareholders | | | | | | | | | | | | | | | | | | | | |
From net investment income | | | $(0.35 | ) | | | $(0.39 | ) | | | $(0.47 | ) | | | $(0.31 | ) | | | $(0.58 | ) |
Net asset value, end of period (x) | | | $9.98 | | | | $9.26 | | | | $9.84 | | | | $9.71 | | | | $9.25 | |
Total return (%) (k)(r)(s)(x) | | | 11.60 | | | | (1.99 | ) | | | 6.24 | | | | 8.24 | (c) | | | (1.85 | ) |
| | | | | |
Ratios (%) (to average net assets)
and Supplemental data: | | | | | | | | | | | | | | | | | | | | |
Expenses before expense reductions (f)(h) | | | 1.01 | | | | 1.03 | | | | 1.02 | | | | 0.89 | (c) | | | 0.96 | |
Expenses after expense reductions (f)(h) | | | 0.78 | | | | 0.80 | | | | 0.80 | | | | 0.71 | (c) | | | 0.80 | |
Net investment income (loss) | | | 3.32 | | | | 3.42 | | | | 3.39 | | | | 4.09 | (c) | | | 3.74 | |
Portfolio turnover | | | 104 | | | | 59 | | | | 72 | | | | 21 | | | | 31 | |
Net assets at end of period (000 omitted) | | | $38,670 | | | | $38,111 | | | | $42,409 | | | | $44,191 | | | | $47,422 | |
| |
| Service Class | | Year ended | |
| | | | | |
| | | 12/31/19 | | | 12/31/18 | | | 12/31/17 | | | 12/31/16 | | | 12/31/15 | |
| | | | | |
Net asset value, beginning of period | | | $9.19 | | | | $9.75 | | | | $9.63 | | | | $9.17 | | | | $9.92 | |
| | | | | |
| Income (loss) from investment operations | | | | | | | | | | | | | | | | | | | | |
Net investment income (loss) (d) | | | $0.30 | | | | $0.30 | | | | $0.31 | | | | $0.37 | (c) | | | $0.34 | |
Net realized and unrealized gain (loss) | | | 0.74 | | | | (0.50 | ) | | | 0.25 | | | | 0.37 | | | | (0.54 | ) |
Total from investment operations | | | $1.04 | | | | $(0.20 | ) | | | $0.56 | | | | $0.74 | | | | $(0.20 | ) |
| | | | | |
| Less distributions declared to shareholders | | | | | | | | | | | | | | | | | | | | |
From net investment income | | | $(0.33 | ) | | | $(0.36 | ) | | | $(0.44 | ) | | | $(0.28 | ) | | | $(0.55 | ) |
Net asset value, end of period (x) | | | $9.90 | | | | $9.19 | | | | $9.75 | | | | $9.63 | | | | $9.17 | |
Total return (%) (k)(r)(s)(x) | | | 11.29 | | | | (2.11 | ) | | | 5.88 | | | | 8.00 | (c) | | | (2.06 | ) |
| | | | | |
Ratios (%) (to average net assets)
and Supplemental data: | | | | | | | | | | | | | | | | | | | | |
Expenses before expense reductions (f)(h) | | | 1.26 | | | | 1.28 | | | | 1.27 | | | | 1.14 | (c) | | | 1.21 | |
Expenses after expense reductions (f)(h) | | | 1.03 | | | | 1.05 | | | | 1.05 | | | | 0.97 | (c) | | | 1.05 | |
Net investment income (loss) | | | 3.07 | | | | 3.17 | | | | 3.16 | | | | 3.83 | (c) | | | 3.49 | |
Portfolio turnover | | | 104 | | | | 59 | | | | 72 | | | | 21 | | | | 31 | |
Net assets at end of period (000 omitted) | | | $6,371 | | | | $6,614 | | | | $7,287 | | | | $8,776 | | | | $9,548 | |
See Notes to Financial Statements
17
MFS Strategic Income Portfolio
Financial Highlights – continued
| (c) | Amount reflects aone-time reimbursement of expenses by the custodian (or former custodian) without which net investment income and performance would be lower and expenses would be higher. |
| (d) | Per share data is based on average shares outstanding. |
| (f) | Ratios do not reflect reductions from fees paid indirectly, if applicable. |
| (h) | In addition to the fees and expenses which the fund bears directly, the fund indirectly bears a pro rata share of the fees and expenses of the underlying affiliated funds in which the fund invests. Accordingly, the expense ratio for the fund reflects only those fees and expenses borne directly by the fund. Because the underlying affiliated funds have varied expense and fee levels and the fund may own different proportions of the underlying affiliated funds at different times, the amount of fees and expenses incurred indirectly by the fund will vary. |
| (k) | The total return does not reflect expenses that apply to separate accounts. Inclusion of these charges would reduce the total return figures for all periods shown. |
| (r) | Certain expenses have been reduced without which performance would have been lower. |
| (s) | From time to time the fund may receive proceeds from litigation settlements, without which performance would be lower. |
| (x) | The net asset values and total returns have been calculated on net assets which include adjustments made in accordance with U.S. generally accepted accounting principles required at period end for financial reporting purposes. |
See Notes to Financial Statements
18
MFS Strategic Income Portfolio
NOTES TO FINANCIAL STATEMENTS
| (1) | | Business and Organization |
MFS Strategic Income Portfolio (the fund) is a diversified series of MFS Variable Insurance Trust II (the trust). The trust is organized as a Massachusetts business trust and is registered under the Investment Company Act of 1940, as amended, as anopen-end management investment company. The shareholders of each series of the trust are separate accounts of insurance companies, which offer variable annuity and/or life insurance products, and qualified retirement and pension plans.
The fund is an investment company and accordingly follows the investment company accounting and reporting guidance of the Financial Accounting Standards Board (FASB) Accounting Standards Codification Topic 946 Financial Services – Investment Companies.
| (2) | | Significant Accounting Policies |
General– The preparation of financial statements in conformity with U.S. generally accepted accounting principles requires management to make estimates and assumptions that affect the reported amounts of assets and liabilities, and disclosure of contingent assets and liabilities at the date of the financial statements and the reported amounts of increases and decreases in net assets from operations during the reporting period. Actual results could differ from those estimates. In the preparation of these financial statements, management has evaluated subsequent events occurring after the date of the fund’s Statement of Assets and Liabilities through the date that the financial statements were issued. The fund invests in the MFS High Yield Pooled Portfolio (“High Yield Pooled Portfolio”). MFS does not receive a management fee from the High Yield Pooled Portfolio. The High Yield Pooled Portfolio’s investment objective is to seek total return with an emphasis on high current income, but also considering capital appreciation. The accounting policies of the High Yield Pooled Portfolio are outlined in its shareholder report, which is available without charge by calling1-800-225-2606 and on the Securities and Exchange Commission (SEC) web site at http://www.sec.gov. The accounting policies detailed in the Significant Accounting Policies note cover both the fund and the High Yield Pooled Portfolio. For purposes of this policy disclosure, “fund” refers to both the fund and the High Yield Pooled Portfolio in which the fund invests. The High Yield Pooled Portfolio’s shareholder report is not covered by this report. The fund and the High Yield Pooled Portfolio invest in high-yield securities rated below investment grade. Investments in below investment grade quality securities can involve a substantially greater risk of default or can already be in default, and their values can decline significantly. Below investment grade quality securities tend to be more sensitive to adverse news about the issuer, or the market or economy in general, than higher quality debt instruments. The fund and the High Yield Pooled Portfolio invest in foreign securities. Investments in foreign securities are vulnerable to the effects of changes in the relative values of the local currency and the U.S. dollar and to the effects of changes in each country’s market, economic, industrial, political, regulatory, geopolitical, and other conditions.
In March 2017, the FASB issued Accounting Standards Update2017-08, Receivables – Nonrefundable Fees and Other Costs (Subtopic310-20) – Premium Amortization on Purchased Callable Debt Securities (“ASU2017-08”). For callable debt securities purchased at a premium that have explicit,non-contingent call features and that are callable at fixed prices on preset dates,ASU 2017-08 requires the premium to be amortized to the earliest call date. The fund adopted ASU2017-08 as of the beginning of the reporting period on a modified retrospective basis. The adoption resulted in a change in accounting principle, since the fund had historically amortized such premiums to maturity for U.S. GAAP. As a result of the adoption, the fund recognized a cumulative effect adjustment that decreased the beginning of period cost of investments and increased the unrealized appreciation on investments by offsetting amounts. Adoption had no impact on the fund’s net assets or any prior period information presented in the financial statements. With respect to the fund’s results of operations, amortization of premium to first call date under ASU2017-08 accelerates amortization with the intent of more closely aligning the recognition of income on such bonds with the economics of the instrument.
Balance Sheet Offsetting– The fund’s accounting policy with respect to balance sheet offsetting is that, absent an event of default by the counterparty or a termination of the agreement, the International Swaps and Derivatives Association (ISDA) Master Agreement, or similar agreement, does not result in an offset of reported amounts of financial assets and financial liabilities in the Statement of Assets and Liabilities across transactions between the fund and the applicable counterparty. The fund’s right to setoff may be restricted or prohibited by the bankruptcy or insolvency laws of the particular jurisdiction to which a specific master netting agreement counterparty is subject. Balance sheet offsetting disclosures, to the extent applicable to the fund, have been included in the fund’s Significant Accounting Policies note under the captions for each of the fund’sin-scope financial instruments and transactions.
Investment Valuations– The investments of the fund and the High Yield Pooled Portfolio are valued as described below.
Equity securities, including restricted equity securities, are generally valued at the last sale or official closing price on their primary market or exchange as provided by a third-party pricing service. Equity securities, for which there were no sales reported that day, are generally valued at the last quoted daily bid quotation on their primary market or exchange as provided by a third-party pricing service. Debt instruments and floating rate loans, including restricted debt instruments, are generally valued at an evaluated or composite bid as provided by a third-party pricing service. Short-term instruments with a maturity at issuance of 60 days or less may be valued at amortized cost, which approximates market value. Exchange-traded options are generally valued at the last sale or
19
MFS Strategic Income Portfolio
Notes to Financial Statements – continued
official closing price on their primary exchange as provided by a third-party pricing service. Exchange-traded options for which there were no sales reported that day are generally valued at the last daily bid quotation on their primary exchange as provided by athird-party pricing service. For put options, the position may be valued at the last daily ask quotation if there are no trades reported during the day. Options not traded on an exchange are generally valued at a broker/dealer bid quotation. Foreign currency options are generally valued at valuations provided by a third-party pricing service. Futures contracts are generally valued at last posted settlement price on their primary exchange as provided by a third-party pricing service. Futures contracts for which there were no trades that day for a particular position are generally valued at the closing bid quotation on their primary exchange as provided by a third-party pricing service. Forward foreign currency exchange contracts are generally valued at the mean of bid and asked prices for the time period interpolated from rates provided by a third-party pricing service for proximate time periods. Swap agreements are generally valued using valuations provided by a third-party pricing service, which for cleared swaps includes an evaluation of any trading activity at the clearinghouses.Open-end investment companies are generally valued at net asset value per share. Securities and other assets generally valued on the basis of information from a third-party pricing service may also be valued at a broker/dealer bid quotation. In determining values, third-party pricing services can utilize both transaction data and market information such as yield, quality, coupon rate, maturity, type of issue, trading characteristics, and other market data. The values of foreign securities and other assets and liabilities expressed in foreign currencies are converted to U.S. dollars using the mean of bid and asked prices for rates provided by a third-party pricing service.
The Board of Trustees has delegated primary responsibility for determining or causing to be determined the value of the fund’s investments (including any fair valuation) to the adviser pursuant to valuation policies and procedures approved by the Board. If the adviser determines that reliable market quotations are not readily available, investments are valued at fair value as determined in good faith by the adviser in accordance with such procedures under the oversight of the Board of Trustees. Under the fund’s valuation policies and procedures, market quotations are not considered to be readily available for most types of debt instruments and floating rate loans and many types of derivatives. These investments are generally valued at fair value based on information from third-party pricing services. In addition, investments may be valued at fair value if the adviser determines that an investment’s value has been materially affected by events occurring after the close of the exchange or market on which the investment is principally traded (such as foreign exchange or market) and prior to the determination of the fund’s net asset value, or after the halt of trading of a specific security where trading does not resume prior to the close of the exchange or market on which the security is principally traded. The adviser generally relies on third-party pricing services or other information (such as the correlation with price movements of similar securities in the same or other markets; the type, cost and investment characteristics of the security; the business and financial condition of the issuer; and trading and other market data) to assist in determining whether to fair value and at what value to fair value an investment. The value of an investment for purposes of calculating the fund’s net asset value can differ depending on the source and method used to determine value. When fair valuation is used, the value of an investment used to determine the fund’s net asset value may differ from quoted or published prices for the same investment. There can be no assurance that the fund could obtain the fair value assigned to an investment if it were to sell the investment at the same time at which the fund determines its net asset value per share.
Various inputs are used in determining the value of the fund’s assets or liabilities. These inputs are categorized into three broad levels. In certain cases, the inputs used to measure fair value may fall into different levels of the fair value hierarchy. In such cases, an investment’s level within the fair value hierarchy is based on the lowest level of input that is significant to the fair value measurement. The fund’s assessment of the significance of a particular input to the fair value measurement in its entirety requires judgment, and considers factors specific to the investment. Level 1 includes unadjusted quoted prices in active markets for identical assets or liabilities. Level 2 includes other significant observable market-based inputs (including quoted prices for similar securities, interest rates, prepayment speed, and credit risk). Level 3 includes unobservable inputs, which may include the adviser’s own
20
MFS Strategic Income Portfolio
Notes to Financial Statements – continued
assumptions in determining the fair value of investments. Other financial instruments are derivative instruments, such as futures contracts and forward foreign currency exchange contracts. The following is a summary of the levels used as of December 31, 2019 in valuing the fund’s assets or liabilities:
| | | | | | | | | | | | | | | | |
| Financial Instruments | | Level 1 | | | Level 2 | | | Level 3 | | | Total | |
| Equity Securities | | | $8,946 | | | | $— | | | | $— | | | | $8,946 | |
| U.S. Treasury Bonds & U.S. Government Agencies & Equivalents | | | — | | | | 1,728,811 | | | | — | | | | 1,728,811 | |
| Non-U.S. Sovereign Debt | | | — | | | | 3,217,488 | | | | — | | | | 3,217,488 | |
| Municipal Bonds | | | — | | | | 1,026,399 | | | | — | | | | 1,026,399 | |
| U.S. Corporate Bonds | | | — | | | | 11,747,744 | | | | — | | | | 11,747,744 | |
| Residential Mortgage-Backed Securities | | | — | | | | 1,640,786 | | | | — | | | | 1,640,786 | |
| Commercial Mortgage-Backed Securities | | | — | | | | 9,176,158 | | | | — | | | | 9,176,158 | |
| Asset-Backed Securities (including CDOs) | | | — | | | | 6,055,360 | | | | — | | | | 6,055,360 | |
| Foreign Bonds | | | — | | | | 3,909,491 | | | | — | | | | 3,909,491 | |
| Mutual Funds | | | 5,127,873 | | | | — | | | | — | | | | 5,127,873 | |
| Total | | | $5,136,819 | | | | $38,502,237 | | | | $— | | | | $43,639,056 | |
| | | | |
| Other Financial Instruments | | | | | | | | | | | | |
| Futures Contracts – Assets | | | $57,261 | | | | $— | | | | $— | | | | $57,261 | |
| Futures Contracts – Liabilities | | | (104,461 | ) | | | — | | | | — | | | | (104,461 | ) |
| Forward Foreign Currency Exchange Contracts – Assets | | | — | | | | 5,805 | | | | — | | | | 5,805 | |
| Forward Foreign Currency Exchange Contracts – Liabilities | | | — | | | | (2,572 | ) | | | — | | | | (2,572 | ) |
For further information regarding security characteristics, see the Portfolio of Investments. Please refer to the High Yield Pooled Portfolio’s shareholder report for further information regarding the levels used in valuing its assets or liabilities.
Foreign Currency Translation– Purchases and sales of foreign investments, income, and expenses are converted into U.S. dollars based upon currency exchange rates prevailing on the respective dates of such transactions or on the reporting date for foreign denominated receivables and payables. Gains and losses attributable to foreign currency exchange rates on sales of securities are recorded for financial statement purposes as net realized gains and losses on investments. Gains and losses attributable to foreign exchange rate movements on receivables, payables, income and expenses are recorded for financial statement purposes as foreign currency transaction gains and losses. That portion of both realized and unrealized gains and losses on investments that results from fluctuations in foreign currency exchange rates is not separately disclosed.
Derivatives– The fund uses derivatives primarily to increase or decrease exposure to a particular market or segment of the market, or security, to increase or decrease interest rate or currency exposure, or as alternatives to direct investments. Derivatives are used for hedging ornon-hedging purposes. While hedging can reduce or eliminate losses, it can also reduce or eliminate gains. When the fund uses derivatives as an investment to increase market exposure, or for hedging purposes, gains and losses from derivative instruments may be substantially greater than the derivative’s original cost.
The derivative instruments used by the fund during the period were purchased options, futures contracts, forward foreign currency exchange contracts, and swap agreements. Depending on the type of derivative, the fund may exit a derivative position by entering into an offsetting transaction with a counterparty or exchange, negotiating an agreement with the derivative counterparty, or novating the position to a third party. The fund may be unable to promptly close out a futures position in instances where the daily fluctuation in the price for that type of future exceeds the daily limit set by the exchange. The fund’s period end derivatives, as presented in the Portfolio of Investments and the associated Derivative Contract tables, generally are indicative of the volume of its derivative activity during the period.
The following table presents, by major type of derivative contract, the fair value, on a gross basis, of the asset and liability components of derivatives held by the fund at December 31, 2019 as reported in the Statement of Assets and Liabilities:
| | | | | | | | | | |
| | | | | Fair Value (a) | |
| Risk | | Derivative Contracts | | Asset Derivatives | | | Liability Derivatives | |
| Interest Rate | | Interest Rate Futures | | | $57,261 | | | | $(104,461 | ) |
| Interest Rate | | Purchased Interest Rate Options | | | 1,420 | | | | — | |
| Foreign Exchange | | Forward Foreign Currency Exchange Contracts | | | 5,805 | | | | (2,572 | ) |
| Total | | | | | $64,486 | | | | $(107,033 | ) |
| (a) | The value of purchased options outstanding is included in investments in unaffiliated issuers, at value, within the fund’s Statement of Assets and Liabilities. Values presented in this table for futures contracts correspond to the values reported in the fund’s Portfolio of Investments. Only the current day net variation margin for futures contracts is separately reported within the fund’s Statement of Assets and Liabilities. |
21
MFS Strategic Income Portfolio
Notes to Financial Statements – continued
The following table presents, by major type of derivative contract, the realized gain (loss) on derivatives held by the fund for the year ended December 31, 2019 as reported in the Statement of Operations:
| | | | | | | | | | | | | | | | |
| Risk | | Futures
Contracts | | | Swap
Agreements | | | Forward Foreign
Currency
Exchange
Contracts | | | Unaffiliated Issuers
(Purchased
Options) | |
| Interest Rate | | | $289,680 | | | | $— | | | | $— | | | | $— | |
| Foreign Exchange | | | — | | | | — | | | | 17,355 | | | | — | |
| Credit | | | — | | | | (27,660 | ) | | | — | | | | (23,370 | ) |
| Total | | | $289,680 | | | | $(27,660 | ) | | | $17,355 | | | | $(23,370 | ) |
The following table presents, by major type of derivative contract, the change in unrealized appreciation or depreciation on derivatives held by the fund for the year ended December 31, 2019 as reported in the Statement of Operations:
| | | | | | | | | | | | | | | | |
| Risk | | Futures
Contracts | | | Swap
Agreements | | | Forward Foreign
Currency
Exchange
Contracts | | | Unaffiliated Issuers
(Purchased
Options) | |
| Interest Rate | | | $(140,399 | ) | | | $— | | | | $— | | | | $— | |
| Foreign Exchange | | | — | | | | — | | | | 52,117 | | | | — | |
| Credit | | | — | | | | 6,904 | | | | — | | | | (17,030 | ) |
| Total | | | $(140,399 | ) | | | $6,904 | | | | $52,117 | | | | $(17,030 | ) |
Derivative counterparty credit risk is managed through formal evaluation of the creditworthiness of all potential counterparties. On certain, but not all, uncleared derivatives, the fund attempts to reduce its exposure to counterparty credit risk whenever possible by entering into an ISDA Master Agreement on a bilateral basis. The ISDA Master Agreement gives each party to the agreement the right to terminate all transactions traded under such agreement if there is a specified deterioration in the credit quality of the other party. Upon an event of default or a termination of the ISDA Master Agreement, thenon-defaulting party has the right to close out all transactions traded under such agreement and to net amounts owed under each agreement to one net amount payable by one party to the other. This right to close out and net payments across all transactions traded under the ISDA Master Agreement could result in a reduction of the fund’s credit risk to such counterparty equal to any amounts payable by the fund under the applicable transactions, if any.
Collateral and margin requirements differ by type of derivative. For cleared derivatives (e.g., futures contracts, cleared swaps, and exchange-traded options), margin requirements are set by the clearing broker and the clearing house and collateral, in the form of cash or securities, is posted by the fund directly with the clearing broker. Collateral terms are counterparty agreement specific for uncleared derivatives (e.g., forward foreign currency exchange contracts, uncleared swap agreements, and uncleared options) and collateral, in the form of cash and securities, is held in segregated accounts with the fund’s custodian in connection with these agreements. For derivatives traded under an ISDA Master Agreement, which contains a collateral support annex, the collateral requirements are netted across all transactions traded under such counterparty-specific agreement and an amount is posted from one party to the other to collateralize such obligations. Cash that has been segregated or delivered to cover the fund’s collateral or margin obligations under derivative contracts, if any, will be reported separately in the Statement of Assets and Liabilities as restricted cash for uncleared derivatives and/or deposits with brokers for cleared derivatives. Securities pledged as collateral or margin for the same purpose, if any, are noted in the Portfolio of Investments. The fund may be required to make payments of interest on uncovered collateral or margin obligations with the broker. Any such payments are included in “Miscellaneous” expense in the Statement of Operations.
Purchased Options– The fund purchased put options for a premium. Purchased put options entitle the holder to sell a specified number of shares or units of a particular security, currency or index at a specified price at a specified date or within a specified period of time. Purchasing put options may hedge against an anticipated decline in the value of portfolio securities or currency or decrease the fund’s exposure to an underlying instrument.
The premium paid is initially recorded as an investment in the Statement of Assets and Liabilities. That investment is subsequentlymarked-to-market daily with the difference between the premium paid and the market value of the purchased option being recorded as unrealized appreciation or depreciation. Premiums paid for purchased put options which have expired are treated as realized losses on investments in the Statement of Operations. Upon the exercise or closing of a purchased put option, the premium paid is offset against the proceeds on the sale of the underlying security or financial instrument in order to determine the realized gain or loss on investments.
Whether or not the option is exercised, the fund’s maximum risk of loss from purchasing an option is the amount of premium paid. All option contracts involve credit risk if the counterparty to the option contract fails to perform. For uncleared options, this risk is
22
MFS Strategic Income Portfolio
Notes to Financial Statements – continued
mitigated in cases where there is an ISDA Master Agreement between the fund and the counterparty providing for netting as described above and, where applicable, by the posting of collateral by the counterparty to the fund to cover the fund’s exposure to the counterparty under such ISDA Master Agreement.
Futures Contracts– The fund entered into futures contracts which may be used to hedge against or obtain broad market exposure, interest rate exposure, currency exposure, or to manage duration. A futures contract represents a commitment for the future purchase or sale of an asset at a specified price on a specified date.
Upon entering into a futures contract, the fund is required to deposit with the broker, either in cash or securities, an initial margin in an amount equal to a specified percentage of the notional amount of the contract. Subsequent payments (variation margin) are made or received by the fund each day, depending on the daily fluctuations in the value of the contract, and are recorded for financial statement purposes as unrealized gain or loss by the fund until the contract is closed or expires at which point the gain or loss on futures contracts is realized.
The fund bears the risk of interest rates, exchange rates or securities prices moving unexpectedly, in which case, the fund may not achieve the anticipated benefits of the futures contracts and may realize a loss. While futures contracts may present less counterparty risk to the fund since the contracts are exchange traded and the exchange’s clearinghouse guarantees payments to the broker, there is still counterparty credit risk due to the insolvency of the broker. The fund’s maximum risk of loss due to counterparty credit risk is equal to the margin posted by the fund to the broker plus any gains or minus any losses on the outstanding futures contracts.
Forward Foreign Currency Exchange Contracts– The fund entered into forward foreign currency exchange contracts for the purchase or sale of a specific foreign currency at a fixed price on a future date. These contracts may be used to hedge the fund’s currency risk or fornon-hedging purposes. For hedging purposes, the fund may enter into contracts to deliver or receive foreign currency that the fund will receive from or use in its normal investment activities. The fund may also use contracts to hedge against declines in the value of foreign currency denominated securities due to unfavorable exchange rate movements. Fornon-hedging purposes, the fund may enter into contracts with the intent of changing the relative exposure of the fund’s portfolio of securities to different currencies to take advantage of anticipated exchange rate changes.
Forward foreign currency exchange contracts are adjusted by the daily exchange rate of the underlying currency and any unrealized gains or losses are recorded as a receivable or payable for forward foreign currency exchange contracts until the contract settlement date. On contract settlement date, any gain or loss on the contract is recorded as realized gains or losses on forward foreign currency exchange contracts.
Risks may arise upon entering into these contracts from unanticipated movements in the value of the contract and from the potential inability of counterparties to meet the terms of their contracts. Generally, the fund’s maximum risk due to counterparty credit risk is the unrealized gain on the contract due to the use of Continuous Linked Settlement, a multicurrency cash settlement system for the centralized settlement of foreign transactions. This risk is mitigated in cases where there is an ISDA Master Agreement between the fund and the counterparty providing for netting as described above and, where applicable, by the posting of collateral by the counterparty to the fund to cover the fund’s exposure to the counterparty under such ISDA Master Agreement.
Swap Agreements– During the period the fund entered into swap agreements. Swap agreements generally involve a periodic exchange of cash payments on a net basis, at specified intervals or upon the occurrence of specified events, between the fund and a counterparty. Certain swap agreements may be entered into as a bilateral contract (“uncleared swaps”) while others are required to be centrally cleared (“cleared swaps”). In a cleared swap transaction, the ultimate counterparty to the transaction is a clearinghouse (the “clearinghouse”). The contract is transferred and accepted by the clearinghouse immediately following execution of the swap contract with an executing broker. Thereafter, throughout the term of the cleared swap, the fund interfaces indirectly with the clearinghouse through a clearing broker and has counterparty risk to the clearing broker as well.
Both cleared and uncleared swap agreements are marked to market daily. The value of uncleared swap agreements is reported in the Statement of Assets and Liabilities as “Uncleared swaps, at value” which includes any related interest accruals to be paid or received by the fund. For cleared swaps, payments (variation margin) are made or received by the fund each day, depending on the daily fluctuations in the value of the cleared swap, such that only the current day net receivable or payable for variation margin is reported in the Statement of Assets and Liabilities.
For both cleared and uncleared swaps, the periodic exchange of net cash payments, at specified intervals or upon the occurrence of specified events as stipulated by the agreement, is recorded as realized gain or loss on swap agreements in the Statement of Operations. Premiums paid or received at the inception of the agreements are amortized using the effective interest method over the term of the agreement as realized gain or loss on swap agreements in the Statement of Operations. A liquidation payment received or made upon early termination is recorded as a realized gain or loss on swap agreements in the Statement of Operations. The change in unrealized appreciation or depreciation on swap agreements in the Statement of Operations reflects the aggregate change over the reporting period in the value of swaps net of any unamortized premiums paid or received.
23
MFS Strategic Income Portfolio
Notes to Financial Statements – continued
Risks related to swap agreements include the possible lack of a liquid market, unfavorable market and interest rate movements of the underlying instrument and the failure of the counterparty to perform under the terms of the agreements. The fund’s maximum risk of loss from counterparty credit risk is the discounted net value of the cash flows to be received from/paid to the counterparty over the contract’s remaining life, to the extent that the amount is positive. To address counterparty risk, uncleared swap agreements are limited to only highly-rated counterparties. Risk is further reduced by having an ISDA Master Agreement between the fund and the counterparty providing for netting as described above and, where applicable, by the posting of collateral by the counterparty to the fund to cover the fund’s exposure to the counterparty under such ISDA Master Agreement. The fund’s counterparty risk due to cleared swaps is mitigated by the fact that the clearinghouse is the true counterparty to the transaction and the regulatory requirement safeguards in the event of a clearing broker bankruptcy.
The fund entered into credit default swap agreements in order to manage its exposure to the market or certain sectors of the market, to reduce its credit risk exposure to defaults of corporate and sovereign issuers or to create exposure to corporate or sovereign issuers to which it is not otherwise exposed. In a credit default swap agreement, the protection buyer can make an upfront payment and will make a stream of payments to the protection seller based on a fixed percentage applied to the agreement notional amount in exchange for the right to receive a specified return upon the occurrence of a defined credit event on the reference obligation (which may be either a single security or a basket of securities issued by corporate or sovereign issuers) and, with respect to the cases where physical settlement applies, the delivery by the buyer to the seller of a defined deliverable obligation. Although agreement-specific, credit events generally consist of a combination of the following: bankruptcy, failure to pay, restructuring, obligation acceleration, obligation default, or repudiation/moratorium, each as defined in the 2003 ISDA Credit Derivatives Definitions as amended by the relevant agreement. Restructuring is generally not applicable when the reference obligation is issued by a North American corporation and obligation acceleration, obligation default, or repudiation/moratorium are generally only applicable when the reference obligation is issued by a sovereign entity or an entity in an emerging country. Upon determination of the final price for the deliverable obligation (or upon delivery of the deliverable obligation in the case of physical settlement), the difference between the value of the deliverable obligation and the swap agreement’s notional amount is recorded as realized gain or loss on swap agreements in the Statement of Operations.
Loans and Other Direct Debt Instruments– The fund invests in loans and loan participations or other receivables. These investments may include standby financing commitments, including revolving credit facilities, which contractually obligate the fund to supply additional cash to the borrower on demand. The fund generally provides this financial support in order to preserve its existing investment or to obtain a more senior secured interest in the assets of the borrower. Loan participations involve a risk of insolvency of the lending bank or other financial intermediary.
Indemnifications– Under the fund’s organizational documents, its officers and Trustees may be indemnified against certain liabilities and expenses arising out of the performance of their duties to the fund. Additionally, in the normal course of business, the fund enters into agreements with service providers that may contain indemnification clauses. The fund’s maximum exposure under these agreements is unknown as this would involve future claims that may be made against the fund that have not yet occurred.
Investment Transactions and Income– Investment transactions are recorded on the trade date. Interest income is recorded on the accrual basis. All premium and discount is amortized or accreted for financial statement purposes in accordance with U.S. generally accepted accounting principles. Some securities may be purchased on a “when-issued” or “forward delivery” basis, which means that the securities will be delivered to the fund at a future date, usually beyond customary settlement time. Dividends received in cash are recorded on theex-dividend date. Certain dividends from foreign securities will be recorded when the fund is informed of the dividend if such information is obtained subsequent to theex-dividend date. Dividend and interest payments received in additional securities are recorded on theex-dividend orex-interest date in an amount equal to the value of the security on such date. Debt obligations may be placed onnon-accrual status or set to accrue at a rate of interest less than the contractual coupon when the collection of all or a portion of interest has become doubtful. Interest income for those debt obligations may be further reduced by thewrite-off of the related interest receivables when deemed uncollectible.
The fund may receive proceeds from litigation settlements. Any proceeds received from litigation involving portfolio holdings are reflected in the Statement of Operations in realized gain/loss if the security has been disposed of by the fund or in unrealized gain/loss if the security is still held by the fund. Any other proceeds from litigation not related to portfolio holdings are reflected as other income in the Statement of Operations.
The fund purchased or sold debt securities on a when-issued or delayed delivery basis, or in a “To Be Announced” (TBA) or “forward commitment” transaction with delivery or payment to occur at a later date beyond the normal settlement period. When the fund sells securities on a when-issued, delayed delivery, or forward commitment basis, the fund typically owns or has the right to acquire securities equivalent in kind and amount to the delivered securities. At the time a fund enters into a commitment to purchase or sell a security, the transaction is recorded and the value of the security acquired or sold is reflected in the fund’s net asset value. The price of such security and the date that the security will be delivered and paid for are fixed at the time the transaction is negotiated. The value of the security may vary with market fluctuations. TBA securities resulting from these transactions are included in the
24
MFS Strategic Income Portfolio
Notes to Financial Statements – continued
Portfolio of Investments. TBA purchase (sale) commitments are held at carrying amount, which approximates fair value and are categorized as level 2 within the fair value hierarchy and included in Investments purchased or sold on an extended settlement basis in the Statement of Assets and Liabilities. No interest accrues to the fund until payment takes place. At the time that a fund enters into this type of transaction, the fund is required to have sufficient cash and/or liquid securities to cover its commitments. Losses may arise due to changes in the value of the underlying securities prior to settlement date or if the counterparty does not perform under the contract’s terms, or if the issuer does not issue the securities due to political, economic or other factors.
To mitigate the counterparty credit risk on TBA securities and other types of forward settling mortgage-backed securities, the fund whenever possible enters into a Master Securities Forward Transaction Agreement (“MSFTA”) on a bilateral basis with each of the counterparties with whom it undertakes a significant volume of transactions. The MSFTA gives each party to the agreement the right to terminate all transactions traded under such agreement if there is a specified deterioration in the credit quality of the other party. Upon an event of default or a termination of the MSFTA, thenon-defaulting party has the right to close out all transactions traded under such agreement and to net amounts owed under each transaction to one net amount payable by one party to the other. This right to close out and net payments across all transactions traded under the MSFTA could result in a reduction of the fund’s credit risk to such counterparty equal to any amounts payable by the fund under the applicable transactions, if any.
For mortgage-backed securities traded under a MSFTA, the collateral and margining requirements are contract specific. Collateral amounts across all transactions traded under such agreement are netted and an amount is posted from one party to the other to collateralize such obligations. Cash that has been pledged to cover the fund’s collateral or margin obligations under a MSFTA, if any, will be reported separately on the Statement of Assets and Liabilities as restricted cash. Securities pledged as collateral or margin for the same purpose, if any, are noted in the Portfolio of Investments.
Tax Matters and Distributions– The fund intends to qualify as a regulated investment company, as defined under Subchapter M of the Internal Revenue Code, and to distribute all of its taxable income, including realized capital gains. As a result, no provision for federal income tax is required. The fund’s federal tax returns, when filed, will remain subject to examination by the Internal Revenue Service for a three year period. Management has analyzed the fund’s tax positions taken on federal and state tax returns for all open tax years and does not believe that there are any uncertain tax positions that require recognition of a tax liability. Foreign taxes, if any, have been accrued by the fund in the accompanying financial statements in accordance with the applicable foreign tax law. Foreign income taxes may be withheld by certain countries in which the fund invests. Additionally, capital gains realized by the fund on securities issued in or by certain foreign countries may be subject to capital gains tax imposed by those countries.
Distributions to shareholders are recorded on theex-dividend date. Income and capital gain distributions are determined in accordance with income tax regulations, which may differ from U.S. generally accepted accounting principles. Certain capital accounts in the financial statements are periodically adjusted for permanent differences in order to reflect their tax character. These adjustments have no impact on net assets or net asset value per share. Temporary differences which arise from recognizing certain items of income, expense, gain or loss in different periods for financial statement and tax purposes will reverse at some time in the future.
Book/tax differences primarily relate to defaulted bonds, amortization and accretion of debt securities, and derivative transactions.
The tax character of distributions declared to shareholders for the last two fiscal years is as follows:
| | | | | | | | |
| | | Year ended
12/31/19 | | | Year ended
12/31/18 | |
| Ordinary income (including any short-term capital gains) | | | $1,558,012 | | | | $1,829,013 | |
The federal tax cost and the tax basis components of distributable earnings were as follows:
| | | | |
| As of 12/31/19 | | | | |
| |
| Cost of investments | | | $43,639,070 | |
| Gross appreciation | | | 1,286,705 | |
| Gross depreciation | | | (1,330,686 | ) |
| Net unrealized appreciation (depreciation) | | | $(43,981 | ) |
| |
| Undistributed ordinary income | | | 1,602,446 | |
| Capital loss carryforwards | | | (244,458 | ) |
| Other temporary differences | | | (585 | ) |
As of December 31, 2019, the fund had capital loss carryforwards available to offset future realized gains. These net capital losses may be carried forward indefinitely and their character is retained as short-term and/or long-term losses. Such losses are characterized as follows:
Multiple Classes of Shares of Beneficial Interest– The fund offers multiple classes of shares, which differ in their respective distribution and/or service fees. The fund’s income, realized and unrealized gain (loss), and common expenses are allocated to
25
MFS Strategic Income Portfolio
Notes to Financial Statements – continued
shareholders based on the daily net assets of each class. Dividends are declared separately for each class. Differences in per share dividend rates are generally due to differences in separate class expenses. The fund’s distributions declared to shareholders as reported in the Statements of Changes in Net Assets are presented by class as follows:
| | | | | | | | |
| | |
| | | Year ended
12/31/19 | | | Year ended
12/31/18 | |
| Initial Class | | | $1,348,342 | | | | $1,585,207 | |
| Service Class | | | 209,670 | | | | 243,806 | |
| Total | | | $1,558,012 | | | | $1,829,013 | |
| (3) | | Transactions with Affiliates |
Investment Adviser– The fund has an investment advisory agreement with MFS to provide overall investment management and related administrative services and facilities to the fund. For the period from January 1, 2019 through September 30, 2019, the management fee was computed daily and paid monthly at the following annual rates based on the fund’s average daily net assets:
| | | | |
| Up to $1 billion | | | 0.70% | |
| In excess of $1 billion | | | 0.65% | |
Effective October 1, 2019, the management fee is computed daily and paid monthly at the following annual rates based on the fund’s average daily net assets:
| | | | |
| Up to $1 billion | | | 0.50% | |
| In excess of $1 billion | | | 0.45% | |
MFS has agreed in writing to reduce its management fee by a specified amount if certain MFS mutual fund assets exceed thresholds agreed to by MFS and the fund’s Board of Trustees. For the year ended December 31, 2019, this management fee reduction amounted to $4,404, which is included in the reduction of total expenses in the Statement of Operations. The management fee incurred for the year ended December 31, 2019 was equivalent to an annual effective rate of 0.64% of the fund’s average daily net assets.
For the period from January 1, 2019 through July 31, 2019, the investment adviser had agreed in writing to pay a portion of the fund’s total annual operating expenses, excluding interest, taxes, extraordinary expenses, brokerage and transaction costs, and investment-related expenses (such as fees and expenses associated with investments in investment companies and other similar investment vehicles), such that total annual operating expenses did not exceed 0.80% of average daily net assets for the Initial Class shares and 1.05% of average daily net assets for the Service Class shares. This written agreement terminated on July 31, 2019. For the period from January 1, 2019 through July 31, 2019, this reduction amounted to $67,237, which is included in the reduction of total expenses in the Statement of Operations. Effective August 1, 2019, the investment adviser has agreed in writing to pay a portion of the fund’s total annual operating expenses, excluding interest, taxes, extraordinary expenses, brokerage and transaction costs, and investment-related expenses (such as fees and expenses associated with investments in investment companies and other similar investment vehicles), such that total annual operating expenses do not exceed 0.75% of average daily net assets for the Initial Class shares and 1.00% of average daily net assets for the Service Class shares. This written agreement will continue until modified by the fund’s Board of Trustees, but such agreement will continue at least until April 30, 2021. For the period from August 1, 2019 through December 31, 2019, this reduction amounted to $32,107, which is included in the reduction of total expenses in the Statement of Operations.
Distributor– MFS Fund Distributors, Inc. (MFD), a wholly-owned subsidiary of MFS, is the distributor of shares of the fund. The Trustees have adopted a distribution plan for the Service Class shares pursuant to Rule12b-1 under the Investment Company Act of 1940.
The fund’s distribution plan provides that the fund will pay MFD distribution and/or service fees equal to 0.25% per annum of its average daily net assets attributable to Service Class shares as partial consideration for services performed and expenses incurred by MFD and financial intermediaries (including participating insurance companies that invest in the fund to fund variable annuity and variable life insurance contracts, sponsors of qualified retirement and pension plans that invest in the fund, and affiliates of these participating insurance companies and plan sponsors) in connection with the sale and distribution of the Service Class shares. MFD may subsequently pay all, or a portion, of the distribution and/or service fees to financial intermediaries.
Shareholder Servicing Agent– MFS Service Center, Inc. (MFSC), a wholly-owned subsidiary of MFS, receives a fee from the fund for its services as shareholder servicing agent. For the year ended December 31, 2019, the fee was $5,753, which equated to 0.0127% annually of the fund’s average daily net assets. MFSC also receives payment from the fund forout-of-pocket expenses paid by MFSC on behalf of the fund. For the year ended December 31, 2019, these costs amounted to $545.
Administrator– MFS provides certain financial, legal, shareholder communications, compliance, and other administrative services to the fund. Under an administrative services agreement, the fund reimburses MFS the costs incurred to provide these services. The
26
MFS Strategic Income Portfolio
Notes to Financial Statements – continued
fund is charged an annual fixed amount of $17,500 plus a fee based on average daily net assets. The administrative services fee incurred for the year ended December 31, 2019 was equivalent to an annual effective rate of 0.0388% of the fund’s average daily net assets.
Trustees’ and Officers’ Compensation– The fund pays compensation to independent Trustees in the form of a retainer, attendance fees, and additional compensation to Board and Committee chairpersons. The fund does not pay compensation directly to Trustees or officers of the fund who are also officers of the investment adviser, all of whom receive remuneration from MFS for their services to the fund. Certain officers and Trustees of the fund are officers or directors of MFS, MFD, and MFSC.
Other– This fund and certain other funds managed by MFS (the funds) had entered into a service agreement (the ISO Agreement) which provided for payment of fees solely by the funds to Tarantino LLC in return for the provision of services of an Independent Senior Officer (ISO) for the funds. Frank L. Tarantino served as the ISO and was an officer of the funds and the sole member of Tarantino LLC. Effective June 30, 2019, Mr. Tarantino retired from his position as ISO for the funds, and the ISO Agreement was terminated. For the year ended December 31, 2019, the fee paid by the fund under this agreement was $53 and is included in “Miscellaneous” expense in the Statement of Operations. MFS had agreed to bear all expenses associated with office space, other administrative support, and supplies provided to the ISO.
The fund invests in the MFS Institutional Money Market Portfolio which is managed by MFS and seeks current income consistent with preservation of capital and liquidity. This money market fund does not pay a management fee to MFS.
The fund invests in the High Yield Pooled Portfolio, which is a mutual fund advised by MFS that does not pay management fees to MFS but does incur investment and operating costs. The fund invests in the High Yield Pooled Portfolio to gain exposure to high income debt instruments, rather than investing in high income debt instruments directly. Income earned on this investment is included in “Dividends from affiliated issuers” in the Statement of Operations. The High Yield Pooled Portfolio does not pay a management fee to MFS or distribution and/or service fee to MFD.
For the year ended December 31, 2019, purchases and sales of investments, other than purchased option transactions andshort-term obligations, were as follows:
| | | | | | | | |
| | | Purchases | | | Sales | |
| U.S. Government securities | | | $11,825,770 | | | | $15,253,731 | |
| Non-U.S. Government securities | | | $32,723,628 | | | | $30,323,648 | |
| (5) | | Shares of Beneficial Interest |
The fund’s Declaration of Trust permits the Trustees to issue an unlimited number of full and fractional shares of beneficial interest. Transactions in fund shares were as follows:
| | | | | | | | | | | | | | | | |
| | | Year ended 12/31/19 | | | Year ended 12/31/18 | |
| | | | |
| | | Shares | | | Amount | | | Shares | | | Amount | |
| Shares sold | | | | | | | | | | | | | | | | |
Initial Class | | | 238,399 | | | | $2,340,408 | | | | 273,324 | | | | $2,588,388 | |
Service Class | | | 40,987 | | | | 403,039 | | | | 93,876 | | | | 876,047 | |
| | | 279,386 | | | | $2,743,447 | | | | 367,200 | | | | $3,464,435 | |
| | | | |
| Shares issued to shareholders in reinvestment of distributions | | | | | | | | | | | | | | | | |
Initial Class | | | 135,240 | | | | $1,348,342 | | | | 170,087 | | | | $1,585,207 | |
Service Class | | | 21,179 | | | | 209,670 | | | | 26,357 | | | | 243,806 | |
| | | 156,419 | | | | $1,558,012 | | | | 196,444 | | | | $1,829,013 | |
| | | | |
| Shares reacquired | | | | | | | | | | | | | | | | |
Initial Class | | | (614,197 | ) | | | $(6,013,428 | ) | | | (639,667 | ) | | | $(6,059,623 | ) |
Service Class | | | (138,486 | ) | | | (1,342,619 | ) | | | (147,390 | ) | | | (1,394,196 | ) |
| | | (752,683 | ) | | | $(7,356,047 | ) | | | (787,057 | ) | | | $(7,453,819 | ) |
| | | | |
| Net change | | | | | | | | | | | | | | | | |
Initial Class | | | (240,558 | ) | | | $(2,324,678 | ) | | | (196,256 | ) | | | $(1,886,028 | ) |
Service Class | | | (76,320 | ) | | | (729,910 | ) | | | (27,157 | ) | | | (274,343 | ) |
| | | (316,878 | ) | | | $(3,054,588 | ) | | | (223,413 | ) | | | $(2,160,371 | ) |
The fund and certain other funds managed by MFS participate in a $1.25 billion unsecured committed line of credit, subject to a $1 billion sublimit, provided by a syndicate of banks under a credit agreement. Borrowings may be made for temporary financing needs. Interest is charged to each fund, based on its borrowings, generally at a rate equal to the highest of one month LIBOR, the
27
MFS Strategic Income Portfolio
Notes to Financial Statements – continued
Federal Funds Effective Rate and the Overnight Bank Funding Rate, plus an agreed upon spread. A commitment fee, based on the average daily, unused portion of the committed line of credit, is allocated among the participating funds. In addition, the fund and other funds managed by MFS have established unsecured uncommitted borrowing arrangements with certain banks for temporary financing needs. Interest is charged to each fund, based on its borrowings, at rates equal to customary reference rates plus an agreed upon spread. For the year ended December 31, 2019, the fund’s commitment fee and interest expense were $247 and $0, respectively, and are included in “Miscellaneous” expense in the Statement of Operations.
| (7) | | Investments in Affiliated Issuers |
An affiliated issuer may be considered one in which the fund owns 5% or more of the outstanding voting securities, or a company which is under common control. For the purposes of this report, the following were affiliated issuers:
| | | | | | | | | | | | | | | | | | | | | | | | |
| Affiliated Issuers | | Beginning
Value | | | Purchases | | | Sales
Proceeds | | | Realized
Gain
(Loss) | | | Change in
Unrealized
Appreciation or
Depreciation | | | Ending
Value | |
| MFS High Yield Pooled Portfolio | | | $6,231,072 | | | | $4,240,871 | | | | $5,991,380 | | | | $(98,762 | ) | | | $697,220 | | | | $5,079,021 | |
| MFS Institutional Money Market Portfolio | | | 1,455,501 | | | | 26,778,907 | | | | 28,185,364 | | | | (314 | ) | | | 122 | | | | 48,852 | |
| | | $7,686,573 | | | | $31,019,778 | | | | $34,176,744 | | | | $(99,076 | ) | | | $697,342 | | | | $5,127,873 | |
| | | | | | |
| Affiliated Issuers | | | | | | | | | | | | | | Dividend
Income | | | Capital Gain
Distributions | |
| MFS High Yield Pooled Portfolio | | | | | | | | | | | | | | | | | | | $390,304 | | | | $— | |
| MFS Institutional Money Market Portfolio | | | | | | | | | | | | | | | | | | | 46,041 | | | | — | |
| | | | | | | | | | | | | | | | | | | $436,345 | | | | $— | |
28
MFS Strategic Income Portfolio
REPORT OF INDEPENDENT REGISTERED PUBLIC ACCOUNTING FIRM
To the Board of Trustees of MFS Variable Insurance Trust II and the Shareholders of
MFS Strategic Income Portfolio:
Opinion on the Financial Statements and Financial Highlights
We have audited the accompanying statement of assets and liabilities of MFS Strategic Income Portfolio (the “Fund”), including the portfolio of investments, as of December 31, 2019, the related statement of operations for the year then ended, the statements of changes in net assets for each of the two years in the period then ended, the financial highlights for each of the five years in the period then ended, and the related notes. In our opinion, the financial statements and financial highlights present fairly, in all material respects, the financial position of the Fund as of December 31, 2019, and the results of its operations for the year then ended, the changes in its net assets for each of the two years in the period then ended, and the financial highlights for each of the five years in the period then ended, in conformity with accounting principles generally accepted in the United States of America.
Basis for Opinion
These financial statements and financial highlights are the responsibility of the Fund’s management. Our responsibility is to express an opinion on the Fund’s financial statements and financial highlights based on our audits. We are a public accounting firm registered with the Public Company Accounting Oversight Board (United States) (PCAOB) and are required to be independent with respect to the Fund in accordance with the U.S. federal securities laws and the applicable rules and regulations of the Securities and Exchange Commission and the PCAOB.
We conducted our audits in accordance with the standards of the PCAOB. Those standards require that we plan and perform the audit to obtain reasonable assurance about whether the financial statements and financial highlights are free of material misstatement, whether due to error or fraud. The Fund is not required to have, nor were we engaged to perform, an audit of its internal control over financial reporting. As part of our audits we are required to obtain an understanding of internal control over financial reporting but not for the purpose of expressing an opinion on the effectiveness of the Fund’s internal control over financial reporting. Accordingly, we express no such opinion.
Our audits included performing procedures to assess the risks of material misstatement of the financial statements and financial highlights, whether due to error or fraud, and performing procedures that respond to those risks. Such procedures included examining, on a test basis, evidence regarding the amounts and disclosures in the financial statements and financial highlights. Our audits also included evaluating the accounting principles used and significant estimates made by management, as well as evaluating the overall presentation of the financial statements and financial highlights. Our procedures included confirmation of securities owned as of December 31, 2019, by correspondence with the custodian and brokers; when replies were not received from brokers, we performed other auditing procedures. We believe that our audits provide a reasonable basis for our opinion.
DELOITTE & TOUCHE LLP
Boston, Massachusetts
February 14, 2020
We have served as the auditor of one or more of the MFS investment companies since 1924.
29
MFS Strategic Income Portfolio
TRUSTEES AND OFFICERS – IDENTIFICATION AND BACKGROUND
The Trustees and Officers of the Trust, as of February 1, 2020, are listed below, together with their principal occupations during the past five years. (Their titles may have varied during that period.) The address of each Trustee and Officer is 111 Huntington Avenue, Boston, Massachusetts 02199-7618.
| | | | | | | | | | |
Name, Age | | Position(s)
Held with Fund | | Trustee/Officer
Since (h) | | Number of MFS Funds
overseen by the
Trustee | | Principal Occupations
During the Past Five Years | | Other Directorships During the Past Five Years (j) |
| INTERESTED TRUSTEES |
Robert J. Manning (k)
(age 56) | | Trustee | | February 2004 | | 133 | | Massachusetts Financial Services Company, Executive Chairman (since January 2017); Director; Chairman of the Board; Chief Executive Officer (until 2015);Co-Chief Executive Officer(2015-2016) | | N/A |
| | | | | |
Robin A. Stelmach (k) (age 58) | | Trustee | | January 2014 | | 133 | | Massachusetts Financial Services Company, Vice Chair (since January 2017); Chief Operating Officer and Executive Vice President (until January 2017) | | N/A |
|
| INDEPENDENT TRUSTEES |
John P. Kavanaugh (age 65) | | Trustee and Chair of Trustees | | January 2009 | | 133 | | Private investor | | N/A |
| | | | | |
Steven E. Buller (age 68) | | Trustee | | February 2014 | | 133 | | Financial Accounting Standards Advisory Council, Chairman(2014-2015); Public Company Accounting Oversight Board, Standing Advisory Group, Member (until 2014); BlackRock, Inc. (investment management), Managing Director (until 2014), BlackRock Finco UK (investment management), Director (until 2014) | | N/A |
| | | | | |
John A. Caroselli (age 65) | | Trustee | | March 2017 | | 133 | | JC Global Advisors, LLC (management consulting), President (since 2015); First Capital Corporation (commercial finance), Executive Vice President (until 2015) | | N/A |
| | | | | |
Maureen R. Goldfarb (age 64) | | Trustee | | January 2009 | | 133 | | Private investor | | N/A |
| | | | | |
Peter D. Jones
(age 64) | | Trustee | | January 2019 | | 133 | | Franklin Templeton Distributors, Inc. (investment management), President (until 2015); Franklin Templeton Institutional, LLC (investment management), Chairman (until 2015) | | N/A |
| | | | | |
James W. Kilman, Jr.
(age 58) | | Trustee | | January 2019 | | 133 | | Burford Capital Limited (finance and investment management), Chief Financial Officer (since 2019); KielStrand Capital LLC (family office), Chief Executive Officer (since 2016); Morgan Stanley & Co. (financial services), Vice Chairman of Investment Banking,Co-Head of Diversified Financials Coverage – Financial Institutions Investment Banking Group (until 2016) | | Alpha-En Corporation, Director (2016-2019) |
30
MFS Strategic Income Portfolio
Trustees and Officers – continued
| | | | | | | | | | |
Name, Age | | Position(s)
Held with Fund | | Trustee/Officer
Since (h) | | Number of MFS Funds
overseen by the
Trustee | | Principal Occupations
During the Past Five Years | | Other Directorships During the Past Five Years (j) |
Clarence Otis, Jr. (age 63) | | Trustee | | March 2017 | | 133 | | Darden Restaurants, Inc., Chief Executive Officer (until 2014) | | VF Corporation, Director; Verizon Communications, Inc., Director; The Travelers Companies, Director; Federal Reserve Bank of Atlanta, Director (until 2015) |
| | | | | |
Maryanne L. Roepke (age 63) | | Trustee | | May 2014 | | 133 | | American Century Investments (investment management), Senior Vice President and Chief Compliance Officer (until 2014) | | N/A |
| | | | | |
Laurie J. Thomsen
(age 62) | | Trustee | | March 2005 | | 133 | | Private investor | | The Travelers Companies, Director; Dycom Industries, Inc., Director (since 2015) |
| | | | | | | | |
Name, Age | | Position(s)
Held with Fund | | Trustee/Officer
Since (h) | | Number of
MFS Funds
for which the
Person is an
Officer | | Principal Occupations During the Past Five Years |
| OFFICERS | | | | | | |
Christopher R. Bohane (k)
(age 46) | | Assistant Secretary and Assistant Clerk | | July 2005 | | 133 | | Massachusetts Financial Services Company, Vice President and Assistant General Counsel |
| | | | |
Kino Clark (k) (age 51) | | Assistant Treasurer | | January 2012 | | 133 | | Massachusetts Financial Services Company, Vice President |
| | | | |
John W. Clark, Jr. (k) (age 52) | | Assistant Treasurer | | April 2017 | | 133 | | Massachusetts Financial Services Company, Vice President (since March 2017); Deutsche Bank (financial services), Department Head –Treasurer’s Office (until February 2017) |
| | | | |
Thomas H. Connors (k) (age 60) | | Assistant Secretary and Assistant Clerk | | September 2012 | | 133 | | Massachusetts Financial Services Company, Vice President and Senior Counsel |
| | | | |
David L. DiLorenzo (k)
(age 51) | | President | | July 2005 | | 133 | | Massachusetts Financial Services Company, Senior Vice President |
| | | | |
Heidi W. Hardin (k) (age 52) | | Secretary and Clerk | | April 2017 | | 133 | | Massachusetts Financial Services Company, Executive Vice President and General Counsel (since March 2017); Harris Associates (investment management), General Counsel (from September 2015 to January 2017); Janus Capital Management LLC (investment management), Senior Vice President and General Counsel (until September 2015) |
| | | | |
Brian E. Langenfeld (k) (age 46) | | Assistant
Secretary and Assistant Clerk | | June 2006 | | 133 | | Massachusetts Financial Services Company, Vice President and Senior Counsel |
| | | | |
Amanda S. Mooradian (k) (age 40) | | Assistant
Secretary and Assistant Clerk | | September 2018 | | 133 | | Massachusetts Financial Services Company, Assistant Vice President and Counsel |
| | | | |
Susan A. Pereira (k)
(age 49) | | Assistant
Secretary and Assistant Clerk | | July 2005 | | 133 | | Massachusetts Financial Services Company, Vice President and Assistant General Counsel |
| | | | |
Kasey L. Phillips (k) (age 49) | | Assistant Treasurer | | September 2012 | | 133 | | Massachusetts Financial Services Company, Vice President |
| | | | |
Matthew A. Stowe (k) (age 45) | | Assistant Secretary and Assistant Clerk | | October 2014 | | 133 | | Massachusetts Financial Services Company, Vice President and Assistant General Counsel |
31
MFS Strategic Income Portfolio
Trustees and Officers – continued
| | | | | | | | |
Name, Age | | Position(s)
Held with Fund | | Trustee/Officer
Since (h) | | Number of
MFS Funds
for which the
Person is an
Officer | | Principal Occupations During the Past Five Years |
Martin J. Wolin (k) (age 52) | | Chief Compliance Officer | | July 2015 | | 133 | | Massachusetts Financial Services Company, Senior Vice President and Chief Compliance Officer (since July 2015); Mercer (financial service provider), Chief Risk and Compliance Officer, North America and Latin America (until June 2015) |
| | | | |
James O. Yost (k)
(age 59) | | Treasurer | | September 1990 | | 133 | | Massachusetts Financial Services Company, Senior Vice President |
| (h) | Date first appointed to serve as Trustee/officer of an MFS Fund. Each Trustee has served continuously since appointment unless indicated otherwise. For the period from December 15, 2004 until February 22, 2005, Mr. Manning served as Advisory Trustee. From January 2012 through December 2016, Messrs. DiLorenzo and Yost served as Treasurer and Deputy Treasurer of the Funds, respectively. |
| (j) | Directorships or trusteeships of companies required to report to the Securities and Exchange Commission (i.e., “public companies”). |
| (k) | “Interested person” of the Trust within the meaning of the Investment Company Act of 1940 (referred to as the 1940 Act), which is the principal federal law governing investment companies like the fund, as a result of a position with MFS. The address of MFS is 111 Huntington Avenue, Boston, Massachusetts 02199-7618. |
Each Trustee (other than Messrs. Jones and Kilman) has been elected by shareholders and each Trustee and Officer holds office until his or her successor is chosen and qualified or until his or her earlier death, resignation, retirement or removal. Messrs. Jones and Kilman became Trustees of the Funds on January 1, 2019. The Trust does not hold annual meetings for the purpose of electing Trustees, and Trustees are not elected for fixed terms. Under the terms of the Board’s retirement policy, an Independent Trustee shall retire at the end of the calendar year in which he or she reaches the earlier of 75 years of age or 15 years of service on the Board (or, in the case of any Independent Trustee who joined the Board prior to 2015, 20 years of service on the Board).
Messrs. Buller, Kilman and Otis and Ms. Roepke are members of the Trust’s Audit Committee.
Each of the Interested Trustees and certain Officers hold comparable officer positions with certain affiliates of MFS.
The Statement of Additional Information for a Fund includes further information about the Trustees and is available without charge upon request by calling1-800-225-2606.
| | |
Investment Adviser Massachusetts Financial Services Company 111 Huntington Avenue Boston, MA 02199-7618 | | Custodian State Street Bank and Trust Company 1 Lincoln Street Boston, MA 02111-2900 |
| |
Distributor MFS Fund Distributors, Inc. 111 Huntington Avenue Boston, MA 02199-7618 | | Independent Registered Public Accounting Firm Deloitte & Touche LLP 200 Berkeley Street Boston, MA 02116 |
| |
Portfolio Manager(s) Neeraj Arora Philipp Burgener David Cole Alexander Mackey Joshua Marston Robert Persons Michael Skatrud | | |
32
MFS Strategic Income Portfolio
BOARD REVIEW OF INVESTMENT ADVISORY AGREEMENT
MFS Strategic Income Portfolio
The Investment Company Act of 1940 requires that both the full Board of Trustees and a majority of thenon-interested (“independent”) Trustees, voting separately, annually approve the continuation of the Fund’s investment advisory agreement with MFS. The Trustees consider matters bearing on the Fund and its advisory arrangements at their meetings throughout the year, including a review of performance data at each regular meeting. In addition, the independent Trustees met several times over the course of three months beginning in May and ending in July, 2019 (“contract review meetings”) for the specific purpose of considering whether to approve the continuation of the investment advisory agreement for the Fund and the other investment companies that the Board oversees (the “MFS Funds”). The independent Trustees were assisted in their evaluation of the Fund’s investment advisory agreement by independent legal counsel, from whom they received separate legal advice and with whom they met separately from MFS during various contract review meetings. The independent Trustees were also assisted in this process by the MFS Funds’ Independent Senior Officer, a senior officer appointed by and reporting to the independent Trustees.
In connection with their deliberations regarding the continuation of the investment advisory agreement, the Trustees, including the independent Trustees, considered such information and factors as they believed, in light of the legal advice furnished to them and their own business judgment, to be relevant. The investment advisory agreement for the Fund was considered separately, although the Trustees also took into account the common interests of all MFS Funds in their review. As described below, the Trustees considered the nature, quality, and extent of the various investment advisory, administrative, and shareholder services performed by MFS under the existing investment advisory agreement and other arrangements with the Fund.
In connection with their contract review meetings, the Trustees received and relied upon materials that included, among other items: (i) information provided by Broadridge Financial Solutions, Inc. (“Broadridge”), an independent third party, on the investment performance of the Fund for various time periods ended December 31, 2018 and the investment performance of a group of funds with substantially similar investment classifications/objectives (the “Broadridge performance universe”), (ii) information provided by Broadridge on the Fund’s advisory fees and other expenses and the advisory fees and other expenses of comparable funds identified by Broadridge as well as all other funds in the same investment classification/category (the “Broadridge expense group and universe”), (iii) information provided by MFS on the advisory fees of portfolios of other clients of MFS, including institutional separate accounts and other clients, (iv) information as to whether and to what extent applicable expense waivers, reimbursements or fee “breakpoints” are observed for the Fund, (v) information regarding MFS’ financial results and financial condition, including MFS’ and certain of its affiliates’ estimated profitability from services performed for the Fund and the MFS Funds as a whole, and compared to MFS’ institutional business, (vi) MFS’ views regarding the outlook for the mutual fund industry and the strategic business plans of MFS, (vii) descriptions of various functions performed by MFS for the Funds, such as compliance monitoring and portfolio trading practices, and (viii) information regarding the overall organization of MFS, including information about MFS’ senior management and other personnel providing investment advisory, administrative and other services to the Fund and the other MFS Funds. The comparative performance, fee and expense information prepared and provided by Broadridge was not independently verified and the independent Trustees did not independently verify any information provided to them by MFS.
The Trustees’ conclusion as to the continuation of the investment advisory agreement was based on a comprehensive consideration of all information provided to the Trustees and not the result of any single factor. Some of the factors that figured particularly in the Trustees’ deliberations are described below, although individual Trustees may have evaluated the information presented differently from one another, giving different weights to various factors. It is also important to recognize that the fee arrangements for the Fund and other MFS Funds are the result of years of review and discussion between the independent Trustees and MFS, that certain aspects of such arrangements may receive greater scrutiny in some years than in others, and that the Trustees’ conclusions may be based, in part, on their consideration of these same arrangements during the course of the year and in prior years.
Based on information provided by Broadridge and MFS, the Trustees reviewed the Fund’s total return investment performance as well as the Broadridge performance universe over various time periods. The Trustees placed particular emphasis on the total return performance of the Fund’s Initial Class shares in comparison to the performance of funds in its Broadridge performance universe over the five-year period ended December 31, 2018, which the Trustees believed was a long enough period to reflect differing market conditions. The total return performance of the Fund’s Initial Class shares was in the 2nd quintile relative to the other funds in the universe for this five-year period (the 1st quintile being the best performers and the 5th quintile being the worst performers). The total return performance of the Fund’s Initial Class shares was in the 4th quintile for theone-year period and the 2nd quintile for thethree-year period ended December 31, 2018 relative to the Broadridge performance universe. Because of the passage of time, these performance results may differ from the performance results for more recent periods, including those shown elsewhere in this report.
In the course of their deliberations, the Trustees took into account information provided by MFS in connection with the contract review meetings, as well as during investment review meetings conducted with portfolio management personnel during the course of the year regarding the Fund’s performance. After reviewing these and related factors, the Trustees concluded, within the context of their overall conclusions regarding the investment advisory agreement, that they were satisfied with MFS’ responses and efforts relating to investment performance.
33
MFS Strategic Income Portfolio
Board Review of Investment Advisory Agreement – continued
In assessing the reasonableness of the Fund’s advisory fee, the Trustees considered, among other information, the Fund’s advisory fee and the total expense ratio of the Fund’s Initial Class shares as a percentage of average daily net assets and the advisory fee and total expense ratios of the Broadridge expense group based on information provided by Broadridge. The Trustees considered that MFS currently observes an expense limitation for the Fund, which may not be changed without the Trustees’ approval. The Trustees also considered that, according to the data provided by Broadridge (which takes into account any fee reductions or expense limitations that were in effect during the Fund’s last fiscal year), the Fund’s effective advisory fee rate was approximately at the Broadridge expense group median and the Fund’s total expense ratio was higher than the Broadridge expense group median. The Trustees also noted that MFS has agreed to further reduce such expense limitation for the Fund effective August 1, 2019, which may not be changed without the Trustees’ approval.
The Trustees also considered the advisory fees charged by MFS to any institutional separate accounts advised by MFS (“separate accounts”) and unaffiliated investment companies for which MFS serves as subadviser (“subadvised funds”) that have comparable investment strategies to the Fund, if any. In comparing these fees, the Trustees considered information provided by MFS as to the generally broader scope of services provided by MFS to the Fund, as well as the more extensive regulatory burdens imposed on MFS in managing the Fund, in comparison to separate accounts and subadvised funds. The Trustees also considered the higher demands placed on MFS’ investment personnel and trading infrastructure as a result of the daily cashin-flows andout-flows of the Fund in comparison to separate accounts.
The Trustees also considered whether the Fund may benefit from any economies of scale in the management of the Fund in the event of growth in assets of the Fund and/or growth in assets of the MFS Funds as a whole. They noted that the Fund’s advisory fee rate schedule is subject to a contractual breakpoint that reduces the Fund’s advisory fee rate on average daily net assets over $1 billion. The Trustees also noted that MFS has agreed in writing to waive a portion of the management fees of certain MFS Funds, including the Fund, if the total combined assets of certain funds within the MFS Funds’ complex increase above agreed upon thresholds (the “group fee waiver”), enabling the Fund’s shareholders to share in the benefits from any economies of scale at the complex level. The group fee waiver is reviewed and renewed annually between the Board and MFS. The Trustees concluded that the breakpoint and the group fee waiver were sufficient to allow the Fund to benefit from economies of scale as its assets and overall complex assets grow.
The Trustees also considered information prepared by MFS relating to MFS’ costs and profits with respect to the Fund, the MFS Funds considered as a group, and other investment companies and accounts advised by MFS, as well as MFS’ methodologies used to determine and allocate its costs to the MFS Funds, the Fund and other accounts and products for purposes of estimating profitability.
After reviewing these and other factors described herein, the Trustees concluded, within the context of their overall conclusions regarding the investment advisory agreement, that the advisory fees charged to the Fund represent reasonable compensation in light of the services being provided by MFS to the Fund.
In addition, the Trustees considered MFS’ resources and related efforts to continue to retain, attract and motivate capable personnel to serve the Fund. The Trustees also considered current and developing conditions in the financial services industry, including the presence of large and well-capitalized companies which are spending, and appear to be prepared to continue to spend, substantial sums to engage personnel and to provide services to competing investment companies. In this regard, the Trustees also considered the financial resources of MFS and its ultimate parent, Sun Life Financial Inc. The Trustees also considered the advantages and possible disadvantages to the Fund of having an adviser that also serves other investment companies as well as other accounts.
The Trustees also considered the nature, quality, cost, and extent of administrative, transfer agency, and distribution services provided to the Fund by MFS and its affiliates under agreements and plans other than the investment advisory agreement, including any12b-1 fees the Fund pays to MFS Fund Distributors, Inc., an affiliate of MFS. The Trustees also considered the nature, extent and quality of certain other services MFS performs or arranges for on the Fund’s behalf, which may include securities lending programs, directed expense payment programs, class action recovery programs, and MFS’ interaction with third-party service providers, principally custodians andsub-custodians. The Trustees concluded that the variousnon-advisory services provided by MFS and its affiliates on behalf of the Fund were satisfactory.
The Trustees consideredso-called“fall-out benefits” to MFS such as reputational value derived from serving as investment manager to the MFS Funds. The Trustees also considered that, effective January 3, 2018, MFS had discontinued its historic practice of obtaining investment research from portfolio brokerage commissions paid by certain MFS Funds and would thereafter directly pay for or voluntarily reimburse a Fund, if applicable, for the costs of external research acquired through the use of the Fund’s portfolio brokerage commissions.
Based on their evaluation of factors that they deemed to be material, including those factors described above, the Board of Trustees, including the independent Trustees, concluded that the Fund’s investment advisory agreement with MFS should be continued for an additionalone-year period, commencing August 1, 2019.
34
MFS Strategic Income Portfolio
PROXY VOTING POLICIES AND INFORMATION
MFS votes proxies on behalf of the fund pursuant to proxy voting policies and procedures that are available without charge, upon request, by calling 1-800-225-2606, by visitingmfs.com/proxyvoting, or by visiting the SEC’s Web site athttp://www.sec.gov.
Information regarding how the fund voted proxies relating to portfolio securities during the most recent twelve-month period ended June 30 is available by August 31 of each year without charge by visitingmfs.com/proxyvoting, or by visiting the SEC’s Web site athttp://www.sec.gov.
QUARTERLY PORTFOLIO DISCLOSURE
The fund files a complete schedule of portfolio holdings with the SEC for the first and third quarters of each fiscal year as an exhibit to its reports on Form N-PORT. The fund’s Form N-PORT reports are available on the SEC’s website athttp://www.sec.gov. A shareholder can obtain the portfolio holdings report for the first and third quarters of the fund’s fiscal year atmfs.com/vit2 by choosing the fund’s name and then selecting the “Resources” tab and clicking on “Prospectus and Reports”.
FURTHER INFORMATION
From time to time, MFS may post important information about the fund or the MFS funds on the MFS web site (mfs.com). This information is available athttps://www.mfs.com/en-us/what-we-do/announcements.htmlor atmfs.com/vit2 by choosing the fund’s name.
INFORMATION ABOUT FUND CONTRACTS AND LEGAL CLAIMS
The fund has entered into contractual arrangements with an investment adviser, administrator, distributor, shareholder servicing agent, 529 program manager (if applicable), and custodian who each provide services to the fund. Unless expressly stated otherwise, shareholders are not parties to, or intended beneficiaries of these contractual arrangements, and these contractual arrangements are not intended to create any shareholder right to enforce them against the service providers or to seek any remedy under them against the service providers, either directly or on behalf of the fund.
Under the Trust’s By-Laws and Declaration of Trust, any claims asserted against or on behalf of the MFS Funds, including claims against Trustees and Officers, must be brought in state and federal courts located within the Commonwealth of Massachusetts.
35
rev. 3/16
| | | | |
| | | |
| FACTS | | WHAT DOES MFS DO WITH YOUR
PERSONAL INFORMATION? | |  |
| | |
| Why? | | Financial companies choose how they share your personal information. Federal law gives consumers the right to limit some but not all sharing. Federal law also requires us to tell you how we collect, share, and protect your personal information. Please read this notice carefully to understand what we do. |
| | |
| What? | | The types of personal information we collect and share depend on the product or service you have with us. This information can include: • Social Security number and account balances • Account transactions and transaction history • Checking account information and wire transfer instructions When you areno longer our customer, we continue to share your information as described in this notice. |
| | |
| How? | | All financial companies need to share customers’ personal information to run their everyday business. In the section below, we list the reasons financial companies can share their customers’ personal information; the reasons MFS chooses to share; and whether you can limit this sharing. |
| | | | |
Reasons we can share your
personal information | | Does MFS share? | | Can you limit this
sharing? |
For our everyday business purposes – such as to process your transactions, maintain your account(s), respond to court orders and legal investigations, or report to credit bureaus | | Yes | | No |
For our marketing purposes – to offer our products and services to you | | No | | We don’t share |
| For joint marketing with other financial companies | | No | | We don’t share |
For our affiliates’ everyday business purposes – information about your transactions and experiences | | No | | We don’t share |
For our affiliates’ everyday business purposes – information about your creditworthiness | | No | | We don’t share |
| For nonaffiliates to market to you | | No | | We don’t share |
| | |
| | |
| Questions? | | Call800-225-2606 or go tomfs.com. |
36
| | |
| Who we are |
| Who is providing this notice? | | MFS Funds, MFS Investment Management, MFS Institutional Advisors, Inc., and MFS Heritage Trust Company. |
| | |
| What we do |
| How does MFS protect my personal information? | | To protect your personal information from unauthorized access and use, we use security measures that comply with federal law. These measures include procedural, electronic, and physical safeguards for the protection of the personal information we collect about you. |
How does MFS
collect my personal information? | | We collect your personal information, for example, when you • open an account or provide account information • direct us to buy securities or direct us to sell your securities • make a wire transfer We also collect your personal information from others, such as credit bureaus, affiliates, or other companies. |
| Why can’t I limit all sharing? | | Federal law gives you the right to limit only • sharing for affiliates’ everyday business purposes – information about your creditworthiness • affiliates from using your information to market to you • sharing for nonaffiliates to market to you State laws and individual companies may give you additional rights to limit sharing. |
| | |
| Definitions |
| Affiliates | | Companies related by common ownership or control. They can be financial and nonfinancial companies. • MFS does not share personal information with affiliates, except for everyday business purposes as described on page one of this notice. |
| Nonaffiliates | | Companies not related by common ownership or control. They can be financial and nonfinancial companies. • MFS does not share with nonaffiliates so they can market to you. |
| Joint marketing | | A formal agreement between nonaffiliated financial companies that together market financial products or services to you. • MFS doesn’t jointly market. |
| | |
| Other important information |
| If you own an MFS product or receive an MFS service in the name of a third party such as a bank or broker-dealer, their privacy policy may apply to you instead of ours. |
37
Annual Report
December 31, 2019

MFS® Technology Portfolio

MFS® Variable Insurance Trust II
Beginning on January 1, 2021, as permitted by regulations adopted by the U.S. Securities and Exchange Commission, the insurance company that offers your contract may determine that it will no longer send you paper copies of the fund’s annual and semiannual shareholder reports unless you specifically request paper copies from the insurance company or from your financial intermediary. Instead, the shareholder reports will be made available on a Web site (insurancefunds.mfs.com or other Web site of which you will be notified), and the insurance company will notify you by mail each time a report is posted and provide you with a Web site link to access the report. Instructions for requesting paper copies will be provided by your insurance company or financial intermediary.
If you already elected to receive shareholder reports by email, you will not be affected by this change and you need not take any action. If your insurance company or financial intermediary offers electronic delivery, you may elect to receive shareholder reports and other communications from the insurance company or financial intermediary by email by following the instructions provided by the insurance company or financial intermediary.
Beginning on January 1, 2019, you may elect to receive all future reports in paper free of charge from the insurance company or financial intermediary. You can inform the insurance company or financial intermediary that you wish to continue receiving paper copies of your shareholder reports by contacting your insurance company or financial intermediary. Your election to receive reports in paper will apply to all funds held in your account with your insurance company or financial intermediary.
TKS-ANN
MFS® Technology Portfolio
CONTENTS
The report is prepared for the general information of contract owners. It is authorized for distribution to prospective investors only when preceded or accompanied by a current prospectus.
NOT FDIC INSURED• MAY LOSE VALUE• NO BANK OR CREDIT UNION GUARANTEE• NOT A DEPOSIT• NOT INSURED BY ANY FEDERAL GOVERNMENT AGENCY OR NCUA/NCUSIF
MFS Technology Portfolio
LETTER FROM THE EXECUTIVE CHAIR

Dear Contract Owners:
Slowing global growth, low inflation, and trade friction between the United States and China have been hallmarks of the past 12 months. After experiencing an uptick in market volatility in late 2018, markets steadied for most of 2019, thanks in large measure to the adoption of a dovish policy stance on the part of global central banks, focused on supporting economic growth. Negotiations aimed at a “phase one” trade deal between the U.S. and China bore fruit at the end of the period, boosting investor sentiment, while signs of stability emerging from the global manufacturing sector also lifted spirits. Uncertainty over Brexit, along with the ripple effects from the trade conflict, hampered business confidence and investment in the United Kingdom and Europe for much of the period, though investors expect greater clarity regarding Brexit as a result of December’s general election. The pro-Brexit Conservative Party won the election by a comfortable margin and set the stage for the U.K.’s departure from the EU at the end of January.
Markets expect the longest economic expansion in U.S. history will continue, albeit at a slower pace, as trade tensions recede. In an effort to prolong the expansion, the U.S. Federal Reserve lowered interest rates three times between July and October and the European Central Bank loosened policy in September. While the global monetary policy backdrop remains quite accommodative, signs of easing trade tensions and fading global recession fears led to improved market sentiment in late 2019 as investors grew less risk averse. In early 2020, an outbreak of coronavirus emanating from China reintroduced global growth fears, causing an uptick in volatility.
Here at MFS®, we aim to help our clients navigate the growing complexity of the markets and world economies. Our long-term investment philosophy and commitment to the responsible allocation of capital allow us to tune out the noise and uncover what we believe are the best, most durable investment opportunities in the market. Through our powerful global investment platform, we combine collective expertise, thoughtful risk management and long-term discipline to create sustainable value for investors.
Respectfully,

Robert J. Manning
Executive Chair
MFS Investment Management
February 14, 2020
The opinions expressed in this letter are subject to change and may not be relied upon for investment advice. No forecasts can be guaranteed.
1
MFS Technology Portfolio
PORTFOLIO COMPOSITION
Portfolio structure

| | | | |
| Top ten holdings | | | | |
| Amazon.com, Inc. | | | 9.3% | |
| Microsoft Corp. | | | 9.1% | |
| Alphabet, Inc., “A” | | | 8.8% | |
| Facebook, Inc., “A” | | | 6.8% | |
| Visa, Inc., “A” | | | 5.0% | |
| Mastercard, Inc., “A” | | | 4.6% | |
| Adobe Systems, Inc. | | | 4.1% | |
| Salesforce.com, Inc. | | | 4.0% | |
| Global Payments, Inc. | | | 3.5% | |
| Fiserv, Inc. | | | 3.3% | |
| | | | |
| Top five industries | | | | |
| Computer Software | | | 22.8% | |
| Internet | | | 18.2% | |
| Business Services | | | 15.4% | |
| Specialty Stores | | | 9.8% | |
| Other Banks & Diversified Financials | | | 9.6% | |
| (s) | Includes securities sold short. |
Cash & Cash Equivalents includes any cash, investments in money market funds, short-term securities, and other assets less liabilities. Please see the Statement of Assets and Liabilities for additional information related to the fund’s cash position and other assets and liabilities.
Percentages are based on net assets as of December 31, 2019.
The portfolio is actively managed and current holdings may be different.
2
MFS Technology Portfolio
MANAGEMENT REVIEW
Summary of Results
For the twelve months ended December 31, 2019, Initial Class shares of the MFS Technology Portfolio (fund) provided a total return of 36.16%, while Service Class shares of the fund provided a total return of 35.88%. These compare with a return of 31.49% over the same period for the fund’s benchmark, the Standard & Poor’s 500 Stock Index, and a return of 42.68% for the fund’s other benchmark, the Standard & Poor’s North American Technology Sector Index.
Market Environment
Fading fears of a near-term global recession, the announcement of a partial trade deal between the United States and China and the decline in uncertainty over Brexit helped bolster market sentiment late in the period. Changes in market sentiment, largely driven by uncertainty over the outcome of trade negotiations between the US and China, had contributed to periodic bouts of volatility during the reporting period. The global economy decelerated, led by weakness in China and Europe, although the pace of the slowdown moderated late in the period amid nascent signs of stabilization in the manufacturing sector.
The deteriorating global growth backdrop, along with declining inflationary pressures, prompted the US Federal Reserve to adopt a more dovish posture beginning in early 2019, resulting in the first interest rate cut in over a decade at the end of July, followed by additional cuts in September and October. The Fed’s actions led to a sharp decline in long-term interest rates during the period’s second half, causing the inversion of portions of the US Treasury yield curve for a time. Amid an improvement in risk sentiment in Q4 2019 and indications of a bottoming in growth and potential upturn in activity, the Fed indicated in October that further rate cuts were unlikely unless the outlook for the economy materially worsened.
Globally, central banks have tilted more dovish as well, with the European Central Bank unveiling a package of easing measures, which included putting overnight rates deeper into negative territory, restarting its bond-buying program and lengthening the term of cheap loans to banks to three years from two. The central banks of India and Australia are among those that have cut rates several times in recent months, although China has been more cautious in increasing liquidity as it keeps trying to deleverage its economy, cutting rates only marginally.
Emerging markets experienced considerable volatility through the end of 2018, as tighter global financial conditions exposed structural weakness in some countries. Those conditions improved in 2019 as the Fed became more dovish. Notwithstanding the periodic headwinds on market sentiment from significant trade friction between the US and China over much of the year, emerging market hard currency debt and local rates benefited from relatively cheap valuations at the beginning of the period and easier global monetary conditions. These factors, plus the fading of certain global risk factors mentioned above, hastened spread-tightening in the latter part of the period. At the same, idiosyncratic risks spiked in some countries (e.g., Argentina and Lebanon), contributing to increased dispersion in performance among sovereign assets.
Detractors from Performance
The fund’s underweight allocation to thetechnology hardware storage & peripheralsindustry detracted from performance relative to the Standard & Poor’s North American Technology Sector Index. Within this industry, an underweight position in computer and personal electronics maker Apple held back relative results. The share price of Apple benefited from stronger-than-expected demand in its wearable technology and services segments, which more than offset slightly weaker revenues from iPhone sales.
Anout-of-benchmark exposure to theroad & rail industry also hampered relative returns, led by the fund’s holdings of technology platform operator Uber Technologies (b). The share price of Uber declined as the company reported its largest quarterly loss since the company’s first disclosure as a public company in 2017, largely caused by stock-based compensation paid to employees after its IPO.
An underweight position in the semiconductors & semiconductor equipmentindustry was another detractor from relative results. Within this industry, not owning shares of computer graphics processors maker NVIDIA held back relative performance. The share price of NVIDIA advanced during the period on the back of solid results, particularly within its gaming segment, and recovery in growth within its data center division. The stock also received a boost from the announcement that NVIDIA would acquire semiconductor company Mellanox.
Elsewhere, the fund’s overweight positions in information technology company DXC Technology, customer information software manager salesforce.com, domain name registration and web hosting services provider GoDaddy, technology company Alphabet and technology skill development solutions provider Pluralsight hampered relative results. The share price of DXC Technology fell after the company reported disappointing earnings results and weaker-than-expected full-year guidance as clients transitioned to the cloud at a faster rate than anticipated, which put pressure on its legacy IT business. A more uncertain macro business environment and foreign exchange headwinds were also cited as near-term challenges. Additionally, an underweight position in software giant Microsoft weakened relative returns.
3
MFS Technology Portfolio
Management Review – continued
The fund’s cash and/or cash equivalents position during the period was also a detractor from relative performance. Under normal market conditions, the fund strives to be fully invested and generally holds cash to buy new holdings and to provide liquidity. In a period when equity markets rose, as measured by the fund’s benchmark, holding cash held back performance versus the benchmark, which has no cash position.
Contributors to Performance
An underweight position in thecommunications equipmentindustry boosted relative performance. Here, a short position in network equipment company Cisco Systems bolstered relative performance. The share price of Cisco Systems declined as management delivered a weaker-than-expected full-year outlook, citing concerns over a challenging macro environment and a slowdown in China.
Anout-of–benchmark exposure to thehealth care providers & servicesindustry also aided relative returns, led by the fund’s holdings of precision oncology testing and development services provider Guardant Health (b). The share price of Guardant Health appreciated, early in the period, on the back of stronger-than-expected revenue growth, driven by solid performance in the company’s clinical testing, biopharma and development services divisions.
Stocks in other industries that benefited relative results included the fund’s overweight positions in electronic payment processing providers, Total System Services (h) and Global Payments, semiconductor equipment manufacturer Applied Materials and cloud communications and collaboration services provider RingCentral. The stock price of Total System Services advanced following the announcement that electronic payment services company Global Payments would acquire the company in anall-stock deal. Additionally, holdings of technology services provider Endava (b), and not owning shares of semiconductor company Intel, enterprise software products maker Oracle and online travel company Booking Holdings, further supported relative returns.
Respectfully,
Portfolio Manager(s)
Matthew Sabel
| (b) | Security is not a benchmark constituent. |
| (h) | Security was not held in the portfolio at period end. |
The views expressed in this report are those of the portfolio manager(s) only through the end of the period of the report as stated on the cover and do not necessarily reflect the views of MFS or any other person in the MFS organization. These views are subject to change at any time based on market or other conditions, and MFS disclaims any responsibility to update such views. These views may not be relied upon as investment advice or an indication of trading intent on behalf of any MFS portfolio. References to specific securities are not recommendations of such securities, and may not be representative of any MFS portfolio’s current or future investments.
4
MFS Technology Portfolio
PERFORMANCE SUMMARY THROUGH 12/31/19
The following chart illustrates the historical performance of the fund in comparison to its benchmark(s). Benchmarks are unmanaged and may not be invested in directly. Benchmark returns do not reflect any fees or expenses. The performance of other share classes will be greater than or less than that of the class depicted below. (See Notes to Performance Summary.)
Performance data shown represents past performance and is no guarantee of future results. Investment return and principal value fluctuate so your units, when sold, may be worth more or less than the original cost; current performance may be lower or higher than quoted. The performance shown does not reflect the deduction of taxes, if any, that a contract holder would pay on fund distributions or the redemption of contract units. The returns for the fund shown also do not reflect the deduction of expenses associated with variable products, such as mortality and expense risk charges, separate account charges, and sales charges imposed by the insurance company separate accounts. Such expenses would reduce the overall returns shown.
Growth of a Hypothetical $10,000 Investment
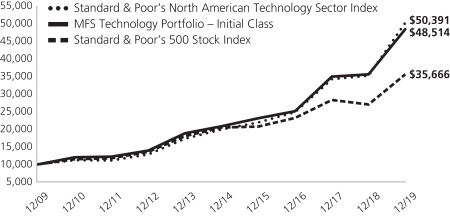
Total Returns through 12/31/19
Average annual total returns
| | | | | | | | | | | | |
| | | Share Class | | Class Inception Date | | 1-yr | | 5-yr | | 10-yr | | |
| | | Initial Class | | 6/16/00 | | 36.16% | | 18.31% | | 17.11% | | |
| | | Service Class | | 8/24/01 | | 35.88% | | 18.04% | | 16.81% | | |
| | | | |
| Comparative benchmark(s) | | | | | | | | |
| | | Standard & Poor’s 500 Stock Index (f) | | 31.49% | | 11.70% | | 13.56% | | |
| | | Standard & Poor’s North American Technology Sector Index (f) | | 42.68% | | 20.34% | | 17.55% | | |
| (f) | Source: FactSet Research Systems Inc. |
Benchmark Definition(s)
Standard & Poor’s 500 Stock Index – a market capitalization-weighted index of 500 widely held equity securities, designed to measure broad U.S. equity performance.(b)
Standard & Poor’s North American Technology Sector Index – a modified market capitalization-weighted index that measures the performance of selected technology stocks.(b)
It is not possible to invest directly in an index.
| (b) | “Standard & Poor’s®” and “S&P®” are registered trademarks of Standard & Poor’s Financial Services LLC (“S&P”) and Dow Jones is a registered trademark of Dow Jones Trademark Holdings LLC (“Dow Jones”) and have been licensed for use by S&P Dow Jones Indices LLC and sublicensed for certain purposes by Massachusetts Financial Services Company. The S&P 500® is a product of S&P Dow Jones Indices LLC, and has been licensed for use by Massachusetts Financial Services Company. Massachusetts Financial Services Company’s product(s) is not sponsored, endorsed, sold, or promoted by S&P Dow Jones Indices LLC, Dow Jones, S&P, or their respective affiliates, and neither S&P Dow Jones Indices LLC, Dow Jones, S&P, nor their respective affiliates make any representation regarding the advisability of investing in such product(s). |
5
MFS Technology Portfolio
Performance Summary – continued
Notes to Performance Summary
Average annual total return represents the average annual change in value for each share class for the periods presented.
Performance results reflect any applicable expense subsidies and waivers in effect during the periods shown. Without such subsidies and waivers the fund’s performance results would be less favorable. Please see the prospectus and financial statements for complete details. All results are historical and assume the reinvestment of any dividends and capital gains distributions.
Performance results do not include adjustments made for financial reporting purposes in accordance with U.S. generally accepted accounting principles and may differ from amounts reported in the financial highlights.
From time to time the fund may receive proceeds from litigation settlements, without which performance would be lower.
6
MFS Technology Portfolio
EXPENSE TABLE
Fund Expenses Borne by the Contract Holders during the Period,
July 1, 2019 through December 31, 2019
As a contract holder of the fund, you incur ongoing costs, including management fees; distribution and/or service(12b-1) fees; and other fund expenses. This example is intended to help you understand your ongoing costs (in dollars) of investing in the fund and to
compare these costs with the ongoing costs of investing in other mutual funds.
The example is based on an investment of $1,000 invested at the beginning of the period and held for the entire period July 1, 2019 through December 31, 2019.
Actual Expenses
The first line for each share class in the following table provides information about actual account values and actual expenses. You may use the information in this line, together with the amount you invested, to estimate the expenses that you paid over the period. Simply divide your account value by $1,000 (for example, an $8,600 account value divided by $1,000 = 8.6), then multiply the result by the number in the first line under the heading entitled “Expenses Paid During Period” to estimate the expenses you paid on your account during this period.
Hypothetical Example for Comparison Purposes
The second line for each share class in the following table provides information about hypothetical account values and hypothetical expenses based on the fund’s actual expense ratio and an assumed rate of return of 5% per year before expenses, which is not the fund’s actual return. The hypothetical account values and expenses may not be used to estimate the actual ending account balance or expenses you paid for the period. You may use this information to compare the ongoing costs of investing in the fund and other funds. To do so, compare this 5% hypothetical example with the 5% hypothetical examples that appear in the shareholder reports of the other funds.
Please note that the expenses shown in the table are meant to highlight the fund’s ongoing costs only and do not take into account the fees and expenses imposed under the variable contracts through which your investment in the fund is made. Therefore, the second line for each share class in the table is useful in comparing ongoing costs associated with an investment in vehicles (such as the fund) which fund benefits under variable annuity and variable life insurance contracts and to qualified pension and retirement plans only, and will not help you determine the relative total costs of investing in the fund through variable annuity and variable life insurance contracts. If the fees and expenses imposed under the variable contracts were included, your costs would have been higher.
| | | | | | | | | | | | | | | | | | |
| Share Class | | | | Annualized
Expense Ratio | | | Beginning
Account Value
7/01/19 | | | Ending Account Value
12/31/19 | | | Expenses Paid
During Period (p)
7/01/19-12/31/19 | |
| Initial Class | | Actual | | | 0.93% | | | | $1,000.00 | | | | $1,076.10 | | | | $4.87 | |
| | Hypothetical (h) | | | 0.93% | | | | $1,000.00 | | | | $1,020.52 | | | | $4.74 | |
| Service Class | | Actual | | | 1.18% | | | | $1,000.00 | | | | $1,074.97 | | | | $6.17 | |
| | Hypothetical (h) | | | 1.18% | | | | $1,000.00 | | | | $1,019.26 | | | | $6.01 | |
| (h) | 5% class return per year before expenses. |
| (p) | “Expenses Paid During Period” are equal to each class’s annualized expense ratio, as shown above, multiplied by the average account value over the period, multiplied by 184/365 (to reflect theone-half year period). |
Notes to Expense Table
Expense ratios include 0.03% of investment related expenses from short sales (See Note 2 of the Notes to Financial Statements) that are outside of the expense limitation arrangement (See Note 3 of the Notes to Financial Statements).
7
MFS Technology Portfolio
PORTFOLIO OF INVESTMENTS – 12/31/19
The Portfolio of Investments is a complete list of all securities owned by your fund. It is categorized by broad-based asset classes.
| | | | | | | | |
| | |
| Issuer | | Shares/Par | | | Value ($) | |
| COMMON STOCKS – 101.1% | | | | | |
| Aerospace – 1.4% | | | | | | | | |
| FLIR Systems, Inc. | | | 647 | | | $ | 33,689 | |
| L3Harris Technologies, Inc. | | | 2,864 | | | | 566,700 | |
| Northrop Grumman Corp. | | | 1,006 | | | | 346,034 | |
| | | | | | | | |
| | | | | | $ | 946,423 | |
| | | | | | | | |
| Biotechnology – 1.2% | | | | | | | | |
| Bio-Techne Corp. | | | 2,035 | | | $ | 446,703 | |
| Illumina, Inc. (a) | | | 1,169 | | | | 387,804 | |
| | | | | | | | |
| | | | | | $ | 834,507 | |
| | | | | | | | |
| Broadcasting – 0.2% | | | | | | | | |
| Netflix, Inc. (a) | | | 462 | | | $ | 149,489 | |
| | | | | | | | |
| Brokerage & Asset Managers – 1.2% | | | | | |
| NASDAQ, Inc. | | | 4,770 | | | $ | 510,867 | |
| Tradeweb Markets, Inc. | | | 7,145 | | | | 331,171 | |
| | | | | | | | |
| | | | | | $ | 842,038 | |
| | | | | | | | |
| Business Services – 15.4% | | | | | | | | |
| Clarivate Analytics PLC (a) | | | 23,096 | | | $ | 388,013 | |
| DXC Technology Co. | | | 1,153 | | | | 43,341 | |
| Endava PLC, ADR (a) | | | 19,647 | | | | 915,550 | |
| Equifax, Inc. | | | 722 | | | | 101,167 | |
| Fidelity National Information Services, Inc. | | | 11,625 | | | | 1,616,921 | |
| Fiserv, Inc. (a) | | | 19,443 | | | | 2,248,194 | |
| FleetCor Technologies, Inc. (a) | | | 1,670 | | | | 480,493 | |
| Global Payments, Inc. | | | 12,976 | | | | 2,368,900 | |
| PayPal Holdings, Inc. (a) | | | 13,078 | | | | 1,414,647 | |
| TransUnion | | | 5,907 | | | | 505,698 | |
| Verisk Analytics, Inc., “A” | | | 2,848 | | | | 425,321 | |
| | | | | | | | |
| | | | | | $ | 10,508,245 | |
| | | | | | | | |
| Cable TV – 1.2% | | | | | | | | |
| Altice USA, Inc., “A” (a) | | | 6,253 | | | $ | 170,957 | |
| Charter Communications, Inc., “A” (a) | | | 1,408 | | | | 682,993 | |
| | | | | | | | |
| | | | | | $ | 853,950 | |
| | | | | | | | |
| Computer Software – 22.8% | | | | | | | | |
| Adobe Systems, Inc. (a) | | | 8,512 | | | $ | 2,807,343 | |
| Autodesk, Inc. (a) | | | 4,556 | | | | 835,844 | |
| Black Knight, Inc. (a) | | | 4,786 | | | | 308,601 | |
| Blue Prism Group PLC (a) | | | 14,445 | | | | 216,787 | |
| DocuSign, Inc. (a) | | | 5,175 | | | | 383,519 | |
| Freee KK (a) | | | 2,200 | | | | 65,298 | |
| Microsoft Corp. | | | 39,246 | | | | 6,189,094 | |
| Rakus Co. Ltd. | | | 19,900 | | | | 366,480 | |
| RingCentral, Inc. (a) | | | 3,592 | | | | 605,863 | |
| Salesforce.com, Inc. (a) | | | 16,802 | | | | 2,732,677 | |
| Uber Technologies, Inc. (a) | | | 20,838 | | | | 619,722 | |
| Zendesk, Inc. | | | 4,951 | | | | 379,395 | |
| | | | | | | | |
| | | | | | $ | 15,510,623 | |
| | | | | | | | |
| Computer Software – Systems – 9.7% | | | | | |
| Apple, Inc. | | | 7,345 | | | $ | 2,156,859 | |
| Constellation Software, Inc. | | | 678 | | | | 658,478 | |
| | | | | | | | |
| | |
| Issuer | | Shares/Par | | | Value ($) | |
| COMMON STOCKS – continued | | | | | |
| Computer Software – Systems – continued | | | | | |
| Descartes Systems Group, Inc. (a) | | | 9,761 | | | $ | 417,185 | |
| EPAM Systems, Inc. | | | 1,517 | | | | 321,847 | |
| HubSpot, Inc. (a) | | | 3,953 | | | | 626,549 | |
| Linx S.A. | | | 23,000 | | | | 202,516 | |
| Pluralsight, Inc., “A” (a) | | | 18,917 | | | | 325,561 | |
| Q2 Holdings, Inc. (a) | | | 3,847 | | | | 311,915 | |
| ServiceNow, Inc. (a) | | | 2,865 | | | | 808,847 | |
| Square, Inc., “A” (a) | | | 8,649 | | | | 541,081 | |
| Workday, Inc. (a) | | | 1,404 | | | | 230,888 | |
| | | | | | | | |
| | | | | | $ | 6,601,726 | |
| | | | | | | | |
| Consumer Services – 0.6% | | | | | | | | |
| Grand Canyon Education, Inc. (a) | | | 4,512 | | | $ | 432,205 | |
| | | | | | | | |
| Electrical Equipment – 1.0% | | | | | | | | |
| Amphenol Corp., “A” | | | 6,397 | | | $ | 692,347 | |
| | | | | | | | |
| Electronics – 5.0% | | | | | | | | |
| Applied Materials, Inc. | | | 19,482 | | | $ | 1,189,181 | |
| Marvell Technology Group Ltd. | | | 20,311 | | | | 539,460 | |
| Microchip Technology, Inc. | | | 13,395 | | | | 1,402,724 | |
| NXP Semiconductors N.V. | | | 1,699 | | | | 216,215 | |
| Silicon Laboratories, Inc. (a) | | | 358 | | | | 41,521 | |
| | | | | | | | |
| | | | | | $ | 3,389,101 | |
| | | | | | | | |
| Internet – 18.2% | | | | | | | | |
| Alibaba Group Holding Ltd., ADR (a) | | | 3,473 | | | $ | 736,623 | |
| Alphabet, Inc., “A” (a)(s) | | | 4,498 | | | | 6,024,576 | |
| Facebook, Inc., “A” (a)(s) | | | 22,430 | | | | 4,603,758 | |
| GoDaddy, Inc. (a) | | | 8,981 | | | | 609,990 | |
| Wix.com Ltd. (a) | | | 3,314 | | | | 405,567 | |
| | | | | | | | |
| | | | | | $ | 12,380,514 | |
| | | | | | | | |
| Leisure & Toys – 1.9% | | | | | | | | |
| Electronic Arts, Inc. (a) | | | 11,987 | | | $ | 1,288,722 | |
| | | | | | | | |
| Medical & Health Technology & Services – 0.7% | |
| Guardant Health, Inc. (a) | | | 6,331 | | | $ | 494,704 | |
| | | | | | | | |
| Other Banks & Diversified Financials – 9.6% | | | | | |
| Mastercard, Inc., “A” | | | 10,496 | | | $ | 3,134,001 | |
| Visa, Inc., “A” | | | 18,228 | | | | 3,425,041 | |
| | | | | | | | |
| | | | | | $ | 6,559,042 | |
| | | | | | | | |
| Printing & Publishing – 1.2% | | | | | | | | |
| IHS Markit Ltd. (a) | | | 8,500 | | | $ | 640,475 | |
| Wolters Kluwer N.V. | | | 2,214 | | | | 161,474 | |
| | | | | | | | |
| | | | | | $ | 801,949 | |
| | | | | | | | |
| Specialty Stores – 9.8% | | | | | | | | |
| Amazon.com, Inc. (a)(s) | | | 3,423 | | | $ | 6,325,156 | |
| Chewy, Inc., “A” (a) | | | 11,321 | | | | 328,309 | |
| | | | | | | | |
| | | | | | $ | 6,653,465 | |
| | | | | | | | |
Total Common Stocks
(Identified Cost, $43,379,709) | | | | | | $ | 68,939,050 | |
| | | | | | | | |
8
MFS Technology Portfolio
Portfolio of Investments – continued
| | | | | | | | |
| | |
| Issuer | | Shares/Par | | | Value ($) | |
| INVESTMENT COMPANIES (h) – 0.4% | | | | | |
| Money Market Funds – 0.4% | | | | | |
| MFS Institutional Money Market Portfolio, 1.7% (v) (Identified Cost, $263,828) | | | 263,828 | | | $ | 263,828 | |
| | | | | | | | |
| |
| SECURITIES SOLD SHORT – (1.8)% | | | | | |
| Automotive – (0.9)% | | | | | |
| Tesla, Inc. | | | (1,545 | ) | | $ | (646,320 | ) |
| | | | | | | | |
| Computer Software – Systems – (0.3)% | | | | | |
| NetApp, Inc. | | | (3,174 | ) | | $ | (197,581 | ) |
| | | | | | | | |
| Network & Telecom – (0.6)% | | | | | |
| Cisco Systems, Inc. | | | (8,133 | ) | | $ | (390,059 | ) |
| | | | | | | | |
Total Securities Sold Short
(Proceeds Received, $1,009,147) | | | | | | $ | (1,233,960 | ) |
| | | | | | | | |
OTHER ASSETS, LESS
LIABILITIES – 0.3% | | | | | | | 177,884 | |
| | | | | | | | |
| NET ASSETS – 100.0% | | | | | | $ | 68,146,802 | |
| | | | | | | | |
| (a) | | Non-income producing security. |
| (h) | | An affiliated issuer, which may be considered one in which the fund owns 5% or more of the outstanding voting securities, or a company which is under common control. At period end, the aggregate values of the fund’s investments in affiliated issuers and in unaffiliated issuers were $263,828 and $68,939,050, respectively. |
| (s) | | Security or a portion of the security was pledged to cover collateral requirements for securities sold short. |
| (v) | | Affiliated issuer that is available only to investment companies managed by MFS. The rate quoted for the MFS Institutional Money Market Portfolio is the annualizedseven-day yield of the fund at period end. |
The following abbreviations are used in this report and are defined:
| ADR | | American Depositary Receipt |
At December 31, 2019, the fund had cash collateral of $268,579 and other liquid securities with an aggregate value of $2,126,585 to cover any collateral or margin obligations for securities sold short. Restricted cash and/or deposits with brokers in the Statement of Assets and Liabilities are comprised of cash collateral.
See Notes to Financial Statements
9
MFS Technology Portfolio
FINANCIAL STATEMENTS | STATEMENT OF ASSETS AND LIABILITIES
This statement represents your fund’s balance sheet, which details the assets and liabilities comprising the total value of the fund.
| | | | |
At 12/31/19 | | | | |
| |
Assets | | | | |
Investments in unaffiliated issuers, at value (identified cost, $43,379,709) | | | $68,939,050 | |
Investments in affiliated issuers, at value (identified cost, $263,828) | | | 263,828 | |
Deposits with brokers for | | | | |
Securities sold short | | | 268,579 | |
Receivables for | | | | |
Fund shares sold | | | 10,298 | |
Interest and dividends | | | 4,206 | |
Other assets | | | 661 | |
Total assets | | | $69,486,622 | |
| |
Liabilities | | | | |
Payables for | | | | |
Securities sold short, at value (proceeds received, $1,009,147) | | | $1,233,960 | |
Investments purchased | | | 25,914 | |
Fund shares reacquired | | | 29,648 | |
Payable to affiliates | | | | |
Investment adviser | | | 2,770 | |
Administrative services fee | | | 108 | |
Shareholder servicing costs | | | 14 | |
Distribution and/or service fees | | | 671 | |
Payable for independent Trustees’ compensation | | | 28 | |
Accrued expenses and other liabilities | | | 46,707 | |
Total liabilities | | | $1,339,820 | |
Net assets | | | $68,146,802 | |
| |
Net assets consist of | | | | |
Paid-in capital | | | $43,296,581 | |
Total distributable earnings (loss) | | | 24,850,221 | |
Net assets | | | $68,146,802 | |
Shares of beneficial interest outstanding | | | 3,364,876 | |
| | | | | | | | | | | | |
| | | |
| | | Net assets | | | Shares
outstanding | | | Net asset value
per share | |
Initial Class | | | $19,336,165 | | | | 912,753 | | | | $21.18 | |
Service Class | | | 48,810,637 | | | | 2,452,123 | | | | 19.91 | |
See Notes to Financial Statements
10
MFS Technology Portfolio
FINANCIAL STATEMENTS | STATEMENT OF OPERATIONS
This statement describes how much your fund earned in investment income and accrued in expenses. It also describes any gains and/or losses generated by fund operations.
| | | | |
Year ended 12/31/19 | | | | |
| |
Net investment income (loss) | | | | |
Income | | | | |
Dividends | | | $283,590 | |
Other | | | 26,690 | |
Dividends from affiliated issuers | | | 25,391 | |
Income on securities loaned | | | 6,280 | |
Foreign taxes withheld | | | (3,075 | ) |
Total investment income | | | $338,876 | |
Expenses | | | | |
Management fee | | | $491,505 | |
Distribution and/or service fees | | | 116,371 | |
Shareholder servicing costs | | | 2,922 | |
Administrative services fee | | | 19,569 | |
Independent Trustees’ compensation | | | 3,021 | |
Custodian fee | | | 6,045 | |
Shareholder communications | | | 1,509 | |
Audit and tax fees | | | 57,314 | |
Dividend and interest expense on securities sold short | | | 16,355 | |
Interest expense and fees | | | 592 | |
Miscellaneous | | | 34,281 | |
Total expenses | | | $749,484 | |
Reduction of expenses by investment adviser | | | (6,386 | ) |
Net expenses | | | $743,098 | |
Net investment income (loss) | | | $(404,222 | ) |
| |
Realized and unrealized gain (loss) | | | | |
Realized gain (loss) (identified cost basis) | | | | |
Unaffiliated issuers | | | $70,155 | |
Affiliated issuers | | | 158 | |
Written options | | | 40,053 | |
Securities sold short | | | (151,205 | ) |
Foreign currency | | | (130 | ) |
Net realized gain (loss) | | | $(40,969 | ) |
Change in unrealized appreciation or depreciation | | | | |
Unaffiliated issuers | | | $20,262,512 | |
Securities sold short | | | (224,813 | ) |
Net unrealized gain (loss) | | | $20,037,699 | |
Net realized and unrealized gain (loss) | | | $19,996,730 | |
Change in net assets from operations | | | $19,592,508 | |
See Notes to Financial Statements
11
MFS Technology Portfolio
FINANCIAL STATEMENTS | STATEMENTS OF CHANGES IN NET ASSETS
These statements describe the increases and/or decreases in net assets resulting from operations, any distributions, and any shareholder transactions.
| | | | | | | | |
| | | Year ended | |
| | | 12/31/19 | | | 12/31/18 | |
Change in net assets | | | | | | | | |
| | |
From operations | | | | | | | | |
Net investment income (loss) | | | $(404,222 | ) | | | $(1,354,994 | ) |
Net realized gain (loss) | | | (40,969 | ) | | | 108,354,927 | |
Net unrealized gain (loss) | | | 20,037,699 | | | | (82,721,053 | ) |
Change in net assets from operations | | | $19,592,508 | | | | $24,278,880 | |
Total distributions to shareholders | | | $(6,957,005 | ) | | | $(15,602,152 | ) |
Change in net assets from fund share transactions | | | $(816,272 | ) | | | $(183,617,707 | ) |
Total change in net assets | | | $11,819,231 | | | | $(174,940,979 | ) |
| | |
Net assets | | | | | | | | |
At beginning of period | | | 56,327,571 | | | | 231,268,550 | |
At end of period | | | $68,146,802 | | | | $56,327,571 | |
See Notes to Financial Statements
12
MFS Technology Portfolio
FINANCIAL STATEMENTS | FINANCIAL HIGHLIGHTS
The financial highlights table is intended to help you understand the fund’s financial performance for the past 5 years. Certain information reflects financial results for a single fund share. The total returns in the table represent the rate that an investor would have earned (or lost) on an investment in the fund share class (assuming reinvestment of all distributions) held for the entire period.
| | | | | | | | | | | | | | | | | | | | |
| Initial Class | | Year ended | |
| | | | | |
| | | 12/31/19 | | | 12/31/18 | | | 12/31/17 | | | 12/31/16 | | | 12/31/15 | |
| | | | | |
Net asset value, beginning of period | | | $17.34 | | | | $17.96 | | | | $13.19 | | | | $12.45 | | | | $11.63 | |
| | | | | |
| Income (loss) from investment operations | | | | | | | | | | | | | | | | | | | | |
Net investment income (loss) (d) | | | $(0.09 | ) | | | $(0.07 | ) | | | $(0.05 | ) | | | $(0.01 | )(c) | | | $(0.03 | ) |
Net realized and unrealized gain (loss) | | | 6.16 | | | | 0.58 | | | | 5.16 | | | | 1.10 | | | | 1.22 | |
Total from investment operations | | | $6.07 | | | | $0.51 | | | | $5.11 | | | | $1.09 | | | | $1.19 | |
| | | | | |
| Less distributions declared to shareholders | | | | | | | | | | | | | | | | | | | | |
From net realized gain | | | $(2.23 | ) | | | $(1.13 | ) | | | $(0.34 | ) | | | $(0.35 | ) | | | $(0.37 | ) |
Net asset value, end of period (x) | | | $21.18 | | | | $17.34 | | | | $17.96 | | | | $13.19 | | | | $12.45 | |
Total return (%) (k)(r)(s)(x) | | | 36.16 | | | | 1.73 | | | | 39.00 | | | | 8.69 | (c) | | | 10.75 | |
| | | | | |
Ratios (%) (to average net assets)
and Supplemental data: | | | | | | | | | | | | | | | | | | | | |
Expenses before expense reductions (f) | | | 0.97 | | | | 0.94 | | | | 0.88 | | | | 0.85 | (c) | | | 0.91 | |
Expenses after expense reductions (f) | | | 0.96 | | | | 0.93 | | | | 0.88 | | | | 0.85 | (c) | | | 0.91 | |
Net investment income (loss) | | | (0.44 | ) | | | (0.38 | ) | | | (0.29 | ) | | | (0.10 | )(c) | | | (0.22 | ) |
Portfolio turnover | | | 33 | | | | 39 | | | | 31 | | | | 36 | | | | 45 | |
Net assets at end of period (000 omitted) | | | $19,336 | | | | $17,056 | | | | $27,659 | | | | $15,195 | | | | $15,588 | |
| | | | | |
| Supplemental Ratios (%): | | | | | | | | | | | | | | | | | | | | |
Ratios of expenses to average net assets after expense reductions excluding short sale expenses and interest expense and fees (f) | | | 0.93 | | | | 0.85 | | | | 0.85 | | | | 0.82 | (c) | | | 0.89 | |
| |
| Service Class | | Year ended | |
| | | | | |
| | | 12/31/19 | | | 12/31/18 | | | 12/31/17 | | | 12/31/16 | | | 12/31/15 | |
| | | | | |
Net asset value, beginning of period | | | $16.44 | | | | $17.11 | | | | $12.61 | | | | $11.95 | | | | $11.20 | |
| | | | | |
| Income (loss) from investment operations | | | | | | | | | | | | | | | | | | | | |
Net investment income (loss) (d) | | | $(0.13 | ) | | | $(0.12 | ) | | | $(0.08 | ) | | | $(0.04 | )(c) | | | $(0.05 | ) |
Net realized and unrealized gain (loss) | | | 5.83 | | | | 0.58 | | | | 4.92 | | | | 1.05 | | | | 1.17 | |
Total from investment operations | | | $5.70 | | | | $0.46 | | | | $4.84 | | | | $1.01 | | | | $1.12 | |
| | | | | |
| Less distributions declared to shareholders | | | | | | | | | | | | | | | | | | | | |
From net realized gain | | | $(2.23 | ) | | | $(1.13 | ) | | | $(0.34 | ) | | | $(0.35 | ) | | | $(0.37 | ) |
Net asset value, end of period (x) | | | $19.91 | | | | $16.44 | | | | $17.11 | | | | $12.61 | | | | $11.95 | |
Total return (%) (k)(r)(s)(x) | | | 35.88 | | | | 1.52 | | | | 38.65 | | | | 8.39 | (c) | | | 10.53 | |
| | | | | |
Ratios (%) (to average net assets)
and Supplemental data: | | | | | | | | | | | | | | | | | | | | |
Expenses before expense reductions (f) | | | 1.22 | | | | 1.16 | | | | 1.14 | | | | 1.10 | (c) | | | 1.16 | |
Expenses after expense reductions (f) | | | 1.21 | | | | 1.15 | | | | 1.13 | | | | 1.10 | (c) | | | 1.16 | |
Net investment income (loss) | | | (0.69 | ) | | | (0.61 | ) | | | (0.53 | ) | | | (0.35 | )(c) | | | (0.47 | ) |
Portfolio turnover | | | 33 | | | | 39 | | | | 31 | | | | 36 | | | | 45 | |
Net assets at end of period (000 omitted) | | | $48,811 | | | | $39,272 | | | | $203,610 | | | | $126,561 | | | | $106,002 | |
| | | | | |
| Supplemental Ratios (%): | | | | | | | | | | | | | | | | | | | | |
Ratios of expenses to average net assets after expense reductions excluding short sale expenses and interest expense and fees (f) | | | 1.18 | | | | 1.07 | | | | 1.10 | | | | 1.06 | (c) | | | 1.14 | |
See Notes to Financial Statements
13
MFS Technology Portfolio
Financial Highlights – continued
| (c) | Amount reflects aone-time reimbursement of expenses by the custodian (or former custodian) without which net investment income and performance would be lower and expenses would be higher. |
| (d) | Per share data is based on average shares outstanding. |
| (f) | Ratios do not reflect reductions from fees paid indirectly, if applicable. |
| (k) | The total return does not reflect expenses that apply to separate accounts. Inclusion of these charges would reduce the total return figures for all periods shown. |
| (r) | Certain expenses have been reduced without which performance would have been lower. |
| (s) | From time to time the fund may receive proceeds from litigation settlements, without which performance would be lower. |
| (x) | The net asset values and total returns have been calculated on net assets which include adjustments made in accordance with U.S. generally accepted accounting principles required at period end for financial reporting purposes. |
See Notes to Financial Statements
14
MFS Technology Portfolio
NOTES TO FINANCIAL STATEMENTS
| (1) | | Business and Organization |
MFS Technology Portfolio (the fund) is anon-diversified series of MFS Variable Insurance Trust II (the trust). The trust is organized as a Massachusetts business trust and is registered under the Investment Company Act of 1940, as amended, as anopen-end management investment company. The shareholders of each series of the trust are separate accounts of insurance companies, which offer variable annuity and/or life insurance products, and qualified retirement and pension plans.
The fund is an investment company and accordingly follows the investment company accounting and reporting guidance of the Financial Accounting Standards Board (FASB) Accounting Standards Codification Topic 946 Financial Services – Investment Companies.
| (2) | | Significant Accounting Policies |
General– The preparation of financial statements in conformity with U.S. generally accepted accounting principles requires management to make estimates and assumptions that affect the reported amounts of assets and liabilities, and disclosure of contingent assets and liabilities at the date of the financial statements and the reported amounts of increases and decreases in net assets from operations during the reporting period. Actual results could differ from those estimates. In the preparation of these financial statements, management has evaluated subsequent events occurring after the date of the fund’s Statement of Assets and Liabilities through the date that the financial statements were issued. The fund invests primarily in securities of issuers in the technology industry. Issuers in a single industry can react similarly to market, currency, political, economic, regulatory, geopolitical, and other conditions. The value of stocks in the technology sector can be very volatile due to the rapid pace of product change, technological developments, and other factors.
Balance Sheet Offsetting– The fund’s accounting policy with respect to balance sheet offsetting is that, absent an event of default by the counterparty or a termination of the agreement, the International Swaps and Derivatives Association (ISDA) Master Agreement, or similar agreement, does not result in an offset of reported amounts of financial assets and financial liabilities in the Statement of Assets and Liabilities across transactions between the fund and the applicable counterparty. The fund’s right to setoff may be restricted or prohibited by the bankruptcy or insolvency laws of the particular jurisdiction to which a specific master netting agreement counterparty is subject. Balance sheet offsetting disclosures, to the extent applicable to the fund, have been included in the fund’s Significant Accounting Policies note under the captions for each of the fund’sin-scope financial instruments and transactions.
Investment Valuations– Equity securities, including restricted equity securities and equity securities sold short, are generally valued at the last sale or official closing price on their primary market or exchange as provided by a third-party pricing service. Equity securities, for which there were no sales reported that day, are generally valued at the last quoted daily bid quotation on their primary market or exchange as provided by a third-party pricing service. Equity securities sold short, for which there were no sales reported for that day, are generally valued at the last quoted daily ask quotation on their primary market or exchange as provided by a third-party pricing service. Short-term instruments with a maturity at issuance of 60 days or less may be valued at amortized cost, which approximates market value. Exchange-traded options are generally valued at the last sale or official closing price on their primary exchange as provided by a third-party pricing service. Exchange-traded options for which there were no sales reported that day are generally valued at the last daily bid quotation on their primary exchange as provided by a third-party pricing service. For put options, the position may be valued at the last daily ask quotation if there are no trades reported during the day. Options not traded on an exchange are generally valued at a broker/dealer bid quotation. Foreign currency options are generally valued at valuations provided by a third-party pricing service.Open-end investment companies are generally valued at net asset value per share. Securities and other assets generally valued on the basis of information from a third-party pricing service may also be valued at a broker/dealer bid quotation. In determining values, third-party pricing services can utilize both transaction data and market information such as yield, quality, coupon rate, maturity, type of issue, trading characteristics, and other market data. The values of foreign securities and other assets and liabilities expressed in foreign currencies are converted to U.S. dollars using the mean of bid and asked prices for rates provided by a third-party pricing service.
The Board of Trustees has delegated primary responsibility for determining or causing to be determined the value of the fund’s investments (including any fair valuation) to the adviser pursuant to valuation policies and procedures approved by the Board. If the adviser determines that reliable market quotations are not readily available, investments are valued at fair value as determined in good faith by the adviser in accordance with such procedures under the oversight of the Board of Trustees. Under the fund’s valuation policies and procedures, market quotations are not considered to be readily available for most types of debt instruments and floating rate loans and many types of derivatives. These investments are generally valued at fair value based on information from third-party pricing services. In addition, investments may be valued at fair value if the adviser determines that an investment’s value has been materially affected by events occurring after the close of the exchange or market on which the investment is principally traded (such as foreign exchange or market) and prior to the determination of the fund’s net asset value, or after the halt of trading of a specific security where trading does not resume prior to the close of the exchange or market on which the security is principally traded. Events that occur after foreign markets close (such as developments in foreign markets and significant movements in the U.S.
15
MFS Technology Portfolio
Notes to Financial Statements – continued
markets) and prior to the determination of the fund’s net asset value may be deemed to have a material effect on the value of securities traded in foreign markets. Accordingly, the fund’s foreign equity securities may often be valued at fair value. The adviser generally relies on third-party pricing services or other information (such as the correlation with price movements of similar securities in the same or other markets; the type, cost and investment characteristics of the security; the business and financial condition of the issuer; and trading and other market data) to assist in determining whether to fair value and at what value to fair value an investment. The value of an investment for purposes of calculating the fund’s net asset value can differ depending on the source and method used to determine value. When fair valuation is used, the value of an investment used to determine the fund’s net asset value may differ from quoted or published prices for the same investment. There can be no assurance that the fund could obtain the fair value assigned to an investment if it were to sell the investment at the same time at which the fund determines its net asset value per share.
Various inputs are used in determining the value of the fund’s assets or liabilities. These inputs are categorized into three broad levels. In certain cases, the inputs used to measure fair value may fall into different levels of the fair value hierarchy. In such cases, an investment’s level within the fair value hierarchy is based on the lowest level of input that is significant to the fair value measurement. The fund’s assessment of the significance of a particular input to the fair value measurement in its entirety requires judgment, and considers factors specific to the investment. Level 1 includes unadjusted quoted prices in active markets for identical assets or liabilities. Level 2 includes other significant observable market-based inputs (including quoted prices for similar securities, interest rates, prepayment speed, and credit risk). Level 3 includes unobservable inputs, which may include the adviser’s own assumptions in determining the fair value of investments. The following is a summary of the levels used as of December 31, 2019 in valuing the fund’s assets or liabilities:
| | | | | | | | | | | | | | | | |
| Financial Instruments | | Level 1 | | | Level 2 | | | Level 3 | | | Total | |
| Equity Securities | | | $68,939,050 | | | | $— | | | | $— | | | | $68,939,050 | |
| Mutual Funds | | | 263,828 | | | | — | | | | — | | | | 263,828 | |
| Total | | | $69,202,878 | | | | $— | | | | $— | | | | $69,202,878 | |
| | | | |
| Securities Sold Short | | | $(1,233,960 | ) | | | $— | | | | $— | | | | $(1,233,960 | ) |
For further information regarding security characteristics, see the Portfolio of Investments.
Foreign Currency Translation– Purchases and sales of foreign investments, income, and expenses are converted into U.S. dollars based upon currency exchange rates prevailing on the respective dates of such transactions or on the reporting date for foreign denominated receivables and payables. Gains and losses attributable to foreign currency exchange rates on sales of securities are recorded for financial statement purposes as net realized gains and losses on investments. Gains and losses attributable to foreign exchange rate movements on receivables, payables, income and expenses are recorded for financial statement purposes as foreign currency transaction gains and losses. That portion of both realized and unrealized gains and losses on investments that results from fluctuations in foreign currency exchange rates is not separately disclosed.
Derivatives– The fund uses derivatives primarily to increase or decrease exposure to a particular market or segment of the market, or security, to increase or decrease interest rate or currency exposure, or as alternatives to direct investments. Derivatives are used for hedging ornon-hedging purposes. While hedging can reduce or eliminate losses, it can also reduce or eliminate gains. When the fund uses derivatives as an investment to increase market exposure, or for hedging purposes, gains and losses from derivative instruments may be substantially greater than the derivative’s original cost.
The derivative instruments used by the fund during the period were written options and purchased options. Depending on the type of derivative, the fund may exit a derivative position by entering into an offsetting transaction with a counterparty or exchange, negotiating an agreement with the derivative counterparty, or novating the position to a third party. The fund’s period end derivatives, as presented in the Portfolio of Investments and the associated Derivative Contract tables, generally are indicative of the volume of its derivative activity during the period.
At December 31, 2019, the fund did not have any outstanding derivative instruments.
The following table presents, by major type of derivative contract, the realized gain (loss) on derivatives held by the fund for the year ended December 31, 2019 as reported in the Statement of Operations:
| | | | | | | | |
| Risk | | Unaffiliated Issuers
(Purchased Options) | | | Written Options | |
| Equity | | | $15,972 | | | | $40,053 | |
There is no change in unrealized appreciation (depreciation) on derivative transactions at period end.
Derivative counterparty credit risk is managed through formal evaluation of the creditworthiness of all potential counterparties. On certain, but not all, uncleared derivatives, the fund attempts to reduce its exposure to counterparty credit risk whenever possible by entering into an ISDA Master Agreement on a bilateral basis. The ISDA Master Agreement gives each party to the agreement the
16
MFS Technology Portfolio
Notes to Financial Statements – continued
right to terminate all transactions traded under such agreement if there is a specified deterioration in the credit quality of the other party. Upon an event of default or a termination of the ISDA Master Agreement, thenon-defaulting party has the right to close out all transactions traded under such agreement and to net amounts owed under each agreement to one net amount payable by one party to the other. This right to close out and net payments across all transactions traded under the ISDA Master Agreement could result in a reduction of the fund’s credit risk to such counterparty equal to any amounts payable by the fund under the applicable transactions, if any.
Collateral and margin requirements differ by type of derivative. For cleared derivatives (e.g., futures contracts, cleared swaps, and exchange-traded options), margin requirements are set by the clearing broker and the clearing house and collateral, in the form of cash or securities, is posted by the fund directly with the clearing broker. Collateral terms are counterparty agreement specific for uncleared derivatives (e.g., forward foreign currency exchange contracts, uncleared swap agreements, and uncleared options) and collateral, in the form of cash and securities, is held in segregated accounts with the fund’s custodian in connection with these agreements. For derivatives traded under an ISDA Master Agreement, which contains a collateral support annex, the collateral requirements are netted across all transactions traded under such counterparty-specific agreement and an amount is posted from one party to the other to collateralize such obligations. Cash that has been segregated or delivered to cover the fund’s collateral or margin obligations under derivative contracts, if any, will be reported separately in the Statement of Assets and Liabilities as restricted cash for uncleared derivatives and/or deposits with brokers for cleared derivatives. Securities pledged as collateral or margin for the same purpose, if any, are noted in the Portfolio of Investments. The fund may be required to make payments of interest on uncovered collateral or margin obligations with the broker. Any such payments are included in “Miscellaneous” expense in the Statement of Operations.
Written Options– In exchange for a premium, the fund wrote call options on securities for which it anticipated the price would decline and also wrote put options on securities for which it anticipated the price would increase. At the time the option was written, the fund believed the premium received exceeded the potential loss that could result from adverse price changes in the options’ underlying securities. In a written option, the fund as the option writer grants the buyer the right to purchase from, or sell to, the fund a specified number of shares or units of a particular security, currency or index at a specified price within a specified period of time.
The premium received is initially recorded as a liability in the Statement of Assets and Liabilities. The option is subsequentlymarked-to-market daily with the difference between the premium received and the market value of the written option being recorded as unrealized appreciation or depreciation. When a written option expires, the fund realizes a gain equal to the amount of the premium received. The difference between the premium received and the amount paid on effecting a closing transaction is considered a realized gain or loss. When a written call option is exercised, the premium received is offset against the proceeds to determine the realized gain or loss. When a written put option is exercised, the premium reduces the cost basis of the security purchased by the fund.
At the initiation of the written option contract, for exchange traded options, the fund is required to deposit securities or cash as collateral with the custodian for the benefit of the broker or directly with the clearing broker, based on the type of option. For uncleared options, the fund may post collateral subject to the terms of an ISDA Master Agreement as generally described above if the market value of the options contract moves against it. The fund, as writer of an option, may have no control over whether the underlying securities may be sold (call) or purchased (put) and, as a result, bears the market risk of an unfavorable change in the price of the securities underlying the written option. Losses from writing options can exceed the premium received and can exceed the potential loss from an ordinary buy and sell transaction. Although the fund’s market risk may be significant, the maximum counterparty credit risk to the fund is equal to the market value of any collateral posted to the broker. For uncleared options, this risk is mitigated in cases where there is an ISDA Master Agreement between the fund and the counterparty providing for netting as described above.
Purchased Options– The fund purchased put options for a premium. Purchased put options entitle the holder to sell a specified number of shares or units of a particular security, currency or index at a specified price at a specified date or within a specified period of time. Purchasing put options may hedge against an anticipated decline in the value of portfolio securities or currency or decrease the fund’s exposure to an underlying instrument.
The premium paid is initially recorded as an investment in the Statement of Assets and Liabilities. That investment is subsequentlymarked-to-market daily with the difference between the premium paid and the market value of the purchased option being recorded as unrealized appreciation or depreciation. Premiums paid for purchased put options which have expired are treated as realized losses on investments in the Statement of Operations. Upon the exercise or closing of a purchased put option, the premium paid is offset against the proceeds on the sale of the underlying security or financial instrument in order to determine the realized gain or loss on investments.
Whether or not the option is exercised, the fund’s maximum risk of loss from purchasing an option is the amount of premium paid. All option contracts involve credit risk if the counterparty to the option contract fails to perform. For uncleared options, this risk is
17
MFS Technology Portfolio
Notes to Financial Statements – continued
mitigated in cases where there is an ISDA Master Agreement between the fund and the counterparty providing for netting as described above and, where applicable, by the posting of collateral by the counterparty to the fund to cover the fund’s exposure to the counterparty under such ISDA Master Agreement.
Short Sales– The fund entered into short sales whereby it sells a security it does not own in anticipation of a decline in the value of that security. The fund will realize a gain if the security price decreases and a loss if the security price increases between the date of the short sale and the date on which the fund replaces the borrowed security. Losses from short sales can exceed the proceeds of the security sold; and they can also exceed the potential loss from an ordinary buy and sell transaction. The amount of any premium, dividends, or interest the fund may be required to pay in connection with a short sale will be recognized as a fund expense. During the year ended December 31, 2019, this expense amounted to $16,355. The fund segregates cash or marketable securities in an amount that, when combined with the amount of proceeds from the short sale deposited with the broker, at least equals the current market value of the security sold short.
Security Loans– Under its Securities Lending Agency Agreement with the fund, State Street Bank and Trust Company, as lending agent, loans the securities of the fund to certain qualified institutions (the “Borrowers”) approved by the fund. Security loans can be terminated at the discretion of either the lending agent or the fund and the related securities must be returned within the earlier of the standard trade settlement period for such securities or within three business days. The loans are collateralized by cash and/or U.S. Treasury and federal agency obligations in an amount typically at least equal to the market value of the securities loaned. On loans collateralized by cash, the cash collateral is invested in a money market fund. The market value of the loaned securities is determined at the close of business of the fund and any additional required collateral is delivered to the fund on the next business day. The lending agent provides the fund with indemnification against Borrower default. In the event of Borrower default, the lending agent will, for the benefit of the fund, either purchase securities identical to those loaned or, when such purchase is commercially impracticable, pay the fund the market value of the loaned securities. In return, the lending agent assumes the fund’s rights to the related collateral. If the collateral value is less than the cost to purchase identical securities, the lending agent is responsible for the shortfall, but only to the extent that such shortfall is not due to a decline in collateral value resulting from collateral reinvestment for which the fund bears the risk of loss. A portion of the income generated upon investment of the collateral is remitted to the Borrowers, and the remainder is allocated between the fund and the lending agent. On loans collateralized by U.S. Treasury and/or federal agency obligations, a fee is received from the Borrower, and is allocated between the fund and the lending agent. Income from securities lending is separately reported in the Statement of Operations. The dividend and interest income earned on the securities loaned is accounted for in the same manner as other dividend and interest income. At December 31, 2019, there were no securities on loan or collateral outstanding.
Indemnifications– Under the fund’s organizational documents, its officers and Trustees may be indemnified against certain liabilities and expenses arising out of the performance of their duties to the fund. Additionally, in the normal course of business, the fund enters into agreements with service providers that may contain indemnification clauses. The fund’s maximum exposure under these agreements is unknown as this would involve future claims that may be made against the fund that have not yet occurred.
Investment Transactions and Income– Investment transactions are recorded on the trade date. Interest income is recorded on the accrual basis. Dividends received in cash are recorded on theex-dividend date. Certain dividends from foreign securities will be recorded when the fund is informed of the dividend if such information is obtained subsequent to theex-dividend date. Dividend payments received in additional securities are recorded on theex-dividend date in an amount equal to the value of the security on such date.
The fund may receive proceeds from litigation settlements. Any proceeds received from litigation involving portfolio holdings are reflected in the Statement of Operations in realized gain/loss if the security has been disposed of by the fund or in unrealized gain/loss if the security is still held by the fund. Any other proceeds from litigation not related to portfolio holdings are reflected as other income in the Statement of Operations.
Tax Matters and Distributions– The fund intends to qualify as a regulated investment company, as defined under Subchapter M of the Internal Revenue Code, and to distribute all of its taxable income, including realized capital gains. As a result, no provision for federal income tax is required. The fund’s federal tax returns, when filed, will remain subject to examination by the Internal Revenue Service for a three year period. Management has analyzed the fund’s tax positions taken on federal and state tax returns for all open tax years and does not believe that there are any uncertain tax positions that require recognition of a tax liability. Foreign taxes, if any, have been accrued by the fund in the accompanying financial statements in accordance with the applicable foreign tax law. Foreign income taxes may be withheld by certain countries in which the fund invests. Additionally, capital gains realized by the fund on securities issued in or by certain foreign countries may be subject to capital gains tax imposed by those countries.
Distributions to shareholders are recorded on theex-dividend date. Income and capital gain distributions are determined in accordance with income tax regulations, which may differ from U.S. generally accepted accounting principles. Certain capital accounts in the financial statements are periodically adjusted for permanent differences in order to reflect their tax character. These
18
MFS Technology Portfolio
Notes to Financial Statements – continued
adjustments have no impact on net assets or net asset value per share. Temporary differences which arise from recognizing certain items of income, expense, gain or loss in different periods for financial statement and tax purposes will reverse at some time in the future.
Book/tax differences primarily relate to net operating losses, wash sale loss deferrals and straddle loss deferrals.
The tax character of distributions declared to shareholders for the last two fiscal years is as follows:
| | | | | | | | |
| | | Year ended
12/31/19 | | | Year ended
12/31/18 | |
| Ordinary income (including any short-term capital gains) | | | $97,726 | | | | $3,607,065 | |
| Long-term capital gains | | | 6,859,279 | | | | 11,995,087 | |
| Total distributions | | | $6,957,005 | | | | $15,602,152 | |
The federal tax cost and the tax basis components of distributable earnings were as follows:
| | | | |
| As of 12/31/19 | | | | |
| |
| Cost of investments | | | $43,118,697 | |
| Gross appreciation | | | 25,479,852 | |
| Gross depreciation | | | (629,631 | ) |
| Net unrealized appreciation (depreciation) | | | $24,850,221 | |
Multiple Classes of Shares of Beneficial Interest– The fund offers multiple classes of shares, which differ in their respective distribution and/or service fees. The fund’s income, realized and unrealized gain (loss), and common expenses are allocated to shareholders based on the daily net assets of each class. Dividends are declared separately for each class. Differences in per share dividend rates are generally due to differences in separate class expenses. The fund’s distributions declared to shareholders as reported in the Statements of Changes in Net Assets are presented by class as follows:
| | | | | | | | |
| | |
| | | Year ended
12/31/19 | | | Year ended
12/31/18 | |
| Initial Class | | | $1,929,881 | | | | $1,094,630 | |
| Service Class | | | 5,027,124 | | | | 14,507,522 | |
| Total | | | $6,957,005 | | | | $15,602,152 | |
| (3) | | Transactions with Affiliates |
Investment Adviser– The fund has an investment advisory agreement with MFS to provide overall investment management and related administrative services and facilities to the fund. The management fee is computed daily and paid monthly at the following annual rates based on the fund’s average daily net assets:
| | | | |
| Up to $1 billion | | | 0.75% | |
| In excess of $1 billion | | | 0.70% | |
MFS has agreed in writing to reduce its management fee by a specified amount if certain MFS mutual fund assets exceed thresholds agreed to by MFS and the fund’s Board of Trustees. For the year ended December 31, 2019, this management fee reduction amounted to $6,386, which is included in the reduction of total expenses in the Statement of Operations. The management fee incurred for the year ended December 31, 2019 was equivalent to an annual effective rate of 0.74% of the fund’s average daily net assets.
The investment adviser has agreed in writing to pay a portion of the fund’s total annual operating expenses, excluding interest, taxes, extraordinary expenses, brokerage and transaction costs, and investment-related expenses (such as short sale dividend and interest expenses incurred in connection with the fund’s investment activity), such that total annual operating expenses do not exceed 1.00% of average daily net assets for the Initial Class shares and 1.25% of average daily net assets for the Service Class shares. This written agreement will continue until modified by the fund’s Board of Trustees, but such agreement will continue at least until April 30, 2021. For the year ended December 31, 2019, the fund’s actual operating expenses did not exceed the limit and therefore, the investment adviser did not pay any portion of the fund’s expenses related to this agreement.
Distributor– MFS Fund Distributors, Inc. (MFD), a wholly-owned subsidiary of MFS, is the distributor of shares of the fund. The Trustees have adopted a distribution plan for the Service Class shares pursuant to Rule12b-1 under the Investment Company Act of 1940.
The fund’s distribution plan provides that the fund will pay MFD distribution and/or service fees equal to 0.25% per annum of its average daily net assets attributable to Service Class shares as partial consideration for services performed and expenses incurred by MFD and financial intermediaries (including participating insurance companies that invest in the fund to fund variable annuity and variable life insurance contracts, sponsors of qualified retirement and pension plans that invest in the fund, and affiliates of these participating insurance companies and plan sponsors) in connection with the sale and distribution of the Service Class shares. MFD may subsequently pay all, or a portion, of the distribution and/or service fees to financial intermediaries.
19
MFS Technology Portfolio
Notes to Financial Statements – continued
Shareholder Servicing Agent– MFS Service Center, Inc. (MFSC), a wholly-owned subsidiary of MFS, receives a fee from the fund for its services as shareholder servicing agent. For the year ended December 31, 2019, the fee was $2,660, which equated to 0.0041% annually of the fund’s average daily net assets. MFSC also receives payment from the fund forout-of-pocket expenses paid by MFSC on behalf of the fund. For the year ended December 31, 2019, these costs amounted to $262.
Administrator– MFS provides certain financial, legal, shareholder communications, compliance, and other administrative services to the fund. Under an administrative services agreement, the fund reimburses MFS the costs incurred to provide these services. The fund is charged an annual fixed amount of $17,500 plus a fee based on average daily net assets. The administrative services fee incurred for the year ended December 31, 2019 was equivalent to an annual effective rate of 0.0299% of the fund’s average daily net assets.
Trustees’ and Officers’ Compensation– The fund pays compensation to independent Trustees in the form of a retainer, attendance fees, and additional compensation to Board and Committee chairpersons. The fund does not pay compensation directly to Trustees or officers of the fund who are also officers of the investment adviser, all of whom receive remuneration from MFS for their services to the fund. Certain officers and Trustees of the fund are officers or directors of MFS, MFD, and MFSC.
Other– This fund and certain other funds managed by MFS (the funds) had entered into a service agreement (the ISO Agreement) which provided for payment of fees solely by the funds to Tarantino LLC in return for the provision of services of an Independent Senior Officer (ISO) for the funds. Frank L. Tarantino served as the ISO and was an officer of the funds and the sole member of Tarantino LLC. Effective June 30, 2019, Mr. Tarantino retired from his position as ISO for the funds, and the ISO Agreement was terminated. For the year ended December 31, 2019, the fee paid by the fund under this agreement was $77 and is included in “Miscellaneous” expense in the Statement of Operations. MFS had agreed to bear all expenses associated with office space, other administrative support, and supplies provided to the ISO.
The fund invests in the MFS Institutional Money Market Portfolio which is managed by MFS and seeks current income consistent with preservation of capital and liquidity. This money market fund does not pay a management fee to MFS.
The fund is permitted to engage in purchase and sale transactions with funds and accounts for which MFS serves as investment adviser orsub-adviser (“cross-trades”) pursuant to a policy adopted by the Board of Trustees. This policy has been designed to ensure that cross-trades conducted by the fund comply with Rule17a-7 under the Investment Company Act of 1940. During the year ended December 31, 2019, the fund engaged in purchase transactions pursuant to this policy, which amounted to $40,977.
The adviser has voluntarily undertaken to reimburse the fund from its own resources on a quarterly basis for the cost of investment research embedded in the cost of the fund’s securities trades. This agreement may be rescinded at any time. For the year ended December 31, 2019, this reimbursement amounted to $9,727, which is included in “Other” income in the Statement of Operations.
For the year ended December 31, 2019, purchases and sales of investments, other than purchased option transactions, short sales, and short-term obligations, aggregated $21,088,101 and $27,573,180, respectively.
| (5) | | Shares of Beneficial Interest |
The fund’s Declaration of Trust permits the Trustees to issue an unlimited number of full and fractional shares of beneficial interest. Transactions in fund shares were as follows:
| | | | | | | | | | | | | | | | |
| | | Year ended 12/31/19 | | | Year ended 12/31/18 | |
| | | | |
| | | Shares | | | Amount | | | Shares | | | Amount | |
| Shares sold | | | | | | | | | | | | | | | | |
Initial Class | | | 46,536 | | | | $963,805 | | | | 93,157 | | | | $1,884,589 | |
Service Class | | | 461,713 | | | | 8,867,564 | | | | 2,524,146 | | | | 48,418,535 | |
| | | 508,249 | | | | $9,831,369 | | | | 2,617,303 | | | | $50,303,124 | |
| | | | |
| Shares issued to shareholders in reinvestment of distributions | | | | | | | | | | | | | | | | |
Initial Class | | | 99,478 | | | | $1,929,881 | | | | 51,805 | | | | $1,094,630 | |
Service Class | | | 275,459 | | | | 5,027,124 | | | | 723,567 | | | | 14,507,522 | |
| | | 374,937 | | | | $6,957,005 | | | | 775,372 | | | | $15,602,152 | |
| | | | |
| Shares reacquired | | | | | | | | | | | | | | | | |
Initial Class | | | (216,620 | ) | | | $(4,411,510 | ) | | | (701,868 | ) | | | $(14,582,305 | ) |
Service Class | | | (673,201 | ) | | | (13,193,136 | ) | | | (12,758,134 | ) | | | (234,940,678 | ) |
| | | (889,821 | ) | | | $(17,604,646 | ) | | | (13,460,002 | ) | | | $(249,522,983 | ) |
| | | | |
| Net change | | | | | | | | | | | | | | | | |
Initial Class | | | (70,606 | ) | | | $(1,517,824 | ) | | | (556,906 | ) | | | $(11,603,086 | ) |
Service Class | | | 63,971 | | | | 701,552 | | | | (9,510,421 | ) | | | (172,014,621 | ) |
| | | (6,635 | ) | | | $(816,272 | ) | | | (10,067,327 | ) | | | $(183,617,707 | ) |
20
MFS Technology Portfolio
Notes to Financial Statements – continued
The fund and certain other funds managed by MFS participate in a $1.25 billion unsecured committed line of credit, subject to a $1 billion sublimit, provided by a syndicate of banks under a credit agreement. Borrowings may be made for temporary financing needs. Interest is charged to each fund, based on its borrowings, generally at a rate equal to the highest of one month LIBOR, the Federal Funds Effective Rate and the Overnight Bank Funding Rate, plus an agreed upon spread. A commitment fee, based on the average daily, unused portion of the committed line of credit, is allocated among the participating funds. In addition, the fund and other funds managed by MFS have established unsecured uncommitted borrowing arrangements with certain banks for temporary financing needs. Interest is charged to each fund, based on its borrowings, at rates equal to customary reference rates plus an agreed upon spread. For the year ended December 31, 2019, the fund’s commitment fee and interest expense were $315 and $0, respectively, and are included in “Interest expense and fees” in the Statement of Operations.
| (7) | | Investments in Affiliated Issuers |
An affiliated issuer may be considered one in which the fund owns 5% or more of the outstanding voting securities, or a company which is under common control. For the purposes of this report, the following were affiliated issuers:
| | | | | | | | | | | | | | | | | | | | | | | | |
| Affiliated Issuers | | Beginning
Value | | | Purchases | | | Sales
Proceeds | | | Realized
Gain
(Loss) | | | Change in
Unrealized
Appreciation or
Depreciation | | | Ending
Value | |
| MFS Institutional Money Market Portfolio | | | $1,116,606 | | | | $18,309,901 | | | | $19,162,837 | | | | $158 | | | | $— | | | | $263,828 | |
| | | | | | |
| Affiliated Issuers | | | | | | | | | | | | | | Dividend
Income | | | Capital Gain
Distributions | |
| MFS Institutional Money Market Portfolio | | | | | | | | | | | | | | | | | | | $25,391 | | | | $— | |
21
MFS Technology Portfolio
REPORT OF INDEPENDENT REGISTERED PUBLIC ACCOUNTING FIRM
To the Board of Trustees of MFS Variable Insurance Trust II and the Shareholders of
MFS Technology Portfolio:
Opinion on the Financial Statements and Financial Highlights
We have audited the accompanying statement of assets and liabilities of MFS Technology Portfolio (the “Fund”), including the portfolio of investments, as of December 31, 2019, the related statement of operations for the year then ended, the statements of changes in net assets for each of the two years in the period then ended, the financial highlights for each of the five years in the period then ended, and the related notes. In our opinion, the financial statements and financial highlights present fairly, in all material respects, the financial position of the Fund as of December 31, 2019, and the results of its operations for the year then ended, the changes in its net assets for each of the two years in the period then ended, and the financial highlights for each of the five years in the period then ended, in conformity with accounting principles generally accepted in the United States of America.
Basis for Opinion
These financial statements and financial highlights are the responsibility of the Fund’s management. Our responsibility is to express an opinion on the Fund’s financial statements and financial highlights based on our audits. We are a public accounting firm registered with the Public Company Accounting Oversight Board (United States) (PCAOB) and are required to be independent with respect to the Fund in accordance with the U.S. federal securities laws and the applicable rules and regulations of the Securities and Exchange Commission and the PCAOB.
We conducted our audits in accordance with the standards of the PCAOB. Those standards require that we plan and perform the audit to obtain reasonable assurance about whether the financial statements and financial highlights are free of material misstatement, whether due to error or fraud. The Fund is not required to have, nor were we engaged to perform, an audit of its internal control over financial reporting. As part of our audits we are required to obtain an understanding of internal control over financial reporting but not for the purpose of expressing an opinion on the effectiveness of the Fund’s internal control over financial reporting. Accordingly, we express no such opinion.
Our audits included performing procedures to assess the risks of material misstatement of the financial statements and financial highlights, whether due to error or fraud, and performing procedures that respond to those risks. Such procedures included examining, on a test basis, evidence regarding the amounts and disclosures in the financial statements and financial highlights. Our audits also included evaluating the accounting principles used and significant estimates made by management, as well as evaluating the overall presentation of the financial statements and financial highlights. Our procedures included confirmation of securities owned as of December 31, 2019, by correspondence with the custodian and brokers; when replies were not received from brokers, we performed other auditing procedures. We believe that our audits provide a reasonable basis for our opinion.
DELOITTE & TOUCHE LLP
Boston, Massachusetts
February 14, 2020
We have served as the auditor of one or more of the MFS investment companies since 1924.
22
MFS Technology Portfolio
TRUSTEES AND OFFICERS – IDENTIFICATION AND BACKGROUND
The Trustees and Officers of the Trust, as of February 1, 2020, are listed below, together with their principal occupations during the past five years. (Their titles may have varied during that period.) The address of each Trustee and Officer is 111 Huntington Avenue, Boston, Massachusetts 02199-7618.
| | | | | | | | | | |
Name, Age | | Position(s)
Held with Fund | | Trustee/Officer
Since (h) | | Number of MFS Funds
overseen by the
Trustee | | Principal Occupations
During the Past Five Years | | Other Directorships During the Past Five Years (j) |
| INTERESTED TRUSTEES |
Robert J. Manning (k)
(age 56) | | Trustee | | February 2004 | | 133 | | Massachusetts Financial Services Company, Executive Chairman (since January 2017); Director; Chairman of the Board; Chief Executive Officer (until 2015);Co-Chief Executive Officer(2015-2016) | | N/A |
| | | | | |
Robin A. Stelmach (k) (age 58) | | Trustee | | January 2014 | | 133 | | Massachusetts Financial Services Company, Vice Chair (since January 2017); Chief Operating Officer and Executive Vice President (until January 2017) | | N/A |
|
| INDEPENDENT TRUSTEES |
John P. Kavanaugh (age 65) | | Trustee and Chair of Trustees | | January 2009 | | 133 | | Private investor | | N/A |
| | | | | |
Steven E. Buller (age 68) | | Trustee | | February 2014 | | 133 | | Financial Accounting Standards Advisory Council, Chairman(2014-2015); Public Company Accounting Oversight Board, Standing Advisory Group, Member (until 2014); BlackRock, Inc. (investment management), Managing Director (until 2014), BlackRock Finco UK (investment management), Director (until 2014) | | N/A |
| | | | | |
John A. Caroselli (age 65) | | Trustee | | March 2017 | | 133 | | JC Global Advisors, LLC (management consulting), President (since 2015); First Capital Corporation (commercial finance), Executive Vice President (until 2015) | | N/A |
| | | | | |
Maureen R. Goldfarb (age 64) | | Trustee | | January 2009 | | 133 | | Private investor | | N/A |
| | | | | |
Peter D. Jones
(age 64) | | Trustee | | January 2019 | | 133 | | Franklin Templeton Distributors, Inc. (investment management), President (until 2015); Franklin Templeton Institutional, LLC (investment management), Chairman (until 2015) | | N/A |
| | | | | |
James W. Kilman, Jr.
(age 58) | | Trustee | | January 2019 | | 133 | | Burford Capital Limited (finance and investment management), Chief Financial Officer (since 2019); KielStrand Capital LLC (family office), Chief Executive Officer (since 2016); Morgan Stanley & Co. (financial services), Vice Chairman of Investment Banking,Co-Head of Diversified Financials Coverage – Financial Institutions Investment Banking Group (until 2016) | | Alpha-En Corporation, Director (2016-2019) |
23
MFS Technology Portfolio
Trustees and Officers – continued
| | | | | | | | | | |
Name, Age | | Position(s)
Held with Fund | | Trustee/Officer
Since (h) | | Number of MFS Funds
overseen by the
Trustee | | Principal Occupations
During the Past Five Years | | Other Directorships During the Past Five Years (j) |
Clarence Otis, Jr. (age 63) | | Trustee | | March 2017 | | 133 | | Darden Restaurants, Inc., Chief Executive Officer (until 2014) | | VF Corporation, Director; Verizon Communications, Inc., Director; The Travelers Companies, Director; Federal Reserve Bank of Atlanta, Director (until 2015) |
| | | | | |
Maryanne L. Roepke (age 63) | | Trustee | | May 2014 | | 133 | | American Century Investments (investment management), Senior Vice President and Chief Compliance Officer (until 2014) | | N/A |
| | | | | |
Laurie J. Thomsen
(age 62) | | Trustee | | March 2005 | | 133 | | Private investor | | The Travelers Companies, Director; Dycom Industries, Inc., Director (since 2015) |
| | | | | | | | |
Name, Age | | Position(s)
Held with Fund | | Trustee/Officer
Since (h) | | Number of
MFS Funds
for which the
Person is an
Officer | | Principal Occupations During the Past Five Years |
| OFFICERS | | | | | | |
Christopher R. Bohane (k)
(age 46) | | Assistant Secretary and Assistant Clerk | | July 2005 | | 133 | | Massachusetts Financial Services Company, Vice President and Assistant General Counsel |
| | | | |
Kino Clark (k) (age 51) | | Assistant Treasurer | | January 2012 | | 133 | | Massachusetts Financial Services Company, Vice President |
| | | | |
John W. Clark, Jr. (k) (age 52) | | Assistant Treasurer | | April 2017 | | 133 | | Massachusetts Financial Services Company, Vice President (since March 2017); Deutsche Bank (financial services), Department Head –Treasurer’s Office (until February 2017) |
| | | | |
Thomas H. Connors (k) (age 60) | | Assistant Secretary and Assistant Clerk | | September 2012 | | 133 | | Massachusetts Financial Services Company, Vice President and Senior Counsel |
| | | | |
David L. DiLorenzo (k)
(age 51) | | President | | July 2005 | | 133 | | Massachusetts Financial Services Company, Senior Vice President |
| | | | |
Heidi W. Hardin (k) (age 52) | | Secretary and Clerk | | April 2017 | | 133 | | Massachusetts Financial Services Company, Executive Vice President and General Counsel (since March 2017); Harris Associates (investment management), General Counsel (from September 2015 to January 2017); Janus Capital Management LLC (investment management), Senior Vice President and General Counsel (until September 2015) |
| | | | |
Brian E. Langenfeld (k) (age 46) | | Assistant
Secretary and Assistant Clerk | | June 2006 | | 133 | | Massachusetts Financial Services Company, Vice President and Senior Counsel |
| | | | |
Amanda S. Mooradian (k) (age 40) | | Assistant
Secretary and Assistant Clerk | | September 2018 | | 133 | | Massachusetts Financial Services Company, Assistant Vice President and Counsel |
| | | | |
Susan A. Pereira (k)
(age 49) | | Assistant
Secretary and Assistant Clerk | | July 2005 | | 133 | | Massachusetts Financial Services Company, Vice President and Assistant General Counsel |
| | | | |
Kasey L. Phillips (k) (age 49) | | Assistant Treasurer | | September 2012 | | 133 | | Massachusetts Financial Services Company, Vice President |
| | | | |
Matthew A. Stowe (k) (age 45) | | Assistant Secretary and Assistant Clerk | | October 2014 | | 133 | | Massachusetts Financial Services Company, Vice President and Assistant General Counsel |
24
MFS Technology Portfolio
Trustees and Officers – continued
| | | | | | | | |
Name, Age | | Position(s)
Held with Fund | | Trustee/Officer
Since (h) | | Number of
MFS Funds
for which the
Person is an
Officer | | Principal Occupations During the Past Five Years |
Martin J. Wolin (k) (age 52) | | Chief Compliance Officer | | July 2015 | | 133 | | Massachusetts Financial Services Company, Senior Vice President and Chief Compliance Officer (since July 2015); Mercer (financial service provider), Chief Risk and Compliance Officer, North America and Latin America (until June 2015) |
| | | | |
James O. Yost (k)
(age 59) | | Treasurer | | September 1990 | | 133 | | Massachusetts Financial Services Company, Senior Vice President |
| (h) | Date first appointed to serve as Trustee/officer of an MFS Fund. Each Trustee has served continuously since appointment unless indicated otherwise. For the period from December 15, 2004 until February 22, 2005, Mr. Manning served as Advisory Trustee. From January 2012 through December 2016, Messrs. DiLorenzo and Yost served as Treasurer and Deputy Treasurer of the Funds, respectively. |
| (j) | Directorships or trusteeships of companies required to report to the Securities and Exchange Commission (i.e., “public companies”). |
| (k) | “Interested person” of the Trust within the meaning of the Investment Company Act of 1940 (referred to as the 1940 Act), which is the principal federal law governing investment companies like the fund, as a result of a position with MFS. The address of MFS is 111 Huntington Avenue, Boston, Massachusetts 02199-7618. |
Each Trustee (other than Messrs. Jones and Kilman) has been elected by shareholders and each Trustee and Officer holds office until his or her successor is chosen and qualified or until his or her earlier death, resignation, retirement or removal. Messrs. Jones and Kilman became Trustees of the Funds on January 1, 2019. The Trust does not hold annual meetings for the purpose of electing Trustees, and Trustees are not elected for fixed terms. Under the terms of the Board’s retirement policy, an Independent Trustee shall retire at the end of the calendar year in which he or she reaches the earlier of 75 years of age or 15 years of service on the Board (or, in the case of any Independent Trustee who joined the Board prior to 2015, 20 years of service on the Board).
Messrs. Buller, Kilman and Otis and Ms. Roepke are members of the Trust’s Audit Committee.
Each of the Interested Trustees and certain Officers hold comparable officer positions with certain affiliates of MFS.
The Statement of Additional Information for a Fund includes further information about the Trustees and is available without charge upon request by calling1-800-225-2606.
| | |
Investment Adviser Massachusetts Financial Services Company 111 Huntington Avenue Boston, MA 02199-7618 | | Custodian State Street Bank and Trust Company 1 Lincoln Street Boston, MA 02111-2900 |
| |
Distributor MFS Fund Distributors, Inc. 111 Huntington Avenue Boston, MA 02199-7618 | | Independent Registered Public Accounting Firm Deloitte & Touche LLP 200 Berkeley Street Boston, MA 02116 |
| |
Portfolio Manager(s) Matthew Sabel | | |
25
MFS Technology Portfolio
BOARD REVIEW OF INVESTMENT ADVISORY AGREEMENT
MFS Technology Portfolio
The Investment Company Act of 1940 requires that both the full Board of Trustees and a majority of thenon-interested (“independent”) Trustees, voting separately, annually approve the continuation of the Fund’s investment advisory agreement with MFS. The Trustees consider matters bearing on the Fund and its advisory arrangements at their meetings throughout the year, including a review of performance data at each regular meeting. In addition, the independent Trustees met several times over the course of three months beginning in May and ending in July, 2019 (“contract review meetings”) for the specific purpose of considering whether to approve the continuation of the investment advisory agreement for the Fund and the other investment companies that the Board oversees (the “MFS Funds”). The independent Trustees were assisted in their evaluation of the Fund’s investment advisory agreement by independent legal counsel, from whom they received separate legal advice and with whom they met separately from MFS during various contract review meetings. The independent Trustees were also assisted in this process by the MFS Funds’ Independent Senior Officer, a senior officer appointed by and reporting to the independent Trustees.
In connection with their deliberations regarding the continuation of the investment advisory agreement, the Trustees, including the independent Trustees, considered such information and factors as they believed, in light of the legal advice furnished to them and their own business judgment, to be relevant. The investment advisory agreement for the Fund was considered separately, although the Trustees also took into account the common interests of all MFS Funds in their review. As described below, the Trustees considered the nature, quality, and extent of the various investment advisory, administrative, and shareholder services performed by MFS under the existing investment advisory agreement and other arrangements with the Fund.
In connection with their contract review meetings, the Trustees received and relied upon materials that included, among other items: (i) information provided by Broadridge Financial Solutions, Inc. (“Broadridge”), an independent third party, on the investment performance of the Fund for various time periods ended December 31, 2018 and the investment performance of a group of funds with substantially similar investment classifications/objectives (the “Broadridge performance universe”), (ii) information provided by Broadridge on the Fund’s advisory fees and other expenses and the advisory fees and other expenses of comparable funds identified by Broadridge as well as all other funds in the same investment classification/category (the “Broadridge expense group and universe”), (iii) information provided by MFS on the advisory fees of portfolios of other clients of MFS, including institutional separate accounts and other clients, (iv) information as to whether and to what extent applicable expense waivers, reimbursements or fee “breakpoints” are observed for the Fund, (v) information regarding MFS’ financial results and financial condition, including MFS’ and certain of its affiliates’ estimated profitability from services performed for the Fund and the MFS Funds as a whole, and compared to MFS’ institutional business, (vi) MFS’ views regarding the outlook for the mutual fund industry and the strategic business plans of MFS, (vii) descriptions of various functions performed by MFS for the Funds, such as compliance monitoring and portfolio trading practices, and (viii) information regarding the overall organization of MFS, including information about MFS’ senior management and other personnel providing investment advisory, administrative and other services to the Fund and the other MFS Funds. The comparative performance, fee and expense information prepared and provided by Broadridge was not independently verified and the independent Trustees did not independently verify any information provided to them by MFS.
The Trustees’ conclusion as to the continuation of the investment advisory agreement was based on a comprehensive consideration of all information provided to the Trustees and not the result of any single factor. Some of the factors that figured particularly in the Trustees’ deliberations are described below, although individual Trustees may have evaluated the information presented differently from one another, giving different weights to various factors. It is also important to recognize that the fee arrangements for the Fund and other MFS Funds are the result of years of review and discussion between the independent Trustees and MFS, that certain aspects of such arrangements may receive greater scrutiny in some years than in others, and that the Trustees’ conclusions may be based, in part, on their consideration of these same arrangements during the course of the year and in prior years.
Based on information provided by Broadridge and MFS, the Trustees reviewed the Fund’s total return investment performance as well as the Broadridge performance universe over various time periods. The Trustees placed particular emphasis on the total return performance of the Fund’s Initial Class shares in comparison to the performance of funds in its Broadridge performance universe over the five-year period ended December 31, 2018, which the Trustees believed was a long enough period to reflect differing market conditions. The total return performance of the Fund’s Initial Class shares was in the 2nd quintile relative to the other funds in the universe for this five-year period (the 1st quintile being the best performers and the 5th quintile being the worst performers). The total return performance of the Fund’s Initial Class shares was in the 1st quintile for theone-year period and the 2nd quintile for thethree-year period ended December 31, 2018 relative to the Broadridge performance universe. Because of the passage of time, these performance results may differ from the performance results for more recent periods, including those shown elsewhere in this report.
In the course of their deliberations, the Trustees took into account information provided by MFS in connection with the contract review meetings, as well as during investment review meetings conducted with portfolio management personnel during the course of the year regarding the Fund’s performance. After reviewing these and related factors, the Trustees concluded, within the context of their overall conclusions regarding the investment advisory agreement, that they were satisfied with MFS’ responses and efforts relating to investment performance.
26
MFS Technology Portfolio
Board Review of Investment Advisory Agreement – continued
In assessing the reasonableness of the Fund’s advisory fee, the Trustees considered, among other information, the Fund’s advisory fee and the total expense ratio of the Fund’s Initial Class shares as a percentage of average daily net assets and the advisory fee and total expense ratios of the Broadridge expense group based on information provided by Broadridge. The Trustees considered that MFS currently observes an expense limitation for the Fund, which may not be changed without the Trustees’ approval. The Trustees also considered that, according to the data provided by Broadridge (which takes into account any fee reductions or expense limitations that were in effect during the Fund’s last fiscal year), the Fund’s effective advisory fee rate and total expense ratio were each approximately at the Broadridge expense group median.
The Trustees also considered the advisory fees charged by MFS to any institutional separate accounts advised by MFS (“separate accounts”) and unaffiliated investment companies for which MFS serves as subadviser (“subadvised funds”) that have comparable investment strategies to the Fund, if any. In comparing these fees, the Trustees considered information provided by MFS as to the generally broader scope of services provided by MFS to the Fund, as well as the more extensive regulatory burdens imposed on MFS in managing the Fund, in comparison to separate accounts and subadvised funds. The Trustees also considered the higher demands placed on MFS’ investment personnel and trading infrastructure as a result of the daily cashin-flows andout-flows of the Fund in comparison to separate accounts.
The Trustees also considered whether the Fund may benefit from any economies of scale in the management of the Fund in the event of growth in assets of the Fund and/or growth in assets of the MFS Funds as a whole. They noted that the Fund’s advisory fee rate schedule is subject to a contractual breakpoint that reduces the Fund’s advisory fee rate on average daily net assets over $1 billion. The Trustees also noted that MFS has agreed in writing to waive a portion of the management fees of certain MFS Funds, including the Fund, if the total combined assets of certain funds within the MFS Funds’ complex increase above agreed upon thresholds (the “group fee waiver”), enabling the Fund’s shareholders to share in the benefits from any economies of scale at the complex level. The group fee waiver is reviewed and renewed annually between the Board and MFS. The Trustees concluded that the breakpoint and the group fee waiver were sufficient to allow the Fund to benefit from economies of scale as its assets and overall complex assets grow.
The Trustees also considered information prepared by MFS relating to MFS’ costs and profits with respect to the Fund, the MFS Funds considered as a group, and other investment companies and accounts advised by MFS, as well as MFS’ methodologies used to determine and allocate its costs to the MFS Funds, the Fund and other accounts and products for purposes of estimating profitability.
After reviewing these and other factors described herein, the Trustees concluded, within the context of their overall conclusions regarding the investment advisory agreement, that the advisory fees charged to the Fund represent reasonable compensation in light of the services being provided by MFS to the Fund.
In addition, the Trustees considered MFS’ resources and related efforts to continue to retain, attract and motivate capable personnel to serve the Fund. The Trustees also considered current and developing conditions in the financial services industry, including the presence of large and well-capitalized companies which are spending, and appear to be prepared to continue to spend, substantial sums to engage personnel and to provide services to competing investment companies. In this regard, the Trustees also considered the financial resources of MFS and its ultimate parent, Sun Life Financial Inc. The Trustees also considered the advantages and possible disadvantages to the Fund of having an adviser that also serves other investment companies as well as other accounts.
The Trustees also considered the nature, quality, cost, and extent of administrative, transfer agency, and distribution services provided to the Fund by MFS and its affiliates under agreements and plans other than the investment advisory agreement, including any12b-1 fees the Fund pays to MFS Fund Distributors, Inc., an affiliate of MFS. The Trustees also considered the nature, extent and quality of certain other services MFS performs or arranges for on the Fund’s behalf, which may include securities lending programs, directed expense payment programs, class action recovery programs, and MFS’ interaction with third-party service providers, principally custodians andsub-custodians. The Trustees concluded that the variousnon-advisory services provided by MFS and its affiliates on behalf of the Fund were satisfactory.
The Trustees consideredso-called“fall-out benefits” to MFS such as reputational value derived from serving as investment manager to the MFS Funds. The Trustees also considered that, effective January 3, 2018, MFS had discontinued its historic practice of obtaining investment research from portfolio brokerage commissions paid by certain MFS Funds and would thereafter directly pay for or voluntarily reimburse a Fund, if applicable, for the costs of external research acquired through the use of the Fund’s portfolio brokerage commissions.
Based on their evaluation of factors that they deemed to be material, including those factors described above, the Board of Trustees, including the independent Trustees, concluded that the Fund’s investment advisory agreement with MFS should be continued for an additionalone-year period, commencing August 1, 2019.
27
MFS Technology Portfolio
PROXY VOTING POLICIES AND INFORMATION
MFS votes proxies on behalf of the fund pursuant to proxy voting policies and procedures that are available without charge, upon request, by calling 1-800-225-2606, by visitingmfs.com/proxyvoting, or by visiting the SEC’s Web site athttp://www.sec.gov.
Information regarding how the fund voted proxies relating to portfolio securities during the most recent twelve-month period ended June 30 is available by August 31 of each year without charge by visitingmfs.com/proxyvoting, or by visiting the SEC’s Web site athttp://www.sec.gov.
QUARTERLY PORTFOLIO DISCLOSURE
The fund files a complete schedule of portfolio holdings with the SEC for the first and third quarters of each fiscal year as an exhibit to its reports on Form N-PORT. The fund’s Form N-PORT reports are available on the SEC’s website athttp://www.sec.gov. A shareholder can obtain the portfolio holdings report for the first and third quarters of the fund’s fiscal year atmfs.com/vit2 by choosing the fund’s name and then selecting the “Resources” tab and clicking on “Prospectus and Reports”.
FURTHER INFORMATION
From time to time, MFS may post important information about the fund or the MFS funds on the MFS web site (mfs.com). This information is available athttps://www.mfs.com/en-us/what-we-do/announcements.htmlor atmfs.com/vit2 by choosing the fund’s name.
INFORMATION ABOUT FUND CONTRACTS AND LEGAL CLAIMS
The fund has entered into contractual arrangements with an investment adviser, administrator, distributor, shareholder servicing agent, 529 program manager (if applicable), and custodian who each provide services to the fund. Unless expressly stated otherwise, shareholders are not parties to, or intended beneficiaries of these contractual arrangements, and these contractual arrangements are not intended to create any shareholder right to enforce them against the service providers or to seek any remedy under them against the service providers, either directly or on behalf of the fund.
Under the Trust’s By-Laws and Declaration of Trust, any claims asserted against or on behalf of the MFS Funds, including claims against Trustees and Officers, must be brought in state and federal courts located within the Commonwealth of Massachusetts.
FEDERAL TAX INFORMATION (unaudited)
The following information is provided pursuant to provisions of the Internal Revenue Code.
The fund designates $7,546,000 as capital gain dividends paid during the fiscal year.
For corporate shareholders, 96.12% of the ordinary income dividends paid during the fiscal year qualify for the corporate dividends received deduction.
28
rev. 3/16
| | | | |
| | | |
| FACTS | | WHAT DOES MFS DO WITH YOUR
PERSONAL INFORMATION? | |  |
| | |
| Why? | | Financial companies choose how they share your personal information. Federal law gives consumers the right to limit some but not all sharing. Federal law also requires us to tell you how we collect, share, and protect your personal information. Please read this notice carefully to understand what we do. |
| | |
| What? | | The types of personal information we collect and share depend on the product or service you have with us. This information can include: • Social Security number and account balances • Account transactions and transaction history • Checking account information and wire transfer instructions When you areno longer our customer, we continue to share your information as described in this notice. |
| | |
| How? | | All financial companies need to share customers’ personal information to run their everyday business. In the section below, we list the reasons financial companies can share their customers’ personal information; the reasons MFS chooses to share; and whether you can limit this sharing. |
| | | | |
Reasons we can share your
personal information | | Does MFS share? | | Can you limit this
sharing? |
For our everyday business purposes – such as to process your transactions, maintain your account(s), respond to court orders and legal investigations, or report to credit bureaus | | Yes | | No |
For our marketing purposes – to offer our products and services to you | | No | | We don’t share |
| For joint marketing with other financial companies | | No | | We don’t share |
For our affiliates’ everyday business purposes – information about your transactions and experiences | | No | | We don’t share |
For our affiliates’ everyday business purposes – information about your creditworthiness | | No | | We don’t share |
| For nonaffiliates to market to you | | No | | We don’t share |
| | |
| | |
| Questions? | | Call800-225-2606 or go tomfs.com. |
29
| | |
| Who we are |
| Who is providing this notice? | | MFS Funds, MFS Investment Management, MFS Institutional Advisors, Inc., and MFS Heritage Trust Company. |
| | |
| What we do |
| How does MFS protect my personal information? | | To protect your personal information from unauthorized access and use, we use security measures that comply with federal law. These measures include procedural, electronic, and physical safeguards for the protection of the personal information we collect about you. |
How does MFS
collect my personal information? | | We collect your personal information, for example, when you • open an account or provide account information • direct us to buy securities or direct us to sell your securities • make a wire transfer We also collect your personal information from others, such as credit bureaus, affiliates, or other companies. |
| Why can’t I limit all sharing? | | Federal law gives you the right to limit only • sharing for affiliates’ everyday business purposes – information about your creditworthiness • affiliates from using your information to market to you • sharing for nonaffiliates to market to you State laws and individual companies may give you additional rights to limit sharing. |
| | |
| Definitions |
| Affiliates | | Companies related by common ownership or control. They can be financial and nonfinancial companies. • MFS does not share personal information with affiliates, except for everyday business purposes as described on page one of this notice. |
| Nonaffiliates | | Companies not related by common ownership or control. They can be financial and nonfinancial companies. • MFS does not share with nonaffiliates so they can market to you. |
| Joint marketing | | A formal agreement between nonaffiliated financial companies that together market financial products or services to you. • MFS doesn’t jointly market. |
| | |
| Other important information |
| If you own an MFS product or receive an MFS service in the name of a third party such as a bank or broker-dealer, their privacy policy may apply to you instead of ours. |
30
Annual Report
December 31, 2019

MFS® U.S. Government Money Market Portfolio

MFS® Variable Insurance Trust II
Beginning on January 1, 2021, as permitted by regulations adopted by the U.S. Securities and Exchange Commission, the insurance company that offers your contract may determine that it will no longer send you paper copies of the fund’s annual and semiannual shareholder reports unless you specifically request paper copies from the insurance company or from your financial intermediary. Instead, the shareholder reports will be made available on a Web site (insurancefunds.mfs.com or other Web site of which you will be notified), and the insurance company will notify you by mail each time a report is posted and provide you with a Web site link to access the report. Instructions for requesting paper copies will be provided by your insurance company or financial intermediary.
If you already elected to receive shareholder reports by email, you will not be affected by this change and you need not take any action. If your insurance company or financial intermediary offers electronic delivery, you may elect to receive shareholder reports and other communications from the insurance company or financial intermediary by email by following the instructions provided by the insurance company or financial intermediary.
Beginning on January 1, 2019, you may elect to receive all future reports in paper free of charge from the insurance company or financial intermediary. You can inform the insurance company or financial intermediary that you wish to continue receiving paper copies of your shareholder reports by contacting your insurance company or financial intermediary. Your election to receive reports in paper will apply to all funds held in your account with your insurance company or financial intermediary.
MKS-ANN
MFS® U.S. Government Money Market Portfolio
CONTENTS
The report is prepared for the general information of contract owners. It is authorized for distribution to prospective investors only when preceded or accompanied by a current prospectus.
NOT FDIC INSURED• MAY LOSE VALUE• NO BANK OR CREDIT UNION GUARANTEE• NOT A DEPOSIT• NOT INSURED BY ANY FEDERAL GOVERNMENT AGENCY OR NCUA/NCUSIF
MFS U.S. Government Money Market Portfolio
LETTER FROM THE EXECUTIVE CHAIR

Dear Contract Owners:
Slowing global growth, low inflation, and trade friction between the United States and China have been hallmarks of the past 12 months. After experiencing an uptick in market volatility in late 2018, markets steadied for most of 2019, thanks in large measure to the adoption of a dovish policy stance on the part of global central banks, focused on supporting economic growth. Negotiations aimed at a “phase one” trade deal between the U.S. and China bore fruit at the end of the period, boosting investor sentiment, while signs of stability emerging from the global manufacturing sector also lifted spirits. Uncertainty over Brexit, along with the ripple effects from the trade conflict, hampered business confidence and investment in the United Kingdom and Europe for much of the period, though investors expect greater clarity regarding Brexit as a result of December’s general election. The pro-Brexit Conservative Party won the election by a comfortable margin and set the stage for the U.K.’s departure from the EU at the end of January.
Markets expect the longest economic expansion in U.S. history will continue, albeit at a slower pace, as trade tensions recede. In an effort to prolong the expansion, the U.S. Federal Reserve lowered interest rates three times between July and October and the European Central Bank loosened policy in September. While the global monetary policy backdrop remains quite accommodative, signs of easing trade tensions and fading global recession fears led to improved market sentiment in late 2019 as investors grew less risk averse. In early 2020, an outbreak of coronavirus emanating from China reintroduced global growth fears, causing an uptick in volatility.
Here at MFS®, we aim to help our clients navigate the growing complexity of the markets and world economies. Our long-term investment philosophy and commitment to the responsible allocation of capital allow us to tune out the noise and uncover what we believe are the best, most durable investment opportunities in the market. Through our powerful global investment platform, we combine collective expertise, thoughtful risk management and long-term discipline to create sustainable value for investors.
Respectfully,

Robert J. Manning
Executive Chair
MFS Investment Management
February 14, 2020
The opinions expressed in this letter are subject to change and may not be relied upon for investment advice. No forecasts can be guaranteed.
1
MFS U.S. Government Money Market Portfolio
PORTFOLIO COMPOSITION
Portfolio structure (u)
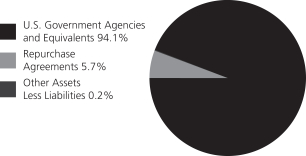
| | | | |
| Composition including fixed income credit quality (a)(u) | |
| A-1+ | | | 11.3% | |
| A-1 | | | 88.5% | |
| Other Assets Less Liabilities | | | 0.2% | |
| | | | |
| Maturity breakdown (u) | | | | |
| 0 - 7 days | | | 16.0% | |
| 8 - 29 days | | | 60.1% | |
| 30 - 59 days | | | 23.7% | |
| 60 - 89 days | | | 0.0% | |
| 90 - 365 days | | | 0.0% | |
| Other Assets Less Liabilities | | | 0.2% | |
| (a) | Ratings are assigned to portfolio securities utilizing ratings from Moody’s, Fitch, and Standard & Poor’s rating agencies and applying the following hierarchy: If all three agencies provide a rating, the middle rating (after dropping the highest and lowest ratings) is assigned; if two of the three agencies rate a security, the lower of the two is assigned. Ratings are shown in the S&P scale. All ratings are subject to change. The fund is not rated by these agencies. |
| (u) | For purposes of this presentation, accrued interest, where applicable, is included. |
Percentages are based on net assets as of December 31, 2019.
The portfolio is actively managed and current holdings may be different.
2
MFS U.S. Government Money Market Portfolio
PERFORMANCE SUMMARY THROUGH 12/31/19
Total returns as well as the current 7-day yield have been provided for the applicable time periods. Performance results reflect the percentage change in net asset value, including the reinvestment of any dividends and capital gains distributions. (See Notes to Performance Summary.) An investment in the portfolio is not insured or guaranteed by the Federal Deposit Insurance Corporation or any other government agency. Although the fund seeks to preserve the value of your investment at $1.00 per unit, it is possible to lose money by investing in the fund.
Performance data shown represents past performance and is no guarantee of future results. Investment return and principal value fluctuate so your units, when sold, may be worth more or less than the original cost; current performance may be lower or higher than quoted. The performance shown does not reflect the deduction of taxes, if any, that a contract holder would pay on fund distributions or the redemption of contract units. The returns for the fund shown also do not reflect the deduction of expenses associated with variable products, such as mortality and expense risk charges, separate account charges, and sales charges imposed by the insurance company separate accounts. Such expenses would reduce the overall returns shown.
| | | | | | | | | | |
| | | Share Class | | Inception | | 1-Year Total Return | | Current 7-day yield | | |
| | | Initial Class | | 7/19/85 | | 1.63% | | 1.07% | | |
| | | Service Class | | 8/24/01 | | 1.63% | | 1.07% | | |
Notes to Performance Summary
Yields quoted are based on the latest seven days ended as of December 31, 2019, with dividends annualized. The yield quotations more closely reflect the current earnings of the fund than the total return quotations.
Performance results reflect any applicable expense subsidies, waivers and adjustments in effect during the periods shown. Without such subsidies and waivers the fund’s performance results would be less favorable. Please see the prospectus and financial statements for complete details. All results are historical and assume the reinvestment of any dividends and capital gain distributions.
3
MFS U.S. Government Money Market Portfolio
EXPENSE TABLE
Fund Expenses Borne by the Contract Holders during the Period,
July 1, 2019 through December 31, 2019
As a contract holder of the fund, you incur ongoing costs, including management fees; distribution and/or service(12b-1) fees; and other fund expenses. This example is intended to help you understand your ongoing costs (in dollars) of investing in the fund and to compare these costs with the ongoing costs of investing in other mutual funds.
The example is based on an investment of $1,000 invested at the beginning of the period and held for the entire period July 1, 2019 through December 31, 2019.
Actual Expenses
The first line for each share class in the following table provides information about actual account values and actual expenses. You may use the information in this line, together with the amount you invested, to estimate the expenses that you paid over the period. Simply divide your account value by $1,000 (for example, an $8,600 account value divided by $1,000 = 8.6), then multiply the result by the number in the first line under the heading entitled “Expenses Paid During Period” to estimate the expenses you paid on your account during this period.
Hypothetical Example for Comparison Purposes
The second line for each share class in the following table provides information about hypothetical account values and hypothetical expenses based on the fund’s actual expense ratio and an assumed rate of return of 5% per year before expenses, which is not the fund’s actual return. The hypothetical account values and expenses may not be used to estimate the actual ending account balance or expenses you paid for the period. You may use this information to compare the ongoing costs of investing in the fund and other funds. To do so, compare this 5% hypothetical example with the 5% hypothetical examples that appear in the shareholder reports of the other funds.
Please note that the expenses shown in the table are meant to highlight the fund’s ongoing costs only and do not take into account the fees and expenses imposed under the variable contracts through which your investment in the fund is made. Therefore, the second line for each share class in the table is useful in comparing ongoing costs associated with an investment in vehicles (such as the fund) which fund benefits under variable annuity and variable life insurance contracts and to qualified pension and retirement plans only, and will not help you determine the relative total costs of investing in the fund through variable annuity and variable life insurance contracts. If the fees and expenses imposed under the variable contracts were included, your costs would have been higher.
| | | | | | | | | | | | | | | | | | |
| Share Class | | | | Annualized
Expense Ratio | | | Beginning
Account Value
7/01/19 | | | Ending Account Value
12/31/19 | | | Expenses Paid
During Period (p)
7/01/19-12/31/19 | |
| Initial Class | | Actual | | | 0.55% | | | | $1,000.00 | | | | $1,007.09 | | | | $2.78 | |
| | Hypothetical (h) | | | 0.55% | | | | $1,000.00 | | | | $1,022.43 | | | | $2.80 | |
| Service Class | | Actual | | | 0.55% | | | | $1,000.00 | | | | $1,007.09 | | | | $2.78 | |
| | Hypothetical (h) | | | 0.55% | | | | $1,000.00 | | | | $1,022.43 | | | | $2.80 | |
| (h) | 5% class return per year before expenses. |
| (p) | “Expenses Paid During Period” are equal to each class’s annualized expense ratio, as shown above, multiplied by the average account value over the period, multiplied by 184/365 (to reflect theone-half year period). |
4
MFS U.S. Government Money Market Portfolio
PORTFOLIO OF INVESTMENTS – 12/31/19
The Portfolio of Investments is a complete list of all securities owned by your fund. It is categorized by broad-based asset classes.
| | | | | | | | |
| Issuer | | Shares/Par | | | Value ($) | |
U.S. GOVERNMENT AGENCIES AND
EQUIVALENTS (y) – 94.1% | |
| Fannie Mae, 1.544%, due 1/02/2020 | | $ | 14,275,000 | | | $ | 14,274,397 | |
| Fannie Mae, 1.55%, due 1/15/2020 | | | 7,930,000 | | | | 7,924,973 | |
| Fannie Mae, 1.564%, due 1/15/2020 | | | 3,590,000 | | | | 3,587,871 | |
| Fannie Mae, 1.659%, due 1/15/2020 | | | 10,500,000 | | | | 10,493,712 | |
| Fannie Mae, 1.576%, due 1/29/2020 | | | 5,821,000 | | | | 5,813,983 | |
| Fannie Mae, 1.577%, due 1/29/2020 | | | 10,485,000 | | | | 10,472,360 | |
| Federal Farm Credit Bank, 1.553%, due 1/14/2020 | | | 10,400,000 | | | | 10,394,254 | |
| Federal Farm Credit Bank, 1.584%, due 1/17/2020 | | | 10,500,000 | | | | 10,492,720 | |
| Federal Farm Credit Bank, 1.628%, due 1/21/2020 | | | 18,500,000 | | | | 18,483,555 | |
| Federal Farm Credit Bank, 1.598%, due 1/30/2020 | | | 4,765,000 | | | | 4,758,974 | |
| Federal Farm Credit Bank, 1.566%, due 1/31/2020 | | | 8,385,000 | | | | 8,374,239 | |
| Federal Home Loan Bank, 1.576%, due 1/06/2020 | | | 13,090,000 | | | | 13,087,182 | |
| Federal Home Loan Bank, 1.564%, due 1/09/2020 | | | 6,586,000 | | | | 6,583,746 | |
| Federal Home Loan Bank, 1.571%, due 1/10/2020 | | | 7,865,000 | | | | 7,861,962 | |
| Federal Home Loan Bank, 1.57%, due 1/17/2020 | | | 10,230,000 | | | | 10,222,975 | |
| Federal Home Loan Bank, 1.586%, due 1/22/2020 | | | 10,505,000 | | | | 10,495,441 | |
| Federal Home Loan Bank, 1.564%, due 1/23/2020 | | | 2,499,000 | | | | 2,496,648 | |
| | | | | | | | |
| | |
| Issuer | | Shares/Par | | | Value ($) | |
U.S. GOVERNMENT AGENCIES AND
EQUIVALENTS (y) – continued | |
| Federal Home Loan Bank, 1.6%, due 2/12/2020 | | $ | 10,500,000 | | | $ | 10,480,743 | |
| Freddie Mac, 1.564%, due 1/13/2020 | | | 8,800,000 | | | | 8,795,483 | |
| Freddie Mac, 1.578%, due 2/20/2020 | | | 7,790,000 | | | | 7,773,230 | |
| Freddie Mac, 1.598%, due 2/20/2020 | | | 5,295,000 | | | | 5,283,454 | |
| Freddie Mac, 1.566%, due 2/25/2020 | | | 12,300,000 | | | | 12,271,061 | |
| Freddie Mac, 1.566%, due 2/26/2020 | | | 18,430,000 | | | | 18,385,850 | |
| U.S. Treasury Bill, 1.659%, due 1/09/2020 | | | 14,910,000 | | | | 14,904,599 | |
| U.S. Treasury Bill, 1.794%, due 1/16/2020 | | | 15,000,000 | | | | 14,989,000 | |
| | | | | | | | |
Total U.S. Government Agencies and
Equivalents, at Amortized Cost and Value | | | $ | 248,702,412 | |
| | | | | | | | |
|
| REPURCHASE AGREEMENTS – 5.7% | |
| Goldman Sachs Repurchase Agreement, 1.52%, dated 12/31/2019, due 1/02/2020, total to be received $14,973,264 (secured by U.S. Treasury and Federal Agency obligations valued at $15,271,440 in a jointly traded account), at Cost and Value | | $ | 14,972,000 | | | $ | 14,972,000 | |
| | | | | | | | |
OTHER ASSETS, LESS
LIABILITIES – 0.2% | | | | 557,889 | |
| | | | | | | | |
| NET ASSETS – 100.0% | | | | | | $ | 264,232,301 | |
| | | | | | | | |
| (y) | | The rate shown represents an annualized yield at time of purchase. |
See Notes to Financial Statements
5
MFS U.S. Government Money Market Portfolio
FINANCIAL STATEMENTS | STATEMENT OF ASSETS AND LIABILITIES
This statement represents your fund’s balance sheet, which details the assets and liabilities comprising the total value of the fund.
| | | | |
At 12/31/19 | | | | |
| |
Assets | | | | |
Investments in unaffiliated issuers, at cost and value | | | $263,674,412 | |
Cash | | | 949 | |
Receivables for | | | | |
Fund shares sold | | | 965,507 | |
Interest | | | 632 | |
Other assets | | | 1,770 | |
Total assets | | | $264,643,270 | |
| |
Liabilities | | | | |
Payables for | | | | |
Fund shares reacquired | | | $345,267 | |
Payable to affiliates | | | | |
Investment adviser | | | 7,070 | |
Administrative services fee | | | 241 | |
Shareholder servicing costs | | | 10 | |
Payable for independent Trustees’ compensation | | | 54 | |
Accrued expenses and other liabilities | | | 58,327 | |
Total liabilities | | | $410,969 | |
Net assets | | | $264,232,301 | |
| |
Net assets consist of | | | | |
Paid-in capital | | | $264,232,286 | |
Total distributable earnings (loss) | | | 15 | |
Net assets | | | $264,232,301 | |
Shares of beneficial interest outstanding | | | 264,452,332 | |
| | | | | | | | | | | | |
| | | |
| | | Net assets | | | Shares
outstanding | | | Net asset value
per share | |
Initial Class | | | $149,689,185 | | | | 149,814,070 | | | | $1.00 | |
Service Class | | | 114,543,116 | | | | 114,638,262 | | | | 1.00 | |
See Notes to Financial Statements
6
MFS U.S. Government Money Market Portfolio
FINANCIAL STATEMENTS | STATEMENT OF OPERATIONS
This statement describes how much your fund earned in investment income and accrued in expenses. It also describes any gains and/or losses generated by fund operations.
| | | | |
Year ended 12/31/19 | | | | |
| |
Net investment income (loss) | | | | |
Income | | | | |
Interest | | | $6,031,966 | |
Other | | | 62 | |
Total investment income | | | $6,032,028 | |
Expenses | | | | |
Management fee | | | $1,381,949 | |
Distribution and/or service fees | | | 306,862 | |
Shareholder servicing costs | | | 3,392 | |
Administrative services fee | | | 47,989 | |
Independent Trustees’ compensation | | | 10,215 | |
Custodian fee | | | 14,569 | |
Shareholder communications | | | 18,814 | |
Audit and tax fees | | | 36,851 | |
Legal fees | | | 2,465 | |
Miscellaneous | | | 30,425 | |
Total expenses | | | $1,853,531 | |
Reduction of expenses by investment adviser and distributor | | | (333,821 | ) |
Net expenses | | | $1,519,710 | |
Net investment income (loss) | | | $4,512,318 | |
Realized gain (loss) (identified cost basis) | | | | |
Unaffiliated issuers | | | $15 | |
Change in net assets from operations | | | $4,512,333 | |
See Notes to Financial Statements
7
MFS U.S. Government Money Market Portfolio
FINANCIAL STATEMENTS | STATEMENTS OF CHANGES IN NET ASSETS
These statements describe the increases and/or decreases in net assets resulting from operations, any distributions, and any shareholder transactions.
| | | | | | | | |
| | | Year ended | |
| | | 12/31/19 | | | 12/31/18 | |
Change in net assets | | | | | | | | |
| | |
From operations | | | | | | | | |
Net investment income (loss) | | | $4,512,318 | | | | $3,659,550 | |
Net realized gain (loss) | | | 15 | | | | — | |
Change in net assets from operations | | | $4,512,333 | | | | $3,659,550 | |
Total distributions to shareholders | | | $(4,512,318 | ) | | | $(3,659,550 | ) |
Change in net assets from fund share transactions | | | $(24,227,082 | ) | | | $(26,075,131 | ) |
Total change in net assets | | | $(24,227,067 | ) | | | $(26,075,131 | ) |
| | |
Net assets | | | | | | | | |
At beginning of period | | | 288,459,368 | | | | 314,534,499 | |
At end of period | | | $264,232,301 | | | | $288,459,368 | |
See Notes to Financial Statements
8
MFS U.S. Government Money Market Portfolio
FINANCIAL STATEMENTS | FINANCIAL HIGHLIGHTS
The financial highlights table is intended to help you understand the fund’s financial performance for the past 5 years. Certain information reflects financial results for a single fund share. The total returns in the table represent the rate that an investor would have earned (or lost) on an investment in the fund share class (assuming reinvestment of all distributions) held for the entire period.
| | | | | | | | | | | | | | | | | | | | |
| Initial Class | | Year ended | |
| | | | | |
| | | 12/31/19 | | | 12/31/18 | | | 12/31/17 | | | 12/31/16 | | | 12/31/15 | |
| | | | | |
Net asset value, beginning of period | | | $1.00 | | | | $1.00 | | | | $1.00 | | | | $1.00 | | | | $1.00 | |
| | | | | |
| Income (loss) from investment operations | | | | | | | | | | | | | | | | | | | | |
Net investment income (loss) (d) | | | $0.02 | | | | $0.01 | | | | $0.00 | (w) | | | $0.00 | (c)(w) | | | $0.00 | |
Net realized and unrealized gain (loss) | | | 0.00 | (w) | | | — | | | | 0.00 | (w) | | | 0.00 | (w) | | | 0.00 | (w) |
Total from investment operations | | | $0.02 | | | | $0.01 | | | | $0.00 | (w) | | | $0.00 | (w) | | | $0.00 | (w) |
| | | | | |
| Less distributions declared to shareholders | | | | | | | | | | | | | | | | | | | | |
From net investment income | | | $(0.02 | ) | | | $(0.01 | ) | | | $(0.00 | )(w) | | | $(0.00 | )(w) | | | $— | |
Net asset value, end of period | | | $1.00 | | | | $1.00 | | | | $1.00 | | | | $1.00 | | | | $1.00 | |
Total return (%) (k)(r) | | | 1.63 | | | | 1.26 | | | | 0.30 | | | | 0.01 | (c) | | | 0.00 | |
| |
Ratios (%) (to average net assets)
and Supplemental data: | | | | | |
Expenses before expense reductions (f) | �� | | 0.56 | | | | 0.56 | | | | 0.56 | | | | 0.53 | (c) | | | 0.57 | |
Expenses after expense reductions (f) | | | 0.55 | | | | 0.55 | | | | 0.54 | | | | 0.30 | (c) | | | 0.13 | |
Net investment income (loss) | | | 1.63 | | | | 1.25 | | | | 0.29 | | | | 0.01 | (c) | | | 0.00 | |
Net assets at end of period (000 omitted) | | | $149,689 | | | | $160,304 | | | | $168,107 | | | | $179,458 | | | | $190,761 | |
| |
| Service Class | | Year ended | |
| | | | | |
| | | 12/31/19 | | | 12/31/18 | | | 12/31/17 | | | 12/31/16 | | | 12/31/15 | |
| | | | | |
Net asset value, beginning of period | | | $1.00 | | | | $1.00 | | | | $1.00 | | | | $1.00 | | | | $1.00 | |
| | | | | |
| Income (loss) from investment operations | | | | | | | | | | | | | | | | | | | | |
Net investment income (loss) (d) | | | $0.02 | | | | $0.01 | | | | $0.00 | (w) | | | $0.00 | (c)(w) | | | $0.00 | |
Net realized and unrealized gain (loss) | | | 0.00 | (w) | | | — | | | | 0.00 | (w) | | | 0.00 | (w) | | | 0.00 | (w) |
Total from investment operations | | | $0.02 | | | | $0.01 | | | | $0.00 | (w) | | | $0.00 | (w) | | | $0.00 | (w) |
| | | | | |
| Less distributions declared to shareholders | | | | | | | | | | | | | | | | | | | | |
From net investment income | | | $(0.02 | ) | | | $(0.01 | ) | | | $(0.00 | )(w) | | | $(0.00 | )(w) | | | $— | |
Net asset value, end of period | | | $1.00 | | | | $1.00 | | | | $1.00 | | | | $1.00 | | | | $1.00 | |
Total return (%) (k)(r) | | | 1.63 | | | | 1.26 | | | | 0.29 | | | | 0.01 | (c) | | | 0.00 | |
| |
Ratios (%) (to average net assets)
and Supplemental data: | | | | | |
Expenses before expense reductions (f) | | | 0.81 | | | | 0.81 | | | | 0.81 | | | | 0.79 | (c) | | | 0.82 | |
Expenses after expense reductions (f) | | | 0.55 | | | | 0.55 | | | | 0.55 | | | | 0.30 | (c) | | | 0.13 | |
Net investment income (loss) | | | 1.64 | | | | 1.24 | | | | 0.27 | | | | 0.01 | (c) | | | 0.00 | |
Net assets at end of period (000 omitted) | | | $114,543 | | | | $128,156 | | | | $146,428 | | | | $182,935 | | | | $182,097 | |
| (c) | | Amount reflects aone-time reimbursement of expenses by the custodian (or former custodian) without which net investment income and performance would be lower and expenses would be higher. |
| (d) | | Per share data is based on average shares outstanding. |
| (f) | | Ratios do not reflect reductions from fees paid indirectly, if applicable. |
| (k) | | The total return does not reflect expenses that apply to separate accounts. Inclusion of these charges would reduce the total return figures for all periods shown. |
| (r) | | Certain expenses have been reduced without which performance would have been lower. |
| (w) | | Per share amount was less than $0.01. |
See Notes to Financial Statements
9
MFS U.S. Government Money Market Portfolio
NOTES TO FINANCIAL STATEMENTS
| (1) | | Business and Organization |
MFS U.S. Government Money Market Portfolio (the fund) is a diversified series of MFS Variable Insurance Trust II (the trust). The trust is organized as a Massachusetts business trust and is registered under the Investment Company Act of 1940, as amended, as anopen-end management investment company. The shareholders of each series of the trust are separate accounts of insurance companies, which offer variable annuity and/or life insurance products, and qualified retirement and pension plans.
The fund is an investment company and accordingly follows the investment company accounting and reporting guidance of the Financial Accounting Standards Board (FASB) Accounting Standards Codification Topic 946 Financial Services – Investment Companies.
| (2) | | Significant Accounting Policies |
General– The preparation of financial statements in conformity with U.S. generally accepted accounting principles requires management to make estimates and assumptions that affect the reported amounts of assets and liabilities, and disclosure of contingent assets and liabilities at the date of the financial statements and the reported amounts of increases and decreases in net assets from operations during the reporting period. Actual results could differ from those estimates. In the preparation of these financial statements, management has evaluated subsequent events occurring after the date of the fund’s Statement of Assets and Liabilities through the date that the financial statements were issued.
Balance Sheet Offsetting– The fund’s accounting policy with respect to balance sheet offsetting is that, absent an event of default by the counterparty or a termination of the agreement, the International Swaps and Derivatives Association (ISDA) Master Agreement, or similar agreement, does not result in an offset of reported amounts of financial assets and financial liabilities in the Statement of Assets and Liabilities across transactions between the fund and the applicable counterparty. The fund’s right to setoff may be restricted or prohibited by the bankruptcy or insolvency laws of the particular jurisdiction to which a specific master netting agreement counterparty is subject. Balance sheet offsetting disclosures, to the extent applicable to the fund, have been included in the fund’s Significant Accounting Policies note under the captions for each of the fund’sin-scope financial instruments and transactions.
Investment Valuations– Pursuant to procedures approved by the Board of Trustees, investments held by the fund are generally valued at amortized cost, which approximates market value. Amortized cost involves valuing an instrument at its cost as adjusted for amortization of premium or accretion of discount rather than its current market value. The amortized cost value of an instrument can be different from the market value of an instrument.
Various inputs are used in determining the value of the fund’s assets or liabilities. These inputs are categorized into three broad levels. In certain cases, the inputs used to measure fair value may fall into different levels of the fair value hierarchy. In such cases, an investment’s level within the fair value hierarchy is based on the lowest level of input that is significant to the fair value measurement. The fund’s assessment of the significance of a particular input to the fair value measurement in its entirety requires judgment, and considers factors specific to the investment. Level 1 includes unadjusted quoted prices in active markets for identical assets or liabilities. Level 2 includes other significant observable market-based inputs (including quoted prices for similar securities, interest rates, prepayment speed, and credit risk). Level 3 includes unobservable inputs, which may include the adviser’s own assumptions in determining the fair value of investments. The following is a summary of the levels used as of December 31, 2019 in valuing the fund’s assets or liabilities:
| | | | | | | | | | | | | | | | |
| Financial Instruments | | Level 1 | | | Level 2 | | | Level 3 | | | Total | |
| Short-Term Securities | | | $— | | | | $263,674,412 | | | | $— | | | | $263,674,412 | |
For further information regarding security characteristics, see the Portfolio of Investments.
Repurchase Agreements– The fund enters into repurchase agreements under the terms of Master Repurchase Agreements with approved counterparties. Each repurchase agreement is recorded at cost. The fund requires that the securities collateral in a repurchase transaction be transferred to a custodian. The fund monitors, on a daily basis, the value of the collateral to ensure that its value, including accrued interest, is greater than amounts owed to the fund under each such repurchase agreement. Upon an event of default under a Master Repurchase Agreement, thenon-defaulting party may close out all transactions traded under such agreement and net amounts owed under each transaction to one net amount payable by one party to the other. Absent an event of default, the Master Repurchase Agreement does not result in an offset of reported amounts of assets and liabilities in the Statement of Assets and Liabilities across transactions between the fund and the applicable counterparty. The fund and other funds managed by MFS may utilize a joint trading account for the purpose of entering into one or more repurchase agreements. At December 31, 2019, the fund had investments in repurchase agreements with a gross value of $14,972,000 included in investments in unaffiliated issuers in the Statement of Assets and Liabilities. The value of the related collateral exceeded the value of the repurchase agreements at period end.
Indemnifications– Under the fund’s organizational documents, its officers and Trustees may be indemnified against certain liabilities and expenses arising out of the performance of their duties to the fund. Additionally, in the normal course of business, the
10
MFS U.S. Government Money Market Portfolio
Notes to Financial Statements – continued
fund enters into agreements with service providers that may contain indemnification clauses. The fund’s maximum exposure under these agreements is unknown as this would involve future claims that may be made against the fund that have not yet occurred.
Investment Transactions and Income– Investment transactions are recorded on the trade date. Interest income is recorded on the accrual basis. All premium and discount is amortized or accreted for financial statement purposes in accordance with U.S. generally accepted accounting principles.
Tax Matters and Distributions– The fund intends to qualify as a regulated investment company, as defined under Subchapter M of the Internal Revenue Code, and to distribute all of its taxable income, including realized capital gains. As a result, no provision for federal income tax is required. The fund’s federal tax returns, when filed, will remain subject to examination by the Internal Revenue Service for a three year period. Management has analyzed the fund’s tax positions taken on federal and state tax returns for all open tax years and does not believe that there are any uncertain tax positions that require recognition of a tax liability.
Distributions to shareholders are recorded on theex-dividend date. Income and capital gain distributions are determined in accordance with income tax regulations, which may differ from U.S. generally accepted accounting principles. Certain capital accounts in the financial statements are periodically adjusted for permanent differences in order to reflect their tax character. These adjustments have no impact on net assets or net asset value per share. Temporary differences which arise from recognizing certain items of income, expense, gain or loss in different periods for financial statement and tax purposes will reverse at some time in the future.
During the year ended December 31, 2019, there were no significant adjustments due to differences between book and tax accounting.
The tax character of distributions declared to shareholders for the last two fiscal years is as follows:
| | | | | | | | |
| | | Year ended
12/31/19 | | | Year ended
12/31/18 | |
| Ordinary income (including any short-term capital gains) | | | $4,512,318 | | | | $3,659,550 | |
The federal tax cost and the tax basis components of distributable earnings were as follows:
| | | | |
| As of 12/31/19 | | | | |
| Cost of investments | | | $263,674,412 | |
| Undistributed ordinary income | | | 15 | |
Multiple Classes of Shares of Beneficial Interest– The fund offers multiple classes of shares, which differ in their respective distribution and/or service fees. The fund’s income and common expenses are allocated to shareholders based on the value of settled shares outstanding of each class. The fund’s realized and unrealized gain (loss) are allocated to shareholders based on the daily net assets of each class. Dividends are declared separately for each class. Differences in per share dividend rates are generally due to differences in separate class expenses. The fund’s distributions declared to shareholders as reported in the Statements of Changes in Net Assets are presented by class as follows:
| | | | | | | | |
| | |
| | | Year ended
12/31/19 | | | Year ended
12/31/18 | |
| Initial Class | | | $2,504,152 | | | | $1,937,963 | |
| Service Class | | | 2,008,166 | | | | 1,721,587 | |
| Total | | | $4,512,318 | | | | $3,659,550 | |
| (3) | | Transactions with Affiliates |
Investment Adviser– The fund has an investment advisory agreement with MFS to provide overall investment management and related administrative services and facilities to the fund. The management fee is computed daily and paid monthly at the following annual rates based on the fund’s average daily net assets:
| | | | |
| Up to $500 million | | | 0.50% | |
| In excess of $500 million | | | 0.45% | |
MFS has agreed in writing to reduce its management fee by a specified amount if certain MFS mutual fund assets exceed thresholds agreed to by MFS and the fund’s Board of Trustees. For the year ended December 31, 2019, this management fee reduction amounted to $26,959, which is included in the reduction of total expenses in the Statement of Operations. The management fee incurred for the year ended December 31, 2019 was equivalent to an annual effective rate of 0.49% of the fund’s average daily net assets.
The investment adviser has agreed in writing to pay a portion of the fund’s total annual operating expenses, excluding interest, taxes, extraordinary expenses, brokerage and transaction costs, and investment-related expenses, such that total annual operating expenses do not exceed 0.57% of average daily net assets for each of the Initial Class and Service Class shares. This written agreement will continue until modified by the fund’s Board of Trustees, but such agreement will continue at least until April 30, 2021. For the year ended December 31, 2019, the fund’s actual operating expenses did not exceed the limits described above and therefore, the investment adviser did not pay any portion of the fund’s expenses related to this agreement.
11
MFS U.S. Government Money Market Portfolio
Notes to Financial Statements – continued
Distributor– MFS Fund Distributors, Inc. (MFD), a wholly-owned subsidiary of MFS, is the distributor of shares of the fund. The Trustees have adopted a distribution plan for the Service Class shares pursuant to Rule12b-1 under the Investment Company Act of 1940.
The fund’s distribution plan provides that the fund will pay MFD distribution and/or service fees equal to 0.25% per annum of its average daily net assets attributable to Service Class shares as partial consideration for services performed and expenses incurred by MFD and financial intermediaries (including participating insurance companies that invest in the fund to fund variable annuity and variable life insurance contracts, sponsors of qualified retirement and pension plans that invest in the fund, and affiliates of these participating insurance companies and plan sponsors) in connection with the sale and distribution of the Service Class shares. MFD may subsequently pay all, or a portion, of the distribution and/or service fees to financial intermediaries. MFD has agreed in writing to waive the entire 0.25% distribution and/or service fee. This written agreement will continue until modified by the fund’s Board of Trustees, but such agreement will continue at least until April 30, 2021. For the year ended December 31, 2019, this waiver amounted to $306,862, which is included in the reduction of total expenses in the Statement of Operations. The distribution and/or service fees incurred for the year ended December 31, 2019 were equivalent to an annual effective rate of 0.00% of the average daily net assets attributable to Service Class shares.
Shareholder Servicing Agent– MFS Service Center, Inc. (MFSC), a wholly-owned subsidiary of MFS, receives a fee from the fund for its services as shareholder servicing agent. For the year ended December 31, 2019, the fee was $3,032, which equated to 0.0011% annually of the fund’s average daily net assets. MFSC also receives payment from the fund forout-of-pocket expenses paid by MFSC on behalf of the fund. For the year ended December 31, 2019, these costs amounted to $360.
Administrator– MFS provides certain financial, legal, shareholder communications, compliance, and other administrative services to the fund. Under an administrative services agreement, the fund reimburses MFS the costs incurred to provide these services. The fund is charged an annual fixed amount of $17,500 plus a fee based on average daily net assets. The administrative services fee incurred for the year ended December 31, 2019 was equivalent to an annual effective rate of 0.0174% of the fund’s average daily net assets.
Trustees’ and Officers’ Compensation– The fund pays compensation to independent Trustees in the form of a retainer, attendance fees, and additional compensation to Board and Committee chairpersons. The fund does not pay compensation directly to Trustees or officers of the fund who are also officers of the investment adviser, all of whom receive remuneration from MFS for their services to the fund. Certain officers and Trustees of the fund are officers or directors of MFS, MFD, and MFSC.
Other– This fund and certain other funds managed by MFS (the funds) had entered into a service agreement (the ISO Agreement) which provided for payment of fees solely by the funds to Tarantino LLC in return for the provision of services of an Independent Senior Officer (ISO) for the funds. Frank L. Tarantino served as the ISO and was an officer of the funds and the sole member of Tarantino LLC. Effective June 30, 2019, Mr. Tarantino retired from his position as ISO for the funds, and the ISO Agreement was terminated. For the year ended December 31, 2019, the fee paid by the fund under this agreement was $336 and is included in “Miscellaneous” expense in the Statement of Operations. MFS had agreed to bear all expenses associated with office space, other administrative support, and supplies provided to the ISO.
12
MFS U.S. Government Money Market Portfolio
Notes to Financial Statements – continued
| (4) | | Shares of Beneficial Interest |
The fund’s Declaration of Trust permits the Trustees to issue an unlimited number of full and fractional shares of beneficial interest. The number of shares sold, reinvested and reacquired corresponds to the net proceeds from the sale of shares, reinvestment of distributions and cost of shares reacquired, respectively, since shares are sold and reacquired at $1.00 per share. Transactions in fund shares were as follows:
| | | | | | | | |
| | | Year ended
12/31/19 | | | Year ended
12/31/18 | |
| Shares sold | | | | | | | | |
Initial Class | | | 36,663,940 | | | | 40,333,024 | |
Service Class | | | 32,307,851 | | | | 35,513,369 | |
| | | 68,971,791 | | | | 75,846,393 | |
| | |
| Shares issued to shareholders in reinvestment of distributions | | | | | | | | |
Initial Class | | | 2,504,152 | | | | 1,937,963 | |
Service Class | | | 2,008,166 | | | | 1,721,587 | |
| | | 4,512,318 | | | | 3,659,550 | |
| | |
| Shares reacquired | | | | | | | | |
Initial Class | | | (49,779,510 | ) | | | (50,062,009 | ) |
Service Class | | | (47,931,681 | ) | | | (55,519,065 | ) |
| | | (97,711,191 | ) | | | (105,581,074 | ) |
| | |
| Net change | | | | | | | | |
Initial Class | | | (10,611,418 | ) | | | (7,791,022 | ) |
Service Class | | | (13,615,664 | ) | | | (18,284,109 | ) |
| | | (24,227,082 | ) | | | (26,075,131 | ) |
The fund and certain other funds managed by MFS participate in a $1.25 billion unsecured committed line of credit, subject to a $1 billion sublimit, provided by a syndicate of banks under a credit agreement. Borrowings may be made for temporary financing needs. Interest is charged to each fund, based on its borrowings, generally at a rate equal to the highest of one month LIBOR, the Federal Funds Effective Rate and the Overnight Bank Funding Rate, plus an agreed upon spread. A commitment fee, based on the average daily, unused portion of the committed line of credit, is allocated among the participating funds. In addition, the fund and other funds managed by MFS have established unsecured uncommitted borrowing arrangements with certain banks for temporary financing needs. Interest is charged to each fund, based on its borrowings, at rates equal to customary reference rates plus an agreed upon spread. For the year ended December 31, 2019, the fund’s commitment fee and interest expense were $1,531 and $0, respectively, and are included in “Miscellaneous” expense in the Statement of Operations.
13
MFS U.S. Government Money Market Portfolio
REPORT OF INDEPENDENT REGISTERED PUBLIC ACCOUNTING FIRM
To the Board of Trustees of MFS Variable Insurance Trust II and the Shareholders of
MFS U.S. Government Money Market Portfolio:
Opinion on the Financial Statements and Financial Highlights
We have audited the accompanying statement of assets and liabilities of MFS U.S. Government Money Market Portfolio (the “Fund”), including the portfolio of investments, as of December 31, 2019, the related statement of operations for the year then ended, the statements of changes in net assets for each of the two years in the period then ended, the financial highlights for each of the five years in the period then ended, and the related notes. In our opinion, the financial statements and financial highlights present fairly, in all material respects, the financial position of the Fund as of December 31, 2019, and the results of its operations for the year then ended, the changes in its net assets for each of the two years in the period then ended, and the financial highlights for each of the five years in the period then ended, in conformity with accounting principles generally accepted in the United States of America.
Basis for Opinion
These financial statements and financial highlights are the responsibility of the Fund’s management. Our responsibility is to express an opinion on the Fund’s financial statements and financial highlights based on our audits. We are a public accounting firm registered with the Public Company Accounting Oversight Board (United States) (PCAOB) and are required to be independent with respect to the Fund in accordance with the U.S. federal securities laws and the applicable rules and regulations of the Securities and Exchange Commission and the PCAOB.
We conducted our audits in accordance with the standards of the PCAOB. Those standards require that we plan and perform the audit to obtain reasonable assurance about whether the financial statements and financial highlights are free of material misstatement, whether due to error or fraud. The Fund is not required to have, nor were we engaged to perform, an audit of its internal control over financial reporting. As part of our audits we are required to obtain an understanding of internal control over financial reporting but not for the purpose of expressing an opinion on the effectiveness of the Fund’s internal control over financial reporting. Accordingly, we express no such opinion.
Our audits included performing procedures to assess the risks of material misstatement of the financial statements and financial highlights, whether due to error or fraud, and performing procedures that respond to those risks. Such procedures included examining, on a test basis, evidence regarding the amounts and disclosures in the financial statements and financial highlights. Our audits also included evaluating the accounting principles used and significant estimates made by management, as well as evaluating the overall presentation of the financial statements and financial highlights. Our procedures included confirmation of securities owned as of December 31, 2019, by correspondence with the custodian and brokers. We believe that our audits provide a reasonable basis for our opinion.
DELOITTE & TOUCHE LLP
Boston, Massachusetts
February 14, 2020
We have served as the auditor of one or more of the MFS investment companies since 1924.
14
MFS U.S. Government Money Market Portfolio
TRUSTEES AND OFFICERS – IDENTIFICATION AND BACKGROUND
The Trustees and Officers of the Trust, as of February 1, 2020, are listed below, together with their principal occupations during the past five years. (Their titles may have varied during that period.) The address of each Trustee and Officer is 111 Huntington Avenue, Boston, Massachusetts 02199-7618.
| | | | | | | | | | |
Name, Age | | Position(s)
Held with Fund | | Trustee/Officer
Since (h) | | Number of MFS Funds
overseen by the
Trustee | | Principal Occupations
During the Past Five Years | | Other Directorships During the Past Five Years (j) |
| INTERESTED TRUSTEES |
Robert J. Manning (k)
(age 56) | | Trustee | | February 2004 | | 133 | | Massachusetts Financial Services Company, Executive Chairman (since January 2017); Director; Chairman of the Board; Chief Executive Officer (until 2015);Co-Chief Executive Officer(2015-2016) | | N/A |
| | | | | |
Robin A. Stelmach (k) (age 58) | | Trustee | | January 2014 | | 133 | | Massachusetts Financial Services Company, Vice Chair (since January 2017); Chief Operating Officer and Executive Vice President (until January 2017) | | N/A |
|
| INDEPENDENT TRUSTEES |
John P. Kavanaugh (age 65) | | Trustee and Chair of Trustees | | January 2009 | | 133 | | Private investor | | N/A |
| | | | | |
Steven E. Buller (age 68) | | Trustee | | February 2014 | | 133 | | Financial Accounting Standards Advisory Council, Chairman(2014-2015); Public Company Accounting Oversight Board, Standing Advisory Group, Member (until 2014); BlackRock, Inc. (investment management), Managing Director (until 2014), BlackRock Finco UK (investment management), Director (until 2014) | | N/A |
| | | | | |
John A. Caroselli (age 65) | | Trustee | | March 2017 | | 133 | | JC Global Advisors, LLC (management consulting), President (since 2015); First Capital Corporation (commercial finance), Executive Vice President (until 2015) | | N/A |
| | | | | |
Maureen R. Goldfarb (age 64) | | Trustee | | January 2009 | | 133 | | Private investor | | N/A |
| | | | | |
Peter D. Jones
(age 64) | | Trustee | | January 2019 | | 133 | | Franklin Templeton Distributors, Inc. (investment management), President (until 2015); Franklin Templeton Institutional, LLC (investment management), Chairman (until 2015) | | N/A |
| | | | | |
James W. Kilman, Jr.
(age 58) | | Trustee | | January 2019 | | 133 | | Burford Capital Limited (finance and investment management), Chief Financial Officer (since 2019); KielStrand Capital LLC (family office), Chief Executive Officer (since 2016); Morgan Stanley & Co. (financial services), Vice Chairman of Investment Banking,Co-Head of Diversified Financials Coverage – Financial Institutions Investment Banking Group (until 2016) | | Alpha-En Corporation, Director (2016-2019) |
15
MFS U.S. Government Money Market Portfolio
Trustees and Officers – continued
| | | | | | | | | | |
Name, Age | | Position(s)
Held with Fund | | Trustee/Officer
Since (h) | | Number of MFS Funds
overseen by the
Trustee | | Principal Occupations
During the Past Five Years | | Other Directorships During the Past Five Years (j) |
Clarence Otis, Jr. (age 63) | | Trustee | | March 2017 | | 133 | | Darden Restaurants, Inc., Chief Executive Officer (until 2014) | | VF Corporation, Director; Verizon Communications, Inc., Director; The Travelers Companies, Director; Federal Reserve Bank of Atlanta, Director (until 2015) |
| | | | | |
Maryanne L. Roepke (age 63) | | Trustee | | May 2014 | | 133 | | American Century Investments (investment management), Senior Vice President and Chief Compliance Officer (until 2014) | | N/A |
| | | | | |
Laurie J. Thomsen
(age 62) | | Trustee | | March 2005 | | 133 | | Private investor | | The Travelers Companies, Director; Dycom Industries, Inc., Director (since 2015) |
| | | | | | | | |
Name, Age | | Position(s)
Held with Fund | | Trustee/Officer
Since (h) | | Number of
MFS Funds
for which the
Person is an
Officer | | Principal Occupations During the Past Five Years |
| OFFICERS | | | | | | |
Christopher R. Bohane (k)
(age 46) | | Assistant Secretary and Assistant Clerk | | July 2005 | | 133 | | Massachusetts Financial Services Company, Vice President and Assistant General Counsel |
| | | | |
Kino Clark (k) (age 51) | | Assistant Treasurer | | January 2012 | | 133 | | Massachusetts Financial Services Company, Vice President |
| | | | |
John W. Clark, Jr. (k) (age 52) | | Assistant Treasurer | | April 2017 | | 133 | | Massachusetts Financial Services Company, Vice President (since March 2017); Deutsche Bank (financial services), Department Head – Treasurer’s Office (until February 2017) |
| | | | |
Thomas H. Connors (k) (age 60) | | Assistant Secretary and Assistant Clerk | | September 2012 | | 133 | | Massachusetts Financial Services Company, Vice President and Senior Counsel |
| | | | |
David L. DiLorenzo (k)
(age 51) | | President | | July 2005 | | 133 | | Massachusetts Financial Services Company, Senior Vice President |
| | | | |
Heidi W. Hardin (k) (age 52) | | Secretary and Clerk | | April 2017 | | 133 | | Massachusetts Financial Services Company, Executive Vice President and General Counsel (since March 2017); Harris Associates (investment management), General Counsel (from September 2015 to January 2017); Janus Capital Management LLC (investment management), Senior Vice President and General Counsel (until September 2015) |
| | | | |
Brian E. Langenfeld (k) (age 46) | | Assistant
Secretary and Assistant Clerk | | June 2006 | | 133 | | Massachusetts Financial Services Company, Vice President and Senior Counsel |
| | | | |
Amanda S. Mooradian (k) (age 40) | | Assistant
Secretary and Assistant Clerk | | September 2018 | | 133 | | Massachusetts Financial Services Company, Assistant Vice President and Counsel |
| | | | |
Susan A. Pereira (k)
(age 49) | | Assistant
Secretary and Assistant Clerk | | July 2005 | | 133 | | Massachusetts Financial Services Company, Vice President and Assistant General Counsel |
| | | | |
Kasey L. Phillips (k) (age 49) | | Assistant Treasurer | | September 2012 | | 133 | | Massachusetts Financial Services Company, Vice President |
| | | | |
Matthew A. Stowe (k) (age 45) | | Assistant Secretary and Assistant Clerk | | October 2014 | | 133 | | Massachusetts Financial Services Company, Vice President and Assistant General Counsel |
16
MFS U.S. Government Money Market Portfolio
Trustees and Officers – continued
| | | | | | | | |
Name, Age | | Position(s)
Held with Fund | | Trustee/Officer
Since (h) | | Number of
MFS Funds
for which the
Person is an
Officer | | Principal Occupations During the Past Five Years |
Martin J. Wolin (k) (age 52) | | Chief Compliance Officer | | July 2015 | | 133 | | Massachusetts Financial Services Company, Senior Vice President and Chief Compliance Officer (since July 2015); Mercer (financial service provider), Chief Risk and Compliance Officer, North America and Latin America (until June 2015) |
| | | | |
James O. Yost (k)
(age 59) | | Treasurer | | September 1990 | | 133 | | Massachusetts Financial Services Company, Senior Vice President |
| (h) | Date first appointed to serve as Trustee/officer of an MFS Fund. Each Trustee has served continuously since appointment unless indicated otherwise. For the period from December 15, 2004 until February 22, 2005, Mr. Manning served as Advisory Trustee. From January 2012 through December 2016, Messrs. DiLorenzo and Yost served as Treasurer and Deputy Treasurer of the Funds, respectively. |
| (j) | Directorships or trusteeships of companies required to report to the Securities and Exchange Commission (i.e., “public companies”). |
| (k) | “Interested person” of the Trust within the meaning of the Investment Company Act of 1940 (referred to as the 1940 Act), which is the principal federal law governing investment companies like the fund, as a result of a position with MFS. The address of MFS is 111 Huntington Avenue, Boston, Massachusetts 02199-7618. |
Each Trustee (other than Messrs. Jones and Kilman) has been elected by shareholders and each Trustee and Officer holds office until his or her successor is chosen and qualified or until his or her earlier death, resignation, retirement or removal. Messrs. Jones and Kilman became Trustees of the Funds on January 1, 2019. The Trust does not hold annual meetings for the purpose of electing Trustees, and Trustees are not elected for fixed terms. Under the terms of the Board’s retirement policy, an Independent Trustee shall retire at the end of the calendar year in which he or she reaches the earlier of 75 years of age or 15 years of service on the Board (or, in the case of any Independent Trustee who joined the Board prior to 2015, 20 years of service on the Board).
Messrs. Buller, Kilman and Otis and Ms. Roepke are members of the Trust’s Audit Committee.
Each of the Interested Trustees and certain Officers hold comparable officer positions with certain affiliates of MFS.
The Statement of Additional Information for a Fund includes further information about the Trustees and is available without charge upon request by calling1-800-225-2606.
| | |
Investment Adviser Massachusetts Financial Services Company 111 Huntington Avenue Boston, MA 02199-7618 | | Custodian State Street Bank and Trust Company 1 Lincoln Street Boston, MA 02111-2900 |
| |
Distributor MFS Fund Distributors, Inc. 111 Huntington Avenue Boston, MA 02199-7618 | | Independent Registered Public Accounting Firm Deloitte & Touche LLP 200 Berkeley Street Boston, MA 02116 |
| |
Portfolio Manager(s) Ed O’Dette | | |
17
MFS U.S. Government Money Market Portfolio
BOARD REVIEW OF INVESTMENT ADVISORY AGREEMENT
MFS U.S. Government Money Market Portfolio
The Investment Company Act of 1940 requires that both the full Board of Trustees and a majority of thenon-interested (“independent”) Trustees, voting separately, annually approve the continuation of the Fund’s investment advisory agreement with MFS. The Trustees consider matters bearing on the Fund and its advisory arrangements at their meetings throughout the year, including a review of performance data at each regular meeting. In addition, the independent Trustees met several times over the course of three months beginning in May and ending in July, 2019 (“contract review meetings”) for the specific purpose of considering whether to approve the continuation of the investment advisory agreement for the Fund and the other investment companies that the Board oversees (the “MFS Funds”). The independent Trustees were assisted in their evaluation of the Fund’s investment advisory agreement by independent legal counsel, from whom they received separate legal advice and with whom they met separately from MFS during various contract review meetings. The independent Trustees were also assisted in this process by the MFS Funds’ Independent Senior Officer, a senior officer appointed by and reporting to the independent Trustees.
In connection with their deliberations regarding the continuation of the investment advisory agreement, the Trustees, including the independent Trustees, considered such information and factors as they believed, in light of the legal advice furnished to them and their own business judgment, to be relevant. The investment advisory agreement for the Fund was considered separately, although the Trustees also took into account the common interests of all MFS Funds in their review. As described below, the Trustees considered the nature, quality, and extent of the various investment advisory, administrative, and shareholder services performed by MFS under the existing investment advisory agreement and other arrangements with the Fund.
In connection with their contract review meetings, the Trustees received and relied upon materials that included, among other items: (i) information provided by Broadridge Financial Solutions, Inc. (“Broadridge”), an independent third party, on the investment performance of the Fund for various time periods ended December 31, 2018 and the investment performance of a group of funds with substantially similar investment classifications/objectives (the “Broadridge performance universe”), (ii) information provided by Broadridge on the Fund’s advisory fees and other expenses and the advisory fees and other expenses of comparable funds identified by Broadridge as well as all other funds in the same investment classification/category (the “Broadridge expense group and universe”), (iii) information provided by MFS on the advisory fees of portfolios of other clients of MFS, including institutional separate accounts and other clients, (iv) information as to whether and to what extent applicable expense waivers, reimbursements or fee “breakpoints” are observed for the Fund, (v) information regarding MFS’ financial results and financial condition, including MFS’ and certain of its affiliates’ estimated profitability from services performed for the Fund and the MFS Funds as a whole, and compared to MFS’ institutional business, (vi) MFS’ views regarding the outlook for the mutual fund industry and the strategic business plans of MFS, (vii) descriptions of various functions performed by MFS for the Funds, such as compliance monitoring and portfolio trading practices, and (viii) information regarding the overall organization of MFS, including information about MFS’ senior management and other personnel providing investment advisory, administrative and other services to the Fund and the other MFS Funds. The comparative performance, fee and expense information prepared and provided by Broadridge was not independently verified and the independent Trustees did not independently verify any information provided to them by MFS.
The Trustees’ conclusion as to the continuation of the investment advisory agreement was based on a comprehensive consideration of all information provided to the Trustees and not the result of any single factor. Some of the factors that figured particularly in the Trustees’ deliberations are described below, although individual Trustees may have evaluated the information presented differently from one another, giving different weights to various factors. It is also important to recognize that the fee arrangements for the Fund and other MFS Funds are the result of years of review and discussion between the independent Trustees and MFS, that certain aspects of such arrangements may receive greater scrutiny in some years than in others, and that the Trustees’ conclusions may be based, in part, on their consideration of these same arrangements during the course of the year and in prior years.
Based on information provided by Broadridge and MFS, the Trustees reviewed the Fund’s total return investment performance as well as the Broadridge performance universe over various time periods. The Trustees placed particular emphasis on the total return performance of the Fund’s Initial Class shares in comparison to the performance of funds in its Broadridge performance universe over the five-year period ended December 31, 2018, which the Trustees believed was a long enough period to reflect differing market conditions. The total return performance of the Fund’s Initial Class shares was in the 4th quintile relative to the other funds in the universe for this five-year period (the 1st quintile being the best performers and the 5th quintile being the worst performers). The total return performance of the Fund’s Initial Class shares was in the 4th quintile for each of theone- and three-year periods ended December 31, 2018 relative to the Broadridge performance universe. Because of the passage of time, these performance results may differ from the performance results for more recent periods, including those shown elsewhere in this report.
In the course of their deliberations, the Trustees took into account information provided by MFS in connection with the contract review meetings, as well as during investment review meetings conducted with portfolio management personnel during the course of the year regarding the Fund’s performance. In addition, the Trustees noted the market conditions affecting all money market funds, in particular the low interest rate environment during portions of the three- and five-year periods, and MFS’ voluntary waiver
18
MFS U.S. Government Money Market Portfolio
Board Review of Investment Advisory Agreement – continued
of all or a portion of its fees to ensure that the Fund avoided a negative yield during those periods. After reviewing these and related factors, the Trustees concluded, within the context of their overall conclusions regarding the investment advisory agreement, that they were satisfied with MFS’ responses and efforts relating to investment performance.
In assessing the reasonableness of the Fund’s advisory fee, the Trustees considered, among other information, the Fund’s advisory fee and the total expense ratio of the Fund’s Initial Class shares as a percentage of average daily net assets and the advisory fee and total expense ratios of the Broadridge expense group based on information provided by Broadridge. The Trustees considered that MFS currently observes an expense limitation for the Fund, which may not be changed without the Trustees’ approval. The Trustees also considered that, according to the data provided by Broadridge (which takes into account any fee reductions or expense limitations that were in effect during the Fund’s last fiscal year), the Fund’s effective advisory fee rate and total expense ratio were each higher than the Broadridge expense group median.
The Trustees also considered the advisory fees charged by MFS to any institutional separate accounts advised by MFS (“separate accounts”) and unaffiliated investment companies for which MFS serves as subadviser (“subadvised funds”) that have comparable investment strategies to the Fund, if any. In comparing these fees, the Trustees considered information provided by MFS as to the generally broader scope of services provided by MFS to the Fund, as well as the more extensive regulatory burdens imposed on MFS in managing the Fund, in comparison to separate accounts and subadvised funds. The Trustees also considered the higher demands placed on MFS’ investment personnel and trading infrastructure as a result of the daily cashin-flows andout-flows of the Fund in comparison to separate accounts.
The Trustees also considered whether the Fund may benefit from any economies of scale in the management of the Fund in the event of growth in assets of the Fund and/or growth in assets of the MFS Funds as a whole. They noted that the Fund’s advisory fee rate schedule is subject to a contractual breakpoint that reduces the Fund’s advisory fee rate on average daily net assets over $500 million. The Trustees also noted that MFS has agreed in writing to waive a portion of the management fees of certain MFS Funds, including the Fund, if the total combined assets of certain funds within the MFS Funds’ complex increase above agreed upon thresholds (the “group fee waiver”), enabling the Fund’s shareholders to share in the benefits from any economies of scale at the complex level. The group fee waiver is reviewed and renewed annually between the Board and MFS. The Trustees concluded that the breakpoint and the group fee waiver were sufficient to allow the Fund to benefit from economies of scale as its assets and overall complex assets grow.
The Trustees also considered information prepared by MFS relating to MFS’ costs and profits with respect to the Fund, the MFS Funds considered as a group, and other investment companies and accounts advised by MFS, as well as MFS’ methodologies used to determine and allocate its costs to the MFS Funds, the Fund and other accounts and products for purposes of estimating profitability.
After reviewing these and other factors described herein, the Trustees concluded, within the context of their overall conclusions regarding the investment advisory agreement, that the advisory fees charged to the Fund represent reasonable compensation in light of the services being provided by MFS to the Fund.
In addition, the Trustees considered MFS’ resources and related efforts to continue to retain, attract and motivate capable personnel to serve the Fund. The Trustees also considered current and developing conditions in the financial services industry, including the presence of large and well-capitalized companies which are spending, and appear to be prepared to continue to spend, substantial sums to engage personnel and to provide services to competing investment companies. In this regard, the Trustees also considered the financial resources of MFS and its ultimate parent, Sun Life Financial Inc. The Trustees also considered the advantages and possible disadvantages to the Fund of having an adviser that also serves other investment companies as well as other accounts.
The Trustees also considered the nature, quality, cost, and extent of administrative, transfer agency, and distribution services provided to the Fund by MFS and its affiliates under agreements and plans other than the investment advisory agreement, including any12b-1 fees the Fund pays to MFS Fund Distributors, Inc., an affiliate of MFS. The Trustees also considered the nature, extent and quality of certain other services MFS performs or arranges for on the Fund’s behalf, which may include securities lending programs, directed expense payment programs, class action recovery programs, and MFS’ interaction with third-party service providers, principally custodians andsub-custodians. The Trustees concluded that the variousnon-advisory services provided by MFS and its affiliates on behalf of the Fund were satisfactory.
The Trustees consideredso-called“fall-out benefits” to MFS such as reputational value derived from serving as investment manager to the MFS Funds. The Trustees also considered that, effective January 3, 2018, MFS had discontinued its historic practice of obtaining investment research from portfolio brokerage commissions paid by certain MFS Funds and would thereafter directly pay for or voluntarily reimburse a Fund, if applicable, for the costs of external research acquired through the use of the Fund’s portfolio brokerage commissions.
Based on their evaluation of factors that they deemed to be material, including those factors described above, the Board of Trustees, including the independent Trustees, concluded that the Fund’s investment advisory agreement with MFS should be continued for an additionalone-year period, commencing August 1, 2019.
19
MFS U.S. Government Money Market Portfolio
PROXY VOTING POLICIES AND INFORMATION
MFS votes proxies on behalf of the fund pursuant to proxy voting policies and procedures that are available without charge, upon request, by calling 1-800-225-2606, by visitingmfs.com/proxyvoting, or by visiting the SEC’s Web site athttp://www.sec.gov.
Information regarding how the fund voted proxies relating to portfolio securities during the most recent twelve-month period ended June 30 is available by August 31 of each year without charge by visitingmfs.com/proxyvoting, or by visiting the SEC’s Web site athttp://www.sec.gov.
PORTFOLIO HOLDINGS INFORMATION
The fund files monthly portfolio information with the SEC on Form N-MFP. The fund’s Form N-MFP reports are available on the SEC’s website athttp://www.sec.gov. A shareholder can also access the fund’s portfolio holdings as of each month end and the fund’s Form N-MFP reports atmfs.com/vit2 after choosing “Click here for access to Money Market fund reports”.
FURTHER INFORMATION
From time to time, MFS may post important information about the fund or the MFS funds on the MFS web site (mfs.com). This information is available athttps://www.mfs.com/en-us/what-we-do/announcements.htmlor atmfs.com/vit2 by choosing the fund’s name.
INFORMATION ABOUT FUND CONTRACTS AND LEGAL CLAIMS
The fund has entered into contractual arrangements with an investment adviser, administrator, distributor, shareholder servicing agent, 529 program manager (if applicable), and custodian who each provide services to the fund. Unless expressly stated otherwise, shareholders are not parties to, or intended beneficiaries of these contractual arrangements, and these contractual arrangements are not intended to create any shareholder right to enforce them against the service providers or to seek any remedy under them against the service providers, either directly or on behalf of the fund.
Under the Trust’s By-Laws and Declaration of Trust, any claims asserted against or on behalf of the MFS Funds, including claims against Trustees and Officers, must be brought in state and federal courts located within the Commonwealth of Massachusetts.
20
rev. 3/16
| | | | |
| | | |
| FACTS | | WHAT DOES MFS DO WITH YOUR
PERSONAL INFORMATION? | |  |
| | |
| Why? | | Financial companies choose how they share your personal information. Federal law gives consumers the right to limit some but not all sharing. Federal law also requires us to tell you how we collect, share, and protect your personal information. Please read this notice carefully to understand what we do. |
| | |
| What? | | The types of personal information we collect and share depend on the product or service you have with us. This information can include: • Social Security number and account balances • Account transactions and transaction history • Checking account information and wire transfer instructions When you areno longer our customer, we continue to share your information as described in this notice. |
| | |
| How? | | All financial companies need to share customers’ personal information to run their everyday business. In the section below, we list the reasons financial companies can share their customers’ personal information; the reasons MFS chooses to share; and whether you can limit this sharing. |
| | | | |
Reasons we can share your
personal information | | Does MFS share? | | Can you limit this
sharing? |
For our everyday business purposes – such as to process your transactions, maintain your account(s), respond to court orders and legal investigations, or report to credit bureaus | | Yes | | No |
For our marketing purposes – to offer our products and services to you | | No | | We don’t share |
| For joint marketing with other financial companies | | No | | We don’t share |
For our affiliates’ everyday business purposes – information about your transactions and experiences | | No | | We don’t share |
For our affiliates’ everyday business purposes – information about your creditworthiness | | No | | We don’t share |
| For nonaffiliates to market to you | | No | | We don’t share |
| | |
| | |
| Questions? | | Call800-225-2606 or go tomfs.com. |
21
| | |
| Who we are |
| Who is providing this notice? | | MFS Funds, MFS Investment Management, MFS Institutional Advisors, Inc., and MFS Heritage Trust Company. |
| | |
| What we do |
| How does MFS protect my personal information? | | To protect your personal information from unauthorized access and use, we use security measures that comply with federal law. These measures include procedural, electronic, and physical safeguards for the protection of the personal information we collect about you. |
How does MFS
collect my personal information? | | We collect your personal information, for example, when you • open an account or provide account information • direct us to buy securities or direct us to sell your securities • make a wire transfer We also collect your personal information from others, such as credit bureaus, affiliates, or other companies. |
| Why can’t I limit all sharing? | | Federal law gives you the right to limit only • sharing for affiliates’ everyday business purposes – information about your creditworthiness • affiliates from using your information to market to you • sharing for nonaffiliates to market to you State laws and individual companies may give you additional rights to limit sharing. |
| | |
| Definitions |
| Affiliates | | Companies related by common ownership or control. They can be financial and nonfinancial companies. • MFS does not share personal information with affiliates, except for everyday business purposes as described on page one of this notice. |
| Nonaffiliates | | Companies not related by common ownership or control. They can be financial and nonfinancial companies. • MFS does not share with nonaffiliates so they can market to you. |
| Joint marketing | | A formal agreement between nonaffiliated financial companies that together market financial products or services to you. • MFS doesn’t jointly market. |
| | |
| Other important information |
| If you own an MFS product or receive an MFS service in the name of a third party such as a bank or broker-dealer, their privacy policy may apply to you instead of ours. |
22
The Registrant has adopted a Code of Ethics (the “Code”) pursuant to Section 406 of the Sarbanes-Oxley Act and as defined in FormN-CSR that applies to the Registrant’s principal executive officer and principal financial and accounting officer. During the period covered by this report, the Registrant has not amended any provision in the Code that relates to an element of the Code’s definition enumerated in paragraph (b) of Item 2 of this FormN-CSR. During the period covered by this report, the Registrant did not grant a waiver, including an implicit waiver, from any provision of the Code.
A copy of the Code is filed as an exhibit to this FormN-CSR.
| ITEM 3. | AUDIT COMMITTEE FINANCIAL EXPERT. |
Messrs. Steven E. Buller, James Kilman, and Clarence Otis, Jr. and Ms. Maryanne L. Roepke, members of the Audit Committee, have been determined by the Board of Trustees in their reasonable business judgment to meet the definition of “audit committee financial expert” as such term is defined in FormN-CSR. In addition, Messrs. Buller, Kilman, and Otis and Ms. Roepke are “independent” members of the Audit Committee (as such term has been defined by the Securities and Exchange Commission in regulations implementing Section 407 of the Sarbanes-Oxley Act of 2002). The Securities and Exchange Commission has stated that the designation of a person as an audit committee financial expert pursuant to this Item 3 on the FormN-CSR does not impose on such a person any duties, obligations or liability that are greater than the duties, obligations or liability imposed on such person as a member of the Audit Committee and the Board of Trustees in the absence of such designation or identification.
| ITEM 4. | PRINCIPAL ACCOUNTANT FEES AND SERVICES. |
Items 4(a) through 4(d) and 4(g):
The Board of Trustees has appointed Deloitte & Touche LLP (“Deloitte”) to serve as independent accountants to the Registrant (hereinafter the “Registrant” or the “Fund”). The tables below set forth the audit fees billed to the Fund as well as fees fornon-audit services provided to the Fund and/or to the Fund’s investment adviser, Massachusetts Financial Services Company (“MFS”), and to various entities either controlling, controlled by, or under common control with MFS that provide ongoing services to the Fund (“MFS Related Entities”).
For the fiscal years ended December 31, 2019 and 2019, audit fees billed to the Fund by Deloitte were as follows:
| | | | | | | | |
| | | Audit Fees | |
| | | 2019 | | | 2018 | |
Fees billed by Deloitte: | | | | | | | | |
MFS Blended Research Core Equity Portfolio | | | 45,742 | | | | 44,678 | |
MFS Core Equity Portfolio | | | 47,901 | | | | 46,788 | |
MFS Corporate Bond Portfolio | | | 66,863 | | | | 65,324 | |
MFS Emerging Markets Equity Portfolio | | | 48,206 | | | | 47,086 | |
MFS Global Governments Portfolio | | | 64,488 | | | | 63,002 | |
MFS Global Growth Portfolio | | | 58,874 | | | | 57,514 | |
MFS Global Research Portfolio | | | 46,670 | | | | 45,585 | |
MFS Global Tactical Allocation Portfolio | | | 64,526 | | | | 63,039 | |
MFS Government Securities Portfolio | | | 54,806 | | | | 53,538 | |
MFS High Yield Portfolio | | | 71,180 | | | | 69,544 | |
MFS International Growth Portfolio | | | 48,206 | | | | 47,086 | |
MFS International Intrinsic Value Portfolio | | | 49,132 | | | | 47,991 | |
MFS Massachusetts Investors Growth Stock Portfolio | | | 47,795 | | | | 46,684 | |
MFS Research International Portfolio | | | 45,742 | | | | 44,678 | |
MFS Strategic Income Portfolio | | | 70,902 | | | | 69,272 | |
MFS Technology Portfolio | | | 45,848 | | | | 44,781 | |
MFS U.S. Government Money Market Portfolio | | | 28,266 | | | | 27,595 | |
| | | | | | | | |
Total | | | 905,147 | | | | 884,185 | |
For the fiscal years ended December 31, 2019 and 2018, fees billed by Deloitte for audit-related, tax and other services provided to each Fund and for audit-related, tax and other services provided to MFS and MFS Related Entities were as follows:
| | | | | | | | | | | | | | | | | | | | | | | | |
| | | Audit-Related Fees1 | | | Tax Fees2 | | | All Other Fees3 | |
| | | 2019 | | | 2018 | | | 2019 | | | 2018 | | | 2019 | | | 2018 | |
Fees billed by Deloitte: | | | | | | | | | | | | | | | | | | | | | | | | |
To MFS Blended Research Core Equity Portfolio | | | 2,400 | | | | 2,400 | | | | 5,104 | | | | 4,989 | | | | 0 | | | | 0 | |
To MFS Core Equity Portfolio | | | 2,400 | | | | 2,400 | | | | 5,104 | | | | 4,989 | | | | 0 | | | | 0 | |
To MFS Corporate Bond Portfolio | | | 2,400 | | | | 2,400 | | | | 5,104 | | | | 4,989 | | | | 0 | | | | 0 | |
To MFS Emerging Markets Equity Portfolio | | | 2,400 | | | | 2,400 | | | | 5,104 | | | | 4,989 | | | | 0 | | | | 0 | |
To MFS Global Governments Portfolio | | | 2,400 | | | | 2,400 | | | | 5,104 | | | | 4,989 | | | | 0 | | | | 0 | |
To MFS Global Growth Portfolio | | | 2,400 | | | | 2,400 | | | | 5,104 | | | | 4,989 | | | | 0 | | | | 0 | |
To MFS Global Research Portfolio | | | 2,400 | | | | 2,400 | | | | 5,104 | | | | 4,989 | | | | 0 | | | | 0 | |
To MFS Global Tactical Allocation Portfolio | | | 2,400 | | | | 2,400 | | | | 5,104 | | | | 4,989 | | | | 0 | | | | 0 | |
To MFS Government Securities Portfolio | | | 2,400 | | | | 2,400 | | | | 5,104 | | | | 4,989 | | | | 0 | | | | 0 | |
To MFS High Yield Portfolio | | | 2,400 | | | | 2,400 | | | | 5,104 | | | | 4,989 | | | | 0 | | | | 0 | |
To MFS International Growth Portfolio | | | 2,400 | | | | 2,400 | | | | 5,104 | | | | 4,989 | | | | 0 | | | | 0 | |
To MFS International Intrinsic Value Portfolio | | | 2,400 | | | | 2,400 | | | | 5,104 | | | | 4,989 | | | | 0 | | | | 0 | |
To MFS Massachusetts Investors Growth Stock Portfolio | | | 2,400 | | | | 2,400 | | | | 5,104 | | | | 4,989 | | | | 0 | | | | 0 | |
To MFS Research International Portfolio | | | 2,400 | | | | 2,400 | | | | 5,104 | | | | 4,989 | | | | 0 | | | | 0 | |
To MFS Strategic Income Portfolio | | | 2,400 | | | | 2,400 | | | | 5,104 | | | | 4,989 | | | | 0 | | | | 0 | |
To MFS Technology Portfolio | | | 2,400 | | | | 2,400 | | | | 5,104 | | | | 4,989 | | | | 0 | | | | 0 | |
To MFS U.S. Government Money Market Portfolio | | | 2,400 | | | | 2,400 | | | | 5,104 | | | | 4,989 | | | | 0 | | | | 0 | |
Total fees billed by Deloitte To above Funds: | | | 40,800 | | | | 40,800 | | | | 86,768 | | | | 84,813 | | | | 0 | | | | 0 | |
| | | | | | | | | | | | | | | | | | | | | | | | |
| | | Audit-Related Fees1 | | | Tax Fees2 | | | All Other Fees3 | |
| | | 2019 | | | 2018 | | | 2019 | | | 2018 | | | 2019 | | | 2018 | |
Fees billed by Deloitte: | | | | | | | | | | | | | | | | | | | | | | | | |
To MFS and MFS Related Entities of MFS Blended Research Core Equity Portfolio* | | | 0 | | | | 0 | | | | 0 | | | | 0 | | | | 3,790 | | | | 5,390 | |
To MFS and MFS Related Entities of MFS Core Equity Portfolio* | | | 0 | | | | 0 | | | | 0 | | | | 0 | | | | 3,790 | | | | 5,390 | |
To MFS and MFS Related Entities of MFS Corporate Bond Portfolio* | | | 0 | | | | 0 | | | | 0 | | | | 0 | | | | 3,790 | | | | 5,390 | |
To MFS and MFS Related Entities of MFS Emerging Markets Equity Portfolio* | | | 0 | | | | 0 | | | | 0 | | | | 0 | | | | 3,790 | | | | 5,390 | |
To MFS and MFS Related Entities of MFS Global Governments Portfolio* | | | 0 | | | | 0 | | | | 0 | | | | 0 | | | | 3,790 | | | | 5,390 | |
To MFS and MFS Related Entities of MFS Global Growth Portfolio* | | | 0 | | | | 0 | | | | 0 | | | | 0 | | | | 3,790 | | | | 5,390 | |
To MFS and MFS Related Entities of MFS Global Research Portfolio* | | | 0 | | | | 0 | | | | 0 | | | | 0 | | | | 3,790 | | | | 5,390 | |
To MFS and MFS Related Entities of MFS Global Tactical Allocation Portfolio* | | | 0 | | | | 0 | | | | 0 | | | | 0 | | | | 3,790 | | | | 5,390 | |
To MFS and MFS Related Entities of MFS Government Securities Portfolio* | | | 0 | | | | 0 | | | | 0 | | | | 0 | | | | 3,790 | | | | 5,390 | |
To MFS and MFS Related Entities of MFS High Yield Portfolio* | | | 0 | | | | 0 | | | | 0 | | | | 0 | | | | 3,790 | | | | 5,390 | |
To MFS and MFS Related Entities of MFS International Growth Portfolio* | | | 0 | | | | 0 | | | | 0 | | | | 0 | | | | 3,790 | | | | 5,390 | |
To MFS and MFS Related Entities of MFS International Intrinsic Value Portfolio* | | | 0 | | | | 0 | | | | 0 | | | | 0 | | | | 3,790 | | | | 5,390 | |
To MFS and MFS Related Entities of MFS Massachusetts Investors Growth Stock Portfolio* | | | 0 | | | | 0 | | | | 0 | | | | 0 | | | | 3,790 | | | | 5,390 | |
To MFS and MFS Related Entities of MFS Research International Portfolio* | | | 0 | | | | 0 | | | | 0 | | | | 0 | | | | 3,790 | | | | 5,390 | |
To MFS and MFS Related Entities of MFS Strategic Income Portfolio* | | | 0 | | | | 0 | | | | 0 | | | | 0 | | | | 3,790 | | | | 5,390 | |
To MFS and MFS Related Entities of MFS Technology Portfolio* | | | 0 | | | | 0 | | | | 0 | | | | 0 | | | | 3,790 | | | | 5,390 | |
To MFS and MFS Related Entities of MFS U.S. Government Money Market Portfolio* | | | 0 | | | | 0 | | | | 0 | | | | 0 | | | | 3,790 | | | | 5,390 | |
| | | | | | | | |
| | | Aggregate fees for non-audit
services: | |
| | | 2019 | | | 2018 | |
Fees billed by Deloitte: | | | | | | | | |
To MFS Blended Research Core Equity Portfolio, MFS and MFS Related Entities# | | | 361,294 | | | | 12,779 | |
To MFS Core Equity Portfolio, MFS and MFS Related Entities# | | | 361,294 | | | | 12,779 | |
To MFS Corporate Bond Portfolio, MFS and MFS Related Entities# | | | 361,294 | | | | 12,779 | |
To MFS Emerging Markets Equity Portfolio, MFS and MFS Related Entities# | | | 361,294 | | | | 12,779 | |
To MFS Global Governments Portfolio, MFS and MFS Related Entities# | | | 361,294 | | | | 12,779 | |
To MFS Global Growth Portfolio MFS and MFS Related Entities# | | | 361,294 | | | | 12,779 | |
To MFS Global Research Portfolio, MFS and MFS Related Entities# | | | 361,294 | | | | 12,779 | |
To MFS Global Tactical Allocation Portfolio, MFS and MFS Related Entities# | | | 361,294 | | | | 12,779 | |
To MFS Government Securities Portfolio, MFS and MFS Related Entities# | | | 361,294 | | | | 12,779 | |
To MFS High Yield Portfolio, MFS and MFS Related Entities# | | | 361,294 | | | | 12,779 | |
To MFS International Growth Portfolio, MFS and MFS Related Entities# | | | 361,294 | | | | 12,779 | |
To MFS International Intrinsic Value Portfolio, MFS and MFS Related Entities# | | | 361,294 | | | | 12,779 | |
To MFS Massachusetts Investors Growth Stock Portfolio, MFS and MFS Related Entities# | | | 361,294 | | | | 12,779 | |
To MFS Research International Portfolio, MFS and MFS Related Entities# | | | 361,294 | | | | 12,779 | |
To MFS Strategic Income Portfolio, MFS and MFS Related Entities# | | | 361,294 | | | | 12,779 | |
To MFS Technology Portfolio, MFS and MFS Related Entities# | | | 361,294 | | | | 12,779 | |
To MFS U.S. Government Money Market Portfolio, MFS and MFS Related Entities# | | | 361,294 | | | | 12,779 | |
| * | This amount reflects the fees billed to MFS and MFS Related Entities fornon-audit services relating directly to the operations and financial reporting of the Fund (portions of which services also related to the operations and financial reporting of other funds within the MFS Funds complex). |
| # | This amount reflects the aggregate fees billed by Deloitte fornon-audit services rendered to the Fund and fornon-audit services rendered to MFS and the MFS Related Entities. |
| 1 | The fees included under “Audit-Related Fees” are fees related to assurance and related services that are reasonably related to the performance of the audit or review of financial statements, but not reported under ‘‘Audit Fees,’’ including accounting consultations, agreed-upon procedure reports, attestation reports, comfort letters and internal control reviews. |
| 2 | The fees included under “Tax Fees” are fees associated with tax compliance, tax advice and tax planning, including services relating to the filing or amendment of federal, state or local income tax returns, regulated investment company qualification reviews and tax distribution and analysis. |
| 3 | The fees included under “All Other Fees” are fees for products and services provided by Deloitte other than those reported under “Audit Fees,” “Audit-Related Fees” and “Tax Fees”. |
Item 4(e)(1):
Set forth below are the policies and procedures established by the Audit Committee of the Board of Trustees relating to thepre-approval of audit andnon-audit related services:
To the extent required by applicable law,pre-approval by the Audit Committee of the Board is needed for all audit and permissiblenon-audit services rendered to the Fund and all permissiblenon-audit services rendered to MFS or MFS Related Entities if the services relate directly to the operations and financial reporting of the Registrant.Pre-approval is currently on anengagement-by-engagement basis. In the eventpre-approval of such services is necessary between regular meetings of the Audit Committee and it is not practical to wait to seekpre-approval at the next regular meeting of the Audit Committee,pre-approval of such services may be referred to the Chair of the Audit Committee for approval; provided that the Chair may notpre-approve any individual engagement for such services exceeding $50,000 or multiple engagements for such services in the aggregate exceeding $100,000 between such regular meetings of the Audit Committee. Any engagementpre-approved by the Chair between regular meetings of the Audit Committee shall be presented for ratification by the entire Audit Committee at its next regularly scheduled meeting.
Item 4(e)(2):
None, or 0%, of the services relating to the Audit-Related Fees, Tax Fees and All Other Fees paid by the Fund and MFS and MFS Related Entities relating directly to the operations and financial reporting of the Registrant disclosed above were approved by the audit committee pursuant to paragraphs (c)(7)(i)(C) of Rule2-01 of RegulationS-X (which permits audit committee approval after the start of the engagement with respect to services other than audit, review or attest services, if certain conditions are satisfied).
Item 4(f):
Not applicable.
Item 4(h):
The Registrant’s Audit Committee has considered whether the provision by a Registrant’s independent registered public accounting firm ofnon-audit services to MFS and MFS Related Entities that were notpre-approved by the Committee (because such services were provided prior to the effectiveness of SEC rules requiringpre-approval or because such services did not relate directly to the operations and financial reporting of the Registrant) was compatible with maintaining the independence of the independent registered public accounting firm as the Registrant’s principal auditors.
| ITEM 5. | AUDIT COMMITTEE OF LISTED REGISTRANTS. |
Not applicable to the Registrant.
| ITEM 6. | SCHEDULE OF INVESTMENTS |
A schedule of investments of each series of the Registrant is included as part of the report to shareholders of such series under Item 1 of this FormN-CSR.
| ITEM 7. | DISCLOSURE OF PROXY VOTING POLICIES AND PROCEDURES FORCLOSED-END MANAGEMENT INVESTMENT COMPANIES. |
Not applicable to the Registrant.
| ITEM 8. | PORTFOLIO MANAGERS OFCLOSED-END MANAGEMENT INVESTMENT COMPANIES. |
Not applicable to the Registrant.
| ITEM 9. | PURCHASES OF EQUITY SECURITIES BYCLOSED-END MANAGEMENT INVESTMENT COMPANY AND AFFILIATED PURCHASERS. |
Not applicable to the Registrant.
| ITEM 10. | SUBMISSION OF MATTERS TO A VOTE OF SECURITY HOLDERS. |
There were no material changes to the procedures by which shareholders may send recommendations to the Board for nominees to the Registrant’s Board since the Registrant last provided disclosure as to such procedures in response to the requirements of Item 407 (c)(2)(iv) of RegulationS-K or this Item.
| ITEM 11. | CONTROLS AND PROCEDURES. |
| (a) | Based upon their evaluation of the effectiveness of the registrant’s disclosure controls and procedures (as defined in Rule30a-3(c) under the Investment Company Act of 1940 (the “Act”)) as conducted within 90 days of the filing date of this report on FormN-CSR, the registrant’s principal financial officer and principal executive officer have concluded that those disclosure controls and procedures provide reasonable assurance that the material information required to be disclosed by the registrant on this report is recorded, processed, summarized and reported within the time periods specified in the Securities and Exchange Commission’s rules and forms. |
| (b) | There were no changes in the registrant’s internal controls over financial reporting (as defined in Rule30a-3(d) under the Act) that occurred during the period covered by the report that have materially affected, or are reasonably likely to materially affect, the registrant’s internal control over financial reporting. |
| ITEM 12. | DISCLOSURE OF SECURITIES LENDING ACTIVITIES FORCLOSED-END MANAGEMENT INVESTMENT COMPANIES. |
Not applicable to the Registrant.
| (a) (1) | Any code of ethics, or amendment thereto, that is the subject of the disclosure required by Item 2, to the extent that the registrant intends to satisfy the Item 2 requirements through filing of an exhibit: Attached hereto asEX-99.COE. |
| | (2) | A separate certification for each principal executive officer and principal financial officer of the registrant as required by Rule30a-2(a) under the Act (17 CFR270.30a-2): Attached hereto asEX-99.302CERT. |
| | (3) | Any written solicitation to purchase securities under Rule23c-1 under the Act (17 CFR270.23c-1) sent or given during the period covered by the report by or on behalf of the registrant to 10 or more persons. Not applicable. |
| | (4) | Change in the registrant’s independent public accountant. Not applicable. |
| (b) | If the report is filed under Section 13(a) or 15(d) of the Exchange Act, provide the certifications required by Rule30a-2(b) under the Act (17 CFR270.30a-2(b)), Rule13a-14(b) or Rule15d-14(b) under the Exchange Act (17 CFR240.13a-14(b) or240.15d-14(b)) and Section 1350 of Chapter 63 of Title 18 of the United States Code (18 U.S.C. 1350) as an exhibit. A certification furnished pursuant to this paragraph will not be deemed “filed” for the purposes of Section 18 of the Exchange Act (15 U.S.C. 78r), or otherwise subject to the liability of that section. Such certification will not be deemed to be incorporated by reference into any filing under the Securities Act of 1933 or the Exchange Act, except to the extent that the registrant specifically incorporates it by reference. Attached hereto asEX-99.906CERT. |
Notice
A copy of the Amended and Restated Declaration of Trust, as amended, of the Registrant is on file with the Secretary of State of The Commonwealth of Massachusetts and notice is hereby given that this instrument is executed on behalf of the Registrant by an officer of the Registrant as an officer and not individually and the obligations of or arising out of this instrument are not binding upon any of the Trustees or shareholders individually, but are binding only upon the assets and property of the respective constituent series of the Registrant.
SIGNATURES
Pursuant to the requirements of the Securities Exchange Act of 1934 and the Investment Company Act of 1940, the registrant has duly caused this report to be signed on its behalf by the undersigned, thereunto duly authorized.
(Registrant) MFS VARIABLE INSURANCE TRUST II
| | |
| By (Signature and Title)* | | DAVID L. DILORENZO |
| | David L. DiLorenzo, President |
Date: February 14, 2020
Pursuant to the requirements of the Securities Exchange Act of 1934 and the Investment Company Act of 1940, this report has been signed below by the following persons on behalf of the registrant and in the capacities and on the dates indicated.
| | |
| By (Signature and Title)* | | DAVID L. DILORENZO |
| | David L. DiLorenzo, President (Principal Executive Officer) |
Date: February 14, 2020
| | |
| By (Signature and Title)* | | JAMES O. YOST |
| | James O. Yost, Treasurer (Principal Financial Officer and Accounting Officer) |
Date: February 14, 2020
| * | Print name and title of each signing officer under his or her signature. |