UNITED STATES
SECURITIES AND EXCHANGE COMMISSION
Washington, D.C. 20549
FORM N-CSR
Certified Shareholder Report of
Registered Management Investment Companies
Investment Company Act File Number: 811-03735
The New Economy Fund
(Exact Name of Registrant as Specified in Charter)
333 South Hope Street
Los Angeles, California 90071
(Address of Principal Executive Offices)
Registrant's telephone number, including area code: (213) 486-9200
Date of fiscal year end: November 30
Date of reporting period: May 31, 2014
Michael W. Stockton
The New Economy Fund
333 South Hope Street
Los Angeles, California 90071
(Name and Address of Agent for Service)
Copies to:
Kathryn A. Sanders
O’Melveny & Myers LLP
400 South Hope Street, 10th Floor
Los Angeles, California 90071
(Counsel for the Registrant)
ITEM 1 – Reports to Stockholders

 | | The New Economy Fund® |
| | Semi-annual report
for the six months ended
May 31, 2014 |
The New Economy Fund seeks long-term growth of capital by investing in securities of companies that can benefit from innovation, exploit new technologies or provide products and services that meet the demands of an evolving global economy.
This fund is one of more than 40 offered by one of the nation’s largest mutual fund families, American Funds, from Capital Group. For more than 80 years, Capital has invested with a long-term focus based on thorough research and attention to risk.
Fund results shown in this report, unless otherwise indicated, are for Class A shares at net asset value. If a sales charge (maximum 5.75%) had been deducted, the results would have been lower. Results are for past periods and are not predictive of results for future periods. Current and future results may be lower or higher than those shown. Share prices and returns will vary, so investors may lose money. Investing for short periods makes losses more likely. Investments are not FDIC-insured, nor are they deposits of or guaranteed by a bank or any other entity, so they may lose value. For current information and month-end results, visit americanfunds.com.
Here are the average annual total returns on a $1,000 investment with all distributions reinvested for periods ended June 30, 2014 (the most recent calendar quarter-end):
| Class A shares | | 1 year | | | 5 years | | | 10 years | |
| | | | | | | |
| Reflecting 5.75% maximum sales charge | | | 22.79% | | | | 17.88% | | | | 9.39% | |
For other share class results, visit americanfunds.com and americanfundsretirement.com.
The total annual fund operating expense ratio was 0.83% for Class A shares as of the prospectus dated February 1, 2014.
Investment results assume all distributions are reinvested and reflect applicable fees and expenses. When applicable, investment results reflect fee waivers, without which results would have been lower. Visit americanfunds.com for more information.
Investing outside the United States may be subject to risks, such as currency fluctuations, periods of illiquidity and price volatility. These risks may be heightened in connection with investments in developing countries. Global diversification can help reduce these risks. Refer to the fund prospectus and the Risk Factors section of this report for more information on these and other risks associated with investing in the fund.

Fellow investors:
Continuing recovery in most major economies and supportive monetary policy helped equities post solid gains for the period. The New Economy Fund increased 5.58% for the six months ended May 31, 2014, compared with the 7.61% rise of the unmanaged Standard & Poor’s 500 Composite Index, a broad measure of the U.S. stock market, and the 6.63% return of the Global Service and Information Index,† an unmanaged index that tracks companies in the services and information sectors around the world.
The fund’s return also compares with the 6.24% gain of the Lipper Growth Funds Index, which measures a number of U.S. growth funds, and the 5.00% return of the Lipper International Funds Index, which measures funds invested in securities whose primary trading markets are outside the U.S.
Results at a glance
For periods ended May 31, 2014, with all distributions reinvested
| | | Cumulative total returns | | Average annual total returns |
| | | | | | | | | | | (since 12/1/83) |
| | | 6 months | | 1 year | | 5 years | | 10 years | | Lifetime |
| | | | | | | | | | | |
| The New Economy Fund (Class A shares) | | | 5.58 | % | | | 25.82 | % | | | 19.18 | % | | | 9.98 | % | | | 11.54 | % |
| Standard & Poor’s 500 Composite Index* | | | 7.61 | | | | 20.42 | | | | 18.38 | | | | 7.76 | | | | 11.05 | |
| Global Service and Information Index*† | | | 6.63 | | | | 19.61 | | | | 16.34 | | | | 6.92 | | | | N/A | |
| Lipper Growth Funds Index | | | 6.24 | | | | 21.76 | | | | 17.96 | | | | 7.16 | | | | 9.31 | |
| Lipper International Funds Index | | | 5.00 | | | | 17.27 | | | | 11.45 | | | | 7.71 | | | | N/A | |
| * | This market index is unmanaged and, therefore, has no expenses. Investors cannot invest directly in an index. |
| † | The index is compiled by Capital Research and Management Company, the investment adviser to the fund. |
For the 10-year period ending May 31, 2014, The New Economy Fund had an average annual total return of 9.98%, which exceeded the 7.76% return of the S&P 500, the 6.92% return of the Global Service and Information Index, the 7.16% return of the Lipper Growth Funds Index and the 7.71% return of the Lipper International Funds Index. We believe the five-year, 10-year and lifetime returns are important for investors to consider as they are most reflective of our long-term approach and philosophy (see the table on page 1).
The market in review
The U.S. stock market continued to rise during the period. Despite a few pullbacks during the six months, particularly in some stocks that had done well in 2013, the stock market nonetheless continued to gain ground. U.S. market valuations are reasonable, given history and the current level of interest rates, though they are clearly subject to volatility as we saw this period.
The U.S. economy continues to recover, albeit at a slower pace than past cycles. The Federal Reserve has reaffirmed its commitment to keeping interest rates at historically low levels. Europe’s recovery is lagging the U.S. recovery, but its economy as a whole is improving. Some countries in Europe have strengthened more rapidly than others.
| Where the fund’s assets are invested | | (percent of net assets) |
| | | | | |
| | | As of 5/31/14 | | As of 11/30/13 |
| | | | | |
| United States | | | 54.3 | % | | | 56.3 | % |
| | | | | | | | | |
| Europe | | | | | | | | |
| Euro zone* | | | 8.4 | | | | 7.6 | |
| United Kingdom | | | 6.5 | | | | 5.0 | |
| Other Europe | | | 2.2 | | | | 2.2 | |
| | | | 17.1 | | | | 14.8 | |
| | | | | | | | | |
| Asia & Pacific Basin | | | | | | | | |
| Hong Kong | | | 4.8 | | | | 7.9 | |
| China | | | 3.4 | | | | 3.5 | |
| Japan | | | 2.3 | | | | 2.3 | |
| South Korea | | | 1.6 | | | | 1.9 | |
| Other Asia & Pacific Basin | | | 3.2 | | | | 3.5 | |
| | | | 15.3 | | | | 19.1 | |
| | | | | | | | | |
| Other (including Latin America) | | | 0.9 | | | | 0.6 | |
| | | | | | | | | |
| Short-term securities & other assets less liabilities | | | 12.4 | | | | 9.2 | |
| | | | 100.0 | % | | | 100.0 | % |
| * | Countries using the euro as a common currency: Austria, Belgium, Cyprus, Estonia, Finland, France, Germany, Greece, Ireland, Italy, Latvia, Luxembourg, Malta, the Netherlands, Portugal, Slovakia, Slovenia and Spain. |
China is experiencing slowing growth, but so far is managing this transition effectively. Emerging markets continue to be volatile amid ongoing geopolitical issues swirling in different countries, principally Ukraine, Thailand and Iraq.
The fund’s portfolio in review
During the period, many of the companies we hold continued to grow and expand. Some segments of the market experienced a fair amount of volatility, particularly biotechnology and internet-related companies. Despite this, Netflix, the fund’s largest holding, gained 14.22% and second-largest holding Gilead Sciences rose 8.56%.
Our top-10 holdings within the health care sector also had solid results. Alexion Pharmaceuticals, an American biopharmaceutical company; Grifols, a Spanish multinational pharmaceutical and chemical company; and Hologic, a developer, manufacturer and supplier of diagnostic and medical imaging systems related to women’s health, all realized positive returns.
During the period, some of the fund’s holdings did not keep up with the broader market. Samsung Electronics (+0.19%) and Amazon (–20.60%) were two examples.
Looking ahead
The market has risen considerably in the past five-plus years, since the 2009 lows. Given the length of the market’s expansion, it is not too surprising that valuations in most sectors have risen appreciably. Usually at this time in a cycle, there tends to be an increase in volatility, which is something we are watching and preparing for.
We live in an increasingly short-term oriented world, yet we continue to focus on the same approach that has served our shareholders well in the long term. That is, we concentrate on deep and thorough global research, fundamental analysis and a long-term approach to our investments.
We thank you for your investment in The New Economy Fund.
Sincerely,
 |  |
| Timothy D. Armour | Claudia P. Huntington |
| Vice Chairman of the Board | President |
July 15, 2014
For current information about the fund, visit americanfunds.com.
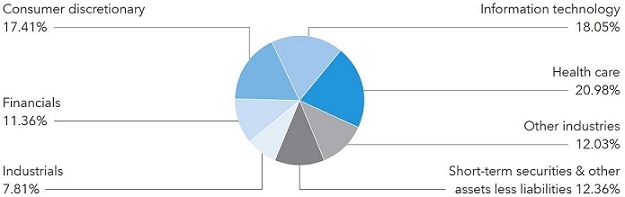
| Summary investment portfolio May 31, 2014 | unaudited |
| Industry sector diversification | Percent of net assets |
| Country diversification | | Percent of
net assets |
| United States | | | 54.3 | % |
| Euro zone* | | | 8.4 | |
| United Kingdom | | | 6.5 | |
| Hong Kong | | | 4.8 | |
| China | | | 3.4 | |
| Japan | | | 2.3 | |
| South Korea | | | 1.6 | |
| Russian Federation | | | 0.8 | |
| Australia | | | 0.7 | |
| Philippines | | | 0.6 | |
| Other countries | | | 4.2 | |
| Short-term securities & other assets less liabilities | | | 12.4 | |
| * | Countries using the euro as a common currency; those represented in the fund’s portfolio are Belgium, France, Germany, Greece, Ireland, the Netherlands, Portugal and Spain. |
| Common stocks 87.60% | | Shares | | | Value
(000) | | | Percent of
net assets | |
| Health care 20.98% | | | | | | | | | | | | |
| Gilead Sciences, Inc.1 | | | 4,246,563 | | | $ | 344,863 | | | | 2.45 | % |
| Thermo Fisher Scientific Inc. | | | 2,446,000 | | | | 285,962 | | | | 2.03 | |
| Alexion Pharmaceuticals, Inc.1 | | | 1,649,900 | | | | 274,411 | | | | 1.95 | |
| Grifols, SA, Class A, non-registered shares | | | 1,601,000 | | | | 86,750 | | | | | |
| Grifols, SA, Class B, non-registered shares | | | 1,318,175 | | | | 54,625 | | | | 1.31 | |
| Grifols, SA, Class B (ADR) | | | 1,040,085 | | | | 43,288 | | | | | |
| Hologic, Inc.1 | | | 7,121,450 | | | | 174,048 | | | | 1.24 | |
| Amgen Inc. | | | 1,199,995 | | | | 139,187 | | | | .99 | |
| Stryker Corp. | | | 1,507,750 | | | | 127,390 | | | | .90 | |
| McKesson Corp. | | | 600,000 | | | | 113,784 | | | | .81 | |
| Biogen Idec Inc.1 | | | 354,150 | | | | 113,105 | | | | .80 | |
| | | Shares | | | Value
(000) | | | Percent of
net assets | |
| Illumina, Inc.1 | | | 643,776 | | | $ | 101,878 | | | | .72 | % |
| NuVasive, Inc.1,2 | | | 2,917,700 | | | | 97,276 | | | | .69 | |
| Myriad Genetics, Inc.1 | | | 2,922,695 | | | | 96,917 | | | | .69 | |
| BioMarin Pharmaceutical Inc.1 | | | 1,596,050 | | | | 92,507 | | | | .66 | |
| Mesoblast Ltd.1,2 | | | 20,210,000 | | | | 91,033 | | | | .65 | |
| Synageva BioPharma Corp.1 | | | 998,587 | | | | 81,035 | | | | .57 | |
| Other securities | | | | | | | 636,250 | | | | 4.52 | |
| | | | | | | | 2,954,309 | | | | 20.98 | |
| | | | | | | | | | | | | |
| Information technology 18.05% | | | | | | | | | | | | |
| Google Inc., Class A1 | | | 262,225 | | | | 149,901 | | | | | |
| Google Inc., Class C1 | | | 262,225 | | | | 147,103 | | | | 2.11 | |
| Samsung Electronics Co. Ltd. | | | 163,047 | | | | 230,618 | | | | 1.64 | |
| Baidu, Inc., Class A (ADR)1 | | | 886,400 | | | | 147,142 | | | | 1.04 | |
| Intuit Inc. | | | 1,717,200 | | | | 136,157 | | | | .97 | |
| Accenture PLC, Class A | | | 1,638,300 | | | | 133,440 | | | | .95 | |
| Texas Instruments Inc. | | | 2,555,000 | | | | 120,034 | | | | .85 | |
| AAC Technologies Holdings Inc. | | | 17,712,000 | | | | 104,518 | | | | .74 | |
| Oracle Corp. | | | 2,110,500 | | | | 88,683 | | | | .63 | |
| Other securities | | | | | | | 1,283,610 | | | | 9.12 | |
| | | | | | | | 2,541,206 | | | | 18.05 | |
| | | | | | | | | | | | | |
| Consumer discretionary 17.41% | | | | | | | | | | | | |
| Netflix, Inc.1 | | | 934,800 | | | | 390,587 | | | | 2.77 | |
| Galaxy Entertainment Group Ltd. | | | 28,120,000 | | | | 224,693 | | | | 1.60 | |
| Daily Mail and General Trust PLC, Class A, nonvoting | | | 10,236,701 | | | | 149,367 | | | | 1.06 | |
| lululemon athletica inc.1 | | | 3,299,197 | | | | 147,243 | | | | 1.05 | |
| MGM China Holdings Ltd. | | | 36,772,000 | | | | 128,060 | | | | .91 | |
| Amazon.com, Inc.1 | | | 403,400 | | | | 126,083 | | | | .89 | |
| Kingfisher PLC | | | 15,865,000 | | | | 104,244 | | | | .74 | |
| ProSiebenSat.1 Media AG | | | 2,071,000 | | | | 94,249 | | | | .67 | |
| DIRECTV1 | | | 1,024,600 | | | | 84,468 | | | | .60 | |
| Melco Crown Entertainment Ltd. (ADR) | | | 2,448,900 | | | | 84,414 | | | | .60 | |
| Other securities | | | | | | | 917,732 | | | | 6.52 | |
| | | | | | | | 2,451,140 | | | | 17.41 | |
| | | | | | | | | | | | | |
| Financials 11.36% | | | | | | | | | | | | |
| AIA Group Ltd. | | | 27,722,200 | | | | 138,916 | | | | .99 | |
| Crown Castle International Corp. | | | 1,389,400 | | | | 106,609 | | | | .76 | |
| SVB Financial Group1 | | | 882,800 | | | | 93,091 | | | | .66 | |
| Endurance Specialty Holdings Ltd. | | | 1,526,000 | | | | 78,925 | | | | .56 | |
| Other securities | | | | | | | 1,181,944 | | | | 8.39 | |
| | | | | | | | 1,599,485 | | | | 11.36 | |
| | | | | | | | | | | | | |
| Industrials 7.81% | | | | | | | | | | | | |
| Nielsen NV | | | 3,762,000 | | | | 181,554 | | | | 1.29 | |
| Ryanair Holdings PLC (ADR)1 | | | 2,274,700 | | | | 129,339 | | | | .92 | |
| CSX Corp. | | | 3,592,222 | | | | 105,611 | | | | .75 | |
| Union Pacific Corp. | | | 437,977 | | | | 87,276 | | | | .62 | |
| Other securities | | | | | | | 595,433 | | | | 4.23 | |
| | | | | | | | 1,099,213 | | | | 7.81 | |
| Common stocks (continued) | | Shares | | | Value
(000) | | | Percent of
net assets | |
| Telecommunication services 3.39% | | | | | | | | | | | | |
| SoftBank Corp. | | | 1,842,700 | | | $ | 132,953 | | | | .94 | % |
| Verizon Communications Inc. | | | 2,242,141 | | | | 112,017 | | | | .80 | |
| Other securities | | | | | | | 231,649 | | | | 1.65 | |
| | | | | | | | 476,619 | | | | 3.39 | |
| | | | | | | | | | | | | |
| Energy 1.83% | | | | | | | | | | | | |
| Schlumberger Ltd. | | | 1,122,400 | | | | 116,775 | | | | .83 | |
| Other securities | | | | | | | 140,839 | | | | 1.00 | |
| | | | | | | | 257,614 | | | | 1.83 | |
| | | | | | | | | | | | | |
| Consumer staples 1.54% | | | | | | | | | | | | |
| Costco Wholesale Corp. | | | 698,000 | | | | 80,982 | | | | .57 | |
| Other securities | | | | | | | 135,947 | | | | .97 | |
| | | | | | | | 216,929 | | | | 1.54 | |
| | | | | | | | | | | | | |
| Materials 0.36% | | | | | | | | | | | | |
| Other securities | | | | | | | 50,011 | | | | .36 | |
| | | | | | | | | | | | | |
| Miscellaneous 4.87% | | | | | | | | | | | | |
| Other common stocks in initial period of acquisition | | | | | | | 685,931 | | | | 4.87 | |
| | | | | | | | | | | | | |
| Total common stocks (cost: $8,232,028,000) | | | | | | | 12,332,457 | | | | 87.60 | |
| | | | | | | | | | | | | |
| Rights & warrants 0.04% | | | | | | | | | | | | |
| Miscellaneous 0.04% | | | | | | | | | | | | |
| Other rights & warrants in initial period of acquisition | | | | | | | 5,845 | | | | .04 | |
| | | | | | | | | | | | | |
| Total rights & warrants (cost: $0) | | | | | | | 5,845 | �� | | | .04 | |
| | | | | | | | | | | | | |
| Short-term securities 12.71% | | | Principal amount
(000) | | | | | | | | | |
| Federal Home Loan Bank 0.05%–0.135% due 6/6–10/1/2014 | | $ | 398,400 | | | | 398,372 | | | | 2.83 | |
| Freddie Mac 0.055%–0.15% due 6/10–10/9/2014 | | | 203,700 | | | | 203,679 | | | | 1.45 | |
| Coca-Cola Co. 0.12%–0.20% due 7/22–12/1/20143 | | | 191,500 | | | | 191,420 | | | | 1.36 | |
| IBM Corp. 0.06%–0.09% due 6/26–8/20/20143 | | | 147,900 | | | | 147,889 | | | | 1.05 | |
| Fannie Mae 0.07%–0.13% due 7/21–11/12/2014 | | | 107,400 | | | | 107,385 | | | | .76 | |
| Procter & Gamble Co. 0.08%–0.10% due 6/3–8/14/20143 | | | 97,000 | | | | 96,993 | | | | .69 | |
| Google Inc. 0.11% due 8/7/20143 | | | 32,400 | | | | 32,395 | | | | .23 | |
| Other securities | | | | | | | 611,700 | | | | 4.34 | |
| | | | | | | | | | | | | |
| Total short-term securities (cost: $1,789,771,000) | | | | | | | 1,789,833 | | | | 12.71 | |
| Total investment securities (cost: $10,021,799,000) | | | | | | | 14,128,135 | | | | 100.35 | |
| Other assets less liabilities | | | | | | | (49,889 | ) | | | (.35 | ) |
| | | | | | | | | | | | | |
| Net assets | | | | | | $ | 14,078,246 | | | | 100.00 | % |
This summary investment portfolio is designed to streamline the report and help investors better focus on the fund’s principal holdings. See the inside back cover for details on how to obtain a complete schedule of portfolio holdings.
As permitted by U.S. Securities and Exchange Commission regulations, “Miscellaneous” securities include holdings in their first year of acquisition that have not previously been publicly disclosed.
“Other securities” includes all issues that are not disclosed separately in the summary investment portfolio, including securities which were valued under fair value procedures adopted by authority of the board of trustees. The total value of securities which were valued under fair value procedures was $6,606,000, which represented .05% of the net assets of the fund. All of these securities (with an aggregate value of $6,606,000, an aggregate cost of $31,575,000, and which represented .05% of the net assets of the fund) were acquired from 9/6/2000 to 4/18/2002 through private placement transactions exempt from registration under the Securities Act of 1933, which may subject them to legal or contractual restrictions on resale.
Investments in affiliates
A company is an affiliate of the fund under the Investment Company Act of 1940 if the fund’s holdings in that company represent 5% or more of the outstanding voting shares. The value of the fund’s affiliated-company holdings is either shown in the summary investment portfolio or included in the value of “Other securities” under the respective industry sectors. Further details on such holdings and related transactions during the six months ended May 31, 2014, appear below.
| | | Beginning
shares | | | Additions | | | Reductions | | | Ending
shares | | | Dividend
income
(000) | | | Value of
affiliates at
5/31/2014
(000) | |
| NuVasive, Inc.1 | | | 2,896,186 | | | | 100,000 | | | | 78,486 | | | | 2,917,700 | | | $ | — | | | $ | 97,276 | |
| Mesoblast Ltd.1 | | | 14,210,000 | | | | 6,000,000 | | | | — | | | | 20,210,000 | | | | — | | | | 91,033 | |
| Avanti Communications Group PLC1 | | | 6,933,372 | | | | — | | | | — | | | | 6,933,372 | | | | — | | | | 33,035 | |
| Exelixis, Inc.4 | | | 11,930,900 | | | | 692,000 | | | | 12,622,900 | | | | — | | | | — | | | | — | |
| | | | | | | | | | | | | | | | | | | $ | — | | | $ | 221,344 | |
The following footnotes apply to either the individual securities noted or one or more of the securities aggregated and listed as a single line item.
| 1 | Security did not produce income during the last 12 months. |
| 2 | Represents an affiliated company as defined under the Investment Company Act of 1940. |
| 3 | Acquired in a transaction exempt from registration under section 4(2) of the Securities Act of 1933. May be resold in the U.S. in transactions exempt from registration, normally to qualified institutional buyers. The total value of all such securities, including those in “Other securities,” was $944,504,000, which represented 6.71% of the net assets of the fund. |
| 4 | Unaffiliated issuer at 5/31/2014. |
Key to abbreviation
ADR = American Depositary Receipts
See Notes to Financial Statements
Financial statements
| Statement of assets and liabilities | | unaudited |
| at May 31, 2014 | | (dollars in thousands) |
| | | |
| Assets: | | | | | | | | |
| Investment securities, at value: | | | | | | | | |
| Unaffiliated issuers (cost: $9,788,096) | | $ | 13,906,791 | | | | | |
| Affiliated issuers (cost: $233,703) | | | 221,344 | | | $ | 14,128,135 | |
| Cash | | | | | | | 120 | |
| Receivables for: | | | | | | | | |
| Sales of investments | | | 22,961 | | | | | |
| Sales of fund’s shares | | | 23,713 | | | | | |
| Dividends and interest | | | 17,789 | | | | 64,463 | |
| | | | | | | | 14,192,718 | |
| Liabilities: | | | | | | | | |
| Payables for: | | | | | | | | |
| Purchases of investments | | | 86,978 | | | | | |
| Repurchases of fund’s shares | | | 14,182 | | | | | |
| Investment advisory services | | | 4,547 | | | | | |
| Services provided by related parties | | | 6,454 | | | | | |
| Trustees’ deferred compensation | | | 2,155 | | | | | |
| Other | | | 156 | | | | 114,472 | |
| Net assets at May 31, 2014 | | | | | | $ | 14,078,246 | |
| | | | | | | | | |
| Net assets consist of: | | | | | | | | |
| Capital paid in on shares of beneficial interest | | | | | | $ | 9,115,966 | |
| Undistributed net investment income | | | | | | | 46,505 | |
| Undistributed net realized gain | | | | | | | 809,572 | |
| Net unrealized appreciation | | | | | | | 4,106,203 | |
| Net assets at May 31, 2014 | | | | | | $ | 14,078,246 | |
(dollars and shares in thousands, except per-share amounts)
Shares of beneficial interest issued and outstanding (no stated par value) —
unlimited shares authorized (360,439 total shares outstanding)
| | | Net assets | | | Shares
outstanding | | | Net asset value
per share | |
| Class A | | $ | 9,743,710 | | | | 248,442 | | | $ | 39.22 | |
| Class B | | | 46,375 | | | | 1,250 | | | | 37.09 | |
| Class C | | | 444,768 | | | | 12,146 | | | | 36.62 | |
| Class F-1 | | | 480,038 | | | | 12,231 | | | | 39.25 | |
| Class F-2 | | | 532,494 | | | | 13,579 | | | | 39.22 | |
| Class 529-A | | | 371,802 | | | | 9,551 | | | | 38.93 | |
| Class 529-B | | | 7,221 | | | | 194 | | | | 37.15 | |
| Class 529-C | | | 106,095 | | | | 2,860 | | | | 37.09 | |
| Class 529-E | | | 19,859 | | | | 516 | | | | 38.51 | |
| Class 529-F-1 | | | 26,457 | | | | 680 | | | | 38.90 | |
| Class R-1 | | | 42,982 | | | | 1,146 | | | | 37.50 | |
| Class R-2 | | | 182,466 | | | | 4,843 | | | | 37.68 | |
| Class R-3 | | | 315,854 | | | | 8,190 | | | | 38.57 | |
| Class R-4 | | | 339,644 | | | | 8,722 | | | | 38.94 | |
| Class R-5 | | | 144,941 | | | | 3,681 | | | | 39.37 | |
| Class R-6 | | | 1,273,540 | | | | 32,408 | | | | 39.30 | |
See Notes to Financial Statements
| Statement of operations | | unaudited |
| for the six months ended May 31, 2014 | | (dollars in thousands) |
| | | |
| Investment income: | | | | | | | | |
| Income: | | | | | | | | |
| Dividends (net of non-U.S. taxes of $2,032) | | $ | 103,502 | | | | | |
| Interest | | | 877 | | | $ | 104,379 | |
| Fees and expenses*: | | | | | | | | |
| Investment advisory services | | | 26,009 | | | | | |
| Distribution services | | | 16,648 | | | | | |
| Transfer agent services | | | 8,262 | | | | | |
| Administrative services | | | 1,441 | | | | | |
| Reports to shareholders | | | 420 | | | | | |
| Registration statement and prospectus | | | 259 | | | | | |
| Trustees’ compensation | | | 327 | | | | | |
| Auditing and legal | | | 48 | | | | | |
| Custodian | | | 583 | | | | | |
| Other | | | 304 | | | | 54,301 | |
| Net investment income | | | | | | | 50,078 | |
| | | | | | | | | |
| Net realized gain and unrealized depreciation on investments and currency: | | | | | | | | |
| Net realized gain on: | | | | | | | | |
| Investments (net of non-U.S. taxes of $1,392; also includes $14,347 net loss from affiliates) | | | 809,118 | | | | | |
| Currency transactions | | | 1,280 | | | | 810,398 | |
| Net unrealized depreciation on: | | | | | | | | |
| Investments | | | (153,739 | ) | | | | |
| Currency translations | | | (167 | ) | | | (153,906 | ) |
| Net realized gain and unrealized depreciation on investments and currency | | | | | | | 656,492 | |
| | | | | | | | | |
| Net increase in net assets resulting from operations | | | | | | $ | 706,570 | |
*Additional information related to class-specific fees and expenses is included in the Notes to Financial Statements.
See Notes to Financial Statements
| Statements of changes in net assets |
| | | (dollars in thousands) |
| | | |
| | | Six months ended | | | Year ended | |
| | | May 31, | | | November 30, | |
| | | 2014* | | | 2013 | |
| | | | | | | |
| Operations: | | | | | | |
| Net investment income | | $ | 50,078 | | | $ | 46,521 | |
| Net realized gain on investments and currency transactions | | | 810,398 | | | | 829,210 | |
| Net unrealized (depreciation) appreciation on investments and currency translations | | | (153,906 | ) | | | 2,609,212 | |
| Net increase in net assets resulting from operations | | | 706,570 | | | | 3,484,943 | |
| | | | | | | | | |
| Dividends and distributions paid to shareholders: | | | | | | | | |
| Dividends from net investment income | | | (44,133 | ) | | | (46,579 | ) |
| Distributions from net realized gain on investments | | | (759,677 | ) | | | (236,050 | ) |
| Total dividends and distributions paid to shareholders | | | (803,810 | ) | | | (282,629 | ) |
| | | | | | | | | |
| Net capital share transactions | | | 1,738,181 | | | | 1,434,691 | |
| | | | | | | | | |
| Total increase in net assets | | | 1,640,941 | | | | 4,637,005 | |
| | | | | | | | | |
| Net assets: | | | | | | | | |
| Beginning of period | | | 12,437,305 | | | | 7,800,300 | |
| End of period (including undistributed net investment income: $46,505 and $40,560, respectively) | | $ | 14,078,246 | | | $ | 12,437,305 | |
*Unaudited.
See Notes to Financial Statements
| Notes to financial statements | unaudited |
1. Organization
The New Economy Fund (the “fund”) is registered under the Investment Company Act of 1940 as an open-end, diversified management investment company. The fund seeks long-term growth of capital by investing in securities of companies that can benefit from innovation, exploit new technologies or provide products and services that meet the demands of an evolving global economy. Shareholders approved a proposal to reorganize the fund into a Delaware statutory trust. The reorganization may be completed in the next 12 months; however, the fund reserves the right to delay the implementation.
The fund has 16 share classes consisting of five retail share classes (Classes A, B and C, as well as two F share classes, F-1 and F-2), five 529 college savings plan share classes (Classes 529-A, 529-B, 529-C, 529-E and 529-F-1) and six retirement plan share classes (Classes R-1, R-2, R-3, R-4, R-5 and R-6). The 529 college savings plan share classes can be used to save for college education. The retirement plan share classes are generally offered only through eligible employer-sponsored retirement plans. The fund’s share classes are described further in the following table:
| Share class | | Initial sales charge | | Contingent deferred sales
charge upon redemption | | Conversion feature | |
| Classes A and 529-A | | Up to 5.75% | | None (except 1% for certain redemptions within one year of purchase without an initial sales charge) | | None | |
| Classes B and 529-B* | | None | | Declines from 5% to 0% for redemptions within six years of purchase | | Classes B and 529-B convert to Classes A and 529-A, respectively, after eight years | |
| Class C | | None | | 1% for redemptions within one year of purchase | | Class C converts to Class F-1 after 10 years | |
| Class 529-C | | None | | 1% for redemptions within one year of purchase | | None | |
| Class 529-E | | None | | None | | None | |
| Classes F-1, F-2 and 529-F-1 | | None | | None | | None | |
Classes R-1, R-2, R-3,
R-4, R-5 and R-6 | | None | | None | | None | |
*Class B and 529-B shares of the fund are not available for purchase.
Holders of all share classes have equal pro rata rights to assets, dividends and liquidation proceeds. Each share class has identical voting rights, except for the exclusive right to vote on matters affecting only its class. Share classes have different fees and expenses (“class-specific fees and expenses”), primarily due to different arrangements for distribution, administrative and shareholder services. Differences in class-specific fees and expenses will result in differences in net investment income and, therefore, the payment of different per-share dividends by each share class.
2. Significant accounting policies
The financial statements have been prepared to comply with accounting principles generally accepted in the United States of America. These principles require management to make estimates and assumptions that affect reported amounts and disclosures. Actual results could differ from those estimates. The fund follows the significant accounting policies described in this section, as well as the valuation policies described in the next section on valuation.
Security transactions and related investment income — Security transactions are recorded by the fund as of the date the trades are executed with brokers. Realized gains and losses from security transactions are determined based on the specific identified cost of the securities. In the event a security is purchased with a delayed payment date, the fund will segregate liquid assets sufficient to meet its payment obligations. Dividend income is recognized on the ex-dividend date and interest income is recognized on an accrual basis. Market discounts, premiums and original issue discounts on fixed-income securities are amortized daily over the expected life of the security.
Class allocations — Income, fees and expenses (other than class-specific fees and expenses) and realized and unrealized gains and losses are allocated daily among the various share classes based on their relative net assets. Class-specific fees and expenses, such as distribution, administrative and shareholder services, are charged directly to the respective share class.
Dividends and distributions to shareholders — Dividends and distributions to shareholders are recorded on the ex-dividend date.
Currency translation — Assets and liabilities, including investment securities, denominated in currencies other than U.S. dollars are translated into U.S. dollars at the exchange rates supplied by one or more pricing vendors on the valuation date. Purchases and sales of investment securities and income and expenses are translated into U.S. dollars at the exchange rates on the dates of such transactions. The effects of changes in exchange rates on investment securities are included with the net realized gain or loss and net unrealized appreciation or depreciation on investments in the fund’s statement of operations. The realized gain or loss and unrealized appreciation or depreciation resulting from all other transactions denominated in currencies other than U.S. dollars are disclosed separately.
3. Valuation
Capital Research and Management Company (“CRMC”), the fund’s investment adviser, values the fund’s investments at fair value as defined by accounting principles generally accepted in the United States of America. The net asset value of each share class of the fund is generally determined as of approximately 4:00 p.m. New York time each day the New York Stock Exchange is open.
Methods and inputs — The fund’s investment adviser uses the following methods and inputs to establish the fair value of the fund’s assets and liabilities. Use of particular methods and inputs may vary over time based on availability and relevance as market and economic conditions evolve.
Equity securities are generally valued at the official closing price of, or the last reported sale price on, the exchange or market on which such securities are traded, as of the close of business on the day the securities are being valued or, lacking any sales, at the last available bid price. Prices for each security are taken from the principal exchange or market on which the security trades.
Fixed-income securities, including short-term securities purchased with more than 60 days left to maturity, are generally valued at prices obtained from one or more pricing vendors. Vendors value such securities based on one or more of the inputs described in the following table. The table provides examples of inputs that are commonly relevant for valuing particular classes of fixed-income securities in which the fund is authorized to invest. However, these classifications are not exclusive, and any of the inputs may be used to value any other class of fixed-income security.
| Fixed-income class | | Examples of standard inputs |
| All | | Benchmark yields, transactions, bids, offers, quotations from dealers and trading systems, new issues, spreads and other relationships observed in the markets among comparable securities; and proprietary pricing models such as yield measures calculated using factors such as cash flows, financial or collateral performance and other reference data (collectively referred to as “standard inputs”) |
| Corporate bonds & notes; convertible securities | | Standard inputs and underlying equity of the issuer |
| Bonds & notes of governments & government agencies | | Standard inputs and interest rate volatilities |
When the fund’s investment adviser deems it appropriate to do so (such as when vendor prices are unavailable or not deemed to be representative), fixed-income securities will be valued in good faith at the mean quoted bid and ask prices that are reasonably and timely available (or bid prices, if ask prices are not available) or at prices for securities of comparable maturity, quality and type.
Securities with both fixed-income and equity characteristics, or equity securities traded principally among fixed-income dealers, are generally valued in the manner described for either equity or fixed-income securities, depending on which method is deemed most appropriate by the fund’s investment adviser. Short-term securities purchased within 60 days to maturity are valued at amortized cost, which approximates fair value. The value of short-term securities originally purchased with maturities greater than 60 days is determined based on an amortized value to par when they reach 60 days.
Securities and other assets for which representative market quotations are not readily available or are considered unreliable by the fund’s investment adviser are fair valued as determined in good faith under fair valuation guidelines adopted by authority of the fund’s board of trustees as further described. The investment adviser follows fair valuation guidelines, consistent with U.S. Securities and Exchange Commission rules and guidance, to consider relevant principles and factors when making fair value determinations. The investment adviser considers relevant indications of value that are reasonably and timely available to it in determining the fair value to be assigned to a particular security, such as the type and cost of the security; contractual or legal restrictions on resale of the security; relevant financial or business developments of the issuer; actively traded similar or related securities; conversion or exchange rights on the security; related corporate actions; significant events occurring after the close of trading in the security; and changes in overall market conditions. In addition, the closing prices of equity securities that trade in markets outside U.S. time zones may be adjusted to reflect significant events that occur after the close of local trading but before the net asset value of each share class of the fund is determined. Fair valuations and valuations of investments that are not actively trading involve judgment and may differ materially from valuations that would have been used had greater market activity occurred.
Processes and structure — The fund’s board of trustees has delegated authority to the fund’s investment adviser to make fair value determinations, subject to board oversight. The investment adviser has established a Joint Fair Valuation Committee (the “Fair Valuation Committee”) to administer, implement and oversee the fair valuation process, and to make fair value decisions. The Fair Valuation Committee regularly reviews its own fair value decisions, as well as decisions made under its standing instructions to the investment adviser’s valuation teams. The Fair Valuation Committee reviews changes in fair value measurements from period to period and may, as deemed appropriate, update the fair valuation guidelines to better reflect the results of back testing and address new or evolving issues. The Fair Valuation Committee reports any changes to the fair valuation guidelines to the board of trustees with supplemental information to support the changes. The fund’s board and audit committee also regularly review reports that describe fair value determinations and methods.
The fund’s investment adviser has also established a Fixed-Income Pricing Review Group to administer and oversee the fixed-income valuation process, including the use of fixed-income pricing vendors. This group regularly reviews pricing vendor information and market data. Pricing decisions, processes and controls over security valuation are also subject to additional internal reviews, including an annual control self-evaluation program facilitated by the investment adviser’s compliance group.
Classifications — The fund’s investment adviser classifies the fund’s assets and liabilities into three levels based on the inputs used to value the assets or liabilities. Level 1 values are based on quoted prices in active markets for identical securities. Level 2 values
are based on significant observable market inputs, such as quoted prices for similar securities and quoted prices in inactive markets. Certain securities trading outside the U.S. may transfer between Level 1 and Level 2 due to valuation adjustments resulting from significant market movements following the close of local trading. Level 3 values are based on significant unobservable inputs that reflect the investment adviser’s determination of assumptions that market participants might reasonably use in valuing the securities. The valuation levels are not necessarily an indication of the risk or liquidity associated with the underlying investment. For example, U.S. government securities are reflected as Level 2 because the inputs used to determine fair value may not always be quoted prices in an active market. The following table presents the fund’s valuation levels as of May 31, 2014 (dollars in thousands):
| | | Investment securities | |
| | | Level 1 | | | Level 2 | | | Level 3 | | | Total | |
| Assets: | | | | | | | | | | | | | | | | |
| Common stocks: | | | | | | | | | | | | | | | | |
| Health care | | $ | 2,954,309 | | | $ | — | | | $ | — | | | $ | 2,954,309 | |
| Information technology | | | 2,541,206 | | | | — | | | | — | | | | 2,541,206 | |
| Consumer discretionary | | | 2,444,534 | | | | — | | | | 6,606 | | | | 2,451,140 | |
| Financials | | | 1,599,485 | | | | — | | | | — | | | | 1,599,485 | |
| Industrials | | | 1,099,213 | | | | — | | | | — | | | | 1,099,213 | |
| Telecommunication services | | | 476,619 | | | | — | | | | — | | | | 476,619 | |
| Energy | | | 257,614 | | | | — | | | | — | | | | 257,614 | |
| Consumer staples | | | 216,929 | | | | — | | | | — | | | | 216,929 | |
| Materials | | | 50,011 | | | | — | | | | — | | | | 50,011 | |
| Miscellaneous | | | 685,931 | | | | — | | | | — | | | | 685,931 | |
| Rights & warrants | | | 5,845 | | | | — | | | | — | | | | 5,845 | |
| Short-term securities | | | — | | | | 1,789,833 | | | | — | | | | 1,789,833 | |
| Total | | $ | 12,331,696 | | | $ | 1,789,833 | | | $ | 6,606 | | | $ | 14,128,135 | |
4. Risk factors
Investing in the fund may involve certain risks including, but not limited to, those described below.
Market conditions — The prices of, and the income generated by, the common stocks and other securities held by the fund may decline due to market conditions and other factors, including those directly involving the issuers of securities held by the fund. The fund may be subject to additional risks because it invests in a more limited group of sectors and industries than the broad market.
Investing in growth-oriented stocks — Growth-oriented stocks may involve larger price swings and greater potential for loss than other types of investments.
Investing in small companies — Investing in smaller companies may pose additional risks. For example, it is often more difficult to value or dispose of small company stocks and more difficult to obtain information about smaller companies than about larger companies. In addition, the prices of these stocks may be more volatile than stocks of larger, more established companies.
Investing outside the U.S. — Securities of issuers domiciled outside the U.S., or with significant operations outside the U.S., may lose value because of adverse political, social, economic or market developments in the countries or regions in which the issuers operate. These securities may also lose value due to changes in foreign currency exchange rates against the U.S. dollar and/or currencies of other countries. Securities markets in certain countries may be more volatile and/or less liquid than those in the U.S. Investments outside the U.S. may also be subject to different settlement and accounting practices and different regulatory, legal and reporting standards, and may be more difficult to value, than those in the U.S. The risks of investing outside the U.S. may be heightened in connection with investments in emerging markets.
Investing in emerging markets — Investing in emerging markets may involve risks in addition to and greater than those generally associated with investing in the securities markets of developed countries. For instance, developing countries may have less developed legal and accounting systems than those in developed countries. The governments of these countries may be less stable and more likely to impose capital controls, nationalize a company or industry, place restrictions on foreign ownership and on withdrawing sale proceeds of securities from the country, and/or impose punitive taxes that could adversely affect the prices of securities. In addition, the economies of these countries may be dependent on relatively few industries that are more susceptible to local and global changes. Securities markets in these countries can also be relatively small and have substantially lower trading volumes. As a result, securities issued in these countries may be more volatile and less liquid, and may be more difficult to value, than securities issued in countries with more developed economies and/or markets. Additionally, there may be increased settlement risks for transactions in local securities.
Management — The investment adviser to the fund actively manages the fund’s investments. Consequently, the fund is subject to the risk that the methods and analyses employed by the investment adviser in this process may not produce the desired results. This could cause the fund to lose value or its investment results to lag relevant benchmarks or other funds with similar objectives.
5. Taxation and distributions
Federal income taxation — The fund complies with the requirements under Subchapter M of the Internal Revenue Code applicable to mutual funds and intends to distribute substantially all of its net taxable income and net capital gains each year. The fund is not subject to income taxes to the extent such distributions are made. Therefore, no federal income tax provision is required.
As of and during the period ended May 31, 2014, the fund did not have a liability for any unrecognized tax benefits. The fund recognizes interest and penalties, if any, related to unrecognized tax benefits as income tax expense in the statement of operations. During the period, the fund did not incur any interest or penalties.
The fund is not subject to examination by U.S. federal tax authorities for tax years before 2009, by state tax authorities for tax years before 2008 and by tax authorities outside the U.S. for tax years before 2007.
Non-U.S. taxation — Dividend and interest income are recorded net of non-U.S. taxes paid. Gains realized by the fund on the sale of securities in certain countries are subject to non-U.S. taxes. The fund records a liability based on unrealized gains to provide for potential non-U.S. taxes payable upon the sale of these securities.
Distributions — Distributions paid to shareholders are based on net investment income and net realized gains determined on a tax basis, which may differ from net investment income and net realized gains for financial reporting purposes. These differences are due primarily to different treatment for items such as currency gains and losses; short-term capital gains and losses; unrealized appreciation of certain investments in securities outside the U.S.; deferred expenses; and non-U.S. taxes on capital gains. The fiscal year in which amounts are distributed may differ from the year in which the net investment income and net realized gains are recorded by the fund for financial reporting purposes.
The components of distributable earnings on a tax basis are reported as of the fund’s most recent year-end. As of November 30, 2013, the fund had tax basis undistributed ordinary income of $84,896,000 and undistributed long-term capital gains of $717,857,000.
As of May 31, 2014, the tax basis unrealized appreciation (depreciation) and cost of investment securities were as follows (dollars in thousands):
| Gross unrealized appreciation on investment securities | | $ | 4,302,141 | |
| Gross unrealized depreciation on investment securities | | | (196,988 | ) |
| Net unrealized appreciation on investment securities | | | 4,105,153 | |
| Cost of investment securities | | | 10,022,982 | |
The tax character of distributions paid to shareholders was as follows (dollars in thousands):
| | | Six months ended May 31, 2014 | | | Year ended November 30, 2013 | |
| Share class | | Ordinary
income | | | Long-term
capital
gains | | | Total
distributions
paid | | | Ordinary
income | | | Long-term
capital
gains | | | Total
distributions
paid | |
| Class A | | $ | 60,201 | | | $ | 511,493 | | | $ | 571,694 | | | $ | 35,632 | | | $ | 178,162 | | | $ | 213,794 | |
| Class B | | | 185 | | | | 3,217 | | | | 3,402 | | | | — | | | | 1,543 | | | | 1,543 | |
| Class C | | | 1,250 | | | | 21,730 | | | | 22,980 | | | | — | | | | 5,991 | | | | 5,991 | |
| Class F-1 | | | 3,173 | | | | 24,471 | | | | 27,644 | | | | 786 | | | | 4,288 | | | | 5,074 | |
| Class F-2 | | | 3,059 | | | | 19,383 | | | | 22,442 | | | | 998 | | | | 3,248 | | | | 4,246 | |
| Class 529-A | | | 2,089 | | | | 18,886 | | | | 20,975 | | | | 1,139 | | | | 6,060 | | | | 7,199 | |
| Class 529-B | | | 27 | | | | 479 | | | | 506 | | | | — | | | | 234 | | | | 234 | |
| Class 529-C | | | 328 | | | | 5,704 | | | | 6,032 | | | | — | | | | 1,911 | | | | 1,911 | |
| Class 529-E | | | 76 | | | | 970 | | | | 1,046 | | | | 33 | | | | 309 | | | | 342 | |
| Class 529-F-1 | | | 178 | | | | 1,297 | | | | 1,475 | | | | 101 | | | | 391 | | | | 492 | |
| Class R-1 | | | 114 | | | | 1,989 | | | | 2,103 | | | | — | | | | 701 | | | | 701 | |
| Class R-2 | | | 590 | | | | 10,257 | | | | 10,847 | | | | — | | | | 3,844 | | | | 3,844 | |
| Class R-3 | | | 1,329 | | | | 15,863 | | | | 17,192 | | | | 491 | | | | 5,174 | | | | 5,665 | |
| Class R-4 | | | 1,733 | | | | 14,457 | | | | 16,190 | | | | 1,047 | | | | 4,799 | | | | 5,846 | |
| Class R-5 | | | 2,167 | | | | 13,661 | | | | 15,828 | | | | 1,192 | | | | 3,825 | | | | 5,017 | |
| Class R-6 | | | 8,954 | | | | 54,500 | | | | 63,454 | | | | 5,160 | | | | 15,570 | | | | 20,730 | |
| Total | | $ | 85,453 | | | $ | 718,357 | | | $ | 803,810 | | | $ | 46,579 | | | $ | 236,050 | | | $ | 282,629 | |
6. Fees and transactions with related parties
CRMC, the fund’s investment adviser, is the parent company of American Funds Distributors,® Inc. (“AFD”), the principal underwriter of the fund’s shares, and American Funds Service Company® (“AFS”), the fund’s transfer agent. CRMC, AFD and AFS are considered related parties to the fund.
Investment advisory services — The fund has an investment advisory and service agreement with CRMC that provides for monthly fees accrued daily. These fees are based on a series of decreasing annual rates beginning with 0.580% on the first $500 million of daily net assets and decreasing to 0.345% on such assets in excess of $27 billion. For the six months ended May 31, 2014, the investment advisory services fee was $26,009,000, which was equivalent to an annualized rate of 0.390% of average daily net assets.
Class-specific fees and expenses — Expenses that are specific to individual share classes are accrued directly to the respective share class. The principal class-specific fees and expenses are described below:
Distribution services — The fund has plans of distribution for all share classes, except Class F-2, R-5 and R-6 shares. Under the plans, the board of trustees approves certain categories of expenses that are used to finance activities primarily intended to sell fund shares and service existing accounts. The plans provide for payments, based on an annualized percentage of average daily net
assets, ranging from 0.25% to 1.00% as noted in this section. In some cases, the board of trustees has limited the amounts that may be paid to less than the maximum allowed by the plans. All share classes with a plan may use up to 0.25% of average daily net assets to pay service fees, or to compensate AFD for paying service fees, to firms that have entered into agreements with AFD to provide certain shareholder services. The remaining amounts available to be paid under each plan are paid to dealers to compensate them for their sales activities.
For Class A and 529-A shares, distribution-related expenses include the reimbursement of dealer and wholesaler commissions paid by AFD for certain shares sold without a sales charge. These share classes reimburse AFD for amounts billed within the prior 15 months but only to the extent that the overall annual expense limit of 0.25% is not exceeded. As of May 31, 2014, there were no unreimbursed expenses subject to reimbursement for Class A or 529-A shares.
| Share class | | Currently approved limits | | Plan limits | |
| Class A | | | 0.25 | % | | | 0.25 | % | |
| Class 529-A | | | 0.25 | | | | 0.50 | | |
| Classes B and 529-B | | | 1.00 | | | | 1.00 | | |
| Classes C, 529-C and R-1 | | | 1.00 | | | | 1.00 | | |
| Class R-2 | | | 0.75 | | | | 1.00 | | |
| Classes 529-E and R-3 | | | 0.50 | | | | 0.75 | | |
| Classes F-1, 529-F-1 and R-4 | | | 0.25 | | | | 0.50 | | |
Transfer agent services — The fund has a shareholder services agreement with AFS under which the fund compensates AFS for providing transfer agent services to each of the fund’s share classes. These services include recordkeeping, shareholder communications and transaction processing. In addition, the fund reimburses AFS for amounts paid to third parties for performing transfer agent services on behalf of fund shareholders.
Administrative services — The fund has an administrative services agreement with CRMC under which the fund compensates CRMC for providing administrative services to Class A, C, F, 529 and R shares. These services include, but are not limited to, coordinating, monitoring, assisting and overseeing third parties that provide services to fund shareholders. Under the agreement, Class A shares pay an annual fee of 0.01% and Class C, F, 529 and R shares pay an annual fee of 0.05% of their respective average daily net assets.
529 plan services — Each 529 share class is subject to service fees to compensate the Commonwealth of Virginia for the maintenance of the 529 college savings plan. During the period December 1, 2013, to March 31, 2014, the quarterly fee was based on a series of decreasing annual rates beginning with 0.10% on the first $30 billion of the net assets invested in Class 529 shares of the American Funds and decreasing to 0.06% on such assets between $120 billion and $150 billion. Effective April 1, 2014, the quarterly fee was amended to provide for reduced annual rates of 0.07%, 0.06% and 0.05% over $30 billion, $50 billion and $70 billion,
respectively, of the net assets invested in Class 529 shares of the American Funds. The fee for any given calendar quarter is accrued and calculated on the basis of the average net assets of Class 529 shares of the American Funds for the last month of the prior calendar quarter. The fee is included in other expenses in the fund’s statement of operations. The Commonwealth of Virginia is not considered a related party.
For the six months ended May 31, 2014, class-specific expenses under the agreements were as follows (dollars in thousands):
| Share class | | Distribution
services | | | Transfer agent
services | | | Administrative
services | | | 529 plan
services |
| Class A | | | $10,926 | | | | $6,371 | | | | $469 | | | Not applicable |
| Class B | | | 255 | | | | 38 | | | | Not applicable | | | Not applicable |
| Class C | | | 1,993 | | | | 270 | | | | 100 | | | Not applicable |
| Class F-1 | | | 607 | | | | 312 | | | | 121 | | | Not applicable |
| Class F-2 | | | Not applicable | | | | 207 | | | | 102 | | | Not applicable |
| Class 529-A | | | 353 | | | | 193 | | | | 88 | | | $166 |
| Class 529-B | | | 38 | | | | 5 | | | | 2 | | | 4 |
| Class 529-C | | | 501 | | | | 59 | | | | 25 | | | 47 |
| Class 529-E | | | 46 | | | | 6 | | | | 5 | | | 9 |
| Class 529-F-1 | | | — | | | | 14 | | | | 6 | | | 12 |
| Class R-1 | | | 186 | | | | 21 | | | | 9 | | | Not applicable |
| Class R-2 | | | 667 | | | | 325 | | | | 45 | | | Not applicable |
| Class R-3 | | | 726 | | | | 237 | | | | 73 | | | Not applicable |
| Class R-4 | | | 350 | | | | 142 | | | | 70 | | | Not applicable |
| Class R-5 | | | Not applicable | | | | 60 | | | | 60 | | | Not applicable |
| Class R-6 | | | Not applicable | | | | 2 | | | | 266 | | | Not applicable |
| Total class-specific expenses | | | $16,648 | | | | $8,262 | | | | $1,441 | | | $238 |
Trustees’ deferred compensation — Trustees who are unaffiliated with CRMC may elect to defer the cash payment of part or all of their compensation. These deferred amounts, which remain as liabilities of the fund, are treated as if invested in shares of the fund or other American Funds. These amounts represent general, unsecured liabilities of the fund and vary according to the total returns of the selected funds. Trustees’ compensation of $327,000 in the fund’s statement of operations includes $219,000 in current fees (either paid in cash or deferred) and a net increase of $108,000 in the value of the deferred amounts.
Affiliated officers and trustees — Officers and certain trustees of the fund are or may be considered to be affiliated with CRMC, AFD and AFS. No affiliated officers or trustees received any compensation directly from the fund.
7. Capital share transactions
Capital share transactions in the fund were as follows (dollars and shares in thousands):
| | | Sales* | | | Reinvestments
of dividends
and distributions | | | Repurchases* | | | Net increase
(decrease) | |
| Share class | | Amount | | | Shares | | | Amount | | | Shares | | | Amount | | | Shares | | | Amount | | | Shares | |
| | | | | | | | | | | | | | | | |
| Six months ended May 31, 2014 | | | | | | | | | | | | | | | |
| | | | | | | | | | | | | | | | |
| Class A | | $ | 949,352 | | | | 24,522 | | | $ | 559,590 | | | | 14,699 | | | $ | (615,187 | ) | | | (15,962 | ) | | $ | 893,755 | | | | 23,259 | |
| Class B | | | 3,272 | | | | 89 | | | | 3,381 | | | | 93 | | | | (14,043 | ) | | | (384 | ) | | | (7,390 | ) | | | (202 | ) |
| Class C | | | 121,241 | | | | 3,345 | | | | 22,777 | | | | 638 | | | | (45,621 | ) | | | (1,262 | ) | | | 98,397 | | | | 2,721 | |
| Class F-1 | | | 185,590 | | | | 4,789 | | | | 27,487 | | | | 721 | | | | (147,313 | ) | | | (3,809 | ) | | | 65,764 | | | | 1,701 | |
| Class F-2 | | | 259,718 | | | | 6,699 | | | | 21,174 | | | | 557 | | | | (75,981 | ) | | | (1,992 | ) | | | 204,911 | | | | 5,264 | |
| Class 529-A | | | 45,961 | | | | 1,196 | | | | 20,969 | | | | 555 | | | | (17,849 | ) | | | (464 | ) | | | 49,081 | | | | 1,287 | |
| Class 529-B | | | 602 | | | | 16 | | | | 506 | | | | 14 | | | | (1,898 | ) | | | (52 | ) | | | (790 | ) | | | (22 | ) |
| Class 529-C | | | 13,299 | | | | 362 | | | | 6,032 | | | | 167 | | | | (6,009 | ) | | | (164 | ) | | | 13,322 | | | | 365 | |
| Class 529-E | | | 2,936 | | | | 78 | | | | 1,046 | | | | 28 | | | | (645 | ) | | | (17 | ) | | | 3,337 | | | | 89 | |
| Class 529-F-1 | | | 5,338 | | | | 139 | | | | 1,475 | | | | 39 | | | | (2,278 | ) | | | (59 | ) | | | 4,535 | | | | 119 | |
| Class R-1 | | | 13,334 | | | | 358 | | | | 2,103 | | | | 57 | | | | (5,388 | ) | | | (144 | ) | | | 10,049 | | | | 271 | |
| Class R-2 | | | 29,719 | | | | 797 | | | | 10,844 | | | | 296 | | | | (29,342 | ) | | | (790 | ) | | | 11,221 | | | | 303 | |
| Class R-3 | | | 84,775 | | | | 2,217 | | | | 17,185 | | | | 459 | | | | (46,181 | ) | | | (1,217 | ) | | | 55,779 | | | | 1,459 | |
| Class R-4 | | | 119,235 | | | | 3,113 | | | | 16,184 | | | | 428 | | | | (47,201 | ) | | | (1,232 | ) | | | 88,218 | | | | 2,309 | |
| Class R-5 | | | 56,262 | | | | 1,448 | | | | 15,795 | | | | 414 | | | | (154,896 | ) | | | (4,028 | ) | | | (82,839) | | | | (2,166) | |
| Class R-6 | | | 319,872 | | | | 8,302 | | | | 63,334 | | | | 1,663 | | | | (52,375 | ) | | | (1,354 | ) | | | 330,831 | | | | 8,611 | |
| Total net increase (decrease) | | $ | 2,210,506 | | | | 57,470 | | | $ | 789,882 | | | | 20,828 | | | $ | (1,262,207 | ) | | | (32,930 | ) | | $ | 1,738,181 | | | | 45,368 | |
| | | | | | | | | | | | | | | | | | | | | | | | | | | | | | | | | |
| Year ended November 30, 2013 | | | | | | | | | | | | | | | | | | | | | | |
| Class A | | $ | 1,346,842 | | | | 40,376 | | | $ | 208,058 | | | | 7,397 | | | $ | (911,557 | ) | | | (27,868 | ) | | $ | 643,343 | | | | 19,905 | |
| Class B | | | 7,162 | | | | 225 | | | | 1,531 | | | | 57 | | | | (20,042 | ) | | | (643 | ) | | | (11,349 | ) | | | (361 | ) |
| Class C | | | 128,010 | | | | 4,007 | | | | 5,896 | | | | 222 | | | | (51,508 | ) | | | (1,651 | ) | | | 82,398 | | | | 2,578 | |
| Class F-1 | | | 247,530 | | | | 7,245 | | | | 4,991 | | | | 177 | | | | (61,931 | ) | | | (1,848 | ) | | | 190,590 | | | | 5,574 | |
| Class F-2 | | | 198,082 | | | | 5,745 | | | | 3,851 | | | | 137 | | | | (41,092 | ) | | | (1,248 | ) | | | 160,841 | | | | 4,634 | |
| Class 529-A | | | 63,174 | | | | 1,926 | | | | 7,189 | | | | 257 | | | | (26,566 | ) | | | (814 | ) | | | 43,797 | | | | 1,369 | |
| Class 529-B | | | 747 | | | | 24 | | | | 234 | | | | 9 | | | | (2,947 | ) | | | (95 | ) | | | (1,966 | ) | | | (62 | ) |
| Class 529-C | | | 17,070 | | | | 541 | | | | 1,909 | | | | 71 | | | | (9,543 | ) | | | (305 | ) | | | 9,436 | | | | 307 | |
| Class 529-E | | | 3,101 | | | | 96 | | | | 342 | | | | 12 | | | | (1,074 | ) | | | (33 | ) | | | 2,369 | | | | 75 | |
| Class 529-F-1 | | | 5,417 | | | | 164 | | | | 492 | | | | 17 | | | | (1,932 | ) | | | (59 | ) | | | 3,977 | | | | 122 | |
| Class R-1 | | | 10,373 | | | | 321 | | | | 701 | | | | 26 | | | | (9,112 | ) | | | (291 | ) | | | 1,962 | | | | 56 | |
| Class R-2 | | | 47,774 | | | | 1,496 | | | | 3,839 | | | | 141 | | | | (48,917 | ) | | | (1,546 | ) | | | 2,696 | | | | 91 | |
| Class R-3 | | | 91,757 | | | | 2,787 | | | | 5,659 | | | | 204 | | | | (70,623 | ) | | | (2,184 | ) | | | 26,793 | | | | 807 | |
| Class R-4 | | | 82,091 | | | | 2,480 | | | | 5,845 | | | | 209 | | | | (50,222 | ) | | | (1,525 | ) | | | 37,714 | | | | 1,164 | |
| Class R-5 | | | 76,557 | | | | 2,279 | | | | 5,009 | | | | 178 | | | | (37,629 | ) | | | (1,129 | ) | | | 43,937 | | | | 1,328 | |
| Class R-6 | | | 249,660 | | | | 7,537 | | | | 20,730 | | | | 737 | | | | (72,237 | ) | | | (2,178 | ) | | | 198,153 | | | | 6,096 | |
| Total net increase (decrease) | | $ | 2,575,347 | | | | 77,249 | | | $ | 276,276 | | | | 9,851 | | | $ | (1,416,932 | ) | | | (43,417 | ) | | $ | 1,434,691 | | | | 43,683 | |
*Includes exchanges between share classes of the fund.
8. Investment transactions
The fund made purchases and sales of investment securities, excluding short-term securities and U.S. government obligations, if any, of $2,178,065,000 and $1,812,335,000, respectively, during the six months ended May 31, 2014.
Financial highlights
| | | | | | | | Income (loss) from investment operations1 | |
| | | | | Net asset
value,
beginning
of period | | | Net
investment
income (loss)2 | | | Net gains (losses)
on securities
(both realized
and unrealized) | | | Total from
investment
operations | |
| Class A: | | Six months ended 5/31/20145,6 | | $ | 39.61 | | | $ | .15 | | | $ | 1.99 | | | $ | 2.14 | |
| | | Year ended 11/30/2013 | | | 28.83 | | | | .17 | | | | 11.67 | | | | 11.84 | |
| | | Year ended 11/30/2012 | | | 24.14 | | | | .16 | | | | 4.65 | | | | 4.81 | |
| | | Year ended 11/30/2011 | | | 24.22 | | | | .11 | | | | (.02 | ) | | | .09 | |
| | | Year ended 11/30/2010 | | | 21.87 | | | | .18 | | | | 2.28 | | | | 2.46 | |
| | | Year ended 11/30/2009 | | | 15.22 | | | | .12 | | | | 6.76 | | | | 6.88 | |
| Class B: | | Six months ended 5/31/20145,6 | | | 37.59 | | | | — | 8 | | | 1.89 | | | | 1.89 | |
| | | Year ended 11/30/2013 | | | 27.45 | | | | (.08 | ) | | | 11.10 | | | | 11.02 | |
| | | Year ended 11/30/2012 | | | 23.04 | | | | (.05 | ) | | | 4.46 | | | | 4.41 | |
| | | Year ended 11/30/2011 | | | 23.14 | | | | (.08 | ) | | | (.02 | ) | | | (.10 | ) |
| | | Year ended 11/30/2010 | | | 20.95 | | | | — | 8 | | | 2.19 | | | | 2.19 | |
| | | Year ended 11/30/2009 | | | 14.50 | | | | (.02 | ) | | | 6.50 | | | | 6.48 | |
| Class C: | | Six months ended 5/31/20145,6 | | | 37.16 | | | | — | 8 | | | 1.85 | | | | 1.85 | |
| | | Year ended 11/30/2013 | | | 27.15 | | | | (.10 | ) | | | 10.99 | | | | 10.89 | |
| | | Year ended 11/30/2012 | | | 22.80 | | | | (.05 | ) | | | 4.40 | | | | 4.35 | |
| | | Year ended 11/30/2011 | | | 22.90 | | | | (.08 | ) | | | (.02 | ) | | | (.10 | ) |
| | | Year ended 11/30/2010 | | | 20.75 | | | | — | 8 | | | 2.16 | | | | 2.16 | |
| | | Year ended 11/30/2009 | | | 14.39 | | | | (.02 | ) | | | 6.44 | | | | 6.42 | |
| Class F-1: | | Six months ended 5/31/20145,6 | | | 39.67 | | | | .14 | | | | 1.99 | | | | 2.13 | |
| | | Year ended 11/30/2013 | | | 28.87 | | | | .14 | | | | 11.70 | | | | 11.84 | |
| | | Year ended 11/30/2012 | | | 24.16 | | | | .16 | | | | 4.66 | | | | 4.82 | |
| | | Year ended 11/30/2011 | | | 24.23 | | | | .11 | | | | (.01 | ) | | | .10 | |
| | | Year ended 11/30/2010 | | | 21.90 | | | | .18 | | | | 2.28 | | | | 2.46 | |
| | | Year ended 11/30/2009 | | | 15.11 | | | | .12 | | | | 6.77 | | | | 6.89 | |
| Class F-2: | | Six months ended 5/31/20145,6 | | | 39.65 | | | | .20 | | | | 1.99 | | | | 2.19 | |
| | | Year ended 11/30/2013 | | | 28.88 | | | | .24 | | | | 11.68 | | | | 11.92 | |
| | | Year ended 11/30/2012 | | | 24.19 | | | | .23 | | | | 4.65 | | | | 4.88 | |
| | | Year ended 11/30/2011 | | | 24.27 | | | | .18 | | | | (.02 | ) | | | .16 | |
| | | Year ended 11/30/2010 | | | 21.93 | | | | .24 | | | | 2.29 | | | | 2.53 | |
| | | Year ended 11/30/2009 | | | 15.24 | | | | .14 | | | | 6.81 | | | | 6.95 | |
| Class 529-A: | | Six months ended 5/31/20145,6 | | | 39.33 | | | | .13 | | | | 1.98 | | | | 2.11 | |
| | | Year ended 11/30/2013 | | | 28.65 | | | | .14 | | | | 11.58 | | | | 11.72 | |
| | | Year ended 11/30/2012 | | | 24.00 | | | | .14 | | | | 4.63 | | | | 4.77 | |
| | | Year ended 11/30/2011 | | | 24.10 | | | | .10 | | | | (.02 | ) | | | .08 | |
| | | Year ended 11/30/2010 | | | 21.77 | | | | .17 | | | | 2.27 | | | | 2.44 | |
| | | Year ended 11/30/2009 | | | 15.16 | | | | .12 | | | | 6.72 | | | | 6.84 | |
| Class 529-B: | | Six months ended 5/31/20145,6 | | | 37.68 | | | | (.02 | ) | | | 1.88 | | | | 1.86 | |
| | | Year ended 11/30/2013 | | | 27.54 | | | | (.11 | ) | | | 11.13 | | | | 11.02 | |
| | | Year ended 11/30/2012 | | | 23.15 | | | | (.08 | ) | | | 4.47 | | | | 4.39 | |
| | | Year ended 11/30/2011 | | | 23.27 | | | | (.11 | ) | | | (.01 | ) | | | (.12 | ) |
| | | Year ended 11/30/2010 | | | 21.09 | | | | (.02 | ) | | | 2.20 | | | | 2.18 | |
| | | Year ended 11/30/2009 | | | 14.63 | | | | (.03 | ) | | | 6.54 | | | | 6.51 | |
| Class 529-C: | | Six months ended 5/31/20145,6 | | | 37.62 | | | | (.02 | ) | | | 1.88 | | | | 1.86 | |
| | | Year ended 11/30/2013 | | | 27.49 | | | | (.12 | ) | | | 11.13 | | | | 11.01 | |
| | | Year ended 11/30/2012 | | | 23.11 | | | | (.07 | ) | | | 4.45 | | | | 4.38 | |
| | | Year ended 11/30/2011 | | | 23.24 | | | | (.10 | ) | | | (.02 | ) | | | (.12 | ) |
| | | Year ended 11/30/2010 | | | 21.06 | | | | (.01 | ) | | | 2.19 | | | | 2.18 | |
| | | Year ended 11/30/2009 | | | 14.62 | | | | (.03 | ) | | | 6.53 | | | | 6.50 | |
| Dividends and distributions | | | | | | | | | | | | | | | | | | | |
Dividends
(from net
investment
income) | | | Distributions
(from capital
gains) | | | Total
dividends
and
distributions | | | Net asset
value, end
of period | | | Total
return3,4 | | | Net assets,
end of period
(in millions) | | | Ratio of
expenses to
average net
assets before
waivers | | | Ratio of
expenses to
average net
assets after
waivers4 | | | Ratio of
net income
(loss) to
average net
assets2,4 | |
| $ | (.14 | ) | | $ | (2.39 | ) | | $ | (2.53 | ) | | $ | 39.22 | | | | 5.58 | % | | $ | 9,744 | | | | .79 | %7 | | | .79 | %7 | | | .77 | %7 |
| | (.18 | ) | | | (.88 | ) | | | (1.06 | ) | | | 39.61 | | | | 42.52 | | | | 8,920 | | | | .83 | | | | .83 | | | | .50 | |
| | (.12 | ) | | | — | | | | (.12 | ) | | | 28.83 | | | | 20.02 | | | | 5,919 | | | | .87 | | | | .87 | | | | .59 | |
| | (.17 | ) | | | — | | | | (.17 | ) | | | 24.14 | | | | .31 | | | | 5,298 | | | | .85 | | | | .85 | | | | .45 | |
| | (.11 | ) | | | — | | | | (.11 | ) | | | 24.22 | | | | 11.34 | | | | 5,760 | | | | .86 | | | | .86 | | | | .78 | |
| | (.23 | ) | | | — | | | | (.23 | ) | | | 21.87 | | | | 45.88 | | | | 5,733 | | | | .95 | | | | .94 | | | | .67 | |
| | — | | | | (2.39 | ) | | | (2.39 | ) | | | 37.09 | | | | 5.20 | | | | 46 | | | | 1.56 | 7 | | | 1.56 | 7 | | | (.02 | )7 |
| | — | | | | (.88 | ) | | | (.88 | ) | | | 37.59 | | | | 41.39 | | | | 55 | | | | 1.60 | | | | 1.60 | | | | (.24 | ) |
| | — | | | | — | | | | — | | | | 27.45 | | | | 19.09 | | | | 50 | | | | 1.63 | | | | 1.63 | | | | (.19 | ) |
| | — | | | | — | | | | — | | | | 23.04 | | | | (.39 | ) | | | 62 | | | | 1.62 | | | | 1.62 | | | | (.34 | ) |
| | — | | | | — | | | | — | | | | 23.14 | | | | 10.45 | | | | 90 | | | | 1.64 | | | | 1.64 | | | | — | 9 |
| | (.03 | ) | | | — | | | | (.03 | ) | | | 20.95 | | | | 44.73 | | | | 117 | | | | 1.72 | | | | 1.71 | | | | (.09 | ) |
| | — | | | | (2.39 | ) | | | (2.39 | ) | | | 36.62 | | | | 5.15 | | | | 445 | | | | 1.60 | 7 | | | 1.60 | 7 | | | (.02 | )7 |
| | — | | | | (.88 | ) | | | (.88 | ) | | | 37.16 | | | | 41.37 | | | | 350 | | | | 1.63 | | | | 1.63 | | | | (.32 | ) |
| | — | | | | — | | | | — | | | | 27.15 | | | | 19.08 | | | | 186 | | | | 1.67 | | | | 1.67 | | | | (.22 | ) |
| | — | | | | — | | | | — | | | | 22.80 | | | | (.47 | ) | | | 172 | | | | 1.63 | | | | 1.63 | | | | (.33 | ) |
| | (.01 | ) | | | — | | | | (.01 | ) | | | 22.90 | | | | 10.45 | | | | 188 | | | | 1.64 | | | | 1.64 | | | | .01 | |
| | (.06 | ) | | | — | | | | (.06 | ) | | | 20.75 | | | | 44.81 | | | | 182 | | | | 1.69 | | | | 1.68 | | | | (.09 | ) |
| | (.16 | ) | | | (2.39 | ) | | | (2.55 | ) | | | 39.25 | | | | 5.57 | | | | 480 | | | | .84 | 7 | | | .84 | 7 | | | .73 | 7 |
| | (.16 | ) | | | (.88 | ) | | | (1.04 | ) | | | 39.67 | | | | 42.46 | | | | 418 | | | | .86 | | | | .86 | | | | .43 | |
| | (.11 | ) | | | — | | | | (.11 | ) | | | 28.87 | | | | 20.03 | | | | 143 | | | | .86 | | | | .86 | | | | .61 | |
| | (.17 | ) | | | — | | | | (.17 | ) | | | 24.16 | | | | .33 | | | | 143 | | | | .85 | | | | .85 | | | | .44 | |
| | (.13 | ) | | | — | | | | (.13 | ) | | | 24.23 | | | | 11.32 | | | | 167 | | | | .86 | | | | .86 | | | | .77 | |
| | (.10 | ) | | | — | | | | (.10 | ) | | | 21.90 | | | | 45.93 | | | | 187 | | | | .91 | | | | .91 | | | | .66 | |
| | (.23 | ) | | | (2.39 | ) | | | (2.62 | ) | | | 39.22 | | | | 5.72 | | | | 532 | | | | .57 | 7 | | | .57 | 7 | | | 1.02 | 7 |
| | (.27 | ) | | | (.88 | ) | | | (1.15 | ) | | | 39.65 | | | | 42.88 | | | | 330 | | | | .57 | | | | .57 | | | | .70 | |
| | (.19 | ) | | | — | | | | (.19 | ) | | | 28.88 | | | | 20.35 | | | | 106 | | | | .59 | | | | .59 | | | | .87 | |
| | (.24 | ) | | | — | | | | (.24 | ) | | | 24.19 | | | | .58 | | | | 72 | | | | .59 | | | | .59 | | | | .72 | |
| | (.19 | ) | | | — | | | | (.19 | ) | | | 24.27 | | | | 11.63 | | | | 63 | | | | .59 | | | | .59 | | | | 1.06 | |
| | (.26 | ) | | | — | | | | (.26 | ) | | | 21.93 | | | | 46.33 | | | | 54 | | | | .62 | | | | .61 | | | | .69 | |
| | (.12 | ) | | | (2.39 | ) | | | (2.51 | ) | | | 38.93 | | | | 5.56 | | | | 372 | | | | .87 | 7 | | | .87 | 7 | | | .70 | 7 |
| | (.16 | ) | | | (.88 | ) | | | (1.04 | ) | | | 39.33 | | | | 42.38 | | | | 325 | | | | .91 | | | | .91 | | | | .42 | |
| | (.12 | ) | | | — | | | | (.12 | ) | | | 28.65 | | | | 19.92 | | | | 197 | | | | .93 | | | | .93 | | | | .53 | |
| | (.18 | ) | | | — | | | | (.18 | ) | | | 24.00 | | | | .32 | | | | 156 | | | | .90 | | | | .90 | | | | .40 | |
| | (.11 | ) | | | — | | | | (.11 | ) | | | 24.10 | | | | 11.27 | | | | 135 | | | | .91 | | | | .91 | | | | .75 | |
| | (.23 | ) | | | — | | | | (.23 | ) | | | 21.77 | | | | 45.84 | | | | 110 | | | | .97 | | | | .97 | | | | .64 | |
| | — | | | | (2.39 | ) | | | (2.39 | ) | | | 37.15 | | | | 5.10 | | | | 7 | | | | 1.68 | 7 | | | 1.68 | 7 | | | (.13 | )7 |
| | — | | | | (.88 | ) | | | (.88 | ) | | | 37.68 | | | | 41.26 | | | | 8 | | | | 1.72 | | | | 1.72 | | | | (.36 | ) |
| | — | | | | — | | | | — | | | | 27.54 | | | | 18.96 | | | | 8 | | | | 1.75 | | | | 1.75 | | | | (.31 | ) |
| | — | | | | — | | | | — | | | | 23.15 | | | | (.52 | ) | | | 10 | | | | 1.72 | | | | 1.72 | | | | (.43 | ) |
| | — | | | | — | | | | — | | | | 23.27 | | | | 10.34 | | | | 13 | | | | 1.74 | | | | 1.74 | | | | (.10 | ) |
| | (.05 | ) | | | — | | | | (.05 | ) | | | 21.09 | | | | 44.65 | | | | 14 | | | | 1.80 | | | | 1.80 | | | | (.18 | ) |
| | — | | | | (2.39 | ) | | | (2.39 | ) | | | 37.09 | | | | 5.11 | | | | 106 | | | | 1.67 | 7 | | | 1.67 | 7 | | | (.11 | )7 |
| | — | | | | (.88 | ) | | | (.88 | ) | | | 37.62 | | | | 41.30 | | | | 94 | | | | 1.71 | | | | 1.71 | | | | (.38 | ) |
| | — | | | | — | | | | — | | | | 27.49 | | | | 18.95 | | | | 60 | | | | 1.74 | | | | 1.74 | | | | (.28 | ) |
| | (.01 | ) | | | — | | | | (.01 | ) | | | 23.11 | | | | (.53 | ) | | | 49 | | | | 1.71 | | | | 1.71 | | | | (.41 | ) |
| | — | | | | — | | | | — | | | | 23.24 | | | | 10.35 | | | | 44 | | | | 1.72 | | | | 1.72 | | | | (.07 | ) |
| | (.06 | ) | | | — | | | | (.06 | ) | | | 21.06 | | | | 44.71 | | | | 36 | | | | 1.79 | | | | 1.79 | | | | (.18 | ) |
See page 26 for footnotes.
Financial highlights (continued)
| | | | | | | | Income (loss) from investment operations1 | |
| | | | | Net asset
value,
beginning
of period | | | Net
investment
income (loss)2 | | | Net gains (losses)
on securities
(both realized
and unrealized) | | | Total from
investment
operations | |
| Class 529-E: | | Six months ended 5/31/20145,6 | | $ | 38.91 | | | $ | .08 | | | $ | 1.96 | | | $ | 2.04 | |
| | | Year ended 11/30/2013 | | | 28.35 | | | | .05 | | | | 11.48 | | | | 11.53 | |
| | | Year ended 11/30/2012 | | | 23.75 | | | | .07 | | | | 4.57 | | | | 4.64 | |
| | | Year ended 11/30/2011 | | | 23.85 | | | | .03 | | | | (.01 | ) | | | .02 | |
| | | Year ended 11/30/2010 | | | 21.57 | | | | .10 | | | | 2.24 | | | | 2.34 | |
| | | Year ended 11/30/2009 | | | 15.01 | | | | .06 | | | | 6.67 | | | | 6.73 | |
| Class 529-F-1: | | Six months ended 5/31/20145,6 | | | 39.33 | | | | .17 | | | | 1.97 | | | | 2.14 | |
| | | Year ended 11/30/2013 | | | 28.65 | | | | .21 | | | | 11.58 | | | | 11.79 | |
| | | Year ended 11/30/2012 | | | 24.01 | | | | .19 | | | | 4.62 | | | | 4.81 | |
| | | Year ended 11/30/2011 | | | 24.09 | | | | .16 | | | | (.03 | ) | | | .13 | |
| | | Year ended 11/30/2010 | | | 21.77 | | | | .21 | | | | 2.27 | | | | 2.48 | |
| | | Year ended 11/30/2009 | | | 15.17 | | | | .15 | | | | 6.73 | | | | 6.88 | |
| Class R-1: | | Six months ended 5/31/20145,6 | | | 37.99 | | | | — | 8 | | | 1.90 | | | | 1.90 | |
| | | Year ended 11/30/2013 | | | 27.72 | | | | (.08 | ) | | | 11.23 | | | | 11.15 | |
| | | Year ended 11/30/2012 | | | 23.27 | | | | (.04 | ) | | | 4.49 | | | | 4.45 | |
| | | Year ended 11/30/2011 | | | 23.39 | | | | (.08 | ) | | | (.01 | ) | | | (.09 | ) |
| | | Year ended 11/30/2010 | | | 21.20 | | | | .01 | | | | 2.21 | | | | 2.22 | |
| | | Year ended 11/30/2009 | | | 14.71 | | | | (.01 | ) | | | 6.57 | | | | 6.56 | |
| Class R-2: | | Six months ended 5/31/20145,6 | | | 38.16 | | | | — | 8 | | | 1.91 | | | | 1.91 | |
| | | Year ended 11/30/2013 | | | 27.84 | | | | (.07 | ) | | | 11.27 | | | | 11.20 | |
| | | Year ended 11/30/2012 | | | 23.37 | | | | (.05 | ) | | | 4.52 | | | | 4.47 | |
| | | Year ended 11/30/2011 | | | 23.47 | | | | (.08 | ) | | | (.02 | ) | | | (.10 | ) |
| | | Year ended 11/30/2010 | | | 21.26 | | | | — | 8 | | | 2.21 | | | | 2.21 | |
| | | Year ended 11/30/2009 | | | 14.76 | | | | (.03 | ) | | | 6.59 | | | | 6.56 | |
| Class R-3: | | Six months ended 5/31/20145,6 | | | 38.98 | | | | .08 | | | | 1.96 | | | | 2.04 | |
| | | Year ended 11/30/2013 | | | 28.38 | | | | .06 | | | | 11.50 | | | | 11.56 | |
| | | Year ended 11/30/2012 | | | 23.77 | | | | .07 | | | | 4.58 | | | | 4.65 | |
| | | Year ended 11/30/2011 | | | 23.87 | | | | .03 | | | | (.02 | ) | | | .01 | |
| | | Year ended 11/30/2010 | | | 21.58 | | | | .11 | | | | 2.25 | | | | 2.36 | |
| | | Year ended 11/30/2009 | | | 15.01 | | | | .07 | | | | 6.67 | | | | 6.74 | |
| Class R-4: | | Six months ended 5/31/20145,6 | | | 39.36 | | | | .15 | | | | 1.96 | | | | 2.11 | |
| | | Year ended 11/30/2013 | | | 28.67 | | | | .16 | | | | 11.60 | | | | 11.76 | |
| | | Year ended 11/30/2012 | | | 24.01 | | | | .16 | | | | 4.63 | | | | 4.79 | |
| | | Year ended 11/30/2011 | | | 24.11 | | | | .12 | | | | (.03 | ) | | | .09 | |
| | | Year ended 11/30/2010 | | | 21.79 | | | | .18 | | | | 2.27 | | | | 2.45 | |
| | | Year ended 11/30/2009 | | | 15.17 | | | | .13 | | | | 6.73 | | | | 6.86 | |
| Class R-5: | | Six months ended 5/31/20145,6 | | | 39.80 | | | | .20 | | | | 1.99 | | | | 2.19 | |
| | | Year ended 11/30/2013 | | | 28.98 | | | | .26 | | | | 11.71 | | | | 11.97 | |
| | | Year ended 11/30/2012 | | | 24.26 | | | | .25 | | | | 4.67 | | | | 4.92 | |
| | | Year ended 11/30/2011 | | | 24.34 | | | | .19 | | | | (.03 | ) | | | .16 | |
| | | Year ended 11/30/2010 | | | 21.97 | | | | .24 | | | | 2.31 | | | | 2.55 | |
| | | Year ended 11/30/2009 | | | 15.31 | | | | .17 | | | | 6.80 | | | | 6.97 | |
| Class R-6: | | Six months ended 5/31/20145,6 | | | 39.73 | | | | .21 | | | | 1.99 | | | | 2.20 | |
| | | Year ended 11/30/2013 | | | 28.93 | | | | .28 | | | | 11.69 | | | | 11.97 | |
| | | Year ended 11/30/2012 | | | 24.23 | | | | .26 | | | | 4.66 | | | | 4.92 | |
| | | Year ended 11/30/2011 | | | 24.31 | | | | .21 | | | | (.03 | ) | | | .18 | |
| | | Year ended 11/30/2010 | | | 21.92 | | | | .27 | | | | 2.28 | | | | 2.55 | |
| | | Period from 5/1/2009 to 11/30/20095,10 | | | 17.22 | | | | .13 | | | | 4.57 | | | | 4.70 | |
| Dividends and distributions | | | | | | | | | | | | | | | | | | | |
Dividends
(from net
investment
income) | | | Distributions
(from capital
gains) | | | Total
dividends
and
distributions | | | Net asset
value, end
of period | | | Total
return3,4 | | | Net assets,
end of period
(in millions) | | | Ratio of
expenses to
average net
assets before
waivers | | | Ratio of
expenses to
average net
assets after
waivers4 | | | Ratio of
net income
(loss) to
average net
assets2,4 | |
| $ | (.05 | ) | | $ | (2.39 | ) | | $ | (2.44 | ) | | $ | 38.51 | | | | 5.41 | % | | $ | 20 | | | | 1.13 | %7 | | | 1.13 | %7 | | | .44 | %7 |
| | (.09 | ) | | | (.88 | ) | | | (.97 | ) | | | 38.91 | | | | 42.04 | | | | 17 | | | | 1.16 | | | | 1.16 | | | | .16 | |
| | (.04 | ) | | | — | | | | (.04 | ) | | | 28.35 | | | | 19.59 | | | | 10 | | | | 1.20 | | | | 1.20 | | | | .26 | |
| | (.12 | ) | | | — | | | | (.12 | ) | | | 23.75 | | | | — | 7 | | | 8 | | | | 1.19 | | | | 1.19 | | | | .11 | |
| | (.06 | ) | | | — | | | | (.06 | ) | | | 23.85 | | | | 10.93 | | | | 7 | | | | 1.21 | | | | 1.21 | | | | .44 | |
| | (.17 | ) | | | — | | | | (.17 | ) | | | 21.57 | | | | 45.45 | | | | 6 | | | | 1.28 | | | | 1.27 | | | | .34 | |
| | (.18 | ) | | | (2.39 | ) | | | (2.57 | ) | | | 38.90 | | | | 5.64 | | | | 26 | | | | .67 | 7 | | | .67 | 7 | | | .90 | 7 |
| | (.23 | ) | | | (.88 | ) | | | (1.11 | ) | | | 39.33 | | | | 42.69 | | | | 22 | | | | .71 | | | | .71 | | | | .62 | |
| | (.17 | ) | | | — | | | | (.17 | ) | | | 28.65 | | | | 20.17 | | | | 13 | | | | .74 | | | | .74 | | | | .73 | |
| | (.21 | ) | | | — | | | | (.21 | ) | | | 24.01 | | | | .47 | | | | 10 | | | | .70 | | | | .70 | | | | .62 | |
| | (.16 | ) | | | — | | | | (.16 | ) | | | 24.09 | | | | 11.47 | | | | 7 | | | | .71 | | | | .71 | | | | .94 | |
| | (.28 | ) | | | — | | | | (.28 | ) | | �� | 21.77 | | | | 46.18 | | | | 6 | | | | .78 | | | | .77 | | | | .79 | |
| | — | | | | (2.39 | ) | | | (2.39 | ) | | | 37.50 | | | | 5.17 | | | | 43 | | | | 1.57 | 7 | | | 1.57 | 7 | | | — | 7,9 |
| | — | | | | (.88 | ) | | | (.88 | ) | | | 37.99 | | | | 41.46 | | | | 33 | | | | 1.59 | | | | 1.59 | | | | (.25 | ) |
| | — | | | | — | | | | — | | | | 27.72 | | | | 19.12 | | | | 23 | | | | 1.61 | | | | 1.61 | | | | (.15 | ) |
| | (.03 | ) | | | — | | | | (.03 | ) | | | 23.27 | | | | (.41 | ) | | | 23 | | | | 1.61 | | | | 1.61 | | | | (.32 | ) |
| | (.03 | ) | | | — | | | | (.03 | ) | | | 23.39 | | | | 10.46 | | | | 22 | | | | 1.62 | | | | 1.62 | | | | .03 | |
| | (.07 | ) | | | — | | | | (.07 | ) | | | 21.20 | | | | 44.78 | | | | 16 | | | | 1.68 | | | | 1.68 | | | | (.08 | ) |
| | — | | | | (2.39 | ) | | | (2.39 | ) | | | 37.68 | | | | 5.17 | | | | 182 | | | | 1.57 | 7 | | | 1.57 | 7 | | | — | 7,9 |
| | — | | | | (.88 | ) | | | (.88 | ) | | | 38.16 | | | | 41.47 | | | | 173 | | | | 1.57 | | | | 1.57 | | | | (.23 | ) |
| | — | | | | — | | | | — | | | | 27.84 | | | | 19.13 | | | | 124 | | | | 1.63 | | | | 1.63 | | | | (.17 | ) |
| | — | | | | — | | | | — | | | | 23.37 | | | | (.43 | ) | | | 112 | | | | 1.63 | | | | 1.63 | | | | (.33 | ) |
| | — | | | | — | | | | — | | | | 23.47 | | | | 10.40 | | | | 118 | | | | 1.67 | | | | 1.67 | | | | (.01 | ) |
| | (.06 | ) | | | — | | | | (.06 | ) | | | 21.26 | | | | 44.58 | | | | 108 | | | | 1.81 | | | | 1.80 | | | | (.19 | ) |
| | (.06 | ) | | | (2.39 | ) | | | (2.45 | ) | | | 38.57 | | | | 5.41 | | | | 316 | | | | 1.13 | 7 | | | 1.13 | 7 | | | .44 | 7 |
| | (.08 | ) | | | (.88 | ) | | | (.96 | ) | | | 38.98 | | | | 42.09 | | | | 262 | | | | 1.15 | | | | 1.15 | | | | .19 | |
| | (.04 | ) | | | — | | | | (.04 | ) | | | 28.38 | | | | 19.62 | | | | 168 | | | | 1.18 | | | | 1.18 | | | | .28 | |
| | (.11 | ) | | | — | | | | (.11 | ) | | | 23.77 | | | | .04 | | | | 150 | | | | 1.17 | | | | 1.17 | | | | .13 | |
| | (.07 | ) | | | — | | | | (.07 | ) | | | 23.87 | | | | 10.98 | | | | 150 | | | | 1.18 | | | | 1.18 | | | | .47 | |
| | (.17 | ) | | | — | | | | (.17 | ) | | | 21.58 | | | | 45.39 | | | | 127 | | | | 1.25 | | | | 1.24 | | | | .36 | |
| | (.14 | ) | | | (2.39 | ) | | | (2.53 | ) | | | 38.94 | | | | 5.56 | | | | 340 | | | | .82 | 7 | | | .82 | 7 | | | .76 | 7 |
| | (.19 | ) | | | (.88 | ) | | | (1.07 | ) | | | 39.36 | | | | 42.52 | | | | 252 | | | | .83 | | | | .83 | | | | .49 | |
| | (.13 | ) | | | — | | | | (.13 | ) | | | 28.67 | | | | 20.06 | | | | 150 | | | | .85 | | | | .85 | | | | .61 | |
| | (.19 | ) | | | — | | | | (.19 | ) | | | 24.01 | | | | .35 | | | | 132 | | | | .85 | | | | .85 | | | | .45 | |
| | (.13 | ) | | | — | | | | (.13 | ) | | | 24.11 | | | | 11.28 | | | | 111 | | | | .86 | | | | .86 | | | | .79 | |
| | (.24 | ) | | | — | | | | (.24 | ) | | | 21.79 | | | | 45.97 | | | | 85 | | | | .90 | | | | .90 | | | | .71 | |
| | (.23 | ) | | | (2.39 | ) | | | (2.62 | ) | | | 39.37 | | | | 5.70 | | | | 145 | | | | .51 | 7 | | | .51 | 7 | | | 1.04 | 7 |
| | (.27 | ) | | | (.88 | ) | | | (1.15 | ) | | | 39.80 | | | | 42.93 | | | | 233 | | | | .53 | | | | .53 | | | | .79 | |
| | (.20 | ) | | | — | | | | (.20 | ) | | | 28.98 | | | | 20.45 | | | | 131 | | | | .54 | | | | .54 | | | | .92 | |
| | (.24 | ) | | | — | | | | (.24 | ) | | | 24.26 | | | | .64 | | | | 111 | | | | .54 | | | | .54 | | | | .76 | |
| | (.18 | ) | | | — | | | | (.18 | ) | | | 24.34 | | | | 11.65 | | | | 133 | | | | .56 | | | | .56 | | | | 1.08 | |
| | (.31 | ) | | | — | | | | (.31 | ) | | | 21.97 | | | | 46.45 | | | | 165 | | | | .59 | | | | .59 | | | | .99 | |
| | (.24 | ) | | | (2.39 | ) | | | (2.63 | ) | | | 39.30 | | | | 5.75 | | | | 1,274 | | | | .47 | 7 | | | .47 | 7 | | | 1.11 | 7 |
| | (.29 | ) | | | (.88 | ) | | | (1.17 | ) | | | 39.73 | | | | 43.02 | | | | 945 | | | | .48 | | | | .48 | | | | .84 | |
| | (.22 | ) | | | — | | | | (.22 | ) | | | 28.93 | | | | 20.48 | | | | 512 | | | | .49 | | | | .49 | | | | .97 | |
| | (.26 | ) | | | — | | | | (.26 | ) | | | 24.23 | | | | .70 | | | | 340 | | | | .49 | | | | .49 | | | | .81 | |
| | (.16 | ) | | | — | | | | (.16 | ) | | | 24.31 | | | | 11.68 | | | | 270 | | | | .51 | | | | .51 | | | | 1.17 | |
| | — | | | | — | | | | — | | | | 21.92 | | | | 27.29 | | | | 154 | | | | .54 | 7 | | | .54 | 7 | | | 1.06 | 7 |
See page 26 for footnotes.
Financial highlights (continued)
| | | Six months
ended
May 31, | | Year ended November 30 |
| | | 20145,6 | | 2013 | | 2012 | | 2011 | | 2010 | | 2009 |
| Portfolio turnover rate for all share classes | | | 15 | % | | | 29 | % | | | 37 | % | | | 45 | % | | | 47 | % | | | 51 | % |
| 1 | Based on average shares outstanding. |
| 2 | For the period ended May 31, 2014, this column reflects the impact of a corporate action event that resulted in a one-time increase to net investment income. If the corporate action event had not occurred, the Class A net investment income per share and ratio of net income to average net assets would have been lower by $.09 and .23 percentage points, respectively. The impact to the other share classes would have been similar. |
| 3 | Total returns exclude any applicable sales charges, including contingent deferred sales charges. |
| 4 | This column reflects the impact, if any, of certain waivers from CRMC. During one of the periods shown, CRMC reduced fees for investment advisory services. |
| 5 | Based on operations for the period shown and, accordingly, is not representative of a full year. |
| 6 | Unaudited. |
| 7 | Annualized. |
| 8 | Amount less than $.01. |
| 9 | Amount less than .01%. |
| 10 | Class R-6 shares were offered beginning May 1, 2009. |
See Notes to Financial Statements
As a fund shareholder, you incur two types of costs: (1) transaction costs, such as initial sales charges on purchase payments and contingent deferred sales charges on redemptions (loads), and (2) ongoing costs, including management fees, distribution and service (12b-1) fees, and other expenses. This example is intended to help you understand your ongoing costs (in dollars) of investing in the fund so you can compare these costs with the ongoing costs of investing in other mutual funds. The example is based on an investment of $1,000 invested at the beginning of the period and held for the entire six-month period (December 1, 2013, through May 31, 2014).
Actual expenses:
The first line of each share class in the table on the following page provides information about actual account values and actual expenses. You may use the information in this line, together with the amount you invested, to estimate the expenses that you paid over the period. Simply divide your account value by $1,000 (for example, an $8,600 account value divided by $1,000 = 8.6), then multiply the result by the number in the first line under the heading entitled “Expenses paid during period” to estimate the expenses you paid on your account during this period.
Hypothetical example for comparison purposes:
The second line of each share class in the table on the following page provides information about hypothetical account values and hypothetical expenses based on the actual expense ratio for the share class and an assumed rate of return of 5.00% per year before expenses, which is not the actual return of the share class. The hypothetical account values and expenses may not be used to estimate the actual ending account balance or expenses you paid for the period. You may use this information to compare the ongoing costs of investing in the fund and other funds. To do so, compare this 5.00% hypothetical example with the 5.00% hypothetical examples that appear in the shareholder reports of the other funds.
Notes:
Retirement plan participants may be subject to certain fees charged by the plan sponsor, and Class F-1, F-2 and 529-F-1 shareholders may be subject to fees charged by financial intermediaries, typically ranging from 0.75% to 1.50% of assets annually depending on services offered. You can estimate the impact of these fees by adding the amount of the fees to the total estimated expenses you paid on your account during the period as calculated above. In addition, your ending account value would be lower by the amount of these fees.
Note that the expenses shown in the table on the following page are meant to highlight your ongoing costs only and do not reflect any transactional costs, such as sales charges (loads). Therefore, the second line of each share class in the table is useful in comparing ongoing costs only and will not help you determine the relative total costs of owning different funds. In addition, if these transactional costs were included, your costs would have been higher.
| | | Beginning
account value
12/1/2013 | | | Ending
account value
5/31/2014 | | | Expenses
paid during
period* | | | Annualized
expense
ratio | |
| Class A — actual return | | $ | 1,000.00 | | | $ | 1,055.84 | | | $ | 4.05 | | | | .79 | % |
| Class A — assumed 5% return | | | 1,000.00 | | | | 1,020.99 | | | | 3.98 | | | | .79 | |
| Class B — actual return | | | 1,000.00 | | | | 1,051.98 | | | | 7.98 | | | | 1.56 | |
| Class B — assumed 5% return | | | 1,000.00 | | | | 1,017.15 | | | | 7.85 | | | | 1.56 | |
| Class C — actual return | | | 1,000.00 | | | | 1,051.51 | | | | 8.18 | | | | 1.60 | |
| Class C — assumed 5% return | | | 1,000.00 | | | | 1,016.95 | | | | 8.05 | | | | 1.60 | |
| Class F-1 — actual return | | | 1,000.00 | | | | 1,055.71 | | | | 4.31 | | | | .84 | |
| Class F-1 — assumed 5% return | | | 1,000.00 | | | | 1,020.74 | | | | 4.23 | | | | .84 | |
| Class F-2 — actual return | | | 1,000.00 | | | | 1,057.21 | | | | 2.92 | | | | .57 | |
| Class F-2 — assumed 5% return | | | 1,000.00 | | | | 1,022.09 | | | | 2.87 | | | | .57 | |
| Class 529-A — actual return | | | 1,000.00 | | | | 1,055.59 | | | | 4.46 | | | | .87 | |
| Class 529-A — assumed 5% return | | | 1,000.00 | | | | 1,020.59 | | | | 4.38 | | | | .87 | |
| Class 529-B — actual return | | | 1,000.00 | | | | 1,051.01 | | | | 8.59 | | | | 1.68 | |
| Class 529-B — assumed 5% return | | | 1,000.00 | | | | 1,016.55 | | | | 8.45 | | | | 1.68 | |
| Class 529-C — actual return | | | 1,000.00 | | | | 1,051.13 | | | | 8.54 | | | | 1.67 | |
| Class 529-C — assumed 5% return | | | 1,000.00 | | | | 1,016.60 | | | | 8.40 | | | | 1.67 | |
| Class 529-E — actual return | | | 1,000.00 | | | | 1,054.13 | | | | 5.79 | | | | 1.13 | |
| Class 529-E — assumed 5% return | | | 1,000.00 | | | | 1,019.30 | | | | 5.69 | | | | 1.13 | |
| Class 529-F-1 — actual return | | | 1,000.00 | | | | 1,056.41 | | | | 3.44 | | | | .67 | |
| Class 529-F-1 — assumed 5% return | | | 1,000.00 | | | | 1,021.59 | | | | 3.38 | | | | .67 | |
| Class R-1 — actual return | | | 1,000.00 | | | | 1,051.73 | | | | 8.03 | | | | 1.57 | |
| Class R-1 — assumed 5% return | | | 1,000.00 | | | | 1,017.10 | | | | 7.90 | | | | 1.57 | |
| Class R-2 — actual return | | | 1,000.00 | | | | 1,051.72 | | | | 8.03 | | | | 1.57 | |
| Class R-2 — assumed 5% return | | | 1,000.00 | | | | 1,017.10 | | | | 7.90 | | | | 1.57 | |
| Class R-3 — actual return | | | 1,000.00 | | | | 1,054.12 | | | | 5.79 | | | | 1.13 | |
| Class R-3 — assumed 5% return | | | 1,000.00 | | | | 1,019.30 | | | | 5.69 | | | | 1.13 | |
| Class R-4 — actual return | | | 1,000.00 | | | | 1,055.59 | | | | 4.20 | | | | .82 | |
| Class R-4 — assumed 5% return | | | 1,000.00 | | | | 1,020.84 | | | | 4.13 | | | | .82 | |
| Class R-5 — actual return | | | 1,000.00 | | | | 1,057.05 | | | | 2.62 | | | | .51 | |
| Class R-5 — assumed 5% return | | | 1,000.00 | | | | 1,022.39 | | | | 2.57 | | | | .51 | |
| Class R-6 — actual return | | | 1,000.00 | | | | 1,057.48 | | | | 2.41 | | | | .47 | |
| Class R-6 — assumed 5% return | | | 1,000.00 | | | | 1,022.59 | | | | 2.37 | | | | .47 | |
| * | The “expenses paid during period” are equal to the “annualized expense ratio,” multiplied by the average account value over the period, multiplied by the number of days in the period, and divided by 365 (to reflect the one-half year period). |
Offices of the fund and of the investment adviser
Capital Research and Management Company
333 South Hope Street
Los Angeles, CA 90071-1406
6455 Irvine Center Drive
Irvine, CA 92618-4518
Transfer agent for shareholder accounts
American Funds Service Company
(Write to the address near you.)
P.O. Box 6007
Indianapolis, IN 46206-6007
P.O. Box 2280
Norfolk, VA 23501-2280
Custodian of assets
State Street Bank and Trust Company
One Lincoln Street
Boston, MA 02111
Counsel
O’Melveny & Myers LLP
400 South Hope Street
Los Angeles, CA 90071-2899
Independent registered public accounting firm
PricewaterhouseCoopers LLP
601 South Figueroa Street
Los Angeles, CA 90017-3874
Principal underwriter
American Funds Distributors, Inc.
333 South Hope Street
Los Angeles, CA 90071-1406
Investors should carefully consider investment objectives, risks, charges and expenses. This and other important information is contained in the fund prospectus and summary prospectus, which can be obtained from your financial professional and should be read carefully before investing. You may also call American Funds Service Company (AFS) at (800) 421-4225 or visit the American Funds website at americanfunds.com.
“American Funds Proxy Voting Procedures and Principles” — which describes how we vote proxies relating to portfolio securities — is available on the American Funds website or upon request by calling AFS. The fund files its proxy voting record with the U.S. Securities and Exchange Commission (SEC) for the 12 months ended June 30 by August 31. The proxy voting record is available free of charge on the SEC website at sec.gov and on the American Funds website.
A complete May 31, 2014, portfolio of The New Economy Fund’s investments is available free of charge by calling AFS or visiting the SEC website (where it is part of Form N-CSR).
The New Economy Fund files a complete list of its portfolio holdings with the SEC for the first and third quarters of each fiscal year on Form N-Q. This filing is available free of charge on the SEC website. You may also review or, for a fee, copy this filing at the SEC’s Public Reference Room in Washington, D.C. Additional information regarding the operation of the Public Reference Room may be obtained by calling the SEC’s Office of Investor Education and Advocacy at (800) SEC-0330. Additionally, the list of portfolio holdings is available by calling AFS.
This report is for the information of shareholders of The New Economy Fund, but it also may be used as sales literature when preceded or accompanied by the current prospectus or summary prospectus, which gives details about charges, expenses, investment objectives and operating policies of the fund. If used as sales material after September 30, 2014, this report must be accompanied by an American Funds statistical update for the most recently completed calendar quarter.
The American Funds Advantage
Since 1931, American Funds, part of Capital Group, has helped investors pursue long-term investment success. Our consistent approach — in combination with The Capital SystemSM — has resulted in a superior long-term track record.
| | Aligned with investor success |
| | We base our decisions on a long-term perspective, which we believe aligns our goals with the interests of our clients. Our portfolio managers average 26 years of investment experience, including 21 years at our company, reflecting a career commitment to our long-term approach.1 |
| | |
| | The Capital SystemSM |
| | Our investment process, The Capital System, combines individual accountability with teamwork. Each fund is divided into portions that are managed independently by investment professionals with diverse backgrounds, ages and investment approaches. An extensive global research effort is the backbone of our system. |
| | |
| | Superior long-term track record |
| | Our equity funds have beaten their Lipper peer indexes in 90% of 10-year periods and 96% of 20-year periods. Our fixed-income funds have beaten their Lipper indexes in 56% of 10-year periods and 57% of 20-year periods.2 Our fund management fees have been among the lowest in the industry.3 |
| | 1 | Portfolio manager experience as of December 31, 2013. |
| | 2 | Based on Class A share results for rolling periods through December 31, 2013. Periods covered are the shorter of the fund’s lifetime or since the comparable Lipper index inception date (except SMALLCAP World Fund, for which the Lipper average was used). |
| | 3 | Based on management fees for the 20-year period ended December 31, 2013, versus comparable Lipper categories, excluding funds of funds. |

ITEM 2 – Code of Ethics
Not applicable for filing of semi-annual reports to shareholders.
ITEM 3 – Audit Committee Financial Expert
Not applicable for filing of semi-annual reports to shareholders.
ITEM 4 – Principal Accountant Fees and Services
Not applicable for filing of semi-annual reports to shareholders.
ITEM 5 – Audit Committee of Listed Registrants
Not applicable to this Registrant, insofar as the Registrant is not a listed issuer as defined in Rule 10A-3 under the Securities Exchange Act of 1934.
ITEM 6 – Schedule of Investments
 | The New Economy Fund Investment portfolio May 31, 2014 |
unaudited
| Common stocks 87.60% | | |
| | | Value |
| Health care 20.98% | Shares | (000) |
| | | |
| Gilead Sciences, Inc.1 | 4,246,563 | $ 344,863 |
| Thermo Fisher Scientific Inc. | 2,446,000 | 285,962 |
| Alexion Pharmaceuticals, Inc.1 | 1,649,900 | 274,411 |
| Grifols, SA, Class A, non-registered shares | 1,601,000 | 86,750 |
| Grifols, SA, Class B, non-registered shares | 1,318,175 | 54,625 |
| Grifols, SA, Class B (ADR) | 1,040,085 | 43,288 |
| Hologic, Inc.1 | 7,121,450 | 174,048 |
| Amgen Inc. | 1,199,995 | 139,187 |
| Stryker Corp. | 1,507,750 | 127,390 |
| McKesson Corp. | 600,000 | 113,784 |
| Biogen Idec Inc.1 | 354,150 | 113,105 |
| Illumina, Inc.1 | 643,776 | 101,878 |
| NuVasive, Inc.1,2 | 2,917,700 | 97,276 |
| Myriad Genetics, Inc.1 | 2,922,695 | 96,917 |
| BioMarin Pharmaceutical Inc.1 | 1,596,050 | 92,507 |
| Mesoblast Ltd.1,2 | 20,210,000 | 91,033 |
| Synageva BioPharma Corp.1 | 998,587 | 81,035 |
| William Demant Holding A/S1 | 873,000 | 78,367 |
| UCB SA | 962,700 | 76,744 |
| UnitedHealth Group Inc. | 921,300 | 73,363 |
| St. Jude Medical, Inc. | 1,087,700 | 70,592 |
| Endo International PLC1 | 803,900 | 56,747 |
| Bayer AG | 360,000 | 52,067 |
| Aetna Inc. | 577,000 | 44,746 |
| Insulet Corp.1 | 1,185,000 | 43,407 |
| Envision Healthcare Holdings, Inc.1 | 1,000,000 | 34,480 |
| Boston Scientific Corp.1 | 2,551,292 | 32,733 |
| QIAGEN NV1 | 1,290,814 | 29,614 |
| Humana Inc. | 227,533 | 28,319 |
| Edwards Lifesciences Corp.1 | 185,600 | 15,071 |
| | | 2,954,309 |
| Information technology 18.05% | | |
| | | |
| Google Inc., Class A1 | 262,225 | 149,901 |
| Google Inc., Class C1 | 262,225 | 147,103 |
| Samsung Electronics Co. Ltd. | 163,047 | 230,618 |
| Baidu, Inc., Class A (ADR)1 | 886,400 | 147,142 |
| Intuit Inc. | 1,717,200 | 136,157 |
| Accenture PLC, Class A | 1,638,300 | 133,440 |
| Texas Instruments Inc. | 2,555,000 | 120,034 |
| AAC Technologies Holdings Inc. | 17,712,000 | 104,518 |
| Oracle Corp. | 2,110,500 | 88,683 |
| Adobe Systems Inc.1 | 1,175,000 | 75,835 |
| Motorola Solutions, Inc. | 1,080,425 | 72,842 |
| Gemalto NV | 666,300 | 72,344 |
| Common stocks | | |
| | | Value |
| Information technology (continued) | Shares | (000) |
| | | |
| Seagate Technology | 1,309,397 | $ 70,354 |
| Yandex NV, Class A1 | 2,098,000 | 65,332 |
| Apple Inc. | 102,600 | 64,946 |
| Delta Electronics, Inc. | 9,598,000 | 62,417 |
| Cray Inc.1 | 1,990,000 | 55,800 |
| Western Union Co. | 3,435,000 | 55,544 |
| Yahoo! Inc.1 | 1,535,000 | 53,188 |
| Murata Manufacturing Co., Ltd. | 620,000 | 52,517 |
| Autodesk, Inc.1 | 1,000,000 | 52,370 |
| Avago Technologies Ltd. | 731,000 | 51,660 |
| Trimble Navigation Ltd.1 | 1,410,300 | 50,870 |
| SAP AG | 650,000 | 49,760 |
| TriQuint Semiconductor, Inc.1 | 3,161,510 | 49,193 |
| Hexagon AB, Class B | 1,426,838 | 44,839 |
| Mail.Ru Group Ltd. (GDR)1 | 1,300,000 | 44,252 |
| Youku Tudou Inc., Class A (ADR)1 | 1,800,000 | 35,100 |
| Freescale Semiconductor, Ltd.1 | 1,551,980 | 34,438 |
| NetEase, Inc. (ADR) | 430,800 | 30,656 |
| Palo Alto Networks, Inc.1 | 396,000 | 29,664 |
| ASML Holding NV | 272,340 | 23,373 |
| Cognizant Technology Solutions Corp., Class A1 | 455,500 | 22,142 |
| EMC Corp. | 750,000 | 19,920 |
| Hittite Microwave Corp. | 215,000 | 12,642 |
| CoStar Group, Inc.1 | 73,500 | 11,653 |
| Demand Media, Inc.1 | 1,500,000 | 6,900 |
| Microsoft Corp. | 165,000 | 6,755 |
| Pandora Media, Inc.1 | 257,000 | 6,304 |
| | | 2,541,206 |
| Consumer discretionary 17.41% | | |
| | | |
| Netflix, Inc.1 | 934,800 | 390,587 |
| Galaxy Entertainment Group Ltd. | 28,120,000 | 224,693 |
| Daily Mail and General Trust PLC, Class A, nonvoting | 10,236,701 | 149,367 |
| lululemon athletica inc.1 | 3,299,197 | 147,243 |
| MGM China Holdings Ltd. | 36,772,000 | 128,060 |
| Amazon.com, Inc.1 | 403,400 | 126,083 |
| Kingfisher PLC | 15,865,000 | 104,244 |
| ProSiebenSat.1 Media AG | 2,071,000 | 94,249 |
| DIRECTV1 | 1,024,600 | 84,468 |
| Melco Crown Entertainment Ltd. (ADR) | 2,448,900 | 84,414 |
| Thomas Cook Group PLC1 | 26,608,023 | 73,145 |
| Garmin Ltd. | 1,100,000 | 64,801 |
| Twenty-First Century Fox, Inc., Class A | 1,729,325 | 61,235 |
| Sands China Ltd. | 7,780,000 | 56,697 |
| Time Warner Inc. | 800,000 | 55,864 |
| JCDecaux SA | 1,400,000 | 55,783 |
| Lions Gate Entertainment Corp. | 2,105,000 | 55,004 |
| Reed Elsevier PLC | 3,430,000 | 54,676 |
| Liberty Global PLC, Class A1 | 872,700 | 39,289 |
| Liberty Global PLC, Class C1 | 205,400 | 8,791 |
| William Hill PLC | 7,900,000 | 47,088 |
| SJM Holdings Ltd. | 16,340,000 | 46,894 |
| John Wiley & Sons, Inc., Class A | 700,000 | 38,346 |
| Home Depot, Inc. | 470,300 | 37,732 |
| Common stocks | | |
| | | Value |
| Consumer discretionary (continued) | Shares | (000) |
| | | |
| WPP PLC | 1,650,000 | $ 35,595 |
| Kering SA | 157,000 | 34,692 |
| Nordstrom, Inc. | 473,300 | 32,213 |
| AutoNation, Inc.1 | 519,000 | 29,671 |
| Comcast Corp., Class A | 538,900 | 28,131 |
| NIKE, Inc., Class B | 273,200 | 21,012 |
| Zhongsheng Group Holdings Ltd. | 14,264,500 | 17,884 |
| YUM! Brands, Inc. | 214,500 | 16,583 |
| Multi Screen Media Private Ltd.1,3,4 | 48,466 | 4,009 |
| Multi Screen Media Private Ltd. (INR denominated)1,3,4 | 31,400 | 2,597 |
| | | 2,451,140 |
| Financials 11.36% | | |
| | | |
| AIA Group Ltd. | 27,722,200 | 138,916 |
| Crown Castle International Corp. | 1,389,400 | 106,609 |
| SVB Financial Group1 | 882,800 | 93,091 |
| Endurance Specialty Holdings Ltd. | 1,526,000 | 78,925 |
| Wells Fargo & Co. | 1,362,300 | 69,178 |
| Banco Espírito Santo, SA1 | 50,930,000 | 69,078 |
| Eurobank Ergasias SA1 | 122,295,386 | 68,350 |
| Altisource Residential Corp. | 2,442,418 | 68,119 |
| Ocwen Financial Corp.1 | 1,655,980 | 58,075 |
| Principal Financial Group, Inc. | 1,200,000 | 56,124 |
| Piraeus Bank SA1 | 22,482,456 | 55,164 |
| Aberdeen Asset Management PLC | 7,370,000 | 54,986 |
| HDFC Bank Ltd. (ADR) | 1,200,000 | 54,036 |
| Banco Santander, SA1 | 5,233,895 | 53,681 |
| Marsh & McLennan Companies, Inc. | 1,000,000 | 50,270 |
| Chongqing Rural Commercial Bank Co., Ltd., Class H1 | 97,595,000 | 45,065 |
| Fairfax Financial Holdings Ltd. | 100,000 | 45,035 |
| Bankia, SA1 | 22,130,000 | 44,978 |
| Mizuho Financial Group, Inc. | 22,900,000 | 44,540 |
| JPMorgan Chase & Co. | 800,000 | 44,456 |
| Agricultural Bank of China, Class H | 97,780,000 | 43,637 |
| HSBC Holdings PLC | 3,770,215 | 39,755 |
| Fifth Third Bancorp | 1,800,000 | 37,242 |
| Industrial and Commercial Bank of China Ltd., Class H | 48,736,000 | 31,682 |
| Bank of China Ltd., Class H | 55,556,000 | 26,442 |
| UBS AG | 1,134,312 | 22,775 |
| Altisource Asset Management Corp.1 | 22,400 | 22,023 |
| China Construction Bank Corp., Class H | 27,994,050 | 20,545 |
| Home Loan Servicing Solutions, Ltd. | 898,300 | 20,032 |
| Global Logistic Properties Ltd. | 6,870,000 | 15,226 |
| Altisource Portfolio Solutions SA1 | 127,400 | 14,041 |
| Longfor Properties Co. Ltd. | 5,855,500 | 7,409 |
| | | 1,599,485 |
| Industrials 7.81% | | |
| | | |
| Nielsen NV | 3,762,000 | 181,554 |
| Ryanair Holdings PLC (ADR)1 | 2,274,700 | 129,339 |
| CSX Corp. | 3,592,222 | 105,611 |
| Union Pacific Corp. | 437,977 | 87,276 |
| United Continental Holdings, Inc.1 | 1,690,996 | 75,029 |
| Verisk Analytics, Inc., Class A1 | 1,226,000 | 72,567 |
| Common stocks | | |
| | | Value |
| Industrials (continued) | Shares | (000) |
| | | |
| Sensata Technologies Holding NV1 | 1,506,300 | $ 64,605 |
| PT AKR Corporindo Tbk | 173,899,680 | 61,442 |
| Intertek Group PLC | 1,000,000 | 48,912 |
| JG Summit Holdings, Inc. | 39,268,800 | 44,245 |
| Babcock International Group PLC | 2,076,923 | 42,264 |
| BAE Systems PLC | 5,940,000 | 42,126 |
| Alliance Global Group, Inc. | 58,300,000 | 39,506 |
| Towers Watson & Co., Class A | 338,500 | 38,085 |
| AirAsia Bhd. | 45,583,400 | 35,468 |
| Danaher Corp. | 250,000 | 19,608 |
| KBR, Inc. | 255,000 | 6,194 |
| Beacon Roofing Supply, Inc.1 | 156,000 | 5,382 |
| | | 1,099,213 |
| Telecommunication services 3.39% | | |
| | | |
| SoftBank Corp. | 1,842,700 | 132,953 |
| Verizon Communications Inc. | 2,242,141 | 112,017 |
| T-Mobile US, Inc.1 | 1,545,000 | 53,040 |
| MTN Group Ltd. | 2,200,000 | 46,367 |
| Telephone and Data Systems, Inc. | 1,331,100 | 36,885 |
| Avanti Communications Group PLC1,2 | 6,933,372 | 33,035 |
| CenturyLink, Inc. | 727,700 | 27,413 |
| Vodafone Group PLC | 7,636,363 | 26,816 |
| United States Cellular Corp. | 188,434 | 8,093 |
| | | 476,619 |
| Energy 1.83% | | |
| | | |
| Schlumberger Ltd. | 1,122,400 | 116,775 |
| Cheniere Energy, Inc.1 | 920,378 | 62,687 |
| FMC Technologies, Inc.1 | 715,400 | 41,536 |
| Halliburton Co. | 480,000 | 31,027 |
| C&J Energy Services, Inc.1 | 182,600 | 5,589 |
| | | 257,614 |
| Consumer staples 1.54% | | |
| | | |
| Costco Wholesale Corp. | 698,000 | 80,982 |
| Associated British Foods PLC | 1,408,000 | 71,228 |
| Walgreen Co. | 900,000 | 64,719 |
| | | 216,929 |
| Materials 0.36% | | |
| | | |
| Syngenta AG | 130,000 | 50,011 |
| Miscellaneous 4.87% | | |
| | | |
| Other common stocks in initial period of acquisition | | 685,931 |
| Total common stocks (cost: $8,232,028,000) | | 12,332,457 |
| Rights & warrants 0.04% | | |
| | | |
| Miscellaneous 0.04% | | |
| | | |
| Other rights & warrants in initial period of acquisition | | 5,845 |
| Total rights & warrants (cost: $0) | | 5,845 |
| | | |
| | | |
| | | |
| | Principal amount | Value |
| Short-term securities 12.71% | (000) | (000) |
| | | |
| Federal Home Loan Bank 0.05%–0.135% due 6/6–10/1/2014 | $398,400 | $ 398,372 |
| Freddie Mac 0.055%–0.15% due 6/10–10/9/2014 | 203,700 | 203,679 |
| Coca-Cola Co. 0.12%–0.20% due 7/22–12/1/20145 | 191,500 | 191,420 |
| IBM Corp. 0.06%–0.09% due 6/26–8/20/20145 | 147,900 | 147,889 |
| Fannie Mae 0.07%–0.13% due 7/21–11/12/2014 | 107,400 | 107,385 |
| Procter & Gamble Co. 0.08%–0.10% due 6/3–8/14/20145 | 97,000 | 96,993 |
| Chevron Corp. 0.08% due 6/30/20145 | 57,700 | 57,693 |
| National Rural Utilities Cooperative Finance Corp. 0.09%–0.10% due 6/19–6/30/2014 | 50,400 | 50,397 |
| United Parcel Service Inc. 0.12% due 10/2/20145 | 50,000 | 49,977 |
| United Technologies Corp. 0.07% due 6/25/20145 | 49,300 | 49,298 |
| Private Export Funding Corp. 0.17%–0.18% due 11/12–11/18/20145 | 45,100 | 45,063 |
| Paccar Financial Corp. 0.07% due 6/24–6/25/2014 | 43,100 | 43,098 |
| Army and Air Force Exchange Service 0.07% due 6/11/20145 | 35,800 | 35,799 |
| Emerson Electric Co. 0.085%–0.11% due 7/21–7/30/20145 | 34,300 | 34,294 |
| Google Inc. 0.11% due 8/7/20145 | 32,400 | 32,395 |
| NetJets Inc. 0.06% due 6/5/20145 | 30,300 | 30,300 |
| 3M Co. 0.08% due 6/23/20145 | 29,100 | 29,097 |
| Wal-Mart Stores, Inc. 0.05% due 6/23/20145 | 27,800 | 27,799 |
| Pfizer Inc 0.09% due 6/17/20145 | 27,700 | 27,699 |
| Microsoft Corp. 0.09% due 8/27/20145 | 25,000 | 24,994 |
| General Electric Co. 0.06% due 6/2/2014 | 22,400 | 22,400 |
| PepsiCo Inc. 0.07%–0.08% due 6/5–7/25/20145 | 22,100 | 22,099 |
| Walt Disney Co. 0.07% due 6/27/20145 | 21,400 | 21,399 |
| Federal Farm Credit Banks 0.08% due 8/11/2014 | 20,000 | 19,998 |
| eBay Inc. 0.11% due 8/12/20145 | 17,300 | 17,296 |
| John Deere Financial Ltd. 0.08% due 6/25/20145 | 3,000 | 3,000 |
| Total short-term securities (cost: $1,789,771,000) | | 1,789,833 |
| Total investment securities (cost: $10,021,799,000) | | 14,128,135 |
| Other assets less liabilities | | (49,889) |
| Net assets | | $14,078,246 |
As permitted by U.S. Securities and Exchange Commission regulations, “Miscellaneous” securities include holdings in their first year of acquisition that have not previously been publicly disclosed.
| 1 | Security did not produce income during the last 12 months. |
| 2 | Represents an affiliated company as defined under the Investment Company Act of 1940. |
| 3 | Valued under fair value procedures adopted by authority of the board of trustees. The total value of all such securities was $6,606,000, which represented .05% of the net assets of the fund. |
| 4 | Acquired through a private placement transaction exempt from registration under the Securities Act of 1933. May be subject to legal or contractual restrictions on resale. Further details on these holdings appear below. |
| | | | | Percent |
| | Acquisition | Cost | Value | of net |
| | date(s) | (000) | (000) | assets |
| | | | | |
| Multi Screen Media Private Ltd. | 9/6/2000–4/18/2002 | $ 21,520 | $ 4,009 | .03% |
| Multi Screen Media Private Ltd. (INR denominated) | 9/6/2000 | 10,055 | 2,597 | .02 |
| Total restricted securities | | $31,575 | $6,606 | .05% |
| 5 | Acquired in a transaction exempt from registration under section 4(2) of the Securities Act of 1933. May be resold in the U.S. in transactions exempt from registration, normally to qualified institutional buyers. The total value of all such securities was $944,504,000, which represented 6.71% of the net assets of
the fund. |
Key to abbreviations
ADR = American Depositary Receipts
GDR = Global Depositary Receipts
INR = Indian rupees
Investments are not FDIC-insured, nor are they deposits of or guaranteed by a bank or any other entity, so they may lose value.
Investors should carefully consider investment objectives, risks, charges and expenses. This and other important information is contained in the fund prospectus and summary prospectus, which can be obtained from your financial professional and should be read carefully before investing. You may also call American Funds Service Company (AFS) at (800) 421-4225 or visit the American Funds website at americanfunds.com.
MFGEFPX-014-0714O-S42164
ITEM 7 – Disclosure of Proxy Voting Policies and Procedures for Closed-End Management Investment Companies
Not applicable to this Registrant, insofar as the Registrant is not a closed-end management investment company.
ITEM 8 – Portfolio Managers of Closed-End Management Investment Companies
Not applicable to this Registrant, insofar as the Registrant is not a closed-end management investment company.
ITEM 9 – Purchases of Equity Securities by Closed-End Management Investment Company and Affiliated Purchasers
Not applicable to this Registrant, insofar as the Registrant is not a closed-end management investment company.
ITEM 10 – Submission of Matters to a Vote of Security Holders
There have been no material changes to the procedures by which shareholders may recommend nominees to the Registrant’s board of trustees since the Registrant last submitted a proxy statement to its shareholders. The procedures are as follows. The Registrant has a nominating and governance committee comprised solely of persons who are not considered ‘‘interested persons’’ of the Registrant within the meaning of the Investment Company Act of 1940, as amended. The committee periodically reviews such issues as the board’s composition, responsibilities, committees, compensation and other relevant issues, and recommends any appropriate changes to the full board of trustees. While the committee normally is able to identify from its own resources an ample number of qualified candidates, it will consider shareholder suggestions of persons to be considered as nominees to fill future vacancies on the board. Such suggestions must be sent in writing to the nominating and governance committee of the Registrant, c/o the Registrant’s Secretary, and must be accompanied by complete biographical and occupational data on the prospective nominee, along with a written consent of the prospective nominee for consideration of his or her name by the nominating and governance committee.
ITEM 11 – Controls and Procedures
| (a) | The Registrant’s Principal Executive Officer and Principal Financial Officer have concluded, based on their evaluation of the Registrant’s disclosure controls and procedures (as such term is defined in Rule 30a-3 under the Investment Company Act of 1940), that such controls and procedures are adequate and reasonably designed to achieve the purposes described in paragraph (c) of such rule. |
| | |
| (b) | There were no changes in the Registrant’s internal controls over financial reporting (as defined in Rule 30a-3(d) under the Investment Company Act of 1940) that occurred during the Registrant’s second fiscal quarter of the period covered by this report that has materially affected, or is reasonably likely to materially affect, the Registrant’s internal control over financial reporting. |
ITEM 12 – Exhibits
| (a)(1) | Not applicable for filing of semi-annual reports to shareholders. |
| | |
| (a)(2) | The certifications required by Rule 30a-2 of the Investment Company Act of 1940 and Sections 302 and 906 of the Sarbanes-Oxley Act of 2002 are attached as exhibits hereto. |
SIGNATURES
Pursuant to the requirements of the Securities Exchange Act of 1934 and the Investment Company Act of 1940, the Registrant has duly caused this report to be signed on its behalf by the undersigned, thereunto duly authorized.
| | THE NEW ECONOMY FUND |
| | |
| | By /s/ Paul F. Roye |
| | Paul F. Roye, Executive Vice President and Principal Executive Officer |
| | |
| | Date: July 31, 2014 |
Pursuant to the requirements of the Securities Exchange Act of 1934 and the Investment Company Act of 1940, this report has been signed below by the following persons on behalf of the Registrant and in the capacities and on the dates indicated.
| By /s/ Paul F. Roye |
Paul F. Roye, Executive Vice President and Principal Executive Officer |
| |
| Date: July 31, 2014 |
| By /s/ Neal F. Wellons |
Neal F. Wellons, Treasurer and Principal Financial Officer |
| |
| Date: July 31, 2014 |