UNITED STATES
SECURITIES AND EXCHANGE COMMISSION
Washington, D.C. 20549
FORM N-CSR
Certified Shareholder Report of
Registered Management Investment Companies
Investment Company Act File Number: 811-03735
The New Economy Fund
(Exact Name of Registrant as Specified in Charter)
333 South Hope Street
Los Angeles, California 90071
(Address of Principal Executive Offices)
Registrant's telephone number, including area code: (213) 486-9200
Date of fiscal year end: November 30
Date of reporting period: May 31, 2016
Michael W. Stockton
The New Economy Fund
333 South Hope Street
Los Angeles, California 90071
(Name and Address of Agent for Service)
ITEM 1 – Reports to Stockholders

 | The New Economy Fund® |
| |
| Semi-annual report |
| for the six months ended |
| May 31, 2016 |
| |
The New Economy Fund seeks long-term growth of capital. Current income is a secondary consideration.
This fund is one of more than 40 offered by one of the nation’s largest mutual fund families, American Funds, from Capital Group. For 85 years, Capital has invested with a long-term focus based on thorough research and attention to risk.
Fund results shown in this report, unless otherwise indicated, are for Class A shares at net asset value. If a sales charge (maximum 5.75%) had been deducted, the results would have been lower. Results are for past periods and are not predictive of results for future periods. Current and future results may be lower or higher than those shown. Share prices and returns will vary, so investors may lose money. Investing for short periods makes losses more likely. Investments are not FDIC-insured, nor are they deposits of or guaranteed by a bank or any other entity, so they may lose value. For current information and month-end results, visit americanfunds.com.
Here are the average annual total returns on a $1,000 investment with all distributions reinvested for periods ended June 30, 2016 (the most recent calendar quarter-end):
| Class A shares | 1 year | 5 years | 10 years |
| | | | |
| Reflecting 5.75% maximum sales charge | –14.16% | 8.95% | 7.10% |
For other share class results, visit americanfunds.com and americanfundsretirement.com.
The total annual fund operating expense ratio was 0.78% for Class A shares as of the prospectus dated February 1, 2016.
Investment results assume all distributions are reinvested and reflect applicable fees and expenses. When applicable, investment results reflect fee waivers, without which results would have been lower. Visit americanfunds.com for more information.
Investing outside the United States may be subject to risks, such as currency fluctuations, periods of illiquidity and price volatility. These risks may be heightened in connection with investments in developing countries. Global diversification can help reduce these risks. Refer to the fund prospectus and the Risk Factors section of this report for more information on these and other risks associated with investing in the fund.

Fellow investors:
The U.S. stock market experienced a volatile period during the six months ended May 31, 2016. As measured by Standard & Poor’s 500 Composite Index, the market declined 6.59% for the first half of the period, and then bounced back to end the period with a 1.93% total return.
The New Economy Fund’s return fell 3.95% with all distributions reinvested. This trailed its benchmarks, including the 1.93% rise of the unmanaged S&P 500, a market capitalization-weighted index based on the results of 500 widely held common
Results at a glance
For periods ended May 31, 2016, with all distributions reinvested
| | | Cumulative total returns | | Average annual total returns |
| | | 6 months | | 1 year | | 5 years | | 10 years | | Lifetime
(since 12/1/83) |
| | | | | | | | | | | |
| The New Economy Fund (Class A shares) | | | –3.95 | % | | | –6.61 | % | | | 10.59 | % | | | 8.07 | % | | | 10.92 | % |
| Standard & Poor’s 500 Composite Index1 | | | 1.93 | | | | 1.72 | | | | 11.67 | | | | 7.41 | | | | 10.78 | |
| MSCI ACWI (All Country World Index)1,2,3 | | | 0.01 | | | | –5.42 | | | | 5.17 | | | | 4.32 | | | | N/A | |
| Global Service and Information Index1,3,4 | | | –0.25 | | | | –3.24 | | | | 9.77 | | | | 5.47 | | | | N/A | |
| Lipper Growth Funds Index5 | | | –0.79 | | | | –1.67 | | | | 10.19 | | | | 6.49 | | | | 9.03 | |
| Lipper International Funds Index3,5 | | | –1.92 | | | | –9.49 | | | | 2.13 | | | | 2.67 | | | | N/A | |
| 1 | The market indexes are unmanaged and, therefore, have no expenses. Investors cannot invest directly in an index. |
| 2 | Results reflect dividends net of withholding taxes. |
| 3 | This index was not in existence as of the date the fund began investment operations; therefore, lifetime results are not available. |
| 4 | The index is compiled by Capital Research and Management Company, the investment adviser to the fund. |
| 5 | Lipper indexes track the largest mutual funds (no more than 30), represented by one share class per fund, in the corresponding Lipper category. |
stocks, and the 0.01% increase of the unmanaged MSCI ACWI (All Country World Index)*, which measures equity market results based on more than 40 developed and emerging market country indexes.
The fund’s return also lagged the –0.25% return of the Global Service and Information Index (an unmanaged index that tracks companies in the services and information sectors around the world), the –0.79% return of the Lipper Growth Funds Index (which measures a number of U.S. growth funds) and the 1.92% decline of the Lipper International Funds Index (which measures funds invested in securities whose primary trading markets are outside the U.S.).
For the 10-year period ending May 31, 2016, The New Economy Fund had an average annual total return of 8.07%, which exceeded the 7.41% return of the S&P 500, the 4.32% return of the MSCI ACWI and the 5.47% return of the Global Service and Information Index. We believe the 10-year and lifetime returns (see the table on page 1) are important for investors to consider as they are most reflective of our long-term approach and philosophy.
Select economies continue to improve
Global economies continue to experience an uneven recovery from the financial crisis. U.S. economic growth slowed, but still remains positive. More robust growth will depend on the strength of the U.S. consumer, a rise in U.S. productivity, a pickup in global economies, and the level of interest rates.
*Results reflect dividends net of withholding taxes.
Where the fund’s assets are invested (by country of domicile)
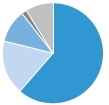
| | As of May 31, 2016 | | | Percent of net assets |
| ■ | United States | | | 61.4 | % |
| ■ | Asia & Pacific Basin | | | 17.5 | |
| ■ | Europe | | | 10.7 | |
| ■ | Other (including Latin America) | | | 1.6 | |
| ■ | Short-term securities & other assets less liabilities | | | 8.8 | |
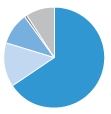
| | As of November 30, 2015 | | | Percent of net assets |
| ■ | United States | | | 65.8 | % |
| ■ | Asia & Pacific Basin | | | 14.0 | |
| ■ | Europe | | | 10.3 | |
| ■ | Other (including Latin America) | | | 0.8 | |
| ■ | Short-term securities & other assets less liabilities | | | 9.1 | |
Central banks in key economies remain accommodative. The U.S. Federal Reserve raised interest rates for the first time in nine years. Absolute rates remain very low, however, and the Fed appears to be waiting to see a more robust economy before it raises rates again. Around the world, countries such as Denmark, Japan, Sweden and Switzerland have negative interest rates — meaning their benchmark rate to borrow is below zero.
These monetary policies are meant to stimulate demand and boost growth, but so far there has been no meaningful effect on inflation and real consumer spending. That said, the global financial system overall is stronger than it has been in several years.
Many countries continue to have anemic growth. China’s growth rate has slowed, and it is unclear when it will accelerate given challenging debt levels and inefficiencies in many large state-owned enterprises. India may be able to maintain its current level of growth given the implementation of pro-growth policies. Brazil’s economy is under pressure, though with the recent change in leadership, there is hope that its economy can begin to improve.
The fund
Results during the period lagged as some of our largest holdings had a challenging few months following strong returns over the past fiscal year. However, we continue to be optimistic about these companies’ growth prospects over the long term.
At this point in the market cycle, selectivity is particularly important. Market instability is providing us the opportunity to invest in quality companies at attractive valuations.
A look ahead
We may see more market volatility. That would present opportunities. We continue to conduct thorough global research, fundamental analysis and a long-term approach to identify companies with good growth prospects and reasonably valued stocks.
Thank you for your continued faith in our investment philosophy. We look forward to reporting to you again in six months.
Sincerely,
 |  |
| Timothy D. Armour | Claudia P. Huntington |
| Vice Chairman of the Board | President |
July 15, 2016
For current information about the fund, visit americanfunds.com.
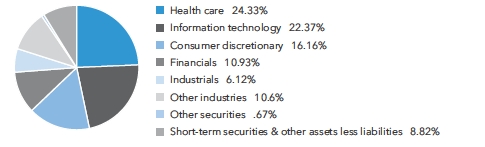
| Summary investment portfolio May 31, 2016 | unaudited |
| | |
| Industry sector diversification | Percent of net assets |
| Country diversification by domicile | | | Percent of net assets |
| United States | | | 61.38 | % |
| United Kingdom | | | 5.44 | |
| China | | | 5.34 | |
| Euro zone* | | | 5.14 | |
| Japan | | | 4.39 | |
| India | | | 2.25 | |
| Hong Kong | | | 2.25 | |
| South Korea | | | 1.22 | |
| Philippines | | | .87 | |
| Other countries | | | 2.90 | |
| Short-term securities & other assets less liabilities | | | 8.82 | |
| * | Countries using the euro as a common currency; those represented in the fund’s portfolio are Belgium, France, Germany, Ireland, Italy, the Netherlands and Spain. |
| Common stocks 90.51% | | | Shares | | | | Value
(000) | |
| Health care 24.33% | | | | | | | | |
| Thermo Fisher Scientific Inc. | | | 2,446,000 | | | $ | 371,229 | |
| Alexion Pharmaceuticals, Inc.1 | | | 2,296,694 | | | | 346,571 | |
| Amgen Inc. | | | 1,510,413 | | | | 238,570 | |
| Hologic, Inc.1 | | | 6,853,850 | | | | 235,841 | |
| BioMarin Pharmaceutical Inc.1 | | | 2,047,430 | | | | 183,552 | |
| NuVasive, Inc.1,2 | | | 3,004,500 | | | | 163,355 | |
| McKesson Corp. | | | 885,000 | | | | 162,079 | |
| Stryker Corp. | | | 1,389,250 | | | | 154,429 | |
| Kite Pharma, Inc.1,2 | | | 2,915,400 | | | | 149,414 | |
| Express Scripts Holding Co.1 | | | 1,923,300 | | | | 145,305 | |
| Ultragenyx Pharmaceutical Inc.1 | | | 1,553,545 | | | | 113,564 | |
| UnitedHealth Group Inc. | | | 821,300 | | | | 109,783 | |
| PerkinElmer, Inc. | | | 1,834,355 | | | | 100,431 | |
| Myriad Genetics, Inc.1 | | | 2,714,800 | | | | 92,005 | |
| Illumina, Inc.1 | | | 633,200 | | | | 91,706 | |
| AbbVie Inc. | | | 1,419,001 | | | | 89,298 | |
| Other securities | | | | | | | 877,619 | |
| | | | | | | | 3,624,751 | |
| | | Shares | | | Value
(000) | |
| Information technology 22.37% | | | | | | | | |
| Alphabet Inc., Class C1 | | | 232,688 | | | $ | 171,193 | |
| Alphabet Inc., Class A1 | | | 192,695 | | | | 144,300 | |
| Tencent Holdings Ltd. | | | 13,137,000 | | | | 292,976 | |
| Skyworks Solutions, Inc. | | | 3,467,150 | | | | 231,467 | |
| Baidu, Inc., Class A (ADR)1 | | | 1,064,232 | | | | 190,008 | |
| Accenture PLC, Class A | | | 1,568,300 | | | | 186,581 | |
| Qorvo, Inc.1 | | | 3,294,480 | | | | 167,920 | |
| Trimble Navigation Ltd.1 | | | 5,432,430 | | | | 138,962 | |
| Intuit Inc. | | | 1,128,200 | | | | 120,334 | |
| Texas Instruments Inc. | | | 1,865,000 | | | | 113,019 | |
| Oracle Corp. | | | 2,401,814 | | | | 96,553 | |
| International Business Machines Corp. | | | 350,000 | | | | 53,809 | |
| Apple Inc. | | | 297,000 | | | | 29,658 | |
| Other securities | | | | | | | 1,395,014 | |
| | | | | | | | 3,331,794 | |
| | | | | | | | | |
| Consumer discretionary 16.16% | | | | | | | | |
| Netflix, Inc.1 | | | 4,501,100 | | | | 461,678 | |
| Sony Corp. | | | 8,829,000 | | | | 247,166 | |
| lululemon athletica inc.1 | | | 3,205,900 | | | | 208,480 | |
| Amazon.com, Inc.1 | | | 285,000 | | | | 205,995 | |
| Galaxy Entertainment Group Ltd. | | | 49,690,000 | | | | 166,896 | |
| Twenty-First Century Fox, Inc., Class A | | | 4,200,000 | | | | 121,296 | |
| Daily Mail and General Trust PLC, Class A, non-voting | | | 10,896,701 | | | | 108,108 | |
| Other securities | | | | | | | 888,007 | |
| | | | | | | | 2,407,626 | |
| | | | | | | | | |
| Financials 10.93% | | | | | | | | |
| HDFC Bank Ltd.3 | | | 4,875,000 | | | | 101,335 | |
| HDFC Bank Ltd. (ADR) | | | 1,200,000 | | | | 77,232 | |
| Kotak Mahindra Bank Ltd. | | | 14,190,882 | | | | 157,453 | |
| American International Group, Inc. | | | 2,200,000 | | | | 127,336 | |
| Endurance Specialty Holdings Ltd. | | | 1,776,000 | | | | 120,626 | |
| Barclays PLC | | | 39,981,344 | | | | 105,622 | |
| AIA Group Ltd. | | | 17,591,800 | | | | 102,892 | |
| Prudential PLC | | | 4,900,000 | | | | 97,937 | |
| Other securities | | | | | | | 738,215 | |
| | | | | | | | 1,628,648 | |
| | | | | | | | | |
| Industrials 6.12% | | | | | | | | |
| Nielsen Holdings PLC | | | 2,513,100 | | | | 134,174 | |
| CSX Corp. | | | 3,809,400 | | | | 100,682 | |
| Union Pacific Corp. | | | 1,075,954 | | | | 90,584 | |
| Ryanair Holdings PLC (ADR) | | | 1,026,999 | | | | 89,760 | |
| Other securities | | | | | | | 496,023 | |
| | | | | | | | 911,223 | |
| | | | | | | | | |
| Consumer staples 2.73% | | | | | | | | |
| Associated British Foods PLC | | | 2,059,540 | | | | 87,818 | |
| Other securities | | | | | | | 318,717 | |
| | | | | | | | 406,535 | |
| Common stocks (continued) | | Shares | | | Value
(000) | |
| Telecommunication services 1.46% | | | | | | | | |
| AT&T Inc. | | | 2,237,088 | | | $ | 87,582 | |
| Other securities | | | | | | | 129,446 | |
| | | | | | | | 217,028 | |
| | | | | | | | | |
| Other 1.85% | | | | | | | | |
| Other securities | | | | | | | 276,273 | |
| | | | | | | | | |
| Miscellaneous 4.56% | | | | | | | | |
| Other common stocks in initial period of acquisition | | | | | | | 679,828 | |
| | | | | | | | | |
| Total common stocks (cost: $10,763,408,000) | | | | | | | 13,483,706 | |
| | | | | | | | | |
| Convertible stocks 0.39% | | | | | | | | |
| Health care 0.39% | | | | | | | | |
| Other securities | | | | | | | 58,570 | |
| | | | | | | | | |
| Total convertible stocks (cost: $22,686,000) | | | | | | | 58,570 | |
| | | | | | | | | |
| Bonds, notes & other debt instruments 0.28% | Principal amount
(000) | | | | | |
| U.S. Treasury bonds & notes 0.28% | | | | | | | | |
| Other securities | | | | | | | 42,317 | |
| | | | | | | | | |
| Total bonds, notes & other debt instruments (cost: $42,882,000) | | | | | | | 42,317 | |
| | | | | | | | | |
| Short-term securities 8.95% | | | | | | | | |
| Alphabet Inc. 0.53% due 7/6/20164 | $ | | 31,000 | | | | 30,988 | |
| Apple Inc. 0.45%–0.49% due 7/18/2016–8/16/20164 | | | 120,200 | | | | 120,106 | |
| Federal Home Loan Bank 0.29%–0.58% due 6/1/2016–7/22/2016 | | | 336,700 | | | | 336,628 | |
| IBM Corp. 0.44% due 6/20/2016–6/27/20164 | | | 106,800 | | | | 106,777 | |
| Pfizer Inc. 0.47%–0.54% due 6/21/2016–8/24/20164 | | | 168,200 | | | | 168,032 | |
| Other securities | | | | | | | 570,215 | |
| | | | | | | | | |
| Total short-term securities (cost: $1,332,661,000) | | | | | | | 1,332,746 | |
| Total investment securities 100.13% (cost: $12,161,637,000) | | | | | | | 14,917,339 | |
| Other assets less liabilities (0.13)% | | | | | | | (19,946 | ) |
| | | | | | | | | |
| Net assets 100.00% | | | | | | $ | 14,897,393 | |
This summary investment portfolio is designed to streamline the report and help investors better focus on the fund’s principal holdings. See the inside back cover for details on how to obtain a complete schedule of portfolio holdings.
As permitted by U.S. Securities and Exchange Commission regulations, “Miscellaneous” securities include holdings in their first year of acquisition that have not previously been publicly disclosed.
“Other securities” includes all issues that are not disclosed separately in the summary investment portfolio. One of these securities (with a value of $58,570,000, a cost of $22,686,000, and which represented 0.39% of the net assets of the fund) was acquired on 6/10/2014 through a private placement transaction exempt from registration under the Securities Act of 1933, which may subject it to legal or contractual restrictions on resale.
Investments in affiliates
A company is an affiliate of the fund under the Investment Company Act of 1940 if the fund’s holdings in that company represent 5% or more of the outstanding voting shares. The value of the fund’s affiliated-company holdings is either shown in the summary investment portfolio or included in the value of “Other securities” under the respective industry sectors. Further details on such holdings and related transactions during the six months ended May 31, 2016, appear below.
| | | Beginning
shares | | | Additions | | | Reductions | | | Ending
shares | | | Dividend
income
(000) | | | Value of
affiliates at
5/31/2016
(000) | |
| NuVasive, Inc.1 | | | 2,854,000 | | | | 150,500 | | | | — | | | | 3,004,500 | | | $ | — | | | $ | 163,355 | |
| Kite Pharma, Inc.1 | | | 2,797,500 | | | | 117,900 | | | | — | | | | 2,915,400 | | | | — | | | | 149,414 | |
| Cray Inc.1 | | | 2,503,010 | | | | — | | | | 200,000 | | | | 2,303,010 | | | | — | | | | 76,736 | |
| Mesoblast Ltd.1 | | | 21,900,000 | | | | — | | | | — | | | | 21,900,000 | | | | — | | | | 31,261 | |
| Mesoblast Ltd. (ADR)1 | | | 372,800 | | | | — | | | | — | | | | 372,800 | | | | — | | | | 2,635 | |
| Avanti Communications Group PLC1 | | | 8,688,970 | | | | — | | | | — | | | | 8,688,970 | | | | — | | | | 8,746 | |
| Transocean Partners LLC5 | | | 2,544,143 | | | | — | | | | 2,544,143 | | | | — | | | | 922 | | | | — | |
| | | | | | | | | | | | | | | | | | | $ | 922 | | | $ | 432,147 | |
The following footnotes apply to either the individual securities noted or one or more of the securities aggregated and listed as a single line item.
| 1 | Security did not produce income during the last 12 months. |
| 2 | Represents an affiliated company as defined under the Investment Company Act of 1940. |
| 3 | Valued under fair value procedures adopted by authority of the board of trustees. The total value of all such securities, including those in “Miscellaneous” and “Other securities,” was $160,264,000, which represented 1.08% of the net assets of the fund. |
| 4 | Acquired in a transaction exempt from registration under Section 4(2) of the Securities Act of 1933. May be resold in the U.S. in transactions exempt from registration, normally to qualified institutional buyers. The total value of all such securities, including those in “Other securities,” was $742,021,000, which represented 4.98% of the net assets of the fund. |
| 5 | Unaffiliated issuer at 5/31/2016. |
Key to abbreviations
ADR = American Depositary Receipts
See Notes to Financial Statements
Financial statements
| Statement of assets and liabilities | | unaudited |
| at May 31, 2016 | | (dollars in thousands) |
| | | |
| Assets: | | | | | | | | |
| Investment securities, at value: | | | | | | | | |
| Unaffiliated issuers (cost: $11,698,561) | | $ | 14,485,192 | | | | | |
| Affiliated issuers (cost: $463,076) | | | 432,147 | | | $ | 14,917,339 | |
| Cash | | | | | | | 225 | |
| Cash denominated in currencies other than U.S. dollars (cost: $1,796) | | | | | | | 1,796 | |
| Receivables for: | | | | | | | | |
| Sales of investments | | | 86,872 | | | | | |
| Sales of fund’s shares | | | 9,920 | | | | | |
| Dividends and interest | | | 19,642 | | | | | |
| Other | | | 590 | | | | 117,024 | |
| | | | | | | | 15,036,384 | |
| Liabilities: | | | | | | | | |
| Payables for: | | | | | | | | |
| Purchases of investments | | | 96,664 | | | | | |
| Repurchases of fund’s shares | | | 16,713 | | | | | |
| Investment advisory services | | | 4,768 | | | | | |
| Services provided by related parties | | | 5,295 | | | | | |
| Trustees’ deferred compensation | | | 2,145 | | | | | |
| Non-U.S. taxes | | | 13,252 | | | | | |
| Other | | | 154 | | | | 138,991 | |
| Net assets at May 31, 2016 | | | | | | $ | 14,897,393 | |
| | | | | | | | | |
| Net assets consist of: | | | | | | | | |
| Capital paid in on shares of beneficial interest | | | | | | $ | 11,704,024 | |
| Undistributed net investment income | | | | | | | 5,833 | |
| Undistributed net realized gain | | | | | | | 444,612 | |
| Net unrealized appreciation | | | | | | | 2,742,924 | |
| Net assets at May 31, 2016 | | | | | | $ | 14,897,393 | |
See Notes to Financial Statements
(dollars and shares in thousands, except per-share amounts)
Shares of beneficial interest issued and outstanding (no stated par value) —
unlimited shares authorized (425,089 total shares outstanding)
| | | Net assets | | | Shares
outstanding | | | Net asset value
per share | |
| Class A | | $ | 9,972,481 | | | | 283,136 | | | $ | 35.22 | |
| Class B | | | 11,221 | | | | 342 | | | | 32.82 | |
| Class C | | | 494,083 | | | | 15,290 | | | | 32.31 | |
| Class F-1 | | | 346,997 | | | | 9,832 | | | | 35.29 | |
| Class F-2 | | | 696,192 | | | | 19,778 | | | | 35.20 | |
| Class 529-A | | | 418,084 | | | | 11,976 | | | | 34.91 | |
| Class 529-B | | | 1,834 | | | | 56 | | | | 32.80 | |
| Class 529-C | | | 114,781 | | | | 3,506 | | | | 32.74 | |
| Class 529-E | | | 21,196 | | | | 615 | | | | 34.47 | |
| Class 529-F-1 | | | 32,924 | | | | 944 | | | | 34.88 | |
| Class R-1 | | | 50,402 | | | | 1,516 | | | | 33.24 | |
| Class R-2 | | | 164,983 | | | | 4,938 | | | | 33.41 | |
| Class R-2E | | | 1,041 | | | | 30 | | | | 34.94 | |
| Class R-3 | | | 300,206 | | | | 8,692 | | | | 34.54 | |
| Class R-4 | | | 373,688 | | | | 10,704 | | | | 34.91 | |
| Class R-5E | | | 9 | | | | — | * | | | 35.11 | |
| Class R-5 | | | 149,582 | | | | 4,226 | | | | 35.40 | |
| Class R-6 | | | 1,747,689 | | | | 49,508 | | | | 35.30 | |
*Amount less than one thousand.
See Notes to Financial Statements
| Statement of operations | unaudited |
| for the six months ended May 31, 2016 | (dollars in thousands) |
| | | | | | | |
| Investment income: | | | | | | | | |
| Income: | | | | | | | | |
| Dividends (net of non-U.S. taxes of $2,763; also includes $922 from affiliates) | | $ | 89,318 | | | | | |
| Interest | | | 3,176 | | | $ | 92,494 | |
| Fees and expenses*: | | | | | | | | |
| Investment advisory services | | | 28,288 | | | | | |
| Distribution services | | | 17,257 | | | | | |
| Transfer agent services | | | 9,834 | | | | | |
| Administrative services | | | 1,676 | | | | | |
| Reports to shareholders | | | 463 | | | | | |
| Registration statement and prospectus | | | 645 | | | | | |
| Trustees’ compensation | | | 165 | | | | | |
| Auditing and legal | | | 215 | | | | | |
| Custodian | | | 522 | | | | | |
| Other | | | 308 | | | | | |
| Total fees and expenses before reimbursement | | | 59,373 | | | | | |
| Less transfer agent services reimbursement | | | — | † | | | | |
| Total fees and expenses after reimbursement | | | | | | | 59,373 | |
| Net investment income | | | | | | | 33,121 | |
| | | | | | | | | |
| Net realized gain and unrealized depreciation: | | | | | | | | |
| Net realized gain on: | | | | | | | | |
| Investments (net of non-U.S. taxes of $55; also includes $12,123 net loss from affiliates) | | | 344,694 | | | | | |
| Currency transactions | | | 106 | | | | 344,800 | |
| Net unrealized (depreciation) appreciation on: | | | | | | | | |
| Investments (net of non-U.S. taxes of $12,986) | | | (1,009,352 | ) | | | | |
| Currency translations | | | 152 | | | | (1,009,200 | ) |
| Net realized gain and unrealized depreciation | | | | | | | (664,400 | ) |
| | | | | | | | | |
| Net decrease in net assets resulting from operations | | | | | | $ | (631,279 | ) |
*Additional information related to class-specific fees and expenses is included in the Notes to Financial Statements.
†Amount less than one thousand.
See Notes to Financial Statements
Statements of changes in net assets
(dollars in thousands)
| | | Six months ended | | | Year ended | |
| | | May 31,
2016* | | | November 30,
2015 | |
| | | | | | | | | |
| Operations: | | | | | | | | |
| Net investment income | | $ | 33,121 | | | $ | 42,301 | |
| Net realized gain | | | 344,800 | | | �� | 997,984 | |
| Net unrealized depreciation | | | (1,009,200 | ) | | | (437,629 | ) |
| Net (decrease) increase in net assets resulting from operations | | | (631,279 | ) | | | 602,656 | |
| | | | | | | | | |
| Dividends and distributions paid to shareholders: | | | | | | | | |
| Dividends from net investment income | | | (64,296 | ) | | | (72,804 | ) |
| Distributions from net realized gain on investments | | | (836,882 | ) | | | (1,095,957 | ) |
| Total dividends and distributions paid to shareholders | | | (901,178 | ) | | | (1,168,761 | ) |
| | | | | | | | | |
| Net capital share transactions | | | 694,043 | | | | 1,672,107 | |
| | | | | | | | | |
| Total (decrease) increase in net assets | | | (838,414 | ) | | | 1,106,002 | |
| | | | | | | | | |
| Net assets: | | | | | | | | |
| Beginning of period | | | 15,735,807 | | | | 14,629,805 | |
| End of period (including undistributed net investment income: $5,833 and $37,008, respectively) | | $ | 14,897,393 | | | $ | 15,735,807 | |
*Unaudited.
See Notes to Financial Statements
| Notes to financial statements | unaudited |
1. Organization
The New Economy Fund (the “fund”) is registered under the Investment Company Act of 1940 as an open-end, diversified management investment company. The fund seeks long-term growth of capital. Current income is a secondary consideration.
The fund has 18 share classes consisting of five retail share classes (Classes A, B and C, as well as two F share classes, F-1 and F-2), five 529 college savings plan share classes (Classes 529-A, 529-B, 529-C, 529-E and 529-F-1) and eight retirement plan share classes (Classes R-1, R-2, R-2E, R-3, R-4, R-5E, R-5 and R-6). The 529 college savings plan share classes can be used to save for college education. The retirement plan share classes are generally offered only through eligible employer-sponsored retirement plans. The fund’s share classes are described further in the following table:
| Share class | | Initial sales charge | | Contingent deferred sales
charge upon redemption | | Conversion feature | |
| Classes A and 529-A | | Up to 5.75% | | None (except 1% for certain redemptions within one year of purchase without an initial sales charge) | | None | |
| Classes B and 529-B* | | None | | Declines from 5% to 0% for redemptions within six years of purchase | | Classes B and 529-B convert to Classes A and 529-A, respectively, after eight years | |
| Class C | | None | | 1% for redemptions within one year of purchase | | Class C converts to Class F-1 after 10 years | |
| Class 529-C | | None | | 1% for redemptions within one year of purchase | | None | |
| Class 529-E | | None | | None | | None | |
| Classes F-1, F-2 and 529-F-1 | | None | | None | | None | |
Classes R-1, R-2, R-2E,
R-3, R-4, R-5E, R-5 and R-6 | | None | | None | | None | |
*Class B and 529-B shares of the fund are not available for purchase.
Holders of all share classes have equal pro rata rights to the assets, dividends and liquidation proceeds of the fund. Each share class has identical voting rights, except for the exclusive right to vote on matters affecting only its class. Share classes have different fees and expenses (“class-specific fees and expenses”), primarily due to different arrangements for distribution, transfer agent and administrative services. Differences in class-specific fees and expenses will result in differences in net investment income and, therefore, the payment of different per-share dividends by each share class.
2. Significant accounting policies
The fund is an investment company that applies the accounting and reporting guidance issued in Topic 946 by the U.S. Financial Accounting Standards Board. The fund’s financial statements have been prepared to comply with U.S. generally accepted accounting principles (“U.S. GAAP”). These principles require the fund’s investment adviser to make estimates and assumptions that affect reported amounts and disclosures. Actual results could differ from those estimates. Subsequent events, if any, have been evaluated through the date of issuance in the preparation of the financial statements. The fund follows the significant accounting policies described in this section, as well as the valuation policies described in the next section on valuation.
Security transactions and related investment income — Security transactions are recorded by the fund as of the date the trades are executed with brokers. Realized gains and losses from security transactions are determined based on the specific identified cost of the securities. In the event a security is purchased with a delayed payment date, the fund will segregate liquid assets sufficient to meet its payment obligations. Dividend income is recognized on the ex-dividend date and interest income is recognized on an accrual basis. Market discounts, premiums and original issue discounts on fixed-income securities are amortized daily over the expected life of the security.
Class allocations — Income, fees and expenses (other than class-specific fees and expenses) and realized and unrealized gains and losses are allocated daily among the various share classes based on their relative net assets. Class-specific fees and expenses, such as distribution, transfer agent and administrative services, are charged directly to the respective share class.
Dividends and distributions to shareholders — Dividends and distributions to shareholders are recorded on the ex-dividend date.
Currency translation — Assets and liabilities, including investment securities, denominated in currencies other than U.S. dollars are translated into U.S. dollars at the exchange rates supplied by one or more pricing vendors on the valuation date. Purchases and sales of investment securities and income and expenses are translated into U.S. dollars at the exchange rates on the dates of such transactions. The effects of changes in exchange rates on investment securities are included with the net realized gain or loss and net unrealized appreciation or depreciation on investments in the fund’s statement of operations. The realized gain or loss and unrealized appreciation or depreciation resulting from all other transactions denominated in currencies other than U.S. dollars are disclosed separately.
3. Valuation
Capital Research and Management Company (“CRMC”), the fund’s investment adviser, values the fund’s investments at fair value as defined by U.S. GAAP. The net asset value of each share class of the fund is generally determined as of approximately 4:00 p.m. New York time each day the New York Stock Exchange is open.
Methods and inputs — The fund’s investment adviser uses the following methods and inputs to establish the fair value of the fund’s assets and liabilities. Use of particular methods and inputs may vary over time based on availability and relevance as market and economic conditions evolve.
Equity securities are generally valued at the official closing price of, or the last reported sale price on, the exchange or market on which such securities are traded, as of the close of business on the day the securities are being valued or, lacking any sales, at the last available bid price. Prices for each security are taken from the principal exchange or market on which the security trades.
Fixed-income securities, including short-term securities, are generally valued at prices obtained from one or more pricing vendors. Vendors value such securities based on one or more of the inputs described in the following table. The table provides examples of inputs that are commonly relevant for valuing particular classes of fixed-income securities in which the fund is authorized to invest. However, these classifications are not exclusive, and any of the inputs may be used to value any other class of fixed-income security.
| Fixed-income class | Examples of standard inputs |
| All | Benchmark yields, transactions, bids, offers, quotations from dealers and trading systems, new issues, spreads and other relationships observed in the markets among comparable securities; and proprietary pricing models such as yield measures calculated using factors such as cash flows, financial or collateral performance and other reference data (collectively referred to as “standard inputs”) |
| Corporate bonds & notes; convertible securities | Standard inputs and underlying equity of the issuer |
| Bonds & notes of governments & government agencies | Standard inputs and interest rate volatilities |
When the fund’s investment adviser deems it appropriate to do so (such as when vendor prices are unavailable or deemed to be not representative), fixed-income securities will be valued in good faith at the mean quoted bid and ask prices that are reasonably and timely available (or bid prices, if ask prices are not available) or at prices for securities of comparable maturity, quality and type.
Securities with both fixed-income and equity characteristics, or equity securities traded principally among fixed-income dealers, are generally valued in the manner described for either equity or fixed-income securities, depending on which method is deemed most appropriate by the fund’s investment adviser.
Securities and other assets for which representative market quotations are not readily available or are considered unreliable by the fund’s investment adviser are fair valued as determined in good faith under fair valuation guidelines adopted by authority of the fund’s board of trustees as further described. The investment adviser follows fair valuation guidelines, consistent with U.S. Securities and Exchange Commission rules and guidance, to consider relevant principles and factors when making fair value determinations. The investment adviser considers relevant indications of value that are reasonably and timely available to it in determining the fair value to be assigned to a particular security, such as the type and cost of the security; contractual or legal restrictions on resale of the security; relevant financial or business developments of the issuer; actively traded similar or related securities; conversion or exchange rights on the security; related corporate actions; significant events occurring after the close of trading in the security; and changes in overall market conditions. In addition, the closing prices of equity securities that trade in markets outside U.S. time zones may be adjusted to reflect significant events that occur after the close of local trading but before the net asset value of each share class of the fund is determined. Fair valuations and valuations of investments that are not actively trading involve judgment and may differ materially from valuations that would have been used had greater market activity occurred.
Processes and structure — The fund’s board of trustees has delegated authority to the fund’s investment adviser to make fair value determinations, subject to board oversight. The investment adviser has established a Joint Fair Valuation Committee (the “Fair Valuation Committee”) to administer, implement and oversee the fair valuation process, and to make fair value decisions. The Fair Valuation Committee regularly reviews its own fair value decisions, as well as decisions made under its standing instructions to the investment adviser’s valuation teams. The Fair Valuation Committee reviews changes in fair value measurements from period to period and may, as deemed appropriate, update the fair valuation guidelines to better reflect the results of back testing and address new or evolving issues. The Fair Valuation Committee reports any changes to the fair valuation guidelines to the board of trustees with supplemental information to support the changes. The fund’s board and audit committee also regularly review reports that describe fair value determinations and methods.
The fund’s investment adviser has also established a Fixed-Income Pricing Review Group to administer and oversee the fixed-income valuation process, including the use of fixed-income pricing vendors. This group regularly reviews pricing vendor information and market data. Pricing decisions, processes and controls over security valuation are also subject to additional internal reviews, including an annual control self-evaluation program facilitated by the investment adviser’s compliance group.
Classifications — The fund’s investment adviser classifies the fund’s assets and liabilities into three levels based on the inputs used to value the assets or liabilities. Level 1 values are based on quoted prices in active markets for identical securities. Level 2 values are based on significant observable market inputs, such as quoted prices for similar securities and quoted prices in inactive markets. Certain securities trading outside the U.S. may transfer between Level 1 and Level 2 due to valuation adjustments resulting from significant market movements following the close of local trading. Level 3 values are based on significant unobservable inputs that reflect the investment adviser’s determination of assumptions that market participants might reasonably use in valuing the securities. The valuation levels are not necessarily an indication of the risk or liquidity associated with the underlying investment. For example, U.S. government securities are reflected as Level 2 because the inputs used to determine fair value may not always be quoted prices in an active market. The following table presents the fund’s valuation levels as of May 31, 2016 (dollars in thousands):
| | | Investment securities | |
| | | Level 1* | | | Level 2 | | | Level 3 | | | Total | |
| Assets: | | | | | | | | | | | | | | | | |
| Common stocks: | | | | | | | | | | | | | | | | |
| Health care | | $ | 3,624,751 | | | $ | — | | | $ | — | | | $ | 3,624,751 | |
| Information technology | | | 3,331,794 | | | | — | | | | — | | | | 3,331,794 | |
| Consumer discretionary | | | 2,407,626 | | | | — | | | | — | | | | 2,407,626 | |
| Financials | | | 1,527,313 | | | | 101,335 | | | | — | | | | 1,628,648 | |
| Industrials | | | 911,223 | | | | — | | | | — | | | | 911,223 | |
| Consumer staples | | | 406,535 | | | | — | | | | — | | | | 406,535 | |
| Telecommunication services | | | 217,028 | | | | — | | | | — | | | | 217,028 | |
| Other | | | 276,273 | | | | — | | | | — | | | | 276,273 | |
| Miscellaneous | | | 679,469 | | | | 359 | | | | — | | | | 679,828 | |
| Convertible stocks | | | — | | | | — | | | | 58,570 | | | | 58,570 | |
| Bonds, notes & other debt instruments | | | — | | | | 42,317 | | | | — | | | | 42,317 | |
| Short-term securities | | | — | | | | 1,332,746 | | | | — | | | | 1,332,746 | |
| Total | | $ | 13,382,012 | | | $ | 1,476,757 | | | $ | 58,570 | | | $ | 14,917,339 | |
| * | Securities with a value of $2,982,711,000, which represented 20.02% of the net assets of the fund, transferred from Level 2 to Level 1 since the prior fiscal year-end, primarily due to a lack of significant market movements following the close of local trading and due to observable quoted prices in an active market. |
4. Risk factors
Investing in the fund may involve certain risks including, but not limited to, those described below.
Market conditions — The prices of, and the income generated by, the common stocks and other securities held by the fund may decline — sometimes rapidly or unpredictably — due to various factors, including events or conditions affecting the general economy or particular industries; overall market changes; local, regional or global political, social or economic instability; governmental or governmental agency responses to economic conditions; and currency exchange rate, interest rate and commodity price fluctuations. The fund may be subject to additional risks because it invests in a more limited group of sectors and industries than the broad market.
Issuer risks — The prices of, and the income generated by, securities held by the fund may decline in response to various factors directly related to the issuers of such securities, including reduced demand for an issuer’s goods or services, poor management performance and strategic initiatives such as mergers, acquisitions or dispositions, and the market response to any such initiatives.
Investing in growth-oriented stocks — Growth-oriented common stocks and other equity-type securities (such as preferred stocks, convertible preferred stocks and convertible bonds) may involve larger price swings and greater potential for loss than other types of investments. These risks may be even greater in the case of smaller capitalization stocks.
Investing outside the U.S. — Securities of issuers domiciled outside the U.S., or with significant operations or revenues outside the U.S., may lose value because of adverse political, social, economic or market developments (including social instability, regional conflicts, terrorism and war) in the countries or regions in which the issuers operate or generate revenue. These securities may also lose value due to changes in foreign currency exchange rates against the U.S. dollar and/or currencies of other countries. Issuers of these securities may be more susceptible to actions of foreign governments, such as the imposition of price controls or punitive taxes, that could adversely impact revenues. Securities markets in certain countries may be more volatile and/or less liquid than those in the U.S. Investments outside the U.S. may also be subject to different accounting practices and different regulatory, legal and reporting standards and practices, and may be more difficult to value, than those in the U.S. In addition, the value of investments outside the U.S. may be reduced by foreign taxes, including foreign withholding taxes on interest and dividends. Further, there may be increased risks of delayed settlement of securities purchased or sold by the fund. The risks of investing outside the U.S. may be heightened in connection with investments in emerging markets.
Investing in emerging markets — Investing in emerging markets may involve risks in addition to and greater than those generally associated with investing in the securities markets of developed countries. For instance, developing countries may have less developed legal and accounting systems than those in developed countries. The governments of these countries may be less stable and more likely to impose capital controls, nationalize a company or industry, place restrictions on foreign ownership and on withdrawing sale proceeds of securities from the country, and/or impose punitive taxes that could adversely affect the prices of securities. In addition, the economies of these countries may be dependent on relatively few industries that are more susceptible to local and global changes. Securities markets in these countries can also be relatively small and have substantially lower trading volumes. As a result, securities issued in these countries may be more volatile and less liquid, and may be more difficult to value, than securities issued in countries with more developed economies and/or markets. Less certainty with respect to security valuations may lead to additional challenges and risks in calculating the fund’s net asset value. Additionally, there may be increased settlement risks for transactions in local securities.
Investing in small companies — Investing in smaller companies may pose additional risks. For example, it is often more difficult to value or dispose of small company stocks and more difficult to obtain information about smaller companies than about larger companies. Furthermore, smaller companies often have limited product lines, operating histories, markets and/or financial resources, may be dependent on one or a few key persons for management, and can be more susceptible to losses. Moreover, the prices of their stocks may be more volatile than stocks of larger, more established companies.
Management — The investment adviser to the fund actively manages the fund’s investments. Consequently, the fund is subject to the risk that the methods and analyses employed by the investment adviser in this process may not produce the desired results. This could cause the fund to lose value or its investment results to lag relevant benchmarks or other funds with similar objectives.
5. Taxation and distributions
Federal income taxation — The fund complies with the requirements under Subchapter M of the Internal Revenue Code applicable to mutual funds and intends to distribute substantially all of its net taxable income and net capital gains each year. The fund is not subject to income taxes to the extent such distributions are made. Therefore, no federal income tax provision is required.
As of and during the period ended May 31, 2016, the fund did not have a liability for any unrecognized tax benefits. The fund recognizes interest and penalties, if any, related to unrecognized tax benefits as income tax expense in the statement of operations. During the period, the fund did not incur any interest or penalties.
The fund is not subject to examination by U.S. federal tax authorities for tax years before 2011, by state tax authorities for tax years before 2010 and by tax authorities outside the U.S. for tax years before 2009.
Non-U.S. taxation — Dividend and interest income are recorded net of non-U.S. taxes paid. The fund may file withholding tax reclaims in certain jurisdictions to recover a portion of amounts previously withheld. As a result of rulings from European courts, the fund filed for additional reclaims related to prior years. These reclaims are recorded when the amount is known and there are no significant uncertainties on collectability. Gains realized by the fund on the sale of securities in certain countries are subject to non-U.S. taxes. The fund records a liability based on unrealized gains to provide for potential non-U.S. taxes payable upon the sale of these securities.
Distributions — Distributions paid to shareholders are based on net investment income and net realized gains determined on a tax basis, which may differ from net investment income and net realized gains for financial reporting purposes. These differences are due primarily to different treatment for items such as currency gains and losses; short-term capital gains and losses; unrealized appreciation of certain investments in securities outside the U.S.; and income on certain investments. The fiscal year in which amounts are distributed may differ from the year in which the net investment income and net realized gains are recorded by the fund for financial reporting purposes.
The components of distributable earnings on a tax basis are reported as of the fund’s most recent year-end. As of November 30, 2015, the components of distributable earnings on a tax basis were as follows (dollars in thousands):
| Undistributed ordinary income | | $ | 62,091 | |
| Undistributed long-term capital gains | | | 836,686 | |
As of May 31, 2016, the tax basis unrealized appreciation (depreciation) and cost of investment securities were as follows (dollars in thousands):
| Gross unrealized appreciation on investment securities | | $ | 3,801,459 | |
| Gross unrealized depreciation on investment securities | | | (968,553 | ) |
| Net unrealized appreciation on investment securities | | | 2,832,906 | |
| Cost of investment securities | | | 12,084,433 | |
The tax character of distributions paid to shareholders was as follows (dollars in thousands):
| | | Six months ended May 31, 2016 | | | Year ended November 30, 2015 | |
| Share class | | Ordinary
income | | | Long-term
capital gains | | | Total
dividends and
distributions
paid | | | Ordinary
income | | | Long-term
capital gains | | | Total
dividends and
distributions
paid | |
| Class A | | $ | 42,416 | | | $ | 564,020 | | | $ | 606,436 | | | $ | 49,171 | | | $ | 743,705 | | | $ | 792,876 | |
| Class B | | | — | | | | 1,126 | | | | 1,126 | | | | — | | | | 2,945 | | | | 2,945 | |
| Class C | | | — | * | | | 31,172 | | | | 31,172 | | | | — | * | | | 38,028 | | | | 38,028 | |
| Class F-1 | | | 1,264 | | | | 20,849 | | | | 22,113 | | | | 1,507 | | | | 30,588 | | | | 32,095 | |
| Class F-2 | | | 4,814 | | | | 41,082 | | | | 45,896 | | | | 4,867 | | | | 49,207 | | | | 54,074 | |
| Class 529-A | | | 1,442 | | | | 23,103 | | | | 24,545 | | | | 1,701 | | | | 29,252 | | | | 30,953 | |
| Class 529-B | | | — | | | | 170 | | | | 170 | | | | — | | | | 461 | | | | 461 | |
| Class 529-C | | | — | | | | 6,785 | | | | 6,785 | | | | — | * | | | 8,640 | | | | 8,640 | |
| Class 529-E | | | 21 | | | | 1,193 | | | | 1,214 | | | | 42 | | | | 1,570 | | | | 1,612 | |
| Class 529-F-1 | | | 177 | | | | 1,786 | | | | 1,963 | | | | 181 | | | | 2,153 | | | | 2,334 | |
| Class R-1 | | | — | | | | 3,158 | | | | 3,158 | | | | — | | | | 4,060 | | | | 4,060 | |
| Class R-2 | | | — | | | | 10,328 | | | | 10,328 | | | | — | | | | 14,434 | | | | 14,434 | |
| Class R-2E | | | 2 | | | | 17 | | | | 19 | | | | — | * | | | 1 | | | | 1 | |
| Class R-3 | | | 166 | | | | 17,697 | | | | 17,863 | | | | 778 | | | | 25,732 | | | | 26,510 | |
| Class R-4 | | | 1,535 | | | | 21,244 | | | | 22,779 | | | | 1,922 | | | | 27,721 | | | | 29,643 | |
| Class R-5E† | | | — | * | | | 1 | | | | 1 | | | | — | | | | — | | | | — | |
| Class R-5 | | | 1,066 | | | | 8,411 | | | | 9,477 | | | | 1,071 | | | | 11,100 | | | | 12,171 | |
| Class R-6 | | | 11,393 | | | | 84,740 | | | | 96,133 | | | | 11,564 | | | | 106,360 | | | | 117,924 | |
| Total | | $ | 64,296 | | | $ | 836,882 | | | $ | 901,178 | | | $ | 72,804 | | | $ | 1,095,957 | | | $ | 1,168,761 | |
| * | Amount less than one thousand. |
| † | Class R-5E shares were offered beginning November 20, 2015. |
6. Fees and transactions with related parties
CRMC, the fund’s investment adviser, is the parent company of American Funds Distributors,® Inc. (“AFD”), the principal underwriter of the fund’s shares, and American Funds Service Company® (“AFS”), the fund’s transfer agent. CRMC, AFD and AFS are considered related parties to the fund.
Investment advisory services — The fund has an investment advisory and service agreement with CRMC that provides for monthly fees accrued daily. These fees are based on a series of decreasing annual rates beginning with 0.580% on the first $500 million of daily net assets and decreasing to 0.345% on such assets in excess of $27 billion. For the six months ended May 31, 2016, the investment advisory services fee was $28,288,000, which was equivalent to an annualized rate of 0.388% of average daily net assets.
Class-specific fees and expenses — Expenses that are specific to individual share classes are accrued directly to the respective share class. The principal class-specific fees and expenses are further described below:
Distribution services — The fund has plans of distribution for all share classes, except Class F-2, R-5E, R-5 and R-6 shares. Under the plans, the board of trustees approves certain categories of expenses that are used to finance activities primarily intended to sell fund shares and service existing accounts. The plans provide for payments, based on an annualized percentage of average daily net assets, ranging from 0.25% to 1.00% as noted in this section. In some cases, the board of trustees has limited the amounts that may be paid to less than the maximum allowed by the plans. All share classes with a plan may use up to 0.25% of average daily net assets to pay service fees, or to compensate AFD for paying service fees, to firms that have entered into agreements with AFD to provide certain shareholder services. The remaining amounts available to be paid under each plan are paid to dealers to compensate them for their sales activities.
For Class A and 529-A shares, distribution-related expenses include the reimbursement of dealer and wholesaler commissions paid by AFD for certain shares sold without a sales charge. These share classes reimburse AFD for amounts billed within the prior 15 months but only to the extent that the overall annual expense limit of 0.25% is not exceeded. As of May 31, 2016, there were no unreimbursed expenses subject to reimbursement for Class A or 529-A shares.
| Share class | Currently approved limits | Plan limits |
| Class A | 0.25% | 0.25% |
| Class 529-A | 0.25 | 0.50 |
| Classes B and 529-B | 1.00 | 1.00 |
| Classes C, 529-C and R-1 | 1.00 | 1.00 |
| Class R-2 | 0.75 | 1.00 |
| Class R-2E | 0.60 | 0.85 |
| Classes 529-E and R-3 | 0.50 | 0.75 |
| Classes F-1, 529-F-1 and R-4 | 0.25 | 0.50 |
Transfer agent services — The fund has a shareholder services agreement with AFS under which the fund compensates AFS for providing transfer agent services to each of the fund’s share classes. These services include recordkeeping, shareholder communications and transaction processing. In addition, the fund reimburses AFS for amounts paid to third parties for performing transfer agent services on behalf of fund shareholders.
Administrative services — The fund has an administrative services agreement with CRMC under which the fund compensates CRMC for providing administrative services to Class A, C, F, 529 and R shares. These services include, but are not limited to, coordinating, monitoring, assisting and overseeing third parties that provide services to fund shareholders. Under the agreement, Class A shares pay an annual fee of 0.01% and Class C, F, 529 and R shares pay an annual fee of 0.05% of their respective average daily net assets.
529 plan services — Each 529 share class is subject to service fees to compensate the Virginia College Savings Plan (“Virginia529”) for its oversight and administration of the 529 college savings plan. The quarterly fee is based on a series of decreasing annual rates beginning with 0.10% on the first $30 billion of the net assets invested in Class 529 shares of the American Funds and decreasing to 0.05% on such assets in excess of $70 billion. Effective July 1, 2016, the quarterly fee will be amended to annual rates of 0.10% on the first $20 billion of the net assets invested in the Class 529 shares of the American Funds, 0.05% on net assets between $20 billion and $100 billion, and 0.03% on net assets over $100 billion. The fee for any given calendar quarter is accrued and calculated on the basis of the average net assets of Class 529 shares of the American Funds for the last month of the prior calendar quarter. The fee is included in other expenses in the fund’s statement of operations. Virginia529 is not considered a related party to the fund.
For the six months ended May 31, 2016, class-specific expenses under the agreements were as follows (dollars in thousands):
| | | Distribution | | | Transfer agent | | | Administrative | | | 529 plan |
| Share class | | services | | | services | | | services | | | services |
| Class A | | | $11,157 | | | | $7,573 | | | | $491 | | | | Not applicable |
| Class B | | | 75 | | | | 14 | | | | Not applicable | | | | Not applicable |
| Class C | | | 2,477 | | | | 384 | | | | 124 | | | | Not applicable |
| Class F-1 | | | 444 | | | | 239 | | | | 89 | | | | Not applicable |
| Class F-2 | | | Not applicable | | | | 397 | | | | 174 | | | | Not applicable |
| Class 529-A | | | 406 | | | | 265 | | | | 101 | | | | $180 |
| Class 529-B | | | 11 | | | | 2 | | | | 1 | | | | 1 |
| Class 529-C | | | 553 | | | | 77 | | | | 28 | | | | 49 |
| Class 529-E | | | 52 | | | | 8 | | | | 5 | | | | 9 |
| Class 529-F-1 | | | — | | | | 20 | | | | 8 | | | | 14 |
| Class R-1 | | | 252 | | | | 28 | | | | 13 | | | | Not applicable |
| Class R-2 | | | 618 | | | | 333 | | | | 42 | | | | Not applicable |
| Class R-2E | | | 2 | | | | 1 | | | | — | * | �� | | Not applicable |
| Class R-3 | | | 746 | | | | 256 | | | | 75 | | | | Not applicable |
| Class R-4 | | | 464 | | | | 195 | | | | 93 | | | | Not applicable |
| Class R-5E | | | Not applicable | | | | — | * | | | — | * | | | Not applicable |
| Class R-5 | | | Not applicable | | | | 37 | | | | 37 | | | | Not applicable |
| Class R-6 | | | Not applicable | | | | 5 | | | | 395 | | | | Not applicable |
| Total class-specific expenses | | | $17,257 | | | | $9,834 | | | | $1,676 | | | | $253 |
*Amount less than one thousand.
Trustees’ deferred compensation — Trustees who are unaffiliated with CRMC may elect to defer the cash payment of part or all of their compensation. These deferred amounts, which remain as liabilities of the fund, are treated as if invested in shares of the fund or other American Funds. These amounts represent general, unsecured liabilities of the fund and vary according to the total returns of the selected funds. Trustees’ compensation of $165,000 in the fund’s statement of operations reflects $205,000 in current fees (either paid in cash or deferred) and a net decrease of $40,000 in the value of the deferred amounts.
Affiliated officers and trustees — Officers and certain trustees of the fund are or may be considered to be affiliated with CRMC, AFD and AFS. No affiliated officers or trustees received any compensation directly from the fund.
Security transactions with related funds — The fund may purchase from, or sell securities to, other CRMC-managed funds (or funds managed by certain affiliates of CRMC) under procedures adopted by the fund’s board of trustees. The funds involved in such transactions are considered related by virtue of having a common investment adviser (or affiliated investment advisers), common trustees and/or common officers. When such transactions occur, each transaction is executed at the current market price of the security and no brokerage commissions or fees are paid in accordance with Rule 17a-7 of the 1940 Act.
7. Capital share transactions
Capital share transactions in the fund were as follows (dollars and shares in thousands):
| | | | | | | | | Reinvestments of | | | | | | | | | | | | | |
| | | | | | | | | dividends and | | | | | | | | | Net increase | |
| | | Sales1 | | | distributions | | | Repurchases1 | | | (decrease) | |
| Share class | | Amount | | | Shares | | | Amount | | | Shares | | | Amount | | | Shares | | | Amount | | | Shares | |
| | | | | | | | | | | | | | | | | | | | | | | | | | | | | | | | | |
| Six months ended May 31, 2016 | | | | | | | | | | | | | | | | | | | | | | | | | |
| | | | | | | | | | | | | | | | | | | | | | | | | | | | | | | | | |
| Class A | | $ | 507,098 | | | | 14,706 | | | $ | 594,257 | | | | 16,530 | | | $ | (757,641 | ) | | | (22,042 | ) | | $ | 343,714 | | | | 9,194 | |
| Class B | | | 311 | | | | 10 | | | | 1,121 | | | | 33 | | | | (9,147 | ) | | | (286 | ) | | | (7,715 | ) | | | (243 | ) |
| Class C | | | 48,349 | | | | 1,521 | | | | 30,853 | | | | 932 | | | | (71,458 | ) | | | (2,274 | ) | | | 7,744 | | | | 179 | |
| Class F-1 | | | 51,137 | | | | 1,490 | | | | 21,872 | | | | 607 | | | | (90,872 | ) | | | (2,635 | ) | | | (17,863 | ) | | | (538 | ) |
| Class F-2 | | | 134,277 | | | | 3,887 | | | | 43,221 | | | | 1,204 | | | | (177,929 | ) | | | (5,223 | ) | | | (431 | ) | | | (132 | ) |
| Class 529-A | | | 31,905 | | | | 928 | | | | 24,543 | | | | 689 | | | | (27,400 | ) | | | (799 | ) | | | 29,048 | | | | 818 | |
| Class 529-B | | | 70 | | | | 2 | | | | 169 | | | | 5 | | | | (1,290 | ) | | | (40 | ) | | | (1,051 | ) | | | (33 | ) |
| Class 529-C | | | 9,540 | | | | 296 | | | | 6,784 | | | | 202 | | | | (8,876 | ) | | | (276 | ) | | | 7,448 | | | | 222 | |
| Class 529-E | | | 1,454 | | | | 43 | | | | 1,214 | | | | 35 | | | | (1,309 | ) | | | (39 | ) | | | 1,359 | | | | 39 | |
| Class 529-F-1 | | | 5,813 | | | | 164 | | | | 1,963 | | | | 55 | | | | (4,856 | ) | | | (136 | ) | | | 2,920 | | | | 83 | |
| Class R-1 | | | 4,716 | | | | 146 | | | | 3,158 | | | | 93 | | | | (9,417 | ) | | | (290 | ) | | | (1,543 | ) | | | (51 | ) |
| Class R-2 | | | 24,531 | | | | 750 | | | | 10,323 | | | | 302 | | | | (36,996 | ) | | | (1,140 | ) | | | (2,142 | ) | | | (88 | ) |
| Class R-2E | | | 988 | | | | 28 | | | | 19 | | | | 1 | | | | (38 | ) | | | (1 | ) | | | 969 | | | | 28 | |
| Class R-3 | | | 40,336 | | | | 1,195 | | | | 17,854 | | | | 505 | | | | (53,431 | ) | | | (1,588 | ) | | | 4,759 | | | | 112 | |
| Class R-4 | | | 43,718 | | | | 1,280 | | | | 22,777 | | | | 639 | | | | (51,251 | ) | | | (1,506 | ) | | | 15,244 | | | | 413 | |
| Class R-5E | | | — | | | | — | | | | — | | | | — | | | | — | | | | — | | | | — | | | | — | |
| Class R-5 | | | 20,277 | | | | 590 | | | | 9,470 | | | | 262 | | | | (23,626 | ) | | | (695 | ) | | | 6,121 | | | | 157 | |
| Class R-6 | | | 281,110 | | | | 8,211 | | | | 96,133 | | | | 2,672 | | | | (71,781 | ) | | | (2,070 | ) | | | 305,462 | | | | 8,813 | |
| Total net increase (decrease) | | $ | 1,205,630 | | | | 35,247 | | | $ | 885,731 | | | | 24,766 | | | $ | (1,397,318 | ) | | | (41,040 | ) | | $ | 694,043 | | | | 18,973 | |
| | | | | | | | | Reinvestments of | | | | | | | | | | | | | |
| | | | | | | | | dividends and | | | | | | | | | Net increase | |
| | | Sales1 | | | distributions | | | Repurchases1 | | | (decrease) | |
| Share class | | Amount | | | Shares | | | Amount | | | Shares | | | Amount | | | Shares | | | Amount | | | Shares | |
| | | | | | | | | | | | | | | | | | | | | | | | | |
| Year ended November 30, 2015 | | | | | | | | | | | | | | | | | | | | | | | | | |
| | | | | | | | | | | | | | | | | | | | | | | | | | | | | | | | | |
| Class A | | $ | 1,471,698 | | | | 38,085 | | | $ | 776,272 | | | | 20,913 | | | $ | (1,193,452 | ) | | | (31,054 | ) | | $ | 1,054,518 | | | | 27,944 | |
| Class B | | | 2,016 | | | | 55 | | | | 2,925 | | | | 84 | | | | (20,313 | ) | | | (561 | ) | | | (15,372 | ) | | | (422 | ) |
| Class C | | | 150,578 | | | | 4,215 | | | | 37,629 | | | | 1,092 | | | | (99,109 | ) | | | (2,783 | ) | | | 89,098 | | | | 2,524 | |
| Class F-1 | | | 157,237 | | | | 4,041 | | | | 31,758 | | | | 854 | | | | (179,846 | ) | | | (4,675 | ) | | | 9,149 | | | | 220 | |
| Class F-2 | | | 311,479 | | | | 8,037 | | | | 51,302 | | | | 1,384 | | | | (222,455 | ) | | | (5,817 | ) | | | 140,326 | | | | 3,604 | |
| Class 529-A | | | 71,494 | | | | 1,870 | | | | 30,935 | | | | 840 | | | | (45,832 | ) | | | (1,197 | ) | | | 56,597 | | | | 1,513 | |
| Class 529-B | | | 258 | | | | 7 | | | | 461 | | | | 13 | | | | (3,376 | ) | | | (93 | ) | | | (2,657 | ) | | | (73 | ) |
| Class 529-C | | | 21,604 | | | | 598 | | | | 8,638 | | | | 247 | | | | (15,405 | ) | | | (424 | ) | | | 14,837 | | | | 421 | |
| Class 529-E | | | 3,277 | | | | 87 | | | | 1,613 | | | | 44 | | | | (2,970 | ) | | | (79 | ) | | | 1,920 | | | | 52 | |
| Class 529-F-1 | | | 8,688 | | | | 227 | | | | 2,334 | | | | 63 | | | | (4,919 | ) | | | (129 | ) | | | 6,103 | | | | 161 | |
| Class R-1 | | | 16,616 | | | | 454 | | | | 4,059 | | | | 115 | | | | (12,364 | ) | | | (340 | ) | | | 8,311 | | | | 229 | |
| Class R-2 | | | 54,497 | | | | 1,481 | | | | 14,428 | | | | 406 | | | | (59,941 | ) | | | (1,634 | ) | | | 8,984 | | | | 253 | |
| Class R-2E | | | 71 | | | | 2 | | | | — | | | | — | | | | — | | | | — | | | | 71 | | | | 2 | |
| Class R-3 | | | 101,953 | | | | 2,674 | | | | 26,496 | | | | 726 | | | | (114,947 | ) | | | (3,049 | ) | | | 13,502 | | | | 351 | |
| Class R-4 | | | 113,266 | | | | 2,977 | | | | 29,643 | | | | 805 | | | | (99,890 | ) | | | (2,626 | ) | | | 43,019 | | | | 1,156 | |
| Class R-5E2 | | | 10 | | | | — | 3 | | | — | | | | — | | | | — | | | | — | | | | 10 | | | | — | 3 |
| Class R-5 | | | 50,299 | | | | 1,307 | | | | 12,146 | | | | 326 | | | | (49,485 | ) | | | (1,282 | ) | | | 12,960 | | | | 351 | |
| Class R-6 | | | 390,912 | | | | 10,170 | | | | 117,923 | | | | 3,174 | | | | (278,104 | ) | | | (7,530 | ) | | | 230,731 | | | | 5,814 | |
| Total net increase (decrease) | | $ | 2,925,953 | | | | 76,287 | | | $ | 1,148,562 | | | | 31,086 | | | $ | (2,402,408 | ) | | | (63,273 | ) | | $ | 1,672,107 | | | | 44,100 | |
| 1 | Includes exchanges between share classes of the fund. |
| 2 | Class R-5E shares were offered beginning November 20, 2015. |
| 3 | Amount less than one thousand. |
8. Investment transactions
The fund made purchases and sales of investment securities, excluding short-term securities and U.S. government obligations, if any, of $1,959,057,000 and $2,056,007,000, respectively, during the six months ended May 31, 2016.
Financial highlights
| | | | | | (Loss) income from investment operations1 | |
| | | Net asset
value,
beginning
of period | | | Net
investment
income
(loss)2 | | | Net (losses)
gains on
securities (both
realized and
unrealized) | | | Total from
investment
operations | |
| Class A: | | | | | | | | | | | | | | | | |
| Six months ended 5/31/20165,6 | | $ | 38.93 | | | $ | .08 | | | $ | (1.57 | ) | | $ | (1.49 | ) |
| Year ended 11/30/2015 | | | 40.58 | | | | .11 | | | | 1.47 | | | | 1.58 | |
| Year ended 11/30/2014 | | | 39.61 | | | | .22 | | | | 3.28 | | | | 3.50 | |
| Year ended 11/30/2013 | | | 28.83 | | | | .17 | | | | 11.67 | | | | 11.84 | |
| Year ended 11/30/2012 | | | 24.14 | | | | .16 | | | | 4.65 | | | | 4.81 | |
| Year ended 11/30/2011 | | | 24.22 | | | | .11 | | | | (.02 | ) | | | .09 | |
| Class B: | | | | | | | | | | | | | | | | |
| Six months ended 5/31/20165,6 | | | 36.41 | | | | (.06 | ) | | | (1.47 | ) | | | (1.53 | ) |
| Year ended 11/30/2015 | | | 38.23 | | | | (.17 | ) | | | 1.38 | | | | 1.21 | |
| Year ended 11/30/2014 | | | 37.59 | | | | (.07 | ) | | | 3.10 | | | | 3.03 | |
| Year ended 11/30/2013 | | | 27.45 | | | | (.08 | ) | | | 11.10 | | | | 11.02 | |
| Year ended 11/30/2012 | | | 23.04 | | | | (.05 | ) | | | 4.46 | | | | 4.41 | |
| Year ended 11/30/2011 | | | 23.14 | | | | (.08 | ) | | | (.02 | ) | | | (.10 | ) |
| Class C: | | | | | | | | | | | | | | | | |
| Six months ended 5/31/20165,6 | | | 35.89 | | | | (.06 | ) | | | (1.46 | ) | | | (1.52 | ) |
| Year ended 11/30/2015 | | | 37.74 | | | | (.18 | ) | | | 1.36 | | | | 1.18 | |
| Year ended 11/30/2014 | | | 37.16 | | | | (.10 | ) | | | 3.07 | | | | 2.97 | |
| Year ended 11/30/2013 | | | 27.15 | | | | (.10 | ) | | | 10.99 | | | | 10.89 | |
| Year ended 11/30/2012 | | | 22.80 | | | | (.05 | ) | | | 4.40 | | | | 4.35 | |
| Year ended 11/30/2011 | | | 22.90 | | | | (.08 | ) | | | (.02 | ) | | | (.10 | ) |
| Class F-1: | | | | | | | | | | | | | | | | |
| Six months ended 5/31/20165,6 | | | 38.99 | | | | .07 | | | | (1.59 | ) | | | (1.52 | ) |
| Year ended 11/30/2015 | | | 40.60 | | | | .10 | | | | 1.47 | | | | 1.57 | |
| Year ended 11/30/2014 | | | 39.67 | | | | .21 | | | | 3.27 | | | | 3.48 | |
| Year ended 11/30/2013 | | | 28.87 | | | | .14 | | | | 11.70 | | | | 11.84 | |
| Year ended 11/30/2012 | | | 24.16 | | | | .16 | | | | 4.66 | | | | 4.82 | |
| Year ended 11/30/2011 | | | 24.23 | | | | .11 | | | | (.01 | ) | | | .10 | |
| Class F-2: | | | | | | | | | | | | | | | | |
| Six months ended 5/31/20165,6 | | | 38.96 | | | | .12 | | | | (1.58 | ) | | | (1.46 | ) |
| Year ended 11/30/2015 | | | 40.63 | | | | .19 | | | | 1.47 | | | | 1.66 | |
| Year ended 11/30/2014 | | | 39.65 | | | | .29 | | | | 3.31 | | | | 3.60 | |
| Year ended 11/30/2013 | | | 28.88 | | | | .24 | | | | 11.68 | | | | 11.92 | |
| Year ended 11/30/2012 | | | 24.19 | | | | .23 | | | | 4.65 | | | | 4.88 | |
| Year ended 11/30/2011 | | | 24.27 | | | | .18 | | | | (.02 | ) | | | .16 | |
| Class 529-A: | | | | | | | | | | | | | | | | |
| Six months ended 5/31/20165,6 | | | 38.60 | | | | .07 | | | | (1.57 | ) | | | (1.50 | ) |
| Year ended 11/30/2015 | | | 40.27 | | | | .08 | | | | 1.46 | | | | 1.54 | |
| Year ended 11/30/2014 | | | 39.33 | | | | .18 | | | | 3.27 | | | | 3.45 | |
| Year ended 11/30/2013 | | | 28.65 | | | | .14 | | | | 11.58 | | | | 11.72 | |
| Year ended 11/30/2012 | | | 24.00 | | | | .14 | | | | 4.63 | | | | 4.77 | |
| Year ended 11/30/2011 | | | 24.10 | | | | .10 | | | | (.02 | ) | | | .08 | |
| Dividends and distributions | | | | | | | | | | | | | | | | | | | |
Dividends
(from net
investment
income) | | | Distributions
(from capital
gains) | | | Total
dividends
and
distributions | | | Net asset
value, end
of period | | | Total return3,4 | | | Net assets,
end of
period
(in
millions) | | | Ratio of
expenses to
average net
assets before
reimbursements | | | Ratio of
expenses to
average net
assets after
reimbursements3 | | | Ratio of
net income
(loss) to
average
net assets2,3 | |
| | | | | | | | | | | | | | | | | | | | | | | | | | | | | | | | | �� | | |
| $ | (.16 | ) | | $ | (2.06 | ) | | $ | (2.22 | ) | | $ | 35.22 | | | | (3.95 | )%7 | | $ | 9,972 | | | | .81 | %8 | | | .81 | %8 | | | .46 | %8 |
| | (.20 | ) | | | (3.03 | ) | | | (3.23 | ) | | | 38.93 | | | | 4.27 | | | | 10,666 | | | | .78 | | | | .78 | | | | .29 | |
| | (.14 | ) | | | (2.39 | ) | | | (2.53 | ) | | | 40.58 | | | | 9.25 | | | | 9,984 | | | | .79 | | | | .79 | | | | .56 | |
| | (.18 | ) | | | (.88 | ) | | | (1.06 | ) | | | 39.61 | | | | 42.52 | | | | 8,920 | | | | .83 | | | | .83 | | | | .50 | |
| | (.12 | ) | | | — | | | | (.12 | ) | | | 28.83 | | | | 20.02 | | | | 5,919 | | | | .87 | | | | .87 | | | | .59 | |
| | (.17 | ) | | | — | | | | (.17 | ) | | | 24.14 | | | | .31 | | | | 5,298 | | | | .85 | | | | .85 | | | | .45 | |
| | | | | | | | | | | | | | | | | | | | | | | | | | | | | | | | | | | |
| | — | | | | (2.06 | ) | | | (2.06 | ) | | | 32.82 | | | | (4.33 | )7 | | | 11 | | | | 1.59 | 8 | | | 1.59 | 8 | | | (.36 | )8 |
| | — | | | | (3.03 | ) | | | (3.03 | ) | | | 36.41 | | | | 3.48 | | | | 21 | | | | 1.54 | | | | 1.54 | | | | (.46 | ) |
| | — | | | | (2.39 | ) | | | (2.39 | ) | | | 38.23 | | | | 8.43 | | | | 39 | | | | 1.55 | | | | 1.55 | | | | (.18 | ) |
| | — | | | | (.88 | ) | | | (.88 | ) | | | 37.59 | | | | 41.39 | | | | 55 | | | | 1.60 | | | | 1.60 | | | | (.24 | ) |
| | — | | | | — | | | | — | | | | 27.45 | | | | 19.09 | | | | 50 | | | | 1.63 | | | | 1.63 | | | | (.19 | ) |
| | — | | | | — | | | | — | | | | 23.04 | | | | (.39 | ) | | | 62 | | | | 1.62 | | | | 1.62 | | | | (.34 | ) |
| | | | | | | | | | | | | | | | | | | | | | | | | | | | | | | | | | | |
| | — | | | | (2.06 | ) | | | (2.06 | ) | | | 32.31 | | | | (4.37 | )7 | | | 494 | | | | 1.62 | 8 | | | 1.62 | 8 | | | (.35 | )8 |
| | — | | | | (3.03 | ) | | | (3.03 | ) | | | 35.89 | | | | 3.44 | | | | 542 | | | | 1.59 | | | | 1.59 | | | | (.51 | ) |
| | — | | | | (2.39 | ) | | | (2.39 | ) | | | 37.74 | | | | 8.37 | | | | 475 | | | | 1.60 | | | | 1.60 | | | | (.26 | ) |
| | — | | | | (.88 | ) | | | (.88 | ) | | | 37.16 | | | | 41.37 | | | | 350 | | | | 1.63 | | | | 1.63 | | | | (.32 | ) |
| | — | | | | — | | | | — | | | | 27.15 | | | | 19.08 | | | | 186 | | | | 1.67 | | | | 1.67 | | | | (.22 | ) |
| | — | | | | — | | | | — | | | | 22.80 | | | | (.47 | ) | | | 172 | | | | 1.63 | | | | 1.63 | | | | (.33 | ) |
| | | | | | | | | | | | | | | | | | | | | | | | | | | | | | | | | | | |
| | (.12 | ) | | | (2.06 | ) | | | (2.18 | ) | | | 35.29 | | | | (4.00 | )7 | | | 347 | | | | .85 | 8 | | | .85 | 8 | | | .41 | 8 |
| | (.15 | ) | | | (3.03 | ) | | | (3.18 | ) | | | 38.99 | | | | 4.23 | | | | 404 | | | | .83 | | | | .83 | | | | .25 | |
| | (.16 | ) | | | (2.39 | ) | | | (2.55 | ) | | | 40.60 | | | | 9.20 | | | | 412 | | | | .84 | | | | .84 | | | | .54 | |
| | (.16 | ) | | | (.88 | ) | | | (1.04 | ) | | | 39.67 | | | | 42.46 | | | | 418 | | | | .86 | | | | .86 | | | | .43 | |
| | (.11 | ) | | | — | | | | (.11 | ) | | | 28.87 | | | | 20.03 | | | | 143 | | | | .86 | | | | .86 | | | | .61 | |
| | (.17 | ) | | | — | | | | (.17 | ) | | | 24.16 | | | | .33 | | | | 143 | | | | .85 | | | | .85 | | | | .44 | |
| | | | | | | | | | | | | | | | | | | | | | | | | | | | | | | | | | | |
| | (.24 | ) | | | (2.06 | ) | | | (2.30 | ) | | | 35.20 | | | | (3.85 | )7 | | | 696 | | | | .58 | 8 | | | .58 | 8 | | | .68 | 8 |
| | (.30 | ) | | | (3.03 | ) | | | (3.33 | ) | | | 38.96 | | | | 4.49 | | | | 776 | | | | .57 | | | | .57 | | | | .50 | |
| | (.23 | ) | | | (2.39 | ) | | | (2.62 | ) | | | 40.63 | | | | 9.52 | | | | 662 | | | | .57 | | | | .57 | | | | .73 | |
| | (.27 | ) | | | (.88 | ) | | | (1.15 | ) | | | 39.65 | | | | 42.88 | | | | 330 | | | | .57 | | | | .57 | | | | .70 | |
| | (.19 | ) | | | — | | | | (.19 | ) | | | 28.88 | | | | 20.35 | | | | 106 | | | | .59 | | | | .59 | | | | .87 | |
| | (.24 | ) | | | — | | | | (.24 | ) | | | 24.19 | | | | .58 | | | | 72 | | | | .59 | | | | .59 | | | | .72 | |
| | | | | | | | | | | | | | | | | | | | | | | | | | | | | | | | | | | |
| | (.13 | ) | | | (2.06 | ) | | | (2.19 | ) | | | 34.91 | | | | (4.00 | )7 | | | 418 | | | | .89 | 8 | | | .89 | 8 | | | .38 | 8 |
| | (.18 | ) | | | (3.03 | ) | | | (3.21 | ) | | | 38.60 | | | | 4.19 | | | | 431 | | | | .86 | | | | .86 | | | | .21 | |
| | (.12 | ) | | | (2.39 | ) | | | (2.51 | ) | | | 40.27 | | | | 9.19 | | | | 388 | | | | .87 | | | | .87 | | | | .47 | |
| | (.16 | ) | | | (.88 | ) | | | (1.04 | ) | | | 39.33 | | | | 42.38 | | | | 325 | | | | .91 | | | | .91 | | | | .42 | |
| | (.12 | ) | | | — | | | | (.12 | ) | | | 28.65 | | | | 19.92 | | | | 197 | | | | .93 | | | | .93 | | | | .53 | |
| | (.18 | ) | | | — | | | | (.18 | ) | | | 24.00 | | | | .32 | | | | 156 | | | | .90 | | | | .90 | | | | .40 | |
See page 32 for footnotes.
Financial highlights (continued)
| | | | | | (Loss) income from investment operations1 | |
| | | Net asset
value,
beginning
of period | | | Net
investment
income
(loss)2 | | | Net (losses)
gains on
securities (both
realized and
unrealized) | | | Total from
investment
operations | |
| Class 529-B: | | | | | | | | | | | | | | | | |
| Six months ended 5/31/20165,6 | | $ | 36.41 | | | $ | (.07 | ) | | $ | (1.48 | ) | | $ | (1.55 | ) |
| Year ended 11/30/2015 | | | 38.27 | | | | (.21 | ) | | | 1.38 | | | | 1.17 | |
| Year ended 11/30/2014 | | | 37.68 | | | | (.11 | ) | | | 3.09 | | | | 2.98 | |
| Year ended 11/30/2013 | | | 27.54 | | | | (.11 | ) | | | 11.13 | | | | 11.02 | |
| Year ended 11/30/2012 | | | 23.15 | | | | (.08 | ) | | | 4.47 | | | | 4.39 | |
| Year ended 11/30/2011 | | | 23.27 | | | | (.11 | ) | | | (.01 | ) | | | (.12 | ) |
| Class 529-C: | | | | | | | | | | | | | | | | |
| Six months ended 5/31/20165,6 | | | 36.35 | | | | (.07 | ) | | | (1.48 | ) | | | (1.55 | ) |
| Year ended 11/30/2015 | | | 38.21 | | | | (.21 | ) | | | 1.38 | | | | 1.17 | |
| Year ended 11/30/2014 | | | 37.62 | | | | (.12 | ) | | | 3.10 | | | | 2.98 | |
| Year ended 11/30/2013 | | | 27.49 | | | | (.12 | ) | | | 11.13 | | | | 11.01 | |
| Year ended 11/30/2012 | | | 23.11 | | | | (.07 | ) | | | 4.45 | | | | 4.38 | |
| Year ended 11/30/2011 | | | 23.24 | | | | (.10 | ) | | | (.02 | ) | | | (.12 | ) |
| Class 529-E: | | | | | | | | | | | | | | | | |
| Six months ended 5/31/20165,6 | | | 38.09 | | | | .02 | | | | (1.54 | ) | | | (1.52 | ) |
| Year ended 11/30/2015 | | | 39.78 | | | | (.01 | ) | | | 1.43 | | | | 1.42 | |
| Year ended 11/30/2014 | | | 38.91 | | | | .08 | | | | 3.23 | | | | 3.31 | |
| Year ended 11/30/2013 | | | 28.35 | | | | .05 | | | | 11.48 | | | | 11.53 | |
| Year ended 11/30/2012 | | | 23.75 | | | | .07 | | | | 4.57 | | | | 4.64 | |
| Year ended 11/30/2011 | | | 23.85 | | | | .03 | | | | (.01 | ) | | | .02 | |
| Class 529-F-1: | | | | | | | | | | | | | | | | |
| Six months ended 5/31/20165,6 | | | 38.61 | | | | .10 | | | | (1.57 | ) | | | (1.47 | ) |
| Year ended 11/30/2015 | | | 40.28 | | | | .16 | | | | 1.45 | | | | 1.61 | |
| Year ended 11/30/2014 | | | 39.33 | | | | .26 | | | | 3.26 | | | | 3.52 | |
| Year ended 11/30/2013 | | | 28.65 | | | | .21 | | | | 11.58 | | | | 11.79 | |
| Year ended 11/30/2012 | | | 24.01 | | | | .19 | | | | 4.62 | | | | 4.81 | |
| Year ended 11/30/2011 | | | 24.09 | | | | .16 | | | | (.03 | ) | | | .13 | |
| Class R-1: | | | | | | | | | | | | | | | | |
| Six months ended 5/31/20165,6 | | | 36.84 | | | | (.05 | ) | | | (1.49 | ) | | | (1.54 | ) |
| Year ended 11/30/2015 | | | 38.66 | | | | (.18 | ) | | | 1.39 | | | | 1.21 | |
| Year ended 11/30/2014 | | | 37.99 | | | | (.09 | ) | | | 3.15 | | | | 3.06 | |
| Year ended 11/30/2013 | | | 27.72 | | | | (.08 | ) | | | 11.23 | | | | 11.15 | |
| Year ended 11/30/2012 | | | 23.27 | | | | (.04 | ) | | | 4.49 | | | | 4.45 | |
| Year ended 11/30/2011 | | | 23.39 | | | | (.08 | ) | | | (.01 | ) | | | (.09 | ) |
| Class R-2: | | | | | | | | | | | | | | | | |
| Six months ended 5/31/20165,6 | | | 37.03 | | | | (.06 | ) | | | (1.50 | ) | | | (1.56 | ) |
| Year ended 11/30/2015 | | | 38.84 | | | | (.17 | ) | | | 1.39 | | | | 1.22 | |
| Year ended 11/30/2014 | | | 38.16 | | | | (.08 | ) | | | 3.15 | | | | 3.07 | |
| Year ended 11/30/2013 | | | 27.84 | | | | (.07 | ) | | | 11.27 | | | | 11.20 | |
| Year ended 11/30/2012 | | | 23.37 | | | | (.05 | ) | | | 4.52 | | | | 4.47 | |
| Year ended 11/30/2011 | | | 23.47 | | | | (.08 | ) | | | (.02 | ) | | | (.10 | ) |
| Dividends and distributions | | | | | | | | | | | | | | | | | | | |
Dividends
(from net
investment
income) | | | Distributions
(from capital
gains) | | | Total
dividends
and
distributions | | | Net asset
value, end
of period | | | Total return3,4 | | | Net assets,
end of
period
(in
millions) | | | Ratio of
expenses to
average net
assets before
reimbursements | | | Ratio of
expenses to
average net
assets after
reimbursements3 | | | Ratio of
net income
(loss) to
average
net assets2,3 | |
| | | | | | | | | | | | | | | | | | | | | | | | | | | | | | | | | | | |
| $ | — | | | $ | (2.06 | ) | | $ | (2.06 | ) | | $ | 32.80 | | | | (4.39 | )%7 | | $ | 2 | | | | 1.69 | %8 | | | 1.69 | %8 | | | (.45 | )%8 |
| | — | | | | (3.03 | ) | | | (3.03 | ) | | | 36.41 | | | | 3.36 | | | | 3 | | | | 1.66 | | | | 1.66 | | | | (.57 | ) |
| | — | | | | (2.39 | ) | | | (2.39 | ) | | | 38.27 | | | | 8.27 | | | | 6 | | | | 1.67 | | | | 1.67 | | | | (.30 | ) |
| | — | | | | (.88 | ) | | | (.88 | ) | | | 37.68 | | | | 41.26 | | | | 8 | | | | 1.72 | | | | 1.72 | | | | (.36 | ) |
| | — | | | | — | | | | — | | | | 27.54 | | | | 18.96 | | | | 8 | | | | 1.75 | | | | 1.75 | | | | (.31 | ) |
| | — | | | | — | | | | — | | | | 23.15 | | | | (.52 | ) | | | 10 | | | | 1.72 | | | | 1.72 | | | | (.43 | ) |
| | | | | | | | | | | | | | | | | | | | | | | | | | | | | | | | | | | |
| | — | | | | (2.06 | ) | | | (2.06 | ) | | | 32.74 | | | | (4.40 | )7 | | | 115 | | | | 1.68 | 8 | | | 1.68 | 8 | | | (.42 | )8 |
| | — | | | | (3.03 | ) | | | (3.03 | ) | | | 36.35 | | | | 3.37 | | | | 120 | | | | 1.66 | | | | 1.66 | | | | (.59 | ) |
| | — | | | | (2.39 | ) | | | (2.39 | ) | | | 38.21 | | | | 8.29 | | | | 109 | | | | 1.67 | | | | 1.67 | | | | (.33 | ) |
| | — | | | | (.88 | ) | | | (.88 | ) | | | 37.62 | | | | 41.30 | | | | 94 | | | | 1.71 | | | | 1.71 | | | | (.38 | ) |
| | — | | | | — | | | | — | | | | 27.49 | | | | 18.95 | | | | 60 | | | | 1.74 | | | | 1.74 | | | | (.28 | ) |
| | (.01 | ) | | | — | | | | (.01 | ) | | | 23.11 | | | | (.53 | ) | | | 49 | | | | 1.71 | | | | 1.71 | | | | (.41 | ) |
| | | | | | | | | | | | | | | | | | | | | | | | | | | | | | | | | | | |
| | (.04 | ) | | | (2.06 | ) | | | (2.10 | ) | | | 34.47 | | | | (4.11 | )7 | | | 21 | | | | 1.13 | 8 | | | 1.13 | 8 | | | .14 | 8 |
| | (.08 | ) | | | (3.03 | ) | | | (3.11 | ) | | | 38.09 | | | | 3.92 | | | | 22 | | | | 1.11 | | | | 1.11 | | | | (.04 | ) |
| | (.05 | ) | | | (2.39 | ) | | | (2.44 | ) | | | 39.78 | | | | 8.89 | | | | 21 | | | | 1.12 | | | | 1.12 | | | | .21 | |
| | (.09 | ) | | | (.88 | ) | | | (.97 | ) | | | 38.91 | | | | 42.04 | | | | 17 | | | | 1.16 | | | | 1.16 | | | | .16 | |
| | (.04 | ) | | | — | | | | (.04 | ) | | | 28.35 | | | | 19.59 | | | | 10 | | | | 1.20 | | | | 1.20 | | | | .26 | |
| | (.12 | ) | | | — | | | | (.12 | ) | | | 23.75 | | | | .00 | 9 | | | 8 | | | | 1.19 | | | | 1.19 | | | | .11 | |
| | | | | | | | | | | | | | | | | | | | | | | | | | | | | | | | | | | |
| | (.20 | ) | | | (2.06 | ) | | | (2.26 | ) | | | 34.88 | | | | (3.88 | )7 | | | 33 | | | | .69 | 8 | | | .69 | 8 | | | .59 | 8 |
| | (.25 | ) | | | (3.03 | ) | | | (3.28 | ) | | | 38.61 | | | | 4.37 | | | | 33 | | | | .66 | | | | .66 | | | | .41 | |
| | (.18 | ) | | | (2.39 | ) | | | (2.57 | ) | | | 40.28 | | | | 9.39 | | | | 28 | | | | .67 | | | | .67 | | | | .68 | |
| | (.23 | ) | | | (.88 | ) | | | (1.11 | ) | | | 39.33 | | | | 42.69 | | | | 22 | | | | .71 | | | | .71 | | | | .62 | |
| | (.17 | ) | | | — | | | | (.17 | ) | | | 28.65 | | | | 20.17 | | | | 13 | | | | .74 | | | | .74 | | | | .73 | |
| | (.21 | ) | | | — | | | | (.21 | ) | | | 24.01 | | | | .47 | | | | 10 | | | | .70 | | | | .70 | | | | .62 | |
| | | | | | | | | | | | | | | | | | | | | | | | | | | | | | | | | | | |
| | — | | | | (2.06 | ) | | | (2.06 | ) | | | 33.24 | | | | (4.31 | )7 | | | 50 | | | | 1.57 | 8 | | | 1.57 | 8 | | | (.31 | )8 |
| | — | | | | (3.03 | ) | | | (3.03 | ) | | | 36.84 | | | | 3.44 | | | | 58 | | | | 1.56 | | | | 1.56 | | | | (.49 | ) |
| | — | | | | (2.39 | ) | | | (2.39 | ) | | | 38.66 | | | | 8.43 | | | | 52 | | | | 1.56 | | | | 1.56 | | | | (.25 | ) |
| | — | | | | (.88 | ) | | | (.88 | ) | | | 37.99 | | | | 41.46 | | | | 33 | | | | 1.59 | | | | 1.59 | | | | (.25 | ) |
| | — | | | | — | | | | — | | | | 27.72 | | | | 19.12 | | | | 23 | | | | 1.61 | | | | 1.61 | | | | (.15 | ) |
| | (.03 | ) | | | — | | | | (.03 | ) | | | 23.27 | | | | (.41 | ) | | | 23 | | | | 1.61 | | | | 1.61 | | | | (.32 | ) |
| | | | | | | | | | | | | | | | | | | | | | | | | | | | | | | | | | | |
| | — | | | | (2.06 | ) | | | (2.06 | ) | | | 33.41 | | | | (4.34 | )7 | | | 165 | | | | 1.61 | 8 | | | 1.61 | 8 | | | (.35 | )8 |
| | — | | | | (3.03 | ) | | | (3.03 | ) | | | 37.03 | | | | 3.45 | | | | 186 | | | | 1.55 | | | | 1.55 | | | | (.47 | ) |
| | — | | | | (2.39 | ) | | | (2.39 | ) | | | 38.84 | | | | 8.41 | | | | 185 | | | | 1.57 | | | | 1.57 | | | | (.22 | ) |
| | — | | | | (.88 | ) | | | (.88 | ) | | | 38.16 | | | | 41.47 | | | | 173 | | | | 1.57 | | | | 1.57 | | | | (.23 | ) |
| | — | | | | — | | | | — | | | | 27.84 | | | | 19.13 | | | | 124 | | | | 1.63 | | | | 1.63 | | | | (.17 | ) |
| | — | | | | — | | | | — | | | | 23.37 | | | | (.43 | ) | | | 112 | | | | 1.63 | | | | 1.63 | | | | (.33 | ) |
See page 32 for footnotes.
Financial highlights (continued)
| | | | | | (Loss) income from investment operations1 |
| | | | | | | | | Net (losses) | | | | |
| | | Net asset | | | Net | | | gains on | | | | |
| | | value, | | | investment | | | securities (both | | | Total from | |
| | | beginning | | | income | | | realized and | | | investment | |
| | | of period | | | (loss)2 | | | unrealized) | | | operations | |
| Class R-2E: | | | | | | | | | | | | | | | | |
| Six months ended 5/31/20165,6 | | $ | 38.85 | | | $ | .02 | | | $ | (1.58 | ) | | $ | (1.56 | ) |
| Year ended 11/30/2015 | | | 40.60 | | | | .06 | | | | 1.54 | | | | 1.60 | |
| Period from 8/29/2014 to 11/30/20146,12 | | | 40.22 | | | | .01 | | | | .37 | | | | .38 | |
| Class R-3: | | | | | | | | | | | | | | | | |
| Six months ended 5/31/20165,6 | | | 38.14 | | | | .02 | | | | (1.54 | ) | | | (1.52 | ) |
| Year ended 11/30/2015 | | | 39.84 | | | | (.01 | ) | | | 1.43 | | | | 1.42 | |
| Year ended 11/30/2014 | | | 38.98 | | | | .08 | | | | 3.23 | | | | 3.31 | |
| Year ended 11/30/2013 | | | 28.38 | | | | .06 | | | | 11.50 | | | | 11.56 | |
| Year ended 11/30/2012 | | | 23.77 | | | | .07 | | | | 4.58 | | | | 4.65 | |
| Year ended 11/30/2011 | | | 23.87 | | | | .03 | | | | (.02 | ) | | | .01 | |
| Class R-4: | | | | | | | | | | | | | | | | |
| Six months ended 5/31/20165,6 | | | 38.61 | | | | .08 | | | | (1.57 | ) | | | (1.49 | ) |
| Year ended 11/30/2015 | | | 40.29 | | | | .10 | | | | 1.46 | | | | 1.56 | |
| Year ended 11/30/2014 | | | 39.36 | | | | .20 | | | | 3.26 | | | | 3.46 | |
| Year ended 11/30/2013 | | | 28.67 | | | | .16 | | | | 11.60 | | | | 11.76 | |
| Year ended 11/30/2012 | | | 24.01 | | | | .16 | | | | 4.63 | | | | 4.79 | |
| Year ended 11/30/2011 | | | 24.11 | | | | .12 | | | | (.03 | ) | | | .09 | |
| Class R-5E: | | | | | | | | | | | | | | | | |
| Six months ended 5/31/20165,6 | | | 38.93 | | | | .10 | | | | (1.57 | ) | | | (1.47 | ) |
| Period from 11/20/2015 to 11/30/20156,13 | | | 38.84 | | | | — | 14 | | | .09 | | | | .09 | |
| Class R-5: | | | | | | | | | | | | | | | | |
| Six months ended 5/31/20165,6 | | | 39.17 | | | | .13 | | | | (1.58 | ) | | | (1.45 | ) |
| Year ended 11/30/2015 | | | 40.80 | | | | .22 | | | | 1.47 | | | | 1.69 | |
| Year ended 11/30/2014 | | | 39.80 | | | | .35 | | | | 3.27 | | | | 3.62 | |
| Year ended 11/30/2013 | | | 28.98 | | | | .26 | | | | 11.71 | | | | 11.97 | |
| Year ended 11/30/2012 | | | 24.26 | | | | .25 | | | | 4.67 | | | | 4.92 | |
| Year ended 11/30/2011 | | | 24.34 | | | | .19 | | | | (.03 | ) | | | .16 | |
| Class R-6: | | | | | | | | | | | | | | | | |
| Six months ended 5/31/20165,6 | | | 39.08 | | | | .14 | | | | (1.58 | ) | | | (1.44 | ) |
| Year ended 11/30/2015 | | | 40.73 | | | | .24 | | | | 1.47 | | | | 1.71 | |
| Year ended 11/30/2014 | | | 39.73 | | | | .34 | | | | 3.29 | | | | 3.63 | |
| Year ended 11/30/2013 | | | 28.93 | | | | .28 | | | | 11.69 | | | | 11.97 | |
| Year ended 11/30/2012 | | | 24.23 | | | | .26 | | | | 4.66 | | | | 4.92 | |
| Year ended 11/30/2011 | | | 24.31 | | | | .21 | | | | (.03 | ) | | | .18 | |
| | | Six months
ended
May 31, | | Year ended November 30 |
| | | 20165,6,7 | | 2015 | | 2014 | | 2013 | | 2012 | | 2011 |
| Portfolio turnover rate for all share classes | | | 15% | | | | 34 | % | | | 27 | % | | | 29 | % | | | 37 | % | | | 45 | % |
See Notes to Financial Statements
| Dividends and distributions | | | | | | | | | | | | | | |
Dividends
(from net
investment
income) | | | Distributions
(from capital
gains) | | | Total
dividends
and
distributions | | | Net asset
value, end
of period | | | Total return3,4 | | | Net assets,
end of
period
(in
millions) | | | Ratio of
expenses to
average net
assets before
reimbursements | | | Ratio of
expenses to
average net
assets after
reimbursements3 | | | Ratio of
net income
(loss) to
average
net assets2,3 | |
| | | | | | | | | | | | | | | | | | | | | | | | | | |
| $ | (.29 | ) | | $ | (2.06 | ) | | $ | (2.35 | ) | | $ | 34.94 | | | | (4.15 | )%7 | | $ | 1 | | | | 1.23 | %8 | | | 1.23 | %8 | | | .09 | %8 |
| | (.32 | ) | | | (3.03 | ) | | | (3.35 | ) | | | 38.85 | | | | 4.33 | 10 | | | — | 11 | | | .84 | 10 | | | .84 | 10 | | | .16 | 10 |
| | — | | | | — | | | | — | | | | 40.60 | | | | .94 | 7,10 | | | — | 11 | | | .17 | 7,10 | | | .17 | 7,10 | | | .03 | 7,10 |
| | | | | | | | | | | | | | | | | | | | | | | | | | | | | | | | | | | |
| | (.02 | ) | | | (2.06 | ) | | | (2.08 | ) | | | 34.54 | | | | (4.11 | )7 | | | 300 | | | | 1.14 | 8 | | | 1.14 | 8 | | | .13 | 8 |
| | (.09 | ) | | | (3.03 | ) | | | (3.12 | ) | | | 38.14 | | | | 3.91 | | | | 327 | | | | 1.11 | | | | 1.11 | | | | (.04 | ) |
| | (.06 | ) | | | (2.39 | ) | | | (2.45 | ) | | | 39.84 | | | | 8.88 | | | | 328 | | | | 1.13 | | | | 1.13 | | | | .21 | |
| | (.08 | ) | | | (.88 | ) | | | (.96 | ) | | | 38.98 | | | | 42.09 | | | | 262 | | | | 1.15 | | | | 1.15 | | | | .19 | |
| | (.04 | ) | | | — | | | | (.04 | ) | | | 28.38 | | | | 19.62 | | | | 168 | | | | 1.18 | | | | 1.18 | | | | .28 | |
| | (.11 | ) | | | — | | | | (.11 | ) | | | 23.77 | | | | .04 | | | | 150 | | | | 1.17 | | | | 1.17 | | | | .13 | |
| | | | | | | | | | | | | | | | | | | | | | | | | | | | | | | | | | | |
| | (.15 | ) | | | (2.06 | ) | | | (2.21 | ) | | | 34.91 | | | | (3.98 | )7 | | | 374 | | | | .82 | 8 | | | .82 | 8 | | | .45 | 8 |
| | (.21 | ) | | | (3.03 | ) | | | (3.24 | ) | | | 38.61 | | | | 4.25 | | | | 397 | | | | .81 | | | | .81 | | | | .27 | |
| | (.14 | ) | | | (2.39 | ) | | | (2.53 | ) | | | 40.29 | | | | 9.22 | | | | 368 | | | | .81 | | | | .81 | | | | .52 | |
| | (.19 | ) | | | (.88 | ) | | | (1.07 | ) | | | 39.36 | | | | 42.52 | | | | 252 | | | | .83 | | | | .83 | | | | .49 | |
| | (.13 | ) | | | — | | | | (.13 | ) | | | 28.67 | | | | 20.06 | | | | 150 | | | | .85 | | | | .85 | | | | .61 | |
| | (.19 | ) | | | — | | | | (.19 | ) | | | 24.01 | | | | .35 | | | | 132 | | | | .85 | | | | .85 | | | | .45 | |
| | | | | | | | | | | | | | | | | | | | | | | | | | | | | | | | | | | |
| | (.29 | ) | | | (2.06 | ) | | | (2.35 | ) | | | 35.11 | | | | (3.89 | )7 | | | — | 11 | | | .69 | 8 | | | .68 | 8 | | | .58 | 8 |
| | — | | | | — | | | | — | | | | 38.93 | | | | .23 | 7 | | | — | 11 | | | .02 | 7 | | | .02 | 7 | | | — | 7,9 |
| | | | | | | | | | | | | | | | | | | | | | | | | | | | | | | | | | | |
| | (.26 | ) | | | (2.06 | ) | | | (2.32 | ) | | | 35.40 | | | | (3.81 | )7 | | | 150 | | | | .52 | 8 | | | .52 | 8 | | | .75 | 8 |
| | (.29 | ) | | | (3.03 | ) | | | (3.32 | ) | | | 39.17 | | | | 4.55 | | | | 160 | | | | .50 | | | | .50 | | | | .57 | |
| | (.23 | ) | | | (2.39 | ) | | | (2.62 | ) | | | 40.80 | | | | 9.54 | | | | 152 | | | | .52 | | | | .52 | | | | .88 | |
| | (.27 | ) | | | (.88 | ) | | | (1.15 | ) | | | 39.80 | | | | 42.93 | | | | 233 | | | | .53 | | | | .53 | | | | .79 | |
| | (.20 | ) | | | — | | | | (.20 | ) | | | 28.98 | | | | 20.45 | | | | 131 | | | | .54 | | | | .54 | | | | .92 | |
| | (.24 | ) | | | — | | | | (.24 | ) | | | 24.26 | | | | .64 | | | | 111 | | | | .54 | | | | .54 | | | | .76 | |
| | | | | | | | | | | | | | | | | | | | | | | | | | | | | | | | | | | |
| | (.28 | ) | | | (2.06 | ) | | | (2.34 | ) | | | 35.30 | | | | (3.80 | )7 | | | 1,748 | | | | .47 | 8 | | | .47 | 8 | | | .81 | 8 |
| | (.33 | ) | | | (3.03 | ) | | | (3.36 | ) | | | 39.08 | | | | 4.61 | | | | 1,590 | | | | .46 | | | | .46 | | | | .62 | |
| | (.24 | ) | | | (2.39 | ) | | | (2.63 | ) | | | 40.73 | | | | 9.60 | | | | 1,421 | | | | .46 | | | | .46 | | | | .86 | |
| | (.29 | ) | | | (.88 | ) | | | (1.17 | ) | | | 39.73 | | | | 43.02 | | | | 945 | | | | .48 | | | | .48 | | | | .84 | |
| | (.22 | ) | | | — | | | | (.22 | ) | | | 28.93 | | | | 20.48 | | | | 512 | | | | .49 | | | | .49 | | | | .97 | |
| | (.26 | ) | | | — | | | | (.26 | ) | | | 24.23 | | | | .70 | | | | 340 | | | | .49 | | | | .49 | | | | .81 | |
See page 32 for footnotes.
Financial highlights (continued)
| 1 | Based on average shares outstanding. |
| 2 | For the year ended November 30, 2014, this column reflects the impact of a corporate action event that resulted in a one-time increase to net investment income. If the corporate action event had not occurred, the Class A net investment income per share and ratio of net income to average net assets would have been lower by $.09 and .22 percentage points, respectively. The impact to the other share classes would have been similar. |
| 3 | This column reflects the impact, if any, of certain reimbursements from CRMC. During one of the periods shown, CRMC paid a portion of the fund’s transfer agent fees for certain retirement plan share classes. |
| 4 | Total returns exclude any applicable sales charges, including contingent deferred sales charges. |
| 5 | Unaudited. |
| 6 | Based on operations for the period shown and, accordingly, is not representative of a full year. |
| 7 | Not annualized. |
| 8 | Annualized. |
| 9 | Amount less than .01%. |
| 10 | All or a significant portion of assets in this class consisted of seed capital invested by CRMC and/or its affiliates. Fees for distribution services are not charged or accrued on these seed capital assets. If such fees were paid by the fund on seed capital assets, fund expenses would have been higher and net income and total return would have been lower. |
| 11 | Amount less than $1 million. |
| 12 | Class R-2E shares were offered beginning August 29, 2014. |
| 13 | Class R-5E shares were offered beginning November 20, 2015. |
| 14 | Amount less than $.01. |
As a fund shareholder, you incur two types of costs: (1) transaction costs, such as initial sales charges on purchase payments and contingent deferred sales charges on redemptions (loads), and (2) ongoing costs, including management fees, distribution and service (12b-1) fees, and other expenses. This example is intended to help you understand your ongoing costs (in dollars) of investing in the fund so you can compare these costs with the ongoing costs of investing in other mutual funds. The example is based on an investment of $1,000 invested at the beginning of the period and held for the entire six-month period (December 1, 2015, through May 31, 2016).
Actual expenses:
The first line of each share class in the table on the following page provides information about actual account values and actual expenses. You may use the information in this line, together with the amount you invested, to estimate the expenses that you paid over the period. Simply divide your account value by $1,000 (for example, an $8,600 account value divided by $1,000 = 8.6), then multiply the result by the number in the first line under the heading entitled “Expenses paid during period” to estimate the expenses you paid on your account during this period.
Hypothetical example for comparison purposes:
The second line of each share class in the table on the following page provides information about hypothetical account values and hypothetical expenses based on the actual expense ratio for the share class and an assumed rate of return of 5.00% per year before expenses, which is not the actual return of the share class. The hypothetical account values and expenses may not be used to estimate the actual ending account balance or expenses you paid for the period. You may use this information to compare the ongoing costs of investing in the fund and other funds. To do so, compare this 5.00% hypothetical example with the 5.00% hypothetical examples that appear in the shareholder reports of the other funds.
Notes:
Retirement plan participants may be subject to certain fees charged by the plan sponsor, and Class F-1, F-2 and 529-F-1 shareholders may be subject to fees charged by financial intermediaries, typically ranging from 0.75% to 1.50% of assets annually depending on services offered. You can estimate the impact of these fees by adding the amount of the fees to the total estimated expenses you paid on your account during the period as calculated above. In addition, your ending account value would be lower by the amount of these fees.
Note that the expenses shown in the table on the following page are meant to highlight your ongoing costs only and do not reflect any transactional costs, such as sales charges (loads). Therefore, the second line of each share class in the table is useful in comparing ongoing costs only and will not help you determine the relative total costs of owning different funds. In addition, if these transactional costs were included, your costs would have been higher.
| | | Beginning
account value
12/1/2015 | | | Ending
account value
5/31/2016 | | | Expenses paid
during period* | | | Annualized
expense ratio | |
| Class A - actual return | | $ | 1,000.00 | | | $ | 960.48 | | | $ | 3.97 | | | | .81 | % |
| Class A - assumed 5% return | | | 1,000.00 | | | | 1,020.95 | | | | 4.09 | | | | .81 | |
| Class B - actual return | | | 1,000.00 | | | | 956.67 | | | | 7.78 | | | | 1.59 | |
| Class B - assumed 5% return | | | 1,000.00 | | | | 1,017.05 | | | | 8.02 | | | | 1.59 | |
| Class C - actual return | | | 1,000.00 | | | | 956.31 | | | | 7.92 | | | | 1.62 | |
| Class C - assumed 5% return | | | 1,000.00 | | | | 1,016.90 | | | | 8.17 | | | | 1.62 | |
| Class F-1 - actual return | | | 1,000.00 | | | | 960.03 | | | | 4.17 | | | | .85 | |
| Class F-1 - assumed 5% return | | | 1,000.00 | | | | 1,020.75 | | | | 4.29 | | | | .85 | |
| Class F-2 - actual return | | | 1,000.00 | | | | 961.45 | | | | 2.84 | | | | .58 | |
| Class F-2 - assumed 5% return | | | 1,000.00 | | | | 1,022.10 | | | | 2.93 | | | | .58 | |
| Class 529-A - actual return | | | 1,000.00 | | | | 959.96 | | | | 4.36 | | | | .89 | |
| Class 529-A - assumed 5% return | | | 1,000.00 | | | | 1,020.55 | | | | 4.50 | | | | .89 | |
| Class 529-B - actual return | | | 1,000.00 | | | | 956.09 | | | | 8.26 | | | | 1.69 | |
| Class 529-B - assumed 5% return | | | 1,000.00 | | | | 1,016.55 | | | | 8.52 | | | | 1.69 | |
| Class 529-C - actual return | | | 1,000.00 | | | | 956.01 | | | | 8.22 | | | | 1.68 | |
| Class 529-C - assumed 5% return | | | 1,000.00 | | | | 1,016.60 | | | | 8.47 | | | | 1.68 | |
| Class 529-E - actual return | | | 1,000.00 | | | | 958.89 | | | | 5.53 | | | | 1.13 | |
| Class 529-E - assumed 5% return | | | 1,000.00 | | | | 1,019.35 | | | | 5.70 | | | | 1.13 | |
| Class 529-F-1 - actual return | | | 1,000.00 | | | | 961.19 | | | | 3.38 | | | | .69 | |
| Class 529-F-1 - assumed 5% return | | | 1,000.00 | | | | 1,021.55 | | | | 3.49 | | | | .69 | |
| Class R-1 - actual return | | | 1,000.00 | | | | 956.88 | | | | 7.68 | | | | 1.57 | |
| Class R-1 - assumed 5% return | | | 1,000.00 | | | | 1,017.15 | | | | 7.92 | | | | 1.57 | |
| Class R-2 - actual return | | | 1,000.00 | | | | 956.56 | | | | 7.88 | | | | 1.61 | |
| Class R-2 - assumed 5% return | | | 1,000.00 | | | | 1,016.95 | | | | 8.12 | | | | 1.61 | |
| Class R-2E - actual return | | | 1,000.00 | | | | 958.54 | | | | 6.02 | | | | 1.23 | |
| Class R-2E - assumed 5% return | | | 1,000.00 | | | | 1,018.85 | | | | 6.21 | | | | 1.23 | |
| Class R-3 - actual return | | | 1,000.00 | | | | 958.93 | | | | 5.58 | | | | 1.14 | |
| Class R-3 - assumed 5% return | | | 1,000.00 | | | | 1,019.30 | | | | 5.76 | | | | 1.14 | |
| Class R-4 - actual return | | | 1,000.00 | | | | 960.23 | | | | 4.02 | | | | .82 | |
| Class R-4 - assumed 5% return | | | 1,000.00 | | | | 1,020.90 | | | | 4.14 | | | | .82 | |
| Class R-5E - actual return | | | 1,000.00 | | | | 961.14 | | | | 3.33 | | | | .68 | |
| Class R-5E - assumed 5% return | | | 1,000.00 | | | | 1,021.60 | | | | 3.44 | | | | .68 | |
| Class R-5 - actual return | | | 1,000.00 | | | | 961.92 | | | | 2.55 | | | | .52 | |
| Class R-5 - assumed 5% return | | | 1,000.00 | | | | 1,022.40 | | | | 2.63 | | | | .52 | |
| Class R-6 - actual return | | | 1,000.00 | | | | 962.00 | | | | 2.31 | | | | .47 | |
| Class R-6 - assumed 5% return | | | 1,000.00 | | | | 1,022.65 | | | | 2.38 | | | | .47 | |
| * | The “expenses paid during period” are equal to the “annualized expense ratio,” multiplied by the average account value over the period, multiplied by the number of days in the period, and divided by 366 (to reflect the one-half year period). |
This page was intentionally left blank.
Offices of the fund and of the investment adviser
Capital Research and Management Company
333 South Hope Street
Los Angeles, CA 90071-1406
6455 Irvine Center Drive
Irvine, CA 92618-4518
Transfer agent for shareholder accounts
American Funds Service Company
(Write to the address near you.)
P.O. Box 6007
Indianapolis, IN 46206-6007
P.O. Box 2280
Norfolk, VA 23501-2280
Custodian of assets
State Street Bank and Trust Company
One Lincoln Street
Boston, MA 02111
Counsel
O’Melveny & Myers LLP
400 South Hope Street
Los Angeles, CA 90071-2899
Independent registered public accounting firm
PricewaterhouseCoopers LLP
601 South Figueroa Street
Los Angeles, CA 90017-3874
Principal underwriter
American Funds Distributors, Inc.
333 South Hope Street
Los Angeles, CA 90071-1406
Investors should carefully consider investment objectives, risks, charges and expenses. This and other important information is contained in the fund prospectus and summary prospectus, which can be obtained from your financial professional and should be read carefully before investing. You may also call American Funds Service Company (AFS) at (800) 421-4225 or visit the American Funds website at americanfunds.com.
“American Funds Proxy Voting Procedures and Principles” — which describes how we vote proxies relating to portfolio securities — is available on the American Funds website or upon request by calling AFS. The fund files its proxy voting record with the U.S. Securities and Exchange Commission (SEC) for the 12 months ended June 30 by August 31. The proxy voting record is available free of charge on the SEC website at sec.gov and on the American Funds website.
A complete May 31, 2016, portfolio of The New Economy Fund’s investments is available free of charge by calling AFS or visiting the SEC website (where it is part of Form N-CSR).
The New Economy Fund files a complete list of its portfolio holdings with the SEC for the first and third quarters of each fiscal year Form N-Q. This filing is available free of charge on the SEC website. You may also review or, for a fee, copy this filing at the SEC’s Public Reference Room in Washington, D.C. Additional information regarding the operation of the Public Reference Room may be obtained by calling the SEC’s Office of Investor Education and Advocacy at (800) SEC-0330. Additionally, the list of portfolio holdings is available by calling AFS.
This report is for the information of shareholders of The New Economy Fund, but it also may be used as sales literature when preceded or accompanied by the current prospectus or summary prospectus, which gives details about charges, expenses, investment objectives and operating policies of the fund. If used as sales material after September 30, 2016, this report must be accompanied by an American Funds statistical update for the most recently completed calendar quarter.
The American Funds AdvantageSM
Since 1931, American Funds, part of Capital Group, has helped investors pursue long-term investment success. Our consistent approach — in combination with The Capital SystemSM — has resulted in a superior long-term track record.
| | Aligned with investor success |
| | We base our decisions on a long-term perspective, which we believe aligns our goals with the interests of our clients. Our portfolio managers average 27 years of investment experience, including 22 years at our company, reflecting a career commitment to our long-term approach.1 |
| | |
| | The Capital SystemSM |
| | The Capital System combines individual accountability with teamwork. Funds using The Capital System are divided into portions that are managed independently by investment professionals with diverse backgrounds, ages and investment approaches. An extensive global research effort is the backbone of our system. |
| | |
| | Superior long-term track record |
| | Our equity funds have beaten their Lipper peer indexes in 91% of 10-year periods and 95% of 20-year periods. Our fixed-income funds have beaten their Lipper indexes in 58% of 10-year periods and 58% of 20-year periods.2 Our fund management fees have been among the lowest in the industry.3 |
| | 1 | Portfolio manager experience as of December 31, 2015. |
| | | |
| | 2 | Based on Class A share results for rolling periods through December 31, 2015. Periods covered are the shorter of the fund’s lifetime or since the comparable Lipper index inception date (except Capital Income Builder and SMALLCAP World Fund, for which the Lipper average was used). |
| | | |
| | 3 | On average, our management fees were in the lowest quintile 68% of the time, based on the 20-year period ended December 31, 2015, versus comparable Lipper categories, excluding funds of funds. |

ITEM 2 – Code of Ethics
Not applicable for filing of semi-annual reports to shareholders.
ITEM 3 – Audit Committee Financial Expert
Not applicable for filing of semi-annual reports to shareholders.
ITEM 4 – Principal Accountant Fees and Services
Not applicable for filing of semi-annual reports to shareholders.
ITEM 5 – Audit Committee of Listed Registrants
Not applicable to this Registrant, insofar as the Registrant is not a listed issuer as defined in Rule 10A-3 under the Securities Exchange Act of 1934.
ITEM 6 – Schedule of Investments
The New Economy Fund®
Investment portfolio
May 31, 2016
Common stocks 90.51%
Health care 24.33% | Shares | Value
(000) |
| Thermo Fisher Scientific Inc. | 2,446,000 | $371,229 |
| Alexion Pharmaceuticals, Inc.1 | 2,296,694 | 346,571 |
| Amgen Inc. | 1,510,413 | 238,570 |
| Hologic, Inc.1 | 6,853,850 | 235,841 |
| BioMarin Pharmaceutical Inc.1 | 2,047,430 | 183,552 |
| NuVasive, Inc.1,2 | 3,004,500 | 163,355 |
| McKesson Corp. | 885,000 | 162,079 |
| Stryker Corp. | 1,389,250 | 154,429 |
| Kite Pharma, Inc.1,2 | 2,915,400 | 149,414 |
| Express Scripts Holding Co.1 | 1,923,300 | 145,305 |
| Grifols, SA, Class B (ADR) | 2,758,252 | 45,594 |
| Grifols, SA, Class A, non-registered shares | 2,000,000 | 45,318 |
| Grifols, SA, Class B, preferred non-voting, non-registered shares | 2,636,350 | 43,091 |
| Ultragenyx Pharmaceutical Inc.1 | 1,553,545 | 113,564 |
| UnitedHealth Group Inc. | 821,300 | 109,783 |
| PerkinElmer, Inc. | 1,834,355 | 100,431 |
| Myriad Genetics, Inc.1 | 2,714,800 | 92,005 |
| Illumina, Inc.1 | 633,200 | 91,706 |
| AbbVie Inc. | 1,419,001 | 89,298 |
| Perrigo Co. PLC | 865,000 | 82,902 |
| Medtronic PLC | 948,000 | 76,295 |
| Gilead Sciences, Inc. | 872,000 | 75,916 |
| GW Pharmaceuticals PLC (ADR)1 | 851,124 | 75,852 |
| Boston Scientific Corp.1 | 2,551,292 | 57,940 |
| bluebird bio, Inc.1 | 1,273,442 | 57,623 |
| Envision Healthcare Holdings, Inc.1 | 1,877,614 | 46,584 |
| Team Health Holdings, Inc.1 | 852,820 | 40,910 |
| Aetna Inc. | 300,000 | 33,969 |
| Mesoblast Ltd.1,2 | 21,900,000 | 31,261 |
| Mesoblast Ltd. (ADR)1,2 | 372,800 | 2,635 |
| UCB SA | 426,000 | 30,786 |
| Endo International PLC1 | 1,935,200 | 30,595 |
| Humana Inc. | 163,600 | 28,223 |
| QIAGEN NV1 | 1,290,814 | 27,676 |
| Edwards Lifesciences Corp.1 | 239,580 | 23,599 |
| athenahealth, Inc.1 | 114,275 | 14,498 |
| St. Jude Medical, Inc. | 81,061 | 6,352 |
| | | 3,624,751 |
| Information technology 22.37% | | |
| Alphabet Inc., Class C1 | 232,688 | 171,193 |
| Alphabet Inc., Class A1 | 192,695 | 144,300 |
| Tencent Holdings Ltd. | 13,137,000 | 292,976 |
| Skyworks Solutions, Inc. | 3,467,150 | 231,467 |
| Baidu, Inc., Class A (ADR)1 | 1,064,232 | 190,008 |
| Accenture PLC, Class A | 1,568,300 | 186,581 |
| Qorvo, Inc.1 | 3,294,480 | 167,920 |
The New Economy Fund — Page 1 of 6
Common stocks
Information technology (continued) | Shares | Value
(000) |
| Trimble Navigation Ltd.1 | 5,432,430 | $138,962 |
| Intuit Inc. | 1,128,200 | 120,334 |
| Texas Instruments Inc. | 1,865,000 | 113,019 |
| Oracle Corp. | 2,401,814 | 96,553 |
| AAC Technologies Holdings Inc. | 10,075,500 | 81,556 |
| Cray Inc.1,2 | 2,303,010 | 76,736 |
| Alibaba Group Holding Ltd. (ADR)1 | 887,000 | 72,734 |
| Murata Manufacturing Co., Ltd. | 620,000 | 72,506 |
| Broadcom Ltd. | 447,100 | 69,014 |
| Nintendo Co., Ltd. | 463,000 | 68,780 |
| Intel Corp. | 2,150,000 | 67,919 |
| Western Union Co. | 3,435,000 | 66,811 |
| Hamamatsu Photonics KK | 2,360,000 | 64,363 |
| Samsung Electronics Co., Ltd. | 55,595 | 60,269 |
| Zebra Technologies Corp., Class A1 | 1,105,800 | 58,729 |
| Autodesk, Inc.1 | 1,000,000 | 58,270 |
| YY Inc., Class A (ADR)1 | 1,249,581 | 54,294 |
| International Business Machines Corp. | 350,000 | 53,809 |
| LG Display Co., Ltd. | 2,460,000 | 53,254 |
| Juniper Networks, Inc. | 2,221,399 | 52,003 |
| Inphi Corp.1 | 1,537,035 | 47,940 |
| Topcon Corp. | 4,597,000 | 46,910 |
| Cypress Semiconductor Corp. | 3,896,000 | 41,414 |
| Finisar Corp.1 | 1,861,901 | 31,317 |
| Arista Networks, Inc.1 | 425,000 | 31,148 |
| Apple Inc. | 297,000 | 29,658 |
| Seagate Technology | 1,309,397 | 29,540 |
| salesforce.com, inc.1 | 330,000 | 27,624 |
| Viavi Solutions Inc.1 | 3,983,000 | 27,204 |
| ASML Holding NV | 272,340 | 27,090 |
| Moneysupermarket.com Group PLC | 4,860,000 | 23,278 |
| QLogic Corp.1 | 1,671,500 | 23,167 |
| Lumentum Holdings Inc.1 | 828,700 | 20,999 |
| Amphenol Corp., Class A | 310,000 | 18,203 |
| Motorola Solutions, Inc. | 174,500 | 12,088 |
| Cognizant Technology Solutions Corp., Class A1 | 88,900 | 5,462 |
| National Instruments Corp. | 153,733 | 4,392 |
| | | 3,331,794 |
| Consumer discretionary 16.16% | | |
| Netflix, Inc.1 | 4,501,100 | 461,678 |
| Sony Corp. | 8,829,000 | 247,166 |
| lululemon athletica inc.1 | 3,205,900 | 208,480 |
| Amazon.com, Inc.1 | 285,000 | 205,995 |
| Galaxy Entertainment Group Ltd. | 49,690,000 | 166,896 |
| Twenty-First Century Fox, Inc., Class A | 4,200,000 | 121,296 |
| Daily Mail and General Trust PLC, Class A, non-voting | 10,896,701 | 108,108 |
| Kering SA | 447,000 | 72,191 |
| Marriott International, Inc., Class A | 1,066,400 | 70,425 |
| Priceline Group Inc.1 | 50,500 | 63,849 |
| JCDecaux SA | 1,500,000 | 61,911 |
| Naspers Ltd., Class N | 418,000 | 61,480 |
| William Hill PLC | 13,600,000 | 61,279 |
| Viacom Inc., Class B | 1,278,964 | 56,748 |
| Kingfisher PLC | 10,436,100 | 55,503 |
The New Economy Fund — Page 2 of 6
Common stocks
Consumer discretionary (continued) | Shares | Value
(000) |
| Ralph Lauren Corp., Class A | 550,000 | $51,881 |
| Lions Gate Entertainment Corp. | 2,105,000 | 46,941 |
| Graham Holdings Co., Class B | 93,164 | 46,391 |
| Melco Crown Entertainment Ltd. (ADR) | 2,448,900 | 35,436 |
| Home Depot, Inc. | 251,000 | 33,162 |
| Eros International PLC, Class A1 | 2,078,778 | 30,558 |
| Sands China Ltd. | 7,780,000 | 29,835 |
| Don Quijote Holdings Co., Ltd. | 803,000 | 25,816 |
| Lands’ End, Inc.1 | 1,500,000 | 25,155 |
| Five Below, Inc.1 | 509,220 | 21,316 |
| NIKE, Inc., Class B | 346,400 | 19,128 |
| Domino’s Pizza, Inc. | 85,200 | 10,299 |
| B2W - Cia. Digital, ordinary nominative1 | 3,176,600 | 8,703 |
| | | 2,407,626 |
| Financials 10.93% | | |
| HDFC Bank Ltd.3 | 4,875,000 | 101,335 |
| HDFC Bank Ltd. (ADR) | 1,200,000 | 77,232 |
| Kotak Mahindra Bank Ltd. | 14,190,882 | 157,453 |
| American International Group, Inc. | 2,200,000 | 127,336 |
| Endurance Specialty Holdings Ltd. | 1,776,000 | 120,626 |
| Barclays PLC | 39,981,344 | 105,622 |
| AIA Group Ltd. | 17,591,800 | 102,892 |
| Prudential PLC | 4,900,000 | 97,937 |
| EXOR SpA | 2,258,000 | 85,646 |
| Essent Group Ltd.1 | 3,316,000 | 72,488 |
| Wells Fargo & Co. | 1,362,300 | 69,096 |
| Progressive Corp. | 1,800,000 | 59,940 |
| JPMorgan Chase & Co. | 800,000 | 52,216 |
| Banco Santander, SA | 10,570,574 | 50,468 |
| East West Bancorp, Inc. | 1,300,000 | 50,180 |
| Metropolitan Bank & Trust Co. | 26,500,000 | 49,356 |
| Leucadia National Corp. | 2,608,000 | 47,205 |
| State Street Corp. | 700,000 | 44,142 |
| Crown Castle International Corp. | 420,000 | 38,140 |
| Siam Commercial Bank PCL | 9,940,000 | 37,284 |
| Fifth Third Bancorp | 1,800,000 | 33,966 |
| Aberdeen Asset Management PLC | 7,370,000 | 29,792 |
| Altisource Residential Corp. | 1,825,899 | 18,296 |
| | | 1,628,648 |
| Industrials 6.12% | | |
| Nielsen Holdings PLC | 2,513,100 | 134,174 |
| CSX Corp. | 3,809,400 | 100,682 |
| Union Pacific Corp. | 1,075,954 | 90,584 |
| Ryanair Holdings PLC (ADR) | 1,026,999 | 89,760 |
| AKR Corporindo Tbk PT | 173,899,680 | 81,476 |
| Sensata Technologies Holding NV1 | 2,162,300 | 79,962 |
| Deutsche Post AG | 2,200,000 | 64,170 |
| CAE Inc. | 5,000,000 | 62,493 |
| JG Summit Holdings, Inc. | 33,268,800 | 58,762 |
| Babcock International Group PLC | 2,076,923 | 31,194 |
| Verisk Analytics, Inc., Class A1 | 381,000 | 30,248 |
| AirAsia Bhd. | 45,583,400 | 25,392 |
| Old Dominion Freight Line, Inc.1 | 390,000 | 25,096 |
The New Economy Fund — Page 3 of 6
Common stocks
Industrials (continued) | Shares | Value
(000) |
| Alliance Global Group, Inc. | 66,610,000 | $21,679 |
| J.B. Hunt Transport Services, Inc. | 188,000 | 15,551 |
| | | 911,223 |
| Consumer staples 2.73% | | |
| Associated British Foods PLC | 2,059,540 | 87,818 |
| Costco Wholesale Corp. | 557,000 | 82,865 |
| AMOREPACIFIC Corp. | 193,200 | 67,680 |
| Walgreens Boots Alliance, Inc. | 700,000 | 54,180 |
| COSMOS Pharmaceutical Corp. | 225,000 | 40,434 |
| Sprouts Farmers Market, Inc.1 | 1,630,953 | 40,382 |
| Kroger Co. | 625,000 | 22,350 |
| Herbalife Ltd.1 | 187,000 | 10,826 |
| | | 406,535 |
| Telecommunication services 1.46% | | |
| AT&T Inc. | 2,237,088 | 87,582 |
| Verizon Communications Inc. | 1,091,000 | 55,532 |
| MTN Group Ltd. | 6,500,000 | 50,664 |
| CenturyLink, Inc. | 534,800 | 14,504 |
| Avanti Communications Group PLC1,2 | 8,688,970 | 8,746 |
| | | 217,028 |
| Materials 0.91% | | |
| Croda International PLC | 1,313,103 | 55,914 |
| International Flavors & Fragrances Inc. | 310,700 | 40,080 |
| Monsanto Co. | 345,400 | 38,847 |
| | | 134,841 |
| Energy 0.52% | | |
| Schlumberger Ltd. | 725,000 | 55,317 |
| FMC Technologies, Inc.1 | 588,600 | 16,028 |
| Golar LNG Ltd. | 390,000 | 6,786 |
| | | 78,131 |
| Utilities 0.42% | | |
| ENN Energy Holdings Ltd. | 12,760,000 | 63,301 |
| Miscellaneous 4.56% | | |
| Other common stocks in initial period of acquisition | | 679,828 |
| Total common stocks (cost: $10,763,408,000) | | 13,483,706 |
Convertible stocks 0.39%
Health care 0.39% | | |
| Stemcentrx, Inc., Series F-1, convertible preferred3,4 | 1,879,501 | 58,570 |
| Total convertible stocks (cost: $22,686,000) | | 58,570 |
The New Economy Fund — Page 4 of 6
Bonds, notes & other debt instruments 0.28%
U.S. Treasury bonds & notes 0.28%
U.S. Treasury 0.28% | Principal amount
(000) | Value
(000) |
| U.S. Treasury 1.625% 2026 | $4,355 | $4,266 |
| U.S. Treasury 3.00% 2045 | 18,316 | 19,662 |
| U.S. Treasury 2.50% 2046 | 18,970 | 18,389 |
| Total bonds, notes & other debt instruments (cost: $42,882,000) | | 42,317 |
| Short-term securities 8.95% | | |
| Alphabet Inc. 0.53% due 7/6/20165 | 31,000 | 30,988 |
| Apple Inc. 0.45%–0.49% due 7/18/2016–8/16/20165 | 120,200 | 120,106 |
| Chariot Funding, LLC 1.02% due 9/30/20165 | 20,000 | 19,947 |
| Chevron Corp. 0.51% due 7/25/20165 | 40,800 | 40,775 |
| Emerson Electric Co. 0.40% due 6/28/20165 | 21,900 | 21,893 |
| Fannie Mae 0.41% due 6/13/2016 | 50,000 | 49,996 |
| Federal Farm Credit Banks 0.22% due 6/13/2016 | 19,100 | 19,099 |
| Federal Home Loan Bank 0.29%–0.58% due 6/1/2016–7/22/2016 | 336,700 | 336,628 |
| General Electric Co. 0.32% due 6/1/2016 | 50,000 | 50,000 |
| IBM Corp. 0.44% due 6/20/2016–6/27/20165 | 106,800 | 106,777 |
| John Deere Financial Ltd. 0.42% due 6/2/20165 | 15,000 | 15,000 |
| Microsoft Corp. 0.43%–0.48% due 7/27/2016–8/17/20165 | 75,600 | 75,521 |
| Paccar Financial Corp. 0.38%–0.50% due 6/1/2016–6/16/2016 | 50,100 | 50,096 |
| PepsiCo Inc. 0.42% due 7/5/20165 | 23,300 | 23,290 |
| Pfizer Inc. 0.47%–0.54% due 6/21/2016–8/24/20165 | 168,200 | 168,032 |
| Private Export Funding Corp. 0.52%–0.60% due 8/2/2016–9/12/20165 | 64,100 | 64,014 |
| Qualcomm Inc. 0.41%–0.42% due 7/6/2016–7/20/20165 | 36,400 | 36,381 |
| Regents of the University of California 0.50% due 7/8/2016 | 25,000 | 24,987 |
| Wal-Mart Stores, Inc. 0.35% due 6/15/20165 | 19,300 | 19,297 |
| Wells Fargo Bank, N.A. 0.85%–0.92% due 8/22/2016–12/1/2016 | 59,900 | 59,919 |
| Total short-term securities (cost: $1,332,661,000) | | 1,332,746 |
| Total investment securities 100.13% (cost: $12,161,637,000) | | 14,917,339 |
| Other assets less liabilities (0.13)% | | (19,946) |
| Net assets 100.00% | | $14,897,393 |
As permitted by U.S. Securities and Exchange Commission regulations, “Miscellaneous” securities include holdings in their first year of acquisition that have not previously been publicly disclosed.
The following footnotes apply to either the individual securities noted or one or more of the securities aggregated and listed as a single line item.
| 1 | Security did not produce income during the last 12 months. |
| 2 | Represents an affiliated company as defined under the Investment Company Act of 1940. |
| 3 | Valued under fair value procedures adopted by authority of the board of trustees. The total value of all such securities, including those in “Miscellaneous,“ was $160,264,000, which represented 1.08% of the net assets of the fund. |
| 4 | Acquired through a private placement transaction exempt from registration under the Securities Act of 1933. May be subject to legal or contractual restrictions on resale. Further details on these holdings appear below. |
| 5 | Acquired in a transaction exempt from registration under Section 4(2) of the Securities Act of 1933. May be resold in the U.S. in transactions exempt from registration, normally to qualified institutional buyers. The total value of all such securities was $742,021,000, which represented 4.98% of the net assets of the fund. |
| Private placement securities | Acquisition
date | Cost
(000) | Value
(000) | Percent
of net
assets |
| Stemcentrx, Inc., Series F-1, convertible preferred | 6/10/2014 | $22,686 | $58,570 | .39% |
| |
| Key to abbreviation |
| ADR = American Depositary Receipts |
The New Economy Fund — Page 5 of 6
Investments are not FDIC-insured, nor are they deposits of or guaranteed by a bank or any other entity, so they may lose value.
Investors should carefully consider investment objectives, risks, charges and expenses. This and other important information is contained in the fund prospectus and summary prospectus, which can be obtained from your financial professional and should be read carefully before investing. You may also call American Funds Service Company (AFS) at (800) 421-4225 or visit the American Funds website at americanfunds.com.
| MFGEFPX-014-0716O-S54157 | The New Economy Fund — Page 6 of 6 |
ITEM 7 – Disclosure of Proxy Voting Policies and Procedures for Closed-End Management Investment Companies
Not applicable to this Registrant, insofar as the Registrant is not a closed-end management investment company.
ITEM 8 – Portfolio Managers of Closed-End Management Investment Companies
Not applicable to this Registrant, insofar as the Registrant is not a closed-end management investment company.
ITEM 9 – Purchases of Equity Securities by Closed-End Management Investment Company and Affiliated Purchasers
Not applicable to this Registrant, insofar as the Registrant is not a closed-end management investment company.
ITEM 10 – Submission of Matters to a Vote of Security Holders
There have been no material changes to the procedures by which shareholders may recommend nominees to the Registrant’s board of trustees since the Registrant last submitted a proxy statement to its shareholders. The procedures are as follows. The Registrant has a nominating and governance committee comprised solely of persons who are not considered ‘‘interested persons’’ of the Registrant within the meaning of the Investment Company Act of 1940, as amended. The committee periodically reviews such issues as the board’s composition, responsibilities, committees, compensation and other relevant issues, and recommends any appropriate changes to the full board of trustees. While the committee normally is able to identify from its own resources an ample number of qualified candidates, it will consider shareholder suggestions of persons to be considered as nominees to fill future vacancies on the board. Such suggestions must be sent in writing to the nominating and governance committee of the Registrant, c/o the Registrant’s Secretary, and must be accompanied by complete biographical and occupational data on the prospective nominee, along with a written consent of the prospective nominee for consideration of his or her name by the nominating and governance committee.
ITEM 11 – Controls and Procedures
| (a) | The Registrant’s Principal Executive Officer and Principal Financial Officer have concluded, based on their evaluation of the Registrant’s disclosure controls and procedures (as such term is defined in Rule 30a-3 under the Investment Company Act of 1940), that such controls and procedures are adequate and reasonably designed to achieve the purposes described in paragraph (c) of such rule. |
| | |
| (b) | There were no changes in the Registrant’s internal controls over financial reporting (as defined in Rule 30a-3(d) under the Investment Company Act of 1940) that occurred during the Registrant’s second fiscal quarter of the period covered by this report that has materially affected, or is reasonably likely to materially affect, the Registrant’s internal control over financial reporting. |
ITEM 12 – Exhibits
| (a)(1) | Not applicable for filing of semi-annual reports to shareholders. |
| | |
| (a)(2) | The certifications required by Rule 30a-2 of the Investment Company Act of 1940 and Sections 302 and 906 of the Sarbanes-Oxley Act of 2002 are attached as exhibits hereto. |
SIGNATURES
Pursuant to the requirements of the Securities Exchange Act of 1934 and the Investment Company Act of 1940, the Registrant has duly caused this report to be signed on its behalf by the undersigned, thereunto duly authorized.
| | THE NEW ECONOMY FUND |
| | |
| | By /s/ Donald H. Rolfe |
| | Donald H. Rolfe, Executive Vice President and Principal Executive Officer |
| | |
| | Date: July 29, 2016 |
Pursuant to the requirements of the Securities Exchange Act of 1934 and the Investment Company Act of 1940, this report has been signed below by the following persons on behalf of the Registrant and in the capacities and on the dates indicated.
| By /s/ Donald H. Rolfe |
Donald H. Rolfe, Executive Vice President and Principal Executive Officer |
| |
| Date: July 29, 2016 |
| By /s/ Kimberley H. Monasterio |
Kimberley H. Monasterio, Treasurer and Principal Financial Officer |
| |
| Date: July 29, 2016 |