Use these links to rapidly review the document
TABLE OF CONTENTS
Table of Contents
SECURITIES AND EXCHANGE COMMISSION
WASHINGTON, D. C. 20549
FORM 10-K
Annual Report Pursuant to Section 13 or 15(d) of the
Securities Exchange Act of 1934
For the fiscal year ended December 31, 2013
Commission file number 0-12422
MAINSOURCE FINANCIAL GROUP, INC.
(Exact name of registrant as specified in its charter)
| | |
Indiana
(State or other jurisdiction
of incorporation or organization) | | 35-1562245
(I.R.S. Employer
Identification No.) |
2105 North State Road 3 Bypass
Greensburg, Indiana 47240
(Address of principal executive offices) (Zip code) |
Registrant's telephone number, including area code:(812) 663-6734 |
Securities registered pursuant to Section 12(b) of the Act: |
Title of each class
Common shares, no par value |
|
Name of each exchange on which registered
The NASDAQ Stock Market LLC |
Securities registered pursuant to Section 12(g) of the Act:
None |
Indicate by check mark if the registrant is a well-known seasoned issuer, as defined in Rule 405 of the Securities Act. Yes o No ý
Indicate by check mark if the registrant is not required to file reports pursuant to Section 13 or Section 15(d) of the Act. Yes o No ý
Indicate by check mark whether the registrant (1) has filed all reports required to be filed by Section 13 or 15(d) of the Securities Exchange Act of 1934 during the preceding 12 months (or for such shorter period that the registrant was required to file such reports), and (2) has been subject to such filing requirements for the past 90 days. Yes ý No o
Indicate by check mark whether the registrant has submitted electronically and posted on its corporate Website, if any, every Interactive Data File required to be submitted and posted pursuant to Rule 405 of Regulation S-T during the previous 12 months (or for such shorter period that the registrant was required to submit and post such files). Yes ý No o
Indicate by check mark if disclosure of delinquent filers pursuant to Item 405 of Regulation S-K is not contained herein, and will not be contained, to the best of registrant's knowledge, in definitive proxy or information statements incorporated by reference in Part III of this Form 10-K or any amendment to this Form 10-K. o
Indicate by check mark whether the registrant is a large accelerated filer, an accelerated filer, a non-accelerated filer, or a smaller reporting company. See definitions of "large accelerated filer", "accelerated filer", and "smaller reporting company" in Rule 12b-2 of the Exchange Act.
| | | | | | |
| Large accelerated filero | | Accelerated filerý | | Non-accelerated filero
(Do not check if a smaller
reporting company) | | Smaller reporting companyo |
Indicate by check mark whether the registrant is a shell company (as defined in Rule 12b-2 of the Act). Yes o No ý
The aggregate market value (not necessarily a reliable indication of the price at which more than a limited number of shares would trade) of the voting stock held by non-affiliates of the registrant was $273,856,945 as of June 30, 2013.
As of March 14, 2014, there were outstanding 20,424,224 common shares, without par value, of the registrant.
DOCUMENTS INCORPORATED BY REFERENCE
| | |
Documents | | Part of Form 10-K
Into Which Incorporated |
|---|
Definitive Proxy Statement for Annual
Meeting of Shareholders to be held
April 30, 2014 | | Part III (Items 10 through 14) |
1
Table of Contents
FORM 10-K
TABLE OF CONTENTS
Pursuant to General Instruction G, the information called for by Items 10-14 is omitted by MainSource Financial Group, Inc. since MainSource Financial Group, Inc. will file with the Commission a definitive proxy statement for its 2014 Annual Meeting of Shareholders pursuant to Regulation 14A not later than 120 days after the close of the fiscal year containing the information required by Items 10-14.
2
Table of Contents
PART I.
(Dollar amounts in thousands except per share data)
ITEM 1. BUSINESS
General
MainSource Financial Group, Inc. ("MainSource" or the "Company") is an Indiana corporation and bank holding company, within the meaning of the Bank Holding Company Act of 1956, as amended (the "BHC Act"), that has elected to become a financial holding company ("FHC"). The Company is based in Greensburg, Indiana. As of December 31, 2013, the Company operated one banking subsidiary: MainSource Bank ("the Bank"), an Indiana state chartered bank. Through its non-bank affiliates, the Company provides services incidental to the business of banking. Since its formation in 1982, the Company has acquired and established various institutions and financial services companies and may acquire additional financial institutions and financial services companies in the future. For further discussion of the business of the Company see Management's Discussion and Analysis in Part II, Item 7.
As of December 31, 2013, the Company operated 74 branch banking offices in Indiana, Illinois, Ohio and Kentucky. As of December 31, 2013, the Company had consolidated assets of $2,859,864, consolidated deposits of $2,200,628 and shareholders' equity of $305,526.
Through the Bank, the Company offers a broad range of financial services, including: accepting time and transaction deposits; making consumer, commercial, agribusiness and real estate mortgage loans; renting safe deposit facilities; providing personal and corporate trust services; and providing other corporate services such as letters of credit and repurchase agreements.
The lending activities of the Bank are separated into primarily the categories of commercial, commercial real estate, residential, and consumer. Loans are originated by the lending officers of the Bank subject to limitations set forth in lending policies. The Board of Directors of the Bank monitors concentrations of credit, problem and past due loans and charge-offs of uncollectible loans and approves loan policy. The Bank maintains conservative loan policies and underwriting practices in order to address and manage loan risks. These policies and practices include granting loans on a sound and collectible basis, serving the legitimate needs of the community and the general market area while obtaining a balance between maximum yield and minimum risk, ensuring that primary and secondary sources of repayment are adequate in relation to the amount of the loan, developing and maintaining adequate diversification of the loan portfolio as a whole and of the loans within each category and developing and applying adequate collection policies.
Commercial loans include secured and unsecured loans, including real estate loans, to individuals and companies and to governmental units predominantly within the market area of the Bank for a myriad of business purposes.
Agricultural loans are generated in the Bank's markets. Most of the loans are real estate loans on farm properties. Loans are also made for agricultural production and such loans are generally reviewed annually.
Residential real estate lending has been the largest component of the loan portfolio for many years. The Bank generates residential mortgages for its own portfolio. However, the Company elects to sell the majority of its fixed rate mortgages into the secondary market while maintaining the servicing of such loans. At December 31, 2013, the Company was servicing a $786 million residential real estate loan portfolio. By originating loans for sale in the secondary market, the Company can more fully satisfy customer demand for fixed rate residential mortgages and increase fee income, while reducing the risk of loss caused by rising interest rates.
The principal source of revenues for the Company is interest and fees on loans, which accounted for 53.4% of total revenues in 2013, 55.0% in 2012 and 55.7% in 2011. While the Company's chief decision makers monitor the revenue streams of the various Company products and services, the identifiable segments are not material and operations are managed and financial performance is evaluated on a Company-wide basis. Accordingly, all of the Company's financial service operations are considered by management to be aggregated in one reportable operating segment.
The Company's investment securities portfolio is primarily comprised of state and municipal bonds; U. S. government sponsored entities' mortgage-backed securities and collateralized mortgage obligations; and corporate securities. The Company has classified its entire investment portfolio as available for sale, with fair value changes reported separately in shareholders' equity. Funds invested in the investment portfolio generally represent funds not immediately required to meet loan demand. Income related to the Company's investment portfolio accounted for 16.7% of total revenues in 2013, 16.2% in 2012 and 17.0% in 2011. As of December 31, 2013, the Company had not identified any securities as being "high risk" as defined by the FFIEC Supervisory Policy Statement on Securities Activities.
The primary source of funds for the Bank is deposits generated in local market areas. To attract and retain stable depositors, the Bank markets various programs for demand, savings and time deposit accounts. These programs include interest and non-interest bearing demand and individual retirement accounts.
3
Table of Contents
Currently, national retailing and manufacturing subsidiaries, brokerage and insurance firms and credit unions are fierce competitors within the financial services industry. Mergers between financial institutions within Indiana and neighboring states, which became permissible under the Interstate Banking and Branching Efficiency Act of 1994, have also added competitive pressure.
The branches of the Bank are predominantly located in non-metropolitan areas and the Bank's business is centered in loans and deposits generated within markets considered largely rural in nature. In addition to competing vigorously with other banks, thrift institutions, credit unions and finance companies located within their service areas, we also compete, directly and indirectly, with all providers of financial services.
Employees
As of December 31, 2013, the Company and its subsidiaries had 772 full-time equivalent employees to whom they provide a variety of benefits and with whom they enjoy excellent relations. None of our employees are subject to collective bargaining agreements.
Available Information
We make available free of charge on or through our Internet web site, www.mainsourcebank.com, our Annual Report on Form 10-K, Quarterly Reports on Form 10-Q and Current Reports on Form 8-K and all amendments to those reports filed or furnished pursuant to Section 13(a) or Section 15(d) of the Securities Exchange Act of 1934, as amended (the "Exchange Act") as soon as reasonably practicable after we electronically file such material with, or furnish it to, the Securities and Exchange Commission ("SEC"). Such materials are also available free of charge on the SEC website, www.sec.gov. We have included our and the SEC's Internet website addresses throughout this Annual Report on Form 10-K as textual references only. The information contained on these websites is not incorporated into this Annual Report on Form 10-K.
Regulation and Supervision
The Company is a financial holding company ("FHC") within the meaning of the Bank Holding Company Act of 1956, as amended. As a FHC, the Company is subject to regulation by the Federal Reserve Board ("FRB"). The Bank is an Indiana state chartered bank subject to supervision and regulation by the Federal Deposit Insurance Corporation ("FDIC") and the Indiana Department of Financial Institutions. The following is a discussion of material statutes and regulations affecting the Company and the Bank. The discussion is qualified in its entirety by reference to such statutes and regulations.
Bank Holding Company Act of 1956, as amended
Generally, the BHC Act governs the acquisition and control of banks and nonbanking companies by bank holding companies. A bank holding company is subject to regulation by and is required to register with the FRB under the BHC Act. The BHC Act requires a bank holding company to file an annual report of its operations and such additional information as the FRB may require. The FRB has issued regulations under the BHC Act requiring a bank holding company to serve as a source of financial and managerial strength to its subsidiary banks. It is the policy of the FRB that, pursuant to this requirement, a bank holding company should stand ready to use its resources to provide adequate capital funds to its subsidiary banks during periods of financial stress or adversity.
The acquisition of 5% or more of the voting shares of any bank or bank holding company generally requires the prior approval of the FRB and is subject to applicable federal and state law, including the Riegle-Neal Interstate Banking and Branching Efficiency Act of 1994 ("Riegle-Neal") for interstate transactions. The FRB evaluates acquisition applications based on, among other things, competitive factors, supervisory factors, adequacy of financial and managerial resources, and banking and community needs considerations.
The BHC Act also prohibits, with certain exceptions, a bank holding company from acquiring direct or indirect ownership or control of more than 5% of the voting shares of any "nonbanking" company unless the nonbanking activities are found by the FRB to be "so closely related to banking...as to be a proper incident thereto." Under current regulations of the FRB, a bank holding company and its nonbank subsidiaries are permitted, among other activities, to engage in such banking-related business ventures as consumer finance, equipment leasing, data processing, mortgage banking, financial and investment advice, and securities brokerage services. The BHC Act does not place territorial restrictions on the activities of a bank holding company or its nonbank subsidiaries.
Federal law prohibits acquisition of "control" of a bank or bank holding company without prior notice to certain federal bank regulators. "Control" is defined in certain cases as the acquisition of as little as 10% of the outstanding shares of any class of voting stock. Furthermore, under certain circumstances, a bank holding company may not be able to purchase its own stock, where the gross consideration will equal 10% or more of the company's net worth, without obtaining approval of the FRB. Under the Federal Reserve Act, banks and their affiliates are subject to certain requirements and restrictions when dealing with each other (affiliate transactions include transactions between a bank and its bank holding company).
4
Table of Contents
The Gramm-Leach-Bliley Financial Modernization Act of 1999 (the "Modernization Act") was enacted on November 12, 1999. The Modernization Act, which amended the BHC Act, provides the following:
- •
- it allows bank holding companies that qualify as "financial holding companies" to engage in a broad range of financial and related activities;
- •
- it allows insurers and other financial services companies to acquire banks;
- •
- it removes various restrictions that applied to bank holding company ownership of securities firms and mutual fund advisory companies; and
- •
- it establishes the overall regulatory structure applicable to bank holding companies that also engage in insurance and securities operations.
The Company initially qualified as a financial holding company in December, 2004. Thus the Company is authorized to operate as a financial holding company and is eligible to engage in, or acquire companies engaged in, the broader range of activities that are permitted by the Modernization Act. These activities include those that are determined to be "financial in nature," including insurance underwriting, securities underwriting and dealing, and making merchant banking investments in commercial and financial companies. If a banking subsidiary ceases to be "well capitalized" or "well managed" under applicable regulatory standards, the FRB may, among other things, place limitations on our ability to conduct these broader financial activities or, if the deficiencies persist, require us to divest the banking subsidiary. In addition, if a banking subsidiary receives a rating of less than satisfactory under the Community Reinvestment Act of 1977 ("CRA"), we would be prohibited from engaging in any additional activities other than those permissible for bank holding companies that are not financial holding companies.
In 1970, Congress enacted the Currency and Foreign Transactions Reporting Act, commonly known as the Bank Secrecy Act (the "BSA"). The BSA requires financial institutions to maintain records of certain customers and currency transactions and to report certain domestic and foreign currency transactions, which may have a high degree of usefulness in criminal, tax, or regulatory investigations or proceedings. Under this law, financial institutions are required to develop a BSA compliance program.
In 2001, the President signed into law comprehensive anti-terrorism legislation known as the USA Patriot Act. Title III of the USA Patriot Act requires financial institutions, including the Company and the Bank, to help prevent and detect international money laundering and the financing of terrorism and prosecute those involved in such activities. The Department of the Treasury has adopted additional requirements to further implement Title III.
Under these regulations, a mechanism has been established for law enforcement officials to communicate names of suspected terrorists and money launderers to financial institutions to enable financial institutions to promptly locate accounts and transactions involving those suspects. Financial institutions receiving names of suspects must search their account and transaction records for potential matches and report positive results to the U.S. Department of the Treasury Financial Crimes Enforcement Network ("FinCEN"). Each financial institution must designate a point of contact to receive information requests. These regulations outline how financial institutions can share information concerning suspected terrorist and money laundering activity with other financial institutions under the protection of a statutory safe harbor if each financial institution notifies FinCEN of its intent to share information. The Department of the Treasury has also adopted regulations intended to prevent money laundering and terrorist financing through correspondent accounts maintained by U.S. financial institutions on behalf of foreign banks. Financial institutions are required to take reasonable steps to ensure that they are not providing banking services directly or indirectly to foreign shell banks. In addition, banks must have procedures in place to verify the identity of the persons with whom they deal.
The Federal Deposit Insurance Corporation Improvement Act of 1991 ("FDICIA") requires, among other things, federal bank regulatory authorities to take "prompt corrective action" with respect to banks which do not meet minimum capital requirements. For these purposes, FDICIA establishes five capital tiers: well capitalized, adequately capitalized, undercapitalized, significantly undercapitalized and critically undercapitalized. The FDIC has adopted regulations to implement the prompt corrective action provisions of FDICIA.
"Undercapitalized" banks are subject to growth limitations and are required to submit a capital restoration plan. A bank's compliance with such plan is required to be guaranteed by the bank's parent holding company. If an "undercapitalized" bank fails to submit an acceptable plan, it is treated as if it is significantly undercapitalized. "Significantly undercapitalized" banks are subject to one or more restrictions, including an order by the FDIC to sell sufficient voting stock to become adequately capitalized, requirements to reduce total assets and cease receipt of deposits from correspondent banks, and restrictions on compensation of
5
Table of Contents
executive officers. "Critically undercapitalized" institutions may not, beginning 60 days after becoming "critically undercapitalized," make any payment of principal or interest on certain subordinated debt or extend credit for a highly leveraged transaction or enter into any transaction outside the ordinary course of business. In addition, "critically undercapitalized" institutions are subject to appointment of a receiver or conservator.
Currently, a "well capitalized" institution is one that has a total risk-based capital ratio of at least 10%, a Tier 1 risk-based capital ratio of at least 6%, a leverage ratio of at least 5% and is not subject to regulatory direction to maintain a specific level for any capital measure. An "adequately capitalized" institution is one that has ratios greater than 8%, 4% and 4%. An institution is "undercapitalized" if its respective ratios are less than 8%, 4% and 4%. "Significantly undercapitalized" institutions have ratios of less than 6%, 3% and 3%. An institution is deemed to be "critically undercapitalized" if it has a ratio of tangible equity to total assets that is 2% or less.
The Sarbanes-Oxley Act of 2002 (the "Sarbanes-Oxley Act") represents a comprehensive revision of laws affecting corporate governance, accounting obligations and corporate reporting. Among other requirements, the Sarbanes-Oxley Act established: (i) requirements for audit committees of public companies, including independence and expertise standards; (ii) additional responsibilities regarding financial statements for the chief executive officers and chief financial officers of reporting companies; (iii) standards for auditors and regulation of audits; (iv) increased disclosure and reporting obligations for reporting companies regarding various matters relating to corporate governance, and (v) new and increased civil and criminal penalties for violation of the securities laws.
The deposits of the Bank are insured to the maximum extent permitted by law by the Deposit Insurance Fund ("DIF") of the FDIC, which was created in 2006 as the result of the merger of the Bank Insurance Fund and the Savings Association Insurance Fund in accordance with the Federal Deposit Insurance Reform Act of 2005 (the "FDI Act"). The FDIC maintains the DIF by assessing depository institutions an insurance premium. Pursuant to the Dodd-Frank Act, the FDIC is required to set a DIF reserve ratio of 1.35% of estimated insured deposits and is required to achieve this ratio by September 30, 2020.
Under the FDIC's risk-based assessment system, insured institutions are required to pay deposit insurance premiums based on the risk that each institution poses to the DIF. An institution's risk to the DIF is measured by its regulatory capital levels, supervisory evaluations, and certain other factors. An institution's assessment rate depends upon the risk category to which it is assigned. As noted above, pursuant to the Dodd-Frank Act, the FDIC will calculate an institution's assessment level based on its total average consolidated assets during the assessment period less average tangible equity (i.e., Tier 1 capital) as opposed to an institution's deposit level which was the previous basis for calculating insurance assessments. Pursuant to the Dodd-Frank Act, institutions will be placed into one of four risk categories for purposes of determining the institution's actual assessment rate. The FDIC will determine the risk category based on the institution's capital position (well capitalized, adequately capitalized, or undercapitalized) and supervisory condition (based on exam reports and related information provided by the institution's primary federal regulator).
The Company is a legal entity separate and distinct from the Bank. There are various legal limitations on the extent to which the Bank can supply funds to the Company. The principal source of the Company's funds consists of dividends from the Bank. State and Federal law restricts the amount of dividends that may be paid by banks. The specific limits depend on a number of factors, including the bank's type of charter, recent earnings, recent dividends, level of capital and regulatory status. The regulators are authorized, and under certain circumstances are required, to determine that the payment of dividends or other distributions by a bank would be an unsafe or unsound practice and to prohibit that payment. For example, the FDI Act generally prohibits a depository institution from making any capital distribution (including payment of a dividend) or paying any management fee to its parent holding company if the depository institution would thereafter be undercapitalized.
The Dodd-Frank Act and its accompanying regulations also limit a depository institution's ability to make capital distributions if it does not hold a 2.5% capital buffer above the required minimum risk-based capital ratios. Regulators also review and limit proposed dividend payments as part of the supervisory process and review of an institution's capital planning. In addition to dividend limitations, the Bank is subject to certain restrictions on extensions of credit to the Company, on investments in the stock or other securities of the Company and in taking such stock or securities as collateral for loans.
The Community Reinvestment Act requires that the federal banking regulators evaluate the records of a financial institution in meeting the credit needs of its local community, including low and moderate income neighborhoods. These factors are also
6
Table of Contents
considered in evaluating mergers, acquisitions, and applications to open a branch or facility. Failure to adequately meet these criteria could result in the imposition of additional requirements and limitations on the Bank.
As discussed above, the Company and the Bank must meet certain minimum capital requirements mandated by each of their state or federal regulators. These regulatory agencies require BHCs and banks to maintain certain minimum ratios of primary capital to total assets and total capital to total assets. The FRB requires BHCs to maintain a minimum Tier 1 leverage ratio of 3% capital to total assets; however, for all but the most highly rated institutions which do not anticipate significant growth, the minimum Tier 1 leverage ratio is 3% plus an additional cushion of 100 to 200 basis points. As of December 31, 2013, the Company's leverage ratio of capital to total assets was 10.1%. The FRB and FDIC each have approved the imposition of "risk-adjusted" capital ratios on BHCs and financial institutions. The Company's Tier 1 Capital to Risk-Weighted Assets Ratio was 15.4% and its Total Capital to Risk-Weighted Assets Ratio was 16.7% at December 31, 2013. The Bank had capital to asset ratios and risk- adjusted capital ratios at December 31, 2013, in excess of the applicable minimum regulatory requirements.
On July 21, 2010, President Obama signed into law the sweeping financial regulatory reform act entitled the "Dodd-Frank Wall Street Reform and Consumer Protection Act" (Dodd-Frank Act). This significant law affects the lending, deposit, investment, trading and operating activities of financial institutions and their holding companies. Various federal agencies are given significant discretion in drafting and implementing a broad range of new rules and regulations, and consequently, while many new rules and regulation have been adopted, many of the details and much of the impact of the Dodd-Frank Act may not be known for many months or years.
Certain provisions of Dodd-Frank are now effective and have been fully implemented, including the revisions in the deposit insurance assessment base for FDIC insurance and the permanent increase in coverage to $250,000; the permissibility of paying interest on business checking accounts; the removal of barriers to interstate branching and required disclosure and shareholder advisory votes on executive compensation. Action in 2013 to implement the final Dodd-Frank provisions included (i) final new capital rules, (ii) a final rule to implement the so called "Volcker rule" restrictions on certain proprietary trading and investment activities and (iii) final rules and increased enforcement action by the Consumer Finance Protection Bureau ("CFPB").
Key provisions of the Dodd-Frank Act are as follows:
- •
- eliminated the federal prohibitions on paying interest on demand deposits, thus allowing businesses to have interest bearing checking accounts.
- •
- broadened the base for Federal Deposit Insurance Corporation insurance assessments.
- •
- required publicly traded companies to give stockholders a nonbinding vote on executive compensation and so-called "golden parachute" payments.
- •
- broadened the scope of derivative instruments, and subjected covered institutions to increased regulation of its derivative business, including margin requirements, record keeping and reporting requirements, and heightened supervision.
- •
- created a new Consumer Financial Protection Bureau with broad powers to supervise and enforce consumer protection laws. Banks and savings institutions with $10 billion or less in assets will continue to be examined for compliance with consumer laws by their primary bank regulators. The CFPB, along with the Department of Justice and bank regulatory authorities also seek to enforce discriminatory lending laws. In such actions, the CFPB and others have used a disparate impact analysis, which measures discriminatory results without regard to intent.
- •
- debit card and interchange fees must be reasonable and proportional to the issuer's cost for processing the transaction. The Federal Reserve Board has approved a debit card interchange regulation which caps an issuer's base fee at $0.21 per transaction plus an additional fee computed at five basis-points of the transaction value. These standards apply to issuers that, together with their affiliates, have assets of $10 billion or more. The Company's assets are under $10 billion and therefore it is not directly impacted by these provisions.
Regulations issued under the Secure and Fair Enforcement for Mortgage Licensing Act of 2008 (the "S.A.F.E. Act") require residential mortgage loan originators who are employees of institutions regulated by the foregoing agencies, including national banks, to meet the registration requirements of the S.A.F.E. Act. The S.A.F.E. Act requires residential mortgage loan originators who are employees of regulated financial institutions to be registered with the Nationwide Mortgage Licensing System and Registry, a database created by the Conference of State Bank Supervisors and the American Association of Residential Mortgage Regulators to
7
Table of Contents
support the licensing of mortgage loan originators by the states. Employees of regulated financial institutions are generally prohibited from originating residential mortgage loans unless they are registered.
In December 2010, the Basel Committee released its final framework for strengthening international capital and liquidity regulation, officially identified by the Basel Committee as "Basel III". The Basel III standards operate in conjunction with portions of standards previously released by the Basel Committee and commonly known as "Basel II" and "Basel 2.5." On June 7, 2012, the Federal Reserve Board, FDIC, and the Office of the Comptroller of the Currency requested comment on these proposed rules that, taken together, would implement the Basel regulatory capital reforms through what are referred to herein as the "Basel III capital framework."
On July 2, 2013, the Federal Reserve adopted a final rule for the Basel III capital framework and, on July 9, 2013, the FDIC adopted the same provisions in the form of an "interim" final rule. The rule will apply to all national and state banks and savings associations and most bank holding companies and savings and loan holding companies, which are collectively referred to herein as "covered" banking organizations. The requirements in the rule begin to phase in on January 1, 2015 for covered banking organizations (including the Company). The requirements in the rule will be fully phased in by January 1, 2019. Although many of the rules contained in these final regulations are applicable only to large, internationally active banks, some of them will apply on a phased in basis to all banking organizations, including the Company and the Bank.
The following are among the new requirements that will be phased in beginning January 1, 2015:
- •
- an increase in the minimum Tier 1 capital ratio from 4.00% to 6.00% of risk-weighted assets.
- •
- a new category and a required 4.50% of risk-weighted assets ratio is established for "common equity Tier 1" as a subset of Tier 1 capital limited to common equity.
- •
- a minimum non-risk-based leverage ratio is set at 4.00% eliminating a 3.00% exception for higher rated banks.
- •
- changes in the permitted composition of Tier 1 capital to exclude trust preferred securities, mortgage servicing rights and certain deferred tax assets and include unrealized gains and losses on available for sale debt and equity securities.
- •
- a new additional capital conservation buffer of 2.5% of risk weighted assets over each of the required capital ratios that will be phased in from 2016 to 2019 must be met to avoid limitations in the ability of the Bank to pay dividends, repurchase shares or pay discretionary bonuses.
- •
- the risk-weights of certain assets for purposes of calculating the risk-based capital ratios are changed for high volatility commercial real estate acquisition, development and construction loans, certain past due non-residential mortgage loans and certain mortgage-backed and other securities exposures.
- •
- an additional "countercyclical capital buffer" is required for larger and more complex institutions.
On December 10, 2013, the Federal Reserve, the Office of the Comptroller of the Currency, the FDIC, the CFTC and the SEC issued final rules to implement the Volcker Rule contained in section 619 of the Dodd-Frank Act, generally to become effective on July 21, 2015. The Volcker Rule prohibits an insured depository institution and its affiliates from: (i) engaging in "proprietary trading" and (ii) investing in or sponsoring certain types of funds ("covered funds") subject to certain limited exceptions. The rule also effectively prohibits short-term trading strategies by any U.S. banking entity if those strategies involve instruments other than those specifically permitted for trading and prohibits the use of some hedging strategies.
Under these rules and subject to certain exceptions, banking entities, including the Company and the Bank, will be restricted from engaging in activities that are considered proprietary trading and from sponsoring or investing in certain entities, including hedge or private equity funds that are considered "covered funds." These rules will become effective on April 1, 2014. Certain collateralized debt obligations ("CDO") securities backed by trust preferred securities were initially defined as covered funds subject to the investment prohibitions of the final rule. Action taken by the Federal Reserve in January 2014 exempted many such securities to address the concern that community banks holding such CDO securities may have been required to recognize losses on those securities.
The United States has imposed economic sanctions that affect transactions with designated foreign countries, nationals and others which are administered by the U.S. Treasury Department Office of Foreign Assets Control. Failure to comply with these sanctions could have serious legal and reputational consequences, including causing applicable bank regulatory authorities not to
8
Table of Contents
approve merger or acquisition transactions when regulatory approval is required or to prohibit such transactions even if approval is not required.
The Dodd-Frank Act requires the federal bank regulatory agencies and the SEC to establish joint regulations or guidelines prohibiting incentive-based payment arrangements at specified regulated entities having at least $1 billion in total assets that encourage inappropriate risks by providing an executive officer, employee, director or principal stockholder with excessive compensation, fees, or benefits that could lead to material financial loss to the entity. In addition, these regulators must establish regulations or guidelines requiring enhanced disclosure of incentive-based compensation arrangements to regulators. The agencies proposed such regulations in April 2011, but these regulations have not yet been finalized.
In June 2010, the FRB and the FDIC issued comprehensive final guidance on incentive compensation policies intended to ensure that the incentive compensation policies of banking organizations do not undermine the safety and soundness of such organizations by encouraging excessive risk-taking. The guidance, which covers all employees that have the ability to materially affect the risk profile of an organization, either individually or as part of a group, is based upon the key principles that a banking organization's incentive compensation arrangements should (i) provide incentives that do not encourage risk-taking beyond the organization's ability to effectively identify and manage risks, (ii) be compatible with effective internal controls and risk management, and (iii) be supported by strong corporate governance, including active and effective oversight by the organization's board of directors. These three principles are incorporated into the proposed joint compensation regulations under The Dodd-Frank Act, discussed above. The FRB will review, as part of its regular, risk-focused examination process, the incentive compensation arrangements of banking organizations, such as the Company, that are not "large, complex banking organizations." These reviews will be tailored to each organization based on the scope and complexity of the organization's activities and the prevalence of incentive compensation arrangements. The findings of the supervisory initiatives will be included in reports of examination. Deficiencies will be incorporated into the organization's supervisory ratings, which can affect the organization's ability to make acquisitions and take other actions. Enforcement actions may be taken against a banking organization if its incentive compensation arrangements, or related risk-management control or governance processes, pose a risk to the organization's safety and soundness and the organization is not taking prompt and effective measures to correct the deficiency.
In addition to the specific legislation described above, various additional legislation is currently being considered by Congress. This legislation may change banking statutes and the Company's operating environment in substantial and unpredictable ways and may increase reporting requirements and governance. If enacted, such legislation could increase or decrease the cost of doing business, limit or expand permissible activities, or affect the competitive balance among banks, savings associations, credit unions, and other financial institutions. The Company cannot predict whether any potential legislation will be enacted and, if enacted, the effect that it, or any implementing regulations, would have on its business, results of operations, or financial condition.
9
Table of Contents
ITEM 1A. RISK FACTORS
In addition to the other information contained in this report, the following risks may affect us. If any of these risks actually occur, our business, financial condition or results of operations may suffer. As a result, the price of our common shares could decline.
Risks Related to Our Business.
Like most banking organizations, a significant portion of our assets consists of loans, which if not repaid could result in losses to the Company.
As a lender, we are exposed to the risk that our customers will be unable to repay their loans according to their terms and that the collateral securing the payment of their loans (if any) may not be sufficient to assure repayment. Credit losses could have a material adverse effect on our operating results.
As of December 31, 2013, our total loan portfolio was approximately $1,672 million or 58% of our total assets. Three major components of the loan portfolio are loans principally secured by real estate, approximately $1,415 million or 85% of total loans; other commercial loans, approximately $211 million or 12% of total loans; and consumer loans, approximately $46 million or 3% of total loans. Our credit risk with respect to our consumer installment loan portfolio and commercial loan portfolio relates principally to the general creditworthiness of individuals and businesses within our local market area. Our credit risk with respect to our residential and commercial real estate mortgage and construction loan portfolio relates principally to the general creditworthiness of individuals and businesses and the value of real estate serving as security for the repayment of the loans. A related risk in connection with loans secured by commercial real estate is the effect of unknown or unexpected environmental contamination, which could make the real estate effectively unmarketable or otherwise significantly reduce its value as security. Continued or worsening declines in the economy could cause additional credit issues, particularly within our residential and commercial real estate mortgage and construction loan portfolio.
Our allowance for loan losses may not be sufficient to cover actual loan losses, which could adversely affect our earnings.
We maintain an allowance for loan losses at a level estimated by management to be sufficient to cover probable incurred loan losses in our loan portfolio. Loan losses will likely occur in the future and may occur at a rate greater than we have experienced to date. In determining the size of the allowance, our management makes various assumptions and judgments about the collectability of our loan portfolio, including the diversification by industry of our commercial loan portfolio, the effect of changes in the local real estate markets on collateral values, the results of recent regulatory examinations, the effects on the loan portfolio of current economic indicators and their probable impact on borrowers, the amount of charge-offs for the period, the amount of nonperforming loans and related collateral security, and the evaluation of our loan portfolio by an external loan review. If our assumptions and judgments prove to be incorrect, our current allowance may not be sufficient and adjustments may be necessary to allow for different economic conditions or adverse developments in our loan portfolio. Additionally, continuing deterioration in economic conditions affecting borrowers, new information regarding existing loans, identification of additional problem loans and other factors, both within and outside the Company's control, may require an increase in the allowance for loan losses. Federal and state regulators also periodically review our allowance for loan losses and may require us to increase our provision for loan losses or recognize further loan charge-offs, based on judgments different than those of our management. Any increase in our allowance for loan losses or loan charge-offs could have an adverse effect on our operating results and financial condition. There can be no assurance that our monitoring procedures and policies will reduce certain lending risks or that our allowance for loan losses will be adequate to cover actual losses.
If we foreclose on collateral property, we may be subject to the increased costs associated with ownership of real property, resulting in reduced revenues and earnings.
We may have to foreclose on collateral property to protect our investment and may thereafter own and operate such property, in which case we will be exposed to the risks inherent in the ownership of real estate. The amount that we, as a mortgagee, may realize after a default is dependent upon factors outside of our control, including, but not limited to: (i) general or local economic conditions; (ii) neighborhood values; (iii) interest rates; (iv) real estate tax rates; (v) operating expenses of the mortgaged properties; (vi) environmental remediation liabilities; (vii) ability to obtain and maintain adequate occupancy of the properties; (viii) zoning laws; (ix) governmental rules, regulations and fiscal policies; and (x) acts of God. Certain expenditures associated with the ownership of real estate, principally real estate taxes, insurance, and maintenance costs, may adversely affect the income from the real estate. Therefore, the cost of operating real property may exceed the income earned from such property, and we may have to advance funds in order to protect our investment, or we may be required to dispose of the real property at a loss. The foregoing expenditures and costs could adversely affect our ability to generate revenues, resulting in reduced levels of profitability.
10
Table of Contents
Significant interest rate volatility could reduce our profitability.
The interest rate risk inherent in our lending, investing, and deposit taking activities is a significant market risk to us and our business. We derive our income mainly from the difference or "spread" between the interest earned on loans, securities and other interest earning assets, and interest paid on deposits, borrowings and other interest bearing liabilities. In general, the wider the spread, the more net interest income we earn. When market rates of interest change, the interest we receive on our assets and the interest we pay on our liabilities will fluctuate. This can cause decreases in our spread and can greatly affect our income. In addition, interest rate fluctuations can affect how much money we may be able to lend. Changes in interest rates may also affect the level of voluntary prepayments on our loans and the level of financing or refinancing by customers. There can be no assurance that we will be successful in minimizing the adverse effects of changes in interest rates.
New mortgage regulations may adversely impact our business.
Revisions made pursuant to Dodd-Frank to Regulation Z, which implements the Truth in Lending Act (TILA), effective in January 2014, apply to all consumer mortgages (except home equity lines of credit, timeshare plans, reverse mortgages, or temporary loans), and mandate specific underwriting criteria and "ability to repay" requirements for home loans. This may impact our offering and underwriting of single family residential loans in our residential mortgage lending operation and could have a resulting unknown effect on potential delinquencies. In addition, the relatively uniform requirements may make it difficult for regional and community banks to compete against the larger national banks for single family residential loan originations.
We may be required to pay significantly higher Federal Deposit Insurance Corporation (FDIC) premiums in the future.
Insured institution failures during the past several years have significantly increased FDIC loss provisions, resulting in a decline in the designated reserve ratio to historical lows. In addition the Dodd-Frank Act permanently implemented FDIC insurance coverage for all deposit accounts up to $250,000 and revised the insurance premium assessment base from all domestic deposits to the average of total assets less tangible equity. The minimum reserve ratio of the deposit insurance fund has been increased from 1.15% to 1.35%, with the increase to be covered by assessments on insured institutions with assets over $10 billion until the new reserve ratio is reached.
We are generally unable to control the amount of premiums that we are required to pay for FDIC insurance. If there are additional bank or financial institution failures, we may be required to pay even higher FDIC premiums than the recently increased levels. Additionally, the FDIC may make material changes to the calculation of the prepaid assessment from the current proposal. Any future changes in the calculation or assessment of FDIC insurance premiums may have a material adverse effect on our results of operations, financial condition and our ability to continue to pay dividends on our common shares at the current rate or at all.
Future growth or operating results may require the Company to raise additional capital but that capital may not be available or it may be dilutive.
We are required by federal and state regulatory authorities to maintain adequate levels of capital to support our operations. To the extent our future operating results erode capital or we elect to expand through loan growth or acquisition we may be required to raise capital. Our ability to raise capital will depend on conditions in the capital markets, which are outside of our control, and on our financial performance. Accordingly, we cannot be assured of our ability to raise capital if needed or on favorable terms. If we cannot raise additional capital when needed, we will be subject to increased regulatory supervision and the imposition of restrictions on our growth and business. These could negatively impact our ability to operate or further expand our operations through acquisitions or the establishment of additional branches and may result in increases in operating expenses and reductions in revenues that could have a material adverse effect on our financial condition and results of operations.
We rely heavily on our management and other key personnel, and the loss of any of them may adversely affect our operations.
We are and will continue to be dependent upon the services of our management team. The loss of any of our senior managers could have an adverse effect on our growth and performance because of their skills, knowledge of the markets in which we operate and years of industry experience and the difficulty of promptly finding qualified replacement personnel. The loss of key personnel in a particular market could have an adverse effect on our performance in that market because it may be difficult to find qualified replacement personnel who are already located in or would be willing to relocate to a non-metropolitan market. Additionally, recent regulations issued by banking regulators regarding executive compensation may impact our ability to compensate executives and, as a result, to attract and retain qualified personnel.
The geographic concentration of our markets makes our business highly susceptible to local economic conditions.
Unlike larger banking organizations that are more geographically diversified, our operations are currently concentrated in 30 counties in Indiana, three counties in Illinois, two counties in Ohio, and three counties in Kentucky. As a result of this geographic
11
Table of Contents
concentration in four fairly contiguous markets, our financial results depend largely upon economic conditions in these market areas. A deterioration in economic conditions in one or all of these markets could result in one or more of the following:
- •
- an increase in loan delinquencies;
- •
- an increase in problem assets and foreclosures;
- •
- a decrease in the demand for our products and services; or
- •
- a decrease in the value of collateral for loans, especially real estate, in turn reducing customers' borrowing power, the value of assets associated with problem loans and collateral coverage.
If we do not adjust to rapid changes in the financial services industry, our financial performance may suffer.
We face substantial competition for deposit, credit and trust relationships, as well as other sources of funding in the communities we serve. Competing providers include other banks, thrifts and trust companies, insurance companies, mortgage banking operations, credit unions, finance companies, money market funds and other financial and nonfinancial companies which may offer products functionally equivalent to those offered by the Bank. Competing providers may have greater financial resources than we do and offer services within and outside the market areas we serve. In addition to this challenge of attracting and retaining customers for traditional banking services, our competitors now include securities dealers, brokers, mortgage bankers, investment advisors and finance and insurance companies who seek to offer one-stop financial services to their customers that may include services that banks have not been able or allowed to offer to their customers in the past. The increasingly competitive environment is primarily a result of changes in regulation, changes in technology and product delivery systems and the accelerating pace of consolidation among financial service providers. If we are unable to adjust both to increased competition for traditional banking services and changing customer needs and preferences, it could adversely affect our financial performance and your investment in our common stock.
Acquisitions entail risks which could negatively affect our operations.
Acquisitions involve numerous risks, including:
- •
- exposure to asset quality problems of the acquired institution;
- •
- maintaining adequate regulatory capital;
- •
- diversion of management's attention from other business concerns;
- •
- risks and expenses of entering new geographic markets;
- •
- potential significant loss of depositors or loan customers from the acquired institution; or
- •
- exposure to undisclosed or unknown liabilities of an acquired institution.
Any of these acquisition risks could result in unexpected losses or expenses and thereby reduce the expected benefits of the acquisition.
Unanticipated costs related to our acquisitions could reduce our future earnings per share.
We believe we have reasonably estimated the likely costs of integrating the operations of the banks we acquire into the Company and the incremental costs of operating such banks as a part of the MainSource family. However, it is possible that unexpected transaction costs such as taxes, fees or professional expenses or unexpected future operating expenses, such as increased personnel costs or increased taxes, as well as other types of unanticipated adverse developments, could have a material adverse effect on the results of operations and financial condition of MainSource. If unexpected costs are incurred, acquisitions could have a dilutive effect on our earnings per share. Current accounting guidance requires expensing of acquisition costs. In prior years, these costs could be capitalized. In other words, if we incur such unexpected costs and expenses as a result of our acquisitions, we believe that the earnings per share of our common stock could be less than they would have been if those acquisitions had not been completed.
We may be unable to successfully integrate the operations of the banks we have acquired and may acquire in the future and retain employees of such banks.
Our acquisition strategy involves the integration of the banks we have acquired and may acquire in the future as MainSource subsidiary banks. The difficulties of integrating the operations of such banks with MainSource and its other subsidiary banks include:
- •
- coordinating geographically separated organizations;
12
Table of Contents
- •
- integrating personnel with diverse business backgrounds;
- •
- combining different corporate cultures; or
- •
- retaining key employees.
The process of integrating operations could cause an interruption of, or loss of momentum in, the activities of one or more of the Company, our subsidiary banks and the banks we have acquired and may acquire in the future and the loss of key personnel. The integration of such banks as MainSource subsidiary banks requires the experience and expertise of certain key employees of such banks who we expect to retain. We cannot be sure, however, that we will be successful in retaining these employees for the time period necessary to successfully integrate such banks' operations as subsidiary banks of MainSource. The diversion of management's attention and any delays or difficulties encountered in connection with the mergers, along with the integration of the banks as MainSource subsidiary banks, could have an adverse effect on our business and results of operation.
Risks Relating to the Banking Industry
Changes in governmental regulation and legislation could limit our future performance and growth.
We are subject to extensive state and federal regulation, supervision and legislation that governs almost all aspects of our operations, as well as any acquisitions we may propose to make. Any change in applicable federal or state laws or regulations could have a substantial impact on us, our subsidiary banks and our operations. While we cannot predict what effect any presently contemplated or future changes in the laws or regulations or their interpretations would have on us, these changes could reduce the value of your investment.
The implementation of final rules under the many provisions of Dodd-Frank Act could adversely affect us.
Regulation of the financial services industry is undergoing major changes from the enactment and ongoing implementation of Dodd-Frank. Certain provisions of Dodd-Frank are effective and have been fully implemented, including the revisions in the deposit insurance assessment base for FDIC insurance and the permanent increase in FDIC coverage to $250,000; the permissibility of paying interest on business checking accounts; the removal of remaining barriers to interstate branching and required disclosure and shareholder advisory votes on executive compensation. Other recent actions to implement the final Dodd-Frank provisions include (i) final new capital rules, (ii) a final rule to implement the "Volcker Rule" restrictions on certain proprietary trading and investment activities and (iii) the promulgation of final rules and increased enforcement action by the CFPB. The full implementation of certain final rules is delayed or phased in over several years; therefore, as yet we cannot definitively assess what may be the short or longer term specific or aggregate effect of the full implementation of Dodd-Frank on us.
Changes in regulation or oversight may have a material adverse impact on our operations.
We are subject to extensive regulation, supervision and examination by the Indiana Department of Financial Institutions, the Federal Deposit Insurance Corporation, the Board of Governors of the Federal Reserve System, the Securities and Exchange Commission and other regulatory bodies. Such regulation and supervision governs the activities in which we may engage. Regulatory authorities have extensive discretion in their supervisory and enforcement activities, including the imposition of restrictions on our operations, investigations and limitations related to our securities, the classification of our assets and determination of the level of our allowance for loan losses. In light of the current conditions in the U.S. financial markets and economy, Congress and regulators have increased their focus on the regulation of the financial services industry. Any change in such regulation and oversight, whether in the form of regulatory policy, regulations, legislation or supervisory action, may have a material adverse impact on our business, financial condition or results of operations.
Difficult conditions in the capital markets and the economy generally have affected and may continue to materially adversely affect our business and results of operations.
From 2007 through 2009, the U.S. economy was in recession. Business activity across a wide range of industries and regions in the U.S. was greatly reduced. Although economic conditions have begun to improve, certain sectors, such as real estate, remain weak and unemployment remains high. Local governments and many businesses are still in serious difficulty due to lower consumer spending and the lack of liquidity in the credit markets. The Company's financial performance generally, and in particular the ability of borrowers to pay interest on and repay principal of outstanding loans and the value of collateral securing those loans, as well as demand for loans and other products and services that the Company offers, is highly dependent upon the business environment in the markets where the Company operates and in the United States as a whole. A favorable business environment is generally characterized by, among other factors, economic growth, efficient capital markets, low inflation, low unemployment, high business and investor confidence, and strong business earnings. Unfavorable or uncertain economic and market conditions can be caused by declines in economic growth, business activity or investor or business confidence; limitations on the availability or increases in the
13
Table of Contents
cost of credit and capital; increases in inflation or interest rates; high unemployment, natural disasters, or a combination of these or other factors.
During 2012 and 2013, the business environment continued to be adverse for many households and businesses in the United States and worldwide. While economic conditions in the United States and worldwide have begun to improve, there can be no assurance that this improvement will continue. Such conditions have affected, and could continue to adversely affect, the credit quality of the Company's loans, results of operations and financial condition.
Changes in consumer use of banks and changes in consumer spending and savings habits could adversely affect our financial results.
Technology and other changes now allow many customers to complete financial transactions without using banks. For example, consumers can pay bills and transfer funds directly without going through a bank. This process of eliminating banks as intermediaries could result in the loss of fee income, as well as the loss of customer deposits and income generated from those deposits. In addition, changes in consumer spending and savings habits could adversely affect our operations, and we may be unable to timely develop competitive new products and services in response to these changes that are accepted by new and existing customers.
Our earnings could be adversely impacted by incidences of fraud and compliance failure.
Financial institutions are inherently exposed to fraud risk. A fraud can be perpetrated by a customer of MainSource, an employee, a vendor, or members of the general public. We are most subject to fraud and compliance risk in connection with the origination of loans, ACH transactions, ATM transactions and checking transactions. Our largest fraud risk, associated with the origination of loans, includes the intentional misstatement of information in property appraisals or other underwriting documentation provided to us by third parties. Compliance risk is the risk that loans are not originated in compliance with applicable laws and regulations and our standards. There can be no assurance that we can prevent or detect acts of fraud or violation of law or our compliance standards by the third parties that we deal with. Repeated incidences of fraud or compliance failures would adversely impact the performance of our loan portfolio.
Risks Related to the Company's Stock
We may not be able to pay dividends in the future in accordance with past practice.
The Company has traditionally paid a quarterly dividend to common stockholders. The Company is a separate legal entity from the Bank and receives substantially all of its revenue and cash flow from dividends paid by the Bank to the Company. Indiana state law and agreements between the Bank and its federal and state regulators may limit the amount of dividends that the Bank may pay to the Company. In the event that the Bank is unable to pay dividends to the Company for an extended period of time, the Company may not be able to service its debt obligations or pay dividends on its common stock. Additionally, any payment of dividends in the future will depend, in large part, on the Bank's earnings, capital requirements, financial condition and other factors considered relevant by the Company's Board of Directors. Starting in the second quarter of 2009 and continuing to the second quarter of 2012, the Company reduced the amount of cash dividends paid. This reduction was made to preserve capital levels at the Company. Beginning in the third quarter of 2012, the Company raised the dividend to $.03/share, and in the first quarter of 2013 it raised the dividend to $.06/share. In the third quarter of 2013, the Company raised the dividend to $.08/share.
The price of the Company's common stock may be volatile, which may result in losses for investors.
General market price declines or market volatility in the future could adversely affect the price of the Company's common stock. In addition, the following factors may cause the market price for shares of the Company's common stock to fluctuate:
- •
- announcements of developments related to the Company's business;
- •
- fluctuations in the Company's results of operations;
- •
- sales or purchases of substantial amounts of the Company's securities in the marketplace;
- •
- general conditions in the Company's banking niche or the worldwide economy;
- •
- a shortfall or excess in revenues or earnings compared to securities analysts' expectations;
- •
- changes in analysts' recommendations or projections; and
- •
- the Company's announcement of new acquisitions or other projects.
14
Table of Contents
The Company's charter documents and federal regulations may inhibit a takeover, prevent a transaction that may favor or otherwise limit the Company's growth opportunities, which could cause the market price of the Company's common stock to decline.
Certain provisions of the Company's charter documents and federal regulations could have the effect of making it more difficult for a third party to acquire, or of discouraging a third party from attempting to acquire, control of the Company. In addition, the Company must obtain approval from regulatory authorities before acquiring control of any other company.
ITEM 1B. UNRESOLVED STAFF COMMENTS.
None.
ITEM 2. PROPERTIES
As of December 31, 2013, the Company leased an office building located in Greensburg, Indiana, from one of its subsidiaries for use as its corporate headquarters. The Company's subsidiaries own, or lease, all of the facilities from which they conduct business. All leases are comparable to other leases in the respective market areas and do not contain provisions materially detrimental to the Company or its subsidiaries. As of December 31, 2013 the Company had 74 banking locations. At December 31, 2013, the Company had approximately $55,957 invested in premises and equipment.
ITEM 3. LEGAL PROCEEDINGS
The Company and its subsidiaries may be parties (both plaintiff and defendant) to ordinary litigation incidental to the conduct of business. Management is presently not aware of any material pending or contemplated legal proceedings.
ITEM 4. MINE SAFETY DISCLOSURES
Not applicable.
15
Table of Contents
PART II
ITEM 5. MARKET FOR THE REGISTRANT'S COMMON EQUITY, RELATED STOCKHOLDER MATTERS AND ISSUER'S PURCHASES OF EQUITY SECURITIES
Market Information
The Company's Common Stock is traded on the NASDAQ Stock Market under the symbol MSFG. The Common Stock was held by approximately 5,000 shareholders at March 14, 2014. The quarterly high and low closing prices for the Company's common stock as reported by NASDAQ and quarterly cash dividends declared and paid are set forth in the tables below. All per share data is retroactively restated for all stock dividends and splits.
The range of known per share prices by calendar quarter, based on actual transactions, excluding commissions, is shown below.
| | | | | | | | | | | | | |
| | Market Prices | |
|---|
2013
| | Q1
| | Q2
| | Q3
| | Q4
| |
|---|
| | |
High | | $ | 15.10 | | $ | 14.12 | | $ | 15.53 | | $ | 18.05 | |
Low | | $ | 12.65 | | $ | 12.02 | | $ | 13.81 | | $ | 14.05 | |
2012
|
|
Q1
|
|
Q2
|
|
Q3
|
|
Q4
|
|
|---|
| | |
High | | $ | 12.12 | | $ | 12.05 | | $ | 13.00 | | $ | 12.97 | |
Low | | $ | 8.84 | | $ | 10.80 | | $ | 11.27 | | $ | 11.50 | |
| |
Cash Dividends | |
|---|
2013
| | Q1
| | Q2
| | Q3
| | Q4
| |
|---|
| | |
| | $ | 0.06 | | $ | 0.06 | | $ | 0.08 | | $ | 0.08 | |
2012
|
|
Q1
|
|
Q2
|
|
Q3
|
|
Q4
|
|
|---|
| | |
| | $ | 0.01 | | $ | 0.01 | | $ | 0.03 | | $ | 0.03 | |
It is expected that the Company will continue to consider the Company's results of operations, capital levels and other external factors beyond management's control in making the decision to maintain or further raise the dividend.
Issuer Purchases of Equity Securities
The Company purchased the following equity securities of the Company during the quarter ended December 31, 2013:
| | | | | | | | | | | | | |
Period
| | Total Number
of Shares (or
Units) Purchased
(1)
| | Average Price Paid Per
Share (or Unit) (1)
| | Total Number of Shares
(or Units) Purchased as
Part of Publicly
Announced Plans or
Programs
| | Maximum Number (or
Approximate Dollar Value)
of Shares (or Units) That
May Yet Be Purchased
Under the Plans or Programs
| |
|---|
| | |
October 1-31, 2013 | | | — | | | — | | | — | | | 0 | |
November 1-30, 2013 | | | — | | | — | | | — | | | 0 | |
December 1-31, 2013 | | | — | | | — | | | — | | | 0 | |
| | | | |
| | | | | | | | | | | | | | |
Total: | | | — | | | — | | | — | | | 0 | |
16
Table of Contents
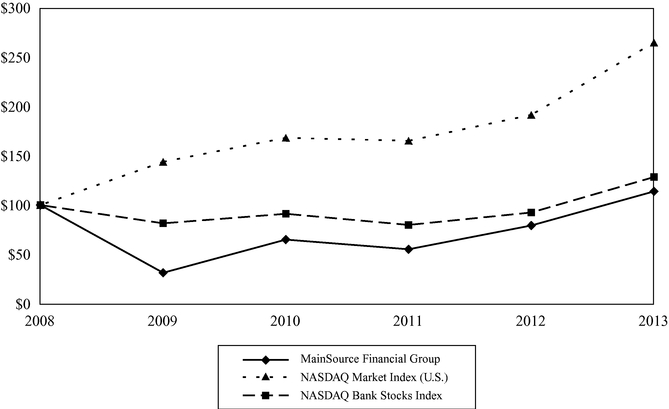
Stock Performance Graph
The following performance graph compares the performance of our common shares to the performance of the NASDAQ Market Index (U.S.) and the NASDAQ Bank Stocks Index for the 60 months ended December 31, 2013. The graph assumes an investment of $100 in each of the Company's common shares, the NASDAQ Market Index (U.S.) and the NASDAQ Bank Stocks Index on December 31, 2008.
| | | | | | | | | | | | | | | | | | | |
| | 12/31/08
| | 12/31/09
| | 12/31/10
| | 12/31/11
| | 12/31/12
| | 12/31/13
| |
|---|
| | |
MainSource Financial Group | | | 100.00 | | | 31.34 | | | 64.99 | | | 55.16 | | | 79.29 | | | 113.87 | |
NASDAQ MARKET INDEX (U.S.) | | | 100.00 | | | 143.88 | | | 168.23 | | | 165.19 | | | 191.47 | | | 264.81 | |
NASDAQ Bank Stocks Index | | | 100.00 | | | 81.49 | | | 91.16 | | | 79.86 | | | 92.46 | | | 128.43 | |
17
Table of Contents
ITEM 6. SELECTED FINANCIAL DATA
Selected Financial Data
(Dollar amounts in thousands except per share data)
| | | | | | | | | | | | | | | | |
| | 2013
| | 2012
| | 2011
| | 2010
| | 2009
| |
|---|
| | |
Results of Operations | | | | | | | | | | | | | | | | |
Net interest income | | $ | 91,300 | | $ | 94,082 | | $ | 99,848 | | $ | 101,252 | | $ | 98,008 | |
Provision for loan losses | | | 4,534 | | | 9,850 | | | 17,800 | | | 35,250 | | | 46,310 | |
Noninterest income | | | 43,129 | | | 43,891 | | | 45,308 | | | 41,291 | | | 40,050 | |
Noninterest expense, excluding goodwill impairment | | | 98,231 | | | 94,838 | | | 99,805 | | | 92,252 | | | 87,222 | |
Goodwill impairment | | | — | | | — | | | — | | | — | | | 80,310 | |
Income (loss) before income tax | | | 31,664 | | | 33,285 | | | 27,551 | | | 15,041 | | | (75,784 | ) |
Income tax (benefit) | | | 5,319 | | | 6,027 | | | 3,738 | | | 239 | | | (11,645 | ) |
Net income (loss) | | | 26,345 | | | 27,258 | | | 23,813 | | | 14,802 | | | (64,139 | ) |
Preferred dividends and accretion | | | 504 | | | 2,110 | | | 3,054 | | | 3,054 | | | 2,919 | |
Net income (loss) available to common shareholders | | | 25,693 | | | 26,505 | | | 20,759 | | | 11,748 | | | (67,058 | ) |
Dividends paid on common stock | | | 5,709 | | | 1,623 | | | 807 | | | 805 | | | 5,135 | |
Per Common Share* | | |
| | |
| | |
| | |
| | |
| |
Earnings (loss) per share (basic) | | $ | 1.26 | | $ | 1.31 | | $ | 1.03 | | $ | 0.58 | | $ | (3.33 | ) |
Earnings (loss) per share (diluted) | | | 1.26 | | | 1.30 | | | 1.03 | | | 0.58 | | | (3.33 | ) |
Dividends paid | | | 0.28 | | | 0.08 | | | 0.04 | | | 0.04 | | | 0.26 | |
Book value — end of period | | | 14.96 | | | 15.21 | | | 13.87 | | | 12.24 | | | 11.84 | |
Tangible book value — end of period | | | 11.53 | | | 11.72 | | | 10.45 | | | 8.71 | | | 8.16 | |
Market price — end of period | | | 18.03 | | | 12.67 | | | 8.83 | | | 10.41 | | | 4.78 | |
At Year End | | |
| | |
| | |
| | |
| | |
| |
Total assets | | $ | 2,859,864 | | $ | 2,769,288 | | $ | 2,754,180 | | $ | 2,769,312 | | $ | 2,906,530 | |
Securities | | | 891,106 | | | 902,341 | | | 876,090 | | | 806,071 | | | 714,607 | |
Loans, excluding held for sale | | | 1,671,926 | | | 1,553,383 | | | 1,534,379 | | | 1,680,971 | | | 1,885,447 | |
Allowance for loan losses | | | 27,609 | | | 32,227 | | | 39,889 | | | 42,605 | | | 46,648 | |
Total deposits | | | 2,200,628 | | | 2,185,054 | | | 2,159,900 | | | 2,211,564 | | | 2,270,650 | |
Federal Home Loan Bank advances | | | 247,858 | | | 141,052 | | | 151,427 | | | 152,065 | | | 222,265 | |
Subordinated debentures | | | 46,394 | | | 50,418 | | | 50,267 | | | 50,117 | | | 49,966 | |
Shareholders' equity | | | 305,526 | | | 323,751 | | | 336,553 | | | 302,570 | | | 294,462 | |
Financial Ratios | | |
| | |
| | |
| | |
| | |
| |
Return on average assets | | | 0.95 | % | | 0.99 | % | | 0.85 | % | | 0.51 | % | | (2.19 | )% |
Return on average common shareholders' equity | | | 8.35 | | | 8.15 | | | 7.44 | | | 4.86 | | | (22.61 | ) |
Allowance for loan losses to total loans (year end, excluding held for sale) | | | 1.65 | | | 2.07 | | | 2.60 | | | 2.53 | | | 2.47 | |
Allowance for loan losses to total non-performing loans (year end) | | | 104.02 | | | 63.04 | | | 61.18 | | | 46.55 | | | 50.60 | |
Shareholders' equity to total assets (year end) | | | 10.68 | | | 11.69 | | | 12.22 | | | 10.93 | | | 10.13 | |
Average equity to average total assets | | | 11.32 | | | 12.12 | | | 11.46 | | | 10.59 | | | 11.59 | |
Dividend payout ratio | | | 22.22 | | | 6.12 | | | 3.89 | | | 6.85 | | | NM | |
- *
- Adjusted for stock split and dividends
- NM
- Not meaningful
18
Table of Contents
ITEM 7. MANAGEMENT'S DISCUSSION AND ANALYSIS OF FINANCIAL CONDITION AND RESULTS OF OPERATIONS
Management's Discussion and Analysis
(Dollar amounts in thousands except per share data)
Forward-Looking Statements
Except for historical information contained herein, the discussion in this Annual Report includes certain forward-looking statements based upon management expectations. Actual results and experience could differ materially from the anticipated results or other expectations expressed in the Company's forward-looking statements. The Company disclaims any intent or obligation to update such forward looking statements. Factors which could cause future results to differ from these expectations include the following: general economic conditions; legislative and regulatory initiatives; monetary and fiscal policies of the federal government; deposit flows; the cost of funds; general market rates of interest; interest rates on competing investments; demand for loan products; demand for financial services; changes in accounting policies or guidelines; changes in the quality or composition of the Company's loan and investment portfolios; the Company's ability to integrate acquisitions, and other factors, including the risk factors set forth in Item 1A of this Annual Report on Form 10-K and in other reports we file from time to time with the Securities and Exchange Commission. The Company intends the forward looking statements set forth herein to be covered by the safe harbor provisions for forward looking statements contained in the Private Securities Litigation Reform Act of 1995.
Overview
MainSource Financial Group, Inc. ("MainSource" or the "Company") is a financial holding company whose principal activity is the ownership and management of its wholly owned subsidiary bank: MainSource Bank headquartered in Greensburg, Indiana (the "Bank"). The Bank operates under an Indiana state charter and is subject to regulation by the Indiana Department of Financial Institutions and the Federal Deposit Insurance Corporation. Non-banking subsidiaries include MainSource Insurance, LLC, Insurance Services Marketing, LLC, MainSource Title, LLC, and MainSource Risk Management, Inc. The first three subsidiaries are subject to regulation by the Indiana Department of Insurance.
Business Strategy
The Company operates under the broad tenets of a long-term strategic plan ("Plan") designed to improve the Company's financial performance, expand its competitive position and enhance long-term shareholder value. The Plan is premised on the belief of the Company's Board of Directors that it can best promote long-term shareholder interests by pursuing strategies which will continue to preserve its community-focused philosophy. The dynamics of the Plan assure continually evolving goals, with the enhancement of shareholder value being the constant, overriding objective. The extent of the Company's success will depend upon how well it anticipates and responds to competitive changes within its markets, the interest rate environment and other external forces.
Results of Operations
Net income attributable to common shareholders was $25,693 in 2013, $26,505 in 2012, and $20,759 in 2011. Earnings per common share on a fully diluted basis were $1.26 in 2013, $1.30 in 2012, and $1.03 in 2011. The primary drivers that led to the small decrease in net income in 2013 vs 2012 were decreases in mortgage banking income of $3,128, a decrease in net interest income of $2,782, decreases in securities gains of $1,032, increases in salary and employee benefits of $3,175, an increase in equipment costs of $1,367, and an increase in a prepayment penalty of $926 on an FHLB advance. An increase in rates led to a decrease in mortgage refinancing activity. The reduction in the Company's yield on earnings assets was not completely offset by the reduction in the Company's cost of funds. As a result of favorable pricing in 2012 vs 2013, the Company had fewer securities gains taken in 2013. The increase in employee and benefit costs was a result of the new markets the Company entered in the second half of 2012 and 2013. The increase in equipment costs is a result of several technology initiatives which enhance the customer experience with the Company. Finally, the Company paid off a FHLB advance early and incurred a prepayment penalty which was slightly higher than the penalty incurred in 2012. Offsetting these decreases were lower loan loss provision expense of $5,316, higher trust and investment product fees of $1,106, a reduction of OREO losses of $820, a reduction in FDIC assessment of $784, and a reduction in marketing expenses of $737. Credit losses continued to decline and new impaired loans decreased in 2013. An increase in financial advisors as a result of 2012 acquisitions resulted in higher trust and investment product fees. OREO losses continued to decline as a result of a reduced amount of OREO property. FDIC premiums lowered as a result of a lower rate for the Company's premiums. Finally, a reduction in marketing expenses was a result of fewer branches in new markets in 2013 versus 2012 which required additional marketing dollars.
The primary drivers that led to the increase in net income in 2012 vs 2011were lower loan loss provision expense of $7,950, reduced consultant expenses of $5,397, higher mortgage banking income of $4,376, an increase in service charge income of $1,668,
19
Table of Contents
a reduction in FDIC premiums of $1,479, and smaller losses on OREO property of $1,385. Credit losses continued to decline and new impaired loans decreased in 2012. The third party consulting fees paid in 2011 were an increase in consultant expenses. A reduction in interest rates in 2012 led to increased mortgage refinancing activity. Continued emphasis on new account growth generated additional service charge income. FDIC premiums lowered as a result of a lower rate for the Company's premiums. Finally, OREO losses declined as a result of a reduced amount of OREO property. Offsetting these items was a reduction in securities gains of $9,990, lower net interest income of $5,766, and a prepayment penalty of $1,313 on a FHLB advance. As a result of favorable pricing, the Company recorded gains during 2011 on the sale of securities at a higher level than 2012. The reduction in the Company's yield on earnings assets was not completely offset by the reduction in the Company's cost of funds. The Company paid off a FHLB advance early and incurred a prepayment penalty.
Net Interest Income
Net interest income and net interest margin are influenced by the volume and yield or cost of earning assets and interest-bearing liabilities. Tax equivalent net interest income of $98,310 in 2013 decreased from $101,054 in 2012. Net interest margin, on a fully-taxable equivalent basis, was 3.91% for 2013 compared to 4.07% for the same period a year ago. The Company was unable to match reductions in its yield on earning assets with a corresponding reduction in its cost of funds, as the cost of funds has floored. The Company experienced loan growth in 2013 which somewhat mitigated the reduction in its yield. The Company was also able to continue to lower the interest paid on deposit accounts. The Federal Reserve Bank continues to target the fed funds rate at 0%-.25%.
20
Table of Contents
The following table summarizes net interest income (on a tax-equivalent basis) for each of the past three years.
Average Balance Sheet and Net Interest Analysis (Taxable Equivalent Basis)*
| | | | | | | | | | | | | | | | | | | | | | | | | | | | |
| | 2013
| | 2012
| | 2011
| |
|---|
| | | |
|---|
Assets
| | Average
Balance
| | Interest
| | Average
Rate
| | Average
Balance
| | Interest
| | Average
Rate
| | Average
Balance
| | Interest
| | Average
Rate
| |
|---|
| | | |
|---|
Short-term investments | | $ | 12,413 | | | 35 | | | 0.28 | % | $ | 48,712 | | | 134 | | | 0.28 | % | $ | 69,960 | | | 167 | | | 0.24 | % |
Federal funds sold and money market accounts | | | 11,298 | | | 29 | | | 0.26 | | | 10,811 | | | 30 | | | 0.28 | | | 16,644 | | | 48 | | | 0.29 | |
Securities | | | | | | | | | | | | | | | | | | | | | | | | | | | | |
Taxable | | | 576,959 | | | 11,873 | | | 2.06 | | | 567,437 | | | 12,510 | | | 2.20 | | | 523,760 | | | 16,040 | | | 3.06 | |
Non-taxable* | | | 314,120 | | | 18,841 | | | 6.00 | | | 302,040 | | | 18,707 | | | 6.19 | | | 304,366 | | | 19,100 | | | 6.28 | |
| | | | |
| | | | | | | | | | | | | | | | | | | | | | | | | | | | | |
Total securities | | | 891,079 | | | 30,714 | | | 3.45 | | | 869,477 | | | 31,217 | | | 3.59 | | | 828,126 | | | 35,140 | | | 4.24 | |
Loans** | | | | | | | | | | | | | | | | | | | | | | | | | | | | |
Commercial* | | | 909,099 | | | 46,242 | | | 5.09 | | | 889,313 | | | 50,523 | | | 5.68 | | | 959,550 | | | 55,905 | | | 5.83 | |
Residential real estate | | | 411,054 | | | 18,188 | | | 4.42 | | | 393,844 | | | 19,969 | | | 5.07 | | | 380,255 | | | 21,970 | | | 5.78 | |
Consumer | | | 277,544 | | | 13,081 | | | 4.71 | | | 270,459 | | | 13,867 | | | 5.13 | | | 276,660 | | | 15,566 | | | 5.63 | |
| | | | |
| | | | | | | | | | | | | | | | | | | | | | | | | | | | | |
Total loans | | | 1,597,697 | | | 77,511 | | | 4.85 | | | 1,553,616 | | | 84,359 | | | 5.43 | | | 1,616,465 | | | 93,441 | | | 5.78 | |
| | | | |
| | | | | | | | | | | | | | | | | | | | | | | | | | | | | |
Total earning assets | | | 2,512,487 | | | 108,289 | | | 4.31 | | | 2,482,616 | | | 115,740 | | | 4.66 | | | 2,531,195 | | | 128,796 | | | 5.09 | |
| | | | |
| | | | | | | | | | | | | | | | | | | | | | | | | | | | | |
Cash and due from banks | | | 42,522 | | | | | | | | | 43,107 | | | | | | | | | 40,444 | | | | | | | |
Unrealized gains (losses) on securities | | | 21,489 | | | | | | | | | 41,035 | | | | | | | | | 26,222 | | | | | | | |
Allowance for loan losses | | | (29,563 | ) | | | | | | | | (37,626 | ) | | | | | | | | (42,583 | ) | | | | | | |
Premises and equipment, net | | | 55,988 | | | | | | | | | 50,710 | | | | | | | | | 49,920 | | | | | | | |
Intangible assets | | | 70,296 | | | | | | | | | 68,704 | | | | | | | | | 70,006 | | | | | | | |
Accrued interest receivable and other assets | | | 113,431 | | | | | | | | | 112,177 | | | | | | | | | 115,695 | | | | | | | |
| | | | | | | | | | | | | | | | | | | | | | | | | | |
| | | | | | | | | | | | | | | | | | | | | | | | | | | | | |
Total assets | | $ | 2,786,650 | | | | | | | | $ | 2,760,723 | | | | | | | | $ | 2,790,899 | | | | | | | |
| | | | | | | | | | | | | | | | | | | | | | | | | | |
| | | | | | | | | | | | | | | | | | | | | | | | | | | | | |
| | | | | | | | | | | | | | | | | | | | | | | | | | | | | |
| | | | | | | | | | | | | | | | | | | | | | | | | | |
Liabilities | | | | | | | | | | | | | | | | | | | | | | | | | | | | |
Interest-bearing deposits DDA, savings, and money market accounts | | $ | 1,375,556 | | | 1,448 | | | 0.11 | | $ | 1,321,901 | | | 2,138 | | | 0.16 | | $ | 1,294,274 | | | 4,275 | | | 0.33 | |
Certificates of deposit | | | 415,176 | | | 3,479 | | | 0.84 | | | 494,142 | | | 5,499 | | | 1.11 | | | 631,270 | | | 9,836 | | | 1.56 | |
| | | | |
| | | | | | | | | | | | | | | | | | | | | | | | | | | | | |
Total interest-bearing deposits | | | 1,790,732 | | | 4,927 | | | 0.28 | | | 1,816,043 | | | 7,637 | | | 0.42 | | | 1,925,544 | | | 14,111 | | | 0.73 | |
Short-term borrowings | | | 33,238 | | | 70 | | | 0.21 | | | 30,514 | | | 104 | | | 0.34 | | | 30,946 | | | 161 | | | 0.52 | |
Subordinated debentures | | | 49,000 | | | 1,675 | | | 3.42 | | | 49,000 | | | 1,825 | | | 3.72 | | | 49,000 | | | 1,737 | | | 3.54 | |
Notes payable and FHLB borrowings | | | 155,834 | | | 3,307 | | | 2.12 | | | 148,466 | | | 5,120 | | | 3.45 | | | 150,814 | | | 5,754 | | | 3.82 | |
| | | | |
| | | | | | | | | | | | | | | | | | | | | | | | | | | | | |
Total interest-bearing liabilities | | | 2,028,804 | | | 9,979 | | | 0.49 | | | 2,044,023 | | | 14,686 | | | 0.72 | | | 2,156,304 | | | 21,763 | | | 1.01 | |
Demand deposits | | | 414,084 | | | | | | | | | 348,858 | | | | | | | | | 288,908 | | | | | | | |
Other liabilities | | | 28,263 | | | | | | | | | 33,354 | | | | | | | | | 25,734 | | | | | | | |
| | | | | | | | | | | | | | | | | | | | | | | | | | |
| | | | | | | | | | | | | | | | | | | | | | | | | | | | | |
Total liabilities | | | 2,471,151 | | | | | | | | | 2,426,235 | | | | | | | | | 2,470,946 | | | | | | | |
Shareholders' equity | | | 315,499 | | | | | | | | | 334,488 | | | | | | | | | 319,953 | | | | | | | |
| | | | | | | | | | | | | | | | | | | | | | | | | | |
| | | | | | | | | | | | | | | | | | | | | | | | | | | | | |
Total liabilities and shareholders' equity | | $ | 2,786,650 | | | 9,979 | | | 0.40 | *** | $ | 2,760,723 | | | 14,686 | | | 0.59 | *** | $ | 2,790,899 | | | 21,763 | | | 0.86 | *** |
| | | | | | | | | | | | | | | | | | | | | | | | | | |
| | | | | | | | | | | | | | | | | | | | | | | | | | | | | |
| | | | | | | | | | | | | | | | | | | | | | | | | | | | | |
| | | | | | | | | | | | | | | | | | | | | | | | | | |
| | | | | | | | | | | | | | | | | |
| | | | | | | | | | | | | | | | | | | | | | | | | | | | | |
Net interest income | | | | | $ | 98,310 | | | 3.91 | **** | | | | $ | 101,054 | | | 4.07 | **** | | | | $ | 107,033 | | | 4.23 | **** |
| | | | | | | | | | | | | | | | | |
| | | | | | | | | | | | | | | | | | | | | | | | | | | | | |
| | | | | | | | | | | | | | | | | | | | | | | | | | | | | |
| | | | | | | | | | | | | | | | | |
Conversion of tax exempt income to a fully taxable equivalent basis using a marginal rate of 35% | | $ | 7,010 | | | | | | | | | | | $ | 6,972 | | | | | | | | $ | 7,185 | | | | |
| | | | | | | | | | | | | | | | | | | | | | | | | | |
| | | | | | | | | | | | | | | | | | | | | | | | | | | | | |
Security yields are calculated based on amortized cost.
- *
- Adjusted to reflect income related to securities and loans exempt from Federal income taxes.
- **
- Nonaccruing loans have been included in the average balances.
- ***
- Total interest expense divided by total earning assets.
- ****
- Net interest income divided by total earning assets.
21
Table of Contents
The following table sets forth for the periods indicated a summary of the changes in interest income and interest expense resulting from changes in volume and changes in rates.
Volume/Rate Analysis of Changes in Net Interest Income
(Tax Equivalent Basis)
| | | | | | | | | | | | | | | | | | | |
| | 2013 OVER 2012 | | 2012 OVER 2011 | |
|---|
| | Volume
| | Rate
| | Total
| | Volume
| | Rate
| | Total
| |
|---|
| | |
Interest income | | | | | | | | | | | | | | | | | | | |
Loans | | $ | 2,340 | | $ | (9,188 | ) | $ | (6,848 | ) | $ | (3,547 | ) | $ | (5,535 | ) | $ | (9,082 | ) |
Securities | | | 764 | | | (1,267 | ) | | (503 | ) | | 1,688 | | | (5,611 | ) | | (3,923 | ) |
Federal funds sold and money market funds | | | 1 | | | (2 | ) | | (1 | ) | | (16 | ) | | (2 | ) | | (18 | ) |
Short-term investments | | | (102 | ) | | 3 | | | (99 | ) | | (66 | ) | | 33 | | | (33 | ) |
| | | | | | |
| | | | | | | | | | | | | | | | | | | | |
Total interest income | | | 3,003 | | | (10,454 | ) | | (7,451 | ) | | (1,941 | ) | | (11.115 | ) | | (13,056 | ) |
| | | | | | |
| | | | | | | | | | | | | | | | | | | | |
Interest expense | | |
| | |
| | |
| | |
| | |
| | |
| |
Interest-bearing DDA, savings, and money market accounts | | $ | 84 | | $ | (774 | ) | $ | (690 | ) | $ | 89 | | $ | (2,226 | ) | $ | (2,137 | ) |
Certificates of deposit | | | (794 | ) | | (1,226 | ) | | (2,020 | ) | | (1,873 | ) | | (2,464 | ) | | (4,337 | ) |
Borrowings | | | 314 | | | (2,161 | ) | | (1,847 | ) | | (89 | ) | | (602 | ) | | (691 | ) |
Subordinated debentures | | | — | | | (150 | ) | | (150 | ) | | — | | | 88 | | | 88 | |
| | | | | | |
| | | | | | | | | | | | | | | | | | | | |
Total interest expense | | | (396 | ) | | (4,311 | ) | | (4,707 | ) | | (1,873 | ) | | (5,204 | ) | | (7,077 | ) |
| | | | | | |
| | | | | | | | | | | | | | | | | | | | |
Change in net interest income | | | 3,399 | | | (6,143 | ) | | (2,744 | ) | | (68 | ) | | (5,911 | ) | | (5,979 | ) |
Change in tax equivalent adjustment | | | | | | | | | 38 | | | | | | | | | (213 | ) |
| | | | | | | | | | | | | | | | | | |
| | | | | | | | | | | | | | | | | | | | |
Change in net interest income before tax equivalent adjustment | | | | | | | | $ | (2,782 | ) | | | | | | | $ | (5,766 | ) |
| | | | | | | | | | | | | | | | | | |
| | | | | | | | | | | | | | | | | | | | |
| | | | | | | | | | | | | | | | | | | | |
| | | | | | | | | | | | | | | | | | |
Variances not attributed to rate or volume are allocated between rate and volume in proportion to the relationship of the absolute dollar amount of the change in each.
Provision for Loan Losses
The Company expensed $4,534, $9,850, and $17,800 in provision for loan losses in 2013, 2012, and 2011 respectively. This level of provision allowed the Company to maintain an adequate allowance for loan losses. This topic is discussed in detail under the heading "Loans, Credit Risk and the Allowance and Provision for Loan Losses".
22
Table of Contents
Non-interest Income and Expense
| | | | | | | | | | | | | | | | |
| |
| |
| |
| | Percent Change | |
|---|
| | 2013
| | 2012
| | 2011
| | 13/12
| | 12/11
| |
|---|
| | |
Non-interest income | | | | | | | | | | | | | | | | |
Mortgage banking | | $ | 6,799 | | $ | 9,927 | | $ | 5,551 | | | -31.5% | | | 78.8% | |
Trust and investment product fees | | | 4,756 | | | 3,650 | | | 3,250 | | | 30.3% | | | 12.3% | |
Service charges on deposit accounts | | | 20,427 | | | 19,815 | | | 18,147 | | | 3.1% | | | 9.2% | |
Net realized gains on securities sales | | | 835 | | | 1,367 | | | 11,357 | | | -38.9% | | | -88.0% | |
Increase in cash surrender value of life insurance | | | 1,378 | | | 1,206 | | | 1,200 | | | 14.3% | | | 0.5% | |
Interchange income | | | 7,056 | | | 6,540 | | | 6,225 | | | 7.9% | | | 5.1% | |
Gain/(loss) on sale of OREO | | | (539 | ) | | (1,359 | ) | | (2,744 | ) | | 60.3% | | | 50.5% | |
Other | | | 2,417 | | | 2,745 | | | 2,322 | | | -11.9% | | | 18.2% | |
| | | | | | | | | | |
| | | | | | | | | | | | | | | | | |
Total non-interest income | | $ | 43,129 | | $ | 43,891 | | $ | 45,308 | | | -1.7% | | | -3.1% | |
| | | | | | | | | | |
| | | | | | | | | | | | | | | | | |
| | | | | | | | | | | | | | | | | |
| | | | | | | | | | |
Non-interest expense | | | | | | | | | | | | | | | | |
Salaries and employee benefits | | $ | 52,165 | | $ | 48,990 | | $ | 49,950 | | | 6.5% | | | -1.9% | |
Net occupancy | | | 7,139 | | | 6,769 | | | 6,686 | | | 5.5% | | | 1.2% | |
Equipment | | | 9,931 | | | 8,564 | | | 7,822 | | | 16.0% | | | 9.5% | |
Intangibles amortization | | | 1,868 | | | 1,835 | | | 1,939 | | | 1.8% | | | -5.4% | |
Telecommunications | | | 1,796 | | | 1,729 | | | 1,991 | | | 3.9% | | | -13.2% | |
Stationery, printing, and supplies | | | 1,190 | | | 1,337 | | | 1,510 | | | -11.0% | | | -11.5% | |
FDIC assessment | | | 1,711 | | | 2,495 | | | 3,974 | | | -31.4% | | | -37.2% | |
Marketing | | | 3,660 | | | 4,397 | | | 4,057 | | | -16.8% | | | 8.4% | |
Collection expenses | | | 3,300 | | | 3,768 | | | 4,334 | | | -12.4% | | | -13.1% | |
Consultant expense | | | 1,582 | | | 1,150 | | | 6,547 | | | 37.6% | | | -82.4% | |
Prepayment penalty on FHLB advance | | | 2,239 | | | 1,313 | | | — | | | 70.5% | | | NA | |
Interchange expense | | | 1,918 | | | 1,591 | | | 1,465 | | | 20.6% | | | 8.6% | |
Other | | | 9,732 | | | 10,900 | | | 9,530 | | | -10.7% | | | 14.4% | |
| | | | | | | | | | |
| | | | | | | | | | | | | | | | | |
Total non-interest expense | | $ | 98,231 | | $ | 94,838 | | $ | 99,805 | | | 3.6% | | | -5.0% | |
| | | | | | | | | | |
| | | | | | | | | | | | | | | | | |
| | | | | | | | | | | | | | | | | |
| | | | | | | | | | |
Non-interest Income
Non-interest income was $43,129 for 2013 compared to $43,891 for the same period in 2012, a decrease of $762 or 1.7%. Decreases in mortgage banking income, securities gains, and other income (primarily title insurance revenue) were the primary causes of the decrease. These decreases were offset by increases in service charges on deposit accounts, interchange income, trust and investment product fees, lower losses on the sale of OREO, and an increase in the cash surrender value of life insurance. An increase in interest rates in 2013 led to decreased mortgage activity and title revenue. As a result of favorable pricing, the Company recorded gains during 2012 on the sale of securities at a higher level than 2013. Continued emphasis on new account growth generated additional service charge and interchange income. The Company acquired two brokerage firms in late 2012 which resulted in higher trust and investment product fees in 2013. OREO losses declined as a result of a reduced amount of OREO properties.
Non-interest income was $43,891 for 2012 compared to $45,308 for the same period in 2011, a decrease of $1,417 or 3.1%. Increases in mortgage banking income, service charge on deposit accounts, lower losses on the sale of OREO, trust and investment product fees, and interchange income were the primary causes of the increase. These increases were offset by a reduction in securities gains. A reduction in interest rates in 2012 led to increased mortgage refinancing activity. Continued emphasis on new account growth generated additional service charge and interchange income. OREO losses declined as a result of a reduced amount of OREO property as well as more timely appraisals when the property is initially placed in OREO. As a result of favorable pricing, the Company recorded gains during 2011 on the sale of securities at a higher level than 2012.
Non-interest Expense
Total non-interest expense was $98,231 in 2013 compared to $94,838 in 2012, an increase of $3,393 or 3.6%. The increase was primarily attributable to increases in salaries and employee benefits, occupancy and equipment costs, a prepayment penalty on a FHLB advance, consultant expenses, and interchange expense. Salaries and employee benefit and occupancy costs increased as a result of the full year effect of de novo branches in 2012 and the opening of several more offices in 2013. The increase in equipment costs is a result of several technology initiatives which enhance the customer experience. The Company paid off a FHLB advance early and incurred a prepayment penalty of $2,239. However, the payoff of this advance should lower interest expense costs by approximately $675 on an annual basis. Consultant expenses increased due to several revenue enhancement initiatives suggested by
23
Table of Contents
the consultants. The increase in interchange expenses is a direct correlation with the increase in interchange income. Offsetting these increases were decreases in FDIC expenses, marketing expense, collection expense, and other expense. FDIC premiums lowered as a result of a lower multiplier for the Company's premiums. Marketing expenses decreased as the Company did not enter any markets in 2013 that required a large outlay of marketing dollars. Collection expenses decreased due to the continued reduction in new problem loans. The reduction in other expense is primarily attributable to professional/legal expenses connected with the Company's participation in the U.S. Department of the Treasury secondary public offering of the Company's preferred stock in 2012.
Total non-interest expense was $94,838 in 2012 compared to $99,805 in 2011, a decrease of $4,967 or 5.0%. The decrease was primarily attributable to a reduction in consultant expenses of $5,397. During 2011 the Company completed an efficiency project with the aid of a third party consulting firm. Almost all of the Company's departments and corresponding headcount were reviewed, as well as the entire organizational structure of the Company. As a result of the project, many of the non-interest expense categories showed reductions in 2012. These included salaries and employee benefits, telecommunications, and stationary and printing costs. Other categories also showing reductions were intangibles amortization, FDIC assessment, and collection expenses. FDIC premiums lowered as a result of a lower multiplier for the Company's premiums. Collection expenses decreased due to a reduction in new problem loans compared to 2011. Offsetting these decreases were increases in occupancy, equipment, marketing, other expenses, and a prepayment penalty on a FHLB advance. Occupancy, equipment, and marketing expenses increased primarily due to opening of three de novo branches in 2012. The largest contributor to other expense was expenses related to tax credit properties. Lastly, the Company paid off a FHLB advance early and incurred a prepayment penalty of $1,313.
Income Taxes
The effective tax rate was 16.8% in 2013, 18.1% in 2012, and 13.6% in 2011. The decrease in the Company's effective rate from 2012 to 2013 was due primarily from a decrease in taxable income with the tax exempt income and tax credits remaining the same from year to year. The increase in the effective rate from 2011 to 2012 was primarily due to an increase in taxable income in 2012. The Company and its subsidiaries file consolidated income tax returns.
Balance Sheet
At December 31, 2013, total assets were $2,859,864 compared to $2,769,288 at December 31, 2012, an increase of $91 million. Increases in loans ($119 million) were offset by a decrease in investment securities ($11 million).
Loans, Credit Risk and the Allowance and Provision for Loan Losses
Loans remain the Company's largest concentration of assets and continue to represent the greatest potential risk. The loan underwriting standards observed by the Bank are viewed by management as a means of controlling problem loans and the resulting charge-offs. The Company also believes credit risks may be elevated if undue concentrations of loans in specific industry segments and to out-of-area borrowers are incurred. Accordingly, the Company's Board of Directors regularly monitors such concentrations to determine compliance with its loan concentration policy. The Company believes it has no undue concentrations of loans.
Total loans (excluding those held for sale) increased by $118,543 in 2013. Almost all categories of loans experienced loan growth in 2013 as the effects of the 2008 recession have subsided and businesses are starting to borrow. The Company has also invested in additional lending personnel and opened branches in new markets which has contributed to the growth. Residential real estate loans continue to represent the largest portion of the total loan portfolio and were 45% of total loans at December 31, 2013 compared to 48% of total loans at the end of 2012.
24
Table of Contents
The following table details the Company's loan portfolio by type of loan.
Loan Portfolio
| | | | | | | | | | | | | | | | |
| | 2013
| | 2012
| | 2011
| | 2010
| | 2009
| |
|---|
| | |
Types of loans | | | | | | | | | | | | | | | | |
Commercial and industrial | | | 167,270 | | $ | 130,787 | | $ | 107,538 | | $ | 163,651 | | $ | 195,509 | |
Agricultural production financing | | | 45,057 | | | 38,232 | | | 32,325 | | | 36,596 | | | 41,889 | |
Farm real estate | | | 87,166 | | | 68,013 | | | 58,424 | | | 37,634 | | | 45,332 | |
Commercial real estate mortgage | | | 520,317 | | | 480,879 | | | 509,887 | | | 525,578 | | | 551,670 | |
Construction and development | | | 45,638 | | | 31,694 | | | 37,078 | | | 84,152 | | | 142,472 | |
Residential real estate mortgage | | | 760,184 | | | 753,230 | | | 730,374 | | | 759,409 | | | 813,602 | |
Consumer | | | 46,294 | | | 50,548 | | | 58,753 | | | 73,951 | | | 94,973 | |
| | | | |
| | | | | | | | | | | | | | | | | |
Total loans | | $ | 1,671,926 | | $ | 1,553,383 | | $ | 1,534,379 | | $ | 1,680,971 | | $ | 1,885,447 | |
| | | | |
| | | | | | | | | | | | | | | | | |
| | | | | | | | | | | | | | | | | |
| | | | |
The following table indicates the amounts of loans (excluding residential and commercial mortgages and consumer loans) outstanding as of December 31, 2013 which, based on remaining scheduled repayments of principal, are due in the periods indicated.
Maturities and Sensitivity to Changes in Interest Rates of Commercial and Construction Loans
| | | | | | | | | | | | | | | |
| | Due:
| | Within
1 Year
| | 1-5 Years
| | Over
5 years
| | Total
| |
|---|
| | |
Loan Type | | | | | | | | | | | | | | | |
Commercial and industrial | | | | $ | 44,635 | | $ | 80,296 | | $ | 42,339 | | $ | 167,270 | |
Agricultural production financing | | | | | 31,324 | | | 10,801 | | | 2,932 | | | 45,057 | |
Construction and development | | | | | 11,628 | | | 15,135 | | | 18,875 | | | 45,638 | |
| | | | | | |
| | | | | | | | | | | | | | | | |
Totals | | | | $ | 87,587 | | $ | 106,232 | | $ | 64,146 | | $ | 257,965 | |
| | | | | | |
| | | | | | | | | | | | | | | | |
| | | | | | | | | | | | | | | | |
| | | | | | |
Percent | | | | | 34% | | | 41% | | | 25% | | | 100% | |
| | | | | | |
| | | | | | | | | | | | | | | | |
| | | | | | | | | | | | | | | | |
| | | | | | |
Rate Sensitivity | | | | | | | | | | | | | | | |
Fixed Rate | | | | $ | 13,132 | | $ | 75,558 | | $ | 24,496 | | $ | 113,186 | |
Variable Rate | | | | | 110,178 | | | 23,170 | | | 11,431 | | | 144,779 | |
| | | | | | |
| | | | | | | | | | | | | | | | |
Totals | | | | $ | 123,310 | | $ | 98,728 | | $ | 35,927 | | $ | 257,965 | |
| | | | | | |
| | | | | | | | | | | | | | | | |
| | | | | | | | | | | | | | | | |
| | | | | | |
Loans are placed on "non-accrual" status when, in management's judgment, the collateral value and/or the borrower's financial condition does not justify accruing interest. As a general rule, commercial, commercial real estate, residential, and consumer loans are reclassified to non-accrual status at or before becoming 90 days past due. Interest previously recorded is reversed and charged against current income. Subsequent interest payments collected on non-accrual loans are thereafter applied as a reduction of the loan's principal balance. Non-performing loans were $26,543 as of December 31, 2013 compared to $51,118 as of December 31, 2012 and represented 1.59% of total loans at December 31, 2013 versus 3.29% one year ago. The significant reduction in 2013 is a result of the Company's continued emphasis on reducing the amount of non-performing loans and the upgrade of three credits that had been classified as troubled debt restructurings that became performing loans in 2013.
The following table details the Company's non-performing loans as of December 31 for the years indicated.
Non-performing Loans
| | | | | | | | | | | | | | | | |
| | 2013
| | 2012
| | 2011
| | 2010
| | 2009
| |
|---|
| | |
Non-accruing loans | | $ | 22,341 | | $ | 35,451 | | $ | 41,528 | | $ | 68,236 | | $ | 77,074 | |
Troubled debt restructurings (accruing) | | | 4,188 | | | 15,102 | | | 20,402 | | | 22,250 | | | 11,843 | |
Accruing loans contractually past due 90 days or more | | | 14 | | | 565 | | | 3,266 | | | 990 | | | 3,279 | |
| | | | |
| | | | | | | | | | | | | | | | | |
Total | | $ | 26,543 | | $ | 51,118 | | $ | 65,196 | | $ | 91,476 | | $ | 92,196 | |
| | | | |
| | | | | | | | | | | | | | | | | |
% of total loans | | | 1.59% | | | 3.29% | | | 4.25% | | | 5.44% | | | 4.89% | |
25
Table of Contents
A reconciliation of non-performing assets ("NPA") for 2013 and 2012 is as follows:
| | | | | | | |
| | 2013
| | 2012
| |
|---|
| | |
Beginning Balance — NPA — January 1 | | $ | 57,795 | | $ | 80,731 | |
Non-accrual | | | | | | | |
Add: New non-accruals | | | 15,538 | | | 34,863 | |
Less: To accrual/payoff/restructured | | | (15,491 | ) | | (18,142 | ) |
Less: To OREO | | | (4,005 | ) | | (5,286 | ) |
Less: Charge offs | | | (9,152 | ) | | (17,512 | ) |
| | | | |
| | | | | | | | |
Increase/(Decrease): Non-accrual loans | | | (13,110 | ) | | (6,077 | ) |
Other Real Estate Owned (OREO) | | | | | | | |
Add: New OREO properties | | | 4,005 | | | 5,286 | |
Less: OREO sold | | | (5,708 | ) | | (12,089 | ) |
Less: OREO losses (write-downs) | | | (854 | ) | | (1,976 | ) |
| | | | |
| | | | | | | | |
Increase/(Decrease): OREO | | | (2,557 | ) | | (8,779 | ) |
Increase/(Decrease): Repossessions | | | — | | | (79 | ) |
Increase/(Decrease): 90 Days Delinquent | | | (551 | ) | | (2,701 | ) |
Increase/(Decrease): TDR's | | | (10,914 | ) | | (5,300 | ) |
| | | | |
| | | | | | | | |
Total NPA change | | | (27,132 | ) | | (22,936 | ) |
| | | | |
| | | | | | | | |
Ending Balance — NPA — December 31 | | $ | 30,663 | | $ | 57,795 | |
| | | | |
| | | | | | | | |
| | | | | | | | |
| | | | |
At December 31, 2013, only two of the non-accrual loan balances were greater than $1,000. These loans are real estate backed loans. The Company is working with these borrowers in an attempt to minimize its losses. In the course of resolving problem loans, the Company may choose to restructure the contractual terms of certain loans. The Company attempts to work out an alternative payment schedule with the borrower in order to avoid foreclosure actions. Any loans that are modified are reviewed by the Company to identify if a troubled debt restructuring has occurred, which is when for economic or legal reasons related to a borrower's financial difficulties, the Company grants a concession to the borrower that it would not otherwise consider. Terms may be modified to fit the ability of the borrower to repay in line with its current financial status and could include reduction of the stated interest rate, other than normal market rate adjustments, extension of maturity dates, or reduction of principal balance or accrued interest. The decision to restructure a loan, versus aggressively enforcing the collection of the loan, may benefit us by increasing the ultimate probability of collection. The Company reviews each relationship before it grants the concession to insure the creditor can comply with the new terms. To date, most of the concessions have been extensions of maturity dates. The provision for loan losses was $4,534 in 2013, $9,850 in 2012, and $17,800 in 2011. The Company's provision for loan losses continued to decline in 2013 due to the stabilization of problem credits. New non-accrual loans declined over 55% in 2013. Net charge-offs were $9,152 in 2013 compared to $17,512 in 2012 and $20,516 in 2011. As a percentage of average loans, net charge-offs equaled 0.57%, 1.13%, and 1.27% in 2013, 2012, and 2011, respectively.
Potential problem loans are identified on the Company's watch list and consist of loans that require close monitoring by management and are not necessarily considered classified credits by regulators. Credits may be considered as a potential problem loan for reasons that are temporary or correctable, such as for a deficiency in loan documentation or absence of current financial statements of the borrower. Potential problem loans may also include credits where adverse circumstances are identified that may affect the borrower's ability to comply with the contractual terms of the loan. Other factors which might indicate the existence of a potential problem loan include the delinquency of a scheduled loan payment, deterioration in a borrower's financial condition identified in a review of periodic financial statements, a decrease in the value of the collateral securing the loan, or a change in the economic environment in which the borrower operates. Substandard commercial loans that were not classified as non-accrual were $27,277 at December 31, 2013 and $28,785 at December 31, 2012, a decrease of $1,563. These loans which are $250 or greater are reviewed at least quarterly by senior management. This review includes monitoring how the borrower is performing versus their workout plan, obtaining and reviewing the borrower's financial information, and monitoring collateral values. Management believes these loans were well secured and had adequate allowance allocations at December 31, 2013.
26
Table of Contents
Summary of the Allowance for Loan Losses
| | | | | | | | | | | | | | | | |
| | 2013
| | 2012
| | 2011
| | 2010
| | 2009
| |
|---|
| | |
Balance at January 1 | | $ | 32,227 | | $ | 39,889 | | $ | 42,605 | | $ | 46,648 | | $ | 34,583 | |
Chargeoffs | | | | | | | | | | | | | | | | |
Commercial | | | 1,152 | | | 1,946 | | | 2,211 | | | 8,190 | | | 8,686 | |
Commercial real estate mortgage | | | 6,353 | | | 13,553 | | | 16,954 | | | 29,177 | | | 21,140 | |
Residential real estate mortgage | | | 2,349 | | | 3,547 | | | 3,093 | | | 2,220 | | | 1,899 | |
Consumer | | | 2,648 | | | 3,286 | | | 2,636 | | | 2,859 | | | 4,477 | |
| | | | |
| | | | | | | | | | | | | | | | | |
Total Chargeoffs | | | 12,502 | | | 22,332 | | | 24,894 | | | 42,446 | | | 36,202 | |
| | | | |
| | | | | | | | | | | | | | | | | |
Recoveries | | | | | | | | | | | | | | | | |
Commercial | | | 341 | | | 543 | | | 1,172 | | | 518 | | | 350 | |
Commercial real estate mortgage | | | 1,087 | | | 2,432 | | | 1,371 | | | 873 | | | 226 | |
Residential real estate mortgage | | | 650 | | | 265 | | | 648 | | | 524 | | | 37 | |
Consumer | | | 1,272 | | | 1,580 | | | 1,187 | | | 1,238 | | | 1,344 | |
| | | | |
| | | | | | | | | | | | | | | | | |
Total Recoveries | | | 3,350 | | | 4,820 | | | 4,378 | | | 3,153 | | | 1,957 | |
| | | | |
| | | | | | | | | | | | | | | | | |
Net Chargeoffs | | | 9,152 | | | 17,512 | | | 20,516 | | | 39,293 | | | 34,245 | |
Provision for loan losses | | | 4,534 | | | 9,850 | | | 17,800 | | | 35,250 | | | 46,310 | |
| | | | |
| | | | | | | | | | | | | | | | | |
Balance at December 31 | | $ | 27,609 | | $ | 32,227 | | $ | 39,889 | | $ | 42,605 | | $ | 46,648 | |
| | | | |
| | | | | | | | | | | | | | | | | |
| | | | | | | | | | | | | | | | | |
| | | | |
Net Chargeoffs to average loans | | | 0.57% | | | 1.13% | | | 1.27% | | | 2.21% | | | 1.73% | |
Provision for loan losses to average loans | | | 0.28% | | | 0.63% | | | 1.10% | | | 1.98% | | | 2.35% | |
Allowance to total loans at year end | | | 1.65% | | | 2.07% | | | 2.60% | | | 2.53% | | | 2.47% | |
| | | | |
| | | | | | | | | | | | | | | | | |
| | | | | | | | | | | | | | | | | |
| | | | |
Although the allowance for loan losses is available for any loan that, in management's judgment, should be charged off, the following table details the allowance for loan losses by loan category and the percent of loans in each category compared to total loans at December 31.
Allocation of the Allowance for Loan Losses
| | | | | | | | | | | | | | | | | | | | | | | | | | | | | | | |
| | 2013 | | 2012 | | 2011 | | 2010 | | 2009 | |
|---|
December 31
| | Amount
| | Percent
of loans
to total
loans
| | Amount
| | Percent
of loans
to total
loans
| | Amount
| | Percent
of loans
to total
loans
| | Amount
| | Percent
of loans
to total
loans
| | Amount
| | Percent
of loans
to total
loans
| |
|---|
| | |
Real estate | | | | | | | | | | | | | | | | | | | | | | | | | | | | | | | |
Residential | | $ | 3,409 | | | 39% | | $ | 3,180 | | | 40% | | $ | 2,972 | | | 38% | | $ | 2,281 | | | 45% | | $ | 9,449 | | | 43% | |
Farm real estate | | | 194 | | | 5 | | | 722 | | | 4 | | | 456 | | | 3 | | | 740 | | | 2 | | | 647 | | | 2 | |
Commercial | | | 17,679 | | | 39 | | | 20,465 | | | 41 | | | 24,187 | | | 45 | | | 20,034 | | | 31 | | | 14,754 | | | 29 | |
Construction and development | | | 2,337 | | | 2 | | | 2,970 | | | 2 | | | 5,833 | | | 2 | | | 11,879 | | | 5 | | | 10,205 | | | 8 | |
| | | | |
| | | | | | | | | | | | | | | | | | | | | | | | | | | | | | | | |
Total real estate | | | 23,619 | | | 85 | | | 27,337 | | | 87 | | | 33,448 | | | 88 | | | 34,934 | | | 83 | | | 35,055 | | | 82 | |
| | | | |
| | | | | | | | | | | | | | | | | | | | | | | | | | | | | | | | |
Commercial | | | | | | | | | | | | | | | | | | | | | | | | | | | | | | | |
Agribusiness | | | 64 | | | 2 | | | 166 | | | 2 | | | 151 | | | 1 | | | 370 | | | 2 | | | 1,126 | | | 2 | |
Other commercial | | | 3,227 | | | 10 | | | 3,728 | | | 8 | | | 5,411 | | | 7 | | | 6,016 | | | 10 | | | 7,880 | | | 11 | |
| | | | |
| | | | | | | | | | | | | | | | | | | | | | | | | | | | | | | | |
Total Commercial | | | 3,291 | | | 12 | | | 3,894 | | | 10 | | | 5,562 | | | 8 | | | 6,386 | | | 12 | | | 9,006 | | | 13 | |
| | | | |
| | | | | | | | | | | | | | | | | | | | | | | | | | | | | | | | |
Consumer | | | 699 | | | 3 | | | 996 | | | 3 | | | 879 | | | 4 | | | 1,285 | | | 5 | | | 2,587 | | | 5 | |
| | | | |
| | | | | | | | | | | | | | | | | | | | | | | | | | | | | | | | |
Total | | $ | 27,609 | | | 100% | | $ | 32,227 | | | 100% | | $ | 39,889 | | | 100% | | $ | 42,605 | | | 100% | | $ | 46,648 | | | 100% | |
| | | | |
| | | | | | | | | | | | | | | | | | | | | | | | | | | | | | | | |
| | | | | | | | | | | | | | | | | | | | | | | | | | | | | | | | |
| | | | |
Management maintains a list of loans warranting either the assignment of a specific reserve amount or other special administrative attention. This watch list, together with a listing of all classified loans, non-accrual loans and delinquent loans, is reviewed monthly by management. Additionally, the Company evaluates its consumer and residential real estate loan pools for probable losses incurred based on historical trends, adjusted by current delinquency and non-performing loan levels.
27
Table of Contents
The Company has both internal and external loan review personnel who annually review approximately 50% of all loans. External loan review personnel examine the top 100 commercial credit relationships. This equates to approximately all relationships above $1,750.
The ability to absorb loan losses promptly when problems are identified is invaluable to a banking organization. Most often, losses incurred as a result of prompt, aggressive collection actions are much lower than losses incurred after prolonged legal proceedings. Accordingly, the Company observes the practice of quickly initiating stringent collection efforts in the early stages of loan delinquency.
The adequacy of the allowance for loan losses is reviewed at least quarterly. The determination of the provision amount in any period is based upon management's continuing review and evaluation of loan loss experience, changes in the composition of the loan portfolio, classified loans including non-accrual and impaired loans, current economic conditions, the amount of loans presently outstanding, and the amount and composition of loan growth. The Company's allowance for loan losses was $27,609, or 1.65% of total loans, at December 31, 2013 compared to $32,227, or 2.07% of total loans, at the end of 2012. This $4,618 decrease in the allowance was due in large part to write-offs in 2013 that had an allowance allocated in 2012 as well as continued monitoring of problem loans.
Securities, at Fair Value
| | | | | | | | | | |
| | December 31, | |
|---|
| | 2013
| | 2012
| | 2011
| |
|---|
| | |
Available for Sale | | | | | | | | | | |
U.S. Government-sponsored entities | | $ | 798 | | $ | 1,638 | | $ | — | |
State and municipal | | | 331,112 | | | 337,939 | | | 344,877 | |
Mortgage-backed | | | 550,738 | | | 554,278 | | | 522,271 | |
Equity and other | | | 8,458 | | | 8,486 | | | 8,942 | |
| | | | |
| | | | | | | | | | | |
Total securities | | $ | 891,106 | | $ | 902,341 | | $ | 876,090 | |
| | | | |
| | | | | | | | | | | |
| | | | | | | | | | | |
| | | | |
Securities offer flexibility in the Company's management of interest rate risk, and are the primary means by which the Company provides liquidity and responds to changing maturity characteristics of assets and liabilities. The Company's investment policy prohibits trading activities and does not allow investment in high-risk derivative products or junk bonds.
As of December 31, 2013, all of the securities are classified as available for sale ("AFS") and are carried at fair value with unrealized gains and losses, net of taxes, excluded from earnings and reported as a separate component of shareholders' equity. A net unrealized gain of $1,746 was recorded to adjust the AFS portfolio to current market value at December 31, 2013 compared to a net unrealized gain of $39,582 at December 31, 2012.
Securities
(Carrying Values at December 31)
| | | | | | | | | | | | | | | | |
| | Within
1 Year
| | 2-5 Yrs
| | 6-10 Yrs
| | Beyond
10 Years
| | Total 2013
| |
|---|
| | |
Available for sale | | | | | | | | | | | | | | | | |
US government agency | | $ | — | | $ | — | | $ | 798 | | $ | — | | $ | 798 | |
State and municipal | | | 14,434 | | | 54,844 | | | 123,194 | | | 138,640 | | | 331,112 | |
Mortgage-backed securities | | | 11 | | | 6,367 | | | 23,604 | | | 520,756 | | | 550,738 | |
Other securities | | | 507 | | | 2,019 | | | — | | | 993 | | | 3,519 | |
| | | | |
| | | | | | | | | | | | | | | | | |
Total available for sale | | $ | 14,952 | | $ | 63,230 | | $ | 147,596 | | $ | 660,389 | | $ | 886,167 | |
| | | | |
| | | | | | | | | | | | | | | | | |
| | | | | | | | | | | | | | | | | |
| | | | |
Weighted average yield* | | | 6.48% | | | 5.80% | | | 5.36% | | | 2.81% | | | 3.45% | |
- *
- Adjusted to reflect income related to securities exempt from federal income taxes.
Amounts in the table above are based on scheduled maturity dates. Variable interest rates are subject to change not less than annually based upon certain interest rate indexes. Expected maturities will differ from contractual maturities because issuers may have the right to call or prepay obligations with or without call or prepayment penalties. Equity securities of $4,939 do not have contractual maturities and are excluded from the table above.
As of December 31, 2013, there were no corporate bonds and other securities which represented more than 10% of shareholders' equity.
28
Table of Contents
For 2013 the tax equivalent yield of the investment securities portfolio was 3.45%, compared to 3.59% and 4.24% for 2012 and 2011, respectively. The average life of the Company's investment securities portfolio was 4.77 years at December 31, 2013. During 2013 the investment portfolio decreased slightly in size as the Company's excess cash was invested in loans as loan demand increased significantly. Cash flows from security sales and normal monthly principal pay downs were reinvested at materially lower yields leading to a sizable decline in portfolio yield. The reinvestments were focused on a balanced approach between a likely long term low interest rate horizon and protection against cash flow extensions when rates do move higher. This investment strategy will allow the portfolio to meet cash needs for future loan growth.
The Company and its investment advisor monitor the securities portfolio on at least a quarterly basis for other-than-temporary impairment ("OTTI"). The amount of the OTTI recognized in earnings depends on whether the Company intends to sell the security or it is more likely than not it will be required to sell the security before recovery of its amortized cost basis, less any current-period credit loss. If an entity intends to sell or it is more likely than not it will be required to sell the security before recovery of its amortized cost basis, less any current-period credit loss, the OTTI shall be recognized in earnings equal to the entire difference between the investment's amortized cost basis and its fair value at the balance sheet date. If an entity does not intend to sell the security and it is not more likely than not that the entity will be required to sell the security before recovery of its amortized cost basis less any current-period loss, the OTTI shall be separated into the amount representing the credit loss and the amount related to all other factors. The amount of the total OTTI related to the credit loss is determined based on the present value of cash flows expected to be collected and is recognized in earnings. The amount of the total OTTI related to other factors is recognized in other comprehensive income, net of applicable taxes. In 2012, the Company recorded a $500 impairment loss on one of its equity securities. There was no OTTI recorded in 2013.
In December, 2013, banking regulators published the final rules under Section 619 of the Dodd-Frank Act (commonly referred to as the "Volcker Rule"). Under the Volcker Rule, collateralized debt obligations, including pooled trust preferred securities, are no longer a permissible investment and would have to be divested prior to July 15, 2015. On January 14, 2014, banking regulators released their interim final rule regarding the Volcker Rule and its impact on collateralized debt obligations. Under the interim final rule, regulators clarified the final rule and said that collateralized debt obligations primarily backed by trust preferred securities issued by depository institutions could continue to be held by banks. The Company was informed from an outside third party that it may be holding one security that would need to be divested by July 15, 2015. At December 31, 2013, the security had an amortized cost of $4,394 with an unrealized gain of $64. The Company is currently conducting further research on this security to see if it is a permissible holding.
Sources of Funds
The Company relies primarily on customer deposits and securities sold under agreement to repurchase ("repurchase agreements") along with shareholders' equity to fund earning assets. Federal Home Loan Bank ("FHLB") advances are used to provide additional funding. The Company also attempts to obtain deposits through branch and whole bank acquisitions.
Deposits generated within local markets provide the major source of funding for earning assets. Average total deposits were 87.8% and 87.2% of total average earning assets for 2013 and 2012, respectively. Total interest-bearing deposits averaged 81.2% and 83.9% of average total deposits during 2013 and 2012. Management is continuing its efforts to increase the percentage of transaction-related deposits to total deposits due to the positive effect on earnings.
Repurchase agreements are high denomination investments utilized by public entities and commercial customers as an element of their cash management responsibilities. During 2013, repurchase agreements averaged $29,132, with an average cost of 0.17%.
Another source of funding is the Federal Home Loan Bank (FHLB). The Company had FHLB advances of $247,858 outstanding at December 31, 2013. These advances have interest rates ranging from 0.3% to 4.8% (see Note 12 to the consolidated financial statements for the maturity schedule of these advances). The Company averaged $153,672 in FHLB advances during 2013 compared to $146,365 during 2012. This increase in the average balance of FHLB borrowings was primarily due to the increased loans generated by the Company in 2013 which created the need for other funding sources. One final source of funding is federal funds purchased. The Company had $9,200 of federal funds purchased as of December 31, 2013 and $8,725 at December 31, 2012.
29
Table of Contents
Average Deposits
| | | | | | | | | | | | | | | | | | | |
| | 2013
| | 2012
| | 2011
| |
|---|
| | | |
|---|
| |
| |
| | Amount
| | Rate
| | Amount
| | Rate
| |
|---|
| | |
Demand | | $ | 414,084 | | | | | $ | 348,858 | | | | | $ | 288,908 | | | | |
Interest Bearing Demand | | | 879,921 | | | 0.12 | % | | 866,493 | | | 0.17 | % | | 843,523 | | | 0.34 | % |
Savings/Money Markets | | | 495,635 | | | 0.09 | | | 455,408 | | | 0.14 | | | 450,751 | | | 0.30 | |
Certificates of Deposit | | | 415,176 | | | 0.84 | | | 494,142 | | | 1.11 | | | 631,270 | | | 1.56 | |
| | | | | | | | | | | | | | | | | |
| | | | | | | | | | | | | | | | | | | | |
Totals | | $ | 2,204,816 | | | 0.22 | % | $ | 2,164,901 | | | 0.35 | % | $ | 2,214,452 | | | 0.64 | % |
| | | | | | | | | | | | | | | | | |
| | | | | | | | | | | | | | | | | | | | |
| | | | | | | | | | | | | | | | | | | | |
| | | | | | | | | | | | | | | | | |
As of December 31, 2013, certificates of deposit and other time deposits of $100 or more mature as follows:
| | | | | | | | | | | | | | | | |
| | 3 months or less
| | 4-6 months
| | 6-12 months
| | over 12 months
| | Total
| |
|---|
| | |
Amount | | $ | 21,984 | | $ | 41,094 | | $ | 21,256 | | $ | 44,798 | | $ | 129,132 | |
Percent | | | 17% | | | 32% | | | 16% | | | 35% | | | | |
Capital Resources
The Federal Reserve Board and other regulatory agencies have adopted risk-based capital guidelines that assign risk weightings to assets and off-balance sheet items. The Company's core capital ("Tier 1") consists of common shareholders' equity adjusted for unrealized gains or losses on available for sale (AFS) securities plus limited amounts of Trust Preferred Securities less goodwill and intangible assets. Total capital consists of core capital, certain debt instruments and a portion of the allowance for loan losses. At December 31, 2013, Tier 1 capital to average assets was 10.1%. Total capital to risk-weighted assets was 16.7%. Both ratios exceed all required ratios established for bank holding companies. Risk-adjusted capital levels of the Bank also exceed regulatory definitions of well-capitalized institutions.
The Trust Preferred Securities (which are classified as subordinated debentures) currently qualify as Tier 1 capital or core capital with respect to the Company under the risk-based capital guidelines established by the Federal Reserve. Under such guidelines, capital received from the proceeds of the sale of these securities cannot constitute more than 25% of the total Tier 1 capital of the Company. Consequently, the amount of Trust Preferred Securities in excess of the 25% limitation constitutes Tier 2 capital, or supplementary capital, of the Company. As of December 31, 2013, all of the Company's Trust Preferred Securities qualify as Tier 1 capital. The Company redeemed $4,124 of these securities in December, 2013.
Common shareholders' equity is impacted by the Company's decision to categorize its securities portfolio as available for sale (AFS). Securities in this category are carried at fair value, and common shareholders' equity is adjusted to reflect unrealized gains and losses, net of taxes.
The Company declared and paid common dividends of $.28 per share in 2013 compared to $.08 in 2012 and $.04 2011. Book value per common share decreased to $14.96 at December 31, 2013 compared to $15.21 at the end of 2012. The decrease is primarily the result of the reduction in the AFS equity adjustment. The net adjustment for AFS securities increased book value per share by $0.06 at December 31, 2013 and increased book value per share by $1.27 at December 31, 2012. Depending on market conditions, the adjustment for AFS securities can cause significant fluctuations in shareholders' equity.
On January 16, 2009, the Company entered into an agreement with the United States Department of Treasury (the "Treasury Department") as part of the Treasury Department's Capital Purchase Program. Under this agreement, the Company issued to the Treasury Department 57,000 shares of Fixed Rate Cumulative Perpetual Preferred Stock, Series A ("preferred stock") and a warrant to purchase up to 571,906 shares ("warrant shares") of the Company's common stock. Like stock options, the warrant issued through the Capital Purchase Program is potentially dilutive. The average stock price for the Company for 2013 and 2012 was $14.58 and $11.45 per share respectively, and the warrant issued in 2009 has an exercise price of $14.95 per share. This resulted in no additional potentially dilutive shares during 2013 and 2012.
On March 28, 2012, the U.S. Department of the Treasury priced its secondary public offering of 57,000 shares of the Company's Preferred Stock. The Company successfully bid for the purchase of 21,030 shares of the Preferred Stock. During the remainder of 2013, the Company purchased the remaining shares of the preferred stock. See Note 2 in the Consolidated Financial Statements for more information related to the sale of the Preferred Stock.
Liquidity
Liquidity management involves maintaining sufficient cash levels to fund operations and to meet the requirements of borrowers, depositors and creditors. Higher levels of liquidity bear higher corresponding costs, measured in terms of lower yields on short-term, more liquid earning assets and higher interest expense involved in extending liability maturities. Liquid assets include cash and cash
30
Table of Contents
equivalents, loans and securities maturing within one year and money market instruments. In addition, the Company holds approximately $871,215 of AFS securities maturing after one year, which can be sold to meet liquidity needs.
Maintaining a relatively stable funding base, which is achieved by diversifying funding sources, supports liquidity, extends the contractual maturity of liabilities, and limits reliance on volatile short-term purchased funds. Short-term funding needs may arise from declines in deposits or other funding sources, funding of loan commitments and requests for new loans. The Company's strategy is to fund assets to the maximum extent possible with core deposits, which provide a sizable source of relatively stable low-cost funds. The Company defines core deposits as all deposits except certificates of deposits greater than $100. Average core deposits funded approximately 82.2% of total earning assets during 2013 and approximately 80.6% in 2012.
Management believes the Company has sufficient liquidity to meet all reasonable borrower, depositor and creditor needs in the present economic environment. The Company has not received any directives from regulatory authorities that would materially affect liquidity, capital resources or operations.
Contractual Obligations as of December 31, 2013
| | | | | | | | | | | | | | | | |
| | Total
| | Less than
1 Year
| | 1-3 Years
| | 3-5 Years
| | More than
5 Years
| |
|---|
| | |
Time Deposits | | $ | 378,456 | | $ | 239,612 | | $ | 101,604 | | $ | 29,867 | | $ | 7,373 | |
FHLB Advances | | | 247,858 | | | 133,294 | | | 39,805 | | | 74,725 | | | 34 | |
Subordinated Debentures | | | 46,394 | | | — | | | — | | | — | | | 46,394 | |
Other Borrowings | | | 38,594 | | | 38,594 | | | — | | | — | | | — | |
Operating Lease Commitments | | | 4,778 | | | 1,087 | | | 1,590 | | | 856 | | | 1,245 | |
| | | | |
| | | | | | | | | | | | | | | | | |
Total | | $ | 716,080 | | $ | 412,587 | | $ | 142,999 | | $ | 105,448 | | $ | 55,046 | |
| | | | |
| | | | | | | | | | | | | | | | | |
| | | | | | | | | | | | | | | | | |
| | | | |
Off-balance Sheet Arrangements
The Bank incurs off-balance sheet risks in the normal course of business in order to meet the financing needs of its customers. These risks derive from commitments to extend credit and standby letters of credit. Off-balance sheet risk to credit loss exists up to the face amount of these instruments, although material losses are not anticipated. See Note 16 to the Consolidated Financial Statements for additional details on the Company's off-balance sheet arrangements.
Interest Rate Risk Management
Interest rate risk is the exposure of the Company's financial condition to adverse changes in market interest rates. In an effort to estimate the impact of sustained interest rate movements to the Company's earnings, the Company monitors interest rate risk through computer-assisted simulation modeling of its net interest income. The Company's simulation modeling monitors the potential impact to net interest income under various interest rate scenarios. The Company's objective is to actively manage its asset/liability position within a one-year interval and to limit the risk in any of the interest rate scenarios to a reasonable level of tax-equivalent net interest income within that interval. The Company monitors compliance within established guidelines of the Funds Management Policy. See Item 7A. Quantitative and Qualitative Disclosures About Market Risk section for further discussion regarding interest rate risk.
Critical Accounting Policies
The accounting and reporting policies of the Company comply with accounting principles generally accepted in the United States and conform to general practices within the banking industry. These policies require estimates and assumptions. Changes in underlying factors, assumptions, or estimates in any of these areas could have a material impact on the Company's future financial condition and results of operations. In management's opinion, some of these areas have a more significant impact than others on the Company's financial reporting. These areas currently include accounting for securities, the allowance for loan losses, goodwill, income taxes, and mortgage servicing rights.
Securities Valuation and Other Than Temporary Impairment of Securities — Securities available-for-sale are carried at fair value, with unrealized holding gains and losses reported separately in accumulated other comprehensive income (loss), net of tax. In estimating the fair value for the majority of securities, fair values are based on observable market prices of the same or similar investments. The majority of securities are priced by an independent third party pricing service. Equity securities that do not have readily determinable fair values are carried at cost. When the fair value of securities is less than its amortized cost for an extended period, the Company will decide if the security is other than temporarily impaired. If the security is deemed to be other than temporarily impaired, an impairment charge will be recorded through earnings. In determining whether a market value decline is other than temporary, management considers the reason for the decline, the extent of the decline, the duration of the decline and whether the Company intends to sell or believes it will be required to sell the securities prior to recovery.
31
Table of Contents
Allowance for Loan Losses — The level of the allowance for loan losses is based upon management's evaluation of the loan and lease portfolios, past loan loss experience, known and inherent risks in the portfolio, adverse situations that may affect the borrower's ability to repay (including the timing of future payments), the estimated value of any underlying collateral, composition of the loan portfolio, economic conditions, and other pertinent factors. This evaluation is inherently subjective as it requires material estimates including the amounts and timing of future cash flows expected to be received on impaired loans that may be susceptible to significant change. The level of allowance maintained is believed by management to be adequate to cover losses inherent in the portfolio. The allowance is increased by provisions charged to expense and decreased by charge-offs, net of recoveries of amounts previously charged-off.
Goodwill — Goodwill and intangible assets deemed to have indefinite lives are subject to annual impairment tests. The Company has selected June 30 as its date for annual impairment testing, but will test more frequently if circumstances warrant. No goodwill impairment was identified during testing performed in 2013 or 2012.
Income taxes — The Company is subject to the income tax laws of the U.S., its states and the municipalities in which it operates. These tax laws are complex and subject to different interpretations by the taxpayer and the relevant government taxing authorities. The Company reviews income tax expense and the carrying value of deferred tax assets; and as new information becomes available, the balances are adjusted as appropriate. In establishing a provision for income tax expense, the Company makes judgments and interpretations about the application of these inherently complex tax laws and also makes estimates about when in the future certain items will affect taxable income in the various tax jurisdictions.
Mortgage servicing rights — The Company originally records mortgage servicing rights at fair value and amortizes them over the period of the estimated future net servicing income of the underlying loans. The servicing rights are evaluated for impairment based upon the fair value of the rights as compared to the carrying amount. Impairment is determined by stratifying rights into groupings based on predominant risk characteristics, such as interest rate, loan type and investor type. Impairment is recognized through a valuation allowance for an individual grouping, to the extent that fair value is less than the carrying amount.
New Accounting Matters
See Note 1 to the Consolidated Financial Statements regarding the adoption of new accounting standards in 2013.
ITEM 7A. QUANTITATIVE AND QUALITATIVE DISCLOSURES ABOUT MARKET RISK
The Company's exposure to market risk is reviewed on a regular basis by the Credit and Risk Committee of the Board of Directors and by the Boards of Directors of the Company and the Bank. Primary market risks, which impact the Company's operations, are liquidity risk and interest rate risk, as discussed above.
As discussed previously, the Company monitors interest rate risk by the use of computer simulation modeling to estimate the potential impact on its net interest income under various interest rate scenarios. Another method by which the Company's interest rate risk position can be estimated is by computing estimated changes in its net portfolio value ("NPV"). This method estimates interest rate risk exposure from movements in interest rates by using interest rate sensitivity analysis to determine the change in the NPV of discounted cash flows from assets and liabilities. Computations are based on a number of assumptions, including the relative levels of market interest rates and prepayments in mortgage loans and certain types of investments. These computations do not contemplate any actions management may undertake in response to changes in interest rates, and should not be relied upon as indicative of actual results. In addition, certain shortcomings are inherent in the method of computing NPV. Should interest rates remain or decrease below current levels, the proportion of adjustable rate loans could decrease in future periods due to refinancing activity. In the event of an interest rate change, prepayment levels would likely be different from those assumed in the table. Lastly, the ability of many borrowers to repay their adjustable rate debt may decline during a rising interest rate environment.
The following tables provide an assessment of the risk to NPV in the event of sudden and sustained 1% and 2% increases and decreases in prevailing interest rates. The table indicates that as of December 31, 2013 the Company's estimated NPV might be expected to increase in the event of a decrease in prevailing interest rates, and might be expected to generally decrease in the event of an increase in prevailing interest rates (dollars in thousands). As of December 31, 2012 the Company's estimated NPV would generally increase in the event of a decrease in prevailing rates and decrease in the event of an increase in prevailing interest rates.
32
Table of Contents
December 31, 2013
| | | | | | | | | | | | | | | | |
| |
| | $ Amount
| | $ Change
| | NPV Ratio
| | Change
| |
|---|
| | |
| | | | +2% | | | 464,119 | | | (79,747 | ) | | 17.28% | | | (155 | ) |
| | | | +1% | | | 502,188 | | | (41,678 | ) | | 18.06% | | | (77 | ) |
| | | | Base | | | 543,866 | | | — | | | 18.83% | | | — | |
| | | | -1% | | | 564,909 | | | 21,043 | | | 18.91% | | | 8 | |
| | | | -2% | | | 590,260 | | | 46,394 | | | 19.11% | | | 28 | |
December 31, 2012
| | | | | | | | | | | | | | | | |
| |
| | $ Amount
| | $ Change
| | NPV Ratio
| | Change
| |
|---|
| | |
| | | | +2% | | | 585,912 | | | (67,797 | ) | | 21.22% | | | (88 | ) |
| | | | +1% | | | 619,214 | | | (34,495 | ) | | 21.69% | | | (41 | ) |
| | | | Base | | | 653,709 | | | — | | | 22.10% | | | — | |
| | | | -1% | | | 668,411 | | | 14,702 | | | 21.91% | | | (19 | ) |
| | | | -2% | | | 771,237 | | | 117,528 | | | 24.35% | | | 225 | |
The above discussion, and the portions of "Management's Discussion and Analysis" in Item 7 of this Report that are referenced in the above discussion contains statements relating to future results of the Company that are considered "forward-looking-statements" within the meaning of the Private Securities Litigation Reform Act of 1995. These statements relate to, among other things, simulation of the impact on net interest income from changes in interest rates. Actual results may differ materially from those expressed or implied therein as a result of certain risks and uncertainties, including those risks and uncertainties expressed above, those that are described in "Management's Discussion and Analysis" in Item 7 of this Report, those that are described in Item 1 of this Report, "Business," under the caption "Forward-Looking-Statements," and those that are described in Item 1A of this Report, "Risk Factors", all of which discussions are incorporated herein by reference.
33
Table of Contents
ITEM 8. FINANCIAL STATEMENTS AND SUPPLEMENTARY DATA

REPORT OF INDEPENDENT REGISTERED PUBLIC ACCOUNTING FIRM
Board of Directors and Shareholders
MainSource Financial Group, Inc.
Greensburg, Indiana
We have audited the accompanying consolidated balance sheets of MainSource Financial Group, Inc. as of December 31, 2013 and 2012 and the related consolidated statements of income, comprehensive income, shareholders' equity, and cash flows for each of the three years in the period ended December 31, 2013. We also have audited MainSource Financial Group, Inc.'s internal control over financial reporting as of December 31, 2013, based on criteria established in the 1992Internal Control — Integrated Framework issued by the Committee of Sponsoring Organizations of the Treadway Commission (COSO). MainSource Financial Group, Inc.'s management is responsible for these financial statements, for maintaining effective internal control over financial reporting, and for its assessment of the effectiveness of internal control over financial reporting, included in the accompanying Management's Report on Internal Control over Financial Reporting. Our responsibility is to express an opinion on these financial statements and an opinion on the company's internal control over financial reporting based on our audits.
We conducted our audits in accordance with the standards of the Public Company Accounting Oversight Board (United States). Those standards require that we plan and perform the audits to obtain reasonable assurance about whether the financial statements are free of material misstatement and whether effective internal control over financial reporting was maintained in all material respects. Our audits of the financial statements included examining, on a test basis, evidence supporting the amounts and disclosures in the financial statements, assessing the accounting principles used and significant estimates made by management, and evaluating the overall financial statement presentation. Our audit of internal control over financial reporting included obtaining an understanding of internal control over financial reporting, assessing the risk that a material weakness exists, and testing and evaluating the design and operating effectiveness of internal control based on the assessed risk. Our audits also included performing such other procedures as we considered necessary in the circumstances. We believe that our audits provide a reasonable basis for our opinions.
A company's internal control over financial reporting is a process designed to provide reasonable assurance regarding the reliability of financial reporting and the preparation of financial statements for external purposes in accordance with generally accepted accounting principles. A company's internal control over financial reporting includes those policies and procedures that (1) pertain to the maintenance of records that, in reasonable detail, accurately and fairly reflect the transactions and dispositions of the assets of the company; (2) provide reasonable assurance that transactions are recorded as necessary to permit preparation of financial statements in accordance with generally accepted accounting principles, and that receipts and expenditures of the company are being made only in accordance with authorizations of management and directors of the company; and (3) provide reasonable assurance regarding prevention or timely detection of unauthorized acquisition, use, or disposition of the company's assets that could have a material effect on the financial statements.
Because of its inherent limitations, internal control over financial reporting may not prevent or detect misstatements. Also, projections of any evaluation of effectiveness to future periods are subject to the risk that controls may become inadequate because of changes in conditions, or that the degree of compliance with the policies or procedures may deteriorate.
In our opinion, the consolidated financial statements referred to above present fairly, in all material respects, the financial position of MainSource Financial Group, Inc. as of December 31, 2013 and 2012, and the results of its operations and its cash flows for each of the three years in the period ended December 31, 2013, in conformity with accounting principles generally accepted in the United States of America. Also in our opinion, MainSource Financial Group, Inc. maintained, in all material respects, effective internal control over financial reporting as of December 31, 2013, based on criteria established in the 1992Internal Control — Integrated Framework issued by the COSO.
| | |
| | | /s/ Crowe Horwath LLP |
Indianapolis, Indiana
March 14, 2014 |
|
|
34
Table of Contents
MAINSOURCE FINANCIAL GROUP, INC.
CONSOLIDATED BALANCE SHEETS
(Dollar amounts in thousands except per share data)
| | | | | | | |
| | December 31,
2013
| | December 31,
2012
| |
|---|
| | |
Assets | | | | | | | |
Cash and due from banks | | $ | 55,826 | | $ | 58,100 | |
Money market funds and federal funds sold | | | 5,494 | | | 7,550 | |
| | | | |
| | | | | | | | |
Cash and cash equivalents | | | 61,320 | | | 65,650 | |
Securities available for sale | | | 891,106 | | | 902,341 | |
Loans held for sale | | | 5,999 | | | 17,025 | |
Loans, net of allowance for loan losses of $27,609 and $32,227 | | | 1,644,317 | | | 1,521,156 | |
Restricted stock, at cost | | | 15,629 | | | 15,639 | |
Premises and equipment, net | | | 55,957 | | | 54,101 | |
Goodwill | | | 64,900 | | | 63,947 | |
Purchased intangible assets | | | 5,125 | | | 6,993 | |
Cash surrender value of life insurance | | | 61,292 | | | 59,410 | |
Interest receivable and other assets | | | 54,219 | | | 63,026 | |
| | | | |
| | | | | | | | |
Total assets | | $ | 2,859,864 | | $ | 2,769,288 | |
| | | | |
| | | | | | | | |
| | | | | | | | |
| | | | |
Liabilities | | |
| | |
| |
Deposits | | | | | | | |
Noninterest bearing | | $ | 436,550 | | $ | 405,167 | |
Interest bearing | | | 1,764,078 | | | 1,779,887 | |
| | | | |
| | | | | | | | |
Total deposits | | | 2,200,628 | | | 2,185,054 | |
Other borrowings | | | 38,594 | | | 34,519 | |
Federal Home Loan Bank (FHLB) advances | | | 247,858 | | | 141,052 | |
Subordinated debentures | | | 46,394 | | | 50,418 | |
Other liabilities | | | 20,864 | | | 34,494 | |
| | | | |
| | | | | | | | |
Total liabilities | | | 2,554,338 | | | 2,445,537 | |
Commitments and contingent liabilities (Notes 1 and 16) | | |
| | |
| |
Shareholders' equity | | |
| | |
| |
Preferred stock, no par value | | | | | | | |
Authorized shares — 400,000 and 400,000 | | | | | | | |
Issued shares — 0 and 57,000; | | | | | | | |
Outstanding shares — 0 and 15,100 | | | | | | | |
Aggregate liquidation preference $0 and $15,100 | | | — | | | 14,918 | |
Common stock $.50 stated value: | | | | | | | |
Authorized shares — 100,000,000 | | | | | | | |
Issued shares — 20,940,298 and 20,859,027 | | | | | | | |
Outstanding shares — 20,417,224 and 20,304,525 | | | 10,508 | | | 10,450 | |
Treasury stock — 523,074 and 554,502 shares, at cost | | | (8,495 | ) | | (9,043 | ) |
Additional paid-in capital | | | 224,793 | | | 224,096 | |
Retained earnings | | | 77,586 | | | 57,602 | |
Accumulated other comprehensive income | | | 1,134 | | | 25,728 | |
| | | | |
| | | | | | | | |
Total shareholders' equity | | | 305,526 | | | 323,751 | |
| | | | |
| | | | | | | | |
Total liabilities and shareholders' equity | | $ | 2,859,864 | | $ | 2,769,288 | |
| | | | |
| | | | | | | | |
| | | | | | | | |
| | | | |
The accompanying notes are an integral part of these consolidated financial statements.
35
Table of Contents
MAINSOURCE FINANCIAL GROUP, INC.
CONSOLIDATED STATEMENTS OF INCOME
YEARS ENDED DECEMBER 31, 2013, 2012, AND 2011
(Dollar amounts in thousands except per share data)
| | | | | | | | | | |
| | 2013
| | 2012
| | 2011
| |
|---|
| | |
Interest income | | | | | | | | | | |
Loans, including fees | | $ | 77,095 | | $ | 83,934 | | $ | 92,941 | |
Securities | | | | | | | | | | |
Taxable | | | 11,873 | | | 12,510 | | | 16,040 | |
Tax exempt | | | 12,247 | | | 12,160 | | | 12,415 | |
Other interest income | | | 64 | | | 164 | | | 215 | |
| | | | |
| | | | | | | | | | | |
Total interest income | | | 101,279 | | | 108,768 | | | 121,611 | |
| | | | |
| | | | | | | | | | | |
Interest expense | | | | | | | | | | |
Deposits | | | 4,927 | | | 7,637 | | | 14,111 | |
Federal Home Loan Bank advances | | | 3,307 | | | 5,120 | | | 5,754 | |
Subordinated debentures | | | 1,675 | | | 1,825 | | | 1,737 | |
Other borrowings | | | 70 | | | 104 | | | 161 | |
| | | | |
| | | | | | | | | | | |
Total interest expense | | | 9,979 | | | 14,686 | | | 21,763 | |
| | | | |
| | | | | | | | | | | |
Net interest income | | | 91,300 | | | 94,082 | | | 99,848 | |
Provision for loan losses | | | 4,534 | | | 9,850 | | | 17,800 | |
| | | | |
| | | | | | | | | | | |
Net interest income after provision for loan losses | | | 86,766 | | | 84,232 | | | 82,048 | |
Non-interest income | | | | | | | | | | |
Service charges on deposit accounts | | | 20,427 | | | 19,815 | | | 18,147 | |
Interchange income | | | 7,056 | | | 6,540 | | | 6,225 | |
Mortgage banking | | | 6,799 | | | 9,927 | | | 5,551 | |
Trust and investment product fees | | | 4,756 | | | 3,650 | | | 3,250 | |
Increase in cash surrender value of life insurance | | | 1,378 | | | 1,206 | | | 1,200 | |
Net realized gains on securities (includes $835, $1,867, and $11,357 accumulated other comprehensive income (AOCI) reclassifications for realized net gains on available for sale securities) | | | 835 | | | 1,867 | | | 11,357 | |
(Loss) on sale and write-down of OREO | | | (539 | ) | | (1,359 | ) | | (2,744 | ) |
Other-than-temporary loss | | | | | | | | | | |
Total impairment loss | | | — | | | (500 | ) | | — | |
Loss recognized in other comprehensive income | | | — | | | — | | | — | |
| | | | |
| | | | | | | | | | | |
Net impairment loss recognized in earnings | | | — | | | (500 | ) | | — | |
Other income | | | 2,417 | | | 2,745 | | | 2,322 | |
| | | | |
| | | | | | | | | | | |
Total non-interest income | | | 43,129 | | | 43,891 | | | 45,308 | |
Non-interest expense | | | | | | | | | | |
Salaries and employee benefits | | | 52,165 | | | 48,990 | | | 49,950 | |
Net occupancy | | | 7,139 | | | 6,769 | | | 6,686 | |
Equipment | | | 9,931 | | | 8,564 | | | 7,822 | |
Intangibles amortization | | | 1,868 | | | 1,835 | | | 1,939 | |
Telecommunications | | | 1,796 | | | 1,729 | | | 1,991 | |
Stationery printing and supplies | | | 1,190 | | | 1,337 | | | 1,510 | |
FDIC assessment | | | 1,711 | | | 2,495 | | | 3,974 | |
Marketing | | | 3,660 | | | 4,397 | | | 4,057 | |
Collection expense | | | 3,300 | | | 3,768 | | | 4,334 | |
Prepayment penalty on FHLB advance | | | 2,239 | | | 1,313 | | | — | |
Consultant expense | | | 1,582 | | | 1,150 | | | 6,547 | |
Interchange expense | | | 1,918 | | | 1,591 | | | 1,465 | |
Other expenses | | | 9,732 | | | 10,900 | | | 9,530 | |
| | | | |
| | | | | | | | | | | |
Total non-interest expense | | | 98,231 | | | 94,838 | | | 99,805 | |
| | | | |
| | | | | | | | | | | |
Income before income tax | | | 31,664 | | | 33,285 | | | 27,551 | |
Income tax expense (includes $284, $635, and $3,861 income tax expense from AOCI reclassification items) | | | 5,319 | | | 6,027 | | | 3,738 | |
| | | | |
| | | | | | | | | | | |
Net income | | $ | 26,345 | | $ | 27,258 | | $ | 23,813 | |
Preferred dividends and discount accretion | | | (504 | ) | | (2,110 | ) | | (3,054 | ) |
Redemption of preferred stock | | | (148 | ) | | 1,357 | | | — | |
| | | | |
| | | | | | | | | | | |
Net income attributable to common shareholders | | $ | 25,693 | | $ | 26,505 | | $ | 20,759 | |
| | | | |
| | | | | | | | | | | |
| | | | | | | | | | | |
| | | | |
Net income per common share: | | | | | | | | | | |
Basic | | $ | 1.26 | | $ | 1.31 | | $ | 1.03 | |
Diluted | | $ | 1.26 | | $ | 1.30 | | $ | 1.03 | |
The accompanying notes are an integral part of these consolidated financial statements.
36
Table of Contents
MAINSOURCE FINANCIAL GROUP, INC.
CONSOLIDATED STATEMENTS OF COMPREHENSIVE INCOME
YEARS ENDED DECEMBER 31, 2013, 2012, AND 2011
(Dollar amounts in thousands except per share data)
| | | | | | | | | | |
| | 2013
| | 2012
| | 2011
| |
|---|
| | |
Net income | | $ | 26,345 | | $ | 27,258 | | $ | 23,813 | |
Other comprehensive income/(loss): | | | | | | | | | | |
Unrealized holding gains/(losses) on securities available for sale | | | (37,001 | ) | | 5,731 | | | 32,025 | |
Reclassification adjustment for (gains) included in net income | | | (835 | ) | | (1,867 | ) | | (11,357 | ) |
Reclassification adjustment for other than temporary loss included in net income | | | — | | | 500 | | | — | |
Tax effect | | | 13,242 | | | (1,528 | ) | | (7,234 | ) |
| | | | |
| | | | | | | | | | | |
Other comprehensive income/(loss) | | | (24,594 | ) | | 2,836 | | | 13,434 | |
| | | | |
| | | | | | | | | | | |
Comprehensive income | | $ | 1,751 | | $ | 30,094 | | $ | 37,247 | |
| | | | |
| | | | | | | | | | | |
| | | | | | | | | | | |
| | | | |
The accompanying notes are an integral part of these consolidated financial statements.
37
Table of Contents
MAINSOURCE FINANCIAL GROUP, INC.
CONSOLIDATED STATEMENTS OF SHAREHOLDERS' EQUITY
YEARS ENDED DECEMBER 31, 2013, 2012, AND 2011
(Dollar amounts in thousands except per share data)
| | | | | | | | | | | | | | | | | | | | | | | | | |
| |
| | Common Stock | |
| |
| |
| |
| |
| |
|---|
| |
| |
| | Additional
Paid-in
Capital
| |
| | Accumulated
Other
Comprehensive
Income/(Loss)
| |
| |
|---|
| | Preferred
Stock
| | Shares
Outstanding
| | Amount
| | Treasury
Stock
| | Retained
Earnings
| �� | Total
| |
|---|
| | |
Balance, January 1, 2011 | | $ | 56,183 | | | 20,136,188 | | $ | 10,394 | | $ | (9,367 | ) | $ | 223,134 | | $ | 12,768 | | $ | 9,458 | | $ | 302,570 | |
Net income | | | | | | | | | | | | | | | | | | 23,813 | | | | | | 23,813 | |
Other comprehensive income | | | | | | | | | | | | | | | | | | | | | 13,434 | | | 13,434 | |
Stock option expense | | | | | | | | | | | | | | | 72 | | | | | | | | | 72 | |
Dividends — common stock ($.04 per share) | | | | | | | | | | | | | | | | | | (807 | ) | | | | | (807 | ) |
Restricted stock award | | | | | | 46,244 | | | 5 | | | | | | 96 | | | | | | | | | 101 | |
Director retainer award | | | | | | 23,782 | | | 12 | | | | | | 208 | | | | | | | | | 220 | |
Dividends — preferred stock | | | | | | | | | | | | | | | | | | (2,850 | ) | | | | | (2,850 | ) |
Accretion of preferred stock discount | | | 204 | | | | | | | | | | | | | | | (204 | ) | | | | | — | |
| | | | |
| | | | | | | | | | | | | | | | | | | | | | | | | | |
Balance, December 31, 2011 | | | 56,387 | | | 20,206,214 | | | 10,411 | | | (9,367 | ) | | 223,510 | | | 32,720 | | | 22,892 | | | 336,553 | |
| | | | |
| | | | | | | | | | | | | | | | | | | | | | | | | | |
Net income | | | | | | | | | | | | | | | | | | 27,258 | | | | | | 27,258 | |
Other comprehensive income | | | | | | | | | | | | | | | | | | | | | 2,836 | | | 2,836 | |
Stock option exercise | | | | | | 19,900 | | | 10 | | | 324 | | | (214 | ) | | | | | | | | 120 | |
Stock option expense | | | | | | | | | | | | | | | 169 | | | | | | | | | 169 | |
Dividends — common stock ($.08 per share) | | | | | | | | | | | | | | | | | | (1,623 | ) | | | | | (1,623 | ) |
Restricted stock award | | | | | | 48,061 | | | 14 | | | | | | 308 | | | | | | | | | 322 | |
Director retainer award | | | | | | 30,350 | | | 15 | | | | | | 323 | | | | | | | | | 338 | |
Dividends — preferred stock | | | | | | | | | | | | | | | | | | (1,967 | ) | | | | | (1,967 | ) |
Repurchase of preferred shares | | | (41,612 | ) | | | | | | | | | | | | | | 1,357 | | | | | | (40,255 | ) |
Accretion of preferred stock discount | | | 143 | | | | | | | | | | | | | | | (143 | ) | | | | | — | |
| | | | |
| | | | | | | | | | | | | | | | | | | | | | | | | | |
Balance, December 31, 2012 | | | 14,918 | | | 20,304,525 | | | 10,450 | | | (9,043 | ) | | 224,096 | | | 57,602 | | | 25,728 | | | 323,751 | |
| | | | |
| | | | | | | | | | | | | | | | | | | | | | | | | | |
Net income | | | | | | | | | | | | | | | | | | 26,345 | | | | | | 26,345 | |
Other comprehensive loss | | | | | | | | | | | | | | | | | | | | | (24,594 | ) | | (24,594 | ) |
Purchase of treasury stock | | | | | | (14,796 | ) | | | | | (204 | ) | | | | | | | | | | | (204 | ) |
Stock option exercise | | | | | | 46,224 | | | 23 | | | 752 | | | (386 | ) | | | | | | | | 389 | |
Stock option expense | | | | | | | | | | | | | | | 161 | | | | | | | | | 161 | |
Dividends — common stock ($.28 per share) | | | | | | | | | | | | | | | | | | (5,709 | ) | | | | | (5,709 | ) |
Restricted stock award | | | | | | 47,971 | | | 21 | | | | | | 569 | | | | | | | | | 590 | |
Director retainer award | | | | | | 33,300 | | | 14 | | | | | | 353 | | | | | | | | | 367 | |
Dividends — preferred stock | | | | | | | | | | | | | | | | | | (470 | ) | | | | | (470 | ) |
Repurchase of preferred shares | | | (14,952 | ) | | | | | | | | | | | | | | (148 | ) | | | | | (15,100 | ) |
Accretion of preferred stock discount | | | 34 | | | | | | | | | | | | | | | (34 | ) | | | | | — | |
| | | | |
| | | | | | | | | | | | | | | | | | | | | | | | | | |
Balance, December 31, 2013 | | $ | — | | | 20,417,224 | | $ | 10,508 | | $ | (8,495 | ) | $ | 224,793 | | $ | 77,586 | | $ | 1,134 | | $ | 305,526 | |
| | | | |
| | | | | | | | | | | | | | | | | | | | | | | | | | |
| | | | | | | | | | | | | | | | | | | | | | | | | | |
| | | | |
The accompanying notes are an integral part of these consolidated financial statements.
38
Table of Contents
MAINSOURCE FINANCIAL GROUP, INC.
CONSOLIDATED STATEMENTS OF CASH FLOWS
YEARS ENDED DECEMBER 31, 2013, 2012, AND 2011
(Dollars in thousands)
| | | | | | | | | | |
| | 2013
| | 2012
| | 2011
| |
|---|
| | |
Operating Activities | | | | | | | | | | |
Net income | | $ | 26,345 | | $ | 27,258 | | $ | 23,813 | |
Adjustments to reconcile net income to net cash provided by operating activities: | | | | | | | | | | |
Provision for loan losses | | | 4,534 | | | 9,850 | | | 17,800 | |
Depreciation expense | | | 5,783 | | | 5,440 | | | 5,074 | |
Amortization of mortgage servicing rights | | | 1,472 | | | 1,964 | | | 1,388 | |
(Recovery)/additional impairment of valuation allowance on mortgage servicing rights | | | (750 | ) | | 676 | | | (45 | ) |
Securities amortization, net | | | 3,031 | | | 4,717 | | | 2,693 | |
Amortization of purchased intangible assets | | | 1,868 | | | 1,835 | | | 1,939 | |
Earnings on cash surrender value of life insurance policies | | | (1,378 | ) | | (1,206 | ) | | (1,200 | ) |
Gain on life insurance benefit | | | — | | | — | | | (141 | ) |
Securities gains, net of impairment | | | (835 | ) | | (1,367 | ) | | (11,357 | ) |
Gain on loans sold | | | (5,464 | ) | | (7,068 | ) | | (3,494 | ) |
Loans originated for sale | | | (218,288 | ) | | (246,596 | ) | | (195,344 | ) |
Proceeds from loan sales | | | 234,778 | | | 253,259 | | | 188,063 | |
Stock based compensation expense | | | 751 | | | 491 | | | 173 | |
Stock portion of director retainer fee expense | | | 367 | | | 338 | | | 220 | |
Loss on sale and write-down of OREO | | | 539 | | | 1,359 | | | 2,744 | |
Prepayment penalty on FHLB advance | | | 2,239 | | | 1,313 | | | — | |
Change in other assets and liabilities | | | 5,091 | | | 1,916 | | | 3,734 | |
| | | | |
| | | | | | | | | | | |
Net cash provided by operating activities | | | 60,083 | | | 54,179 | | | 36,060 | |
Investing Activities | | |
| | |
| | |
| |
Purchases of securities available for sale | | | (233,958 | ) | | (220,543 | ) | | (527,834 | ) |
Proceeds from calls, maturities, and payments on securities available for sale | | | 125,010 | | | 131,130 | | | 120,588 | |
Proceeds from sales of securities available for sale | | | 80,151 | | | 64,176 | | | 366,559 | |
Loan originations and payments, net | | | (128,650 | ) | | (15,060 | ) | | 102,983 | |
Purchases of premises and equipment | | | (7,631 | ) | | (7,387 | ) | | (6,865 | ) |
Proceeds from sale of OREO | | | 6,023 | | | 12,706 | | | 16,346 | |
Purchase of life insurance policies | | | (504 | ) | | (10,000 | ) | | — | |
Proceeds from redemption of restricted stock | | | 10 | | | 217 | | | 3,646 | |
Proceeds from life insurance benefit | | | — | | | — | | | 893 | |
Cash received from branch acquisitions, net | | | 18,157 | | | 5,464 | | | — | |
| | | | |
| | | | | | | | | | | |
Net cash provided/(used) by investing activities | | | (141,392 | ) | | (39,297 | ) | | 76,316 | |
Financing Activities | | |
| | |
| | |
| |
Net change in deposits | | | (6,594 | ) | | (11,709 | ) | | (51,664 | ) |
Net change in other borrowings | | | 4,075 | | | 8,730 | | | (7,392 | ) |
Proceeds from FHLB advances | | | 665,000 | | | 95,000 | | | 15,000 | |
Repayment of FHLB advances | | | (560,433 | ) | | (106,688 | ) | | (15,638 | ) |
Cash dividends on preferred stock | | | (470 | ) | | (1,967 | ) | | (2,850 | ) |
Cash dividends on common stock | | | (5,709 | ) | | (1,623 | ) | | (807 | ) |
Purchase of treasury shares | | | (204 | ) | | — | | | — | |
Repurchase of preferred stock | | | (15,100 | ) | | (40,255 | ) | | — | |
Repayment of subordinated debentures, net | | | (4,000 | ) | | — | | | — | |
Proceeds from exercise of stock options, including tax benefit | | | 414 | | | 132 | | | — | |
| | | | |
| | | | | | | | | | | |
Net cash provided/(used) by financing activities | | | 76,979 | | | (58,380 | ) | | (63,351 | ) |
| | | | |
| | | | | | | | | | | |
Net change in cash and cash equivalents | | | (4,330 | ) | | (43,498 | ) | | 49,025 | |
Cash and cash equivalents, beginning of year | | | 65,650 | | | 109,148 | | | 60,123 | |
| | | | |
| | | | | | | | | | | |
Cash and cash equivalents, end of year | | $ | 61,320 | | $ | 65,650 | | $ | 109,148 | |
| | | | |
| | | | | | | | | | | |
| | | | | | | | | | | |
| | | | |
Supplemental cash flow information | | | | | | | | | | |
Interest paid | | $ | 10,375 | | $ | 15,382 | | $ | 23,263 | |
Income taxes paid | | | 2,400 | | | 3,893 | | | 2,672 | |
Supplemental non cash disclosure | | | | | | | | | | |
Loan balances transferred to foreclosed real estate | | | 4,005 | | | 5,286 | | | 23,093 | |
See Note 26 regarding non-cash transactions included in acquisitions.
The accompanying notes are an integral part of these consolidated financial statements.
39
Table of Contents
NOTES TO THE CONSOLIDATED FINANCIAL STATEMENTS
(Dollar amounts in thousands except per share data)
NOTE 1 — SUMMARY OF SIGNIFICANT ACCOUNTING POLICIES
Nature of Operations and Principles of Consolidation: The consolidated financial statements include MainSource Financial Group, Inc. and its wholly owned subsidiaries, together referred to as "the Company". Intercompany transactions and balances are eliminated in consolidation.
The Company's wholly owned subsidiaries include MainSource Bank ("the Bank"), MainSource Title, LLC, MainSource Insurance, LLC, Insurance Services Marketing, LLC, and MainSource Risk Management.
The Company provides financial services through its offices in Indiana, Illinois, Ohio, and Kentucky. Its primary deposit products are checking, savings, and term certificate accounts, and its primary lending products are residential mortgage, commercial, and installment loans. Substantially all loans are secured by specific items of collateral including business assets, consumer assets and real estate. Other financial instruments which potentially represent concentrations of credit risk include deposit accounts in other financial institutions and federal funds sold. See the Loan Policy section for further discussion on loan information.
Use of Estimates: To prepare financial statements in conformity with U. S. generally accepted accounting principles, management makes estimates and assumptions based on available information. These estimates and assumptions affect the amounts reported in the financial statements and the disclosures provided and actual results could differ. The allowance for loan losses, carrying value of goodwill, loan servicing rights, other real estate owned, deferred tax assets and fair values of financial instruments are particularly subject to change.
Cash Flows: Cash and cash equivalents include cash and due from banks, interest bearing deposits with other financial institutions with maturities under 90 days, money market funds and federal funds sold. Net cash flows are reported for loan and deposit transactions, federal funds purchased and repurchase agreements.
Securities: Securities are classified as available for sale when they might be sold before maturity. Securities available for sale are carried at fair value, with unrealized holding gains and losses reported in other comprehensive income/(loss), net of tax.
Interest income includes amortization of purchase premium or discount. Premiums and discounts on securities are amortized on the level-yield method, which considers prepayments only on mortgage-backed securities. Gains and losses on sales are recorded on the trade date and are based on the amortized cost of the security sold. The Company evaluates securities for other-than-temporary impairment ("OTTI") at least on a quarterly basis, and more frequently when economic or market conditions warrant such an evaluation. For securities in an unrealized loss position, management considers the extent and duration of the unrealized loss, and the financial condition and near-term prospects of the issuer. Management also assesses whether it intends to sell, or it is more likely than not that it will be required to sell, a security in an unrealized loss position before recovery of its amortized cost basis. If either of the criteria regarding intent or requirement to sell is met, the entire difference between amortized cost and fair value is recognized as impairment through earnings. For debt securities that do not meet the aforementioned criteria, the amount of impairment is split into two components as follows: 1) OTTI related to credit loss, which must be recognized in the income statement and 2) OTTI related to other factors, which is recognized in other comprehensive income. The credit loss is defined as the difference between the present value of the cash flows expected to be collected and the amortized cost basis. For equity securities, the entire amount of impairment is recognized through earnings.
Loans Held for Sale: Loans originated and intended for sale in the secondary market are carried at the lower of cost or market in the aggregate, as determined by outstanding commitments from investors. Net unrealized losses, if any, are recorded as a valuation allowance and charged to earnings.
Mortgage loans held for sale are generally sold with servicing rights retained. The carrying value of mortgage loans sold is reduced by the amount allocated to the servicing right. Gains and losses on sales of mortgage loans are based on the difference between the selling price and the carrying value of the related loan sold.
Loans: Loans that management has the intent and ability to hold for the foreseeable future or until maturity or payoff are reported at the principal balance outstanding, net of purchase premiums or discounts, unearned interest, deferred loan fees and costs, and an allowance for loan losses. Interest income is accrued on the unpaid principal balance. Loan origination fees, net of certain direct origination costs, are deferred and recognized in interest income using the level-yield method without anticipating prepayments.
For all classes of financing receivables, interest income is not reported when full loan repayment is in doubt, typically when the loan is impaired or payments are past due over 90 days. Past due status is based on the contractual terms of the loan. Loans are placed on non-accrual or charged-off at an earlier date if collection of principal or interest is considered doubtful.
40
Table of Contents
For all classes of financing receivables, interest accrued but not received for loans placed on non-accrual is reversed against interest income. Payments received on such loans subsequent to being placed on non-accrual are applied to the principal balance of the loans. Loans are returned to accrual status when all the principal and interest amounts contractually due are brought current and future payments are reasonably assured. Non-accrual loans and loans past due 90 days still on accrual include both smaller balance homogeneous loans that are collectively evaluated for impairment and individually classified impaired loans. Troubled Debt Restructurings, ("TDRs"), normally follow the same guidelines as regular loans in placing on non-accrual status.
Allowance for Loan Losses: The allowance for loan losses is a valuation allowance for probable incurred credit losses. Loan losses are charged against the allowance when management believes the uncollectibility of a loan balance is confirmed. Subsequent recoveries, if any, are credited to the allowance. Management estimates the allowance balance required using past loan loss experience, the nature and volume of the portfolio, information about specific borrower situations and estimated collateral values, economic conditions, and other factors. Allocations of the allowance may be made for specific loans, but the entire allowance is available for any loan that, in management's judgment, should be charged-off.
The allowance consists of specific and general components. The specific component relates to loans that are individually classified as impaired. The general component covers non-impaired loans and is based on historical loss experience adjusted for current factors. The historical loss experience is determined by portfolio segment and is based on the actual loss history experienced by the Company over the most recent 3 years. This actual loss experience is supplemented with other economic factors based on the risks present for each portfolio segment. These economic factors include consideration of the following: levels of and trends in delinquencies and impaired loans; levels of and trends in charge-offs and recoveries; trends in volume and terms of loans; effects of any changes in risk selection and underwriting standards; other changes in lending policies, procedures, and practices; experience, ability, and depth of lending management and other relevant staff; national and local economic trends and conditions; industry conditions; and effects of changes in credit concentrations
For allowance purposes, the following portfolio segments have been identified: Commercial, Commercial Real Estate ("CRE"), Residential and Consumer. The classes within the Commercial portfolio are commercial and industrial and agricultural. The classes within the Commercial Real Estate portfolio are farm, hotel, construction and development, and other. The classes within the Residential portfolio are 1-4 family and home equity. Finally, the classes within the Consumer portfolio are direct and indirect.
The risk characteristics of each loan portfolio segment are as follows:
Commercial
The commercial portfolio contains commercial and industrial and agricultural loans. Commercial loans are made to commercial customers for use in normal business operations to finance working capital needs, equipment purchases, agricultural financing, or other projects and are repaid from operations of the business. The majority of these borrowers are customers doing business within the Company's geographic regions. Commercial loans are generally underwritten individually and secured with the assets of the company and/or the personal guarantee of the business owners. In the case of loans secured by accounts receivable, the availability of funds for the repayment of these loans may be substantially dependent on the ability of the borrower to collect amounts due from its customers.
Commercial real estate
Commercial real estate loans consist of loans for income-producing real estate properties and real estate developers. The Company mitigates its risk on these loans by requiring collateral values that exceed the loan amount and underwriting the loan with projected cash flow in excess of the debt service requirement. These loans are made to finance properties such as apartment buildings, office and industrial buildings, hotels, farm real estate, and retail shopping centers; and are repaid through cash flows related to the operation, sale, or refinance of the property.
Residential
The residential portfolio contains residential mortgage and home equity loans. Residential mortgage loans represent loans to consumers for the purchase or refinance of a residence. These loans are generally financed over a 15- to 30- year term, and in most cases, are extended to borrowers to finance their primary residence. Residential loans are secured by the residence being financed. For residential loans that are secured by 1-4 family residences and are generally owner occupied, the Company generally establishes a maximum loan-to-value ratio and requires private mortgage insurance if that ratio is exceeded. Home equity lending includes both home equity loans and lines-of-credit. This type of lending, which is secured by a first- or second- lien on the borrower's residence, allows customers to borrow against the equity in their home. Repayment of these loans is primarily dependent on the personal income of the borrowers, which can be impacted by economic conditions in their market areas such as unemployment levels. Repayment can also be impacted by changes in property values on residential properties. Risk is mitigated by the fact that the loans are of smaller individual amounts and spread over a large number of borrowers.
41
Table of Contents
Consumer
The consumer portfolio consists of direct and indirect installment loans. The largest percentage of the direct consumer loans are automobile loans and the automobile or other vehicle is normally used as collateral for the loan. The Company no longer writes any indirect loans. These loans are generally financed over a short (3-7 year) time horizon. Similar to the residential loans above, repayment of these loans is primarily dependent on the personal income of the borrowers, which can be impacted by economic conditions in their market areas such as unemployment levels. Risk is mitigated by the fact that the loans are of smaller individual amounts and spread over a large number of borrowers.
All loans are charged off when the Company has determined that future collectability of the entire loan balance is doubtful. For commercial and commercial real estate loans, collateral dependent loans are written down to the discounted fair value of the collateral.
A loan is considered impaired when, based on current information and events, it is probable that the Company will be unable to collect the scheduled payments of principal or interest when due according to the contractual terms of the loan agreement. Loans that experience insignificant payment delays and payment shortfalls generally are not classified as impaired. Management determines the significance of payment delays and payment shortfalls on a case-by-case basis, taking into consideration all of the circumstances surrounding the loan and the borrower, including the length of the delay, the reasons for the delay, the borrower's prior payment record, and the amount of the shortfall in relation to the principal and interest owed. Loans, for which the terms have been modified, and for which the borrower is experiencing financial difficulties, are considered troubled debt restructurings and classified as impaired. Impairment is measured on a loan by loan basis for commercial and commercial real estate loans by either the present value of expected future cash flows discounted at the loan's effective interest rate, the loan's obtainable market price, or the fair value of the collateral if the loan is collateral dependent. Large groups of smaller balance homogeneous loans are collectively evaluated for impairment. Accordingly, the Company does not separately identify individual consumer and residential real estate loans for impairment disclosures. A specific reserve is established as a component of the allowance when a loan has been determined to be impaired for all commercial and commercial real estate loans greater than $250.
Federal Home Loan Bank (FHLB) Stock: The Bank is a member of the Federal Home Loan Bank ("FHLB") system. Members are required to own a certain amount of stock based on the level of borrowings and other factors, and may invest in additional amounts. FHLB stock is carried at cost, classified as a restricted security, and periodically evaluated for impairment based on ultimate recovery of par value. Both cash and stock dividends are reported as income.
Premises and Equipment: Land is carried at cost. Premises and equipment are stated at cost less accumulated depreciation. Buildings and related components are depreciated using the straight-line method with useful lives ranging from 30 to 39 years for buildings and 5 to 15 years for related components. Furniture, fixtures and equipment are depreciated using the straight-line method with useful lives ranging from 3 to 10 years.
Foreclosed Assets: Assets acquired through or instead of loan foreclosure are initially recorded at fair value net of estimated selling costs when acquired, establishing a new cost basis. If fair value declines after acquisition, a valuation allowance is recorded through expense. Costs after acquisition are expensed.
Company Owned Life Insurance: The Company has purchased life insurance policies on certain employees. Company owned life insurance is recorded at the amount that can be realized under the insurance contract at the balance sheet date, which is the cash surrender value adjusted for other charges or other amounts due that are probable at settlement.
Servicing Assets: Servicing rights are recognized separately when they are acquired through sales of loans. When mortgage loans are sold, servicing rights are initially recorded at fair value with the income statement effect recorded in mortgage banking in non-interest income. Fair value is based on a valuation model that calculates the present value of estimated future net servicing income. All classes of servicing assets are subsequently measured using the amortization method which requires servicing rights to be amortized into non-interest income in proportion to, and over the period of, the estimated future net servicing income of the underlying loans.
Servicing assets are evaluated for impairment based upon the fair value of the rights as compared to carrying amount. Impairment is determined by stratifying rights into groupings based on predominant risk characteristics, such as interest rate, loan type and investor type. Impairment is recognized through a valuation allowance for an individual grouping, to the extent that fair value is less than the carrying amount. If the Company later determines that all or a portion of the impairment no longer exists for a particular grouping, a reduction of the allowance may be recorded as an increase to income. Changes in valuation allowances are reported with mortgage banking on the income statement. The fair values of servicing rights are subject to significant fluctuations as a result of changes in estimated and actual prepayment speeds and default rates and losses.
Servicing fee income, which is reported on the income statement as mortgage banking in non-interest income, is recorded for fees earned for servicing loans. The fees are based on a contractual percentage of the outstanding principal, or a fixed amount per
42
Table of Contents
loan and are recorded as income when earned. The amortization of mortgage servicing rights is netted against loan servicing fee income. Servicing fees totaled $2,038, $1,864 and $2,104 for the years ended December 31, 2013, 2012 and 2011. Late fees and ancillary fees related to loan servicing are not material.
Mortgage Banking Derivatives: Commitments to fund mortgage loans (interest rate locks) to be sold into the secondary market and forward commitments for the future delivery of these mortgage loans are accounted for as free standing derivatives. Fair values of interest rate locks are recorded at the time of commitment, adjusted for expected fall out before the loan is funded. The Company enters into forward commitments for the future delivery of mortgage loans when interest rate locks are entered into, in order to hedge the change in interest rates resulting from its commitments to fund the loans. The fair value of these forward commitments is estimated based on the change in mortgage interest rates from the date the commitment is entered into. Any changes are recorded in mortgage banking on the income statement. The amount of income/(expense) related to these derivatives was $(1,675), $1,740, and $40 in 2013, 2012, and 2011 and is included in the "Gain from sale of mortgage loans and interest rate locks" in Note 14. See Note 14 for additional information on mortgage banking activities.
Transfers of Financial Assets: Transfers of financial assets are accounted for as sales when control over the assets has been surrendered. Control over transferred assets is deemed to be surrendered when the assets have been isolated from the Company, the transferee obtains the right (free of conditions that constrain it from taking advantage of that right) to pledge or exchange the transferred assets, and the Company does not maintain effective control over the transferred assets through an agreement or option to repurchase them before their maturity.
Goodwill and Other Intangible Assets: Goodwill resulting from business combinations prior to January 1, 2009 represents the excess of the purchase price over the fair value of acquired tangible assets and liabilities and identifiable intangible assets. Goodwill resulting from business combinations after January 1, 2009, is generally determined as the excess of the fair value of the consideration transferred, plus the fair value of any noncontrolling interests in the acquiree, over the fair value of the net assets acquired and liabilities assumed as of the acquisition date. Goodwill and intangible assets acquired in a purchase business combination and determined to have an indefinite useful life are not amortized, but tested for impairment at least annually. The Company has selected June 30 of each year as the date to perform its impairment review. Intangible assets with definite useful lives are amortized over their estimated useful lives to their estimated residual values. Goodwill is the only intangible asset with an indefinite life on the Company's balance sheet.
Other intangible assets consist largely of core deposit and acquired customer relationship intangibles arising from whole bank and branch acquisitions. They are initially measured at fair value and then are amortized on an accelerated method over their estimated useful lives, generally ten years.
Loan Commitments and Related Financial Instruments: Financial instruments include off-balance sheet credit instruments, such as commitments to make loans and commercial letters of credit, issued to meet customer financing needs. The face amount for these items represents the exposure to loss, before considering customer collateral or ability to repay. Such financial instruments are recorded when they are funded.
Long-term Assets: Premises and equipment and other long-term assets are reviewed for impairment when events indicate their carrying amount may not be recoverable from future undiscounted cash flows. If impaired, the assets are recorded at fair value.
Income Taxes: Income tax expense is the total of the current year income tax due or refundable and the change in deferred tax assets and liabilities. Deferred tax assets and liabilities are the expected future tax amounts for the temporary differences between carrying amounts and tax bases of assets and liabilities, computed using enacted tax rates. A valuation allowance, if needed, reduces deferred tax assets to the amount expected to be realized.
A tax position is recognized as a benefit only if it is "more likely than not" that the tax position would be sustained in a tax examination, with a tax examination being presumed to occur. The amount recognized is the largest amount of tax benefit that is greater than 50% likely of being realized on examination. For tax positions not meeting the "more likely than not" test, no tax benefit is recorded.
The Company recognizes interest and/or penalties related to income tax matters in income tax expense.
Stock-Based Compensation: Compensation cost is recognized for stock options and restricted stock awards issued to employees, based on the fair value of these awards at the date of grant. A Black-Scholes model is utilized to estimate the fair value of stock options. Compensation cost is recognized over the required service period, generally defined as the vesting period. For awards with graded vesting, compensation cost is recognized on a straight-line basis over the requisite service period for the entire award.
Retirement Plans: Employee 401(k) and profit sharing plan expense is the amount of matching contributions and discretionary contributions, respectively.
43
Table of Contents
Earnings Per Common Share: Basic earnings per common share is net income available to common shareholders divided by the weighted average number of common shares outstanding during the period. Diluted earnings per common share include the dilutive effect of additional potential common shares issuable under stock options. Earnings and dividends per share are restated for all stock splits and dividends through the date of issuance of the financial statements.
Comprehensive Income: Comprehensive income consists of net income and other comprehensive income. Other comprehensive income includes unrealized gains and losses on securities available for sale which are also recognized as a separate component of equity.
Loss Contingencies: Loss contingencies, including claims and legal actions arising in the ordinary course of business, are recorded as liabilities when the likelihood of loss is probable and an amount or range of loss can be reasonably estimated. Management does not believe there are now any such matters that will have a material effect on the financial statements.
Restrictions on Cash: Cash on hand or on deposit with the Federal Reserve Bank as required to meet regulatory reserve and clearing requirements.
Equity: Stock dividends in excess of 20% are reported by transferring the par value of the stock issued from retained earnings to common stock. Stock dividends for 20% or less are reported by transferring the fair value, as of the ex-dividend date, of the stock issued from retained earnings to common stock and additional paid-in capital. Fractional share amounts are paid in cash with a reduction in retained earnings. Treasury stock is carried at cost and valued on an average cost basis.
Dividend Restriction: Banking regulations require maintaining certain capital levels and may limit the dividends paid by the banks to the holding company or by the holding company to shareholders.
Fair Value of Financial Instruments: Fair values of financial instruments are estimated using relevant market information and other assumptions, as more fully disclosed in a Note 7. Fair value estimates involve uncertainties and matters of significant judgment regarding interest rates, credit risk, prepayments, and other factors, especially in the absence of broad markets for particular items. Changes in assumptions or in market conditions could significantly affect the estimates.
Operating Segments: While the Company monitors the revenue streams of the various products and services, the identifiable segments are not material and operations are managed and financial performance is evaluated on a Company-wide basis. Accordingly, all of the Company's financial service operations are considered by management to be aggregated in one reportable operating segment.
Reclassifications: Some items in the prior year financial statements were reclassified to conform to the current presentation. Reclassifications had no effect on prior year net income or shareholders' equity.
In July, 2013, the FASB issued Accounting Standards Update 2013-11, Presentation of an Unrecognized Tax Benefit When a Net Operating Loss Carryforward, a Similar Tax Loss, or a Tax Credit Carryforward Exists." U.S. GAAP does not include explicit guidance on the financial statement presentation of an unrecognized tax benefit when a net operating loss carryforward, a similar tax loss, or a tax credit carryforward exists. The amendments in this ASU state that an unrecognized tax benefit, or a portion of an unrecognized tax benefit, should be presented in the financial statements as a reduction to a deferred tax asset for a net operating loss carryforward, a similar tax loss, or a tax credit carryforward, except as follows. To the extent a net operating loss carryforward, a similar tax loss, or a tax credit carryforward is not available at the reporting date under the tax law of the applicable jurisdiction to settle any additional income taxes that would result from the disallowance of a tax position or the tax law of the applicable jurisdiction does not require the entity to use, and the entity does not intend to use, the deferred tax asset for such purpose, the unrecognized tax benefit should be presented in the financial statements as a liability and should not be combined with deferred tax assets.This standard applies to all entities that have unrecognized tax benefits when a net operating loss carryforward, a similar tax loss, or a tax credit carryforward exists at the reporting date. The amendments in this ASU are effective for fiscal years, and interim periods within those years, beginning after December 15, 2013. Early adoption is permitted. The amendments should be applied prospectively to all unrecognized tax benefits that exist at the effective date. Retrospective application is permitted. The Company has no unrecognized tax positions as of December 31, 2013.
In February, 2013, the FASB issued Accounting Standards Update 2013-02, "Reporting of Amounts Reclassified Out of Accumulated Other Comprehensive Income". This update amended guidance on the reporting of reclassifications out of accumulated other comprehensive income. The guidance requires an entity to report the effect of significant reclassifications out of accumulated other comprehensive income on the respective line items of net income if the amount being reclassified is required under U.S. generally accepted accounting principles. For other amounts that are not required under U.S. generally accepted accounting principles, an entity is required to disclose in the notes to the financial statements these amounts. This amended guidance became effective on January 1, 2013 and was applied prospectively. The effect of adopting this standard did not have a material
44
Table of Contents
impact on the Company's consolidated operating results or financial condition, but the additional disclosures are included on the Consolidated Statements of Income.
NOTE 2 — PREFERRED STOCK AND STOCK REPURCHASE
On January 16, 2009, the Company entered into an agreement with the United States Department of Treasury (the "Treasury Department") as part of the Treasury Department's Capital Purchase Program. Under this agreement, the Company issued to the Treasury Department 57,000 shares of Fixed Rate Cumulative Perpetual Preferred Stock, Series A ("preferred stock"), having a liquidation amount per share of $1,000, for a total price of $57 million and a warrant to purchase up to 571,906 shares ("warrant shares") of the Company's common stock, at an initial per share exercise price of $14.95, for an aggregate purchase price of $8.55 million.
In addition to the preferred shares, the Treasury Department received a warrant to purchase 571,906 shares of the Company's common stock at an initial per share exercise price of $14.95. The warrant provides for the adjustment of the exercise price and the number of shares of the Company's common stock issuable upon exercise pursuant to customary anti-dilution provisions, such as upon stock splits or distributions of securities or other assets to holders of Company common stock, and upon certain issuances of the Company common stock at or below a specified price relative to the initial exercise price. The SEC and FASB indicated they would not object to permanent equity classification under the Capital Purchase Program. The warrant has a term of ten years and is currently exercisable. Like stock options, the warrant issued through the Capital Purchase Program is potentially dilutive. On June 6, 2013, the Treasury Department announced it had completed an auction to sell the Warrant in a private transaction. The average stock price for the Company for 2013, 2012, and 2011 was $14.58, $11.45, and $8.86 per share, respectively, and the warrant issued in 2009 has an exercise price of $14.95 per share. This resulted in no additional dilutive shares in calculating earnings per share for 2013, 2012, or 2011.
On March 28, 2012, the U.S. Department of the Treasury priced its secondary public offering of 57,000 shares of the Company's Preferred Stock. The Company successfully bid for the purchase of 21,030 shares of the Preferred Stock for a total purchase price of $19,581, plus accrued and unpaid dividends on the Preferred Stock from and including February 15, 2012 to the settlement date, April 3, 2012. The book value of the preferred stock retired was $20,823. As a result of its successful bid in the offering, the Company retired 21,030 shares of its original sale of 57,000 shares of Preferred Stock on March 29, 2012. The difference between the book value and the bid price of $1,242 was credited to retained earnings. The remaining 35,970 shares were purchased by unrelated third parties. On May 31, 2012 the Company purchased an additional 1,820 shares or $1,820 in liquidation value of the preferred stock at a cost of $1,747. The difference between the book value and bid price of $60 was credited to retained earnings. On December 5, 2012, the Company purchased an additional 19,050 shares or $19,050 in liquidation value of the preferred stock at a cost of $18,927. The difference between the book value and bid price of $55 was credited to retained earnings..
On July 10, 2013, the Company notified the remaining holders of its preferred stock that it intended to redeem all 15,100 preferred shares that remained outstanding. The effective date for the redemption was August 12, 2013. The shares were redeemed from third-parties that purchased the preferred stock from the Treasury Department public auction of the preferred stock during 2012. The purchase price for shares of the preferred stock in the redemption was the stated liquidation value of $1,000.00 per share, plus any accrued or unpaid dividends that have been earned thereon up to, but not including, the date of redemption. The difference between the book value of $14,952 and redemption price of $15,100, $148 was charged to retained earnings. As a result of this redemption, no shares of the Company's preferred stock remain outstanding.
NOTE 3 — RESTRICTION ON CASH AND DUE FROM BANKS
The Bank is required to maintain reserve funds in cash or on deposit with the Federal Reserve Bank. The reserves required at December 31, 2013 and 2012 were $15,641 and $14,357. The Company had no compensating balance requirements at December 31, 2013 and 2012.
45
Table of Contents
NOTE 4 — SECURITIES
The fair value of securities available for sale and related gross unrealized gains and losses recognized in accumulated other comprehensive income was as follows:
| | | | | | | | | | | | | |
| | Amortized
Cost
| | Gross
Unrealized
Gains
| | Gross
Unrealized
Losses
| | Fair Value
| |
|---|
| | |
As of December 31, 2013 | | | | | | | | | | | | | |
Available for Sale | | | | | | | | | | | | | |
U. S. government agency | | $ | 793 | | $ | 5 | | $ | — | | $ | 798 | |
State and municpal | | | 321,151 | | | 12,173 | | | (2,212 | ) | | 331,112 | |
Mortgage-backed securities-residential (Government Sponsored Entity) | | | 186,054 | | | 3,175 | | | (3,800 | ) | | 185,429 | |
Collateralized mortgage obligations (Government Sponsored Entity) | | | 372,896 | | | 1,642 | | | (9,229 | ) | | 365,309 | |
Equity securities | | | 4,939 | | | — | | | — | | | 4,939 | |
Other securities | | | 3,527 | | | — | | | (8 | ) | | 3,519 | |
| | | | |
| | | | | | | | | | | | | | |
| | $ | 889,360 | | $ | 16,995 | | $ | (15,249 | ) | $ | 891,106 | |
| | | | |
| | | | | | | | | | | | | | |
| | | | | | | | | | | | | | |
| | | | |
As of December 31, 2012 | | |
| | |
| | |
| | |
| |
Available for Sale | | | | | | | | | | | | | |
U. S. government agency | | $ | 1,600 | | $ | 38 | | $ | — | | $ | 1,638 | |
State and municipal | | | 310,552 | | | 27,484 | | | (97 | ) | | 337,939 | |
Mortgage-backed securities-residential (Government Sponsored Entity) | | | 219,352 | | | 7,711 | | | (8 | ) | | 227,055 | |
Collateralized mortgage obligations (Government Sponsored Entity) | | | 322,758 | | | 4,604 | | | (139 | ) | | 327,223 | |
Equity securities | | | 4,939 | | | — | | | — | | | 4,939 | |
Other securities | | | 3,558 | | | — | | | (11 | ) | | 3,547 | |
| | | | |
| | | | | | | | | | | | | | |
Total available for sale | | $ | 862,759 | | $ | 39,837 | | $ | (255 | ) | $ | 902,341 | |
| | | | |
| | | | | | | | | | | | | | |
| | | | | | | | | | | | | | |
| | | | |
Contractual maturities of securities at December 31, 2013 were as follows. Securities not due at a single maturity or with no maturity at year end are shown separately.
| | | | | | | |
| | Available for Sale | |
|---|
| | Amortized Cost
| | Fair Value
| |
|---|
| | |
Within one year | | $ | 14,715 | | $ | 14,940 | |
One through five years | | | 54,799 | | | 56,864 | |
Six through ten years | | | 120,911 | | | 123,992 | |
After ten years | | | 135,046 | | | 139,633 | |
Mortgage-backed securities-residential (Government Sponsored Entity) | | | 186,054 | | | 185,429 | |
Collateralized mortgage obligations (Government Sponsored Entity) | | | 372,896 | | | 365,309 | |
Equity securities | | | 4,939 | | | 4,939 | |
| | | | |
| | | | | | | | |
Total available for sale securities | | $ | 889,360 | | $ | 891,106 | |
| | | | |
| | | | | | | | |
| | | | | | | | |
| | | | |
Gross proceeds from sales of securities available for sale during 2013, 2012 and 2011 were $80,151, $64,176, and $366,559. Gross gains of $912, $1,944 and $11,440 and gross losses of $77, $77, and $83 were realized on those sales in 2013, 2012 and 2011, respectively. The tax provision related to these net realized gains was $284, $635, and $3,861 respectively.
Securities with a carrying value of $323,542 and $259,613 were pledged at December 31, 2013 and 2012 to secure certain deposits and repurchase agreements, secure future funding needs, and for other purposes as permitted or required by law.
At year end 2013 and 2012, there were no holdings of securities of any one issuer, other than the U.S. Government and its sponsored entities, in an amount greater than 10% of shareholders' equity.
46
Table of Contents
Below is a summary of securities with unrealized losses as of year-end 2013 and 2012 presented by length of time the securities have been in a continuous unrealized loss position.
| | | | | | | | | | | | | | | | | | | |
2013
| | Less than 12 months
| | 12 months or longer
| | Total
| |
|---|
| | | |
|---|
Description of securities
| | Fair Value
| | Unrealized
Losses
| | Fair Value
| | Unrealized
Losses
| | Fair Value
| | Unrealized
Losses
| |
|---|
| | |
State and municipal | | $ | 31,660 | | $ | (1,791 | ) | $ | 4,153 | | $ | (421 | ) | $ | 35,813 | | $ | (2,212 | ) |
Mortgage-backed securities-residential (Government Sponsored Entity) | | | 114,036 | | | (3,800 | ) | | — | | | — | | | 114,036 | | | (3,800 | ) |
Collateralized mortgage obligations (Government Sponsored Entity) | | | 267,579 | | | (9,040 | ) | | 4,100 | | | (189 | ) | | 271,679 | | | (9,229 | ) |
Other securities | | | — | | | — | | | 993 | | | (8 | ) | | 993 | | | (8 | ) |
| | | | |
| | | | | | | | | | | | | | | | | | | | |
Total temporarily impaired | | $ | 413,275 | | $ | (14,631 | ) | $ | 9,246 | | $ | (618 | ) | $ | 422,521 | | $ | (15,249 | ) |
| | | | |
| | | | | | | | | | | | | | | | | | | | |
| | | | | | | | | | | | | | | | | | | | |
| | | | |
| | | | | | | | | | | | | | | | | | | |
2012
| | Less than 12 months
| | 12 months or longer
| | Total
| |
|---|
| | | |
|---|
Description of securities
| | Fair Value
| | Unrealized
Losses
| | Fair Value
| | Unrealized
Losses
| | Fair Value
| | Unrealized
Losses
| |
|---|
| | |
State and municipal | | $ | 6,646 | | $ | (97 | ) | $ | — | | $ | — | | $ | 6,646 | | $ | (97 | ) |
Mortgage-backed securities-residential (Government Sponsored Entity) | | | 12,766 | | | (8 | ) | | — | | | — | | | 12,766 | | | (8 | ) |
Collateralized mortgage obligations (Government Sponsored Entity) | | | 32,330 | | | (139 | ) | | — | | | — | | | 32,330 | | | (139 | ) |
Other securities | | | 990 | | | (11 | ) | | — | | | — | | | 990 | | | (11 | ) |
| | | | |
| | | | | | | | | | | | | | | | | | | | |
Total temporarily impaired | | $ | 52,732 | | $ | (255 | ) | $ | — | | $ | — | | $ | 52,732 | | $ | (255 | ) |
| | | | |
| | | | | | | | | | | | | | | | | | | | |
| | | | | | | | | | | | | | | | | | | | |
| | | | |
Other-Than-Temporary-Impairment
Management evaluates securities for OTTI at least on a quarterly basis, and more frequently when economic or market conditions warrant such an evaluation. The investment securities portfolio is evaluated for OTTI by segregating the portfolio into two general segments and applying the appropriate OTTI model. Investment securities are generally evaluated for OTTI under ASC 320. However, certain purchased beneficial interests, including non-agency mortgage-backed securities, asset-backed securities, and collateralized debt obligations, that had credit ratings at the time of purchase of below AA are evaluated using the model outlined in ASC 325-10 (formerly EITF Issue No. 99-20,Recognition of Interest Income and Impairment on Purchased Beneficial Interests and Beneficial Interests that Continue to be Held by a Transfer in Securitized Financial Assets). The Company holds no securities that fall within the scope of ASC 325-10.
In determining OTTI under ASC 320, management considers many factors, including: (1) the length of time and the extent to which the fair value has been less than cost, (2) the financial condition and near-term prospects of the issuer, (3) whether the market decline was affected by macroeconomic conditions, and (4) whether the entity has the intent to sell the debt security or more likely than not will be required to sell the debt security before its anticipated recovery. The assessment of whether an other-than-temporary decline exists involves a high degree of subjectivity and judgment and is based on the information available to management at a point in time.
When OTTI occurs under either model, the amount of the OTTI recognized in earnings depends on whether the Company intends to sell the security or it is more likely than not it will be required to sell the security before recovery of its amortized cost basis, less any current period credit loss. If an entity intends to sell or it is more likely than not it will be required to sell the security before recovery of its amortized cost basis, less any current period credit loss, the OTTI shall be recognized in earnings equal to the entire difference between the investment's amortized cost basis and its fair value at the balance sheet date. If an entity does not intend to sell the security and it is not more likely than not that the entity will be required to sell the security before recovery of its amortized cost basis less any current period loss, the OTTI shall be separated into the amount representing the credit loss and the amount related to all other factors. The amount of the total OTTI related to the credit loss is determined based on the present value of cash flows expected to be collected and is recognized in earnings. The amount of the total OTTI related to other factors is recognized in other comprehensive income, net of applicable taxes. The previous amortized cost basis less the OTTI recognized in earnings becomes the new amortized cost basis of the investment.
As of December 31, 2013, the Company's security portfolio consisted of 1,054 securities, 178 of which were in an unrealized loss position. Unrealized losses on state and municipal securities of $2,212 have not been recognized into income because management has the ability to hold for a period of time sufficient to allow for any anticipated recovery in fair value and it is unlikely that management will be required to sell the securities before their anticipated recovery. The decline in value is primarily attributable
47
Table of Contents
to temporary illiquidity and the financial crisis affecting these markets and not the expected cash flows of the individual securities. The fair value of these debt securities is expected to recover as the securities approach their maturity date.
At December 31, 2013, all of the mortgage-backed securities held by the Company were issued by U.S. government-sponsored entities and agencies, primarily Fannie Mae and Freddie Mac, institutions which the government has affirmed its commitment to support. Because the decline in fair value of approximately $3,800 is attributable to changes in interest rates and illiquidity, and not credit quality, and because the Company does not have the intent to sell these mortgage-backed securities and it is unlikely that it will be required to sell the securities before their anticipated recovery, the Company does not consider these securities to be other-than-temporarily impaired at December 31, 2013.
The Company's collateralized mortgage obligation securities portfolio includes agency collateralized mortgage obligations with a market value of $365,309 which had unrealized losses of approximately $9,229 at December 31, 2013. The Company monitors to insure it has adequate credit support and as of December 31, 2013, the Company believes there is no OTTI and does not have the intent to sell these securities and it is unlikely that it will be required to sell the securities before their anticipated recovery. All securities are investment grade.
The unrealized losses on other securities are related to one single issue trust preferred security and has not been recognized into income because management has the ability to hold for a period of time sufficient to allow for any anticipated recovery in fair value and it is unlikely that management will be required to sell the security before its anticipated recovery. The Company performs a quarterly review of this security and based on this review, no evidence of adverse changes in expected cash flows is anticipated. The decline in value is primarily attributable to temporary illiquidity and the financial crisis affecting these markets and not the expected cash flows of the individual security. Currently, the issuer has made all contractual payments and given no indication that they will not be able to make them into the future. The fair value of these debt securities is expected to recover as the securities approach their maturity date. As of December 31, 2013, the Company owned $993 of these securities with an unrealized loss of $8.
In 2012, there was a $500 impairment loss recognized on one equity security reducing its fair value to $250. This amount is shown as an impairment loss on the income statement.
NOTE 5 — LOANS AND ALLOWANCE FOR LOAN LOSSES
Loans were as follows:
| | | | | | | |
| | December 31,
2013
| | December 31,
2012
| |
|---|
| | |
Commercial | | | | | | | |
Commercial and industrial | | $ | 180,378 | | $ | 134,156 | |
Agricultural | | | 30,323 | | | 22,355 | |
Commercial Real Estate | | | | | | | |
Farm | | | 76,082 | | | 66,119 | |
Hotel | | | 108,226 | | | 131,495 | |
Construction and development | | | 35,731 | | | 25,208 | |
Other | | | 546,970 | | | 507,231 | |
Residential | | | | | | | |
1-4 family | | | 403,733 | | | 394,195 | |
Home equity | | | 244,277 | | | 224,329 | |
Consumer | | | | | | | |
Direct | | | 45,129 | | | 45,844 | |
Indirect | | | 1,077 | | | 2,451 | |
| | | | |
| | | | | | | | |
Total loans | | | 1,671,926 | | | 1,553,383 | |
Allowance for loan losses | | | (27,609 | ) | | (32,227 | ) |
| | | | |
| | | | | | | | |
Net loans | | $ | 1,644,317 | | $ | 1,521,156 | |
| | | | |
| | | | | | | | |
| | | | | | | | |
| | | | |
48
Table of Contents
The following tables presents the activity in the allowance for loan losses by portfolio segment for the years ending December 31, 2013, 2012, and 2011:
| | | | | | | | | | | | | | | | |
2013
| | Commercial
| | Commercial
Real Estate
| | Residential
| | Consumer
| | Total
| |
|---|
| | |
Allowance for loan losses | | | | | | | | | | | | | | | | |
Balance, January 1 | | $ | 3,894 | | $ | 24,157 | | $ | 3,180 | | $ | 996 | | $ | 32,227 | |
Provision charged to expense | | | 208 | | | 1,319 | | | 1,928 | | | 1,079 | | | 4,534 | |
Losses charged off | | | (1,152 | ) | | (6,353 | ) | | (2,349 | ) | | (2,648 | ) | | (12,502 | ) |
Recoveries | | | 341 | | | 1,087 | | | 650 | | | 1,272 | | | 3,350 | |
| | | | |
| | | | | | | | | | | | | | | | | |
Balance, December 31 | | $ | 3,291 | | $ | 20,210 | | $ | 3,409 | | $ | 699 | | $ | 27,609 | |
| | | | |
| | | | | | | | | | | | | | | | | |
| | | | | | | | | | | | | | | | | |
| | | | |
| | | | | | | | | | | | | | | | |
2012
| | Commercial
| | Commercial
Real Estate
| | Residential
| | Consumer
| | Total
| |
|---|
| | |
Allowance for loan losses | | | | | | | | | | | | | | | | |
Balance, January 1 | | $ | 5,562 | | $ | 30,476 | | $ | 2,972 | | $ | 879 | | $ | 39,889 | |
Provision charged to expense | | | (265 | ) | | 4,802 | | | 3,490 | | | 1,823 | | | 9,850 | |
Losses charged off | | | (1,946 | ) | | (13,553 | ) | | (3,547 | ) | | (3,286 | ) | | (22,332 | ) |
Recoveries | | | 543 | | | 2,432 | | | 265 | | | 1,580 | | | 4,820 | |
| | | | |
| | | | | | | | | | | | | | | | | |
Balance, December 31 | | $ | 3,894 | | $ | 24,157 | | $ | 3,180 | | $ | 996 | | $ | 32,227 | |
| | | | |
| | | | | | | | | | | | | | | | | |
| | | | | | | | | | | | | | | | | |
| | | | |
| | | | | | | | | | | | | | | | |
2011
| | Commercial
| | Commercial
Real Estate
| | Residential
| | Consumer
| | Total
| |
|---|
| | |
Allowance for loan losses | | | | | | | | | | | | | | | | |
Balance, January 1 | | $ | 6,386 | | $ | 32,653 | | $ | 2,281 | | $ | 1,285 | | $ | 42,605 | |
Provision charged to expense | | | 215 | | | 13,406 | | | 3,136 | | | 1,043 | | | 17,800 | |
Losses charged off | | | (2,211 | ) | | (16,954 | ) | | (3,093 | ) | | (2,636 | ) | | (24,894 | ) |
Recoveries | | | 1,172 | | | 1,371 | | | 648 | | | 1,187 | | | 4,378 | |
| | | | |
| | | | | | | | | | | | | | | | | |
Balance, December 31 | | $ | 5,562 | | $ | 30,476 | | $ | 2,972 | | $ | 879 | | $ | 39,889 | |
| | | | |
| | | | | | | | | | | | | | | | | |
| | | | | | | | | | | | | | | | | |
| | | | |
The following table presents the balance in the allowance for loan losses and the recorded investment by portfolio segment and based on impairment method as of December 31, 2013 and 2012:
| | | | | | | | | | | | | | | | |
December 31, 2013
| | Commercial
| | Commercial
Real Estate
| | Residential
| | Consumer
| | Total
| |
|---|
| | |
Allowance for loan losses | | | | | | | | | | | | | | | | |
Ending Balance individually evaluated for impairment | | $ | 13 | | $ | 1,167 | | $ | 105 | | $ | 2 | | $ | 1,287 | |
Ending Balance collectively evaluated for impairment | | | 3,278 | | | 19,043 | | | 3,304 | | | 697 | | | 26,322 | |
| | | | |
| | | | | | | | | | | | | | | | | |
Total ending allowance balance | | $ | 3,291 | | $ | 20,210 | | $ | 3,409 | | $ | 699 | | $ | 27,609 | |
| | | | |
| | | | | | | | | | | | | | | | | |
| | | | | | | | | | | | | | | | | |
| | | | |
Loans | | | | | | | | | | | | | | | | |
Ending Balance individually evaluated for impairment | | $ | 300 | | $ | 21,240 | | $ | 10,797 | | $ | 785 | | $ | 33,122 | |
Ending Balance collectively evaluated for impairment | | | 210,401 | | | 745,769 | | | 637,213 | | | 45,421 | | $ | 1,638,804 | |
| | | | |
| | | | | | | | | | | | | | | | | |
Total ending loan balance excludes $5,043 of accrued interest | | $ | 210,701 | | $ | 767,009 | | $ | 648,010 | | $ | 46,206 | | $ | 1,671,926 | |
| | | | |
| | | | | | | | | | | | | | | | | |
| | | | | | | | | | | | | | | | | |
| | | | |
| | | | | | | | | | | | | | | | |
December 31, 2012
| | Commercial
| | Commercial
Real Estate
| | Residential
| | Consumer
| | Total
| |
|---|
| | |
Allowance for loan losses | | | | | | | | | | | | | | | | |
Ending Balance individually evaluated for impairment | | $ | 150 | | $ | 3,067 | | | — | | | — | | $ | 3,217 | |
Ending Balance collectively evaluated for impairment | | | 3,744 | | | 21,090 | | | 3,180 | | | 996 | | | 29,010 | |
| | | | |
| | | | | | | | | | | | | | | | | |
Total ending allowance balance | | $ | 3,894 | | $ | 24,157 | | $ | 3,180 | | $ | 996 | | $ | 32,227 | |
| | | | |
| | | | | | | | | | | | | | | | | |
| | | | | | | | | | | | | | | | | |
| | | | |
Loans | | | | | | | | | | | | | | | | |
Ending Balance individually evaluated for impairment | | $ | 1,797 | | $ | 33,499 | | $ | 14,175 | | $ | 1,083 | | $ | 50,554 | |
Ending Balance collectively evaluated for impairment | | | 154,714 | | | 696,554 | | | 604,349 | | | 47,212 | | | 1,502,829 | |
| | | | |
| | | | | | | | | | | | | | | | | |
Total ending loan balance excludes $5,206 of accrued interest | | $ | 156,511 | | $ | 730,053 | | $ | 618,524 | | $ | 48,295 | | $ | 1,553,383 | |
| | | | |
| | | | | | | | | | | | | | | | | |
| | | | | | | | | | | | | | | | | |
| | | | |
49
Table of Contents
Nonperforming loans were as follows:
| | | | | | | |
December 31
| | 2013
| | 2012
| |
|---|
| | |
Loans past due 90 days or more still on accrual | | $ | 14 | | $ | 565 | |
Troubled debt restructurings (accruing) | | | 4,188 | | | 15,102 | |
Non-accrual loans | | | 22,341 | | | 35,451 | |
| | | | |
| | | | | | | | |
Total | | $ | 26,543 | | $ | 51,118 | |
| | | | |
| | | | | | | | |
| | | | | | | | |
| | | | |
Nonperforming loans include both smaller balance homogeneous loans that are collectively evaluated for impairment and individually classified impaired loans. The decrease in troubled debt restructurings was due primarily to three credits totaling $6,814 that became performing loans in 2013.
The following table presents loans individually evaluated for impairment by class of loans as of December 31, 2013, 2012, and 2011. Performing troubled debt restructurings at December 31, 2013, totaling $6,593 were excluded as allowed by ASC 310-40.
| | | | | | | | | | | | | | | | |
December 31, 2013
| | Unpaid
Principal
Balance
| | Recorded
Investment
| | Allowance
for Loan
Losses
Allocated
| | Interest
Income
Recognized
| | Cash Basis
Interest
Recognized
| |
|---|
| | |
With an allowance recorded | | | | | | | | | | | | | | | | |
Commercial | | | | | | | | | | | | | | | | |
Commercial and industrial | | $ | 194 | | $ | 177 | | $ | 13 | | | | | | | |
Agricultural | | | — | | | — | | | — | | | | | | | |
Commercial Real Estate | | | | | | | | | | | | | | | | |
Farm | | | 625 | | | 436 | | | 61 | | | | | | | |
Hotel | | | — | | | — | | | — | | | | | | | |
Construction and development | | | — | | | — | | | — | | | | | | | |
Other | | | 7,309 | | | 6,382 | | | 1,106 | | | | | | | |
Residential | | | | | | | | | | | | | | | | |
1-4 Family | | | 1,089 | | | 981 | | | 102 | | | | | | | |
Home Equity | | | 50 | | | 50 | | | 3 | | | | | | | |
Consumer | | | | | | | | | | | | | | | | |
Direct | | | 126 | | | 126 | | | 2 | | | | | | | |
Indirect | | | — | | | — | | | — | | | | | | | |
| | | | |
| | | | | | | | | | | | | | | | | |
Subtotal — impaired with allowance recorded | | | 9,393 | | | 8,152 | | | 1,287 | | | | | | | |
With no related allowance recorded | | | | | | | | | | | | | | | | |
Commercial | | | | | | | | | | | | | | | | |
Commercial and industrial | | $ | 204 | | $ | 123 | | | | | $ | 12 | | $ | 12 | |
Agricultural | | | — | | | — | | | | | | — | | | — | |
Commercial Real Estate | | | | | | | | | | | | | | | | |
Farm | | | 767 | | | 657 | | | | | | 11 | | | 11 | |
Hotel | | | — | | | — | | | | | | 1 | | | 1 | |
Construction and development | | | 942 | | | 795 | | | | | | 45 | | | 45 | |
Other | | | 8,651 | | | 6,377 | | | | | | 72 | | | 72 | |
Residential | | | | | | | | | | | | | | | | |
1-4 Family | | | 8,931 | | | 8,007 | | | | | | 15 | | | 15 | |
Home Equity | | | 1,860 | | | 1,759 | | | | | | 13 | | | 13 | |
Consumer | | | | | | | | | | | | | | | | |
Direct | | | 675 | | | 649 | | | | | | 17 | | | 17 | |
Indirect | | | 11 | | | 10 | | | | | | — | | | — | |
| | | | |
| | | | | | | | | | | | | | | | | |
Subtotal — impaired with no allowance recorded | | | 22,041 | | | 18,377 | | | — | | | 186 | | | 186 | |
| | | | |
| | | | | | | | | | | | | | | | | |
Total impaired loans | | $ | 31,434 | | $ | 26,529 | | $ | 1,287 | | $ | 186 | | $ | 186 | |
| | | | |
| | | | | | | | | | | | | | | | | |
| | | | | | | | | | | | | | | | | |
| | | | |
50
Table of Contents
| | | | | | | | | | | | | | | | |
December 31, 2012
| | Unpaid
Principal
Balance
| | Recorded
Investment
| | Allowance
for Loan
Losses
Allocated
| | Interest
Income
Recognized
| | Cash Basis
Interest Recognized
| |
|---|
| | |
With an allowance recorded | | | | | | | | | | | | | | | | |
Commercial | | | | | | | | | | | | | | | | |
Commercial and industrial | | $ | 305 | | $ | 305 | | $ | 150 | | | | | | | |
Agricultural | | | — | | | — | | | — | | | | | | | |
Commercial Real Estate | | | | | | | | | | | | | | | | |
Farm | | | 922 | | | 922 | | | 442 | | | | | | | |
Hotel | | | | | | | | | | | | | | | | |
Construction and development | | | 742 | | | 644 | | | 240 | | | | | | | |
Other | | | 9,727 | | | 9,419 | | | 2,385 | | | | | | | |
Residential | | | | | | | | | | | | | | | | |
1-4 Family | | | | | | | | | | | | | | | | |
Home Equity | | | | | | | | | | | | | | | | |
Consumer | | | | | | | | | | | | | | | | |
Direct | | | | | | | | | | | | | | | | |
Indirect | | | | | | | | | | | | | | | | |
| | | | |
| | | | | | | | | | | | | | | | | |
Subtotal — impaired with allowance recorded | | | 11,696 | | | 11,290 | | | 3,217 | | | | | | | |
With no related allowance recorded | | | | | | | | | | | | | | | | |
Commercial | | | | | | | | | | | | | | | | |
Commercial and industrial | | $ | 2,115 | | $ | 1,492 | | | | | $ | 76 | | $ | 76 | |
Agricultural | | | 1 | | | — | | | | | | | | | | |
Commercial Real Estate | | | | | | | | | | | | | | | | |
Farm | | | 741 | | | 663 | | | | | | 9 | | | 9 | |
Hotel | | | 6,257 | | | 5,968 | | | | | | | | | | |
Construction and development | | | 2,685 | | | 1,499 | | | | | | 108 | | | 108 | |
Other | | | 20,047 | | | 14,384 | | | | | | 129 | | | 129 | |
Residential | | | | | | | | | | | | | | | | |
1-4 Family | | | 13,110 | | | 11,548 | | | | | | 3 | | | 3 | |
Home Equity | | | 2,801 | | | 2,627 | | | | | | 17 | | | 17 | |
Consumer | | | | | | | | | | | | | | | | |
Direct | | | 1,083 | | | 1,066 | | | | | | 9 | | | 9 | |
Indirect | | | 19 | | | 17 | | | | | | 7 | | | 7 | |
| | | | |
| | | | | | | | | | | | | | | | | |
Subtotal — impaired with no allowance recorded | | | 48,859 | | | 39,264 | | | — | | | 358 | | | 358 | |
| | | | |
| | | | | | | | | | | | | | | | | |
Total impaired loans | | $ | 60,555 | | $ | 50,554 | | $ | 3,217 | | $ | 358 | | $ | 358 | |
| | | | |
| | | | | | | | | | | | | | | | | |
| | | | | | | | | | | | | | | | | |
| | | | |
51
Table of Contents
| | | | | | | | | | | | | | | | |
December 31, 2011
| | Unpaid
Principal
Balance
| | Recorded
Investment
| | Allowance
for Loan
Losses
Allocated
| | Interest
Income
Recognized
| | Cash Basis
Interest
Recognized
| |
|---|
| | |
With an allowance recorded | | | | | | | | | | | | | | | | |
Commercial | | | | | | | | | | | | | | | | |
Commercial and industrial | | $ | 3,130 | | $ | 3,057 | | $ | 1,193 | | | | | | | |
Agricultural | | | — | | | — | | | — | | | | | | | |
Commercial Real Estate | | | | | | | | | | | | | | | | |
Farm | | | 486 | | | 486 | | | 193 | | | | | | | |
Hotel | | | 5,385 | | | 5,385 | | | 100 | | | | | | | |
Construction and development | | | 5,558 | | | 5,476 | | | 2,371 | | | | | | | |
Other | | | 14,400 | | | 14,322 | | | 2,812 | | | | | | | |
Residential | | | | | | | | | | | | | | | | |
1-4 Family | | | | | | | | | | | | | | | | |
Home Equity | | | | | | | | | | | | | | | | |
Consumer | | | | | | | | | | | | | | | | |
Direct | | | | | | | | | | | | | | | | |
Indirect | | | | | | | | | | | | | | | | |
| | | | |
| | | | | | | | | | | | | | | | | |
Subtotal — impaired with allowance recorded | | | 28,959 | | | 28,726 | | | 6,669 | | | | | | | |
With no related allowance recorded | | | | | | | | | | | | | | | | |
Commercial | | | | | | | | | | | | | | | | |
Commercial and industrial | | $ | 2,720 | | $ | 2,030 | | | | | $ | 22 | | $ | 22 | |
Agricultural | | | 351 | | | 57 | | | | | | — | | | — | |
Commercial Real Estate | | | | | | | | | | | | | | | | |
Farm | | | 579 | | | 531 | | | | | | — | | | — | |
Hotel | | | 876 | | | 384 | | | | | | | | | | |
Construction and development | | | 2,996 | | | 1,839 | | | | | | 1 | | | 1 | |
Other | | | 16,325 | | | 12,726 | | | | | | 135 | | | 135 | |
Residential | | | | | | | | | | | | | | | | |
1-4 Family | | | 12,344 | | | 12,045 | | | | | | 8 | | | 8 | |
Home Equity | | | 2,548 | | | 2,477 | | | | | | 8 | | | 8 | |
Consumer | | | | | | | | | | | | | | | | |
Direct | | | 1,096 | | | 1,083 | | | | | | 9 | | | 9 | |
Indirect | | | 35 | | | 33 | | | | | | 5 | | | 5 | |
| | | | |
| | | | | | | | | | | | | | | | | |
Subtotal — impaired with no allowance recorded | | | 39,870 | | | 33,205 | | | — | | | 188 | | | 188 | |
| | | | |
| | | | | | | | | | | | | | | | | |
Total impaired loans | | $ | 68,829 | | $ | 61,931 | | $ | 6,669 | | $ | 188 | | $ | 188 | |
| | | | |
| | | | | | | | | | | | | | | | | |
| | | | | | | | | | | | | | | | | |
| | | | |
The following table presents the average recorded investment of impaired loans in 2013, 2012, and 2011.
| | | | | | | | | | |
| | 2013
| | 2012
| | 2011
| |
|---|
| | |
Commercial | | | | | | | | | | |
Commercial and industrial | | $ | 997 | | $ | 4,401 | | $ | 6,438 | |
Agricultural | | | — | | | 23 | | | 103 | |
Commercial Real Estate | | | | | | | | | | |
Farm | | | 1,360 | | | 1,180 | | | 1,110 | |
Hotel | | | 1,194 | | | 2,388 | | | 7,271 | |
Construction and development | | | 1,514 | | | 4,751 | | | 9,467 | |
Other | | | 18,150 | | | 25,716 | | | 29,079 | |
Residential | | | | | | | | | | |
1-4 family | | | 10,372 | | | 11,778 | | | 11,825 | |
Home equity | | | 2,420 | | | 2,719 | | | 1,974 | |
Consumer | | | | | | | | | | |
Direct | | | 893 | | | 1,041 | | | 1,143 | |
Indirect | | | 14 | | | 41 | | | 58 | |
| | | | |
| | | | | | | | | | | |
Total loans | | $ | 36,914 | | $ | 54,038 | | $ | 68,468 | |
| | | | |
| | | | | | | | | | | |
| | | | | | | | | | | |
| | | | |
52
Table of Contents
The following table presents the recorded investment in non-accrual and loans past due over 90 days still on accrual by class of loans as of December 31, 2013 and 2012.
| | | | | | | | | | | | | |
| | Non-accrual
| | Past due over
90 days and
still accruing
| |
|---|
| | | |
|---|
December 31,
| | 2013
| | 2012
| | 2013
| | 2012
| |
|---|
| | |
Commercial | | | | | | | | | | | | | |
Commercial and industrial | | $ | 159 | | $ | 1,777 | | $ | 14 | | $ | — | |
Agricultural | | | — | | | — | | | — | | | — | |
Commercial Real Estate | | | | | | | | | | | | | |
Farm | | | 1,093 | | | 1,584 | | | — | | | — | |
Hotel | | | — | | | — | | | — | | | — | |
Construction and development | | | 329 | | | 1,657 | | | — | | | 565 | |
Other | | | 11,489 | | | 17,442 | | | — | | | — | |
Residential | | | | | | | | | | | | | |
1-4 Family | | | 7,635 | | | 10,392 | | | — | | | — | |
Home Equity | | | 1,452 | | | 2,216 | | | — | | | — | |
Consumer | | | | | | | | | | | | | |
Direct | | | 174 | | | 366 | | | — | | | — | |
Indirect | | | 10 | | | 17 | | | — | | | — | |
| | | | |
| | | | | | | | | | | | | | |
Total | | $ | 22,341 | | $ | 35,451 | | $ | 14 | | $ | 565 | |
| | | | |
| | | | | | | | | | | | | | |
| | | | | | | | | | | | | | |
| | | | |
The following table presents the aging of the recorded investment in past due loans as of December 31, 2013 and 2012 by class of loans:
| | | | | | | | | | | | | | | | | | | |
December 31, 2013
| | Total
Loans
| | 30-59 Days
Past Due
| | 60-89 Days
Past Due
| | Greater than
90 Days
Past Due
| | Total
Past Due
| | Loans Not
Past Due
| |
|---|
| | |
Commercial | | | | | | | | | | | | | | | | | | | |
Commercial and industrial | | $ | 180,378 | | $ | 64 | | $ | 24 | | $ | 72 | | $ | 160 | | $ | 180,218 | |
Agricultural | | | 30,323 | | | — | | | — | | | — | | | — | | | 30,323 | |
Commercial Real Estate | | | | | | | | | | | | | | | | | | | |
Farm | | | 76,082 | | | — | | | — | | | 697 | | | 697 | | | 75,385 | |
Hotel | | | 108,226 | | | — | | | — | | | — | | | — | | | 108,226 | |
Construction and development | | | 35,731 | | | 466 | | | — | | | 329 | | | 795 | | | 34,936 | |
Other | | | 546,970 | | | 984 | | | 187 | | | 5,944 | | | 7,115 | | | 539,855 | |
Residential | | | | | | | | | | | | | | | | | | | |
1-4 Family | | | 403,733 | | | 7,381 | | | 1,969 | | | 4,936 | | | 14,286 | | | 389,447 | |
Home Equity | | | 244,277 | | | 646 | | | 313 | | | 1,025 | | | 1,984 | | | 242,293 | |
Consumer | | | | | | | | | | | | | | | | | | | |
Direct | | | 45,129 | | | 192 | | | 32 | | | 126 | | | 350 | | | 44,779 | |
Indirect | | | 1,077 | | | 2 | | | 4 | | | — | | | 6 | | | 1,071 | |
| | | | |
| | | | | | | | | | | | | | | | | | | | |
Total — excludes $5,043 of accrued interest | | $ | 1,671,926 | | $ | 9,735 | | $ | 2,529 | | $ | 13,129 | | $ | 25,393 | | $ | 1,646,533 | |
| | | | |
| | | | | | | | | | | | | | | | | | | | |
| | | | | | | | | | | | | | | | | | | | |
| | | | |
53
Table of Contents
| | | | | | | | | | | | | | | | | | | |
December 31, 2012
| | Total
Loans
| | 30-59 Days
Past Due
| | 60-89 Days
Past Due
| | Greater than
90 Days
Past Due
| | Total
Past Due
| | Loans Not
Past Due
| |
|---|
| | |
Commercial | | | | | | | | | | | | | | | | | | | |
Commercial and industrial | | $ | 134,156 | | $ | 1,421 | | $ | 311 | | $ | 1,094 | | $ | 2,826 | | $ | 131,330 | |
Agricultural | | | 22,355 | | | — | | | — | | | — | | | — | | | 22,355 | |
Commercial Real Estate | | | | | | | | | | | | | | | | | | | |
Farm | | | 66,119 | | | 158 | | | — | | | 1,417 | | | 1,575 | | | 64,544 | |
Hotel | | | 131,495 | | | — | | | — | | | — | | | — | | | 131,495 | |
Construction and development | | | 25,208 | | | — | | | — | | | 2,121 | | | 2,121 | | | 23,087 | |
Other | | | 507,231 | | | 2,516 | | | 1,208 | | | 10,607 | | | 14,331 | | | 492,900 | |
Residential | | | | | | | | | | | | | | | | | | | |
1-4 Family | | | 394,195 | | | 7,788 | | | 2,605 | | | 5,492 | | | 15,885 | | | 378,310 | |
Home Equity | | | 224,329 | | | 1,170 | | | 357 | | | 1,428 | | | 2,955 | | | 221,374 | |
Consumer | | | | | | | | | | | | | | | | | | | |
Direct | | | 45,844 | | | 182 | | | 49 | | | 242 | | | 473 | | | 45,371 | |
Indirect | | | 2,451 | | | 33 | | | 12 | | | 5 | | | 50 | | | 2,401 | |
| | | | |
| | | | | | | | | | | | | | | | | | | | |
Total — excludes $5,206 of accrued interest | | $ | 1,553,383 | | $ | 13,268 | | $ | 4,542 | | $ | 22,406 | | $ | 40,216 | | $ | 1,513,167 | |
| | | | |
| | | | | | | | | | | | | | | | | | | | |
| | | | | | | | | | | | | | | | | | | | |
| | | | |
During the years ending December 31, 2013 and 2012, the terms of certain loans were modified as troubled debt restructurings. The modification of the terms of such loans included one or a combination of the following: a reduction of the stated interest rate of the loan or an extension of the maturity date at a stated rate of interest lower than the current market rate for new debt with similar risk.
Modifications involving a reduction of the stated interest rate of the loan were for periods ranging from 60 months to 30 years. Modifications involving an extension of the maturity date were for periods ranging from 6 months to 14 months.
The total of troubled debt restructurings at December 31, 2013 and 2012 was $14,347 and $18,932 respectively. Included in the TDR totals are non-accrual loans of $3,566 and $3,829 at December 31, 2013 and 2012 and performing loans of $6,593 at December 31, 2013 and $0 at December 31, 2012. The Company has allocated $534 of specific reserves to customers whose loan terms have been modified in troubled debt restructurings as of December 31, 2013. The Company has committed to lend additional amounts totaling $0 to customers with outstanding loans that are classified as troubled debt restructurings. At December 31, 2012, the comparable numbers were $567 of specific reserves and $0 of commitments.
The following tables present loans by class modified as troubled debt restructurings that occurred during the year ending December 31, 2013 and 2012:
| | | | | | | | | | |
2013
| | Number of Loans
| | Pre-Modification
Outstanding Recorded
Investment
| | Post-Modification
Outstanding Recorded
Investment
| |
|---|
| | |
Commercial | | | | | | | | | | |
Commercial and industrial | | | 1 | | $ | 28 | | $ | 28 | |
Commercial Real Estate | | | | | | | | | | |
Other real estate | | | 3 | | | 344 | | | 344 | |
Residential | | | | | | | | | | |
1-4 Family | | | 7 | | | 359 | | | 359 | |
Home Equity | | | 1 | | | 20 | | | 20 | |
Consumer | | | | | | | | | | |
Direct | | | 1 | | | 30 | | | 30 | |
| | | | |
| | | | | | | | | | | |
Total | | | 13 | | $ | 781 | | $ | 781 | |
| | | | |
| | | | | | | | | | | |
| | | | | | | | | | | |
| | | | |
54
Table of Contents
| | | | | | | | | | |
2012
| | Number of Loans
| | Pre-Modification
Outstanding Recorded
Investment
| | Post-Modification
Outstanding Recorded
Investment
| |
|---|
| | |
Commercial | | | | | | | | | | |
Commercial and industrial | | | 2 | | $ | 179 | | $ | 179 | |
Commercial Real Estate | | | | | | | | | | |
Hotel | | | 2 | | | 7,727 | | | 5,968 | |
Other | | | 7 | | | 6,241 | | | 5,367 | |
Residential | | | | | | | | | | |
1-4 Family | | | 1 | | | 91 | | | 91 | |
Home Equity | | | 1 | | | 70 | | | 70 | |
Consumer | | | | | | | | | | |
Direct | | | 1 | | | 4 | | | 4 | |
| | | | |
| | | | | | | | | | | |
Total | | | 14 | | $ | 14,312 | | $ | 11,679 | |
| | | | |
| | | | | | | | | | | |
| | | | | | | | | | | |
| | | | |
The troubled debt restructurings described above increased the allowance for loan losses by $30 and $10 and resulted in charge offs of $442 and $2,477 during the years ending December 31, 2013 and 2012 respectively.
The following tables present loans by class modified as troubled debt restructurings for which there was a payment default within twelve months following the modification during the years ending December 31, 2013 and 2012:
| | | | | | | |
2013
| | Number of Loans
| | Recorded Investment
| |
|---|
| | |
Residential | | | | | | | |
1-4 Family | | | 2 | | $ | 89 | |
Home Equity | | | 1 | | | 15 | |
Consumer | | | | | | | |
Direct | | | 1 | | | 4 | |
| | | | |
| | | | | | | | |
Total | | | 4 | | $ | 108 | |
| | | | |
| | | | | | | | |
| | | | | | | | |
| | | | |
| | | | | | | |
2012
| | Number of Loans
| | Recorded Investment
| |
|---|
| | |
Commercial | | | | | | | |
Commercial and industrial | | | 3 | | $ | 2,195 | |
Commercial real estate: | | | | | | | |
Development | | | 1 | | | 323 | |
Other | | | 9 | | | 3,332 | |
Residential | | | | | | | |
1-4 Family | | | 2 | | | 125 | |
Home Equity | | | 1 | | | 12 | |
| | | | |
| | | | | | | | |
Total | | | 16 | | $ | 5,987 | |
| | | | |
| | | | | | | | |
| | | | | | | | |
| | | | |
A loan is considered to be in payment default once it is 90 days contractually past due under the modified terms. The troubled debt restructurings that subsequently defaulted described above increased the allowance for loan losses by $0 and $256 and resulted in charge offs of $0 and $1,192 during the years ending December 31, 2013 and 2012 respectively.
In order to determine whether a borrower is experiencing financial difficulty, an evaluation is performed of the probability that the borrower will be in payment default on any of its debt in the foreseeable future without the modification. This evaluation is performed under the company's internal underwriting policy.
The terms of certain other loans were modified during years ending December 31, 2013 and 2012 that did not meet the definition of a troubled debt restructuring. These loans have a total recorded investment as of December 31, 2013 and 2012 of $0 and $18,612. The modification of these loans involved either a modification of the terms of a loan to borrowers who were not experiencing financial difficulties or a delay in a payment that was considered to be insignificant.
The Company categorizes loans into risk categories based on relevant information about the ability of the borrower to service their debt such as: current financial information, historical payment experience, credit documentation, public information, and current economic trends, among other factors. The Company analyzes commercial and commercial real estate loans individually by
55
Table of Contents
classifying the loans as to credit risk. This analysis includes credit relationships with an outstanding balance greater than $1 million on an annual basis. The Company uses the following definitions for risk ratings:
Special Mention — Loans classified as special mention have above average risk that requires management's ongoing attention. The borrower may have demonstrated inability to generate profits or to maintain net worth, chronic delinquency and /or a demonstrated lack of willingness or capacity to meet obligations.
Substandard — Loans classified as substandard are inadequately protected by the current net worth and paying capacity of the obligor or of the collateral pledged, if any. Loans so classified have a well-defined weakness or weaknesses that jeopardize the liquidation of the debt. They are classified by the distinct possibility that the institution will sustain some loss if the deficiencies are not corrected.
Non-accrual — Loans classified as non-accrual are loans where the further accrual of interest is stopped because payment in full of principal and interest is not expected. In most cases, the principal and interest has been in default for a period of 90 days or more.
As of December 31, 2013 and 2012, and based on the most recent analysis performed, the risk category of loans by class of loans is as follows:
| | | | | | | | | | | | | |
December 31, 2013
| | Pass
| | Special
Mention
| | Substandard
| | Non-accrual
| |
|---|
| | |
Commercial | | | | | | | | | | | | | |
Commercial and industrial | | $ | 174,408 | | $ | 4,561 | | $ | 1,250 | | $ | 159 | |
Agricultural | | | 30,323 | | | — | | | — | | | — | |
Commercial Real Estate | | | | | | | | | | | | | |
Farm | | $ | 74,884 | | | 105 | | | — | | | 1,093 | |
Hotel | | | 61,195 | | | 31,401 | | | 15,630 | | | — | |
Construction and development | | | 34,936 | | | — | | | 466 | | | 329 | |
Other | | | 504,657 | | | 20,893 | | | 9,931 | | | 11,489 | |
| | | | |
| | | | | | | | | | | | | | |
Total | | $ | 880,403 | | $ | 56,960 | | $ | 26,277 | | $ | 13,070 | |
| | | | |
| | | | | | | | | | | | | | |
| | | | | | | | | | | | | | |
| | | | |
| | | | | | | | | | | | | |
December 31, 2012
| | Pass
| | Special
Mention
| | Substandard
| | Non-accrual
| |
|---|
| | |
Commercial | | | | | | | | | | | | | |
Commercial and industrial | | $ | 119,755 | | $ | 9,824 | | $ | 2,800 | | $ | 1,777 | |
Agricultural | | | 22,350 | | | — | | | 5 | | | — | |
Commercial Real Estate | | | | | | | | | | | | | |
Farm | | | 63,294 | | | 1,094 | | | 147 | | | 1,584 | |
Hotel | | | 83,522 | | | 47,973 | | | — | | | — | |
Construction and development | | | 18,719 | | | 1,465 | | | 3,367 | | | 1,657 | |
Other | | | 439,702 | | | 27,621 | | | 22,466 | | | 17,442 | |
| | | | |
| | | | | | | | | | | | | | |
Total | | $ | 747,342 | | $ | 87,977 | | $ | 28,785 | | $ | 22,460 | |
| | | | |
| | | | | | | | | | | | | | |
| | | | | | | | | | | | | | |
| | | | |
Loans not analyzed individually as part of the above described process are classified by delinquency. These loans are primarily residential mortgage and consumer loans. All consumer loans fully or partially secured by 1-4 family residential real estate that are 60-89 days will be classified as Watch. If loans are greater than 90 days past due, they will be classified as Substandard. Consumer loans not secured by 1-4 family residential real estate that are 60-119 days past due will be classified Substandard while loans greater than 119 days will be classified as Loss. As of December 31, 2013 and 2012, the performing/non performing loans by category of loans is as follows:
| | | | | | | | | | |
December 31, 2013
| | Performing
| | Watch
| | Substandard
| |
|---|
| | |
Residential | | | | | | | | | | |
1-4 Family | | $ | 396,836 | | $ | 1,965 | | $ | 4,932 | |
Home Equity | | | 242,934 | | | 315 | | | 1,028 | |
| | | | |
| | | | | | | | | | | |
Total | | $ | 639,770 | | $ | 2,280 | | $ | 5,960 | |
| | | | |
| | | | | | | | | | | |
| | | | | | | | | | | |
| | | | |
56
Table of Contents
| | | | | | | | | | |
December 31, 2013
| | Performing
| | Substandard
| | Loss
| |
|---|
| | |
Consumer | | | | | | | | | | |
Direct | | $ | 44,970 | | $ | 32 | | $ | 127 | |
Indirect | | | 1,073 | | | 4 | | | — | |
| | | | |
| | | | | | | | | | | |
Total | | $ | 46,043 | | $ | 36 | | $ | 127 | |
| | | | |
| | | | | | | | | | | |
| | | | | | | | | | | |
| | | | |
| | | | | | | | | | |
December 31, 2012
| | Performing
| | Watch
| | Substandard
| |
|---|
| | |
Residential | | | | | | | | | | |
1-4 Family | | $ | 386,098 | | $ | 2,605 | | $ | 5,492 | |
Home Equity | | | 222,544 | | | 357 | | | 1,428 | |
| | | | |
| | | | | | | | | | | |
Total | | $ | 608,642 | | $ | 2,962 | | $ | 6,920 | |
| | | | |
| | | | | | | | | | | |
| | | | | | | | | | | |
| | | | |
| | | | | | | | | | |
December 31, 2012
| | Performing
| | Substandard
| | Loss
| |
|---|
| | |
Consumer | | | | | | | | | | |
Direct | | $ | 45,553 | | $ | 195 | | $ | 96 | |
Indirect | | | 2,434 | | | 12 | | | 5 | |
| | | | |
| | | | | | | | | | | |
Total | | $ | 47,987 | | $ | 207 | | $ | 101 | |
| | | | |
| | | | | | | | | | | |
| | | | | | | | | | | |
| | | | |
NOTE 6 — OTHER REAL ESTATE OWNED
Activity in the real estate owned assets, which are included in interest receivable and other assets in the consolidated balance sheets, was as follows:
| | | | | | | | | | |
| | 2013
| | 2012
| | 2011
| |
|---|
| | |
Beginning Balance | | $ | 6,677 | | $ | 15,456 | | $ | 11,453 | |
Transfer to other real estate owned | | | 4,005 | | | 5,286 | | | 23,093 | |
Sale — Out of other real estate owned | | | (5,708 | ) | | (12,089 | ) | | (16,125 | ) |
Write-down | | | (854 | ) | | (1,976 | ) | | (2,965 | ) |
| | | | |
| | | | | | | | | | | |
Ending Balance | | $ | 4,120 | | $ | 6,677 | | $ | 15,456 | |
| | | | |
| | | | | | | | | | | |
| | | | | | | | | | | |
| | | | |
The value of the sale amount above is the carrying value of the property when it was sold.
Activity in the valuation account for other real estate was as follows:
| | | | | | | | | | |
| | 2013
| | 2012
| | 2011
| |
|---|
| | |
Beginning Balance — January 1 | | $ | (1,672 | ) | $ | (2,279 | ) | $ | (779 | ) |
Impairments during year | | | (854 | ) | | (1,976 | ) | | (2,965 | ) |
Recovery on impairments | | | — | | | — | | | — | |
Reductions | | | 1,198 | | | 2,583 | | | 1,465 | |
| | | | |
| | | | | | | | | | | |
Ending Balance — December 31 | | $ | (1,328 | ) | $ | (1,672 | ) | $ | (2,279 | ) |
| | | | |
| | | | | | | | | | | |
| | | | | | | | | | | |
| | | | |
Net loss on OREO activity which is included in non-interest income and expenses related to foreclosed assets included in other expenses in the consolidated statements of income, were as follows:
| | | | | | | | | | |
| | 2013
| | 2012
| | 2011
| |
|---|
| | |
Write-downs | | $ | 854 | | $ | 1,976 | | $ | 2,965 | |
Losses/(gains)on sales | | | (315 | ) | | (617 | ) | | (221 | ) |
| | | | |
| | | | | | | | | | | |
Net loss | | $ | 539 | | $ | 1,359 | | $ | 2,744 | |
| | | | |
| | | | | | | | | | | |
Operating expenses | | | 417 | | | 624 | | | 1,152 | |
| | | | |
| | | | | | | | | | | |
57
Table of Contents
NOTE 7 — FAIR VALUE
ASC 820 establishes a fair value hierarchy which requires an entity to maximize the use of observable inputs and minimize the use of unobservable inputs when measuring fair value. The standard describes three levels of inputs that may be used to measure fair value:
Level 1: Quoted prices (unadjusted) for identical assets or liabilities in active markets that the entity has the ability to access as of the measurement date.
Level 2: Significant other observable inputs other than Level 1 prices such as quoted prices for similar assets or liabilities; quoted prices in markets that are not active; or other inputs that are observable or can be corroborated by observable market data.
Level 3: Significant unobservable inputs that reflect a reporting entity's own assumptions about the assumptions that market participants would use in pricing an asset or liability.
The fair values of securities available for sale are determined by obtaining quoted prices on nationally recognized securities exchanges (Level 1 inputs) or using market data utilizing pricing models, primarily Interactive Data Corporation ("IDC"), that vary based upon asset class and include available trade, bid, and other market information. Matrix pricing is used for most municipals, which is a mathematical technique widely used in the industry to value debt securities without relying exclusively on quoted prices for the specific securities but rather by relying on the securities' relationship to other benchmark quoted securities. The grouping of securities is done according to insurer, credit support, state of issuance, and rating to incorporate additional spreads and municipal curves. For the general market municipals, the Thomson Municipal Market Data curve is used to determine the initial curve for determining the price, movement, and yield relationships with the municipal market (Level 2 inputs). Level 3 securities are largely comprised of small, local municipality issuances. Fair values are derived through consideration of funding type, maturity and other features of the issuance, and include reviewing financial statements, earnings forecasts, industry trends and the valuation of comparative issuers. In most cases, the book value of the security is used as the fair value as meaningful pricing data is not readily available. Twice a year, a sample of prices supplied by the pricing agent is validated by comparison to prices obtained from other third party sources.
The fair value of impaired loans with specific allocations of the allowance for loan losses is generally based on recent real estate appraisals or industry accepted valuation methods. In a limited number of situations, the Company's appraisal department is determining the value of appraisal. These appraisals may utilize a single valuation approach or a combination of approaches including comparable sales and the income approach. Adjustments are routinely made in the appraisal process by the loan officers to adjust for differences between the comparable sales and income data available. Such adjustments are typically significant and result in a Level 3 classification of the inputs for determining fair value. These adjustments typically range from 0%-50%. Impaired loans are evaluated quarterly for additional impairment and take into account changing market conditions, specific information in the market the property is located, and the overall economic climate as well as overall changes in the credit. The Company's Appraisal Manager has the overall responsibility for all appraisals. The Company's loan officer responsible for the loan, the special assets officer, as well as the senior officers of the Company review the adjustments made to the appraisal for market and disposal costs on the loan.
The fair value of servicing rights is based on a valuation model from a third party that calculates the present value of estimated net servicing income. The valuation model incorporates assumptions that market participants would use in estimating future net servicing income. The inputs used include estimates of prepayment speeds, discount rate, cost to service, contractual servicing fee income, late fees, and float income. The most significant assumption used to value mortgage servicing rights is prepayment rate. Prepayment rates are estimated based on published industry consensus prepayment rates. The most significant unobservable assumption is the discount rate. At December 31, 2013 the constant prepayment speed (PSA) used was 174 and the discount rate was 10.0%. At December 31, 2012 the constant prepayment speed (PSA) used was 332 and the discount rate was 10.0%. The Company is able to compare the valuation model inputs and results to widely available published industry data for reasonableness (Level 3 inputs). On a quarterly basis, loan servicing rights are evaluated for impairment based upon the fair value of the rights as compared to carrying amount. If the carrying amount of an individual tranche exceeds fair value, impairment is recorded on that tranche so that the servicing asset is carried at fair value. Fair value is determined at a tranche level, based on market prices for comparable mortgage servicing contracts, when available, or alternatively based on a valuation model that calculates the present value of estimated future net servicing income. The valuation model utilizes assumptions that market participants would use in estimating future net servicing income and that can be validated against available market data.
The fair value of other real estate owned is measured based on the value of the collateral securing those assets and is determined using several methods. The fair value of real estate is generally determined based on appraisals by qualified licensed appraisers (third party). The appraisers typically determine the value of the real estate by utilizing an income or market valuation approach. If an appraisal is not available, the fair value may be determined by using a cash flow analysis. Appraisals for both collateral-dependent impaired loans and other real estate owned are performed by certified general appraisers whose qualifications and licenses have been reviewed and verified by the Company. Once received, a member of the Appraisal Department reviews the assumptions and
58
Table of Contents
approaches utilized in the appraisal as well as the overall resulting fair value in comparison with independent data sources such as recent market data or industry-wide statistics. Fair values are reviewed on at least an annual basis. The Company normally applies an internal discount to the value of appraisals used in the fair value evaluation of OREO. The deductions take into account changing business factors and market conditions. These deductions range from 0% to 50%. As noted in the impaired loans discussion above, the Company's Appraisal Manager has the overall responsibility for all appraisals. The Appraisal Manager reports to the Vice President of Credit Administration who reports to the Chief Credit Officer of the Company.
The fair value of mortgage banking derivatives are based on derivative valuation models using market data inputs as of the valuation date (Level 2). The mortgage banking derivative is classified as Interest receivable and other assets on the balance sheet.
Assets and Liabilities Measured on a Recurring Basis
Assets and liabilities measured at fair value under ASC 820 on a recurring basis, including financial assets and liabilities for which the Company has elected the fair value option, are summarized below:
| | | | | | | | | | | | | |
| |
| | Fair Value Measurements at December 31, 2013 Using: | |
|---|
(Dollars in thousands)
| | Carrying
Value
| | Quoted Prices in
Active Markets for
Identical Assets
(Level 1)
| | Significant
Other Observable
Inputs
(Level 2)
| | Significant
Unobservable
Inputs
(Level 3)
| |
|---|
| | |
Financial Assets | | | | | | | | | | | | | |
Investment securities available-for-sale | | | | | | | | | | | | | |
U. S. government agency | | $ | 798 | | | | | $ | 798 | | | | |
States and municipal | | | 331,112 | | | | | | 316,692 | | | 14,420 | |
Mortgage-backed securities — residential — Government Sponsored Entity | | | 185,429 | | | | | | 185,429 | | | | |
Collateralized mortgage obligations — Government Sponsored Entity | | | 365,309 | | | | | | 365,309 | | | | |
Equity securities | | | 4,939 | | | 4,689 | | | | | | 250 | |
Other securities | | | 3,519 | | | | | | 993 | | | 2,526 | |
| | | | |
| | | | | | | | | | | | | | |
Total investment securities available-for-sale | | $ | 891,106 | | $ | 4,689 | | $ | 869,221 | | $ | 17,196 | |
| | | | |
| | | | | | | | | | | | | | |
| | | | | | | | | | | | | | |
| | | | |
Mortgage banking derivatives | | $ | 525 | | | | | $ | 525 | | | | |
| | | | | | | | | | | | | |
| |
| | Fair Value Measurements at December 31, 2012 Using: | |
|---|
| | Carrying
Value
| | Quoted Prices in
Active Markets for
Identical Assets
(Level 1)
| | Significant
Other Observable
Inputs
(Level 2)
| �� | Significant
Unobservable
Inputs
(Level 3)
| |
|---|
| | |
Financial Assets | | | | | | | | | | | | | |
Investment securities available-for-sale | | | | | | | | | | | | | |
U. S. government agency | | $ | 1,638 | | | | | $ | 1,638 | | | | |
States and municipal | | | 337,939 | | | | | | 322,469 | | | 15,470 | |
Mortgage-backed securities — Residential — Government Sponsored Entity | | | 227,055 | | | | | | 227,055 | | | | |
Collateralized mortgage obligations — Government Sponsored Entity | | | 327,223 | | | | | | 327,223 | | | | |
Equity securities | | | 4,939 | | | 4,689 | | | | | | 250 | |
Other securities | | | 3,547 | | | | | | 990 | | | 2,557 | |
| | | | |
| | | | | | | | | | | | | | |
Total investment securities available- for-sale | | $ | 902,341 | | $ | 4,689 | | $ | 879,375 | | $ | 18,277 | |
| | | | |
| | | | | | | | | | | | | | |
| | | | | | | | | | | | | | |
| | | | |
Mortgage banking derivatives | | $ | 2,200 | | | | | $ | 2,200 | | | | |
There have been no transfers between Level 1 and 2 during the two years ending December 31, 2013 and 2012.
59
Table of Contents
The tables below presents a reconciliation and income statement classification of gains and losses for all assets measured at fair value on a recurring basis using significant unobservable inputs (Level 3) for the years ended December 31, 2013 and 2012:
| | | | | | | |
States and municipal
| | 2013
| | 2012
| |
|---|
| | |
Beginning balance, January 1 | | $ | 15,470 | | $ | 23,556 | |
Total gains or losses (realized / unrealized) | | | | | | | |
Included in earnings | | | | | | | |
Gains (losses) on securities | | | — | | | 361 | |
Included in other comprehensive income | | | (99 | ) | | (51 | ) |
Sales | | | — | | | (7,268 | ) |
Settlements | | | (951 | ) | | (832 | ) |
Transfers into Level 2 | | | — | | | (296 | ) |
| | | | |
| | | | | | | | |
Ending balance, December 31 | | $ | 14,420 | | $ | 15,470 | |
| | | | |
| | | | | | | | |
| | | | | | | | |
| | | | |
| | | | | | | |
Equity securities
| | 2013
| | 2012
| |
|---|
| | |
Beginning balance, January 1 | | $ | 250 | | $ | 750 | |
Total gains or losses (realized / unrealized) | | | | | | | |
Included in earnings | | | | | | | |
Other than temporary impairment | | | — | | | (500 | ) |
| | | | |
| | | | | | | | |
Ending balance, December 31 | | $ | 250 | | $ | 250 | |
| | | | |
| | | | | | | | |
| | | | | | | | |
| | | | |
| | | | | | | |
Other securities
| | 2013
| | 2012
| |
|---|
| | |
Beginning balance, January 1 | | $ | 2,557 | | $ | 2,587 | |
Total gains or losses (realized / unrealized) | | | | | | | |
Included in other comprehensive income | | | (31 | ) | | (30 | ) |
| | | | |
| | | | | | | | |
Ending balance, December 31 | | $ | 2,526 | | $ | 2,557 | |
| | | | |
| | | | | | | | |
| | | | | | | | |
| | | | |
In 2012, the municipal transfer into Level 2 was a security that was originally purchased where pricing data was not available and resulted in a Level 3 valuation. Subsequently, pricing data was obtained in 2012 that allowed a transfer into Level 2.
The Company's state and municipal security valuations were supported by analysis prepared by an independent third party. Fair values are derived through consideration of funding type, maturity and other features of the issuance, and include reviewing financial statements, earnings forecasts, industry trends and the valuation of comparative issuers.
The Company's equity security valuation was supported by an analysis prepared by the Company's Investments Manager. Fair value is derived through consideration of funding type, maturity and other features of the issuance, and includes reviewing financial statements, earnings forecasts, industry trends and the valuation of comparative issuers.
The Company's other security valuation was supported by analysis prepared by an independent third party. Fair values are derived through consideration of funding type, maturity and other features of the issuance, and include reviewing financial statements, earnings forecasts, industry trends and the valuation of comparative issuers.
60
Table of Contents
Assets and Liabilities Measured on a Non-Recurring Basis
Assets and liabilities measured at fair value on a non-recurring basis are summarized below:
| | | | | | | | | | | | | |
| |
| | Fair Value Measurements at December 31, 2013 Using: | |
|---|
| | December 31, 2013
| | Quoted Prices in
Active Markets for
Identical Assets
(Level 1)
| | Significant
Other Observable
Inputs
(Level 2)
| | Significant
Unobservable
Inputs (Level 3)
| |
|---|
| | |
Assets: | | | | | | | | | | | | | |
Impaired loans | | | | | | | | | | | | | |
Commercial and industrial | | $ | 76 | | | | | | | | $ | 76 | |
Farm real estate | | | 375 | | | | | | | | | 375 | |
1-4 Family | | | 226 | | | | | | | | | 226 | |
Other | | | 5,112 | | | | | | | | | 5,112 | |
| | | | | | | | | | | | |
| | | | | | | | | | | | | | |
Total impaired loans | | $ | 5,789 | | | | | | | | $ | 5,789 | |
Impaired servicing rights | | $ | 1,794 | | | | | | | | $ | 1,794 | |
Other real estate owned/assets held for sale | | | | | | | | | | | | | |
Construction and development | | $ | 522 | | | | | | | | $ | 522 | |
Home equity | | | 67 | | | | | | | | | 67 | |
Other commercial real estate | | | 425 | | | | | | | | | 425 | |
| | | | | | | | | | | | |
| | | | | | | | | | | | | | |
| | $ | 1,014 | | | | | | | | $ | 1,014 | |
| | | | | | | | | | | | | |
| |
| | Fair Value Measurements at December 31, 2012 Using | |
|---|
| | December 31, 2012
| | Quoted Prices in
Active Markets for
Identical Assets
(Level 1)
| | Significant
Other Observable
Inputs
(Level 2)
| | Significant
Unobservable
Inputs
(Level 3)
| |
|---|
| | |
Assets: | | | | | | | | | | | | | |
Impaired loans | | | | | | | | | | | | | |
Commercial and industrial | | $ | 155 | | | | | | | | $ | 155 | |
Farm real estate | | | 480 | | | | | | | | | 480 | |
Construction and development | | | 404 | | | | | | | | | 404 | |
Other | | | 4,936 | | | | | | | | | 4,936 | |
| | | | | | | | | | | | |
| | | | | | | | | | | | | | |
Total impaired loans | | $ | 5,975 | | | | | | | | $ | 5,975 | |
Impaired servicing rights | | $ | 2,942 | | | | | | | | $ | 2,942 | |
Other real estate owned/assets held for sale | | | | | | | | | | | | | |
Construction and development | | $ | 1,764 | | | | | | | | $ | 1,764 | |
Other commercial real estate | | | 803 | | | | | | | | | 803 | |
1-4 Family | | | 95 | | | | | | | | | 95 | |
| | | | | | | | | | | | |
| | | | | | | | | | | | | | |
| | $ | 2,662 | | | | | | | | $ | 2,662 | |
The following represent impairment charges recognized during the period:
Impaired loans, which are measured for impairment using the fair value of the collateral for collateral dependent loans, had a recorded investment of $6,879, with a valuation allowance of $1,090, resulting in an additional provision for loan losses of $432 in 2013. A breakdown on these loans by portfolio class is as follows:
| | | | | | | | | | |
| | Recorded
Investment
| | Valuation
Allowance
| | Net
| |
|---|
| | |
Commercial and industrial | | $ | 89 | | $ | 13 | | $ | 76 | |
Farm real estate | | | 435 | | | 60 | | | 375 | |
1-4 Family | | | 237 | | | 11 | | | 226 | |
Other | | | 6,118 | | | 1,006 | | | 5,112 | |
| | | | |
| | | | | | | | | | | |
Ending Balance | | $ | 6,879 | | $ | 1,090 | | $ | 5,789 | |
| | | | |
| | | | | | | | | | | |
| | | | | | | | | | | |
| | | | |
At December 31, 2012, impaired loans had a recorded investment of $9,151, with a valuation allowance of $3,176, resulting in an additional provision for loan losses of $1,958 for the year ending December 31, 2012.
61
Table of Contents
Impaired tranches of servicing rights were carried at a fair value of $1,794, which is made up of the gross outstanding balance of $2,169, net of a valuation allowance of $375. A recovery of $750 was included in 2013 earnings. In 2012, impaired servicing rights were written down to a fair value of $2,942, which was made up of the gross outstanding balance was $4,067, net of a valuation allowance of $1,125. A charge of $676 was included in 2012 earnings.
Other real estate owned/assets held for sale is evaluated at the time a property is acquired through foreclosure or moved to held for sale or shortly thereafter. Fair value is based on appraisals by qualified licensed appraisers. At December 31, 2013, the fair value is made up of the gross outstanding balance of $1,362, net a valuation allowance of $348. At December 31, 2012, the fair value is made up of the gross outstanding balance of $4,334, net a valuation allowance of $1,672. During 2013, these properties were written down by $175 which was included in 2013 earnings. During 2012, these properties were written down by $647 which was included in 2012 earnings. A breakdown of these properties by portfolio class at December 31, 2013 is as follows:
| | | | | | | | | | |
| | Gross
Balance
| | Valuation
Allowance
| | Net
| |
|---|
| | |
Construction and development | | $ | 645 | | $ | 123 | | $ | 522 | |
Other commercial real estate | | | 635 | | | 210 | | | 425 | |
Home Equity | | | 82 | | | 15 | | | 67 | |
| | | | |
| | | | | | | | | | | |
Ending Balance | | $ | 1,362 | | $ | 348 | | $ | 1,014 | |
| | | | |
| | | | | | | | | | | |
| | | | | | | | | | | |
| | | | |
The following table presents quantitative information about level 3 fair value measurements for financial instruments measured at fair value on a non-recurring basis at December 31, 2013 and 2012. Impaired commercial, commercial real estate loans, and other real estate owned that are deemed collateral dependent are valued based on the fair value of the underlying collateral. These estimates are based on the most recently available appraisals with certain adjustments made based on the type of property, age of appraisal, current status of the property and other related factors to estimate the current value of the collateral.
| | | | | | | | |
December 31, 2013
| | Fair Value
(in thousands)
| | Valuation
Technique(s)
| | Unobservable
Input(s)
| | Range/Average
|
|---|
| |
| Impaired Loans: | | | | | | | | |
Commercial & industrial | | $ 76 | | Sales comparison approach | | Adjustment for differences between comparable sales | | 0%-10%
10% Avg |
Farm real estate | | 375 | | Sales comparison approach | | Adjustment for differences between comparable sales | | 40%
40% Avg |
Other/1-4 Family | | 5,338
$5,789 | | Sales comparison approach | | Adjustment for differences between comparable sales, type of property, current status of property | | 0%-40%
25% Avg |
| Other real estate owned: | | | | | | | | |
Construction and development | | $ 522 | | Sales comparison approach | | Adjustment for differences between comparable sales. | | 10%
10% Avg |
Other and Home equity | | 492
$1,014 | | Sales comparison approach | | Adjustment for differences between comparable sales. | | 10%-15%
10% Avg |
Mortgage servicing rights |
|
$1,794 |
|
Cash flow analysis |
|
Discount rate |
|
10% |
62
Table of Contents
| | | | | | | | |
December 31, 2012
| | Fair Value
(in thousands)
| | Valuation
Technique(s)
| | Unobservable
Input(s)
| | Range/Average
|
|---|
| |
| Impaired Loans: | | | | | | | | |
Commercial & industrial | | $ 155 | | Liquidation value of inventory | | Management adjustment | | 15%
15% Avg |
Farm real estate | | 480 | | Sales comparison approach | | Adjustment for differences between comparable sales | | 35-40%
37% Avg |
Construction and development | | 404 | | Sales comparison approach | | Adjustment for differences between comparable sales | | 10%-50%
41% Avg |
Other | | 4,936
$5,975 | | Sales comparison approach | | Adjustment for differences between comparable sales, type of property, current status of property | | 0%-60%
32% Avg |
| Other real estate owned: | | | | | | | | |
Construction and development | | $1,764 | | Sales comparison approach | | Adjustment for differences between comparable sales. | | 10%-26%
15% Avg |
Other and 1-4 family | | 898
$2,662 | | Sales comparison approach | | Adjustment for differences between comparable sales. | | 2%-35%
17% Avg |
Mortgage servicing rights |
|
$2,942 |
|
Cash flow analysis |
|
Discount rate |
|
10% |
Carrying amount and estimated fair values of financial instruments, not previously presented, at year end were as follows:
| | | | | | | | | | | | | | | | |
December 31, 2013
| | Carrying
Amount
| | Level 1
| | Level 2
| | Level 3
| | Total
| |
|---|
| | |
Assets | | | | | | | | | | | | | | | | |
Cash and cash equivalents | | $ | 61,320 | | $ | 55,826 | | $ | 5,494 | | | | | $ | 61,320 | |
Loans including loans held for sale, net | | | 1,644,527 | | | | | | 6,158 | | | 1,657,199 | | | 1,663,357 | |
Restricted stock | | | 15,629 | | | | | | | | | | | | N/A | |
Interest receivable | | | 9,706 | | | | | | 4,573 | | | 5,133 | | | 9,706 | |
Liabilities | | | | | | | | | | | | | | | | |
Deposits | | | (2,200,628 | ) | | (436,550 | ) | | (1,764,719 | ) | | | | | (2,201,269 | ) |
Other borrowings | | | (38,594 | ) | | | | | (38,594 | ) | | | | | (38,594 | ) |
FHLB advances | | | (247,858 | ) | | | | | (252,402 | ) | | | | | (252,402 | ) |
Interest payable | | | (799 | ) | | | | | (799 | ) | | | | | (799 | ) |
Subordinated debentures | | | (46,394 | ) | | | | | (23,130 | ) | | | | | (23,130 | ) |
| | | | | | | | | | | | | | | | |
December 31, 2012
| | Carrying
Amount
| | Level 1
| | Level 2
| | Level 3
| | Total
| |
|---|
| | |
Assets | | | | | | | | | | | | | | | | |
Cash and cash equivalents | | $ | 65,650 | | $ | 58,100 | | $ | 7,550 | | | | | $ | 65,650 | |
Loans including loans held for sale, net | | | 1,532,247 | | | | | | 17,616 | | | 1,538,489 | | | 1,556,105 | |
Restricted stock | | | 15,639 | | | | | | | | | | | | N/A | |
Interest receivable | | | 9,827 | | | | | | 4,621 | | | 5,206 | | | 9,827 | |
Liabilities | | | | | | | | | | | | | | | | |
Deposits | | | (2,185,054 | ) | | (405,167 | ) | | (1,780,511 | ) | | | | | (2,185,678 | ) |
Other borrowings | | | (34,519 | ) | | | | | (34,519 | ) | | | | | (34,519 | ) |
FHLB advances | | | (141,052 | ) | | | | | (152,018 | ) | | | | | (152,018 | ) |
Interest payable | | | (1,195 | ) | | | | | (1,195 | ) | | | | | (1,195 | ) |
Subordinated debentures | | | (50,418 | ) | | | | | (31,763 | ) | | | | | (31,763 | ) |
The difference between the loan balance included above and the amounts shown in Note 5 are the impaired loans discussed above.
The methods and assumptions, not previously presented, used to estimate fair values are described as follows:
(a) Cash and Cash Equivalents
The carrying amounts of cash and short-term instruments approximate fair values and are classified as either Level 1 or Level 2. Noninterest bearing deposits are Level 1 whereas interest bearing due from bank accounts and fed funds sold are Level 2.
63
Table of Contents
(b) Restricted Stock
It is not practical to determine the fair value of FHLB stock due to restrictions placed on its transferability.
(c) Loans, Net
Fair values of loans are estimated as follows: For variable rate loans that reprice frequently and with no significant change in credit risk, fair values are based on carrying values resulting in a Level 3 classification. Fair values for other loans are estimated using discounted cash flow analyses, using interest rates currently being offered for loans with similar terms to borrowers of similar credit quality resulting in a Level 3 classification. Loans held for sale is estimated based upon binding contracts and quotes from third party investors resulting in a Level 2 classification. Impaired loans are valued at the lower of cost or fair value as described previously. The methods utilized to estimate the fair value of loans do not necessarily represent an exit price.
(d) Deposits
The fair values disclosed for non-interest bearing deposits are equal to the amount payable on demand at the reporting date resulting in a Level 1 classification. The carrying amounts of variable rate interest bearing deposits approximate their fair values at the reporting date resulting in a Level 2 classification. Fair values for fixed rate interest bearing deposits are estimated using a discounted cash flows calculation that applies interest rates currently being offered on certificates to a schedule of aggregated expected monthly maturities on time deposits resulting in a Level 2 classification.
(e) Other Borrowings
The fair values of the Company's FHLB advances are estimated using discounted cash flow analyses based on the current borrowing rates resulting in a Level 2 classification.
The fair values of the Company's subordinated debentures are estimated using discounted cash flow analyses based on the current borrowing rates for similar types of borrowing arrangements resulting in a Level 3 classification.
The fair values of the Company's Other borrowings are estimated using discounted cash flow analyses based on current borrowing rates resulting in a Level 2 classification.
(f) Accrued Interest Receivable/Payable
The carrying amounts of accrued interest approximate fair value resulting in a Level 2 or Level 3 classification based on the level of the asset or liability with which the accrual is associated.
NOTE 8 — PREMISES AND EQUIPMENT
| | | | | | | |
December 31
| | 2013
| | 2012
| |
|---|
| | |
Land | | $ | 14,445 | | $ | 14,090 | |
Buildings | | | 50,638 | | | 48,640 | |
Furniture and equipment | | | 35,727 | | | 34,835 | |
| | | | |
| | | | | | | | |
Total cost | | | 100,810 | | | 97,565 | |
Accumulated depreciation | | | (44,853 | ) | | (43,464 | ) |
| | | | |
| | | | | | | | |
Net | | $ | 55,957 | | $ | 54,101 | |
| | | | |
| | | | | | | | |
| | | | | | | | |
| | | | |
Depreciation expense was $5,783, $5,440, and $5,074 in 2013, 2012 and 2011.
Operating Leases: The Company leases certain branch properties under operating leases. Rent expense was $1,056, $1,126, and $933 for 2013, 2012, and 2011. Rent commitments, before considering renewal options that generally are present, were as follows:
| | | | |
2014 | | $ | 1,087 | |
2015 | | | 931 | |
2016 | | | 659 | |
2017 | | | 445 | |
2018 | | | 411 | |
Thereafter | | | 1,245 | |
| | | | |
| | | | | |
Total | | $ | 4,778 | |
| | | | |
| | | | | |
| | | | | |
| | | | |
64
Table of Contents
NOTE 9 — GOODWILL AND INTANGIBLE ASSETS
Goodwill
The change in carrying amount of goodwill is as follows.
| | | | | | | |
| | 2013
| | 2012
| |
|---|
| | |
Balance, January 1 | | $ | 63,947 | | $ | 61,919 | |
Acquired goodwill | | | 953 | | | 2,028 | |
| | | | |
| | | | | | | | |
Balance, December 31 | | $ | 64,900 | | $ | 63,947 | |
| | | | |
| | | | | | | | |
| | | | | | | | |
| | | | |
The Company tests goodwill for impairment on an annual basis, or more often if events or circumstances indicate there may be impairment. Impairment exists when a reporting unit's carrying value of goodwill exceeds its fair value. At June 30, 2013, the Company elected to perform a quantitative assessment to determine if the fair value of the reporting unit exceeded its carrying value, including goodwill. The quantitative assessment indicated that the fair value of the reporting unit exceeded its carrying value, resulting in no impairment.
A discussion of goodwill acquired in 2013 and 2012 can be found at Note 26.
Acquired Intangible Assets
| | | | | | | |
| | 2013
| | 2012
| |
|---|
| | |
Core deposit intangibles | | $ | 27,169 | | $ | 27,169 | |
Other customer relationship intangibles | | | 2,194 | | | 2,194 | |
Accumulated amortization | | | (24,238 | ) | | (22,370 | ) |
| | | | |
| | | | | | | | |
Purchased intangibles, net | | $ | 5,125 | | $ | 6,993 | |
| | | | |
| | | | | | | | |
| | | | | | | | |
| | | | |
Aggregate amortization expense was $1,868, $1,835, and $1,939 for 2013, 2012, and 2011.
Estimated amortization expense for each of the next five years follows:
| | | | |
2014 | | $ | 1,643 | |
2015 | | | 1,402 | |
2016 | | | 715 | |
2017 | | | 347 | |
2018 | | | 272 | |
NOTE 10 — DEPOSITS
| | | | | | | |
| | December 31,
2013
| | December 31,
2012
| |
|---|
| | |
Non-interest-bearing demand | | $ | 436,550 | | $ | 405,167 | |
Interest-bearing demand | | | 884,128 | | | 855,049 | |
Savings | | | 501,494 | | | 470,265 | |
Certificates of deposit of $100 or more | | | 129,132 | | | 149,806 | |
Other certificates and time deposits | | | 249,324 | | | 304,767 | |
| | | | |
| | | | | | | | |
Total deposits | | $ | 2,200,628 | | $ | 2,185,054 | |
| | | | |
| | | | | | | | |
| | | | | | | | |
| | | | |
Certificates and other time deposits mature as follows:
| | | | |
2014 | | $ | 239,612 | |
2015 | | | 71,440 | |
2016 | | | 30,164 | |
2017 | | | 22,523 | |
2018 | | | 7,344 | |
Thereafter | | | 7,373 | |
| | | | |
| | | | | |
Total | | $ | 378,456 | |
| | | | |
| | | | | |
| | | | | |
| | | | |
65
Table of Contents
NOTE 11 — OTHER BORROWINGS
| | | | | | | |
December 31
| | 2013
| | 2012
| |
|---|
| | |
Other borrowings consisted of the following at year-end: | | | | | | | |
Securities sold under repurchase agreements | | $ | 29,394 | | $ | 25,794 | |
Federal funds purchased | | | 9,200 | | | 8,725 | |
| | | | |
| | | | | | | | |
Total other borrowings | | $ | 38,594 | | $ | 34,519 | |
| | | | |
| | | | | | | | |
| | | | | | | | |
| | | | |
Securities sold under repurchase agreements ("agreements") consist of obligations secured by securities issued by government-sponsored entities, and a safekeeping agent holds such collateral. The balance at December 31, 2013 and 2012 was $29,394 and $25,794 respectively. The majority of the agreements at December 31, 2013 mature within 30 days.
Information concerning securities sold under agreements to repurchase is summarized as follows:
| | | | | | | | | | |
| | 2013
| | 2012
| | 2011
| |
|---|
| | |
Average daily balance during the year | | $ | 29,132 | | $ | 28,243 | | $ | 30,404 | |
Average interest rate during the year | | | 0.17 | % | | 0.34 | % | | 0.52 | % |
Maximum month-end balance during the year | | $ | 31,479 | | $ | 30,974 | | $ | 40,960 | |
Weighted average interest rate at year-end | | | 0.18 | % | | 0.20 | % | | 0.44 | % |
NOTE 12 — FEDERAL HOME LOAN BANK ADVANCES
Federal Home Loan Bank ("FHLB") advances at year end were as follows:
| | | | | | | |
| | 2013
| | 2012
| |
|---|
| | |
Maturities from January 2014 through May 2022, primarily fixed rates from 0.3% to 4.8%, averaging 1.3% | | $ | 247,858 | | | | |
Maturities from April 2013 through May 2022, primarily fixed rates from 0.56% to 5.9%, averaging 3.0% | | | | | $ | 141,052 | |
| | | | |
| | | | | | | | |
| | $ | 247,858 | | $ | 141,052 | |
| | | | |
| | | | | | | | |
| | | | | | | | |
| | | | |
The majority of the FHLB advances are secured by mortgage loans totaling approximately 170% of the advance under a blanket security agreement. The advances are subject to restrictions or penalties in the event of prepayment. Of the $247,858 in advances at December 31, 2013, $0 of the advances contained options whereby the FHLB may convert the fixed rate advance to an adjustable rate advance, at which time the Company may prepay the advance without a penalty. Of the $141,052 in advances at December 31, 2012, $105,000 or 74% of the advances contained such options.
Required payments over the next five years are:
| | | | |
2014 | | $ | 133,294 | |
2015 | | | 25,070 | |
2016 | | | 14,735 | |
2017 | | | 33 | |
2018 | | | 74,692 | |
Thereafter | | | 34 | |
NOTE 13 — SUBORDINATED DEBENTURES
The Company formed four separate trusts in 2002, 2003, and 2006 that issued floating rate trust preferred securities as part of pooled offerings. The Company issued subordinated debentures to the trusts in exchange for the proceeds of the offerings, which debentures represent the sole asset of the trusts. The Company acquired two trusts from a prior acquisition — Harrodsburg Statutory Trust I and Independence Bancorp Statutory Trust I. The Independence Bancorp Statutory Trust I was paid off in the fourth quarter of 2013. In accordance with accounting guidelines, the trusts are not consolidated with the Company's financial statements, but rather the subordinated debentures are shown as a liability, because the Company is not considered the primary beneficiary of the trusts. The Company's investment in the common stock of the trust was $1,394 at December 31, 2013 and $1,518 at December 31, 2012 and is included in interest receivable and other assets on the consolidated balance sheets. Interest payments are payable quarterly in arrears and the Company has the option to defer interest payments from time to time for a period not to exceed 20 consecutive quarters. The subordinated debentures mature in 30 years from issuance and can be called anytime after five years at par.
66
Table of Contents
The subordinated debentures may be included in Tier 1 capital (with certain limitations) under current regulatory guidelines and interpretations. The following table summarizes the other terms of each issuance.
| | | | | | | | | | | | | | | | | | | |
Trust Name
| | Issuance
| | Amount
December 31,
2013
| | Amount
December 31,
2012
| | Variable
Rate
| | Rate as of
12/31/13
| | Maturity
| |
|---|
| | |
Trust 1 | | | 2002 | | $ | 8,248 | | $ | 8,248 | | | LIBOR +3.25 | % | | 3.50 | % | | 2032 | |
Trust 2 | | | 2003 | | | 14,433 | | | 14,433 | | | LIBOR +3.25 | % | | 3.50 | % | | 2033 | |
Trust 3 | | | 2003 | | | 7,217 | | | 7,217 | | | LIBOR +3.15 | % | | 3.39 | % | | 2033 | |
Trust 4 | | | 2006 | | | 11,341 | | | 11,341 | | | LIBOR +1.63 | % | | 1.87 | % | | 2036 | |
Harrodsburg | | | 2003 | | | 5,155 | | | 5,100 | | | LIBOR +3.15 | % | | 3.40 | % | | 2033 | |
Independence | | | 2003 | | | — | | | 4,079 | | | LIBOR +3.15 | % | | — | | | 2033 | |
| | | | | | | | | | | | | | | | |
| | | | | | | | | | | | | | | | | | | | |
| | | | | $ | 46,394 | | $ | 50,418 | | | | | | | | | | |
| | | | | | | | | | | | | | | | |
| | | | | | | | | | | | | | | | | | | | |
| | | | | | | | | | | | | | | | | | | | |
| | | | | | | | | | | | | | | | |
NOTE 14 — MORTGAGE BANKING AND LOAN SERVICING
Net revenues from mortgage banking activity consisted of the following:
| | | | | | | | | | |
| | Years Ended December 31 | |
|---|
| | 2013
| | 2012
| | 2011
| |
|---|
| | |
Gain from sale of mortgage loans and interest rate locks | | $ | 3,956 | | $ | 9,126 | | $ | 3,534 | |
Mortgage loan servicing revenue (expense): | | | | | | | | | | |
Mortgage loan servicing revenue | | | 3,565 | | | 3,441 | | | 3,360 | |
Amortization of mortgage servicing rights | | | (1,472 | ) | | (1,964 | ) | | (1,388 | ) |
Mortgage servicing rights valuation adjustments | | | 750 | | | (676 | ) | | 45 | |
| | | | |
| | | | | | | | | | | |
Net servicing revenue | | | 2,843 | | | 801 | | | 2,017 | |
| | | | |
| | | | | | | | | | | |
Net revenue from mortgage banking activity | | $ | 6,799 | | $ | 9,927 | | $ | 5,551 | |
| | | | |
| | | | | | | | | | | |
| | | | | | | | | | | |
| | | | |
Loans serviced for others are not included in the accompanying consolidated balance sheets. Loan servicing fee income was $2,038, $1,864, and $2,104 for 2013, 2012, and 2011. The unpaid principal balances of loans serviced for others totaled $785,794 and $758,074 at December 31, 2013 and 2012. Custodial escrow balances maintained in connection with serviced loans were $6,234 and $8,296 at year end 2013 and 2012. The weighted average amortization period is 6.4 years. Mortgage servicing rights are included in other assets on the consolidated balance sheets. The fair value of capitalized mortgage servicing assets is based on comparable market values and expected cash flows, with impairment assessed based on portfolio characteristics including product type and interest rates. The carrying value of capitalized mortgage servicing rights was $5,155 and $4,350 at year end 2013 and 2012. Fair value at year-end 2013 was determined using a discount rate of 10%, and prepayment speeds ranging from 105% to 368%, depending on the stratification of the specific right. Fair value at year-end 2012 was determined using a discount rate of 10%, and prepayment speeds ranging from 112% to 505%, depending on the stratification of the specific right. The notional amount of interest rate lock commitments to make 1-4 family residential mortgage loans intended to be sold on the secondary market totaled $20.7 million and $66.7 million at December 31, 2013 and 2012, respectively. The estimated fair value of these commitments totaled $525 and $2,200 at December 31, 2013 and 2012, respectively, and is included in other assets on the consolidated balance sheet.
| | | | | | | | | | |
| | 2013
| | 2012
| | 2011
| |
|---|
| | |
Mortgage servicing assets | | | | | | | | | | |
Balances, January 1 | | $ | 4,350 | | $ | 5,412 | | $ | 5,498 | |
Servicing assets capitalized | | | 1,527 | | | 1,578 | | | 1,257 | |
Amortization of servicing assets | | | (1,472 | ) | | (1,964 | ) | | (1,388 | ) |
Change in valuation allowance | | | 750 | | | (676 | ) | | 45 | |
| | | | |
| | | | | | | | | | | |
Balance, December 31 | | $ | 5,155 | | $ | 4,350 | | $ | 5,412 | |
| | | | |
| | | | | | | | | | | |
| | | | | | | | | | | |
| | | | |
Valuation allowance: | | | | | | | | | | |
Balances, January 1 | | $ | 1,125 | | $ | 449 | | $ | 494 | |
Additions expensed | | | — | | | 676 | | | 300 | |
Reductions credited to operations | | | (750 | ) | | — | | | (345 | ) |
| | | | |
| | | | | | | | | | | |
Balance, December 31 | | $ | 375 | | $ | 1,125 | | $ | 449 | |
| | | | |
| | | | | | | | | | | |
| | | | | | | | | | | |
| | | | |
67
Table of Contents
NOTE 15 — INCOME TAX
Income tax expense (benefit) was as follows:
| | | | | | | | | | |
Year Ended December 31
| | 2013
| | 2012
| | 2011
| |
|---|
| | |
Income tax expense | | | | | | | | | | |
Currently payable | | $ | 3,616 | | $ | 4,419 | | $ | 3,746 | |
Deferred | | | 1,589 | | | 1,731 | | | (1,165 | ) |
Change in valuation allowance | | | 114 | | | (123 | ) | | 1,157 | |
| | | | |
| | | | | | | | | | | |
Total income tax expense | | $ | 5,319 | | $ | 6,027 | | $ | 3,738 | |
| | | | |
| | | | | | | | | | | |
| | | | | | | | | | | |
| | | | |
Effective tax rates differ from the federal statutory rate of 35% applied to income before income taxes due to the following:
| | | | | | | | | | |
Federal statutory income tax rate | | | 35 | % | | 35 | % | | 35 | % |
Federal statutory income tax | | $ | 11,082 | | $ | 11,650 | | $ | 9,643 | |
Tax exempt interest | | | (4,529 | ) | | (4,527 | ) | | (4,631 | ) |
Effect of state income taxes | | | 111 | | | 192 | | | 72 | |
Non-deductible expenses | | | 504 | | | 349 | | | 163 | |
Tax exempt income on life insurance | | | (482 | ) | | (422 | ) | | (469 | ) |
Tax credits | | | (757 | ) | | (861 | ) | | (898 | ) |
Change in valuation allowance | | | 114 | | | (123 | ) | | 1,157 | |
Captive insurance premiums | | | (91 | ) | | — | | | — | |
Other | | | (633 | ) | | (231 | ) | | (1,299 | ) |
| | | | |
| | | | | | | | | | | |
Income tax expense | | $ | 5,319 | | $ | 6,027 | | $ | 3,738 | |
| | | | |
| | | | | | | | | | | |
| | | | | | | | | | | |
| | | | |
The components of the net deferred tax asset (liability) are as follows:
| | | | | | | |
December 31
| | 2013
| | 2012
| |
|---|
| | |
Assets | | | | | | | |
Allowance for loan losses | | $ | 10,717 | | $ | 12,427 | |
State net operating loss carryforward | | | 6,357 | | | 5,898 | |
Credit carryforwards | | | 9,987 | | | 8,595 | |
OREO write-downs | | | 884 | | | 953 | |
Other | | | 2,755 | | | 2,765 | |
| | | | |
| | | | | | | | |
Total assets | | | 30,700 | | | 30,638 | |
| | | | |
| | | | | | | | |
Liabilities | | | | | | | |
Depreciation | | | (3,639 | ) | | (3,664 | ) |
Mortgage servicing rights | | | (2,046 | ) | | (1,722 | ) |
Unrealized gain on securities AFS | | | (611 | ) | | (13,854 | ) |
Intangibles | | | (2,197 | ) | | (1,085 | ) |
Deferred loan fees/costs | | | (1,513 | ) | | (1,241 | ) |
Other | | | (1,290 | ) | | (1,322 | ) |
| | | | |
| | | | | | | | |
Total liabilities | | | (11,296 | ) | | (22,888 | ) |
| | | | |
| | | | | | | | |
Less: Valuation allowance | | | (6,030 | ) | | (5,916 | ) |
| | | | |
| | | | | | | | |
Net deferred tax asset | | $ | 13,374 | | $ | 1,834 | |
| | | | |
| | | | | | | | |
| | | | | | | | |
| | | | |
As of December 31, 2013, the Company had $2,662 of alternative minimum tax credit carryforwards, which under current tax law have no expiration period. The Company had general business credit carryforwards of $7,325 that begin to expire in 2027.
The Company has an Indiana state operating loss carryforward of $115,050, which begins to expire in 2019. The Company maintains a valuation allowance to reduce these carryforward items and other Indiana deferred tax assets to the amount expected to be realized.
A valuation allowance for deferred tax assets is recorded when it is more likely than not that some portion or all of the deferred tax assets will not be realized. The ultimate realization of the deferred tax assets depends on the ability of the Company to generate sufficient taxable income of the appropriate character in the future and in the appropriate taxing jurisdictions. At December 31, 2013, the largest component of deferred tax assets is associated with the allowance for loan losses. The Company considers the scheduled
68
Table of Contents
reversal of deferred tax liabilities, projected future taxable income, and tax planning strategies in making this assessment. With the exception of the deferred tax asset associated with the Company's Indiana deferred tax assets, no valuation allowance for deferred tax assets were considered necessary at December 31, 2013 or 2012.
Retained earnings of the subsidiary bank include approximately $13,112 for which no deferred income tax liability has been recognized. This amount represents an allocation of previously acquired institutions to bad debt deductions as of December 31, 1987 for tax purposes only. Reduction of amounts so allocated for purposes other than tax bad debt losses including redemption of bank stock or excess dividends, or loss of "bank" status would create income for tax purposes only, which would be subject to the then-current corporate income tax rate. The unrecorded deferred income tax liability on the above amount for the Company was approximately $4,589 at each of December 31, 2013 and 2012.
Unrecognized Tax Benefits
The Company does not have any unrecognized tax benefits during any periods presented and does not expect this to significantly change in the next twelve months.
There were no interest and penalties recorded in the income statement during any period and no amounts accrued for interest and penalties at December 31, 2013, or 2012.
The Company and its subsidiaries are subject to U.S. federal income tax as well as income tax of the states of Indiana and Illinois. The Company is no longer subject to examination by taxing authorities for years before 2010.
NOTE 16 — COMMITMENTS
Some financial instruments, such as loan commitments, credit lines, letters of credit, and overdraft protection, are issued to meet customer financing needs. These are agreements to provide credit or to support the credit of others, as long as conditions established in the contract are met, and usually have expiration dates. Commitments may expire without being used. Off-balance sheet risk to credit loss exists up to the face amount of these instruments, although material losses are not anticipated. The same credit policies are used to make such commitments as are used for loans, including obtaining collateral at exercise of the commitment.
Financial instruments whose contract amount represents credit risk as of December 31 were as follows:
| | | | | | | | | | | | | |
| | 2013 | | 2012 | |
|---|
| | Fixed
Rate
| | Variable
Rate
| | Fixed
Rate
| | Variable
Rate
| |
|---|
| | |
Commitments to extend credit and unused lines of credit | | $ | 16,196 | | $ | 453,500 | | $ | 2,691 | | $ | 392,674 | |
Commercial letters of credit | | | — | | | 12,318 | | | — | | | 13,933 | |
Commitments to make loans are generally made for periods of 60 days or less. Interest rates on fixed rate commitments range from 2.95% to 19.8% with maturities ranging from 1 year to 5 years.
NOTE 17 — DIVIDENDS
The Company's principal source of funds for dividend payments is dividends received from the Bank. Banking regulations limit the amount of dividends that may be paid without prior approval of regulatory agencies. Under these regulations, the amount of dividends that may be paid in any calendar year is limited to the current year's net profits, combined with the retained net profits of the preceding two years, subject to the capital requirements described in Note 19. As of December 31, 2013, the Bank would need to earn approximately $16,700 in 2014 before the Bank could declare dividends without regulatory approval.
NOTE 18 — DIVIDEND REINVESTMENT PLAN
The Company maintains an Automatic Dividend Reinvestment Plan. The plan enables shareholders to elect to have their cash dividends on all or a portion of shares held automatically reinvested in additional shares of the Company's common stock. The stock is purchased by the Company's transfer agent on the open market and credited to participant accounts at fair market value. Dividends are reinvested on a quarterly basis.
NOTE 19 — REGULATORY MATTERS
Banks and bank holding companies are subject to various regulatory capital requirements administered by the federal banking agencies and are assigned to a capital category. The assigned capital category is largely determined by three ratios that are calculated according to the regulations. The ratios are intended to measure capital relative to assets and credit risk associated with those assets and off-balance sheet exposures. The capital category assigned to an entity can also be affected by qualitative judgments made by
69
Table of Contents
regulatory agencies about the risk inherent in the entity's activities that are not part of the calculated ratios. Failure to meet capital requirements can initiate regulatory action. Risk adjusted capital levels of the Company's subsidiary bank exceed regulatory definitions of well-capitalized institutions.
Management believes as of December 31, 2013, the Company and Bank meet all capital adequacy requirements to which they are subject. The holding company is a source of additional financial strength with its $11.7 million in cash and its ability to downstream additional capital to the Bank.
There are five capital categories defined in the regulations, ranging from well capitalized to critically undercapitalized. Classification in any of the undercapitalized categories can result in actions by regulators that could have a material effect on operations. At December 31, 2013 and 2012, the most recent regulatory notifications categorized the Bank as well capitalized under the regulatory framework for prompt corrective actions. There are no conditions or events since that notification that management believes have changed the Bank's category.
Actual and required capital amounts and ratios are presented below.
| | | | | | | | | | | | | | | | | | | |
| | Actual
| | Required for
Adequate Capital
| | To Be
Well Capitalized
| |
|---|
| | | |
|---|
December 31, 2013
| | Amount
| | Ratio
| | Amount
| | Ratio
| | Amount
| | Ratio
| |
|---|
| | |
MainSource Financial Group | | | | | | | | | | | | | | | | | | | |
Total capital (to risk-weighted assets) | | $ | 302,181 | | | 16.7 | % | $ | 145,150 | | | 8.0 | % | | N/A | | | N/A | |
Tier 1 capital (to risk-weighted assets) | | | 279,440 | | | 15.4 | | | 72,575 | | | 4.0 | | | N/A | | | N/A | |
Tier 1 capital (to average assets) | | | 279,440 | | | 10.1 | | | 110,428 | | | 4.0 | | | N/A | | | N/A | |
MainSource Bank | | | | | | | | | | | | | | | | | | | |
Total capital (to risk-weighted assets) | | $ | 283,653 | | | 15.7 | % | $ | 144,147 | | | 8.0 | % | $ | 180,184 | | | 10.0 | % |
Tier 1 capital (to risk-weighted assets) | | | 261,069 | | | 14.5 | | | 72,074 | | | 4.0 | | | 108,111 | | | 6.0 | |
Tier 1 capital (to average assets) | | | 261,069 | | | 9.6 | | | 109,090 | | | 4.0 | | | 136,363 | | | 5.0 | |
| | | | | | | | | | | | | | | | | | | |
| | Actual
| | Required for
Adequate Capital
| | To Be
Well Capitalized
| |
|---|
| | | |
|---|
December 31, 2012
| | Amount
| | Ratio
| | Amount
| | Ratio
| | Amount
| | Ratio
| |
|---|
| | |
MainSource Financial Group | | | | | | | | | | | | | | | | | | | |
Total capital (to risk-weighted assets) | | $ | 296,714 | | | 17.8 | % | $ | 133,549 | | | 8.0 | % | | N/A | | | N/A | |
Tier 1 capital (to risk-weighted assets) | | | 275,707 | | | 16.5 | | | 66,774 | | | 4.0 | | | N/A | | | N/A | |
Tier 1 capital (to average assets) | | | 275,707 | | | 10.4 | | | 106,077 | | | 4.0 | | | N/A | | | N/A | |
MainSource Bank | | | | | | | | | | | | | | | | | | | |
Total capital (to risk-weighted assets) | | $ | 283,303 | | | 17.2 | % | $ | 132,052 | | | 8.0 | % | $ | 165,065 | | | 10.0 | % |
Tier 1 capital (to risk-weighted assets) | | | 262,527 | | | 15.9 | | | 66,026 | | | 4.0 | | | 99,039 | | | 6.0 | |
Tier 1 capital (to average assets) | | | 262,527 | | | 9.9 | | | 106,077 | | | 4.0 | | | 132,596 | | | 5.0 | |
NOTE 20 — EMPLOYEE BENEFIT PLANS
The Company has a defined-contribution retirement plan in which substantially all employees may participate. The Company matches 80% of the first 8% of eligible employees' contributions and makes additional contributions based on employee compensation and the overall profitability of the Company. Expense was $2,419 in 2013, $2,377 in 2012, and $2,269 in 2011 which include an additional contribution in 2013, 2012 and 2011 based on the overall profitability of the Company.
NOTE 21 — RELATED PARTY TRANSACTIONS
The Company has entered into transactions with certain directors, executive officers, significant shareholders and their affiliates or associates (related parties).
The aggregate amount of loans, as defined, to such related parties was as follows:
| | | | |
Balances, January 1, 2013 | | $ | 2,263 | |
Changes in composition of related parties | | | (42 | ) |
New loans, including renewals and advances | | | 743 | |
Payments, including renewals | | | (467 | ) |
| | | | |
| | | | | |
Balances, December 31, 2013 | | $ | 2,497 | |
| | | | |
| | | | | |
| | | | | |
| | | | |
Deposits from related parties held by the Company at December 31, 2013 and 2012 totaled $1,342 and $5,788.
70
Table of Contents
NOTE 22 — STOCK-BASED COMPENSATION
On January 16, 2007, the Company's Board of Directors adopted and approved the MainSource Financial Group, Inc. 2007 Stock Incentive Plan (the "2007 Stock Incentive Plan") effective upon the approval of the Plan by the Company's shareholders, which occurred on April 26, 2007 at the Company's annual meeting of shareholders. The 2007 Stock Incentive Plan provides for the grant of incentive stock options, nonstatutory stock options, stock bonuses and restricted stock awards. Incentive stock options may be granted only to employees. An aggregate of 650,000 shares of common stock are reserved for issuance under the 2007 Stock Incentive Plan. Shares issuable under the 2007 Stock Incentive Plan may be authorized and unissued shares of common stock or treasury shares. The 2007 Stock Incentive Plan is in addition to, and not in replacement of, a similar plan adopted in 2003 (the "2003 Plan"). However, no further awards of options will be made under the 2003 Plan. Unexercised options, which were previously issued under the 2003 Plan, were not terminated, but continued in accordance with the 2003 Plan and the agreements pursuant to which the options were issued.
The fair value of each option award is estimated on the date of grant using a closed form option valuation (Black-Scholes) model that uses the assumptions noted in the table below. Expected volatilities are based on historical volatilities of the Company's common stock. The Company uses historical data to estimate option exercise and post-vesting termination behavior. Employee and management options are tracked separately. The expected term of options granted is based on historical data and represents the period of time that options granted are expected to be outstanding, which takes into account that the options are not transferable. The risk-free interest rate for the expected term of the option is based on the U.S. Treasury yield curve in effect at the time of the grant.
The fair value of options granted was determined using the following weighted average assumptions as of grant date.
| | | | | | | | | | |
| | 2013
| | 2012
| | 2011
| |
|---|
| | |
Risk-free interest rate | | | 1.35 | % | | 1.29 | % | | 2.36 | % |
Expected term (years) | | | 7.00 | | | 7.00 | | | 7.00 | |
Expected stock price volatility | | | 33.93 | % | | 40.19 | % | | 61.41 | % |
Dividend yield | | | 1.77 | % | | 0.42 | % | | 0.46 | % |
A summary of the activity in the 2007 Stock Incentive Plan and the 2003 Plan for 2013 follows:
| | | | | | | | | | | | | |
Options (restated for stock dividends and splits)
| | Shares
| | Weighted
Average
Exercise
Price
| | Weighted
Average
Remaining
Contractual
Term
(years)
| | Aggregate
Intrinsic
Value
| |
|---|
| | |
Outstanding, beginning of year | | | 433,132 | | $ | 13.06 | | | | | | | |
Granted | | | 57,783 | | | 13.98 | | | | | | | |
Exercised | | | (46,224 | ) | | 8.41 | | | | | | | |
Forfeited or expired | | | (42,552 | ) | | 12.68 | | | | | | | |
| | | | |
| | | | | | | | | | | | | | |
Outstanding at end of year | | | 402,139 | | $ | 13.79 | | | 5.2 | | $ | 1,900 | |
Exercisable at year end | | | 295,680 | | $ | 14.21 | �� | | 3.9 | | $ | 1,327 | |
Fully vested and expected to vest | | | 392,516 | | $ | 13.81 | | | 5.1 | | $ | 1,852 | |
Information related to the 2007 Stock Incentive Plan and the 2003 Plan during each year follows:
| | | | | | | | | | |
| | 2013
| | 2012
| | 2011
| |
|---|
| | |
Intrinsic value of options exercised | | $ | 265 | | $ | 124 | | $ | — | |
Cash received from option exercises | | | 389 | | | 120 | | | — | |
Tax benefit realized from option exercises | | | 25 | | | 12 | | | — | |
Weighted average (per share) fair value of options granted | | | 4.16 | | | 4.88 | | | 5.16 | |
The intrinsic value for stock options is calculated based on the exercise price of the underlying awards and the market price of the Company's common stock as of the reporting date for those options where the exercise price is less than the market price.
The Company recorded $161, $169, and $72 in stock option compensation expense during 2013, 2012, and 2011 to salaries and employee benefits. As of December 31, 2013, there was $405 of total unrecognized compensation cost related to nonvested stock options granted under the Plan. The cost is expected to be recognized over a weighted-average period of 2.5 years.
During the second quarters of 2012 and 2013, the Executive Compensation Committee of the Board of Directors of the Company granted restricted stock awards in lieu of cash awards to certain executive officers pursuant to the Company's long-term incentive plan (the "LTIP"). Compensation expense is recognized over the vesting period of the awards based on the fair value of the stock at the issue date. The value of the awards was determined by multiplying the award amount by the closing price of a share of
71
Table of Contents
Company common stock on the grant date, April 10, 2013 ($13.67) and April 25, 2012 ($11.85). The restricted stock awards vest as follows — 80% on the second anniversary of the date of grant and 20% on the third anniversary of the date of grant. A total of 10,792 shares of common stock of the Company were granted in 2013 and 48,061 shares of common stock were granted in 2012.
Also in the second quarter of 2013, the Executive Compensation Committee of the Board of Directors of the Company granted restricted stock awards to certain executive officers and other employees pursuant to the Company's LTIP. Compensation expense is recognized over the vesting period of the awards based on the fair value of the stock at the issue date. The value of the awards was determined by multiplying the award amount by the closing price of a share of Company common stock on the grant date. The restricted stock awards vest as follows — 100% on the third anniversary of the date of grant. A total of 37,179 shares of common stock of the Company were granted in 2013.
A summary of changes in the Company's nonvested shares for 2013 follows:
| | | | | | | |
| | Shares
| | Weighted Average
Grant Date
Fair Value
| |
|---|
| | |
Nonvested at January 1, 2013 | | | 94,305 | | $ | 10.79 | |
Granted | | | 47,971 | | | 14.46 | |
Vested | | | (36,993 | ) | | 10.68 | |
Forfeited | | | — | | | — | |
| | | | |
| | | | | | | | |
Nonvested at December 31, 2013 | | | 105,283 | | $ | 12.85 | |
As of December 31, 2013, there was $1,056 of total unrecognized compensation costs related to nonvested restricted stock awards granted under the 2007 Stock Incentive Plan that will be recognized over the remaining vesting period of approximately 1.30 years. The recognized compensation costs related to the 2007 Stock Incentive Plan was $590, $322, and $101 for the 2013, 2012, and 2011 respectively.
During the second quarter of 2011, members of the Board of Directors of the Company were given the option of having their retainer paid in cash, Company stock, or a combination of cash and stock. The retainer was paid quarterly, on May 1, August 1, and November 1, 2011, and February 1, 2012, for all directors serving on the Board on those dates. During the second quarter of 2012, members of the Board of Directors of the Company were also given the option of having their retainer paid in cash, Company stock, or a combination of cash and stock. The retainer was paid quarterly on May 1, August 1, and November 1, 2012, and February 1, 2013, for all directors serving on the Board on those dates. The value of the quarterly awards paid in stock was determined by multiplying the award amount by the average closing price of a share of Company common stock on the five trading days prior to the issuance of the stock.
In the second quarter of 2013, members of the Board of Directors received their entire annual retainer in restricted Company stock for the following year. The 2013 award vests quarterly for all directors who remain on the Board of Directors on the vesting date, with 25% of the award vesting on each of May 1, August 1, and November 1, 2013, and February 1, 2014. The value of the 2013 retainer award was determined by multiplying the award amount by the closing price of the stock on the issuance date.
For all awards, other expense is recognized over the three month period of the awards based on the fair value of the stock at the issue dates. Shares awarded by quarter were as follows:
| | | | | | | | | |
Quarter
| | Shares
| | Price per Share
| |
|---|
| | |
2011 | | 2Q | | | 6,750 | | $ | 9.53 | |
| | 3Q | | | 7,902 | | $ | 8.80 | |
| | 4Q | | | 9,130 | | $ | 9.44 | |
2012 | | 1Q | | |
8,750 | |
$ |
9.29 | |
| | 2Q | | | 7,200 | | $ | 11.83 | |
| | 3Q | | | 7,200 | | $ | 11.58 | |
| | 4Q | | | 7,200 | | $ | 12.25 | |
2013 | | 1Q | | |
7,200 | |
$ |
13.38 | |
| | 2Q | | | 26,100 | | $ | 13.79 | |
A total of $367, $338, and $220 was recognized as expense in 2013, 2012, and 2011 for these grants.
72
Table of Contents
NOTE 23 — EARNINGS PER COMMON SHARE
Earnings per common share were computed as follows:
| | | | | | | | | | |
Year Ended December 31, 2013
| | Net
Income
| | Weighted
Average
Shares
| | Per
Share
Amount
| |
|---|
| | |
Basic Earnings Per Common Share | | | | | | | | | | |
Net income | | $ | 26,345 | | | | | | | |
Preferred dividends and discount accretion | | | (504 | ) | | | | | | |
Redemption of preferred shares | | | (148 | ) | | | | | | |
| | | | |
| | | | | | | | | | | |
| | | 25,693 | | | 20,375,365 | | $ | 1.26 | |
Effect of dilutive stock options | | | | | | 57,487 | | | | |
| | | | |
| | | | | | | | | | | |
Diluted Earnings Per Common Share | | | | | | | | | | |
Net income attributable to common shareholders and assumed conversions | | $ | 25,693 | | | 20,432,852 | | $ | 1.26 | |
| | | | | | | | | | |
Year Ended December 31, 2012
| | Net Income
| | Weighted Average Shares
| | Per Share Amount
| |
|---|
| | |
Basic Earnings Per Common Share | | | | | | | | | | |
Net income | | $ | 27,258 | | | | | | | |
Preferred dividends and discount accretion | | | (2,110 | ) | | | | | | |
Redemption of preferred shares | | | 1,357 | | | | | | | |
| | | | |
| | | | | | | | | | | |
| | | 26,505 | | | 20,265,761 | | $ | 1.31 | |
Effect of dilutive stock options | | | | | | 58,896 | | | | |
| | | | |
| | | | | | | | | | | |
Diluted Earnings Per Common Share | | | | | | | | | | |
Net income attributable to common shareholders and assumed conversions | | $ | 26,505 | | | 20,324,657 | | $ | 1.30 | |
| | | | | | | | | | |
Year Ended December 31, 2011
| | Net Income
| | Weighted Average Shares
| | Per Share Amount
| |
|---|
| | |
Basic Earnings Per Common Share | | | | | | | | | | |
Net income | | $ | 23,813 | | | | | | | |
Preferred dividends and discount accretion | | | (3,054 | ) | | | | | | |
| | | | |
| | | | | | | | | | | |
| | | 20,759 | | | 20,179,512 | | $ | 1.03 | |
Effect of dilutive stock options | | | | | | 41,615 | | | | |
| | | | |
| | | | | | | | | | | |
Diluted Earnings Per Common Share | | | | | | | | | | |
Net income available to common shareholders and assumed conversions | | $ | 20,759 | | | 20,221,127 | | $ | 1.03 | |
Stock options for 281,589, 289,544, and 254,850 shares of common stock were not considered in computing diluted earnings per common share for 2013, 2012 and 2011 because they were antidilutive. Stock warrants for 571,906 shares of common stock were not considered in computing earnings per share in 2013, 2012 and 2011 because they were antidilutive.
73
Table of Contents
NOTE 24 — QUARTERLY FINANCIAL DATA (UNAUDITED)
| | | | | | | | | | | | | | | | |
| |
| |
| |
| | Earnings per
Common Share | |
|---|
| | Interest
Income
| | Net Interest
Income
| | Net Income
| | Basic
| | Fully
Diluted
| |
|---|
| | |
2013 | | | | | | | | | | | | | | | | |
First quarter | | $ | 25,316 | | $ | 22,598 | | $ | 3,991 | | $ | 0.19 | | $ | 0.19 | |
Second quarter | | | 25,036 | | | 22,535 | | | 7,324 | | | 0.35 | | | 0.35 | |
Third quarter | | | 25,377 | | | 22,953 | | | 7,632 | | | 0.36 | | | 0.36 | |
Fourth quarter | | | 25,550 | | | 23,214 | | | 7,398 | | | 0.36 | | | 0.36 | |
2012 | | |
| | |
| | |
| | |
| | |
| |
First quarter | | $ | 27,909 | | $ | 23,778 | | $ | 6,011 | | $ | 0.32 | | $ | 0.32 | |
Second quarter | | | 27,678 | | | 23,750 | | | 6,982 | | | 0.32 | | | 0.32 | |
Third quarter | | | 26,832 | | | 23,331 | | | 6,986 | | | 0.32 | | | 0.32 | |
Fourth quarter | | | 26,349 | | | 23,223 | | | 7,279 | | | 0.34 | | | 0.34 | |
The first quarter of 2012 earnings per share amount of $0.32/share is $0.06 higher than the amount reported in the first quarter 10Q due to the redemption of preferred stock in the first quarter.
NOTE 25 — PARENT ONLY CONDENSED FINANCIAL STATEMENTS
Parent Only Condensed Balance Sheets
| | | | | | | |
December 31
| | 2013
| | 2012
| |
|---|
| | |
Assets | | | | | | | |
Cash and cash equivalents | | $ | 11,667 | | $ | 7,102 | |
Securities available for sale | | | 399 | | | 399 | |
Investment in subsidiaries | | | 334,531 | | | 361,397 | |
Other assets | | | 10,827 | | | 11,523 | |
| | | | |
| | | | | | | | |
Total assets | | $ | 357,424 | | $ | 380,421 | |
| | | | |
| | | | | | | | |
| | | | | | | | |
| | | | |
Liabilities | | | | | | | |
Subordinated debentures | | $ | 46,394 | | $ | 50,418 | |
Other liabilities | | | 5,504 | | | 6,252 | |
| | | | |
| | | | | | | | |
Total liabilities | | | 51,898 | | | 56,670 | |
Shareholders' equity | | | 305,526 | | | 323,751 | |
| | | | |
| | | | | | | | |
Total liabilities and shareholders' equity | | $ | 357,424 | | $ | 380,421 | |
| | | | |
| | | | | | | | |
| | | | | | | | |
| | | | |
74
Table of Contents
Parent Only Condensed Statements of Operations
| | | | | | | | | | |
Year Ended December 31
| | 2013
| | 2012
| | 2011
| |
|---|
| | |
Income | | | | | | | | | | |
Dividends from subsidiaries | | $ | 34,200 | | $ | 47,800 | | $ | 2,825 | |
Fees from subsidiaries | | | 14,160 | | | 19,024 | | | 19,624 | |
Other income | | | 9 | | | (845 | ) | | 176 | |
| | | | |
| | | | | | | | | | | |
Total income | | | 48,369 | | | 65,979 | | | 22,625 | |
Expenses | | | | | | | | | | |
Interest expense | | | 1,675 | | | 1,825 | | | 1,737 | |
Salaries and benefits | | | 9,790 | | | 11,238 | | | 11,388 | |
Professional fees | | | 951 | | | 1,465 | | | 2,534 | |
Other expenses | | | 10,059 | | | 13,655 | | | 13,173 | |
| | | | |
| | | | | | | | | | | |
Total expenses | | | 22,475 | | | 28,183 | | | 28,832 | |
| | | | |
| | | | | | | | | | | |
Income (loss) before income taxes and equity in undistributed income of subsidiaries | | | 25,894 | | | 37,796 | | | (6,207 | ) |
Income tax (benefit) | | | (2,849 | ) | | (3,377 | ) | | (3,069 | ) |
| | | | |
| | | | | | | | | | | |
Income (loss) before equity in undistributed income of subsidiaries | | | 28,743 | | | 41,173 | | | (3,138 | ) |
Equity in undistributed income (loss) of subsidiaries | | | (2,398 | ) | | (13,915 | ) | | 26,951 | |
| | | | |
| | | | | | | | | | | |
Net income | | $ | 26,345 | | $ | 27,258 | | $ | 23,813 | |
| | | | |
| | | | | | | | | | | |
| | | | | | | | | | | |
| | | | |
Parent Only Condensed Statements of Cash Flows
| | | | | | | | | | |
Year Ended December 31
| | 2013
| | 2012
| | 2011
| |
|---|
| | |
Operating Activities | | | | | | | | | | |
Net income | | $ | 26,345 | | $ | 27,258 | | $ | 23,813 | |
Undistributed (income)/loss of subsidiaries | | | 2,398 | | | 13,915 | | | (26,951 | ) |
Changes in other assets and liabilities | | | 1,833 | | | 2,862 | | | 2,699 | |
| | | | |
| | | | | | | | | | | |
Net cash provided/(used) by operating activities | | | 30,576 | | | 44,035 | | | (439 | ) |
Investing Activities | | | | | | | | | | |
Capital contributed to subsidiary, net | | | (250 | ) | | — | | | — | |
Purchases of equipment | | | (667 | ) | | (1,230 | ) | | (2,166 | ) |
| | | | |
| | | | | | | | | | | |
Net cash used by investing activities | | | (917 | ) | | (1,230 | ) | | (2,166 | ) |
Financing Activities | | | | | | | | | | |
Proceeds from exercise of stock options | | | 389 | | | 120 | | | — | |
Repurchase of preferred stock | | | (15,100 | ) | | (40,255 | ) | | — | |
Purchase of treasury shares | | | (204 | ) | | — | | | — | |
Repayment of subordinated debentures, net | | | (4,000 | ) | | — | | | — | |
Cash dividends on preferred stock | | | (470 | ) | | (1,967 | ) | | (2,850 | ) |
Cash dividends on common stock | | | (5,709 | ) | | (1,623 | ) | | (807 | ) |
| | | | |
| | | | | | | | | | | |
Net cash used by financing activities | | | (25,094 | ) | | (43,725 | ) | | (3,657 | ) |
| | | | |
| | | | | | | | | | | |
Net change in cash and cash equivalents | | | 4,565 | | | (920 | ) | | (6,262 | ) |
Cash and cash equivalents, beginning of year | | | 7,102 | | | 8,022 | | | 14,284 | |
| | | | |
| | | | | | | | | | | |
Cash and cash equivalents, end of year | | $ | 11,667 | | $ | 7,102 | | $ | 8,022 | |
| | | | |
| | | | | | | | | | | |
| | | | | | | | | | | |
| | | | |
NOTE 26 — ACQUISITIONS
In December, 2013, the Company purchased a branch in Hope, Indiana. As of the date of acquisition, the Company acquired $3 million in loans and $22 million in deposits. Goodwill of $0.5 million was recorded. $18 million of cash was received at purchase. The goodwill will be deducted for tax purposes over 15 years. No other purchase accounting entries were made at acquisition as the amounts computed were considered immaterial.
75
Table of Contents
In December, 2012, the Company purchased a branch in Shelbyville, Kentucky. As of the date of acquisition, the Company acquired $27 million in loans and $37 million in deposits. Goodwill of $1 million and a core deposit intangible of $0.2 million were also recorded. $7.5 million of cash was received at purchase. The core deposit intangible asset is being amortized over 10 years. Goodwill and the core deposit intangible will be deducted for tax purposes over 15 years. The Company completed its purchase accounting on this acquisition in the first quarter of 2013 and recorded an additional $0.4 million of goodwill and time deposits fair value adjustment. This time deposit premium is being amortized over 4 years.
In September, 2012, the Company purchased a brokerage firm in Seymour, Indiana for a cash payment of $1.6 million and future cash payments to be made of $0.4 million. As of the date of acquisition, the Company acquired a customer relationship intangible asset of $1.0 million, a non-compete intangible asset of $0.1 million, and goodwill of $0.8 million. The customer relationship intangible asset is being amortized over 13 years and the non-compete intangible asset is being amortized over 5 years. Goodwill and the intangible assets will be deducted for tax purposes over 15 years.
In October, 2012, the Company purchased a brokerage firm in Indianapolis, Indiana for a cash payment of $0.4 million and future cash payments to be made of $0.2 million. As of the date of acquisition, the Company acquired a customer relationship intangible asset of $0.3 million, a small non-compete intangible asset, and goodwill of $0.2 million. The customer relationship intangible asset is being amortized over 13 years and the non-compete intangible asset is being amortized over 5 years. Goodwill and the intangible assets will be deducted for tax purposes over 15 years.
The above transactions were considered business combinations. Their results of operations are included in the financial statements after acquisition. Proforma data was not considered material and is not presented.
NOTE 27 — BRANCH CLOSURES
In April 2013, the Company closed eight branch offices in the following locations: Redkey, Fortville, Cambridge City, Fountain City, Trafalgar, East Enterprise, and Covington, Indiana and Troy, Ohio. The Company now operates two offices in Troy, Ohio. In total, the eight branches being closed represented approximately $85,000 in deposits. Included in the 2013 operating results are $150 of severance costs, $550 of impairment costs for the affected properties, and $50 of other costs related to the closing of the branches.
NOTE 28 — SUBSEQUENT EVENT — BRANCH CLOSURES
On January 31, 2014, the Company announced its plan to close 3 branch offices of MainSource Bank in the second quarter of 2014. The branch offices to be closed are located in Griffith and the downtown branch located in Linton, Indiana, and one of its branches located in Frankfort, Kentucky. As of December 31, 2013, the 3 branches had approximately $20 million in total deposits.
76
Table of Contents
ITEM 9. CHANGES IN AND DISAGREEMENTS WITH ACCOUNTANTS ON ACCOUNTING AND FINANCIAL DISCLOSURE
In connection with its audits for the three most recent fiscal years ended December 31, 2013, there have been no disagreements with the Company's independent registered public accounting firm on any matter of accounting principles or practices, financial statement disclosure or auditing scope or procedure.
ITEM 9A. CONTROLS & PROCEDURES
Disclosure Controls and Procedures
As of the end of the period covered by this report, an evaluation was carried out under the supervision and with the participation of the Company's management, including our Chief Executive Officer and Chief Financial Officer, of the effectiveness of our disclosure controls and procedures (as defined in Exchange Act Rules 13a-15(e) and 15d-15(e) under the Securities Exchange Act of 1934). Based on their evaluation, our Chief Executive Officer and Chief Financial Officer have concluded that the Company's disclosure controls and procedures are, to the best of their knowledge, effective to ensure that information required to be disclosed by the Company in reports that it files or submits under the Exchange Act is recorded, processed, summarized and reported within the time periods specified in Securities and Exchange Commission rules and forms as of such date.
Our management has evaluated our internal control over financial reporting and there were no changes in our internal control over financial reporting that occurred during the most recent fiscal quarter that have materially affected, or are reasonably likely to materially affect, the Company's internal control over financial reporting.
Management's Report on Internal Control Over Financial Reporting
MainSource Financial Group, Inc. (the "Company") is responsible for the preparation, integrity, and fair presentation of the consolidated financial statements included in this annual report. The consolidated financial statements and notes included in this annual report have been prepared in conformity with United States generally accepted accounting principles and necessarily include some amounts that are based on management's best estimates and judgments.
We, as management of the Company, are responsible for establishing and maintaining effective internal control over financial reporting that is designed to produce reliable financial statements in conformity with United States generally accepted accounting principles. The system of internal control over financial reporting as it relates to the financial statements is evaluated for effectiveness by management and tested for reliability through a program of internal audits and other management testing. Because of its inherent limitations, internal control over financial reporting may not prevent or detect misstatements. Also, projections of any evaluation of effectiveness to future periods are subject to the risk that controls may become inadequate because of changes in conditions, or that the degree of compliance with the policies or procedures may deteriorate.
Management assessed the Company's system of internal control over financial reporting as of December 31, 2013, in relation to criteria for effective internal control over financial reporting as described in "Internal Control — Integrated Framework" issued by the Committee of Sponsoring Organizations of the Treadway Commission. Based on this assessment, management concluded that as of December 31, 2013, its system of internal controls over financial reporting is effective and meets the criteria of the "Internal Control — Integrated Framework". Crowe Horwath LLP, independent registered public accounting firm, has issued an attestation report dated March 14, 2014 on the Company's internal control over financial reporting. This report is incorporated by reference in Item 8 above, under the heading "Report of Independent Registered Public Accounting Firm".
Archie M. Brown, Jr.
President and Chief Executive Officer
James M. Anderson
Executive Vice President and Chief Financial Officer
ITEM 9B. OTHER INFORMATION
None
77
Table of Contents
PART IV
ITEM 15. EXHIBITS, FINANCIAL STATEMENT SCHEDULES
(a)(1) Financial Statements.
Financial Statements filed as part of this Form 10-K are included under Part II, Item 8, above.
(a)(2) Financial statement schedules
All schedules are omitted because they are not applicable or not required, or because the required information is included in the consolidated financial statements or related notes in Part II, Item 8 above.
(a)(3) Exhibits:
3.1 Amended and Restated Articles of Incorporation (incorporated by reference to Exhibit 3.1 to the Report on Form 8-K of the registrant filed December 13, 2013 with the Commission (Commission File No. 0-12422)).
3.2 Amended and Restated Bylaws of MainSource Financial Group, Inc. dated July 19, 2010 (incorporated by reference to Exhibit 3.1 to the Report on Form 8-K of the registrant filed July 22, 2010 with the Commission (Commission File No. 0-12422)).
4.1 Indenture dated as of December 19, 2002 between the Registrant, as issuer, and State Street Bank and Trust Company of Connecticut, N.A., as trustee, re: floating rate junior subordinated deferrable interest debentures due 2032 (incorporated by reference to Exhibit 4.6 to the Annual Report on Form 10-K of the registrant for the fiscal year ended December 31, 2002 filed March 28, 2003 with the Commission (Commission File No. 0-12422)).
4.2 Amended and Restated Declaration of Trust dated as of December 19, 2002 among State Street Bank and Trust Company of Connecticut, N.A., as institutional trustee, the Registrant, as sponsor, and James L. Saner Sr., Donald A. Benziger and James M. Anderson, as administrators (incorporated by reference to Exhibit 4.7 to the Annual Report on Form 10-K of the registrant for the fiscal year ended December 31, 2002 filed March 28, 2003 with the Commission (Commission File No. 0-12422)).
4.3 Guarantee Agreement dated as of December 19, 2002 between the Registrant, and State Street Bank and Trust Company of Connecticut, N.A (incorporated by reference to Exhibit 4.8 to the Annual Report on Form 10-K of the registrant for the fiscal year ended December 31, 2002 filed March 28, 2003 with the Commission (Commission File No. 0-12422)).
4.4 Indenture dated as of April 1, 2003 between the Registrant, as issuer, and U.S. Bank, N.A., as trustee, re: floating rate junior subordinated deferrable interest debentures due 2033 (incorporated by reference to Exhibit 4.1 to the Quarterly Report on Form 10-Q of the registrant for the quarter ended June 30, 2003 filed August 14, 2003 with the Commission (Commission File No. 0-12422)).
4.5 Amended and Restated Declaration of Trust dated as of April 1, 2003 among U.S. Bank, N.A., as institutional trustee, the Registrant, as sponsor, and James L. Saner Sr., Donald A. Benziger and James M. Anderson, as administrators (incorporated by reference to Exhibit 4.2 to the Quarterly Report on Form 10-Q of the registrant for the quarter ended June 30, 2003 filed August 14, 2003 with the Commission (Commission File No. 0-12422)).
4.6 Guarantee Agreement dated as of April 1, 2003 between the Registrant, and U.S. Bank, N.A (incorporated by reference to Exhibit 4.3 to the Quarterly Report on Form 10-Q of the registrant for the quarter ended June 30, 2003 filed August 14, 2003 with the Commission (Commission File No. 0-12422)).
4.7 Indenture dated as of June 12, 2003 between the Registrant, as issuer, and The Bank of New York, as trustee, re: rate junior subordinated deferrable interest debentures due (incorporated by reference to Exhibit 4.4 to the Quarterly Report on Form 10-Q of the registrant for the quarter ended June 30, 2003 filed August 14, 2003 with the Commission (Commission File No. 0-12422)).
4.8 Amended and Restated Declaration of Trust dated as of June 12, 2003 among The Bank of New York, as institutional trustee, the Registrant, as sponsor, and James L. Saner Sr., Donald A. Benziger and James M. Anderson, as administrators (incorporated by reference to Exhibit 4.5 to the Quarterly Report on Form 10-Q of the registrant for the quarter ended June 30, 2003 filed August 14, 2003 with the Commission (Commission File No. 0-12422)).
4.9 Guarantee Agreement dated as of June 12, 2003 between the Registrant, and The Bank of New York (incorporated by reference to Exhibit 4.6 to the Quarterly Report on Form 10-Q of the registrant for the quarter ended June 30, 2003 filed August 14, 2003 with the Commission (Commission File No. 0-12422)).
4.10 Form of Amended and Restated Declaration of Trust dated as of October 13, 2006, of MainSource Statutory Trust IV, among MainSource Financial Group, Inc. as sponsor, Wells Fargo Delaware Trust Company as Delaware trustee and Wells Fargo
78
Table of Contents
Bank, National Association, as institutional trustee (incorporated by reference to Exhibit 10.1 to the periodic report on Form 8-K of the registrant filed October 17, 2006 with the Commission (Commission File No. 0-12422)).
4.11 Form of Indenture dated as of October 13, 2006, between MainSource Financial Group, Inc. and Wells Fargo Bank, National Association, as trustee (incorporated by reference to Exhibit 10.2 to the periodic report on Form 8-K of the registrant filed October 17, 2006 with the Commission (Commission File No. 0-12422)).
4.12 Form of Guarantee Agreement dated as of October 13, 2006, between MainSource Financial Group, Inc., as guarantor, and Wells Fargo Bank, National Association, as guarantee trustee (incorporated by reference to Exhibit 10.3 to the periodic report on Form 8-K of the registrant filed October 17, 2006 with the Commission (Commission File No. 0-12422)).
4.13 Warrant for the Purchase of Shares of MainSource Financial Group, Inc. Common Stock (incorporated by reference to Exhibit 4.2 to the Report on Form 8-K of the registrant filed January 20, 2009 with the Commission (Commission File No. 0-12422)).
10.1 Registrant's 2003 Stock Option Plan (incorporated by reference to Exhibit 10.1 to the Annual Report on Form 10-K of the registrant for the fiscal year ended December 31, 2003 filed March 12, 2004 with the Commission (Commission File No. 0-12422)).*
10.2 Form of Stock Option Agreement Under 2003 Stock Option Plan for Directors of Registrant dated May 19, 2003 (incorporated by reference to Exhibit 10.2 to the Annual Report on Form 10-K of the registrant for the fiscal year ended December 31, 2003 filed March 12, 2004 with the Commission (Commission File No. 0-12422)).*
10.3 Form of Stock Option Agreement Under 2003 Stock Option Plan for Officers of Registrant (incorporated by reference to Exhibit 10.1 to the Report on Form 8-K of the registrant filed February 24, 2005 with the Commission (Commission File No. 0-12422)).*
10.4 Letter Agreement between MainSource Financial Group, Inc. and Archie M. Brown, Jr. (incorporated by reference to Exhibit 10.1 to the Report on Form 8-K of the registrant filed July 24, 2008 with the Commission (Commission File No. 0-12422)).*
10.5 Form of Indemnification Agreement for Directors and Certain Officers of Registrant (incorporated by reference to Exhibit 10.1 to the Report on Form 8-K of the registrant filed February 24, 2005 with the Commission (Commission File No. 0-12422)).
10.6 Registrant's 2007 Stock Incentive Plan (incorporated by reference to Exhibit 10.9 to the Report on Form 10-K of the registrant for the year ending December 31, 2007, filed March 17, 2008 with the Commission (Commission File No. 0-12422)).*
10.7 Form of Award Agreement for Archie M. Brown, Jr. under the MainSource Financial Group, Inc. 2007 Stock Incentive Plan (incorporated by reference to Exhibit 10.2 to the Report on Form 8-K of the registrant filed July 24, 2008 with the Commission (Commission File No. 0-12422)).*
10.8 Form of Stock Award Agreement under the MainSource Financial Group, Inc. 2007 Stock Incentive Plan (for Executives) (incorporated by reference to Exhibit 10.1 to the Report on Form 8-K of the registrant filed February 27, 2009 with the Commission (Commission File No. 0-12422)).*
10.9 Consulting Agreement, Restrictive Covenants, and Releases dated January 24, 2011, between Jeffrey C. Smith and MainSource Financial Group, Inc. (incorporated by reference to Exhibit 10.1 to the Report on Form 8-K of the registrant filed on January 28, 2011 with the Commission (Commission File No. 0-12422)).*
10.10 Form of Restricted Stock Award Agreement (for Executives) under the MainSource Financial Group, Inc. 2007 Stock Incentive Plan (incorporated by reference to Exhibit 10.1 to the Quarterly Report on Form 10-Q of the registrant filed on August 8, 2011, for the quarter ending June 30, 2011, with the Commission (Commission File No. 0-12422)).*
10.11 Change in Control Agreement with Archie M. Brown, Jr. dated November 14, 2011 (incorporated by reference to Exhibit 99.1 to the Report on Form 8-K of the registrant filed on November 17, 2011 with the Commission (Commission File No. 0-12422)).*
10.12 Change in Control Agreement with James M. Anderson dated November 14, 2011 (incorporated by reference to Exhibit 99.2 to the Report on Form 8-K of the registrant filed on November 17, 2011 with the Commission (Commission File No. 0-12422)).*
10.13 Change in Control Agreement with Daryl R. Tressler dated November 14, 2011 (incorporated by reference to Exhibit 99.3 to the Report on Form 8-K of the registrant filed on November 17, 2011 with the Commission (Commission File No. 0-12422)).*
79
Table of Contents
10.14 Change in Control Agreement with William J. Goodwin dated November 14, 2011 (incorporated by reference to Exhibit 99.4 to the Report on Form 8-K of the registrant filed on November 17, 2011 with the Commission (Commission File No. 0-12422)).*
10.15 MainSource Financial Group, Inc. Short-Term Incentive Plan (incorporated by reference to Exhibit 10.1 to the Report on Form 8-K of the registrant filed on May 1, 2012 with the Commission (Commission File No. 0-12422)).*
10.16 Change in Control Agreement with Chris Harrison dated May 4, 2012(incorporated by reference to Exhibit 10.1 to the Report on Form 8-K of the registrant filed on May 10, 2012 with the Commission (Commission File No. 0-12422)).*
14 Code of Ethical Conduct (incorporated by reference to Exhibit 14 to the Annual Report on Form 10-K of the registrant for the fiscal year ended December 31, 2003 filed March 12, 2004 with the Commission (Commission File No. 0-12422)).
21 List of subsidiaries of the Registrant.
23.1 Consent of Crowe Horwath LLP.
31.1 Certification pursuant to Section 302 of Sarbanes-Oxley Act of 2002 by Chief Executive Officer
31.2 Certification pursuant to Section 302 of Sarbanes-Oxley Act of 2002 by Chief Financial Officer
32.1 Certification pursuant to Section 906 of the Sarbanes-Oxley Act of 2002, by Chief Executive Officer
32.2 Certification pursuant to Section 906 of the Sarbanes-Oxley Act of 2002, by Chief Financial Officer
101 The following financial statements and notes from the MainSource Financial Group Annual Report on Form 10-K for the year ended December 31, 2013, formatted in XBRL pursuant to Rule 405 of Regulation S-T: (i) Condensed Consolidated Balance Sheets; (ii) Condensed Consolidated Statements of Income; (iii) Condensed Consolidated Statements of Comprehensive Income; (iv) Condensed Consolidated Statements of Shareholders' Equity; (v) Condensed Consolidated Statements of Cash Flow; and (vi) the Notes to the condensed consolidated financial statements.**
- *
- A management contract or compensatory plan or agreement.
- **
- Furnished, not filed, for purposes of Section 11 and 12 of the Securities Act of 1933 and Section 18 of the Securities Exchange Act of 1934.
- (b)
- Exhibits
Reference is made to Item 15(a)(3) above.
- (c)
- Schedules
None required.
80
Table of Contents
Pursuant to the requirements of Section 13 or 15(d) of the Securities Exchange Act of 1934, the registrant has duly caused this report to be signed on its behalf by the undersigned, thereunto duly authorized, on the 14th day of March, 2014.
| | | | |
| | | MAINSOURCE FINANCIAL GROUP, INC. | | |
|
|
/s/ Archie M. Brown, Jr.
President and Chief Executive Officer |
|
|
Pursuant to the requirements of the Securities Exchange Act of 1934, this report on Form 10-K has been signed by the following persons on behalf of the registrant and in the capacities with the Company and on the dates indicated.
| | | | | | |
Signature
| | Capacity
| | Date
|
|---|
| |
|---|
|
|
|
|
|
|
|
| /s/ | | William G. Barron | | | | |
| | | | | |
| | | | | | | |
| | | William G. Barron | | Director | | March 14, 2014 |
/s/ |
|
Brian J. Crall |
|
|
|
|
| | | | | |
| | | | | | | |
| | | Brian J. Crall | | Lead Director | | March 14, 2014 |
/s/ |
|
Philip A. Frantz |
|
|
|
|
| | | | | |
| | | | | | | |
| | | Philip A. Frantz | | Director | | March 14, 2014 |
/s/ |
|
D.J. Hines |
|
|
|
|
| | | | | |
| | | | | | | |
| | | D.J. Hines | | Director | | March 14, 2014 |
/s/ |
|
Thomas M. O'Brien |
|
|
|
|
| | | | | |
| | | | | | | |
| | | Thomas M. O'Brien | | Director | | March 14, 2014 |
/s/ |
|
Kathleen Bardwell |
|
|
|
|
| | | | | |
| | | | | | | |
| | | Kathleen Bardwell | | Director | | March 14, 2014 |
/s/ |
|
Lawrence R. Rueff DVM |
|
|
|
|
| | | | | |
| | | | | | | |
| | | Lawrence R. Rueff DVM | | Director | | March 14, 2014 |
/s/ |
|
John G. Seale |
|
|
|
|
| | | | | |
| | | | | | | |
| | | John G. Seale | | Director | | March 14, 2014 |
/s/ |
|
Charles J. Thayer |
|
|
|
|
| | | | | |
| | | | | | | |
| | | Charles J. Thayer | | Director | | March 14, 2014 |
/s/ |
|
James M. Anderson |
|
|
|
|
| | | | | |
| | | | | | | |
| | | James M. Anderson | | Executive Vice President and Chief
Financial Officer
(Principal Financial Officer) | | March 14, 2014 |
81
Table of Contents
| | | | | | |
/s/ |
|
Patrick A. Weigel |
|
|
|
|
| | | | | |
| | | | | | | |
| | | Patrick A. Weigel | | Controller
(Principal Accounting Officer) | | March 14, 2014 |
/s/ |
|
Archie M. Brown, Jr. |
|
|
|
|
| | | | | |
| | | | | | | |
| | | Archie M. Brown, Jr. | | President, Chief Executive Officer and
Chairman of the Board
(Principal Executive Officer) | | March 14, 2014 |
82