UNITED STATES
SECURITIES AND EXCHANGE COMMISSION
Washington, D.C. 20549
FORM N-CSR
CERTIFIED SHAREHOLDER REPORT OF REGISTERED
MANAGEMENT INVESTMENT COMPANIES
Investment Company Act file number 811-3759
Variable Insurance Products IV
(Exact name of registrant as specified in charter)
82 Devonshire St., Boston, Massachusetts 02109
(Address of principal executive offices) (Zip code)
Eric D. Roiter, Secretary
82 Devonshire St.
Boston, Massachusetts 02109
(Name and address of agent for service)
Registrant's telephone number, including area code: 617-563-7000
Date of fiscal year end: | December 31 |
| |
Date of reporting period: | December 31, 2004 |
Item 1. Reports to Stockholders
Fidelity® Variable Insurance Products
Sector Funds
Consumer Industries Portfolio
Cyclical Industries Portfolio
Financial Services Portfolio
Health Care Portfolio
Natural Resources Portfolio
Technology Portfolio
Telecommunications & Utilities Growth Portfolio
Annual Report
December 31, 2004
(2_fidelity_logos) (Registered_Trademark)
Contents
Shareholder Expense Example | 4 | An example of shareholder expenses |
Consumer Industries Portfolio | 5 | Performance |
| 6 | Management's Discussion |
| 7 | Investment Summary |
| 8 | Investments |
| 11 | Financial Statements |
Cyclical Industries Portfolio | 13 | Performance |
| 14 | Management's Discussion |
| 15 | Investment Summary |
| 16 | Investments |
| 20 | Financial Statements |
Financial Services Portfolio | 22 | Performance |
| 23 | Management's Discussion |
| 24 | Investment Summary |
| 25 | Investments |
| 28 | Financial Statements |
Health Care Portfolio | 30 | Performance |
| 31 | Management's Discussion |
| 32 | Investment Summary |
| 33 | Investments |
| 35 | Financial Statements |
Natural Resources Portfolio | 37 | Performance |
| 38 | Management's Discussion |
| 39 | Investment Summary |
| 40 | Investments |
| 42 | Financial Statements |
Technology Portfolio | 44 | Performance |
| 45 | Management's Discussion |
| 46 | Investment Summary |
| 47 | Investments |
| 50 | Financial Statements |
Telecommunications &
Utilities Growth Portfolio | 52 | Performance |
| 53 | Management's Discussion |
| 54 | Investment Summary |
| 55 | Investments |
| 57 | Financial Statements |
Notes to Financial Statements | 59 | Notes to the Financial Statements |
Report of Independent Registered Public Accounting Firm | 64 | |
Trustees and Officers | 65 | |
Distributions | 70 | |
Proxy Voting Results | 71 | |
To view a fund's proxy voting guidelines and proxy voting record for the 12-month period ended June 30, visit www.fidelity.com/proxyvotingresults or visit the Securities and Exchange Commission's (SEC) web site at www.sec.gov. You may also call 1-800-544-5429 to request a free copy of the proxy voting guidelines.
Fidelity Variable Insurance Products are separate account options which are purchased through a variable insurance contract.
Standard & Poor's, S&P and S&P 500 are registered service marks of The McGraw-Hill Companies, Inc. and have been licensed for use by Fidelity Distributors Corporation.
Other third party marks appearing herein are the property of their respective owners.
All other marks appearing herein are registered or unregistered trademarks or service marks of FMR Corp. or an affiliated company.
(Recycle graphic) This report is printed on recycled paper using soy-based inks.
Annual Report
This report and the financial statements contained herein are submitted for the general information of the shareholders of the funds. This report is not
authorized for distribution to prospective investors in the funds unless preceded or accompanied by an effective prospectus.
A fund files its complete schedule of portfolio holdings with the SEC for the first and third quarters of each fiscal year on Form N-Q. Forms N-Q are available on the SEC's web site at http://www.sec.gov. A fund's Forms N-Q may be reviewed and copied at the SEC's Public Reference Room in Washington, DC. Information regarding the operation of the SEC's Public Reference Room may be obtained by calling 1-800-SEC-0330. For a complete list of a fund's portfolio holdings, view the most recent quarterly holdings report, semiannual report, or annual report on Fidelity's web site at http://www.advisor.fidelity.com.
NOT FDIC INSURED · MAY LOSE VALUE · NO BANK GUARANTEE
Neither the funds nor Fidelity Distributors Corporation is a bank.
Annual Report
Shareholder Expense Example
As a shareholder of a Fund, you incur two types of costs: (1) transaction costs, and (2) ongoing costs, including management fees and other Fund expenses. This Example is intended to help you understand your ongoing costs (in dollars) of investing in the Funds and to compare these costs with the ongoing costs of investing in other mutual funds.
The Example is based on an investment of $1,000 invested at the beginning of the period and held for the entire period (July 1, 2004 to December 31, 2004).
Actual Expenses
The first line of the table below for each fund provides information about actual account values and actual expenses. You may use the information in this line, together with the amount you invested, to estimate the expenses that you paid over the period. Simply divide your account value by $1,000.00 (for example, an $8,600 account value divided by $1,000.00 = 8.6), then multiply the result by the number in the first line for a fund under the heading entitled "Expenses Paid During Period" to estimate the expenses you paid on your account during this period. The estimate of expenses does not include any fees or other expenses of any variable annuity or variable life insurance product. If they were, the estimate of expenses you paid during the period would be higher, and your ending account value would be lower.
Hypothetical Example for Comparison Purposes
The second line of the table below for each fund provides information about hypothetical account values and hypothetical expenses based on a fund's actual expense ratio and an assumed rate of return of 5% per year before expenses, which is not the Fund's actual return. The hypothetical account values and expenses may not be used to estimate the actual ending account balance or expenses you paid for the period. You may use this information to compare the ongoing costs of investing in the Fund and other funds. To do so, compare this 5% hypothetical example with the 5% hypothetical examples that appear in the shareholder reports of the other funds. The estimate of expenses does not include any fees or other expenses of any variable annuity or variable life insurance product. If they were, the estimate of expenses you paid during the period would be higher, and your ending account value would be lower.
Please note that the expenses shown in the table are meant to highlight your ongoing costs only and do not reflect any transaction costs. Therefore, the second line of the table is useful in comparing ongoing costs only, and will not help you determine the relative total costs of owning different funds.
| Beginning
Account Value
July 1, 2004 | Ending
Account Value
December 31, 2004 | Expenses Paid
During Period*
July 1, 2004
to December 31, 2004 |
Consumer Industries Portfolio | | | |
Actual | $ 1,000.00 | $ 1,093.40 | $ 7.16 |
HypotheticalA | $ 1,000.00 | $ 1,018.30 | $ 6.90 |
Cyclical Industries Portfolio | | | |
Actual | $ 1,000.00 | $ 1,139.90 | $ 4.73 |
HypotheticalA | $ 1,000.00 | $ 1,020.71 | $ 4.47 |
Financial Services Portfolio | | | |
Actual | $ 1,000.00 | $ 1,101.20 | $ 4.54 |
HypotheticalA | $ 1,000.00 | $ 1,020.81 | $ 4.37 |
Health Care Portfolio | | | |
Actual | $ 1,000.00 | $ 1,033.10 | $ 3.99 |
HypotheticalA | $ 1,000.00 | $ 1,021.22 | $ 3.96 |
Natural Resources Portfolio | | | |
Actual | $ 1,000.00 | $ 1,142.30 | $ 4.09 |
HypotheticalA | $ 1,000.00 | $ 1,021.32 | $ 3.86 |
Technology Portfolio | | | |
Actual | $ 1,000.00 | $ 1,008.60 | $ 3.89 |
HypotheticalA | $ 1,000.00 | $ 1,021.27 | $ 3.91 |
Telecommunications & Utilities Growth Portfolio | | | |
Actual | $ 1,000.00 | $ 1,181.60 | $ 5.15 |
HypotheticalA | $ 1,000.00 | $ 1,020.41 | $ 4.77 |
A 5% return per year before expenses
* Expenses are equal to each Fund's annualized expense ratio (shown in the table below); multiplied by the average account value over the period, multiplied by 184/366 (to reflect the one-half year period).
| Annualized
Expense Ratio |
Consumer Industries Portfolio | 1.36% |
Cyclical Industries Portfolio | .88% |
Financial Services Portfolio | .86% |
Health Care Portfolio | .78% |
Natural Resources Portfolio | .76% |
Technology Portfolio | .77% |
Telecommunications & Utilities Growth Portfolio | .94% |
Annual Report
Fidelity Variable Insurance Products: Consumer Industries Portfolio
Performance: The Bottom Line
Average annual total return reflects the change in the value of an investment, assuming reinvestment of the class' dividend income and capital gains (the profits earned upon the sale of securities that have grown in value) and assuming a constant rate of performance each year. During periods of reimbursement by Fidelity, a fund's total return will be greater than it would be had the reimbursement not occurred. Performance numbers are net of all underlying fund operating expenses, but do not include any insurance charges imposed by your insurance company's separate account. If performance information included the effect of these additional charges, the total returns would have been lower. How a fund did yesterday is no guarantee of how it will do tomorrow.
Average Annual Total Returns
Periods ended December 31, 2004 | Past 1
year | Life of fundA |
Fidelity® VIP: Consumer Industries | 9.34% | 3.15% |
A From July 18, 2001.
$10,000 Over Life of Fund
Let's say hypothetically that $10,000 was invested in Fidelity® Variable Insurance Products: Consumer Industries Portfolio on July 18, 2001, when the fund started. The chart shows how the value of your investment would have changed, and also shows how the S&P 500® Index performed over the same period.
Annual Report
Fidelity Variable Insurance Products: Consumer Industries Portfolio
Management's Discussion of Fund Performance
Comments from John Roth, Portfolio Manager of Fidelity® Variable Insurance Products: Consumer Industries Portfolio
The year ending December 31, 2004, generally was positive for equity investors, as many stock market benchmarks produced double-digit gains. Broad-based themes included the continued dominance of small-cap stocks, which outperformed large-caps for the sixth consecutive year. The small-cap Russell 2000® Index was up 18.33% in 2004, while the larger-cap Standard & Poor's 500SM Index rose 10.88%. Value stocks ended the year well ahead of growth stocks: The Russell 3000® Value Index advanced 16.94%, compared to 6.93% for the Russell 3000 Growth Index. Energy and basic materials stocks led the market upward. Energy stocks were boosted by record-high oil prices, while strong demand from China helped support commodity prices. The health care sector was among the market's weakest performers. Technology also fell off the pace, though it was helped by a rally late in the year. The tech-heavy NASDAQ Composite® Index returned 9.15%, thanks primarily to a 14.87% jump in the fourth quarter. Elsewhere, the Dow Jones Industrial AverageSM gained 5.37% for the year.
For the 12-month period ending December 31, 2004, the fund underperformed both the Goldman Sachs® Consumer Industries Index, which returned 11.17%, and the S&P 500®. A major factor in the fund's underperformance relative to its benchmarks was a significant overweighting in media stocks with exposure to radio, based in part on an expectation that ad spending would increase along with the economy. Ad spending did come back but accrued instead to non-traditional areas such as Internet advertising. The Goldman Sachs Consumer Industries Index included larger weightings in better-performing consumer staples stocks. The S&P® index holds an even broader range of stocks, including commodities and materials, which did much better than the consumer sector. Positive contributors included Yahoo!, which was very well-positioned to take advantage of new money flowing into Internet advertising, and retailer American Eagle Outfitters, which executed its business strategy very well. The company did well after two years of struggling, successfully turning around its business. Poor performers included doughnut franchiser Krispy Kreme, which was marked by a decelerating growth rate, continuing declines in the profitability of its stores and missed earnings expectations. While Univision successfully created a formidable niche among Hispanic customers, the stock's performance dragged as investors lowered their expectations for the Spanish-language media company's earnings growth.
The views expressed in this statement reflect those of the portfolio manager only through the end of the period of the report as stated on the cover and do not necessarily represent the views of Fidelity or any other person in the Fidelity organization. Any such views are subject to change at any time based upon market or other conditions and Fidelity disclaims any responsibility to update such views. These views may not be relied on as investment advice and, because investment decisions for a Fidelity fund are based on numerous factors, may not be relied on as an indication of trading intent on behalf of any Fidelity fund.
Annual Report
Fidelity Variable Insurance Products: Consumer Industries Portfolio
Investment Summary
Top Five Stocks as of December 31, 2004 |
| % of fund's net assets |
News Corp. Class A | 4.1 |
Home Depot, Inc. | 3.9 |
Procter & Gamble Co. | 3.6 |
Wal-Mart Stores, Inc. | 3.2 |
McDonald's Corp. | 2.9 |
| 17.7 |
Top Industries as of December 31, 2004 |
% of fund's net assets |
 | Media | 17.9% | |
 | Hotels, Restaurants & Leisure | 15.5% | |
 | Specialty Retail | 11.8% | |
 | Food & Staples Retailing | 5.9% | |
 | Internet Software & Services | 5.7% | |
 | All Others* | 43.2% | |

* Includes short-term investments and net other assets. |
Annual Report
Fidelity Variable Insurance Products: Consumer Industries Portfolio
Investments December 31, 2004
Showing Percentage of Net Assets
Common Stocks - 95.9% |
| Shares | | Value (Note 1) |
AUTOMOBILES - 2.1% |
Automobile Manufacturers - 0.8% |
Thor Industries, Inc. | 2,600 | | $ 96,330 |
Motorcycle Manufacturers - 1.3% |
Harley-Davidson, Inc. | 2,600 | | 157,950 |
TOTAL AUTOMOBILES | | 254,280 |
BEVERAGES - 3.4% |
Brewers - 0.6% |
Anheuser-Busch Companies, Inc. | 1,300 | | 65,949 |
Soft Drinks - 2.8% |
PepsiCo, Inc. | 2,000 | | 104,400 |
The Coca-Cola Co. | 5,730 | | 238,540 |
| | 342,940 |
TOTAL BEVERAGES | | 408,889 |
CHEMICALS - 0.6% |
Fertilizers & Agricultural Chemicals - 0.6% |
Monsanto Co. | 1,300 | | 72,215 |
COMMERCIAL SERVICES & SUPPLIES - 3.6% |
Commercial Printing - 0.2% |
R.R. Donnelley & Sons Co. | 800 | | 28,232 |
Diversified Commercial Services - 3.4% |
Apollo Group, Inc. Class A (a) | 2,300 | | 185,633 |
Bright Horizons Family Solutions, Inc. (a) | 1,027 | | 66,509 |
Cendant Corp. | 4,400 | | 102,872 |
Strayer Education, Inc. | 500 | | 54,895 |
| | 409,909 |
TOTAL COMMERCIAL SERVICES & SUPPLIES | | 438,141 |
FOOD & STAPLES RETAILING - 5.9% |
Drug Retail - 0.7% |
CVS Corp. | 2,000 | | 90,140 |
Food Retail - 0.8% |
Safeway, Inc. (a) | 4,000 | | 78,960 |
Whole Foods Market, Inc. | 200 | | 19,070 |
| | 98,030 |
Hypermarkets & Super Centers - 4.4% |
Costco Wholesale Corp. | 2,900 | | 140,389 |
Wal-Mart Stores, Inc. | 7,280 | | 384,530 |
| | 524,919 |
TOTAL FOOD & STAPLES RETAILING | | 713,089 |
|
| Shares | | Value (Note 1) |
FOOD PRODUCTS - 3.9% |
Agricultural Products - 1.6% |
Bunge Ltd. | 2,400 | | $ 136,824 |
Fresh Del Monte Produce, Inc. | 1,900 | | 56,259 |
| | 193,083 |
Packaged Foods & Meats - 2.3% |
Dean Foods Co. (a) | 2,740 | | 90,283 |
Smithfield Foods, Inc. (a) | 4,400 | | 130,196 |
SunOpta, Inc. (a) | 1,800 | | 12,915 |
The J.M. Smucker Co. | 800 | | 37,656 |
| | 271,050 |
TOTAL FOOD PRODUCTS | | 464,133 |
HOTELS, RESTAURANTS & LEISURE - 15.5% |
Casinos & Gaming - 2.4% |
Caesars Entertainment, Inc. (a) | 2,000 | | 40,280 |
International Game Technology | 1,800 | | 61,884 |
MGM MIRAGE (a) | 2,500 | | 181,850 |
| | 284,014 |
Hotels, Resorts & Cruise Lines - 5.5% |
Carnival Corp. unit | 2,900 | | 167,127 |
Hilton Hotels Corp. | 2,800 | | 63,672 |
Kerzner International Ltd. (a) | 600 | | 36,030 |
Royal Caribbean Cruises Ltd. | 2,500 | | 136,100 |
Starwood Hotels & Resorts Worldwide, Inc. unit | 3,400 | | 198,560 |
Wyndham International, Inc. Class A (a) | 54,800 | | 65,212 |
| | 666,701 |
Leisure Facilities - 0.1% |
International Speedway Corp. Class A | 300 | | 15,840 |
Restaurants - 7.5% |
Brinker International, Inc. (a) | 1,930 | | 67,685 |
Buffalo Wild Wings, Inc. (a) | 200 | | 6,962 |
CBRL Group, Inc. | 700 | | 29,295 |
Krispy Kreme Doughnuts, Inc. (a) | 5,400 | | 68,040 |
McDonald's Corp. | 11,110 | | 356,187 |
Outback Steakhouse, Inc. | 2,680 | | 122,690 |
Starbucks Corp. (a) | 1,000 | | 62,360 |
Wendy's International, Inc. | 2,980 | | 116,995 |
Yum! Brands, Inc. | 1,600 | | 75,488 |
| | 905,702 |
TOTAL HOTELS, RESTAURANTS & LEISURE | | 1,872,257 |
HOUSEHOLD PRODUCTS - 5.1% |
Household Products - 5.1% |
Colgate-Palmolive Co. | 2,700 | | 138,132 |
Kimberly-Clark Corp. | 640 | | 42,118 |
Procter & Gamble Co. | 7,840 | | 431,827 |
| | 612,077 |
Common Stocks - continued |
| Shares | | Value (Note 1) |
INDUSTRIAL CONGLOMERATES - 0.7% |
Industrial Conglomerates - 0.7% |
3M Co. | 1,100 | | $ 90,277 |
INTERNET & CATALOG RETAIL - 1.5% |
Internet Retail - 1.5% |
Amazon.com, Inc. (a) | 1,400 | | 62,006 |
eBay, Inc. (a) | 1,000 | | 116,280 |
| | 178,286 |
INTERNET SOFTWARE & SERVICES - 5.7% |
Internet Software & Services - 5.7% |
Google, Inc. Class A | 1,700 | | 328,270 |
Sina Corp. (a) | 1,200 | | 38,472 |
Sohu.com, Inc. (a) | 800 | | 14,168 |
Yahoo!, Inc. (a) | 7,964 | | 300,084 |
| | 680,994 |
LEISURE EQUIPMENT & PRODUCTS - 4.5% |
Leisure Products - 4.5% |
Brunswick Corp. | 4,200 | | 207,900 |
MarineMax, Inc. (a) | 2,200 | | 65,472 |
Polaris Industries, Inc. | 2,300 | | 156,446 |
RC2 Corp. (a) | 600 | | 19,560 |
SCP Pool Corp. | 2,950 | | 94,105 |
| | 543,483 |
MEDIA - 17.9% |
Advertising - 5.7% |
ADVO, Inc. | 1,300 | | 46,345 |
Harte-Hanks, Inc. | 800 | | 20,784 |
JC Decaux SA (a) | 6,700 | | 195,229 |
Lamar Advertising Co. Class A (a) | 2,870 | | 122,779 |
Omnicom Group, Inc. | 3,500 | | 295,120 |
| | 680,257 |
Broadcasting & Cable TV - 2.3% |
E.W. Scripps Co. Class A | 2,100 | | 101,388 |
EchoStar Communications Corp. Class A | 700 | | 23,268 |
Liberty Media Corp. Class A (a) | 5,210 | | 57,206 |
Liberty Media International, Inc.
Class A (a) | 15 | | 693 |
Radio One, Inc. Class D (non-vtg.) (a) | 1,600 | | 25,792 |
SBS Broadcasting SA (a) | 700 | | 28,161 |
Spanish Broadcasting System, Inc.
Class A (a) | 2,820 | | 29,779 |
Univision Communications, Inc.
Class A (a) | 400 | | 11,708 |
| | 277,995 |
Movies & Entertainment - 7.5% |
Fox Entertainment Group, Inc. Class A (a) | 3,740 | | 116,912 |
News Corp. Class A | 26,300 | | 490,758 |
Walt Disney Co. | 10,600 | | 294,680 |
| | 902,350 |
|
| Shares | | Value (Note 1) |
Publishing - 2.4% |
Gannett Co., Inc. | 1,480 | | $ 120,916 |
McGraw-Hill Companies, Inc. | 700 | | 64,078 |
Reuters Group PLC sponsored ADR | 700 | | 30,065 |
Washington Post Co. Class B | 80 | | 78,642 |
| | 293,701 |
TOTAL MEDIA | | 2,154,303 |
MULTILINE RETAIL - 4.8% |
Department Stores - 1.7% |
Federated Department Stores, Inc. | 1,100 | | 63,569 |
JCPenney Co., Inc. | 1,600 | | 66,240 |
Neiman Marcus Group, Inc. Class A | 400 | | 28,616 |
Nordstrom, Inc. | 900 | | 42,057 |
Saks, Inc. | 600 | | 8,706 |
| | 209,188 |
General Merchandise Stores - 3.1% |
Big Lots, Inc. (a) | 1,800 | | 21,834 |
Family Dollar Stores, Inc. | 1,860 | | 58,088 |
Target Corp. | 5,600 | | 290,808 |
| | 370,730 |
TOTAL MULTILINE RETAIL | | 579,918 |
PAPER & FOREST PRODUCTS - 0.0% |
Paper Products - 0.0% |
Neenah Paper, Inc. (a) | 19 | | 619 |
PERSONAL PRODUCTS - 3.9% |
Personal Products - 3.9% |
Alberto-Culver Co. | 2,400 | | 116,568 |
Avon Products, Inc. | 4,800 | | 185,760 |
Gillette Co. | 3,800 | | 170,164 |
| | 472,492 |
REAL ESTATE - 0.6% |
Real Estate Investment Trusts - 0.3% |
MeriStar Hospitality Corp. (a) | 5,000 | | 41,750 |
Real Estate Management & Development - 0.3% |
ZipRealty, Inc. | 1,800 | | 32,166 |
TOTAL REAL ESTATE | | 73,916 |
SOFTWARE - 0.6% |
Home Entertainment Software - 0.6% |
Electronic Arts, Inc. (a) | 1,200 | | 74,016 |
SPECIALTY RETAIL - 11.8% |
Apparel Retail - 3.5% |
Aeropostale, Inc. (a) | 800 | | 23,544 |
American Eagle Outfitters, Inc. | 4,500 | | 211,950 |
Chico's FAS, Inc. (a) | 1,200 | | 54,636 |
Foot Locker, Inc. | 3,400 | | 91,562 |
Gap, Inc. | 1,100 | | 23,232 |
Common Stocks - continued |
| Shares | | Value (Note 1) |
SPECIALTY RETAIL - CONTINUED |
Apparel Retail - continued |
Hot Topic, Inc. (a) | 800 | | $ 13,752 |
Limited Brands, Inc. | 314 | | 7,228 |
| | 425,904 |
Computer & Electronics Retail - 0.5% |
Best Buy Co., Inc. | 900 | | 53,478 |
Home Improvement Retail - 4.9% |
Home Depot, Inc. | 10,910 | | 466,293 |
Lowe's Companies, Inc. | 2,100 | | 120,939 |
| | 587,232 |
Specialty Stores - 2.9% |
Office Depot, Inc. (a) | 3,300 | | 57,288 |
PETsMART, Inc. | 800 | | 28,424 |
Staples, Inc. | 3,000 | | 101,130 |
Steiner Leisure Ltd. (a) | 3,128 | | 93,465 |
Toys 'R' Us, Inc. (a) | 1,800 | | 36,846 |
West Marine, Inc. (a) | 1,300 | | 32,175 |
| | 349,328 |
TOTAL SPECIALTY RETAIL | | 1,415,942 |
TEXTILES, APPAREL & LUXURY GOODS - 3.8% |
Apparel, Accessories & Luxury Goods - 2.2% |
Coach, Inc. (a) | 1,100 | | 62,040 |
Kenneth Cole Productions, Inc. Class A (sub. vtg.) | 600 | | 18,516 |
Liz Claiborne, Inc. | 2,100 | | 88,641 |
Polo Ralph Lauren Corp. Class A | 1,500 | | 63,900 |
Quiksilver, Inc. (a) | 900 | | 26,811 |
| | 259,908 |
Footwear - 1.6% |
NIKE, Inc. Class B | 2,000 | | 181,380 |
Phoenix Footwear Group, Inc. (a) | 2,100 | | 16,338 |
| | 197,718 |
TOTAL TEXTILES, APPAREL & LUXURY GOODS | | 457,626 |
TOTAL COMMON STOCKS (Cost $9,584,765) | 11,556,953 |
Money Market Funds - 2.8% |
| Shares | | Value (Note 1) |
Fidelity Cash Central Fund, 2.24% (b)
(Cost $338,997) | 338,997 | | $ 338,997 |
TOTAL INVESTMENT PORTFOLIO - 98.7% (Cost $9,923,762) | 11,895,950 |
NET OTHER ASSETS - 1.3% | | 154,821 |
NET ASSETS - 100% | $ 12,050,771 |
Legend |
(a) Non-income producing |
(b) Affiliated fund that is available only to investment companies and other accounts managed by Fidelity Investments. The rate quoted is the annualized seven-day yield of the fund at period end. A complete listing of the fund's holdings as of its most recent fiscal year end is available upon request. |
Income Tax Information |
At December 31, 2004, the fund had a capital loss carryforward of approximately $2,359,000 of which $1,677,000 and $682,000 will expire on December 31, 2010 and 2011, respectively. |
See accompanying notes which are an integral part of the financial statements.
Annual Report
Fidelity Variable Insurance Products: Consumer Industries Portfolio
Financial Statements
Statement of Assets and Liabilities
December 31, 2004 |
| | |
Assets | | |
Investment in securities, at value (cost $9,923,762) - See accompanying schedule | | $ 11,895,950 |
Cash | | 4,458 |
Receivable for fund shares sold | | 172,852 |
Dividends receivable | | 9,939 |
Interest receivable | | 875 |
Prepaid expenses | | 40 |
Other receivables | | 798 |
Total assets | | 12,084,912 |
| | |
Liabilities | | |
Payable for fund shares redeemed | $ 16 | |
Accrued management fee | 5,469 | |
Other affiliated payables | 3,155 | |
Other payables and accrued expenses | 25,501 | |
Total liabilities | | 34,141 |
| | |
Net Assets | | $ 12,050,771 |
Net Assets consist of: | | |
Paid in capital | | $ 12,517,183 |
Accumulated undistributed net realized gain (loss) on investments and foreign currency transactions | | (2,438,600) |
Net unrealized appreciation (depreciation) on investments | | 1,972,188 |
Net Assets, for 1,083,841 shares outstanding | | $ 12,050,771 |
Net Asset Value, offering price and redemption price per share ($12,050,771 ÷ 1,083,841 shares) | | $ 11.12 |
Statement of Operations
Year ended December 31, 2004 |
| | |
Investment Income | | |
Dividends | | $ 91,289 |
Interest | | 3,832 |
Total income | | 95,121 |
| | |
Expenses | | |
Management fee | $ 61,441 | |
Transfer agent fees | 10,724 | |
Accounting fees and expenses | 30,001 | |
Non-interested trustees' compensation | 58 | |
Custodian fees and expenses | 6,280 | |
Audit | 32,324 | |
Legal | 552 | |
Miscellaneous | 2,999 | |
Total expenses before reductions | 144,379 | |
Expense reductions | (4,059) | 140,320 |
Net investment income (loss) | | (45,199) |
Realized and Unrealized Gain (Loss) Net realized gain (loss) on: | | |
Investment securities | 483,108 | |
Foreign currency transactions | 110 | |
Total net realized gain (loss) | | 483,218 |
Change in net unrealized appreciation (depreciation) on investment securities | | 502,895 |
Net gain (loss) | | 986,113 |
Net increase (decrease) in net assets resulting from operations | | $ 940,914 |
See accompanying notes which are an integral part of the financial statements.
Annual Report
Financial Statements - continued
Statement of Changes in Net Assets
| Year ended
December 31,
2004 | Year ended
December 31,
2003 |
Increase (Decrease) in Net Assets | | |
Operations | | |
Net investment income (loss) | $ (45,199) | $ (34,989) |
Net realized gain (loss) | 483,218 | (424,475) |
Change in net unrealized appreciation (depreciation) | 502,895 | 2,652,701 |
Net increase (decrease) in net assets resulting from operations | 940,914 | 2,193,237 |
Share transactions
Proceeds from sales of shares | 3,448,896 | 2,064,591 |
Cost of shares redeemed | (3,300,182) | (5,477,315) |
Net increase (decrease) in net assets resulting from share transactions | 148,714 | (3,412,724) |
Redemption fees | 2,426 | 1,846 |
Total increase (decrease) in net assets | 1,092,054 | (1,217,641) |
| | |
Net Assets | | |
Beginning of period | 10,958,717 | 12,176,358 |
End of period | $ 12,050,771 | $ 10,958,717 |
Other Information Shares | | |
Sold | 335,214 | 223,933 |
Redeemed | (328,967) | (643,510) |
Net increase (decrease) | 6,247 | (419,577) |
Financial Highlights
Years ended December 31, | 2004 | 2003 | 2002 | 2001F |
Selected Per-Share Data | | | | |
Net asset value, beginning of period | $ 10.17 | $ 8.13 | $ 9.72 | $ 10.00 |
Income from Investment Operations | | | | |
Net investment income (loss)E | (.04) | (.03) | (.03) | .01 |
Net realized and unrealized gain (loss) | .99 | 2.07 | (1.56) | (.29) |
Total from investment operations | .95 | 2.04 | (1.59) | (.28) |
Distributions from net investment income | - | - | (.01) | - |
Redemption fees added to paid in capitalE | -H | -H | .01 | -H |
Net asset value, end of period | $ 11.12 | $ 10.17 | $ 8.13 | $ 9.72 |
Total ReturnB,C,D | 9.34% | 25.09% | (16.27)% | (2.80)% |
Ratios to Average Net AssetsG | | | | |
Expenses before expense reductions | 1.35% | 1.72% | 1.30% | 2.61%A |
Expenses net of voluntary waivers, if any | 1.35% | 1.50% | 1.30% | 1.50%A |
Expenses net of all reductions | 1.31% | 1.46% | 1.27% | 1.48%A |
Net investment income (loss) | (.42)% | (.34)% | (.29)% | .17%A |
Supplemental Data | | | | |
Net assets, end of period (000 omitted) | $ 12,051 | $ 10,959 | $ 12,176 | $ 7,989 |
Portfolio turnover rate | 145% | 108% | 129% | 162%A |
A Annualized
B Total returns for periods of less than one year are not annualized.
C Total returns do not reflect charges attributable to your insurance company's separate account. Inclusion of these charges would reduce the total returns shown.
D Total returns would have been lower had certain expenses not been reduced during the periods shown.
E Calculated based on average shares outstanding during the period.
F For the period July 18, 2001 (commencement of operations) to December 31, 2001.
G Expense ratios reflect operating expenses of the fund. Expenses before reductions do not reflect amounts reimbursed by the investment adviser or reductions from brokerage service arrangements or other expense offset arrangements and do not represent the amount paid by the fund during periods when reimbursements or reductions occur. Expense ratios before reductions for start-up periods may not be representative of longer-term operating periods. Expenses net of any voluntary waivers reflect expenses after reimbursement by the investment adviser but prior to reductions from brokerage service arrangements or other expense offset arrangements. Expenses net of all reductions represent the net expenses paid by the fund.
H Amount represents less than $.01 per share.
See accompanying notes which are an integral part of the financial statements.
Consumer Industries Portfolio
Fidelity Variable Insurance Products: Cyclical Industries Portfolio
Performance: The Bottom Line
Average annual total return reflects the change in the value of an investment, assuming reinvestment of the class' dividend income and capital gains (the profits earned upon the sale of securities that have grown in value) and assuming a constant rate of performance each year. During periods of reimbursement by Fidelity, a fund's total return will be greater than it would be had the reimbursement not occurred. Performance numbers are net of all underlying fund operating expenses, but do not include any insurance charges imposed by your insurance company's separate account. If performance information included the effect of these additional charges, the total returns would have been lower. How a fund did yesterday is no guarantee of how it will do tomorrow.
Average Annual Total Returns
Periods ended December 31, 2004 | Past 1
year | Life of fundA |
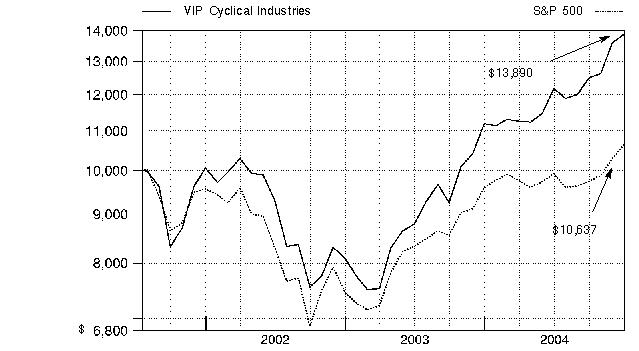
Fidelity VIP: Cyclical Industries | 24.10% | 9.97% |
A From July 18, 2001.
$10,000 Over Life of Fund
Let's say hypothetically that $10,000 was invested in Fidelity® Variable Insurance Products: Cyclical Industries Portfolio on July 18, 2001, when the fund started. The chart shows how the value of your investment would have changed, and also shows how the S&P 500 Index performed over the same period.
Annual Report
Fidelity Variable Insurance Products: Cyclical Industries Portfolio
Management's Discussion of Fund Performance
Comments from Matthew Friedman, Portfolio Manager of Fidelity® Variable Insurance Products: Cyclical Industries Portfolio
The year ending December 31, 2004, generally was positive for equity investors, as many stock market benchmarks produced double-digit gains. Broad-based themes included the continued dominance of small-cap stocks, which outperformed large-caps for the sixth consecutive year. The small-cap Russell 2000® Index was up 18.33% in 2004, while the larger-cap Standard & Poor's 500SM Index rose 10.88%. Value stocks ended the year well ahead of growth stocks: The Russell 3000® Value Index advanced 16.94%, compared to 6.93% for the Russell 3000 Growth Index. Energy and basic materials stocks led the market upward. Energy stocks were boosted by record-high oil prices, while strong demand from China helped support commodity prices. The health care sector was among the market's weakest performers. Technology also fell off the pace, though it was helped by a rally late in the year. The tech-heavy NASDAQ Composite® Index returned 9.15%, thanks primarily to a 14.87% jump in the fourth quarter. Elsewhere, the Dow Jones Industrial AverageSM gained 5.37% for the year.
Cyclical stocks outperformed the broad market during the 12 months ending December 31, 2004. Against this backdrop, the portfolio more than doubled the return of the S&P 500® and also beat the Goldman Sachs® Cyclical Industries Index, which returned 19.61%. Early in the period, we switched the portfolio's emphasis from early-cycle industries, such as automobile manufacturers, to late-cycle groups, such as chemical companies. Late-cycle stocks tend to perform better in the later stages of an economic recovery, which we experienced throughout 2004. This strategy helped performance, as did good stock selection overall. Commodity chemical companies Millennium Chemicals and Lyondell Chemical, which merged in December, profited from the combination of low inventories and high overseas demand for their products. Also, not owning or significantly underweighting General Motors, DaimlerChrysler and Ford - all early-cycle stocks and sector index components - helped performance, as high inventories and reduced demand contributed to shrinking profit margins in the industry. Although chemical companies were able to price skyrocketing energy costs into their products, airlines weren't as fortunate. Price competition from discount airlines and higher energy costs weighed on Continental, AirTran and Ireland's Ryanair, each of which detracted from performance.
The views expressed in this statement reflect those of the portfolio manager only through the end of the period of the report as stated on the cover and do not necessarily represent the views of Fidelity or any other person in the Fidelity organization. Any such views are subject to change at any time based upon market or other conditions and Fidelity disclaims any responsibility to update such views. These views may not be relied on as investment advice and, because investment decisions for a Fidelity fund are based on numerous factors, may not be relied on as an indication of trading intent on behalf of any Fidelity fund.
Annual Report
Fidelity Variable Insurance Products: Cyclical Industries Portfolio
Investment Summary
Top Five Stocks as of December 31, 2004 |
| % of fund's net assets |
Tyco International Ltd. | 5.0 |
General Electric Co. | 4.7 |
United Parcel Service, Inc. Class B | 3.6 |
Lyondell Chemical Co. | 3.3 |
Honeywell International, Inc. | 3.2 |
| 19.8 |
Top Industries as of December 31, 2004 |
% of fund's net assets |
| Aerospace & Defense | 18.4% | |
| Chemicals | 17.7% | |
| Industrial Conglomerates | 14.4% | |
| Air Freight & Logistics | 9.4% | |
| Machinery | 9.2% | |
 | All Others* | 30.9% | |

* Includes short-term investments and net other assets. |
Annual Report
Fidelity Variable Insurance Products: Cyclical Industries Portfolio
Investments December 31, 2004
Showing Percentage of Net Assets
Common Stocks - 97.9% |
| Shares | | Value (Note 1) |
AEROSPACE & DEFENSE - 18.4% |
Aerospace & Defense - 18.4% |
BAE Systems PLC | 39,217 | | $ 173,473 |
BE Aerospace, Inc. (a) | 49,800 | | 579,672 |
Bombardier, Inc. Class B (sub. vtg.) | 700 | | 1,388 |
DRS Technologies, Inc. (a) | 3,900 | | 166,569 |
EADS NV | 16,571 | | 480,834 |
EDO Corp. | 15,920 | | 505,460 |
Embraer - Empresa Brasileira de Aeronautica SA sponsored ADR | 5,800 | | 193,952 |
Engineered Support Systems, Inc. | 1,600 | | 94,752 |
Essex Corp. (a) | 1,700 | | 34,425 |
General Dynamics Corp. | 2,300 | | 240,580 |
Goodrich Corp. | 8,800 | | 287,232 |
Hexcel Corp. (a) | 10,400 | | 150,800 |
Honeywell International, Inc. | 56,600 | | 2,004,206 |
L-3 Communications Holdings, Inc. | 5,200 | | 380,848 |
Lockheed Martin Corp. | 19,070 | | 1,059,339 |
Meggitt PLC | 41,200 | | 206,952 |
Northrop Grumman Corp. | 13,758 | | 747,885 |
Precision Castparts Corp. | 9,900 | | 650,232 |
Raytheon Co. | 13,400 | | 520,322 |
Rockwell Collins, Inc. | 9,020 | | 355,749 |
Rolls-Royce Group PLC | 11,800 | | 55,933 |
The Boeing Co. | 29,310 | | 1,517,379 |
United Defense Industries, Inc. (a) | 9,700 | | 458,325 |
United Technologies Corp. | 5,700 | | 589,095 |
| | 11,455,402 |
AIR FREIGHT & LOGISTICS - 9.4% |
Air Freight & Logistics - 9.4% |
Dynamex, Inc. (a) | 24,525 | | 454,448 |
EGL, Inc. (a) | 10,900 | | 325,801 |
Expeditors International of Washington, Inc. | 6,900 | | 385,572 |
FedEx Corp. | 13,400 | | 1,319,766 |
Forward Air Corp. (a) | 10,240 | | 457,728 |
Hub Group, Inc. Class A (a) | 3,132 | | 163,553 |
Park-Ohio Holdings Corp. (a) | 6,047 | | 156,617 |
Ryder System, Inc. | 3,500 | | 167,195 |
United Parcel Service, Inc. Class B | 25,800 | | 2,204,868 |
UTI Worldwide, Inc. | 2,900 | | 197,258 |
| | 5,832,806 |
AIRLINES - 2.0% |
Airlines - 2.0% |
AirTran Holdings, Inc. (a) | 63,400 | | 678,380 |
Alaska Air Group, Inc. (a) | 5,200 | | 174,148 |
AMR Corp. (a) | 400 | | 4,380 |
Southwest Airlines Co. | 22,200 | | 361,416 |
| | 1,218,324 |
|
| Shares | | Value (Note 1) |
AUTO COMPONENTS - 0.2% |
Auto Parts & Equipment - 0.2% |
Amerigon, Inc. (a) | 800 | | $ 2,990 |
BorgWarner, Inc. | 900 | | 48,753 |
Delphi Corp. | 100 | | 902 |
Johnson Controls, Inc. | 800 | | 50,752 |
| | 103,397 |
AUTOMOBILES - 0.6% |
Automobile Manufacturers - 0.6% |
Ford Motor Co. | 300 | | 4,392 |
Hyundai Motor Co. | 3,660 | | 196,223 |
Renault SA | 1,500 | | 125,243 |
Toyota Motor Corp. ADR | 900 | | 73,683 |
| | 399,541 |
BUILDING PRODUCTS - 1.8% |
Building Products - 1.8% |
American Standard Companies, Inc. (a) | 11,810 | | 487,989 |
Masco Corp. | 10,020 | | 366,031 |
York International Corp. | 7,600 | | 262,504 |
| | 1,116,524 |
CHEMICALS - 17.7% |
Commodity Chemicals - 5.4% |
Lyondell Chemical Co. | 71,336 | | 2,063,037 |
NOVA Chemicals Corp. | 15,800 | | 746,550 |
Pioneer Companies, Inc. (a) | 24,100 | | 500,075 |
Spartech Corp. | 1,800 | | 48,762 |
| | 3,358,424 |
Diversified Chemicals - 2.5% |
Dow Chemical Co. | 25,600 | | 1,267,456 |
FMC Corp. (a) | 6,100 | | 294,630 |
| | 1,562,086 |
Fertilizers & Agricultural Chemicals - 3.7% |
Agrium, Inc. | 19,600 | | 330,750 |
Monsanto Co. | 13,300 | | 738,815 |
Mosaic Co. (a) | 14,300 | | 233,376 |
Potash Corp. of Saskatchewan | 11,900 | | 989,188 |
| | 2,292,129 |
Industrial Gases - 2.7% |
Air Products & Chemicals, Inc. | 14,300 | | 828,971 |
Airgas, Inc. | 6,500 | | 172,315 |
Praxair, Inc. | 15,800 | | 697,570 |
| | 1,698,856 |
Specialty Chemicals - 3.4% |
Albemarle Corp. | 8,300 | | 321,293 |
Cytec Industries, Inc. | 9,300 | | 478,206 |
Ecolab, Inc. | 19,000 | | 667,470 |
Ferro Corp. | 8,530 | | 197,811 |
PolyOne Corp. (a) | 8,230 | | 74,564 |
Common Stocks - continued |
| Shares | | Value (Note 1) |
CHEMICALS - CONTINUED |
Specialty Chemicals - continued |
Rohm & Haas Co. | 200 | | $ 8,846 |
Valspar Corp. | 7,100 | | 355,071 |
| | 2,103,261 |
TOTAL CHEMICALS | | 11,014,756 |
COMMERCIAL SERVICES & SUPPLIES - 1.4% |
Employment Services - 0.2% |
Heidrick & Struggles International, Inc. (a) | 1,700 | | 58,259 |
Korn/Ferry International (a) | 2,500 | | 51,875 |
| | 110,134 |
Environmental Services - 0.7% |
Waste Connections, Inc. (a) | 4,500 | | 154,125 |
Waste Services, Inc. (a) | 76,600 | | 279,590 |
| | 433,715 |
Office Services & Supplies - 0.5% |
Herman Miller, Inc. | 12,666 | | 349,962 |
TOTAL COMMERCIAL SERVICES & SUPPLIES | | 893,811 |
COMMUNICATIONS EQUIPMENT - 0.5% |
Communications Equipment - 0.5% |
Harris Corp. | 4,700 | | 290,413 |
CONSTRUCTION & ENGINEERING - 3.1% |
Construction & Engineering - 3.1% |
Dycom Industries, Inc. (a) | 18,300 | | 558,516 |
EMCOR Group, Inc. (a) | 1,600 | | 72,288 |
Fluor Corp. | 2,900 | | 158,079 |
Foster Wheeler Ltd. (a) | 7,170 | | 113,788 |
Granite Construction, Inc. | 5,500 | | 146,300 |
Jacobs Engineering Group, Inc. (a) | 12,400 | | 592,596 |
Perini Corp. (a) | 7,700 | | 128,513 |
Shaw Group, Inc. (a) | 100 | | 1,785 |
Washington Group International, Inc. (a) | 3,500 | | 144,375 |
| | 1,916,240 |
CONSTRUCTION MATERIALS - 1.5% |
Construction Materials - 1.5% |
Eagle Materials, Inc. | 3,420 | | 295,317 |
Eagle Materials, Inc. Class B | 1,400 | | 118,020 |
Florida Rock Industries, Inc. | 1,200 | | 71,436 |
Texas Industries, Inc. | 3,600 | | 224,568 |
Vulcan Materials Co. | 3,900 | | 212,979 |
| | 922,320 |
|
| Shares | | Value (Note 1) |
CONTAINERS & PACKAGING - 0.7% |
Metal & Glass Containers - 0.7% |
Owens-Illinois, Inc. (a) | 11,950 | | $ 270,668 |
Pactiv Corp. (a) | 5,700 | | 144,153 |
| | 414,821 |
DISTRIBUTORS - 0.3% |
Distributors - 0.3% |
WESCO International, Inc. (a) | 5,600 | | 165,984 |
ELECTRICAL EQUIPMENT - 1.6% |
Electrical Components & Equipment - 1.6% |
A.O. Smith Corp. | 1,700 | | 50,898 |
A.O. Smith Corp. Class A | 200 | | 6,000 |
AMETEK, Inc. | 4,200 | | 149,814 |
Cooper Industries Ltd. Class A | 900 | | 61,101 |
Emerson Electric Co. | 2,900 | | 203,290 |
NEOMAX Co. Ltd. | 2,000 | | 35,497 |
Rockwell Automation, Inc. | 3,200 | | 158,560 |
Roper Industries, Inc. | 5,870 | | 356,720 |
| | 1,021,880 |
ELECTRONIC EQUIPMENT & INSTRUMENTS - 0.2% |
Electronic Equipment & Instruments - 0.2% |
Cognex Corp. | 1,600 | | 44,640 |
Dionex Corp. (a) | 1,940 | | 109,940 |
| | 154,580 |
FOOD PRODUCTS - 0.1% |
Agricultural Products - 0.1% |
Delta & Pine Land Co. | 2,700 | | 73,656 |
HEALTH CARE EQUIPMENT & SUPPLIES - 0.0% |
Health Care Equipment - 0.0% |
Thermo Electron Corp. (a) | 710 | | 21,435 |
HOUSEHOLD DURABLES - 5.7% |
Home Furnishings - 0.9% |
Dixie Group, Inc. (a) | 3,700 | | 62,382 |
Interface, Inc. Class A (a) | 32,400 | | 323,028 |
Tempur-Pedic International, Inc. | 7,200 | | 152,640 |
| | 538,050 |
Homebuilding - 3.9% |
D.R. Horton, Inc. | 10,650 | | 429,302 |
KB Home | 6,300 | | 657,720 |
Ryland Group, Inc. | 10,280 | | 591,511 |
Standard Pacific Corp. | 100 | | 6,414 |
Toll Brothers, Inc. (a) | 10,900 | | 747,849 |
| | 2,432,796 |
Common Stocks - continued |
| Shares | | Value (Note 1) |
HOUSEHOLD DURABLES - CONTINUED |
Household Appliances - 0.9% |
Blount International, Inc. (a) | 17,800 | | $ 310,076 |
Maytag Corp. | 11,900 | | 251,090 |
| | 561,166 |
TOTAL HOUSEHOLD DURABLES | | 3,532,012 |
INDUSTRIAL CONGLOMERATES - 14.4% |
Industrial Conglomerates - 14.4% |
3M Co. | 20,460 | | 1,679,152 |
Carlisle Companies, Inc. | 400 | | 25,968 |
General Electric Co. | 81,160 | | 2,962,340 |
Siemens AG sponsored ADR | 14,700 | | 1,244,649 |
Tyco International Ltd. | 86,540 | | 3,092,939 |
| | 9,005,048 |
MACHINERY - 9.2% |
Construction & Farm Machinery & Heavy Trucks - 4.2% |
AGCO Corp. (a) | 25,510 | | 558,414 |
Bucyrus International, Inc. Class A | 14,600 | | 593,344 |
Caterpillar, Inc. | 3,800 | | 370,538 |
Daewoo Shipbuilding & Marine Engineering Co. Ltd. | 19,120 | | 284,436 |
Navistar International Corp. (a) | 10,480 | | 460,910 |
PACCAR, Inc. | 1,240 | | 99,795 |
Toro Co. | 900 | | 73,215 |
Wabash National Corp. (a) | 7,600 | | 204,668 |
| | 2,645,320 |
Industrial Machinery - 5.0% |
Briggs & Stratton Corp. | 1,800 | | 74,844 |
CUNO, Inc. (a) | 2,300 | | 136,620 |
Danaher Corp. | 3,700 | | 212,417 |
Dover Corp. | 5,900 | | 247,446 |
Gardner Denver, Inc. (a) | 2,000 | | 72,580 |
IDEX Corp. | 3,830 | | 155,115 |
Ingersoll-Rand Co. Ltd. Class A | 1,700 | | 136,510 |
ITT Industries, Inc. | 9,000 | | 760,050 |
Kennametal, Inc. | 540 | | 26,876 |
Manitowoc Co., Inc. | 9,600 | | 361,440 |
Pall Corp. | 5,700 | | 165,015 |
Pentair, Inc. | 4,380 | | 190,793 |
SPX Corp. | 9,200 | | 368,552 |
|
| Shares | | Value (Note 1) |
Timken Co. | 4,400 | | $ 114,488 |
Watts Water Technologies, Inc. Class A | 2,300 | | 74,152 |
| | 3,096,898 |
TOTAL MACHINERY | | 5,742,218 |
MARINE - 0.1% |
Marine - 0.1% |
Alexander & Baldwin, Inc. | 820 | | 34,784 |
METALS & MINING - 0.2% |
Diversified Metals & Mining - 0.2% |
Brush Engineered Materials, Inc. (a) | 1,400 | | 25,900 |
Massey Energy Co. | 2,800 | | 97,860 |
| | 123,760 |
OIL & GAS - 1.7% |
Oil & Gas Refining & Marketing & Transportation - 1.7% |
Ashland, Inc. | 9,800 | | 572,124 |
Frontline Ltd. (NY Shares) | 5,600 | | 248,416 |
Ship Finance International Ltd. | 706 | | 14,487 |
Teekay Shipping Corp. | 2,500 | | 105,275 |
Top Tankers, Inc. | 7,900 | | 128,375 |
| | 1,068,677 |
ROAD & RAIL - 6.0% |
Railroads - 5.4% |
Burlington Northern Santa Fe Corp. | 14,200 | | 671,802 |
Canadian National Railway Co. | 18,700 | | 1,138,674 |
Canadian Pacific Railway Ltd. | 200 | | 6,850 |
CSX Corp. | 15,220 | | 610,018 |
Norfolk Southern Corp. | 26,860 | | 972,063 |
| | 3,399,407 |
Trucking - 0.6% |
Laidlaw International, Inc. (a) | 1,200 | | 25,680 |
Landstar System, Inc. (a) | 2,478 | | 182,480 |
Swift Transportation Co., Inc. (a) | 6,600 | | 141,768 |
| | 349,928 |
TOTAL ROAD & RAIL | | 3,749,335 |
SPECIALTY RETAIL - 0.5% |
Specialty Stores - 0.5% |
Advance Auto Parts, Inc. (a) | 1,800 | | 78,624 |
Asbury Automotive Group, Inc. (a) | 8,400 | | 115,752 |
AutoNation, Inc. (a) | 2,600 | | 49,946 |
The Pep Boys - Manny, Moe & Jack | 5,700 | | 97,299 |
| | 341,621 |
Common Stocks - continued |
| Shares | | Value (Note 1) |
TRADING COMPANIES & DISTRIBUTORS - 0.6% |
Trading Companies & Distributors - 0.6% |
MSC Industrial Direct Co., Inc. Class A | 5,500 | | $ 197,890 |
W.W. Grainger, Inc. | 2,320 | | 154,558 |
| | 352,448 |
TOTAL COMMON STOCKS (Cost $52,651,715) | 60,965,793 |
Money Market Funds - 2.2% |
| | | |
Fidelity Cash Central Fund, 2.24% (b)
(Cost $1,395,448) | 1,395,448 | | 1,395,448 |
TOTAL INVESTMENT PORTFOLIO - 100.1% (Cost $54,047,163) | 62,361,241 |
NET OTHER ASSETS - (0.1)% | (62,144) |
NET ASSETS - 100% | $ 62,299,097 |
Legend |
(a) Non-income producing |
(b) Affiliated fund that is available only to investment companies and other accounts managed by Fidelity Investments. The rate quoted is the annualized seven-day yield of the fund at period end. A complete listing of the fund's holdings as of its most recent fiscal year end is available upon request. |
Other Information |
Distribution of investments by country of issue, as a percentage of total net assets, is as follows: |
United States of America | 88.5% |
Canada | 5.1% |
Germany | 2.0% |
Others (individually less than 1%) | 4.4% |
| 100.0% |
Income Tax Information |
The fund hereby designates as capital gain dividends: For dividends with respect to the taxable year ended December 31, 2004, $189,000 or, if different, the net capital gain of such year. |
See accompanying notes which are an integral part of the financial statements.
Cyclical Industries Portfolio
Fidelity Variable Insurance Products: Cyclical Industries Portfolio
Financial Statements
Statement of Assets and Liabilities
December 31, 2004 |
| | |
Assets | | |
Investment in securities, at value (cost $54,047,163) - See accompanying schedule | | $ 62,361,241 |
Foreign currency held at value
(cost $2) | | 2 |
Receivable for investments sold | | 605,871 |
Receivable for fund shares sold | | 432,782 |
Dividends receivable | | 93,573 |
Interest receivable | | 3,869 |
Prepaid expenses | | 108 |
Other receivables | | 6,837 |
Total assets | | 63,504,283 |
| | |
Liabilities | | |
Payable for investments purchased | $ 1,140,406 | |
Accrued management fee | 28,413 | |
Other affiliated payables | 5,901 | |
Other payables and accrued expenses | 30,466 | |
Total liabilities | | 1,205,186 |
| | |
Net Assets | | $ 62,299,097 |
Net Assets consist of: | | |
Paid in capital | | $ 53,909,386 |
Undistributed net investment income | | 25,010 |
Accumulated undistributed net realized gain (loss) on investments and foreign currency transactions | | 50,559 |
Net unrealized appreciation (depreciation) on investments and assets and liabilities in foreign currencies | | 8,314,142 |
Net Assets, for 4,509,629 shares outstanding | | $ 62,299,097 |
Net Asset Value, offering price and redemption price per share ($62,299,097 ÷ 4,509,629 shares) | | $ 13.81 |
Statement of Operations
Year ended December 31, 2004 |
| | |
Investment Income | | |
Dividends (a) | | $ 437,544 |
Interest | | 30,587 |
Security lending | | 827 |
Total income | | 468,958 |
| | |
Expenses | | |
Management fee | $ 174,752 | |
Transfer agent fees | 24,764 | |
Accounting and security lending fees | 30,009 | |
Non-interested trustees' compensation | 150 | |
Custodian fees and expenses | 20,451 | |
Audit | 32,388 | |
Legal | 691 | |
Miscellaneous | 6,339 | |
Total expenses before reductions | 289,544 | |
Expense reductions | (13,629) | 275,915 |
Net investment income (loss) | | 193,043 |
Realized and Unrealized Gain (Loss) Net realized gain (loss) on: | | |
Investment securities | 2,225,822 | |
Foreign currency transactions | (1,967) | |
Total net realized gain (loss) | | 2,223,855 |
Change in net unrealized appreciation (depreciation) on: Investment securities | 5,631,494 | |
Assets and liabilities in foreign currencies | 81 | |
Total change in net unrealized appreciation (depreciation) | | 5,631,575 |
Net gain (loss) | | 7,855,430 |
Net increase (decrease) in net assets resulting from operations | | $ 8,048,473 |
(a) As a result of the change in the estimate of the return of capital component of dividend income realized in the year ended December 31, 2003, dividend income has been reduced by $12,216, with a corresponding increase to net realized gain (loss) and net unrealized appreciation (depreciation). |
See accompanying notes which are an integral part of the financial statements.
Annual Report
Fidelity Variable Insurance Products: Cyclical Industries Portfolio
Financial Statements - continued
Statement of Changes in Net Assets
| Year ended
December 31,
2004 | Year ended
December 31,
2003 |
Increase (Decrease) in Net Assets | | |
Operations | | |
Net investment income (loss) | $ 193,043 | $ 32,891 |
Net realized gain (loss) | 2,223,855 | 273,942 |
Change in net unrealized appreciation (depreciation) | 5,631,575 | 3,052,010 |
Net increase (decrease) in net assets resulting from operations | 8,048,473 | 3,358,843 |
Distributions to shareholders from net investment income | (176,284) | (33,211) |
Share transactions
Proceeds from sales of shares | 42,450,936 | 11,594,535 |
Reinvestment of distributions | 176,284 | 33,211 |
Cost of shares redeemed | (7,859,383) | (3,630,929) |
Net increase (decrease) in net assets resulting from share transactions | 34,767,837 | 7,996,817 |
Redemption fees | 41,074 | 11,897 |
Total increase (decrease) in net assets | 42,681,100 | 11,334,346 |
| | |
Net Assets | | |
Beginning of period | 19,617,997 | 8,283,651 |
End of period (including undistributed net investment income of $25,010 and $0, respectively) | $ 62,299,097 | $ 19,617,997 |
Other Information Shares | | |
Sold | 3,437,474 | 1,144,472 |
Issued in reinvestment of distributions | 12,719 | 2,995 |
Redeemed | (697,784) | (415,929) |
Net increase (decrease) | 2,752,409 | 731,538 |
Financial Highlights
Years ended December 31, | 2004 | 2003 | 2002 | 2001F |
Selected Per-Share Data | | | | |
Net asset value, beginning of period | $ 11.16 | $ 8.08 | $ 10.06 | $ 10.00 |
Income from Investment Operations | | | | |
Net investment income (loss)E | .08H | .03 | (.01) | .01 |
Net realized and unrealized gain (loss) | 2.59 | 3.06 | (1.98) | .04 |
Total from investment operations | 2.67 | 3.09 | (1.99) | .05 |
Distributions from net investment income | (.04) | (.02) | (.01) | - |
Redemption fees added to paid in capitalE | .02 | .01 | .02 | .01 |
Net asset value, end of period | $ 13.81 | $ 11.16 | $ 8.08 | $ 10.06 |
Total ReturnB,C,D | 24.10% | 38.37% | (19.60)% | .60% |
Ratios to Average Net AssetsG | | | | |
Expenses before expense reductions | .95% | 1.85% | 1.44% | 2.70%A |
Expenses net of voluntary waivers, if any | .95% | 1.50% | 1.44% | 1.50%A |
Expenses net of all reductions | .90% | 1.47% | 1.42% | 1.50%A |
Net investment income (loss) | .63%H | .35% | (.06)% | .18%A |
Supplemental Data | | | | |
Net assets, end of period (000 omitted) | $ 62,299 | $ 19,618 | $ 8,284 | $ 10,290 |
Portfolio turnover rate | 121% | 117% | 143% | 29%A |
A Annualized
B Total returns for periods of less than one year are not annualized.
C Total returns do not reflect charges attributable to your insurance company's separate account. Inclusion of these charges would reduce the total returns shown.
D Total returns would have been lower had certain expenses not been reduced during the periods shown.
E Calculated based on average shares outstanding during the period.
F For the period July 18, 2001 (commencement of operations) to December 31, 2001.
G Expense ratios reflect operating expenses of the fund. Expenses before reductions do not reflect amounts reimbursed by the investment adviser or reductions from brokerage service arrangements or other expense offset arrangements and do not represent the amount paid by the fund during periods when reimbursements or reductions occur. Expense ratios before reductions for start-up periods may not be representative of longer-term operating periods. Expenses net of any voluntary waivers reflect expenses after reimbursement by the investment adviser but prior to reductions from brokerage service arrangements or other expense offset arrangements. Expenses net of all reductions represent the net expenses paid by the fund.
H As a result of the change in the estimate of the return of capital component of dividend income realized in the year ended December 31, 2003, net investment income per share and the ratio of net investment income to average net assets for the year ended December 31, 2004, have been reduced by $.00 per share and .04%, respectively. The change in estimate has no impact on total net assets or total return of the fund.
See accompanying notes which are an integral part of the financial statements.
Cyclical Industrites Portfolio
Fidelity Variable Insurance Products: Financial Services Portfolio
Performance: The Bottom Line
Average annual total return reflects the change in the value of an investment, assuming reinvestment of the class' dividend income and capital gains (the profits earned upon the sale of securities that have grown in value) and assuming a constant rate of performance each year. During periods of reimbursement by Fidelity, a fund's total return will be greater than it would be had the reimbursement not occurred. Performance numbers are net of all underlying fund operating expenses, but do not include any insurance charges imposed by your insurance company's separate account. If performance information included the effect of these additional charges, the total returns would have been lower. How a fund did yesterday is no guarantee of how it will do tomorrow.
Average Annual Total Returns
Periods ended December 31, 2004 | Past 1
year | Life of fundA |
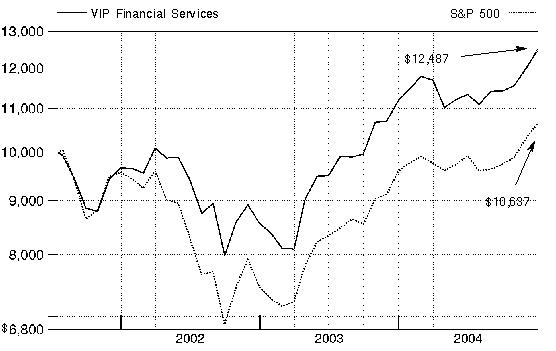
Fidelity VIP: Financial Services | 11.73% | 6.63% |
A From July 18, 2001.
$10,000 Over Life of Fund
Let's say hypothetically that $10,000 was invested in Fidelity® Variable Insurance Products: Financial Services Portfolio on July 18, 2001, when the fund started. The chart shows how the value of your investment would have changed, and also shows how the S&P 500 Index performed over the same period.
Annual Report
Fidelity Variable Insurance Products: Financial Services Portfolio
Management's Discussion of Fund Performance
Comments from Matthew Fruhan, Portfolio Manager of Fidelity® Variable Insurance Products: Financial Services Portfolio
The year ending December 31, 2004, generally was positive for equity investors, as many stock market benchmarks produced double-digit gains. Broad-based themes included the continued dominance of small-cap stocks, which outperformed large-caps for the sixth consecutive year. The small-cap Russell 2000® Index was up 18.33% in 2004, while the larger-cap Standard & Poor's 500SM Index rose 10.88%. Value stocks ended the year well ahead of growth stocks: The Russell 3000® Value Index advanced 16.94%, compared to 6.93% for the Russell 3000 Growth Index. Energy and basic materials stocks led the market upward. Energy stocks were boosted by record-high oil prices, while strong demand from China helped support commodity prices. The health care sector was among the market's weakest performers. Technology also fell off the pace, though it was helped by a rally late in the year. The tech-heavy NASDAQ Composite® Index returned 9.15%, thanks primarily to a 14.87% jump in the fourth quarter. Elsewhere, the Dow Jones Industrial AverageSM gained 5.37% for the year.
For the 12 months that ended December 31, 2004, Financial Services Portfolio trailed the Goldman Sachs® Financial Services Index, which returned 14.33%, while outperforming the S&P 500®. The portfolio's underweighting of both real estate investment trusts (REITs) and regional banks, two industries that performed well early in 2004, was a major factor in its underperformance relative to the Goldman Sachs index. In addition, Fannie Mae, Freddie Mac and American International Group (AIG), three major portfolio holdings, all struggled after encountering regulatory scrutiny. I reduced the weightings in Fannie Mae and Freddie Mac, two government-sponsored mortgage entities, but I increased the position in insurer AIG because I didn't think its long-term earnings outlook would be hurt by recent controversies. Despite disappointing results early in 2004, the portfolio remained underweighted in REITs and regional banks because of the risk of slowing profits when interest rates finally began rising. At the same time, I kept the portfolio overweighted in firms that I felt could continue to increase their earnings, even in a rising interest rate environment. These included: security brokers, especially those that do significant business in the equity market and in mergers and acquisitions; and consumer finance companies, particularly credit card businesses. First Marblehead, whose primary business is securitizing student loans, was a very strong contributor, as was online financial services firm Ameritrade, which appreciated significantly in the final months of 2004 as the stock market rallied. CIT Group, a commercial lender to mid-sized companies, also performed well as its earnings rose and its growth prospects improved.
The views expressed in this statement reflect those of the portfolio manager only through the end of the period of the report as stated on the cover and do not necessarily represent the views of Fidelity or any other person in the Fidelity organization. Any such views are subject to change at any time based upon market or other conditions and Fidelity disclaims any responsibility to update such views. These views may not be relied on as investment advice and, because investment decisions for a Fidelity fund are based on numerous factors, may not be relied on as an indication of trading intent on behalf of any Fidelity fund.
Annual Report
Fidelity Variable Insurance Products: Financial Services Portfolio
Investment Summary
Top Five Stocks as of December 31, 2004 |
| % of fund's net assets |
Bank of America Corp. | 9.1 |
American International Group, Inc. | 8.1 |
Morgan Stanley | 5.1 |
Merrill Lynch & Co., Inc. | 4.5 |
Wachovia Corp. | 3.8 |
| 30.6 |
Top Industries as of December 31, 2004 |
% of fund's net assets |
| Commercial Banks | 24.9% | |
| Capital Markets | 21.2% | |
| Insurance | 20.2% | |
| Consumer Finance | 9.2% | |
| Thrifts & Mortgage Finance | 7.7% | |
| All Others* | 16.8% | |

* Includes short-term investments and net other assets. |
Annual Report
Fidelity Variable Insurance Products: Financial Services Portfolio
Investments December 31, 2004
Showing Percentage of Net Assets
Common Stocks - 96.4% |
| Shares | | Value (Note 1) |
CAPITAL MARKETS - 21.2% |
Asset Management & Custody Banks - 4.0% |
American Capital Strategies Ltd. | 1,000 | | $ 33,350 |
Bank of New York Co., Inc. | 3,650 | | 121,983 |
Calamos Asset Management, Inc.
Class A | 1,200 | | 32,400 |
Federated Investors, Inc. Class B (non-vtg.) | 1,580 | | 48,032 |
Firstcity Financial Corp. (a) | 2,228 | | 22,458 |
Franklin Resources, Inc. | 3,700 | | 257,705 |
Investors Financial Services Corp. | 2,400 | | 119,952 |
Legg Mason, Inc. | 1,500 | | 109,890 |
Northern Trust Corp. | 4,450 | | 216,181 |
State Street Corp. | 11,400 | | 559,968 |
Waddell & Reed Financial, Inc. Class A | 5,510 | | 131,634 |
| | 1,653,553 |
Diversified Capital Markets - 0.5% |
UBS AG (NY Shares) | 2,500 | | 209,600 |
Investment Banking & Brokerage - 16.7% |
Ameritrade Holding Corp. (a) | 47,600 | | 676,872 |
Bear Stearns Companies, Inc. | 1,780 | | 182,112 |
Charles Schwab Corp. | 19,200 | | 229,632 |
E*TRADE Financial Corp. (a) | 22,000 | | 328,900 |
Goldman Sachs Group, Inc. | 7,140 | | 742,846 |
LaBranche & Co., Inc. (a)(d) | 2,230 | | 19,981 |
Lehman Brothers Holdings, Inc. | 7,580 | | 663,098 |
Merrill Lynch & Co., Inc. | 31,000 | | 1,852,870 |
Morgan Stanley | 38,210 | | 2,121,419 |
Piper Jaffray Companies (a) | 183 | | 8,775 |
TradeStation Group, Inc. (a) | 20,195 | | 141,769 |
| | 6,968,274 |
TOTAL CAPITAL MARKETS | | 8,831,427 |
COMMERCIAL BANKS - 24.9% |
Diversified Banks - 20.4% |
Banco Popolare di Verona e Novara | 8,000 | | 162,352 |
Bangkok Bank Ltd. PCL (For. Reg.) | 29,000 | | 85,044 |
Bank of America Corp. | 80,196 | | 3,768,407 |
HDFC Bank Ltd. sponsored ADR | 3,700 | | 167,832 |
HSBC Holdings PLC sponsored ADR | 300 | | 25,542 |
Mitsubishi Tokyo Financial Group, Inc. (MTFG) sponsored ADR | 15,000 | | 153,300 |
National Bank of Canada | 5,600 | | 231,280 |
Royal Bank of Canada | 4,160 | | 222,733 |
State Bank of India | 8,430 | | 137,833 |
U.S. Bancorp, Delaware | 24,800 | | 776,736 |
Wachovia Corp. | 30,497 | | 1,604,142 |
Wells Fargo & Co. | 18,800 | | 1,168,420 |
| | 8,503,621 |
Regional Banks - 4.5% |
Cathay General Bancorp | 4,822 | | 180,825 |
|
| Shares | | Value (Note 1) |
Center Financial Corp., California | 4,800 | | $ 96,096 |
City National Corp. | 800 | | 56,520 |
East West Bancorp, Inc. | 3,900 | | 163,644 |
Hanmi Financial Corp. | 4,300 | | 154,542 |
M&T Bank Corp. | 400 | | 43,136 |
Nara Bancorp, Inc. | 400 | | 8,508 |
North Fork Bancorp, Inc., New York | 10,450 | | 301,483 |
Silicon Valley Bancshares (a) | 2,900 | | 129,978 |
Synovus Financial Corp. | 100 | | 2,858 |
UCBH Holdings, Inc. | 6,800 | | 311,576 |
Valley National Bancorp | 18 | | 498 |
Westcorp | 8,800 | | 404,184 |
| | 1,853,848 |
TOTAL COMMERCIAL BANKS | | 10,357,469 |
COMMERCIAL SERVICES & SUPPLIES - 1.3% |
Diversified Commercial Services - 1.3% |
Asset Acceptance Capital Corp. | 18,057 | | 384,614 |
Jackson Hewitt Tax Service, Inc. | 6,800 | | 171,700 |
| | 556,314 |
CONSUMER FINANCE - 9.2% |
Consumer Finance - 9.2% |
American Express Co. | 24,940 | | 1,405,868 |
Capital One Financial Corp. | 6,200 | | 522,102 |
First Marblehead Corp. (a) | 7,400 | | 416,250 |
MBNA Corp. | 44,805 | | 1,263,053 |
QC Holdings, Inc. | 1,216 | | 23,299 |
SLM Corp. | 3,640 | | 194,340 |
| | 3,824,912 |
DIVERSIFIED FINANCIAL SERVICES - 7.4% |
Other Diversifed Financial Services - 6.5% |
Citigroup, Inc. | 24,130 | | 1,162,583 |
J.P. Morgan Chase & Co. | 36,238 | | 1,413,644 |
Principal Financial Group, Inc. | 2,700 | | 110,538 |
| | 2,686,765 |
Specialized Finance - 0.9% |
Archipelago Holdings, Inc. | 4,000 | | 83,880 |
CIT Group, Inc. | 4,100 | | 187,862 |
Encore Capital Group, Inc. (a) | 2,300 | | 54,694 |
eSpeed, Inc. Class A (a) | 3,900 | | 48,243 |
| | 374,679 |
TOTAL DIVERSIFIED FINANCIAL SERVICES | | 3,061,444 |
INDUSTRIAL CONGLOMERATES - 1.2% |
Industrial Conglomerates - 1.2% |
General Electric Co. | 13,700 | | 500,050 |
INSURANCE - 20.2% |
Life & Health Insurance - 3.1% |
AFLAC, Inc. | 7,500 | | 298,800 |
Common Stocks - continued |
| Shares | | Value (Note 1) |
INSURANCE - CONTINUED |
Life & Health Insurance - continued |
Lincoln National Corp. | 500 | | $ 23,340 |
MetLife, Inc. | 11,010 | | 446,015 |
Protective Life Corp. | 1,200 | | 51,228 |
Sun Life Financial, Inc. | 12,090 | | 404,511 |
Torchmark Corp. | 1,400 | | 79,996 |
| | 1,303,890 |
Multi-Line Insurance - 9.8% |
American International Group, Inc. | 51,610 | | 3,389,229 |
Genworth Financial, Inc. Class A | 2,100 | | 56,700 |
Hartford Financial Services Group, Inc. | 6,960 | | 482,398 |
HCC Insurance Holdings, Inc. | 2,220 | | 73,526 |
Unitrin, Inc. | 1,700 | | 77,265 |
| | 4,079,118 |
Property & Casualty Insurance - 5.4% |
ACE Ltd. | 15,150 | | 647,663 |
AMBAC Financial Group, Inc. | 1,510 | | 124,016 |
Berkshire Hathaway, Inc. Class B (a) | 331 | | 971,816 |
Fidelity National Financial, Inc. | 2,642 | | 120,660 |
MBIA, Inc. | 4,060 | | 256,917 |
St. Paul Travelers Companies, Inc. | 2,800 | | 103,796 |
XL Capital Ltd. Class A | 500 | | 38,825 |
| | 2,263,693 |
Reinsurance - 1.9% |
Endurance Specialty Holdings Ltd. | 13,560 | | 463,752 |
Max Re Capital Ltd. | 2,916 | | 62,198 |
Montpelier Re Holdings Ltd. | 1,800 | | 69,210 |
PartnerRe Ltd. | 1,900 | | 117,686 |
Scottish Re Group Ltd. | 2,200 | | 56,980 |
| | 769,826 |
TOTAL INSURANCE | | 8,416,527 |
IT SERVICES - 0.2% |
Data Processing & Outsourced Services - 0.2% |
First Data Corp. | 2,000 | | 85,080 |
REAL ESTATE - 3.3% |
Real Estate Investment Trusts - 3.3% |
Apartment Investment & Management Co. Class A | 10,030 | | 386,556 |
CBL & Associates Properties, Inc. | 900 | | 68,715 |
Duke Realty Corp. | 1,830 | | 62,476 |
Equity Lifestyle Properties, Inc. | 1,000 | | 35,750 |
Equity Residential (SBI) | 2,390 | | 86,470 |
Federal Realty Investment Trust (SBI) | 580 | | 29,957 |
Healthcare Realty Trust, Inc. | 3,600 | | 146,520 |
Novastar Financial, Inc. | 900 | | 44,550 |
Reckson Associates Realty Corp. | 1,800 | | 59,058 |
Simon Property Group, Inc. | 4,600 | | 297,482 |
Spirit Finance Corp. | 9,000 | | 113,850 |
|
| Shares | | Value (Note 1) |
The Mills Corp. | 700 | | $ 44,632 |
Vornado Realty Trust | 60 | | 4,568 |
| | 1,380,584 |
THRIFTS & MORTGAGE FINANCE - 7.5% |
Thrifts & Mortgage Finance - 7.5% |
Countrywide Financial Corp. | 14,963 | | 553,781 |
Doral Financial Corp. | 50 | | 2,463 |
Fannie Mae | 5,850 | | 416,579 |
First Niagara Financial Group, Inc. | 3,200 | | 44,640 |
Freddie Mac | 5,700 | | 420,090 |
Golden West Financial Corp., Delaware | 5,400 | | 331,668 |
Hudson City Bancorp, Inc. | 3,600 | | 132,552 |
MGIC Investment Corp. | 1,400 | | 96,474 |
New York Community Bancorp, Inc. | 4,533 | | 93,244 |
Provident Financial Services, Inc. | 6,700 | | 129,779 |
Radian Group, Inc. | 1,625 | | 86,515 |
Sovereign Bancorp, Inc. | 19,490 | | 439,500 |
The PMI Group, Inc. | 2,300 | | 96,025 |
W Holding Co., Inc. | 3,774 | | 86,576 |
Washington Mutual, Inc. | 3,900 | | 164,892 |
| | 3,094,778 |
TOTAL COMMON STOCKS (Cost $31,259,815) | 40,108,585 |
Convertible Preferred Stocks - 0.2% |
| | | |
THRIFTS & MORTGAGE FINANCE - 0.2% |
Thrifts & Mortgage Finance - 0.2% |
Fannie Mae 5.375%
(Cost $100,000) | 1 | | 105,375 |
Money Market Funds - 3.6% |
| | | |
Fidelity Cash Central Fund, 2.24% (b) | 1,459,475 | | 1,459,475 |
Fidelity Securities Lending Cash Central Fund, 2.23% (b)(c) | 20,000 | | 20,000 |
TOTAL MONEY MARKET FUNDS (Cost $1,479,475) | 1,479,475 |
TOTAL INVESTMENT PORTFOLIO - 100.2% (Cost $32,839,290) | 41,693,435 |
NET OTHER ASSETS - (0.2)% | (98,763) |
NET ASSETS - 100% | $ 41,594,672 |
Legend |
(a) Non-income producing |
(b) Affiliated fund that is available only to investment companies and other accounts managed by Fidelity Investments. The rate quoted is the annualized seven-day yield of the fund at period end. A complete listing of the fund's holdings as of its most recent fiscal year end is available upon request. |
(c) Includes investment made with cash collateral received from securities on loan. |
(d) Security or a portion of the security is on loan at period end. |
Income Tax Information |
At December 31, 2004, the fund had a capital loss carryforward of approximately $1,758,000 all of which will expire on December 31, 2011. |
See accompanying notes which are an integral part of the financial statements.
Annual Report
Fidelity Variable Insurance Products: Financial Services Portfolio
Financial Statements
Statement of Assets and Liabilities
December 31, 2004 |
| | |
Assets | | |
Investment in securities, at value (including securities loaned of $17,920) (cost $32,839,290) - See accompanying schedule | | $ 41,693,435 |
Receivable for investments sold | | 331,318 |
Dividends receivable | | 36,560 |
Interest receivable | | 3,679 |
Prepaid expenses | | 152 |
Other receivables | | 2,295 |
Total assets | | 42,067,439 |
| | |
Liabilities | | |
Payable to custodian bank | $ 41,722 | |
Payable for investments purchased | 294,631 | |
Payable for fund shares redeemed | 59,832 | |
Accrued management fee | 19,703 | |
Other affiliated payables | 4,792 | |
Other payables and accrued expenses | 32,087 | |
Collateral on securities loaned, at value | 20,000 | |
Total liabilities | | 472,767 |
| | |
Net Assets | | $ 41,594,672 |
Net Assets consist of: | | |
Paid in capital | | $ 34,218,272 |
Undistributed net investment income | | 449,474 |
Accumulated undistributed net realized gain (loss) on investments and foreign currency transactions | | (1,924,995) |
Net unrealized appreciation (depreciation) on investments and assets and liabilities in foreign currencies | | 8,851,921 |
Net Assets, for 3,413,537 shares outstanding | | $ 41,594,672 |
Net Asset Value, offering price and redemption price per share ($41,594,672 ÷ 3,413,537 shares) | | $ 12.19 |
Statement of Operations
Year ended December 31, 2004 |
| | |
Investment Income | | |
Dividends | | $ 766,281 |
Interest | | 18,080 |
Security lending | | 1,776 |
Total income | | 786,137 |
| | |
Expenses | | |
Management fee | $ 234,228 | |
Transfer agent fees | 30,216 | |
Accounting and security lending fees | 30,031 | |
Non-interested trustees' compensation | 223 | |
Custodian fees and expenses | 9,804 | |
Audit | 32,458 | |
Legal | 886 | |
Miscellaneous | 8,643 | |
Total expenses before reductions | 346,489 | |
Expense reductions | (9,826) | 336,663 |
Net investment income (loss) | | 449,474 |
Realized and Unrealized Gain (Loss) Net realized gain (loss) on: | | |
Investment securities | 2,977,097 | |
Foreign currency transactions | (3,542) | |
Total net realized gain (loss) | | 2,973,555 |
Change in net unrealized appreciation (depreciation) on: Investment securities (net of increase in deferred foreign taxes of $2,253) | 668,312 | |
Assets and liabilities in foreign currencies | (62) | |
Total change in net unrealized appreciation (depreciation) | | 668,250 |
Net gain (loss) | | 3,641,805 |
Net increase (decrease) in net assets resulting from operations | | $ 4,091,279 |
See accompanying notes which are an integral part of the financial statements.
Annual Report
Fidelity Variable Insurance Products: Financial Services Portfolio
Financial Statements - continued
Statement of Changes in Net Assets
| Year ended
December 31,
2004 | Year ended
December 31,
2003 |
Increase (Decrease) in Net Assets | | |
Operations | | |
Net investment income (loss) | $ 449,474 | $ 380,590 |
Net realized gain (loss) | 2,973,555 | (623,543) |
Change in net unrealized appreciation (depreciation) | 668,250 | 9,630,683 |
Net increase (decrease) in net assets resulting from operations | 4,091,279 | 9,387,730 |
Distributions to shareholders from net investment income | - | (403,705) |
Share transactions
Proceeds from sales of shares | 10,285,693 | 13,759,235 |
Reinvestment of distributions | - | 403,705 |
Cost of shares redeemed | (13,703,290) | (17,000,774) |
Net increase (decrease) in net assets resulting from share transactions | (3,417,597) | (2,837,834) |
Redemption fees | 20,525 | 30,113 |
Total increase (decrease) in net assets | 694,207 | 6,176,304 |
| | |
Net Assets | | |
Beginning of period | 40,900,465 | 34,724,161 |
End of period (including undistributed net investment income of $449,474 and $0, respectively) | $ 41,594,672 | $ 40,900,465 |
Other Information Shares | | |
Sold | 907,842 | 1,431,706 |
Issued in reinvestment of distributions | - | 37,554 |
Redeemed | (1,241,488) | (1,836,791) |
Net increase (decrease) | (333,646) | (367,531) |
Financial Highlights
Years ended December 31, | 2004 | 2003 | 2002 | 2001F |
Selected Per-Share Data | | | | |
Net asset value, beginning of period | $ 10.91 | $ 8.44 | $ 9.64 | $ 10.00 |
Income from Investment Operations | | | | |
Net investment income (loss)E | .12 | .10 | .10 | .03 |
Net realized and unrealized gain (loss) | 1.15 | 2.47 | (1.21) | (.38) |
Total from investment operations | 1.27 | 2.57 | (1.11) | (.35) |
Distributions from net investment income | - | (.11) | (.10) | (.02) |
Redemption fees added to paid in capitalE | .01 | .01 | .01 | .01 |
Net asset value, end of period | $ 12.19 | $ 10.91 | $ 8.44 | $ 9.64 |
Total ReturnB.C.D | 11.73% | 30.59% | (11.41)% | (3.40)% |
Ratios to Average Net AssetsG | | | | |
Expenses before expense reductions | .85% | .97% | .92% | 1.40%A |
Expenses net of voluntary waivers, if any | .85% | .97% | .92% | 1.40%A |
Expenses net of all reductions | .83% | .96% | .89% | 1.37%A |
Net investment income (loss) | 1.10% | 1.06% | 1.07% | .79%A |
Supplemental Data | | | | |
Net assets, end of period (000 omitted) | $ 41,595 | $ 40,900 | $ 34,724 | $ 29,069 |
Portfolio turnover rate | 98% | 66% | 107% | 114%A |
A Annualized
B Total returns for periods of less than one year are not annualized.
C Total returns do not reflect charges attributable to your insurance company's separate account. Inclusion of these charges would reduce the total returns shown.
D Total returns would have been lower had certain expenses not been reduced during the periods shown.
E Calculated based on average shares outstanding during the period.
F For the period July 18, 2001 (commencement of operations) to December 31, 2001.
G Expense ratios reflect operating expenses of the fund. Expenses before reductions do not reflect amounts reimbursed by the investment adviser or reductions from brokerage service arrangements or other expense offset arrangements and do not represent the amount paid by the fund during periods when reimbursements or reductions occur. Expense ratios before reductions for start-up periods may not be representative of longer-term operating periods. Expenses net of any voluntary waivers reflect expenses after reimbursement by the investment adviser but prior to reductions from brokerage service arrangements or other expense offset arrangements. Expenses net of all reductions represent the net expenses paid by the fund.
See accompanying notes which are an integral part of the financial statements.
Financial Services Portfolio
Fidelity Variable Insurance Products: Health Care Portfolio
Performance: The Bottom Line
Average annual total return reflects the change in the value of an investment, assuming reinvestment of the class' dividend income and capital gains (the profits earned upon the sale of securities that have grown in value) and assuming a constant rate of performance each year. During periods of reimbursement by Fidelity, a fund's total return will be greater than it would be had the reimbursement not occurred. Performance numbers are net of all underlying fund operating expenses, but do not include any insurance charges imposed by your insurance company's separate account. If performance information included the effect of these additional charges, the total returns would have been lower. How a fund did yesterday is no guarantee of how it will do tomorrow.
Average Annual Total Returns
Periods ended December 31, 2004 | Past 1
year | Life of fundA |
Fidelity VIP: Health Care | 8.97% | 2.02% |
A From July 18, 2001.
$10,000 Over Life of Fund
Let's say hypothetically that $10,000 was invested in Fidelity® Variable Insurance Products: Health Care Portfolio on July 18, 2001, when the fund started. The chart shows how the value of your investment would have changed, and also shows how the S&P 500 Index performed over the same period.

Annual Report
Fidelity Variable Insurance Products: Health Care Portfolio
Management's Discussion of Fund Performance
Comments from Sam Peters, Portfolio Manager of Fidelity® Variable Insurance Products: Health Care Portfolio
The year ending December 31, 2004, generally was positive for equity investors, as many stock market benchmarks produced double-digit gains. Broad-based themes included the continued dominance of small-cap stocks, which outperformed large-caps for the sixth consecutive year. The small-cap Russell 2000® Index was up 18.33% in 2004, while the larger-cap Standard & Poor's 500SM Index rose 10.88%. Value stocks ended the year well ahead of growth stocks: The Russell 3000® Value Index advanced 16.94%, compared to 6.93% for the Russell 3000 Growth Index. Energy and basic materials stocks led the market upward. Energy stocks were boosted by record-high oil prices, while strong demand from China helped support commodity prices. The health care sector was among the market's weakest performers. Technology also fell off the pace, though it was helped by a rally late in the year. The tech-heavy NASDAQ Composite® Index returned 9.15%, thanks primarily to a 14.87% jump in the fourth quarter. Elsewhere, the Dow Jones Industrial AverageSM gained 5.37% for the year.
For the 12 months ending December 31, 2004, the fund performed better than the Goldman Sachs® Health Care Index, which had a total return of 6.27%, and slightly worse than the S&P 500®. Performance versus the sector benchmark was helped by maintaining an underweighting in pharmaceutical stocks, which continued to undergo a variety of market-driven and company-specific problems during the period. Despite the industry's troubles, favorable stock selection within the pharmaceutical group also helped, most notably through an underweighting in drug maker Merck and overweightings in more-diversified companies such as Johnson & Johnson and Abbott Laboratories. Medical equipment stocks boosted performance as well, with cardiac device maker St. Jude Medical making a strong contribution. With cost containment as a continuing theme in health care, the fund's overweighted positions in such managed care companies as UnitedHealth Group and PacifiCare Health were strong contributors to overall returns; however, not owning enough names in this strongly performing group - including index components WellPoint Health Networks and Anthem - held back performance. Among the stocks the fund owned, Millennium Pharmaceuticals suffered from the continuing weak growth prospects of its main drug products.
The views expressed in this statement reflect those of the portfolio manager only through the end of the period of the report as stated on the cover and do not necessarily represent the views of Fidelity or any other person in the Fidelity organization. Any such views are subject to change at any time based upon market or other conditions and Fidelity disclaims any responsibility to update such views. These views may not be relied on as investment advice and, because investment decisions for a Fidelity fund are based on numerous factors, may not be relied on as an indication of trading intent on behalf of any Fidelity fund
Annual Report
Fidelity Variable Insurance Products: Health Care Portfolio
Investment Summary
Top Five Stocks as of December 31, 2004 |
| % of fund's net assets |
Johnson & Johnson | 10.3 |
UnitedHealth Group, Inc. | 6.8 |
Medtronic, Inc. | 6.7 |
Pfizer, Inc. | 6.5 |
Abbott Laboratories | 6.2 |
| 36.5 |
Top Industries as of December 31, 2004 |
% of fund's net assets |
| Pharmaceuticals | 37.5% | |
| Health Care Equipment & Supplies | 29.7% | |
| Health Care Providers & Services | 16.5% | |
| Biotechnology | 15.3% | |
| Personal Products | 0.1% | |
| All Others* | 0.9% | |

* Includes short-term investments and net other assets. |
Annual Report
Fidelity Variable Insurance Products: Health Care Portfolio
Investments December 31, 2004
Showing Percentage of Net Assets
Common Stocks - 99.1% |
| Shares | | Value (Note 1) |
BIOTECHNOLOGY - 15.3% |
Biotechnology - 15.3% |
Affymetrix, Inc. (a) | 5,300 | | $ 193,715 |
Alkermes, Inc. (a) | 9,600 | | 135,264 |
Amgen, Inc. (a) | 48,700 | | 3,124,105 |
Biogen Idec, Inc. (a) | 10,800 | | 719,388 |
Charles River Laboratories International, Inc. (a) | 1,104 | | 50,795 |
Genentech, Inc. (a) | 62,100 | | 3,380,724 |
Genzyme Corp. - General Division (a) | 13,000 | | 754,910 |
ImClone Systems, Inc. (a) | 4,500 | | 207,360 |
MedImmune, Inc. (a) | 17,830 | | 483,371 |
Millennium Pharmaceuticals, Inc. (a) | 34,000 | | 412,080 |
Neurocrine Biosciences, Inc. (a) | 7,000 | | 345,100 |
OSI Pharmaceuticals, Inc. (a) | 2,300 | | 172,155 |
Protein Design Labs, Inc. (a) | 3,900 | | 80,574 |
| | 10,059,541 |
HEALTH CARE EQUIPMENT & SUPPLIES - 29.7% |
Health Care Equipment - 25.4% |
Aspect Medical Systems, Inc. (a) | 4,300 | | 105,178 |
Baxter International, Inc. | 114,150 | | 3,942,741 |
Beckman Coulter, Inc. | 2,700 | | 180,873 |
Biomet, Inc. | 23,965 | | 1,039,841 |
Boston Scientific Corp. (a) | 30,520 | | 1,084,986 |
Cytyc Corp. (a) | 22,700 | | 625,839 |
Epix Pharmaceuticals, Inc. (a) | 7,900 | | 141,489 |
Foxhollow Technologies, Inc. | 1,250 | | 30,738 |
Guidant Corp. | 16,000 | | 1,153,600 |
Hospira, Inc. (a) | 352 | | 11,792 |
IntraLase Corp. | 400 | | 9,392 |
Kinetic Concepts, Inc. | 5,800 | | 442,540 |
Medtronic, Inc. | 88,660 | | 4,403,742 |
ResMed, Inc. (a) | 6,000 | | 306,600 |
Respironics, Inc. (a) | 5,300 | | 288,108 |
St. Jude Medical, Inc. (a) | 48,020 | | 2,013,479 |
Stereotaxis, Inc. | 14,400 | | 141,552 |
Waters Corp. (a) | 12,700 | | 594,233 |
Zimmer Holdings, Inc. (a) | 2,400 | | 192,288 |
| | 16,709,011 |
Health Care Supplies - 4.3% |
Advanced Medical Optics, Inc. (a) | 4,100 | | 168,674 |
Alcon, Inc. | 19,600 | | 1,579,760 |
Cooper Companies, Inc. | 2,400 | | 169,416 |
Dade Behring Holdings, Inc. (a) | 6,050 | | 338,800 |
|
| Shares | | Value (Note 1) |
DJ Orthopedics, Inc. (a) | 7,000 | | $ 149,940 |
Edwards Lifesciences Corp. (a) | 10,100 | | 416,726 |
| | 2,823,316 |
TOTAL HEALTH CARE EQUIPMENT & SUPPLIES | | 19,532,327 |
HEALTH CARE PROVIDERS & SERVICES - 16.5% |
Health Care Distributors & Services - 4.0% |
Cardinal Health, Inc. | 11,300 | | 657,095 |
McKesson Corp. | 42,200 | | 1,327,612 |
Omnicare, Inc. | 13,600 | | 470,832 |
Patterson Companies, Inc. (a) | 4,200 | | 182,238 |
| | 2,637,777 |
Health Care Facilities - 0.2% |
Community Health Systems, Inc. (a) | 5,500 | | 153,340 |
Health Care Services - 3.1% |
DaVita, Inc. (a) | 6,450 | | 254,969 |
IMS Health, Inc. | 22,700 | | 526,867 |
Laboratory Corp. of America Holdings (a) | 8,500 | | 423,470 |
Quest Diagnostics, Inc. | 6,300 | | 601,965 |
WebMD Corp. (a) | 28,000 | | 228,480 |
| | 2,035,751 |
Managed Health Care - 9.2% |
Health Net, Inc. (a) | 7,900 | | 228,073 |
PacifiCare Health Systems, Inc. (a) | 23,300 | | 1,316,916 |
UnitedHealth Group, Inc. | 51,000 | | 4,489,530 |
| | 6,034,519 |
TOTAL HEALTH CARE PROVIDERS & SERVICES | | 10,861,387 |
PERSONAL PRODUCTS - 0.1% |
Personal Products - 0.1% |
NBTY, Inc. (a) | 2,900 | | 69,629 |
PHARMACEUTICALS - 37.5% |
Pharmaceuticals - 37.5% |
Abbott Laboratories | 87,220 | | 4,068,813 |
Allergan, Inc. | 6,900 | | 559,383 |
Eli Lilly & Co. | 39,800 | | 2,258,650 |
Endo Pharmaceuticals Holdings, Inc. (a) | 6,900 | | 145,038 |
Forest Laboratories, Inc. (a) | 7,700 | | 345,422 |
Hollis-Eden Pharmaceuticals, Inc. (a) | 13,100 | | 123,402 |
Johnson & Johnson | 106,415 | | 6,748,838 |
Medicis Pharmaceutical Corp. Class A | 2,200 | | 77,242 |
Merck & Co., Inc. | 101,680 | | 3,267,995 |
Pfizer, Inc. | 159,940 | | 4,300,787 |
Schering-Plough Corp. | 34,550 | | 721,404 |
Sepracor, Inc. (a) | 6,100 | | 362,157 |
Common Stocks - continued |
| Shares | | Value (Note 1) |
PHARMACEUTICALS - CONTINUED |
Pharmaceuticals - continued |
Watson Pharmaceuticals, Inc. (a) | 9,500 | | $ 311,695 |
Wyeth | 31,320 | | 1,333,919 |
| | 24,624,745 |
TOTAL COMMON STOCKS (Cost $55,472,899) | 65,147,629 |
Money Market Funds - 1.0% |
| | | |
Fidelity Cash Central Fund, 2.24% (b)
(Cost $618,652) | 618,652 | | 618,652 |
TOTAL INVESTMENT PORTFOLIO - 100.1% (Cost $56,091,551) | 65,766,281 |
NET OTHER ASSETS - (0.1)% | (47,976) |
NET ASSETS - 100% | $ 65,718,305 |
Legend |
(a) Non-income producing |
(b) Affiliated fund that is available only to investment companies and other accounts managed by Fidelity Investments. The rate quoted is the annualized seven-day yield of the fund at period end. A complete listing of the fund's holdings as of its most recent fiscal year end is available upon request. |
Income Tax Information |
At December 31, 2004, the fund had a capital loss carryforward of approximately $9,189,000 of which $5,750,000, $3,336,000 and $103,000 will expire on December 31, 2010, 2011 and 2012, respectively. |
See accompanying notes which are an integral part of the financial statements.
Health Care Portfolio
Fidelity Variable Insurance Products: Health Care Portfolio
Financial Statements
Statement of Assets and Liabilities
December 31, 2004 |
| | |
Assets | | |
Investment in securities, at value (cost $56,091,551) - See accompanying schedule | | $ 65,766,281 |
Dividends receivable | | 99,043 |
Interest receivable | | 1,296 |
Prepaid expenses | | 298 |
Other receivables | | 3,436 |
Total assets | | 65,870,354 |
| | |
Liabilities | | |
Payable for fund shares redeemed | $ 81,994 | |
Accrued management fee | 30,983 | |
Other affiliated payables | 6,156 | |
Other payables and accrued expenses | 32,916 | |
Total liabilities | | 152,049 |
| | |
Net Assets | | $ 65,718,305 |
Net Assets consist of: | | |
Paid in capital | | $ 65,655,101 |
Undistributed net investment income | | 133,453 |
Accumulated undistributed net realized gain (loss) on investments and foreign currency transactions | | (9,744,979) |
Net unrealized appreciation (depreciation) on investments | | 9,674,730 |
Net Assets, for 6,195,441 shares outstanding | | $ 65,718,305 |
Net Asset Value, offering price and redemption price per share ($65,718,305 ÷ 6,195,441 shares) | | $ 10.61 |
Statement of Operations
Year ended December 31, 2004 |
| | |
Investment Income | | |
Dividends | | $ 658,777 |
Interest | | 14,006 |
Security lending | | 192 |
Total income | | 672,975 |
| | |
Expenses | | |
Management fee | $ 381,536 | |
Transfer agent fees | 47,538 | |
Accounting and security lending fees | 30,023 | |
Non-interested trustees' compensation | 363 | |
Custodian fees and expenses | 6,089 | |
Audit | 32,563 | |
Legal | 1,247 | |
Miscellaneous | 12,615 | |
Total expenses before reductions | 511,974 | |
Expense reductions | (9,020) | 502,954 |
Net investment income (loss) | | 170,021 |
Realized and Unrealized Gain (Loss) Net realized gain (loss) on: | | |
Investment securities | (63,216) | |
Foreign currency transactions | 78 | |
Total net realized gain (loss) | | (63,138) |
Change in net unrealized appreciation (depreciation) on investment securities | | 4,055,052 |
Net gain (loss) | | 3,991,914 |
Net increase (decrease) in net assets resulting from operations | | $ 4,161,935 |
See accompanying notes which are an integral part of the financial statements.
Annual Report
Financial Statements - continued
Statement of Changes in Net Assets
| Year ended
December 31,
2004 | Year ended
December 31,
2003 |
Increase (Decrease) in Net Assets | | |
Operations | | |
Net investment income (loss) | $ 170,021 | $ 162,579 |
Net realized gain (loss) | (63,138) | 199,649 |
Change in net unrealized appreciation (depreciation) | 4,055,052 | 6,634,464 |
Net increase (decrease) in net assets resulting from operations | 4,161,935 | 6,996,692 |
Distributions to shareholders from net investment income | (200,555) | - |
Share transactions
Proceeds from sales of shares | 31,011,321 | 15,153,175 |
Reinvestment of distributions | 200,555 | - |
Cost of shares redeemed | (22,096,899) | (17,043,080) |
Net increase (decrease) in net assets resulting from share transactions | 9,114,977 | (1,889,905) |
Redemption fees | 38,750 | 25,765 |
Total increase (decrease) in net assets | 13,115,107 | 5,132,552 |
| | |
Net Assets | | |
Beginning of period | 52,603,198 | 47,470,646 |
End of period (including undistributed net investment income of $133,453 and undistributed net investment income of $162,579, respectively) | $ 65,718,305 | $ 52,603,198 |
Other Information Shares | | |
Sold | 3,030,904 | 1,655,710 |
Issued in reinvestment of distributions | 19,547 | - |
Redeemed | (2,239,742) | (1,914,631) |
Net increase (decrease) | 810,709 | (258,921) |
Financial Highlights
Years ended December 31, | 2004 | 2003 | 2002 | 2001F |
Selected Per-Share Data | | | | |
Net asset value, beginning of period | $ 9.77 | $ 8.41 | $ 10.19 | $ 10.00 |
Income from Investment Operations | | | | |
Net investment income (loss)E | .03 | .03 | .04 | .01 |
Net realized and unrealized gain (loss) | .84 | 1.33 | (1.79) | .16 |
Total from investment operations | .87 | 1.36 | (1.75) | .17 |
Distributions from net investment income | (.04) | - | (.03) | - |
Distributions from net realized gain | - | - | (.01) | (.02) |
Total distributions | (.04) | - | (.04) | (.02) |
Redemption fees added to paid in capitalE | .01 | -H | .01 | .04 |
Net asset value, end of period | $ 10.61 | $ 9.77 | $ 8.41 | $ 10.19 |
Total ReturnB,C,D | 8.97% | 16.17% | (17.08) % | 2.10% |
Ratios to Average Net AssetsG | | | | |
Expenses before expense reductions | .77% | .89% | .84% | 1.01%A |
Expenses net of voluntary waivers, if any | .77% | .89% | .84% | 1.01%A |
Expenses net of all reductions | .76% | .85% | .79% | 1.00%A |
Net investment income (loss) | .26% | .32% | .39% | .13%A |
Supplemental Data | | | | |
Net assets, end of period (000 omitted) | $ 65,718 | $ 52,603 | $ 47,471 | $ 61,229 |
Portfolio turnover rate | 56% | 124% | 166% | 82%A |
A Annualized
B Total returns for periods of less than one year are not annualized.
C Total returns do not reflect charges attributable to your insurance company's separate account. Inclusion of these charges would reduce the total returns shown.
D Total returns would have been lower had certain expenses not been reduced during the periods shown.
E Calculated based on average shares outstanding during the period.
F For the period July 18, 2001 (commencement of operations) to December 31, 2001.
G Expense ratios reflect operating expenses of the fund. Expenses before reductions do not reflect amounts reimbursed by the investment adviser or reductions from brokerage service arrangements or other expense offset arrangements and do not represent the amount paid by the fund during periods when reimbursements or reductions occur. Expense ratios before reductions for start-up periods may not be representative of longer-term operating periods. Expenses net of any voluntary waivers reflect expenses after reimbursement by the investment adviser but prior to reductions from brokerage service arrangements or other expense offset arrangements. Expenses net of all reductions represent the net expenses paid by the fund.
H Amount represents less than $.01 per share.
See accompanying notes which are an integral part of the financial statements.
Health Care Portfolio
Fidelity Variable Insurance Products: Natural Resources Portfolio
Performance: The Bottom Line
Average annual total return reflects the change in the value of an investment, assuming reinvestment of the class' dividend income and capital gains (the profits earned upon the sale of securities that have grown in value) and assuming a constant rate of performance each year. During periods of reimbursement by Fidelity, a fund's total return will be greater than it would be had the reimbursement not occurred. Performance numbers are net of all underlying fund operating expenses, but do not include any insurance charges imposed by your insurance company's separate account. If performance information included the effect of these additional charges, the total returns would have been lower. How a fund did yesterday is no guarantee of how it will do tomorrow.
Average Annual Total Returns
Periods ended December 31, 2004 | Past 1
year | Life of fundA |
Fidelity VIP: Natural Resources | 23.96% | 9.94% |
A From July 19, 2001.
$10,000 Over Life of Fund
Let's say hypothetically that $10,000 was invested in Fidelity® Variable Insurance Products: Natural Resources Portfolio on July 19, 2001, when the fund started. The chart shows how the value of your investment would have changed, and also shows how the S&P 500 Index performed over the same period.
Annual Report
Fidelity Variable Insurance Products: Natural Resources Portfolio
Management's Discussion of Fund Performance
Comments from Matthew Friedman, Portfolio Manager of Fidelity® Variable Insurance Products: Natural Resources Portfolio
The year ending December 31, 2004, generally was positive for equity investors, as many stock market benchmarks produced double-digit gains. Broad-based themes included the continued dominance of small-cap stocks, which outperformed large-caps for the sixth consecutive year. The small-cap Russell 2000® Index was up 18.33% in 2004, while the larger-cap Standard & Poor's 500SM Index rose 10.88%. Value stocks ended the year well ahead of growth stocks: The Russell 3000® Value Index advanced 16.94%, compared to 6.93% for the Russell 3000 Growth Index. Energy and basic materials stocks led the market upward. Energy stocks were boosted by record-high oil prices, while strong demand from China helped support commodity prices. The health care sector was among the market's weakest performers. Technology also fell off the pace, though it was helped by a rally late in the year. The tech-heavy NASDAQ Composite® Index returned 9.15%, thanks primarily to a 14.87% jump in the fourth quarter. Elsewhere, the Dow Jones Industrial AverageSM gained 5.37% for the year.
Higher oil prices helped the portfolio more than double the increase of the S&P 500® during the 12-month period ending December 31, 2004, though it slightly trailed the Goldman Sachs® Natural Resources Index, which gained 24.59%. One word dominated the period - oil. Low supply, based on the inability to substantially increase refinery production, and continued growing demand contributed to record energy prices during the period. Integrated oil companies, including Exxon Mobil, BP and ChevronTexaco, saw their stock prices soar as they passed profits on to shareholders in the form of share buybacks and increased dividends. Overweighting these stocks helped performance relative to the sector index. Oil refiner Valero Energy also contributed to the fund's return. Detracting from performance were metals companies Freeport-McMoRan Copper & Gold, which experienced falling stock prices after an impressive run-up prior to 2004, and Alcoa, which struggled due to the rising costs of making aluminum. The portfolio had large overweightings in both stocks relative to the sector index. Elsewhere, concerns about Canadian Natural Resources' cost structure contributed to its stock's decline. Oil producer YUKOS, which was taken over by the Russian government amid charges of unpaid back taxes, also detracted from performance. We sold the position during the period.
The views expressed in this statement reflect those of the portfolio manager only through the end of the period of the report as stated on the cover and do not necessarily represent the views of Fidelity or any other person in the Fidelity organization. Any such views are subject to change at any time based upon market or other conditions and Fidelity disclaims any responsibility to update such views. These views may not be relied on as investment advice and, because investment decisions for a Fidelity fund are based on numerous factors, may not be relied on as an indication of trading intent on behalf of any Fidelity fund.
Annual Report
Fidelity Variable Insurance Products: Natural Resources Portfolio
Investment Summary
Top Five Stocks as of December 31, 2004 |
| % of fund's net assets |
Exxon Mobil Corp. | 8.7 |
BP PLC sponsored ADR | 8.1 |
ConocoPhillips | 6.3 |
Halliburton Co. | 5.6 |
Schlumberger Ltd. (NY Shares) | 4.7 |
| 33.4 |
Top Industries as of December 31, 2004 |
% of fund's net assets |
| Oil & Gas | 48.9% | |
| Energy Equipment & Services | 29.3% | |
| Metals & Mining | 12.2% | |
| Paper & Forest Products | 4.7% | |
| Containers & Packaging | 1.9% | |
| All Others* | 3.0% | |

* Includes short-term investments and net other assets. |
Annual Report
Fidelity Variable Insurance Products: Natural Resources Portfolio
Investments December 31, 2004
Showing Percentage of Net Assets
Common Stocks - 98.0% |
| Shares | | Value (Note 1) |
CHEMICALS - 0.3% |
Industrial Gases - 0.3% |
Stuart Energy Systems Corp. (a) | 98,200 | | $ 347,792 |
CONTAINERS & PACKAGING - 1.9% |
Paper Packaging - 1.9% |
Packaging Corp. of America | 29,890 | | 703,910 |
Smurfit-Stone Container Corp. (a) | 93,210 | | 1,741,163 |
| | 2,445,073 |
ELECTRIC UTILITIES - 0.1% |
Electric Utilities - 0.1% |
PPL Corp. | 2,300 | | 122,544 |
ENERGY EQUIPMENT & SERVICES - 29.3% |
Oil & Gas Drilling - 6.5% |
ENSCO International, Inc. | 21,100 | | 669,714 |
Grey Wolf, Inc. (a) | 27,700 | | 145,979 |
Nabors Industries Ltd. (a) | 25,000 | | 1,282,250 |
Noble Corp. (a) | 35,830 | | 1,782,184 |
Precision Drilling Corp. (a) | 12,300 | | 774,080 |
Pride International, Inc. (a) | 41,600 | | 854,464 |
Transocean, Inc. (a) | 61,800 | | 2,619,702 |
| | 8,128,373 |
Oil & Gas Equipment & Services - 22.8% |
Baker Hughes, Inc. | 31,380 | | 1,338,985 |
BJ Services Co. | 21,200 | | 986,648 |
Cooper Cameron Corp. (a) | 11,400 | | 613,434 |
Core Laboratories NV (a) | 8,800 | | 205,480 |
FMC Technologies, Inc. (a) | 9,200 | | 296,240 |
Grant Prideco, Inc. (a) | 98,900 | | 1,982,945 |
Halliburton Co. | 179,400 | | 7,039,656 |
National-Oilwell, Inc. (a) | 28,450 | | 1,004,001 |
Oil States International, Inc. (a) | 23,600 | | 455,244 |
Pason Systems, Inc. | 5,500 | | 169,583 |
RPC, Inc. | 5,200 | | 130,624 |
Schlumberger Ltd. (NY Shares) | 88,060 | | 5,895,617 |
Smith International, Inc. (a) | 51,540 | | 2,804,291 |
Superior Energy Services, Inc. (a) | 74,800 | | 1,152,668 |
Tenaris SA sponsored ADR | 7,500 | | 366,750 |
Varco International, Inc. (a) | 66,640 | | 1,942,556 |
Weatherford International Ltd. (a) | 33,100 | | 1,698,030 |
Willbros Group, Inc. (a) | 25,500 | | 587,775 |
| | 28,670,527 |
TOTAL ENERGY EQUIPMENT & SERVICES | | 36,798,900 |
MACHINERY - 0.3% |
Construction & Farm Machinery & Heavy Trucks - 0.3% |
Bucyrus International, Inc. Class A | 10,800 | | 438,912 |
|
| Shares | | Value (Note 1) |
METALS & MINING - 12.2% |
Aluminum - 4.5% |
Alcan, Inc. | 45,620 | | $ 2,235,380 |
Alcoa, Inc. | 107,290 | | 3,371,052 |
| | 5,606,432 |
Diversified Metals & Mining - 3.1% |
Breakwater Resources Ltd. (a) | 449,000 | | 213,275 |
Cameco Corp. | 18,900 | | 660,713 |
CONSOL Energy, Inc. | 19,900 | | 816,895 |
Freeport-McMoRan Copper & Gold, Inc. Class B | 15,380 | | 587,977 |
Industrias Penoles SA de CV | 13,300 | | 71,629 |
Massey Energy Co. | 9,600 | | 335,520 |
Peabody Energy Corp. | 15,000 | | 1,213,650 |
| | 3,899,659 |
Gold - 4.4% |
Eldorado Gold Corp. (a) | 81,500 | | 241,104 |
Newmont Mining Corp. | 119,700 | | 5,315,877 |
| | 5,556,981 |
Precious Metals & Minerals - 0.2% |
Stillwater Mining Co. (a) | 19,900 | | 224,074 |
TOTAL METALS & MINING | | 15,287,146 |
MULTI-UTILITIES & UNREGULATED POWER - 0.3% |
Multi-Utilities & Unregulated Power - 0.3% |
Questar Corp. | 7,400 | | 377,104 |
OIL & GAS - 48.9% |
Integrated Oil & Gas - 32.2% |
Amerada Hess Corp. | 2,800 | | 230,664 |
BG Group PLC ADR | 26,900 | | 926,705 |
BP PLC sponsored ADR | 175,340 | | 10,239,856 |
ChevronTexaco Corp. | 21,300 | | 1,118,463 |
ConocoPhillips | 91,381 | | 7,934,612 |
ENI Spa sponsored ADR | 5,100 | | 641,784 |
Exxon Mobil Corp. | 213,200 | | 10,928,631 |
Marathon Oil Corp. | 32,400 | | 1,218,564 |
Occidental Petroleum Corp. | 49,300 | | 2,877,148 |
Petro-Canada | 9,900 | | 504,653 |
Royal Dutch Petroleum Co. (NY Shares) | 2,750 | | 157,795 |
Sibneft sponsored ADR | 100 | | 3,025 |
Total SA sponsored ADR | 34,510 | | 3,790,578 |
| | 40,572,478 |
Oil & Gas Exploration & Production - 11.4% |
Abraxas Petroleum Corp. (a) | 55,800 | | 129,456 |
Burlington Resources, Inc. | 15,900 | | 691,650 |
Canadian Natural Resources Ltd. | 39,500 | | 1,686,979 |
Denbury Resources, Inc. (a) | 38,800 | | 1,065,060 |
EnCana Corp. | 72,218 | | 4,116,426 |
Encore Acquisition Co. (a) | 17,100 | | 596,961 |
EOG Resources, Inc. | 4,800 | | 342,528 |
Forest Oil Corp. (a) | 28,900 | | 916,708 |
Common Stocks - continued |
| Shares | | Value (Note 1) |
OIL & GAS - CONTINUED |
Oil & Gas Exploration & Production - continued |
Newfield Exploration Co. (a) | 12,700 | | $ 749,935 |
Pioneer Natural Resources Co. | 8,200 | | 287,820 |
Plains Exploration & Production Co. (a) | 4,500 | | 117,000 |
Pogo Producing Co. | 12,300 | | 596,427 |
Quicksilver Resources, Inc. (a) | 33,400 | | 1,228,452 |
Range Resources Corp. | 64,300 | | 1,315,578 |
Ultra Petroleum Corp. (a) | 10,800 | | 519,804 |
| | 14,360,784 |
Oil & Gas Refining & Marketing & Transportation - 5.3% |
Ashland, Inc. | 10,200 | | 595,476 |
Frontier Oil Corp. | 19,800 | | 527,868 |
Holly Corp. | 32,500 | | 905,775 |
Premcor, Inc. | 23,000 | | 969,910 |
Tesoro Petroleum Corp. (a) | 16,000 | | 509,760 |
Valero Energy Corp. | 68,900 | | 3,128,060 |
| | 6,636,849 |
TOTAL OIL & GAS | | 61,570,111 |
PAPER & FOREST PRODUCTS - 4.7% |
Forest Products - 1.3% |
Canfor Corp. (a) | 184 | | 2,400 |
Weyerhaeuser Co. | 24,400 | | 1,640,168 |
| | 1,642,568 |
Paper Products - 3.4% |
Georgia-Pacific Corp. | 26,900 | | 1,008,212 |
International Paper Co. | 58,800 | | 2,469,600 |
MeadWestvaco Corp. | 17,917 | | 607,207 |
Tembec, Inc. (a) | 29,300 | | 176,044 |
| | 4,261,063 |
TOTAL PAPER & FOREST PRODUCTS | | 5,903,631 |
TOTAL COMMON STOCKS (Cost $107,745,898) | 123,291,213 |
Money Market Funds - 1.7% |
| | | |
Fidelity Cash Central Fund, 2.24% (b)
(Cost $2,147,251) | 2,147,251 | | 2,147,251 |
TOTAL INVESTMENT PORTFOLIO - 99.7% (Cost $109,893,149) | 125,438,464 |
NET OTHER ASSETS - 0.3% | 342,665 |
NET ASSETS - 100% | $ 125,781,129 |
Legend |
(a) Non-income producing |
(b) Affiliated fund that is available only to investment companies and other accounts managed by Fidelity Investments. The rate quoted is the annualized seven-day yield of the fund at period end. A complete listing of the fund's holdings as of its most recent fiscal year end is available upon request. |
Other Information |
Distribution of investments by country of issue, as a percentage of total net assets, is as follows: |
United States of America | 71.3% |
Canada | 9.2% |
United Kingdom | 8.8% |
Netherlands Antilles | 4.7% |
France | 3.0% |
Cayman Islands | 1.4% |
Others (individually less than 1%) | 1.6% |
| 100.0% |
Income Tax Information |
The fund hereby designates as capital gain dividends: For dividends with respect to the taxable year ended December 31, 2004, $162,000 or, if different, the net capital gain of such year. |
See accompanying notes which are an integral part of the financial statements.
Natural Resources Portfolio
Fidelity Variable Insurance Products: Natural Resources Portfolio
Financial Statements
Statement of Assets and Liabilities
December 31, 2004 |
| | |
Assets | | |
Investment in securities, at value (cost $109,893,149) - See accompanying schedule | | $ 125,438,464 |
Foreign currency held at value (cost $584) | | 584 |
Receivable for fund shares sold | | 331,955 |
Dividends receivable | | 92,610 |
Interest receivable | | 5,692 |
Prepaid expenses | | 243 |
Other receivables | | 13,103 |
Total assets | | 125,882,651 |
| | |
Liabilities | | |
Accrued management fee | $ 58,152 | |
Transfer agent fee payable | 6,906 | |
Other affiliated payables | 3,803 | |
Other payables and accrued expenses | 32,661 | |
Total liabilities | | 101,522 |
| | |
Net Assets | | $ 125,781,129 |
Net Assets consist of: | | |
Paid in capital | | $ 110,914,638 |
Accumulated undistributed net realized gain (loss) on investments and foreign currency transactions | | (679,010) |
Net unrealized appreciation (depreciation) on investments and assets and liabilities in foreign currencies | | 15,545,501 |
Net Assets, for 9,234,093 shares outstanding | | $ 125,781,129 |
Net Asset Value, offering price and redemption price per share ($125,781,129 ÷ 9,234,093 shares) | | $ 13.62 |
Statement of Operations
Year ended December 31, 2004 |
| | |
Investment Income | | |
Dividends | | $ 1,055,361 |
Interest | | 53,313 |
Security lending | | 2,031 |
| | 1,110,705 |
Less foreign taxes withheld | | (39,898) |
Total income | | 1,070,807 |
| | |
Expenses | | |
Management fee | $ 396,073 | |
Transfer agent fees | 50,992 | |
Accounting and security lending fees | 33,307 | |
Non-interested trustees' compensation | 343 | |
Custodian fees and expenses | 16,132 | |
Audit | 32,529 | |
Legal | 1,161 | |
Miscellaneous | 9,952 | |
Total expenses before reductions | 540,489 | |
Expense reductions | (25,285) | 515,204 |
Net investment income (loss) | | 555,603 |
Realized and Unrealized Gain (Loss) Net realized gain (loss) on: | | |
Investment securities | 3,918,741 | |
Foreign currency transactions | (8,682) | |
Total net realized gain (loss) | | 3,910,059 |
Change in net unrealized appreciation (depreciation) on: Investment securities | 11,070,094 | |
Assets and liabilities in foreign currencies | (247) | |
Total change in net unrealized appreciation (depreciation) | | 11,069,847 |
Net gain (loss) | | 14,979,906 |
Net increase (decrease) in net assets resulting from operations | | $ 15,535,509 |
See accompanying notes which are an integral part of the financial statements.
Annual Report
Fidelity Variable Insurance Products: Natural Resources Portfolio
Financial Statements - continued
Statement of Changes in Net Assets
| Year ended
December 31,
2004 | Year ended
December 31,
2003 |
Increase (Decrease) in Net Assets | | |
Operations | | |
Net investment income (loss) | $ 555,603 | $ 107,043 |
Net realized gain (loss) | 3,910,059 | (1,559,759) |
Change in net unrealized appreciation (depreciation) | 11,069,847 | 6,751,795 |
Net increase (decrease) in net assets resulting from operations | 15,535,509 | 5,299,079 |
Distributions to shareholders from net investment income | (592,299) | (118,735) |
Share transactions
Proceeds from sales of shares | 91,406,678 | 17,445,260 |
Reinvestment of distributions | 592,299 | 118,735 |
Cost of shares redeemed | (12,885,896) | (11,686,648) |
Net increase (decrease) in net assets resulting from share transactions | 79,113,081 | 5,877,347 |
Redemption fees | 101,073 | 29,307 |
Total increase (decrease) in net assets | 94,157,364 | 11,086,998 |
| | |
Net Assets | | |
Beginning of period | 31,623,765 | 20,536,767 |
End of period (including undistributed net investment income of $0 and distributions in excess of net investment income of $11,132, respectively) | $ 125,781,129 | $ 31,623,765 |
Other Information Shares | | |
Sold | 7,384,923 | 1,760,481 |
Issued in reinvestment of distributions | 43,392 | 11,565 |
Redeemed | (1,058,987) | (1,325,092) |
Net increase (decrease) | 6,369,328 | 446,954 |
Financial Highlights
Years ended December 31, | 2004 | 2003 | 2002 | 2001F |
Selected Per-Share Data | | | | |
Net asset value, beginning of period | $ 11.04 | $ 8.49 | $ 9.68 | $ 10.00 |
Income from Investment Operations | | | | |
Net investment income (loss)E | .10 | .05 | .06 | .02 |
Net realized and unrealized gain (loss) | 2.53 | 2.54 | (1.20) | (.35) |
Total from investment operations | 2.63 | 2.59 | (1.14) | (.33) |
Distributions from net investment income | (.07) | (.05) | (.07) | (.01) |
Redemption fees added to paid in capitalE | .02 | .01 | .02 | .02 |
Net asset value, end of period | $ 13.62 | $ 11.04 | $ 8.49 | $ 9.68 |
Total ReturnB,C,D | 23.96% | 30.61% | (11.58)% | (3.10)% |
Ratios to Average Net AssetsG | | | | |
Expenses before expense reductions | .78% | 1.26% | 1.10% | 2.11%A |
Expenses net of voluntary waivers, if any | .78% | 1.26% | 1.10% | 1.50%A |
Expenses net of all reductions | .74% | 1.25% | 1.08% | 1.44%A |
Net investment income (loss) | .80% | .56% | .70% | .49%A |
Supplemental Data | | | | |
Net assets, end of period (000 omitted) | $ 125,781 | $ 31,624 | $ 20,537 | $ 12,326 |
Portfolio turnover rate | 87% | 73% | 83% | 129%A |
A Annualized
B Total returns for periods of less than one year are not annualized.
C Total returns do not reflect charges attributable to your insurance company's separate account. Inclusion of these charges would reduce the total returns shown.
D Total returns would have been lower had certain expenses not been reduced during the periods shown.
E Calculated based on average shares outstanding during the period.
F For the period July 19, 2001 (commencement of operations) to December 31, 2001.
G Expense ratios reflect operating expenses of the fund. Expenses before reductions do not reflect amounts reimbursed by the investment adviser or reductions from brokerage service arrangements or other expense offset arrangements and do not represent the amount paid by the fund during periods when reimbursements or reductions occur. Expense ratios before reductions for start-up periods may not be representative of longer-term operating periods. Expenses net of any voluntary waivers reflect expenses after reimbursement by the investment adviser but prior to reductions from brokerage service arrangements or other expense offset arrangements. Expenses net of all reductions represent the net expenses paid by the fund.
See accompanying notes which are an integral part of the financial statements.
Natural Resources Portfolio
Fidelity Variable Insurance Products: Technology Portfolio
Performance: The Bottom Line
Average annual total return reflects the change in the value of an investment, assuming reinvestment of the class' dividend income and capital gains (the profits earned upon the sale of securities that have grown in value) and assuming a constant rate of performance each year. During periods of reimbursement by Fidelity, a fund's total return will be greater than it would be had the reimbursement not occurred. Performance numbers are net of all underlying fund operating expenses, but do not include any insurance charges imposed by your insurance company's separate account. If performance information included the effect of these additional charges, the total returns would have been lower. How a fund did yesterday is no guarantee of how it will do tomorrow.
Average Annual Total Returns
Periods ended December 31, 2004 | Past 1
year | Life of fundA |
Fidelity VIP: Technology | 0.43% | -1.87% |
A From July 19, 2001.
$10,000 Over Life of Fund
Let's say hypothetically that $10,000 was invested in Fidelity® Variable Insurance Products: Technology Portfolio on July 19, 2001, when the fund started. The chart shows how the value of your investment would have changed, and also shows how the S&P 500 Index performed over the same period.

Annual Report
Fidelity Variable Insurance Products: Technology Portfolio
Management's Discussion of Fund Performance
Comments from Sonu Kalra, Portfolio Manager of Fidelity® Variable Insurance Products: Technology Portfolio
The year ending December 31, 2004, generally was positive for equity investors, as many stock market benchmarks produced double-digit gains. Broad-based themes included the continued dominance of small-cap stocks, which outperformed large-caps for the sixth consecutive year. The small-cap Russell 2000® Index was up 18.33% in 2004, while the larger-cap Standard & Poor's 500SM Index rose 10.88%. Value stocks ended the year well ahead of growth stocks: The Russell 3000® Value Index advanced 16.94%, compared to 6.93% for the Russell 3000 Growth Index. Energy and basic materials stocks led the market upward. Energy stocks were boosted by record-high oil prices, while strong demand from China helped support commodity prices. The health care sector was among the market's weakest performers. Technology also fell off the pace, though it was helped by a rally late in the year. The tech-heavy NASDAQ Composite® Index returned 9.15%, thanks primarily to a 14.87% jump in the fourth quarter. Elsewhere, the Dow Jones Industrial AverageSM gained 5.37% for the year.
For the 12 months ending December 31, 2004, the fund trailed both the 2.92% return of the Goldman Sachs® Technology Index and the S&P 500®. An overweighting in semiconductors and semiconductor equipment stocks had a negative impact on the fund's performance compared with the Goldman Sachs index, as did underweighting Internet retailers. Additionally, my stock picking in the systems software group hurt performance. Chip makers Agere Systems, Integrated Circuit Systems and Conexant Systems, along with semiconductor equipment manufacturer Teradyne, all were among the largest detractors from performance relative to the sector index. On the positive side, the fund's performance received a significant boost from my stock selection in computer hardware. In that group, Apple Computer stood out as our top contributor both in absolute terms and compared with the benchmark. The company's iPod digital music player became the must-have consumer electronics item during the period, driving sales and profits sharply higher. Personal computer manufacturer Dell, the fund's second-largest holding at period end, continued to take market share and benefit from its position as the industry's lowest-cost provider.
Note to shareholders: Charlie Chai became Portfolio Manager of Technology Portfolio on January 12, 2005.
The views expressed in this statement reflect those of the portfolio manager only through the end of the period of the report as stated on the cover and do not necessarily represent the views of Fidelity or any other person in the Fidelity organization. Any such views are subject to change at any time based upon market or other conditions and Fidelity disclaims any responsibility to update such views. These views may not be relied on as investment advice and, because investment decisions for a Fidelity fund are based on numerous factors, may not be relied on as an indication of trading intent on behalf of any Fidelity fund.
Annual Report
Fidelity Variable Insurance Products: Technology Portfolio
Investment Summary
Top Five Stocks as of December 31, 2004 |
| % of fund's net assets |
Intel Corp. | 8.9 |
Dell, Inc. | 6.5 |
Microsoft Corp. | 6.1 |
Cisco Systems, Inc. | 5.6 |
EMC Corp. | 5.1 |
| 32.2 |
Top Industries as of December 31, 2004 |
% of fund's net assets |
| Semiconductors & Semiconductor Equipment | 31.0% | |
| Computers & Peripherals | 22.5% | |
| Communications Equipment | 18.4% | |
| Software | 15.5% | |
| Internet Software & Services | 4.7% | |
| All Others* | 7.9% | |

* Includes short-term investments and net other assets. |
Annual Report
Fidelity Variable Insurance Products: Technology Portfolio
Investments December 31, 2004
Showing Percentage of Net Assets
Common Stocks - 99.9% |
| Shares | | Value (Note 1) |
COMMUNICATIONS EQUIPMENT - 18.4% |
Communications Equipment - 18.4% |
Alcatel SA sponsored ADR (a) | 41,300 | | $ 645,519 |
Alvarion Ltd. (a) | 8,800 | | 116,864 |
Andrew Corp. (a) | 23,000 | | 313,490 |
Avaya, Inc. (a) | 50,700 | | 872,040 |
Carrier Access Corp. (a) | 14,600 | | 155,928 |
Cisco Systems, Inc. (a) | 341,500 | | 6,590,950 |
Comverse Technology, Inc. (a) | 16,670 | | 407,582 |
Corning, Inc. (a) | 9,900 | | 116,523 |
CSR PLC | 30,909 | | 231,332 |
Enterasys Networks, Inc. (a) | 146,500 | | 263,700 |
Extreme Networks, Inc. (a) | 29,800 | | 195,190 |
Foundry Networks, Inc. (a) | 22,300 | | 293,468 |
Juniper Networks, Inc. (a) | 78,396 | | 2,131,587 |
Motorola, Inc. | 193,330 | | 3,325,276 |
Nokia Corp. sponsored ADR | 34,800 | | 545,316 |
Plantronics, Inc. | 10,800 | | 447,876 |
Powerwave Technologies, Inc. (a) | 34,500 | | 292,560 |
QUALCOMM, Inc. | 64,900 | | 2,751,760 |
Research In Motion Ltd. (a) | 17,400 | | 1,432,310 |
Sierra Wireless, Inc. (a) | 16,400 | | 290,143 |
| | 21,419,414 |
COMPUTERS & PERIPHERALS - 22.5% |
Computer Hardware - 13.4% |
Apple Computer, Inc. (a) | 68,400 | | 4,404,960 |
Compal Electronics, Inc. | 216,970 | | 216,356 |
Dell, Inc. (a) | 180,139 | | 7,591,057 |
Hewlett-Packard Co. | 17,600 | | 369,072 |
International Business Machines Corp. | 7,610 | | 750,194 |
palmOne, Inc. (a) | 7,256 | | 228,927 |
Quanta Computer, Inc. | 164,680 | | 295,274 |
Sun Microsystems, Inc. (a) | 334,700 | | 1,800,686 |
| | 15,656,526 |
Computer Storage & Peripherals - 9.1% |
Adaptec, Inc. (a) | 13,300 | | 100,947 |
Brocade Communications Systems, Inc. (a) | 500 | | 3,820 |
Dot Hill Systems Corp. (a) | 76,100 | | 596,624 |
EMC Corp. (a) | 398,140 | | 5,920,342 |
Emulex Corp. (a) | 2,900 | | 48,836 |
Lexmark International, Inc. Class A (a) | 10,600 | | 901,000 |
Network Appliance, Inc. (a) | 25,100 | | 833,822 |
QLogic Corp. (a) | 16,100 | | 591,353 |
Seagate Technology | 62,000 | | 1,070,740 |
Synaptics, Inc. (a) | 2,069 | | 63,270 |
Western Digital Corp. (a) | 44,410 | | 481,404 |
| | 10,612,158 |
TOTAL COMPUTERS & PERIPHERALS | | 26,268,684 |
|
| Shares | | Value (Note 1) |
ELECTRONIC EQUIPMENT & INSTRUMENTS - 3.5% |
Electronic Equipment & Instruments - 0.3% |
Aeroflex, Inc. (a) | 10,100 | | $ 122,412 |
Symbol Technologies, Inc. | 11,600 | | 200,680 |
| | 323,092 |
Electronic Manufacturing Svcs. - 2.0% |
Benchmark Electronics, Inc. (a) | 5,700 | | 194,370 |
Celestica, Inc. (sub. vtg.) (a) | 45,800 | | 645,017 |
Flextronics International Ltd. (a) | 28,800 | | 398,016 |
Hon Hai Precision Industries Co. Ltd. | 111,549 | | 515,813 |
Solectron Corp. (a) | 40,400 | | 215,332 |
Xyratex Ltd. | 21,500 | | 354,320 |
| | 2,322,868 |
Technology Distributors - 1.2% |
Arrow Electronics, Inc. (a) | 13,700 | | 332,910 |
Avnet, Inc. (a) | 13,000 | | 237,120 |
CDW Corp. | 10,300 | | 683,405 |
Ingram Micro, Inc. Class A (a) | 9,200 | | 191,360 |
| | 1,444,795 |
TOTAL ELECTRONIC EQUIPMENT & INSTRUMENTS | | 4,090,755 |
HOTELS, RESTAURANTS & LEISURE - 0.0% |
Hotels, Resorts & Cruise Lines - 0.0% |
eLong, Inc. ADR | 100 | | 1,865 |
HOUSEHOLD DURABLES - 0.5% |
Consumer Electronics - 0.5% |
Harman International Industries, Inc. | 2,200 | | 279,400 |
LG Electronics, Inc. | 3,570 | | 221,056 |
ReignCom Ltd. | 3,226 | | 87,568 |
| | 588,024 |
INTERNET & CATALOG RETAIL - 2.2% |
Internet Retail - 2.2% |
Amazon.com, Inc. (a) | 13,700 | | 606,773 |
eBay, Inc. (a) | 17,100 | | 1,988,388 |
| | 2,595,161 |
INTERNET SOFTWARE & SERVICES - 4.7% |
Internet Software & Services - 4.7% |
Akamai Technologies, Inc. (a) | 15,100 | | 196,753 |
DoubleClick, Inc. (a) | 18,700 | | 145,486 |
Google, Inc. Class A | 9,800 | | 1,892,380 |
Housevalues, Inc. | 200 | | 3,004 |
Openwave Systems, Inc. (a) | 15,033 | | 232,410 |
SonicWALL, Inc. (a) | 35,600 | | 224,992 |
Supportsoft, Inc. (a) | 7,000 | | 46,620 |
VeriSign, Inc. (a) | 9,600 | | 321,792 |
Yahoo!, Inc. (a) | 64,140 | | 2,416,795 |
| | 5,480,232 |
Common Stocks - continued |
| Shares | | Value (Note 1) |
IT SERVICES - 1.2% |
IT Consulting & Other Services - 1.2% |
Cognizant Technology Solutions Corp. Class A (a) | 21,800 | | $ 922,794 |
Infosys Technologies Ltd. sponsored ADR | 4,700 | | 325,757 |
Kanbay International, Inc. | 2,100 | | 65,730 |
Satyam Computer Services Ltd. ADR (d) | 4,900 | | 118,237 |
| | 1,432,518 |
SEMICONDUCTORS & SEMICONDUCTOR EQUIPMENT - 31.0% |
Semiconductor Equipment - 4.0% |
Applied Materials, Inc. (a) | 108,840 | | 1,861,164 |
ATMI, Inc. (a) | 12,000 | | 270,360 |
KLA-Tencor Corp. (a) | 22,100 | | 1,029,418 |
Teradyne, Inc. (a) | 66,700 | | 1,138,569 |
Tessera Technologies, Inc. (a) | 6,572 | | 244,544 |
Varian Semiconductor Equipment Associates, Inc. (a) | 3,400 | | 125,290 |
| | 4,669,345 |
Semiconductors - 27.0% |
Agere Systems, Inc.: | | | |
Class A (a) | 58,500 | | 80,145 |
Class B (a) | 31,100 | | 41,985 |
Altera Corp. (a) | 32,400 | | 670,680 |
Analog Devices, Inc. | 59,000 | | 2,178,280 |
Applied Micro Circuits Corp. (a) | 31,800 | | 133,878 |
Broadcom Corp. Class A (a) | 4,400 | | 142,032 |
Cambridge Display Technologies, Inc. | 7,300 | | 83,074 |
Cree, Inc. (a) | 7,400 | | 296,592 |
Cypress Semiconductor Corp. (a) | 50,600 | | 593,538 |
Fairchild Semiconductor International, Inc. (a) | 17,400 | | 282,924 |
Freescale Semiconductor, Inc.: | | | |
Class A | 20,800 | | 370,656 |
Class B | 39,112 | | 718,096 |
Integrated Circuit Systems, Inc. (a) | 73,000 | | 1,527,160 |
Integrated Device Technology, Inc. (a) | 60,400 | | 698,224 |
Intel Corp. | 444,940 | | 10,407,145 |
International Rectifier Corp. (a) | 14,000 | | 623,980 |
Intersil Corp. Class A | 32,500 | | 544,050 |
Linear Technology Corp. | 7,900 | | 306,204 |
Marvell Technology Group Ltd. (a) | 58,600 | | 2,078,542 |
Mindspeed Technologies, Inc. (a) | 75,400 | | 209,612 |
National Semiconductor Corp. | 191,300 | | 3,433,835 |
NVIDIA Corp. (a) | 22,700 | | 534,812 |
O2Micro International Ltd. (a) | 13,700 | | 156,728 |
ON Semiconductor Corp. (a) | 65,100 | | 295,554 |
PMC-Sierra, Inc. (a) | 24,200 | | 272,250 |
Portalplayer, Inc. | 100 | | 2,468 |
Samsung Electronics Co. Ltd. | 1,111 | | 483,487 |
Semiconductor Manufacturing International Corp. sponsored ADR | 1,480 | | 15,940 |
|
| Shares | | Value (Note 1) |
Sigmatel, Inc. (a) | 20,391 | | $ 724,492 |
Silicon Image, Inc. (a) | 14,380 | | 236,695 |
Silicon Laboratories, Inc. (a) | 6,900 | | 243,639 |
Taiwan Semiconductor Manufacturing Co. Ltd. | 215,410 | | 342,190 |
Taiwan Semiconductor Manufacturing Co. Ltd. sponsored ADR | 89,257 | | 757,792 |
Texas Instruments, Inc. | 58,200 | | 1,432,884 |
Trident Microsystems, Inc. (a) | 2,800 | | 46,816 |
United Microelectronics Corp. | 265,000 | | 170,887 |
United Microelectronics Corp. sponsored ADR (d) | 123,505 | | 435,973 |
| | 31,573,239 |
TOTAL SEMICONDUCTORS & SEMICONDUCTOR EQUIPMENT | | 36,242,584 |
SOFTWARE - 15.5% |
Application Software - 1.8% |
Amdocs Ltd. (a) | 6,100 | | 160,125 |
JAMDAT Mobile, Inc. | 6,000 | | 123,900 |
Lawson Software, Inc. (a) | 15,796 | | 108,519 |
Quest Software, Inc. (a) | 41,779 | | 666,375 |
SAP AG sponsored ADR | 10,500 | | 464,205 |
Siebel Systems, Inc. (a) | 58,100 | | 610,050 |
| | 2,133,174 |
Systems Software - 13.7% |
Adobe Systems, Inc. | 4,775 | | 299,584 |
Computer Associates International, Inc. | 217 | | 6,740 |
Macrovision Corp. (a) | 15,635 | | 402,132 |
McAfee, Inc. (a) | 21,400 | | 619,102 |
Microsoft Corp. | 268,100 | | 7,160,951 |
Novell, Inc. (a) | 62,181 | | 419,722 |
Oracle Corp. (a) | 165,000 | | 2,263,800 |
Red Hat, Inc. (a) | 82,660 | | 1,103,511 |
Secure Computing Corp. (a) | 6,300 | | 62,874 |
Symantec Corp. (a) | 36,800 | | 947,968 |
VERITAS Software Corp. (a) | 92,930 | | 2,653,152 |
Visual Networks, Inc. (a) | 18,800 | | 65,424 |
| | 16,004,960 |
TOTAL SOFTWARE | | 18,138,134 |
SPECIALTY RETAIL - 0.0% |
Computer & Electronics Retail - 0.0% |
Best Buy Co., Inc. | 300 | | 17,826 |
WIRELESS TELECOMMUNICATION SERVICES - 0.4% |
Wireless Telecommunication Services - 0.4% |
InPhonic, Inc. | 100 | | 2,748 |
Common Stocks - continued |
| Shares | | Value (Note 1) |
WIRELESS TELECOMMUNICATION SERVICES - CONTINUED |
Wireless Telecommunication Services - continued |
Leap Wireless International, Inc. (a) | 8,100 | | $ 218,700 |
Nextel Communications, Inc. Class A (a) | 5,900 | | 177,000 |
| | 398,448 |
TOTAL COMMON STOCKS (Cost $95,598,301) | 116,673,645 |
Money Market Funds - 0.4% |
| | | |
Fidelity Cash Central Fund, 2.24% (b) | 150,221 | | 150,221 |
Fidelity Securities Lending Cash Central Fund, 2.23% (b)(c) | 370,451 | | 370,451 |
TOTAL MONEY MARKET FUNDS (Cost $520,672) | 520,672 |
TOTAL INVESTMENT PORTFOLIO - 100.3% (Cost $96,118,973) | 117,194,317 |
NET OTHER ASSETS - (0.3)% | (363,493) |
NET ASSETS - 100% | $ 116,830,824 |
Legend |
(a) Non-income producing |
(b) Affiliated fund that is available only to investment companies and other accounts managed by Fidelity Investments. The rate quoted is the annualized seven-day yield of the fund at period end. A complete listing of the fund's holdings as of its most recent fiscal year end is available upon request. |
(c) Includes investment made with cash collateral received from securities on loan. |
(d) Security or a portion of the security is on loan at period end. |
Other Information |
Distribution of investments by country of issue, as a percentage of total net assets, is as follows: |
United States of America | 89.2% |
Taiwan | 2.4% |
Bermuda | 2.1% |
Canada | 2.0% |
Cayman Islands | 1.0% |
Others (individually less than 1%) | 3.3% |
| 100.0% |
Income Tax Information |
At December 31, 2004, the fund had a capital loss carryforward of approximately $8,117,000 of which $6,957,000 and $1,160,000 will expire on December 31, 2010 and 2012, respectively. |
See accompanying notes which are an integral part of the financial statements.
Annual Report
Fidelity Variable Insurance Products: Technology Portfolio
Financial Statements
Statement of Assets and Liabilities
December 31, 2004 |
| | |
Assets | | |
Investment in securities, at value (including securities loaned of $351,713) (cost $96,118,973) - See accompanying schedule | | $ 117,194,317 |
Foreign currency held at value (cost $1,371) | | 1,440 |
Receivable for investments sold | | 786,777 |
Receivable for fund shares sold | | 5,512 |
Dividends receivable | | 28,110 |
Interest receivable | | 2,846 |
Prepaid expenses | | 469 |
Other affiliated receivables | | 260 |
Other receivables | | 21,252 |
Total assets | | 118,040,983 |
| | |
Liabilities | | |
Payable for investments purchased | $ 514,909 | |
Payable for fund shares redeemed | 221,091 | |
Accrued management fee | 56,896 | |
Other affiliated payables | 10,170 | |
Other payables and accrued expenses | 36,642 | |
Collateral on securities loaned, at value | 370,451 | |
Total liabilities | | 1,210,159 |
| | |
Net Assets | | $ 116,830,824 |
Net Assets consist of: | | |
Paid in capital | | $ 104,587,106 |
Undistributed net investment income | | 334,161 |
Accumulated undistributed net realized gain (loss) on investments and foreign currency transactions | | (9,165,919) |
Net unrealized appreciation (depreciation) on investments and assets and liabilities in foreign currencies | | 21,075,476 |
Net Assets, for 12,466,760 shares outstanding | | $ 116,830,824 |
Net Asset Value, offering price and redemption price per share ($116,830,824 ÷ 12,466,760 shares) | | $ 9.37 |
Statement of Operations
Year ended December 31, 2004 |
| | |
Investment Income | | |
Dividends | | $ 262,151 |
Special Dividends | | 936,900 |
Interest | | 20,260 |
Security lending | | 21,577 |
Total income | | 1,240,888 |
| | |
Expenses | | |
Management fee | $ 779,318 | |
Transfer agent fees | 90,600 | |
Accounting and security lending fees | 51,418 | |
Non-interested trustees' compensation | 753 | |
Custodian fees and expenses | 29,591 | |
Audit | 33,786 | |
Legal | 2,117 | |
Interest | 1,056 | |
Miscellaneous | 22,841 | |
Total expenses before reductions | 1,011,480 | |
Expense reductions | (91,687) | 919,793 |
Net investment income (loss) | | 321,095 |
Realized and Unrealized Gain (Loss) Net realized gain (loss) on: | | |
Investment securities | (877,354) | |
Foreign currency transactions | (8,649) | |
Total net realized gain (loss) | | (886,003) |
Change in net unrealized appreciation (depreciation) on: Investment securities | (4,465,868) | |
Assets and liabilities in foreign currencies | 122 | |
Total change in net unrealized appreciation (depreciation) | | (4,465,746) |
Net gain (loss) | | (5,351,749) |
Net increase (decrease) in net assets resulting from operations | | $ (5,030,654) |
See accompanying notes which are an integral part of the financial statements.
Annual Report
Fidelity Variable Insurance Products: Technology Portfolio
Financial Statements - continued
Statement of Changes in Net Assets
| Year ended
December 31,
2004 | Year ended
December 31,
2003 |
Increase (Decrease) in Net Assets | | |
Operations | | |
Net investment income (loss) | $ 321,095 | $ (295,080) |
Net realized gain (loss) | (886,003) | 5,393,906 |
Change in net unrealized appreciation (depreciation) | (4,465,746) | 28,897,858 |
Net increase (decrease) in net assets resulting from operations | (5,030,654) | 33,996,684 |
Share transactions
Proceeds from sales of shares | 41,591,140 | 123,143,044 |
Cost of shares redeemed | (87,134,416) | (22,975,915) |
Net increase (decrease) in net assets resulting from share transactions | (45,543,276) | 100,167,129 |
Redemption fees | 130,386 | 155,596 |
Total increase (decrease) in net assets | (50,443,544) | 134,319,409 |
| | |
Net Assets | | |
Beginning of period | 167,274,368 | 32,954,959 |
End of period (including undistributed net investment income of $334,161 and $0, respectively) | $ 116,830,824 | $ 167,274,368 |
Other Information Shares | | |
Sold | 4,379,607 | 15,303,104 |
Redeemed | (9,843,606) | (2,993,567) |
Net increase (decrease) | (5,463,999) | 12,309,537 |
Financial Highlights
Years ended December 31, | 2004 | 2003 | 2002 | 2001H |
Selected Per-Share Data | | | | |
Net asset value, beginning of period | $ 9.33 | $ 5.86 | $ 9.42 | $ 10.00 |
Income from Investment Operations | | | | |
Net investment income (loss)E | .02F | (.03) | (.04) | (.03) |
Net realized and unrealized gain (loss) | .01G | 3.49 | (3.54) | (.57) |
Total from investment operations | .03 | 3.46 | (3.58) | (.60) |
Redemption fees added to paid in capitalE | .01 | .01 | .02 | .02 |
Net asset value, end of period | $ 9.37 | $ 9.33 | $ 5.86 | $ 9.42 |
Total ReturnB,C,D | .43% | 59.22% | (37.79)% | (5.80)% |
Ratios to Average Net AssetsI | | | | |
Expenses before expense reductions | .75% | .83% | .99% | 1.31%A |
Expenses net of voluntary waivers, if any | .75% | .83% | .99% | 1.31%A |
Expenses net of all reductions | .68% | .75% | .86% | 1.29%A |
Net investment income (loss) | .24% | (.34)% | (.52)% | (.70)%A |
Supplemental Data | | | | |
Net assets, end of period (000 omitted) | $ 116,831 | $ 167,274 | $ 32,955 | $ 43,430 |
Portfolio turnover rate | 118% | 129% | 217% | 129%A |
A Annualized
B Total returns for periods of less than one year are not annualized.
C Total returns do not reflect charges attributable to your insurance company's separate account. Inclusion of these charges would reduce the total returns shown.
D Total returns would have been lower had certain expenses not been reduced during the periods shown.
E Calculated based on average shares outstanding during the period.
F Investment income per share reflects a special dividend which amounted to $.06 per share.
G The amount shown for a share outstanding does not correspond with the aggregate net gain (loss) on investments for the period due to the timing of sales and repurchases of shares in relation to fluctuating market values of the investments of the fund.
H For the period July 19, 2001 (commencement of operations) to December 31, 2001.
I Expense ratios reflect operating expenses of the fund. Expenses before reductions do not reflect amounts reimbursed by the investment adviser or reductions from brokerage service arrangements or other expense offset arrangements and do not represent the amount paid by the fund during periods when reimbursements or reductions occur. Expense ratios before reductions for start-up periods may not be representative of longer-term operating periods. Expenses net of any voluntary waivers reflect expenses after reimbursement by the investment adviser but prior to reductions from brokerage service arrangements or other expense offset arrangements. Expenses net of all reductions represent the net expenses paid by the fund.
See accompanying notes which are an integral part of the financial statements.
Technology Portfolio
Fidelity Variable Insurance Products: Telecommunications & Utilities Growth Portfolio
Performance: The Bottom Line
Average annual total return reflects the change in the value of an investment, assuming reinvestment of the class' dividend income and capital gains (the profits earned upon the sale of securities that have grown in value) and assuming a constant rate of performance each year. During periods of reimbursement by Fidelity, a fund's total return will be greater than it would be had the reimbursement not occurred. Performance numbers are net of all underlying fund operating expenses, but do not include any insurance charges imposed by your insurance company's separate account. If performance information included the effect of these additional charges, the total returns would have been lower. How a fund did yesterday is no guarantee of how it will do tomorrow.
Average Annual Total Returns
Periods ended December 31, 2004 | Past 1
year | Life of fundA |
Fidelity VIP: Telecommunications & Utilities Growth | 24.61% | -1.51% |
A From July 19, 2001.
$10,000 Over Life of Fund
Let's say hypothetically that $10,000 was invested in Fidelity® Variable Insurance Products: Telecommunications & Utilities Growth Portfolio on July 19, 2001, when the fund started. The chart shows how the value of your investment would have changed, and also shows how the S&P 500 Index performed over the same period.

Annual Report
Fidelity Variable Insurance Products: Telecommunications & Utilities Growth Portfolio
Management's Discussion of Fund Performance
Comments from Brian Younger, Portfolio Manager of Fidelity® Variable Insurance Products: Telecommunications & Utilities Growth Portfolio
The year ending December 31, 2004, generally was positive for equity investors, as many stock market benchmarks produced double-digit gains. Broad-based themes included the continued dominance of small-cap stocks, which outperformed large-caps for the sixth consecutive year. The small-cap Russell 2000® Index was up 18.33% in 2004, while the larger-cap Standard & Poor's 500SM Index rose 10.88%. Value stocks ended the year well ahead of growth stocks: The Russell 3000® Value Index advanced 16.94%, compared to 6.93% for the Russell 3000 Growth Index. Energy and basic materials stocks led the market upward. Energy stocks were boosted by record-high oil prices, while strong demand from China helped support commodity prices. The health care sector was among the market's weakest performers. Technology also fell off the pace, though it was helped by a rally late in the year. The tech-heavy NASDAQ Composite® Index returned 9.15%, thanks primarily to a 14.87% jump in the fourth quarter. Elsewhere, the Dow Jones Industrial AverageSM gained 5.37% for the year.
For the 12 months ending December 31, 2004, the fund beat both the Goldman Sachs® Utilities Index, which returned 21.91%, and the S&P 500®. Stock selection in the electric utilities sector was the key to performance versus the sector benchmark, as I focused on companies with both good dividend yields and reasonable prospects for earnings and revenue growth. Among the fund's biggest gainers was TXU, a Texas-based utility that delivered strong earnings growth after restructuring and bringing in new management. Within telecommunications, the fund favored companies with stable businesses. American Tower, a wireless tower company, and Citizens Communications, a rural phone operator, both posted strong absolute and relative returns. Verizon Communications, a regional Bell operating company (RBOC) with a strong wireless business, also rallied nicely. Conversely, underweightings in AT&T Wireless and Sprint hampered returns relative to the index. Shares of AT&T Wireless took off after Cingular Wireless announced it would acquire the carrier, while Sprint's strength in wireless and potential merger with Nextel Communications fueled its outsized gains. Returns from BellSouth and SBC Communications, RBOCs that jointly own Cingular, also were disappointing. These stocks stalled amid concerns that Cingular had overpaid for its AT&T Wireless acquisition.
The views expressed in this statement reflect those of the portfolio manager only through the end of the period of the report as stated on the cover and do not necessarily represent the views of Fidelity or any other person in the Fidelity organization. Any such views are subject to change at any time based upon market or other conditions and Fidelity disclaims any responsibility to update such views. These views may not be relied on as investment advice and, because investment decisions for a Fidelity fund are based on numerous factors, may not be relied on as an indication of trading intent on behalf of any Fidelity fund.
Annual Report
Fidelity Variable Insurance Products: Telecommunications & Utilities Growth Portfolio
Investment Summary
Top Five Stocks as of December 31, 2004 |
| % of fund's net assets |
Verizon Communications, Inc. | 9.9 |
SBC Communications, Inc. | 9.6 |
BellSouth Corp. | 8.9 |
Nextel Communications, Inc. Class A | 7.7 |
TXU Corp. | 7.0 |
| 43.1 |
Top Industries as of December 31, 2004 |
% of fund's net assets |
| Diversified Telecommunication Services | 39.1% | |
| Electric Utilities | 24.1% | |
| Wireless Telecommunication Services | 17.4% | |
| Media | 7.9% | |
| Multi-Utilities & Unregulated Power | 7.6% | |
| All Others* | 3.9% | |

* Includes short-term investments and net other assets. |
Annual Report
Fidelity Variable Insurance Products: Telecommunications & Utilities Growth Portfolio
Investments December 31, 2004
Showing Percentage of Net Assets
Common Stocks - 97.7% |
| Shares | | Value (Note 1) |
COMMERCIAL SERVICES & SUPPLIES - 0.1% |
Diversified Commercial Services - 0.1% |
Adesa, Inc. | 1,100 | | $ 23,342 |
CONSTRUCTION & ENGINEERING - 0.5% |
Construction & Engineering - 0.5% |
Dycom Industries, Inc. (a) | 6,880 | | 209,978 |
DIVERSIFIED TELECOMMUNICATION SERVICES - 39.1% |
Integrated Telecommunication Services - 39.1% |
ALLTEL Corp. | 3,710 | | 218,000 |
BellSouth Corp. | 122,430 | | 3,402,330 |
Citizens Communications Co. | 114,530 | | 1,579,369 |
Golden Telecom, Inc. | 1,400 | | 36,988 |
Iowa Telecommunication Services, Inc. | 2,900 | | 62,553 |
Qwest Communications International, Inc. (a) | 203,970 | | 905,627 |
SBC Communications, Inc. | 142,310 | | 3,667,329 |
Sprint Corp. | 42,700 | | 1,061,095 |
TELUS Corp. (non-vtg.) | 7,300 | | 211,335 |
Verizon Communications, Inc. | 93,760 | | 3,798,216 |
| | 14,942,842 |
ELECTRIC UTILITIES - 24.1% |
Electric Utilities - 24.1% |
Allegheny Energy, Inc. (a) | 4,800 | | 94,608 |
Allete, Inc. | 233 | | 8,563 |
Entergy Corp. | 13,500 | | 912,465 |
Exelon Corp. | 41,000 | | 1,806,870 |
FirstEnergy Corp. | 30,720 | | 1,213,747 |
PG&E Corp. (a) | 46,000 | | 1,530,880 |
PPL Corp. | 13,400 | | 713,952 |
TXU Corp. | 41,540 | | 2,681,822 |
Westar Energy, Inc. | 1,700 | | 38,879 |
Wisconsin Energy Corp. | 6,620 | | 223,160 |
| | 9,224,946 |
GAS UTILITIES - 0.8% |
Gas Utilities - 0.8% |
KeySpan Corp. | 440 | | 17,358 |
Nicor, Inc. | 1,900 | | 70,186 |
Peoples Energy Corp. | 1,200 | | 52,740 |
Piedmont Natural Gas Co., Inc. | 1,000 | | 23,240 |
Southern Union Co. (a) | 3,600 | | 86,328 |
UGI Corp. | 1,000 | | 40,910 |
| | 290,762 |
INTERNET SOFTWARE & SERVICES - 0.1% |
Internet Software & Services - 0.1% |
Raindance Communications, Inc. (a) | 14,500 | | 33,640 |
MEDIA - 7.9% |
Broadcasting & Cable TV - 7.9% |
EchoStar Communications Corp. Class A | 53,100 | | 1,765,044 |
|
| Shares | | Value (Note 1) |
NTL, Inc. (a) | 1,300 | | $ 94,848 |
The DIRECTV Group, Inc. (a) | 52,483 | | 878,565 |
XM Satellite Radio Holdings, Inc.
Class A (a) | 7,300 | | 274,626 |
| | 3,013,083 |
MULTI-UTILITIES & UNREGULATED POWER - 7.6% |
Multi-Utilities & Unregulated Power - 7.6% |
AES Corp. (a) | 36,750 | | 502,373 |
Constellation Energy Group, Inc. | 4,890 | | 213,742 |
Dominion Resources, Inc. | 22,370 | | 1,515,344 |
Energen Corp. | 1,300 | | 76,635 |
Equitable Resources, Inc. | 2,200 | | 133,452 |
ONEOK, Inc. | 6,800 | | 193,256 |
Sierra Pacific Resources (a) | 24,750 | | 259,875 |
| | 2,894,677 |
WATER UTILITIES - 0.1% |
Water Utilities - 0.1% |
Aqua America, Inc. | 1,287 | | 31,647 |
WIRELESS TELECOMMUNICATION SERVICES - 17.4% |
Wireless Telecommunication Services - 17.4% |
Alamosa Holdings, Inc. (a) | 6,400 | | 79,808 |
American Tower Corp. Class A (a) | 58,010 | | 1,067,384 |
Crown Castle International Corp. (a) | 27,490 | | 457,434 |
Nextel Communications, Inc. Class A (a) | 97,620 | | 2,928,600 |
Nextel Partners, Inc. Class A (a) | 35,300 | | 689,762 |
NII Holdings, Inc. (a) | 13,500 | | 640,575 |
Price Communications Corp. (a) | 3,400 | | 63,206 |
SpectraSite, Inc. (a) | 6,700 | | 387,930 |
Western Wireless Corp. Class A (a) | 11,300 | | 331,090 |
| | 6,645,789 |
TOTAL COMMON STOCKS (Cost $31,305,557) | 37,310,706 |
Money Market Funds - 2.1% |
| | | |
Fidelity Cash Central Fund, 2.24% (b)
(Cost $794,574) | 794,574 | | 794,574 |
TOTAL INVESTMENT PORTFOLIO - 99.8% (Cost $32,100,131) | 38,105,280 |
NET OTHER ASSETS - 0.2% | | 76,895 |
NET ASSETS - 100% | $ 38,182,175 |
Legend |
(a) Non-income producing |
(b) Affiliated fund that is available only to investment companies and other accounts managed by Fidelity Investments. The rate quoted is the annualized seven-day yield of the fund at period end. A complete listing of the fund's holdings as of its most recent fiscal year end is available upon request. |
Income Tax Information |
At December 31, 2004, the fund had a capital loss carryforward of approximately $2,601,000 of which $2,273,000 and $328,000 will expire on December 31, 2010 and 2011, respectively. |
See accompanying notes which are an integral part of the financial statements.
Telecommunications & Utilities Growth Portfolio
Fidelity Variable Insurance Products: Telecommunications & Utilities Growth Portfolio
Financial Statements
Statement of Assets and Liabilities
December 31, 2004 |
| | |
Assets | | |
Investment in securities, at value (cost $32,100,131) - See accompanying schedule | | $ 38,105,280 |
Receivable for fund shares sold | | 84,215 |
Dividends receivable | | 37,955 |
Interest receivable | | 1,103 |
Prepaid expenses | | 58 |
Other receivables | | 3,236 |
Total assets | | 38,231,847 |
| | |
Liabilities | | |
Payable for fund shares redeemed | $ 46 | |
Accrued management fee | 17,854 | |
Other affiliated payables | 4,592 | |
Other payables and accrued expenses | 27,180 | |
Total liabilities | | 49,672 |
| | |
Net Assets | | $ 38,182,175 |
Net Assets consist of: | | |
Paid in capital | | $ 35,166,452 |
Accumulated undistributed net realized gain (loss) on investments and foreign currency transactions | | (2,989,432) |
Net unrealized appreciation (depreciation) on investments and assets and liabilities in foreign currencies | | 6,005,155 |
Net Assets, for 4,178,666 shares outstanding | | $ 38,182,175 |
Net Asset Value, offering price and redemption price per share ($38,182,175 ÷ 4,178,666 shares) | | $ 9.14 |
Statement of Operations
Year ended December 31, 2004 |
| | |
Investment Income | | |
Dividends | | $ 466,113 |
Special Dividends | | 118,260 |
Interest | | 9,973 |
Total income | | 594,346 |
| | |
Expenses | | |
Management fee | $ 111,795 | |
Transfer agent fees | 17,201 | |
Accounting fees and expenses | 30,001 | |
Non-interested trustees' compensation | 98 | |
Custodian fees and expenses | 8,040 | |
Audit | 32,349 | |
Legal | 574 | |
Miscellaneous | 3,144 | |
Total expenses before reductions | 203,202 | |
Expense reductions | (6,853) | 196,349 |
Net investment income (loss) | | 397,997 |
Realized and Unrealized Gain (Loss) Net realized gain (loss) on: | | |
Investment securities | 598,857 | |
Foreign currency transactions | 219 | |
Total net realized gain (loss) | | 599,076 |
Change in net unrealized appreciation (depreciation) on: Investment securities | 4,246,133 | |
Assets and liabilities in foreign currencies | 6 | |
Total change in net unrealized appreciation (depreciation) | | 4,246,139 |
Net gain (loss) | | 4,845,215 |
Net increase (decrease) in net assets resulting from operations | | $ 5,243,212 |
See accompanying notes which are an integral part of the financial statements.
Annual Report
Financial Statements - continued
Statement of Changes in Net Assets
| Year ended
December 31,
2004 | Year ended
December 31,
2003 |
Increase (Decrease) in Net Assets | | |
Operations | | |
Net investment income (loss) | $ 397,997 | $ 128,322 |
Net realized gain (loss) | 599,076 | (15,779) |
Change in net unrealized appreciation (depreciation) | 4,246,139 | 2,009,227 |
Net increase (decrease) in net assets resulting from operations | 5,243,212 | 2,121,770 |
Distributions to shareholders from net investment income | (420,028) | (127,557) |
Share transactions
Proceeds from sales of shares | 30,485,065 | 8,094,462 |
Reinvestment of distributions | 420,028 | 127,557 |
Cost of shares redeemed | (9,281,514) | (6,820,171) |
Net increase (decrease) in net assets resulting from share transactions | 21,623,579 | 1,401,848 |
Redemption fees | 35,419 | 34,040 |
Total increase (decrease) in net assets | 26,482,182 | 3,430,101 |
| | |
Net Assets | | |
Beginning of period | 11,699,993 | 8,269,892 |
End of period (including undistributed net investment income of $0 and undistributed net investment income of $855, respectively) | $ 38,182,175 | $ 11,699,993 |
Other Information Shares | | |
Sold | 3,649,882 | 1,219,470 |
Issued in reinvestment of distributions | 46,036 | 18,115 |
Redeemed | (1,094,472) | (1,050,360) |
Net increase (decrease) | 2,601,446 | 187,225 |
Financial Highlights
Years ended December 31, | 2004 | 2003 | 2002 | 2001G |
Selected Per-Share Data | | | | |
Net asset value, beginning of period | $ 7.42 | $ 5.95 | $ 8.60 | $ 10.00 |
Income from Investment Operations | | | | |
Net investment income (loss)E | .17F | .08 | .09 | .02 |
Net realized and unrealized gain (loss) | 1.65 | 1.45 | (2.67) | (1.42) |
Total from investment operations | 1.82 | 1.53 | (2.58) | (1.40) |
Distributions from net investment income | (.11) | (.08) | (.08) | (.01) |
Redemption fees added to paid in capitalE | .01 | .02 | .01 | .01 |
Net asset value, end of period | $ 9.14 | $ 7.42 | $ 5.95 | $ 8.60 |
Total ReturnB,C,D | 24.61% | 26.17% | (29.91)% | (13.90)% |
Ratios to Average Net AssetsH | | | | |
Expenses before expense reductions | 1.04% | 1.71% | 1.82% | 2.35%A |
Expenses net of voluntary waivers, if any | 1.04% | 1.50% | 1.50% | 1.50%A |
Expenses net of all reductions | 1.00% | 1.46% | 1.39% | 1.49%A |
Net investment income (loss) | 2.03% | 1.19% | 1.30% | .45%A |
Supplemental Data | | | | |
Net assets, end of period (000 omitted) | $ 38,182 | $ 11,700 | $ 8,270 | $ 9,833 |
Portfolio turnover rate | 84% | 123% | 154% | 85%A |
A Annualized
B Total returns for periods of less than one year are not annualized.
C Total returns do not reflect charges attributable to your insurance company's separate account. Inclusion of these charges would reduce the total returns shown.
D Total returns would have been lower had certain expenses not been reduced during the periods shown.
E Calculated based on average shares outstanding during the period.
F Investment income per share reflects a special dividend which amounted to $.06 per share.
G For the period July 19, 2001 (commencement of operations) to December 31, 2001.
H Expense ratios reflect operating expenses of the fund. Expenses before reductions do not reflect amounts reimbursed by the investment adviser or reductions from brokerage service arrangements or other expense offset arrangements and do not represent the amount paid by the fund during periods when reimbursements or reductions occur. Expense ratios before reductions for start-up periods may not be representative of longer-term operating periods. Expenses net of any voluntary waivers reflect expenses after reimbursement by the investment adviser but prior to reductions from brokerage service arrangements or other expense offset arrangements. Expenses net of all reductions represent the net expenses paid by the fund.
See accompanying notes which are an integral part of the financial statements.
Telecommunications & Utilities Growth Portfolio
Notes to Financial Statements
For the period ended December 31, 2004
1. Significant Accounting Policies.
Consumer Industries Portfolio, Cyclical Industries Portfolio, Financial Services Portfolio, Health Care Portfolio, Natural Resources Portfolio, Technology Portfolio, and Telecommunications & Utilities Growth Portfolio (the funds) are funds of Variable Insurance Products Fund IV (the trust) and are registered under the Investment Company Act of 1940, as amended (the 1940 Act), as open-end management investment companies organized as a Massachusetts business trust. Each fund is authorized to issue an unlimited number of shares. Shares of each fund may only be purchased by insurance companies for the purpose of funding variable annuity or variable life insurance contracts. Each fund offers Initial Class shares.
The financial statements have been prepared in conformity with accounting principles generally accepted in the United States of America, which require management to make certain estimates and assumptions at the date of the financial statements. The following summarizes the significant accounting policies of the funds:
Security Valuation. Net asset value per share (NAV calculation) is calculated as of the close of business of the New York Stock Exchange, normally 4:00 p.m. Eastern time. Equity securities, including restricted securities, for which market quotations are available are valued at the last sale price or official closing price (closing bid price or last evaluated quote if no sale has occurred) on the primary market or exchange on which they trade. If prices are not readily available or do not accurately reflect fair value for a security, or if a security's value has been materially affected by events occurring after the close of the exchange or market on which the security is principally traded, that security may be valued by another method that the Board of Trustees believes accurately reflects fair value. A security's valuation may differ depending on the method used for determining value. Price movements in futures contracts and ADRs, market and trading trends, the bid/ask quotes of brokers and off-exchange institutional trading may be reviewed in the course of making a good faith determination of a security's fair value. Short-term securities with remaining maturities of sixty days or less for which quotations are not readily available are valued on the basis of amortized cost. Investments in open-end investment companies are valued at their net asset value each business day.
Foreign Currency. Certain funds may use foreign currency contracts to facilitate transactions in foreign-denominated securities. Losses from these transactions may arise from changes in the value of the foreign currency or if the counterparties do not perform under the contracts' terms.
Foreign-denominated assets, including investment securities, and liabilities are translated into U.S. dollars at the exchange rate at period end. Purchases and sales of investment securities, income and dividends received and expenses denominated in foreign currencies are translated into U.S. dollars at the exchange rate in effect on the transaction date.
The effects of exchange rate fluctuations on investments are included with the net realized and unrealized gain (loss) on investment securities. Other foreign currency transactions resulting in realized and unrealized gain (loss) are disclosed separately.
Investment Transactions and Income. Security transactions are accounted for as of trade date. Gains and losses on securities sold are determined on the basis of identified cost and may include proceeds received from litigation. Dividend income is recorded on the ex-dividend date, except for certain dividends from foreign securities where the ex-dividend date may have passed, which are recorded as soon as the funds are informed of the ex-dividend date. Non-cash dividends included in dividend income, if any, are recorded at the fair market value of the securities received. Distributions received on securities that represent a return of capital or capital gain are recorded as a reduction of cost of investments and/or as a realized gain. The funds estimate the components of distributions received that may be considered return of capital distributions or capital gain distributions. Large, non-recurring dividends recognized by the funds are presented separately on the Statement of Operations as "Special Dividends" and the impact of these dividends to net investment income per share is presented in the Financial Highlights. Interest income is accrued as earned. Interest income includes coupon interest and amortization of premium and accretion of discount on debt securities. Investment income is recorded net of foreign taxes withheld where recovery of such taxes is uncertain.
Expenses. Most expenses of the trust can be directly attributed to a fund. Expenses which cannot be directly attributed are apportioned among the funds in the trust.
Income Tax Information and Distributions to Shareholders. Each year, each fund intends to qualify as a regulated investment company by distributing all of its taxable income and realized gains under Subchapter M of the Internal Revenue Code. As a result, no provision for income taxes is required in the accompanying financial statements. Foreign taxes are provided for based on each fund's understanding of the tax rules and rates that exist in the foreign markets in which it invests.
Distributions are recorded on the ex-dividend date. Income and capital gain distributions are determined in accordance with income tax regulations, which may differ from generally accepted accounting principles. Capital accounts within the financial statements are adjusted for permanent book-tax differences. These adjustments have no impact on net assets or the results of operations. Temporary book-tax differences will reverse in a subsequent period.
Book-tax differences are primarily due to foreign currency transactions, passive foreign investment companies (PFIC), non taxable dividends, net operating losses, capital loss carryforwards and losses deferred due to wash sales and excise tax regulations.
Annual Report
Notes to Financial Statements - continued
1. Significant Accounting Policies - continued
Income Tax Information and Distributions to Shareholders - continued
The tax-basis components of distributable earnings and the federal tax cost as of period end were as follows for each fund:
| Cost for Federal
Income Tax Purposes | Unrealized
Appreciation | Unrealized
Depreciation | Net Unrealized
Appreciation/
(Depreciation) |
Consumer Industries Portfolio | $ 9,950,027 | $ 2,116,879 | $ (170,956) | $ 1,945,923 |
Cyclical Industries Portfolio | 54,185,678 | 8,602,085 | (426,522) | 8,175,563 |
Financial Services Portfolio | 33,001,460 | 8,915,144 | (223,169) | 8,691,975 |
Health Care Portfolio | 56,647,594 | 12,264,800 | (3,146,113) | 9,118,687 |
Natural Resources Portfolio | 110,690,724 | 15,777,915 | (1,030,175) | 14,747,740 |
Technology Portfolio | 97,158,073 | 23,776,242 | (3,739,998) | 20,036,244 |
Telecommunications & Utilities Growth Portfolio | 32,488,312 | 6,002,034 | (385,066) | 5,616,968 |
| Undistributed
Ordinary Income | Undistributed Long-term Capital Gain | Capital Loss
Carryforward |
Consumer Industries Portfolio | $ - | $ - | $ (2,358,977) |
Cyclical Industries Portfolio | 25,010 | 189,139 | - |
Financial Services Portfolio | 442,451 | - | (1,758,019) |
Health Care Portfolio | 133,530 | - | (9,189,013) |
Natural Resources Portfolio | - | 118,751 | - |
Technology Portfolio | 324,127 | - | (8,116,656) |
Telecommunications & Utilities Growth Portfolio | - | - | (2,601,243) |
The tax character of distributions paid was as follows:
| December 31, 2004 |
| Ordinary Income | Long-term
Capital Gains |
Cyclical Industries Portfolio | 176,284 | - |
Health Care Portfolio | 200,555 | - |
Natural Resources Portfolio | 548,630 | 43,669 |
Telecommunications & Utilities Growth Portfolio | 420,028 | - |
| December 31, 2003 | |
| Ordinary Income | |
Cyclical Industries Portfolio | 33,211 | |
Financial Services Portfolio | 403,705 | |
Natural Resources Portfolio | 118,735 | |
Telecommunications & Utilities Growth Portfolio | 127,557 | |
Short-Term Trading (Redemption) Fees. Shares held in the funds less than 60 days are subject to a redemption fee equal to 1.00% of the proceeds of the redeemed shares. All redemption fees, including any estimated redemption fees paid by Fidelity Management & Research Company (FMR), are retained by the funds and accounted for as an addition to paid in capital.
2. Operating Policies.
Repurchase Agreements. FMR has received an Exemptive Order from the Securities and Exchange Commission (the SEC) which permits the funds and other affiliated entities of FMR to transfer uninvested cash balances into joint trading accounts. These accounts are then invested in repurchase agreements that are collateralized by U.S. Treasury or Government obligations. Certain funds may also invest directly with institutions, in repurchase agreements that are collateralized by commercial paper obligations and corporate obligations. Collateral is held in segregated accounts with custodian banks and may be obtained in the event of a default of the counterparty. Collateral is marked-to-market daily and maintained at a value at least equal to the principal amount of the repurchase agreement (including accrued interest).
Annual Report
3. Purchases and Sales of Investments.
Purchases and sales of securities, other than short-term securities and U.S. government securities, are noted in the table below.
| Purchases ($) | Sales ($) |
Consumer Industries Portfolio | 15,413,686 | 15,140,943 |
Cyclical Industries Portfolio | 69,839,911 | 35,851,779 |
Financial Services Portfolio | 38,822,876 | 42,411,327 |
Health Care Portfolio | 45,719,910 | 36,325,597 |
Natural Resources Portfolio | 137,376,600 | 59,066,567 |
Technology Portfolio | 157,761,969 | 197,722,319 |
Telecommunications & Utilities Growth Portfolio | 37,332,276 | 16,465,283 |
4. Fees and Other Transactions with Affiliates.
Management Fee. FMR and its affiliates provide the funds with investment management related services for which the funds pay a monthly management fee. The management fee is the sum of an individual fund fee rate and a group fee rate. The individual fund fee rate is applied to each fund's average net assets. The group fee rate is based upon the average net assets of all the mutual funds advised by FMR. The group fee rate decreases as assets under management increase and increases as assets under management decrease. For the period, each fund's annual management fee rate expressed as a percentage of each fund's average net assets was as follows:
| Individual Rate | Group Rate | Total |
Consumer Industries Portfolio | .30% | .28% | .57% |
Cyclical Industries Portfolio | .30% | .28% | .57% |
Financial Services Portfolio | .30% | .28% | .57% |
Health Care Portfolio | .30% | .28% | .57% |
Natural Resources Portfolio | .30% | .28% | .57% |
Technology Portfolio | .30% | .28% | .58% |
Telecommunications & Utilities Growth Portfolio | .30% | .28% | .57% |
Transfer Agent Fees. Fidelity Investment Institutional Operations Company, Inc. (FIIOC), an affiliate of FMR, is the funds' transfer, dividend disbursing and shareholder servicing agent. FIIOC receives an asset-based fee with respect to each account. FIIOC pays a portion of the expenses related to the typesetting, printing and mailing of shareholder reports, except proxy statements. Each fund pays a transfer agent fee, excluding out of pocket expenses, equal to an annual rate of .07% of their month end net assets.
Accounting and Security Lending Fees. Fidelity Service Company, Inc. (FSC), an affiliate of FMR, maintains each fund's accounting records. The accounting fee is based on the level of average net assets for the month. Under a separate contract, FSC administers the security lending program. The security lending fee is based on the number and duration of lending transactions.
Central Funds. The funds may invest in affiliated Central Funds managed by Fidelity Investments Money Management, Inc. (FIMM), an affiliate of FMR. The Central Funds are open-end investment companies available only to investment companies and other accounts managed by FMR and its affiliates. The Central Funds seek preservation of capital and current income and do not pay a management fee. Income distributions earned by the funds are recorded as income in the accompanying financial statements. Distributions from the Central Funds are noted in the table below:
| Income Distributions |
Consumer Industries Portfolio | $ 3,779 |
Cyclical Industries Portfolio | 30,560 |
Financial Services Portfolio | 18,059 |
Health Care Portfolio | 13,991 |
Natural Resources Portfolio | 55,827 |
Technology Portfolio | 19,718 |
Telecommunications & Utilities Growth Portfolio | 9,853 |
Annual Report
Notes to Financial Statements - continued
4. Fees and Other Transactions with Affiliates - continued
Brokerage Commissions. Certain funds placed a portion of their portfolio transactions with brokerage firms which are affiliates of the investment adviser. The commissions paid to these affiliated firms were as follows:
| Amount |
Consumer Industries Portfolio | $ 793 |
Cyclical Industries Portfolio | 4,398 |
Financial Services Portfolio | 2,197 |
Health Care Portfolio | 802 |
Natural Resources Portfolio | 3,362 |
Technology Portfolio | 34,107 |
Telecommunications & Utilities Growth Portfolio | 806 |
Interfund Lending Program. Pursuant to an Exemptive Order issued by the SEC, the funds, along with other registered investment companies having management contracts with FMR, may participate in an interfund lending program. This program provides an alternative credit facility allowing the funds to borrow from, or lend money to, other participating funds. Each applicable fund's activity in this program during the period was as follows:
| Borrower or Lender | Average Daily Loan Balance | Weighted Average Interest Rate | Interest Earned (included in interest income) | Interest Expense |
Technology Portfolio | Borrower | $ 3,896,286 | 1.15% | - | $ 872 |
5. Committed Line of Credit.
Certain funds participate with other funds managed by FMR in a $4.2 billion credit facility (the "line of credit") to be utilized for temporary or emergency purposes to fund shareholder redemptions or for other short-term liquidity purposes. The participating funds have agreed to pay commitment fees on their pro rata portion of the line of credit. During the period, there were no borrowings on this line of credit.
6. Security Lending.
Certain funds lend portfolio securities from time to time in order to earn additional income. Each applicable fund receives collateral (in the form of U.S. Treasury obligations, letters of credit and/or cash) against the loaned securities and maintains collateral in an amount not less than 100% of the market value of the loaned securities during the period of the loan. The market value of the loaned securities is determined at the close of business of the funds and any additional required collateral is delivered to the funds on the next business day. If the borrower defaults on its obligation to return the securities loaned because of insolvency or other reasons, a fund could experience delays and costs in recovering the securities loaned or in gaining access to the collateral. Cash collateral is invested in cash equivalents. The value of loaned securities and cash collateral at period end are disclosed on each applicable fund's Statement of Assets and Liabilities.
7. Bank Borrowings.
Each fund is permitted to have bank borrowings for temporary or emergency purposes to fund shareholder redemptions. Each fund has established borrowing arrangements with certain banks. The interest rate on the borrowings is the bank's base rate, as revised from time to time. Each applicable fund's activity in this program during the period was as follows:
| Average Daily Loan Balance | Weighted Average Interest Rate |
Technology Portfolio | $5,279,000 | 1.25% |
Annual Report
8. Expense Reductions.
Many of the brokers with whom FMR places trades on behalf of certain funds provided services to these funds in addition to trade execution. These services included payments of expenses on behalf of each applicable fund. In addition, through arrangements with each applicable fund's custodian, credits realized as a result of uninvested cash balances were used to reduce each applicable fund's expenses. All of the applicable expense reductions are noted in the table below.
| Brokerage Service
Arrangements | Custody
expense
reduction |
| | |
Consumer Industries Portfolio | $ 4,059 | $ - |
Cyclical Industries Portfolio | 13,507 | 122 |
Financial Services Portfolio | 9,826 | - |
Health Care Portfolio | 9,020 | - |
Natural Resources Portfolio | 25,149 | 136 |
Technology Portfolio | 91,687 | - |
Telecommunications & Utilities Growth Portfolio | 6,853 | - |
9. Other Information.
At the end of the period, FMR or its affiliates were owners of record of more than 10% of the outstanding shares of the following funds:
Fund | Affiliated % |
Consumer Industries Portfolio | 100% |
Cyclical Industries Portfolio | 100% |
Financial Services Portfolio | 100% |
Health Care Portfolio | 100% |
Natural Resources Portfolio | 100% |
Technology Portfolio | 100% |
Telecommunications & Utilities Growth Portfolio | 100% |
Annual Report
Report of Independent Registered Public Accounting Firm
To the Trustees of Variable Insurance Products Fund IV and the Shareholders of Consumer Industries Portfolio, Cyclical Industries Portfolio, Financial Services Portfolio, Health Care Portfolio, Natural Resources Portfolio, Technology Portfolio and Telecommunications & Utilities Growth Portfolio:
In our opinion, the accompanying statements of assets and liabilities, including the schedules of investments, and the related statements of operations and of changes in net assets and the financial highlights present fairly, in all material respects, the financial position of Consumer Industries Portfolio, Financial Services Portfolio, Health Care Portfolio, Natural Resources Portfolio, Technology Portfolio and Telecommunications & Utilities Growth Portfolio (a funds of Variable Insurance Products Fund IV) at December 31, 2004 and the results of their operations, the changes in their net assets and the financial highlights for the periods indicated, in conformity with accounting principles generally accepted in the United States of America. These financial statements and financial highlights (hereafter referred to as "financial statements") are the responsibility of the Variable Insurance Product Fund IV's management; our responsibility is to express an opinion on these financial statements based on our audits. We conducted our audits of these financial statements in accordance with the standards of the Public Company Accounting Oversight Board (United States). Those standards require that we plan and perform the audit to obtain reasonable assurance about whether the financial statements are free of material misstatement. An audit includes examining, on a test basis, evidence supporting the amounts and disclosures in the financial statements, assessing the accounting principles used and significant estimates made by management, and evaluating the overall financial statement presentation. We believe that our audits, which included confirmation of securities at December 31, 2004 by correspondence with the custodian and brokers, provide a reasonable basis for our opinion.
/s/PricewaterhouseCoopers LLP
PricewaterhouseCoopers LLP
Boston, Massachusetts
February 14, 2005
Annual Report
Trustees and Officers
The Trustees, Member of the Advisory Board, and executive officers of the trust and funds, as applicable, are listed below. The Board of Trustees governs each fund and is responsible for protecting the interests of shareholders. The Trustees are experienced executives who meet periodically throughout the year to oversee each fund's activities, review contractual arrangements with companies that provide services to each fund, and review each fund's performance. Except for William O. McCoy, Dennis J. Dirks, and Kenneth L. Wolfe, each of the Trustees oversees 301 funds advised by FMR or an affiliate. Mr. McCoy oversees 303 funds advised by FMR or an affiliate. Mr. Dirks and Mr. Wolfe oversee 223 funds advised by FMR or an affiliate.
The Trustees hold office without limit in time except that (a) any Trustee may resign; (b) any Trustee may be removed by written instrument, signed by at least two-thirds of the number of Trustees prior to such removal; (c) any Trustee who requests to be retired or who has become incapacitated by illness or injury may be retired by written instrument signed by a majority of the other Trustees; and (d) any Trustee may be removed at any special meeting of shareholders by a two-thirds vote of the outstanding voting securities of the trust. In any event, each non-interested Trustee shall retire not later than the last day of the calendar year in which his or her 72nd birthday occurs. The executive officers and Advisory Board Member hold office without limit in time, except that any officer and Advisory Board Member may resign or may be removed by a vote of a majority of the Trustees at any regular meeting or any special meeting of the Trustees. Except as indicated, each individual has held the office shown or other offices in the same company for the past five years.
The funds' Statement of Additional Information (SAI) includes more information about Trustees. To request a free copy, call Fidelity at 1-800-544-5429.
Interested Trustees*:
Correspondence intended for each Trustee who is an "interested person" (as defined in the 1940 Act) may be sent to Fidelity Investments, 82 Devonshire Street, Boston, Massachusetts 02109.
Name, Age; Principal Occupation |
Edward C. Johnson 3d (74)** |
| Year of Election or Appointment: 1983 Mr. Johnson is Chairman of the Board of Trustees. Mr. Johnson serves as Chief Executive Officer, Chairman, and a Director of FMR Corp.; a Director and Chairman of the Board and of the Executive Committee of FMR; Chairman and a Director of Fidelity Management & Research (Far East) Inc.; Chairman (1998) and a Director of Fidelity Investments Money Management, Inc.; and Chairman (2001) and a Director (2000) of FMR Co., Inc. |
Abigail P. Johnson (43)** |
| Year of Election or Appointment: 2001 Senior Vice President of VIP Consumer Industries (2001), VIP Cyclical Industries (2001), VIP Financial Services (2001), VIP Health Care (2001), VIP Natural Resources (2001) VIP Technology (2001), and VIP Telecommunications & Utilities Growth (2001). Ms. Johnson also serves as Senior Vice President of other Fidelity funds (2001). She is President and a Director of FMR (2001), Fidelity Investments Money Management, Inc. (2001), FMR Co., Inc. (2001), and a Director of FMR Corp. Previously, Ms. Johnson managed a number of Fidelity funds. |
Laura B. Cronin (50) |
| Year of Election or Appointment: 2003 Ms. Cronin is an Executive Vice President (2002) and Chief Financial Officer (2002) of FMR Corp. and is a member of the Fidelity Management Committee (2003). Previously, Ms. Cronin served as Vice President of Finance of FMR (1997-1999), and Chief Financial Officer of FMR (1999-2001), Fidelity Personal Investments (2001), and Fidelity Brokerage Company (2001-2002). |
Robert L. Reynolds (52) |
| Year of Election or Appointment: 2003 Mr. Reynolds is a Director (2003) and Chief Operating Officer (2002) of FMR Corp. and is the head of the Fidelity Management Committee (2003). He also serves on the Board at Fidelity Investments Canada, Ltd. (2000). Previously, Mr. Reynolds served as President of Fidelity Investments Institutional Retirement Group (1996-2000). |
* Trustees have been determined to be "Interested Trustees" by virtue of, among other things, their affiliation with the trust or various entities under common control with FMR.
** Edward C. Johnson 3d, Trustee, is Abigail P. Johnson's father.
Annual Report
Trustees and Officers - continued
Non-Interested Trustees:
Correspondence intended for each non-interested Trustee (that is, the Trustees other than the Interested Trustees) may be sent to Fidelity Investments, P.O. Box 55235, Boston, Massachusetts 02205-5235.
Name, Age; Principal Occupation |
Dennis J. Dirks (56) |
| Year of Election or Appointment: 2005 Mr. Dirks also serves as a Trustee (2005) or Member of the Advisory Board (2004) of other investment companies advised by FMR. Prior to his retirement in May 2003, Mr. Dirks was Chief Operating Officer and a member of the Board of The Depository Trust & Clearing Corporation (DTCC) (1999-2003). He also served as President, Chief Operating Officer, and Board member of The Depository Trust Company (DTC) (1999-2003) and President and Board member of the National Securities Clearing Corporation (NSCC) (1999-2003). In addition, Mr. Dirks served as Chief Executive Officer and Board member of the Government Securities Clearing Corporation (2001-2003) and Chief Executive Officer and Board member of the Mortgage-Backed Securities Clearing Corporation (2001-2003). |
Robert M. Gates (61) |
| Year of Election or Appointment: 1997 Dr. Gates is Vice Chairman of the non-interested Trustees (2005). Dr. Gates is President of Texas A&M University (2002). He was Director of the Central Intelligence Agency (CIA) from 1991 to 1993. From 1989 to 1991, Dr. Gates served as Assistant to the President of the United States and Deputy National Security Advisor. Dr. Gates is a Director of NACCO Industries, Inc. (mining and manufacturing), Parker Drilling Co., Inc. (drilling and rental tools for the energy industry, 2001), and Brinker International (restaurant management, 2003). He also serves as a member of the Advisory Board of VoteHere.net (secure internet voting, 2001). Previously, Dr. Gates served as a Director of LucasVarity PLC (automotive components and diesel engines), a Director of TRW Inc. (automotive, space, defense, and information technology), and Dean of the George Bush School of Government and Public Service at Texas A&M University (1999-2001). Dr. Gates also is a Trustee of the Forum for International Policy. |
George H. Heilmeier (68) |
| Year of Election or Appointment: 2004 Dr. Heilmeier is Chairman Emeritus of Telcordia Technologies (communication software and systems), where prior to his retirement, he served as company Chairman and Chief Executive Officer. He currently serves on the Boards of Directors of The Mitre Corporation (systems engineering and information technology support for the government), INET Technologies Inc. (telecommunications network surveillance, 2001), Teletech Holdings (customer management services), and HRL Laboratories (private research and development, 2004). He is Chairman of the General Motors Technology Advisory Committee and a Life Fellow of the Institute of Electrical and Electronics Engineers (IEEE) (2000). Dr. Heilmeier is a member of the Defense Science Board and the National Security Agency Advisory Board. He is also a member of the National Academy of Engineering, the American Academy of Arts and Sciences, and the Board of Overseers of the School of Engineering and Applied Science of the University of Pennsylvania. Previously, Dr. Heilmeier served as a Director of TRW Inc. (automotive, space, defense, and information technology, 1992-2002), Compaq (1994-2002), and Automatic Data Processing, Inc. (ADP) (technology-based business outsourcing, 1995-2002). |
Marie L. Knowles (58) |
| Year of Election or Appointment: 2001 Prior to Ms. Knowles' retirement in June 2000, she served as Executive Vice President and Chief Financial Officer of Atlantic Richfield Company (ARCO) (diversified energy, 1996-2000). From 1993 to 1996, she was a Senior Vice President of ARCO and President of ARCO Transportation Company. She served as a Director of ARCO from 1996 to 1998. She currently serves as a Director of Phelps Dodge Corporation (copper mining and manufacturing) and McKesson Corporation (healthcare service, 2002). Ms. Knowles is a Trustee of the Brookings Institution and the Catalina Island Conservancy and also serves as a member of the Advisory Board for the School of Engineering of the University of Southern California. |
Ned C. Lautenbach (60) |
| Year of Election or Appointment: 2000 Mr. Lautenbach has been a partner of Clayton, Dubilier & Rice, Inc. (private equity investment firm) since September 1998. Previously, Mr. Lautenbach was with the International Business Machines Corporation (IBM) from 1968 until his retirement in 1998. He was most recently Senior Vice President and Group Executive of Worldwide Sales and Services. From 1993 to 1995, he was Chairman of IBM World Trade Corporation, and from 1994 to 1998 was a member of IBM's Corporate Executive Committee. Mr. Lautenbach serves as Co-Chairman and a Director of Covansys, Inc. (global provider of business and technology solutions, 2000). In addition, he is a Director of Italtel Holding S.p.A. (telecommunications (Milan, Italy), 2004) and Eaton Corporation (diversified industrial) as well as the Philharmonic Center for the Arts in Naples, Florida (1999). He also is a member of the Council on Foreign Relations. |
Marvin L. Mann (71) |
| Year of Election or Appointment: 1993 Mr. Mann is Chairman of the non-interested Trustees (2001). He is Chairman Emeritus of Lexmark International, Inc. (computer peripherals), where he served as CEO until April 1998, retired as Chairman May 1999, and remains a member of the Board. Prior to 1991, he held the positions of Vice President of International Business Machines Corporation (IBM) and President and General Manager of various IBM divisions and subsidiaries. He is a member of the Executive Committee of the Independent Director's Council of the Investment Company Institute. In addition, Mr. Mann is a member of the President's Cabinet at the University of Alabama and the Board of Visitors of the Culverhouse College of Commerce and Business Administration at the University of Alabama. |
William O. McCoy (71) |
| Year of Election or Appointment: 1997 Prior to his retirement in December 1994, Mr. McCoy was Vice Chairman of the Board of BellSouth Corporation (telecommunications) and President of BellSouth Enterprises. He is currently a Director of Liberty Corporation (holding company), Duke Realty Corporation (real estate), and Progress Energy, Inc. (electric utility). He is also a partner of Franklin Street Partners (private investment management firm) and a member of the Research Triangle Foundation Board. In addition, Mr. McCoy served as the Interim Chancellor (1999-2000) and a member of the Board of Visitors (1994-1998) for the University of North Carolina at Chapel Hill and currently serves on the Board of Directors of the University of North Carolina Health Care System and the Board of Visitors of the Kenan-Flagler Business School (University of North Carolina at Chapel Hill). He also served as Vice President of Finance for the University of North Carolina (16-school system, 1995-1998). |
Cornelia M. Small (60) |
| Year of Election or Appointment: 2005 Ms. Small is a member (2000) and Chairperson (2002) of the Investment Committee, and a member (2002) of the Board of Trustees of Smith College. Previously, she served as Chief Investment Officer (1999-2000), Director of Global Equity Investments (1996-1999), and a member of the Board of Directors of Scudder, Stevens & Clark (1990-1997) and Scudder Kemper Investments (1997-1998). In addition, Ms. Small served as Co-Chair (2000-2003) of the Annual Fund for the Fletcher School of Law and Diplomacy. |
William S. Stavropoulos (65) |
| Year of Election or Appointment: 2001 Mr. Stavropoulos is Chairman of the Board (2000), CEO (2002), a position he previously held from 1995-2000, Chairman of the Executive Committee (2000), and a Member of the Board of Directors of The Dow Chemical Company. Since joining The Dow Chemical Company in 1967, Mr. Stavropoulos served in numerous senior management positions, including President (1993-2000; 2002-2003). Currently, he is a Director of NCR Corporation (data warehousing and technology solutions), BellSouth Corporation (telecommunications), Chemical Financial Corporation, and Maersk Inc. (industrial conglomerate, 2002). He also serves as a member of the Board of Trustees of the American Enterprise Institute for Public Policy Research. In addition, Mr. Stavropoulos is a member of The Business Council, J.P. Morgan International Council and the University of Notre Dame Advisory Council for the College of Science. |
Kenneth L. Wolfe (65) |
| Year of Election or Appointment: 2005 Mr. Wolfe also serves as a Trustee (2005) or Member of the Advisory Board (2004) of other investment companies advised by FMR. Prior to his retirement in 2001, Mr. Wolfe was Chairman and Chief Executive Officer of Hershey Foods Corporation (1993-2001). He currently serves as a member of the boards of Adelphia Communications Corporation (2003), Bausch & Lomb, Inc., and Revlon Inc. (2004). |
Annual Report
Trustees and Officers - continued
Advisory Board Member and Executive Officers:
Correspondence intended for each executive officer and Mr. Lynch may be sent to Fidelity Investments, 82 Devonshire Street, Boston, Massachusetts 02109.
Name, Age; Principal Occupation |
Peter S. Lynch (61) |
| Year of Election or Appointment: 2003 Member of the Advisory Board of Variable Insurance Products Fund IV. Vice Chairman and a Director of FMR, and Vice Chairman (2001) and a Director (2000) of FMR Co., Inc. Previously, Mr. Lynch served as a Trustee of the Fidelity funds (1990-2003). Prior to May 31, 1990, he was a Director of FMR and Executive Vice President of FMR (a position he held until March 31, 1991), Vice President of Fidelity® Magellan® Fund and FMR Growth Group Leader, and Managing Director of FMR Corp. Mr. Lynch was also Vice President of Fidelity Investments Corporate Services. In addition, he serves as a Trustee of Boston College, Massachusetts Eye & Ear Infirmary, Historic Deerfield, John F. Kennedy Library, and the Museum of Fine Arts of Boston. |
Eric D. Roiter (56) |
| Year of Election or Appointment: 2001 Secretary of VIP Consumer Industries, VIP Cyclical Industries, VIP Financial Services, VIP Health Care, VIP Natural Resources VIP Technology, and VIP Telecommunications & Utilities Growth. He also serves as Secretary of other Fidelity funds; Vice President, General Counsel, and Secretary of FMR Co., Inc. (2001-present) and FMR; Vice President and Secretary of FDC; Assistant Secretary of Fidelity Management & Research (U.K.) Inc. (2001-present), Fidelity Management & Research (Far East) Inc. (2001-present), and Fidelity Investments Money Management, Inc. (2001-present). Mr. Roiter is an Adjunct Member, Faculty of Law, at Boston College Law School (2003-present). |
Stuart Fross (45) |
| Year of Election or Appointment: 2003 Assistant Secretary of VIP Consumer Industries, VIP Cyclical Industries, VIP Financial Services, VIP Health Care, VIP Natural Resources VIP Technology, and VIP Telecommunications & Utilities Growth. Mr. Fross also serves as Assistant Secretary of other Fidelity funds (2003) and is an employee of FMR. |
Christine Reynolds (46) |
| Year of Election or Appointment: 2004 President, Treasurer, and Anti-Money Laundering (AML) officer of VIP Consumer Industries, VIP Cyclical Industries, VIP Financial Services, VIP Health Care, VIP Natural Resources VIP Technology, and VIP Telecommunications & Utilities Growth. Ms. Reynolds also serves as President, Treasurer, and AML officer of other Fidelity funds (2004) and is a Vice President (2003) and an employee (2002) of FMR. Before joining Fidelity Investments, Ms. Reynolds worked at PricewaterhouseCoopers LLP (PwC) (1980-2002), where she was most recently an audit partner with PwC's investment management practice. |
Timothy F. Hayes (54) |
| Year of Election or Appointment:2002 Chief Financial Officer of VIP Consumer Industries, VIP Cyclical Industries, VIP Financial Services, VIP Health Care, VIP Natural Resources VIP Technology, and VIP Telecommunications & Utilities Growth. Mr. Hayes also serves as Chief Financial Officer of other Fidelity funds (2002). Recently he was appointed President of Fidelity Service Company (2003) where he also serves as a Director. Mr. Hayes also serves as President of Fidelity Investments Operations Group (FIOG, 2002), which includes Fidelity Pricing and Cash Management Services Group (FPCMS), where he was appointed President in 1998. Previously, Mr. Hayes served as Chief Financial Officer of Fidelity Investments Corporate Systems and Service Group (1998) and Fidelity Systems Company (1997-1998). |
Kenneth A. Rathgeber (57) |
| Year of Election or Appointment: 2004 Chief Compliance Officer of VIP Consumer Industries, VIP Cyclical Industries, VIP Financial Services, VIP Health Care, VIP Natural Resources VIP Technology, and VIP Telecommunications & Utilities Growth. Mr. Rathgeber also serves as Chief Compliance Officer of other Fidelity funds (2004) and Executive Vice President of Risk Oversight for Fidelity Investments (2002). Previously, he served as Executive Vice President and Chief Operating Officer for Fidelity Investments Institutional Services Company, Inc. (1998-2002). |
John R. Hebble (46) |
| Year of Election or Appointment: 2003 Deputy Treasurer of VIP Consumer Industries, VIP Cyclical Industries, VIP Financial Services, VIP Health Care, VIP Natural Resources VIP Technology, and VIP Telecommunications & Utilities Growth. Mr. Hebble also serves as Deputy Treasurer of other Fidelity funds (2003), and is an employee of FMR. Before joining Fidelity Investments, Mr. Hebble worked at Deutsche Asset Management where he served as Director of Fund Accounting (2002-2003) and Assistant Treasurer of the Scudder Funds (1998-2003). |
Kimberley H. Monasterio (41) |
| Year of Election or Appointment: 2004 Deputy Treasurer of VIP Consumer Industries, VIP Cyclical Industries, VIP Financial Services, VIP Health Care, VIP Natural Resources VIP Technology, and VIP Telecommunications & Utilities Growth. Ms. Monasterio also serves as Deputy Treasurer of other Fidelity funds (2004) and is an employee of FMR (2004). Before joining Fidelity Investments, Ms. Monasterio served as Treasurer (2000-2004) and Chief Financial Officer (2002-2004) of the Franklin Templeton Funds and Senior Vice President of Franklin Templeton Services, LLC (2000-2004). |
John H. Costello (58) |
| Year of Election or Appointment: 2001 Assistant Treasurer of VIP Consumer Industries, VIP Cyclical Industries, VIP Financial Services, VIP Health Care, VIP Natural Resources VIP Technology, and VIP Telecommunications & Utilities Growth. Mr. Costello also serves as Assistant Treasurer of other Fidelity funds and is an employee of FMR. |
Peter L. Lydecker (50) |
| Year of Election or Appointment: 2004 Assistant Treasurer of VIP Consumer Industries, VIP Cyclical Industries, VIP Financial Services, VIP Health Care, VIP Natural Resources VIP Technology, and VIP Telecommunications & Utilities Growth. Mr. Lydecker also serves as Assistant Treasurer of other Fidelity funds (2004) and is an employee of FMR. |
Mark Osterheld (49) |
| Year of Election or Appointment: 2002 Assistant Treasurer of VIP Consumer Industries, VIP Cyclical Industries, VIP Financial Services, VIP Health Care, VIP Natural Resources VIP Technology, and VIP Telecommunications & Utilities Growth. Mr. Osterheld also serves as Assistant Treasurer of other Fidelity funds (2002) and is an employee of FMR. |
Kenneth B. Robins (35) |
| Year of Election or Appointment: 2004 Assistant Treasurer of VIP Consumer Industries, VIP Cyclical Industries, VIP Financial Services, VIP Health Care, VIP Natural Resources VIP Technology, and VIP Telecommunications & Utilities Growth. Mr. Robins also serves as Assistant Treasurer of other Fidelity funds (2004) and is an employee of FMR (2004). Before joining Fidelity Investments, Mr. Robins worked at KPMG LLP, where he was a partner in KPMG's department of professional practice (2002-2004) and a Senior Manager (1999-2000). In addition, Mr. Robins served as Assistant Chief Accountant, United States Securities and Exchange Commission (2000-2002). |
Annual Report
Distributions
The Board of Trustees of each fund voted to pay to shareholders of record at the opening of business on record date, the following distributions per share derived from capital gains realized from sales of portfolio securities, and dividends derived from net investment income:
Fund | Pay Date | Record Date | Dividends | Capital Gains |
Cyclical Industries | 2/11/05 | 2/11/05 | $.01 | $.05 |
Financial Services | 2/11/05 | 2/11/05 | $.14 | $- |
Health Care | 2/11/05 | 2/11/05 | $.025 | $- |
Natural Resources | 2/11/05 | 2/11/05 | $- | $.015 |
Technology | 2/11/05 | 2/11/05 | $.035 | $- |
A percentage of the dividends distributed during the fiscal year for the following funds qualifies for the dividends-received deduction for corporate shareholders:
Health Care | 100% |
Telecommunications & Utilities Growth | 100% |
The funds will notify shareholders in January 2005 of amounts for use in preparing 2004 income tax returns.
Annual Report
Proxy Voting Results
A special meeting of each fund's shareholders was held on December 14, 2004. The results of votes taken among shareholders on proposals before them are reported below. Each vote reported represents one dollar of net asset value held on the record date for the meeting.
PROPOSAL 1 |
To amend the Declaration of Trust to allow the Board of Trustees, if permitted by applicable law, to authorize fund mergers without shareholder approval. A |
| # of
Votes | % of
Votes |
Affirmative | 458,190,063.70 | 83.431 |
Against | 70,246,908.89 | 12.791 |
Abstain | 20,745,786.74 | 3.778 |
TOTAL | 549,182,759.33 | 100.000 |
PROPOSAL 2 |
To elect a Board of Trustees. A |
| # of
Votes | % of
Votes |
J. Michael Cook |
Affirmative | 521,583,205.95 | 94.974 |
Withheld | 27,599,553.38 | 5.026 |
TOTAL | 549,182,759.33 | 100.000 |
Ralph F. Cox |
Affirmative | 519,150,329.49 | 94.531 |
Withheld | 30,032,429.84 | 5.469 |
TOTAL | 549,182,759.33 | 100.000 |
Laura B. Cronin |
Affirmative | 520,911,931.53 | 94.852 |
Withheld | 28,270,827.80 | 5.148 |
TOTAL | 549,182,759.33 | 100.000 |
Dennis J. Dirks B |
Affirmative | 521,590,729.90 | 94.976 |
Withheld | 27,592,029.43 | 5.024 |
TOTAL | 549,182,759.33 | 100.000 |
Robert M. Gates |
Affirmative | 519,905,480.12 | 94.669 |
Withheld | 29,277,279.21 | 5.331 |
TOTAL | 549,182,759.33 | 100.000 |
George H. Heilmeier |
Affirmative | 520,921,777.54 | 94.854 |
Withheld | 28,260,981.79 | 5.146 |
TOTAL | 549,182,759.33 | 100.000 |
Abigail P. Johnson |
Affirmative | 519,065,339.91 | 94.516 |
Withheld | 30,117,419.42 | 5.484 |
TOTAL | 549,182,759.33 | 100.000 |
Edward C. Johnson 3d |
Affirmative | 518,847,346.05 | 94.476 |
Withheld | 30,335,413.28 | 5.524 |
TOTAL | 549,182,759.33 | 100.000 |
Donald J. Kirk |
Affirmative | 521,181,241.00 | 94.901 |
Withheld | 28,001,518.33 | 5.099 |
TOTAL | 549,182,759.33 | 100.000 |
| # of
Votes | % of
Votes |
Marie L. Knowles |
Affirmative | 521,391,176.23 | 94.939 |
Withheld | 27,791,583.10 | 5.061 |
TOTAL | 549,182,759.33 | 100.000 |
Ned C. Lautenbach |
Affirmative | 521,804,568.92 | 95.015 |
Withheld | 27,378,190.41 | 4.985 |
TOTAL | 549,182,759.33 | 100.000 |
Marvin L. Mann |
Affirmative | 520,497,408.02 | 94.777 |
Withheld | 28,685,351.31 | 5.223 |
TOTAL | 549,182,759.33 | 100.000 |
William O. McCoy |
Affirmative | 520,233,312.84 | 94.729 |
Withheld | 28,949,446.49 | 5.271 |
TOTAL | 549,182,759.33 | 100.000 |
Robert L. Reynolds |
Affirmative | 521,415,834.89 | 94.944 |
Withheld | 27,766,924.44 | 5.056 |
TOTAL | 549,182,759.33 | 100.000 |
Cornelia M. Small B |
Affirmative | 521,014,631.05 | 94.871 |
Withheld | 28,168,128.28 | 5.129 |
TOTAL | 549,182,759.33 | 100.000 |
William S. Stavropoulos |
Affirmative | 520,522,282.96 | 94.781 |
Withheld | 28,660,476.37 | 5.219 |
TOTAL | 549,182,759.33 | 100.000 |
A Denotes trust-wide proposals and voting results. B Effective January 1, 2005. |
Annual Report
Investment Adviser
Fidelity Management & Research Company
Boston, MA
Investment Sub-Advisers
FMR Co., Inc.
Fidelity Management & Research (U.K.) Inc.
Fidelity Management & Research (Far East) Inc.
Fidelity Investments Japan Limited
Fidelity International Investment Advisors
Fidelity International Investment Advisors
(U.K.) Limited
General Distributor
Fidelity Distributors Corporation
Boston, MA
Transfer and Shareholder Servicing Agent
Fidelity Investments Institutional Operations Company, Inc.
Boston, MA
Custodians
JPMorgan Chase Bank
New York, NY
State Street Bank & Trust Co.
Quincy, MA
VIPFCI-ANN-0205
1.768901.103
Fidelity® Variable Insurance Products:
Growth Stock Portfolio
Annual Report
December 31, 2004
(2_fidelity_logos) (Registered_Trademark)
Contents
Performance | 3 | How the fund has done over time. |
Management's Discussion | 4 | The manager's review of fund performance, strategy and outlook. |
Shareholder Expense Example | 5 | An example of shareholder expenses. |
Investment Summary | 7 | A summary of the fund's investments at period end. |
Investments | 8 | A complete list of the fund's investments with their
market values. |
Financial Statements | 10 | Statements of assets and liabilities, operations, and
changes in net assets, as well as financial highlights. |
Notes | 14 | Notes to the financial statements. |
Report of Independent Registered Public Accounting Firm | 17 | |
Trustees and Officers | 18 | |
Distributions | 23 | |
Proxy Voting Results | 24 | |
To view a fund's proxy voting guidelines and proxy voting record for the 12-month period ended June 30, visit www.fidelity.com/proxyvotingresults or visit the Securities and Exchange Commission's (SEC) web site at www.sec.gov. You may also call 1-800-544-5429 to request a free copy of the proxy voting guidelines.
Fidelity Variable Insurance Products are separate account options which are purchased through a variable insurance contract.
Standard & Poor's, S&P and S&P 500 are registered service marks of The McGraw-Hill Companies, Inc. and have been licensed for use by Fidelity Distributors Corporation.
Other third party marks appearing herein are the property of their respective owners.
All other marks appearing herein are registered or unregistered trademarks or service marks of FMR Corp. or an affiliated company.
(Recycle graphic) This report is printed on recycled paper using soy-based inks.
This report and the financial statements contained herein are submitted for the general information of the shareholders of the fund. This report is not authorized for distribution to prospective investors in the fund unless preceded or accompanied by an effective prospectus.
A fund files its complete schedule of portfolio holdings with the SEC for the first and third quarters of each fiscal year on Form N-Q. Forms N-Q are available on the SEC's web site at http://www.sec.gov. A fund's Forms N-Q may be reviewed and copied at the SEC's Public Reference Room in Washington, DC. Information regarding the operation of the SEC's Public Reference Room may be obtained by calling 1-800-SEC-0330. For a complete list of a fund's portfolio holdings, view the most recent quarterly holdings report, semiannual report, or annual report on Fidelity's web site at http://www.advisor.fidelity.com.
NOT FDIC INSURED · MAY LOSE VALUE · NO BANK GUARANTEE
Neither the fund nor Fidelity Distributors Corporation is a bank.
Growth Stock Portfolio
Fidelity Variable Insurance Products: Growth Stock Portfolio
Performance: The Bottom Line
Average annual total return reflects the change in the value of an investment, assuming reinvestment of the class' dividend income and capital gains (the profits earned upon the sale of securities that have grown in value) and assuming a constant rate of performance each year. During periods of reimbursement by Fidelity, a fund's total return will be greater than it would be had the reimbursement not occurred. Performance numbers are net of all underlying fund operating expenses, but do not include any insurance charges imposed by your insurance company's separate account. If performance information included the effect of these additional charges, the total returns would have been lower. How a fund did yesterday is no guarantee of how it will do tomorrow.
Average Annual Total Returns
Periods ended December 31, 2004 | | Past 1
year | Life of
fund A |
Fidelity® VIP: Growth Stock - Initial Class | | 2.31% | 12.66% |
Fidelity VIP: Growth Stock - Service Class B | | 2.32% | 12.58% |
Fidelity VIP: Growth Stock - Service Class 2 C | | 2.14% | 12.40% |
A From December 11, 2002
B Performance for Service Class shares reflects an asset-based service fee (12b-1 fee).
C Performance for Service Class 2 shares reflects an asset-based service fee (12b-1 fee).
$10,000 Over Life of Fund
Let's say hypothetically that $10,000 was invested in Fidelity ® Variable Insurance Products: Growth Stock Portfolio - Initial Class on December 11, 2002, when the fund started. The chart shows how the value of your investment would have changed, and also shows how the Russell 1000® Growth Index performed over the same period.
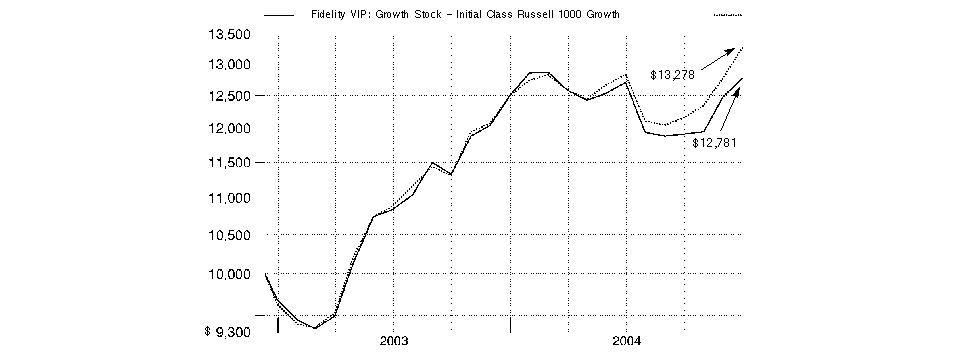
Annual Report
Fidelity Variable Insurance Products: Growth Stock Portfolio
Management's Discussion of Fund Performance
Comments from Brian Hanson, Portfolio Manager of Fidelity® Variable Insurance Products: Growth Stock Portfolio
The year ending December 31, 2004, generally was positive for equity investors, as many stock market benchmarks produced double-digit gains. Broad-based themes included the continued dominance of small-cap stocks, which outperformed large-caps for the sixth consecutive year. The small-cap Russell 2000® Index was up 18.33% in 2004, while the larger-cap Standard & Poor's 500SM Index rose 10.88%. Value stocks ended the year well ahead of growth stocks: The Russell 3000® Value Index advanced 16.94%, compared to 6.93% for the Russell 3000 Growth Index. Energy and basic materials stocks led the market upward. Energy stocks were boosted by record-high oil prices, while strong demand from China helped support commodity prices. The health care sector was among the market's weakest performers. Technology also fell off the pace, though it was helped by a rally late in the year. The tech-heavy NASDAQ Composite® Index returned 9.15%, thanks primarily to a 14.87% jump in the fourth quarter. Elsewhere, the Dow Jones Industrial AverageSM gained 5.37% for the year.
For the 12 months that ended on December 31, 2004, the fund trailed the Russell 1000® Growth Index, which gained 6.30%, and significantly underperformed the LipperSM Variable Annuity Growth Funds Average, which rose 10.36%. The fund lagged its benchmarks mainly because of its bias toward large-cap growth stocks, which have been underperforming the more rapidly advancing small- and mid-cap growth stocks during this stage of the business cycle. Underweighting the retail space, which generally did well during the period, and overweighting pharmaceuticals, which performed poorly, also held back performance. Among stocks that hurt, chipmaker Intersil was the biggest detractor versus the index, missing its goal of surpassing industry-average earnings. Underweightings in better-than-expected performers Home Depot, pharmaceutical giant Johnson & Johnson and wireless technology pioneer QUALCOMM also hurt performance. Neither Home Depot nor QUALCOMM was held in the portfolio at period end. Contributors included Solectron, the electronics contract manufacturer, and BJ Services, an oil services provider, both of which benefited from positive industry-specific trends.
The views expressed in this statement reflect those of the portfolio manager only through the end of the period of the report as stated on the cover and do not necessarily represent the views of Fidelity or any other person in the Fidelity organization. Any such views are subject to change at any time based upon market or other conditions and Fidelity disclaims any responsibility to update such views. These views may not be relied on as investment advice and, because investment decisions for a Fidelity fund are based on numerous factors, may not be relied on as an indication of trading intent on behalf of any Fidelity fund.
Annual Report
Fidelity Variable Insurance Products: Growth Stock Portfolio
Shareholder Expense Example
As a shareholder of the Fund, you incur two types of costs: (1) transaction costs, and (2) ongoing costs, including management fees, distribution and/or service (12b-1) fees and other Fund expenses. This Example is intended to help you understand your ongoing costs (in dollars) of investing in the Fund and to compare these costs with the ongoing costs of investing in other mutual funds.
The Example is based on an investment of $1,000 invested at the beginning of the period and held for the entire period (July 1, 2004 to December 31, 2004).
Actual Expenses
The first line of the table below for each class of the Fund provides information about actual account values and actual expenses. You may use the information in this line, together with the amount you invested, to estimate the expenses that you paid over the period. Simply divide your account value by $1,000.00 (for example, an $8,600 account value divided by $1,000.00 = 8.6), then multiply the result by the number in the first line for a class of the Fund under the heading entitled "Expenses Paid During Period" to estimate the expenses you paid on your account during this period. The estimate of expenses does not include any fees or other expenses of any variable annuity or variable life insurance product. If they were, the estimate of expenses you paid during the period would be higher, and your ending account value would be lower.
Hypothetical Example for Comparison Purposes
The second line of the table below for each class of the Fund provides information about hypothetical account values and hypothetical expenses based on a Class' actual expense ratio and an assumed rate of return of 5% per year before expenses, which is not the Class' actual return. The hypothetical account values and expenses may not be used to estimate the actual ending account balance or expenses you paid for the period. You may use this information to compare the ongoing costs of investing in the Fund and other funds. To do so, compare this 5% hypothetical example with the 5% hypothetical examples that appear in the shareholder reports of the other funds. The estimate of expenses does not include any fees or other expenses of any variable annuity or variable life insurance product. If they were, the estimate of expenses you paid during the period would be higher, and your ending account value would be lower.
Please note that the expenses shown in the table are meant to highlight your ongoing costs only and do not reflect any transaction costs. Therefore, the second line of the table is useful in comparing ongoing costs only, and will not help you determine the relative total costs of owning different funds.
| Beginning
Account Value
July 1, 2004 | Ending
Account Value
December 31, 2004 | Expenses Paid
During Period*
July 1, 2004
to December 31, 2004 |
Initial Class | | | |
Actual | $ 1,000.00 | $ 1,005.50 | $ 5.04 ** |
Hypothetical A | $ 1,000.00 | $ 1,020.11 | $ 5.08 ** |
Service Class | | | |
Actual | $ 1,000.00 | $ 1,005.60 | $ 5.55 ** |
Hypothetical A | $ 1,000.00 | $ 1,019.61 | $ 5.58 ** |
Service Class 2 | | | |
Actual | $ 1,000.00 | $ 1,004.70 | $ 6.30 ** |
Hypothetical A | $ 1,000.00 | $ 1,018.85 | $ 6.34 ** |
A 5% return per year before expenses
* Expenses are equal to each Class' annualized expense ratio (shown in the table below); multiplied by the average account value over the period, multiplied by 184/366 (to reflect the one-half year period).
| Annualized
Expense Ratio |
Initial Class | 1.00% ** |
Service Class | 1.10% ** |
Service Class 2 | 1.25% ** |
** If changes to voluntary expense limitations effective February 1, 2005 had been in effect during the period, the annualized expense ratio and the expenses paid in the actual and hypothetical examples above would have been as follows:
Annual Report
| Annualized
Expense Ratio | Expenses
Paid |
Initial Class | .85% | |
Actual | | $ 4.29 |
HypotheticalA | | $ 4.32 |
Service Class | .95% | |
Actual | | $ 4.79 |
HypotheticalA | | $ 4.82 |
Service Class 2 | 1.10% | |
Actual | | $ 5.55 |
HypotheticalA | | $ 5.58 |
A 5% return per year before expenses
Growth Stock Portfolio
Fidelity Variable Insurance Products: Growth Stock Portfolio
Investment Summary
Top Five Stocks as of December 31, 2004 |
| % of fund's
net assets |
Dell, Inc. | 6.0 |
Microsoft Corp. | 3.9 |
Schering-Plough Corp. | 3.8 |
Johnson & Johnson | 3.5 |
Foot Locker, Inc. | 3.2 |
| 20.4 |
Top Five Market Sectors as of December 31, 2004 |
| % of fund's
net assets |
Information Technology | 31.8 |
Health Care | 23.0 |
Consumer Discretionary | 11.9 |
Energy | 7.9 |
Consumer Staples | 7.0 |
Asset Allocation as of December 31, 2004 |
% of fund's net assets * |
 | Stocks | 95.3% | |
 | Short-Term Investments and Net Other Assets | 4.7% | |
* Foreign investments 4.1% | |

Annual Report
Fidelity Variable Insurance Products: Growth Stock Portfolio
Investments December 31, 2004
Showing Percentage of Net Assets
Common Stocks - 95.3% |
| Shares | | Value (Note 1) |
CONSUMER DISCRETIONARY - 11.9% |
Automobiles - 0.7% |
Harley-Davidson, Inc. | 700 | | $ 42,525 |
Internet & Catalog Retail - 0.4% |
eBay, Inc. (a) | 200 | | 23,256 |
Media - 6.6% |
Fox Entertainment Group, Inc. Class A (a) | 1,100 | | 34,386 |
Getty Images, Inc. (a) | 1,000 | | 68,850 |
Lamar Advertising Co. Class A (a) | 2,800 | | 119,784 |
Radio One, Inc. Class D (non-vtg.) (a) | 1,400 | | 22,568 |
Spanish Broadcasting System, Inc. Class A (a) | 6,900 | | 72,864 |
Univision Communications, Inc. Class A (a) | 3,500 | | 102,445 |
| | 420,897 |
Specialty Retail - 4.2% |
Foot Locker, Inc. | 7,600 | | 204,668 |
RadioShack Corp. | 1,000 | | 32,880 |
Ross Stores, Inc. | 1,200 | | 34,644 |
| | 272,192 |
TOTAL CONSUMER DISCRETIONARY | | 758,870 |
CONSUMER STAPLES - 7.0% |
Beverages - 1.1% |
PepsiCo, Inc. | 1,400 | | 73,080 |
Food & Staples Retailing - 3.3% |
CVS Corp. | 1,100 | | 49,577 |
Wal-Mart Stores, Inc. | 3,100 | | 163,742 |
| | 213,319 |
Household Products - 2.6% |
Procter & Gamble Co. | 2,960 | | 163,037 |
TOTAL CONSUMER STAPLES | | 449,436 |
ENERGY - 7.9% |
Energy Equipment & Services - 7.0% |
BJ Services Co. | 3,000 | | 139,620 |
Halliburton Co. | 1,600 | | 62,784 |
Nabors Industries Ltd. (a) | 1,700 | | 87,193 |
National-Oilwell, Inc. (a) | 1,900 | | 67,051 |
Pride International, Inc. (a) | 2,800 | | 57,512 |
Varco International, Inc. (a) | 1,200 | | 34,980 |
| | 449,140 |
Oil & Gas - 0.9% |
Teekay Shipping Corp. | 600 | | 25,266 |
Valero Energy Corp. | 700 | | 31,780 |
| | 57,046 |
TOTAL ENERGY | | 506,186 |
|
| Shares | | Value (Note 1) |
FINANCIALS - 4.3% |
Capital Markets - 0.3% |
Harris & Harris Group, Inc. (a) | 1,200 | | $ 19,656 |
Commercial Banks - 1.3% |
Bank of America Corp. | 700 | | 32,893 |
Wachovia Corp. | 900 | | 47,340 |
| | 80,233 |
Consumer Finance - 0.5% |
American Express Co. | 600 | | 33,822 |
Insurance - 1.6% |
American International Group, Inc. | 1,600 | | 105,072 |
Thrifts & Mortgage Finance - 0.6% |
Golden West Financial Corp., Delaware | 600 | | 36,852 |
TOTAL FINANCIALS | | 275,635 |
HEALTH CARE - 23.0% |
Biotechnology - 2.8% |
Biogen Idec, Inc. (a) | 400 | | 26,644 |
Genentech, Inc. (a) | 900 | | 48,996 |
ImmunoGen, Inc. (a) | 4,300 | | 38,012 |
Millennium Pharmaceuticals, Inc. (a) | 4,200 | | 50,904 |
Protein Design Labs, Inc. (a) | 700 | | 14,462 |
| | 179,018 |
Health Care Equipment & Supplies - 5.9% |
Cholestech Corp. (a) | 2,600 | | 21,167 |
Guidant Corp. | 1,300 | | 93,730 |
Kinetic Concepts, Inc. | 400 | | 30,520 |
Medtronic, Inc. | 2,700 | | 134,109 |
ResMed, Inc. (a) | 400 | | 20,440 |
St. Jude Medical, Inc. (a) | 1,800 | | 75,474 |
| | 375,440 |
Health Care Providers & Services - 3.3% |
Cardinal Health, Inc. | 600 | | 34,890 |
McKesson Corp. | 2,000 | | 62,920 |
UnitedHealth Group, Inc. | 900 | | 79,227 |
WebMD Corp. (a) | 4,000 | | 32,640 |
| | 209,677 |
Pharmaceuticals - 11.0% |
Eli Lilly & Co. | 700 | | 39,725 |
Johnson & Johnson | 3,500 | | 221,970 |
Pfizer, Inc. | 2,500 | | 67,225 |
Schering-Plough Corp. | 11,700 | | 244,296 |
Watson Pharmaceuticals, Inc. (a) | 600 | | 19,686 |
Wyeth | 2,700 | | 114,993 |
| | 707,895 |
TOTAL HEALTH CARE | | 1,472,030 |
Common Stocks - continued |
| Shares | | Value (Note 1) |
INDUSTRIALS - 6.6% |
Aerospace & Defense - 2.4% |
Honeywell International, Inc. | 3,500 | | $ 123,935 |
The Boeing Co. | 500 | | 25,885 |
| | 149,820 |
Industrial Conglomerates - 1.0% |
General Electric Co. | 1,800 | | 65,700 |
Machinery - 1.1% |
Trinity Industries, Inc. | 2,000 | | 68,160 |
Road & Rail - 2.1% |
Burlington Northern Santa Fe Corp. | 1,400 | | 66,234 |
Norfolk Southern Corp. | 1,900 | | 68,761 |
| | 134,995 |
TOTAL INDUSTRIALS | | 418,675 |
INFORMATION TECHNOLOGY - 31.8% |
Communications Equipment - 2.1% |
Cisco Systems, Inc. (a) | 3,600 | | 69,480 |
Juniper Networks, Inc. (a) | 2,400 | | 65,256 |
| | 134,736 |
Computers & Peripherals - 7.8% |
Dell, Inc. (a) | 9,100 | | 383,473 |
UNOVA, Inc. (a) | 4,700 | | 118,863 |
| | 502,336 |
Electronic Equipment & Instruments - 7.3% |
Benchmark Electronics, Inc. (a) | 1,100 | | 37,510 |
Flextronics International Ltd. (a) | 10,100 | | 139,582 |
Jabil Circuit, Inc. (a) | 5,200 | | 133,016 |
National Instruments Corp. | 1,900 | | 51,775 |
Solectron Corp. (a) | 19,300 | | 102,869 |
| | 464,752 |
Internet Software & Services - 1.4% |
Yahoo!, Inc. (a) | 2,300 | | 86,664 |
Semiconductors & Semiconductor Equipment - 7.0% |
Analog Devices, Inc. | 1,000 | | 36,920 |
Applied Materials, Inc. (a) | 3,600 | | 61,560 |
Integrated Circuit Systems, Inc. (a) | 2,200 | | 46,024 |
Intersil Corp. Class A | 5,200 | | 87,048 |
LTX Corp. (a) | 9,100 | | 69,979 |
Micrel, Inc. (a) | 4,300 | | 47,386 |
Silicon Laboratories, Inc. (a) | 1,600 | | 56,496 |
Varian Semiconductor Equipment Associates, Inc. (a) | 1,200 | | 44,220 |
| | 449,633 |
Software - 6.2% |
Microsoft Corp. | 9,200 | | 245,732 |
|
| Shares | | Value (Note 1) |
Quest Software, Inc. (a) | 7,300 | | $ 116,435 |
Siebel Systems, Inc. (a) | 3,300 | | 34,650 |
| | 396,817 |
TOTAL INFORMATION TECHNOLOGY | | 2,034,938 |
MATERIALS - 2.8% |
Chemicals - 2.6% |
NOVA Chemicals Corp. | 2,000 | | 94,500 |
PolyOne Corp. (a) | 8,100 | | 73,386 |
| | 167,886 |
Metals & Mining - 0.2% |
Freeport-McMoRan Copper & Gold, Inc. Class B | 300 | | 11,469 |
TOTAL MATERIALS | | 179,355 |
TOTAL COMMON STOCKS (Cost $5,544,728) | 6,095,125 |
Money Market Funds - 5.2% |
| | | |
Fidelity Cash Central Fund, 2.24% (b)
(Cost $332,706) | 332,706 | | 332,706 |
TOTAL INVESTMENT PORTFOLIO - 100.5% (Cost $5,877,434) | | 6,427,831 |
NET OTHER ASSETS - (0.5)% | | (32,548) |
NET ASSETS - 100% | $ 6,395,283 |
Legend |
(a) Non-income producing |
(b) Affiliated fund that is available only to investment companies and other accounts managed by Fidelity Investments. The rate quoted is the annualized seven-day yield of the fund at period end. A complete listing of the fund's holdings as of its most recent fiscal year end is available upon request. |
Income Tax Information |
The fund hereby designates as capital gain dividends: For dividends with respect to the taxable year ended December 31, 2004, $145,122 or, if different, the net capital gain of such year; and for dividends with respect to the taxable year ended December 31, 2003, $2,925, or, if different, the excess of: (a) the net capital gain of such year, over (b) amounts previously designated as capital gain dividends with respect to such year. |
See accompanying notes which are an integral part of the financial statements.
Growth Stock Portfolio
Fidelity Variable Insurance Products: Growth Stock Portfolio
Financial Statements
Statement of Assets and Liabilities
| December 31, 2004 |
| | |
Assets | | |
Investment in securities, at value (cost $5,877,434) - See accompanying schedule | | $ 6,427,831 |
Receivable for investments sold | | 26,076 |
Dividends receivable | | 1,707 |
Interest receivable | | 505 |
Prepaid expenses | | 24 |
Receivable from investment adviser for expense reductions | | 4,082 |
Other receivables | | 881 |
Total assets | | 6,461,106 |
| | |
Liabilities | | |
Payable to custodian bank | $ 18,319 | |
Payable for investments purchased | 12,678 | |
Accrued management fee | 3,025 | |
Distribution fees payable | 683 | |
Other affiliated payables | 3,102 | |
Other payables and accrued expenses | 28,016 | |
Total liabilities | | 65,823 |
| | |
Net Assets | | $ 6,395,283 |
Net Assets consist of: | | |
Paid in capital | | $ 5,862,767 |
Undistributed net investment income | | 2,529 |
Accumulated undistributed net realized gain (loss) on investments and foreign currency transactions | | (20,410) |
Net unrealized appreciation (depreciation) on investments | | 550,397 |
Net Assets | | $ 6,395,283 |
| | |
Initial Class:
Net Asset Value, offering price and redemption price per share ($1,938,023 ÷ 173,929 shares) | | $ 11.14 |
| | |
Service Class:
Net Asset Value, offering price and redemption price per share ($1,913,624 ÷ 172,141 shares) | | $ 11.12 |
| | |
Service Class 2:
Net Asset Value, offering price and redemption price per share ($2,543,636 ÷ 229,585 shares) | | $ 11.08 |
Statement of Operations
| Year ended December 31, 2004 |
| | |
Investment Income | | |
Dividends | | $ 50,925 |
Special Dividends | | 27,600 |
Interest | | 2,177 |
Total income | | 80,702 |
| | |
Expenses | | |
Management fee | $ 35,639 | |
Transfer agent fees | 5,395 | |
Distribution fees | 8,029 | |
Accounting fees and expenses | 33,001 | |
Non-interested trustees' compensation | 34 | |
Custodian fees and expenses | 7,267 | |
Audit | 34,825 | |
Legal | 89 | |
Miscellaneous | 890 | |
Total expenses before reductions | 125,169 | |
Expense reductions | (58,104) | 67,065 |
Net investment income (loss) | | 13,637 |
Realized and Unrealized Gain (Loss) Net realized gain (loss) on: | | |
Investment securities | 297,058 | |
Foreign currency transactions | 145 | |
Total net realized gain (loss) | | 297,203 |
Change in net unrealized appreciation (depreciation) on: Investment securities | (171,294) | |
Assets and liabilities in foreign currencies | (2) | |
Total change in net unrealized appreciation (depreciation) | | (171,296) |
Net gain (loss) | | 125,907 |
Net increase (decrease) in net assets resulting from operations | | $ 139,544 |
See accompanying notes which are an integral part of the financial statements.
Annual Report
Fidelity Variable Insurance Products: Growth Stock Portfolio
Financial Statements - continued
Statement of Changes in Net Assets
| Year ended
December 31,
2004 | Year ended
December 31,
2003 |
Increase (Decrease) in Net Assets | | |
Operations | | |
Net investment income (loss) | $ 13,637 | $ (11,094) |
Net realized gain (loss) | 297,203 | 536,643 |
Change in net unrealized appreciation (depreciation) | (171,296) | 872,201 |
Net increase (decrease) in net assets resulting from operations | 139,544 | 1,397,750 |
Distributions to shareholders from net investment income | (10,928) | (5,000) |
Distributions to shareholders from net realized gain | (488,248) | (341,023) |
Total distributions | (499,176) | (346,023) |
Share transactions - net increase (decrease) | 507,259 | 355,850 |
Total increase (decrease) in net assets | 147,627 | 1,407,577 |
| | |
Net Assets | | |
Beginning of period | 6,247,656 | 4,840,079 |
End of period (including undistributed net investment income of $2,529 and $0, respectively) | $ 6,395,283 | $ 6,247,656 |
Other Information: | | | |
Share Transactions | Year ended December 31, 2004 |
Shares | Initial Class | Service Class | Service Class 2 |
Sold | 1,124 | - | - |
Reinvested | 13,278 | 13,189 | 17,628 |
Redeemed | (425) | - | - |
Net increase (decrease) | 13,977 | 13,189 | 17,628 |
| | | |
Dollars Sold | $ 12,923 | $ - | $ - |
Reinvested | 150,698 | 149,337 | 199,141 |
Redeemed | (4,840) | - | - |
Net increase (decrease) | $ 158,781 | $ 149,337 | $ 199,141 |
Share Transactions | Year ended December 31, 2003 |
Shares | Initial Class | Service Class | Service Class 2 |
Sold | 2,425 | - | - |
Reinvested | 8,994 | 8,952 | 11,957 |
Redeemed | (1,468) | - | - |
Net increase (decrease) | 9,951 | 8,952 | 11,957 |
| | | |
Dollars Sold | $ 27,406 | $ - | $ - |
Reinvested | 104,262 | 103,612 | 138,149 |
Redeemed | (17,579) | - | - |
Net increase (decrease) | $ 114,089 | $ 103,612 | $ 138,149 |
Distributions | Year ended December 31, 2004 |
| Initial Class | Service Class | Service Class 2 |
From net investment income | $ 3,302 | $ 3,268 | $ 4,358 |
From net realized gain | 147,396 | 146,069 | 194,783 |
Total | $ 150,698 | $ 149,337 | $ 199,141 |
| Year ended December 31, 2003 |
| Initial Class | Service Class | Service Class 2 |
From net investment income | $ 1,500 | $ 1,500 | $ 2,000 |
From net realized gain | 102,762 | 102,112 | 136,149 |
Total | $ 104,262 | $ 103,612 | $ 138,149 |
See accompanying notes which are an integral part of the financial statements.
Growth Stock Portfolio
Financial Highlights - Initial Class
Years ended December 31, | 2004 | 2003 | 2002 G |
Selected Per-Share Data | | | |
Net asset value, beginning of period | $ 11.79 | $ 9.68 | $ 10.00 |
Income from Investment Operations | | | |
Net investment income (loss) E | .04 F | (.01) | - I |
Net realized and unrealized gain (loss) | .23 | 2.81 | (.32) |
Total from investment operations | .27 | 2.80 | (.32) |
Distributions from net investment income | (.02) | (.01) | - |
Distributions from net realized gain | (.90) | (.68) | - |
Total distributions | (.92) | (.69) | - |
Net asset value, end of period | $ 11.14 | $ 11.79 | $ 9.68 |
Total Return B, C, D | 2.31% | 29.05% | (3.20)% |
Ratios to Average Net Assets H | | | |
Expenses before expense reductions | 1.94% | 2.68% | 9.76% A |
Expenses net of voluntary waivers, if any | 1.00% | 1.14% | 1.25% A |
Expenses net of all reductions | .95% | 1.09% | 1.22% A |
Net investment income (loss) | .35% | (.07)% | .35% A |
Supplemental Data | | | |
Net assets, end of period (000 omitted) | $ 1,938 | $ 1,885 | $ 1,452 |
Portfolio turnover rate | 151% | 149% | 108% A |
A Annualized
B Total returns for periods of less than one year are not annualized.
C Total returns do not reflect charges attributable to your insurance company's separate account. Inclusion of these charges would reduce the total returns shown.
D Total returns would have been lower had certain expenses not been reduced during the periods shown.
E Calculated based on average shares outstanding during the period.
F Investment income per share reflects a special dividend which amounted to $.05 per share.
G For the period December 11, 2002 (commencement of operations) to December 31, 2002.
H Expense ratios reflect operating expenses of the class. Expenses before reductions do not reflect amounts reimbursed by the investment adviser or reductions from brokerage service arrangements or other expense offset arrangements and do not represent the amount paid by the class during periods when reimbursements or reductions occur. Expense ratios before reductions for start-up periods may not be representative of longer-term operating periods. Expenses net of any voluntary waivers reflect expenses after reimbursement by the investment adviser but prior to reductions from brokerage service arrangements or other expense offset arrangements. Expenses net of all reductions represent the net expenses paid by the class.
I Amount represents less than $.01 per share.
Financial Highlights - Service Class
Years ended December 31, | 2004 | 2003 | 2002 G |
Selected Per-Share Data | | | |
Net asset value, beginning of period | $ 11.77 | $ 9.68 | $ 10.00 |
Income from Investment Operations | | | |
Net investment income (loss) E | .03 F | (.02) | - I |
Net realized and unrealized gain (loss) | .24 | 2.80 | (.32) |
Total from investment operations | .27 | 2.78 | (.32) |
Distributions from net investment income | (.02) | (.01) | - |
Distributions from net realized gain | (.90) | (.68) | - |
Total distributions | (.92) | (.69) | - |
Net asset value, end of period | $ 11.12 | $ 11.77 | $ 9.68 |
Total Return B, C, D | 2.32% | 28.85% | (3.20)% |
Ratios to Average Net Assets H | | | |
Expenses before expense reductions | 1.97% | 2.74% | 9.86% A |
Expenses net of voluntary waivers, if any | 1.10% | 1.24% | 1.35% A |
Expenses net of all reductions | 1.05% | 1.19% | 1.32% A |
Net investment income (loss) | .25% | (.17)% | .25% A |
Supplemental Data | | | |
Net assets, end of period (000 omitted) | $ 1,914 | $ 1,871 | $ 1,452 |
Portfolio turnover rate | 151% | 149% | 108% A |
A Annualized
B Total returns for periods of less than one year are not annualized.
C Total returns do not reflect charges attributable to your insurance company's separate account. Inclusion of these charges would reduce the total returns shown.
D Total returns would have been lower had certain expenses not been reduced during the periods shown.
E Calculated based on average shares outstanding during the period.
F Investment income per share reflects a special dividend which amounted to $.05 per share.
G For the period December 11, 2002 (commencement of operations) to December 31, 2002.
H Expense ratios reflect operating expenses of the class. Expenses before reductions do not reflect amounts reimbursed by the investment adviser or reductions from brokerage service arrangements or other expense offset arrangements and do not represent the amount paid by the class during periods when reimbursements or reductions occur. Expense ratios before reductions for start-up periods may not be representative of longer-term operating periods. Expenses net of any voluntary waivers reflect expenses after reimbursement by the investment adviser but prior to reductions from brokerage service arrangements or other expense offset arrangements. Expenses net of all reductions represent the net expenses paid by the class.
I Amount represents less than $.01 per share.
See accompanying notes which are an integral part of the financial statements.
Annual Report
Financial Highlights - Service Class 2
Years ended December 31, | 2004 | 2003 | 2002 G |
Selected Per-Share Data | | | |
Net asset value, beginning of period | $ 11.75 | $ 9.68 | $ 10.00 |
Income from Investment Operations | | | |
Net investment income (loss) E | .01 F | (.04) | - I |
Net realized and unrealized gain (loss) | .24 | 2.80 | (.32) |
Total from investment operations | .25 | 2.76 | (.32) |
Distributions from net investment income | (.02) | (.01) | - |
Distributions from net realized gain | (.90) | (.68) | - |
Total distributions | (.92) | (.69) | - |
Net asset value, end of period | $ 11.08 | $ 11.75 | $ 9.68 |
Total Return B, C, D | 2.14% | 28.64% | (3.20)% |
Ratios to Average Net Assets H | | | |
Expenses before expense reductions | 2.12% | 2.89% | 10.01% A |
Expenses net of voluntary waivers, if any | 1.25% | 1.39% | 1.50% A |
Expenses net of all reductions | 1.20% | 1.34% | 1.47% A |
Net investment income (loss) | .10% | (.33)% | .10% A |
Supplemental Data | | | |
Net assets, end of period (000 omitted) | $ 2,544 | $ 2,491 | $ 1,936 |
Portfolio turnover rate | 151% | 149% | 108% A |
A Annualized
B Total returns for periods of less than one year are not annualized.
C Total returns do not reflect charges attributable to your insurance company's separate account. Inclusion of these charges would reduce the total returns shown.
D Total returns would have been lower had certain expenses not been reduced during the periods shown.
E Calculated based on average shares outstanding during the period.
F Investment income per share reflects a special dividend which amounted to $.05 per share.
G For the period December 11, 2002 (commencement of operations) to December 31, 2002.
H Expense ratios reflect operating expenses of the class. Expenses before reductions do not reflect amounts reimbursed by the investment adviser or reductions from brokerage service arrangements or other expense offset arrangements and do not represent the amount paid by the class during periods when reimbursements or reductions occur. Expense ratios before reductions for start-up periods may not be representative of longer-term operating periods. Expenses net of any voluntary waivers reflect expenses after reimbursement by the investment adviser but prior to reductions from brokerage service arrangements or other expense offset arrangements. Expenses net of all reductions represent the net expenses paid by the class.
I Amount represents less than $.01 per share.
Growth Stock Portfolio
See accompanying notes which are an integral part of the financial statements.
Notes to Financial Statements
For the period ended December 31, 2004
1. Significant Accounting Policies.
Growth Stock Portfolio (the fund) is a fund of Variable Insurance Products Fund IV, (the trust) (referred to in this report as Fidelity Variable Insurance Products: Growth Stock Portfolio) and is authorized to issue an unlimited number of shares. The trust is registered under the Investment Company Act of 1940, as amended (the 1940 Act), as an open-end management investment company organized as a Massachusetts business trust. Shares of the fund may only be purchased by insurance companies for the purpose of funding variable annuity or variable life insurance contracts. The fund offers the following classes of shares: Initial Class shares, Service Class shares and Service Class 2 shares. All classes have equal rights and voting privileges, except for matters affecting a single class. Investment income, realized and unrealized capital gains and losses, the common expenses of the fund, and certain fund-level expense reductions, if any, are allocated on a pro rata basis to each class based on the relative net assets of each class to the total net assets of the fund. Each class differs with respect to distribution and service plan fees incurred. Certain expense reductions also differ by class.
The financial statements have been prepared in conformity with accounting principles generally accepted in the United States of America, which require management to make certain estimates and assumptions at the date of the financial statements. The following summarizes the significant accounting policies of the fund:
Security Valuation. Net asset value per share (NAV calculation) is calculated as of the close of business of the New York Stock Exchange, normally 4:00 p.m. Eastern time. Equity securities, including restricted securities, for which market quotations are available are valued at the last sale price or official closing price (closing bid price or last evaluated quote if no sale has occurred) on the primary market or exchange on which they trade. If prices are not readily available or do not accurately reflect fair value for a security, or if a security's value has been materially affected by events occurring after the close of the exchange or market on which the security is principally traded, that security may be valued by another method that the Board of Trustees believes accurately reflects fair value. A security's valuation may differ depending on the method used for determining value. Price movements in futures contracts and ADRs, market and trading trends, the bid/ask quotes of brokers and off-exchange institutional trading may be reviewed in the course of making a good faith determination of a security's fair value. Short-term securities with remaining maturities of sixty days or less for which quotations are not readily available are valued on the basis of amortized cost. Investments in open-end investment companies are valued at their net asset value each business day.
Foreign Currency. The fund uses foreign currency contracts to facilitate transactions in foreign-denominated securities. Losses from these transactions may arise from changes in the value of the foreign currency or if the counterparties do not perform under the contracts' terms.
Foreign-denominated assets, including investment securities, and liabilities are translated into U.S. dollars at the exchange rate at period end. Purchases and sales of investment securities, income and dividends received and expenses denominated in foreign currencies are translated into U.S. dollars at the exchange rate in effect on the transaction date.
The effects of exchange rate fluctuations on investments are included with the net realized and unrealized gain (loss) on investment securities. Other foreign currency transactions resulting in realized and unrealized gain (loss) are disclosed separately.
Investment Transactions and Income. Security transactions are accounted for as of trade date. Gains and losses on securities sold are determined on the basis of identified cost. Dividend income is recorded on the ex-dividend date, except for certain dividends from foreign securities where the ex-dividend date may have passed, which are recorded as soon as the fund is informed of the ex-dividend date. Non-cash dividends included in dividend income, if any, are recorded at the fair market value of the securities received. Distributions received on securities that represent a return of capital or capital gain are recorded as a reduction of cost of investments and/or as a realized gain. The fund estimates the components of distributions received that may be considered return of capital distributions or capital gain distributions. Large, non-recurring dividends recognized by the fund are presented separately on the Statement of Operations as "Special Dividends" and the impact of these dividends to net investment income per share is presented in the Financial Highlights. Interest income is accrued as earned. Interest income includes coupon interest and amortization of premium and accretion of discount on debt securities. Investment income is recorded net of foreign taxes withheld where recovery of such taxes is uncertain.
Expenses. Most expenses of the trust can be directly attributed to a fund. Expenses which cannot be directly attributed are apportioned among the funds in the trust.
Income Tax Information and Distributions to Shareholders. Each year, the fund intends to qualify as a regulated investment company by distributing all of its taxable income and realized gains under Subchapter M of the Internal Revenue Code. As a result, no provision for income taxes is required in the accompanying financial statements. Foreign taxes are provided for based on the fund's understanding of the tax rules and rates that exist in the foreign markets in which it invests. Distributions are recorded on the ex-dividend date.
Income dividends and capital gain distributions are declared separately for each class. Income and capital gain distributions are determined in accordance with income tax regulations, which may differ from generally accepted accounting principles.
Capital accounts within the financial statements are adjusted for permanent book-tax differences. These adjustments have no impact on net assets or the results of operations. Temporary book-tax differences will reverse in a subsequent period. Book-tax differences are primarily due to losses deferred due to wash sales and excise tax regulations.
Annual Report
Notes to Financial Statements - continued
1. Significant Accounting Policies - continued
Income Tax Information and Distributions to Shareholders - continued
The tax-basis components of distributable earnings and the federal tax cost as of period end were as follows:
Unrealized appreciation | $ 644,196 | |
Unrealized depreciation | (118,631) | |
Net unrealized appreciation (depreciation) | 525,565 | |
Undistributed ordinary income | 20,829 | |
| | |
Cost for federal income tax purposes | $ 5,902,266 | |
The tax character of distributions paid was as follows:
| December 31, 2004 | December 31, 2003 |
Ordinary Income | $ 351,131 | $ 346,023 |
Long-term Capital Gains | 148,045 | - |
Total | $ 499,176 | $ 346,023 |
2. Operating Policies.
Repurchase Agreements. Fidelity Management & Research Company (FMR) has received an Exemptive Order from the Securities and Exchange Commission (the SEC) which permits the fund and other affiliated entities of FMR to transfer uninvested cash balances into joint trading accounts. These accounts are then invested in repurchase agreements that are collateralized by U.S. Treasury or Government obligations. The fund may also invest directly with institutions, in repurchase agreements that are collateralized by commercial paper obligations and corporate obligations. Collateral is held in segregated accounts with custodian banks and may be obtained in the event of a default of the counterparty. Collateral is marked-to-market daily and maintained at a value at least equal to the principal amount of the repurchase agreement (including accrued interest).
3. Purchases and Sales of Investments.
Purchases and sales of securities, other than short-term securities and U.S. government securities, aggregated $9,167,230 and $9,408,604, respectively.
4. Fees and Other Transactions with Affiliates.
Management Fee. FMR and its affiliates provide the fund with investment management related services for which the fund pays a monthly management fee. The management fee is the sum of an individual fund fee rate that is based on an annual rate of .30% of the fund's average net assets and a group fee rate that averaged .28% during the period. The group fee rate is based upon the average net assets of all the mutual funds advised by FMR. The group fee rate decreases as assets under management increase and increases as assets under management decrease. For the period, the total annual management fee rate was .58% of the fund's average net assets.
Distribution and Service Plan. In accordance with Rule 12b-1 of the 1940 Act, the fund has adopted separate 12b-1 Plans for each Service Class of shares. Each Service Class pays Fidelity Distributors Corporation (FDC), an affiliate of FMR, a service fee. For the period, the service fee is based on an annual rate of .10% of Service Class' average net assets and .25% of Service Class 2's average net assets.
For the period, each class paid FDC the following amounts, all of which were re-allowed to insurance companies for the distribution of shares and providing shareholder support services:
Service Class | $ 1,857 | |
Service Class 2 | 6,172 | |
| $ 8,029 | |
Growth Stock Portfolio
4. Fees and Other Transactions with Affiliates - continued
Transfer Agent Fees. Fidelity Investments Institutional Operations Company, Inc. (FIIOC), an affiliate of FMR, is the fund's transfer, dividend disbursing, and shareholder servicing agent. FIIOC receives an asset-based fee with respect to each account. FIIOC pays a portion of the expenses related to the typesetting, printing and mailing of shareholder reports, except proxy statements. Each class pays a transfer agent fee, excluding out of pocket expenses, equal to an annual rate of .07% of their month end net assets. For the period, the total transfer agent fees paid by each class to FIIOC, including out of pocket expenses, were as follows:
Initial Class | $ 2,556 | |
Service Class | 1,218 | |
Service Class 2 | 1,621 | |
| $ 5,395 | |
Accounting Fees. Fidelity Service Company, Inc. (FSC), an affiliate of FMR, maintains the fund's accounting records. The fee is based on the level of average net assets for the month.
Central Funds. The fund may invest in affiliated Central Funds managed by Fidelity Investments Money Management, Inc. (FIMM), an affiliate of FMR. The Central Funds are open-end investment companies available only to investment companies and other accounts managed by FMR and its affiliates. The Central Funds seek preservation of capital and current income and do not pay a management fee. Income distributions earned by the fund are recorded as income in the accompanying financial statements and totaled $2,060 for the period.
Brokerage Commissions. The fund placed a portion of its portfolio transactions with brokerage firms which are affiliates of the investment adviser. The commissions paid to these affiliated firms were $1,440 for the period.
5. Committed Line of Credit.
The fund participates with other funds managed by FMR in a $4.2 billion credit facility (the "line of credit") to be utilized for temporary or emergency purposes to fund shareholder redemptions or for other short-term liquidity purposes. The fund has agreed to pay commitment fees on its pro rata portion of the line of credit. During the period, there were no borrowings on this line of credit.
6. Expense Reductions.
FMR voluntarily agreed to reimburse each class to the extent annual operating expenses exceeded certain levels of average net assets as noted in the table below. Some expenses, for example interest expense, are excluded from this reimbursement. Effective February 1, 2005 the expense limitations will be changed to 0.85%, 0.95% and 1.10%, for Initial Class, Service Class and Service Class 2, respectively.
| Expense
Limitations | Reimbursement
from adviser |
Initial Class | 1.00% | $ 17,623 |
Service Class | 1.10% | 16,129 |
Service Class 2 | 1.25% | 21,460 |
| | $ 55,212 |
Many of the brokers with whom FMR places trades on behalf of the fund provided services to the fund in addition to trade execution. These services included payments of certain expenses on behalf of the fund totaling $2,892 for the period.
7. Other Information.
At the end of the period, FMR or its affiliates were the owners of record of 100% of the total outstanding shares of the fund.
Annual Report
Report of Independent Registered Public Accounting Firm
To the Trustees of Variable Insurance Products Fund IV and the Shareholders of Growth Stock Portfolio:
In our opinion, the accompanying statement of assets and liabilities, including the schedule of investments, and the related statements of operations and of changes in net assets and the financial highlights present fairly, in all material respects, the financial position of Growth Stock Portfolio (a fund of Variable Insurance Products Fund IV) at December 31, 2004 and the results of its operations, the changes in its net assets and the financial highlights for the periods indicated, in conformity with accounting principles generally accepted in the United States of America. These financial statements and financial highlights (hereafter referred to as "financial statements") are the responsibility of the Growth Stock Portfolio's management; our responsibility is to express an opinion on these financial statements based on our audits. We conducted our audits of these financial statements in accordance with the standards of the Public Company Accounting Oversight Board (United States). Those standards require that we plan and perform the audit to obtain reasonable assurance about whether the financial statements are free of material misstatement. An audit includes examining, on a test basis, evidence supporting the amounts and disclosures in the financial statements, assessing the accounting principles used and significant estimates made by management, and evaluating the overall financial statement presentation. We believe that our audits, which included confirmation of securities at December 31, 2004 by correspondence with the custodian and brokers, provide a reasonable basis for our opinion.
/s/PricewaterhouseCoopers LLP
PricewaterhouseCoopers LLP
Boston, Massachusetts
February 18, 2005
Annual Report
Trustees and Officers
The Trustees, Member of the Advisory Board, and executive officers of the trust and fund, as applicable, are listed below. The Board of Trustees governs the fund and is responsible for protecting the interests of shareholders. The Trustees are experienced executives who meet periodically throughout the year to oversee the fund's activities, review contractual arrangements with companies that provide services to the fund, and review the fund's performance. Except for William O. McCoy, Dennis J. Dirks, and Kenneth L. Wolfe, each of the Trustees oversees 301 funds advised by FMR or an affiliate. Mr. McCoy oversees 303 funds advised by FMR or an affiliate. Mr. Dirks and Mr. Wolfe oversee 233 funds advised by FMR or an affiliate.
The Trustees hold office without limit in time except that (a) any Trustee may resign; (b) any Trustee may be removed by written instrument, signed by at least two-thirds of the number of Trustees prior to such removal; (c) any Trustee who requests to be retired or who has become incapacitated by illness or injury may be retired by written instrument signed by a majority of the other Trustees; and (d) any Trustee may be removed at any special meeting of shareholders by a two-thirds vote of the outstanding voting securities of the trust. In any event, each non-interested Trustee shall retire not later than the last day of the calendar year in which his or her 72nd birthday occurs. The executive officers and Advisory Board Member hold office without limit in time, except that any officer and Advisory Board Member may resign or may be removed by a vote of a majority of the Trustees at any regular meeting or any special meeting of the Trustees. Except as indicated, each individual has held the office shown or other offices in the same company for the past five years.
The fund's Statement of Additional Information (SAI) includes more information about the Trustees. To request a free copy, call Fidelity at 1-800-544-5429.
Interested Trustees*:
Correspondence intended for each Trustee who is an "interested person" (as defined in the 1940 Act) may be sent to Fidelity Investments, 82 Devonshire Street, Boston, Massachusetts 02109.
Name, Age; Principal Occupation |
Edward C. Johnson 3d (74)** |
| Year of Election or Appointment: 1983 Mr. Johnson is Chairman of the Board of Trustees. Mr. Johnson serves as Chief Executive Officer, Chairman, and a Director of FMR Corp.; a Director and Chairman of the Board and of the Executive Committee of FMR; Chairman and a Director of Fidelity Management & Research (Far East) Inc.; Chairman (1998) and a Director of Fidelity Investments Money Management, Inc.; and Chairman (2001) and a Director (2000) of FMR Co., Inc. |
Abigail P. Johnson (43)** |
| Year of Election or Appointment: 2001 Senior Vice President of VIP Growth Stock (2002). Ms. Johnson also serves as Senior Vice President of other Fidelity funds (2001). She is President and a Director of FMR (2001), Fidelity Investments Money Management, Inc. (2001), FMR Co., Inc. (2001), and a Director of FMR Corp. Previously, Ms. Johnson managed a number of Fidelity funds. |
Laura B. Cronin (50) |
| Year of Election or Appointment: 2003 Ms. Cronin is an Executive Vice President (2002) and Chief Financial Officer (2002) of FMR Corp. and is a member of the Fidelity Management Committee (2003). Previously, Ms. Cronin served as Vice President of Finance of FMR (1997-1999), and Chief Financial Officer of FMR (1999-2001), Fidelity Personal Investments (2001), and Fidelity Brokerage Company (2001-2002). |
Robert L. Reynolds (52) |
| Year of Election or Appointment: 2003 Mr. Reynolds is a Director (2003) and Chief Operating Officer (2002) of FMR Corp. and is the head of the Fidelity Management Committee (2003). He also serves on the Board at Fidelity Investments Canada, Ltd. (2000). Previously, Mr. Reynolds served as President of Fidelity Investments Institutional Retirement Group (1996-2000). |
* Trustees have been determined to be "Interested Trustees" by virtue of, among other things, their affiliation with the trust or various entities under common control with FMR.
** Edward C. Johnson 3d, Trustee, is Abigail P. Johnson's father.
Annual Report
Non-Interested Trustees:
Correspondence intended for each non-interested Trustee (that is, the Trustees other than the Interested Trustees) may be sent to Fidelity Investments, P.O. Box 55235, Boston, Massachusetts 02205-5235.
Name, Age; Principal Occupation |
Dennis J. Dirks (56) |
| Year of Election or Appointment: 2005 Trustee of Variable Insurance Products Fund IV. Mr. Dirks also serves as a Trustee (2005) or Member of the Advisory Board (2004) of other investment companies advised by FMR. Prior to his retirement in May 2003, Mr. Dirks was Chief Operating Officer and a member of the Board of The Depository Trust & Clearing Corporation (DTCC) (1999-2003). He also served as President, Chief Operating Officer, and Board member of The Depository Trust Company (DTC) (1999-2003) and President and Board member of the National Securities Clearing Corporation (NSCC) (1999-2003). In addition, Mr. Dirks served as Chief Executive Officer and Board member of the Government Securities Clearing Corporation (2001-2003) and Chief Executive Officer and Board member of the Mortgage-Backed Securities Clearing Corporation (2001-2003). |
Robert M. Gates (61) |
| Year of Election or Appointment: 1997 Dr. Gates is Vice Chairman of the non-interested Trustees (2005). Dr. Gates is President of Texas A&M University (2002). He was Director of the Central Intelligence Agency (CIA) from 1991 to 1993. From 1989 to 1991, Dr. Gates served as Assistant to the President of the United States and Deputy National Security Advisor. Dr. Gates is a Director of NACCO Industries, Inc. (mining and manufacturing), Parker Drilling Co., Inc. (drilling and rental tools for the energy industry, 2001), and Brinker International (restaurant management, 2003). He also serves as a member of the Advisory Board of VoteHere.net (secure Internet voting, 2001). Previously, Dr. Gates served as a Director of LucasVarity PLC (automotive components and diesel engines), a Director of TRW Inc. (automotive, space, defense, and information technology), and Dean of the George Bush School of Government and Public Service at Texas A&M University (1999-2001). Dr. Gates also is a Trustee of the Forum for International Policy. |
George H. Heilmeier (68) |
| Year of Election or Appointment: 2004 Dr. Heilmeier is Chairman Emeritus of Telcordia Technologies (communication software and systems), where prior to his retirement, he served as company Chairman and Chief Executive Officer. He currently serves on the Boards of Directors of The Mitre Corporation (systems engineering and information technology support for the government), INET Technologies Inc. (telecommunications network surveillance, 2001), Teletech Holdings (customer management services), and HRL Laboratories (private research and development, 2004). He is Chairman of the General Motors Technology Advisory Committee and a Life Fellow of the Institute of Electrical and Electronics Engineers (IEEE) (2000). Dr. Heilmeier is a member of the Defense Science Board and the National Security Agency Advisory Board. He is also a member of the National Academy of Engineering, the American Academy of Arts and Sciences, and the Board of Overseers of the School of Engineering and Applied Science of the University of Pennsylvania. Previously, Dr. Heilmeier served as a Director of TRW Inc. (automotive, space, defense, and information technology, 1992-2002), Compaq (1994-2002), and Automatic Data Processing, Inc. (ADP) (technology-based business outsourcing, 1995-2002). |
Marie L. Knowles (58) |
| Year of Election or Appointment: 2001 Prior to Ms. Knowles' retirement in June 2000, she served as Executive Vice President and Chief Financial Officer of Atlantic Richfield Company (ARCO) (diversified energy, 1996-2000). From 1993 to 1996, she was a Senior Vice President of ARCO and President of ARCO Transportation Company. She served as a Director of ARCO from 1996 to 1998. She currently serves as a Director of Phelps Dodge Corporation (copper mining and manufacturing) and McKesson Corporation (healthcare service, 2002). Ms. Knowles is a Trustee of the Brookings Institution and the Catalina Island Conservancy and also serves as a member of the Advisory Board for the School of Engineering of the University of Southern California. |
Ned C. Lautenbach (60) |
| Year of Election or Appointment: 2000 Mr. Lautenbach has been a partner of Clayton, Dubilier & Rice, Inc. (private equity investment firm) since September 1998. Previously, Mr. Lautenbach was with the International Business Machines Corporation (IBM) from 1968 until his retirement in 1998. He was most recently Senior Vice President and Group Executive of Worldwide Sales and Services. From 1993 to 1995, he was Chairman of IBM World Trade Corporation, and from 1994 to 1998 was a member of IBM's Corporate Executive Committee. Mr. Lautenbach serves as Co-Chairman and a Director of Covansys, Inc. (global provider of business and technology solutions, 2000). In addition, he is a Director of Italtel Holding S.p.A. (telecommunications (Milan, Italy), 2004) and Eaton Corporation (diversified industrial) as well as the Philharmonic Center for the Arts in Naples, Florida (1999). He also is a member of the Council on Foreign Relations. |
Marvin L. Mann (71) |
| Year of Election or Appointment: 1993 Mr. Mann is Chairman of the non-interested Trustees (2001). He is Chairman Emeritus of Lexmark International, Inc. (computer peripherals), where he served as CEO until April 1998, retired as Chairman May 1999, and remains a member of the Board. Prior to 1991, he held the positions of Vice President of International Business Machines Corporation (IBM) and President and General Manager of various IBM divisions and subsidiaries. He is a member of the Executive Committee of the Independent Director's Council of the Investment Company Institute. In addition, Mr. Mann is a member of the President's Cabinet at the University of Alabama and the Board of Visitors of the Culverhouse College of Commerce and Business Administration at the University of Alabama. |
William O. McCoy (71) |
| Year of Election or Appointment: 1997 Prior to his retirement in December 1994, Mr. McCoy was Vice Chairman of the Board of BellSouth Corporation (telecommunications) and President of BellSouth Enterprises. He is currently a Director of Liberty Corporation (holding company), Duke Realty Corporation (real estate), and Progress Energy, Inc. (electric utility). He is also a partner of Franklin Street Partners (private investment management firm) and a member of the Research Triangle Foundation Board. In addition, Mr. McCoy served as the Interim Chancellor (1999-2000) and a member of the Board of Visitors (1994-1998) for the University of North Carolina at Chapel Hill and currently serves on the Board of Directors of the University of North Carolina Health Care System and the Board of Visitors of the Kenan-Flagler Business School (University of North Carolina at Chapel Hill). He also served as Vice President of Finance for the University of North Carolina (16-school system, 1995-1998). |
Cornelia M. Small (60) |
| Year of Election or Appointment: 2005 Ms. Small is a member (2000) and Chairperson (2002) of the Investment Committee, and a member (2002) of the Board of Trustees of Smith College. Previously, she served as Chief Investment Officer (1999-2000), Director of Global Equity Investments (1996-1999), and a member of the Board of Directors of Scudder, Stevens & Clark (1990-1997) and Scudder Kemper Investments (1997-1998). In addition, Ms. Small served as Co-Chair (2000-2003) of the Annual Fund for the Fletcher School of Law and Diplomacy. |
William S. Stavropoulos (65) |
| Year of Election or Appointment: 2001 Mr. Stavropoulos is Chairman of the Board (2000), CEO (2002), a position he previously held from 1995-2000, Chairman of the Executive Committee (2000), and a Member of the Board of Directors of The Dow Chemical Company. Since joining The Dow Chemical Company in 1967, Mr. Stavropoulos served in numerous senior management positions, including President (1993-2000; 2002-2003). Currently, he is a Director of NCR Corporation (data warehousing and technology solutions), BellSouth Corporation (telecommunications), Chemical Financial Corporation, and Maersk Inc. (industrial conglomerate, 2002). He also serves as a member of the Board of Trustees of the American Enterprise Institute for Public Policy Research. In addition, Mr. Stavropoulos is a member of The Business Council, J.P. Morgan International Council and the University of Notre Dame Advisory Council for the College of Science. |
Kenneth L. Wolfe (65) |
| Year of Election or Appointment: 2005 Trustee of Variable Insurance Products Fund IV. Mr. Wolfe also serves as a Trustee (2005) or Member of the Advisory Board (2004) of other investment companies advised by FMR. Prior to his retirement in 2001, Mr. Wolfe was Chairman and Chief Executive Officer of Hershey Foods Corporation (1993-2001). He currently serves as a member of the boards of Adelphia Communications Corporation (2003), Bausch & Lomb, Inc., and Revlon Inc. (2004). |
Advisory Board Member and Executive Officers:
Correspondence intended for each executive officer and Mr. Lynch may be sent to Fidelity Investments, 82 Devonshire Street, Boston, Massachusetts 02109.
Name, Age; Principal Occupation |
Peter S. Lynch (61) |
| Year of Election or Appointment: 2003 Member of the Advisory Board of Variable Insurance Products Fund IV. Vice Chairman and a Director of FMR, and Vice Chairman (2001) and a Director (2000) of FMR Co., Inc. Previously, Mr. Lynch served as a Trustee of the Fidelity funds (1990-2003). Prior to May 31, 1990, he was a Director of FMR and Executive Vice President of FMR (a position he held until March 31, 1991), Vice President of Fidelity® Magellan® Fund and FMR Growth Group Leader, and Managing Director of FMR Corp. Mr. Lynch was also Vice President of Fidelity Investments Corporate Services. In addition, he serves as a Trustee of Boston College, Massachusetts Eye & Ear Infirmary, Historic Deerfield, John F. Kennedy Library, and the Museum of Fine Arts of Boston. |
John B. McDowell (46) |
| Year of Election or Appointment: 2002 Vice President of VIP Growth Stock. Mr. McDowell also serves as Vice President of certain Equity Funds (2002). He is Senior Vice President of FMR (1999), FMR Co., Inc. (2001), and Fidelity Management Trust Company (FMTC). Since joining Fidelity Investments in 1985, Mr. McDowell has worked as a research analyst and manager. |
Brian J. Hanson (31) |
| Year of Election or Appointment: 2004 Vice President of VIP Growth Stock. Mr. Hanson also serves as Vice President of another fund advised by FMR. Prior to assuming his current responsibilities, Mr. Hanson worked as an analyst and manager. Mr. Hanson also serves as Vice President of FMR (2004) and FMR Co., Inc. (2004). |
Eric D. Roiter (56) |
| Year of Election or Appointment: 2002 Secretary of VIP Growth Stock. He also serves as Secretary of other Fidelity funds; Vice President, General Counsel, and Secretary of FMR Co., Inc. (2001-present) and FMR; Vice President and Secretary of FDC; Assistant Secretary of Fidelity Management & Research (U.K.) Inc. (2001-present), Fidelity Management & Research (Far East) Inc. (2001-present), and Fidelity Investments Money Management, Inc. (2001-present). Mr. Roiter is an Adjunct Member, Faculty of Law, at Boston College Law School (2003-present). |
Stuart Fross (45) |
| Year of Election or Appointment: 2003 Assistant Secretary of VIP Growth Stock. Mr. Fross also serves as Assistant Secretary of other Fidelity funds (2003) and is an employee of FMR. |
Christine Reynolds (46) |
| Year of Election or Appointment: 2004 President, Treasurer, and Anti-Money Laundering (AML) officer of VIP Growth Stock. Ms. Reynolds also serves as President, Treasurer, and AML officer of other Fidelity funds (2004) and is a Vice President (2003) and an employee (2002) of FMR. Before joining Fidelity Investments, Ms. Reynolds worked at PricewaterhouseCoopers LLP (PwC) (1980-2002), where she was most recently an audit partner with PwC's investment management practice. |
Timothy F. Hayes (54) |
| Year of Election or Appointment: 2002 Chief Financial Officer of VIP Growth Stock. Mr. Hayes also serves as Chief Financial Officer of other Fidelity funds (2002). Recently he was appointed President of Fidelity Service Company (2003) where he also serves as a Director. Mr. Hayes also serves as President of Fidelity Investments Operations Group (FIOG, 2002), which includes Fidelity Pricing and Cash Management Services Group (FPCMS), where he was appointed President in 1998. Previously, Mr. Hayes served as Chief Financial Officer of Fidelity Investments Corporate Systems and Service Group (1998) and Fidelity Systems Company (1997-1998). |
Kenneth A. Rathgeber (57) |
| Year of Election or Appointment: 2004 Chief Compliance Officer of VIP Growth Stock. Mr. Rathgeber also serves as Chief Compliance Officer of other Fidelity funds (2004) and Executive Vice President of Risk Oversight for Fidelity Investments (2002). Previously, he served as Executive Vice President and Chief Operating Officer for Fidelity Investments Institutional Services Company, Inc. (1998-2002). |
John R. Hebble (46) |
| Year of Election or Appointment: 2003 Deputy Treasurer of VIP Growth Stock. Mr. Hebble also serves as Deputy Treasurer of other Fidelity funds (2003), and is an employee of FMR. Before joining Fidelity Investments, Mr. Hebble worked at Deutsche Asset Management where he served as Director of Fund Accounting (2002-2003) and Assistant Treasurer of the Scudder Funds (1998-2003). |
Kimberley H. Monasterio (41) |
| Year of Election or Appointment: 2004 Deputy Treasurer of VIP Growth Stock. Ms. Monasterio also serves as Deputy Treasurer of other Fidelity funds (2004) and is an employee of FMR (2004). Before joining Fidelity Investments, Ms. Monasterio served as Treasurer (2000-2004) and Chief Financial Officer (2002-2004) of the Franklin Templeton Funds and Senior Vice President of Franklin Templeton Services, LLC (2000-2004). |
John H. Costello (58) |
| Year of Election or Appointment: 2002 Assistant Treasurer of VIP Growth Stock. Mr. Costello also serves as Assistant Treasurer of other Fidelity funds and is an employee of FMR. |
Peter L. Lydecker (50) |
| Year of Election or Appointment: 2004 Assistant Treasurer of VIP Growth Stock. Mr. Lydecker also serves as Assistant Treasurer of other Fidelity funds (2004) and is an employee of FMR. |
Mark Osterheld (49) |
| Year of Election or Appointment: 2002 Assistant Treasurer of VIP Growth Stock. Mr. Osterheld also serves as Assistant Treasurer of other Fidelity funds (2002) and is an employee of FMR. |
Kenneth B. Robins (35) |
| Year of Election or Appointment: 2004 Assistant Treasurer of VIP Growth Stock. Mr. Robins also serves as Assistant Treasurer of other Fidelity funds (2004) and is an employee of FMR (2004). Before joining Fidelity Investments, Mr. Robins worked at KPMG LLP, where he was a partner in KPMG's department of professional practice (2002-2004) and a Senior Manager (1999-2000). In addition, Mr. Robins served as Assistant Chief Accountant, United States Securities and Exchange Commission (2000-2002). |
Annual Report
Distributions
The Board of Trustees of Growth Stock Portfolio voted to pay to shareholders of record at the opening of business on record date, the following distributions per share derived from capital gains realized from sales of portfolio securities and dividends derived from net investment income:
| Pay Date | Record Date | Dividends | Capital Gains |
Initial Class | 2/11/05 | 2/11/05 | $.005 | $.035 |
Service Class | 2/11/05 | 2/11/05 | $.005 | $.035 |
Service Class 2 | 2/11/05 | 2/11/05 | $.005 | $.035 |
The fund will notify shareholders in January 2005 of amounts for use in preparing 2004 income tax returns.
Annual Report
Proxy Voting Results
A special meeting of the fund's shareholders was held on December 14, 2004. The results of votes taken among shareholders on proposals before them are reported below. Each vote reported represents one dollar of net asset value held on the record date for the meeting.
PROPOSAL 1 |
To amend the Declaration of Trust to allow the Board of Trustees, if permitted by applicable law, to authorize fund mergers without shareholder approval. A |
| # of
Votes | % of
Votes |
Affirmative | 458,190,063.70 | 83.431 |
Against | 70,246,908.89 | 12.791 |
Abstain | 20,745,786.74 | 3.778 |
TOTAL | 549,182,759.33 | 100.000 |
PROPOSAL 2 |
To elect a Board of Trustees. A |
| # of
Votes | % of
Votes |
J. Michael Cook |
Affirmative | 521,583,205.95 | 94.974 |
Withheld | 27,599,553.38 | 5.026 |
TOTAL | 549,182,759.33 | 100.000 |
Ralph F. Cox |
Affirmative | 519,150,329.49 | 94.531 |
Withheld | 30,032,429.84 | 5.469 |
TOTAL | 549,182,759.33 | 100.000 |
Laura B. Cronin |
Affirmative | 520,911,931.53 | 94.852 |
Withheld | 28,270,827.80 | 5.148 |
TOTAL | 549,182,759.33 | 100.000 |
Dennis J. Dirks B |
Affirmative | 521,590,729.90 | 94.976 |
Withheld | 27,592,029.43 | 5.024 |
TOTAL | 549,182,759.33 | 100.000 |
Robert M. Gates |
Affirmative | 519,905,480.12 | 94.669 |
Withheld | 29,277,279.21 | 5.331 |
TOTAL | 549,182,759.33 | 100.000 |
George H. Heilmeier |
Affirmative | 520,921,777.54 | 94.854 |
Withheld | 28,260,981.79 | 5.146 |
TOTAL | 549,182,759.33 | 100.000 |
Abigail P. Johnson |
Affirmative | 519,065,339.91 | 94.516 |
Withheld | 30,117,419.42 | 5.484 |
TOTAL | 549,182,759.33 | 100.000 |
Edward C. Johnson 3d |
Affirmative | 518,847,346.05 | 94.476 |
Withheld | 30,335,413.28 | 5.524 |
TOTAL | 549,182,759.33 | 100.000 |
Donald J. Kirk |
Affirmative | 521,181,241.00 | 94.901 |
Withheld | 28,001,518.33 | 5.099 |
TOTAL | 549,182,759.33 | 100.000 |
| # of
Votes | % of
Votes |
Marie L. Knowles |
Affirmative | 521,391,176.23 | 94.939 |
Withheld | 27,791,583.10 | 5.061 |
TOTAL | 549,182,759.33 | 100.000 |
Ned C. Lautenbach |
Affirmative | 521,804,568.92 | 95.015 |
Withheld | 27,378,190.41 | 4.985 |
TOTAL | 549,182,759.33 | 100.000 |
Marvin L. Mann |
Affirmative | 520,497,408.02 | 94.777 |
Withheld | 28,685,351.31 | 5.223 |
TOTAL | 549,182,759.33 | 100.000 |
William O. McCoy |
Affirmative | 520,233,312.84 | 94.729 |
Withheld | 28,949,446.49 | 5.271 |
TOTAL | 549,182,759.33 | 100.000 |
Robert L. Reynolds |
Affirmative | 521,415,834.89 | 94.944 |
Withheld | 27,766,924.44 | 5.056 |
TOTAL | 549,182,759.33 | 100.000 |
Cornelia M. Small B |
Affirmative | 521,014,631.05 | 94.871 |
Withheld | 28,168,128.28 | 5.129 |
TOTAL | 549,182,759.33 | 100.000 |
William S. Stavropoulos |
Affirmative | 520,522,282.96 | 94.781 |
Withheld | 28,660,476.37 | 5.219 |
TOTAL | 549,182,759.33 | 100.000 |
A Denotes trust-wide proposals and voting results. B Effective January 1, 2005. |
Annual Report
Annual Report
Growth Stock Portfolio
Annual Report
Investment Adviser
Fidelity Management & Research Company
Boston, MA
Investment Sub-Advisers
FMR Co., Inc.
Fidelity Management & Research (U.K.) Inc.
Fidelity Management & Research (Far East) Inc.
Fidelity Investments Japan Limited
Fidelity International Investment Advisors
Fidelity International Investment Advisors
(U.K.) Limited
General Distributor
Fidelity Distributors Corporation
Boston, MA
Transfer and Shareholder Servicing Agent
Fidelity Investments Institutional Operations Company, Inc.
Boston, MA
Custodian
Mellon Bank, N.A.
Pittsburgh, PA
VIPGR-ANN-0205
1.781993.102
Fidelity® Variable Insurance Products:
Real Estate Portfolio
Annual Report
December 31, 2004
(2_fidelity_logos) (Registered_Trademark)
Contents
Performance | 3 | How the fund has done over time. |
Management's Discussion | 4 | The manager's review of fund performance, strategy and outlook. |
Shareholder Expense Example | 5 | An example of shareholder expenses. |
Investment Summary | 6 | A summary of the fund's investments at period end. |
Investments | 7 | A complete list of the fund's investments with their
market values. |
Financial Statements | 9 | Statements of assets and liabilities, operations, and
changes in net assets, as well as financial highlights. |
Notes | 13 | Notes to the financial statements. |
Report of Independent Registered Public Accounting Firm | 16 | |
Trustees and Officers | 17 | |
Proxy Voting Results | 22 | |
Distributions | 23 | |
To view a fund's proxy voting guidelines and proxy voting record for the 12-month period ended June 30, visit www.fidelity.com/proxyvotingresults or visit the Securities and Exchange Commission's (SEC) web site at www.sec.gov. You may also call 1-800-544-5429 to request a free copy of the proxy voting guidelines.
Fidelity Variable Insurance Products are separate account options which are purchased through a variable insurance contract.
Standard & Poor's, S&P and S&P 500 are registered service marks of The McGraw-Hill Companies, Inc. and have been licensed for use by Fidelity Distributors Corporation.
Other third party marks appearing herein are the property of their respective owners.
All other marks appearing herein are registered or unregistered trademarks or service marks of FMR Corp. or an affiliated company.
(Recycle graphic) This report is printed on recycled paper using soy-based inks.
This report and the financial statements contained herein are submitted for the general information of the shareholders of the fund. This report is not authorized for distribution to prospective investors in the fund unless preceded or accompanied by an effective prospectus.
A fund files its complete schedule of portfolio holdings with the SEC for the first and third quarters of each fiscal year on Form N-Q. Forms N-Q are available on the SEC's web site at http://www.sec.gov. A fund's Forms N-Q may be reviewed and copied at the SEC's Public Reference Room in Washington, DC. Information regarding the operation of the SEC's Public Reference Room may be obtained by calling 1-800-SEC-0330. For a complete list of a fund's portfolio holdings, view the most recent quarterly holdings report, semiannual report, or annual report on Fidelity's web site at http://www.advisor.fidelity.com.
NOT FDIC INSURED · MAY LOSE VALUE · NO BANK GUARANTEE
Neither the fund nor Fidelity Distributors Corporation is a bank.
Real Estate Portfolio
Fidelity Variable Insurance Products: Real Estate Portfolio
Performance: The Bottom Line
Average annual total return reflects the change in the value of an investment, assuming reinvestment of the class' dividend income and capital gains (the profits earned upon the sale of securities that have grown in value) and assuming a constant rate of performance each year. During periods of reimbursement by Fidelity, a fund's total return will be greater than it would be had the reimbursement not occurred. Performance numbers are net of all underlying fund operating expenses, but do not include any insurance charges imposed by your insurance company's separate account. If performance information included the effect of these additional charges, the total returns would have been lower. How a fund did yesterday is no guarantee of how it will do tomorrow.
Average Annual Total Returns
Periods ended December 31, 2004 | | Past 1
year | Life of fund A |
Fidelity VIP: Real Estate - Initial Class | | 34.14% | 32.52% |
Fidelity VIP: Real Estate - Service Class B | | 34.04% | 32.39% |
Fidelity VIP: Real Estate - Service Class 2 C | | 33.79% | 32.18% |
A From November 6, 2002.
B Performance for Service Class shares reflects an asset-based service fee (12b-1 fee).
C Performance for Service Class 2 shares reflects an asset-based service fee (12b-1 fee).
$10,000 Over Life of Fund
Let's say hypothetically that $10,000 was invested in Fidelity® Variable Insurance Products: Real Estate Portfolio - Initial Class on November 6, 2002, when the fund started. The chart shows how the value of your investment would have changed, and also shows how the S&P 500® Index performed over the same period.
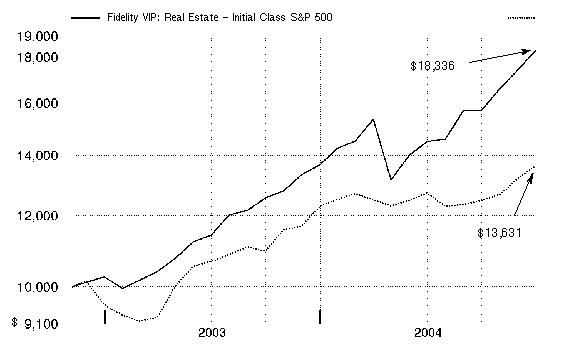
Annual Report
Fidelity Variable Insurance Products: Real Estate Portfolio
Management's Discussion of Fund Performance
Comments from Steve Buller, Portfolio Manager of Fidelity® Variable Insurance Products: Real Estate Portfolio
Real estate securities continued to rally during 2004, enjoying their fifth consecutive year of outperformance relative to the broad stock market and their second consecutive year of gains exceeding 30%. For the 12 months ending December 31, 2004, the Dow Jones Wilshire® Real Estate Securities Index gained 34.83%, while the Standard & Poor's 500SM Index rose 10.88%. The strong performance came even as the market for real estate investment trusts (REITs) encountered unusual volatility. During a six-week period in the spring, as investors became increasingly confident that the Federal Reserve Board would be raising short-term interest rates, REIT prices tumbled nearly 20%. However, as confidence increased that the rate hikes would be implemented gradually, yields on the benchmark 10-year Treasury note remained relatively stable - providing investors in real estate securities with the confidence to return to the market. Accordingly, REITs returned to favor and enjoyed extremely strong performance for the rest of 2004, rising approximately 45% between the market's low point on May 10 and the end of the year.
The portfolio performed in line with both its benchmark, the Dow Jones Wilshire Real Estate Securities Index, and the 33.71% increase of the LipperSM Variable Annuity Real Estate Funds Average during the 12 months ending December 31, 2004. The fund's performance was slightly held back by holding cash in the portfolio at inopportune times in a rising market due to investment inflows. Compared to the broad equity market, the fund benefited from the strong backdrop for real estate securities. Two of the biggest detractors relative to the Dow Jones Wilshire benchmark resulted from underweighting apartment REITs Archstone Smith Trust and AvalonBay Communities, each a component of the sector index. Both businesses, which own a number of high-rise apartment buildings in desirable areas of the United States, benefited as investors saw appreciation potential in converting the companies' apartments to condos. On the plus side, the fund was helped by a large position in Starwood Hotels & Resorts Worldwide, which benefited from its strong business fundamentals and reasonable valuation. Also boosting results was Vornado Realty Trust, whose office properties performed well in the New York City and Washington, D.C. markets.
The views expressed in this statement reflect those of the portfolio manager only through the end of the period of the report as stated on the cover and do not necessarily represent the views of Fidelity or any other person in the Fidelity organization. Any such views are subject to change at any time based upon market or other conditions and Fidelity disclaims any responsibility to update such views. These views may not be relied on as investment advice and, because investment decisions for a Fidelity fund are based on numerous factors, may not be relied on as an indication of trading intent on behalf of any Fidelity fund.
Annual Report
Fidelity Variable Insurance Products: Real Estate Portfolio
Shareholder Expense Example
As a shareholder of the Fund, you incur two types of costs: (1) transaction costs, and (2) ongoing costs, including management fees, distribution and/or service (12b-1) fees and other Fund expenses. This Example is intended to help you understand your ongoing costs (in dollars) of investing in the Fund and to compare these costs with the ongoing costs of investing in other mutual funds.
The Example is based on an investment of $1,000 invested at the beginning of the period and held for the entire period (July 1, 2004 to December 31, 2004).
Actual Expenses
The first line of the table below for each class of the Fund provides information about actual account values and actual expenses. You may use the information in this line, together with the amount you invested, to estimate the expenses that you paid over the period. Simply divide your account value by $1,000.00 (for example, an $8,600 account value divided by $1,000.00 = 8.6), then multiply the result by the number in the first line for a class of the Fund under the heading entitled "Expenses Paid During Period" to estimate the expenses you paid on your account during this period. The estimate of expenses does not include any fees or other expenses of any variable annuity or variable life insurance product. If they were, the estimate of expenses you paid during the period would be higher, and your ending account value would be lower.
Hypothetical Example for Comparison Purposes
The second line of the table below for each class of the Fund provides information about hypothetical account values and hypothetical expenses based on a Class' actual expense ratio and an assumed rate of return of 5% per year before expenses, which is not the Class' actual return. The hypothetical account values and expenses may not be used to estimate the actual ending account balance or expenses you paid for the period. You may use this information to compare the ongoing costs of investing in the Fund and other funds. To do so, compare this 5% hypothetical example with the 5% hypothetical examples that appear in the shareholder reports of the other funds. The estimate of expenses does not include any fees or other expenses of any variable annuity or variable life insurance product. If they were, the estimate of expenses you paid during the period would be higher, and your ending account value would be lower.
Please note that the expenses shown in the table are meant to highlight your ongoing costs only and do not reflect any transaction costs. Therefore, the second line of the table is useful in comparing ongoing costs only, and will not help you determine the relative total costs of owning different funds.
| Beginning
Account Value
July 1, 2004 | Ending
Account Value
December 31, 2004 | Expenses Paid
During Period*
July 1, 2004
to December 31, 2004 |
Initial Class | | | |
Actual | $ 1,000.00 | $ 1,263.50 | $ 4.32 |
HypotheticalA | $ 1,000.00 | $ 1,021.32 | $ 3.86 |
Service Class | | | |
Actual | $ 1,000.00 | $ 1,263.40 | $ 4.84 |
HypotheticalA | $ 1,000.00 | $ 1,020.86 | $ 4.32 |
Service Class 2 | | | |
Actual | $ 1,000.00 | $ 1,261.80 | $ 5.69 |
HypotheticalA | $ 1,000.00 | $ 1,020.11 | $ 5.08 |
A 5% return per year before expenses
* Expenses are equal to each Class' annualized expense ratio (shown in the table below); multiplied by the average account value over the period, multiplied by 184/366 (to reflect the one-half year period).
| Annualized
Expense Ratio |
Initial Class | .76% |
Service Class | .85% |
Service Class 2 | 1.00% |
Annual Report
Fidelity Variable Insurance Products: Real Estate Portfolio
Investment Summary
Top Ten Stocks as of December 31, 2004 |
| % of fund's
net assets |
Starwood Hotels & Resorts Worldwide, Inc. unit | 8.5 |
Vornado Realty Trust | 7.8 |
ProLogis | 7.1 |
Simon Property Group, Inc. | 6.1 |
Equity Office Properties Trust | 5.5 |
General Growth Properties, Inc. | 5.4 |
Reckson Associates Realty Corp. | 5.0 |
Duke Realty Corp. | 4.9 |
CBL & Associates Properties, Inc. | 4.8 |
Public Storage, Inc. | 3.7 |
| 58.8 |
Top Five REIT Sectors as of December 31, 2004 |
| % of fund's
net assets |
REITs - Industrial Buildings | 23.3 |
REITs - Malls | 17.5 |
REITs - Office Buildings | 14.9 |
REITs - Shopping Centers | 14.7 |
REITs - Apartments | 8.4 |
Asset Allocation (% of fund's net assets) |
As of December 31, 2004 |
 | Stocks | 95.8% | |
 | Short-Term
Investments and
Net Other Assets | 4.2% | |

Annual Report
Fidelity Variable Insurance Products: Real Estate Portfolio
Investments December 31, 2004
Showing Percentage of Net Assets
Common Stocks - 95.8% |
| Shares | | Value (Note 1) |
HOTELS, RESTAURANTS & LEISURE - 8.5% |
Hotels, Resorts & Cruise Lines - 8.5% |
Starwood Hotels & Resorts Worldwide, Inc. unit | 221,630 | | $ 12,943,191 |
MARINE - 0.0% |
Marine - 0.0% |
Alexander & Baldwin, Inc. | 800 | | 33,936 |
REAL ESTATE - 87.3% |
Real Estate Investment Trusts - 4.1% |
American Financial Realty Trust (SBI) | 21,500 | | 347,870 |
Digital Realty Trust, Inc. | 40,300 | | 542,841 |
GMH Communities Trust | 63,900 | | 900,990 |
HomeBanc Mortgage Corp., Georgia | 62,600 | | 605,968 |
Trizec Properties, Inc. | 204,600 | | 3,871,032 |
TOTAL REAL ESTATE INVESTMENT TRUSTS | | 6,268,701 |
REITs - Apartments - 8.4% |
American Campus Communities, Inc. | 37,800 | | 850,122 |
Apartment Investment & Management Co. Class A | 109,620 | | 4,224,755 |
AvalonBay Communities, Inc. | 32,400 | | 2,439,720 |
Cornerstone Realty Income Trust, Inc. | 39,600 | | 395,208 |
Equity Residential (SBI) | 126,300 | | 4,569,534 |
United Dominion Realty Trust, Inc. (SBI) | 17,200 | | 426,560 |
TOTAL REITS - APARTMENTS | | 12,905,899 |
REITs - Health Care Facilities - 0.9% |
Ventas, Inc. | 51,400 | | 1,408,874 |
REITs - Hotels - 0.4% |
Eagle Hospitality Properties Trust, Inc. | 1,000 | | 10,300 |
MeriStar Hospitality Corp. (a) | 60,620 | | 506,177 |
TOTAL REITS - HOTELS | | 516,477 |
REITs - Industrial Buildings - 23.3% |
Catellus Development Corp. | 166,152 | | 5,084,251 |
CenterPoint Properties Trust (SBI) | 105,630 | | 5,058,621 |
Duke Realty Corp. | 218,120 | | 7,446,617 |
Plum Creek Timber Co., Inc. | 22,300 | | 857,212 |
ProLogis | 251,920 | | 10,915,694 |
Public Storage, Inc. | 102,640 | | 5,722,180 |
U-Store-It Trust | 31,100 | | 539,585 |
TOTAL REITS - INDUSTRIAL BUILDINGS | | 35,624,160 |
REITs - Malls - 17.5% |
CBL & Associates Properties, Inc. | 96,610 | | 7,376,174 |
General Growth Properties, Inc. | 228,451 | | 8,260,788 |
|
| Shares | | Value (Note 1) |
Simon Property Group, Inc. | 144,640 | | $ 9,353,869 |
The Mills Corp. | 28,650 | | 1,826,724 |
TOTAL REITS - MALLS | | 26,817,555 |
REITs - Management/Investment - 2.3% |
Equity Lifestyle Properties, Inc. | 33,800 | | 1,208,350 |
Newcastle Investment Corp. (a) | 72,100 | | 2,291,338 |
TOTAL REITS - MANAGEMENT/INVESTMENT | | 3,499,688 |
REITs - Office Buildings - 14.9% |
Boston Properties, Inc. | 85,200 | | 5,509,884 |
Equity Office Properties Trust | 292,600 | | 8,520,512 |
Highwoods Properties, Inc. (SBI) | 12,390 | | 343,203 |
Kilroy Realty Corp. | 20,400 | | 872,100 |
Reckson Associates Realty Corp. | 233,010 | | 7,645,058 |
TOTAL REITS - OFFICE BUILDINGS | | 22,890,757 |
REITs - Prisons - 0.8% |
Correctional Properties Trust | 43,898 | | 1,267,774 |
REITs - Shopping Centers - 14.7% |
Federal Realty Investment Trust (SBI) | 58,340 | | 3,013,261 |
Inland Real Estate Corp. | 68,133 | | 1,086,721 |
Kimco Realty Corp. | 67,800 | | 3,931,722 |
Pan Pacific Retail Properties, Inc. | 15,300 | | 959,310 |
Vornado Realty Trust | 156,800 | | 11,937,184 |
Weingarten Realty Investors (SBI) | 41,300 | | 1,656,130 |
TOTAL REITS - SHOPPING CENTERS | | 22,584,328 |
TOTAL REAL ESTATE | | 133,784,213 |
TOTAL COMMON STOCKS (Cost $121,803,061) | 146,761,340 |
Money Market Funds - 4.4% |
| | | |
Fidelity Cash Central Fund, 2.24% (b)
(Cost $6,771,360) | 6,771,360 | | 6,771,360 |
TOTAL INVESTMENT PORTFOLIO - 100.2% (Cost $128,574,421) |
| 153,532,700 |
NET OTHER ASSETS - (0.2)% | | (274,528) |
NET ASSETS - 100% | $ 153,258,172 |
Legend |
(a) Non-income producing |
(b) Affiliated fund that is available only to investment companies and other accounts managed by Fidelity Investments. The rate quoted is the annualized seven-day yield of the fund at period end. A complete listing of the fund's holdings as of its most recent fiscal year end is available upon request. |
Income Tax Information |
The fund hereby designates as capital gain dividends: For dividends with respect to the taxable year ended December 31, 2004, $918,000 or, if different, the net capital gain of such year, and for dividends with respect to the taxable year ended December 31, 2003, $103,000 or, if different, the excess of (a) the net capital gain of such year, over (b) amounts previously designated as capital gain dividends with respect to such year. |
See accompanying notes which are an integral part of the financial statements.
Real Estate Portfolio
Fidelity Variable Insurance Products Fund: Real Estate Portfolio
Financial Statements
Statement of Assets and Liabilities
| December 31, 2004 |
| | |
Assets | | |
Investment in securities, at value (cost $128,574,421) - See accompanying schedule | | $ 153,532,700 |
Receivable for investments sold | | 648,273 |
Receivable for fund shares sold | | 559,161 |
Dividends receivable | | 832,078 |
Interest receivable | | 12,509 |
Prepaid expenses | | 298 |
Other receivables | | 4,692 |
Total assets | | 155,589,711 |
| | |
Liabilities | | |
Payable for investments purchased | $ 2,210,452 | |
Payable for fund shares redeemed | 3,707 | |
Accrued management fee | 68,580 | |
Distribution fees payable | 783 | |
Other affiliated payables | 13,325 | |
Other payables and accrued expenses | 34,692 | |
Total liabilities | | 2,331,539 |
| | |
Net Assets | | $ 153,258,172 |
Net Assets consist of: | | |
Paid in capital | | $ 127,642,701 |
Accumulated undistributed net realized gain (loss) on investments and foreign currency transactions | | 657,192 |
Net unrealized appreciation (depreciation) on investments | | 24,958,279 |
Net Assets | | $ 153,258,172 |
| | |
Initial Class:
Net Asset Value, offering price and redemption price per share ($147,779,093 ÷ 8,465,436 shares) | | $ 17.46 |
| | |
Service Class:
Net Asset Value, offering price and redemption price per share ($2,743,974 ÷ 157,441 shares) | | $ 17.43 |
| | |
Service Class 2:
Net Asset Value, offering price and redemption price per share ($2,735,105 ÷ 157,273 shares) | | $ 17.39 |
Statement of Operations
| Year ended December 31, 2004 |
| | |
Investment Income | | |
Dividends | | $ 3,191,606 |
Interest | | 60,044 |
Total income | | 3,251,650 |
| | |
Expenses | | |
Management fee | $ 493,539 | |
Transfer agent fees | 62,098 | |
Distribution fees | 7,901 | |
Accounting fees and expenses | 38,014 | |
Non-interested trustees' compensation | 428 | |
Custodian fees and expenses | 17,362 | |
Audit | 32,983 | |
Legal | 1,077 | |
Interest | 928 | |
Miscellaneous | 14,966 | |
Total expenses before reductions | 669,296 | |
Expense reductions | (18,086) | 651,210 |
Net investment income (loss) | | 2,600,440 |
Realized and Unrealized Gain (Loss) Net realized gain (loss) on: | | |
Investment securities | 995,619 | |
Foreign currency transactions | 453 | |
Total net realized gain (loss) | | 996,072 |
Change in net unrealized appreciation (depreciation) on: Investment securities | 22,297,662 | |
Assets and liabilities in foreign currencies | (18) | |
Total change in net unrealized appreciation (depreciation) | | 22,297,644 |
Net gain (loss) | | 23,293,716 |
Net increase (decrease) in net assets resulting from operations | | $ 25,894,156 |
See accompanying notes which are an integral part of the financial statements.
Annual Report
Fidelity Variable Insurace Products Fund: Real Estate Portfolio
Financial Statements - continued
Statement of Changes in Net Assets
| Year ended
December 31, 2004 | Year ended
December 31, 2003 |
Increase (Decrease) in Net Assets | | |
Operations | | |
Net investment income (loss) | $ 2,600,440 | $ 514,875 |
Net realized gain (loss) | 996,072 | 304,087 |
Change in net unrealized appreciation (depreciation) | 22,297,644 | 2,580,758 |
Net increase (decrease) in net assets resulting from operations | 25,894,156 | 3,399,720 |
Distributions to shareholders from net investment income | (2,574,398) | (513,643) |
Distributions to shareholders from net realized gain | (431,678) | (239,700) |
Total distributions | (3,006,076) | (753,343) |
Share transactions - net increase (decrease) | 80,958,007 | 41,635,633 |
Total increase (decrease) in net assets | 103,846,087 | 44,282,010 |
| | |
Net Assets | | |
Beginning of period | 49,412,085 | 5,130,075 |
End of period (including undistributed net investment income of $0 and $7,211, respectively) | $ 153,258,172 | $ 49,412,085 |
Other Information: | |
Share Transactions | Year ended December 31, 2004 |
Shares | Initial Class | Service Class | Service Class 2 |
Sold | 7,277,962 | - | - |
Reinvested | 169,297 | 3,283 | 3,109 |
Redeemed | (2,389,526) | - | - |
Net increase (decrease) | 5,057,733 | 3,283 | 3,109 |
| | | |
Dollars Sold | $ 110,246,700 | $ - | $ - |
Reinvested | 2,897,952 | 55,606 | 52,518 |
Redeemed | (32,294,769) | - | - |
Net increase (decrease) | $ 80,849,883 | $ 55,606 | $ 52,518 |
| | | |
Share Transactions | Year ended December 31, 2003 |
Shares | Initial Class | Service Class | Service Class 2 |
Sold | 3,172,692 | - | - |
Reinvested | 51,781 | 2,518 | 2,524 |
Redeemed | (18,958) | - | - |
Net increase (decrease) | 3,205,515 | 2,518 | 2,524 |
| | | |
Dollars Sold | $ 41,129,487 | $ - | $ - |
Reinvested | 686,621 | 33,361 | 33,361 |
Redeemed | (247,197) | - | - |
Net increase (decrease) | $ 41,568,911 | $ 33,361 | $ 33,361 |
| | | |
Distributions | Year ended December 31, 2004 |
| Initial Class | Service Class | Service Class 2 |
From net investment income | $ 2,484,800 | $ 46,343 | $ 43,255 |
From net realized gain | 413,152 | 9,263 | 9,263 |
Total | $ 2,897,952 | $ 55,606 | $ 52,518 |
| | | |
| Year ended December 31, 2003 |
| Initial Class | Service Class | Service Class 2 |
From net investment income | $ 468,151 | $ 22,746 | $ 22,746 |
From net realized gain | 218,470 | 10,615 | 10,615 |
Total | $ 686,621 | $ 33,361 | $ 33,361 |
See accompanying notes which are an integral part of the financial statements.
Real Estate Portfolio
Financial Highlights - Initial Class
Years ended December 31, | 2004 | 2003 | 2002 G |
Selected Per-Share Data | | | |
Net asset value, beginning of period | $ 13.30 | $ 10.15 | $ 10.00 |
Income from Investment Operations | | | |
Net investment income (loss) E | .45 | .48F | .08 |
Net realized and unrealized gain (loss) | 4.08 | 2.89 | .18 |
Total from investment operations | 4.53 | 3.37 | .26 |
Distributions from net investment income | (.31) | (.15) | (.11) |
Distributions from net realized gain | (.06) | (.07) | - |
Total distributions | (.37) | (.22) | (.11) |
Net asset value, end of period | $ 17.46 | $ 13.30 | $ 10.15 |
Total Return B, C, D | 34.14% | 33.21% | 2.61% |
Ratios to Average Net Assets H | | | |
Expenses before expense reductions | .77% | 1.72% | 4.89% A |
Expenses net of voluntary waivers, if any | .77% | 1.03% | 1.25% A |
Expenses net of all reductions | .74% | 1.00% | 1.22% A |
Net investment income (loss) | 3.02% | 4.44% | 5.38% A |
Supplemental Data | | | |
Net assets, end of period (000 omitted) | $ 147,779 | $ 45,320 | $ 2,052 |
Portfolio turnover rate | 66% | 46% | 44% A |
A Annualized
B Total returns for periods of less than one year are not annualized.
C Total returns do not reflect charges attributable to your insurance company's separate account. Inclusion of these charges would reduce the total returns shown.
D Total returns would have been lower had certain expenses not been reduced during the periods shown.
E Calculated based on average shares outstanding during the period.
F Investment income per share reflects a special dividend which amounted to $.11 per share.
G For the period November 6, 2002 (commencement of operations) to December 31, 2002.
H Expense ratios reflect operating expenses of the class. Expenses before reductions do not reflect amounts reimbursed by the investment adviser or reductions from brokerage service arrangements or other expense offset arrangements and do not represent the amount paid by the class during periods when reimbursements or reductions occur. Expense ratios before reductions for start-up periods may not be representative of longer-term operating periods. Expenses net of any voluntary waivers reflect expenses after reimbursement by the investment adviser but prior to reductions from brokerage service arrangements or other expense offset arrangements. Expenses net of all reductions represent the net expenses paid by the class.
Financial Highlights - Service Class
Years ended December 31, | 2004 | 2003 | 2002 G |
Selected Per-Share Data | | | |
Net asset value, beginning of period | $ 13.28 | $ 10.15 | $ 10.00 |
Income from Investment Operations | | | |
Net investment income (loss) E | .43 | .49 F | .08 |
Net realized and unrealized gain (loss) | 4.08 | 2.86 | .18 |
Total from investment operations | 4.51 | 3.35 | .26 |
Distributions from net investment income | (.30) | (.15) | (.11) |
Distributions from net realized gain | (.06) | (.07) | - |
Total distributions | (.36) | (.22) | (.11) |
Net asset value, end of period | $ 17.43 | $ 13.28 | $ 10.15 |
Total Return B, C, D | 34.04% | 33.01% | 2.61% |
Ratios to Average Net Assets H | | | |
Expenses before expense reductions | .86% | 1.80% | 4.99% A |
Expenses net of voluntary waivers, if any | .86% | 1.24% | 1.35% A |
Expenses net of all reductions | .84% | 1.22% | 1.31% A |
Net investment income (loss) | 2.92% | 4.23% | 5.28% A |
Supplemental Data | | | |
Net assets, end of period (000 omitted) | $ 2,744 | $ 2,048 | $ 1,539 |
Portfolio turnover rate | 66% | 46% | 44% A |
A Annualized
B Total returns for periods of less than one year are not annualized.
C Total returns do not reflect charges attributable to your insurance company's separate account. Inclusion of these charges would reduce the total returns shown.
D Total returns would have been lower had certain expenses not been reduced during the periods shown.
E Calculated based on average shares outstanding during the period.
F Investment income per share reflects a special dividend which amounted to $.11 per share.
G For the period November 6, 2002 (commencement of operations) to December 31, 2002.
H Expense ratios reflect operating expenses of the class. Expenses before reductions do not reflect amounts reimbursed by the investment adviser or reductions from brokerage service arrangements or other expense offset arrangements and do not represent the amount paid by the class during periods when reimbursements or reductions occur. Expense ratios before reductions for start-up periods may not be representative of longer-term operating periods. Expenses net of any voluntary waivers reflect expenses after reimbursement by the investment adviser but prior to reductions from brokerage service arrangements or other expense offset arrangements. Expenses net of all reductions represent the net expenses paid by the class.
Annual Report
Fidelity Variable Insurance Products Fund: Real Estate Portfolio
Financial Statements - continued
Financial Highlights - Service Class 2
Years ended December 31, | 2004 | 2003 | 2002 G |
Selected Per-Share Data | | | |
Net asset value, beginning of period | $ 13.26 | $ 10.15 | $ 10.00 |
Income from Investment Operations | | | |
Net investment income (loss) E | .41 | .47 F | .08 |
Net realized and unrealized gain (loss) | 4.06 | 2.86 | .18 |
Total from investment operations | 4.47 | 3.33 | .26 |
Distributions from net investment income | (.28) | (.15) | (.11) |
Distributions from net realized gain | (.06) | (.07) | - |
Total distributions | (.34) | (.22) | (.11) |
Net asset value, end of period | $ 17.39 | $ 13.26 | $ 10.15 |
Total Return B, C, D | 33.79% | 32.81% | 2.61% |
Ratios to Average Net Assets H | | | |
Expenses before expense reductions | 1.01% | 1.95% | 5.14% A |
Expenses net of voluntary waivers, if any | 1.01% | 1.39% | 1.50% A |
Expenses net of all reductions | .99% | 1.37% | 1.46% A |
Net investment income (loss) | 2.77% | 4.08% | 5.13% A |
Supplemental Data | | | |
Net assets, end of period (000 omitted) | $ 2,735 | $ 2,044 | $ 1,539 |
Portfolio turnover rate | 66% | 46% | 44% A |
A Annualized
B Total returns for periods of less than one year are not annualized.
C Total returns do not reflect charges attributable to your insurance company's separate account. Inclusion of these charges would reduce the total returns shown.
D Total returns would have been lower had certain expenses not been reduced during the periods shown.
E Calculated based on average shares outstanding during the period.
F Investment income per share reflects a special dividend which amounted to $.11 per share.
G For the period November 6, 2002 (commencement of operations) to December 31, 2002.
H Expense ratios reflect operating expenses of the class. Expenses before reductions do not reflect amounts reimbursed by the investment adviser or reductions from brokerage service arrangements or other expense offset arrangements and do not represent the amount paid by the class during periods when reimbursements or reductions occur. Expense ratios before reductions for start-up periods may not be representative of longer-term operating periods. Expenses net of any voluntary waivers reflect expenses after reimbursement by the investment adviser but prior to reductions from brokerage service arrangements or other expense offset arrangements. Expenses net of all reductions represent the net expenses paid by the class.
See accompanying notes which are an integral part of the financial statements.
Real Estate Portfolio
Notes to Financial Statements
For the period ended December 31, 2004
1. Significant Accounting Policies.
Real Estate Portfolio (the fund) is a fund of Variable Insurance Products Fund IV, (the trust) (referred to in this report as Fidelity Variable Insurance Products: Real Estate Portfolio) and is authorized to issue an unlimited number of shares. The trust is registered under the Investment Company Act of 1940, as amended (the 1940 Act), as an open-end management investment company organized as a Massachusetts business trust. Shares of the fund may only be purchased by insurance companies for the purpose of funding variable annuity or variable life insurance contracts. The fund offers the following classes of shares: Initial Class shares, Service Class shares and Service Class 2 shares. All classes have equal rights and voting privileges, except for matters affecting a single class. Investment income, realized and unrealized capital gains and losses, the common expenses of the fund, and certain fund-level expense reductions, if any, are allocated on a pro rata basis to each class based on the relative net assets of each class to the total net assets of the fund. Each class differs with respect to distribution and service plan fees incurred. Certain expense reductions also differ by class.
The financial statements have been prepared in conformity with accounting principles generally accepted in the United States of America, which require management to make certain estimates and assumptions at the date of the financial statements. The following summarizes the significant accounting policies of the fund:
Security Valuation. Net asset value per share (NAV calculation) is calculated as of the close of business of the New York Stock Exchange, normally 4:00 p.m. Eastern time. Equity securities, including restricted securities, for which market quotations are available are valued at the last sale price or official closing price (closing bid price or last evaluated quote if no sale has occurred) on the primary market or exchange on which they trade. If prices are not readily available or do not accurately reflect fair value for a security, or if a security's value has been materially affected by events occurring after the close of the exchange or market on which the security is principally traded, that security may be valued by another method that the Board of Trustees believes accurately reflects fair value. A security's valuation may differ depending on the method used for determining value. Price movements in futures contracts and ADRs, market and trading trends, the bid/ask quotes of brokers and off-exchange institutional trading may be reviewed in the course of making a good faith determination of a security's fair value. Short-term securities with remaining maturities of sixty days or less for which quotations are not readily available are valued on the basis of amortized cost. Investments in open-end investment companies are valued at their net asset value each business day.
Foreign Currency. The fund uses foreign currency contracts to facilitate transactions in foreign-denominated securities. Losses from these transactions may arise from changes in the value of the foreign currency or if the counterparties do not perform under the contracts' terms.
Foreign-denominated assets, including investment securities, and liabilities are translated into U.S. dollars at the exchange rate at period end. Purchases and sales of investment securities, income and dividends received and expenses denominated in foreign currencies are translated into U.S. dollars at the exchange rate in effect on the transaction date.
The effects of exchange rate fluctuations on investments are included with the net realized and unrealized gain (loss) on investment securities. Other foreign currency transactions resulting in realized and unrealized gain (loss) are disclosed separately.
Investment Transactions and Income. Security transactions are accounted for as of trade date. Gains and losses on securities sold are determined on the basis of identified cost. Dividend income is recorded on the ex-dividend date, except for certain dividends from foreign securities where the ex-dividend date may have passed, which are recorded as soon as the fund is informed of the ex-dividend date. Non-cash dividends included in dividend income, if any, are recorded at the fair market value of the securities received. Distributions received on securities that represent a return of capital or capital gain are recorded as a reduction of cost of investments and/or as a realized gain. The fund estimates the components of distributions received that may be considered return of capital distributions or capital gain distributions. Interest income is accrued as earned. Interest income includes coupon interest and amortization of premium and accretion of discount on debt securities. Investment income is recorded net of foreign taxes withheld where recovery of such taxes is uncertain.
Expenses. Most expenses of the trust can be directly attributed to a fund. Expenses which cannot be directly attributed are apportioned among the funds in the trust.
Income Tax Information and Distributions to Shareholders. Each year, the fund intends to qualify as a regulated investment company by distributing all of its taxable income and realized gains under Subchapter M of the Internal Revenue Code. As a result, no provision for income taxes is required in the accompanying financial statements. Foreign taxes are provided for based on the fund's understanding of the tax rules and rates that exist in the foreign markets in which it invests.
Distributions are recorded on the ex-dividend date. Income dividends and capital gain distributions are declared separately for each class. Income and capital gain distributions are determined in accordance with income tax regulations, which may differ from generally accepted accounting principles.
Capital accounts within the financial statements are adjusted for permanent book-tax differences. These adjustments have no impact on net assets or the results of operations. Temporary book-tax differences will reverse in a subsequent period.
Annual Report
Notes to Financial Statements - continued
1. Significant Accounting Policies - continued
Income Tax Information and Distributions to Shareholders - continued
Book-tax differences are primarily due to foreign currency transactions and losses deferred due to wash sales.
The tax-basis components of distributable earnings and the federal tax cost as of period end were as follows:
Unrealized appreciation | $ 24,734,033 | |
Unrealized depreciation | (275,189) | |
Net unrealized appreciation (depreciation) | 24,458,844 | |
Undistributed ordinary income | 567,419 | |
Undistributed long-term capital gain | 589,207 | |
| | |
Cost for federal income tax purposes | $ 129,073,856 | |
The tax character of distributions paid was as follows:
| December 31, 2004 | December 31, 2003 |
Ordinary Income | $ 2,574,398 | $ 719,100 |
Long-term Capital Gains | 431,678 | 34,243 |
Total | $ 3,006,076 | $ 753,343 |
2. Operating Policies.
Repurchase Agreements. Fidelity Management & Research Company (FMR) has received an Exemptive Order from the Securities and Exchange Commission (the SEC) which permits the fund and other affiliated entities of FMR to transfer uninvested cash balances into joint trading accounts. These accounts are then invested in repurchase agreements that are collateralized by U.S. Treasury or Government obligations. The fund may also invest directly with institutions, in repurchase agreements that are collateralized by commercial paper obligations and corporate obligations. Collateral is held in segregated accounts with custodian banks and may be obtained in the event of a default of the counterparty. Collateral is marked-to-market daily and maintained at a value at least equal to the principal amount of the repurchase agreement (including accrued interest).
3. Purchases and Sales of Investments.
Purchases and sales of securities, other than short-term securities and U.S. government securities, aggregated $133,857,851 and $55,710,710, respectively.
4. Fees and Other Transactions with Affiliates.
Management Fee. FMR and its affiliates provide the fund with investment management related services for which the fund pays a monthly management fee. The management fee is the sum of an individual fund fee rate that is based on an annual rate of .30% of the fund's average net assets and a group fee rate that averaged .28% during the period. The group fee rate is based upon the average net assets of all the mutual funds advised by FMR. The group fee rate decreases as assets under management increase and increases as assets under management decrease. For the period, the total annual management fee rate was .57% of the fund's average net assets.
Distribution and Service Plan. In accordance with Rule 12b-1 of the 1940 Act, the fund has adopted separate 12b-1 Plans for each Service Class of shares. Each Service Class pays Fidelity Distributors Corporation (FDC), an affiliate of FMR, a service fee. For the period, the service fee is based on an annual rate of .10% of Service Class' average net assets and .25% of Service Class 2's average net assets.
For the period, each class paid FDC the following amounts, all of which were re-allowed to insurance companies for the distribution of shares and providing shareholder support services:
Service Class | $ 2,261 | |
Service Class 2 | 5,640 | |
| $ 7,901 | |
Real Estate Portfolio
4. Fees and Other Transactions with Affiliates - continued
Transfer Agent Fees. Fidelity Investments Institutional Operations Company, Inc. (FIIOC), an affiliate of FMR, is the fund's transfer, dividend disbursing, and shareholder servicing agent. FIIOC receives an asset-based fee with respect to each account. FIIOC pays a portion of the expenses related to the typesetting, printing and mailing of shareholder reports, except proxy statements. Each class pays a transfer agent fee, excluding out of pocket expenses, equal to an annual rate of .07% of their month end net assets. For the period, the total transfer agent fees paid by each class to FIIOC, including out of pocket expenses, were as follows:
Initial Class | $ 59,074 | |
Service Class | 1,514 | |
Service Class 2 | 1,510 | |
| $ 62,098 | |
Accounting Fees. Fidelity Service Company, Inc. (FSC), an affiliate of FMR, maintains the fund's accounting records. The fee is based on the level of average net assets for the month.
Central Funds. The fund may invest in affiliated Central Funds managed by Fidelity Investments Money Management, Inc. (FIMM), an affiliate of FMR. The Central Funds are open-end investment companies available only to investment companies and other accounts managed by FMR and its affiliates. The Central Funds seek preservation of capital and current income and do not pay a management fee. Income distributions earned by the fund are recorded as income in the accompanying financial statements and totaled $58,701 for the period.
Brokerage Commissions. The fund placed a portion of its portfolio transactions with brokerage firms which are affiliates of the investment adviser. The commissions paid to these affiliated firms were $15,456 for the period.
Interfund Lending Program. Pursuant to an Exemptive Order issued by the SEC, the fund, along with other registered investment companies having management contracts with FMR, may participate in an interfund lending program. This program provides an alternative credit facility allowing the funds to borrow from, or lend money to, other participating funds. At period end, there were no interfund loans outstanding. The fund's activity in this program during the period was as follows:
Borrower or Lender | Average Daily
Loan Balance | Weighted Average Interest Rate | Interest Earned
(included in
interest income) | Interest Expense |
Borrower | $ 3,276,222 | 1.13% | - | $ 928 |
5. Expense Reductions.
Many of the brokers with whom FMR places trades on behalf of the fund provided services to the fund in addition to trade execution. These services included payments of certain expenses on behalf of the fund totaling $18,086 for the period.
6. Other Information.
At the end of the period, FMR or its affiliates were the owners of record of 100% of the total outstanding shares of the fund.
Annual Report
Report of Independent Registered Public Accounting Firm
To the Trustees of Variable Insurance Products Fund IV and the Shareholders of Real Estate Portfolio:
In our opinion, the accompanying statement of assets and liabilities, including the schedule of investments, and the related statements of operations and of changes in net assets and the financial highlights present fairly, in all material respects, the financial position of Real Estate Portfolio (a fund of Variable Insurance Products Fund IV) at December 31, 2004 and the results of its operations, the changes in its net assets and the financial highlights for the periods indicated, in conformity with accounting principles generally accepted in the United States of America. These financial statements and financial highlights (hereafter referred to as "financial statements") are the responsibility of the Real Estate Portfolio's management; our responsibility is to express an opinion on these financial statements based on our audits. We conducted our audits of these financial statements in accordance with the standards of the Public Company Accounting Oversight Board (United States). Those standards require that we plan and perform the audit to obtain reasonable assurance about whether the financial statements are free of material misstatement. An audit includes examining, on a test basis, evidence supporting the amounts and disclosures in the financial statements, assessing the accounting principles used and significant estimates made by management, and evaluating the overall financial statement presentation. We believe that our audits, which included confirmation of securities at December 31, 2004 by correspondence with the custodian and brokers, provide a reasonable basis for our opinion.
/s/PricewaterhouseCoopers LLP
PricewaterhouseCoopers LLP
Boston, Massachusetts
February 18, 2005
Annual Report
Trustees and Officers
The Trustees, Member of the Advisory Board, and executive officers of the trust and fund, as applicable, are listed below. The Board of Trustees governs the fund and is responsible for protecting the interests of shareholders. The Trustees are experienced executives who meet periodically throughout the year to oversee the fund's activities, review contractual arrangements with companies that provide services to the fund, and review the fund's performance. Except for William O. McCoy, Dennis J. Dirks, and Kenneth L. Wolfe each of the Trustees oversees 301 funds advised by FMR or an affiliate. Mr. McCoy oversees 303 funds advised by FMR or an affiliate. Mr. Dirks and Mr. Wolfe oversee 233 funds advised by FMR or an affiliate.
The Trustees hold office without limit in time except that (a) any Trustee may resign; (b) any Trustee may be removed by written instrument, signed by at least two-thirds of the number of Trustees prior to such removal; (c) any Trustee who requests to be retired or who has become incapacitated by illness or injury may be retired by written instrument signed by a majority of the other Trustees; and (d) any Trustee may be removed at any special meeting of shareholders by a two-thirds vote of the outstanding voting securities of the trust. In any event, each non-interested Trustee shall retire not later than the last day of the calendar year in which his or her 72nd birthday occurs. The executive officers and Advisory Board Member hold office without limit in time, except that any officer and Advisory Board Member may resign or may be removed by a vote of a majority of the Trustees at any regular meeting or any special meeting of the Trustees. Except as indicated, each individual has held the office shown or other offices in the same company for the past five years.
The funds' Statement of Additional Information (SAI) includes more information about the Trustees. To request a free copy, call Fidelity at 1-800-544-5429.
Interested Trustees*:
Correspondence intended for each Trustee who is an "interested person" (as defined in the 1940 Act) may be sent to Fidelity Investments, 82 Devonshire Street, Boston, Massachusetts 02109.
Name, Age; Principal Occupation |
Edward C. Johnson 3d (74)** |
| Year of Election or Appointment:1983 Mr. Johnson is Chairman of the Board of Trustees. Mr. Johnson serves as Chief Executive Officer, Chairman, and a Director of FMR Corp.; a Director and Chairman of the Board and of the Executive Committee of FMR; Chairman and a Director of Fidelity Management & Research (Far East) Inc.; Chairman (1998) and a Director of Fidelity Investments Money Management, Inc.; and Chairman (2001) and a Director (2000) of FMR Co., Inc. |
Abigail P. Johnson (43)** |
| Year of Election or Appointment: 2001 Senior Vice President of VIP Real Estate (2002). Ms. Johnson also serves as Senior Vice President of other Fidelity funds (2001). She is President and a Director of FMR (2001), Fidelity Investments Money Management, Inc. (2001), FMR Co., Inc. (2001), and a Director of FMR Corp. Previously, Ms. Johnson managed a number of Fidelity funds. |
Laura B. Cronin (50) |
| Year of Election or Appointment: 2003 Ms. Cronin is an Executive Vice President (2002) and Chief Financial Officer (2002) of FMR Corp. and is a member of the Fidelity Management Committee (2003). Previously, Ms. Cronin served as Vice President of Finance of FMR (1997-1999), and Chief Financial Officer of FMR (1999-2001), Fidelity Personal Investments (2001), and Fidelity Brokerage Company (2001-2002). |
Robert L. Reynolds (52) |
| Year of Election or Appointment: 2003 Mr. Reynolds is a Director (2003) and Chief Operating Officer (2002) of FMR Corp. and is the head of the Fidelity Management Committee (2003). He also serves on the Board at Fidelity Investments Canada, Ltd. (2000). Previously, Mr. Reynolds served as President of Fidelity Investments Institutional Retirement Group (1996-2000). |
* Trustees have been determined to be "Interested Trustees" by virtue of, among other things, their affiliation with the trust or various entities under common control with FMR.
** Edward C. Johnson 3d, Trustee, is Abigail P. Johnson's father.
Annual Report
Trustees and Officers - continued
Non-Interested Trustees:
Correspondence intended for each non-interested Trustee (that is, the Trustees other than the Interested Trustees) may be sent to Fidelity Investments, P.O. Box 55235, Boston, Massachusetts 02205-5235.
Name, Age; Principal Occupation |
Dennis J. Dirks (56) |
| Year of Election or Appointment: 2005 Mr. Dirks also serves as a Trustee (2005) or Member of the Advisory Board (2004) of other investment companies advised by FMR. Prior to his retirement in May 2003, Mr. Dirks was Chief Operating Officer and a member of the Board of The Depository Trust & Clearing Corporation (DTCC) (1999-2003). He also served as President, Chief Operating Officer, and Board member of The Depository Trust Company (DTC) (1999-2003) and President and Board member of the National Securities Clearing Corporation (NSCC) (1999-2003). In addition, Mr. Dirks served as Chief Executive Officer and Board member of the Government Securities Clearing Corporation (2001-2003) and Chief Executive Officer and Board member of the Mortgage-Backed Securities Clearing Corporation (2001-2003). |
Robert M. Gates (61) |
| Year of Election or Appointment: 1997 Dr. Gates is Vice Chairman of the non-interested Trustees (2005). Dr. Gates is President of Texas A&M University (2002). He was Director of the Central Intelligence Agency (CIA) from 1991 to 1993. From 1989 to 1991, Dr. Gates served as Assistant to the President of the United States and Deputy National Security Advisor. Dr. Gates is a Director of NACCO Industries, Inc. (mining and manufacturing), Parker Drilling Co., Inc. (drilling and rental tools for the energy industry, 2001), and Brinker International (restaurant management, 2003). He also serves as a member of the Advisory Board of VoteHere.net (secure Internet voting, 2001). Previously, Dr. Gates served as a Director of LucasVarity PLC (automotive components and diesel engines), a Director of TRW Inc. (automotive, space, defense, and information technology), and Dean of the George Bush School of Government and Public Service at Texas A&M University (1999-2001). Dr. Gates also is a Trustee of the Forum for International Policy. |
George H. Heilmeier (68) |
| Year of Election or Appointment: 2004 Dr. Heilmeier is Chairman Emeritus of Telcordia Technologies (communication software and systems), where prior to his retirement, he served as company Chairman and Chief Executive Officer. He currently serves on the Boards of Directors of The Mitre Corporation (systems engineering and information technology support for the government), INET Technologies Inc. (telecommunications network surveillance, 2001), Teletech Holdings (customer management services), and HRL Laboratories (private research and development, 2004). He is Chairman of the General Motors Technology Advisory Committee and a Life Fellow of the Institute of Electrical and Electronics Engineers (IEEE) (2000). Dr. Heilmeier is a member of the Defense Science Board and the National Security Agency Advisory Board. He is also a member of the National Academy of Engineering, the American Academy of Arts and Sciences, and the Board of Overseers of the School of Engineering and Applied Science of the University of Pennsylvania. Previously, Dr. Heilmeier served as a Director of TRW Inc. (automotive, space, defense, and information technology, 1992-2002), Compaq (1994-2002), and Automatic Data Processing, Inc. (ADP) (technology-based business outsourcing, 1995-2002). |
Marie L. Knowles (58) |
| Year of Election or Appointment: 2001 Prior to Ms. Knowles' retirement in June 2000, she served as Executive Vice President and Chief Financial Officer of Atlantic Richfield Company (ARCO) (diversified energy, 1996-2000). From 1993 to 1996, she was a Senior Vice President of ARCO and President of ARCO Transportation Company. She served as a Director of ARCO from 1996 to 1998. She currently serves as a Director of Phelps Dodge Corporation (copper mining and manufacturing) and McKesson Corporation (healthcare service, 2002). Ms. Knowles is a Trustee of the Brookings Institution and the Catalina Island Conservancy and also serves as a member of the Advisory Board for the School of Engineering of the University of Southern California. |
Ned C. Lautenbach (60) |
| Year of Election or Appointment: 2000 Mr. Lautenbach has been a partner of Clayton, Dubilier & Rice, Inc. (private equity investment firm) since September 1998. Previously, Mr. Lautenbach was with the International Business Machines Corporation (IBM) from 1968 until his retirement in 1998. He was most recently Senior Vice President and Group Executive of Worldwide Sales and Services. From 1993 to 1995, he was Chairman of IBM World Trade Corporation, and from 1994 to 1998 was a member of IBM's Corporate Executive Committee. Mr. Lautenbach serves as Co-Chairman and a Director of Covansys, Inc. (global provider of business and technology solutions, 2000). In addition, he is a Director of Italtel Holding S.p.A. (telecommunications (Milan, Italy), 2004) and Eaton Corporation (diversified industrial) as well as the Philharmonic Center for the Arts in Naples, Florida (1999). He also is a member of the Council on Foreign Relations. |
Marvin L. Mann (71) |
| Year of Election or Appointment: 1993 Mr. Mann is Chairman of the non-interested Trustees (2001). He is Chairman Emeritus of Lexmark International, Inc. (computer peripherals), where he served as CEO until April 1998, retired as Chairman May 1999, and remains a member of the Board. Prior to 1991, he held the positions of Vice President of International Business Machines Corporation (IBM) and President and General Manager of various IBM divisions and subsidiaries. He is a member of the Executive Committee of the Independent Director's Council of the Investment Company Institute. In addition, Mr. Mann is a member of the President's Cabinet at the University of Alabama and the Board of Visitors of the Culverhouse College of Commerce and Business Administration at the University of Alabama. |
William O. McCoy (71) |
| Year of Election or Appointment: 1997 Prior to his retirement in December 1994, Mr. McCoy was Vice Chairman of the Board of BellSouth Corporation (telecommunications) and President of BellSouth Enterprises. He is currently a Director of Liberty Corporation (holding company), Duke Realty Corporation (real estate), and Progress Energy, Inc. (electric utility). He is also a partner of Franklin Street Partners (private investment management firm) and a member of the Research Triangle Foundation Board. In addition, Mr. McCoy served as the Interim Chancellor (1999-2000) and a member of the Board of Visitors (1994-1998) for the University of North Carolina at Chapel Hill and currently serves on the Board of Directors of the University of North Carolina Health Care System and the Board of Visitors of the Kenan-Flagler Business School (University of North Carolina at Chapel Hill). He also served as Vice President of Finance for the University of North Carolina (16-school system, 1995-1998). |
Cornelia M. Small (60) |
| Year of Election or Appointment: 2005 Ms. Small is a member (2000) and Chairperson (2002) of the Investment Committee, and a member (2002) of the Board of Trustees of Smith College. Previously, she served as Chief Investment Officer (1999-2000), Director of Global Equity Investments (1996-1999), and a member of the Board of Directors of Scudder, Stevens & Clark (1990-1997) and Scudder Kemper Investments (1997-1998). In addition, Ms. Small served as Co-Chair (2000-2003) of the Annual Fund for the Fletcher School of Law and Diplomacy. |
William S. Stavropoulos (65) |
| Year of Election or Appointment: 2001 Mr. Stavropoulos is Chairman of the Board (2000), CEO (2002), a position he previously held from 1995-2000, Chairman of the Executive Committee (2000), and a Member of the Board of Directors of The Dow Chemical Company. Since joining The Dow Chemical Company in 1967, Mr. Stavropoulos served in numerous senior management positions, including President (1993-2000; 2002-2003). Currently, he is a Director of NCR Corporation (data warehousing and technology solutions), BellSouth Corporation (telecommunications), Chemical Financial Corporation, and Maersk Inc. (industrial conglomerate, 2002). He also serves as a member of the Board of Trustees of the American Enterprise Institute for Public Policy Research. In addition, Mr. Stavropoulos is a member of The Business Council, J.P. Morgan International Council and the University of Notre Dame Advisory Council for the College of Science. |
Kenneth L. Wolfe (65) |
| Year of Election or Appointment: 2005 Mr. Wolfe also serves as a Trustee (2005) or Member of the Advisory Board (2004) of other investment companies advised by FMR. Prior to his retirement in 2001, Mr. Wolfe was Chairman and Chief Executive Officer of Hershey Foods Corporation (1993-2001). He currently serves as a member of the boards of Adelphia Communications Corporation (2003), Bausch & Lomb, Inc., and Revlon Inc. (2004). |
Advisory Board Member and Executive Officers:
Correspondence intended for each executive officer and Mr. Lynch may be sent to Fidelity Investments, 82 Devonshire Street, Boston, Massachusetts 02109.
Name, Age; Principal Occupation |
Peter S. Lynch (61) |
| Year of Election or Appointment: 2003 Member of the Advisory Board of Variable Insurance Products Fund IV. Vice Chairman and a Director of FMR, and Vice Chairman (2001) and a Director (2000) of FMR Co., Inc. Previously, Mr. Lynch served as a Trustee of the Fidelity funds (1990-2003). Prior to May 31, 1990, he was a Director of FMR and Executive Vice President of FMR (a position he held until March 31, 1991), Vice President of Fidelity® Magellan® Fund and FMR Growth Group Leader, and Managing Director of FMR Corp. Mr. Lynch was also Vice President of Fidelity Investments Corporate Services. In addition, he serves as a Trustee of Boston College, Massachusetts Eye & Ear Infirmary, Historic Deerfield, John F. Kennedy Library, and the Museum of Fine Arts of Boston. |
Bart A. Grenier (45) |
| Year of Election or Appointment: 2002 Vice President of VIP Real Estate. Mr. Grenier also serves as Vice President of certain Equity Funds (2001), a position he previously held from 1999 to 2000, and Vice President of certain High Income Funds (2002). He is Senior Vice President of FMR (1999) and FMR Co., Inc. (2001), and President and Director of Strategic Advisers, Inc. (2002). He also heads Fidelity's Asset Allocation Group (2000), Fidelity's Growth and Income Group (2001), Fidelity's Value Group (2001), and Fidelity's High Income Division (2001). Previously, Mr. Grenier served as President of Fidelity Ventures (2000), Vice President of certain High Income Funds (1997-2000), High Income Division Head (1997-2000), Group Leader of the Income-Growth and Asset Allocation-Income Groups (1996-2000), and Assistant Equity Division Head (1997-2000). |
Steven J. Buller (37) |
| Year of Election or Appointment: 2002 Vice President of VIP Real Estate. Mr. Buller also serves as Vice President of other funds advised by FMR. Prior to assuming his current responsibilities, Mr. Buller managed a variety of Fidelity funds. Mr. Buller also serves as Vice President of FMR (2000) and FMR Co., Inc. (2001). |
Eric D. Roiter (56) |
| Year of Election or Appointment: 2002 Secretary of VIP Real Estate. He also serves as Secretary of other Fidelity funds; Vice President, General Counsel, and Secretary of FMR Co., Inc. (2001-present) and FMR; Vice President and Secretary of FDC; Assistant Secretary of Fidelity Management & Research (U.K.) Inc. (2001-present), Fidelity Management & Research (Far East) Inc. (2001-present), and Fidelity Investments Money Management, Inc. (2001-present). Mr. Roiter is an Adjunct Member, Faculty of Law, at Boston College Law School (2003-present). |
Stuart Fross (45) |
| Year of Election or Appointment: 2003 Assistant Secretary of VIP Real Estate. Mr. Fross also serves as Assistant Secretary of other Fidelity funds (2003) and is an employee of FMR. |
Christine Reynolds (46) |
| Year of Election or Appointment: 2004 President, Treasurer, and Anti-Money Laundering (AML) officer of VIP Real Estate. Ms. Reynolds also serves as President, Treasurer, and AML officer of other Fidelity funds (2004) and is a Vice President (2003) and an employee (2002) of FMR. Before joining Fidelity Investments, Ms. Reynolds worked at PricewaterhouseCoopers LLP (PwC) (1980-2002), where she was most recently an audit partner with PwC's investment management practice. |
Timothy F. Hayes (54) |
| Year of Election or Appointment: 2002 Chief Financial Officer of VIP Real Estate. Mr. Hayes also serves as Chief Financial Officer of other Fidelity funds (2002). Recently he was appointed President of Fidelity Service Company (2003) where he also serves as a Director. Mr. Hayes also serves as President of Fidelity Investments Operations Group (FIOG, 2002), which includes Fidelity Pricing and Cash Management Services Group (FPCMS), where he was appointed President in 1998. Previously, Mr. Hayes served as Chief Financial Officer of Fidelity Investments Corporate Systems and Service Group (1998) and Fidelity Systems Company (1997-1998). |
Kenneth A. Rathgeber (57) |
| Year of Election or Appointment: 2004 Chief Compliance Officer of VIP Real Estate. Mr. Rathgeber also serves as Chief Compliance Officer of other Fidelity funds (2004) and Executive Vice President of Risk Oversight for Fidelity Investments (2002). Previously, he served as Executive Vice President and Chief Operating Officer for Fidelity Investments Institutional Services Company, Inc. (1998-2002). |
John R. Hebble (46) |
| Year of Election or Appointment: 2003 Deputy Treasurer of VIP Real Estate. Mr. Hebble also serves as Deputy Treasurer of other Fidelity funds (2003), and is an employee of FMR. Before joining Fidelity Investments, Mr. Hebble worked at Deutsche Asset Management where he served as Director of Fund Accounting (2002-2003) and Assistant Treasurer of the Scudder Funds (1998-2003). |
Kimberley H. Monasterio (41) |
| Year of Election or Appointment: 2004 Deputy Treasurer of VIP Real Estate. Ms. Monasterio also serves as Deputy Treasurer of other Fidelity funds (2004) and is an employee of FMR (2004). Before joining Fidelity Investments, Ms. Monasterio served as Treasurer (2000-2004) and Chief Financial Officer (2002-2004) of the Franklin Templeton Funds and Senior Vice President of Franklin Templeton Services, LLC (2000-2004). |
John H. Costello (58) |
| Year of Election or Appointment: 2002 Assistant Treasurer of VIP Real Estate. Mr. Costello also serves as Assistant Treasurer of other Fidelity funds and is an employee of FMR. |
Peter L. Lydecker (50) |
| Year of Election or Appointment: 2004 Assistant Treasurer of VIP Real Estate. Mr. Lydecker also serves as Assistant Treasurer of other Fidelity funds (2004) and is an employee of FMR. |
Mark Osterheld (49) |
| Year of Election or Appointment: 2002 Assistant Treasurer of VIP Real Estate. Mr. Osterheld also serves as Assistant Treasurer of other Fidelity funds (2002) and is an employee of FMR. |
Kenneth B. Robins (35) |
| Year of Election or Appointment:2004 Assistant Treasurer of VIP Real Estate. Mr. Robins also serves as Assistant Treasurer of other Fidelity funds (2004) and is an employee of FMR (2004). Before joining Fidelity Investments, Mr. Robins worked at KPMG LLP, where he was a partner in KPMG's department of professional practice (2002-2004) and a Senior Manager (1999-2000). In addition, Mr. Robins served as Assistant Chief Accountant, United States Securities and Exchange Commission (2000-2002). |
Annual Report
Proxy Voting Results
A special meeting of the fund's shareholders was held on December 14, 2004. The results of votes taken among shareholders on proposals before them are reported below. Each vote reported represents one dollar of net asset value held on the record date for the meeting.
PROPOSAL 1 |
To amend the Declaration of Trust to allow the Board of Trustees, if permitted by applicable law, to authorize fund mergers without shareholder approval. A |
| # of
Votes | % of
Votes |
Affirmative | 458,190,063.70 | 83.431 |
Against | 70,246,908.89 | 12.791 |
Abstain | 20,745,786.74 | 3.778 |
TOTAL | 549,182,759.33 | 100.000 |
PROPOSAL 2 |
To elect a Board of Trustees. A |
| # of
Votes | % of
Votes |
J. Michael Cook |
Affirmative | 521,583,205.95 | 94.974 |
Withheld | 27,599,553.38 | 5.026 |
TOTAL | 549,182,759.33 | 100.000 |
Ralph F. Cox |
Affirmative | 519,150,329.49 | 94.531 |
Withheld | 30,032,429.84 | 5.469 |
TOTAL | 549,182,759.33 | 100.000 |
Laura B. Cronin |
Affirmative | 520,911,931.53 | 94.852 |
Withheld | 28,270,827.80 | 5.148 |
TOTAL | 549,182,759.33 | 100.000 |
Dennis J. Dirks B |
Affirmative | 521,590,729.90 | 94.976 |
Withheld | 27,592,029.43 | 5.024 |
TOTAL | 549,182,759.33 | 100.000 |
Robert M. Gates |
Affirmative | 519,905,480.12 | 94.669 |
Withheld | 29,277,279.21 | 5.331 |
TOTAL | 549,182,759.33 | 100.000 |
George H. Heilmeier |
Affirmative | 520,921,777.54 | 94.854 |
Withheld | 28,260,981.79 | 5.146 |
TOTAL | 549,182,759.33 | 100.000 |
Abigail P. Johnson |
Affirmative | 519,065,339.91 | 94.516 |
Withheld | 30,117,419.42 | 5.484 |
TOTAL | 549,182,759.33 | 100.000 |
Edward C. Johnson 3d |
Affirmative | 518,847,346.05 | 94.476 |
Withheld | 30,335,413.28 | 5.524 |
TOTAL | 549,182,759.33 | 100.000 |
Donald J. Kirk |
Affirmative | 521,181,241.00 | 94.901 |
Withheld | 28,001,518.33 | 5.099 |
TOTAL | 549,182,759.33 | 100.000 |
| # of
Votes | % of
Votes |
Marie L. Knowles |
Affirmative | 521,391,176.23 | 94.939 |
Withheld | 27,791,583.10 | 5.061 |
TOTAL | 549,182,759.33 | 100.000 |
Ned C. Lautenbach |
Affirmative | 521,804,568.92 | 95.015 |
Withheld | 27,378,190.41 | 4.985 |
TOTAL | 549,182,759.33 | 100.000 |
Marvin L. Mann |
Affirmative | 520,497,408.02 | 94.777 |
Withheld | 28,685,351.31 | 5.223 |
TOTAL | 549,182,759.33 | 100.000 |
William O. McCoy |
Affirmative | 520,233,312.84 | 94.729 |
Withheld | 28,949,446.49 | 5.271 |
TOTAL | 549,182,759.33 | 100.000 |
Robert L. Reynolds |
Affirmative | 521,415,834.89 | 94.944 |
Withheld | 27,766,924.44 | 5.056 |
TOTAL | 549,182,759.33 | 100.000 |
Cornelia M. Small B |
Affirmative | 521,014,631.05 | 94.871 |
Withheld | 28,168,128.28 | 5.129 |
TOTAL | 549,182,759.33 | 100.000 |
William S. Stavropoulos |
Affirmative | 520,522,282.96 | 94.781 |
Withheld | 28,660,476.37 | 5.219 |
TOTAL | 549,182,759.33 | 100.000 |
A Denotes trust-wide proposals and voting results. B Effective January 1, 2005. |
Annual Report
Distributions
The Board of Trustees of Variable Insurance Products: Real Estate Portfolio voted to pay to shareholders of record at the opening of business on record date, the following distributions per share derived from capital gains realized from sales of portfolio securities, and dividends derived from net investment income:
| Pay Date | Record Date | Capital Gains |
Initial Class | 2/11/05 | 2/11/05 | $.135 |
Service Class | 2/11/05 | 2/11/05 | $.135 |
Service Class 2 | 2/11/05 | 2/11/05 | $.135 |
The fund will notify shareholders in January 2005 of amounts for use in preparing 2004 income tax returns.
Annual Report
Investment Adviser
Fidelity Management & Research Company
Boston, MA
Investment Sub-Advisers
FMR Co., Inc.
Fidelity Management & Research (U.K.) Inc.
Fidelity Management & Research (Far East) Inc.
Fidelity Investments Japan Limited
Fidelity International Investment Advisors
Fidelity International Investment Advisors (U.K.) Ltd.
General Distributor
Fidelity Distributors Corporation
Boston, MA
Transfer and Shareholder Servicing Agent
Fidelity Investments Institutional Operations Company, Inc.
Boston, MA
Custodian
Mellon Bank, N.A.
Pittsburgh, PA
VIPRE-ANN-0205
1.781992.102
Fidelity® Variable Insurance Products:
Value Leaders Portfolio
Annual Report
December 31, 2004
(2_fidelity_logos) (Registered_Trademark)
Contents
Performance | 3 | How the fund has done over time. |
Management's Discussion | 4 | The manager's review of fund performance, strategy and outlook. |
Shareholder Expense Example | 5 | An example of shareholder expenses. |
Investment Summary | 6 | A summary of the fund's investments at period end. |
Investments | 7 | A complete list of the fund's investments with their
market values. |
Financial Statements | 11 | Statements of assets and liabilities, operations, and
changes in net assets, as well as financial highlights. |
Notes | 15 | Notes to the financial statements. |
Report of Independent Registered Public Accounting Firm | 18 | |
Trustees and Officers | 19 | |
Distributions | 24 | |
Proxy Voting Results | 25 | |
| | |
| | |
| | |
To view a fund's proxy voting guidelines and proxy voting record for the 12-month period ended June 30, visit www.fidelity.com/proxyvotingresults or visit the Securities and Exchange Commission's (SEC) web site at www.sec.gov. You may also call 1-800-544-5429 to request a free copy of the proxy voting guidelines.
Fidelity Variable Insurance Products are separate account options which are purchased through a variable insurance contract.
Standard & Poor's, S&P and S&P 500 are registered service marks of The McGraw-Hill Companies, Inc. and have been licensed for use by Fidelity Distributors Corporation.
Other third party marks appearing herein are the property of their respective owners.
All other marks appearing herein are registered or unregistered trademarks or service marks of FMR Corp. or an affiliated company.
(Recycle graphic) This report is printed on recycled paper using soy-based inks.
This report and the financial statements contained herein are submitted for the general information of the shareholders of the fund. This report is not authorized for distribution to prospective investors in the fund unless preceded or accompanied by an effective prospectus.
A fund files its complete schedule of portfolio holdings with the SEC for the first and third quarters of each fiscal year on Form N-Q. Forms N-Q are available on the SEC's web site at http://www.sec.gov. A fund's Forms N-Q may be reviewed and copied at the SEC's Public Reference Room in Washington, DC. Information regarding the operation of the SEC's Public Reference Room may be obtained by calling 1-800-SEC-0330. For a complete list of a fund's portfolio holdings, view the most recent quarterly holdings report, semiannual report, or annual report on Fidelity's web site at http://www.advisor.fidelity.com.
NOT FDIC INSURED · MAY LOSE VALUE · NO BANK GUARANTEE
Neither the fund nor Fidelity Distributors Corporation is a bank.
Value Leaders Portfolio
Fidelity Variable Insurance Products: Value Leaders Portfolio
Performance: The Bottom Line
Average annual total return reflects the change in the value of an investment, assuming reinvestment of the class' dividend income and capital gains (the profits earned upon the sale of securities that have grown in value) and assuming a constant rate of performance each year. During periods of reimbursement by Fidelity, a fund's total return will be greater than it would be had the reimbursement not occurred. Performance numbers are net of all underlying fund operating expenses, but do not include any insurance charges imposed by your insurance company's separate account. If performance information included the effect of these additional charges, the total returns would have been lower. How a fund did yesterday is no guarantee of how it will do tomorrow.
Average Annual Total Returns
Periods ended December 31, 2004 | | Past 1
year | Life of fund A |
Fidelity VIP®: Value Leaders Portfolio - Initial Class | | 15.15% | 18.29% |
Fidelity VIP: Value Leaders Portfolio - Service Class B | | 15.08% | 18.17% |
Fidelity VIP: Value Leaders Portfolio - Service Class 2 C | | 14.91% | 17.98% |
A From June 17, 2003.
B Performance for Service Class shares reflects an asset-based service fee (12b-1 fee).
C Performance for Service Class 2 shares reflects an asset-based service fee (12b-1 fee).
$10,000 Over Life of Fund
Let's say hypothetically that $10,000 was invested in Fidelity® Variable Insurance Products: Value Leaders Portfolio - Initial Class on June 17, 2003, when the fund started. The chart shows how the value of your investment would have changed, and also shows how the Russell 1000® Value Index performed over the same period.
Annual Report
Fidelity Variable Insurance Products: Value Leaders Portfolio
Management's Discussion of Fund Performance
Comments from Brian Hogan, Portfolio Manager of Fidelity® Variable Insurance Products: Value Leaders Portfolio
The year ending December 31, 2004, generally was positive for equity investors, as many stock market benchmarks produced double-digit gains. Broad-based themes included the continued dominance of small-cap stocks, which outperformed large-caps for the sixth consecutive year. The small-cap Russell 2000® Index was up 18.33% in 2004, while the larger-cap Standard & Poor's 500SM Index rose 10.88%. Value stocks ended the year well ahead of growth stocks: The Russell 3000® Value Index advanced 16.94%, compared to 6.93% for the Russell 3000 Growth Index. Energy and basic materials stocks led the market upward. Energy stocks were boosted by record-high oil prices, while strong demand from China helped support commodity prices. The health care sector was among the market's weakest performers. Technology also fell off the pace, though it was helped by a rally late in the year. The tech-heavy NASDAQ Composite® Index returned 9.15%, thanks primarily to a 14.87% jump in the fourth quarter. Elsewhere, the Dow Jones Industrial AverageSM gained 5.37% for the year.
For the one-year period that ended December 31, 2004, the fund modestly underperformed the Russell 1000® Value Index, which returned 16.49%, but outperformed the LipperSM Variable Annuity Growth Funds Average, which returned 10.36%. The largest detractor relative to the index was Clear Channel Communications, which owns 1,200 radio stations and whose stock declined after the company's revenues didn't meet expectations. Underweighting strong-performing Exxon Mobil also took a big toll on performance relative to the Russell index, as the company benefited from high oil prices. On the positive side, industrial conglomerate Tyco International was the fund's top contributor in both relative and absolute terms. The company benefited from its new management team, significantly reduced its gross debt and generated more cash than had been anticipated. Another key contributor was Nucor Corporation, the largest U.S. steel maker. Its stock continued to rise as the company significantly exceeded consensus earnings estimates due to better-than-expected pricing and continued strong product demand.
The views expressed in this statement reflect those of the portfolio manager only through the end of the period of the report as stated on the cover and do not necessarily represent the views of Fidelity or any other person in the Fidelity organization. Any such views are subject to change at any time based upon market or other conditions and Fidelity disclaims any responsibility to update such views. These views may not be relied on as investment advice and, because investment decisions for a Fidelity fund are based on numerous factors, may not be relied on as an indication of trading intent on behalf of any Fidelity fund.
Annual Report
Fidelity Variable Insurance Products: Value Leaders Portfolio
Shareholder Expense Example
As a shareholder of the Fund, you incur two types of costs: (1) transaction costs, and (2) ongoing costs, including management fees, distribution and/or service (12b-1) fees and other Fund expenses. This Example is intended to help you understand your ongoing costs (in dollars) of investing in the Fund and to compare these costs with the ongoing costs of investing in other mutual funds.
The Example is based on an investment of $1,000 invested at the beginning of the period and held for the entire period (July 1, 2004 to December 31, 2004).
Actual Expenses
The first line of the table below for each class of the Fund provides information about actual account values and actual expenses. You may use the information in this line, together with the amount you invested, to estimate the expenses that you paid over the period. Simply divide your account value by $1,000.00 (for example, an $8,600 account value divided by $1,000.00 = 8.6), then multiply the result by the number in the first line for a class of the Fund under the heading entitled "Expenses Paid During Period" to estimate the expenses you paid on your account during this period. The estimate of expenses does not include any fees or other expenses of any variable annuity or variable life insurance product. If they were, the estimate of expenses you paid during the period would be higher, and your ending account value would be lower.
Hypothetical Example for Comparison Purposes
The second line of the table below for each class of the Fund provides information about hypothetical account values and hypothetical expenses based on a Class' actual expense ratio and an assumed rate of return of 5% per year before expenses, which is not the Class' actual return. The hypothetical account values and expenses may not be used to estimate the actual ending account balance or expenses you paid for the period. You may use this information to compare the ongoing costs of investing in the Fund and other funds. To do so, compare this 5% hypothetical example with the 5% hypothetical examples that appear in the shareholder reports of the other funds. The estimate of expenses does not include any fees or other expenses of any variable annuity or variable life insurance product. If they were, the estimate of expenses you paid during the period would be higher, and your ending account value would be lower.
Please note that the expenses shown in the table are meant to highlight your ongoing costs only and do not reflect any transaction costs. Therefore, the second line of the table is useful in comparing ongoing costs only, and will not help you determine the relative total costs of owning different funds.
| Beginning
Account Value
July 1, 2004 | Ending
Account Value
December 31, 2004 | Expenses Paid
During Period*
July 1, 2004
to December 31, 2004 |
Initial Class | | | |
Actual | $ 1,000.00 | $ 1,100.90 | $ 5.28 * * |
HypotheticalA | $ 1,000.00 | $ 1,020.11 | $ 5.08 * * |
Service Class | | | |
Actual | $ 1,000.00 | $ 1,101.10 | $ 5.81 * * |
HypotheticalA | $ 1,000.00 | $ 1,019.61 | $ 5.58 * * |
Service Class 2 | | | |
Actual | $ 1,000.00 | $ 1,099.40 | $ 6.60 * * |
HypotheticalA | $ 1,000.00 | $ 1,018.85 | $ 6.34 * * |
A 5% return per year before expenses
* Expenses are equal to each Class' annualized expense ratio (shown in the table below); multiplied by the average account value over the period, multiplied by 184/366 (to reflect the one-half year period).
| Annualized
Expense Ratio |
Initial Class | 1.00% * * |
Service Class | 1.10% * * |
Service Class 2 | 1.25% * * |
* * If changes to voluntary expense limitations effective February 1, 2005 had been in effect during the period, the annualized expense ratio and the expenses paid in the actual and hypothetical examples would have been as follows:
| Annualized
Expense Ratio | Expenses
Paid |
Initial Class | .85% | |
Actual | | $ 4.49 |
HypotheticalA | | $ 4.32 |
Service Class | .95% | |
Actual | | $ 5.02 |
HypotheticalA | | $ 4.82 |
Service Class 2 | 1.10% | |
Actual | | $ 5.81 |
HypotheticalA | | $ 5.58 |
A 5% return per year before expenses
Annual Report
Fidelity Variable Insurance Products: Value Leaders Portfolio
Investment Summary
Top Five Stocks as of December 31, 2004 |
| % of fund's
net assets |
General Electric Co. | 6.1 |
Exxon Mobil Corp. | 3.6 |
Bank of America Corp. | 3.4 |
American International Group, Inc. | 2.5 |
Honeywell International, Inc. | 2.4 |
| 18.0 |
Top Five Market Sectors as of December 31, 2004 |
| % of fund's
net assets |
Financials | 20.3 |
Industrials | 19.2 |
Energy | 12.7 |
Health Care | 10.4 |
Consumer Discretionary | 9.2 |
Asset Allocation as of December 31, 2004 |
% of fund's net assets * |
 | Stocks | 99.7% | |
 | Short-Term
Investments and
Net Other Assets | 0.3% | |

* Foreign investments 3.5% | |
Annual Report
Fidelity Variable Insurance Products: Value Leaders Portfolio
Investments December 31, 2004
Showing Percentage of Net Assets
Common Stocks - 99.7% |
| Shares | | Value (Note 1) |
CONSUMER DISCRETIONARY - 9.2% |
Distributors - 0.1% |
WESCO International, Inc. (a) | 300 | | $ 8,892 |
Hotels, Restaurants & Leisure - 1.0% |
McDonald's Corp. | 1,840 | | 58,990 |
Wendy's International, Inc. | 100 | | 3,926 |
| | 62,916 |
Household Durables - 1.6% |
Blount International, Inc. (a) | 400 | | 6,968 |
Centex Corp. | 500 | | 29,790 |
KB Home | 300 | | 31,320 |
LG Electronics, Inc. | 100 | | 6,192 |
Sony Corp. sponsored ADR | 400 | | 15,584 |
Techtronic Industries Co. Ltd. | 5,500 | | 11,994 |
| | 101,848 |
Leisure Equipment & Products - 0.3% |
Eastman Kodak Co. | 620 | | 19,995 |
Media - 4.0% |
Clear Channel Communications, Inc. | 1,180 | | 39,518 |
Emmis Communications Corp.
Class A (a) | 550 | | 10,555 |
Fox Entertainment Group, Inc. Class A (a) | 300 | | 9,378 |
Grupo Televisa SA de CV sponsored ADR | 300 | | 18,150 |
Lamar Advertising Co. Class A (a) | 600 | | 25,668 |
News Corp. Class A | 338 | | 6,307 |
NTL, Inc. (a) | 105 | | 7,661 |
Omnicom Group, Inc. | 160 | | 13,491 |
Time Warner, Inc. (a) | 1,350 | | 26,244 |
Univision Communications, Inc.
Class A (a) | 100 | | 2,927 |
Valassis Communications, Inc. (a) | 200 | | 7,002 |
Viacom, Inc. Class B (non-vtg.) | 1,213 | | 44,141 |
Walt Disney Co. | 1,680 | | 46,704 |
| | 257,746 |
Multiline Retail - 0.8% |
99 Cents Only Stores (a) | 1,200 | | 19,392 |
JCPenney Co., Inc. | 400 | | 16,560 |
Nordstrom, Inc. | 300 | | 14,019 |
| | 49,971 |
Specialty Retail - 1.4% |
American Eagle Outfitters, Inc. | 200 | | 9,420 |
CarMax, Inc. (a) | 300 | | 9,315 |
Home Depot, Inc. | 900 | | 38,466 |
The Pep Boys - Manny, Moe & Jack | 400 | | 6,828 |
Toys 'R' Us, Inc. (a) | 1,400 | | 28,658 |
| | 92,687 |
TOTAL CONSUMER DISCRETIONARY | | 594,055 |
CONSUMER STAPLES - 3.5% |
Beverages - 0.3% |
PepsiCo, Inc. | 350 | | 18,270 |
|
| Shares | | Value (Note 1) |
Food & Staples Retailing - 0.5% |
Albertsons, Inc. | 500 | | $ 11,940 |
Safeway, Inc. (a) | 1,100 | | 21,714 |
| | 33,654 |
Food Products - 0.3% |
Bunge Ltd. | 200 | | 11,402 |
Smithfield Foods, Inc. (a) | 200 | | 5,918 |
| | 17,320 |
Household Products - 0.1% |
Clorox Co. | 140 | | 8,250 |
Personal Products - 0.4% |
Gillette Co. | 600 | | 26,868 |
Tobacco - 1.9% |
Altria Group, Inc. | 1,970 | | 120,367 |
TOTAL CONSUMER STAPLES | | 224,729 |
ENERGY - 12.7% |
Energy Equipment & Services - 5.0% |
Baker Hughes, Inc. | 200 | | 8,534 |
BJ Services Co. | 300 | | 13,962 |
ENSCO International, Inc. | 510 | | 16,187 |
FMC Technologies, Inc. (a) | 200 | | 6,440 |
GlobalSantaFe Corp. | 700 | | 23,177 |
Halliburton Co. | 1,500 | | 58,860 |
Hornbeck Offshore Services, Inc. | 400 | | 7,720 |
National-Oilwell, Inc. (a) | 210 | | 7,411 |
Pride International, Inc. (a) | 1,500 | | 30,810 |
Rowan Companies, Inc. (a) | 300 | | 7,770 |
Schlumberger Ltd. (NY Shares) | 200 | | 13,390 |
Smith International, Inc. (a) | 300 | | 16,323 |
Transocean, Inc. (a) | 1,000 | | 42,390 |
Varco International, Inc. (a) | 1,260 | | 36,729 |
Weatherford International Ltd. (a) | 620 | | 31,806 |
| | 321,509 |
Oil & Gas - 7.7% |
Apache Corp. | 430 | | 21,745 |
BP PLC sponsored ADR | 340 | | 19,856 |
Burlington Resources, Inc. | 740 | | 32,190 |
ChevronTexaco Corp. | 1,200 | | 63,012 |
ConocoPhillips | 430 | | 37,337 |
Encore Acquisition Co. (a) | 300 | | 10,473 |
Exxon Mobil Corp. | 4,550 | | 233,233 |
Occidental Petroleum Corp. | 550 | | 32,098 |
Premcor, Inc. | 370 | | 15,603 |
Quicksilver Resources, Inc. (a) | 600 | | 22,068 |
Valero Energy Corp. | 300 | | 13,620 |
| | 501,235 |
TOTAL ENERGY | | 822,744 |
Common Stocks - continued |
| Shares | | Value (Note 1) |
FINANCIALS - 20.3% |
Capital Markets - 3.9% |
Bear Stearns Companies, Inc. | 400 | | $ 40,924 |
Lehman Brothers Holdings, Inc. | 500 | | 43,740 |
Merrill Lynch & Co., Inc. | 1,640 | | 98,023 |
Morgan Stanley | 840 | | 46,637 |
State Street Corp. | 300 | | 14,736 |
TradeStation Group, Inc. (a) | 800 | | 5,616 |
| | 249,676 |
Commercial Banks - 6.3% |
Banco Bradesco SA sponsored ADR (non-vtg.) | 600 | | 15,036 |
Bank of America Corp. | 4,598 | | 216,060 |
Texas Capital Bancshares, Inc. (a) | 300 | | 6,486 |
UCBH Holdings, Inc. | 400 | | 18,328 |
Wachovia Corp. | 2,312 | | 121,611 |
Wells Fargo & Co. | 450 | | 27,968 |
| | 405,489 |
Consumer Finance - 0.2% |
MBNA Corp. | 500 | | 14,095 |
Diversified Financial Services - 1.8% |
Citigroup, Inc. | 1,650 | | 79,497 |
J.P. Morgan Chase & Co. | 896 | | 34,953 |
| | 114,450 |
Insurance - 5.1% |
ACE Ltd. | 820 | | 35,055 |
AFLAC, Inc. | 600 | | 23,904 |
AMBAC Financial Group, Inc. | 340 | | 27,924 |
American International Group, Inc. | 2,410 | | 158,265 |
Hartford Financial Services Group, Inc. | 300 | | 20,793 |
Hilb Rogal & Hobbs Co. | 400 | | 14,496 |
MetLife, Inc. | 430 | | 17,419 |
Scottish Re Group Ltd. | 200 | | 5,180 |
W.R. Berkley Corp. | 600 | | 28,302 |
| | 331,338 |
Real Estate - 1.1% |
Apartment Investment & Management Co. Class A | 900 | | 34,686 |
Equity Lifestyle Properties, Inc. | 150 | | 5,363 |
General Growth Properties, Inc. | 570 | | 20,611 |
iStar Financial, Inc. | 200 | | 9,052 |
| | 69,712 |
Thrifts & Mortgage Finance - 1.9% |
Fannie Mae | 400 | | 28,484 |
Freddie Mac | 300 | | 22,110 |
Golden West Financial Corp., Delaware | 240 | | 14,741 |
New York Community Bancorp, Inc. | 833 | | 17,135 |
Sovereign Bancorp, Inc. | 800 | | 18,040 |
|
| Shares | | Value (Note 1) |
W Holding Co., Inc. | 306 | | $ 7,020 |
Washington Mutual, Inc. | 400 | | 16,912 |
| | 124,442 |
TOTAL FINANCIALS | | 1,309,202 |
HEALTH CARE - 10.4% |
Biotechnology - 0.8% |
Biogen Idec, Inc. (a) | 100 | | 6,661 |
BioMarin Pharmaceutical, Inc. (a) | 1,200 | | 7,668 |
Genentech, Inc. (a) | 300 | | 16,332 |
MedImmune, Inc. (a) | 500 | | 13,555 |
Millennium Pharmaceuticals, Inc. (a) | 450 | | 5,454 |
| | 49,670 |
Health Care Equipment & Supplies - 4.2% |
Baxter International, Inc. | 2,980 | | 102,929 |
Dade Behring Holdings, Inc. (a) | 300 | | 16,800 |
Guidant Corp. | 400 | | 28,840 |
Medtronic, Inc. | 1,040 | | 51,657 |
PerkinElmer, Inc. | 700 | | 15,743 |
St. Jude Medical, Inc. (a) | 200 | | 8,386 |
Thermo Electron Corp. (a) | 300 | | 9,057 |
Waters Corp. (a) | 800 | | 37,432 |
| | 270,844 |
Health Care Providers & Services - 1.9% |
McKesson Corp. | 900 | | 28,314 |
PacifiCare Health Systems, Inc. (a) | 340 | | 19,217 |
Sierra Health Services, Inc. (a) | 300 | | 16,533 |
UnitedHealth Group, Inc. | 700 | | 61,621 |
| | 125,685 |
Pharmaceuticals - 3.5% |
Johnson & Johnson | 610 | | 38,686 |
Merck & Co., Inc. | 1,600 | | 51,424 |
Pfizer, Inc. | 900 | | 24,201 |
Schering-Plough Corp. | 2,550 | | 53,244 |
Wyeth | 1,300 | | 55,367 |
| | 222,922 |
TOTAL HEALTH CARE | | 669,121 |
INDUSTRIALS - 19.2% |
Aerospace & Defense - 4.0% |
Engineered Support Systems, Inc. | 100 | | 5,922 |
Hexcel Corp. (a) | 600 | | 8,700 |
Honeywell International, Inc. | 4,300 | | 152,263 |
Lockheed Martin Corp. | 510 | | 28,331 |
Precision Castparts Corp. | 250 | | 16,420 |
Raytheon Co. | 700 | | 27,181 |
The Boeing Co. | 400 | | 20,708 |
| | 259,525 |
Common Stocks - continued |
| Shares | | Value (Note 1) |
INDUSTRIALS - continued |
Air Freight & Logistics - 0.2% |
Expeditors International of Washington, Inc. | 200 | | $ 11,176 |
Airlines - 0.5% |
AirTran Holdings, Inc. (a) | 500 | | 5,350 |
Delta Air Lines, Inc. (a) | 1,200 | | 8,976 |
Southwest Airlines Co. | 1,200 | | 19,536 |
| | 33,862 |
Building Products - 1.2% |
Masco Corp. | 2,100 | | 76,713 |
Commercial Services & Supplies - 2.3% |
Apollo Group, Inc. Class A (a) | 300 | | 24,213 |
Career Education Corp. (a) | 700 | | 28,000 |
Cintas Corp. | 1,000 | | 43,860 |
On Assignment, Inc. (a) | 566 | | 2,938 |
Robert Half International, Inc. | 1,700 | | 50,031 |
| | 149,042 |
Construction & Engineering - 1.4% |
Chicago Bridge & Iron Co. NV (NY Shares) | 600 | | 24,000 |
Fluor Corp. | 600 | | 32,706 |
Jacobs Engineering Group, Inc. (a) | 300 | | 14,337 |
MasTec, Inc. (a) | 2,100 | | 21,231 |
| | 92,274 |
Industrial Conglomerates - 8.0% |
General Electric Co. | 10,720 | | 391,279 |
Siemens AG sponsored ADR | 100 | | 8,467 |
Tyco International Ltd. | 3,230 | | 115,440 |
| | 515,186 |
Machinery - 0.2% |
ITT Industries, Inc. | 200 | | 16,890 |
Marine - 0.1% |
Alexander & Baldwin, Inc. | 100 | | 4,242 |
Road & Rail - 1.1% |
Norfolk Southern Corp. | 1,000 | | 36,190 |
Swift Transportation Co., Inc. (a) | 800 | | 17,184 |
Union Pacific Corp. | 300 | | 20,175 |
| | 73,549 |
Trading Companies & Distributors - 0.2% |
UAP Holding Corp. | 300 | | 5,181 |
W.W. Grainger, Inc. | 100 | | 6,662 |
| | 11,843 |
TOTAL INDUSTRIALS | | 1,244,302 |
INFORMATION TECHNOLOGY - 8.6% |
Communications Equipment - 1.5% |
Cisco Systems, Inc. (a) | 300 | | 5,790 |
Comverse Technology, Inc. (a) | 1,000 | | 24,450 |
Foundry Networks, Inc. (a) | 1,400 | | 18,424 |
|
| Shares | | Value (Note 1) |
Juniper Networks, Inc. (a) | 1,100 | | $ 29,909 |
QUALCOMM, Inc. | 500 | | 21,200 |
| | 99,773 |
Computers & Peripherals - 0.8% |
International Business Machines Corp. | 220 | | 21,688 |
Sun Microsystems, Inc. (a) | 1,300 | | 6,994 |
Western Digital Corp. (a) | 2,100 | | 22,764 |
| | 51,446 |
Electronic Equipment & Instruments - 0.8% |
Amphenol Corp. Class A (a) | 300 | | 11,022 |
Flextronics International Ltd. (a) | 600 | | 8,292 |
National Instruments Corp. | 250 | | 6,813 |
Solectron Corp. (a) | 400 | | 2,132 |
Symbol Technologies, Inc. | 1,200 | | 20,760 |
| | 49,019 |
Internet Software & Services - 0.5% |
Akamai Technologies, Inc. (a) | 500 | | 6,515 |
Yahoo!, Inc. (a) | 600 | | 22,608 |
| | 29,123 |
IT Services - 0.7% |
Affiliated Computer Services, Inc.
Class A (a) | 660 | | 39,725 |
BearingPoint, Inc. (a) | 400 | | 3,212 |
Sapient Corp. (a) | 600 | | 4,746 |
| | 47,683 |
Office Electronics - 0.4% |
Xerox Corp. (a) | 1,700 | | 28,917 |
Semiconductors & Semiconductor Equipment - 1.6% |
Analog Devices, Inc. | 400 | | 14,768 |
Applied Materials, Inc. (a) | 400 | | 6,840 |
Cabot Microelectronics Corp. (a) | 400 | | 16,020 |
Freescale Semiconductor, Inc. Class A | 1,020 | | 18,176 |
Intel Corp. | 600 | | 14,034 |
KLA-Tencor Corp. (a) | 200 | | 9,316 |
Lam Research Corp. (a) | 400 | | 11,564 |
Samsung Electronics Co. Ltd. | 35 | | 15,231 |
| | 105,949 |
Software - 2.3% |
BEA Systems, Inc. (a) | 1,800 | | 15,948 |
Macrovision Corp. (a) | 100 | | 2,572 |
Microsoft Corp. | 3,660 | | 97,759 |
Oracle Corp. (a) | 500 | | 6,860 |
PalmSource, Inc. (a) | 200 | | 2,548 |
Symantec Corp. (a) | 800 | | 20,608 |
| | 146,295 |
TOTAL INFORMATION TECHNOLOGY | | 558,205 |
MATERIALS - 8.7% |
Chemicals - 5.3% |
Dow Chemical Co. | 1,430 | | 70,799 |
E.I. du Pont de Nemours & Co. | 1,940 | | 95,157 |
Common Stocks - continued |
| Shares | | Value (Note 1) |
MATERIALS - continued |
Chemicals - continued |
Lubrizol Corp. | 200 | | $ 7,372 |
Lyondell Chemical Co. | 3,135 | | 90,664 |
Monsanto Co. | 700 | | 38,885 |
Mosaic Co. (a) | 400 | | 6,528 |
Nalco Holding Co. | 600 | | 11,712 |
Olin Corp. | 700 | | 15,414 |
Valspar Corp. | 100 | | 5,001 |
| | 341,532 |
Containers & Packaging - 1.6% |
Crown Holdings, Inc. (a) | 500 | | 6,870 |
Owens-Illinois, Inc. (a) | 1,100 | | 24,915 |
Packaging Corp. of America | 1,200 | | 28,260 |
Smurfit-Stone Container Corp. (a) | 2,246 | | 41,955 |
| | 102,000 |
Metals & Mining - 1.7% |
Alcoa, Inc. | 1,000 | | 31,420 |
Freeport-McMoRan Copper & Gold, Inc. Class B | 300 | | 11,469 |
International Steel Group, Inc. | 200 | | 8,112 |
Massey Energy Co. | 300 | | 10,485 |
Newmont Mining Corp. | 450 | | 19,985 |
Nucor Corp. | 250 | | 13,085 |
Phelps Dodge Corp. | 160 | | 15,827 |
| | 110,383 |
Paper & Forest Products - 0.1% |
Louisiana-Pacific Corp. | 200 | | 5,348 |
TOTAL MATERIALS | | 559,263 |
TELECOMMUNICATION SERVICES - 5.0% |
Diversified Telecommunication Services - 3.8% |
Covad Communications Group, Inc. (a) | 11,000 | | 23,650 |
SBC Communications, Inc. | 4,590 | | 118,284 |
Telewest Global, Inc. (a) | 1,200 | | 21,096 |
Verizon Communications, Inc. | 2,000 | | 81,020 |
| | 244,050 |
Wireless Telecommunication Services - 1.2% |
American Tower Corp. Class A (a) | 1,400 | | 25,760 |
Leap Wireless International, Inc. (a) | 200 | | 5,400 |
Nextel Communications, Inc. Class A (a) | 650 | | 19,500 |
Nextel Partners, Inc. Class A (a) | 1,000 | | 19,540 |
SpectraSite, Inc. (a) | 200 | | 11,580 |
| | 81,780 |
TOTAL TELECOMMUNICATION SERVICES | | 325,830 |
UTILITIES - 2.1% |
Electric Utilities - 1.5% |
Entergy Corp. | 460 | | 31,091 |
FirstEnergy Corp. | 500 | | 19,755 |
|
| Shares | | Value (Note 1) |
PG&E Corp. (a) | 600 | | $ 19,968 |
PPL Corp. | 370 | | 19,714 |
Southern Co. | 140 | | 4,693 |
TXU Corp. | 50 | | 3,228 |
| | 98,449 |
Multi-Utilities & Unregulated Power - 0.6% |
AES Corp. (a) | 1,300 | | 17,771 |
CMS Energy Corp. (a) | 1,600 | | 16,720 |
Public Service Enterprise Group, Inc. | 100 | | 5,177 |
| | 39,668 |
TOTAL UTILITIES | | 138,117 |
TOTAL COMMON STOCKS (Cost $5,367,650) | 6,445,568 |
Cash Equivalents - 0.4% |
| Maturity Amount | | |
Investments in repurchase agreements (Collateralized by U.S. Treasury Obligations, in a joint trading account at 1.52%, dated 12/31/04 due 1/3/05)
(Cost $26,000) | $ 26,003 | | 26,000 |
TOTAL INVESTMENT PORTFOLIO - 100.1% (Cost $5,393,650) | | 6,471,568 |
NET OTHER ASSETS - (0.1)% | | (6,077) |
NET ASSETS - 100% | $ 6,465,491 |
Legend |
(a) Non-income producing |
Income Tax Information |
The fund hereby designates as capital gain dividends: For dividends with respect to the taxable year ended December 31, 2004, $122,000 or, if different, the net capital gain of such year, and for dividends with respect to the taxable year ended December 31, 2003, $1,000 or, if different, the excess of (a) the net capital gain of such year, over (b) amounts previously designated as capital gain dividends with respect to such year. |
See accompanying notes which are an integral part of the financial statements.
Value Leaders Portfolio
Fidelity Variable Insurance Products: Value Leaders Portfolio
Financial Statements
Statement of Assets and Liabilities
| December 31, 2004 |
Assets | | |
Investment in securities, at value (including repurchase agreements of $26,000) (cost $5,393,650) - See accompanying schedule | | $ 6,471,568 |
Receivable for investments sold | | 23,115 |
Dividends receivable | | 9,865 |
Prepaid expenses | | 22 |
Receivable from investment adviser for expense reductions | | 3,837 |
Other receivables | | 661 |
Total assets | | 6,509,068 |
| | |
Liabilities | | |
Payable to custodian bank | $ 1,688 | |
Payable for investments purchased | 10,336 | |
Accrued management fee | 3,038 | |
Distribution fees payable | 688 | |
Other affiliated payables | 3,106 | |
Other payables and accrued expenses | 24,721 | |
Total liabilities | | 43,577 |
| | |
Net Assets | | $ 6,465,491 |
Net Assets consist of: | | |
Paid in capital | | $ 5,331,856 |
Undistributed net investment income | | 3,147 |
Accumulated undistributed net realized gain (loss) on investments and foreign currency transactions | | 52,568 |
Net unrealized appreciation (depreciation) on investments and assets and liabilities in foreign currencies | | 1,077,920 |
Net Assets | | $ 6,465,491 |
Initial Class:
Net Asset Value, offering price and redemption price per share ($1,943,545 ÷ 158,255 shares) | | $ 12.28 |
| | |
Service Class:
Net Asset Value, offering price and redemption price per share ($1,940,545 ÷ 158,267 shares) | | $ 12.26 |
| | |
Service Class 2:
Net Asset Value, offering price and redemption price per share ($2,581,401 ÷ 211,039 shares) | | $ 12.23 |
Statement of Operations
| Year ended December 31, 2004 |
Investment Income | | |
Dividends | | $ 96,312 |
Special dividends | | 10,980 |
Interest | | 262 |
Total income | | 107,554 |
| | |
Expenses | | |
Management fee | $ 33,557 | |
Transfer agent fees | 3,855 | |
Distribution fees | 7,581 | |
Accounting fees and expenses | 33,000 | |
Non-interested trustees' compensation | 32 | |
Custodian fees and expenses | 18,147 | |
Audit | 31,380 | |
Legal | 84 | |
Miscellaneous | 1,100 | |
Total expenses before reductions | 128,736 | |
Expense reductions | (64,981) | 63,755 |
Net investment income (loss) | | 43,799 |
Realized and Unrealized Gain (Loss) Net realized gain (loss) on: | | |
Investment securities | 287,943 | |
Foreign currency transactions | 60 | |
Total net realized gain (loss) | | 288,003 |
Change in net unrealized appreciation (depreciation) on: Investment securities | 512,778 | |
Assets and liabilities in foreign currencies | (36) | |
Total change in net unrealized appreciation (depreciation) | | 512,742 |
Net gain (loss) | | 800,745 |
Net increase (decrease) in net assets resulting from operations | | $ 844,544 |
See accompanying notes which are an integral part of the financial statements.
Annual Report
Fidelity Variable Insurance Products: Value Leaders Portfolio
Financial Statements - continued
Statement of Changes in Net Assets
| Year ended December 31, 2004 | For the period June 17, 2003 (commencement of operations) to
December 31, 2003 |
Increase (Decrease) in Net Assets | | |
Operations | | |
Net investment income (loss) | $ 43,799 | $ 17,703 |
Net realized gain (loss) | 288,003 | 38,036 |
Change in net unrealized appreciation (depreciation) | 512,742 | 565,178 |
Net increase (decrease) in net assets resulting
from operations | 844,544 | 620,917 |
Distributions to shareholders from net investment income | (40,547) | (20,000) |
Distributions to shareholders from net realized gain | (265,610) | (5,000) |
Total distributions | (306,157) | (25,000) |
Share transactions - net increase (decrease) | 306,157 | 5,025,030 |
Total increase (decrease) in net assets | 844,544 | 5,620,947 |
Net Assets | | |
Beginning of period | 5,620,947 | - |
End of period (including undistributed net investment income of $3,147 and undistributed net investment income of $0, respectively) | $ 6,465,491 | $ 5,620,947 |
Other Information: | |
Share Transactions | Year ended December 31, 2004 |
Shares | Initial Class | Service Class | Service Class 2 |
Reinvested | 7,575 | 7,586 | 10,131 |
Dollars | | | |
Reinvested | $ 91,846 | $ 91,847 | $ 122,464 |
| | | |
Share Transactions | Year ended December 31, 2003A |
Shares | Initial Class | Service Class | Service Class 2 |
Sold | 150,001 | 150,001 | 200,001 |
Reinvested | 679 | 680 | 907 |
Redeemed | - | - | - |
Net increase (decrease) | 150,680 | 150,681 | 200,908 |
Dollars Sold | $ 1,500,010 | $ 1,500,010 | $ 2,000,010 |
Reinvested | 7,500 | 7,500 | 10,000 |
Redeemed | - | - | - |
Net increase (decrease) | $ 1,507,510 | $ 1,507,510 | $ 2,010,010 |
| | | |
Distributions | Year ended December 31, 2004 |
| Initial Class | Service Class | Service Class 2 |
From net investment income | $ 12,164 | $ 12,164 | $ 16,219 |
From net realized gain | 79,682 | 79,683 | 106,245 |
Total | $ 91,846 | $ 91,847 | $ 122,464 |
| | | |
| Year ended December 31, 2003 A |
| Initial Class | Service Class | Service Class 2 |
From net investment income | $ 6,000 | $ 6,000 | $ 8,000 |
From net realized gain | 1,500 | 1,500 | 2,000 |
Total | $ 7,500 | $ 7,500 | $ 10,000 |
A For the period June 17, 2003 (commencement of operations) to December 31, 2003.
See accompanying notes which are an integral part of the financial statements.
Value Leaders Portfolio
Financial Highlights - Initial Class
Years ended December 31, | 2004 | 2003 F |
Selected Per-Share Data | | |
Net asset value, beginning of period | $ 11.20 | $ 10.00 |
Income from Investment Operations | | |
Net investment income (loss) E | .10 H | .04 |
Net realized and unrealized gain (loss) | 1.59 | 1.21 |
Total from investment operations | 1.69 | 1.25 |
Distributions from net investment income | (.08) | (.04) |
Distributions from net realized gain | (.53) | (.01) |
Total distributions | (.61) | (.05) |
Net asset value, end of period | $ 12.28 | $ 11.20 |
Total Return B, C, D | 15.15% | 12.51% |
Ratios to Average Net Assets G | | |
Expenses before expense reductions | 2.07% | 3.63% A |
Expenses net of voluntary waivers, if any | 1.00% | 1.06% A |
Expenses net of all reductions | .96% | 1.04% A |
Net investment income (loss) | .88% | .78% A |
Supplemental Data | | |
Net assets, end of period (000 omitted) | $ 1,944 | $ 1,687 |
Portfolio turnover rate | 121% | 119% A |
A Annualized
B Total returns for periods of less than one year are not annualized.
C Total returns do not reflect charges attributable to your insurance company's separate account. Inclusion of these charges would reduce the total returns shown.
D Total returns would have been lower had certain expenses not been reduced during the periods shown.
E Calculated based on average shares outstanding during the period.
F For the period June 17, 2003 (commencement of operations) to December 31, 2003.
G Expense ratios reflect operating expenses of the class. Expenses before reductions do not reflect amounts reimbursed by the investment adviser or reductions from brokerage service arrangements or other expense offset arrangements and do not represent the amount paid by the class during periods when reimbursements or reductions occur. Expense ratios before reductions for start-up periods may not be representative of longer-term operating periods. Expenses net of any voluntary waivers reflect expenses after reimbursement by the investment adviser but prior to reductions from brokerage service arrangements or other expense offset arrangements. Expenses net of all reductions represent the net expenses paid by the class.
H Investment income per share reflects a special dividend which amounted to $.02 per share.
Financial Highlights - Service Class
Years ended December 31, | 2004 | 2003 F |
Selected Per-Share Data | | |
Net asset value, beginning of period | $ 11.19 | $ 10.00 |
Income from Investment Operations | | |
Net investment income (loss) E | .09 H | .04 |
Net realized and unrealized gain (loss) | 1.59 | 1.20 |
Total from investment operations | 1.68 | 1.24 |
Distributions from net investment income | (.08) | (.04) |
Distributions from net realized gain | (.53) | (.01) |
Total distributions | (.61) | (.05) |
Net asset value, end of period | $ 12.26 | $ 11.19 |
Total Return B, C, D | 15.08% | 12.41% |
Ratios to Average Net Assets G | | |
Expenses before expense reductions | 2.17% | 3.73% A |
Expenses net of voluntary waivers, if any | 1.10% | 1.16% A |
Expenses net of all reductions | 1.06% | 1.14% A |
Net investment income (loss) | .78% | .68% A |
Supplemental Data | | |
Net assets, end of period (000 omitted) | $ 1,941 | $ 1,687 |
Portfolio turnover rate | 121% | 119% A |
A Annualized
B Total returns for periods of less than one year are not annualized.
C Total returns do not reflect charges attributable to your insurance company's separate account. Inclusion of these charges would reduce the total returns shown.
D Total returns would have been lower had certain expenses not been reduced during the periods shown.
E Calculated based on average shares outstanding during the period.
F For the period June 17, 2003 (commencement of operations) to December 31, 2003.
G Expense ratios reflect operating expenses of the class. Expenses before reductions do not reflect amounts reimbursed by the investment adviser or reductions from brokerage service arrangements or other expense offset arrangements and do not represent the amount paid by the class during periods when reimbursements or reductions occur. Expense ratios before reductions for start-up periods may not be representative of longer-term operating periods. Expenses net of any voluntary waivers reflect expenses after reimbursement by the investment adviser but prior to reductions from brokerage service arrangements or other expense offset arrangements. Expenses net of all reductions represent the net expenses paid by the class.
H Investment income per share reflects a special dividend which amounted to $.02 per share.
See accompanying notes which are an integral part of the financial statements.
Annual Report
Fidelity Variable Insurance Products: Value Leaders Portfolio
Financial Statements - continued
Financial Highlights - Service Class 2
Years ended December 31, | 2004 | 2003 F |
Selected Per-Share Data | | |
Net asset value, beginning of period | $ 11.18 | $ 10.00 |
Income from Investment Operations | | |
Net investment income (loss) E | .07 H | .03 |
Net realized and unrealized gain (loss) | 1.59 | 1.20 |
Total from investment operations | 1.66 | 1.23 |
Distributions from net investment income | (.08) | (.04) |
Distributions from net realized gain | (.53) | (.01) |
Total distributions | (.61) | (.05) |
Net asset value, end of period | $ 12.23 | $ 11.18 |
Total Return B, C, D | 14.91% | 12.31% |
Ratios to Average Net Assets G | | |
Expenses before expense reductions | 2.32% | 3.88% A |
Expenses net of voluntary waivers, if any | 1.25% | 1.32% A |
Expenses net of all reductions | 1.21% | 1.29% A |
Net investment income (loss) | .63% | .52% A |
Supplemental Data | | |
Net assets, end of period (000 omitted) | $ 2,581 | $ 2,247 |
Portfolio turnover rate | 121% | 119% A |
A Annualized
B Total returns for periods of less than one year are not annualized.
C Total returns do not reflect charges attributable to your insurance company's separate account. Inclusion of these charges would reduce the total returns shown.
D Total returns would have been lower had certain expenses not been reduced during the periods shown.
E Calculated based on average shares outstanding during the period.
F For the period June 17, 2003 (commencement of operations) to December 31, 2003.
G Expense ratios reflect operating expenses of the class. Expenses before reductions do not reflect amounts reimbursed by the investment adviser or reductions from brokerage service arrangements or other expense offset arrangements and do not represent the amount paid by the class during periods when reimbursements or reductions occur. Expense ratios before reductions for start-up periods may not be representative of longer-term operating periods. Expenses net of any voluntary waivers reflect expenses after reimbursement by the investment adviser but prior to reductions from brokerage service arrangements or other expense offset arrangements. Expenses net of all reductions represent the net expenses paid by the class.
H Investment income per share reflects a special dividend which amounted to $.02 per share.
See accompanying notes which are an integral part of the financial statements.
Value Leaders Portfolio
Notes to Financial Statements
For the period ended December 31, 2004
1. Significant Accounting Policies.
Value Leaders Portfolio (the fund) is a fund of Variable Insurance Products Fund IV, (the trust) (referred to in this report as Fidelity Variable Insurance Products: Value Leaders Portfolio) and is authorized to issue an unlimited number of shares. The trust is registered under the Investment Com-pany Act of 1940, as amended (the 1940 Act), as an open-end management investment company organized as a Massachusetts business trust. Shares of the fund may only be purchased by insurance companies for the purpose of funding variable annuity or variable life insurance contracts. The fund offers the following classes of shares: Initial Class shares, Service Class shares and Service Class 2 shares. All classes have equal rights and voting privileges, except for matters affecting a single class. Investment income, realized and unrealized capital gains and losses, the common expenses of the fund, and certain fund-level expense reductions, if any, are allocated on a pro rata basis to each class based on the relative net assets of each class to the total net assets of the fund. Each class differs with respect to distribution and service plan fees incurred. Certain expense reductions also differ by class.
The financial statements have been prepared in conformity with accounting principles generally accepted in the United States of America, which require management to make certain estimates and assumptions at the date of the financial statements. The following summarizes the significant accounting policies of the fund:
Security Valuation. Net asset value per share (NAV calculation) is calculated as of the close of business of the New York Stock Exchange, normally 4:00 p.m. Eastern time. Equity securities, including restricted securities, for which market quotations are available are valued at the last sale price or official closing price (closing bid price or last evaluated quote if no sale has occurred) on the primary market or exchange on which they trade. If prices are not readily available or do not accurately reflect fair value for a security, or if a security's value has been materially affected by events occurring after the close of the exchange or market on which the security is principally traded, that security may be valued by another method that the Board of Trustees believes accurately reflects fair value. A security's valuation may differ depending on the method used for determining value. Price movements in futures contracts and ADRs, market and trading trends, the bid/ask quotes of brokers and off-exchange institutional trading may be reviewed in the course of making a good faith determination of a security's fair value. Short-term securities with remaining maturities of sixty days or less for which quotations are not readily available are valued on the basis of amortized cost. Investments in open-end investment companies are valued at their net asset value each business day.
Foreign Currency. The fund uses foreign currency contracts to facilitate transactions in foreign-denominated securities. Losses from these transactions may arise from changes in the value of the foreign currency or if the counterparties do not perform under the contracts' terms.
Foreign-denominated assets, including investment securities, and liabilities are translated into U.S. dollars at the exchange rate at period end. Purchases and sales of investment securities, income and dividends received and expenses denominated in foreign currencies are translated into U.S. dollars at the exchange rate in effect on the transaction date.
The effects of exchange rate fluctuations on investments are included with the net realized and unrealized gain (loss) on investment securities. Other foreign currency transactions resulting in realized and unrealized gain (loss) are disclosed separately.
Investment Transactions and Income. Security transactions are accounted for as of trade date. Gains and losses on securities sold are determined on the basis of identified cost. Dividend income is recorded on the ex-dividend date, except for certain dividends from foreign securities where the ex-dividend date may have passed, which are recorded as soon as the fund is informed of the ex-dividend date. Non-cash dividends included in dividend income, if any, are recorded at the fair market value of the securities received. Distributions received on securities that represent a return of capital or capital gain are recorded as a reduction of cost of investments and/or as a realized gain. The fund estimates the components of distributions received that may be considered return of capital distributions or capital gain distributions. Large, non-recurring dividends recognized by the fund are presented separately on the Statement of Operations as "Special Dividends" and the impact of these dividends to net investment income per share is presented in the Financial Highlights. Interest income is accrued as earned. Interest income includes coupon interest and amortization of premium and accretion of discount on debt securities. Investment income is recorded net of foreign taxes withheld where recovery of such taxes is uncertain.
Expenses. Most expenses of the trust can be directly attributed to a fund. Expenses which cannot be directly attributed are apportioned among the funds in the trust.
Income Tax Information and Distributions to Shareholders. Each year, the fund intends to qualify as a regulated investment company by distributing all of its taxable income and realized gains under Subchapter M of the Internal Revenue Code. As a result, no provision for income taxes is required in the accompanying financial statements. Foreign taxes are provided for based on the fund's understanding of the tax rules and rates that exist in the foreign markets in which it invests.
Distributions are recorded on the ex-dividend date. Income dividends and capital gain distributions are declared separately for each class. Income and capital gain distributions are determined in accordance with income tax regulations, which may differ from generally accepted accounting principles. Capital accounts within the financial statements are adjusted for permanent book-tax differences. These adjustments have no impact on net assets or the results of operations. Temporary book-tax differences will reverse in a subsequent period.
Book-tax differences are primarily due to foreign currency transactions and losses deferred due to wash sales.
Annual Report
Notes to Financial Statements - continued
1. Significant Accounting Policies - continued
Income Tax Information and Distributions to Shareholders - continued
The tax-basis components of distributable earnings and the federal tax cost as of period end were as follows:
Unrealized appreciation | $ 1,109,126 | |
Unrealized depreciation | (44,018) | |
Net unrealized appreciation (depreciation) | 1,065,108 | |
Undistributed ordinary income | 21,853 | |
Undistributed long-term capital gain | 46,675 | |
| | |
Cost for federal income tax purposes | $ 5,406,460 | |
The tax character of distributions paid was as follows:
| December 31, 2004 | December 31, 2003 |
Ordinary Income | $ 230,132 | $ 25,000 |
Long-term Capital Gains | 76,025 | - |
Total | $ 306,157 | $ 25,000 |
2. Operating Policies.
Repurchase Agreements. Fidelity Management & Research Company (FMR) has received an Exemptive Order from the Securities and Exchange Commission (the SEC) which permits the fund and other affiliated entities of FMR to transfer uninvested cash balances into joint trading accounts. These accounts are then invested in repurchase agreements that are collateralized by U.S. Treasury or Government obligations. The fund may also invest directly with institutions, in repurchase agreements that are collateralized by commercial paper obligations and corporate obligations. Collateral is held in segregated accounts with custodian banks and may be obtained in the event of a default of the counterparty. Collateral is marked-to-market daily and maintained at a value at least equal to the principal amount of the repurchase agreement (including accrued interest).
3. Purchases and Sales of Investments.
Purchases and sales of securities, other than short-term securities and U.S. government securities, aggregated $7,075,077 and $7,057,873, respectively.
4. Fees and Other Transactions with Affiliates.
Management Fee. FMR and its affiliates provide the fund with investment management related services for which the fund pays a monthly management fee. The management fee is the sum of an individual fund fee rate that is based on an annual rate of .30% of the fund's average net assets and a group fee rate that averaged .28% during the period. The group fee rate is based upon the average net assets of all the mutual funds advised by FMR. The group fee rate decreases as assets under management increase and increases as assets under management decrease. For the period, the total annual management fee rate was .57% of the fund's average net assets.
Distribution and Service Plan. In accordance with Rule 12b-1 of the 1940 Act, the fund has adopted separate 12b-1 Plans for each Service Class of shares. Each Service Class pays Fidelity Distributors Corporation (FDC), an affiliate of FMR, a service fee. For the period, the service fee is based on an annual rate of .10% of Service Class' average net assets and .25% of Service Class 2's average net assets.
For the period, each class paid FDC the following amounts, all of which were re-allowed to insurance companies for the distribution of shares and providing shareholder support services:
Service Class | $ 1,752 | |
Service Class 2 | 5,829 | |
| $ 7,581 | |
Value Leaders Portfolio
4. Fees and Other Transactions with Affiliates - continued
Transfer Agent Fees. Fidelity Investments Institutional Operations Company, Inc. (FIIOC), an affiliate of FMR, is the fund's transfer, dividend disbursing, and shareholder servicing agent. FIIOC receives an asset-based fee with respect to each account. FIIOC pays a portion of the expenses related to the typesetting, printing and mailing of shareholder reports, except proxy statements. Each class pays a transfer agent fee, excluding out of pocket expenses, equal to an annual rate of .07% of their month end net assets. For the period, the total transfer agent fees paid by each class to FIIOC, including out of pocket expenses, were as follows:
Initial Class | $ 1,158 | |
Service Class | 1,158 | |
Service Class 2 | 1,539 | |
| $ 3,855 | |
Accounting Fees. Fidelity Service Company, Inc. (FSC), an affiliate of FMR, maintains the fund's accounting records. The fee is based on the level of average net assets for the month.
Brokerage Commissions. The fund placed a portion of its portfolio transactions with brokerage firms which are affiliates of the investment adviser. The commissions paid to these affiliated firms were $696 for the period.
5. Committed Line of Credit.
The fund participates with other funds managed by FMR in a $4.2 billion credit facility (the "line of credit") to be utilized for temporary or emergency purposes to fund shareholder redemptions or for other short-term liquidity purposes. The fund has agreed to pay commitment fees on its pro rata portion of the line of credit. During the period, there were no borrowings on this line of credit.
6. Expense Reductions.
FMR voluntarily agreed to reimburse each class to the extent annual operating expenses exceeded certain levels of average net assets as noted in the table below. Some expenses, for example interest expense, are excluded from this reimbursement.
| Expense
Limitations | Reimbursement
from adviser |
Initial Class | 1.00% | $ 18,852 |
Service Class | 1.10% | 18,834 |
Service Class 2 | 1.25% | 25,070 |
| | $ 62,756 |
Many of the brokers with whom FMR places trades on behalf of the fund provided services to the fund in addition to trade execution. These services included payments of certain expenses on behalf of the fund totaling $2,174 for the period. In addition, through arrangements with the fund's custodian, credits realized as a result of uninvested cash balances were used to reduce the fund's expenses. During the period, these credits reduced the fund's custody expenses by $51.
7. Other Information.
At the end of the period, FMR or its affiliates were the owners of record of 100% of the total outstanding shares of the fund.
Annual Report
Report of Independent Registered Public Accounting Firm
To the Trustees of Variable Insurance Products Fund IV and the Shareholders of Value Leaders Portfolio:
In our opinion, the accompanying statement of assets and liabilities, including the schedule of investments, and the related statements of operations and of changes in net assets and the financial highlights present fairly, in all material respects, the financial position of Value Leaders Portfolio (a fund of Variable Insurance Products Fund IV) at December 31, 2004 and the results of its operations, the changes in its net assets and the financial highlights for the periods indicated, in conformity with accounting principles generally accepted in the United States of America. These financial statements and financial highlights (hereafter referred to as "financial statements") are the responsibility of the Value Leaders Portfolio's management; our responsibility is to express an opinion on these financial statements based on our audits. We conducted our audits of these financial statements in accordance with the standards of the Public Company Accounting Oversight Board (United States). Those standards require that we plan and perform the audit to obtain reasonable assurance about whether the financial statements are free of material misstatement. An audit includes examining, on a test basis, evidence supporting the amounts and disclosures in the financial statements, assessing the accounting principles used and significant estimates made by management, and evaluating the overall financial statement presentation. We believe that our audits, which included confirmation of securities at December 31, 2004 by correspondence with the custodian and brokers, provide a reasonable basis for our opinion.
/s/PricewaterhouseCoopers LLP
PricewaterhouseCoopers LLP
Boston, Massachusetts
February 18, 2005
Annual Report
Trustees and Officers
The Trustees, Member of the Advisory Board, and executive officers of the trust and fund, as applicable, are listed below. The Board of Trustees governs the fund and is responsible for protecting the interests of shareholders. The Trustees are experienced executives who meet periodically throughout the year to oversee the fund's activities, review contractual arrangements with companies that provide services to the fund, and review the fund's performance. Except for William O. McCoy, Dennis J. Dirks, and Kenneth L. Wolfe, each of the Trustees oversees 301 funds advised by FMR or an affiliate. Mr. McCoy oversees 303 funds advised by FMR or an affiliate. Mr. Dirks and Mr. Wolfe oversee 233 funds advised by FMR or an affiliate.
The Trustees hold office without limit in time except that (a) any Trustee may resign; (b) any Trustee may be removed by written instrument, signed by at least two-thirds of the number of Trustees prior to such removal; (c) any Trustee who requests to be retired or who has become incapacitated by illness or injury may be retired by written instrument signed by a majority of the other Trustees; and (d) any Trustee may be removed at any special meeting of shareholders by a two-thirds vote of the outstanding voting securities of the trust. In any event, each non-interested Trustee shall retire not later than the last day of the calendar year in which his or her 72nd birthday occurs. The executive officers and Advisory Board Member hold office without limit in time, except that any officer and Advisory Board Member may resign or may be removed by a vote of a majority of the Trustees at any regular meeting or any special meeting of the Trustees. Except as indicated, each individual has held the office shown or other offices in the same company for the past five years.
The fund's Statement of Additional Information (SAI) includes more information about the Trustees. To request a free copy, call Fidelity at 1-800-544-5429.
Interested Trustees*:
Correspondence intended for each Trustee who is an "interested person" (as defined in the 1940 Act) may be sent to Fidelity Investments, 82 Devonshire Street, Boston, Massachusetts 02109.
Name, Age; Principal Occupation |
Edward C. Johnson 3d (74)** |
| Year of Election or Appointment: 1983 Mr. Johnson is Chairman of the Board of Trustees. Mr. Johnson serves as Chief Executive Officer, Chairman, and a Director of FMR Corp.; a Director and Chairman of the Board and of the Executive Committee of FMR; Chairman and a Director of Fidelity Management & Research (Far East) Inc.; Chairman (1998) and a Director of Fidelity Investments Money Management, Inc.; and Chairman (2001) and a Director (2000) of FMR Co., Inc. |
Abigail P. Johnson (43)** |
| Year of Election or Appointment: 2001 Senior Vice President of VIP Value Leaders (2003). Ms. Johnson also serves as Senior Vice President of other Fidelity funds (2001). She is President and a Director of FMR (2001), Fidelity Investments Money Management, Inc. (2001), FMR Co., Inc. (2001), and a Director of FMR Corp. Previously, Ms. Johnson managed a number of Fidelity funds. |
Laura B. Cronin (50) |
| Year of Election or Appointment: 2003 Ms. Cronin is an Executive Vice President (2002) and Chief Financial Officer (2002) of FMR Corp. and is a member of the Fidelity Management Committee (2003). Previously, Ms. Cronin served as Vice President of Finance of FMR (1997-1999), and Chief Financial Officer of FMR (1999-2001), Fidelity Personal Investments (2001), and Fidelity Brokerage Company (2001-2002). |
Robert L. Reynolds (52) |
| Year of Election or Appointment: 2003 Mr. Reynolds is a Director (2003) and Chief Operating Officer (2002) of FMR Corp. and is the head of the Fidelity Management Committee (2003). He also serves on the Board at Fidelity Investments Canada, Ltd. (2000). Previously, Mr. Reynolds served as President of Fidelity Investments Institutional Retirement Group (1996-2000). |
* Trustees have been determined to be "Interested Trustees" by virtue of, among other things, their affiliation with the trust or various entities under common control with FMR.
** Edward C. Johnson 3d, Trustee, is Abigail P. Johnson's father.
Annual Report
Trustees and Officers - continued
Non-Interested Trustees:
Correspondence intended for each non-interested Trustee (that is, the Trustees other than the Interested Trustees) may be sent to Fidelity Investments, P.O. Box 55235, Boston, Massachusetts 02205-5235.
Name, Age; Principal Occupation |
Dennis J. Dirks (56) |
| Year of Election or Appointment: 2005 Mr. Dirks also serves as Trustee (2005) or Member of the Advisory Board (2004) of other investment companies advised by FMR. Prior to his retirement in May 2003, Mr. Dirks was Chief Operating Officer and a member of the Board of The Depository Trust & Clearing Corporation (DTCC) (1999-2003). He also served as President, Chief Operating Officer, and Board member of The Depository Trust Company (DTC) (1999-2003) and President and Board member of the National Securities Clearing Corporation (NSCC) (1999-2003). In addition, Mr. Dirks served as Chief Executive Officer and Board member of the Government Securities Clearing Corporation (2001-2003) and Chief Executive Officer and Board member of the Mortgage-Backed Securities Clearing Corporation (2001-2003). |
Robert M. Gates (61) |
| Year of Election or Appointment: 1997 Dr. Gates is Vice Chairman of the non-interested Trustees (2005). Dr. Gates is President of Texas A&M University (2002). He was Director of the Central Intelligence Agency (CIA) from 1991 to 1993. From 1989 to 1991, Dr. Gates served as Assistant to the President of the United States and Deputy National Security Advisor. Dr. Gates is a Director of NACCO Industries, Inc. (mining and manufacturing), Parker Drilling Co., Inc. (drilling and rental tools for the energy industry, 2001), and Brinker International (restaurant management, 2003). He also serves as a member of the Advisory Board of VoteHere.net (secure Internet voting, 2001). Previously, Dr. Gates served as a Director of LucasVarity PLC (automotive components and diesel engines), a Director of TRW Inc. (automotive, space, defense, and information technology), and Dean of the George Bush School of Government and Public Service at Texas A&M University (1999-2001). Dr. Gates also is a Trustee of the Forum for International Policy. |
George H. Heilmeier (68) |
| Year of Election or Appointment: 2004 Dr. Heilmeier is Chairman Emeritus of Telcordia Technologies (communication software and systems), where prior to his retirement, he served as company Chairman and Chief Executive Officer. He currently serves on the Boards of Directors of The Mitre Corporation (systems engineering and information technology support for the government), INET Technologies Inc. (telecommunications network surveillance, 2001), Teletech Holdings (customer management services), and HRL Laboratories (private research and development, 2004). He is Chairman of the General Motors Technology Advisory Committee and a Life Fellow of the Institute of Electrical and Electronics Engineers (IEEE) (2000). Dr. Heilmeier is a member of the Defense Science Board and the National Security Agency Advisory Board. He is also a member of the National Academy of Engineering, the American Academy of Arts and Sciences, and the Board of Overseers of the School of Engineering and Applied Science of the University of Pennsylvania. Previously, Dr. Heilmeier served as a Director of TRW Inc. (automotive, space, defense, and information technology, 1992-2002), Compaq (1994-2002), and Automatic Data Processing, Inc. (ADP) (technology-based business outsourcing, 1995-2002). |
Marie L. Knowles (58) |
| Year of Election or Appointment: 2001 Prior to Ms. Knowles' retirement in June 2000, she served as Executive Vice President and Chief Financial Officer of Atlantic Richfield Company (ARCO) (diversified energy, 1996-2000). From 1993 to 1996, she was a Senior Vice President of ARCO and President of ARCO Transportation Company. She served as a Director of ARCO from 1996 to 1998. She currently serves as a Director of Phelps Dodge Corporation (copper mining and manufacturing) and McKesson Corporation (healthcare service, 2002). Ms. Knowles is a Trustee of the Brookings Institution and the Catalina Island Conservancy and also serves as a member of the Advisory Board for the School of Engineering of the University of Southern California. |
Ned C. Lautenbach (60) |
| Year of Election or Appointment: 2000 Mr. Lautenbach has been a partner of Clayton, Dubilier & Rice, Inc. (private equity investment firm) since September 1998. Previously, Mr. Lautenbach was with the International Business Machines Corporation (IBM) from 1968 until his retirement in 1998. He was most recently Senior Vice President and Group Executive of Worldwide Sales and Services. From 1993 to 1995, he was Chairman of IBM World Trade Corporation, and from 1994 to 1998 was a member of IBM's Corporate Executive Committee. Mr. Lautenbach serves as Co-Chairman and a Director of Covansys, Inc. (global provider of business and technology solutions, 2000). In addition, he is a Director of Italtel Holding S.p.A. (telecommunications (Milan, Italy), 2004) and Eaton Corporation (diversified industrial) as well as the Philharmonic Center for the Arts in Naples, Florida (1999). He also is a member of the Council on Foreign Relations. |
Marvin L. Mann (71) |
| Year of Election or Appointment: 1993 Mr. Mann is Chairman of the non-interested Trustees (2001). He is Chairman Emeritus of Lexmark International, Inc. (computer peripherals), where he served as CEO until April 1998, retired as Chairman May 1999, and remains a member of the Board. Prior to 1991, he held the positions of Vice President of International Business Machines Corporation (IBM) and President and General Manager of various IBM divisions and subsidiaries. He is a member of the Executive Committee of the Independent Director's Council of the Investment Company Institute. In addition, Mr. Mann is a member of the President's Cabinet at the University of Alabama and the Board of Visitors of the Culverhouse College of Commerce and Business Administration at the University of Alabama. |
William O. McCoy (71) |
| Year of Election or Appointment: 1997 Prior to his retirement in December 1994, Mr. McCoy was Vice Chairman of the Board of BellSouth Corporation (telecommunications) and President of BellSouth Enterprises. He is currently a Director of Liberty Corporation (holding company), Duke Realty Corporation (real estate), and Progress Energy, Inc. (electric utility). He is also a partner of Franklin Street Partners (private investment management firm) and a member of the Research Triangle Foundation Board. In addition, Mr. McCoy served as the Interim Chancellor (1999-2000) and a member of the Board of Visitors (1994-1998) for the University of North Carolina at Chapel Hill and currently serves on the Board of Directors of the University of North Carolina Health Care System and the Board of Visitors of the Kenan-Flagler Business School (University of North Carolina at Chapel Hill). He also served as Vice President of Finance for the University of North Carolina (16-school system, 1995-1998). |
Cornelia M. Small (60) |
| Year of Election or Appointment: 2005 Ms. Small is a member (2000) and Chairperson (2002) of the Investment Committee, and a member (2002) of the Board of Trustees of Smith College. Previously, she served as Chief Investment Officer (1999-2000), Director of Global Equity Investments (1996-1999), and a member of the Board of Directors of Scudder, Stevens & Clark (1990-1997) and Scudder Kemper Investments (1997-1998). In addition, Ms. Small served as Co-Chair (2000-2003) of the Annual Fund for the Fletcher School of Law and Diplomacy. |
William S. Stavropoulos (65) |
| Year of Election or Appointment: 2002 Mr. Stavropoulos is Chairman of the Board (2000), CEO (2002), a position he previously held from 1995-2000, Chairman of the Executive Committee (2000), and a Member of the Board of Directors of The Dow Chemical Company. Since joining The Dow Chemical Company in 1967, Mr. Stavropoulos served in numerous senior management positions, including President (1993-2000; 2002-2003). Currently, he is a Director of NCR Corporation (data warehousing and technology solutions), BellSouth Corporation (telecommunications), Chemical Financial Corporation, and Maersk Inc. (industrial conglomerate, 2002). He also serves as a member of the Board of Trustees of the American Enterprise Institute for Public Policy Research. In addition, Mr. Stavropoulos is a member of The Business Council, J.P. Morgan International Council and the University of Notre Dame Advisory Council for the College of Science. |
Kenneth L. Wolfe (65) |
| Year of Election or Appointment: 2005 Mr. Wolfe also serves as Trustee (2005) or Member of the Advisory Board (2004) of other investment companies advised by FMR. Prior to his retirement in 2001, Mr. Wolfe was Chairman and Chief Executive Officer of Hershey Foods Corporation (1993-2001). He currently serves as a member of the boards of Adelphia Communications Corporation (2003), Bausch & Lomb, Inc., and Revlon Inc. (2004). |
Advisory Board Member and Executive Officers:
Correspondence intended for each executive officer and Mr. Lynch may be sent to Fidelity Investments, 82 Devonshire Street, Boston, Massachusetts 02109.
Name, Age; Principal Occupation |
Peter S. Lynch (61) |
| Year of Election or Appointment: 2003 Member of the Advisory Board of Variable Insurance Products Fund IV. Vice Chairman and a Director of FMR, and Vice Chairman (2001) and a Director (2000) of FMR Co., Inc. Previously, Mr. Lynch served as a Trustee of the Fidelity funds (1990-2003). Prior to May 31, 1990, he was a Director of FMR and Executive Vice President of FMR (a position he held until March 31, 1991), Vice President of Fidelity® Magellan® Fund and FMR Growth Group Leader, and Managing Director of FMR Corp. Mr. Lynch was also Vice President of Fidelity Investments Corporate Services. In addition, he serves as a Trustee of Boston College, Massachusetts Eye & Ear Infirmary, Historic Deerfield, John F. Kennedy Library, and the Museum of Fine Arts of Boston. |
Bart A. Grenier (45) |
| Year of Election or Appointment: 2003 Vice President of VIP Value Leaders. Mr. Grenier also serves as Vice President of certain Equity Funds (2001), a position he previously held from 1999 to 2000, and Vice President of certain High Income Funds (2002). He is Senior Vice President of FMR (1999) and FMR Co., Inc. (2001), and President and Director of Strategic Advisers, Inc. (2002). He also heads Fidelity's Asset Allocation Group (2000), Fidelity's Growth and Income Group (2001), Fidelity's Value Group (2001), and Fidelity's High Income Division (2001). Previously, Mr. Grenier served as President of Fidelity Ventures (2000), Vice President of certain High Income Funds (1997-2000), High Income Division Head (1997-2000), Group Leader of the Income-Growth and Asset Allocation-Income Groups (1996-2000), and Assistant Equity Division Head (1997-2000). |
Eric D. Roiter (56) |
| Year of Election or Appointment: 2003 |
| Secretary of VIP Value Leaders. He also serves as Secretary of other Fidelity funds; Vice President, General Counsel, and Secretary of FMR Co., Inc. (2001-present) and FMR; Vice President and Secretary of FDC; Assistant Secretary of Fidelity Management & Research (U.K.) Inc. (2001-present), Fidelity Management & Research (Far East) Inc. (2001-present), and Fidelity Investments Money Management, Inc. (2001-present). Mr. Roiter is an Adjunct Member, Faculty of Law, at Boston College Law School (2003-present). |
Stuart Fross (45) |
| Year of Election or Appointment: 2003 Assistant Secretary of VIP Value Leaders. Mr. Fross also serves as Assistant Secretary of other Fidelity funds (2003) and is an employee of FMR. |
Christine Reynolds (46) |
| Year of Election or Appointment: 2004 President, Treasurer, and Anti-Money Laundering (AML) officer of VIP Value Leaders. Ms. Reynolds also serves as President, Treasurer, and AML officer of other Fidelity funds (2004) and is a Vice President (2003) and an employee (2002) of FMR. Before joining Fidelity Investments, Ms. Reynolds worked at PricewaterhouseCoopers LLP (PwC) (1980-2002), where she was most recently an audit partner with PwC's investment management practice. |
Timothy F. Hayes (54) |
| Year of Election or Appointment: 2003 Chief Financial Officer of VIP Value Leaders. Mr. Hayes also serves as Chief Financial Officer of other Fidelity funds (2002). Recently he was appointed President of Fidelity Service Company (2003) where he also serves as a Director. Mr. Hayes also serves as President of Fidelity Investments Operations Group (FIOG, 2002), which includes Fidelity Pricing and Cash Management Services Group (FPCMS), where he was appointed President in 1998. Previously, Mr. Hayes served as Chief Financial Officer of Fidelity Investments Corporate Systems and Service Group (1998) and Fidelity Systems Company (1997-1998). |
Kenneth A. Rathgeber (57) |
| Year of Election or Appointment: 2004 Chief Compliance Officer of VIP Value Leaders. Mr. Rathgeber also serves as Chief Compliance Officer of other Fidelity funds (2004) and Executive Vice President of Risk Oversight for Fidelity Investments (2002). Previously, he served as Executive Vice President and Chief Operating Officer for Fidelity Investments Institutional Services Company, Inc. (1998-2002). |
John R. Hebble (46) |
| Year of Election or Appointment: 2003 Deputy Treasurer of VIP Value Leaders. Mr. Hebble also serves as Deputy Treasurer of other Fidelity funds (2003), and is an employee of FMR. Before joining Fidelity Investments, Mr. Hebble worked at Deutsche Asset Management where he served as Director of Fund Accounting (2002-2003) and Assistant Treasurer of the Scudder Funds (1998-2003). |
Kimberley H. Monasterio (41) |
| Year of Election or Appointment: 2004 Deputy Treasurer of VIP Value Leaders. Ms. Monasterio also serves as Deputy Treasurer of other Fidelity funds (2004) and is an employee of FMR (2004). Before joining Fidelity Investments, Ms. Monasterio served as Treasurer (2000-2004) and Chief Financial Officer (2002-2004) of the Franklin Templeton Funds and Senior Vice President of Franklin Templeton Services, LLC (2000-2004). |
John H. Costello (58) |
| Year of Election or Appointment: 2003 Assistant Treasurer of VIP Value Leaders. Mr. Costello also serves as Assistant Treasurer of other Fidelity funds and is an employee of FMR. |
Peter L. Lydecker (50) |
| Year of Election or Appointment: 2004 Assistant Treasurer of VIP Value Leaders. Mr. Lydecker also serves as Assistant Treasurer of other Fidelity funds (2004) and is an employee of FMR. |
Mark Osterheld (49) |
| Year of Election or Appointment: 2003 Assistant Treasurer of VIP Value Leaders. Mr. Osterheld also serves as Assistant Treasurer of other Fidelity funds (2002) and is an employee of FMR. |
Kenneth B. Robins (35) |
| Year of Election or Appointment: 2004 Assistant Treasurer of VIP Value Leaders. Mr. Robins also serves as Assistant Treasurer of other Fidelity funds (2004) and is an employee of FMR (2004). Before joining Fidelity Investments, Mr. Robins worked at KPMG LLP, where he was a partner in KPMG's department of professional practice (2002-2004) and a Senior Manager (1999-2000). In addition, Mr. Robins served as Assistant Chief Accountant, United States Securities and Exchange Commission (2000-2002). |
Annual Report
Distributions
The Board of Trustees of Variable Insurance Products IV: Value Leaders Portfolio voted to pay to shareholders of record at the opening of business on record date, the following distributions per share derived from capital gains realized from sales of portfolio securities, and dividends derived from net investment income:
Fund | Pay Date | Record Date | Dividends | Capital Gains |
Initial Class | 2/11/05 | 2/11/05 | $.01 | $.125 |
Service Class | 2/11/05 | 2/11/05 | $.01 | $.125 |
Service Class 2 | 2/11/05 | 2/11/05 | $.01 | $.125 |
The fund will notify shareholders in January 2005 of amounts for use in preparing 2004 income tax returns.
Annual Report
Proxy Voting Results
A special meeting of the fund's shareholders was held on December 14, 2004. The results of votes taken among shareholders on proposals before them are reported below. Each vote reported represents one dollar of net asset value held on the record date for the meeting.
PROPOSAL 1 |
To amend the Declaration of Trust to allow the Board of Trustees, if permitted by applicable law, to authorize fund mergers without shareholder approval. A |
| # of
Votes | % of
Votes |
Affirmative | 458,190,063.70 | 83.431 |
Against | 70,246,908.89 | 12.791 |
Abstain | 20,745,786.74 | 3.778 |
TOTAL | 549,182,759.33 | 100.000 |
PROPOSAL 2 |
To elect a Board of Trustees. A |
| # of
Votes | % of
Votes |
J. Michael Cook |
Affirmative | 521,583,205.95 | 94.974 |
Withheld | 27,599,553.38 | 5.026 |
TOTAL | 549,182,759.33 | 100.000 |
Ralph F. Cox |
Affirmative | 519,150,329.49 | 94.531 |
Withheld | 30,032,429.84 | 5.469 |
TOTAL | 549,182,759.33 | 100.000 |
Laura B. Cronin |
Affirmative | 520,911,931.53 | 94.852 |
Withheld | 28,270,827.80 | 5.148 |
TOTAL | 549,182,759.33 | 100.000 |
Dennis J. Dirks B |
Affirmative | 521,590,729.90 | 94.976 |
Withheld | 27,592,029.43 | 5.024 |
TOTAL | 549,182,759.33 | 100.000 |
Robert M. Gates |
Affirmative | 519,905,480.12 | 94.669 |
Withheld | 29,277,279.21 | 5.331 |
TOTAL | 549,182,759.33 | 100.000 |
George H. Heilmeier |
Affirmative | 520,921,777.54 | 94.854 |
Withheld | 28,260,981.79 | 5.146 |
TOTAL | 549,182,759.33 | 100.000 |
Abigail P. Johnson |
Affirmative | 519,065,339.91 | 94.516 |
Withheld | 30,117,419.42 | 5.484 |
TOTAL | 549,182,759.33 | 100.000 |
Edward C. Johnson 3d |
Affirmative | 518,847,346.05 | 94.476 |
Withheld | 30,335,413.28 | 5.524 |
TOTAL | 549,182,759.33 | 100.000 |
Donald J. Kirk |
Affirmative | 521,181,241.00 | 94.901 |
Withheld | 28,001,518.33 | 5.099 |
TOTAL | 549,182,759.33 | 100.000 |
| # of
Votes | % of
Votes |
Marie L. Knowles |
Affirmative | 521,391,176.23 | 94.939 |
Withheld | 27,791,583.10 | 5.061 |
TOTAL | 549,182,759.33 | 100.000 |
Ned C. Lautenbach |
Affirmative | 521,804,568.92 | 95.015 |
Withheld | 27,378,190.41 | 4.985 |
TOTAL | 549,182,759.33 | 100.000 |
Marvin L. Mann |
Affirmative | 520,497,408.02 | 94.777 |
Withheld | 28,685,351.31 | 5.223 |
TOTAL | 549,182,759.33 | 100.000 |
William O. McCoy |
Affirmative | 520,233,312.84 | 94.729 |
Withheld | 28,949,446.49 | 5.271 |
TOTAL | 549,182,759.33 | 100.000 |
Robert L. Reynolds |
Affirmative | 521,415,834.89 | 94.944 |
Withheld | 27,766,924.44 | 5.056 |
TOTAL | 549,182,759.33 | 100.000 |
Cornelia M. Small B |
Affirmative | 521,014,631.05 | 94.871 |
Withheld | 28,168,128.28 | 5.129 |
TOTAL | 549,182,759.33 | 100.000 |
William S. Stavropoulos |
Affirmative | 520,522,282.96 | 94.781 |
Withheld | 28,660,476.37 | 5.219 |
TOTAL | 549,182,759.33 | 100.000 |
A Denotes trust-wide proposals and voting results. B Effective January 1, 2005. |
Annual Report
Annual Report
Value Leaders Portfolio
Investment Adviser
Fidelity Management & Research Company
Boston, MA
Investment Sub-Advisers
FMR Co., Inc.
Fidelity Management & Research (U.K.) Inc.
Fidelity Management & Research (Far East) Inc.
Fidelity Investments Japan Limited
Fidelity International Investment Advisors
Fidelity International Investment Advisors (U.K.) Limited
General Distributor
Fidelity Distributors Corporation
Boston, MA
Transfer and Shareholder Servicing Agent
Fidelity Investments Institutional Operations Company, Inc.
Boston, MA
Custodian
Brown Brothers Harriman & Co.
Boston, MA
VVL-ANN-0205
1.796594.101
Fidelity® Variable Insurance Products:
Strategic Income Portfolio
Annual Report
December 31, 2004
(2_fidelity_logos) (Registered_Trademark)
Contents
Performance | 3 | How the fund has done over time. |
Management's Discussion | 4 | The manager's review of fund performance, strategy and outlook. |
Shareholder Expense Example | 5 | An example of shareholder expenses. |
Investment Summary | 7 | A summary of the fund's investments at period end. |
Investments | 8 | A complete list of the fund's investments with their
market values. |
Financial Statements | 18 | Statements of assets and liabilities, operations, and
changes in net assets, as well as financial highlights. |
Notes | 22 | Notes to the financial statements. |
Report of Independent Registered Public Accounting Firm | 26 | |
Central Investment Portfolio Top Fifty Holdings | 27 | Top Fifty holdings of each Fidelity Central Investment Portfolio held by the fund. |
Trustees and Officers | 28 | |
Distributions | 33 | |
Proxy Voting Results | 34 | |
| | |
| | |
To view a fund's proxy voting guidelines and proxy voting record for the 12-month period ended June 30, visit www.fidelity.com/proxyvotingresults or visit the Securities and Exchange Commission's (SEC) web site at www.sec.gov. You may also call 1-800-544-5429 to request a free copy of the proxy voting guidelines.
Fidelity Variable Insurance Products are separate account options which are purchased through a variable insurance contract.
Standard & Poor's, S&P and S&P 500 are registered service marks of The McGraw-Hill Companies, Inc. and have been licensed for use by Fidelity Distributors Corporation.
Other third party marks appearing herein are the property of their respective owners.
All other marks appearing herein are registered or unregistered trademarks or service marks of FMR Corp. or an affiliated company.
(Recycle graphic) This report is printed on recycled paper using soy-based inks.
This report and the financial statements contained herein are submitted for the general information of the shareholders of the fund. This report is not authorized for distribution to prospective investors in the fund unless preceded or accompanied by an effective prospectus.
A fund files its complete schedule of portfolio holdings with the SEC for the first and third quarters of each fiscal year on Form N-Q. Forms N-Q are available on the SEC's web site at http://www.sec.gov. A fund's Forms N-Q may be reviewed and copied at the SEC's Public Reference Room in Washington, DC. Information regarding the operation of the SEC's Public Reference Room may be obtained by calling 1-800-SEC-0330. For a complete list of a fund's portfolio holdings, view the most recent quarterly holdings report, semiannual report, or annual report on Fidelity's web site at http://www.advisor.fidelity.com.
NOT FDIC INSURED · MAY LOSE VALUE · NO BANK GUARANTEE
Neither the fund nor Fidelity Distributors Corporation is a bank.
Strategic Income Portfolio
Fidelity Variable Insurance Products: Strategic Income Portfolio
Performance: The Bottom Line
Average annual total return reflects the change in the value of an investment, assuming reinvestment of the class' dividend income and capital gains (the profits earned upon the sale of securities that have grown in value) and assuming a constant rate of performance each year. During periods of reimbursement by Fidelity, a fund's total return will be greater than it would be had the reimbursement not occurred. Performance numbers are net of all underlying fund operating expenses, but do not include any insurance charges imposed by your insurance company's separate account. If performance information included the effect of these additional charges, the total returns would have been lower. How a fund did yesterday is no guarantee of how it will do tomorrow.
Average Annual Total Returns
Periods ended December 31, 2004 | | Past 1
year | Life of
fund A |
Fidelity® VIP: Strategic Income - Initial Class | | 8.66% | 8.44% |
Fidelity VIP: Strategic Income - Service Class B | | 8.41% | 8.19% |
Fidelity VIP: Strategic Income - Service Class 2 C | | 8.26% | 8.05% |
A From December 23, 2003.
B Performance for Service Class shares reflects an asset-based service fee (12b-1 fee).
C Performance for Service Class 2 shares reflects an asset-based service fee (12b-1 fee).
$10,000 Over Life of Fund
Let's say hypothetically that $10,000 was invested in Fidelity Variable Insurance Products: Strategic Income Portfolio - Initial Class on December 23, 2003, when the fund started. The chart shows how the value of your investment would have changed, and also shows how the Merrill Lynch® U.S. High Yield Master II Index performed over the same period.

Annual Report
Fidelity Variable Insurance Products: Strategic Income Portfolio
Management's Discussion of Fund Performance
Comments from William Eigen, Portfolio Manager of Fidelity® Variable Insurance Products: Strategic Income Portfolio
Investors in U.S. domestic and international fixed-income markets generally found positive returns in 2004, with the strongest gains coming from riskier debt classes. High-yield bonds had another solid year, with the Merrill Lynch® U.S. High Yield Master II Index rising 10.87%. Lower-rated securities once again led the surge, bolstered by improving issuer fundamentals, declining default rates and robust demand from yield-hungry investors. Emerging-markets debt - as measured by the J.P. Morgan Emerging Markets Bond Index Global - also did well, gaining 11.73% on strengthening export-driven local economies and heavy capital flows into the region. Foreign investment-grade debt was a standout in its own right, returning 12.14% according to the Citigroup® Non-U.S. Dollar World Government Bond Index. The U.S. dollar's slide versus most major currencies helped pace the sector. Meanwhile, U.S. government securities struggled as Treasuries were held back by fears of an upturn in long-term interest rates. The Lehman Brothers® Government Bond Index rose just 3.48%.
During the year, the fund performed roughly in line with the Fidelity Strategic Income Composite Index and the LipperSM Variable Annuity Income Funds Average, which returned 9.25% and 8.47%, respectively. Though solid, the fund's overall results could have been better, I felt, given that we benefited from some well-timed tactical asset allocation shifts and two of the four subportfolios beat their respective benchmarks - with the other two finishing about even with their indexes. However, in ramping up operations, the fund received heavy asset flows at times when the market was extremely volatile, a factor that generally restrained performance. I positioned the fund offensively in terms of riskier assets outperforming, but defensively against rising interest rates. This approach largely worked well, particularly among U.S. government securities, whose low single-digit return as a group significantly trailed the broader bond market. In addition to heavily underweighting nominal Treasuries, the fund benefited from investing in Treasury Inflation-Protected Securities, which fared nicely. Unfortunately, substituting cash for some Treasuries curbed our gains slightly in a rising bond market. Modestly overweighting high-yield bonds aided returns versus the index, as did some well-timed tactical shifts among the foreign debt components. Strong credit analysis helped the high-yield subportfolio wipe out an early deficit versus its benchmark, while the emerging-markets subportfolio solidly outperformed due to country and security selection. The U.S. government subportfolio was in line with its index despite favorable sector positioning, while the developed-markets subportfolio did well, helped by capturing relative valuation differences between various interest rate markets in Europe, Canada and Japan.
The views expressed in this statement reflect those of the portfolio manager only through the end of the period of the report as stated on the cover and do not necessarily represent the views of Fidelity or any other person in the Fidelity organization. Any such views are subject to change at any time based upon market or other conditions and Fidelity disclaims any responsibility to update such views. These views may not be relied on as investment advice and, because investment decisions for a Fidelity fund are based on numerous factors, may not be relied on as an indication of trading intent on behalf of any Fidelity fund.
Strategic Income Portfolio
Fidelity Variable Insurance Products: Strategic Income Portfolio
Shareholder Expense Example
As a shareholder of the Fund, you incur two types of costs: (1) transaction costs, and (2) ongoing costs, including management fees, distribution and/or service (12b-1) fees and other Fund expenses. This Example is intended to help you understand your ongoing costs (in dollars) of investing in the Fund and to compare these costs with the ongoing costs of investing in other mutual funds.
The Example is based on an investment of $1,000 invested at the beginning of the period and held for the entire period (July 1, 2004 to December 31, 2004).
Actual Expenses
The first line of the table below for each class of the Fund provides information about actual account values and actual expenses. You may use the information in this line, together with the amount you invested, to estimate the expenses that you paid over the period. Simply divide your account value by $1,000.00 (for example, an $8,600 account value divided by $1,000.00 = 8.6), then multiply the result by the number in the first line for a class of the Fund under the heading entitled "Expenses Paid During Period" to estimate the expenses you paid on your account during this period. The estimate of expenses does not include any fees or other expenses of any variable annuity or variable life insurance product. If they were, the estimate of expenses you paid during the period would be higher, and your ending account value would be lower.
Hypothetical Example for Comparison Purposes
The second line of the table below for each class of the Fund provides information about hypothetical account values and hypothetical expenses based on a Class' actual expense ratio and an assumed rate of return of 5% per year before expenses, which is not the Class' actual return. The hypothetical account values and expenses may not be used to estimate the actual ending account balance or expenses you paid for the period. You may use this information to compare the ongoing costs of investing in the Fund and other funds. To do so, compare this 5% hypothetical example with the 5% hypothetical examples that appear in the shareholder reports of the other funds. The estimate of expenses does not include any fees or other expenses of any variable annuity or variable life insurance product. If they were, the estimate of expenses you paid during the period would be higher, and your ending account value would be lower.
Please note that the expenses shown in the table are meant to highlight your ongoing costs only and do not reflect any transaction costs. Therefore, the second line of the table is useful in comparing ongoing costs only, and will not help you determine the relative total costs of owning different funds.
| Beginning
Account Value
July 1, 2004 | Ending
Account Value
December 31, 2004 | Expenses Paid
During Period*
July 1, 2004
to December 31, 2004 |
Initial Class | | | |
Actual | $ 1,000.00 | $ 1,100.40 | $ 4.17** |
HypotheticalA | $ 1,000.00 | $ 1,021.17 | $ 4.01** |
Service Class | | | |
Actual | $ 1,000.00 | $ 1,098.90 | $ 5.80** |
HypotheticalA | $ 1,000.00 | $ 1,019.61 | $ 5.58** |
Service Class 2 | | | |
Actual | $ 1,000.00 | $ 1,097.40 | $ 6.59** |
HypotheticalA | $ 1,000.00 | $ 1,018.85 | $ 6.34** |
A 5% return per year before expenses
* Expenses are equal to each Class' annualized expense ratio (shown in the table below); multiplied by the average account value over the period, multiplied by 184/366 (to reflect the one-half year period).
| Annualized
Expense Ratio |
Initial Class | .79%** |
Service Class | 1.10%** |
Service Class 2 | 1.25%** |
** If changes to voluntary expense limitations effective February 1, 2005, had been in effect during the period, the annualized expense ratio and the expenses paid in the actual and hypothetical examples above would have been as follows:
Annual Report
Fidelity Variable Insurance Products: Strategic Income Portfolio
Shareholder Expense Example - Continued
| Annualized Expense Ratio | Expenses Paid |
Initial Class | .75% | |
Actual | | $ 3.96 |
HypotheticalA | | $ 3.81 |
Service Class | .85% | |
Actual | | $ 4.49 |
HypotheticalA | | $ 4.32 |
Service Class 2 | 1.00% | |
Actual | | $ 5.28 |
HypotheticalA | | $ 5.08 |
A 5% return per year before expenses
Strategic Income Portfolio
Fidelity Variable Insurance Products: Strategic Income Portfolio
Investment Summary
Top Five Holdings as of December 31, 2004 |
(by issuer, excluding cash equivalents) | % of fund's
net assets |
U.S. Treasury Obligations | 13.9 |
Fannie Mae | 5.0 |
German Federal Republic | 4.8 |
Brazilian Federative Republic | 2.8 |
Japan Government | 2.3 |
| 28.8 |
Top Five Market Sectors as of December 31, 2004 |
| % of fund's
net assets |
Telecommunication Services | 10.2 |
Consumer Discretionary | 9.7 |
Materials | 5.2 |
Energy | 5.1 |
Financials | 4.5 |
Quality Diversification (% of fund's net assets) |
As of December 31, 2004 | | |
 | U.S. Government and
U.S. Government Agency Obligations | 19.6% | |
 | AAA, AA, A | 13.9% | |
 | BBB | 3.8% | |
 | BB | 13.6% | |
 | B | 30.0% | |
 | CCC, CC, C | 9.1% | |
 | D | 0.1% | |
 | Not Rated | 1.1% | |
 | Other Investments | 0.0% | |
 | Equities | 0.8% | |
 | Short-Term
Investments and
Net Other Assets | 8.0% | |

We have used ratings from Moody's® Investors Services, Inc. Where Moody's ratings are not available, we have used S&P® ratings. Percentages are adjusted for the effect of futures contracts, if applicable. |
Asset Allocation (% of fund's net assets) |
As of December 31, 2004* | | |
| Corporate Bonds | 45.8% | |
| U.S. Government and U.S. Government Agency Obligations | 19.6% | |
| Foreign Government & Government Agency Obligations | 25.2% | |
| Stocks | 0.8% | |
| Other Investments | 0.6% | |
| Short-Term
Investments and
Net Other Assets | 8.0% | |

* Foreign
investments 38.5% | |
The information in the above tables is based on the combined investments of the fund and its pro-rata share of the investments of Fidelity's fixed-income central funds. |
Annual Report
Fidelity Variable Insurance Products: Strategic Income Portfolio
Investments December 31, 2004
Showing Percentage of Net Assets
Nonconvertible Bonds - 45.3% |
| Principal Amount (d) | | Value (Note 1) |
CONSUMER DISCRETIONARY - 9.3% |
Auto Components - 0.5% |
Affinia Group, Inc. 9% 11/30/14(g) | | $ 150,000 | | $ 156,375 |
Cooper Standard Auto, Inc.: | | | | |
7% 12/15/12 (g) | | 40,000 | | 40,600 |
8.375% 12/15/14 (g) | | 90,000 | | 90,000 |
EaglePicher, Inc. 9.75% 9/1/13 | | 30,000 | | 30,000 |
Tenneco Automotive, Inc. 8.625% 11/15/14 (g) | | 50,000 | | 51,875 |
TRW Automotive Acquisition Corp.: | | | | |
9.375% 2/15/13 | | 120,000 | | 138,600 |
11% 2/15/13 | | 13,000 | | 15,665 |
| | 523,115 |
Hotels, Restaurants & Leisure - 2.4% |
Carrols Corp. 9% 1/15/13 (g) | | 145,000 | | 150,075 |
Domino's, Inc. 8.25% 7/1/11 | | 100,000 | | 109,000 |
Gaylord Entertainment Co.: | | | | |
6.75% 11/15/14 (g) | | 265,000 | | 265,663 |
8% 11/15/13 | | 100,000 | | 108,000 |
Herbst Gaming, Inc.: | | | | |
7% 11/15/14 (g) | | 60,000 | | 60,900 |
8.125% 6/1/12 | | 100,000 | | 107,250 |
ITT Corp. 7.375% 11/15/15 | | 125,000 | | 139,688 |
Landry's Seafood Restaurants, Inc. 7.5% 12/15/14 (g) | | 120,000 | | 119,550 |
Mandalay Resort Group: | | | | |
6.375% 12/15/11 | | 80,000 | | 83,600 |
6.5% 7/31/09 | | 20,000 | | 21,000 |
MGM MIRAGE: | | | | |
6% 10/1/09 | | 40,000 | | 41,000 |
6.75% 9/1/12 | | 110,000 | | 116,050 |
8.5% 9/15/10 | | 50,000 | | 57,250 |
Morton's Restaurant Group, Inc. 7.5% 7/1/10 | | 90,000 | | 87,750 |
Penn National Gaming, Inc. 6.875% 12/1/11 | | 140,000 | | 145,600 |
Royal Caribbean Cruises Ltd. 6.875% 12/1/13 | | 40,000 | | 43,200 |
Scientific Games Corp. 6.25% 12/15/12 (g) | | 40,000 | | 40,500 |
Speedway Motorsports, Inc. 6.75% 6/1/13 | | 95,000 | | 99,750 |
Starwood Hotels & Resorts Worldwide, Inc. 7.875% 5/1/12 | | 100,000 | | 114,500 |
Station Casinos, Inc.: | | | | |
6% 4/1/12 | | 80,000 | | 82,400 |
6.5% 2/1/14 | | 20,000 | | 20,550 |
Sun International Hotels Ltd./Sun International North America, Inc. 8.875% 8/15/11 | | 120,000 | | 131,700 |
Town Sports International Holdings, Inc. 0% 2/1/14 (e) | | 35,000 | | 18,550 |
|
| Principal Amount (d) | | Value (Note 1) |
Vail Resorts, Inc. 6.75% 2/15/14 | | $ 225,000 | | $ 228,656 |
Virgin River Casino Corp./RBG LLC/B&BB, Inc.: | | | | |
0% 1/15/13 (e)(g) | | 60,000 | | 37,500 |
9% 1/15/12 (g) | | 40,000 | | 41,600 |
| | 2,471,282 |
Household Durables - 0.9% |
Beazer Homes USA, Inc. 8.625% 5/15/11 | | 50,000 | | 54,375 |
Goodman Global Holdings, Inc.: | | | | |
5.76% 6/15/12 (g)(i) | | 40,000 | | 40,700 |
7.875% 12/15/12 (g) | | 190,000 | | 189,288 |
K. Hovnanian Enterprises, Inc.: | | | | |
6% 1/15/10 (g) | | 40,000 | | 40,400 |
6.25% 1/15/15 (g) | | 60,000 | | 59,100 |
7.75% 5/15/13 | | 100,000 | | 106,500 |
KB Home 8.625% 12/15/08 | | 50,000 | | 56,625 |
Levitz Home Furnishings, Inc. 12% 11/1/11 (g) | | 90,000 | | 91,800 |
Standard Pacific Corp.: | | | | |
7.75% 3/15/13 | | 20,000 | | 21,475 |
9.25% 4/15/12 | | 30,000 | | 34,800 |
Technical Olympic USA, Inc. 7.5% 1/15/15 (g) | | 90,000 | | 89,100 |
William Lyon Homes, Inc. 7.5% 2/15/14 | | 100,000 | | 96,000 |
| | 880,163 |
Leisure Equipment & Products - 0.0% |
Riddell Bell Holdings, Inc. 8.375% 10/1/12 (g) | | 40,000 | | 41,600 |
Media - 5.0% |
AMC Entertainment, Inc.: | | | | |
8% 3/1/14 | | 75,000 | | 73,875 |
8.625% 8/15/12 (g) | | 50,000 | | 55,125 |
9.875% 2/1/12 | | 70,000 | | 75,600 |
Cablevision Systems Corp. 8% 4/15/12 (g) | | 715,000 | | 760,581 |
CanWest Media, Inc. 8% 9/15/12 (g) | | 40,000 | | 42,700 |
Charter Communications Operating LLC/Charter Communications Operating Capital Corp.: | | | | |
8% 4/30/12 (g) | | 50,000 | | 52,125 |
8.375% 4/30/14 (g) | | 85,000 | | 89,144 |
Cinemark USA, Inc. 9% 2/1/13 | | 30,000 | | 34,275 |
Cinemark, Inc. 0% 3/15/14 (e) | | 160,000 | | 121,200 |
Corus Entertainment, Inc. 8.75% 3/1/12 | | 60,000 | | 65,775 |
CSC Holdings, Inc.: | | | | |
7.625% 4/1/11 | | 40,000 | | 43,200 |
7.625% 7/15/18 | | 525,000 | | 556,500 |
7.875% 2/15/18 | | 160,000 | | 172,800 |
Dex Media, Inc. 8% 11/15/13 | | 230,000 | | 248,400 |
Nonconvertible Bonds - continued |
| Principal Amount (d) | | Value (Note 1) |
CONSUMER DISCRETIONARY - continued |
Media - continued |
EchoStar DBS Corp.: | | | | |
6.375% 10/1/11 | | $ 45,000 | | $ 46,125 |
6.625% 10/1/14 (g) | | 350,000 | | 355,250 |
Entravision Communications Corp. 8.125% 3/15/09 | | 90,000 | | 94,950 |
Haights Cross Communications, Inc. 0% 8/15/11 (e) | | 20,000 | | 13,100 |
Haights Cross Operating Co. 11.75% 8/15/11 | | 40,000 | | 45,200 |
Houghton Mifflin Co.: | | | | |
0% 10/15/13 (e) | | 580,000 | | 429,200 |
8.25% 2/1/11 | | 20,000 | | 21,300 |
9.875% 2/1/13 | | 130,000 | | 142,025 |
IMAX Corp. 9.625% 12/1/10 | | 45,000 | | 49,050 |
Innova S. de R.L. 9.375% 9/19/13 | | 240,000 | | 273,600 |
Lamar Media Corp. 7.25% 1/1/13 | | 50,000 | | 53,500 |
PanAmSat Holding Corp. 0% 11/1/14 (e)(g) | | 175,000 | | 119,875 |
PEI Holdings, Inc. 11% 3/15/10 | | 60,000 | | 69,900 |
Rainbow National LLC & RNS Co. Corp.: | | | | |
8.75% 9/1/12 (g) | | 110,000 | | 119,350 |
10.375% 9/1/14 (g) | | 280,000 | | 316,400 |
Rogers Cable, Inc.: | | | | |
5.5% 3/15/14 | | 65,000 | | 61,263 |
6.25% 6/15/13 | | 240,000 | | 239,700 |
6.75% 3/15/15 (g) | | 60,000 | | 60,975 |
The Reader's Digest Association, Inc. 6.5% 3/1/11 | | 125,000 | | 130,625 |
WDAC Subsidiary Corp. 8.375% 12/1/14 (g) | | 50,000 | | 49,250 |
| | 5,081,938 |
Specialty Retail - 0.2% |
The Pep Boys - Manny, Moe & Jack 7.5% 12/15/14 | | 150,000 | | 152,250 |
Textiles, Apparel & Luxury Goods - 0.3% |
AAC Group Holding Corp. 0% 10/1/12 (e)(g) | | 225,000 | | 149,625 |
Levi Strauss & Co. 9.75% 1/15/15 (g) | | 170,000 | | 167,875 |
| | 317,500 |
TOTAL CONSUMER DISCRETIONARY | | 9,467,848 |
CONSUMER STAPLES - 0.8% |
Food & Staples Retailing - 0.4% |
Ahold Finance USA, Inc. 8.25% 7/15/10 | | 153,000 | | 174,420 |
Pathmark Stores, Inc. 8.75% 2/1/12 | | 50,000 | | 48,500 |
|
| Principal Amount (d) | | Value (Note 1) |
Reddy Ice Holdings, Inc. 0% 11/1/12 (e)(g) | | $ 130,000 | | $ 89,700 |
Southern States Cooperative, Inc. 10.5% 11/1/10 (g) | | 80,000 | | 82,800 |
| | 395,420 |
Food Products - 0.3% |
Doane Pet Care Co.: | | | | |
9.75% 5/15/07 | | 25,000 | | 24,625 |
10.75% 3/1/10 | | 135,000 | | 144,450 |
Hines Nurseries, Inc. 10.25% 10/1/11 | | 120,000 | | 131,100 |
Philipp Brothers Chemicals, Inc. 9.875% 6/1/08 | | 35,000 | | 32,900 |
| | 333,075 |
Household Products - 0.1% |
Central Garden & Pet Co. 9.125% 2/1/13 | | 75,000 | | 83,063 |
Personal Products - 0.0% |
Elizabeth Arden, Inc. 7.75% 1/15/14 | | 40,000 | | 42,400 |
TOTAL CONSUMER STAPLES | | 853,958 |
ENERGY - 5.0% |
Energy Equipment & Services - 0.6% |
CHC Helicopter Corp. 7.375% 5/1/14 | | 240,000 | | 252,000 |
Hanover Compressor Co. 9% 6/1/14 | | 30,000 | | 33,300 |
Petroliam Nasional BHD (Petronas) 7.625% 10/15/26 (Reg. S) | | 105,000 | | 127,903 |
Seabulk International, Inc. 9.5% 8/15/13 | | 135,000 | | 143,100 |
| | 556,303 |
Oil & Gas - 4.4% |
Belden & Blake Corp. 8.75% 7/15/12 (g) | | 190,000 | | 194,275 |
Chesapeake Energy Corp.: | | | | |
7.5% 9/15/13 | | 40,000 | | 43,550 |
7.5% 6/15/14 | | 35,000 | | 38,150 |
7.75% 1/15/15 | | 30,000 | | 32,700 |
Encore Acquisition Co. 8.375% 6/15/12 | | 40,000 | | 44,600 |
Energy Partners Ltd. 8.75% 8/1/10 | | 155,000 | | 168,950 |
EXCO Resources, Inc. 7.25% 1/15/11 | | 10,000 | | 10,750 |
General Maritime Corp. 10% 3/15/13 | | 250,000 | | 287,500 |
Harvest Operations Corp. 7.875% 10/15/11 (g) | | 50,000 | | 50,375 |
Hurricane Finance BV: | | | | |
9.625% 2/12/10 (g) | | 40,000 | | 44,600 |
9.625% 2/12/10 (Reg. S) | | 10,000 | | 11,150 |
InterNorth, Inc. 9.625% 3/15/06 (c) | | 100,000 | | 31,000 |
Nonconvertible Bonds - continued |
| Principal Amount (d) | | Value (Note 1) |
ENERGY - continued |
Oil & Gas - continued |
Markwest Energy Partners LP/ Markwest Energy Finance Corp. 6.875% 11/1/14 (g) | | $ 25,000 | | $ 25,500 |
OAO Gazprom: | | | | |
9.625% 3/1/13 | | 250,000 | | 296,250 |
10.5% 10/21/09 | | 115,000 | | 136,850 |
Pan American Energy LLC 7.125% 10/27/09 (g) | | 150,000 | | 150,375 |
Pecom Energia SA 9% 5/1/09 (Reg. S) | | 45,000 | | 48,218 |
Pemex Project Funding Master Trust: | | | | |
3.79% 6/15/10 (g)(i) | | 365,000 | | 374,490 |
8.625% 2/1/22 | | 160,000 | | 185,400 |
Petrobras Energia SA 9.375% 10/30/13 | | 170,000 | | 183,345 |
Petroleos Mexicanos 9.25% 3/30/18 | | 115,000 | | 141,738 |
Plains Exploration & Production Co.: | | | | |
7.125% 6/15/14 | | 40,000 | | 43,800 |
8.75% 7/1/12 | | 90,000 | | 100,688 |
Range Resources Corp. 7.375% 7/15/13 | | 100,000 | | 107,000 |
Ship Finance International Ltd. 8.5% 12/15/13 | | 145,000 | | 149,350 |
Teekay Shipping Corp. 8.875% 7/15/11 | | 220,000 | | 255,200 |
The Coastal Corp. 7.75% 6/15/10 | | 55,000 | | 57,475 |
Venoco, Inc. 8.75% 12/15/11 (g) | | 70,000 | | 72,100 |
Williams Companies, Inc.: | | | | |
7.625% 7/15/19 | | 215,000 | | 234,350 |
7.75% 6/15/31 | | 150,000 | | 156,000 |
7.875% 9/1/21 | | 30,000 | | 33,300 |
8.125% 3/15/12 | | 530,000 | | 612,150 |
YPF SA yankee 9.125% 2/24/09 | | 135,000 | | 150,525 |
| | 4,471,704 |
TOTAL ENERGY | | 5,028,007 |
FINANCIALS - 4.4% |
Capital Markets - 0.5% |
BCP Caylux Holdings Luxembourg SCA 9.625% 6/15/14 (g) | | 350,000 | | 392,000 |
J.P. Morgan AG (Vimpel Communications) loan participation note 10.45% 4/26/05 (Reg. S) | | 100,000 | | 101,000 |
| | 493,000 |
Commercial Banks - 0.1% |
Standard Bank London Ltd. 8.125% 9/30/09 | | 100,000 | | 101,500 |
|
| Principal Amount (d) | | Value (Note 1) |
Diversified Financial Services - 3.2% |
Aries Vermogensverwaltngs GmbH 9.6% 10/25/14 (g) | | $ 250,000 | | $ 306,250 |
Canada Housing Trust No. 1 4.65% 9/15/09 | CAD | 550,000 | | 475,200 |
Charter Communications Holdings LLC/Charter Communications Holdings Capital Corp. 0% 5/15/11 (e) | | 80,000 | | 58,800 |
Crystal US Holding 3LLC/Crystal US Sub 3Corp.: | | | | |
Series A, 0% 10/1/14 (e)(g) | | 90,000 | | 62,100 |
Series B, 0% 10/1/14 (e)(g) | | 230,000 | | 156,400 |
Entercom Radio LLC/Entercom Capital, Inc. 7.625% 3/1/14 | | 125,000 | | 134,375 |
FIMEP SA 10.5% 2/15/13 | | 70,000 | | 82,775 |
Gerdau AmeriSteel Corp./GUSAP Partners 10.375% 7/15/11 | | 70,000 | | 82,250 |
Global Cash Access LLC/Global Cash Access Finance Corp. 8.75% 3/15/12 | | 240,000 | | 257,700 |
Graham Packaging Co. LP/ GPC Capital Corp.: | | | | |
8.5% 10/15/12 (g) | | 195,000 | | 203,775 |
9.875% 10/15/14 (g) | | 210,000 | | 223,650 |
Jostens Holding Corp. 0% 12/1/13 (e) | | 400,000 | | 284,000 |
Marquee Holdings, Inc. 0% 8/15/14 (e)(g) | | 315,000 | | 209,475 |
MSW Energy Holdings II LLC/MSW Finance Co. II, Inc. 7.375% 9/1/10 | | 120,000 | | 126,000 |
National Beef Packing Co. LLC/National Beef Finance Corp. 10.5% 8/1/11 | | 75,000 | | 77,625 |
New Asat Finance Ltd. 9.25% 2/1/11 (g) | | 80,000 | | 72,800 |
Norcraft Holdings LP/Norcraft Capital Corp. 0% 9/1/12 (e) | | 160,000 | | 120,000 |
Refco Finance Holdings LLC/Refco Finance, Inc. 9% 8/1/12 (g) | | 100,000 | | 109,000 |
Universal City Development Partners Ltd./UCDP Finance, Inc. 11.75% 4/1/10 | | 90,000 | | 106,538 |
Universal City Florida Holding Co. I/II: | | | | |
7.2% 5/1/10 (g)(i) | | 50,000 | | 51,875 |
8.375% 5/1/10 (g) | | 60,000 | | 62,400 |
WH Holdings Ltd./WH Capital Corp. 9.5% 4/1/11 | | 50,000 | | 55,000 |
| | 3,317,988 |
Real Estate - 0.6% |
American Real Estate Partners/American Real Estate Finance Corp. 8.125% 6/1/12 | | 110,000 | | 117,288 |
BF Saul REIT 7.5% 3/1/14 | | 95,000 | | 98,325 |
Nonconvertible Bonds - continued |
| Principal Amount (d) | | Value (Note 1) |
FINANCIALS - continued |
Real Estate - continued |
Crescent Real Estate Equities LP/Crescent Finance Co. 9.25% 4/15/09 | | $ 50,000 | | $ 54,875 |
La Quinta Properties, Inc.: | | | | |
7% 8/15/12 | | 50,000 | | 53,250 |
8.875% 3/15/11 | | 80,000 | | 89,200 |
Senior Housing Properties Trust 8.625% 1/15/12 | | 140,000 | | 159,950 |
| | 572,888 |
TOTAL FINANCIALS | | 4,485,376 |
HEALTH CARE - 3.2% |
Biotechnology - 0.0% |
Polypore, Inc. 8.75% 5/15/12 | | 20,000 | | 20,850 |
Health Care Equipment & Supplies - 0.1% |
Bio-Rad Laboratories, Inc. 7.5% 8/15/13 | | 70,000 | | 76,300 |
Health Care Providers & Services - 2.6% |
AmeriPath, Inc. 10.5% 4/1/13 | | 150,000 | | 159,375 |
AmerisourceBergen Corp.: | | | | |
7.25% 11/15/12 | | 40,000 | | 44,500 |
8.125% 9/1/08 | | 20,000 | | 22,250 |
Beverly Enterprises, Inc. 7.875% 6/15/14 (g) | | 285,000 | | 304,594 |
Concentra Operating Corp. 9.125% 6/1/12 (g) | | 120,000 | | 135,600 |
Curative Health Services, Inc. 10.75% 5/1/11 | | 105,000 | | 93,450 |
Fresenius Medical Care Capital Trust IV 7.875% 6/15/11 | | 125,000 | | 137,813 |
Genesis HealthCare Corp. 8% 10/15/13 | | 125,000 | | 135,625 |
HCA, Inc.: | | | | |
6.375% 1/15/15 | | 190,000 | | 190,407 |
7.875% 2/1/11 | | 100,000 | | 110,190 |
IASIS Healthcare LLC/IASIS Capital Corp. 8.75% 6/15/14 | | 90,000 | | 98,217 |
Service Corp. International (SCI) 6.75% 4/1/16 | | 150,000 | | 153,375 |
Triad Hospitals, Inc. 7% 11/15/13 | | 120,000 | | 123,000 |
U.S. Oncology, Inc.: | | | | |
9% 8/15/12 (g) | | 150,000 | | 165,750 |
10.75% 8/15/14 (g) | | 185,000 | | 211,825 |
Vanguard Health Holding Co. I 0% 10/1/15 (e)(g) | | 345,000 | | 225,975 |
Vanguard Health Holding Co. II LLC 9% 10/1/14 (g) | | 345,000 | | 367,425 |
| | 2,679,371 |
|
| Principal Amount (d) | | Value (Note 1) |
Pharmaceuticals - 0.5% |
CDRV Investors, Inc. 0% 1/1/15 (e)(g) | | $ 175,000 | | $ 108,063 |
Elan Finance PLC/Elan Finance Corp. 7.75% 11/15/11 (g) | | 110,000 | | 117,700 |
Leiner Health Products, Inc. 11% 6/1/12 | | 90,000 | | 98,325 |
VWR International, Inc. 6.875% 4/15/12 (g) | | 150,000 | | 157,125 |
| | 481,213 |
TOTAL HEALTH CARE | | 3,257,734 |
INDUSTRIALS - 3.2% |
Airlines - 0.7% |
American Airlines, Inc. pass thru trust certificates: | | | | |
7.377% 5/23/19 | | 72,582 | | 50,807 |
7.379% 5/23/16 | | 6,735 | | 4,714 |
AMR Corp. 9% 9/15/16 | | 50,000 | | 38,500 |
Continental Airlines, Inc. pass thru trust certificates 6.9% 7/2/18 | | 23,731 | | 19,934 |
Delta Air Lines, Inc.: | | | | |
7.9% 12/15/09 | | 150,000 | | 94,500 |
8.3% 12/15/29 | | 260,000 | | 125,450 |
10% 8/15/08 | | 30,000 | | 22,275 |
Delta Air Lines, Inc. pass thru trust certificates: | | | | |
7.57% 11/18/10 | | 30,000 | | 29,592 |
7.711% 9/18/11 | | 25,000 | | 19,000 |
7.779% 11/18/05 | | 55,000 | | 49,500 |
7.92% 5/18/12 | | 110,000 | | 84,700 |
Northwest Airlines Corp. 10% 2/1/09 | | 20,000 | | 16,800 |
Northwest Airlines, Inc. 7.875% 3/15/08 | | 65,000 | | 52,650 |
Northwest Airlines, Inc. pass thru trust certificates: | | | | |
7.95% 9/1/16 | | 53,363 | | 45,359 |
8.304% 9/1/10 | | 44,723 | | 38,015 |
| | 691,796 |
Building Products - 0.3% |
Jacuzzi Brands, Inc. 9.625% 7/1/10 | | 155,000 | | 172,050 |
Maax Holdings, Inc. 0% 12/15/12 (e)(g) | | 140,000 | | 88,200 |
| | 260,250 |
Commercial Services & Supplies - 0.2% |
Allied Security Escrow Corp. 11.375% 7/15/11 (g) | | 40,000 | | 42,800 |
Nonconvertible Bonds - continued |
| Principal Amount (d) | | Value (Note 1) |
INDUSTRIALS - continued |
Commercial Services & Supplies - continued |
Browning-Ferris Industries, Inc. 9.25% 5/1/21 | | $ 100,000 | | $ 104,000 |
R.H. Donnelley Finance Corp. I 10.875% 12/15/12 | | 75,000 | | 89,250 |
| | 236,050 |
Construction & Engineering - 0.0% |
Blount, Inc. 8.875% 8/1/12 | | 50,000 | | 54,250 |
Electrical Equipment - 0.3% |
General Cable Corp. 9.5% 11/15/10 | | 125,000 | | 140,313 |
Polypore, Inc. 0% 10/1/12 (e)(g) | | 205,000 | | 130,688 |
| | 271,001 |
Machinery - 0.1% |
Navistar International Corp. 7.5% 6/15/11 | | 100,000 | | 107,000 |
Marine - 0.4% |
H-Lines Finance Holding Corp. 0% 4/1/13 (e)(g) | | 110,000 | | 80,025 |
OMI Corp. 7.625% 12/1/13 | | 190,000 | | 203,300 |
Ultrapetrol Bahamas Ltd. 9% 11/24/14 (g) | | 120,000 | | 119,700 |
| | 403,025 |
Road & Rail - 1.2% |
Kansas City Southern Railway Co.: | | | | |
7.5% 6/15/09 | | 340,000 | | 357,000 |
9.5% 10/1/08 | | 45,000 | | 50,625 |
TFM SA de CV yankee: | | | | |
10.25% 6/15/07 | | 260,000 | | 278,200 |
11.75% 6/15/09 | | 505,000 | | 512,575 |
| | 1,198,400 |
TOTAL INDUSTRIALS | | 3,221,772 |
INFORMATION TECHNOLOGY - 3.0% |
Communications Equipment - 0.5% |
Lucent Technologies, Inc.: | | | | |
6.45% 3/15/29 | | 525,000 | | 477,750 |
6.5% 1/15/28 | | 30,000 | | 27,000 |
| | 504,750 |
Electronic Equipment & Instruments - 0.3% |
Altra Industrial Motion, Inc. 9% 12/1/11 (g) | | 50,000 | | 50,750 |
Celestica, Inc. 7.875% 7/1/11 | | 250,000 | | 267,500 |
| | 318,250 |
|
| Principal Amount (d) | | Value (Note 1) |
IT Services - 0.5% |
Iron Mountain, Inc.: | | | | |
6.625% 1/1/16 | | $ 455,000 | | $ 425,425 |
7.75% 1/15/15 | | 80,000 | | 80,400 |
| | 505,825 |
Office Electronics - 1.2% |
Xerox Capital Trust I 8% 2/1/27 | | 265,000 | | 275,600 |
Xerox Corp.: | | | | |
6.875% 8/15/11 | | 210,000 | | 223,650 |
7.125% 6/15/10 | | 225,000 | | 243,000 |
7.2% 4/1/16 | | 140,000 | | 149,800 |
7.625% 6/15/13 | | 300,000 | | 330,000 |
| | 1,222,050 |
Semiconductors & Semiconductor Equipment - 0.5% |
Freescale Semiconductor, Inc. 7.125% 7/15/14 | | 215,000 | | 233,275 |
MagnaChip Semiconductor SA/MagnaChip Semiconductor Finance Co.: | | | | |
5.78% 12/15/11 (g)(i) | | 40,000 | | 41,050 |
6.875% 12/15/11 (g) | | 60,000 | | 61,800 |
8% 12/15/14 (g) | | 30,000 | | 31,275 |
Viasystems, Inc. 10.5% 1/15/11 | | 140,000 | | 137,200 |
| | 504,600 |
TOTAL INFORMATION TECHNOLOGY | | 3,055,475 |
MATERIALS - 5.1% |
Chemicals - 1.9% |
America Rock Salt Co. LLC 9.5% 3/15/14 | | 160,000 | | 167,200 |
Braskem SA 11.75% 1/22/14 (g) | | 50,000 | | 58,750 |
Equistar Chemicals LP/Equistar Funding Corp. 10.625% 5/1/11 | | 40,000 | | 46,200 |
Huntsman Advanced Materials LLC 11% 7/15/10 (g) | | 20,000 | | 23,500 |
Huntsman ICI Chemicals LLC 10.125% 7/1/09 | | 114,000 | | 120,270 |
Huntsman International LLC 7.375% 1/1/15 (g) | | 215,000 | | 216,613 |
Huntsman LLC: | | | | |
9.32% 7/15/11 (g)(i) | | 20,000 | | 22,300 |
11.625% 10/15/10 | | 280,000 | | 331,800 |
Innophos, Inc. 8.875% 8/15/14 (g) | | 30,000 | | 32,475 |
JohnsonDiversey Holdings, Inc. 0% 5/15/13 (e) | | 295,000 | | 255,175 |
Lyondell Chemical Co. 11.125% 7/15/12 | | 100,000 | | 118,250 |
Millennium America, Inc. 9.25% 6/15/08 | | 145,000 | | 163,850 |
Phibro Animal Health Corp.: | | | | |
13% 12/1/07 unit (g) | | 40,000 | | 43,600 |
13% 12/1/07 unit (g) | | 9,000 | | 9,810 |
Nonconvertible Bonds - continued |
| Principal Amount (d) | | Value (Note 1) |
MATERIALS - continued |
Chemicals - continued |
Resolution Performance Products LLC/RPP Capital Corp. 9.5% 4/15/10 | | $ 50,000 | | $ 53,750 |
Rockwood Specialties Group, Inc. 7.5% 11/15/14 (g) | | 50,000 | | 51,750 |
Solutia, Inc.: | | | | |
6.72% 10/15/37 (c) | | 240,000 | | 195,600 |
7.375% 10/15/27 (c) | | 55,000 | | 44,825 |
| | 1,955,718 |
Containers & Packaging - 0.9% |
BWAY Corp. 10% 10/15/10 | | 90,000 | | 95,850 |
Crown Cork & Seal, Inc. 8% 4/15/23 | | 185,000 | | 182,225 |
Crown European Holdings SA: | | | | |
9.5% 3/1/11 | | 25,000 | | 28,375 |
10.875% 3/1/13 | | 150,000 | | 177,375 |
Owens-Brockway Glass Container, Inc.: | | | | |
6.75% 12/1/14 (g) | | 80,000 | | 81,600 |
8.25% 5/15/13 | | 110,000 | | 121,000 |
8.75% 11/15/12 | | 100,000 | | 112,250 |
8.875% 2/15/09 | | 80,000 | | 86,800 |
| | 885,475 |
Metals & Mining - 1.6% |
Compass Minerals International, Inc. 0% 6/1/13 (e) | | 160,000 | | 129,600 |
CSN Islands VIII Corp. 9.75% 12/16/13 (g) | | 500,000 | | 535,000 |
Foundation Pennsylvania Coal Co. 7.25% 8/1/14 (g) | | 50,000 | | 52,875 |
Freeport-McMoRan Copper & Gold, Inc. 6.875% 2/1/14 | | 300,000 | | 297,750 |
IMCO Recycling Escrow, Inc. 9% 11/15/14 (g) | | 30,000 | | 31,050 |
International Steel Group, Inc. 6.5% 4/15/14 | | 275,000 | | 297,000 |
Ispat Inland ULC 9.75% 4/1/14 | | 20,000 | | 24,700 |
Luscar Coal Ltd. 9.75% 10/15/11 | | 40,000 | | 45,300 |
Massey Energy Co. 6.625% 11/15/10 | | 70,000 | | 72,800 |
Oregon Steel Mills, Inc. 10% 7/15/09 | | 60,000 | | 67,350 |
Peabody Energy Corp. 6.875% 3/15/13 | | 50,000 | | 54,125 |
| | 1,607,550 |
Paper & Forest Products - 0.7% |
Boise Cascade LLC/Boise Cascade Finance Corp.: | | | | |
5.005% 10/15/12 (g)(i) | | 30,000 | | 30,675 |
7.125% 10/15/14 (g) | | 40,000 | | 42,000 |
Georgia-Pacific Corp.: | | | | |
7.375% 12/1/25 | | 307,000 | | 334,630 |
|
| Principal Amount (d) | | Value (Note 1) |
8% 1/15/24 | | $ 90,000 | | $ 104,288 |
8.875% 5/15/31 | | 50,000 | | 62,500 |
9.375% 2/1/13 | | 70,000 | | 81,550 |
Millar Western Forest Products Ltd. 7.75% 11/15/13 | | 95,000 | | 101,650 |
| | 757,293 |
TOTAL MATERIALS | | 5,206,036 |
TELECOMMUNICATION SERVICES - 9.5% |
Diversified Telecommunication Services - 4.8% |
AT&T Corp. 8.75% 11/15/31 | | 360,000 | | 427,950 |
Empresa Brasileira de Telecomm SA 11% 12/15/08 | | 245,000 | | 279,300 |
Eschelon Operating Co. 8.375% 3/15/10 | | 95,000 | | 76,000 |
Indosat Finance Co. BV 7.75% 11/5/10 | | 50,000 | | 53,250 |
Level 3 Financing, Inc. 10.75% 10/15/11 (g) | | 80,000 | | 72,000 |
MCI, Inc. 7.735% 5/1/14 | | 195,000 | | 209,625 |
Mobifon Holdings BV 12.5% 7/31/10 | | 280,000 | | 333,200 |
New Skies Satellites BV: | | | | |
7.4375% 11/1/11 (g)(i) | | 40,000 | | 42,000 |
9.125% 11/1/12 (g) | | 30,000 | | 31,200 |
NTL Cable PLC 8.75% 4/15/14 (g) | | 1,050,000 | | 1,181,250 |
Qwest Corp.: | | | | |
7.875% 9/1/11 (g) | | 320,000 | | 345,600 |
9.125% 3/15/12 (g) | | 1,120,000 | | 1,293,600 |
Qwest Services Corp.: | | | | |
14% 12/15/10 (g)(i) | | 10,000 | | 12,000 |
14.5% 12/15/14 (g)(i) | | 10,000 | | 12,525 |
Telefonica de Argentina SA 9.125% 11/7/10 | | 115,000 | | 121,038 |
Telenet Group Holding NV 0% 6/15/14 (e)(g) | | 500,000 | | 380,000 |
U.S. West Communications: | | | | |
7.25% 9/15/25 | | 5,000 | | 4,875 |
7.5% 6/15/23 | | 25,000 | | 24,563 |
8.875% 6/1/31 | | 5,000 | | 5,300 |
| | 4,905,276 |
Wireless Telecommunication Services - 4.7% |
American Tower Corp. 7.125% 10/15/12 (g) | | 240,000 | | 246,600 |
Centennial Cellular Operating Co./Centennial Communications Corp. 10.125% 6/15/13 | | 380,000 | | 425,600 |
Centennial Communications Corp./Centennial Cellular Operating Co. LLC/Centennial Puerto Rico Operations Corp. 8.125% 2/1/14 (i) | | 80,000 | | 82,400 |
Crown Castle International Corp.: | | | | |
Series B, 7.5% 12/1/13 | | 235,000 | | 252,038 |
Nonconvertible Bonds - continued |
| Principal Amount (d) | | Value (Note 1) |
TELECOMMUNICATION SERVICES - continued |
Wireless Telecommunication Services - continued |
Crown Castle International Corp.: - continued | | | | |
7.5% 12/1/13 | | $ 10,000 | | $ 10,725 |
9.375% 8/1/11 | | 15,000 | | 16,800 |
DirecTV Holdings LLC/DirecTV Financing, Inc. 8.375% 3/15/13 | | 20,000 | | 22,400 |
Dobson Cellular Systems, Inc. 9.875% 11/1/12 (g) | | 80,000 | | 79,000 |
Globe Telecom, Inc. 9.75% 4/15/12 | | 85,000 | | 92,863 |
Inmarsat Finance II PLC 0% 11/15/12 (e)(g) | | 735,000 | | 529,200 |
Kyivstar GSM 10.375% 8/17/09 (g) | | 200,000 | | 221,000 |
Millicom International Cellular SA 10% 12/1/13 (g) | | 635,000 | | 663,575 |
Mobile Telesystems Finance SA: | | | | |
8.375% 10/14/10 (g) | | 130,000 | | 131,950 |
9.75% 1/30/08 (g) | | 35,000 | | 36,838 |
9.75% 1/30/08 (Reg. S) | | 85,000 | | 89,463 |
Nextel Communications, Inc.: | | | | |
5.95% 3/15/14 | | 20,000 | | 20,900 |
7.375% 8/1/15 | | 620,000 | | 685,100 |
Rogers Communications, Inc.: | | | | |
5.525% 12/15/10 (g)(i) | | 80,000 | | 83,800 |
6.375% 3/1/14 | | 200,000 | | 198,000 |
7.25% 12/15/12 (g) | | 50,000 | | 53,000 |
7.5% 3/15/15 (g) | | 80,000 | | 84,200 |
8% 12/15/12 (g) | | 160,000 | | 168,800 |
Telemig Cellular SA/Amazonia Cellular SA 8.75% 1/20/09 (g) | | 140,000 | | 145,600 |
UbiquiTel Operating Co.: | | | | |
9.875% 3/1/11 | | 20,000 | | 22,400 |
9.875% 3/1/11 (g) | | 60,000 | | 67,200 |
Western Wireless Corp. 9.25% 7/15/13 | | 315,000 | | 343,350 |
| | 4,772,802 |
TOTAL TELECOMMUNICATION SERVICES | | 9,678,078 |
UTILITIES - 1.8% |
Electric Utilities - 0.2% |
Texas Genco LLC/Texas Genco Financing Corp. 6.875% 12/15/14 (g) | | 205,000 | | 213,200 |
Gas Utilities - 0.8% |
Southern Natural Gas Co.: | | | | |
7.35% 2/15/31 | | 190,000 | | 197,363 |
8% 3/1/32 | | 35,000 | | 38,238 |
8.875% 3/15/10 | | 120,000 | | 134,250 |
|
| Principal Amount (d) | | Value (Note 1) |
Tennessee Gas Pipeline Co.: | | | | |
7% 10/15/28 | | $ 20,000 | | $ 19,875 |
7.5% 4/1/17 | | 320,000 | | 356,000 |
7.625% 4/1/37 | | 50,000 | | 52,625 |
8.375% 6/15/32 | | 40,000 | | 45,100 |
| | 843,451 |
Multi-Utilities & Unregulated Power - 0.8% |
Calpine Corp.: | | | | |
8.5% 7/15/10 (g) | | 60,000 | | 51,300 |
8.75% 7/15/13 (g) | | 335,000 | | 274,700 |
9.875% 12/1/11 (g) | | 20,000 | | 17,400 |
Chivor SA E.S.P. 9.75% 12/30/14 (g) | | 300,000 | | 312,000 |
Enron Corp. 7.625% 9/10/04 (c) | | 400,000 | | 122,500 |
| | 777,900 |
TOTAL UTILITIES | | 1,834,551 |
TOTAL NONCONVERTIBLE BONDS (Cost $43,888,297) | 46,088,835 |
U.S. Government and Government Agency Obligations - 18.6% |
|
U.S. Government Agency Obligations - 4.7% |
Fannie Mae: | | | | |
3.25% 1/15/08 | | 400,000 | | 396,925 |
3.25% 2/15/09 | | 2,681,000 | | 2,628,868 |
4.25% 5/15/09 | | 1,000,000 | | 1,017,488 |
Freddie Mac 5.625% 3/15/11 | | 640,000 | | 691,723 |
TOTAL U.S. GOVERNMENT AGENCY OBLIGATIONS | | 4,735,004 |
U.S. Treasury Inflation Protected Obligations - 3.5% |
U.S. Treasury Inflation-Indexed Bonds: | | | | |
2.375% 1/15/25 | | 354,403 | | 378,976 |
3.625% 4/15/28 | | 446,074 | | 585,542 |
U.S. Treasury Inflation-Indexed Notes: | | | | |
1.875% 7/15/13 | | 2,058,695 | | 2,117,722 |
2% 1/15/14 | | 103,298 | | 106,913 |
2% 7/15/14 | | 405,032 | | 417,879 |
TOTAL U.S. TREASURY INFLATION PROTECTED OBLIGATIONS | | 3,607,032 |
U.S. Treasury Obligations - 10.4% |
U.S. Treasury Bonds 6.125% 8/15/29 | | 921,000 | | 1,081,311 |
U.S. Treasury Notes: | | | | |
1.875% 11/30/05 | | 3,689,000 | | 3,660,167 |
U.S. Government and Government Agency Obligations - continued |
| Principal Amount (d) | | Value (Note 1) |
U.S. Treasury Obligations - continued |
U.S. Treasury Notes: - continued | | | | |
2.375% 8/31/06 | | $ 2,400,000 | | $ 2,376,094 |
4.25% 11/15/13 | | 3,438,000 | | 3,459,622 |
TOTAL U.S. TREASURY OBLIGATIONS | | 10,577,194 |
TOTAL U.S. GOVERNMENT AND GOVERNMENT AGENCY OBLIGATIONS (Cost $18,748,273) | 18,919,230 |
U.S. Government Agency -
Mortgage Securities - 1.0% |
|
Fannie Mae - 1.0% |
4% 1/1/20 (h)
(Cost $976,563) | | 1,000,000 | | 975,313 |
Asset-Backed Securities - 0.1% |
|
Cumbernauld Funding 5.2% 3/16/09
(Cost $89,816) | GBP | 50,000 | | 96,720 |
Foreign Government and Government Agency Obligations - 25.2% |
|
Argentine Republic 1.98% 8/3/12 (i) | | 335,000 | | 283,023 |
Bogota Distrito Capital 9.5% 12/12/06 (Reg. S) | | 120,000 | | 130,800 |
Brazilian Federative Republic: | | | | |
Brady: | | | | |
capitalization bond 8% 4/15/14 | | 1,414,946 | | 1,448,551 |
par Z-L 6% 4/15/24 | | 250,000 | | 231,875 |
10.5% 7/14/14 | | 75,000 | | 89,025 |
11% 8/17/40 | | 695,000 | | 824,965 |
12% 4/15/10 | | 80,000 | | 99,000 |
12.25% 3/6/30 | | 125,000 | | 165,375 |
12.75% 1/15/20 | | 10,000 | | 13,540 |
Canadian Government: | | | | |
3% 6/1/06 | CAD | 250,000 | | 208,958 |
5.5% 6/1/09 | CAD | 1,220,000 | | 1,093,832 |
5.75% 6/1/29 | CAD | 476,000 | | 448,035 |
Central Bank of Nigeria promissory note 5.092% 1/5/10 | | 54,438 | | 51,687 |
City of Kiev 8.75% 8/8/08 | | 200,000 | | 210,000 |
Colombian Republic: | | | | |
10.75% 1/15/13 | | 170,000 | | 203,575 |
11.75% 3/1/10 | COP | 100,000,000 | | 42,772 |
11.75% 2/25/20 | | 75,000 | | 96,375 |
Dominican Republic: | | | | |
Brady 2.75% 8/30/09 (i) | | 258,333 | | 213,124 |
|
| Principal Amount (d) | | Value (Note 1) |
3.4425% 8/30/24 (i) | | $ 250,000 | | $ 199,063 |
9.04% 1/23/13 (g) | | 25,000 | | 20,938 |
9.5% 9/27/06 (Reg. S) | | 10,000 | | 9,400 |
Ecuador Republic: | | | | |
8% 8/15/30 (Reg. S) (f) | | 150,000 | | 129,600 |
12% 11/15/12 (Reg. S) | | 165,000 | | 169,125 |
German Federal Republic: | | | | |
2.75% 6/23/06 | EUR | 100,000 | | 136,333 |
4.25% 1/4/14 | EUR | 2,530,000 | | 3,600,682 |
4.5% 7/4/09 | EUR | 590,000 | | 850,387 |
4.75% 7/4/34 | EUR | 280,000 | | 409,081 |
Hellenic Republic 3.25% 6/21/07 | EUR | 1,500,000 | | 2,062,295 |
Japan Government: | | | | |
0.2% 7/20/06 | JPY | 35,000,000 | | 342,507 |
0.5% 12/20/06 | JPY | 72,000,000 | | 708,535 |
1.5% 3/20/14 | JPY | 123,000,000 | | 1,217,548 |
2.4% 6/20/24 | JPY | 10,000,000 | | 103,531 |
Lebanese Republic 5.88% 11/30/09 (g)(i) | | 70,000 | | 69,650 |
Panamanian Republic: | | | | |
Brady discount 2.6925% 7/17/26 (i) | | 49,000 | | 43,978 |
9.625% 2/8/11 | | 75,000 | | 88,875 |
10.75% 5/15/20 | | 85,000 | | 110,500 |
Peruvian Republic: | | | | |
9.125% 2/21/12 | | 115,000 | | 134,263 |
9.875% 2/6/15 | | 65,000 | | 80,275 |
Philippine Republic: | | | | |
Brady principal collateralized interest reduction bond 6.5% 12/1/17 | | 250,000 | | 245,625 |
8.375% 2/15/11 | | 520,000 | | 522,600 |
9% 2/15/13 | | 70,000 | | 71,400 |
9.875% 1/15/19 | | 80,000 | | 82,300 |
Russian Federation: | | | | |
5% 3/31/30 (Reg. S) (f) | | 1,180,000 | | 1,216,875 |
8.25% 3/31/10 (Reg. S) | | 70,000 | | 77,000 |
12.75% 6/24/28 (Reg. S) | | 145,000 | | 237,075 |
South African Republic: | | | | |
8.5% 6/23/17 | | 100,000 | | 125,250 |
13% 8/31/10 | ZAR | 185,000 | | 40,373 |
Turkish Republic: | | | | |
0% 12/7/05 | TRL | 288,830,000,000 | | 180,209 |
10.5% 1/13/08 | | 180,000 | | 206,550 |
11% 1/14/13 | | 60,000 | | 76,350 |
11.75% 6/15/10 | | 150,000 | | 189,750 |
11.875% 1/15/30 | | 50,000 | | 72,188 |
20% 10/17/07 | TRL | 283,100,000,000 | | 225,463 |
Ukraine Government: | | | | |
5.33% 8/5/09 (i) | | 100,000 | | 105,750 |
11% 3/15/07 (Reg. S) | | 77,002 | | 82,854 |
Foreign Government and Government Agency Obligations - continued |
| Principal Amount (d) | | Value (Note 1) |
United Kingdom, Great Britain & Northern Ireland: | | | | |
Index Linked 2.5% 7/26/16 | GBP | 289,450 | | $ 591,595 |
4.25% 3/7/36 | GBP | 30,000 | | 56,111 |
4.75% 9/7/15 | GBP | 40,000 | | 78,067 |
5% 3/7/08 | GBP | 260,000 | | 506,737 |
5% 9/7/14 | GBP | 331,000 | | 658,009 |
5.75% 12/7/09 | GBP | 40,000 | | 80,984 |
6% 12/7/28 | GBP | 100,000 | | 235,006 |
United Mexican States: | | | | |
7.5% 4/8/33 | | $ 710,000 | | 766,800 |
8.375% 1/14/11 | | 185,000 | | 217,190 |
9% 12/20/12 | MXN | 1,575,000 | | 136,213 |
10.375% 2/17/09 | | 200,000 | | 244,500 |
11.5% 5/15/26 | | 225,000 | | 344,250 |
Uruguay Republic: | | | | |
7.25% 2/15/11 | | 130,000 | | 128,700 |
17.75% 2/4/06 | UYU | 3,100,000 | | 122,454 |
Venezuelan Republic: | | | | |
Discount A, 3.0625% 3/31/20 (i) | | 250,000 | | 228,125 |
8.5% 10/8/14 | | 70,000 | | 74,130 |
9.25% 9/15/27 | | 80,000 | | 84,400 |
10.75% 9/19/13 | | 410,000 | | 490,463 |
13.625% 8/15/18 | | 135,000 | | 182,588 |
euro Brady par W-A 6.75% 3/31/20 | | 250,000 | | 248,125 |
Vietnamese Socialist Republic Brady par 3.75% 3/12/28 (f) | | 125,000 | | 91,875 |
TOTAL FOREIGN GOVERNMENT AND GOVERNMENT AGENCY OBLIGATIONS (Cost $23,838,749) | 25,665,012 |
Common Stocks - 0.7% |
| | Shares | | |
CONSUMER DISCRETIONARY - 0.1% |
Hotels, Restaurants & Leisure - 0.1% |
Centerplate, Inc. unit | | 10,000 | | 132,300 |
INDUSTRIALS - 0.2% |
Commercial Services & Supplies - 0.2% |
Coinmach Service Corp. unit | | 13,000 | | 178,100 |
TELECOMMUNICATION SERVICES - 0.4% |
Diversified Telecommunication Services - 0.4% |
Telewest Global, Inc. (a) | | 21,681 | | 381,152 |
TOTAL COMMON STOCKS (Cost $629,649) | | 691,552 |
Nonconvertible Preferred Stocks - 0.1% |
| | Shares | | Value (Note 1) |
CONSUMER DISCRETIONARY - 0.1% |
Media - 0.1% |
Spanish Broadcasting System, Inc. Class B, 10.75% | | 62 | | $ 68,820 |
Specialty Retail - 0.0% |
GNC Corp. Series A, 12.00% (a) | | 30 | | 28,875 |
TOTAL NONCONVERTIBLE PREFERRED STOCKS (Cost $93,961) | | 97,695 |
Floating Rate Loans - 0.4% |
| Principal Amount (d) | | |
CONSUMER DISCRETIONARY - 0.1% |
Automobiles - 0.1% |
AM General LLC: | | | | |
Tranche B1, term loan 6.759% 11/1/11 (i) | | $ 100,000 | | 102,000 |
Tranche C2, term loan 11.21% 5/2/12 (i) | | 50,000 | | 51,750 |
| | 153,750 |
FINANCIALS - 0.1% |
Consumer Finance - 0.1% |
Metris Companies, Inc. term loan 11.78% 5/6/07 (i) | | 75,000 | | 78,750 |
TELECOMMUNICATION SERVICES - 0.2% |
Diversified Telecommunication Services - 0.2% |
Valor Telecommunications Enterprises LLC: | | | | |
term loan 12.875% 5/10/12 (i) | | 50,000 | | 52,000 |
Tranche 2, term loan 10.0815% 11/10/11 (i) | | 100,000 | | 103,000 |
| | 155,000 |
UTILITIES - 0.0% |
Electric Utilities - 0.0% |
Astoria Energy LLC term loan 11.31% 4/15/12 (i) | | 50,000 | | 51,250 |
TOTAL FLOATING RATE LOANS (Cost $424,570) | 438,750 |
Sovereign Loan Participations - 0.1% |
| Principal Amount (d) | | Value (Note 1) |
Indonesian Republic loan participation: | | | | |
- Credit Suisse First Boston 3.4375% 3/28/13 (i) | | $ 121,371 | | $ 109,233 |
- Deutsche Bank 0.96% 3/28/13 (i) | JPY | 2,790,244 | | 23,631 |
TOTAL SOVEREIGN LOAN PARTICIPATIONS (Cost $124,129) | 132,864 |
Fixed-Income Funds - 0.5% |
| | Shares | | |
Fidelity Floating Rate Central Investment Portfolio (b)
(Cost $499,949) | | 5,005 | | 499,949 |
Money Market Funds - 7.2% |
| | | |
Fidelity Cash Central Fund, 2.24% (b)
(Cost $7,316,110) | | 7,316,110 | | 7,316,110 |
TOTAL INVESTMENT PORTFOLIO - 99.2% (Cost $96,630,066) | | | 100,922,030 |
NET OTHER ASSETS - 0.8% | | | 816,129 |
NET ASSETS - 100% | | $ 101,738,159 |
Currency Abbreviations |
CAD | - | Canadian dollar |
COP | - | Colombian peso |
EUR | - | European Monetary Unit |
GBP | - | British pound |
JPY | - | Japanese yen |
MXN | - | Mexican peso |
TRL | - | Turkish lira |
UYU | - | Uruguay peso |
ZAR | - | South African rand |
Legend |
(a) Non-income producing |
(b) Affiliated fund that is available only to investment companies and other accounts managed by Fidelity Investments. The rate quoted for Money Market funds is the annualized seven-day yield of the fund at period end. A complete listing of each fund's holdings as of its most recent fiscal year end is available upon request. |
(c) Non-income producing - issuer filed for bankruptcy or is in default of interest payments. |
(d) Principal amount is stated in United States dollars unless otherwise noted. |
(e) Debt obligation initially issued in zero coupon form which converts to coupon form at a specified rate and date. The rate shown is the rate at period end. |
(f) Debt obligation initially issued at one coupon which converts to a higher coupon at a specified date. The rate shown is the rate at period end. |
(g) Security exempt from registration under Rule 144A of the Securities Act of 1933. These securities may be resold in transactions exempt from registration, normally to qualified institutional buyers. At the period end, the value of these securities amounted to $17,391,310 or 17.1% of net assets. |
(h) Security or a portion of the security purchased on a delayed delivery or when-issued basis. |
(i) The coupon rate shown on floating or adjustable rate securities represents the rate at period end. |
Other Information |
Distribution of investments by country of issue, as a percentage of total net assets, is as follows: |
United States of America | 61.5% |
Germany | 5.4% |
Canada | 4.4% |
United Kingdom | 4.2% |
Brazil | 3.3% |
Mexico | 2.8% |
Japan | 2.3% |
Russia | 2.0% |
Greece | 2.0% |
Venezuela | 1.4% |
Luxembourg | 1.2% |
Argentina | 1.1% |
Philippines | 1.0% |
Turkey | 1.0% |
Others (individually less than 1%) | 6.4% |
| 100.0% |
| |
The information in the above table is based on the combined investments of the fund and its pro-rata share of the investments of Fidelity's fixed-income central funds. |
Income Tax Information |
The fund hereby designates as capital gain dividends: For dividends with respect to the taxable year ended December 31, 2004, $673 or, if different, the net captial gain of such year. |
See accompanying notes which are an integral part of the financial statements.
Annual Report
Fidelity Variable Insurance Products: Strategic Income Portfolio
Financial Statements
Statement of Assets and Liabilities
December 31, 2004 |
Assets | | |
Investment in securities, at value (cost $96,630,066) - See accompanying schedule | | $ 100,922,030 |
Cash | | 81,796 |
Foreign currency held at value
(cost $4,192) | | 4,192 |
Receivable for investments sold | | 2,376 |
Receivable for fund shares sold | | 431,736 |
Interest receivable | | 1,517,517 |
Prepaid expenses | | 208 |
Total assets | | 102,959,855 |
| | |
Liabilities | | |
Payable for investments purchased
Regular delivery | $ 146,600 | |
Delayed delivery | 978,563 | |
Payable for fund shares redeemed | 21 | |
Accrued management fee | 48,361 | |
Distribution fees payable | 1,098 | |
Other affiliated payables | 9,388 | |
Other payables and accrued expenses | 37,665 | |
Total liabilities | | 1,221,696 |
| | |
Net Assets | | $ 101,738,159 |
Net Assets consist of: | | |
Paid in capital | | $ 96,650,845 |
Undistributed net investment income | | 388,911 |
Accumulated undistributed net realized gain (loss) on investments and foreign currency transactions | | 397,150 |
Net unrealized appreciation (depreciation) on investments and assets and liabilities in foreign currencies | | 4,301,253 |
Net Assets | | $ 101,738,159 |
| | |
Initial Class:
Net Asset Value, offering price and redemption price per share ($94,153,548 ÷ 8,872,928 shares) | | $ 10.61 |
| | |
Service Class:
Net Asset Value, offering price and redemption price per share ($3,795,219 ÷ 358,290 shares) | | $ 10.59 |
| | |
Service Class 2:
Net Asset Value, offering price and redemption price per share ($3,789,392 ÷ 357,793 shares) | | $ 10.59 |
Statement of Operations
Year ended December 31, 2004 |
Investment Income | | |
Dividends | | $ 6,009 |
Interest | | 2,768,378 |
Total income | | 2,774,387 |
| | |
Expenses | | |
Management fee | $ 271,033 | |
Transfer agent fees | 35,014 | |
Distribution fees | 12,442 | |
Accounting fees and expenses | 36,453 | |
Non-interested trustees' compensation | 233 | |
Custodian fees and expenses | 30,414 | |
Audit | 36,387 | |
Legal | 527 | |
Miscellaneous | 5,235 | |
Total expenses before reductions | 427,738 | |
Expense reductions | (5,447) | 422,291 |
Net investment income | | 2,352,096 |
Realized and Unrealized Gain (Loss) Net realized gain (loss) on: | | |
Investment securities | 728,470 | |
Foreign currency transactions | 17,648 | |
Total net realized gain (loss) | | 746,118 |
Change in net unrealized appreciation (depreciation) on: Investment securities | 4,293,331 | |
Assets and liabilities in foreign currencies | 9,139 | |
Total change in net unrealized appreciation (depreciation) | | 4,302,470 |
Net gain (loss) | | 5,048,588 |
Net increase (decrease) in net assets resulting from operations | | $ 7,400,684 |
See accompanying notes which are an integral part of the financial statements.
Strategic Income Portfolio
Fidelity Variable Insurance Products: Strategic Income Portfolio
Financial Statements - continued
Statement of Changes in Net Assets
| Year ended
December 31, 2004 | December 23, 2003 (commencement
of operations) to
December 31, 2003 |
Increase (Decrease) in Net Assets | | |
Operations | | |
Net investment income | $ 2,352,096 | $ 3,059 |
Net realized gain (loss) | 746,118 | (290) |
Change in net unrealized appreciation (depreciation) | 4,302,470 | (1,217) |
Net increase (decrease) in net assets resulting from operations | 7,400,684 | 1,552 |
Distributions to shareholders from net investment income | (2,222,168) | - |
Distributions to shareholders from net realized gain | (92,747) | - |
Total distributions | (2,314,915) | - |
Share transactions - net increase (decrease) | 86,650,808 | 10,000,030 |
Total increase (decrease) in net assets | 91,736,577 | 10,001,582 |
Net Assets | | |
Beginning of period | 10,001,582 | - |
End of period (including undistributed net investment income of $388,911 and undistributed net investment income of $3,059, respectively) | $ 101,738,159 | $ 10,001,582 |
Other Information: | |
| Year ended December 31, 2004 |
Share Transactions | Initial Class | Service Class | Service Class 2 |
Shares Sold | 8,556,458 | - | - |
Reinvested | 202,564 | 8,289 | 7,792 |
Redeemed | (186,095) | - | - |
Net increase (decrease) | 8,572,927 | 8,289 | 7,792 |
Dollars Sold | $ 86,237,635 | $ - | $ - |
Reinvested | 2,145,082 | 87,543 | 82,290 |
Redeemed | (1,901,742) | - | - |
Net increase (decrease) | $ 86,480,975 | $ 87,543 | $ 82,290 |
| Year ended December 23, 2003 (commencement of operations)
to December 31, 2003 |
Share Transactions | Initial Class | Service Class | Service Class 2 |
Shares Sold | 300,001 | 350,001 | 350,001 |
Reinvested | - | - | - |
Redeemed | - | - | - |
Net increase (decrease) | 300,001 | 350,001 | 350,001 |
Dollars Sold | $ 3,000,010 | $ 3,500,010 | $ 3,500,010 |
Reinvested | - | - | - |
Redeemed | - | - | - |
Net increase (decrease) | $ 3,000,010 | $ 3,500,010 | $ 3,500,010 |
Distributions | Year ended December 31, 2004 |
| Initial Class | Service Class | Service Class 2 |
From net investment income | $ 2,059,339 | $ 84,041 | $ 78,788 |
From net realized gain | 85,743 | 3,502 | 3,502 |
Total | $ 2,145,082 | $ 87,543 | $ 82,290 |
See accompanying notes which are an integral part of the financial statements.
Annual Report
Financial Highlights - Initial Class
Years ended December 31, | 2004 | 2003 F |
Selected Per-Share Data | | |
Net asset value, beginning of period | $ 10.00 | $ 10.00 |
Income from Investment Operations | | |
Net investment income E | .510 | .003 |
Net realized and unrealized gain (loss) | .355 | (.003) |
Total from investment operations | .865 | .000 |
Distributions from net investment income | (.245) | - |
Distributions from net realized gain | (.010) | - |
Total distributions | (.255) | - |
Net asset value, end of period | $ 10.61 | $ 10.00 |
Total Return B, C, D | 8.66% | .00% |
Ratios to Average Net Assets G | | |
Expenses before expense reductions | .85% | 10.00% A |
Expenses net of voluntary waivers, if any | .85% | 1.00% A |
Expenses net of all reductions | .84% | 1.00% A |
Net investment income | 5.02% | 1.36% A |
Supplemental Data | | |
Net assets, end of period (000 omitted) | $ 94,154 | $ 3,001 |
Portfolio turnover rate | 78% | 0% |
A Annualized
B Total returns for periods of less than one year are not annualized.
C Total returns do not reflect charges attributable to your insurance company's separate account. Inclusion of these charges would reduce the total returns shown.
D Total returns would have been lower had certain expenses not been reduced during the periods shown.
E Calculated based on average shares outstanding during the period.
F For the period December 23, 2003 (commencement of operations) to December 31, 2003.
G Expense ratios reflect operating expenses of the class. Expenses before reductions do not reflect amounts reimbursed by the investment adviser or reductions from brokerage service arrangements or other expense offset arrangements and do not represent the amount paid by the class during periods when reimbursements or reductions occur. Expense ratios before reductions for start-up periods may not be representative of longer-term operating periods. Expenses net of any voluntary waivers reflect expenses after reimbursement by the investment adviser but prior to reductions from brokerage service arrangements or other expense offset arrangements. Expenses net of all reductions represent the net expenses paid by the class.
Financial Highlights - Service Class
Years ended December 31, | 2004 | 2003 F |
Selected Per-Share Data | | |
Net asset value, beginning of period | $ 10.00 | $ 10.00 |
Income from Investment Operations | | |
Net investment income E | .485 | .003 |
Net realized and unrealized gain (loss) | .355 | (.003) |
Total from investment operations | .840 | .000 |
Distributions from net investment income | (.240) | - |
Distributions from net realized gain | (.010) | - |
Total distributions | (.250) | - |
Net asset value, end of period | $ 10.59 | $ 10.00 |
Total Return B, C, D | 8.41% | .00% |
Ratios to Average Net Assets G | | |
Expenses before expense reductions | 1.15% | 10.10% A |
Expenses net of voluntary waivers, if any | 1.10% | 1.10% A |
Expenses net of all reductions | 1.10% | 1.10% A |
Net investment income | 4.77% | 1.26% A |
Supplemental Data | | |
Net assets, end of period (000 omitted) | $ 3,795 | $ 3,501 |
Portfolio turnover rate | 78% | 0% |
A Annualized
B Total returns for periods of less than one year are not annualized.
C Total returns do not reflect charges attributable to your insurance company's separate account. Inclusion of these charges would reduce the total returns shown.
D Total returns would have been lower had certain expenses not been reduced during the periods shown.
E Calculated based on average shares outstanding during the period.
F For the period December 23, 2003 (commencement of operations) to December 31, 2003.
G Expense ratios reflect operating expenses of the class. Expenses before reductions do not reflect amounts reimbursed by the investment adviser or reductions from brokerage service arrangements or other expense offset arrangements and do not represent the amount paid by the class during periods when reimbursements or reductions occur. Expense ratios before reductions for start-up periods may not be representative of longer-term operating periods. Expenses net of any voluntary waivers reflect expenses after reimbursement by the investment adviser but prior to reductions from brokerage service arrangements or other expense offset arrangements. Expenses net of all reductions represent the net expenses paid by the class.
See accompanying notes which are an integral part of the financial statements.
Strategic Income Portfolio
Financial Highlights - Service Class 2
Years ended December 31, | 2004 | 2003 F |
Selected Per-Share Data | | |
Net asset value, beginning of period | $ 10.00 | $ 10.00 |
Income from Investment Operations | | |
Net investment income E | .469 | .003 |
Net realized and unrealized gain (loss) | .356 | (.003) |
Total from investment operations | .825 | .000 |
Distributions from net investment income | (.225) | - |
Distributions from net realized gain | (.010) | - |
Total distributions | (.235) | - |
Net asset value, end of period | $ 10.59 | $ 10.00 |
Total Return B, C, D | 8.26% | .00% |
Ratios to Average Net Assets G | | |
Expenses before expense reductions | 1.30% | 10.25% A |
Expenses net of voluntary waivers, if any | 1.25% | 1.25% A |
Expenses net of all reductions | 1.25% | 1.25% A |
Net investment income | 4.62% | 1.11% A |
Supplemental Data | | |
Net assets, end of period (000 omitted) | $ 3,789 | $ 3,500 |
Portfolio turnover rate | 78% | 0% |
A Annualized
B Total returns for periods of less than one year are not annualized.
C Total returns do not reflect charges attributable to your insurance company's separate account. Inclusion of these charges would reduce the total returns shown.
D Total returns would have been lower had certain expenses not been reduced during the periods shown.
E Calculated based on average shares outstanding during the period.
F For the period December 23, 2003 (commencement of operations) to December 31, 2003.
G Expense ratios reflect operating expenses of the class. Expenses before reductions do not reflect amounts reimbursed by the investment adviser or reductions from brokerage service arrangements or other expense offset arrangements and do not represent the amount paid by the class during periods when reimbursements or reductions occur. Expense ratios before reductions for start-up periods may not be representative of longer-term operating periods. Expenses net of any voluntary waivers reflect expenses after reimbursement by the investment adviser but prior to reductions from brokerage service arrangements or other expense offset arrangements. Expenses net of all reductions represent the net expenses paid by the class.
See accompanying notes which are an integral part of the financial statements.
Annual Report
Notes to Financial Statements
For the period ended December 31, 2004
1. Significant Accounting Policies.
Strategic Income Portfolio (the fund) is a fund of Variable Insurance Products Fund IV (the trust) (referred to in this report as Fidelity Variable Insurance Products: Strategic Income Portfolio) and is authorized to issue an unlimited number of shares. The trust is registered under the Investment Company Act of 1940, as amended (the 1940 Act), as an open-end management investment company organized as a Massachusetts business trust. The fund may invest in affiliated fixed income and money market central funds (underlying funds) managed by affiliates of Fidelity Management & Research Company (FMR).
Shares of the fund may only be purchased by insurance companies for the purpose of funding variable annuity or variable life insurance contracts. The fund offers the following classes of shares: Initial Class shares, Service Class shares and Service Class 2 shares. All classes have equal rights and voting privileges, except for matters affecting a single class. Investment income, realized and unrealized capital gains and losses, the common expenses of the fund, and certain fund-level expense reductions, if any, are allocated on a pro rata basis to each class based on the relative net assets of each class to the total net assets of the fund. Each class differs with respect to distribution and service plan fees incurred. Certain expense reductions also differ by class.
The financial statements have been prepared in conformity with accounting principles generally accepted in the United States of America, which require management to make certain estimates and assumptions at the date of the financial statements. The following summarizes the significant accounting policies of the fund and underlying funds (funds):
Security Valuation. Net asset value per share (NAV calculation) is calculated as of the close of business of the New York Stock Exchange, normally 4:00 p.m. Eastern time. Equity securities, including restricted securities, for which market quotations are available are valued at the last sale price or official closing price (closing bid price or last evaluated quote if no sale has occurred) on the primary market or exchange on which they trade. Debt securities, including restricted securities, for which quotations are readily available are valued at their most recent bid prices (sales prices if the principal market is an exchange) in the principal market in which such securities are normally traded, as determined by recognized dealers in such securities, or securities are valued on the basis of information provided by a pricing service. Pricing services use valuation matrices that incorporate both dealer-supplied valuations and valuation models. If prices are not readily available or do not accurately reflect fair value for a security, or if a security's value has been materially affected by events occurring after the close of the exchange or market on which the security is principally traded, that security may be valued by another method that the Board of Trustees believes accurately reflects fair value. A security's valuation may differ depending on the method used for determining value. Price movements in futures contracts and ADRs, market and trading trends, the bid/ask quotes of brokers and off-exchange institutional trading may be reviewed in the course of making a good faith determination of a security's fair value. Short-term securities with remaining maturities of sixty days or less for which quotations are not readily available are valued on the basis of amortized cost. Investments in open-end investment companies, including underlying funds, are valued at their net asset value each business day.
Foreign Currency. The funds use foreign currency contracts to facilitate transactions in foreign-denominated securities. Losses from these transactions may arise from changes in the value of the foreign currency or if the counterparties do not perform under the contracts' terms.
Foreign-denominated assets, including investment securities, and liabilities are translated into U.S. dollars at the exchange rate at period end. Purchases and sales of investment securities, income and dividends received and expenses denominated in foreign currencies are translated into U.S. dollars at the exchange rate in effect on the transaction date.
The effects of exchange rate fluctuations on investments are included with the net realized and unrealized gain (loss) on investment securities. Other foreign currency transactions resulting in realized and unrealized gain (loss) are disclosed separately.
Investment Transactions and Income. Security transactions, including purchases and sales of the underlying funds, are accounted for as of trade date. Gains and losses on securities sold are determined on the basis of identified cost. Dividend income is recorded on the ex-dividend date, except for certain dividends from foreign securities where the ex-dividend date may have passed, which are recorded as soon as the funds are informed of the ex-dividend date. Non-cash dividends included in dividend income, if any, are recorded at the fair market value of the securities received. Interest income is accrued as earned. Interest income includes coupon interest and amortization of premium and accretion of discount on debt securities. Inflation-indexed bonds are fixed-income securities whose principal value is periodically adjusted according to the rate of inflation. Interest is accrued based on the principal value which is adjusted for inflation. Any increase in the principal amount of an inflation- indexed bond is recorded as interest income, even though the principal is not received until maturity. Investment income is recorded net of foreign taxes withheld where recovery of such taxes is uncertain. Debt obligations may be placed on non-accrual status and related interest income may be reduced by ceasing current accruals and writing off interest receivables when the collection of all or a portion of interest has become doubtful based on consistently applied procedures. A debt obligation is removed from non-accrual status when the issuer resumes interest payments or when collectibility of interest is reasonably assured.
Expenses. Most expenses of the trust can be directly attributed to a fund. Expenses which cannot be directly attributed are apportioned among each fund in the trust.
Strategic Income Portfolio
Notes to Financial Statements - continued
1. Significant Accounting Policies - continued
Income Tax Information and Distributions to Shareholders. Each year, the fund intends to qualify as a regulated investment company by distributing all of its taxable income and realized gains under Subchapter M of the Internal Revenue Code. As a result, no provision for income taxes is required in the accompanying financial statements. Foreign taxes are provided for based on the fund's understanding of the tax rules and rates that exist in the foreign markets in which it invests. Dividends are declared daily and paid monthly from net investment income. Distributions from realized gains, if any, are recorded on the ex-dividend date.
Income dividends and capital gain distributions are declared separately for each class. Income and capital gain distributions are determined in accordance with income tax regulations, which may differ from generally accepted accounting principles.
Capital accounts within the financial statements are adjusted for permanent book-tax differences. These adjustments have no impact on net assets or the results of operations. Temporary book-tax differences will reverse in a subsequent period.
Book-tax differences are primarily due to foreign currency transactions, market discount and losses deferred due to wash sales.
The tax-basis components of distributable earnings and the federal tax cost as of period end were as follows:
Unrealized appreciation | $ 4,540,806 | |
Unrealized depreciation | (198,998) | |
Net unrealized appreciation (depreciation) | 4,341,808 | |
Undistributed ordinary income | 745,505 | |
| | |
Cost for federal income tax purposes | $ 96,580,222 | |
The tax character of distributions paid was as follows:
| December 31, 2004 | December 31, 2003 |
Ordinary Income | $ 2,314,242 | $ - |
Long-Term Capital Gains | 673 | - |
Total | $ 2,314,915 | $ - |
2. Operating Policies.
Repurchase Agreements. FMR has received an Exemptive Order from the Securities and Exchange Commission (the SEC) which permits the funds and other affiliated entities of FMR to transfer uninvested cash balances into joint trading accounts. These accounts are then invested in repurchase agreements that are collateralized by U.S. Treasury or Government obligations. The funds may also invest directly with institutions, in repurchase agreements that are collateralized by commercial paper obligations and corporate obligations. Collateral is held in segregated accounts with custodian banks and may be obtained in the event of a default of the counterparty. Collateral is marked-to-market daily and maintained at a value at least equal to the principal amount of the repurchase agreement (including accrued interest).
Delayed Delivery Transactions and When-Issued Securities. The funds may purchase or sell securities on a delayed delivery or when-issued basis. Payment and delivery may take place after the customary settlement period for that security. The price of the underlying securities and the date when the securities will be delivered and paid for are fixed at the time the transaction is negotiated. During the time a delayed delivery sell is outstanding, the contract is marked-to-market daily and equivalent deliverable securities are held for the transaction. The value of the securities purchased on a delayed delivery or when-issued basis are identified as such in the fund's Schedule of Investments. The funds may receive compensation for interest forgone in the purchase of a delayed delivery or when-issued security. With respect to purchase commitments, the funds identify securities as segregated in its records with a value at least equal to the amount of the commitment. Losses may arise due to changes in the value of the underlying securities or if the counterparty does not perform under the contract's terms, or if the issuer does not issue the securities due to political, economic, or other factors.
Restricted Securities. The funds may invest in securities that are subject to legal or contractual restrictions on resale. These securities generally may be resold in transactions exempt from registration or to the public if the securities are registered. Disposal of these securities may involve time-consuming negotiations and expense, and prompt sale at an acceptable price may be difficult. Information regarding restricted securities is included at the end of the fund's Schedule of Investments.
Loans and Other Direct Debt Instruments. The funds may invest in loans and loan participations, trade claims or other receivables. These investments may include standby financing commitments, including revolving credit facilities, that obligate the fund to supply additional cash to the bor-rower on demand. Loan participations involve a risk of insolvency of the lending bank or other financial intermediary. The funds may be contractually obligated to receive approval from the agent bank and/or borrower prior to the sale of these investments.
3. Purchases and Sales of Investments.
Purchases and sales of securities, other than short-term securities, U.S. government securities, aggregated $90,856,813 and $29,724,564, respectively.
4. Fees and Other Transactions with Affiliates.
Management Fee. FMR and its affiliates provide the fund with investment management related services for which the fund pays a monthly management fee. The management fee is the sum of an individual fund fee rate that is based on an annual rate of .45% of the fund's average net assets and a group fee rate that averaged .13% during the period. The group fee rate is based upon the average net assets of all the mutual funds advised by FMR. The group fee rate decreases as assets under management increase and increases as assets under management decrease. For the period, the total annual management fee rate was .57% of the fund's average net assets.
Distribution and Service Plan. In accordance with Rule 12b-1 of the 1940 Act, the fund has adopted separate 12b-1 Plans for each Service Class of shares. Each Service Class pays Fidelity Distributors Corporation (FDC), an affiliate of FMR, a service fee. For the period, the service fee is based on an annual rate of .10% of Service Class' average net assets and .25% of Service Class 2's average net assets.
For the period, each class paid FDC the following amounts, all of which were re-allowed to insurance companies for the distribution of shares and providing shareholder support services:
Service Class | $ 3,557 | |
Service Class 2 | 8,885 | |
| $ 12,442 | |
Transfer Agent Fees. Fidelity Investments Institutional Operations Company, Inc. (FIIOC), an affiliate of FMR, is the fund's transfer, dividend disbursing, and shareholder servicing agent. FIIOC receives an asset-based fee with respect to each account. FIIOC pays a portion of the expenses related to the typesetting, printing and mailing of shareholder reports, except proxy statements. Each class pays a transfer agent fee, excluding out of pocket expenses, equal to an annual rate of .07% of their month end net assets. For the period, the total transfer agent fees paid by each class to FIIOC, including out of pocket expenses, were as follows:
Initial Class | $ 30,022 | |
Service Class | 2,497 | |
Service Class 2 | 2,495 | |
| $ 35,014 | |
Accounting Fees. Fidelity Service Company, Inc. (FSC), an affiliate of FMR, maintains the fund's accounting records. The fee is based on the level of average net assets for the month.
Central Funds. The fund may invest in affiliated Central Funds managed by Fidelity Investments Money Management, Inc. (FIMM), or Fidelity Management and Research Co, Inc. (FMRC), affiliates of FMR. The Central Funds are open-end investment companies available only to investment companies and other accounts managed by FMR and its affiliates. The Money Market Central Funds seek preservation of capital and current income. The Floating Rate Central Investment Portfolio seeks a high level of income and may also seek capital appreciation. The Central Funds do not pay a management fee. Income distributions earned by the fund are recorded as income in the accompanying financial statements and totaled $62,059 for the period.
5. Committed Line of Credit.
The fund participates with other funds managed by FMR in a $4.2 billion credit facility (the "line of credit") to be utilized for temporary or emergency purposes to fund shareholder redemptions or for other short-term liquidity purposes. The fund has agreed to pay commitment fees on its pro rata portion of the line of credit. During the period, there were no borrowings on this line of credit.
Strategic Income Portfolio
Notes to Financial Statements - continued
6. Expense Reductions.
FMR voluntarily agreed to reimburse each class to the extent annual operating expenses exceeded certain levels of average net assets as noted in the table below. Some expenses, for example interest expense, are excluded from this reimbursement. Effective February 1, 2005, the expense limitation will be changed to .75%, .85% and 1.00% for Initial Class, Service Class and Service Class 2, respectively.
| Expense
Limitations | Reimbursement
from adviser |
| | |
Initial Class | 1.00% | $ - |
Service Class | 1.10% | 1,993 |
Service Class 2 | 1.25% | 1,988 |
| | $ 3,981 |
Many of the brokers with whom FMR places trades on behalf of the fund provided services to the fund in addition to trade execution. These services included payments of certain expenses on behalf of the fund totaling $113 for the period. In addition through arrangements with the fund's custodian, credits realized as a result of uninvested cash balances were used to reduce the fund's expenses. During the period, these credits reduced the fund's custody expenses by $1,353.
7. Other Information.
At the end of the period, FMR or its affiliates were the owners of record of 100% of the total outstanding shares of the fund.
Annual Report
Report of Independent Registered
Public Accounting Firm
To the Trustees of Variable Insurance Products Fund IV and the Shareholders of Strategic Income Portfolio:
In our opinion, the accompanying statement of assets and liabilities, including the schedule of investments, and the related statements of operations and of changes in net assets and the financial highlights present fairly, in all material respects, the financial position of Strategic Income Portfolio (a fund of Variable Insurance Products Fund IV) at December 31, 2004 and the results of its operations, the changes in its net assets and the financial highlights for the periods indicated, in conformity with accounting principles generally accepted in the United States of America. These financial statements and financial highlights (hereafter referred to as "financial statements") are the responsibility of the Strategic Income Portfolio's management; our responsibility is to express an opinion on these financial statements based on our audits. We conducted our audits of these financial statements in accordance with the standards of the Public Company Accounting Oversight Board (United States). Those standards require that we plan and perform the audit to obtain reasonable assurance about whether the financial statements are free of material misstatement. An audit includes examining, on a test basis, evidence supporting the amounts and disclosures in the financial statements, assessing the accounting principles used and significant estimates made by management, and evaluating the overall financial statement presentation. We believe that our audits, which included confirmation of securities at December 31, 2004 by correspondence with the custodian and brokers, provide a reasonable basis for our opinion.
/s/PricewaterhouseCoopers LLP
PricewaterhouseCoopers LLP
Boston, Massachusetts
February 18, 2005
Strategic Income Portfolio
Fidelity Floating Rate Central Investment Portfolio
December 31, 2004 (Unaudited)
Top Fifty Holdings (excluding cash equivalents)* |
| Principal
Amount | Value | % of Fund's
Net Assets |
General Growth Properties, Inc. Tranche B, term loan 4.53% 11/12/08 | $ 6,000,000 | $ 6,015,000 | 4.8 |
Lake Las Vegas LLC Tranche 1, term loan 5.1197% 11/1/09 | 4,310,000 | 4,342,325 | 3.5 |
Qwest Corp. Tranche A, term loan 7.39% 6/30/07 | 4,000,000 | 4,170,000 | 3.3 |
UPC Distribution Holdings BV Tranche F, term loan 5.98% 12/31/11 | 4,000,000 | 4,050,000 | 3.2 |
Dex Media West LLC/Dex Media West Finance Co. Tranche B, term loan 4.1033% 9/9/10 | 3,993,293 | 4,043,209 | 3.2 |
El Paso Corp. Credit-Linked Deposit 5.15% 11/22/09 | 4,000,000 | 4,030,000 | 3.2 |
Marina District Finance Co., Inc. term loan 3.93% 10/14/11 | 4,000,000 | 4,030,000 | 3.2 |
R.H. Donnelley Corp. Tranche B2, term loan 4.3086% 6/30/11 | 3,965,788 | 4,005,446 | 3.2 |
PacifiCare Health Systems, Inc. Tranche B, term loan 4.1618% 12/6/10 | 4,000,000 | 4,000,000 | 3.2 |
Nexstar Broadcasting, Inc. Tranche D, term loan 4.31% 12/31/10 | 3,989,975 | 3,999,975 | 3.2 |
Starwood Hotels & Resorts Worldwide, Inc. term loan 3.67% 10/9/06 | 3,666,667 | 3,666,667 | 2.9 |
Smurfit-Stone Container Enterprises, Inc. Tranche B, term loan 4.5208% 11/1/11 | 3,489,621 | 3,537,603 | 2.8 |
Vicar Operating, Inc. Tranche F, term loan 4.1875% 9/30/08 | 3,100,000 | 3,119,375 | 2.5 |
RailAmerica, Inc. term loan 4.375% 9/29/11 | 3,000,000 | 3,052,500 | 2.4 |
Constellation Brands, Inc. Tranche B, term loan 4.5866% 12/22/11 | 3,000,000 | 3,037,500 | 2.4 |
Texas Genco LLC term loan 4.48% 12/14/11 | 3,000,000 | 3,033,750 | 2.4 |
Lamar Media Corp. Tranche C, term loan 4.0625% 6/30/10 | 3,000,000 | 3,030,000 | 2.4 |
ON Semiconductor Corp. Tranche G, term loan 5.5625% 12/15/11 | 3,000,000 | 3,007,500 | 2.4 |
HCA, Inc. term loan 3.42% 11/9/09 | 3,000,000 | 2,992,500 | 2.4 |
Charter Communication Operating LLC Tranche A, term loan 5.13% 4/27/10 | 3,000,000 | 2,981,250 | 2.4 |
Century Cable Holdings LLC Tranche B, term loan 7.25% 6/30/09 | 3,000,000 | 2,977,500 | 2.4 |
Kansas City Southern Railway Co. Tranche B1, term loan 4.0939% 3/30/08 | 2,800,000 | 2,842,000 | 2.3 |
Iron Mountain, Inc. Tranche R, term loan 4.1875% 4/2/11 | 2,500,000 | 2,512,500 | 2.0 |
NRG Energy, Inc. term loan 4.95% 12/24/11 | 2,193,750 | 2,193,750 | 1.8 |
Valor Telecommunications Enterprises LLC Tranche 2, term loan 10.0815% 11/10/11 | 2,000,000 | 2,060,000 | 1.6 |
AM General LLC Tranche B1, term loan 6.759% 11/1/11 | 2,000,000 | 2,040,000 | 1.6 |
Simmons Bedding Co. Tranche C, term loan 4.0535% 12/19/11 | 2,000,000 | 2,030,000 | 1.6 |
Herbalife International, Inc. term loan 4.58% 12/21/10 | 2,000,000 | 2,027,500 | 1.6 |
Reliant Energy, Inc. term loan 4.795% 4/30/10 | 2,000,000 | 2,025,000 | 1.6 |
Advertising Directory Solutions, Inc. Tranche 1, term loan 4.4% 11/9/11 | 2,000,000 | 2,015,000 | 1.6 |
LNR Property Corp. Tranche B, term loan 5.59% 1/31/08 | 2,000,000 | 2,010,000 | 1.6 |
Community Health Systems, Inc. term loan 4.15% 8/19/11 | 1,995,000 | 2,004,975 | 1.6 |
Nextel Communications, Inc. Tranche E, term loan 4.6875% 12/15/10 | 1,994,962 | 1,996,209 | 1.6 |
NRG Energy, Inc. Credit-Linked Deposit 4.325% 12/24/11 | 1,706,250 | 1,708,383 | 1.4 |
Domino's, Inc. term loan 4.3125% 6/25/10 | 1,632,486 | 1,650,852 | 1.3 |
Goodman Global Holdings, Inc. term loan 4.8125% 12/23/11 | 1,220,000 | 1,226,100 | 1.0 |
Smurfit-Stone Container Enterprises, Inc. Tranche C, term loan 4.3958% 11/1/11 | 1,073,729 | 1,088,493 | 0.9 |
Georgia-Pacific Corp. term loan 3.4647% 7/2/09 | 1,000,000 | 998,750 | 0.8 |
Cooper Standard Auto, Inc. Tranche C, term loan 6.25% 12/23/11 | 616,667 | 624,375 | 0.5 |
Landry's Seafood Restaurants, Inc. term loan 4.5276% 12/28/10 | 465,000 | 469,650 | 0.4 |
Smurfit-Stone Container Enterprises, Inc. Credit-Linked Deposit 2.4% 11/1/10 | 436,650 | 442,654 | 0.4 |
Cooper Standard Auto, Inc. Tranche B, term loan 6.25% 12/23/11 | 383,333 | 388,125 | 0.3 |
* The fund commenced operations on December 15, 2004 and holds 42 securities, excluding cash equivalents, which represent 88.9% of the fund's net assets. |
Annual Report
Trustees and Officers
The Trustees, Member of the Advisory Board, and executive officers of the trust and fund, as applicable, are listed below. The Board of Trustees governs the fund and is responsible for protecting the interests of shareholders. The Trustees are experienced executives who meet periodically throughout the year to oversee the fund's activities, review contractual arrangements with companies that provide services to the fund, and review the fund's performance. Except for William O. McCoy, Dennis J. Dirks, and Kenneth L. Wolfe, each of the Trustees oversees 301 funds advised by FMR or an affiliate. Mr. McCoy oversees 303 funds advised by FMR or an affiliate. Mr. Dirks and Mr. Wolfe oversee 233 funds advised by FMR or an affiliate.
The Trustees hold office without limit in time except that (a) any Trustee may resign; (b) any Trustee may be removed by written instrument, signed by at least two-thirds of the number of Trustees prior to such removal; (c) any Trustee who requests to be retired or who has become incapacitated by illness or injury may be retired by written instrument signed by a majority of the other Trustees; and (d) any Trustee may be removed at any special meeting of shareholders by a two-thirds vote of the outstanding voting securities of the trust. In any event, each non-interested Trustee shall retire not later than the last day of the calendar year in which his or her 72nd birthday occurs. The executive officers and Advisory Board Member hold office without limit in time, except that any officer and Advisory Board Member may resign or may be removed by a vote of a majority of the Trustees at any regular meeting or any special meeting of the Trustees. Except as indicated, each individual has held the office shown or other offices in the same company for the past five years.
The fund's Statement of Additional Information (SAI) includes more information about the Trustees. To request a free copy, call Fidelity at 1-800-544-5429.
Interested Trustees*:
Correspondence intended for each Trustee who is an "interested person" (as defined in the 1940 Act) may be sent to Fidelity Investments, 82 Devonshire Street, Boston, Massachusetts 02109.
Name, Age; Principal Occupation |
Edward C. Johnson 3d (74)** |
| Year of Election or Appointment: 1983 Mr. Johnson is Chairman of the Board of Trustees. Mr. Johnson serves as Chief Executive Officer, Chairman, and a Director of FMR Corp.; a Director and Chairman of the Board and of the Executive Committee of FMR; Chairman and a Director of Fidelity Management & Research (Far East) Inc.; Chairman (1998) and a Director of Fidelity Investments Money Management, Inc.; and Chairman (2001) and a Director (2000) of FMR Co., Inc. |
Abigail P. Johnson (43)** |
| Year of Election or Appointment: 2001 Senior Vice President of VIP Strategic Income (2003). Ms. Johnson also serves as Senior Vice President of other Fidelity funds (2001). She is President and a Director of FMR (2001), Fidelity Investments Money Management, Inc. (2001), FMR Co., Inc. (2001), and a Director of FMR Corp. Previously, Ms. Johnson managed a number of Fidelity funds. |
Laura B. Cronin (50) |
| Year of Election or Appointment: 2003 Ms. Cronin is an Executive Vice President (2002) and Chief Financial Officer (2002) of FMR Corp. and is a member of the Fidelity Management Committee (2003). Previously, Ms. Cronin served as Vice President of Finance of FMR (1997-1999), and Chief Financial Officer of FMR (1999-2001), Fidelity Personal Investments (2001), and Fidelity Brokerage Company (2001-2002). |
Robert L. Reynolds (52) |
| Year of Election or Appointment: 2003 Mr. Reynolds is a Director (2003) and Chief Operating Officer (2002) of FMR Corp. and is the head of the Fidelity Management Committee (2003). He also serves on the Board at Fidelity Investments Canada, Ltd. (2000). Previously, Mr. Reynolds served as President of Fidelity Investments Institutional Retirement Group (1996-2000). |
* Trustees have been determined to be "Interested Trustees" by virtue of, among other things, their affiliation with the trust or various entities under common control with FMR.
** Edward C. Johnson 3d, Trustee, is Abigail P. Johnson's father.
Strategic Income Portfolio
Trustees and Officers - continued
Non-Interested Trustees:
Correspondence intended for each non-interested Trustee (that is, the Trustees other than the Interested Trustees) may be sent to Fidelity Investments, P.O. Box 55235, Boston, Massachusetts 02205-5235.
Name, Age; Principal Occupation |
Dennis J. Dirks (56) |
| Year of Election or Appointment: 2005 Mr. Dirks also serves as a Trustee (2005) or Member of the Advisory Board (2004) of other investment companies advised by FMR. Prior to his retirement in May 2003, Mr. Dirks was Chief Operating Officer and a member of the Board of The Depository Trust & Clearing Corporation (DTCC) (1999-2003). He also served as President, Chief Operating Officer, and Board member of The Depository Trust Company (DTC) (1999-2003) and President and Board member of the National Securities Clearing Corporation (NSCC) (1999-2003). In addition, Mr. Dirks served as Chief Executive Officer and Board member of the Government Securities Clearing Corporation (2001-2003) and Chief Executive Officer and Board member of the Mortgage-Backed Securities Clearing Corporation (2001-2003). |
Robert M. Gates (61) |
| Year of Election or Appointment: 1997 Dr. Gates is Vice Chairman of the non-interested Trustees (2005). Dr. Gates is President of Texas A&M University (2002). He was Director of the Central Intelligence Agency (CIA) from 1991 to 1993. From 1989 to 1991, Dr. Gates served as Assistant to the President of the United States and Deputy National Security Advisor. Dr. Gates is a Director of NACCO Industries, Inc. (mining and manufacturing), Parker Drilling Co., Inc. (drilling and rental tools for the energy industry, 2001), and Brinker International (restaurant management, 2003). He also serves as a member of the Advisory Board of VoteHere.net (secure Internet voting, 2001). Previously, Dr. Gates served as a Director of LucasVarity PLC (automotive components and diesel engines), a Director of TRW Inc. (automotive, space, defense, and information technology), and Dean of the George Bush School of Government and Public Service at Texas A&M University (1999-2001). Dr. Gates also is a Trustee of the Forum for International Policy. |
George H. Heilmeier (68) |
| Year of Election or Appointment: 2004 Dr. Heilmeier is Chairman Emeritus of Telcordia Technologies (communication software and systems), where prior to his retirement, he served as company Chairman and Chief Executive Officer. He currently serves on the Boards of Directors of The Mitre Corporation (systems engineering and information technology support for the government), INET Technologies Inc. (telecommunications network surveillance, 2001), Teletech Holdings (customer management services), and HRL Laboratories (private research and development, 2004). He is Chairman of the General Motors Technology Advisory Committee and a Life Fellow of the Institute of Electrical and Electronics Engineers (IEEE) (2000). Dr. Heilmeier is a member of the Defense Science Board and the National Security Agency Advisory Board. He is also a member of the National Academy of Engineering, the American Academy of Arts and Sciences, and the Board of Overseers of the School of Engineering and Applied Science of the University of Pennsylvania. Previously, Dr. Heilmeier served as a Director of TRW Inc. (automotive, space, defense, and information technology, 1992-2002), Compaq (1994-2002), and Automatic Data Processing, Inc. (ADP) (technology-based business outsourcing, 1995-2002). |
Marie L. Knowles (58) |
| Year of Election or Appointment: 2001 Prior to Ms. Knowles' retirement in June 2000, she served as Executive Vice President and Chief Financial Officer of Atlantic Richfield Company (ARCO) (diversified energy, 1996-2000). From 1993 to 1996, she was a Senior Vice President of ARCO and President of ARCO Transportation Company. She served as a Director of ARCO from 1996 to 1998. She currently serves as a Director of Phelps Dodge Corporation (copper mining and manufacturing) and McKesson Corporation (healthcare service, 2002). Ms. Knowles is a Trustee of the Brookings Institution and the Catalina Island Conservancy and also serves as a member of the Advisory Board for the School of Engineering of the University of Southern California. |
Ned C. Lautenbach (60) |
| Year of Election or Appointment: 2000 Mr. Lautenbach has been a partner of Clayton, Dubilier & Rice, Inc. (private equity investment firm) since September 1998. Previously, Mr. Lautenbach was with the International Business Machines Corporation (IBM) from 1968 until his retirement in 1998. He was most recently Senior Vice President and Group Executive of Worldwide Sales and Services. From 1993 to 1995, he was Chairman of IBM World Trade Corporation, and from 1994 to 1998 was a member of IBM's Corporate Executive Committee. Mr. Lautenbach serves as Co-Chairman and a Director of Covansys, Inc. (global provider of business and technology solutions, 2000). In addition, he is a Director of Italtel Holding S.p.A. (telecommunications (Milan, Italy), 2004) and Eaton Corporation (diversified industrial) as well as the Philharmonic Center for the Arts in Naples, Florida (1999). He also is a member of the Council on Foreign Relations. |
Marvin L. Mann (71) |
| Year of Election or Appointment: 1993 Mr. Mann is Chairman of the non-interested Trustees (2001). He is Chairman Emeritus of Lexmark International, Inc. (computer peripherals), where he served as CEO until April 1998, retired as Chairman May 1999, and remains a member of the Board. Prior to 1991, he held the positions of Vice President of International Business Machines Corporation (IBM) and President and General Manager of various IBM divisions and subsidiaries. He is a member of the Executive Committee of the Independent Director's Council of the Investment Company Institute. In addition, Mr. Mann is a member of the President's Cabinet at the University of Alabama and the Board of Visitors of the Culverhouse College of Commerce and Business Administration at the University of Alabama. |
William O. McCoy (71) |
| Year of Election or Appointment: 1997 Prior to his retirement in December 1994, Mr. McCoy was Vice Chairman of the Board of BellSouth Corporation (telecommunications) and President of BellSouth Enterprises. He is currently a Director of Liberty Corporation (holding company), Duke Realty Corporation (real estate), and Progress Energy, Inc. (electric utility). He is also a partner of Franklin Street Partners (private investment management firm) and a member of the Research Triangle Foundation Board. In addition, Mr. McCoy served as the Interim Chancellor (1999-2000) and a member of the Board of Visitors (1994-1998) for the University of North Carolina at Chapel Hill and currently serves on the Board of Directors of the University of North Carolina Health Care System and the Board of Visitors of the Kenan-Flagler Business School (University of North Carolina at Chapel Hill). He also served as Vice President of Finance for the University of North Carolina (16-school system, 1995-1998). |
Cornelia M. Small (60) |
| Year of Election or Appointment: 2005 Ms. Small is a member (2000) and Chairperson (2002) of the Investment Committee, and a member (2002) of the Board of Trus-tees of Smith College. Previously, she served as Chief Investment Officer (1999-2000), Director of Global Equity Investments (1996-1999), and a member of the Board of Directors of Scudder, Stevens & Clark (1990-1997) and Scudder Kemper Investments (1997-1998). In addition, Ms. Small served as Co-Chair (2000-2003) of the Annual Fund for the Fletcher School of Law and Diplomacy. |
William S. Stavropoulos (65) |
| Year of Election or Appointment: 2002 Mr. Stavropoulos is Chairman of the Board (2000), CEO (2002), a position he previously held from 1995-2000, Chairman of the Executive Committee (2000), and a Member of the Board of Directors of The Dow Chemical Company. Since joining The Dow Chemical Company in 1967, Mr. Stavropoulos served in numerous senior management positions, including President (1993-2000; 2002-2003). Currently, he is a Director of NCR Corporation (data warehousing and technology solutions), BellSouth Corporation (telecommunications), Chemical Financial Corporation, and Maersk Inc. (industrial conglomerate, 2002). He also serves as a member of the Board of Trustees of the American Enterprise Institute for Public Policy Research. In addition, Mr. Stavropoulos is a member of The Business Council, J.P. Morgan International Council and the University of Notre Dame Advisory Council for the College of Science. |
Kenneth L. Wolfe (65) |
| Year of Election or Appointment: 2005 Mr. Wolfe also serves as a Trustee (2005) or Member of the Advisory Board (2004) of other investment companies advised by FMR. Prior to his retirement in 2001, Mr. Wolfe was Chairman and Chief Executive Officer of Hershey Foods Corporation (1993-2001). He currently serves as a member of the boards of Adelphia Communications Corporation (2003), Bausch & Lomb, Inc., and Revlon Inc. (2004). |
Advisory Board Member and Executive Officers:
Correspondence intended for each executive officer and Mr. Lynch may be sent to Fidelity Investments, 82 Devonshire Street, Boston, Massachusetts 02109.
Name, Age; Principal Occupation |
Peter S. Lynch (61) |
| Year of Election or Appointment: 2003 Member of the Advisory Board of Variable Insurance Products Fund IV. Vice Chairman and a Director of FMR, and Vice Chairman (2001) and a Director (2000) of FMR Co., Inc. Previously, Mr. Lynch served as a Trustee of the Fidelity funds (1990-2003). Prior to May 31, 1990, he was a Director of FMR and Executive Vice President of FMR (a position he held until March 31, 1991), Vice President of Fidelity® Magellan® Fund and FMR Growth Group Leader, and Managing Director of FMR Corp. Mr. Lynch was also Vice President of Fidelity Investments Corporate Services. In addition, he serves as a Trustee of Boston College, Massachusetts Eye & Ear Infirmary, Historic Deerfield, John F. Kennedy Library, and the Museum of Fine Arts of Boston. |
Bart A. Grenier (45) |
| Year of Election or Appointment: 2003 Vice President of VIP Strategic Income. Mr. Grenier also serves as Vice President of certain Equity Funds (2001), a position he previously held from 1999 to 2000, and Vice President of certain High Income Funds (2002). He is Senior Vice President of FMR (1999) and FMR Co., Inc. (2001), and President and Director of Strategic Advisers, Inc. (2002). He also heads Fidelity's Asset Allocation Group (2000), Fidelity's Growth and Income Group (2001), Fidelity's Value Group (2001), and Fidelity's High Income Division (2001). Previously, Mr. Grenier served as President of Fidelity Ventures (2000), Vice President of certain High Income Funds (1997-2000), High Income Division Head (1997-2000), Group Leader of the Income-Growth and Asset Allocation-Income Groups (1996-2000), and Assistant Equity Division Head (1997-2000). |
Charles S. Morrison (44) |
| Year of Election or Appointment: 2003 Vice President of VIP Strategic Income. Mr. Morrison also serves as Vice President of Fidelity's Bond Funds (2002), and Vice President of certain Asset Allocation and Balanced Funds (2002). He serves as Vice President (2002) and Bond Group Leader (2002) of Fidelity Investments Fixed Income Division. Mr. Morrison is also Vice President of FIMM (2002) and FMR (2002). Mr. Morrison joined Fidelity in 1987 as a Corporate Bond Analyst in the Fixed Income Research Division. |
William Eigen (36) |
| Year of Election or Appointment: 2003 Vice President of VIP Strategic Income. Mr. Eigen also serves as Vice President of other funds advised by FMR. Prior to assuming his current responsibilities, Mr. Eigen worked as a director, strategist, and portfolio manager. |
George Fischer (43) |
| Year of Election or Appointment: 2003 Vice President of VIP Strategic Income. Mr. Fischer also serves as Vice President of other funds advised by FMR. Prior to assuming his current responsibilities, Mr. Fischer managed a variety of Fidelity funds. |
Mark J. Notkin (40) |
| Year of Election or Appointment: 2003 Vice President of VIP Strategic Income. Mr. Notkin also serves as Vice President of other funds advised by FMR. Prior to assuming his current responsibilities, Mr. Notkin managed a variety of Fidelity funds. |
Eric D. Roiter (56) |
| Year of Election or Appointment: 2003 Secretary of VIP Strategic Income. He also serves as Secretary of other Fidelity funds; Vice President, General Counsel, and Secretary of FMR Co., Inc. (2001-present) and FMR; Vice President and Secretary of FDC; Assistant Secretary of Fidelity Management & Research (U.K.) Inc. (2001-present), Fidelity Management & Research (Far East) Inc. (2001-present), and Fidelity Investments Money Management, Inc. (2001-present). Mr. Roiter is an Adjunct Member, Faculty of Law, at Boston College Law School (2003-present). |
Stuart Fross (45) |
| Year of Election or Appointment: 2003 Assistant Secretary of VIP Strategic Income. Mr. Fross also serves as Assistant Secretary of other Fidelity funds (2003) and is an employee of FMR. |
Christine Reynolds (46) |
| Year of Election or Appointment: 2004 President, Treasurer, and Anti-Money Laundering (AML) officer of VIP Strategic Income. Ms. Reynolds also serves as President, Treasurer, and AML officer of other Fidelity funds (2004) and is a Vice President (2003) and an employee (2002) of FMR. Before joining Fidelity Investments, Ms. Reynolds worked at PricewaterhouseCoopers LLP (PwC) (1980-2002), where she was most re-cently an audit partner with PwC's investment management practice. |
Timothy F. Hayes (54) |
| Year of Election or Appointment: 2003 Chief Financial Officer of VIP Strategic Income. Mr. Hayes also serves as Chief Financial Officer of other Fidelity funds (2002). Recently he was appointed President of Fidelity Service Company (2003) where he also serves as a Director. Mr. Hayes also serves as President of Fidelity Investments Operations Group (FIOG, 2002), which includes Fidelity Pricing and Cash Management Services Group (FPCMS), where he was appointed President in 1998. Previously, Mr. Hayes served as Chief Financial Officer of Fidelity Investments Corporate Systems and Service Group (1998) and Fidelity Systems Company (1997-1998). |
Kenneth A. Rathgeber (57) |
| Year of Election or Appointment: 2004 Chief Compliance Officer of VIP Strategic Income. Mr. Rathgeber also serves as Chief Compliance Officer of other Fidelity funds (2004) and Executive Vice President of Risk Oversight for Fidelity Investments (2002). Previously, he served as Executive Vice President and Chief Operating Officer for Fidelity Investments Institutional Services Company, Inc. (1998-2002). |
John R. Hebble (46) |
| Year of Election or Appointment: 2003 Deputy Treasurer of VIP Strategic Income. Mr. Hebble also serves as Deputy Treasurer of other Fidelity funds (2003), and is an employee of FMR. Before joining Fidelity Investments, Mr. Hebble worked at Deutsche Asset Management where he served as Director of Fund Accounting (2002-2003) and Assistant Treasurer of the Scudder Funds (1998-2003). |
Kimberley H. Monasterio (41) |
| Year of Election or Appointment: 2004 Deputy Treasurer of VIP Strategic Income. Ms. Monasterio also serves as Deputy Treasurer of other Fidelity funds (2004) and is an employee of FMR (2004). Before joining Fidelity Investments, Ms. Monasterio served as Treasurer (2000-2004) and Chief Financial Officer (2002-2004) of the Franklin Templeton Funds and Senior Vice President of Franklin Templeton Services, LLC (2000-2004). |
John H. Costello (58) |
| Year of Election or Appointment: 2003 Assistant Treasurer of VIP Strategic Income. Mr. Costello also serves as Assistant Treasurer of other Fidelity funds and is an employee of FMR. |
Peter L. Lydecker (50) |
| Year of Election or Appointment: 2004 Assistant Treasurer of VIP Strategic Income. Mr. Lydecker also serves as Assistant Treasurer of other Fidelity funds (2004) and is an employee of FMR. |
Mark Osterheld (49) |
| Year of Election or Appointment: 2003 Assistant Treasurer of VIP Strategic Income. Mr. Osterheld also serves as Assistant Treasurer of other Fidelity funds (2002) and is an employee of FMR. |
Kenneth B. Robins (35) |
| Year of Election or Appointment: 2004 Assistant Treasurer of VIP Strategic Income. Mr. Robins also serves as Assistant Treasurer of other Fidelity funds (2004) and is an employee of FMR (2004). Before joining Fidelity Investments, Mr. Robins worked at KPMG LLP, where he was a partner in KPMG's department of professional practice (2002-2004) and a Senior Manager (1999-2000). In addition, Mr. Robins served as Assistant Chief Accountant, United States Securities and Exchange Commission (2000-2002). |
Strategic Income Portfolio
Distributions
The Board of Trustees of Strategic Income Portfolio voted to pay to shareholders of record at the opening of business on record date, the following distributions per share derived from capital gains realized from sales of portfolio securities, and dividends derived from net investment income:
| Pay Date | Record Date | Dividends | Capital Gains |
Initial Class | 2/11/05 | 2/11/05 | $.005 | $.065 |
Service Class | 2/11/05 | 2/11/05 | $.005 | $.065 |
Service Class 2 | 2/11/05 | 2/11/05 | $.005 | $.065 |
The fund will notify shareholders in January 2005 of amounts for use in preparing 2004 income tax returns.
Annual Report
Proxy Voting Results
A special meeting of the fund's shareholders was held on December 14, 2004. The results of votes taken among shareholders on proposals before them are reported below. Each vote reported represents one dollar of net asset value held on the record date for the meeting.
PROPOSAL 1 |
To amend the Declaration of Trust to allow the Board of Trustees, if permitted by applicable law, to authorize fund mergers without shareholder approval. A |
| # of
Votes | % of
Votes |
Affirmative | 458,190,063.70 | 83.431 |
Against | 70,246,908.89 | 12.791 |
Abstain | 20,745,786.74 | 3.778 |
TOTAL | 549,182,759.33 | 100.000 |
PROPOSAL 2 |
To elect a Board of Trustees. A |
| # of
Votes | % of
Votes |
J. Michael Cook |
Affirmative | 521,583,205.95 | 94.974 |
Withheld | 27,599,553.38 | 5.026 |
TOTAL | 549,182,759.33 | 100.000 |
Ralph F. Cox |
Affirmative | 519,150,329.49 | 94.531 |
Withheld | 30,032,429.84 | 5.469 |
TOTAL | 549,182,759.33 | 100.000 |
Laura B. Cronin |
Affirmative | 520,911,931.53 | 94.852 |
Withheld | 28,270,827.80 | 5.148 |
TOTAL | 549,182,759.33 | 100.000 |
Dennis J. Dirks B |
Affirmative | 521,590,729.90 | 94.976 |
Withheld | 27,592,029.43 | 5.024 |
TOTAL | 549,182,759.33 | 100.000 |
Robert M. Gates |
Affirmative | 519,905,480.12 | 94.669 |
Withheld | 29,277,279.21 | 5.331 |
TOTAL | 549,182,759.33 | 100.000 |
George H. Heilmeier |
Affirmative | 520,921,777.54 | 94.854 |
Withheld | 28,260,981.79 | 5.146 |
TOTAL | 549,182,759.33 | 100.000 |
Abigail P. Johnson |
Affirmative | 519,065,339.91 | 94.516 |
Withheld | 30,117,419.42 | 5.484 |
TOTAL | 549,182,759.33 | 100.000 |
Edward C. Johnson 3d |
Affirmative | 518,847,346.05 | 94.476 |
Withheld | 30,335,413.28 | 5.524 |
TOTAL | 549,182,759.33 | 100.000 |
Donald J. Kirk |
Affirmative | 521,181,241.00 | 94.901 |
Withheld | 28,001,518.33 | 5.099 |
TOTAL | 549,182,759.33 | 100.000 |
| # of
Votes | % of
Votes |
Marie L. Knowles |
Affirmative | 521,391,176.23 | 94.939 |
Withheld | 27,791,583.10 | 5.061 |
TOTAL | 549,182,759.33 | 100.000 |
Ned C. Lautenbach |
Affirmative | 521,804,568.92 | 95.015 |
Withheld | 27,378,190.41 | 4.985 |
TOTAL | 549,182,759.33 | 100.000 |
Marvin L. Mann |
Affirmative | 520,497,408.02 | 94.777 |
Withheld | 28,685,351.31 | 5.223 |
TOTAL | 549,182,759.33 | 100.000 |
William O. McCoy |
Affirmative | 520,233,312.84 | 94.729 |
Withheld | 28,949,446.49 | 5.271 |
TOTAL | 549,182,759.33 | 100.000 |
Robert L. Reynolds |
Affirmative | 521,415,834.89 | 94.944 |
Withheld | 27,766,924.44 | 5.056 |
TOTAL | 549,182,759.33 | 100.000 |
Cornelia M. Small B |
Affirmative | 521,014,631.05 | 94.871 |
Withheld | 28,168,128.28 | 5.129 |
TOTAL | 549,182,759.33 | 100.000 |
William S. Stavropoulos |
Affirmative | 520,522,282.96 | 94.781 |
Withheld | 28,660,476.37 | 5.219 |
TOTAL | 549,182,759.33 | 100.000 |
A Denotes trust-wide proposals and voting results. B Effective January 1, 2005. |
Strategic Income Portfolio
Annual Report
Investment Adviser
Fidelity Management & Research Company
Boston, MA
Investment Sub-Advisers
FMR Co., Inc.
Fidelity Management & Research (U.K.) Inc.
Fidelity Management & Research (Far East) Inc.
Fidelity Investments Money Management, Inc.
Fidelity Investments Japan Limited
Fidelity International Investment Advisors
Fidelity International Investment Advisors (U.K.) Limited
General Distributor
Fidelity Distributors Corporation
Boston, MA
Transfer and Shareholder Servicing Agent
Fidelity Investments Institutional Operations Company, Inc.
Boston, MA
Custodian
Mellon Bank, N.A.
Pittsburgh, PA
VIPSI-ANN-0205
1.796350.102
Fidelity® Variable Insurance Products:
International Capital Appreciation Portfolio
Annual Report
December 31, 2004
(2_fidelity_logos) (Registered_Trademark)
Contents
Performance | 3 | How the fund has done over time. |
Shareholder Expense Example | 4 | An example of shareholder expenses. |
Investment Summary | 5 | A summary of the fund's investments at period end. |
Investments | 6 | A complete list of the fund's investments with their
market values. |
Financial Statements | 8 | Statements of assets and liabilities, operations, and
changes in net assets, as well as financial highlights. |
Notes | 13 | Notes to the financial statements. |
Report of Independent Registered Public Accounting Firm | 16 | |
Trustees and Officers | 17 | |
Distributions | 22 | |
To view a fund's proxy voting guidelines and proxy voting record for the 12-month period ended June 30, visit www.fidelity.com/proxyvotingresults or visit the Securities and Exchange Commission's (SEC) web site at www.sec.gov. You may also call 1-800-544-5429 to request a free copy of the proxy voting guidelines.
Fidelity Variable Insurance Products are separate account options which are purchased through a variable insurance contract.
Standard & Poor's, S&P and S&P 500 are registered service marks of The McGraw-Hill Companies, Inc. and have been licensed for use by Fidelity Distributors Corporation.
Other third party marks appearing herein are the property of their respective owners.
All other marks appearing herein are registered or unregistered trademarks or service marks of FMR Corp. or an affiliated company.
(Recycle graphic) This report is printed on recycled paper using soy-based inks.
This report and the financial statements contained herein are submitted for the general information of the shareholders of the fund. This report is not authorized for distribution to prospective investors in the fund unless preceded or accompanied by an effective prospectus.
A fund files its complete schedule of portfolio holdings with the SEC for the first and third quarters of each fiscal year on Form N-Q. Forms N-Q are available on the SEC's web site at http://www.sec.gov. A fund's Forms N-Q may be reviewed and copied at the SEC's Public Reference Room in Washington, DC. Information regarding the operation of the SEC's Public Reference Room may be obtained by calling 1-800-SEC-0330. For a complete list of a fund's portfolio holdings, view the most recent quarterly holdings report, semiannual report, or annual report on Fidelity's web site at http://www.advisor.fidelity.com.
NOT FDIC INSURED · MAY LOSE VALUE · NO BANK GUARANTEE
Neither the fund nor Fidelity Distributors Corporation is a bank.
International Capital Appreciation Portfolio
Fidelity Variable Insurance Products: International Capital Appreciation Portfolio
Performance: The Bottom Line
Performance
Average annual total return reflects the change in the value of an investment, assuming reinvestment of the class' dividend income and capital gains (the profits earned upon the sale of securities that have grown in value) and assuming a constant rate of performance each year. How a fund did yesterday is no guarantee of how it will do tomorrow.
Average annual total returns take Fidelity® Variable Insurance Products: International Capital Appreciation Portfolio's cumulative total return and show you what would have happened if Fidelity Variable Insurance Products: International Capital Appreciation Portfolio shares had performed at a constant rate each year. These numbers will be reported once the fund is a year old. In addition, the growth of the hypothetical $10,000 investment in the fund will appear in the fund's next annual report.
Annual Report
Fidelity Variable Insurance Products: International Capital Appreciation Portfolio
Shareholder Expense Example
As a shareholder of the Fund, you incur two types of costs: (1) transaction costs, including redemption fees, and (2) ongoing costs, including management fees, distribution and/or service (12b-1) fees and other Fund expenses. This Example is intended to help you understand your ongoing costs (in dollars) of investing in the Fund and to compare these costs with the ongoing costs of investing in other mutual funds.
The actual expense Example is based on an investment of $1,000 invested at the beginning of the period and held for the entire period (December 22, 2004 to December 31, 2004). The hypothetical expense Example is based on an investment of $1,000 invested for the one half year period (July 1, 2004 to December 31, 2004).
Actual Expenses
The first line of the table below for each class of the Fund provides information about actual account values and actual expenses. You may use the information in this line, together with the amount you invested, to estimate the expenses that you paid over the period. Simply divide your account value by $1,000.00 (for example, an $8,600 account value divided by $1,000.00 = 8.6), then multiply the result by the number in the first line for a class of the Fund under the heading entitled "Expenses Paid During Period" to estimate the expenses you paid on your account during this period. The estimate of expenses does not include any fees or other expenses of any variable annuity or variable life insurance product. If they were, the estimate of expenses you paid during the period would be higher, and your ending account value would be lower.
Hypothetical Example for Comparison Purposes
The second line of the table below for each class of the Fund provides information about hypothetical account values and hypothetical expenses based on a Class' actual expense ratio and an assumed rate of return of 5% per year before expenses, which is not the Class' actual return. The hypothetical account values and expenses may not be used to estimate the actual ending account balance or expenses you paid for the period. You may use this information to compare the ongoing costs of investing in the Fund and other funds. To do so, compare this 5% hypothetical example with the 5% hypothetical examples that appear in the shareholder reports of the other funds. The estimate of expenses does not include any fees or other expenses of any variable annuity or variable life insurance product. If they were, the estimate of expenses you paid during the period would be higher, and your ending account value would be lower.
Please note that the expenses shown in the table are meant to highlight your ongoing costs only and do not reflect any transaction costs. Therefore, the second line of the table is useful in comparing ongoing costs only, and will not help you determine the relative total costs of owning different funds. In addition, if these transactional costs were included, your costs would have been higher.
| Beginning
Account Value | Ending
Account Value
December 31, 2004 | Expenses Paid
During Period |
Initial Class | | | |
Actual | $ 1,000.00 | $ 1,024.00 | $ .30B |
Hypothetical A | $ 1,000.00 | $ 1,019.61 | $ 5.58C |
Service Class | | | |
Actual | $ 1,000.00 | $ 1,024.00 | $ .33B |
Hypothetical A | $ 1,000.00 | $ 1,019.10 | $ 6.09C |
Service Class 2 | | | |
Actual | $ 1,000.00 | $ 1,024.00 | $ .37B |
Hypothetical A | $ 1,000.00 | $ 1,018.35 | $ 6.85C |
Initial Class R | | | |
Actual | $ 1,000.00 | $ 1,024.00 | $ .30B |
Hypothetical A | $ 1,000.00 | $ 1,019.61 | $ 5.58C |
Service Class R | | | |
Actual | $ 1,000.00 | $ 1,024.00 | $ .33B |
Hypothetical A | $ 1,000.00 | $ 1,019.10 | $ 6.09C |
Service Class 2R | | | |
Actual | $ 1,000.00 | $ 1,024.00 | $ .37B |
Hypothetical A | $ 1,000.00 | $ 1,018.35 | $ 6.85C |
A 5% return per year before expenses
B Actual expenses are equal to each Class' annualized expense ratio (shown in the table below); multiplied by the average account value over the period, multiplied by 10/366 (to reflect the period December 22, 2004 to December 31, 2004).
C Hypothetical expenses are equal to each Class' annualized expense ratio (shown in the table below); multiplied by the average account
value over the period, multiplied by 184/366 (to reflect the one-half year period).
| Annualized
Expense Ratio |
Initial Class | 1.10% |
Service Class | 1.20% |
Service Class 2 | 1.35% |
Initial Class R | 1.10% |
Service Class R | 1.20% |
Service Class 2R | 1.35% |
Annual Report
Fidelity Variable Insurance Products: International Capital Appreciation Portfolio
Investment Summary
Top Five Stocks as of December 31, 2004 |
| % of fund's
net assets |
Alcatel SA (RFD) (France) | 4.1 |
Vodafone Group PLC (United Kingdom) | 3.9 |
Actelion Ltd. (Reg.) (Switzerland) | 3.5 |
ASML Holding NV (NY Shares) (Netherlands) | 3.3 |
UBS AG (Reg.) (Switzerland) | 3.2 |
| 18.0 |
Top Five Market Sectors as of December 31, 2004 |
| % of fund's
net assets |
Financials | 22.5 |
Consumer Discretionary | 14.8 |
Information Technology | 12.8 |
Health Care | 12.5 |
Telecommunication Services | 8.2 |
Top Five Countries as of December 31, 2004 |
(excluding cash equivalents) | % of fund's
net assets |
Switzerland | 15.1 |
Japan | 14.2 |
France | 12.5 |
United Kingdom | 11.9 |
Germany | 7.0 |
Annual Report
Fidelity Variable Insurance Products: International Capital Appreciation Portfolio
Investments December 31, 2004
Showing Percentage of Net Assets
Common Stocks - 95.7% |
| Shares | | Value (Note 1) |
Australia - 2.1% |
CSL Ltd. | 1,900 | | $ 43,482 |
Bahamas (Nassau) - 0.6% |
Kerzner International Ltd. (a) | 200 | | 12,010 |
Bermuda - 0.5% |
GOME Electrical Appliances Holdings Ltd. (a) | 10,000 | | 9,070 |
Brazil - 3.9% |
Aracruz Celulose SA sponsored ADR | 1,500 | | 56,550 |
Votorantim Celulose e Papel SA sponsored ADR (non-vtg.) | 1,400 | | 22,680 |
TOTAL BRAZIL | | 79,230 |
Canada - 3.1% |
Canadian Natural Resources Ltd. | 700 | | 29,896 |
EnCana Corp. | 600 | | 34,200 |
TOTAL CANADA | | 64,096 |
China - 1.6% |
Global Bio-Chem Technology Group Co. Ltd. | 20,000 | | 13,123 |
People's Food Holdings Ltd. | 16,000 | | 14,705 |
Weichai Power Co. Ltd. (H Shares) | 2,000 | | 5,545 |
TOTAL CHINA | | 33,373 |
Denmark - 2.1% |
Novo Nordisk AS Series B | 800 | | 43,629 |
France - 12.5% |
Alcatel SA (RFD) (a) | 5,400 | | 84,400 |
Pernod-Ricard | 300 | | 45,865 |
Societe Generale Series A | 400 | | 40,398 |
Technip-Coflexip SA | 100 | | 18,449 |
Thomson SA | 900 | | 23,746 |
Total SA Series B | 200 | | 43,936 |
TOTAL FRANCE | | 256,794 |
Germany - 7.0% |
Allianz AG (Reg.) | 100 | | 13,290 |
Deutsche Telekom AG (Reg.) (a) | 2,300 | | 52,164 |
HeidelbergCement AG | 603 | | 36,237 |
Siemens AG (Reg.) | 500 | | 42,335 |
TOTAL GERMANY | | 144,026 |
Hong Kong - 3.5% |
China Merchants Holdings International Co. Ltd. | 6,000 | | 11,309 |
Johnson Electric Holdings Ltd. | 14,000 | | 13,599 |
Li & Fung Ltd. | 6,000 | | 10,112 |
Techtronic Industries Co. Ltd. | 17,000 | | 37,072 |
TOTAL HONG KONG | | 72,092 |
India - 2.8% |
Bank of Baroda | 4,200 | | 23,655 |
|
| Shares | | Value (Note 1) |
State Bank of India | 700 | | $ 11,445 |
Zee Telefilms Ltd. | 5,600 | | 22,212 |
TOTAL INDIA | | 57,312 |
Italy - 3.1% |
Banca Intesa Spa | 5,100 | | 24,491 |
e.Biscom Spa (a) | 200 | | 11,520 |
ENI Spa | 1,100 | | 27,685 |
TOTAL ITALY | | 63,696 |
Japan - 14.2% |
Aisin Seiki Co. Ltd. | 500 | | 12,667 |
Aruze Corp. | 200 | | 5,096 |
Fast Retailing Co. Ltd. | 200 | | 15,230 |
Fuji Photo Film Co. Ltd. | 700 | | 25,886 |
Honda Motor Co. Ltd. | 400 | | 20,848 |
Hoya Corp. | 100 | | 11,296 |
JAFCO Co. Ltd. | 300 | | 20,385 |
Matsui Securities Co. Ltd. | 300 | | 10,456 |
Mitsui Trust Holdings, Inc. | 1,000 | | 9,997 |
Mizuho Financial Group, Inc. | 8 | | 40,301 |
Nomura Holdings, Inc. | 1,000 | | 14,560 |
SFCG Co. Ltd. | 70 | | 17,700 |
SKY Perfect Communications, Inc. | 8 | | 8,669 |
Softbank Corp. | 500 | | 24,358 |
Sumitomo Mitsui Financial Group, Inc. | 6 | | 43,640 |
Tv Asahi Corp. | 5 | | 10,153 |
TOTAL JAPAN | | 291,242 |
Korea (South) - 0.1% |
Korea Exchange Bank (a) | 310 | | 2,575 |
Netherlands - 5.8% |
ASML Holding NV (a) | 1,500 | | 23,865 |
ASML Holding NV (NY Shares) (a) | 4,300 | | 68,413 |
ING Groep NV (Certificaten Van Aandelen) | 900 | | 27,225 |
TOTAL NETHERLANDS | | 119,503 |
Spain - 1.6% |
Antena 3 Television SA (a) | 100 | | 7,210 |
Telefonica SA | 1,300 | | 24,483 |
TOTAL SPAIN | | 31,693 |
Sweden - 1.2% |
Hennes & Mauritz AB (H&M) (B Shares) | 700 | | 24,384 |
Switzerland - 15.1% |
ABB Ltd. (Reg.) (a) | 5,150 | | 28,700 |
Actelion Ltd. (Reg.) (a) | 706 | | 72,369 |
Credit Suisse Group (Reg.) | 795 | | 33,541 |
Julius Baer Holding AG (Bearer) | 40 | | 12,015 |
Novartis AG (Reg.) | 650 | | 32,851 |
Roche Holding AG (participation certificate) | 303 | | 34,622 |
Common Stocks - continued |
| Shares | | Value (Note 1) |
Switzerland - continued |
The Swatch Group AG (Reg.) | 1,010 | | $ 29,960 |
UBS AG (Reg.) | 767 | | 64,305 |
TOTAL SWITZERLAND | | 308,363 |
Taiwan - 1.9% |
ASUSTeK Computer, Inc. | 4,000 | | 10,632 |
Optimax Technology Corp. | 11,000 | | 28,028 |
TOTAL TAIWAN | | 38,660 |
United Kingdom - 11.9% |
BAE Systems PLC | 2,200 | | 9,732 |
BHP Billiton PLC | 1,500 | | 17,574 |
British Airways PLC (a) | 4,900 | | 22,098 |
Capita Group PLC | 2,100 | | 14,740 |
Enterprise Inns PLC | 900 | | 13,731 |
HSBC Holdings PLC (United Kingdom) (Reg.) | 1,800 | | 30,650 |
Invensys PLC (a) | 56,300 | | 16,747 |
Man Group PLC | 700 | | 19,774 |
Shire Pharmaceuticals Group PLC | 1,800 | | 19,170 |
Vodafone Group PLC | 29,200 | | 79,950 |
TOTAL UNITED KINGDOM | | 244,166 |
United States of America - 1.1% |
NTL, Inc. (a) | 300 | | 21,888 |
TOTAL COMMON STOCKS (Cost $1,913,012) | 1,961,284 |
Cash Equivalents - 8.3% |
| Maturity
Amount | | |
Investments in repurchase agreements (Collateralized by U.S. Treasury Obligations, in a joint trading account at 1.52%, dated 12/31/04 due 1/3/05)
(Cost $169,000) | $ 169,021 | | 169,000 |
TOTAL INVESTMENT PORTFOLIO - 104.0% (Cost $2,082,012) | | 2,130,284 |
NET OTHER ASSETS - (4.0)% | | (81,472) |
NET ASSETS - 100% | $ 2,048,812 |
Legend |
(a) Non-income producing |
See accompanying notes which are an integral part of the financial statements.
International Capital Appreciation Portfolio
Fidelity Variable Insurance Products: International Capital Appreciation Portfolio
Financial Statements
Statement of Assets and Liabilities
| December 31, 2004 |
| | |
Assets | | |
Investment in securities, at value (including repurchase agreements of $169,000) (cost $2,082,012) - See accompanying schedule | | $ 2,130,284 |
Cash | | 159 |
Foreign currency held at value (cost $14,130) | | 14,226 |
Dividends receivable | | 282 |
Receivable from investment adviser for expense reductions | | 23,758 |
Other receivables | | 104 |
Total assets | | 2,168,813 |
| | |
Liabilities | | |
Payable for investments purchased | $ 96,402 | |
Accrued management fee | 388 | |
Distribution fees payable | 70 | |
Other affiliated payables | 911 | |
Other payables and accrued expenses | 22,230 | |
Total liabilities | | 120,001 |
| | |
Net Assets | | $ 2,048,812 |
Net Assets consist of: | | |
Paid in capital | | $ 2,000,060 |
Accumulated net investment loss | | (408) |
Accumulated undistributed net realized gain (loss) on investments and foreign currency transactions | | 965 |
Net unrealized appreciation (depreciation) on investments and assets and liabilities in foreign currencies | | 48,195 |
Net Assets | | $ 2,048,812 |
Calculation of Maximum Offering Price | | |
| | |
Initial Class:
Net Asset Value, offering price and redemption price per share ($307,334 ÷ 30,001 shares) | | $ 10.24 |
| | |
Service Class:
Net Asset Value, offering price and redemption price per share ($307,325 ÷ 30,001 shares) | | $ 10.24 |
| | |
Service Class 2:
Net Asset Value, offering price and redemption price per share ($409,747 ÷ 40,001 shares) | | $ 10.24 |
| | |
Initial Class R:
Net Asset Value, offering price and
redemption price per share
($307,334 ÷ 30,001 shares) | | $ 10.24 |
| | |
Service Class R:
Net Asset Value, offering price and redemption price per share ($307,325 ÷ 30,001 shares) | | $ 10.24 |
| | |
Service Class 2R:
Net Asset Value, offering price and redemption price per share ($409,747 ÷ 40,001 shares) | | $ 10.24 |
Statement of Operations
For the period December 22, 2004 (commencement of operations)
to December 31, 2004 |
| | |
Investment Income | | |
Dividends | | $ 283 |
Interest | | 686 |
Total income | | 969 |
| | |
Expenses | | |
Management fee | $ 388 | |
Transfer agent fees | 34 | |
Distribution fees | 70 | |
Accounting fees and expenses | 875 | |
Custodian fees and expenses | 3,406 | |
Audit | 18,677 | |
Miscellaneous | 1,000 | |
Total expenses before reductions | 24,450 | |
Expense reductions | (23,862) | 588 |
Net investment income (loss) | | 381 |
Realized and Unrealized Gain (Loss) Net realized gain (loss) on: | | |
Investment securities | 964 | |
Foreign currency transactions | (788) | |
Total net realized gain (loss) | | 176 |
Change in net unrealized appreciation (depreciation) on: Investment securities (net of increase in deferred foreign taxes of $150) | 48,122 | |
Assets and liabilities in foreign currencies | 73 | |
Total change in net unrealized appreciation (depreciation) | | 48,195 |
Net gain (loss) | | 48,371 |
Net increase (decrease) in net assets resulting from operations | | $ 48,752 |
See accompanying notes which are an integral part of the financial statements.
Annual Report
Statement of Changes in Net Assets
| For the period
December 22, 2004
(commencement
of operations) to
December 31, 2004 |
Increase (Decrease) in Net Assets | |
Operations | |
Net investment income (loss) | $ 381 |
Net realized gain (loss) | 176 |
Change in net unrealized appreciation (depreciation) | 48,195 |
Net increase (decrease) in net assets resulting from operations | 48,752 |
Share transactions - net increase (decrease) | 2,000,060 |
Total increase (decrease) in net assets | 2,048,812 |
| |
Net Assets | |
Beginning of period | - |
End of period (including accumulated net investment loss of $408) | $ 2,048,812 |
Other Information: | | | | | | |
Share Transactions | For the period December 22, 2004 (commencement of operations) to December 31, 2004 |
Shares | Initial Class | Service Class | Service Class 2 | Initial Class R | Service Class R | Service Class 2R |
Sold | 30,001 | 30,001 | 40,001 | 30,001 | 30,001 | 40,001 |
| | | | | | |
Dollars Sold | $ 300,010 | $ 300,010 | $ 400,010 | $ 300,010 | $ 300,010 | $ 400,010 |
See accompanying notes which are an integral part of the financial statements.
International Capital Appreciation Portfolio
Financial Highlights - Initial Class
Year ended December 31, | 2004 F |
Selected Per-Share Data | |
Net asset value, beginning of period | $ 10.00 |
Income from Investment Operations | |
Net investment income (loss) E | - H |
Net realized and unrealized gain (loss) | .24 |
Total from investment operations | .24 |
Net asset value, end of period | $ 10.24 |
Total Return B, C, D | 2.40% |
Ratios to Average Net Assets G | |
Expenses before expense reductions | 43.27% A |
Expenses net of voluntary waivers, if any | 1.10% A |
Expenses net of all reductions | .92% A |
Net investment income (loss) | .80% A |
Supplemental Data | |
Net assets, end of period (000 omitted) | $ 307 |
Portfolio turnover rate | 52% A |
A Annualized
B Total returns for periods of less than one year are not annualized.
C Total returns do not reflect charges attributable to your insurance company's separate account. Inclusion of these charges would reduce the total returns shown.
D Total returns would have been lower had certain expenses not been reduced during the periods shown.
E Calculated based on average shares outstanding during the period.
F For the period December 22, 2004 (commencement of operations) to December 31, 2004.
G Expense ratios reflect operating expenses of the class. Expenses before reductions do not reflect amounts reimbursed by the investment adviser or reductions from brokerage service arrangements or other expense offset arrangements and do not represent the amount paid by the class during periods when reimbursements or reductions occur. Expense ratios before reductions for start-up periods may not be representative of longer-term operating periods. Expenses net of any voluntary waivers reflect expenses after reimbursement by the investment adviser but prior to reductions from brokerage service arrangements or other expense offset arrangements. Expenses net of all reductions represent the net expenses paid by the class.
H Amount represents less than $.01 per share.
Financial Highlights - Service Class
Year ended December 31, | 2004 F |
Selected Per-Share Data | |
Net asset value, beginning of period | $ 10.00 |
Income from Investment Operations | |
Net investment income (loss) E | - H |
Net realized and unrealized gain (loss) | .24 |
Total from investment operations | .24 |
Net asset value, end of period | $ 10.24 |
Total Return B, C, D | 2.40% |
Ratios to Average Net Assets G | |
Expenses before expense reductions | 43.36% A |
Expenses net of voluntary waivers, if any | 1.20% A |
Expenses net of all reductions | 1.01% A |
Net investment income (loss) | .71% A |
Supplemental Data | |
Net assets, end of period (000 omitted) | $ 307 |
Portfolio turnover rate | 52% A |
A Annualized
B Total returns for periods of less than one year are not annualized.
C Total returns do not reflect charges attributable to your insurance company's separate account. Inclusion of these charges would reduce the total returns shown.
D Total returns would have been lower had certain expenses not been reduced during the periods shown.
E Calculated based on average shares outstanding during the period.
F For the period December 22, 2004 (commencement of operations) to December 31, 2004.
G Expense ratios reflect operating expenses of the class. Expenses before reductions do not reflect amounts reimbursed by the investment adviser or reductions from brokerage service arrangements or other expense offset arrangements and do not represent the amount paid by the class during periods when reimbursements or reductions occur. Expense ratios before reductions for start-up periods may not be representative of longer-term operating periods. Expenses net of any voluntary waivers reflect expenses after reimbursement by the investment adviser but prior to reductions from brokerage service arrangements or other expense offset arrangements. Expenses net of all reductions represent the net expenses paid by the class.
H Amount represents less than $.01 per share.
See accompanying notes which are an integral part of the financial statements.
Annual Report
Financial Highlights - Service Class 2
Year ended December 31, | 2004 F |
Selected Per-Share Data | |
Net asset value, beginning of period | $ 10.00 |
Income from Investment Operations | |
Net investment income (loss) E | - H |
Net realized and unrealized gain (loss) | .24 |
Total from investment operations | .24 |
Net asset value, end of period | $ 10.24 |
Total Return B, C, D | 2.40% |
Ratios to Average Net Assets G | |
Expenses before expense reductions | 43.51% A |
Expenses net of voluntary waivers, if any | 1.35% A |
Expenses net of all reductions | 1.17% A |
Net investment income (loss) | .55% A |
Supplemental Data | |
Net assets, end of period (000 omitted) | $ 410 |
Portfolio turnover rate | 52% A |
A Annualized
B Total returns for periods of less than one year are not annualized.
C Total returns do not reflect charges attributable to your insurance company's separate account. Inclusion of these charges would reduce the total returns shown.
D Total returns would have been lower had certain expenses not been reduced during the periods shown.
E Calculated based on average shares outstanding during the period.
F For the period December 22, 2004 (commencement of operations) to December 31, 2004.
G Expense ratios reflect operating expenses of the class. Expenses before reductions do not reflect amounts reimbursed by the investment adviser or reductions from brokerage service arrangements or other expense offset arrangements and do not represent the amount paid by the class during periods when reimbursements or reductions occur. Expense ratios before reductions for start-up periods may not be representative of longer-term operating periods. Expenses net of any voluntary waivers reflect expenses after reimbursement by the investment adviser but prior to reductions from brokerage service arrangements or other expense offset arrangements. Expenses net of all reductions represent the net expenses paid by the class.
H Amount represents less than $.01 per share.
Financial Highlights - Initial Class R
Year ended December 31, | 2004 F |
Selected Per-Share Data | |
Net asset value, beginning of period | $ 10.00 |
Income from Investment Operations | |
Net investment income (loss) E | - H |
Net realized and unrealized gain (loss) | .24 |
Total from investment operations | .24 |
Net asset value, end of period | $ 10.24 |
Total Return B, C, D | 2.40% |
Ratios to Average Net Assets G | |
Expenses before expense reductions | 43.27% A |
Expenses net of voluntary waivers, if any | 1.10% A |
Expenses net of all reductions | .92% A |
Net investment income (loss) | .80% A |
Supplemental Data | |
Net assets, end of period (000 omitted) | $ 307 |
Portfolio turnover rate | 52% A |
A Annualized
B Total returns for periods of less than one year are not annualized.
C Total returns do not reflect charges attributable to your insurance company's separate account. Inclusion of these charges would reduce the total returns shown.
D Total returns would have been lower had certain expenses not been reduced during the periods shown.
E Calculated based on average shares outstanding during the period.
F For the period December 22, 2004 (commencement of operations) to December 31, 2004.
G Expense ratios reflect operating expenses of the class. Expenses before reductions do not reflect amounts reimbursed by the investment adviser or reductions from brokerage service arrangements or other expense offset arrangements and do not represent the amount paid by the class during periods when reimbursements or reductions occur. Expense ratios before reductions for start-up periods may not be representative of longer-term operating periods. Expenses net of any voluntary waivers reflect expenses after reimbursement by the investment adviser but prior to reductions from brokerage service arrangements or other expense offset arrangements. Expenses net of all reductions represent the net expenses paid by the class.
H Amount represents less than $.01 per share.
See accompanying notes which are an integral part of the financial statements.
International Capital Appreciation Portfolio
Financial Highlights - Service Class R
Year ended December 31, | 2004 F |
Selected Per-Share Data | |
Net asset value, beginning of period | $ 10.00 |
Income from Investment Operations | |
Net investment income (loss) E | - H |
Net realized and unrealized gain (loss) | .24 |
Total from investment operations | .24 |
Net asset value, end of period | $ 10.24 |
Total Return B, C, D | 2.40% |
Ratios to Average Net Assets G | |
Expenses before expense reductions | 43.36% A |
Expenses net of voluntary waivers, if any | 1.20% A |
Expenses net of all reductions | 1.01% A |
Net investment income (loss) | .71% A |
Supplemental Data | |
Net assets, end of period (000 omitted) | $ 307 |
Portfolio turnover rate | 52% A |
A Annualized
B Total returns for periods of less than one year are not annualized.
C Total returns do not reflect charges attributable to your insurance company's separate account. Inclusion of these charges would reduce the total returns shown.
D Total returns would have been lower had certain expenses not been reduced during the periods shown.
E Calculated based on average shares outstanding during the period.
F For the period December 22, 2004 (commencement of operations) to December 31, 2004.
G Expense ratios reflect operating expenses of the class. Expenses before reductions do not reflect amounts reimbursed by the investment adviser or reductions from brokerage service arrangements or other expense offset arrangements and do not represent the amount paid by the class during periods when reimbursements or reductions occur. Expense ratios before reductions for start-up periods may not be representative of longer-term operating periods. Expenses net of any voluntary waivers reflect expenses after reimbursement by the investment adviser but prior to reductions from brokerage service arrangements or other expense offset arrangements. Expenses net of all reductions represent the net expenses paid by the class.
H Amount represents less than $.01 per share.
Financial Highlights - Service Class 2R
Year ended December 31, | 2004 F |
Selected Per-Share Data | |
Net asset value, beginning of period | $ 10.00 |
Income from Investment Operations | |
Net investment income (loss) E | - H |
Net realized and unrealized gain (loss) | .24 |
Total from investment operations | .24 |
Net asset value, end of period | $ 10.24 |
Total Return B, C, D | 2.40% |
Ratios to Average Net Assets G | |
Expenses before expense reductions | 43.51% A |
Expenses net of voluntary waivers, if any | 1.35% A |
Expenses net of all reductions | 1.17% A |
Net investment income (loss) | .55% A |
Supplemental Data | |
Net assets, end of period (000 omitted) | $ 410 |
Portfolio turnover rate | 52% A |
A Annualized
B Total returns for periods of less than one year are not annualized.
C Total returns do not reflect charges attributable to your insurance company's separate account. Inclusion of these charges would reduce the total returns shown.
D Total returns would have been lower had certain expenses not been reduced during the periods shown.
E Calculated based on average shares outstanding during the period.
F For the period December 22, 2004 (commencement of operations) to December 31, 2004.
G Expense ratios reflect operating expenses of the class. Expenses before reductions do not reflect amounts reimbursed by the investment adviser or reductions from brokerage service arrangements or other expense offset arrangements and do not represent the amount paid by the class during periods when reimbursements or reductions occur. Expense ratios before reductions for start-up periods may not be representative of longer-term operating periods. Expenses net of any voluntary waivers reflect expenses after reimbursement by the investment adviser but prior to reductions from brokerage service arrangements or other expense offset arrangements. Expenses net of all reductions represent the net expenses paid by the class.
H Amount represents less than $.01 per share.
See accompanying notes which are an integral part of the financial statements.
Annual Report
Notes to Financial Statements
For the period ended December 31, 2004
1. Significant Accounting Policies.
International Capital Appreciation Portfolio (the fund) is a fund of Variable Insurance Products Fund IV (the trust) (referred to in this report as Fidelity Variable Insurance Products: International Capital Appreciation Portfolio) and is authorized to issue an unlimited number of shares. The trust is registered under the Investment Company Act of 1940, as amended (the 1940 Act), as an open-end management investment company organized as a Massachusetts business trust. Shares of the fund may only be purchased by insurance companies for the purpose of funding variable annuity or variable life insurance contracts. The fund offers the following classes of shares: Initial Class shares, Service Class shares, Service Class 2 shares, Initial Class R shares, Service Class R shares and Service Class 2R shares. All classes have equal rights and voting privileges, except for matters affecting a single class. Investment income, realized and unrealized capital gains and losses, the common expenses of the fund, and certain fund-level expense reductions, if any, are allocated on a pro rata basis to each class based on the relative net assets of each class to the total net assets of the fund. Each class differs with respect to distribution and service plan fees incurred. Certain expense reductions also differ by class.
The financial statements have been prepared in conformity with accounting principles generally accepted in the United States of America, which require management to make certain estimates and assumptions at the date of the financial statements. The following summarizes the significant accounting policies of the fund:
Security Valuation. Net asset value per share (NAV calculation) is calculated as of the close of business of the New York Stock Exchange, normally 4:00 p.m. Eastern time. Equity securities, including restricted securities, for which market quotations are available are valued at the last sale price or official closing price (closing bid price or last evaluated quote if no sale has occurred) on the primary market or exchange on which they trade. If prices are not readily available or do not accurately reflect fair value for a security, or if a security's value has been materially affected by events occurring after the close of the exchange or market on which the security is principally traded, that security may be valued by another method that the Board of Trustees believes accurately reflects fair value. A security's valuation may differ depending on the method used for determining value. Price movements in futures contracts and ADRs, market and trading trends, the bid/ask quotes of brokers and off-exchange institutional trading may be reviewed in the course of making a good faith determination of a security's fair value. Short-term securities with remaining maturities of sixty days or less for which quotations are not readily available are valued on the basis of amortized cost. Investments in open-end investment companies are valued at their net asset value each business day.
Foreign Currency. The fund uses foreign currency contracts to facilitate transactions in foreign-denominated securities. Losses from these transactions may arise from changes in the value of the foreign currency or if the counterparties do not perform under the contracts' terms.
Foreign-denominated assets, including investment securities, and liabilities are translated into U.S. dollars at the exchange rate at period end. Purchases and sales of investment securities, income and dividends received and expenses denominated in foreign currencies are translated into U.S. dollars at the exchange rate in effect on the transaction date.
The effects of exchange rate fluctuations on investments are included with the net realized and unrealized gain (loss) on investment securities. Other foreign currency transactions resulting in realized and unrealized gain (loss) are disclosed separately.
Investment Transactions and Income. Security transactions are accounted for as of trade date. Gains and losses on securities sold are determined on the basis of identified cost. Dividend income is recorded on the ex-dividend date, except for certain dividends from foreign securities where the ex-dividend date may have passed, which are recorded as soon as the fund is informed of the ex-dividend date. Non-cash dividends included in dividend income, if any, are recorded at the fair market value of the securities received. Interest income is accrued as earned. Interest income includes coupon interest and amortization of premium and accretion of discount on debt securities. Investment income is recorded net of foreign taxes withheld where recovery of such taxes is uncertain.
Expenses. Most expenses of the trust can be directly attributed to a fund. Expenses which cannot be directly attributed are apportioned among the funds in the trust.
Income Tax Information and Distributions to Shareholders. Each year, the fund intends to qualify as a regulated investment company by distributing all of its taxable income and realized gains under Subchapter M of the Internal Revenue Code. As a result, no provision for income taxes is required in the accompanying financial statements. Foreign taxes are provided for based on the fund's understanding of the tax rules and rates that exist in the foreign markets in which it invests.
Distributions are recorded on the ex-dividend date. Income dividends and capital gain distributions are declared separately for each class. Income and capital gain distributions are determined in accordance with income tax regulations, which may differ from generally accepted accounting principles.
Capital accounts within the financial statements are adjusted for permanent book-tax differences. These adjustments have no impact on net assets or the results of operations. Temporary book-tax differences will reverse in a subsequent period.
Annual Report
Notes to Financial Statements - continued
1. Significant Accounting Policies - continued
Income Tax Information and Distributions to Shareholders - continued
The tax-basis components of distributable earnings and the federal tax cost as of period end were as follows:
Unrealized appreciation | $ 48,638 | |
Unrealized depreciation | (1,615) | |
Net unrealized appreciation (depreciation) | $ 47,023 | |
Undistributed ordinary income | 1,726 | |
| | |
Cost for federal income tax purposes | $ 2,083,261 | |
Trading (Redemption) Fees. Initial Class R shares, Service Class R shares and Service Class 2R shares held less than 60 days are subject to a redemption fee equal to 1% of the proceeds of the redeemed shares. All redemption fees, including any estimated redemption fees paid by Fidelity Management & Research Company (FMR), are retained by the fund and accounted for as an addition to paid in capital.
2. Operating Policies.
Repurchase Agreements. FMR has received an Exemptive Order from the Securities and Exchange Commission (the SEC) which permits the fund and other affiliated entities of FMR to transfer uninvested cash balances into joint trading accounts. These accounts are then invested in repurchase agreements that are collateralized by U.S. Treasury or Government obligations. The fund may also invest directly with institutions, in repurchase agreements that are collateralized by commercial paper obligations and corporate obligations. Collateral is held in segregated accounts with custodian banks and may be obtained in the event of a default of the counterparty. Collateral is marked-to-market daily and maintained at a value at least equal to the principal amount of the repurchase agreement (including accrued interest).
3. Purchases and Sales of Investments.
Purchases and sales of securities, other than short-term securities and U.S. government securities, aggregated $1,938,963 and $26,915, respectively.
4. Fees and Other Transactions with Affiliates.
Management Fee. FMR and its affiliates provide the fund with investment management related services for which the fund pays a monthly management fee. The management fee is the sum of an individual fund fee rate that is based on an annual rate of .45% of the fund's average net assets and a group fee rate that averaged .28% during the period. The group fee rate is based upon the average net assets of all the mutual funds advised by FMR. The group fee rate decreases as assets under management increase and increases as assets under management decrease. For the period, the total annualized management fee rate was .72% of the fund's average net assets.
Distribution and Service Plan. In accordance with Rule 12b-1 of the 1940 Act, the fund has adopted separate 12b-1 Plans for each Service Class of shares. Each Service Class pays Fidelity Distributors Corporation (FDC), an affiliate of FMR, a service fee. For the period, the service fee is based on an annual rate of .10% of Service Class' and Service Class R's average net assets and .25% of Service Class 2's and Service Class 2R's average net assets.
For the period, each class paid FDC the following amounts, all of which were re-allowed to insurance companies for the distribution of shares and providing shareholder support services:
Service Class | $ 8 | |
Service Class 2 | 27 | |
Service Class R | 8 | |
Service Class 2R | 27 | |
| $ 70 | |
International Capital Appreciation Portfolio
4. Fees and Other Transactions with Affiliates - continued
Transfer Agent Fees. Fidelity Investments Institutional Operations Company, Inc. (FIIOC), an affiliate of FMR, is the fund's transfer, dividend disbursing, and shareholder servicing agent. FIIOC receives an asset-based fee with respect to each account. FIIOC pays a portion of the expenses related to the typesetting, printing and mailing of shareholder reports, except proxy statements. Each class pays a transfer agent fee, excluding out of pocket expenses, equal to an annual rate of .07% of their month end net assets. For the period, the total transfer agent fees paid by each class to FIIOC, including out of pocket expenses, were as follows:
Initial Class | $ 5 | |
Service Class | 5 | |
Service Class 2 | 7 | |
Initial Class R | 5 | |
Service Class R | 5 | |
Service Class 2R | 7 | |
| $ 34 | |
Accounting Fees. Fidelity Service Company, Inc. (FSC), an affiliate of FMR, maintains the fund's accounting records. The fee is based on the level of average net assets for the month.
Brokerage Commissions. The fund placed a portion of its portfolio transactions with brokerage firms which are affiliates of the investment adviser. The commissions paid to these affiliated firms were $4 for the period.
5. Committed Line of Credit.
The fund participates with other funds managed by FMR in a $4.2 billion credit facility (the "line of credit") to be utilized for temporary or emergency purposes to fund shareholder redemptions or for other short-term liquidity purposes. The fund has agreed to pay commitment fees on its pro rata portion of the line of credit. During the period, there were no borrowings on this line of credit.
6. Expense Reductions.
FMR voluntarily agreed to reimburse each class to the extent annual operating expenses exceeded certain levels of average net assets as noted in the table below. Some expenses, for example interest expense, are excluded from this reimbursement.
| Expense
Limitations | Reimbursement
from adviser |
Initial Class | 1.10% | $ 3,564 |
Service Class | 1.20% | 3,564 |
Service Class 2 | 1.35% | 4,751 |
Initial Class R | 1.10% | 3,564 |
Service Class R | 1.20% | 3,564 |
Service Class 2R | 1.35% | 4,751 |
| | $ 23,758 |
Many of the brokers with whom FMR places trades on behalf of the fund provided services to the fund in addition to trade execution. These services included payments of certain expenses on behalf of the fund totaling $104 for the period.
7. Other Information.
At the end of the period, FMR or its affiliates were the owners of record of 100% of the total outstanding shares of the fund.
Annual Report
Report of Independent Registered Public Accounting Firm
To the Trustees of Variable Insurance Products Fund IV and the Shareholders of International Capital Appreciation Portfolio:
In our opinion, the accompanying statement of assets and liabilities, including the schedule of investments, and the related statements of operations and of changes in net assets and the financial highlights present fairly, in all material respects, the financial position of International Capital Appreciation Portfolio (a fund of Variable Insurance Products Fund IV) at December 31, 2004 and the results of its operations, the changes in its net assets and the financial highlights for the period indicated, in conformity with accounting principles generally accepted in the United States of America. These financial statements and financial highlights (hereafter referred to as "financial statements") are the responsibility of the International Capital Appreciation Portfolio's management; our responsibility is to express an opinion on these financial statements based on our audit. We conducted our audit of these financial statements in accordance with the standards of the Public Company Accounting Oversight Board (United States). Those standards require that we plan and perform the audit to obtain reasonable assurance about whether the financial statements are free of material misstatement. An audit includes examining, on a test basis, evidence supporting the amounts and disclosures in the financial statements, assessing the accounting principles used and significant estimates made by management, and evaluating the overall financial statement presentation. We believe that our audit, which included confirmation of securities at December 31, 2004 by correspondence with the custodian and brokers, provide a reasonable basis for our opinion.
/s/PricewaterhouseCoopers LLP
PricewaterhouseCoopers LLP
Boston, Massachusetts
February 18, 2005
Annual Report
Trustees and Officers
The Trustees, Member of the Advisory Board, and executive officers of the trust and fund, as applicable, are listed below. The Board of Trustees governs the fund and is responsible for protecting the interests of shareholders. The Trustees are experienced executives who meet periodically throughout the year to oversee the fund's activities, review contractual arrangements with companies that provide services to the fund, and review the fund's performance. Except for William O. McCoy, Dennis J. Dirks, and Kenneth L. Wolfe, each of the Trustees oversees 301 funds advised by FMR or an affiliate. Mr. McCoy oversees 303 funds advised by FMR or an affiliate. Mr. Dirks and Mr. Wolfe oversee 233 funds advised by FMR or an affiliate.
The Trustees hold office without limit in time except that (a) any Trustee may resign; (b) any Trustee may be removed by written instrument, signed by at least two-thirds of the number of Trustees prior to such removal; (c) any Trustee who requests to be retired or who has become incapacitated by illness or injury may be retired by written instrument signed by a majority of the other Trustees; and (d) any Trustee may be removed at any special meeting of shareholders by a two-thirds vote of the outstanding voting securities of the trust. In any event, each non-interested Trustee shall retire not later than the last day of the calendar year in which his or her 72nd birthday occurs. The executive officers and Advisory Board Member hold office without limit in time, except that any officer and Advisory Board Member may resign or may be removed by a vote of a majority of the Trustees at any regular meeting or any special meeting of the Trustees. Except as indicated, each individual has held the office shown or other offices in the same company for the past five years.
The fund's Statement of Additional Information (SAI) includes more information about the Trustees. To request a free copy, call Fidelity at 1-800-544-5429.
Interested Trustees*:
Correspondence intended for each Trustee who is an "interested person" (as defined in the 1940 Act) may be sent to Fidelity Investments, 82 Devonshire Street, Boston, Massachusetts 02109.
Name, Age; Principal Occupation |
Edward C. Johnson 3d (74)** |
| Year of Election or Appointment: 1983 Mr. Johnson is Chairman of the Board of Trustees. Mr. Johnson serves as Chief Executive Officer, Chairman, and a Director of FMR Corp.; a Director and Chairman of the Board and of the Executive Committee of FMR; Chairman and a Director of Fidelity Management & Research (Far East) Inc.; Chairman (1998) and a Director of Fidelity Investments Money Management, Inc.; and Chairman (2001) and a Director (2000) of FMR Co., Inc. |
Abigail P. Johnson (43)** |
| Year of Election or Appointment: 2001 Senior Vice President of VIP International Capital Appreciation (2004). Ms. Johnson also serves as Senior Vice President of other Fidelity funds (2001). She is President and a Director of FMR (2001), Fidelity Investments Money Management, Inc. (2001), FMR Co., Inc. (2001), and a Director of FMR Corp. Previously, Ms. Johnson managed a number of Fidelity funds. |
Laura B. Cronin (50) |
| Year of Election or Appointment: 2003 Ms. Cronin is an Executive Vice President (2002) and Chief Financial Officer (2002) of FMR Corp. and is a member of the Fidelity Management Committee (2003). Previously, Ms. Cronin served as Vice President of Finance of FMR (1997-1999), and Chief Financial Officer of FMR (1999-2001), Fidelity Personal Investments (2001), and Fidelity Brokerage Company (2001-2002). |
Robert L. Reynolds (52) |
| Year of Election or Appointment: 2003 Mr. Reynolds is a Director (2003) and Chief Operating Officer (2002) of FMR Corp. and is the head of the Fidelity Management Committee (2003). He also serves on the Board at Fidelity Investments Canada, Ltd. (2000). Previously, Mr. Reynolds served as President of Fidelity Investments Institutional Retirement Group (1996-2000). |
* Trustees have been determined to be "Interested Trustees" by virtue of, among other things, their affiliation with the trust or various entities under common control with FMR.
** Edward C. Johnson 3d, Trustee, is Abigail P. Johnson's father.
Annual Report
Non-Interested Trustees:
Correspondence intended for each non-interested Trustee (that is, the Trustees other than the Interested Trustees) may be sent to Fidelity Investments, P.O. Box 55235, Boston, Massachusetts 02205-5235.
Name, Age; Principal Occupation |
Dennis J. Dirks (56) |
| Year of Election or Appointment: 2005 Mr. Dirks also serves as a Trustee (2005) or Member of the Advisory Board (2004) of other investment companies advised by FMR. Prior to his retirement in May 2003, Mr. Dirks was Chief Operating Officer and a member of the Board of The Depository Trust & Clearing Corporation (DTCC) (1999-2003). He also served as President, Chief Operating Officer, and Board member of The Depository Trust Company (DTC) (1999-2003) and President and Board member of the National Securities Clearing Corporation (NSCC) (1999-2003). In addition, Mr. Dirks served as Chief Executive Officer and Board member of the Government Securities Clearing Corporation (2001-2003) and Chief Executive Officer and Board member of the Mortgage-Backed Securities Clearing Corporation (2001-2003). |
Robert M. Gates (61) |
| Year of Election or Appointment: 1997 Dr. Gates is Vice Chairman of the non-interested Trustees (2005). Dr. Gates is President of Texas A&M University (2002). He was Director of the Central Intelligence Agency (CIA) from 1991 to 1993. From 1989 to 1991, Dr. Gates served as Assistant to the President of the United States and Deputy National Security Advisor. Dr. Gates is a Director of NACCO Industries, Inc. (mining and manufacturing), Parker Drilling Co., Inc. (drilling and rental tools for the energy industry, 2001), and Brinker International (restaurant management, 2003). He also serves as a member of the Advisory Board of VoteHere.net (secure Internet voting, 2001). Previously, Dr. Gates served as a Director of LucasVarity PLC (automotive components and diesel engines), a Director of TRW Inc. (automotive, space, defense, and information technology), and Dean of the George Bush School of Government and Public Service at Texas A&M University (1999-2001). Dr. Gates also is a Trustee of the Forum for International Policy. |
George H. Heilmeier (68) |
| Year of Election or Appointment: 2004 Dr. Heilmeier is Chairman Emeritus of Telcordia Technologies (communication software and systems), where prior to his retirement, he served as company Chairman and Chief Executive Officer. He currently serves on the Boards of Directors of The Mitre Corporation (systems engineering and information technology support for the government), INET Technologies Inc. (telecommunications network surveillance, 2001), Teletech Holdings (customer management services), and HRL Laboratories (private research and development, 2004). He is Chairman of the General Motors Technology Advisory Committee and a Life Fellow of the Institute of Electrical and Electronics Engineers (IEEE) (2000). Dr. Heilmeier is a member of the Defense Science Board and the National Security Agency Advisory Board. He is also a member of the National Academy of Engineering, the American Academy of Arts and Sciences, and the Board of Overseers of the School of Engineering and Applied Science of the University of Pennsylvania. Previously, Dr. Heilmeier served as a Director of TRW Inc. (automotive, space, defense, and information technology, 1992-2002), Compaq (1994-2002), and Automatic Data Processing, Inc. (ADP) (technology-based business outsourcing, 1995-2002). |
Marie L. Knowles (58) |
| Year of Election or Appointment: 2001 Prior to Ms. Knowles' retirement in June 2000, she served as Executive Vice President and Chief Financial Officer of Atlantic Richfield Company (ARCO) (diversified energy, 1996-2000). From 1993 to 1996, she was a Senior Vice President of ARCO and President of ARCO Transportation Company. She served as a Director of ARCO from 1996 to 1998. She currently serves as a Director of Phelps Dodge Corporation (copper mining and manufacturing) and McKesson Corporation (healthcare service, 2002). Ms. Knowles is a Trustee of the Brookings Institution and the Catalina Island Conservancy and also serves as a member of the Advisory Board for the School of Engineering of the University of Southern California. |
Ned C. Lautenbach (60) |
| Year of Election or Appointment: 2000 Mr. Lautenbach has been a partner of Clayton, Dubilier & Rice, Inc. (private equity investment firm) since September 1998. Previously, Mr. Lautenbach was with the International Business Machines Corporation (IBM) from 1968 until his retirement in 1998. He was most recently Senior Vice President and Group Executive of Worldwide Sales and Services. From 1993 to 1995, he was Chairman of IBM World Trade Corporation, and from 1994 to 1998 was a member of IBM's Corporate Executive Committee. Mr. Lautenbach serves as Co-Chairman and a Director of Covansys, Inc. (global provider of business and technology solutions, 2000). In addition, he is a Director of Italtel Holding S.p.A. (telecommunications (Milan, Italy), 2004) and Eaton Corporation (diversified industrial) as well as the Philharmonic Center for the Arts in Naples, Florida (1999). He also is a member of the Council on Foreign Relations. |
Marvin L. Mann (71) |
| Year of Election or Appointment: 1993 Mr. Mann is Chairman of the non-interested Trustees (2001). He is Chairman Emeritus of Lexmark International, Inc. (computer peripherals), where he served as CEO until April 1998, retired as Chairman May 1999, and remains a member of the Board. Prior to 1991, he held the positions of Vice President of International Business Machines Corporation (IBM) and President and General Manager of various IBM divisions and subsidiaries. He is a member of the Executive Committee of the Independent Director's Council of the Investment Company Institute. In addition, Mr. Mann is a member of the President's Cabinet at the University of Alabama and the Board of Visitors of the Culverhouse College of Commerce and Business Administration at the University of Alabama. |
William O. McCoy (71) |
| Year of Election or Appointment: 1997 Prior to his retirement in December 1994, Mr. McCoy was Vice Chairman of the Board of BellSouth Corporation (telecommunications) and President of BellSouth Enterprises. He is currently a Director of Liberty Corporation (holding company), Duke Realty Corporation (real estate), and Progress Energy, Inc. (electric utility). He is also a partner of Franklin Street Partners (private investment management firm) and a member of the Research Triangle Foundation Board. In addition, Mr. McCoy served as the Interim Chancellor (1999-2000) and a member of the Board of Visitors (1994-1998) for the University of North Carolina at Chapel Hill and currently serves on the Board of Directors of the University of North Carolina Health Care System and the Board of Visitors of the Kenan-Flagler Business School (University of North Carolina at Chapel Hill). He also served as Vice President of Finance for the University of North Carolina (16-school system, 1995-1998). |
Cornelia M. Small (60) |
| Year of Election or Appointment: 2005 Ms. Small is a member (2000) and Chairperson (2002) of the Investment Committee, and a member (2002) of the Board of Trustees of Smith College. Previously, she served as Chief Investment Officer (1999-2000), Director of Global Equity Investments (1996-1999), and a member of the Board of Directors of Scudder, Stevens & Clark (1990-1997) and Scudder Kemper Investments (1997-1998). In addition, Ms. Small served as Co-Chair (2000-2003) of the Annual Fund for the Fletcher School of Law and Diplomacy. |
William S. Stavropoulos (65) |
| Year of Election or Appointment: 2002 Mr. Stavropoulos is Chairman of the Board (2000), CEO (2002), a position he previously held from 1995-2000, Chairman of the Executive Committee (2000), and a Member of the Board of Directors of The Dow Chemical Company. Since joining The Dow Chemical Company in 1967, Mr. Stavropoulos served in numerous senior management positions, including President (1993-2000; 2002-2003). Currently, he is a Director of NCR Corporation (data warehousing and technology solutions), BellSouth Corporation (telecommunications), Chemical Financial Corporation, and Maersk Inc. (industrial conglomerate, 2002). He also serves as a member of the Board of Trustees of the American Enterprise Institute for Public Policy Research. In addition, Mr. Stavropoulos is a member of The Business Council, J.P. Morgan International Council and the University of Notre Dame Advisory Council for the College of Science. |
Kenneth L. Wolfe (65) |
| Year of Election or Appointment: 2005 Mr. Wolfe also serves as a Trustee (2005) or Member of the Advisory Board (2004) of other investment companies advised by FMR. Prior to his retirement in 2001, Mr. Wolfe was Chairman and Chief Executive Officer of Hershey Foods Corporation (1993-2001). He currently serves as a member of the boards of Adelphia Communications Corporation (2003), Bausch & Lomb, Inc., and Revlon Inc. (2004). |
Advisory Board Member and Executive Officers:
Correspondence intended for each executive officer and Mr. Lynch may be sent to Fidelity Investments, 82 Devonshire Street, Boston, Massachusetts 02109.
Name, Age; Principal Occupation |
Peter S. Lynch (61) |
| Year of Election or Appointment: 2003 Member of the Advisory Board of Variable Insurance Products Fund IV. Vice Chairman and a Director of FMR, and Vice Chairman (2001) and a Director (2000) of FMR Co., Inc. Previously, Mr. Lynch served as a Trustee of the Fidelity funds (1990-2003). Prior to May 31, 1990, he was a Director of FMR and Executive Vice President of FMR (a position he held until March 31, 1991), Vice President of Fidelity® Magellan® Fund and FMR Growth Group Leader, and Managing Director of FMR Corp. Mr. Lynch was also Vice President of Fidelity Investments Corporate Services. In addition, he serves as a Trustee of Boston College, Massachusetts Eye & Ear Infirmary, Historic Deerfield, John F. Kennedy Library, and the Museum of Fine Arts of Boston. |
Philip L. Bullen (45) |
| Year of Election or Appointment: 2004 Vice President of VIP International Capital Appreciation. Mr. Bullen also serves as Vice President of certain Equity Funds (2001) and certain High Income Funds (2001). He is Senior Vice President of FMR (2001) and FMR Co., Inc. (2001), President and a Director of Fidelity Management & Research (Far East) Inc. (2001), President and a Director of Fidelity Management & Research (U.K.) Inc. (2002), and a Director of Strategic Advisers, Inc. (2002). Before joining Fidelity Investments, Mr. Bullen was President and Chief Investment Officer of Santander Global Advisors (1997-2000) and President and Chief Executive Officer of Boston's Baring Asset Management Inc. (1994-1997). |
Kevin R. McCarey (44) |
| Year of Election or Appointment: 2004 Vice President of VIP International Capital Appreciation. Mr. McCarey also serves as Vice President of other funds advised by FMR. Prior to assuming his current responsibilities, Mr. McCarey managed a variety of Fidelity funds. Mr. McCarey also serves as Vice President of FMR and FMR Co., Inc. (2001). |
Eric D. Roiter (56) |
| Year of Election or Appointment: 2004 Secretary of VIP International Capital Appreciation. He also serves as Secretary of other Fidelity funds; Vice President, General Counsel, and Secretary of FMR Co., Inc. (2001-present) and FMR; Vice President and Secretary of FDC; Assistant Secretary of Fidelity Management & Research (U.K.) Inc. (2001-present), Fidelity Management & Research (Far East) Inc. (2001-present), and Fidelity Investments Money Management, Inc. (2001-present). Mr. Roiter is an Adjunct Member, Faculty of Law, at Boston College Law School (2003-present). |
Stuart Fross (45) |
| Year of Election or Appointment: 2004 Assistant Secretary of VIP International Capital Appreciation. Mr. Fross also serves as Assistant Secretary of other Fidelity funds (2003) and is an employee of FMR. |
Christine Reynolds (46) |
| Year of Election or Appointment: 2004 President, Treasurer, and Anti-Money Laundering (AML) officer of VIP International Capital Appreciation. Ms. Reynolds also serves as President, Treasurer, and AML officer of other Fidelity funds (2004) and is a Vice President (2003) and an employee (2002) of FMR. Before joining Fidelity Investments, Ms. Reynolds worked at PricewaterhouseCoopers LLP (PwC) (1980-2002), where she was most recently an audit partner with PwC's investment management practice. |
Timothy F. Hayes (54) |
| Year of Election or Appointment: 2004 Chief Financial Officer of VIP International Capital Appreciation. Mr. Hayes also serves as Chief Financial Officer of other Fidelity funds (2002). Recently he was appointed President of Fidelity Service Company (2003) where he also serves as a Director. Mr. Hayes also serves as President of Fidelity Investments Operations Group (FIOG, 2002), which includes Fidelity Pricing and Cash Management Services Group (FPCMS), where he was appointed President in 1998. Previously, Mr. Hayes served as Chief Financial Officer of Fidelity Investments Corporate Systems and Service Group (1998) and Fidelity Systems Company (1997-1998). |
Kenneth A. Rathgeber (57) |
| Year of Election or Appointment: 2004 Chief Compliance Officer of VIP International Capital Appreciation. Mr. Rathgeber also serves as Chief Compliance Officer of other Fidelity funds (2004) and Executive Vice President of Risk Oversight for Fidelity Investments (2002). Previously, he served as Executive Vice President and Chief Operating Officer for Fidelity Investments Institutional Services Company, Inc. (1998-2002). |
John R. Hebble (46) |
| Year of Election or Appointment: 2004 Deputy Treasurer of VIP International Capital Appreciation. Mr. Hebble also serves as Deputy Treasurer of other Fidelity funds (2003), and is an employee of FMR. Before joining Fidelity Investments, Mr. Hebble worked at Deutsche Asset Management where he served as Director of Fund Accounting (2002-2003) and Assistant Treasurer of the Scudder Funds (1998-2003). |
Kimberley H. Monasterio (41) |
| Year of Election or Appointment: 2004 Deputy Treasurer of VIP International Capital Appreciation. Ms. Monasterio also serves as Deputy Treasurer of other Fidelity funds (2004) and is an employee of FMR (2004). Before joining Fidelity Investments, Ms. Monasterio served as Treasurer (2000-2004) and Chief Financial Officer (2002-2004) of the Franklin Templeton Funds and Senior Vice President of Franklin Templeton Services, LLC (2000-2004). |
John H. Costello (58) |
| Year of Election or Appointment: 2004 Assistant Treasurer of VIP International Capital Appreciation. Mr. Costello also serves as Assistant Treasurer of other Fidelity funds and is an employee of FMR. |
Peter L. Lydecker (50) |
| Year of Election or Appointment: 2004 Assistant Treasurer of VIP International Capital Appreciation. Mr. Lydecker also serves as Assistant Treasurer of other Fidelity funds (2004) and is an employee of FMR. |
Mark Osterheld (49) |
| Year of Election or Appointment: 2004 Assistant Treasurer of VIP International Capital Appreciation. Mr. Osterheld also serves as Assistant Treasurer of other Fidelity funds (2002) and is an employee of FMR. |
Kenneth B. Robins (35) |
| Year of Election or Appointment: 2004 Assistant Treasurer of VIP International Capital Appreciation. Mr. Robins also serves as Assistant Treasurer of other Fidelity funds (2004) and is an employee of FMR (2004). Before joining Fidelity Investments, Mr. Robins worked at KPMG LLP, where he was a partner in KPMG's department of professional practice (2002-2004) and a Senior Manager (1999-2000). In addition, Mr. Robins served as Assistant Chief Accountant, United States Securities and Exchange Commission (2000-2002). |
Annual Report
Distributions
The Board of Trustees of Variable Insurance Products: International Capital Appreciation Portfolio voted to pay to shareholders of record at the opening of business on record date, the following distributions per share derived from capital gains realized from sales of portfolio securities:
Fund | Pay Date | Record Date | Capital Gains |
Initial Class | 2/11/05 | 2/11/05 | $.01 |
Service Class | 2/11/05 | 2/11/05 | $.01 |
Service Class 2 | 2/11/05 | 2/11/05 | $.01 |
The fund will notify shareholders in January 2005 of amounts for use in preparing 2004 income tax returns.
Annual Report
Annual Report
Investment Adviser
Fidelity Management & Research Company
Boston, MA
Investment Sub-Advisers
FMR Co., Inc.
Fidelity Management & Research (U.K.) Inc.
Fidelity Management & Research (Far East) Inc.
Fidelity Investments Money Management, Inc.
Fidelity Investments Japan Limited
General Distributor
Fidelity Distributors Corporation
Boston, MA
Transfer and Shareholder Servicing Agent
Fidelity Investments Institutional Operations Company, Inc.
Boston, MA
Custodian
Brown Brothers Harriman & Co.
Boston, MA
VIPCAP-ANN-0205
1.811843.100
Fidelity® Variable Insurance Products:
International Capital Appreciation Portfolio -
Service Class R
Annual Report
December 31, 2004
(2_fidelity_logos) (Registered_Trademark)
Contents
Performance | 3 | How the fund has done over time. |
Shareholder Expense Example | 4 | An example of shareholder expenses. |
Investment Summary | 5 | A summary of the fund's investments at period end. |
Investments | 6 | A complete list of the fund's investments with their
market values. |
Financial Statements | 8 | Statements of assets and liabilities, operations, and
changes in net assets, as well as financial highlights. |
Notes | 13 | Notes to the financial statements. |
Report of Independent Registered Public Accounting Firm | 16 | |
Trustees and Officers | 17 | |
Distributions | 22 | |
| | |
To view a fund's proxy voting guidelines and proxy voting record for the 12-month period ended June 30, visit www.fidelity.com/proxyvotingresults or visit the Securities and Exchange Commission's (SEC) web site at www.sec.gov. You may also call 1-800-544-5429 to request a free copy of the proxy voting guidelines.
Fidelity Variable Insurance Products are separate account options which are purchased through a variable insurance contract.
Standard & Poor's, S&P and S&P 500 are registered service marks of The McGraw-Hill Companies, Inc. and have been licensed for use by Fidelity Distributors Corporation.
Other third party marks appearing herein are the property of their respective owners.
All other marks appearing herein are registered or unregistered trademarks or service marks of FMR Corp. or an affiliated company.
(Recycle graphic) This report is printed on recycled paper using soy-based inks.
This report and the financial statements contained herein are submitted for the general information of the shareholders of the fund. This report is not authorized for distribution to prospective investors in the fund unless preceded or accompanied by an effective prospectus.
A fund files its complete schedule of portfolio holdings with the SEC for the first and third quarters of each fiscal year on Form N-Q. Forms N-Q are available on the SEC's web site at http://www.sec.gov. A fund's Forms N-Q may be reviewed and copied at the SEC's Public Reference Room in Washington, DC. Information regarding the operation of the SEC's Public Reference Room may be obtained by calling 1-800-SEC-0330. For a complete list of a fund's portfolio holdings, view the most recent quarterly holdings report, semiannual report, or annual report on Fidelity's web site at http://www.advisor.fidelity.com.
NOT FDIC INSURED · MAY LOSE VALUE · NO BANK GUARANTEE
Neither the fund nor Fidelity Distributors Corporation is a bank.
International Capital Appreciation Portfolio
Fidelity Variable Insurance Products: International Capital Appreciation Portfolio
Performance: The Bottom Line
Performance
Average annual total return reflects the change in the value of an investment, assuming reinvestment of the class' dividend income and capital gains (the profits earned upon the sale of securities that have grown in value) and assuming a constant rate of performance each year. How a fund did yesterday is no guarantee of how it will do tomorrow.
Average annual total returns take Fidelity® Variable Insurance Products: International Capital Appreciation Portfolio's cumulative total return and show you what would have happened if Fidelity Variable Insurance Products: International Capital Appreciation Portfolio shares had performed at a constant rate each year. These numbers will be reported once the fund is a year old. In addition, the growth of the hypothetical $10,000 investment in the fund will appear in the fund's next annual report.
Annual Report
Fidelity Variable Insurance Products: International Capital Appreciation Portfolio
Shareholder Expense Example
As a shareholder of the Fund, you incur two types of costs: (1) transaction costs, including redemption fees, and (2) ongoing costs, including management fees, distribution and/or service (12b-1) fees and other Fund expenses. This Example is intended to help you understand your ongoing costs (in dollars) of investing in the Fund and to compare these costs with the ongoing costs of investing in other mutual funds.
The actual expense Example is based on an investment of $1,000 invested at the beginning of the period and held for the entire period (December 22, 2004 to December 31, 2004). The hypothetical expense Example is based on an investment of $1,000 invested for the one half year period (July 1, 2004 to December 31, 2004).
Actual Expenses
The first line of the table below for each class of the Fund provides information about actual account values and actual expenses. You may use the information in this line, together with the amount you invested, to estimate the expenses that you paid over the period. Simply divide your account value by $1,000.00 (for example, an $8,600 account value divided by $1,000.00 = 8.6), then multiply the result by the number in the first line for a class of the Fund under the heading entitled "Expenses Paid During Period" to estimate the expenses you paid on your account during this period. The estimate of expenses does not include any fees or other expenses of any variable annuity or variable life insurance product. If they were, the estimate of expenses you paid during the period would be higher, and your ending account value would be lower.
Hypothetical Example for Comparison Purposes
The second line of the table below for each class of the Fund provides information about hypothetical account values and hypothetical expenses based on a Class' actual expense ratio and an assumed rate of return of 5% per year before expenses, which is not the Class' actual return. The hypothetical account values and expenses may not be used to estimate the actual ending account balance or expenses you paid for the period. You may use this information to compare the ongoing costs of investing in the Fund and other funds. To do so, compare this 5% hypothetical example with the 5% hypothetical examples that appear in the shareholder reports of the other funds. The estimate of expenses does not include any fees or other expenses of any variable annuity or variable life insurance product. If they were, the estimate of expenses you paid during the period would be higher, and your ending account value would be lower.
Please note that the expenses shown in the table are meant to highlight your ongoing costs only and do not reflect any transaction costs. Therefore, the second line of the table is useful in comparing ongoing costs only, and will not help you determine the relative total costs of owning different funds. In addition, if these transactional costs were included, your costs would have been higher.
| Beginning
Account Value | Ending
Account Value
December 31, 2004 | Expenses Paid
During Period |
Initial Class | | | |
Actual | $ 1,000.00 | $ 1,024.00 | $ .30B |
Hypothetical A | $ 1,000.00 | $ 1,019.61 | $ 5.58C |
Service Class | | | |
Actual | $ 1,000.00 | $ 1,024.00 | $ .33B |
Hypothetical A | $ 1,000.00 | $ 1,019.10 | $ 6.09C |
Service Class 2 | | | |
Actual | $ 1,000.00 | $ 1,024.00 | $ .37B |
Hypothetical A | $ 1,000.00 | $ 1,018.35 | $ 6.85C |
Initial Class R | | | |
Actual | $ 1,000.00 | $ 1,024.00 | $ .30B |
Hypothetical A | $ 1,000.00 | $ 1,019.61 | $ 5.58C |
Service Class R | | | |
Actual | $ 1,000.00 | $ 1,024.00 | $ .33B |
Hypothetical A | $ 1,000.00 | $ 1,019.10 | $ 6.09C |
Service Class 2R | | | |
Actual | $ 1,000.00 | $ 1,024.00 | $ .37B |
Hypothetical A | $ 1,000.00 | $ 1,018.35 | $ 6.85C |
A 5% return per year before expenses
B Actual expenses are equal to each Class' annualized expense ratio (shown in the table below); multiplied by the average account value over the period, multiplied by 10/366 (to reflect the period December 22, 2004 to December 31, 2004).
C Hypothetical expenses are equal to each Class' annualized expense ratio (shown in the table below); multiplied by the average account
value over the period, multiplied by 184/366 (to reflect the one-half year period).
| Annualized
Expense Ratio |
Initial Class | 1.10% |
Service Class | 1.20% |
Service Class 2 | 1.35% |
Initial Class R | 1.10% |
Service Class R | 1.20% |
Service Class 2R | 1.35% |
Annual Report
Fidelity Variable Insurance Products: International Capital Appreciation Portfolio
Investment Summary
Top Five Stocks as of December 31, 2004 |
| % of fund's
net assets |
Alcatel SA (RFD) (France) | 4.1 |
Vodafone Group PLC (United Kingdom) | 3.9 |
Actelion Ltd. (Reg.) (Switzerland) | 3.5 |
ASML Holding NV (NY Shares) (Netherlands) | 3.3 |
UBS AG (Reg.) (Switzerland) | 3.2 |
| 18.0 |
Top Five Market Sectors as of December 31, 2004 |
| % of fund's
net assets |
Financials | 22.5 |
Consumer Discretionary | 14.8 |
Information Technology | 12.8 |
Health Care | 12.5 |
Telecommunication Services | 8.2 |
Top Five Countries as of December 31, 2004 |
(excluding cash equivalents) | % of fund's
net assets |
Switzerland | 15.1 |
Japan | 14.2 |
France | 12.5 |
United Kingdom | 11.9 |
Germany | 7.0 |
Annual Report
Fidelity Variable Insurance Products: International Capital Appreciation Portfolio
Investments December 31, 2004
Showing Percentage of Net Assets
Common Stocks - 95.7% |
| Shares | | Value (Note 1) |
Australia - 2.1% |
CSL Ltd. | 1,900 | | $ 43,482 |
Bahamas (Nassau) - 0.6% |
Kerzner International Ltd. (a) | 200 | | 12,010 |
Bermuda - 0.5% |
GOME Electrical Appliances Holdings Ltd. (a) | 10,000 | | 9,070 |
Brazil - 3.9% |
Aracruz Celulose SA sponsored ADR | 1,500 | | 56,550 |
Votorantim Celulose e Papel SA sponsored ADR (non-vtg.) | 1,400 | | 22,680 |
TOTAL BRAZIL | | 79,230 |
Canada - 3.1% |
Canadian Natural Resources Ltd. | 700 | | 29,896 |
EnCana Corp. | 600 | | 34,200 |
TOTAL CANADA | | 64,096 |
China - 1.6% |
Global Bio-Chem Technology Group Co. Ltd. | 20,000 | | 13,123 |
People's Food Holdings Ltd. | 16,000 | | 14,705 |
Weichai Power Co. Ltd. (H Shares) | 2,000 | | 5,545 |
TOTAL CHINA | | 33,373 |
Denmark - 2.1% |
Novo Nordisk AS Series B | 800 | | 43,629 |
France - 12.5% |
Alcatel SA (RFD) (a) | 5,400 | | 84,400 |
Pernod-Ricard | 300 | | 45,865 |
Societe Generale Series A | 400 | | 40,398 |
Technip-Coflexip SA | 100 | | 18,449 |
Thomson SA | 900 | | 23,746 |
Total SA Series B | 200 | | 43,936 |
TOTAL FRANCE | | 256,794 |
Germany - 7.0% |
Allianz AG (Reg.) | 100 | | 13,290 |
Deutsche Telekom AG (Reg.) (a) | 2,300 | | 52,164 |
HeidelbergCement AG | 603 | | 36,237 |
Siemens AG (Reg.) | 500 | | 42,335 |
TOTAL GERMANY | | 144,026 |
Hong Kong - 3.5% |
China Merchants Holdings International Co. Ltd. | 6,000 | | 11,309 |
Johnson Electric Holdings Ltd. | 14,000 | | 13,599 |
Li & Fung Ltd. | 6,000 | | 10,112 |
Techtronic Industries Co. Ltd. | 17,000 | | 37,072 |
TOTAL HONG KONG | | 72,092 |
India - 2.8% |
Bank of Baroda | 4,200 | | 23,655 |
|
| Shares | | Value (Note 1) |
State Bank of India | 700 | | $ 11,445 |
Zee Telefilms Ltd. | 5,600 | | 22,212 |
TOTAL INDIA | | 57,312 |
Italy - 3.1% |
Banca Intesa Spa | 5,100 | | 24,491 |
e.Biscom Spa (a) | 200 | | 11,520 |
ENI Spa | 1,100 | | 27,685 |
TOTAL ITALY | | 63,696 |
Japan - 14.2% |
Aisin Seiki Co. Ltd. | 500 | | 12,667 |
Aruze Corp. | 200 | | 5,096 |
Fast Retailing Co. Ltd. | 200 | | 15,230 |
Fuji Photo Film Co. Ltd. | 700 | | 25,886 |
Honda Motor Co. Ltd. | 400 | | 20,848 |
Hoya Corp. | 100 | | 11,296 |
JAFCO Co. Ltd. | 300 | | 20,385 |
Matsui Securities Co. Ltd. | 300 | | 10,456 |
Mitsui Trust Holdings, Inc. | 1,000 | | 9,997 |
Mizuho Financial Group, Inc. | 8 | | 40,301 |
Nomura Holdings, Inc. | 1,000 | | 14,560 |
SFCG Co. Ltd. | 70 | | 17,700 |
SKY Perfect Communications, Inc. | 8 | | 8,669 |
Softbank Corp. | 500 | | 24,358 |
Sumitomo Mitsui Financial Group, Inc. | 6 | | 43,640 |
Tv Asahi Corp. | 5 | | 10,153 |
TOTAL JAPAN | | 291,242 |
Korea (South) - 0.1% |
Korea Exchange Bank (a) | 310 | | 2,575 |
Netherlands - 5.8% |
ASML Holding NV (a) | 1,500 | | 23,865 |
ASML Holding NV (NY Shares) (a) | 4,300 | | 68,413 |
ING Groep NV (Certificaten Van Aandelen) | 900 | | 27,225 |
TOTAL NETHERLANDS | | 119,503 |
Spain - 1.6% |
Antena 3 Television SA (a) | 100 | | 7,210 |
Telefonica SA | 1,300 | | 24,483 |
TOTAL SPAIN | | 31,693 |
Sweden - 1.2% |
Hennes & Mauritz AB (H&M) (B Shares) | 700 | | 24,384 |
Switzerland - 15.1% |
ABB Ltd. (Reg.) (a) | 5,150 | | 28,700 |
Actelion Ltd. (Reg.) (a) | 706 | | 72,369 |
Credit Suisse Group (Reg.) | 795 | | 33,541 |
Julius Baer Holding AG (Bearer) | 40 | | 12,015 |
Novartis AG (Reg.) | 650 | | 32,851 |
Roche Holding AG (participation certificate) | 303 | | 34,622 |
Common Stocks - continued |
| Shares | | Value (Note 1) |
Switzerland - continued |
The Swatch Group AG (Reg.) | 1,010 | | $ 29,960 |
UBS AG (Reg.) | 767 | | 64,305 |
TOTAL SWITZERLAND | | 308,363 |
Taiwan - 1.9% |
ASUSTeK Computer, Inc. | 4,000 | | 10,632 |
Optimax Technology Corp. | 11,000 | | 28,028 |
TOTAL TAIWAN | | 38,660 |
United Kingdom - 11.9% |
BAE Systems PLC | 2,200 | | 9,732 |
BHP Billiton PLC | 1,500 | | 17,574 |
British Airways PLC (a) | 4,900 | | 22,098 |
Capita Group PLC | 2,100 | | 14,740 |
Enterprise Inns PLC | 900 | | 13,731 |
HSBC Holdings PLC (United Kingdom) (Reg.) | 1,800 | | 30,650 |
Invensys PLC (a) | 56,300 | | 16,747 |
Man Group PLC | 700 | | 19,774 |
Shire Pharmaceuticals Group PLC | 1,800 | | 19,170 |
Vodafone Group PLC | 29,200 | | 79,950 |
TOTAL UNITED KINGDOM | | 244,166 |
United States of America - 1.1% |
NTL, Inc. (a) | 300 | | 21,888 |
TOTAL COMMON STOCKS (Cost $1,913,012) | 1,961,284 |
Cash Equivalents - 8.3% |
| Maturity
Amount | | |
Investments in repurchase agreements (Collateralized by U.S. Treasury Obligations, in a joint trading account at 1.52%, dated 12/31/04 due 1/3/05)
(Cost $169,000) | $ 169,021 | | 169,000 |
TOTAL INVESTMENT PORTFOLIO - 104.0% (Cost $2,082,012) | | 2,130,284 |
NET OTHER ASSETS - (4.0)% | | (81,472) |
NET ASSETS - 100% | $ 2,048,812 |
Legend |
(a) Non-income producing |
See accompanying notes which are an integral part of the financial statements.
International Capital Appreciation Portfolio
Fidelity Variable Insurance Products: International Capital Appreciation Portfolio
Financial Statements
Statement of Assets and Liabilities
| December 31, 2004 |
| | |
Assets | | |
Investment in securities, at value (including repurchase agreements of $169,000) (cost $2,082,012) - See accompanying schedule | | $ 2,130,284 |
Cash | | 159 |
Foreign currency held at value (cost $14,130) | | 14,226 |
Dividends receivable | | 282 |
Receivable from investment adviser for expense reductions | | 23,758 |
Other receivables | | 104 |
Total assets | | 2,168,813 |
| | |
Liabilities | | |
Payable for investments purchased | $ 96,402 | |
Accrued management fee | 388 | |
Distribution fees payable | 70 | |
Other affiliated payables | 911 | |
Other payables and accrued expenses | 22,230 | |
Total liabilities | | 120,001 |
| | |
Net Assets | | $ 2,048,812 |
Net Assets consist of: | | |
Paid in capital | | $ 2,000,060 |
Accumulated net investment loss | | (408) |
Accumulated undistributed net realized gain (loss) on investments and foreign currency transactions | | 965 |
Net unrealized appreciation (depreciation) on investments and assets and liabilities in foreign currencies | | 48,195 |
Net Assets | | $ 2,048,812 |
Calculation of Maximum Offering Price | | |
| | |
Initial Class:
Net Asset Value, offering price and redemption price per share ($307,334 ÷ 30,001 shares) | | $ 10.24 |
| | |
Service Class:
Net Asset Value, offering price and redemption price per share ($307,325 ÷ 30,001 shares) | | $ 10.24 |
| | |
Service Class 2:
Net Asset Value, offering price and redemption price per share ($409,747 ÷ 40,001 shares) | | $ 10.24 |
| | |
Initial Class R:
Net Asset Value, offering price and
redemption price per share
($307,334 ÷ 30,001 shares) | | $ 10.24 |
| | |
Service Class R:
Net Asset Value, offering price and redemption price per share ($307,325 ÷ 30,001 shares) | | $ 10.24 |
| | |
Service Class 2R:
Net Asset Value, offering price and redemption price per share ($409,747 ÷ 40,001 shares) | | $ 10.24 |
Statement of Operations
For the period December 22, 2004 (commencement of operations)
to December 31, 2004 |
| | |
Investment Income | | |
Dividends | | $ 283 |
Interest | | 686 |
Total income | | 969 |
| | |
Expenses | | |
Management fee | $ 388 | |
Transfer agent fees | 34 | |
Distribution fees | 70 | |
Accounting fees and expenses | 875 | |
Custodian fees and expenses | 3,406 | |
Audit | 18,677 | |
Miscellaneous | 1,000 | |
Total expenses before reductions | 24,450 | |
Expense reductions | (23,862) | 588 |
Net investment income (loss) | | 381 |
Realized and Unrealized Gain (Loss) Net realized gain (loss) on: | | |
Investment securities | 964 | |
Foreign currency transactions | (788) | |
Total net realized gain (loss) | | 176 |
Change in net unrealized appreciation (depreciation) on: Investment securities (net of increase in deferred foreign taxes of $150) | 48,122 | |
Assets and liabilities in foreign currencies | 73 | |
Total change in net unrealized appreciation (depreciation) | | 48,195 |
Net gain (loss) | | 48,371 |
Net increase (decrease) in net assets resulting from operations | | $ 48,752 |
Annual Report
See accompanying notes which are an integral part of the financial statements.
Statement of Changes in Net Assets
| For the period
December 22, 2004
(commencement
of operations) to
December 31, 2004 |
Increase (Decrease) in Net Assets | |
Operations | |
Net investment income (loss) | $ 381 |
Net realized gain (loss) | 176 |
Change in net unrealized appreciation (depreciation) | 48,195 |
Net increase (decrease) in net assets resulting from operations | 48,752 |
Share transactions - net increase (decrease) | 2,000,060 |
Total increase (decrease) in net assets | 2,048,812 |
| |
Net Assets | |
Beginning of period | - |
End of period (including accumulated net investment loss of $408) | $ 2,048,812 |
Other Information: | | | | | | |
Share Transactions | For the period December 22, 2004 (commencement of operations) to December 31, 2004 |
Shares | Initial Class | Service Class | Service Class 2 | Initial Class R | Service Class R | Service Class 2R |
Sold | 30,001 | 30,001 | 40,001 | 30,001 | 30,001 | 40,001 |
| | | | | | |
Dollars Sold | $ 300,010 | $ 300,010 | $ 400,010 | $ 300,010 | $ 300,010 | $ 400,010 |
See accompanying notes which are an integral part of the financial statements.
International Capital Appreciation Portfolio
Financial Highlights - Initial Class
Year ended December 31, | 2004 F |
Selected Per-Share Data | |
Net asset value, beginning of period | $ 10.00 |
Income from Investment Operations | |
Net investment income (loss) E | - H |
Net realized and unrealized gain (loss) | .24 |
Total from investment operations | .24 |
Net asset value, end of period | $ 10.24 |
Total Return B, C, D | 2.40% |
Ratios to Average Net Assets G | |
Expenses before expense reductions | 43.27% A |
Expenses net of voluntary waivers, if any | 1.10% A |
Expenses net of all reductions | .92% A |
Net investment income (loss) | .80% A |
Supplemental Data | |
Net assets, end of period (000 omitted) | $ 307 |
Portfolio turnover rate | 52% A |
A Annualized
B Total returns for periods of less than one year are not annualized.
C Total returns do not reflect charges attributable to your insurance company's separate account. Inclusion of these charges would reduce the total returns shown.
D Total returns would have been lower had certain expenses not been reduced during the periods shown.
E Calculated based on average shares outstanding during the period.
F For the period December 22, 2004 (commencement of operations) to December 31, 2004.
G Expense ratios reflect operating expenses of the class. Expenses before reductions do not reflect amounts reimbursed by the investment adviser or reductions from brokerage service arrangements or other expense offset arrangements and do not represent the amount paid by the class during periods when reimbursements or reductions occur. Expense ratios before reductions for start-up periods may not be representative of longer-term operating periods. Expenses net of any voluntary waivers reflect expenses after reimbursement by the investment adviser but prior to reductions from brokerage service arrangements or other expense offset arrangements. Expenses net of all reductions represent the net expenses paid by the class.
H Amount represents less than $.01 per share.
Financial Highlights - Service Class
Year ended December 31, | 2004 F |
Selected Per-Share Data | |
Net asset value, beginning of period | $ 10.00 |
Income from Investment Operations | |
Net investment income (loss) E | - H |
Net realized and unrealized gain (loss) | .24 |
Total from investment operations | .24 |
Net asset value, end of period | $ 10.24 |
Total Return B, C, D | 2.40% |
Ratios to Average Net Assets G | |
Expenses before expense reductions | 43.36% A |
Expenses net of voluntary waivers, if any | 1.20% A |
Expenses net of all reductions | 1.01% A |
Net investment income (loss) | .71% A |
Supplemental Data | |
Net assets, end of period (000 omitted) | $ 307 |
Portfolio turnover rate | 52% A |
A Annualized
B Total returns for periods of less than one year are not annualized.
C Total returns do not reflect charges attributable to your insurance company's separate account. Inclusion of these charges would reduce the total returns shown.
D Total returns would have been lower had certain expenses not been reduced during the periods shown.
E Calculated based on average shares outstanding during the period.
F For the period December 22, 2004 (commencement of operations) to December 31, 2004.
G Expense ratios reflect operating expenses of the class. Expenses before reductions do not reflect amounts reimbursed by the investment adviser or reductions from brokerage service arrangements or other expense offset arrangements and do not represent the amount paid by the class during periods when reimbursements or reductions occur. Expense ratios before reductions for start-up periods may not be representative of longer-term operating periods. Expenses net of any voluntary waivers reflect expenses after reimbursement by the investment adviser but prior to reductions from brokerage service arrangements or other expense offset arrangements. Expenses net of all reductions represent the net expenses paid by the class.
H Amount represents less than $.01 per share.
See accompanying notes which are an integral part of the financial statements.
Annual Report
Financial Highlights - Service Class 2
Year ended December 31, | 2004 F |
Selected Per-Share Data | |
Net asset value, beginning of period | $ 10.00 |
Income from Investment Operations | |
Net investment income (loss) E | - H |
Net realized and unrealized gain (loss) | .24 |
Total from investment operations | .24 |
Net asset value, end of period | $ 10.24 |
Total Return B, C, D | 2.40% |
Ratios to Average Net Assets G | |
Expenses before expense reductions | 43.51% A |
Expenses net of voluntary waivers, if any | 1.35% A |
Expenses net of all reductions | 1.17% A |
Net investment income (loss) | .55% A |
Supplemental Data | |
Net assets, end of period (000 omitted) | $ 410 |
Portfolio turnover rate | 52% A |
A Annualized
B Total returns for periods of less than one year are not annualized.
C Total returns do not reflect charges attributable to your insurance company's separate account. Inclusion of these charges would reduce the total returns shown.
D Total returns would have been lower had certain expenses not been reduced during the periods shown.
E Calculated based on average shares outstanding during the period.
F For the period December 22, 2004 (commencement of operations) to December 31, 2004.
G Expense ratios reflect operating expenses of the class. Expenses before reductions do not reflect amounts reimbursed by the investment adviser or reductions from brokerage service arrangements or other expense offset arrangements and do not represent the amount paid by the class during periods when reimbursements or reductions occur. Expense ratios before reductions for start-up periods may not be representative of longer-term operating periods. Expenses net of any voluntary waivers reflect expenses after reimbursement by the investment adviser but prior to reductions from brokerage service arrangements or other expense offset arrangements. Expenses net of all reductions represent the net expenses paid by the class.
H Amount represents less than $.01 per share.
Financial Highlights - Initial Class R
Year ended December 31, | 2004 F |
Selected Per-Share Data | |
Net asset value, beginning of period | $ 10.00 |
Income from Investment Operations | |
Net investment income (loss) E | - H |
Net realized and unrealized gain (loss) | .24 |
Total from investment operations | .24 |
Net asset value, end of period | $ 10.24 |
Total Return B, C, D | 2.40% |
Ratios to Average Net Assets G | |
Expenses before expense reductions | 43.27% A |
Expenses net of voluntary waivers, if any | 1.10% A |
Expenses net of all reductions | .92% A |
Net investment income (loss) | .80% A |
Supplemental Data | |
Net assets, end of period (000 omitted) | $ 307 |
Portfolio turnover rate | 52% A |
A Annualized
B Total returns for periods of less than one year are not annualized.
C Total returns do not reflect charges attributable to your insurance company's separate account. Inclusion of these charges would reduce the total returns shown.
D Total returns would have been lower had certain expenses not been reduced during the periods shown.
E Calculated based on average shares outstanding during the period.
F For the period December 22, 2004 (commencement of operations) to December 31, 2004.
G Expense ratios reflect operating expenses of the class. Expenses before reductions do not reflect amounts reimbursed by the investment adviser or reductions from brokerage service arrangements or other expense offset arrangements and do not represent the amount paid by the class during periods when reimbursements or reductions occur. Expense ratios before reductions for start-up periods may not be representative of longer-term operating periods. Expenses net of any voluntary waivers reflect expenses after reimbursement by the investment adviser but prior to reductions from brokerage service arrangements or other expense offset arrangements. Expenses net of all reductions represent the net expenses paid by the class.
H Amount represents less than $.01 per share.
See accompanying notes which are an integral part of the financial statements.
International Capital Appreciation Portfolio
Financial Highlights - Service Class R
Year ended December 31, | 2004 F |
Selected Per-Share Data | |
Net asset value, beginning of period | $ 10.00 |
Income from Investment Operations | |
Net investment income (loss) E | - H |
Net realized and unrealized gain (loss) | .24 |
Total from investment operations | .24 |
Net asset value, end of period | $ 10.24 |
Total Return B, C, D | 2.40% |
Ratios to Average Net Assets G | |
Expenses before expense reductions | 43.36% A |
Expenses net of voluntary waivers, if any | 1.20% A |
Expenses net of all reductions | 1.01% A |
Net investment income (loss) | .71% A |
Supplemental Data | |
Net assets, end of period (000 omitted) | $ 307 |
Portfolio turnover rate | 52% A |
A Annualized
B Total returns for periods of less than one year are not annualized.
C Total returns do not reflect charges attributable to your insurance company's separate account. Inclusion of these charges would reduce the total returns shown.
D Total returns would have been lower had certain expenses not been reduced during the periods shown.
E Calculated based on average shares outstanding during the period.
F For the period December 22, 2004 (commencement of operations) to December 31, 2004.
G Expense ratios reflect operating expenses of the class. Expenses before reductions do not reflect amounts reimbursed by the investment adviser or reductions from brokerage service arrangements or other expense offset arrangements and do not represent the amount paid by the class during periods when reimbursements or reductions occur. Expense ratios before reductions for start-up periods may not be representative of longer-term operating periods. Expenses net of any voluntary waivers reflect expenses after reimbursement by the investment adviser but prior to reductions from brokerage service arrangements or other expense offset arrangements. Expenses net of all reductions represent the net expenses paid by the class.
H Amount represents less than $.01 per share.
Financial Highlights - Service Class 2R
Year ended December 31, | 2004 F |
Selected Per-Share Data | |
Net asset value, beginning of period | $ 10.00 |
Income from Investment Operations | |
Net investment income (loss) E | - H |
Net realized and unrealized gain (loss) | .24 |
Total from investment operations | .24 |
Net asset value, end of period | $ 10.24 |
Total Return B, C, D | 2.40% |
Ratios to Average Net Assets G | |
Expenses before expense reductions | 43.51% A |
Expenses net of voluntary waivers, if any | 1.35% A |
Expenses net of all reductions | 1.17% A |
Net investment income (loss) | .55% A |
Supplemental Data | |
Net assets, end of period (000 omitted) | $ 410 |
Portfolio turnover rate | 52% A |
A Annualized
B Total returns for periods of less than one year are not annualized.
C Total returns do not reflect charges attributable to your insurance company's separate account. Inclusion of these charges would reduce the total returns shown.
D Total returns would have been lower had certain expenses not been reduced during the periods shown.
E Calculated based on average shares outstanding during the period.
F For the period December 22, 2004 (commencement of operations) to December 31, 2004.
G Expense ratios reflect operating expenses of the class. Expenses before reductions do not reflect amounts reimbursed by the investment adviser or reductions from brokerage service arrangements or other expense offset arrangements and do not represent the amount paid by the class during periods when reimbursements or reductions occur. Expense ratios before reductions for start-up periods may not be representative of longer-term operating periods. Expenses net of any voluntary waivers reflect expenses after reimbursement by the investment adviser but prior to reductions from brokerage service arrangements or other expense offset arrangements. Expenses net of all reductions represent the net expenses paid by the class.
H Amount represents less than $.01 per share.
See accompanying notes which are an integral part of the financial statements.
Annual Report
Notes to Financial Statements
For the period ended December 31, 2004
1. Significant Accounting Policies.
International Capital Appreciation Portfolio (the fund) is a fund of Variable Insurance Products Fund IV (the trust) (referred to in this report as Fidelity Variable Insurance Products: International Capital Appreciation Portfolio) and is authorized to issue an unlimited number of shares. The trust is registered under the Investment Company Act of 1940, as amended (the 1940 Act), as an open-end management investment company organized as a Massachusetts business trust. Shares of the fund may only be purchased by insurance companies for the purpose of funding variable annuity or variable life insurance contracts. The fund offers the following classes of shares: Initial Class shares, Service Class shares, Service Class 2 shares, Initial Class R shares, Service Class R shares and Service Class 2R shares. All classes have equal rights and voting privileges, except for matters affecting a single class. Investment income, realized and unrealized capital gains and losses, the common expenses of the fund, and certain fund-level expense reductions, if any, are allocated on a pro rata basis to each class based on the relative net assets of each class to the total net assets of the fund. Each class differs with respect to distribution and service plan fees incurred. Certain expense reductions also differ by class.
The financial statements have been prepared in conformity with accounting principles generally accepted in the United States of America, which require management to make certain estimates and assumptions at the date of the financial statements. The following summarizes the significant accounting policies of the fund:
Security Valuation. Net asset value per share (NAV calculation) is calculated as of the close of business of the New York Stock Exchange, normally 4:00 p.m. Eastern time. Equity securities, including restricted securities, for which market quotations are available are valued at the last sale price or official closing price (closing bid price or last evaluated quote if no sale has occurred) on the primary market or exchange on which they trade. If prices are not readily available or do not accurately reflect fair value for a security, or if a security's value has been materially affected by events occurring after the close of the exchange or market on which the security is principally traded, that security may be valued by another method that the Board of Trustees believes accurately reflects fair value. A security's valuation may differ depending on the method used for determining value. Price movements in futures contracts and ADRs, market and trading trends, the bid/ask quotes of brokers and off-exchange institutional trading may be reviewed in the course of making a good faith determination of a security's fair value. Short-term securities with remaining maturities of sixty days or less for which quotations are not readily available are valued on the basis of amortized cost. Investments in open-end investment companies are valued at their net asset value each business day.
Foreign Currency. The fund uses foreign currency contracts to facilitate transactions in foreign-denominated securities. Losses from these transactions may arise from changes in the value of the foreign currency or if the counterparties do not perform under the contracts' terms.
Foreign-denominated assets, including investment securities, and liabilities are translated into U.S. dollars at the exchange rate at period end. Purchases and sales of investment securities, income and dividends received and expenses denominated in foreign currencies are translated into U.S. dollars at the exchange rate in effect on the transaction date.
The effects of exchange rate fluctuations on investments are included with the net realized and unrealized gain (loss) on investment securities. Other foreign currency transactions resulting in realized and unrealized gain (loss) are disclosed separately.
Investment Transactions and Income. Security transactions are accounted for as of trade date. Gains and losses on securities sold are determined on the basis of identified cost. Dividend income is recorded on the ex-dividend date, except for certain dividends from foreign securities where the ex-dividend date may have passed, which are recorded as soon as the fund is informed of the ex-dividend date. Non-cash dividends included in dividend income, if any, are recorded at the fair market value of the securities received. Interest income is accrued as earned. Interest income includes coupon interest and amortization of premium and accretion of discount on debt securities. Investment income is recorded net of foreign taxes withheld where recovery of such taxes is uncertain.
Expenses. Most expenses of the trust can be directly attributed to a fund. Expenses which cannot be directly attributed are apportioned among the funds in the trust.
Income Tax Information and Distributions to Shareholders. Each year, the fund intends to qualify as a regulated investment company by distributing all of its taxable income and realized gains under Subchapter M of the Internal Revenue Code. As a result, no provision for income taxes is required in the accompanying financial statements. Foreign taxes are provided for based on the fund's understanding of the tax rules and rates that exist in the foreign markets in which it invests.
Distributions are recorded on the ex-dividend date. Income dividends and capital gain distributions are declared separately for each class. Income and capital gain distributions are determined in accordance with income tax regulations, which may differ from generally accepted accounting principles.
Capital accounts within the financial statements are adjusted for permanent book-tax differences. These adjustments have no impact on net assets or the results of operations. Temporary book-tax differences will reverse in a subsequent period.
Annual Report
Notes to Financial Statements - continued
1. Significant Accounting Policies - continued
Income Tax Information and Distributions to Shareholders - continued
The tax-basis components of distributable earnings and the federal tax cost as of period end were as follows:
Unrealized appreciation | $ 48,638 | |
Unrealized depreciation | (1,615) | |
Net unrealized appreciation (depreciation) | $ 47,023 | |
Undistributed ordinary income | 1,726 | |
| | |
Cost for federal income tax purposes | $ 2,083,261 | |
Trading (Redemption) Fees. Initial Class R shares, Service Class R shares and Service Class 2R shares held less than 60 days are subject to a redemption fee equal to 1% of the proceeds of the redeemed shares. All redemption fees, including any estimated redemption fees paid by Fidelity Management & Research Company (FMR), are retained by the fund and accounted for as an addition to paid in capital.
2. Operating Policies.
Repurchase Agreements. FMR has received an Exemptive Order from the Securities and Exchange Commission (the SEC) which permits the fund and other affiliated entities of FMR to transfer uninvested cash balances into joint trading accounts. These accounts are then invested in repurchase agreements that are collateralized by U.S. Treasury or Government obligations. The fund may also invest directly with institutions, in repurchase agreements that are collateralized by commercial paper obligations and corporate obligations. Collateral is held in segregated accounts with custodian banks and may be obtained in the event of a default of the counterparty. Collateral is marked-to-market daily and maintained at a value at least equal to the principal amount of the repurchase agreement (including accrued interest).
3. Purchases and Sales of Investments.
Purchases and sales of securities, other than short-term securities and U.S. government securities, aggregated $1,938,963 and $26,915, respectively.
4. Fees and Other Transactions with Affiliates.
Management Fee. FMR and its affiliates provide the fund with investment management related services for which the fund pays a monthly management fee. The management fee is the sum of an individual fund fee rate that is based on an annual rate of .45% of the fund's average net assets and a group fee rate that averaged .28% during the period. The group fee rate is based upon the average net assets of all the mutual funds advised by FMR. The group fee rate decreases as assets under management increase and increases as assets under management decrease. For the period, the total annualized management fee rate was .72% of the fund's average net assets.
Distribution and Service Plan. In accordance with Rule 12b-1 of the 1940 Act, the fund has adopted separate 12b-1 Plans for each Service Class of shares. Each Service Class pays Fidelity Distributors Corporation (FDC), an affiliate of FMR, a service fee. For the period, the service fee is based on an annual rate of .10% of Service Class' and Service Class R's average net assets and .25% of Service Class 2's and Service Class 2R's average net assets.
For the period, each class paid FDC the following amounts, all of which were re-allowed to insurance companies for the distribution of shares and providing shareholder support services:
Service Class | $ 8 | |
Service Class 2 | 27 | |
Service Class R | 8 | |
Service Class 2R | 27 | |
| $ 70 | |
International Capital Appreciation Portfolio
4. Fees and Other Transactions with Affiliates - continued
Transfer Agent Fees. Fidelity Investments Institutional Operations Company, Inc. (FIIOC), an affiliate of FMR, is the fund's transfer, dividend disbursing, and shareholder servicing agent. FIIOC receives an asset-based fee with respect to each account. FIIOC pays a portion of the expenses related to the typesetting, printing and mailing of shareholder reports, except proxy statements. Each class pays a transfer agent fee, excluding out of pocket expenses, equal to an annual rate of .07% of their month end net assets. For the period, the total transfer agent fees paid by each class to FIIOC, including out of pocket expenses, were as follows:
Initial Class | $ 5 | |
Service Class | 5 | |
Service Class 2 | 7 | |
Initial Class R | 5 | |
Service Class R | 5 | |
Service Class 2R | 7 | |
| $ 34 | |
Accounting Fees. Fidelity Service Company, Inc. (FSC), an affiliate of FMR, maintains the fund's accounting records. The fee is based on the level of average net assets for the month.
Brokerage Commissions. The fund placed a portion of its portfolio transactions with brokerage firms which are affiliates of the investment adviser. The commissions paid to these affiliated firms were $4 for the period.
5. Committed Line of Credit.
The fund participates with other funds managed by FMR in a $4.2 billion credit facility (the "line of credit") to be utilized for temporary or emergency purposes to fund shareholder redemptions or for other short-term liquidity purposes. The fund has agreed to pay commitment fees on its pro rata portion of the line of credit. During the period, there were no borrowings on this line of credit.
6. Expense Reductions.
FMR voluntarily agreed to reimburse each class to the extent annual operating expenses exceeded certain levels of average net assets as noted in the table below. Some expenses, for example interest expense, are excluded from this reimbursement.
| Expense
Limitations | Reimbursement
from adviser |
Initial Class | 1.10% | $ 3,564 |
Service Class | 1.20% | 3,564 |
Service Class 2 | 1.35% | 4,751 |
Initial Class R | 1.10% | 3,564 |
Service Class R | 1.20% | 3,564 |
Service Class 2R | 1.35% | 4,751 |
| | $ 23,758 |
Many of the brokers with whom FMR places trades on behalf of the fund provided services to the fund in addition to trade execution. These services included payments of certain expenses on behalf of the fund totaling $104 for the period.
7. Other Information.
At the end of the period, FMR or its affiliates were the owners of record of 100% of the total outstanding shares of the fund.
Annual Report
Report of Independent Registered Public Accounting Firm
To the Trustees of Variable Insurance Products Fund IV and the Shareholders of International Capital Appreciation Portfolio:
In our opinion, the accompanying statement of assets and liabilities, including the schedule of investments, and the related statements of operations and of changes in net assets and the financial highlights present fairly, in all material respects, the financial position of International Capital Appreciation Portfolio (a fund of Variable Insurance Products Fund IV) at December 31, 2004 and the results of its operations, the changes in its net assets and the financial highlights for the period indicated, in conformity with accounting principles generally accepted in the United States of America. These financial statements and financial highlights (hereafter referred to as "financial statements") are the responsibility of the International Capital Appreciation Portfolio's management; our responsibility is to express an opinion on these financial statements based on our audit. We conducted our audit of these financial statements in accordance with the standards of the Public Company Accounting Oversight Board (United States). Those standards require that we plan and perform the audit to obtain reasonable assurance about whether the financial statements are free of material misstatement. An audit includes examining, on a test basis, evidence supporting the amounts and disclosures in the financial statements, assessing the accounting principles used and significant estimates made by management, and evaluating the overall financial statement presentation. We believe that our audit, which included confirmation of securities at December 31, 2004 by correspondence with the custodian and brokers, provide a reasonable basis for our opinion.
/s/PricewaterhouseCoopers LLP
PricewaterhouseCoopers LLP
Boston, Massachusetts
February 18, 2005
Annual Report
Trustees and Officers
The Trustees, Member of the Advisory Board, and executive officers of the trust and fund, as applicable, are listed below. The Board of Trustees governs the fund and is responsible for protecting the interests of shareholders. The Trustees are experienced executives who meet periodically throughout the year to oversee the fund's activities, review contractual arrangements with companies that provide services to the fund, and review the fund's performance. Except for William O. McCoy, Dennis J. Dirks, and Kenneth L. Wolfe, each of the Trustees oversees 301 funds advised by FMR or an affiliate. Mr. McCoy oversees 303 funds advised by FMR or an affiliate. Mr. Dirks and Mr. Wolfe oversee 233 funds advised by FMR or an affiliate.
The Trustees hold office without limit in time except that (a) any Trustee may resign; (b) any Trustee may be removed by written instrument, signed by at least two-thirds of the number of Trustees prior to such removal; (c) any Trustee who requests to be retired or who has become incapacitated by illness or injury may be retired by written instrument signed by a majority of the other Trustees; and (d) any Trustee may be removed at any special meeting of shareholders by a two-thirds vote of the outstanding voting securities of the trust. In any event, each non-interested Trustee shall retire not later than the last day of the calendar year in which his or her 72nd birthday occurs. The executive officers and Advisory Board Member hold office without limit in time, except that any officer and Advisory Board Member may resign or may be removed by a vote of a majority of the Trustees at any regular meeting or any special meeting of the Trustees. Except as indicated, each individual has held the office shown or other offices in the same company for the past five years.
The fund's Statement of Additional Information (SAI) includes more information about the Trustees. To request a free copy, call Fidelity at 1-800-544-5429.
Interested Trustees*:
Correspondence intended for each Trustee who is an "interested person" (as defined in the 1940 Act) may be sent to Fidelity Investments, 82 Devonshire Street, Boston, Massachusetts 02109.
Name, Age; Principal Occupation |
Edward C. Johnson 3d (74)** |
| Year of Election or Appointment: 1983 Mr. Johnson is Chairman of the Board of Trustees. Mr. Johnson serves as Chief Executive Officer, Chairman, and a Director of FMR Corp.; a Director and Chairman of the Board and of the Executive Committee of FMR; Chairman and a Director of Fidelity Management & Research (Far East) Inc.; Chairman (1998) and a Director of Fidelity Investments Money Management, Inc.; and Chairman (2001) and a Director (2000) of FMR Co., Inc. |
Abigail P. Johnson (43)** |
| Year of Election or Appointment: 2001 Senior Vice President of VIP International Capital Appreciation (2004). Ms. Johnson also serves as Senior Vice President of other Fidelity funds (2001). She is President and a Director of FMR (2001), Fidelity Investments Money Management, Inc. (2001), FMR Co., Inc. (2001), and a Director of FMR Corp. Previously, Ms. Johnson managed a number of Fidelity funds. |
Laura B. Cronin (50) |
| Year of Election or Appointment: 2003 Ms. Cronin is an Executive Vice President (2002) and Chief Financial Officer (2002) of FMR Corp. and is a member of the Fidelity Management Committee (2003). Previously, Ms. Cronin served as Vice President of Finance of FMR (1997-1999), and Chief Financial Officer of FMR (1999-2001), Fidelity Personal Investments (2001), and Fidelity Brokerage Company (2001-2002). |
Robert L. Reynolds (52) |
| Year of Election or Appointment: 2003 Mr. Reynolds is a Director (2003) and Chief Operating Officer (2002) of FMR Corp. and is the head of the Fidelity Management Committee (2003). He also serves on the Board at Fidelity Investments Canada, Ltd. (2000). Previously, Mr. Reynolds served as President of Fidelity Investments Institutional Retirement Group (1996-2000). |
* Trustees have been determined to be "Interested Trustees" by virtue of, among other things, their affiliation with the trust or various entities under common control with FMR.
** Edward C. Johnson 3d, Trustee, is Abigail P. Johnson's father.
Annual Report
Non-Interested Trustees:
Correspondence intended for each non-interested Trustee (that is, the Trustees other than the Interested Trustees) may be sent to Fidelity Investments, P.O. Box 55235, Boston, Massachusetts 02205-5235.
Name, Age; Principal Occupation |
Dennis J. Dirks (56) |
| Year of Election or Appointment: 2005 Mr. Dirks also serves as a Trustee (2005) or Member of the Advisory Board (2004) of other investment companies advised by FMR. Prior to his retirement in May 2003, Mr. Dirks was Chief Operating Officer and a member of the Board of The Depository Trust & Clearing Corporation (DTCC) (1999-2003). He also served as President, Chief Operating Officer, and Board member of The Depository Trust Company (DTC) (1999-2003) and President and Board member of the National Securities Clearing Corporation (NSCC) (1999-2003). In addition, Mr. Dirks served as Chief Executive Officer and Board member of the Government Securities Clearing Corporation (2001-2003) and Chief Executive Officer and Board member of the Mortgage-Backed Securities Clearing Corporation (2001-2003). |
Robert M. Gates (61) |
| Year of Election or Appointment: 1997 Dr. Gates is Vice Chairman of the non-interested Trustees (2005). Dr. Gates is President of Texas A&M University (2002). He was Director of the Central Intelligence Agency (CIA) from 1991 to 1993. From 1989 to 1991, Dr. Gates served as Assistant to the President of the United States and Deputy National Security Advisor. Dr. Gates is a Director of NACCO Industries, Inc. (mining and manufacturing), Parker Drilling Co., Inc. (drilling and rental tools for the energy industry, 2001), and Brinker International (restaurant management, 2003). He also serves as a member of the Advisory Board of VoteHere.net (secure Internet voting, 2001). Previously, Dr. Gates served as a Director of LucasVarity PLC (automotive components and diesel engines), a Director of TRW Inc. (automotive, space, defense, and information technology), and Dean of the George Bush School of Government and Public Service at Texas A&M University (1999-2001). Dr. Gates also is a Trustee of the Forum for International Policy. |
George H. Heilmeier (68) |
| Year of Election or Appointment: 2004 Dr. Heilmeier is Chairman Emeritus of Telcordia Technologies (communication software and systems), where prior to his retirement, he served as company Chairman and Chief Executive Officer. He currently serves on the Boards of Directors of The Mitre Corporation (systems engineering and information technology support for the government), INET Technologies Inc. (telecommunications network surveillance, 2001), Teletech Holdings (customer management services), and HRL Laboratories (private research and development, 2004). He is Chairman of the General Motors Technology Advisory Committee and a Life Fellow of the Institute of Electrical and Electronics Engineers (IEEE) (2000). Dr. Heilmeier is a member of the Defense Science Board and the National Security Agency Advisory Board. He is also a member of the National Academy of Engineering, the American Academy of Arts and Sciences, and the Board of Overseers of the School of Engineering and Applied Science of the University of Pennsylvania. Previously, Dr. Heilmeier served as a Director of TRW Inc. (automotive, space, defense, and information technology, 1992-2002), Compaq (1994-2002), and Automatic Data Processing, Inc. (ADP) (technology-based business outsourcing, 1995-2002). |
Marie L. Knowles (58) |
| Year of Election or Appointment: 2001 Prior to Ms. Knowles' retirement in June 2000, she served as Executive Vice President and Chief Financial Officer of Atlantic Richfield Company (ARCO) (diversified energy, 1996-2000). From 1993 to 1996, she was a Senior Vice President of ARCO and President of ARCO Transportation Company. She served as a Director of ARCO from 1996 to 1998. She currently serves as a Director of Phelps Dodge Corporation (copper mining and manufacturing) and McKesson Corporation (healthcare service, 2002). Ms. Knowles is a Trustee of the Brookings Institution and the Catalina Island Conservancy and also serves as a member of the Advisory Board for the School of Engineering of the University of Southern California. |
Ned C. Lautenbach (60) |
| Year of Election or Appointment: 2000 Mr. Lautenbach has been a partner of Clayton, Dubilier & Rice, Inc. (private equity investment firm) since September 1998. Previously, Mr. Lautenbach was with the International Business Machines Corporation (IBM) from 1968 until his retirement in 1998. He was most recently Senior Vice President and Group Executive of Worldwide Sales and Services. From 1993 to 1995, he was Chairman of IBM World Trade Corporation, and from 1994 to 1998 was a member of IBM's Corporate Executive Committee. Mr. Lautenbach serves as Co-Chairman and a Director of Covansys, Inc. (global provider of business and technology solutions, 2000). In addition, he is a Director of Italtel Holding S.p.A. (telecommunications (Milan, Italy), 2004) and Eaton Corporation (diversified industrial) as well as the Philharmonic Center for the Arts in Naples, Florida (1999). He also is a member of the Council on Foreign Relations. |
Marvin L. Mann (71) |
| Year of Election or Appointment: 1993 Mr. Mann is Chairman of the non-interested Trustees (2001). He is Chairman Emeritus of Lexmark International, Inc. (computer peripherals), where he served as CEO until April 1998, retired as Chairman May 1999, and remains a member of the Board. Prior to 1991, he held the positions of Vice President of International Business Machines Corporation (IBM) and President and General Manager of various IBM divisions and subsidiaries. He is a member of the Executive Committee of the Independent Director's Council of the Investment Company Institute. In addition, Mr. Mann is a member of the President's Cabinet at the University of Alabama and the Board of Visitors of the Culverhouse College of Commerce and Business Administration at the University of Alabama. |
William O. McCoy (71) |
| Year of Election or Appointment: 1997 Prior to his retirement in December 1994, Mr. McCoy was Vice Chairman of the Board of BellSouth Corporation (telecommunications) and President of BellSouth Enterprises. He is currently a Director of Liberty Corporation (holding company), Duke Realty Corporation (real estate), and Progress Energy, Inc. (electric utility). He is also a partner of Franklin Street Partners (private investment management firm) and a member of the Research Triangle Foundation Board. In addition, Mr. McCoy served as the Interim Chancellor (1999-2000) and a member of the Board of Visitors (1994-1998) for the University of North Carolina at Chapel Hill and currently serves on the Board of Directors of the University of North Carolina Health Care System and the Board of Visitors of the Kenan-Flagler Business School (University of North Carolina at Chapel Hill). He also served as Vice President of Finance for the University of North Carolina (16-school system, 1995-1998). |
Cornelia M. Small (60) |
| Year of Election or Appointment: 2005 Ms. Small is a member (2000) and Chairperson (2002) of the Investment Committee, and a member (2002) of the Board of Trustees of Smith College. Previously, she served as Chief Investment Officer (1999-2000), Director of Global Equity Investments (1996-1999), and a member of the Board of Directors of Scudder, Stevens & Clark (1990-1997) and Scudder Kemper Investments (1997-1998). In addition, Ms. Small served as Co-Chair (2000-2003) of the Annual Fund for the Fletcher School of Law and Diplomacy. |
William S. Stavropoulos (65) |
| Year of Election or Appointment: 2002 Mr. Stavropoulos is Chairman of the Board (2000), CEO (2002), a position he previously held from 1995-2000, Chairman of the Executive Committee (2000), and a Member of the Board of Directors of The Dow Chemical Company. Since joining The Dow Chemical Company in 1967, Mr. Stavropoulos served in numerous senior management positions, including President (1993-2000; 2002-2003). Currently, he is a Director of NCR Corporation (data warehousing and technology solutions), BellSouth Corporation (telecommunications), Chemical Financial Corporation, and Maersk Inc. (industrial conglomerate, 2002). He also serves as a member of the Board of Trustees of the American Enterprise Institute for Public Policy Research. In addition, Mr. Stavropoulos is a member of The Business Council, J.P. Morgan International Council and the University of Notre Dame Advisory Council for the College of Science. |
Kenneth L. Wolfe (65) |
| Year of Election or Appointment: 2005 Mr. Wolfe also serves as a Trustee (2005) or Member of the Advisory Board (2004) of other investment companies advised by FMR. Prior to his retirement in 2001, Mr. Wolfe was Chairman and Chief Executive Officer of Hershey Foods Corporation (1993-2001). He currently serves as a member of the boards of Adelphia Communications Corporation (2003), Bausch & Lomb, Inc., and Revlon Inc. (2004). |
Advisory Board Member and Executive Officers:
Correspondence intended for each executive officer and Mr. Lynch may be sent to Fidelity Investments, 82 Devonshire Street, Boston, Massachusetts 02109.
Name, Age; Principal Occupation |
Peter S. Lynch (61) |
| Year of Election or Appointment: 2003 Member of the Advisory Board of Variable Insurance Products Fund IV. Vice Chairman and a Director of FMR, and Vice Chairman (2001) and a Director (2000) of FMR Co., Inc. Previously, Mr. Lynch served as a Trustee of the Fidelity funds (1990-2003). Prior to May 31, 1990, he was a Director of FMR and Executive Vice President of FMR (a position he held until March 31, 1991), Vice President of Fidelity® Magellan® Fund and FMR Growth Group Leader, and Managing Director of FMR Corp. Mr. Lynch was also Vice President of Fidelity Investments Corporate Services. In addition, he serves as a Trustee of Boston College, Massachusetts Eye & Ear Infirmary, Historic Deerfield, John F. Kennedy Library, and the Museum of Fine Arts of Boston. |
Philip L. Bullen (45) |
| Year of Election or Appointment: 2004 Vice President of VIP International Capital Appreciation. Mr. Bullen also serves as Vice President of certain Equity Funds (2001) and certain High Income Funds (2001). He is Senior Vice President of FMR (2001) and FMR Co., Inc. (2001), President and a Director of Fidelity Management & Research (Far East) Inc. (2001), President and a Director of Fidelity Management & Research (U.K.) Inc. (2002), and a Director of Strategic Advisers, Inc. (2002). Before joining Fidelity Investments, Mr. Bullen was President and Chief Investment Officer of Santander Global Advisors (1997-2000) and President and Chief Executive Officer of Boston's Baring Asset Management Inc. (1994-1997). |
Kevin R. McCarey (44) |
| Year of Election or Appointment: 2004 Vice President of VIP International Capital Appreciation. Mr. McCarey also serves as Vice President of other funds advised by FMR. Prior to assuming his current responsibilities, Mr. McCarey managed a variety of Fidelity funds. Mr. McCarey also serves as Vice President of FMR and FMR Co., Inc. (2001). |
Eric D. Roiter (56) |
| Year of Election or Appointment: 2004 Secretary of VIP International Capital Appreciation. He also serves as Secretary of other Fidelity funds; Vice President, General Counsel, and Secretary of FMR Co., Inc. (2001-present) and FMR; Vice President and Secretary of FDC; Assistant Secretary of Fidelity Management & Research (U.K.) Inc. (2001-present), Fidelity Management & Research (Far East) Inc. (2001-present), and Fidelity Investments Money Management, Inc. (2001-present). Mr. Roiter is an Adjunct Member, Faculty of Law, at Boston College Law School (2003-present). |
Stuart Fross (45) |
| Year of Election or Appointment: 2004 Assistant Secretary of VIP International Capital Appreciation. Mr. Fross also serves as Assistant Secretary of other Fidelity funds (2003) and is an employee of FMR. |
Christine Reynolds (46) |
| Year of Election or Appointment: 2004 President, Treasurer, and Anti-Money Laundering (AML) officer of VIP International Capital Appreciation. Ms. Reynolds also serves as President, Treasurer, and AML officer of other Fidelity funds (2004) and is a Vice President (2003) and an employee (2002) of FMR. Before joining Fidelity Investments, Ms. Reynolds worked at PricewaterhouseCoopers LLP (PwC) (1980-2002), where she was most recently an audit partner with PwC's investment management practice. |
Timothy F. Hayes (54) |
| Year of Election or Appointment: 2004 Chief Financial Officer of VIP International Capital Appreciation. Mr. Hayes also serves as Chief Financial Officer of other Fidelity funds (2002). Recently he was appointed President of Fidelity Service Company (2003) where he also serves as a Director. Mr. Hayes also serves as President of Fidelity Investments Operations Group (FIOG, 2002), which includes Fidelity Pricing and Cash Management Services Group (FPCMS), where he was appointed President in 1998. Previously, Mr. Hayes served as Chief Financial Officer of Fidelity Investments Corporate Systems and Service Group (1998) and Fidelity Systems Company (1997-1998). |
Kenneth A. Rathgeber (57) |
| Year of Election or Appointment: 2004 Chief Compliance Officer of VIP International Capital Appreciation. Mr. Rathgeber also serves as Chief Compliance Officer of other Fidelity funds (2004) and Executive Vice President of Risk Oversight for Fidelity Investments (2002). Previously, he served as Executive Vice President and Chief Operating Officer for Fidelity Investments Institutional Services Company, Inc. (1998-2002). |
John R. Hebble (46) |
| Year of Election or Appointment: 2004 Deputy Treasurer of VIP International Capital Appreciation. Mr. Hebble also serves as Deputy Treasurer of other Fidelity funds (2003), and is an employee of FMR. Before joining Fidelity Investments, Mr. Hebble worked at Deutsche Asset Management where he served as Director of Fund Accounting (2002-2003) and Assistant Treasurer of the Scudder Funds (1998-2003). |
Kimberley H. Monasterio (41) |
| Year of Election or Appointment: 2004 Deputy Treasurer of VIP International Capital Appreciation. Ms. Monasterio also serves as Deputy Treasurer of other Fidelity funds (2004) and is an employee of FMR (2004). Before joining Fidelity Investments, Ms. Monasterio served as Treasurer (2000-2004) and Chief Financial Officer (2002-2004) of the Franklin Templeton Funds and Senior Vice President of Franklin Templeton Services, LLC (2000-2004). |
John H. Costello (58) |
| Year of Election or Appointment: 2004 Assistant Treasurer of VIP International Capital Appreciation. Mr. Costello also serves as Assistant Treasurer of other Fidelity funds and is an employee of FMR. |
Peter L. Lydecker (50) |
| Year of Election or Appointment: 2004 Assistant Treasurer of VIP International Capital Appreciation. Mr. Lydecker also serves as Assistant Treasurer of other Fidelity funds (2004) and is an employee of FMR. |
Mark Osterheld (49) |
| Year of Election or Appointment: 2004 Assistant Treasurer of VIP International Capital Appreciation. Mr. Osterheld also serves as Assistant Treasurer of other Fidelity funds (2002) and is an employee of FMR. |
Kenneth B. Robins (35) |
| Year of Election or Appointment: 2004 Assistant Treasurer of VIP International Capital Appreciation. Mr. Robins also serves as Assistant Treasurer of other Fidelity funds (2004) and is an employee of FMR (2004). Before joining Fidelity Investments, Mr. Robins worked at KPMG LLP, where he was a partner in KPMG's department of professional practice (2002-2004) and a Senior Manager (1999-2000). In addition, Mr. Robins served as Assistant Chief Accountant, United States Securities and Exchange Commission (2000-2002). |
Annual Report
Distributions
The Board of Trustees of Variable Insurance Products: International Capital Appreciation Portfolio voted to pay to shareholders of record at the opening of business on record date, the following distributions per share derived from capital gains realized from sales of portfolio securities:
Fund | Pay Date | Record Date | Capital Gains |
Initial Class R | 2/11/05 | 2/11/05 | $.01 |
Service Class R | 2/11/05 | 2/11/05 | $.01 |
Service Class 2R | 2/11/05 | 2/11/05 | $.01 |
The fund will notify shareholders in January 2005 of amounts for use in preparing 2004 income tax returns.
Annual Report
Annual Report
Investment Adviser
Fidelity Management & Research Company
Boston, MA
Investment Sub-Advisers
FMR Co., Inc.
Fidelity Management & Research (U.K.) Inc.
Fidelity Management & Research (Far East) Inc.
Fidelity Investments Money Management, Inc.
Fidelity Investments Japan Limited
General Distributor
Fidelity Distributors Corporation
Boston, MA
Transfer and Shareholder Servicing Agent
Fidelity Investments Institutional Operations Company, Inc.
Boston, MA
Custodian
Brown Brothers Harriman & Co.
Boston, MA
VIPCAR-ANN-0205
1.805787.100
Item 2. Code of Ethics
As of the end of the period, December 31, 2004, Variable Insurance Products IV (the trust) has adopted a code of ethics, as defined in Item 2 of Form N-CSR, that applies to its President and Treasurer and its Chief Financial Officer. A copy of the code of ethics is filed as an exhibit to this Form N-CSR.
Item 3. Audit Committee Financial Expert
The Board of Trustees of the trust has determined that Marie L. Knowles is an audit committee financial expert, as defined in Item 3 of Form N-CSR. Ms. Knowles is independent for purposes of Item 3 of Form N-CSR.
Item 4. Principal Accountant Fees and Services
(a) Audit Fees.
For the fiscal years ended December 31, 2004 and December 31, 2003, the aggregate Audit Fees billed by PricewaterhouseCoopers LLP (PwC) for professional services rendered for the audits of the financial statements, or services that are normally provided in connection with statutory and regulatory filings or engagements for those fiscal years, for the Consumer Portfolio, Cyclical Industries Portfolio, Financial Services Portfolio, Growth Stock Portfolio, Health Care Portfolio, International Capital Appreciation Portfolio, Natural Resources Portfolio, Real Estate Portfolio, Strategic Income Portfolio, Technology Portfolio, Telecommunications & Utilities Growth Portfolio and Value Leaders Portfolio (the funds) and for all funds in the Fidelity Group of Funds are shown in the table below.
Fund | 2004A,D | 2003A,B,C |
Consumer Portfolio | $30,000 | $36,000 |
Cyclical Industries Portfolio | $30,000 | $36,000 |
Financial Services Portfolio | $27,000 | $36,000 |
Growth Stock Portfolio | $32,000 | $39,000 |
Health Care Portfolio | $27,000 | $36,000 |
International Capital Appreciation Portfolio | $16,000 | $0 |
Natural Resources Portfolio | $30,000 | $36,000 |
Real Estate Portfolio | $32,000 | $39,000 |
Strategic Income Portfolio | $34,000 | $20,000 |
Technology Portfolio | $27,000 | $36,000 |
Telecommunications & Utilities Growth Portfolio | $30,000 | $36,000 |
Value Leaders Portfolio | $29,000 | $37,000 |
All funds in the Fidelity Group of Funds audited by PwC | $10,800,000 | $10,600,000 |
A | Aggregate amounts may reflect rounding. |
B | Value Leaders Portfolio commenced operations on June 17, 2003. |
C | Strategic Income Portfolio commenced operations on December 23, 2003. |
D | International Capital Appreciation Portfolio commenced operations on December 22, 2004. |
(b) Audit-Related Fees.
In each of the fiscal years ended December 31, 2004 and December 31, 2003 the aggregate Audit-Related Fees billed by PwC for services rendered for assurance and related services to each fund that are reasonably related to the performance of the audit or review of the fund's financial statements, but not reported as Audit Fees, are shown in the table below.
Fund | 2004A,E | 2003A,B,C,D |
Consumer Portfolio | $0 | $0 |
Cyclical Industries Portfolio | $0 | $0 |
Financial Services Portfolio | $0 | $0 |
Growth Stock Portfolio | $0 | $0 |
Health Care Portfolio | $0 | $0 |
International Capital Appreciation Portfolio | $0 | $0 |
Natural Resources Portfolio | $0 | $0 |
Real Estate Portfolio | $0 | $0 |
Strategic Income Portfolio | $0 | $0 |
Technology Portfolio | $0 | $0 |
Telecommunications & Utilities Growth Portfolio | $0 | $0 |
Value Leaders Portfolio | $0 | $0 |
A | Aggregate amounts may reflect rounding. |
B | Includes amounts related to non-audit services prior to May 6, 2003 that would have been subject to pre-approval if the SEC rules relating to the pre-approval of non-audit services had been in effect at that time. |
C | Value Leaders Portfolio commenced operations on June 17, 2003. |
D | Strategic Income Portfolio commenced operations on December 23, 2003. |
E | International Capital Appreciation Portfolio commenced operations on December 22, 2004. |
In each of the fiscal years ended December 31, 2004 and December 31, 2003, the aggregate Audit-Related Fees that were billed by PwC that were required to be approved by the Audit Committee for services rendered on behalf of Fidelity Management & Research Company (FMR) and entities controlling, controlled by, or under common control with FMR (not including any sub-adviser whose role is primarily portfolio management and is subcontracted with or overseen by another investment adviser) that provide ongoing services to the funds ("Fund Service Providers") for assurance and related services that relate directly to the operations and financial reporting of each fund that are reasonably related to the performance of the audit or review of the fund's financial statements, but not reported as Audit Fees, are shown in the table below.
Billed By | 2004A | 2003A,B |
PwC | $0 | $50,000 |
A | Aggregate amounts may reflect rounding. |
B | Includes amounts related to non-audit services prior to May 6, 2003 that would have been subject to pre-approval if the SEC rules relating to the pre-approval of non-audit services had been in effect at that time. |
Fees included in the audit-related category comprise assurance and related services (e.g., due diligence services) that are traditionally performed by the independent registered public accounting firm. These audit-related services include due diligence related to mergers and acquisitions, accounting consultations and audits in connection with acquisitions, internal control reviews, attest services that are not required by statute or regulation and consultation concerning financial accounting and reporting standards.
(c) Tax Fees.
In each of the fiscal years ended December 31, 2004 and December 31, 2003, the aggregate Tax Fees billed by PwC for professional services rendered for tax compliance, tax advice, and tax planning for each fund is shown in the table below.
Fund | 2004A,E | 2003A,B,C,D |
Consumer Portfolio | $1,800 | $1,600 |
Cyclical Industries Portfolio | $1,800 | $1,600 |
Financial Services Portfolio | $1,800 | $1,600 |
Growth Stock Portfolio | $2,200 | $2,000 |
Health Care Portfolio | $1,800 | $1,600 |
International Capital Appreciation Portfolio | $2,400 | $0 |
Natural Resources Portfolio | $1,800 | $1,600 |
Real Estate Portfolio | $2,200 | $2,000 |
Strategic Income Portfolio | $2,200 | $2,200 |
Technology Portfolio | $1,800 | $1,600 |
Telecommunications & Utilities Growth Portfolio | $1,800 | $1,600 |
Value Leaders Portfolio | $2,300 | $2,000 |
A | Aggregate amounts may reflect rounding. |
B | Includes amounts related to non-audit services prior to May 6, 2003 that would have been subject to pre-approval if the SEC rules relating to the pre-approval of non-audit services had been in effect at that time. |
C | Value Leaders Portfolio commenced operations on June 17, 2003. |
D | Strategic Income Portfolio commenced operations on December 23, 2003. |
E | International Capital Appreciation Portfolio commenced operations on December 22, 2004. |
In each of the fiscal years ended December 31, 2004 and December 31, 2003, the aggregate Tax Fees billed by PwC that were required to be approved by the Audit Committee for professional services rendered on behalf of the Fund Service Providers for tax compliance, tax advice, and tax planning that relate directly to the operations and financial reporting of each fund is shown in the table below.
Billed By | 2004A | 2003A,B |
PwC | $0 | $0 |
A | Aggregate amounts may reflect rounding. |
B | Includes amounts related to non-audit services prior to May 6, 2003 that would have been subject to pre-approval if the SEC rules relating to the pre-approval of non-audit services had been in effect at that time. |
Fees included in the Tax Fees category comprise all services performed by professional staff in the independent registered public accounting firm's tax division except those services related to the audit. Typically, this category would include fees for tax compliance, tax planning, and tax advice. Tax compliance, tax advice, and tax planning services include preparation of original and amended tax returns, claims for refund and tax payment-planning services, assistance with tax audits and appeals, tax advice related to mergers and acquisitions and requests for rulings or technical advice from taxing authorities.
(d) All Other Fees.
In each of the fiscal years ended December 31, 2004 and December 31, 2003, the aggregate Other Fees billed by PwC for all other non-audit services rendered to the funds is shown in the table below.
Fund | 2004A,E | 2003A,B,C,D |
Consumer Portfolio | $1,300 | $1,200 |
Cyclical Industries Portfolio | $1,300 | $1,200 |
Financial Services Portfolio | $1,300 | $1,200 |
Growth Stock Portfolio | $1,200 | $1,200 |
Health Care Portfolio | $1,300 | $1,200 |
International Capital Appreciation Portfolio | $0 | $0 |
Natural Resources Portfolio | $1,300 | $1,200 |
Real Estate Portfolio | $1,300 | $1,200 |
Strategic Income Portfolio | $1,300 | $0 |
Technology Portfolio | $1,400 | $1,200 |
Telecommunications & Utilities Growth Portfolio | $1,300 | $1,200 |
Value Leaders Portfolio | $1,200 | $500 |
A | Aggregate amounts may reflect rounding. |
B | Includes amounts related to non-audit services prior to May 6, 2003 that would have been subject to pre-approval if the SEC rules relating to the pre-approval of non-audit services had been in effect at that time. |
C | Value Leaders Portfolio commenced operations on June 17, 2003. |
D | Strategic Income Portfolio commenced operations on December 23, 2003. |
E | International Capital Appreciation Portfolio commenced operations on December 22, 2004. |
In each of the fiscal years ended December 31, 2004 and December 31, 2003, the aggregate Other Fees billed by PwC that were required to be approved by the Audit Committee for all other non-audit services rendered on behalf of the Fund Service Providers that relate directly to the operations and financial reporting of each fund is shown in the table below.
Billed By | 2004A | 2003A,B |
PwC | $490,000 | $190,000 |
A | Aggregate amounts may reflect rounding. |
B | Includes amounts related to non-audit services prior to May 6, 2003 that would have been subject to pre-approval if the SEC rules relating to the pre-approval of non-audit services had been in effect at that time. |
Fees included in the All Other Fees category include services related to internal control reviews, strategy and other consulting, financial information systems design and implementation, consulting on other information systems, and other tax services unrelated to the fund.
(e) (1) | Audit Committee Pre-Approval Policies and Procedures: |
The trust's Audit Committee must pre-approve all audit and non-audit services provided by the independent registered public accounting firm relating to the operations or financial reporting of the funds. Prior to the commencement of any audit or non-audit services to a fund, the Audit Committee reviews the services to determine whether they are appropriate and permissible under applicable law.
The trust's Audit Committee has adopted policies and procedures to, among other purposes, provide a framework for the Committee's consideration of non-audit services by the audit firms that audit the Fidelity funds. The policies and procedures require that any non-audit service provided by a fund audit firm to a Fidelity Fund and any non-audit service provided by a fund auditor to a Fund Service Provider that relates directly to the operations and financial reporting of a Fidelity fund (Covered Service) are subject to approval by the Audit Committee before such service is provided. Non-audit services provided by a fund audit firm for a Fund Service Provider that do not relate directly to the operations and financial reporting of a Fidelity fund (Non-Covered Service) but that are expected to exceed $50,000 are also subject to pre-approval by the Audit Committee.
All Covered Services, as well as Non-Covered Services that are expected to exceed $50,000, must be approved in advance of provision of the service either: (i) by formal resolution of the Audit Committee, or (ii) by oral or written approval of the service by the Chair of the Audit Committee (or if the Chair is unavailable, such other member of the Audit Committee as may be designated by the Chair to act in the Chair's absence). The approval contemplated by (ii) above is permitted where the Treasurer determines that action on such an engagement is necessary before the next meeting of the Audit Committee. Neither pre-approval nor advance notice of Non-Covered Service engagements for which fees are not expected to exceed $50,000 is required; such engagements are to be reported to the Audit Committee monthly.
(e) (2) | Services approved pursuant to paragraph (c)(7)(i)(C) of Rule 2-01 of Regulation S-X: |
Audit-Related Fees:
There were no amounts, including amounts related to non-audit services prior to May 6, 2003 that would have been subject to pre-approval if the SEC rules relating to the pre-approval of non-audit services had been in effect at that time, that were approved by the Audit Committee pursuant to the de minimis exception for the fiscal years ended December 31, 2004 and December 31, 2003 on behalf of each fund.
There were no amounts, including amounts related to non-audit services prior to May 6, 2003 that would have been subject to pre-approval if the SEC rules relating to the pre-approval of non-audit services had been in effect at that time, that were required to be approved by the Audit Committee pursuant to the de minimis exception for the fiscal years ended December 31, 2004 and December 31, 2003 on behalf of the Fund Service Providers that relate directly to the operations and financial reporting of each fund.
Tax Fees:
There were no amounts, including amounts related to non-audit services prior to May 6, 2003 that would have been subject to pre-approval if the SEC rules relating to the pre-approval of non-audit services had been in effect at that time, that were approved by the Audit Committee pursuant to the de minimis exception for the fiscal years ended December 31, 2004 and December 31, 2003 on behalf of each fund.
There were no amounts, including amounts related to non-audit services prior to May 6, 2003 that would have been subject to pre-approval if the SEC rules relating to the pre-approval of non-audit services had been in effect at that time, that were required to be approved by the Audit Committee pursuant to the de minimis exception for the fiscal years ended December 31, 2004 and December 31, 2003 on behalf of the Fund Service Providers that relate directly to the operations and financial reporting of each fund.
All Other Fees:
There were no amounts, including amounts related to non-audit services prior to May 6, 2003 that would have been subject to pre-approval if the SEC rules relating to the pre-approval of non-audit services had been in effect at that time, that were approved by the Audit Committee pursuant to the de minimis exception for the fiscal years ended December 31, 2004 and December 31, 2003 on behalf of each fund.
There were no amounts, including amounts related to non-audit services prior to May 6, 2003 that would have been subject to pre-approval if the SEC rules relating to the pre-approval of non-audit services had been in effect at that time, that were required to be approved by the Audit Committee pursuant to the de minimis exception for the fiscal years ended December 31, 2004 and December 31, 2003 on behalf of the Fund Service Providers that relate directly to the operations and financial reporting of each fund.
(f) According to PwC for the fiscal year ended December 31, 2004, the percentage of hours spent on the audit of each fund's financial statements for the most recent fiscal year that were attributed to work performed by persons who are not full-time, permanent employees of PwC is as follows:
Fund | 2004 |
Consumer Portfolio | 0% |
Cyclical Industries Portfolio | 0% |
Financial Services Portfolio | 0% |
Growth Stock Portfolio | 0% |
Health Care Portfolio | 0% |
International Capital Appreciation Portfolio | 0% |
Natural Resources Portfolio | 0% |
Real Estate Portfolio | 0% |
Strategic Income Portfolio | 0% |
Technology Portfolio | 0% |
Telecommunications & Utilities Growth Portfolio | 0% |
Value Leaders Portfolio | 0% |
(g) For the fiscal years ended December 31, 2004 and December 31, 2003, the aggregate fees billed by PwC of $2,700,000A and $1,950,000A,B for non-audit services rendered on behalf of the funds, FMR (not including any sub-adviser whose role is primarily portfolio management and is subcontracted with or overseen by another investment adviser) and Fund Service Providers relating to Covered Services and Non-Covered Services are shown in the table below.
| 2004A | 2003A,B |
Covered Services | $550,000 | $300,000 |
Non-Covered Services | $2,150,000 | $1,650,000 |
A | Aggregate amounts may reflect rounding. |
B | Includes amounts related to non-audit services prior to May 6, 2003 that would have been subject to pre-approval if the SEC rules relating to the pre-approval of non-audit services had been in effect at that time. |
(h) The trust's Audit Committee has considered Non-Covered Services that were not pre-approved that were provided by PwC to Fund Service Providers to be compatible with maintaining the independence of PwC in its audit of the funds, taking into account representations from PwC, in accordance with Independence Standards Board Standard No.1, regarding its independence from the funds and their related entities.
Item 5. Audit Committee of Listed Registrants
Not applicable.
Item 6. Schedule of Investments
Not applicable.
Item 7. Disclosure of Proxy Voting Policies and Procedures for Closed-End Management Investment Companies
Not applicable.
Item 8. Portfolio Managers of Closed-End Management Investment Companies
Not applicable.
Item 9. Purchase of Equity Securities by Closed-End Management Investment Company and Affiliated Purchasers
Not applicable.
Item 10. Submission of Matters to a Vote of Security Holders
There were no material changes to the procedures by which shareholders may recommend nominees to the trust's Board of Trustees.
Item 11. Controls and Procedures
(a)(i) The President and Treasurer and the Chief Financial Officer have concluded that the trust's disclosure controls and procedures (as defined in Rule 30a-3(c) under the Investment Company Act) provide reasonable assurances that material information relating to the trust is made known to them by the appropriate persons, based on their evaluation of these controls and procedures as of a date within 90 days of the filing date of this report.
(a)(ii) There was no change in the trust's internal control over financial reporting (as defined in Rule 30a-3(d) under the Investment Company Act) that occurred during the second fiscal quarter of the period covered by this report that has materially affected, or is reasonably likely to materially affect, the trust's internal control over financial reporting.
Item 12. Exhibits
(a) | (1) | Code of Ethics pursuant to Item 2 of Form N-CSR is filed and attached hereto as EX-99.CODE ETH. |
(a) | (2) | Certification pursuant to Rule 30a-2(a) under the Investment Company Act of 1940 (17 CFR 270.30a-2(a)) is filed and attached hereto as Exhibit 99.CERT. |
(a) | (3) | Not applicable. |
(b) | | Certification pursuant to Rule 30a-2(b) under the Investment Company Act of 1940 (17 CFR 270.30a-2(b)) is furnished and attached hereto as Exhibit 99.906CERT. |
SIGNATURES
Pursuant to the requirements of the Securities Exchange Act of 1934 and the Investment Company Act of 1940, the registrant has duly caused this report to be signed on its behalf by the undersigned, thereunto duly authorized.
Variable Insurance Products IV
By: | /s/Christine Reynolds |
| Christine Reynolds |
| President and Treasurer |
| |
Date: | February 24, 2005 |
Pursuant to the requirements of the Securities Exchange Act of 1934 and the Investment Company Act of 1940, this report has been signed below by the following persons on behalf of the registrant and in the capacities and on the dates indicated.
By: | /s/Christine Reynolds |
| Christine Reynolds |
| President and Treasurer |
| |
Date: | February 24, 2005 |
By: | /s/Timothy F. Hayes |
| Timothy F. Hayes |
| Chief Financial Officer |
| |
Date: | February 24, 2005 |