UNITED STATES
SECURITIES AND EXCHANGE COMMISSION
Washington, D.C. 20549
FORM N-CSR
CERTIFIED SHAREHOLDER REPORT OF REGISTERED
MANAGEMENT INVESTMENT COMPANIES
Investment Company Act file number 811-3759
Variable Insurance Products Fund IV
(Exact name of registrant as specified in charter)
82 Devonshire St., Boston, Massachusetts 02109
(Address of principal executive offices) (Zip code)
Eric D. Roiter, Secretary
82 Devonshire St.
Boston, Massachusetts 02109
(Name and address of agent for service)
Registrant's telephone number, including area code: 617-563-7000
Date of fiscal year end: | December 31 |
| |
Date of reporting period: | December 31, 2007 |
Item 1. Reports to Stockholders
Fidelity® Variable Insurance Products:
Consumer Discretionary Portfolio
Annual Report
December 31, 2007
(2_fidelity_logos) (Registered_Trademark)
Contents
Performance | <Click Here> | How the fund has done over time. |
Management's Discussion | <Click Here> | The manager's review of fund performance, strategy and outlook. |
Shareholder Expense Example | <Click Here> | An example of shareholder expenses. |
Investment Changes | <Click Here> | A summary of major shifts in the fund's investments over the past six months. |
Investments | <Click Here> | A complete list of the fund's investments with their
market values. |
Financial Statements | <Click Here> | Statements of assets and liabilities, operations, and
changes in net assets, as well as financial highlights. |
Notes | <Click Here> | Notes to the financial statements. |
Report of Independent Registered Public Accounting Firm | <Click Here> | |
Trustees and Officers | <Click Here> | |
Distributions | <Click Here> | |
Board Approval of Investment Advisory Contracts and Management Fees | <Click Here> | |
To view a fund's proxy voting guidelines and proxy voting record for the 12-month period ended June 30, visit http://www.fidelity.com (search for "proxy voting guidelines") or visit the Securities and Exchange Commission's (SEC) web site at http://www.sec.gov. You may also call 1-877-208-0098 to request a free copy of the proxy voting guidelines.
Fidelity Variable Insurance Products are separate account options which are purchased through a variable insurance contract.
Standard & Poor's, S&P and S&P 500 are registered service marks of The McGraw-Hill Companies, Inc. and have been licensed for use by Fidelity Distributors Corporation.
Other third party marks appearing herein are the property of their respective owners.
All other marks appearing herein are registered or unregistered trademarks or service marks of FMR LLC or an affiliated company.
This report and the financial statements contained herein are submitted for the general information of the shareholders of the fund. This report is not authorized for distribution to prospective investors in the fund unless preceded or accompanied by an effective prospectus.
A fund files its complete schedule of portfolio holdings with the SEC for the first and third quarters of each fiscal year on Form N-Q. Forms N-Q are available on the SEC's web site at http://www.sec.gov. A fund's Forms N-Q may be reviewed and copied at the SEC's Public Reference Room in Washington, DC. Information regarding the operation of the SEC's Public Reference Room may be obtained by calling 1-800-SEC-0330. For a complete list of a fund's portfolio holdings, view the most recent holdings listings, semiannual report, or annual report on Fidelity's web site at http://www.fidelity.com or http://www.advisor.fidelity.com, as applicable.
NOT FDIC INSURED · MAY LOSE VALUE · NO BANK GUARANTEE
Neither the fund nor Fidelity Distributors Corporation is a bank.
Annual Report
Performance: The Bottom Line
Average annual total return reflects the change in the value of an investment, assuming reinvestment of the class' dividend income and capital gains (the profits earned upon the sale of securities that have grown in value, if any) and assuming a constant rate of performance each year. During periods of reimbursement by Fidelity, a fund's total return will be greater than it would be had the reimbursement not occurred. Performance numbers are net of all underlying fund operating expenses, but do not include any insurance charges imposed by your insurance company's separate account. If performance information included the effect of these additional charges, the total returns would have been lower. How a fund did yesterday is no guarantee of how it will do tomorrow.
Average Annual Total Returns
Periods ended December 31, 2007 | Past 1
year | Past 5
years | Life of
fundA |
VIP Consumer Discretionary - Initial Class C | -8.14% | 7.82% | 2.67% |
VIP Consumer Discretionary - Investor Class B, C | -8.29% | 7.76% | 2.63% |
A From July 18, 2001.
B The initial offering of Investor Class shares took place on July 21, 2005. Returns prior to July 21, 2005 are those of Initial Class. If Investor Class's transfer agent fee had been reflected, returns prior to July 21, 2005 would have been lower.
C Prior to October 1, 2006, VIP Consumer Discretionary operated under certain different investment policies. The historical performance for the fund may not represent its current investment policies.
$10,000 Over Life of Fund
Let's say hypothetically that $10,000 was invested in VIP Consumer Discretionary Portfolio - Initial Class on July 18, 2001, when the fund started. The chart shows how the value of your investment would have changed, and also shows how the Standard & Poor's 500SM Index (S&P 500®) performed over the same period.
Annual Report
Management's Discussion of Fund Performance
Comments from John Harris, Portfolio Manager of VIP Consumer Discretionary Portfolio
U.S. equity markets, as measured by the bellwether Dow Jones Industrial AverageSM and the Standard & Poor's 500SM Index, registered their fifth consecutive year of positive returns in 2007, as the Dow rose 8.88% and the S&P 500® index advanced 5.49%. The tech-heavy NASDAQ Composite® Index did even better, increasing 10.55%. However, credit- and recession-related concerns carved deeply into stock prices late in 2007, pushing some major market measures into negative territory for the year overall, particularly smaller-cap and value-oriented benchmarks. Based largely on a weak U.S. dollar that boosted returns for U.S. investors, the Morgan Stanley Capital InternationalSM Europe, Australasia, and Far East (MSCI® EAFE®) Index - a gauge of developed stock markets outside the United States and Canada - beat most domestic equity measures, gaining 11.33%. Several European countries had outstanding performance, including Finland and Germany, while Australia also did very well. However, fallout from the credit crunch and concerns about export growth tempered U.K. stocks, while fears that Japanese financial companies would become embroiled in the U.S. subprime mortgage crisis contributed to a loss of more than 4% for the Japanese portion of the index. The emerging-markets stock asset class soared 39.78% according to the MSCI Emerging Markets index. The U.S. investment-grade bond market climbed 6.97% as measured by the Lehman Brothers® U.S. Aggregate Index, beating the 2.53% gain for the Merrill Lynch® U.S. High Yield Master II Constrained Index. The emerging-markets bond category shook off a sluggish first half of 2007 to finish the year with a respectable gain of 6.28% as measured by the J.P. Morgan Emerging Markets Bond Index (EMBI) Global, while the Citigroup® Non-U.S. Group of 7 Index - representing the debt performance of major global economies, excluding the United States - rose 13.05%.
For the 12-month period ending December 31, 2007, the fund outperformed the Morgan Stanley Capital InternationalSM (MSCI®) US Investable Market Consumer Discretionary Index, which was down 11.43%, but trailed the S&P 500. (For specific portfolio performance results, please refer to the performance section of this report.) Results relative to the MSCI index during the period were aided by an underweighting and effective stock selection in the hard-hit homebuilding industry, as well as good stock selection in Internet software and services; casinos and gaming; and hotels, resorts and cruise lines. Our out-of-index position in search engine Google did well, as did Costco Wholesale, another holding not included in the MSCI index. Costco was a relatively defensive position; I felt the discount warehouse chain would tend to gain market share as consumers became more price-conscious, and indeed its profit margins and earnings improved in 2007. Shares in footwear marketer Deckers Outdoor performed strongly as the firm expanded the market for its UGG brand. RadioShack's shares rose after the electronics retailer cut costs to increase cash flow, and I sold our position before the stock sank later in the period. On the negative side, I underweighted index component Amazon.com early in the period and missed a large part of the surge in its stock price. R.H. Donnelley, a publisher of print and online phone directories, suffered greater sales declines than I had anticipated. I missed most of the strong performance by sports apparel firm Nike and did not own the stock at period end.
The views expressed above reflect those of the portfolio manager(s) only through the end of the period as stated on the cover of this report and do not necessarily represent the views of Fidelity or any other person in the Fidelity organization. Any such views are subject to change at any time based upon market or other conditions and Fidelity disclaims any responsibility to update such views. These views may not be relied on as investment advice and, because investment decisions for a Fidelity fund are based on numerous factors, may not be relied on as an indication of trading intent on behalf of any Fidelity fund.
Annual Report
Shareholder Expense Example
As a shareholder of the Fund, you incur two types of costs: (1) transaction costs, including redemption fees, and (2) ongoing costs, including management fees and other Fund expenses. This Example is intended to help you understand your ongoing costs (in dollars) of investing in the Fund and to compare these costs with the ongoing costs of investing in other mutual funds.
The Example is based on an investment of $1,000 invested at the beginning of the period and held for the entire period (July 1, 2007 to December 31, 2007).
Actual Expenses
The first line of the accompanying table for each class of the Fund provides information about actual account values and actual expenses. You may use the information in this line, together with the amount you invested, to estimate the expenses that you paid over the period. Simply divide your account value by $1,000.00 (for example, an $8,600 account value divided by $1,000.00 = 8.6), then multiply the result by the number in the first line for a class of the Fund under the heading entitled "Expenses Paid During Period" to estimate the expenses you paid on your account during this period. The estimate of expenses does not include any fees or other expenses of any variable annuity or variable life insurance product. If they were, the estimate of expenses you paid during the period would be higher, and your ending account value would be lower. In addition, the Fund, as a shareholder in the underlying Fidelity Central Funds, will indirectly bear its pro rata share of the fees and expenses incurred by the underlying Fidelity Central Funds. These fees and expenses are not included in the Fund's annualized expense ratio used to calculate the expense estimate in the table below.
Hypothetical Example for Comparison Purposes
The second line of the accompanying table for each class of the Fund provides information about hypothetical account values and hypothetical expenses based on a Class' actual expense ratio and an assumed rate of return of 5% per year before expenses, which is not the Class' actual return. The hypothetical account values and expenses may not be used to estimate the actual ending account balance or expenses you paid for the period. You may use this information to compare the ongoing costs of investing in the Fund and other funds. To do so, compare this 5% hypothetical example with the 5% hypothetical examples that appear in the shareholder reports of the other funds. The estimate of expenses does not include any fees or other expenses of any variable annuity or variable life insurance product. If they were, the estimate of expenses you paid during the period would be higher, and your ending account value would be lower. In addition, the Fund, as a shareholder in the underlying Fidelity Central Funds, will indirectly bear its pro rata share of the fees and expenses incurred by the underlying Fidelity Central Funds. These fees and expenses are not included in the Fund's annualized expense ratio used to calculate the expense estimate in the table below.
Please note that the expenses shown in the table are meant to highlight your ongoing costs only and do not reflect any transaction costs. Therefore, the second line of the table is useful in comparing ongoing costs only, and will not help you determine the relative total costs of owning different funds. In addition, if these transactional costs were included, your costs would have been higher.
| Beginning
Account Value
July 1, 2007 | Ending
Account Value
December 31, 2007 | Expenses Paid
During Period*
July 1, 2007 to
December 31, 2007 |
Initial Class | | | |
Actual | $ 1,000.00 | $ 867.30 | $ 4.71 |
HypotheticalA | $ 1,000.00 | $ 1,020.16 | $ 5.09 |
Investor Class | | | |
Actual | $ 1,000.00 | $ 866.40 | $ 5.41** |
HypotheticalA | $ 1,000.00 | $ 1,019.41 | $ 5.85** |
A 5% return per year before expenses
* Expenses are equal to each Class' annualized expense ratio (shown in the table below); multiplied by the average account value over the period, multiplied by 184/365 (to reflect the one-half year period).
| Annualized
Expense Ratio |
Initial Class | 1.00% |
Investor Class | 1.15%** |
** If changes to transfer agent contracts and voluntary expense limitations, effective February 1, 2008 had been in effect during the entire period, the annualized expense ratio would have been 1.08% and the expenses paid in the actual and hypothetical examples above would have been 5.08 and 5.50, respectively.
Annual Report
Investment Changes
Top Ten Stocks as of December 31, 2007 |
| % of fund's
net assets | % of fund's net assets
6 months ago |
McDonald's Corp. | 6.4 | 5.0 |
Time Warner, Inc. | 5.9 | 6.3 |
Target Corp. | 5.7 | 5.3 |
Staples, Inc. | 3.7 | 2.9 |
Comcast Corp. Class A | 3.5 | 4.5 |
Home Depot, Inc. | 3.4 | 6.0 |
News Corp | 3.1 | 3.0 |
Lowe's Companies, Inc. | 2.9 | 1.6 |
The Walt Disney Co. | 2.7 | 1.1 |
Omnicom Group, Inc. | 2.5 | 0.8 |
| 39.8 | |
Top Industries (% of fund's net assets) |
As of December 31, 2007 |
 | Media | 28.7% | |
 | Specialty Retail | 22.4% | |
 | Hotels, Restaurants & Leisure | 14.2% | |
 | Multiline Retail | 8.1% | |
 | Textiles, Apparel & Luxury Goods | 5.6% | |
 | All Others* | 21.0% | |

|
As of June 30, 2007 |
| Media | 25.8% | |
| Specialty Retail | 21.3% | |
| Hotels, Restaurants & Leisure | 16.5% | |
| Multiline Retail | 12.2% | |
| Textiles, Apparel & Luxury Goods | 7.0% | |
| All Others* | 17.2% | |

* Includes short-term investments and net other assets. |
Annual Report
Investments December 31, 2007
Showing Percentage of Net Assets
Common Stocks - 99.1% |
| Shares | | Value |
AUTO COMPONENTS - 2.4% |
Auto Parts & Equipment - 2.4% |
Johnson Controls, Inc. | 6,100 | | $ 219,844 |
AUTOMOBILES - 1.4% |
Automobile Manufacturers - 0.6% |
Renault SA | 200 | | 28,315 |
Toyota Motor Corp. sponsored ADR | 300 | | 31,851 |
| | 60,166 |
Motorcycle Manufacturers - 0.8% |
Harley-Davidson, Inc. | 1,500 | | 70,065 |
TOTAL AUTOMOBILES | | 130,231 |
DISTRIBUTORS - 0.3% |
Distributors - 0.3% |
Li & Fung Ltd. | 6,000 | | 24,240 |
DIVERSIFIED CONSUMER SERVICES - 2.5% |
Education Services - 2.1% |
Apollo Group, Inc. Class A (non-vtg.) (a) | 2,100 | | 147,315 |
Career Education Corp. (a) | 700 | | 17,598 |
Princeton Review, Inc. (a) | 1,179 | | 9,821 |
Strayer Education, Inc. | 100 | | 17,058 |
| | 191,792 |
Specialized Consumer Services - 0.4% |
Sotheby's Class A (ltd. vtg.) | 1,100 | | 41,910 |
TOTAL DIVERSIFIED CONSUMER SERVICES | | 233,702 |
FOOD & STAPLES RETAILING - 4.8% |
Drug Retail - 1.9% |
CVS Caremark Corp. | 4,600 | | 182,850 |
Food Distributors - 0.8% |
Sysco Corp. | 2,300 | | 71,783 |
Food Retail - 0.8% |
Susser Holdings Corp. (a) | 3,500 | | 71,750 |
Hypermarkets & Super Centers - 1.3% |
Costco Wholesale Corp. | 1,800 | | 125,568 |
TOTAL FOOD & STAPLES RETAILING | | 451,951 |
HOTELS, RESTAURANTS & LEISURE - 14.2% |
Casinos & Gaming - 3.9% |
International Game Technology | 4,800 | | 210,864 |
Las Vegas Sands Corp. (a) | 900 | | 92,745 |
Penn National Gaming, Inc. (a) | 1,100 | | 65,505 |
| | 369,114 |
Hotels, Resorts & Cruise Lines - 3.9% |
Accor SA | 1,100 | | 87,812 |
Carnival Corp. unit | 3,300 | | 146,817 |
|
| Shares | | Value |
Royal Caribbean Cruises Ltd. | 1,800 | | $ 76,392 |
Starwood Hotels & Resorts Worldwide, Inc. | 1,200 | | 52,836 |
| | 363,857 |
Restaurants - 6.4% |
McDonald's Corp. | 10,100 | | 594,991 |
TOTAL HOTELS, RESTAURANTS & LEISURE | | 1,327,962 |
HOUSEHOLD DURABLES - 0.9% |
Household Appliances - 0.9% |
The Stanley Works | 400 | | 19,392 |
Whirlpool Corp. | 800 | | 65,304 |
| | 84,696 |
INTERNET & CATALOG RETAIL - 3.5% |
Catalog Retail - 1.3% |
Liberty Media Corp. - Interactive
Series A (a) | 6,300 | | 120,204 |
Internet Retail - 2.2% |
Amazon.com, Inc. (a) | 900 | | 83,376 |
Blue Nile, Inc. (a) | 1,800 | | 122,508 |
| | 205,884 |
TOTAL INTERNET & CATALOG RETAIL | | 326,088 |
INTERNET SOFTWARE & SERVICES - 2.0% |
Internet Software & Services - 2.0% |
Google, Inc. Class A (sub. vtg.) (a) | 200 | | 138,296 |
LoopNet, Inc. (a) | 3,400 | | 47,770 |
| | 186,066 |
LEISURE EQUIPMENT & PRODUCTS - 1.3% |
Leisure Products - 0.9% |
Mattel, Inc. | 4,700 | | 89,488 |
Photographic Products - 0.4% |
Eastman Kodak Co. | 1,600 | | 34,992 |
TOTAL LEISURE EQUIPMENT & PRODUCTS | | 124,480 |
MEDIA - 28.7% |
Advertising - 3.5% |
National CineMedia, Inc. | 3,600 | | 90,756 |
Omnicom Group, Inc. | 5,000 | | 237,650 |
| | 328,406 |
Broadcasting & Cable TV - 6.8% |
Clear Channel Communications, Inc. | 3,400 | | 117,368 |
Comcast Corp. Class A (a) | 18,000 | | 328,680 |
Grupo Televisa SA de CV (CPO) sponsored ADR | 6,000 | | 142,620 |
Time Warner Cable, Inc. (a) | 1,600 | | 44,160 |
| | 632,828 |
Movies & Entertainment - 15.0% |
Cinemark Holdings, Inc. | 1,400 | | 23,800 |
Common Stocks - continued |
| Shares | | Value |
MEDIA - CONTINUED |
Movies & Entertainment - continued |
Live Nation, Inc. (a) | 3,622 | | $ 52,591 |
News Corp.: | | | |
Class A | 13,141 | | 269,259 |
Class B | 1,100 | | 23,375 |
Regal Entertainment Group Class A | 12,800 | | 231,296 |
The Walt Disney Co. | 7,800 | | 251,784 |
Time Warner, Inc. | 33,500 | | 553,085 |
| | 1,405,190 |
Publishing - 3.4% |
McGraw-Hill Companies, Inc. | 4,800 | | 210,288 |
R.H. Donnelley Corp. (a) | 2,900 | | 105,792 |
| | 316,080 |
TOTAL MEDIA | | 2,682,504 |
MULTILINE RETAIL - 8.1% |
Department Stores - 2.0% |
JCPenney Co., Inc. | 300 | | 13,197 |
Kohl's Corp. (a) | 1,700 | | 77,860 |
Nordstrom, Inc. | 2,700 | | 99,171 |
| | 190,228 |
General Merchandise Stores - 6.1% |
Dollar Tree Stores, Inc. (a) | 600 | | 15,552 |
Family Dollar Stores, Inc. | 900 | | 17,307 |
Target Corp. | 10,700 | | 535,000 |
| | 567,859 |
TOTAL MULTILINE RETAIL | | 758,087 |
PERSONAL PRODUCTS - 0.7% |
Personal Products - 0.7% |
Bare Escentuals, Inc. (a) | 2,700 | | 65,475 |
SOFTWARE - 0.3% |
Home Entertainment Software - 0.3% |
Activision, Inc. (a) | 1,100 | | 32,670 |
SPECIALTY RETAIL - 22.4% |
Apparel Retail - 4.9% |
Abercrombie & Fitch Co. Class A | 1,100 | | 87,967 |
American Eagle Outfitters, Inc. | 1,100 | | 22,847 |
Casual Male Retail Group, Inc. (a) | 4,950 | | 25,641 |
Citi Trends, Inc. (a) | 1,600 | | 24,704 |
Collective Brands, Inc. (a) | 3,100 | | 53,909 |
Ross Stores, Inc. | 800 | | 20,456 |
TJX Companies, Inc. | 4,300 | | 123,539 |
Tween Brands, Inc. (a) | 2,100 | | 55,608 |
Urban Outfitters, Inc. (a) | 1,500 | | 40,890 |
| | 455,561 |
|
| Shares | | Value |
Automotive Retail - 1.4% |
Advance Auto Parts, Inc. | 2,800 | | $ 106,372 |
Penske Auto Group, Inc. | 1,600 | | 27,936 |
| | 134,308 |
Computer & Electronics Retail - 1.5% |
Best Buy Co., Inc. | 1,050 | | 55,283 |
Gamestop Corp. Class A (a) | 1,300 | | 80,743 |
| | 136,026 |
Home Improvement Retail - 7.0% |
Home Depot, Inc. | 11,784 | | 317,461 |
Lowe's Companies, Inc. | 12,200 | | 275,964 |
Sherwin-Williams Co. | 1,100 | | 63,844 |
| | 657,269 |
Homefurnishing Retail - 0.7% |
Williams-Sonoma, Inc. | 2,500 | | 64,750 |
Specialty Stores - 6.9% |
PetSmart, Inc. | 7,763 | | 182,663 |
Staples, Inc. | 14,950 | | 344,897 |
Tiffany & Co., Inc. | 2,500 | | 115,075 |
| | 642,635 |
TOTAL SPECIALTY RETAIL | | 2,090,549 |
TEXTILES, APPAREL & LUXURY GOODS - 5.6% |
Apparel, Accessories & Luxury Goods - 2.8% |
Burberry Group PLC | 3,900 | | 44,129 |
Coach, Inc. (a) | 5,600 | | 171,248 |
G-III Apparel Group Ltd. (a) | 2,905 | | 42,907 |
Lululemon Athletica, Inc. | 100 | | 4,737 |
| | 263,021 |
Footwear - 2.8% |
Crocs, Inc. (a) | 900 | | 33,129 |
Deckers Outdoor Corp. (a) | 773 | | 119,861 |
Iconix Brand Group, Inc. (a) | 4,200 | | 82,572 |
K-Swiss, Inc. Class A | 1,103 | | 19,964 |
| | 255,526 |
TOTAL TEXTILES, APPAREL & LUXURY GOODS | | 518,547 |
TOTAL COMMON STOCKS (Cost $9,636,270) | 9,257,092 |
Money Market Funds - 1.3% |
| Shares | | Value |
Fidelity Cash Central Fund, 4.58% (b)
(Cost $123,944) | 123,944 | | $ 123,944 |
TOTAL INVESTMENT PORTFOLIO - 100.4% (Cost $9,760,214) | | 9,381,036 |
NET OTHER ASSETS - (0.4)% | | (39,378) |
NET ASSETS - 100% | $ 9,341,658 |
Legend |
(a) Non-income producing |
(b) Affiliated fund that is available only to investment companies and other accounts managed by Fidelity Investments. The rate quoted is the annualized seven-day yield of the fund at period end. A complete unaudited listing of the fund's holdings as of its most recent quarter end is available upon request. |
Affiliated Central Funds |
Information regarding fiscal year to date income earned by the Fund from investments in Fidelity Central Funds is as follows: |
Fund | Income earned |
Fidelity Cash Central Fund | $ 5,680 |
See accompanying notes which are an integral part of the financial statements.
Annual Report
Financial Statements
Statement of Assets and Liabilities
| December 31, 2007 |
Assets | | |
Investment in securities, at value - See accompanying schedule: Unaffiliated issuers
(cost $9,636,270) | $ 9,257,092 | |
Fidelity Central Funds (cost $123,944) | 123,944 | |
Total Investments (cost $9,760,214) | | $ 9,381,036 |
Receivable for fund shares sold | | 308 |
Dividends receivable | | 8,250 |
Distributions receivable from Fidelity Central Funds | | 187 |
Prepaid expenses | | 36 |
Receivable from investment adviser for expense reductions | | 5,645 |
Total assets | | 9,395,462 |
| | |
Liabilities | | |
Payable to custodian bank | $ 11,801 | |
Payable for fund shares redeemed | 389 | |
Accrued management fee | 4,519 | |
Other affiliated payables | 1,092 | |
Other payables and accrued
expenses | 36,003 | |
Total liabilities | | 53,804 |
| | |
Net Assets | | $ 9,341,658 |
Net Assets consist of: | | |
Paid in capital | | $ 9,702,362 |
Accumulated undistributed net realized gain (loss) on investments and foreign currency transactions | | 18,469 |
Net unrealized appreciation
(depreciation) on investments and assets and liabilities in foreign
currencies | | (379,173) |
Net Assets | | $ 9,341,658 |
Statement of Assets and Liabilities - continued
| December 31, 2007 |
| | |
Initial Class:
Net Asset Value, offering price and redemption price
per share ($6,989,169 ÷ 652,264 shares) | | $ 10.72 |
| | |
Investor Class:
Net Asset Value, offering price and redemption price
per share ($2,352,489 ÷ 219,437 shares) | | $ 10.72 |
See accompanying notes which are an integral part of the financial statements.
Annual Report
Statement of Operations
| Year ended December 31, 2007 |
| | |
Investment Income | | |
Dividends | | $ 133,130 |
Interest | | 163 |
Income from Fidelity Central Funds | | 5,680 |
Total income | | 138,973 |
| | |
Expenses | | |
Management fee | $ 82,626 | |
Transfer agent fees | 20,858 | |
Accounting fees and expenses | 5,750 | |
Custodian fees and expenses | 14,356 | |
Independent trustees' compensation | 53 | |
Audit | 41,416 | |
Legal | 124 | |
Miscellaneous | 2,682 | |
Total expenses before reductions | 167,865 | |
Expense reductions | (13,710) | 154,155 |
Net investment income (loss) | | (15,182) |
Realized and Unrealized Gain (Loss) Net realized gain (loss) on: | | |
Investment securities: | | |
Unaffiliated issuers | 1,257,861 | |
Foreign currency transactions | 220 | |
Total net realized gain (loss) | | 1,258,081 |
Change in net unrealized appreciation (depreciation) on: Investment securities | (1,860,259) | |
Assets and liabilities in foreign currencies | (42) | |
Total change in net unrealized appreciation (depreciation) | | (1,860,301) |
Net gain (loss) | | (602,220) |
Net increase (decrease) in net assets resulting from operations | | $ (617,402) |
Statement of Changes in Net Assets
| Year ended
December 31, 2007 | Year ended
December 31, 2006 |
Increase (Decrease) in Net Assets | | |
Operations | | |
Net investment income (loss) | $ (15,182) | $ 102,515 |
Net realized gain (loss) | 1,258,081 | 1,366,498 |
Change in net unrealized appreciation (depreciation) | (1,860,301) | (45,422) |
Net increase (decrease) in net assets resulting from operations | (617,402) | 1,423,591 |
Distributions to shareholders from net investment income | (27,376) | (77,653) |
Distributions to shareholders from net realized gain | (850,763) | - |
Total distributions | (878,139) | (77,653) |
Share transactions - net increase (decrease) | (7,299,873) | 6,814,768 |
Redemption fees | 15,858 | 5,302 |
Total increase (decrease) in net assets | (8,779,556) | 8,166,008 |
| | |
Net Assets | | |
Beginning of period | 18,121,214 | 9,955,206 |
End of period (including undistributed net investment income of $0 and $24,654, respectively) | $ 9,341,658 | $ 18,121,214 |
See accompanying notes which are an integral part of the financial statements.
Annual Report
Financial Highlights - Initial Class
Years ended December 31, | 2007 | 2006 | 2005 | 2004 | 2003 |
Selected Per-Share Data | | | | | |
Net asset value, beginning of period | $ 12.84 | $ 11.45 | $ 11.12 | $ 10.17 | $ 8.13 |
Income from Investment Operations | | | | | |
Net investment income (loss) C | (.01) | .11 F | (.02) | (.04) | (.03) |
Net realized and unrealized gain (loss) | (1.02) | 1.33 | .35 | .99 | 2.07 |
Total from investment operations | (1.03) | 1.44 | .33 | .95 | 2.04 |
Distributions from net investment income | (.02) | (.06) | - | - | - |
Distributions from net realized gain | (1.08) | - | - | - | - |
Total distributions | (1.10) | (.06) | - | - | - |
Redemption fees added to paid in capital C | .01 | .01 | - H | -H | - H |
Net asset value, end of period | $ 10.72 | $ 12.84 | $ 11.45 | $ 11.12 | $ 10.17 |
Total Return A, B | (8.14)% | 12.63% | 2.97% | 9.34% | 25.09% |
Ratios to Average Net Assets D, G | | | | | |
Expenses before reductions | 1.10% | 1.20% | 1.19% | 1.35% | 1.72% |
Expenses net of fee waivers, if any | 1.01% | 1.15% | 1.14% | 1.35% | 1.50% |
Expenses net of all reductions | 1.01% | 1.14% | 1.12% | 1.31% | 1.46% |
Net investment income (loss) | (.07)% | .90% F | (.19)% | (.42)% | (.34)% |
Supplemental Data | | | | | |
Net assets, end of period (000 omitted) | $ 6,989 | $ 13,866 | $ 9,616 | $ 12,051 | $ 10,959 |
Portfolio turnover rate E | 114% | 189% | 74% | 145% | 108% |
A Total returns do not reflect charges attributable to your insurance company's separate account. Inclusion of these charges would reduce the total returns shown.
B Total returns would have been lower had certain expenses not been reduced during the periods shown.
C Calculated based on average shares outstanding during the period.
D Fees and expenses of the underlying Fidelity Central Funds are not included in the Fund's expense ratio. The Fund indirectly bears its proportionate share of the expenses of any underlying Fidelity Central Funds.
E Amount does not include the portfolio activity of any underlying Fidelity Central Funds.
F Investment income per share reflects special dividends which amounted to $.09 per share. Excluding these special dividends, the ratio of net investment income (loss) to average net assets would have been .13%.
G Expense ratios reflect operating expenses of the class. Expenses before reductions do not reflect amounts reimbursed by the investment adviser or reductions from brokerage service arrangements or other expense offset arrangements and do not represent the amount paid by the class during periods when reimbursements or reductions occur. Expenses net of fee waivers reflect expenses after reimbursement by the investment adviser but prior to reductions from brokerage service arrangements or other expense offset arrangements. Expenses net of all reductions represent the net expenses paid by the class.
H Amount represents less than $.01 per share.
Financial Highlights - Investor Class
Years ended December 31, | 2007 | 2006 | 2005 I |
Selected Per-Share Data | | | |
Net asset value, beginning of period | $ 12.83 | $ 11.44 | $ 11.49 |
Income from Investment Operations | | | |
Net investment income (loss) E | (.03) | .10 H | (.01) |
Net realized and unrealized gain (loss) | (1.02) | 1.33 | (.04) |
Total from investment operations | (1.05) | 1.43 | (.05) |
Distributions from net investment income | (.02) | (.05) | - |
Distributions from net realized gain | (1.05) | - | - |
Total distributions | (1.07) | (.05) | - |
Redemption fees added to paid in capitalE | .01 | .01 | - K |
Net asset value, end of period | $ 10.72 | $ 12.83 | $ 11.44 |
Total Return B, C, D | (8.29)% | 12.62% | (.44)% |
Ratios to Average Net Assets F, J | | | |
Expenses before reductions | 1.24% | 1.41% | 1.61% A |
Expenses net of fee waivers, if any | 1.15% | 1.25% | 1.25% A |
Expenses net of all reductions | 1.15% | 1.24% | 1.23% A |
Net investment income (loss) | (.21)% | .80% H | (.20)% A |
Supplemental Data | | | |
Net assets, end of period (000 omitted) | $ 2,352 | $ 4,256 | $ 339 |
Portfolio turnover rate G | 114% | 189% | 74% |
A Annualized
B Total returns for periods of less than one year are not annualized.
C Total returns do not reflect charges attributable to your insurance company's separate account. Inclusion of these charges would reduce the total returns shown.
D Total returns would have been lower had certain expenses not been reduced during the periods shown.
E Calculated based on average shares outstanding during the period.
F Fees and expenses of the underlying Fidelity Central Funds are not included in the Fund's expense ratio. The Fund indirectly bears its proportionate share of the expenses of any underlying Fidelity Central Funds.
G Amount does not include the portfolio activity of any underlying Fidelity Central Funds.
H Investment income per share reflects special dividends which amounted to $.09 per share. Excluding these special dividends, the ratio of net investment income (loss) to average net assets would have been .03%.
I For the period July 21, 2005 (commencement of sale of shares) to December 31, 2005.
J Expense ratios reflect operating expenses of the class. Expenses before reductions do not reflect amounts reimbursed by the investment adviser or reductions from brokerage service arrangements or other expense offset arrangements and do not represent the amount paid by the class during periods when reimbursements or reductions occur. Expense ratios before reductions for start-up periods may not be representative of longer-term operating periods. Expenses net of fee waivers reflect expenses after reimbursement by the investment adviser but prior to reductions from brokerage service arrangements or other expense offset arrangements. Expenses net of all reductions represent the net expenses paid by the class.
K Amount represents less than $.01 per share.
See accompanying notes which are an integral part of the financial statements.
Annual Report
Notes to Financial Statements
For the period ended December 31, 2007
1. Organization.
VIP Consumer Discretionary Portfolio (the Fund) is a non-diversified fund of Variable Insurance Products Fund IV (the trust) and is authorized to issue an unlimited number of shares. The trust is registered under the Investment Company Act of 1940, as amended (the 1940 Act), as an open-end management investment company organized as a Massachusetts business trust. Shares of the Fund may only be purchased by insurance companies for the purpose of funding variable annuity or variable life insurance contracts. The Fund offers the following classes of shares: Initial Class shares and Investor Class shares. All classes have equal rights and voting privileges, except for matters affecting a single class. Investment income, realized and unrealized capital gains and losses, the common expenses of the Fund, and certain fund-level expense reductions, if any, are allocated on a pro rata basis to each class based on the relative net assets of each class to the total net assets of the Fund. Each class differs with respect to transfer agent fees incurred. Certain expense reductions also differ by class.
2. Investments in Fidelity Central Funds.
The Fund may invest in Fidelity Central Funds, which are open-end investment companies available only to other investment companies and accounts managed by Fidelity Management & Research Company (FMR) and its affiliates. The Fund's Schedule of Investments lists each of the Fidelity Central Funds as an investment of the Fund, but does not include the underlying holdings of each Fidelity Central Fund. As an Investing Fund, the Fund indirectly bears its proportionate share of the expenses of the underlying Fidelity Central Funds.
The Money Market Central Funds seek preservation of capital and current income and are managed by Fidelity Investments Money Management, Inc. (FIMM), an affiliate of FMR.
A complete list of holdings for each Fidelity Central Fund is available upon request or at the SEC's web site at www.sec.gov. In addition, the financial statements of the Fidelity Central Funds, which are not covered by the Fund's Report of Independent Registered Public Accounting Firm, are available on the SEC's web site or upon request.
3. Significant Accounting Policies.
The financial statements have been prepared in conformity with accounting principles generally accepted in the United States of America, which require management to make certain estimates and assumptions at the date of the financial statements. The following summarizes the significant accounting policies of the Fund:
Security Valuation. Investments are valued and net asset value (NAV) per share is calculated (NAV calculation) as of the close of business of the New York Stock Exchange (NYSE), normally 4:00 p.m. Eastern time. Wherever possible, the Fund uses independent pricing services approved by the Board of Trustees to value its investments.
Equity securities, including restricted securities, for which market quotations are readily available, are valued at the last reported sale price or official closing price as reported by an independent pricing service on the primary market or exchange on which they are traded. In the event there were no sales during the day or closing prices are not available, securities are valued at the last quoted bid price. Investments in open-end mutual funds, including the Fidelity Central Funds, are valued at their closing net asset value each business day. Short-term securities with remaining maturities of sixty days or less for which quotations are not readily available are valued at amortized cost, which approximates value.
When current market prices or quotations are not readily available or do not accurately reflect fair value, valuations may be determined in accordance with procedures adopted by the Board of Trustees. For example, when developments occur between the close of a market and the close of the NYSE that may materially affect the value of some or all of the securities, or when trading in a security is halted, those securities may be fair valued. Factors used in the determination of fair value may include monitoring news to identify significant market or security specific events such as changes in the value of U.S. securities markets, reviewing developments in foreign markets and evaluating the performance of ADRs, futures contracts and exchange-traded funds. Because the Fund's utilization of fair value pricing depends on market activity, the frequency with which fair value pricing is used cannot be predicted and may be utilized to a significant extent. The value of securities used for NAV calculation under fair value pricing may differ from published prices for the same securities.
Foreign Currency. The Fund uses foreign currency contracts to facilitate transactions in foreign-denominated securities. Losses from these transactions may arise from changes in the value of the foreign currency or if the counterparties do not perform under the contracts' terms.
Foreign-denominated assets, including investment securities, and liabilities are translated into U.S. dollars at the exchange rate at period end. Purchases and sales of investment securities, income and dividends received and expenses denominated in foreign currencies are translated into U.S. dollars at the exchange rate in effect on the transaction date.
The effects of exchange rate fluctuations on investments are included with the net realized and unrealized gain (loss) on investment securities. Other foreign currency transactions resulting in realized and unrealized gain (loss) are disclosed separately.
Annual Report
Notes to Financial Statements - continued
3. Significant Accounting Policies - continued
Investment Transactions and Income. For financial reporting purposes, the Fund's investment holdings and NAV include trades executed through the end of the last business day of the period. The NAV for processing shareholder transactions includes trades executed through the end of the prior business day. Gains and losses on securities sold are determined on the basis of identified cost and may include proceeds received from litigation. Dividend income is recorded on the ex-dividend date, except for certain dividends from foreign securities where the ex-dividend date may have passed, which are recorded as soon as the Fund is informed of the ex-dividend date. Non-cash dividends included in dividend income, if any, are recorded at the fair market value of the securities received. Distributions received on securities that represent a return of capital or capital gain are recorded as a reduction of cost of investments and/or as a realized gain. The Fund estimates the components of distributions received that may be considered return of capital distributions or capital gain distributions. As a result of a change in the estimate of the return of capital component of dividend income realized in the year ended December 31, 2006, dividend income has been reduced $22,895 with a corresponding increase to net unrealized appreciation (depreciation). The change in estimate has no impact on total net assets or total return of the Fund. Interest income and distributions from the Fidelity Central Funds are accrued as earned. Interest income includes coupon interest and amortization of premium and accretion of discount on debt securities. Investment income is recorded net of foreign taxes withheld where recovery of such taxes is uncertain.
Expenses. Most expenses of the trust can be directly attributed to a fund. Expenses which cannot be directly attributed are apportioned among each Fund in the trust. Expense estimates are accrued in the period to which they relate and adjustments are made when actual amounts are known.
Income Tax Information and Distributions to Shareholders. Each year, the Fund intends to qualify as a regulated investment company by distributing substantially all of its taxable income and realized gains under Subchapter M of the Internal Revenue Code and filing its U.S. federal tax return. As a result, no provision for income taxes is required. The Fund adopted the provisions of FASB Interpretation No. 48, Accounting for Uncertainties in Income Taxes (FIN 48), on June 29, 2007. FIN 48 sets forth a minimum threshold for financial statement recognition of the benefit of a tax position taken or expected to be taken in a tax return. The implementation of FIN 48 did not result in any unrecognized tax benefits in the accompanying financial statements. Each of the Fund's federal tax returns for the prior fiscal three years remains subject to examination by the Internal Revenue Service. Foreign taxes are provided for based on the Fund's understanding of the tax rules and rates that exist in the foreign markets in which it invests.
Distributions are recorded on the ex-dividend date. Income dividends and capital gain distributions are declared separately for each class. Income and capital gain distributions are determined in accordance with income tax regulations, which may differ from generally accepted accounting principles.
Capital accounts within the financial statements are adjusted for permanent book-tax differences. These adjustments have no impact on net assets or the results of operations. Temporary book-tax differences will reverse in a subsequent period.
Book-tax differences are primarily due to foreign currency transactions, net operating losses and losses deferred due to wash sales.
The tax-basis components of distributable earnings and the federal tax cost as of period end were as follows:
Unrealized appreciation | $ 903,721 | |
Unrealized depreciation | (1,333,954) | |
Net unrealized appreciation (depreciation) | (430,233) | |
Undistributed ordinary income | 20,585 | |
Undistributed long-term capital gain | 48,945 | |
| | |
Cost for federal income tax purposes | $ 9,811,269 | |
The tax character of distributions paid was as follows:
| December 31, 2007 | December 31, 2006 |
Ordinary Income | $ 512,049 | $ 77,653 |
Long-term Capital Gains | 366,090 | - |
Total | $ 878,139 | $ 77,653 |
Trading (Redemption) Fees. Shares held less than 60 days are subject to a redemption fee equal to 1% of the proceeds of the redeemed shares. All redemption fees, including any estimated redemption fees paid by FMR, are retained by the Fund and accounted for as an addition to paid in capital.
New Accounting Pronouncement. In September 2006, Statement of Financial Accounting Standards No. 157, Fair Value Measurements (SFAS 157), was issued and is effective for fiscal years beginning after November 15, 2007. SFAS 157 defines fair value, establishes a framework for measuring fair value and expands disclosures about fair value measurements. Management is currently evaluating the impact the adoption of SFAS 157 will have on the Fund's financial statement disclosures.
Annual Report
4. Operating Policies.
Repurchase Agreements. FMR has received an Exemptive Order from the Securities and Exchange Commission (the SEC) which permits the Fund and other affiliated entities of FMR to transfer uninvested cash balances into joint trading accounts which are then invested in repurchase agreements. The Fund may also invest directly with institutions in repurchase agreements. Repurchase agreements are collateralized by government or non-government securities. Upon settlement date, collateral is held in segregated accounts with custodian banks and may be obtained in the event of a default of the counterparty. The Fund monitors, on a daily basis, the value of the collateral to ensure it is at least equal to the principal amount of the repurchase agreement (including accrued interest). In the event of a default by the counterparty, realization of the collateral proceeds could be delayed, during which time the value of the collateral may decline.
5. Purchases and Sales of Investments.
Purchases and sales of securities, other than short-term securities, aggregated $16,690,779 and $24,598,360, respectively.
6. Fees and Other Transactions with Affiliates.
Management Fee. FMR and its affiliates provide the Fund with investment management related services for which the Fund pays a monthly management fee. The management fee is the sum of an individual fund fee rate that is based on an annual rate of .30% of the Fund's average net assets and a group fee rate that averaged .26% during the period. The group fee rate is based upon the average net assets of all the mutual funds advised by FMR. The group fee rate decreases as assets under management increase and increases as assets under management decrease. For the period, the total annual management fee rate was .56% of the Fund's average net assets.
Transfer Agent Fees. Fidelity Investments Institutional Operations Company, Inc. (FIIOC), an affiliate of FMR, is the Fund's transfer, dividend disbursing, and shareholder servicing agent. FIIOC receives an asset-based fee with respect to each class. Each class with the exception of Investor Class pays a transfer agent fee, excluding out of pocket expenses, equal to an annual rate of .07% of average net assets. Investor Class pays a monthly asset-based transfer agent fee of .18% of average net assets. The total transfer agent fees paid by each class to FIIOC, including out of pocket expenses, were as follows:
Initial Class | $ 11,596 |
Investor Class | 9,262 |
| $ 20,858 |
Effective February 1, 2008, the Board of Trustees approved a decrease to Investor Class' asset-based fee from .18% to .15% of average net assets.
Accounting Fees. Fidelity Service Company, Inc. (FSC), an affiliate of FMR, maintains the Fund's accounting records. The fee is based on the level of average net assets for the month.
Brokerage Commissions. The Fund placed a portion of its portfolio transactions with brokerage firms which are affiliates of the investment adviser. The commissions paid to these affiliated firms were $697 for the period.
7. Committed Line of Credit.
The Fund participates with other funds managed by FMR in a $4.2 billion credit facility (the "line of credit") to be utilized for temporary or emergency purposes to fund shareholder redemptions or for other short-term liquidity purposes. The Fund has agreed to pay commitment fees on its pro rata portion of the line of credit, which amounted to $35 and is reflected in Miscellaneous Expense on the Statement of Operations. During the period, there were no borrowings on this line of credit.
8. Expense Reductions.
FMR voluntarily agreed to reimburse each class to the extent annual operating expenses exceeded certain levels of average net assets as noted in the table below. Some expenses, for example interest expense, including commitment fees, are excluded from this reimbursement.
The following classes were in reimbursement during the period:
| Expense
Limitations | Reimbursement
from adviser |
Initial Class | 1.15 - 1.00%* | $ 10,212 |
Investor Class | 1.25 - 1.15%* | 3,341 |
| | $ 13,553 |
* Expense limitation in effect at period end.
Effective February 1, 2008, the expense limitation changed to 1.08% for Investor Class.
Many of the brokers with whom FMR places trades on behalf of the Fund provided services to the Fund in addition to trade execution. These services included payments of certain expenses on behalf of the Fund totaling $153 for the period.
Annual Report
Notes to Financial Statements - continued
9. Other.
The Fund's organizational documents provide former and current trustees and officers with a limited indemnification against liabilities arising in connection with the performance of their duties to the Fund. In the normal course of business, the Fund may also enter into contracts that provide general indemnifications. The Fund's maximum exposure under these arrangements is unknown as this would be dependent on future claims that may be made against the Fund. The risk of material loss from such claims is considered remote.
At the end of the period, FMR or its affiliates were the owners of record of 100% of the total outstanding shares of the Fund.
The United States Securities and Exchange Commission ("SEC") is conducting an investigation of FMR (covering the years 2002 to 2004) arising from gifts, gratuities and business entertainment provided by certain brokers to certain individuals who were employed on FMR's domestic equity trading desk during that period. FMR is in discussions with the SEC staff regarding the possible resolution of the matter, but as of period-end no final resolution has been reached.
In December 2006, the Independent Trustees completed their own investigation of the matter with the assistance of independent counsel. The Independent Trustees and FMR agree that, despite the absence of proof that the Fidelity mutual funds experienced diminished execution quality as a result of the improper receipt of gifts and business entertainment, the conduct at issue was serious and is worthy of redress. Accordingly, the Independent Trustees have requested and FMR has agreed to pay $42 million to Fidelity mutual funds, plus interest to be determined at the time that payment is made. A method of allocating this payment among the funds has not yet been determined. The total payment to the Fund is not anticipated to have a material impact on the Fund's net assets. In addition, FMR reimbursed related legal expenses which are recorded in the accompanying Statement of Operations as an expense reduction.
10. Distributions to Shareholders.
Distributions to shareholders of each class were as follows:
Years ended December 31, | 2007 | 2006 |
From net investment income | | |
Initial Class | $ 21,493 | $ 59,733 |
Investor Class | 5,883 | 17,920 |
Total | $ 27,376 | $ 77,653 |
From net realized gain | | |
Initial Class | $ 642,099 | $ - |
Investor Class | 208,664 | - |
Total | $ 850,763 | $ - |
11. Share Transactions.
Transactions for each class of shares were as follows:
| Shares | Dollars |
Years ended December 31, | 2007 | 2006 | 2007 | 2006 |
Initial Class | | | | |
Shares sold | 194,438 | 587,575 | $ 2,608,051 | $ 7,314,538 |
Reinvestment of distributions | 60,458 | 4,634 | 663,592 | 59,733 |
Shares redeemed | (682,661) | (351,833) | (9,097,868) | (4,301,667) |
Net increase (decrease) | (427,765) | 240,376 | $ (5,826,225) | $ 3,072,604 |
Investor Class | | | | |
Shares sold | 215,844 | 344,914 | $ 2,882,128 | $ 4,271,675 |
Reinvestment of distributions | 19,548 | 1,391 | 214,547 | 17,920 |
Shares redeemed | (347,583) | (44,309) | (4,570,323) | (547,431) |
Net increase (decrease) | (112,191) | 301,996 | $ (1,473,648) | $ 3,742,164 |
Annual Report
Report of Independent Registered Public Accounting Firm
To the Trustees of Variable Insurance Products Fund IV and the Shareholders of VIP Consumer Discretionary Portfolio:
In our opinion, the accompanying statement of assets and liabilities, including the schedule of investments, and the related statements of operations and of changes in net assets and the financial highlights present fairly, in all material respects, the financial position of VIP Consumer Discretionary Portfolio (a fund of Variable Insurance Products Fund IV) at December 31, 2007, the results of its operations for the year then ended, the changes in its net assets for each of the two years in the period then ended and the financial highlights for each of the periods indicated, in conformity with accounting principles generally accepted in the United States of America. These financial statements and financial highlights (hereafter referred to as "financial statements") are the responsibility of the VIP Consumer Discretionary Portfolio's management. Our responsibility is to express an opinion on these financial statements based on our audits. We conducted our audits of these financial statements in accordance with the standards of the Public Company Accounting Oversight Board (United States). Those standards require that we plan and perform the audit to obtain reasonable assurance about whether the financial statements are free of material misstatement. An audit includes examining, on a test basis, evidence supporting the amounts and disclosures in the financial statements, assessing the accounting principles used and significant estimates made by management, and evaluating the overall financial statement presentation. We believe that our audits, which included confirmation of securities at December 31, 2007 by correspondence with the custodian and brokers, provide a reasonable basis for our opinion.
/s/ PricewaterhouseCoopers LLP
PricewaterhouseCoopers LLP
Boston, Massachusetts
February 14, 2008
Annual Report
Trustees and Officers
The Trustees, Members of the Advisory Board, and executive officers of the trust and fund, as applicable, are listed below. The Board of Trustees governs the fund and is responsible for protecting the interests of shareholders. The Trustees are experienced executives who meet periodically throughout the year to oversee the fund's activities, review contractual arrangements with companies that provide services to the fund, and review the fund's performance. Except for James C. Curvey, each of the Trustees oversees 373 funds advised by FMR or an affiliate. Mr. Curvey oversees 368 funds advised by FMR or an affiliate.
The Trustees hold office without limit in time except that (a) any Trustee may resign; (b) any Trustee may be removed by written instrument, signed by at least two-thirds of the number of Trustees prior to such removal; (c) any Trustee who requests to be retired or who has become incapacitated by illness or injury may be retired by written instrument signed by a majority of the other Trustees; and (d) any Trustee may be removed at any special meeting of shareholders by a two-thirds vote of the outstanding voting securities of the trust. Each Trustee who is not an interested person (as defined in the 1940 Act) (Independent Trustee), shall retire not later than the last day of the calendar year in which his or her 72nd birthday occurs. The Independent Trustees may waive this mandatory retirement age policy with respect to individual Trustees. The executive officers and Advisory Board Members hold office without limit in time, except that any officer and Advisory Board Member may resign or may be removed by a vote of a majority of the Trustees at any regular meeting or any special meeting of the Trustees. Except as indicated, each individual has held the office shown or other offices in the same company for the past five years.
The fund's Statement of Additional Information (SAI) includes more information about the Trustees. To request a free copy, call Fidelity at 1-877-208-0098.
Interested Trustees*:
Correspondence intended for each Trustee who is an interested person may be sent to Fidelity Investments, 82 Devonshire Street, Boston, Massachusetts 02109.
Name, Age; Principal Occupation |
Edward C. Johnson 3d (77) |
| Year of Election or Appointment: 1983 Mr. Johnson is Chairman of the Board of Trustees. Mr. Johnson serves as President (2006-present), Chief Executive Officer, Chairman, and a Director of FMR LLC; Chairman and a Director of FMR; Chairman and a Director of Fidelity Research & Analysis Company (FRAC); Chairman and a Director of Fidelity Investments Money Management, Inc.; and Chairman (2001-present) and a Director of FMR Co., Inc. In addition, Mr. Johnson serves as Chairman and Director of Fidelity International Limited (FIL). Mr. Edward C. Johnson 3d and Mr. Arthur E. Johnson are not related. |
James C. Curvey (72) |
| Year of Election or Appointment: 2007 Mr. Curvey also serves as Trustee (2007-present) or Member of the Advisory Board (2007-present) of other investment companies advised by FMR. Mr. Curvey is a Director of FMR and FMR Co., Inc. (2007-present). Mr. Curvey is also Vice Chairman (2006-present) and Director of FMR LLC. Mr. Curvey joined Fidelity in 1982 and served in numerous senior management positions, including President and Chief Operating Officer of FMR LLC (1997-2000) and President of Fidelity Strategic Investments (2000-2002). In addition, he serves as a member of the Board of Directors of Geerlings & Wade, Inc. (wine distribution). |
* Trustees have been determined to be "Interested Trustees" by virtue of, among other things, their affiliation with the trust or various entities under common control with FMR. FMR Corp. merged with and into FMR LLC on October 1, 2007. Any references to FMR LLC for prior periods are deemed to be references to the prior entity.
Independent Trustees:
Correspondence intended for each Independent Trustee (that is, the Trustees other than the Interested Trustees) may be sent to Fidelity Investments, P.O. Box 55235, Boston, Massachusetts 02205-5235.
Name, Age; Principal Occupation |
Dennis J. Dirks (59) |
| Year of Election or Appointment: 2005 Prior to his retirement in May 2003, Mr. Dirks was Chief Operating Officer and a member of the Board of The Depository Trust & Clearing Corporation (DTCC) (1999-2003). He also served as President, Chief Operating Officer, and Board member of The Depository Trust Company (DTC) (1999-2003) and President and Board member of the National Securities Clearing Corporation (NSCC) (1999-2003). In addition, Mr. Dirks served as Chief Executive Officer and Board member of the Government Securities Clearing Corporation (2001-2003) and Chief Executive Officer and Board member of the Mortgage-Backed Securities Clearing Corporation (2001-2003). Mr. Dirks also serves as a Trustee and a member of the Finance Committee of Manhattan College (2005-present) and a Trustee and a member of the Finance Committee of AHRC of Nassau County (2006-present). |
Albert R. Gamper, Jr. (65) |
| Year of Election or Appointment: 2006 Prior to his retirement in December 2004, Mr. Gamper served as Chairman of the Board of CIT Group Inc. (commercial finance). During his tenure with CIT Group Inc. Mr. Gamper served in numerous senior management positions, including Chairman (1987-1989; 1999-2001; 2002-2004), Chief Executive Officer (1987-2004), and President (1989-2002). He currently serves as a member of the Board of Directors of Public Service Enterprise Group (utilities, 2001-present), Chairman of the Board of Governors, Rutgers University (2004-present), and Chairman of the Board of Saint Barnabas Health Care System. |
George H. Heilmeier (71) |
| Year of Election or Appointment: 2004 Dr. Heilmeier is Chairman Emeritus of Telcordia Technologies (communication software and systems), where prior to his retirement, he served as company Chairman and Chief Executive Officer. He currently serves on the Boards of Directors of The Mitre Corporation (systems engineering and information technology support for the government), and HRL Laboratories (private research and development, 2004-present). He is Chairman of the General Motors Science & Technology Advisory Board and a Life Fellow of the Institute of Electrical and Electronics Engineers (IEEE). Dr. Heilmeier is a member of the Defense Science Board and the National Security Agency Advisory Board. He is also a member of the National Academy of Engineering, the American Academy of Arts and Sciences, and the Board of Overseers of the School of Engineering and Applied Science of the University of Pennsylvania. Previously, Dr. Heilmeier served as a Director of TRW Inc. (automotive, space, defense, and information technology, 1992-2002), Compaq (1994-2002), Automatic Data Processing, Inc. (ADP) (technology-based business outsourcing, 1995-2002), INET Technologies Inc. (telecommunications network surveillance, 2001-2004), and Teletech Holdings (customer management services). He is the recipient of the 2005 Kyoto Prize in Advanced Technology for his invention of the liquid crystal display, and a member of the Consumer Electronics Hall of Fame. |
James H. Keyes (67) |
| Year of Election or Appointment: 2007 Prior to his retirement in 2003, Mr. Keyes was Chairman, President, and Chief Executive Officer of Johnson Controls, Inc. (automotive supplier, 1993-2003). He currently serves as a member of the boards of LSI Logic Corporation (semiconductor technologies), Navistar International Corporation (manufacture and sale of trucks, buses, and diesel engines, 2002-present), and Pitney Bowes, Inc. (integrated mail, messaging, and document management solutions). |
Marie L. Knowles (61) |
| Year of Election or Appointment: 2001 Prior to Ms. Knowles' retirement in June 2000, she served as Executive Vice President and Chief Financial Officer of Atlantic Richfield Company (ARCO) (diversified energy, 1996-2000). From 1993 to 1996, she was a Senior Vice President of ARCO and President of ARCO Transportation Company. She served as a Director of ARCO from 1996 to 1998. She currently serves as a Director of Phelps Dodge Corporation (copper mining and manufacturing) and McKesson Corporation (healthcare service, 2002-present). Ms. Knowles is a Trustee of the Brookings Institution and the Catalina Island Conservancy and also serves as a member of the Advisory Board for the School of Engineering of the University of Southern California. |
Ned C. Lautenbach (63) |
| Year of Election or Appointment: 2000 Mr. Lautenbach is Chairman of the Independent Trustees (2006-present). Mr. Lautenbach has been a partner of Clayton, Dubilier & Rice, Inc. (private equity investment firm) since September 1998. Previously, Mr. Lautenbach was with the International Business Machines Corporation (IBM) from 1968 until his retirement in 1998. Mr. Lautenbach serves as a Director of Sony Corporation (2006-present) and Eaton Corporation (diversified industrial) as well as the Philharmonic Center for the Arts in Naples, Florida. He also is a member of the Board of Trustees of Fairfield University (2005-present), as well as a member of the Council on Foreign Relations. |
Cornelia M. Small (63) |
| Year of Election or Appointment: 2005 Ms. Small is a member (2000-present) and Chairperson (2002-present) of the Investment Committee, and a member (2002-present) of the Board of Trustees of Smith College. Previously, she served as Chief Investment Officer (1999-2000), Director of Global Equity Investments (1996-1999), and a member of the Board of Directors of Scudder, Stevens & Clark (1990-1997) and Scudder Kemper Investments (1997-1999). In addition, Ms. Small served as Co-Chair (2000-2003) of the Annual Fund for the Fletcher School of Law and Diplomacy. |
William S. Stavropoulos (68) |
| Year of Election or Appointment: 2001 Mr. Stavropoulos is Chairman Emeritus of the Board of Directors of The Dow Chemical Company. Since joining The Dow Chemical Company in 1967, Mr. Stavropoulos served in numerous senior management positions, including President (1993-2000; 2002-2003), CEO (1995-2000; 2002-2004), and Chairman of the Executive Committee (2000-2004). Currently, he is a Director of NCR Corporation (data warehousing and technology solutions), Chemical Financial Corporation, Maersk Inc. (industrial conglomerate, 2002-present), Tyco International, Inc. (multinational manufacturing and services, 2007-present), and a member of the Advisory Board for Metalmark Capital (private equity investment firm, 2005-present). He is a special advisor to Clayton, Dubilier & Rice, Inc., a private equity investment firm. He also serves as a member of the Board of Trustees of the American Enterprise Institute for Public Policy Research. In addition, Mr. Stavropoulos is a member of The Business Council, J.P. Morgan International Council and the University of Notre Dame Advisory Council for the College of Science. |
Kenneth L. Wolfe (68) |
| Year of Election or Appointment: 2005 Mr. Wolfe is Chairman and a Director of Hershey Foods Corporation (2007-present), where prior to his retirement in 2001, he was Chairman and Chief Executive Officer. Mr. Wolfe currently serves as a member of the board of Revlon Inc. (2004-present). Previously, Mr. Wolfe served as a member of the boards of Adelphia Communications Corporation (2003-2006) and Bausch & Lomb, Inc. (1993-2007). |
Advisory Board Members and Executive Officers**:
Correspondence intended for Mr. Mauriello, Mr. Thomas, Mr. Wiley, Mr. Lacy, and Mr. Arthur Johnson may be sent to Fidelity Investments, P.O. Box 55235, Boston, Massachusetts 02205-5235. Correspondence intended for each executive officer and Mr. Lynch may be sent to Fidelity Investments, 82 Devonshire Street, Boston, Massachusetts 02109.
Name, Age; Principal Occupation |
Arthur E. Johnson (60) |
| Year of Election or Appointment: 2008 Member of the Advisory Board of Variable Insurance Products Fund IV. Mr. Johnson serves as Senior Vice President of Corporate Strategic Development of Lockheed Martin Corporation (defense contractor). In addition, Mr. Johnson serves as a member of the Board of Directors of AGL Resources, Inc. (holding company, 2002-present), and IKON Office Solutions, Inc. (document management systems and services). Mr. Arthur E. Johnson and Mr. Edward C. Johnson 3d are not related. |
Alan J. Lacy (54) |
| Year of Election or Appointment: 2008 Member of the Advisory Board of Variable Insurance Products Fund IV. Mr. Lacy serves as Senior Adviser (2007-present) of Oak Hill Capital Partners, L.P. (a private equity firm). Mr. Lacy also served as Vice Chairman and Chief Executive Officer of Sears Holdings Corporation and Sears, Roebuck and Co. (retail, 2005-2006; 2000-2005). In addition, Mr. Lacy serves as a member of the Board of Directors of The Western Union Company (global money transfer, 2006-present) and Bristol-Myers Squibb (global pharmaceuticals, 2007-present). Mr. Lacy is a Trustee of the National Parks Conservation Association and The Field Museum of Natural History. |
Peter S. Lynch (63) |
| Year of Election or Appointment: 2003 Member of the Advisory Board of Variable Insurance Products Fund IV. Mr. Lynch is Vice Chairman and a Director of FMR, and Vice Chairman (2001-present) and a Director of FMR Co., Inc. Previously, Mr. Lynch served as a Trustee of the Fidelity funds (1990-2003). In addition, he serves as a Trustee of Boston College and as the Chairman of the Inner-City Scholarship Fund. |
Joseph Mauriello (63) |
| Year of Election or Appointment: 2007 Member of the Advisory Board of Variable Insurance Products Fund IV. Prior to his retirement in January 2006, Mr. Mauriello served in numerous senior management positions including Deputy Chairman and Chief Operating Officer (2004-2005), and Vice Chairman of Financial Services (2002-2004) of KPMG LLP US (professional services firm, 1965-2005). Mr. Mauriello currently serves as a member of the Board of Directors of XL Capital Ltd. (global insurance and re-insurance company, 2006-present) and of Arcadia Resources Inc. (health care services and products, 2007-present). He also served as a Director of the Hamilton Funds of the Bank of New York (2006-2007). |
David M. Thomas (58) |
| Year of Election or Appointment: 2007 Member of the Advisory Board of Variable Insurance Products Fund IV. Previously, Mr. Thomas served as Executive Chairman (2005-2006) and Chairman and Chief Executive Officer (2000-2005) of IMS Health, Inc. (pharmaceutical and healthcare information solutions). In addition, Mr. Thomas serves as a member of the Board of Directors of Fortune Brands, Inc. (consumer products holding company), and Interpublic Group of Companies, Inc. (marketing communication, 2004-present). |
Michael E. Wiley (57) |
| Year of Election or Appointment: 2007 Member of the Advisory Board of Variable Insurance Products Fund IV. Mr. Wiley also serves as a member of the Board of Trustees of the University of Tulsa (2000-2006; 2007-present). He serves as a Director of Tesoro Corporation (independent oil refiner and marketer, 2005-present), and a Director of Bill Barrett Corporation (exploration and production company, 2005-present). In addition, he also serves as a Director of Post Oak Bank (privately-held bank, 2004-present). Previously, Mr. Wiley served as a Sr. Energy Advisor of Katzenbach Partners, LLC (consulting firm, 2006-2007), as an Advisory Director of Riverstone Holdings (private investment firm), Chairman, President, and CEO of Baker Hughes, Inc. (oilfield services company, 2000-2004), and as Director of Spinnaker Exploration Company (exploration and production company, 2001-2005). |
Kimberley H. Monasterio (44) |
| Year of Election or Appointment: 2007 President and Treasurer of VIP Consumer Discretionary. Ms. Monasterio also serves as President and Treasurer of other Fidelity funds (2007-present) and is an employee of FMR (2004-present). Previously, Ms. Monasterio served as Deputy Treasurer of the Fidelity funds (2004-2006). Before joining Fidelity Investments, Ms. Monasterio served as Treasurer (2000-2004) and Chief Financial Officer (2002-2004) of the Franklin Templeton Funds and Senior Vice President of Franklin Templeton Services, LLC (2000-2004). |
Brian B. Hogan (43) |
| Year of Election or Appointment: 2007 Vice President of VIP Consumer Discretionary. Mr. Hogan also serves as Vice President of Sector Funds (2007-present). Mr. Hogan is Senior Vice President of Equity Research (2006-present). Mr. Hogan also serves as Vice President of FMR and FMR Co., Inc. Previously, Mr. Hogan served as a portfolio manager. |
Eric D. Roiter (59) |
| Year of Election or Appointment: 2001 Secretary of VIP Consumer Discretionary. He also serves as Secretary of other Fidelity funds; Vice President, General Counsel, and Secretary of FMR Co., Inc. (2001-present) and FMR; Assistant Secretary of Fidelity Management & Research (U.K.) Inc. (2001-present), Fidelity Research & Analysis Company (2001-present), and Fidelity Investments Money Management, Inc. (2001-present). Mr. Roiter is an Adjunct Member, Faculty of Law, at Boston College Law School (2003-present). Previously, Mr. Roiter served as Vice President and Secretary of Fidelity Distributors Corporation (FDC) (1998-2005). |
John B. McGinty, Jr. (45) |
| Year of Election or Appointment: 2008 Assistant Secretary of VIP Consumer Discretionary. Mr. McGinty also serves as Assistant Secretary of other Fidelity funds (2008-present) and is an employee of FMR LLC (2004-present). Mr. McGinty also serves as Senior Vice President, Secretary, and Chief Legal Officer of FDC (2007-present). Before joining Fidelity Investments, Mr. McGinty practiced law at Ropes & Gray, LLP. |
R. Stephen Ganis (41) |
| Year of Election or Appointment: 2006 Anti-Money Laundering (AML) officer of VIP Consumer Discretionary. Mr. Ganis also serves as AML officer of other Fidelity funds (2006-present) and FMR LLC (2003-present). Before joining Fidelity Investments, Mr. Ganis practiced law at Goodwin Procter, LLP (2000-2002). |
Joseph B. Hollis (59) |
| Year of Election or Appointment: 2006 Chief Financial Officer of VIP Consumer Discretionary. Mr. Hollis also serves as Chief Financial Officer of other Fidelity funds. Mr. Hollis is President of Fidelity Pricing and Cash Management Services (FPCMS) (2005-present). Mr. Hollis also serves as President and Director of Fidelity Service Company, Inc. (2006-present). Previously, Mr. Hollis served as Senior Vice President of Cash Management Services (1999-2002) and Investment Management Operations (2002-2005). |
Kenneth A. Rathgeber (60) |
| Year of Election or Appointment: 2004 Chief Compliance Officer of VIP Consumer Discretionary. Mr. Rathgeber also serves as Chief Compliance Officer of other Fidelity funds (2004-present) and Executive Vice President of Risk Oversight for Fidelity Investments (2002-present). He is Chief Compliance Officer of FMR (2005-present), FMR Co., Inc. (2005-present), Fidelity Management & Research (U.K.) Inc. (2005-present), Fidelity Research & Analysis Company (2005-present), Fidelity Investments Money Management, Inc. (2005-present), and Strategic Advisers, Inc. (2005-present). Previously, Mr. Rathgeber served as Executive Vice President and Chief Operating Officer for Fidelity Investments Institutional Services Company, Inc. (1998-2002). |
Bryan A. Mehrmann (46) |
| Year of Election or Appointment: 2005 Deputy Treasurer of VIP Consumer Discretionary. Mr. Mehrmann also serves as Deputy Treasurer of other Fidelity funds (2005-present) and is an employee of FMR. Previously, Mr. Mehrmann served as Vice President of Fidelity Investments Institutional Services Group (FIIS)/Fidelity Investments Institutional Operations Corporation, Inc. (FIIOC) Client Services (1998-2004). |
Kenneth B. Robins (38) |
| Year of Election or Appointment: 2005 Deputy Treasurer of VIP Consumer Discretionary. Mr. Robins also serves as Deputy Treasurer of other Fidelity funds (2005-present) and is an employee of FMR (2004-present). Before joining Fidelity Investments, Mr. Robins worked at KPMG LLP, where he was a partner in KPMG's department of professional practice (2002-2004) and a Senior Manager (1999-2000). In addition, Mr. Robins served as Assistant Chief Accountant, United States Securities and Exchange Commission (2000-2002). |
Robert G. Byrnes (41) |
| Year of Election or Appointment: 2005 Assistant Treasurer of VIP Consumer Discretionary. Mr. Byrnes also serves as Assistant Treasurer of other Fidelity funds (2005-present) and is an employee of FMR (2005-present). Previously, Mr. Byrnes served as Vice President of FPCMS (2003-2005). Before joining Fidelity Investments, Mr. Byrnes worked at Deutsche Asset Management where he served as Vice President of the Investment Operations Group (2000-2003). |
Peter L. Lydecker (53) |
| Year of Election or Appointment: 2004 Assistant Treasurer of VIP Consumer Discretionary. Mr. Lydecker also serves as Assistant Treasurer of other Fidelity funds (2004) and is an employee of FMR. |
Paul M. Murphy (60) |
| Year of Election or Appointment: 2007 Assistant Treasurer of VIP Consumer Discretionary. Mr. Murphy also serves as Assistant Treasurer of other Fidelity funds (2007-present) and is an employee of FMR (2007-present). Previously, Mr. Murphy served as Chief Financial Officer of the Fidelity Funds (2005-2006), Vice President and Associate General Counsel of FMR (2007), and Senior Vice President of Fidelity Pricing and Cash Management Services Group (FPCMS) (1994-2007). |
Gary W. Ryan (49) |
| Year of Election or Appointment: 2005 Assistant Treasurer of VIP Consumer Discretionary. Mr. Ryan also serves as Assistant Treasurer of other Fidelity funds (2005-present) and is an employee of FMR (2005-present). Previously, Mr. Ryan served as Vice President of Fund Reporting in FPCMS (1999-2005). |
** FMR Corp. merged with and into FMR LLC on October 1, 2007. Any references to FMR LLC for prior periods are deemed to be references to the prior entity.
Annual Report
Distributions
The Board of Trustees of VIP IV Consumer Discretionary Portfolio (the Fund) voted to pay to shareholders of record at the opening of business on record date, the following distributions per share derived from capital gains realized from sales of portfolio securities:
| Pay Date | Record Date | Capital Gains |
Initial Class | 02/08/08 | 02/08/08 | $0.085 |
Investor Class | 02/08/08 | 02/08/08 | $0.085 |
Initial Class, and Investor Class designate 58% of the dividends distributed during the fiscal year as qualifying for the dividends-received deduction for corporate shareholders.
The fund will notify shareholders in January 2008 of amounts for use in preparing 2007 income tax returns.
Annual Report
Board Approval of Investment Advisory Contracts and Management Fees
VIP Consumer Discretionary Portfolio
Each year, typically in July, the Board of Trustees, including the Independent Trustees (together, the Board), votes on the renewal of the management contract and sub-advisory agreements (together, the Advisory Contracts) for the fund. The Board, assisted by the advice of fund counsel and Independent Trustees' counsel, requests and considers a broad range of information throughout the year.
The Board meets regularly each month except August and takes into account throughout the year matters bearing on Advisory Contracts. The Board, acting directly and through its separate committees, considers at each of its meetings factors that are relevant to the annual renewal of the fund's Advisory Contracts, including the services and support provided to the fund and its shareholders. At the time of the renewal, the Board had 12 standing committees, each composed of Independent Trustees with varying backgrounds, to which the Board has assigned specific subject matter responsibilities in order to enhance effective decision-making by the Board. Each committee has adopted a written charter outlining the structure and purposes of the committee. One such committee, the Equity Contract Committee, meets periodically as needed throughout the year to consider matters specifically related to the annual renewal of Advisory Contracts. The committee requests and receives information on, and makes recommendations to the Independent Trustees concerning, the approval and annual review of the Advisory Contracts.
At its July 2007 meeting, the Board of Trustees, including the Independent Trustees, unanimously determined to renew the Advisory Contracts for the fund. In reaching its determination, the Board considered all factors it believed relevant, including (i) the nature, extent, and quality of the services to be provided to the fund and its shareholders (including the investment performance of the fund); (ii) the competitiveness of the management fee and total expenses of the fund; (iii) the total costs of the services to be provided by and the profits to be realized by the investment adviser and its affiliates from the relationship with the fund; (iv) the extent to which economies of scale would be realized as the fund grows; and (v) whether fee levels reflect these economies of scale, if any, for the benefit of fund shareholders. The Board also approved amendments to the fund's agreements with foreign sub-advisers to clarify that each sub-adviser provides services as an independent contractor.
In determining whether to renew the Advisory Contracts for the fund, the Board ultimately reached a determination, with the assistance of fund counsel and Independent Trustees' counsel, that the renewal of the Advisory Contracts and the compensation to be received by Fidelity under the management contract is consistent with Fidelity's fiduciary duty under applicable law. In addition to evaluating the specific factors noted above, the Board, in reaching its determination, is aware that shareholders in the fund have a broad range of investment choices available to them, including a wide choice among mutual funds offered by competitors to Fidelity, and that the fund's shareholders, with the opportunity to review and weigh the disclosure provided by the fund in its prospectus and other public disclosures, have chosen to invest in this fund, managed by Fidelity.
Nature, Extent, and Quality of Services Provided. The Board considered staffing within the investment adviser, FMR, and the sub-advisers (together, the Investment Advisers), including the background of the fund's portfolio manager and the fund's investment objective and discipline. The Independent Trustees also had discussions with senior management of Fidelity's investment operations and investment groups. The Board considered the structure of the portfolio manager compensation program and whether this structure provides appropriate incentives.
Resources Dedicated to Investment Management and Support Services. The Board reviewed the size, education, and experience of the Investment Advisers' investment staff, their use of technology, and the Investment Advisers' approach to recruiting, training, and retaining portfolio managers and other research, advisory, and management personnel. The Board considered Fidelity's extensive global research capabilities that enable the Investment Advisers to aggregate data from various sources in an effort to produce positive investment results. The Board noted that Fidelity's analysts have access to a variety of technological tools that enable them to perform both fundamental and quantitative analysis and to specialize in various disciplines. The Board also considered that Fidelity's portfolio managers and analysts have access to daily portfolio attribution that allows for monitoring of a fund's portfolio, as well as an electronic communication system that provides immediate real-time access to research concerning issuers and credit enhancers.
Shareholder and Administrative Services. The Board considered (i) the nature, extent, quality, and cost of advisory, administrative, distribution, and shareholder services performed by the Investment Advisers and their affiliates under the Advisory Contracts and under separate agreements covering transfer agency, pricing and bookkeeping, and securities lending services for the fund; (ii) the nature and extent of the Investment Advisers' supervision of third party service providers, principally custodians and subcustodians; and (iii) the resources devoted to, and the record of compliance with, the fund's compliance policies and procedures. The Board reviewed the allocation of fund brokerage, including allocations to brokers affiliated with the Investment Advisers, the use of brokerage commissions to pay fund expenses, and the use of "soft" commission dollars to pay for research services. The Board also considered that Fidelity voluntarily pays for market data out of its own resources. The Board also considered the agreement reached between the Independent Trustees and Fidelity in December 2006 following an independent review of matters relating to receipt of travel, entertainment, gifts and gratuities in violation of Fidelity policies.
The Board noted that the growth of fund assets across the complex allows Fidelity to reinvest in the development of services designed to enhance the value or convenience of the Fidelity funds as investment vehicles. These services include 24-hour access to account information and market information through phone representatives and over the Internet, and investor education materials and asset allocation tools.
Annual Report
Investment in a Large Fund Family. The Board considered the benefits to shareholders of investing in a Fidelity fund, including the benefits of investing in a fund that is part of a large family of funds offering a variety of investment disciplines and providing for a large variety of mutual fund investor services. The Board noted that, since the last Advisory Contract renewals in July 2006, Fidelity has taken a number of actions that benefited particular funds, including (i) dedicating additional resources to investment research and to restructure the investment research teams; (ii) contractually agreeing to reduce the management fee on Fidelity Advisor Floating Rate High Income Fund; (iii) contractually agreeing to reduce the management fees on Fidelity's California, Massachusetts, New Jersey, and New York AMT Tax-Free Money Market Funds, launching new Institutional Classes and Service Classes of these funds, and contractually agreeing to impose expense limitations on these funds; (iv) eliminating the exchange fee on the Fidelity Select Portfolios and reducing the pricing and bookkeeping fee rates for these funds; (v) reducing the maximum transfer agency fee rates on high income funds and certain equity funds; (vi) proposing amended management contracts that, if approved by shareholders, will add a performance adjustment component to the management fees paid by 18 Fidelity Advisor equity funds; (vii) contractually agreeing to reduce fees for Ultra-Short Central Fund and the money market Central Funds; (viii) waiving the Fidelity Advisor funds' contingent deferred sales charge on certain redemptions made through systematic withdrawal programs; and (ix) amending the management contracts for equity and fixed-income funds whose management contracts incorporate a "group fee" structure by adding four new fee "breakpoints" to the group fee rate schedules.
Investment Performance and Compliance. The Board considered whether the fund has operated within its investment objective, as well as its record of compliance with its investment restrictions. It also reviewed the fund's absolute investment performance for each class, as well as the fund's relative investment performance for each class measured against a third-party-sponsored index that reflects the market sector in which the fund invests over multiple periods. The Board noted that FMR does not believe that a meaningful peer group exists against which to compare the fund's performance. The Board also noted that in 2006 FMR implemented changes to the sector fund product line, which included a change to the fund's index. The following charts considered by the Board show, over the one-, three-, and five-year periods ended December 31, 2006, as available, the cumulative total returns of Initial Class and Investor Class of the fund and the cumulative total returns of a third-party-sponsored index ("benchmark").
VIP Consumer Discretionary Portfolio
The Board stated that the relative investment performance of the fund was lower than its benchmark for all the periods shown. The Board considered that the variations in performance between the fund's classes reflect the variations in class expenses, which result in lower performance for the higher expense class. The Board discussed with FMR actions to be taken by FMR to improve the funds below-benchmark performance.
The Board considered that FMR has taken steps to refocus and strengthen equity research, equity portfolio management, and compliance.
Based on its review, and giving particular weight to the nature and quality of the resources dedicated by the Investment Advisers to maintain and improve relative performance, the Board concluded that the nature, extent, and quality of the services provided to the fund will benefit the fund's shareholders, particularly in light of the Board's view that the fund's shareholders benefit from investing in a fund that is part of a large family of funds offering a variety of investment disciplines and services.
Competitiveness of Management Fee and Total Fund Expenses. The Board considered the fund's management fee and total expenses compared to "mapped groups" of competitive funds and classes. Fidelity creates "mapped groups" by combining similar Lipper investment objective categories that have comparable management fee characteristics. Combining Lipper investment objective categories aids the Board's management fee and total expense comparisons by broadening the competitive group used for comparison and by reducing the number of universes to which various Fidelity funds are compared. The Board also considered supplemental information about how the fund's management fee and total expenses ranked relative to groups based on Lipper classifications, which take into account a fund's market capitalization and style.
Annual Report
Board Approval of Investment Advisory Contracts and Management Fees - continued
The Board considered two proprietary management fee comparisons for the 12-month periods shown in the chart below. The group of Lipper funds used by the Board for management fee comparisons is referred to below as the "Total Mapped Group." The Total Mapped Group comparison focuses on a fund's standing relative to the total universe of comparable funds available to investors, in terms of gross management fees before expense reimbursements or caps. "TMG %" represents the percentage of funds in the Total Mapped Group that had management fees that were lower than the fund's. For example, a TMG % of 9% means that 91% of the funds in the Total Mapped Group had higher management fees than the fund. The "Asset-Size Peer Group" (ASPG) comparison focuses on a fund's standing relative to non-Fidelity funds similar in size to the fund within the Total Mapped Group. The ASPG represents at least 15% of the funds in the Total Mapped Group with comparable asset size and management fee characteristics, subject to a minimum of 50 funds (or all funds in the Total Mapped Group if fewer than 50). Additional information, such as the ASPG quartile in which the fund's management fee ranked, is also included in the chart and considered by the Board.
VIP Consumer Discretionary Portfolio
The Board noted that the fund's management fee ranked below the median of its Total Mapped Group and below the median of its ASPG for 2006.
Based on its review, the Board concluded that the fund's management fee was fair and reasonable in light of the services that the fund receives and the other factors considered.
In its review of each class's total expenses, the Board considered the fund's management fee as well as other fund or class expenses, as applicable, such as transfer agent fees, pricing and bookkeeping fees, and custodial, legal, and audit fees. The Board also noted the effects of any waivers and reimbursements on fees and expenses. As part of its review, the Board also considered current and historical total expenses of each class of the fund compared to competitive fund median expenses. Each class of the fund is compared to those funds and classes in the Total Mapped Group (used by the Board for management fee comparisons) that have a similar sales load structure.
The Board noted that the total expenses of each of Initial Class and Investor Class ranked above its competitive median for 2006. The Board noted that the fund offers multiple classes and that the multiple structures are intended to offer pricing options for the intermediary market. The Board also noted that the total expenses of the classes vary primarily due to differences in transfer agent fees. The Board considered that the total expenses of Initial Class were above the median because of relatively high "other expenses" (e.g., legal, audit, custody) due to small class size. The Board considered that the total expenses of Investor Class were above the median primarily due to its higher transfer agent fee.
In its review of total expenses, the Board also considered Fidelity fee structures and other information on clients that FMR and its affiliates service in other competitive markets, such as other mutual funds advised or subadvised by FMR or its affiliates, pension plan clients, and other institutional clients.
Based on its review, the Board concluded that the total expenses of each class of the fund were reasonable, although in one case above the median of the universe presented for comparison, in light of the services that the fund and its shareholders receive and the other factors considered.
Annual Report
Costs of the Services and Profitability. The Board considered the revenues earned and the expenses incurred by Fidelity in conducting the business of developing, marketing, distributing, managing, administering and servicing the fund and its shareholders. The Board also considered the level of Fidelity's profits in respect of all the Fidelity funds.
On an annual basis, FMR presents to the Board Fidelity's profitability for the fund. Fidelity calculates the profitability for each fund, as well as aggregate profitability for groups of Fidelity funds and all Fidelity funds, using a series of detailed revenue and cost allocation methodologies which originate with the audited books and records of Fidelity. The Audit Committee of the Board reviews any significant changes from the prior year's methodologies.
PricewaterhouseCoopers LLP (PwC), independent registered public accounting firm and auditor to Fidelity and certain Fidelity funds, has been engaged annually by the Board as part of the Board's assessment of the results of Fidelity's profitability analysis. PwC's engagement includes the review and assessment of Fidelity's methodologies used in determining the revenues and expenses attributable to Fidelity's mutual fund business, and completion of agreed-upon procedures surrounding the mathematical accuracy of fund profitability and its conformity to allocation methodologies. After considering PwC's reports issued under the engagement and information provided by Fidelity, the Board believes that while other allocation methods may also be reasonable, Fidelity's profitability methodologies are reasonable in all material respects.
The Board has also reviewed Fidelity's non-fund businesses and any fall-out benefits related to the mutual fund business as well as cases where Fidelity's affiliates may benefit from or be related to the fund's business.
The Board considered the costs of the services provided by and the profits realized by Fidelity in connection with the operation of the fund and determined that the amount of profit is a fair entrepreneurial profit for the management of the fund.
Economies of Scale. The Board considered whether there have been economies of scale in respect of the management of the Fidelity funds, whether the Fidelity funds (including the fund) have appropriately benefited from any such economies of scale, and whether there is potential for realization of any further economies of scale. The Board considered the extent to which the fund will benefit from economies of scale through increased services to the fund, through waivers or reimbursements, or through fee or expense reductions.
The Board recognized that the fund's management contract incorporates a "group fee" structure, which provides for lower group fee rates as total fund assets under FMR's management increase, and for higher group fee rates as total fund assets under FMR's management decrease. FMR determines the group fee rates based on a tiered asset "breakpoint" schedule. In connection with the renewal of the fund's management contract, the Board approved amendments to the fund's management contract that added four new fee breakpoints to the group fee rate schedule for assets under FMR's management above $1,386 billion. The Board considered that the group fee rate declines under both the present and amended schedules, but that under the amended schedule, the group fee rate declines faster as assets under FMR's management exceed $1,386 billion. The Board considered that the group fee is designed to deliver the benefits of economies of scale to fund shareholders when total fund assets increase, even if assets of any particular fund are unchanged or have declined, because some portion of Fidelity's costs are attributable to services provided to all Fidelity funds, and all funds benefit if those costs can be allocated among more assets. The Board concluded that, given the group fee structure, fund shareholders will achieve a certain level of economies of scale as assets under FMR's management increase at the fund complex level, regardless of whether Fidelity achieves any such economies of scale.
The Board further concluded that any potential economies of scale are being shared between fund shareholders and Fidelity in an appropriate manner.
Additional Information Requested by the Board. In order to develop fully the factual basis for consideration of the Fidelity funds' Advisory Contracts, the Board requested and received additional information on several topics, including (i) fund performance trends and actions to be taken by FMR to improve certain funds' overall performance; (ii) Fidelity's portfolio manager compensation structure, including its effects on fund profitability and the extent to which portfolio manager compensation is linked to fund performance; (iii) Fidelity's fee structures; (iv) the funds' sub-advisory arrangements; and (v) accounts managed by Fidelity other than the Fidelity funds.
Based on its evaluation of all of the conclusions noted above, and after considering all material factors, the Board ultimately concluded that the advisory fee structures are fair and reasonable, and that the fund's Advisory Contracts should be renewed.
Annual Report
Investment Adviser
Fidelity Management & Research Company
Boston, MA
Investment Sub-Advisers
FMR Co., Inc.
Fidelity Management & Research (U.K.) Inc.
Fidelity Research & Analysis Company
Fidelity Investments Japan Limited
Fidelity International Investment Advisors
Fidelity International Investment Advisors
(U.K.) Limited
General Distributor
Fidelity Distributors Corporation
Boston, MA
Transfer and Service Agents
Fidelity Investments Institutional Operations Company, Inc.
Boston, MA
Fidelity Service Company, Inc.
Boston, MA
Custodian
JPMorgan Chase Bank
New York, NY
VCONIC-ANN-0208
1.817355.102
Fidelity® Variable Insurance Products:
Consumer Staples Portfolio
Annual Report
December 31, 2007
(2_fidelity_logos) (Registered_Trademark)
Contents
Performance | <Click Here> | How the fund has done over time. |
Management's Discussion | <Click Here> | The manager's review of fund performance, strategy and outlook. |
Shareholder Expense Example | <Click Here> | An example of shareholder expenses. |
Investment Changes | <Click Here> | A summary of major shifts in the fund's investments over the past six months. |
Investments | <Click Here> | A complete list of the fund's investments with their
market values. |
Financial Statements | <Click Here> | Statements of assets and liabilities, operations, and
changes in net assets, as well as financial highlights. |
Notes | <Click Here> | Notes to the financial statements. |
Report of Independent Registered Public Accounting Firm | <Click Here> | |
Trustees and Officers | <Click Here> | |
Distributions | <Click Here> | |
To view a fund's proxy voting guidelines and proxy voting record for the 12-month period ended June 30, visit http://www.fidelity.com (search for "proxy voting guidelines") or visit the Securities and Exchange Commission's (SEC) web site at http://www.sec.gov. You may also call 1-877-208-0098 to request a free copy of the proxy voting guidelines.
Fidelity Variable Insurance Products are separate account options which are purchased through a variable insurance contract.
Standard & Poor's, S&P and S&P 500 are registered service marks of The McGraw-Hill Companies, Inc. and have been licensed for use by Fidelity Distributors Corporation.
Other third party marks appearing herein are the property of their respective owners.
All other marks appearing herein are registered or unregistered trademarks or service marks of FMR LLC or an affiliated company.
This report and the financial statements contained herein are submitted for the general information of the shareholders of the fund. This report is not authorized for distribution to prospective investors in the fund unless preceded or accompanied by an effective prospectus.
A fund files its complete schedule of portfolio holdings with the SEC for the first and third quarters of each fiscal year on Form N-Q. Forms N-Q are available on the SEC's web site at http://www.sec.gov. A fund's Forms N-Q may be reviewed and copied at the SEC's Public Reference Room in Washington, DC. Information regarding the operation of the SEC's Public Reference Room may be obtained by calling 1-800-SEC-0330. For a complete list of a fund's portfolio holdings, view the most recent holdings listing, semiannual report, or annual report on Fidelity's web site at http://www.fidelity.com or http://www.advisor.fidelity.com, as applicable.
NOT FDIC INSURED · MAY LOSE VALUE · NO BANK GUARANTEE
Neither the fund nor Fidelity Distributors Corporation is a bank.
Annual Report
Performance: The Bottom Line
Average annual total return reflects the change in the value of an investment, assuming reinvestment of the class' dividend income and capital gains (the profits earned upon the sale of securities that have grown in value, if any) and assuming a constant rate of performance each year. During periods of reimbursement by Fidelity, a fund's total return will be greater than it would be had the reimbursement not occurred. Performance numbers are net of all underlying fund operating expenses, but do not include any insurance charges imposed by your insurance company's separate account. If performance information included the effect of these additional charges, the total returns would have been lower. How a fund did yesterday is no guarantee of how it will do tomorrow.
Average annual total returns take VIP Consumer Staples Portfolio's cumulative total return and show you what would have happened if VIP Consumer Staples Portfolio shares had performed at a constant rate each year. These numbers will be reported once the fund is a year old.
$10,000 Over Life of Fund
Let's say hypothetically that $10,000 was invested in VIP Consumer Staples Portfolio - Initial Class on April 24, 2007, when the fund started. The chart shows how the value of your investment would have changed, and also shows how the Standard & Poor's 500SM Index (S&P 500®) performed over the same period.

Annual Report
Management's Discussion of Fund Performance
Comments from Robert Lee, Portfolio Manager of VIP Consumer Staples Portfolio
U.S. equity markets, as measured by the bellwether Dow Jones Industrial AverageSM and the Standard & Poor's 500SM Index, registered their fifth consecutive year of positive returns in 2007, as the Dow rose 8.88% and the S&P 500® index advanced 5.49%. The tech-heavy NASDAQ Composite® Index did even better, increasing 10.55%. However, credit- and recession-related concerns carved deeply into stock prices late in 2007, pushing some major market measures into negative territory for the year overall, particularly smaller-cap and value-oriented benchmarks. Based largely on a weak U.S. dollar that boosted returns for U.S. investors, the Morgan Stanley Capital InternationalSM Europe, Australasia, and Far East (MSCI® EAFE®) Index - a gauge of developed stock markets outside the United States and Canada - beat most domestic equity measures, gaining 11.33%. Several European countries had outstanding performance, including Finland and Germany, while Australia also did very well. However, fallout from the credit crunch and concerns about export growth tempered U.K. stocks, while fears that Japanese financial companies would become embroiled in the U.S. subprime mortgage crisis contributed to a loss of more than 4% for the Japanese portion of the index. The emerging-markets stock asset class soared 39.78% according to the MSCI Emerging Markets index. The U.S. investment-grade bond market climbed 6.97% as measured by the Lehman Brothers® U.S. Aggregate Index, beating the 2.53% gain for the Merrill Lynch® U.S. High Yield Master II Constrained Index. The emerging-markets bond category shook off a sluggish first half of 2007 to finish the year with a respectable gain of 6.28% as measured by the J.P. Morgan Emerging Markets Bond Index (EMBI) Global, while the Citigroup® Non-U.S. Group of 7 Index - representing the debt performance of major global economies, excluding the United States - rose 13.05%.
From its inception on April 24, 2007, through the end of the period on December 31, 2007, the fund solidly outperformed the Morgan Stanley Capital InternationalSM (MSCI®) US Investable Market Consumer Staples Index, which was up 6.93%, and the S&P 500, which returned 0.53% during the same time period. (For specific portfolio performance results, please refer to the performance section of this report.) Strong stock selection in packaged foods and meats companies, tobacco firms and brewers fueled the fund's outperformance versus the MSCI index. Our position in British American Tobacco (BAT) benefited from the firm's large exposure to emerging markets and from increases in market share, as consumers switched from cheaper local brands to BAT's higher-quality brands. Holdings in Dutch consumer products conglomerate Unilever and Coca-Cola Hellenic Bottling, a dominant soft drink distributor in Eastern Europe, also benefited from strong sales in emerging markets. I invested in Numico, a Dutch maker of infant and clinical nutrition products, at an attractive valuation and sold the position at a significant profit after another firm made an offer for Numico. Swiss food conglomerate Nestle contributed to results as well. None of the stocks just mentioned were components of the MSCI index. Lastly, underweighting major index component Wal-Mart helped relative performance, as the stock was dragged down by disappointing sales and earnings. On the negative side, relative performance was held back by stock selection in restaurants, biotechnology and agricultural products. In terms of individual detractors, avoiding index component Costco Wholesale hurt results, as the discount chain's stock did well during the period. Underweighting tobacco and food conglomerate Altria also hurt relative performance as its stock moved higher; I had underweighted Altria in favor of BAT, which I believed was a better opportunity in tobacco, and that strategy paid off. Out-of-index holdings in biotechnology firm Senomyx and Norway-headquartered Marine Harvest ASA, the world's largest fish farmer, detracted from performance as well.
The views expressed above reflect those of the portfolio manager(s) only through the end of the period as stated on the cover of this report and do not necessarily represent the views of Fidelity or any other person in the Fidelity organization. Any such views are subject to change at any time based upon market or other conditions and Fidelity disclaims any responsibility to update such views. These views may not be relied on as investment advice and, because investment decisions for a Fidelity fund are based on numerous factors, may not be relied on as an indication of trading intent on behalf of any Fidelity fund.
Annual Report
Shareholder Expense Example
As a shareholder of the Fund, you incur two types of costs: (1) transaction costs, including redemption fees, and (2) ongoing costs, including management fees and other Fund expenses. This Example is intended to help you understand your ongoing costs (in dollars) of investing in the Fund and to compare these costs with the ongoing costs of investing in other mutual funds.
The Example is based on an investment of $1,000 invested at the beginning of the period and held for the entire period (July 1, 2007 to
December 31, 2007).
Actual Expenses
The first line of the accompanying table for each class of the Fund provides information about actual account values and actual expenses. You may use the information in this line, together with the amount you invested, to estimate the expenses that you paid over the period. Simply divide your account value by $1,000.00 (for example, an $8,600 account value divided by $1,000.00 = 8.6), then multiply the result by the number in the first line for a class of the Fund under the heading entitled "Expenses Paid During Period" to estimate the expenses you paid on your account during this period. The estimate of expenses does not include any fees or other expenses of any variable annuity or variable life insurance product. If they were, the estimate of expenses you paid during the period would be higher, and your ending account value would be lower. In addition, the Fund, as a shareholder in the underlying Fidelity Central Funds, will indirectly bear its pro rata share of the fees and expenses incurred by the underlying Fidelity Central Funds. These fees and expenses are not included in the Fund's annualized expense ratio used to calculate the expense estimate in the table below.
Hypothetical Example for Comparison Purposes
The second line of the accompanying table for each class of the Fund provides information about hypothetical account values and hypothetical expenses based on a Class' actual expense ratio and an assumed rate of return of 5% per year before expenses, which is not the Class' actual return. The hypothetical account values and expenses may not be used to estimate the actual ending account balance or expenses you paid for the period. You may use this information to compare the ongoing costs of investing in the Fund and other funds. To do so, compare this 5% hypothetical example with the 5% hypothetical examples that appear in the shareholder reports of the other funds. The estimate of expenses does not include any fees or other expenses of any variable annuity or variable life insurance product. If they were, the estimate of expenses you paid during the period would be higher, and your ending account value would be lower. In addition, the Fund, as a shareholder in the underlying Fidelity Central Funds, will indirectly bear its pro rata share of the fees and expenses incurred by the underlying Fidelity Central Funds. These fees and expenses are not included in the Fund's annualized expense ratio used to calculate the expense estimate in the table below.
Please note that the expenses shown in the table are meant to highlight your ongoing costs only and do not reflect any transaction costs. Therefore, the second line of the table is useful in comparing ongoing costs only, and will not help you determine the relative total costs of owning different funds. In addition, if these transactional costs were included, your costs would have been higher.
| Beginning
Account Value
July 1, 2007 | Ending
Account Value
December 31, 2007 | Expenses Paid
During Period*
July 1, 2007 to
December 31, 2007 |
Initial Class | | | |
Actual | $ 1,000.00 | $ 1,121.40 | $ 5.35 |
HypotheticalA | $ 1,000.00 | $ 1,020.16 | $ 5.09 |
Investor Class | | | |
Actual | $ 1,000.00 | $ 1,121.60 | $ 6.15** |
HypotheticalA | $ 1,000.00 | $ 1,019.41 | $ 5.85** |
A 5% return per year before expenses
* Expenses are equal to each Class' annualized expense ratio (shown in the table below); multiplied by the average account value over the period, multiplied by 184/365 (to reflect the one-half year period).
| Annualized
Expense Ratio |
Initial Class | 1.00% |
Investor Class | 1.15%** |
** If changes to transfer agent contracts and voluntary expense limitations, effective February 1, 2008 had been in effect during the entire period, the annualized expense ratio would have been 1.08% and the expenses paid in the actual and hypothetical examples above would have been $5.78 and $5.50, respectively.
Annual Report
Investment Changes
Top Ten Stocks as of December 31, 2007 |
| % of fund's
net assets | % of fund's net assets
6 months ago |
Procter & Gamble Co. | 16.5 | 16.3 |
The Coca-Cola Co. | 9.5 | 8.7 |
PepsiCo, Inc. | 7.9 | 8.8 |
CVS Caremark Corp. | 5.4 | 5.4 |
Nestle SA sponsored ADR | 3.9 | 4.7 |
British American Tobacco PLC sponsored ADR | 3.9 | 4.8 |
Wal-Mart Stores, Inc. | 3.7 | 4.0 |
Colgate-Palmolive Co. | 3.6 | 4.2 |
Altria Group, Inc. | 3.3 | 3.9 |
Walgreen Co. | 3.2 | 3.2 |
| 60.9 | |
Top Industries (% of fund's net assets) |
As of December 31, 2007 |
 | Beverages | 28.6% | |
 | Household Products | 21.3% | |
 | Food & Staples Retailing | 19.4% | |
 | Food Products | 14.0% | |
 | Tobacco | 9.1% | |
 | All Others* | 7.6% | |

As of June 30, 2007 |
| Beverages | 28.1% | |
| Household Products | 21.0% | |
| Food & Staples Retailing | 19.3% | |
| Food Products | 15.2% | |
| Tobacco | 10.3% | |
| All Others* | 6.1% | |

* Includes short-term investments and net other assets. |
Annual Report
Investments December 31, 2007
Showing Percentage of Net Assets
Common Stocks - 97.2% |
| Shares | | Value |
BEVERAGES - 28.6% |
Brewers - 5.6% |
Anadolu Efes Biracilik ve Malt Sanyii AS | 3,200 | | $ 38,090 |
Grupo Modelo SA de CV Series C | 100 | | 472 |
Heineken NV (Bearer) | 2,860 | | 182,754 |
InBev SA | 2,175 | | 180,929 |
Molson Coors Brewing Co. Class B | 5,060 | | 261,197 |
SABMiller PLC | 6,380 | | 179,494 |
| | 842,936 |
Distillers & Vintners - 2.9% |
Brown-Forman Corp. Class B (non-vtg.) | 435 | | 32,238 |
Diageo PLC sponsored ADR | 2,205 | | 189,255 |
Pernod Ricard SA | 930 | | 214,580 |
| | 436,073 |
Soft Drinks - 20.1% |
Coca-Cola Amatil Ltd. | 4,298 | | 35,689 |
Coca-Cola Femsa SA de CV
sponsored ADR | 2,320 | | 114,330 |
Coca-Cola Hellenic Bottling Co. SA sponsored ADR | 2,560 | | 109,414 |
Coca-Cola Icecek AS | 3,600 | | 41,619 |
Fomento Economico Mexicano SA de CV sponsored ADR | 2,900 | | 110,693 |
PepsiCo, Inc. | 15,500 | | 1,176,450 |
The Coca-Cola Co. | 23,100 | | 1,417,647 |
| | 3,005,842 |
TOTAL BEVERAGES | | 4,284,851 |
BIOTECHNOLOGY - 0.2% |
Biotechnology - 0.2% |
Senomyx, Inc. (a) | 4,150 | | 31,084 |
FOOD & STAPLES RETAILING - 19.4% |
Drug Retail - 8.8% |
CVS Caremark Corp. | 20,240 | | 804,540 |
Rite Aid Corp. (a) | 10,400 | | 29,016 |
Walgreen Co. | 12,600 | | 479,808 |
| | 1,313,364 |
Food Distributors - 2.9% |
Sysco Corp. | 12,800 | | 399,488 |
United Natural Foods, Inc. (a) | 1,200 | | 38,064 |
| | 437,552 |
Food Retail - 4.0% |
Kroger Co. | 9,950 | | 265,765 |
Safeway, Inc. | 6,400 | | 218,944 |
SUPERVALU, Inc. | 1,750 | | 65,660 |
Whole Foods Market, Inc. | 1,305 | | 53,244 |
| | 603,613 |
|
| Shares | | Value |
Hypermarkets & Super Centers - 3.7% |
Wal-Mart Stores, Inc. | 11,650 | | $ 553,725 |
TOTAL FOOD & STAPLES RETAILING | | 2,908,254 |
FOOD PRODUCTS - 14.0% |
Agricultural Products - 2.8% |
Archer Daniels Midland Co. | 4,950 | | 229,829 |
Bunge Ltd. | 1,260 | | 146,677 |
Corn Products International, Inc. | 925 | | 33,994 |
Nutreco Holding NV | 245 | | 14,145 |
| | 424,645 |
Packaged Foods & Meats - 11.2% |
BioMar Holding AS | 350 | | 13,460 |
Cadbury Schweppes PLC sponsored ADR | 2,765 | | 136,508 |
Chiquita Brands International, Inc. (a) | 800 | | 14,712 |
Dean Foods Co. | 4,345 | | 112,362 |
Groupe Danone | 2,170 | | 195,843 |
Hershey Co. | 1,700 | | 66,980 |
Kellogg Co. | 1,285 | | 67,373 |
Koninklijke Wessanen NV | 70 | | 1,111 |
Lindt & Spruengli AG | 1 | | 35,092 |
Marine Harvest ASA (a) | 59,400 | | 38,146 |
Nestle SA sponsored ADR | 5,145 | | 589,103 |
Smithfield Foods, Inc. (a) | 990 | | 28,631 |
TreeHouse Foods, Inc. (a) | 100 | | 2,299 |
Tyson Foods, Inc. Class A | 2,900 | | 44,457 |
Unilever NV (NY Shares) | 9,075 | | 330,875 |
| | 1,676,952 |
TOTAL FOOD PRODUCTS | | 2,101,597 |
HOTELS, RESTAURANTS & LEISURE - 0.6% |
Restaurants - 0.6% |
Panera Bread Co. Class A (a) | 1,030 | | 36,895 |
Starbucks Corp. (a) | 2,100 | | 42,987 |
| | 79,882 |
HOUSEHOLD PRODUCTS - 21.3% |
Household Products - 21.3% |
Colgate-Palmolive Co. | 6,985 | | 544,551 |
Henkel KGaA | 991 | | 50,547 |
Kimberly-Clark Corp. | 1,500 | | 104,010 |
Procter & Gamble Co. | 33,700 | | 2,474,249 |
Pz Cussons PLC Class L | 3,500 | | 14,951 |
| | 3,188,308 |
INTERNET & CATALOG RETAIL - 0.2% |
Internet Retail - 0.2% |
NutriSystem, Inc. (a) | 1,250 | | 33,725 |
PERSONAL PRODUCTS - 3.3% |
Personal Products - 3.3% |
Avon Products, Inc. | 9,700 | | 383,441 |
Common Stocks - continued |
| Shares | | Value |
PERSONAL PRODUCTS - CONTINUED |
Personal Products - continued |
Bare Escentuals, Inc. (a) | 1,455 | | $ 35,284 |
Herbalife Ltd. | 1,000 | | 40,280 |
Physicians Formula Holdings, Inc. | 2,440 | | 28,987 |
| | 487,992 |
PHARMACEUTICALS - 0.5% |
Pharmaceuticals - 0.5% |
Johnson & Johnson | 1,130 | | 75,371 |
TOBACCO - 9.1% |
Tobacco - 9.1% |
Altria Group, Inc. | 6,600 | | 498,828 |
British American Tobacco PLC
sponsored ADR | 7,400 | | 581,344 |
Japan Tobacco, Inc. | 9 | | 53,310 |
KT&G Corp. | 810 | | 68,964 |
Loews Corp. - Carolina Group | 625 | | 53,313 |
Souza Cruz Industria Comerico | 4,050 | | 111,056 |
| | 1,366,815 |
TOTAL COMMON STOCKS (Cost $13,629,641) | 14,557,879 |
Money Market Funds - 6.5% |
| | | |
Fidelity Cash Central Fund, 4.58% (b)
(Cost $975,308) | 975,308 | | 975,308 |
TOTAL INVESTMENT PORTFOLIO - 103.7% (Cost $14,604,949) | 15,533,187 |
NET OTHER ASSETS - (3.7)% | (550,610) |
NET ASSETS - 100% | $ 14,982,577 |
Legend |
(a) Non-income producing |
(b) Affiliated fund that is available only to investment companies and other accounts managed by Fidelity Investments. The rate quoted is the annualized seven-day yield of the fund at period end. A complete unaudited listing of the fund's holdings as of its most recent quarter end is available upon request. |
Affiliated Central Funds |
Information regarding fiscal year to date income earned by the Fund from investments in Fidelity Central Funds is as follows: |
Fund | Income earned |
Fidelity Cash Central Fund | $ 15,512 |
Other Information |
Distribution of investments by country of issue, as a percentage of total net assets, is as follows: |
United States of America | 74.5% |
United Kingdom | 7.4% |
Switzerland | 4.1% |
Netherlands | 3.5% |
France | 2.7% |
Mexico | 1.5% |
Belgium | 1.2% |
Bermuda | 1.0% |
Others (individually less than 1%) | 4.1% |
| 100.0% |
See accompanying notes which are an integral part of the financial statements.
Annual Report
Financial Statements
Statement of Assets and Liabilities
| December 31, 2007 |
| | |
Assets | | |
Investment in securities, at value - See accompanying schedule: Unaffiliated issuers
(cost $13,629,641) | $ 14,557,879 | |
Fidelity Central Funds
(cost $975,308) | 975,308 | |
Total Investments (cost $14,604,949) | | $ 15,533,187 |
Cash | | 789 |
Receivable for investments sold | | 18,140 |
Receivable for fund shares sold | | 35,360 |
Dividends receivable | | 15,220 |
Distributions receivable from Fidelity Central Funds | | 3,013 |
Prepaid expenses | | 33 |
Receivable from investment adviser for expense reductions | | 4,479 |
Other receivables | | 190 |
Total assets | | 15,610,411 |
| | |
Liabilities | | |
Payable for investments purchased | $ 584,178 | |
Payable for fund shares redeemed | 29 | |
Accrued management fee | 6,503 | |
Other affiliated payables | 1,837 | |
Other payables and accrued expenses | 35,287 | |
Total liabilities | | 627,834 |
| | |
Net Assets | | $ 14,982,577 |
Net Assets consist of: | | |
Paid in capital | | $ 14,071,960 |
Accumulated undistributed net realized gain (loss) on investments and foreign currency transactions | | (17,650) |
Net unrealized appreciation (depreciation) on investments and assets and liabilities in foreign currencies | | 928,267 |
Net Assets | | $ 14,982,577 |
Statement of Assets and Liabilities - continued
| December 31, 2007 |
Initial Class:
Net Asset Value, offering price and redemption price per share ($7,964,403 ÷ 718,838 shares) | | $ 11.08 |
| | |
Investor Class:
Net Asset Value, offering price and redemption price per share ($7,018,174 ÷ 633,993 shares) | | $ 11.07 |
See accompanying notes which are an integral part of the financial statements.
Annual Report
Statement of Operations
| For the period April 24, 2007
(commencement of operations) to December 31, 2007 |
| | |
Investment Income | | |
Dividends | | $ 109,344 |
Interest | | 1,686 |
Income from Fidelity Central Funds | | 15,512 |
Total income | | 126,542 |
| | |
Expenses | | |
Management fee | $ 34,168 | |
Transfer agent fees | 10,560 | |
Accounting fees and expenses | 2,387 | |
Custodian fees and expenses | 24,249 | |
Independent trustees' compensation | 17 | |
Audit | 32,922 | |
Legal | 9 | |
Miscellaneous | 2,308 | |
Total expenses before reductions | 106,620 | |
Expense reductions | (40,753) | 65,867 |
Net investment income (loss) | | 60,675 |
Realized and Unrealized Gain (Loss) Net realized gain (loss) on: | | |
Investment securities: | | |
Unaffiliated issuers | 62,781 | |
Foreign currency transactions | (797) | |
Total net realized gain (loss) | | 61,984 |
Change in net unrealized appreciation (depreciation) on: Investment securities | 928,238 | |
Assets and liabilities in foreign currencies | 29 | |
Total change in net unrealized appreciation (depreciation) | | 928,267 |
Net gain (loss) | | 990,251 |
Net increase (decrease) in net assets resulting from operations | | $ 1,050,926 |
Statement of Changes in Net Assets
| For the period
April 24, 2007
(commencement of operations) to
December 31, 2007 |
Increase (Decrease) in Net Assets | |
Operations | |
Net investment income (loss) | $ 60,675 |
Net realized gain (loss) | 61,984 |
Change in net unrealized appreciation (depreciation) | 928,267 |
Net increase (decrease) in net assets resulting from operations | 1,050,926 |
Distributions to shareholders from net investment income | (55,122) |
Distributions to shareholders from net realized gain | (89,733) |
Total distributions | (144,855) |
Share transactions - net increase (decrease) | 14,075,457 |
Redemption fees | 1,049 |
Total increase (decrease) in net assets | 14,982,577 |
| |
Net Assets | |
Beginning of period | - |
End of period | $ 14,982,577 |
See accompanying notes which are an integral part of the financial statements.
Annual Report
Financial Highlights - Initial Class
Year ended December 31, | 2007 H |
Selected Per-Share Data | |
Net asset value, beginning of period | $ 10.00 |
Income from Investment Operations | |
Net investment income (loss) E | .08 |
Net realized and unrealized gain (loss) | 1.11 |
Total from investment operations | 1.19 |
Distributions from net investment income | (.04) |
Distributions from net realized gain | (.07) |
Total distributions | (.11) |
Redemption fees added to paid in capital E,J | - |
Net asset value, end of period | $ 11.08 |
Total Return B, C, D | 11.92% |
Ratios to Average Net Assets F, I | |
Expenses before reductions | 1.66% A |
Expenses net of fee waivers, if any | 1.00% A |
Expenses net of all reductions | 1.00% A |
Net investment income (loss) | 1.05% A |
Supplemental Data | |
Net assets, end of period (000 omitted) | $ 7,964 |
Portfolio turnover rate G | 35% A |
A Annualized
B Total returns for periods of less than one year are not annualized.
C Total returns do not reflect charges attributable to your insurance company's separate account. Inclusion of these charges would reduce the total returns shown.
D Total returns would have been lower had certain expenses not been reduced during the periods shown.
E Calculated based on average shares outstanding during the period.
F Fees and expenses of the underlying Fidelity Central Funds are not included in the Fund's expense ratio. The Fund indirectly bears its proportionate share of the expenses of any underlying Fidelity Central Funds.
G Amount does not include the portfolio activity of any underlying Fidelity Central Funds.
H For the period April 24, 2007 (commencement of operations) to December 31, 2007.
I Expense ratios reflect operating expenses of the class. Expenses before reductions do not reflect amounts reimbursed by the investment adviser or reductions from brokerage service arrangements or other expense offset arrangements and do not represent the amount paid by the class during periods when reimbursements or reductions occur. Expense ratios before reductions for start-up periods may not be representative of longer-term operating periods. Expenses net of fee waivers reflect expenses after reimbursement by the investment adviser but prior to reductions from brokerage service arrangements or other expense offset arrangements. Expenses net of all reductions represent the net expenses paid by the class.
J Amount represents less than $.01 per share.
Financial Highlights - Investor Class
Year ended December 31, | 2007 H |
Selected Per-Share Data | |
Net asset value, beginning of period | $ 10.00 |
Income from Investment Operations | |
Net investment income (loss) E | .07 |
Net realized and unrealized gain (loss) | 1.11 |
Total from investment operations | 1.18 |
Distributions from net investment income | (.04) |
Distributions from net realized gain | (.07) |
Total distributions | (.11) |
Redemption fees added to paid in capital E,J | - |
Net asset value, end of period | $ 11.07 |
Total Return B, C, D | 11.82% |
Ratios to Average Net Assets F, I | |
Expenses before reductions | 1.79% A |
Expenses net of fee waivers, if any | 1.15% A |
Expenses net of all reductions | 1.15% A |
Net investment income (loss) | .90% A |
Supplemental Data | |
Net assets, end of period (000 omitted) | $ 7,018 |
Portfolio turnover rate G | 35% A |
A Annualized
B Total returns for periods of less than one year are not annualized.
C Total returns do not reflect charges attributable to your insurance company's separate account. Inclusion of these charges would reduce the total returns shown.
D Total returns would have been lower had certain expenses not been reduced during the periods shown.
E Calculated based on average shares outstanding during the period.
F Fees and expenses of the underlying Fidelity Central Funds are not included in the Fund's expense ratio. The Fund indirectly bears its proportionate share of the expenses of any underlying Fidelity Central Funds.
G Amount does not include the portfolio activity of any underlying Fidelity Central Funds.
H For the period April 24, 2007 (commencement of operations) to December 31, 2007.
I Expense ratios reflect operating expenses of the class. Expenses before reductions do not reflect amounts reimbursed by the investment adviser or reductions from brokerage service arrangements or other expense offset arrangements and do not represent the amount paid by the class during periods when reimbursements or reductions occur. Expense ratios before reductions for start-up periods may not be representative of longer-term operating periods. Expenses net of fee waivers reflect expenses after reimbursement by the investment adviser but prior to reductions from brokerage service arrangements or other expense offset arrangements. Expenses net of all reductions represent the net expenses paid by the class.
J Amount represents less than $.01 per share.
See accompanying notes which are an integral part of the financial statements.
Annual Report
Notes to Financial Statements
For the period ended December 31, 2007
1. Organization.
VIP Consumer Staples Portfolio (the Fund) is a non-diversified fund of Variable Insurance Products Fund IV (the trust) and is authorized to issue an unlimited number of shares. The trust is registered under the Investment Company Act of 1940, as amended (the 1940 Act), as an open-end management investment company organized as a Massachusetts business trust. Shares of the Fund may only be purchased by insurance companies for the purpose of funding variable annuity or variable life insurance contracts. The Fund offers the following classes of shares: Initial Class shares and Investor Class shares. All classes have equal rights and voting privileges, except for matters affecting a single class. Investment income, realized and unrealized capital gains and losses, the common expenses of the Fund, and certain fund-level expense reductions, if any, are allocated on a pro rata basis to each class based on the relative net assets of each class to the total net assets of the Fund. Each class differs with respect to transfer agent fees incurred. Certain expense reductions also differ by class.
2. Investments in Fidelity Central Funds.
The Fund may invest in Fidelity Central Funds, which are open-end investment companies available only to other investment companies and accounts managed by Fidelity Management & Research Company (FMR) and its affiliates. The Fund's Schedule of Investments lists each of the Fidelity Central Funds as an investment of the Fund, but does not include the underlying holdings of each Fidelity Central Fund. As an Investing Fund, the Fund indirectly bears its proportionate share of the expenses of the underlying Fidelity Central Funds.
The Money Market Central Funds seek preservation of capital and current income and are managed by Fidelity Investments Money Management, Inc. (FIMM), an affiliate of FMR.
A complete list of holdings for each Fidelity Central Fund is available upon request or at the SEC's web site at www.sec.gov. In addition, the financial statements of the Fidelity Central Funds, which are not covered by the Fund's Report of Independent Registered Public Accounting Firm, are available on the SEC's web site or upon request.
3. Significant Accounting Policies.
The financial statements have been prepared in conformity with accounting principles generally accepted in the United States of America, which require management to make certain estimates and assumptions at the date of the financial statements. The following summarizes the significant accounting policies of the Fund:
Security Valuation. Investments are valued and net asset value (NAV) per share is calculated (NAV calculation) as of the close of business of the New York Stock Exchange (NYSE), normally 4:00 p.m. Eastern time. Wherever possible, the Fund uses independent pricing services approved by the Board of Trustees to value its investments.
Equity securities, including restricted securities, for which market quotations are readily available, are valued at the last reported sale price or official closing price as reported by an independent pricing service on the primary market or exchange on which they are traded. In the event there were no sales during the day or closing prices are not available, securities are valued at the last quoted bid price.
Investments in open-end mutual funds, including the Fidelity Central Funds, are valued at their closing net asset value each business day. Short-term securities with remaining maturities of sixty days or less for which quotations are not readily available are valued at amortized cost, which approximates value.
When current market prices or quotations are not readily available or do not accurately reflect fair value, valuations may be determined in accordance with procedures adopted by the Board of Trustees. For example, when developments occur between the close of a market and the close of the NYSE that may materially affect the value of some or all of the securities, or when trading in a security is halted, those securities may be fair valued. Factors used in the determination of fair value may include monitoring news to identify significant market or security specific events such as changes in the value of U.S. securities markets, reviewing developments in foreign markets and evaluating the performance of ADRs, futures contracts and exchange-traded funds. Because the Fund's utilization of fair value pricing depends on market activity, the frequency with which fair value pricing is used cannot be predicted and may be utilized to a significant extent. The value of securities used for NAV calculation under fair value pricing may differ from published prices for the same securities.
Annual Report
Notes to Financial Statements - continued
3. Significant Accounting Policies - continued
Foreign Currency. The Fund uses foreign currency contracts to facilitate transactions in foreign-denominated securities. Losses from these transactions may arise from changes in the value of the foreign currency or if the counterparties do not perform under the contracts' terms.
Foreign-denominated assets, including investment securities, and liabilities are translated into U.S. dollars at the exchange rate at period end. Purchases and sales of investment securities, income and dividends received and expenses denominated in foreign currencies are translated into U.S. dollars at the exchange rate in effect on the transaction date.
The effects of exchange rate fluctuations on investments are included with the net realized and unrealized gain (loss) on investment securities. Other foreign currency transactions resulting in realized and unrealized gain (loss) are disclosed separately.
Investment Transactions and Income. For financial reporting purposes, the Fund's investment holdings and NAV include trades executed through the end of the last business day of the period. The NAV for processing shareholder transactions includes trades executed through the end of the prior business day. Gains and losses on securities sold are determined on the basis of identified cost. Dividend income is recorded on the ex-dividend date, except for certain dividends from foreign securities where the ex-dividend date may have passed, which are recorded as soon as the Fund is informed of the ex-dividend date. Non-cash dividends included in dividend income, if any, are recorded at the fair market value of the securities received. Interest income and distributions from the Fidelity Central Funds are accrued as earned. Interest income includes coupon interest and amortization of premium and accretion of discount on debt securities. Investment income is recorded net of foreign taxes withheld where recovery of such taxes is uncertain.
Expenses. Most expenses of the trust can be directly attributed to a fund. Expenses which cannot be directly attributed are apportioned among each Fund in the trust. Expense estimates are accrued in the period to which they relate and adjustments are made when actual amounts are known.
Income Tax Information and Distributions to Shareholders. The Fund intends to qualify as a regulated investment company by distributing substantially all of its taxable income and realized gains under Subchapter M of the Internal Revenue Code and filing its U.S. federal tax return. As a result, no provision for income taxes is required. The Fund is subject to the provisions of FASB Interpretation No. 48, Accounting for Uncertainties in Income Taxes (FIN 48). FIN 48 sets forth a minimum threshold for financial statement recognition of the benefit of a tax position taken or expected to be taken in a tax return. There are no unrecognized tax benefits in the accompanying financial statements in connection with the tax positions expected to be taken in the initial filing of the Fund's federal tax return. Foreign taxes are provided for based on the Fund's understanding of the tax rules and rates that exist in the foreign markets in which it invests.
Distributions are recorded on the ex-dividend date. Income dividends and capital gain distributions are declared separately for each class. Income and capital gain distributions are determined in accordance with income tax regulations, which may differ from generally accepted accounting principles.
Capital accounts within the financial statements are adjusted for permanent book-tax differences. These adjustments have no impact on net assets or the results of operations. Temporary book-tax differences will reverse in a subsequent period.
Book-tax differences are primarily due to foreign currency transactions and losses deferred due to wash sales and excise tax regulations.
The tax-basis components of distributable earnings and the federal tax cost as of period end were as follows:
Unrealized appreciation | $ 1,175,582 |
Unrealized depreciation | (262,264) |
Net unrealized appreciation (depreciation) | $ 913,318 |
| |
Cost for federal income tax purposes | $ 14,619,869 |
The tax character of distributions paid was as follows:
| December 31, 2007 |
Ordinary Income | $ 144,855 |
Short-Term Trading (Redemption) Fees. Shares held less than 60 days are subject to a redemption fee equal to 1% of the proceeds of the redeemed shares. All redemption fees, including any estimated redemption fees paid by FMR, are retained by the Fund and accounted for as an addition to paid in capital.
New Accounting Pronouncement. In September 2006, Statement of Financial Accounting Standards No. 157, Fair Value Measurements
(SFAS 157), was issued and is effective for fiscal years beginning after November 15, 2007. SFAS 157 defines fair value, establishes a framework for measuring fair value and expands disclosures about fair value measurements. Management is currently evaluating the impact the adoption of SFAS 157 will have on the Fund's financial statement disclosures.
Annual Report
4. Operating Policies.
Repurchase Agreements. FMR has received an Exemptive Order from the Securities and Exchange Commission (the SEC) which permits the Fund and other affiliated entities of FMR to transfer uninvested cash balances into joint trading accounts which are then invested in repurchase agreements. The Fund may also invest directly with institutions in repurchase agreements. Repurchase agreements are collateralized by government or non-government securities. Upon settlement date, collateral is held in segregated accounts with custodian banks and may be obtained in the event of a default of the counterparty. The Fund monitors, on a daily basis, the value of the collateral to ensure it is at least equal to the principal amount of the repurchase agreement (including accrued interest). In the event of a default by the counterparty, realization of the collateral proceeds could be delayed, during which time the value of the collateral may decline.
5. Purchases and Sales of Investments.
Purchases and sales of securities, other than short-term securities, aggregated $15,672,364 and $2,105,503, respectively.
6. Fees and Other Transactions with Affiliates.
Management Fee. FMR and its affiliates provide the Fund with investment management related services for which the Fund pays a monthly management fee. The management fee is the sum of an individual fund fee rate that is based on an annual rate of .30% of the Fund's average net assets and a group fee rate that averaged .26% during the period. The group fee rate is based upon the average net assets of all the mutual funds advised by FMR. The group fee rate decreases as assets under management increase and increases as assets under management decrease. For the period, the total annualized management fee rate was .56% of the Fund's average net assets.
Transfer Agent Fees. Fidelity Investments Institutional Operations Company, Inc. (FIIOC), an affiliate of FMR, is the Fund's transfer, dividend disbursing, and shareholder servicing agent. FIIOC receives an asset-based fee with respect to each class. Each class with the exception of Investor Class pays a transfer agent fee, excluding out of pocket expenses, equal to an annual rate of .07% of average net assets. Investor Class pays a monthly asset-based transfer agent fee of .18% of average net assets. The total transfer agent fees paid by each class to FIIOC, including out of pocket expenses, were as follows:
Initial Class | $ 3,673 |
Investor Class | 6,887 |
| $ 10,560 |
Effective February 1, 2008, the Board of Trustees approved a decrease to Investor Class' asset-based fee from .18% to .15% of average net assets.
Accounting Fees. Fidelity Service Company, Inc. (FSC), an affiliate of FMR, maintains the Fund's accounting records. The fee is based on the level of average net assets for the month.
Brokerage Commissions. The Fund placed a portion of its portfolio transactions with brokerage firms which are affiliates of the investment adviser. The commissions paid to these affiliated firms were $139 for the period.
7. Expense Reductions.
FMR voluntarily agreed to reimburse each class to the extent annual operating expenses exceeded certain levels of average net assets as noted in the table below. Some expenses, for example interest expense, are excluded from this reimbursement.
The following classes were in reimbursement during the period:
| Expense
Limitations | Reimbursement
from adviser |
| | |
Initial Class | 1.00% | $ 22,009 |
Investor Class | 1.15% | 18,554 |
| | $ 40,563 |
Effective February 1, 2008, the expense limitation changed to 1.08% for Investor Class.
Many of the brokers with whom FMR places trades on behalf of the Fund provided services to the Fund in addition to trade execution. These services included payments of certain expenses on behalf of the Fund totaling $190 for the period.
Annual Report
Notes to Financial Statements - continued
8. Other.
The Fund's organizational documents provide former and current trustees and officers with a limited indemnification against liabilities arising in connection with the performance of their duties to the Fund. In the normal course of business, the Fund may also enter into contracts that provide general indemnifications. The Fund's maximum exposure under these arrangements is unknown as this would be dependent on future claims that may be made against the Fund. The risk of material loss from such claims is considered remote.
At the end of the period, FMR or its affiliates were the owners of record of 100% of the total outstanding shares of the Fund.
9. Distributions to Shareholders.
Distributions to shareholders of each class were as follows:
Year ended December 31, | 2007 A |
From net investment income | |
Initial Class | $ 30,241 |
Investor Class | 24,881 |
Total | $ 55,122 |
From net realized gain | |
Initial Class | $ 49,230 |
Investor Class | 40,503 |
Total | $ 89,733 |
A For the period April 24, 2007 (commencement of operations) to December 31, 2007.
10. Share Transactions.
Transactions for each class of shares were as follows:
Year ended December 31, | Shares 2007 A | Dollars 2007 A |
Initial Class | | |
Shares sold | 737,178 | $ 7,668,501 |
Reinvestment of distributions | 7,108 | 79,471 |
Shares redeemed | (25,448) | (270,975) |
Net increase (decrease) | 718,838 | $ 7,476,997 |
Investor Class | | |
Shares sold | 637,642 | $ 6,632,924 |
Reinvestment of distributions | 5,854 | 65,384 |
Shares redeemed | (9,503) | (99,848) |
Net increase (decrease) | 633,993 | $ 6,598,460 |
A For the period April 24, 2007 (commencement of operations) to December 31, 2007.
Annual Report
Report of Independent Registered Public Accounting Firm
To the Trustees of Variable Insurance Products Fund IV and the Shareholders of VIP Consumer Staples Portfolio:
In our opinion, the accompanying statement of assets and liabilities, including the schedule of investments, and the related statements of operations and of changes in net assets and the financial highlights present fairly, in all material respects, the financial position of VIP Consumer Staples Portfolio (a fund of Variable Insurance Products Fund IV) at December 31, 2007, and the results of its operations, the changes in its net assets and the financial highlights for the period April 24, 2007 (commencement of operations) through December 31, 2007, in conformity with accounting principles generally accepted in the United States of America. These financial statements and financial highlights (hereafter referred to as "financial statements") are the responsibility of the VIP Consumer Staples Portfolio's management. Our responsibility is to express an opinion on these financial statements based on our audit. We conducted our audit of these financial statements in accordance with the standards of the Public Company Accounting Oversight Board (United States). Those standards require that we plan and perform the audit to obtain reasonable assurance about whether the financial statements are free of material misstatement. An audit includes examining, on a test basis, evidence supporting the amounts and disclosures in the financial statements, assessing the accounting principles used and significant estimates made by management, and evaluating the overall financial statement presentation. We believe that our audit, which included confirmation of securities at December 31, 2007 by correspondence with the custodian and brokers, provides a reasonable basis for our opinion.
/s/ PricewaterhouseCoopers LLP
PricewaterhouseCoopers LLP
Boston, Massachusetts
February 19, 2008
Annual Report
Trustees and Officers
The Trustees, Members of the Advisory Board, and executive officers of the trust and fund, as applicable, are listed below. The Board of Trustees governs the fund and is responsible for protecting the interests of shareholders. The Trustees are experienced executives who meet periodically throughout the year to oversee the fund's activities, review contractual arrangements with companies that provide services to the fund, and review the fund's performance. Except for James C. Curvey, each of the Trustees oversees 373 funds advised by FMR or an affiliate. Mr. Curvey oversees 368 funds advised by FMR or an affiliate.
The Trustees hold office without limit in time except that (a) any Trustee may resign; (b) any Trustee may be removed by written instrument, signed by at least two-thirds of the number of Trustees prior to such removal; (c) any Trustee who requests to be retired or who has become incapacitated by illness or injury may be retired by written instrument signed by a majority of the other Trustees; and (d) any Trustee may be removed at any special meeting of shareholders by a two-thirds vote of the outstanding voting securities of the trust. Each Trustee who is not an interested person (as defined in the 1940 Act) (Independent Trustee), shall retire not later than the last day of the calendar year in which his or her 72nd birthday occurs. The Independent Trustees may waive this mandatory retirement age policy with respect to individual Trustees. The executive officers and Advisory Board Members hold office without limit in time, except that any officer and Advisory Board Member may resign or may be removed by a vote of a majority of the Trustees at any regular meeting or any special meeting of the Trustees. Except as indicated, each individual has held the office shown or other offices in the same company for the past five years.
The fund's Statement of Additional Information (SAI) includes more information about the Trustees. To request a free copy, call Fidelity at 1-877-208-0098.
Interested Trustees*:
Correspondence intended for each Trustee who is an interested person may be sent to Fidelity Investments, 82 Devonshire Street, Boston, Massachusetts 02109.
Name, Age; Principal Occupation |
Edward C. Johnson 3d (77) |
| Year of Election or Appointment: 1983 Mr. Johnson is Chairman of the Board of Trustees. Mr. Johnson serves as President (2006-present), Chief Executive Officer, Chairman, and a Director of FMR LLC; Chairman and a Director of FMR; Chairman and a Director of Fidelity Research & Analysis Company (FRAC); Chairman and a Director of Fidelity Investments Money Management, Inc.; and Chairman (2001-present) and a Director of FMR Co., Inc. In addition, Mr. Johnson serves as Chairman and Director of Fidelity International Limited (FIL). Mr. Edward C. Johnson 3d and Mr. Arthur E. Johnson are not related. |
James C. Curvey (72) |
| Year of Election or Appointment: 2007 Mr. Curvey also serves as Trustee (2007-present) or Member of the Advisory Board (2007-present) of other investment companies advised by FMR. Mr. Curvey is a Director of FMR and FMR Co., Inc. (2007-present). Mr. Curvey is also Vice Chairman (2006-present) and Director of FMR LLC. Mr. Curvey joined Fidelity in 1982 and served in numerous senior management positions, including President and Chief Operating Officer of FMR LLC (1997-2000) and President of Fidelity Strategic Investments (2000-2002). In addition, he serves as a member of the Board of Directors of Geerlings & Wade, Inc. (wine distribution). |
* Trustees have been determined to be "Interested Trustees" by virtue of, among other things, their affiliation with the trust or various entities under common control with FMR. FMR Corp. merged with and into FMR LLC on October 1, 2007. Any references to FMR LLC for prior periods are deemed to be references to the prior entity.
Independent Trustees:
Correspondence intended for each Independent Trustee (that is, the Trustees other than the Interested Trustees) may be sent to Fidelity Investments, P.O. Box 55235, Boston, Massachusetts 02205-5235.
Name, Age; Principal Occupation |
Dennis J. Dirks (59) |
| Year of Election or Appointment: 2005 Prior to his retirement in May 2003, Mr. Dirks was Chief Operating Officer and a member of the Board of The Depository Trust & Clearing Corporation (DTCC) (1999-2003). He also served as President, Chief Operating Officer, and Board member of The Depository Trust Company (DTC) (1999-2003) and President and Board member of the National Securities Clearing Corporation (NSCC) (1999-2003). In addition, Mr. Dirks served as Chief Executive Officer and Board member of the Government Securities Clearing Corporation (2001-2003) and Chief Executive Officer and Board member of the Mortgage-Backed Securities Clearing Corporation (2001-2003). Mr. Dirks also serves as a Trustee and a member of the Finance Committee of Manhattan College (2005-present) and a Trustee and a member of the Finance Committee of AHRC of Nassau County (2006-present). |
Albert R. Gamper, Jr. (65) |
| Year of Election or Appointment: 2006 Prior to his retirement in December 2004, Mr. Gamper served as Chairman of the Board of CIT Group Inc. (commercial finance). During his tenure with CIT Group Inc. Mr. Gamper served in numerous senior management positions, including Chairman (1987-1989; 1999-2001; 2002-2004), Chief Executive Officer (1987-2004), and President (1989-2002). He currently serves as a member of the Board of Directors of Public Service Enterprise Group (utilities, 2001-present), Chairman of the Board of Governors, Rutgers University (2004-present), and Chairman of the Board of Saint Barnabas Health Care System. |
George H. Heilmeier (71) |
| Year of Election or Appointment: 2004 Dr. Heilmeier is Chairman Emeritus of Telcordia Technologies (communication software and systems), where prior to his retirement, he served as company Chairman and Chief Executive Officer. He currently serves on the Boards of Directors of The Mitre Corporation (systems engineering and information technology support for the government), and HRL Laboratories (private research and development, 2004-present). He is Chairman of the General Motors Science & Technology Advisory Board and a Life Fellow of the Institute of Electrical and Electronics Engineers (IEEE). Dr. Heilmeier is a member of the Defense Science Board and the National Security Agency Advisory Board. He is also a member of the National Academy of Engineering, the American Academy of Arts and Sciences, and the Board of Overseers of the School of Engineering and Applied Science of the University of Pennsylvania. Previously, Dr. Heilmeier served as a Director of TRW Inc. (automotive, space, defense, and information technology, 1992-2002), Compaq (1994-2002), Automatic Data Processing, Inc. (ADP) (technology-based business outsourcing, 1995-2002), INET Technologies Inc. (telecommunications network surveillance, 2001-2004), and Teletech Holdings (customer management services). He is the recipient of the 2005 Kyoto Prize in Advanced Technology for his invention of the liquid crystal display, and a member of the Consumer Electronics Hall of Fame. |
James H. Keyes (67) |
| Year of Election or Appointment: 2007 Prior to his retirement in 2003, Mr. Keyes was Chairman, President, and Chief Executive Officer of Johnson Controls, Inc. (automotive supplier, 1993-2003). He currently serves as a member of the boards of LSI Logic Corporation (semiconductor technologies), Navistar International Corporation (manufacture and sale of trucks, buses, and diesel engines, 2002-present), and Pitney Bowes, Inc. (integrated mail, messaging, and document management solutions). |
Marie L. Knowles (61) |
| Year of Election or Appointment: 2001 Prior to Ms. Knowles' retirement in June 2000, she served as Executive Vice President and Chief Financial Officer of Atlantic Richfield Company (ARCO) (diversified energy, 1996-2000). From 1993 to 1996, she was a Senior Vice President of ARCO and President of ARCO Transportation Company. She served as a Director of ARCO from 1996 to 1998. She currently serves as a Director of Phelps Dodge Corporation (copper mining and manufacturing) and McKesson Corporation (healthcare service, 2002-present). Ms. Knowles is a Trustee of the Brookings Institution and the Catalina Island Conservancy and also serves as a member of the Advisory Board for the School of Engineering of the University of Southern California. |
Ned C. Lautenbach (63) |
| Year of Election or Appointment: 2000 Mr. Lautenbach is Chairman of the Independent Trustees (2006-present). Mr. Lautenbach has been a partner of Clayton, Dubilier & Rice, Inc. (private equity investment firm) since September 1998. Previously, Mr. Lautenbach was with the International Business Machines Corporation (IBM) from 1968 until his retirement in 1998. Mr. Lautenbach serves as a Director of Sony Corporation (2006-present) and Eaton Corporation (diversified industrial) as well as the Philharmonic Center for the Arts in Naples, Florida. He also is a member of the Board of Trustees of Fairfield University (2005-present), as well as a member of the Council on Foreign Relations. |
Cornelia M. Small (63) |
| Year of Election or Appointment: 2005 Ms. Small is a member (2000-present) and Chairperson (2002-present) of the Investment Committee, and a member (2002-present) of the Board of Trustees of Smith College. Previously, she served as Chief Investment Officer (1999-2000), Director of Global Equity Investments (1996-1999), and a member of the Board of Directors of Scudder, Stevens & Clark (1990-1997) and Scudder Kemper Investments (1997-1999). In addition, Ms. Small served as Co-Chair (2000-2003) of the Annual Fund for the Fletcher School of Law and Diplomacy. |
William S. Stavropoulos (68) |
| Year of Election or Appointment: 2001 Mr. Stavropoulos is Chairman Emeritus of the Board of Directors of The Dow Chemical Company. Since joining The Dow Chemical Company in 1967, Mr. Stavropoulos served in numerous senior management positions, including President (1993-2000; 2002-2003), CEO (1995-2000; 2002-2004), and Chairman of the Executive Committee (2000-2004). Currently, he is a Director of NCR Corporation (data warehousing and technology solutions), Chemical Financial Corporation, Maersk Inc. (industrial conglomerate, 2002-present), Tyco International, Inc. (multinational manufacturing and services, 2007-present), and a member of the Advisory Board for Metalmark Capital (private equity investment firm, 2005-present). He is a special advisor to Clayton, Dubilier & Rice, Inc., a private equity investment firm. He also serves as a member of the Board of Trustees of the American Enterprise Institute for Public Policy Research. In addition, Mr. Stavropoulos is a member of The Business Council, J.P. Morgan International Council and the University of Notre Dame Advisory Council for the College of Science. |
Kenneth L. Wolfe (68) |
| Year of Election or Appointment: 2005 Mr. Wolfe is Chairman and a Director of Hershey Foods Corporation (2007-present), where prior to his retirement in 2001, he was Chairman and Chief Executive Officer. Mr. Wolfe currently serves as a member of the board of Revlon Inc. (2004-present). Previously, Mr. Wolfe served as a member of the boards of Adelphia Communications Corporation (2003-2006) and Bausch & Lomb, Inc. (1993-2007). |
Advisory Board Members and Executive Officers**:
Correspondence intended for Mr. Mauriello, Mr. Thomas, Mr. Wiley, Mr. Lacy, and Mr. Arthur Johnson may be sent to Fidelity Investments, P.O. Box 55235, Boston, Massachusetts 02205-5235. Correspondence intended for each executive officer and Mr. Lynch may be sent to Fidelity Investments, 82 Devonshire Street, Boston, Massachusetts 02109.
Name, Age; Principal Occupation |
Arthur E. Johnson (60) |
| Year of Election or Appointment: 2008 Member of the Advisory Board of Variable Insurance Products Fund IV. Mr. Johnson serves as Senior Vice President of Corporate Strategic Development of Lockheed Martin Corporation (defense contractor). In addition, Mr. Johnson serves as a member of the Board of Directors of AGL Resources, Inc. (holding company, 2002-present), and IKON Office Solutions, Inc. (document management systems and services). Mr. Arthur E. Johnson and Mr. Edward C. Johnson 3d are not related. |
Alan J. Lacy (54) |
| Year of Election or Appointment: 2008 Member of the Advisory Board of Variable Insurance Products Fund IV. Mr. Lacy serves as Senior Adviser (2007-present) of Oak Hill Capital Partners, L.P. (a private equity firm). Mr. Lacy also served as Vice Chairman and Chief Executive Officer of Sears Holdings Corporation and Sears, Roebuck and Co. (retail, 2005-2006; 2000-2005). In addition, Mr. Lacy serves as a member of the Board of Directors of The Western Union Company (global money transfer, 2006-present) and Bristol-Myers Squibb (global pharmaceuticals 2007-present). Mr. Lacy is a Trustee of the National Parks Conservation Association and The Field Museum of Natural History. |
Peter S. Lynch (63) |
| Year of Election or Appointment: 2003 Member of the Advisory Board of Variable Insurance Products Fund IV. Mr. Lynch is Vice Chairman and a Director of FMR, and Vice Chairman (2001-present) and a Director of FMR Co., Inc. Previously, Mr. Lynch served as a Trustee of the Fidelity funds (1990-2003). In addition, he serves as a Trustee of Boston College and as the Chairman of the Inner-City Scholarship Fund. |
Joseph Mauriello (63) |
| Year of Election or Appointment: 2007 Member of the Advisory Board of Variable Insurance Products Fund IV. Prior to his retirement in January 2006, Mr. Mauriello served in numerous senior management positions including Deputy Chairman and Chief Operating Officer (2004-2005), and Vice Chairman of Financial Services (2002-2004) of KPMG LLP US (professional services firm, 1965-2005). Mr. Mauriello currently serves as a member of the Board of Directors of XL Capital Ltd. (global insurance and re-insurance company, 2006- present) and of Arcadia Resources Inc. (health care services and products, 2007-present). He also served as a Director of the Hamilton Funds of the Bank of New York (2006-2007). |
David M. Thomas (58) |
| Year of Election or Appointment: 2007 Member of the Advisory Board of Variable Insurance Products Fund IV. Previously, Mr. Thomas served as Executive Chairman (2005-2006) and Chairman and Chief Executive Officer (2000-2005) of IMS Health, Inc. (pharmaceutical and healthcare information solutions). In addition, Mr. Thomas serves as a member of the Board of Directors of Fortune Brands, Inc. (consumer products holding company), and Interpublic Group of Companies, Inc. (marketing communication, 2004-present). |
Michael E. Wiley (57) |
| Year of Election or Appointment: 2007 Member of the Advisory Board of Variable Insurance Products Fund IV. Mr. Wiley also serves as a member of the Board of Trustees of the University of Tulsa (2000-2006; 2007-present). He serves as a Director of Tesoro Corporation (independent oil refiner and marketer, 2005-present), and a Director of Bill Barrett Corporation (exploration and production company, 2005-present). In addition, he also serves as a Director of Post Oak Bank (privately-held bank, 2004-present). Previously, Mr. Wiley served as a Sr. Energy Advisor of Katzenbach Partners, LLC (consulting firm, 2006-2007), as an Advisory Director of Riverstone Holdings (private investment firm), Chairman, President, and CEO of Baker Hughes, Inc. (oilfield services company, 2000-2004), and as Director of Spinnaker Exploration Company (exploration and production company, 2001-2005). |
Kimberley H. Monasterio (44) |
| Year of Election or Appointment: 2007 President and Treasurer of VIP Consumer Staples. Ms. Monasterio also serves as President and Treasurer of other Fidelity funds (2007-present) and is an employee of FMR (2004-present). Previously, Ms. Monasterio served as Deputy Treasurer of the Fidelity funds (2004-2006). Before joining Fidelity Investments, Ms. Monasterio served as Treasurer (2000-2004) and Chief Financial Officer (2002-2004) of the Franklin Templeton Funds and Senior Vice President of Franklin Templeton Services, LLC (2000-2004). |
Brian B. Hogan (43) |
| Year of Election or Appointment: 2007 Vice President of VIP Consumer Staples. Mr. Hogan also serves as Vice President of Sector Funds (2007-present). Mr. Hogan is Senior Vice President of Equity Research (2006-present). Mr. Hogan also serves as Vice President of FMR and FMR Co., Inc. Previously, Mr. Hogan served as a portfolio manager. |
Eric D. Roiter (59) |
| Year of Election or Appointment: 2007 Secretary of VIP Consumer Staples. He also serves as Secretary of other Fidelity funds; Vice President, General Counsel, and Secretary of FMR Co., Inc. (2001-present) and FMR; Assistant Secretary of Fidelity Management & Research (U.K.) Inc. (2001-present), Fidelity Research & Analysis Company (2001-present), and Fidelity Investments Money Management, Inc. (2001-present). Mr. Roiter is an Adjunct Member, Faculty of Law, at Boston College Law School (2003-present). Previously, Mr. Roiter served as Vice President and Secretary of Fidelity Distributors Corporation (FDC) (1998-2005). |
John B. McGinty, Jr. (45) |
| Year of Election or Appointment: 2008 Assistant Secretary of VIP Consumer Staples. Mr. McGinty also serves as Assistant Secretary of other Fidelity funds (2008-present) and is an employee of FMR LLC (2004-present). Mr. McGinty also serves as Senior Vice President, Secretary, and Chief Legal Officer of FDC (2007-present). Before joining Fidelity Investments, Mr. McGinty practiced law at Ropes & Gray, LLP. |
R. Stephen Ganis (41) |
| Year of Election or Appointment: 2007 Anti-Money Laundering (AML) officer of VIP Consumer Staples. Mr. Ganis also serves as AML officer of other Fidelity funds (2006-present) and FMR LLC (2003-present). Before joining Fidelity Investments, Mr. Ganis practiced law at Goodwin Procter, LLP (2000-2002). |
Joseph B. Hollis (59) |
| Year of Election or Appointment: 2007 Chief Financial Officer of VIP Consumer Staples. Mr. Hollis also serves as Chief Financial Officer of other Fidelity funds. Mr. Hollis is President of Fidelity Pricing and Cash Management Services (FPCMS) (2005-present). Mr. Hollis also serves as President and Director of Fidelity Service Company, Inc. (2006-present). Previously, Mr. Hollis served as Senior Vice President of Cash Management Services (1999-2002) and Investment Management Operations (2002-2005). |
Kenneth A. Rathgeber (60) |
| Year of Election or Appointment: 2007 Chief Compliance Officer of VIP Consumer Staples. Mr. Rathgeber also serves as Chief Compliance Officer of other Fidelity funds (2004-present) and Executive Vice President of Risk Oversight for Fidelity Investments (2002-present). He is Chief Compliance Officer of FMR (2005-present), FMR Co., Inc. (2005-present), Fidelity Management & Research (U.K.) Inc. (2005-present), Fidelity Research & Analysis Company (2005-present), Fidelity Investments Money Management, Inc. (2005-present), and Strategic Advisers, Inc. (2005-present). Previously, Mr. Rathgeber served as Executive Vice President and Chief Operating Officer for Fidelity Investments Institutional Services Company, Inc. (1998-2002). |
Bryan A. Mehrmann (46) |
| Year of Election or Appointment: 2007 Deputy Treasurer of VIP Consumer Staples. Mr. Mehrmann also serves as Deputy Treasurer of other Fidelity funds (2005-present) and is an employee of FMR. Previously, Mr. Mehrmann served as Vice President of Fidelity Investments Institutional Services Group (FIIS)/Fidelity Investments Institutional Operations Corporation, Inc. (FIIOC) Client Services (1998-2004). |
Kenneth B. Robins (38) |
| Year of Election or Appointment: 2007 Deputy Treasurer of VIP Consumer Staples. Mr. Robins also serves as Deputy Treasurer of other Fidelity funds (2005-present) and is an employee of FMR (2004-present). Before joining Fidelity Investments, Mr. Robins worked at KPMG LLP, where he was a partner in KPMG's department of professional practice (2002-2004) and a Senior Manager (1999-2000). In addition, Mr. Robins served as Assistant Chief Accountant, United States Securities and Exchange Commission (2000-2002). |
Robert G. Byrnes (41) |
| Year of Election or Appointment: 2007 Assistant Treasurer of VIP Consumer Staples. Mr. Byrnes also serves as Assistant Treasurer of other Fidelity funds (2005-present) and is an employee of FMR (2005-present). Previously, Mr. Byrnes served as Vice President of FPCMS (2003-2005). Before joining Fidelity Investments, Mr. Byrnes worked at Deutsche Asset Management where he served as Vice President of the Investment Operations Group (2000-2003). |
Peter L. Lydecker (53) |
| Year of Election or Appointment: 2007 Assistant Treasurer of VIP Consumer Staples. Mr. Lydecker also serves as Assistant Treasurer of other Fidelity funds (2004) and is an employee of FMR. |
Paul M. Murphy (60) |
| Year of Election or Appointment: 2007 Assistant Treasurer of VIP Consumer Staples. Mr. Murphy also serves as Assistant Treasurer of other Fidelity funds (2007-present) and is an employee of FMR (2007-present). Previously, Mr. Murphy served as Chief Financial Officer of the Fidelity Funds (2005-2006), Vice President and Associate General Counsel of FMR (2007), and Senior Vice President of Fidelity Pricing and Cash Management Services Group (FPCMS) (1994-2007). |
Gary W. Ryan (49) |
| Year of Election or Appointment: 2007 Assistant Treasurer of VIP Consumer Staples. Mr. Ryan also serves as Assistant Treasurer of other Fidelity funds (2005-present) and is an employee of FMR (2005-present). Previously, Mr. Ryan served as Vice President of Fund Reporting in FPCMS (1999-2005). |
** FMR Corp. merged with and into FMR LLC on October 1, 2007. Any references to FMR LLC for prior periods are deemed to be references to the prior entity.
Annual Report
Distributions
Initial Class and Investor Class each designate 58% of the dividends distributed in December 2007, as qualifying for the dividends-received deduction for corporate shareholders.
The fund will notify shareholders in January 2008 of amounts for use in preparing 2007 income tax returns.
Annual Report
Investment Adviser
Fidelity Management & Research Company
Boston, MA
Investment Sub-Advisers
FMR Co., Inc.
Fidelity Management & Research (U.K.) Inc.
Fidelity Research & Analysis Company
Fidelity Investments Japan Limited
Fidelity International Investment Advisors
Fidelity International Investment Advisors (U.K.) Limited
General Distributor
Fidelity Distributors Corporation
Boston, MA
Transfer and Service Agents
Fidelity Investments Institutional Operations Company, Inc.
Boston, MA
Fidelity Service Company, Inc.
Boston, MA
Custodian
State Street Bank and Trust Company
Quincy, MA
VCSP-ANN-0208
1.850994.100
Fidelity® Variable Insurance Products:
Energy Portfolio
Annual Report
December 31, 2007
(2_fidelity_logos) (Registered_Trademark)
Contents
Performance | <Click Here> | How the fund has done over time. |
Management's Discussion | <Click Here> | The manager's review of fund performance, strategy and outlook. |
Shareholder Expense Example | <Click Here> | An example of shareholder expenses. |
Investment Changes | <Click Here> | A summary of major shifts in the fund's investments over the past six months. |
Investments | <Click Here> | A complete list of the fund's investments with their
market values. |
Financial Statements | <Click Here> | Statements of assets and liabilities, operations, and
changes in net assets, as well as financial highlights. |
Notes | <Click Here> | Notes to the financial statements. |
Report of Independent Registered Public Accounting Firm | <Click Here> | |
Trustees and Officers | <Click Here> | |
Distributions | <Click Here> | |
Board Approval of Investment Advisory Contracts and Management Fees | <Click Here> | |
| | |
To view a fund's proxy voting guidelines and proxy voting record for the 12-month period ended June 30, visit http://www.fidelity.com (search for "proxy voting guidelines") or visit the Securities and Exchange Commission's (SEC) web site at http://www.sec.gov. You may also call 1-877-208-0098 to request a free copy of the proxy voting guidelines.
Fidelity Variable Insurance Products are separate account options which are purchased through a variable insurance contract.
Standard & Poor's, S&P and S&P 500 are registered service marks of The McGraw-Hill Companies, Inc. and have been licensed for use by Fidelity Distributors Corporation.
Other third party marks appearing herein are the property of their respective owners.
All other marks appearing herein are registered or unregistered trademarks or service marks of FMR LLC or an affiliated company.
This report and the financial statements contained herein are submitted for the general information of the shareholders of the fund. This report is not authorized for distribution to prospective investors in the fund unless preceded or accompanied by an effective prospectus.
A fund files its complete schedule of portfolio holdings with the SEC for the first and third quarters of each fiscal year on Form N-Q. Forms N-Q are available on the SEC's web site at http://www.sec.gov. A fund's Forms N-Q may be reviewed and copied at the SEC's Public Reference Room in Washington, DC. Information regarding the operation of the SEC's Public Reference Room may be obtained by calling 1-800-SEC-0330. For a complete list of the fund's portfolio holdings, view the most recent holdings listing, semiannual report, or annual report on Fidelity's web site at http://www.fidelity.com or http://www.advisor.fidelity.com, as applicable.
NOT FDIC INSURED · MAY LOSE VALUE · NO BANK GUARANTEE
Neither the fund nor Fidelity Distributors Corporation is a bank.
Annual Report
Performance: The Bottom Line
Average annual total return reflects the change in the value of an investment, assuming reinvestment of the class' dividend income and capital gains (the profits earned upon the sale of securities that have grown in value, if any) and assuming a constant rate of performance each year. During periods of reimbursement by Fidelity, a fund's total return will be greater than it would be had the reimbursement not occurred. Performance numbers are net of all underlying fund operating expenses, but do not include any insurance charges imposed by your insurance company's separate account. If performance information included the effect of these additional charges, the total returns would have been lower. How a fund did yesterday is no guarantee of how it will do tomorrow.
Average Annual Total Returns
Periods ended December 31, 2007 | Past 1
year | Past 5
years | Life of
fundA |
VIP Energy - Initial Class C | 45.97% | 32.23% | 21.22% |
VIP Energy - Investor ClassB, C | 45.88% | 32.15% | 21.17% |
A From July 19, 2001.
B The initial offering of Investor Class took place on July 21, 2005. Returns prior to July 21, 2005 are those of Initial Class. If Investor Class's transfer agent fee had been reflected, returns prior to July 21, 2005 would have been lower.
C Prior to October 1, 2006, VIP Energy operated under certain different investment policies. The historical performance for the fund may not represent its current investment policies.
$10,000 Over Life of Fund
Let's say hypothetically that $10,000 was invested in VIP Energy Portfolio - Initial Class on July 19, 2001, when the fund started. The chart shows how the value of your investment would have changed, and also shows how the Standard & Poor's 500SM Index (S&P 500®) performed over the same period.
Annual Report
Management's Discussion of Fund Performance
Comments from John Dowd, Portfolio Manager of VIP Energy Portfolio
U.S. equity markets, as measured by the bellwether Dow Jones Industrial AverageSM and the Standard & Poor's 500SM Index, registered their fifth consecutive year of positive returns in 2007, as the Dow rose 8.88% and the S&P 500® index advanced 5.49%. The tech-heavy NASDAQ Composite® Index did even better, increasing 10.55%. However, credit-and recession-related concerns carved deeply into stock prices late in 2007, pushing some major market measures into negative territory for the year overall, particularly smaller-cap and value-oriented benchmarks. Based largely on a weak U.S. dollar that boosted returns for U.S. investors, the Morgan Stanley Capital InternationalSM Europe, Australasia, and Far East (MSCI® EAFE®) Index - a gauge of developed stock markets outside the United States and Canada - beat most domestic equity measures, gaining 11.33%. Several European countries had outstanding performance, including Finland and Germany, while Australia also did very well. However, fallout from the credit crunch and concerns about export growth tempered U.K. stocks, while fears that Japanese financial companies would become embroiled in the U.S. subprime mortgage crisis contributed to a loss of more than 4% for the Japanese portion of the index. The emerging-markets stock asset class soared 39.78% according to the MSCI Emerging Markets index. The U.S. investment-grade bond market climbed 6.97% as measured by the Lehman Brothers® U.S. Aggregate Index, beating the 2.53% gain for the Merrill Lynch® U.S. High Yield Master II Constrained Index. The emerging-markets bond category shook off a sluggish first half of 2007 to finish the year with a respectable gain of 6.28% as measured by the J.P. Morgan Emerging Markets Bond Index (EMBI) Global, while the Citigroup® Non-U.S. Group of 7 Index - representing the debt performance of major global economies, excluding the United States - rose 13.05%.
For the 12 months ending December 31, 2007, the fund solidly outperformed the 34.42% gain of the Morgan Stanley Capital International (MSCI®) US Investable Market Energy Index and the S&P 500. (For specific portfolio performance results, please refer to the performance section of this report.) Despite an overweighting in oil and gas refining and marketing stocks, which underperformed other groups in the sector, and a couple of missed opportunities in oil-related stocks, superior stock selection and beneficial industry overweightings propelled the fund's return past that of the MSCI index. In terms of subsectors, the fund's overweightings included oil and gas equipment and services, coal and consumable fuels, oil and gas exploration and production, and oil and gas drilling. Overweighted positions in oil rig manufacturer National Oilwell Varco, natural gas producer Range Resources, and U.S. coal producer CONSOL Energy made these stocks top contributors. An out-of-benchmark position in Danish wind turbine maker Vestas Wind Systems also worked well, as did a big underweighting in integrated oil company Exxon Mobil, which helped relative returns when this major index component underperformed the sector as a whole. Conversely, an overweighted position in oil and gas exploration/production company Plains Exploration & Production detracted, as did untimely ownership of refining company Tesoro and underweightings in oil and gas exploration/production company Apache and integrated oil company Occidental Petroleum: All three delivered strong returns. Oilfield services provider Baker Hughes also hurt fund results.
The views expressed above reflect those of the portfolio manager(s) only through the end of the period as stated on the cover of this report and do not necessarily represent the views of Fidelity or any other person in the Fidelity organization. Any such views are subject to change at any time based upon market or other conditions and Fidelity disclaims any responsibility to update such views. These views may not be relied on as investment advice and, because investment decisions for a Fidelity fund are based on numerous factors, may not be relied on as an indication of trading intent on behalf of any Fidelity fund.
Annual Report
Shareholder Expense Example
As a shareholder of the Fund, you incur two types of costs: (1) transaction costs, including redemption fees, and (2) ongoing costs, including management fees, distribution and/or service (12b-1) fees and other Fund expenses. This Example is intended to help you understand your ongoing costs (in dollars) of investing in the Fund and to compare these costs with the ongoing costs of investing in other mutual funds.
The Example is based on an investment of $1,000 invested at the beginning of the period and held for the entire period (July 1, 2007 to December 31, 2007).
Actual Expenses
The first line of the accompanying table for each class of the Fund provides information about actual account values and actual expenses. You may use the information in this line, together with the amount you invested, to estimate the expenses that you paid over the period. Simply divide your account value by $1,000.00 (for example, an $8,600 account value divided by $1,000.00 = 8.6), then multiply the result by the number in the first line for a class of the Fund under the heading entitled "Expenses Paid During Period" to estimate the expenses you paid on your account during this period. The estimate of expenses does not include any fees or other expenses of any variable annuity or variable life insurance product. If they were, the estimate of expenses you paid during the period would be higher, and your ending account value would be lower. In addition, the Fund, as a shareholder in the underlying Fidelity Central Funds, will indirectly bear its pro rata share of the fees and expenses incurred by the underlying Fidelity Central Funds. These fees and expenses are not included in the Fund's annualized expense ratio used to calculate the expense estimate in the table below.
Hypothetical Example for Comparison Purposes
The second line of the accompanying table for each class of the Fund provides information about hypothetical account values and hypothetical expenses based on a Class' actual expense ratio and an assumed rate of return of 5% per year before expenses, which is not the Class' actual return. The hypothetical account values and expenses may not be used to estimate the actual ending account balance or expenses you paid for the period. You may use this information to compare the ongoing costs of investing in the Fund and other funds. To do so, compare this 5% hypothetical example with the 5% hypothetical examples that appear in the shareholder reports of the other funds. The estimate of expenses does not include any fees or other expenses of any variable annuity or variable life insurance product. If they were, the estimate of expenses you paid during the period would be higher, and your ending account value would be lower. In addition, the Fund, as a shareholder in the underlying Fidelity Central Funds, will indirectly bear its pro rata share of the fees and expenses incurred by the underlying Fidelity Central Funds. These fees and expenses are not included in the Fund's annualized expense ratio used to calculate the expense estimate in the table below.
Please note that the expenses shown in the table are meant to highlight your ongoing costs only and do not reflect any transaction costs. Therefore, the second line of the table is useful in comparing ongoing costs only, and will not help you determine the relative total costs of owning different funds. In addition, if these transactional costs were included, your costs would have been higher.
| Beginning
Account Value
July 1, 2007 | Ending
Account Value
December 31, 2007 | Expenses Paid
During Period*
July 1, 2007
to December 31, 2007 |
Initial Class | | | |
Actual | $ 1,000.00 | $ 1,185.30 | $ 3.75 |
HypotheticalA | $ 1,000.00 | $ 1,021.78 | $ 3.47 |
Service Class 2 | | | |
Actual | $ 1,000.00 | $ 1,183.90 | $ 5.17 |
HypotheticalA | $ 1,000.00 | $ 1,020.47 | $ 4.79 |
Investor Class | | | |
Actual | $ 1,000.00 | $ 1,185.00 | $ 4.41 |
HypotheticalA | $ 1,000.00 | $ 1,021.17 | $ 4.08 |
A 5% return per year before expenses
* Expenses are equal to each Class' annualized expense ratio (shown in the table below); multiplied by the average account value over the period, multiplied by 184/365 (to reflect the one-half year period).
| Annualized
Expense Ratio |
Initial Class | .68% |
Service Class 2 | .94% |
Investor Class | .80% |
Annual Report
Investment Changes
Top Ten Stocks as of December 31, 2007 |
| % of fund's
net assets | % of fund's net assets
6 months ago |
Exxon Mobil Corp. | 14.3 | 13.2 |
Valero Energy Corp. | 6.8 | 7.0 |
National Oilwell Varco, Inc. | 6.3 | 4.6 |
Schlumberger Ltd. (NY Shares) | 6.0 | 6.7 |
CONSOL Energy, Inc. | 4.1 | 1.2 |
Peabody Energy Corp. | 3.9 | 1.2 |
Range Resources Corp. | 3.6 | 3.3 |
Transocean, Inc. | 3.4 | 2.4 |
Cabot Oil & Gas Corp. | 3.0 | 2.9 |
Ultra Petroleum Corp. | 2.7 | 2.8 |
| 54.1 | |
Top Industries (% of fund's net assets) |
As of December 31, 2007 |
 | Oil, Gas & Consumable Fuels | 67.5% | |
 | Energy Equipment & Services | 27.5% | |
 | Electrical Equipment | 2.9% | |
 | Construction & Engineering | 0.8% | |
 | Independent Power Producers & Energy Traders | 0.3% | |
 | All Others* | 1.0% | |

|
As of June 30, 2007 |
| Oil, Gas & Consumable Fuels | 64.3% | |
| Energy Equipment & Services | 31.5% | |
| Electrical Equipment | 1.5% | |
| Construction & Engineering | 1.0% | |
| Multi-utilities | 0.2% | |
| All Others* | 1.5% | |

* Includes short-term investments and net other assets. |
Annual Report
Investments December 31, 2007
Showing Percentage of Net Assets
Common Stocks - 99.4% |
| Shares | | Value |
COMMERCIAL SERVICES & SUPPLIES - 0.0% |
Environmental & Facility Services - 0.0% |
Fuel Tech, Inc. (a) | 10,149 | | $ 229,875 |
CONSTRUCTION & ENGINEERING - 0.8% |
Construction & Engineering - 0.8% |
Chicago Bridge & Iron Co. NV (NY Shares) | 11,800 | | 713,192 |
Jacobs Engineering Group, Inc. (a) | 52,000 | | 4,971,720 |
| | 5,684,912 |
ELECTRICAL EQUIPMENT - 2.9% |
Electrical Components & Equipment - 1.0% |
First Solar, Inc. (a) | 1,400 | | 373,996 |
JA Solar Holdings Co. Ltd. ADR | 33,200 | | 2,317,692 |
Q-Cells AG (a) | 8,600 | | 1,224,962 |
Renewable Energy Corp. AS (a) | 35,900 | | 1,823,240 |
Sunpower Corp. Class A (a) | 500 | | 65,195 |
Suntech Power Holdings Co. Ltd. sponsored ADR (a) | 11,100 | | 913,752 |
| | 6,718,837 |
Heavy Electrical Equipment - 1.9% |
Suzlon Energy Ltd. | 44,088 | | 2,166,975 |
Vestas Wind Systems AS (a) | 102,783 | | 11,104,173 |
| | 13,271,148 |
TOTAL ELECTRICAL EQUIPMENT | | 19,989,985 |
ENERGY EQUIPMENT & SERVICES - 27.5% |
Oil & Gas Drilling - 8.1% |
Atwood Oceanics, Inc. (a) | 50,200 | | 5,032,048 |
Diamond Offshore Drilling, Inc. | 65,100 | | 9,244,200 |
Nabors Industries Ltd. (a) | 32,600 | | 892,914 |
Noble Corp. | 202,960 | | 11,469,270 |
Pride International, Inc. (a) | 163,100 | | 5,529,090 |
Transocean, Inc. (a) | 161,647 | | 23,139,768 |
| | 55,307,290 |
Oil & Gas Equipment & Services - 19.4% |
Aker Kvaerner ASA | 18,250 | | 485,256 |
Baker Hughes, Inc. | 80 | | 6,488 |
Cameron International Corp. (a) | 73,400 | | 3,532,742 |
Compagnie Generale de Geophysique SA (a) | 22,100 | | 6,289,284 |
Emer International Group Ltd. (a) | 342,000 | | 235,980 |
Expro International Group PLC | 98,500 | | 2,021,630 |
Exterran Holdings, Inc. (a) | 44,295 | | 3,623,331 |
FMC Technologies, Inc. (a) | 92,020 | | 5,217,534 |
Grant Prideco, Inc. (a) | 1,600 | | 88,816 |
NATCO Group, Inc. Class A (a) | 2,500 | | 135,375 |
National Oilwell Varco, Inc. (a) | 579,478 | | 42,568,454 |
Oceaneering International, Inc. (a) | 69,857 | | 4,704,869 |
Oil States International, Inc. (a) | 29,400 | | 1,003,128 |
Petroleum Geo-Services ASA | 22,200 | | 644,411 |
ProSafe ASA | 35,700 | | 620,784 |
|
| Shares | | Value |
Saipem SpA | 36,400 | | $ 1,456,078 |
Schlumberger Ltd. (NY Shares) | 417,120 | | 41,032,094 |
Smith International, Inc. | 117,180 | | 8,653,743 |
Subsea 7, Inc. (a) | 56,500 | | 1,263,180 |
Superior Energy Services, Inc. (a) | 108,300 | | 3,727,686 |
Weatherford International Ltd. (a) | 52,800 | | 3,622,080 |
WorleyParsons Ltd. | 17,476 | | 795,976 |
| | 131,728,919 |
TOTAL ENERGY EQUIPMENT & SERVICES | | 187,036,209 |
GAS UTILITIES - 0.1% |
Gas Utilities - 0.1% |
Questar Corp. | 12,300 | | 665,430 |
INDEPENDENT POWER PRODUCERS & ENERGY TRADERS - 0.3% |
Independent Power Producers & Energy Traders - 0.3% |
AES Corp. (a) | 26,800 | | 573,252 |
Constellation Energy Group, Inc. | 6,900 | | 707,457 |
NRG Energy, Inc. (a) | 12,400 | | 537,416 |
| | 1,818,125 |
INDUSTRIAL CONGLOMERATES - 0.2% |
Industrial Conglomerates - 0.2% |
McDermott International, Inc. (a) | 26,100 | | 1,540,683 |
OIL, GAS & CONSUMABLE FUELS - 67.5% |
Coal & Consumable Fuels - 9.8% |
Alpha Natural Resources, Inc. (a) | 5,600 | | 181,888 |
Arch Coal, Inc. | 130,150 | | 5,847,640 |
CONSOL Energy, Inc. | 391,130 | | 27,973,618 |
Foundation Coal Holdings, Inc. | 80,000 | | 4,200,000 |
International Coal Group, Inc. (a) | 20,500 | | 109,880 |
Massey Energy Co. | 55,800 | | 1,994,850 |
Natural Resource Partners LP | 2,700 | | 87,642 |
Peabody Energy Corp. | 430,670 | | 26,546,499 |
| | 66,942,017 |
Integrated Oil & Gas - 26.1% |
Chevron Corp. | 166,980 | | 15,584,243 |
ConocoPhillips | 179,375 | | 15,838,813 |
Exxon Mobil Corp. | 1,042,711 | | 97,691,590 |
Hess Corp. | 97,800 | | 9,864,108 |
Marathon Oil Corp. | 222,100 | | 13,517,006 |
Occidental Petroleum Corp. | 159,600 | | 12,287,604 |
Petroleo Brasileiro SA - Petrobras sponsored ADR | 92,500 | | 10,659,700 |
Suncor Energy, Inc. | 18,000 | | 1,954,990 |
| | 177,398,054 |
Oil & Gas Exploration & Production - 20.1% |
American Oil & Gas, Inc. NV (a) | 50,739 | | 294,286 |
Apache Corp. | 16,000 | | 1,720,640 |
Aurora Oil & Gas Corp. (a) | 198,107 | | 307,066 |
Cabot Oil & Gas Corp. | 508,318 | | 20,520,798 |
Canadian Natural Resources Ltd. | 39,200 | | 2,863,606 |
Common Stocks - continued |
| Shares | | Value |
OIL, GAS & CONSUMABLE FUELS - CONTINUED |
Oil & Gas Exploration & Production - continued |
Chesapeake Energy Corp. (d) | 291,100 | | $ 11,411,120 |
Concho Resources, Inc. | 88,544 | | 1,824,892 |
EOG Resources, Inc. | 138,000 | | 12,316,500 |
EXCO Resources, Inc. (a) | 3,700 | | 57,276 |
Goodrich Petroleum Corp. (a) | 17,600 | | 398,112 |
Kodiak Oil & Gas Corp. (a) | 101,700 | | 223,740 |
Newfield Exploration Co. (a) | 13,900 | | 732,530 |
Noble Energy, Inc. | 52,800 | | 4,198,656 |
Petrohawk Energy Corp. (a) | 256,200 | | 4,434,822 |
Plains Exploration & Production Co. (a) | 5,100 | | 275,400 |
Quicksilver Resources, Inc. (a) | 190,384 | | 11,344,983 |
Range Resources Corp. | 480,700 | | 24,688,752 |
Southwestern Energy Co. (a) | 120,100 | | 6,691,972 |
Ultra Petroleum Corp. (a) | 260,500 | | 18,625,750 |
Vanguard Natural Resources LLC | 3,400 | | 54,400 |
XTO Energy, Inc. | 269,150 | | 13,823,544 |
| | 136,808,845 |
Oil & Gas Refining & Marketing - 9.3% |
Holly Corp. | 15,500 | | 788,795 |
Petroplus Holdings AG | 17,752 | | 1,373,732 |
Sunoco, Inc. | 51,236 | | 3,711,536 |
Tesoro Corp. | 205,400 | | 9,797,580 |
Valero Energy Corp. | 660,324 | | 46,242,490 |
Western Refining, Inc. | 49,606 | | 1,200,961 |
| | 63,115,094 |
Oil & Gas Storage & Transport - 2.2% |
El Paso Pipeline Partners LP | 46,700 | | 1,169,835 |
Williams Companies, Inc. | 387,350 | | 13,859,383 |
| | 15,029,218 |
TOTAL OIL, GAS & CONSUMABLE FUELS | | 459,293,228 |
|
| Shares | | Value |
SOFTWARE - 0.1% |
Application Software - 0.1% |
Zhongyu Gas Holdings Ltd. (a) | 3,174,000 | | $ 500,702 |
TOTAL COMMON STOCKS (Cost $455,773,491) | 676,759,149 |
Money Market Funds - 3.0% |
| | | |
Fidelity Cash Central Fund, 4.58% (b) | 11,655,181 | | 11,655,181 |
Fidelity Securities Lending Cash Central Fund, 4.65% (b)(c) | 8,707,500 | | 8,707,500 |
TOTAL MONEY MARKET FUNDS (Cost $20,362,681) | 20,362,681 |
TOTAL INVESTMENT PORTFOLIO - 102.4% (Cost $476,136,172) | | 697,121,830 |
NET OTHER ASSETS - (2.4)% | | (16,183,460) |
NET ASSETS - 100% | $ 680,938,370 |
Legend |
(a) Non-income producing |
(b) Affiliated fund that is available only to investment companies and other accounts managed by Fidelity Investments. The rate quoted is the annualized seven-day yield of the fund at period end. A complete unaudited listing of the fund's holdings as of its most recent quarter end is available upon request. |
(c) Investment made with cash collateral received from securities on loan. |
(d) Security or a portion of the security is on loan at period end. |
Affiliated Central Funds |
Information regarding fiscal year to date income earned by the Fund from investments in Fidelity Central Funds is as follows: |
Fund | Income earned |
Fidelity Cash Central Fund | $ 298,269 |
Fidelity Securities Lending Cash Central Fund | 38,940 |
Total | $ 337,209 |
Distribution of investments by country of issue, as a percentage of total net assets, is as follows: |
United States of America | 81.9% |
Netherlands Antilles | 6.0% |
Canada | 3.4% |
Cayman Islands | 2.4% |
Denmark | 1.6% |
Brazil | 1.6% |
Others (individually less than 1%) | 3.1% |
| 100.0% |
See accompanying notes which are an integral part of the financial statements.
Annual Report
Financial Statements
Statement of Assets and Liabilities
| December 31, 2007 |
| | |
Assets | | |
Investment in securities, at value
(including securities loaned of $8,428,000) - See accompanying schedule: Unaffiliated issuers
(cost $455,773,491) | $ 676,759,149 | |
Fidelity Central Funds
(cost $20,362,681) | 20,362,681 | |
Total Investments
(cost $476,136,172) | | $ 697,121,830 |
Foreign currency held at value
(cost $12) | | 7 |
Receivable for investments sold | | 1,101,868 |
Receivable for fund shares sold | | 1,819,664 |
Dividends receivable | | 261,823 |
Distributions receivable from Fidelity Central Funds | | 27,918 |
Prepaid expenses | | 1,924 |
Other receivables | | 3,680 |
Total assets | | 700,338,714 |
| | |
Liabilities | | |
Payable for investments purchased | $ 9,915,469 | |
Payable for fund shares redeemed | 221,813 | |
Accrued management fee | 298,944 | |
Distribution fees payable | 38,203 | |
Other affiliated payables | 66,554 | |
Other payables and accrued expenses | 151,861 | |
Collateral on securities loaned, at value | 8,707,500 | |
Total liabilities | | 19,400,344 |
| | |
Net Assets | | $ 680,938,370 |
Net Assets consist of: | | |
Paid in capital | | $ 453,304,513 |
Accumulated undistributed net realized gain (loss) on investments and foreign currency transactions | | 6,745,419 |
Net unrealized appreciation (depreciation) on investments and assets and liabilities in foreign currencies | | 220,888,438 |
Net Assets | | $ 680,938,370 |
Initial Class:
Net Asset Value, offering price and redemption price per share ($355,853,699 ÷ 13,402,854 shares) | | $ 26.55 |
| | |
Service Class 2:
Net Asset Value, offering price and redemption price per share ($193,886,517 ÷ 7,333,146 shares) | | $ 26.44 |
| | |
Investor Class:
Net Asset Value, offering price and redemption price per share ($131,198,154 ÷ 4,953,466 shares) | | $ 26.49 |
Statement of Operations
| Year ended December 31, 2007 |
| | |
Investment Income | | |
Dividends | | $ 4,723,121 |
Interest | | 63 |
Income from Fidelity Central Funds | | 337,209 |
Total income | | 5,060,393 |
| | |
Expenses | | |
Management fee | $ 2,786,723 | |
Transfer agent fees | 429,230 | |
Distribution fees | 304,246 | |
Accounting and security
lending fees | 193,018 | |
Custodian fees and expenses | 34,197 | |
Independent trustees' compensation | 1,681 | |
Registration fees | 400 | |
Audit | 42,713 | |
Legal | 4,313 | |
Interest | 10,659 | |
Miscellaneous | 86,199 | |
Total expenses before reductions | 3,893,379 | |
Expense reductions | (6,437) | 3,886,942 |
Net investment income (loss) | | 1,173,451 |
Realized and Unrealized Gain (Loss) Net realized gain (loss) on: | | |
Investment securities: | | |
Unaffiliated issuers (net of foreign taxes of $3,663) | 35,802,209 | |
Foreign currency transactions | 4,263 | |
Total net realized gain (loss) | | 35,806,472 |
Change in net unrealized appreciation (depreciation) on: Investment securities (net of increase in deferred foreign taxes of $97,338) | 145,447,842 | |
Assets and liabilities in foreign currencies | 63 | |
Total change in net unrealized appreciation (depreciation) | | 145,447,905 |
Net gain (loss) | | 181,254,377 |
Net increase (decrease) in net assets resulting from operations | | $ 182,427,828 |
See accompanying notes which are an integral part of the financial statements.
Annual Report
Financial Statements - continued
Statement of Changes in Net Assets
| Year ended
December 31,
2007 | Year ended
December 31,
2006 |
Increase (Decrease) in Net Assets | | |
Operations | | |
Net investment income (loss) | $ 1,173,451 | $ 1,751,602 |
Net realized gain (loss) | 35,806,472 | 50,115,511 |
Change in net unrealized appreciation (depreciation) | 145,447,905 | (2,183,254) |
Net increase (decrease) in net assets resulting from operations | 182,427,828 | 49,683,859 |
Distributions to shareholders from net investment income | (1,200,523) | (2,844,412) |
Distributions to shareholders from net realized gain | (27,081,489) | (54,354,221) |
Total distributions | (28,282,012) | (57,198,633) |
Share transactions - net increase (decrease) | 124,344,576 | 38,551,892 |
Redemption fees | 169,727 | 261,131 |
Total increase (decrease) in net assets | 278,660,119 | 31,298,249 |
| | |
Net Assets | | |
Beginning of period | 402,278,251 | 370,980,002 |
End of period | $ 680,938,370 | $ 402,278,251 |
Financial Highlights - Initial Class
Years ended December 31, | 2007 | 2006 | 2005 | 2004 | 2003 |
Selected Per-Share Data | | | | | |
Net asset value, beginning of period | $ 19.04 | $ 18.92 | $ 13.62 | $ 11.04 | $ 8.49 |
Income from Investment Operations | | | | | |
Net investment income (loss) C | .07 | .09 | .10 | .10 | .05 |
Net realized and unrealized gain (loss) | 8.62 | 3.09 | 6.20 | 2.53 | 2.54 |
Total from investment operations | 8.69 | 3.18 | 6.30 | 2.63 | 2.59 |
Distributions from net investment income | (.06) | (.16) | (.08) | (.07) | (.05) |
Distributions from net realized gain | (1.13) | (2.91) | (.94) | - | - |
Total distributions | (1.19) | (3.07) | (1.02) | (.07) | (.05) |
Redemption fees added to paid in capital C | .01 | .01 | .02 | .02 | .01 |
Net asset value, end of period | $ 26.55 | $ 19.04 | $ 18.92 | $ 13.62 | $ 11.04 |
Total Return A, B | 45.97% | 16.91% | 46.31% | 23.96% | 30.61% |
Ratios to Average Net Assets D, F | | | | | |
Expenses before reductions | .70% | .71% | .72% | .78% | 1.26% |
Expenses net of fee waivers, if any | .70% | .71% | .72% | .78% | 1.26% |
Expenses net of all reductions | .70% | .70% | .66% | .74% | 1.25% |
Net investment income (loss) | .31% | .43% | .56% | .80% | .56% |
Supplemental Data | | | | | |
Net assets, end of period (000 omitted) | $ 355,854 | $ 280,537 | $ 334,368 | $ 125,781 | $ 31,624 |
Portfolio turnover rate E | 61% | 151% | 107% | 87% | 73% |
A Total returns do not reflect charges attributable to your insurance company's separate account. Inclusion of these charges would reduce the total returns shown.
B Total returns would have been lower had certain expenses not been reduced during the periods shown.
C Calculated based on average shares outstanding during the period.
D Fees and expenses of the underlying Fidelity Central Funds are not included in the Fund's expense ratio. The Fund indirectly bears its proportionate share of the expenses of any underlying Fidelity Central Funds.
E Amount does not include the portfolio activity of any underlying Fidelity Central Funds.
F Expense ratios reflect operating expenses of the class. Expenses before reductions do not reflect amounts reimbursed by the investment adviser or reductions from brokerage service arrangements or other expense offset arrangements and do not represent the amount paid by the class during periods when reimbursements or reductions occur. Expenses net of fee waivers reflect expenses after reimbursement by the investment adviser but prior to reductions from brokerage service arrangements or other expense offset arrangements. Expenses net of all reductions represent the net expenses paid by the class.
See accompanying notes which are an integral part of the financial statements.
Annual Report
Financial Highlights - Service Class 2
Years ended December 31, | 2007 | 2006 | 2005 H |
Selected Per-Share Data | | | |
Net asset value, beginning of period | $ 18.98 | $ 18.90 | $ 15.80 |
Income from Investment Operations | | | |
Net investment income (loss) E | .02 | .04 | .04 |
Net realized and unrealized gain (loss) | 8.58 | 3.07 | 4.04 |
Total from investment operations | 8.60 | 3.11 | 4.08 |
Distributions from net investment income | (.02) | (.13) | (.07) |
Distributions from net realized gain | (1.13) | (2.91) | (.92) |
Total distributions | (1.15) | (3.04) | (.99) |
Redemption fees added to paid in capital E | .01 | .01 | .01 |
Net asset value, end of period | $ 26.44 | $ 18.98 | $ 18.90 |
Total Return B, C,D | 45.64% | 16.55% | 25.80% |
Ratios to Average Net Assets F, I | | | |
Expenses before reductions | .95% | .96% | .97% A |
Expenses net of fee waivers, if any | .95% | .96% | .97% A |
Expenses net of all reductions | .94% | .95% | .91% A |
Net investment income (loss) | .07% | .18% | .31% A |
Supplemental Data | | | |
Net assets, end of period (000 omitted) | $ 193,887 | $ 70,305 | $ 20,211 |
Portfolio turnover rate G | 61% | 151% | 107% |
A Annualized
B Total returns for periods of less than one year are not annualized.
C Total returns do not reflect charges attributable to your insurance company's separate account. Inclusion of these charges would reduce the total returns shown.
D Total returns would have been lower had certain expenses not been reduced during the periods shown.
E Calculated based on average shares outstanding during the period.
F Fees and expenses of the underlying Fidelity Central Funds are not included in the Fund's expense ratio. The Fund indirectly bears its proportionate share of the expenses of any underlying Fidelity Central Funds.
G Amount does not include the portfolio activity of any underlying Fidelity Central Funds.
H For the period April 6, 2005 (commencement of sale of shares) to December 31, 2005.
I Expense ratios reflect operating expenses of the class. Expenses before reductions do not reflect amounts reimbursed by the investment adviser or reductions from brokerage service arrangements or other expense offset arrangements and do not represent the amount paid by the class during periods when reimbursements or reductions occur. Expense ratios before reductions for start-up periods may not be representative of longer-term operating periods. Expenses net of fee waivers reflect expenses after reimbursement by the investment adviser but prior to reductions from brokerage service arrangements or other expense offset arrangements. Expenses net of all reductions represent the net expenses paid by the class.
Financial Highlights - Investor Class
Years ended December 31, | 2007 | 2006 | 2005H |
Selected Per-Share Data | | | |
Net asset value, beginning of period | $ 19.00 | $ 18.91 | $ 16.76 |
Income from Investment Operations | | | |
Net investment income (loss)E | .05 | .06 | .03 |
Net realized and unrealized gain (loss) | 8.61 | 3.08 | 3.11 |
Total from investment operations | 8.66 | 3.14 | 3.14 |
Distributions from net investment income | (.05) | (.15) | (.08) |
Distributions from net realized gain | (1.13) | (2.91) | (.92) |
Total distributions | (1.18) | (3.06) | (1.00) |
Redemption fees added to paid in capitalE | .01 | .01 | .01 |
Net asset value, end of period | $ 26.49 | $ 19.00 | $ 18.91 |
Total ReturnB, C,D | 45.88% | 16.69% | 18.73% |
Ratios to Average Net AssetsF, I | | | |
Expenses before reductions | .81% | .84% | .91%A |
Expenses net of fee waivers, if any | .81% | .84% | .91%A |
Expenses net of all reductions | .81% | .82% | .85%A |
Net investment income (loss) | .20% | .31% | .37%A |
Supplemental Data | | | |
Net assets, end of period (000 omitted) | $ 131,198 | $ 51,436 | $ 16,402 |
Portfolio turnover rateG | 61% | 151% | 107% |
A Annualized
B Total returns for periods of less than one year are not annualized.
C Total returns do not reflect charges attributable to your insurance company's separate account. Inclusion of these charges would reduce the total returns shown.
D Total returns would have been lower had certain expenses not been reduced during the periods shown.
E Calculated based on average shares outstanding during the period.
F Fees and expenses of the underlying Fidelity Central Funds are not included in the Fund's expense ratio. The Fund indirectly bears its proportionate share of the expenses of any underlying Fidelity Central Funds.
G Amount does not include the portfolio activity of any underlying Fidelity Central Funds.
H For the period July 21, 2005 (commencement of sale of shares) to December 31, 2005.
I Expense ratios reflect operating expenses of the class. Expenses before reductions do not reflect amounts reimbursed by the investment adviser or reductions from brokerage service arrangements or other expense offset arrangements and do not represent the amount paid by the class during periods when reimbursements or reductions occur. Expense ratios before reductions for start-up periods may not be representative of longer-term operating periods. Expenses net of fee waivers reflect expenses after reimbursement by the investment adviser but prior to reductions from brokerage service arrangements or other expense offset arrangements. Expenses net of all reductions represent the net expenses paid by the class.
See accompanying notes which are an integral part of the financial statements.
Annual Report
Notes to Financial Statements
For the period ended December 31, 2007
1. Organization.
VIP Energy Portfolio (the Fund) is a non-diversified fund of Variable Insurance Products Fund IV (the trust) and is authorized to issue an unlimited number of shares. The trust is registered under the Investment Company Act of 1940, as amended (the 1940 Act), as an open-end management investment company organized as a Massachusetts business trust. Shares of the Fund may only be purchased by insurance companies for the purpose of funding variable annuity or variable life insurance contracts. The Fund offers the following classes of shares: Initial Class shares, Service Class 2 shares, and Investor Class shares. All classes have equal rights and voting privileges, except for matters affecting a single class. Investment income, realized and unrealized capital gains and losses, the common expenses of the Fund, and certain fund-level expense reductions, if any, are allocated on a pro rata basis to each class based on the relative net assets of each class to the total net assets of the Fund. Each class differs with respect to transfer agent and distribution and service plan fees incurred. Certain expense reductions also differ by class.
2. Investments in Fidelity Central Funds.
The Fund may invest in Fidelity Central Funds, which are open-end investment companies available only to other investment companies and accounts managed by Fidelity Management & Research Company (FMR) and its affiliates. The Fund's Schedule of Investments lists each of the Fidelity Central Funds as an investment of the Fund, but does not include the underlying holdings of each Fidelity Central Fund. As an Investing Fund, the Fund indirectly bears its proportionate share of the expenses of the underlying Fidelity Central Funds.
The Money Market Central Funds seek preservation of capital and current income and are managed by Fidelity Investments Money Management, Inc. (FIMM), an affiliate of FMR.
A complete list of holdings for each Fidelity Central Fund is available upon request or at the SEC's web site at www.sec.gov. In addition, the financial statements of the Fidelity Central Funds, which are not covered by the Fund's Report of Independent Registered Public Accounting Firm, are available on the SEC's web site or upon request.
3. Significant Accounting Policies.
The financial statements have been prepared in conformity with accounting principles generally accepted in the United States of America, which require management to make certain estimates and assumptions at the date of the financial statements. The following summarizes the significant accounting policies of the Fund:
Security Valuation. Investments are valued and net asset value (NAV) per share is calculated (NAV calculation) as of the close of business of the New York Stock Exchange (NYSE), normally 4:00 p.m. Eastern time. Wherever possible, the Fund uses independent pricing services approved by the Board of Trustees to value its investments.
Equity securities, including restricted securities, for which market quotations are readily available, are valued at the last reported sale price or official closing price as reported by an independent pricing service on the primary market or exchange on which they are traded. In the event there were no sales during the day or closing prices are not available, securities are valued at the last quoted bid price. Investments in open-end mutual funds, including the Fidelity Central Funds, are valued at their closing net asset value each business day. Short-term securities with remaining maturities of sixty days or less for which quotations are not readily available are valued at amortized cost, which approximates value.
When current market prices or quotations are not readily available or do not accurately reflect fair value, valuations may be determined in accordance with procedures adopted by the Board of Trustees. For example, when developments occur between the close of a market and the close of the NYSE that may materially affect the value of some or all of the securities, or when trading in a security is halted, those securities may be fair valued. Factors used in the determination of fair value may include monitoring news to identify significant market or security specific events such as changes in the value of U.S. securities markets, reviewing developments in foreign markets and evaluating the performance of ADRs, futures contracts and exchange-traded funds. Because the Fund's utilization of fair value pricing depends on market activity, the frequency with which fair value pricing is used cannot be predicted and may be utilized to a significant extent. The value of securities used for NAV calculation under fair value pricing may differ from published prices for the same securities.
Foreign Currency. The Fund uses foreign currency contracts to facilitate transactions in foreign-denominated securities. Losses from these transactions may arise from changes in the value of the foreign currency or if the counterparties do not perform under the contracts' terms.
Foreign-denominated assets, including investment securities, and liabilities are translated into U.S. dollars at the exchange rate at period end. Purchases and sales of investment securities, income and dividends received and expenses denominated in foreign currencies are translated into U.S. dollars at the exchange rate in effect on the transaction date.
The effects of exchange rate fluctuations on investments are included with the net realized and unrealized gain (loss) on investment securities. Other foreign currency transactions resulting in realized and unrealized gain (loss) are disclosed separately.
Annual Report
3. Significant Accounting Policies - continued
Investment Transactions and Income. For financial reporting purposes, the Fund's investment holdings and NAV include trades executed through the end of the last business day of the period. The NAV for processing shareholder transactions includes trades executed through the end of the prior business day. Gains and losses on securities sold are determined on the basis of identified cost. Dividend income is recorded on the ex-dividend date, except for certain dividends from foreign securities where the ex-dividend date may have passed, which are recorded as soon as the Fund is informed of the ex-dividend date. Non-cash dividends included in dividend income, if any, are recorded at the fair market value of the securities received. Distributions received on securities that represent a return of capital or capital gain are recorded as a reduction of cost of investments and/or as a realized gain. The Fund estimates the components of distributions received that may be considered return of capital distributions or capital gain distributions. Interest income and distributions from the Fidelity Central Funds are accrued as earned. Interest income includes coupon interest and amortization of premium and accretion of discount on debt securities. Investment income is recorded net of foreign taxes withheld where recovery of such taxes is uncertain.
Expenses. Most expenses of the trust can be directly attributed to a fund. Expenses which cannot be directly attributed are apportioned among each Fund in the trust. Expense estimates are accrued in the period to which they relate and adjustments are made when actual amounts are known.
Income Tax Information and Distributions to Shareholders. Each year, the Fund intends to qualify as a regulated investment company by distributing substantially all of its taxable income and realized gains under Subchapter M of the Internal Revenue Code and filing its U.S. federal tax return. As a result, no provision for income taxes is required. The Fund adopted the provisions of FASB Interpretation No. 48, Accounting for Uncertainties in Income Taxes (FIN 48), on June 29, 2007. FIN 48 sets forth a minimum threshold for financial statement recognition of the benefit of a tax position taken or expected to be taken in a tax return. The implementation of FIN 48 did not result in any unrecognized tax benefits in the accompanying financial statements. Each of the Fund's federal tax returns for the prior three fiscal years remains subject to examination by the Internal Revenue Service. Foreign taxes are provided for based on the Fund's understanding of the tax rules and rates that exist in the foreign markets in which it invests.
Distributions are recorded on the ex-dividend date. Income dividends and capital gain distributions are declared separately for each class. Income and capital gain distributions are determined in accordance with income tax regulations, which may differ from generally accepted accounting principles.
Capital accounts within the financial statements are adjusted for permanent book-tax differences. These adjustments have no impact on net assets or the results of operations. Temporary book-tax differences will reverse in a subsequent period.
Book-tax differences are primarily due to short-term capital gains, foreign currency transactions, certain foreign taxes, passive foreign investment companies (PFIC), partnerships and losses deferred due to wash sales.
The tax-basis components of distributable earnings and the federal tax cost as of period end were as follows:
Unrealized appreciation | $ 224,430,603 |
Unrealized depreciation | (4,976,707) |
Net unrealized appreciation (depreciation) | 219,453,896 |
Undistributed ordinary income | 2,153,224 |
Undistributed long-term capital gain | 6,026,721 |
| |
Cost for federal income tax purposes | $ 477,667,934 |
The tax character of distributions paid was as follows:
| December 31, 2007 | December 31, 2006 |
Ordinary Income | $ 5,047,984 | $ 27,103,286 |
Long-term Capital Gains | 23,234,028 | 30,095,347 |
Total | $ 28,282,012 | $ 57,198,633 |
Trading (Redemption) Fees. Shares held less than 60 days are subject to a redemption fee equal to 1% of the proceeds of the redeemed shares. All redemption fees, including any estimated redemption fees paid by FMR, are retained by the Fund and accounted for as an addition to paid in capital.
New Accounting Pronouncement. In September 2006, Statement of Financial Accounting Standards No. 157, Fair Value Measurements (SFAS 157), was issued and is effective for fiscal years beginning after November 15, 2007. SFAS 157 defines fair value, establishes a framework for measuring fair value and expands disclosures about fair value measurements. Management is currently evaluating the impact the adoption of SFAS 157 will have on the Fund's financial statement disclosures.
Annual Report
Notes to Financial Statements - continued
4. Operating Policies.
Repurchase Agreements. FMR has received an Exemptive Order from the Securities and Exchange Commission (the SEC) which permits the Fund and other affiliated entities of FMR to transfer uninvested cash balances into joint trading accounts which are then invested in repurchase agreements. The Fund may also invest directly with institutions in repurchase agreements. Repurchase agreements are collateralized by government or non-government securities. Upon settlement date, collateral is held in segregated accounts with custodian banks and may be obtained in the event of a default of the counterparty. The Fund monitors, on a daily basis, the value of the collateral to ensure it is at least equal to the principal amount of the repurchase agreement (including accrued interest). In the event of a default by the counterparty, realization of the collateral proceeds could be delayed, during which time the value of the collateral may decline.
5. Purchases and Sales of Investments.
Purchases and sales of securities, other than short-term securities, aggregated $397,673,505 and $302,722,825, respectively.
6. Fees and Other Transactions with Affiliates.
Management Fee. FMR and its affiliates provide the Fund with investment management related services for which the Fund pays a monthly management fee. The management fee is the sum of an individual fund fee rate that is based on an annual rate of .30% of the Fund's average net assets and a group fee rate that averaged .26% during the period. The group fee rate is based upon the average net assets of all the mutual funds advised by FMR. The group fee rate decreases as assets under management increase and increases as assets under management decrease. For the period, the total annual management fee rate was .56% of the Fund's average net assets.
Distribution and Service Plan. In accordance with Rule 12b-1 of the 1940 Act, the Fund has adopted a separate 12b-1 Plan for Service Class 2 shares. Service Class 2 pays Fidelity Distributors Corporation (FDC), an affiliate of FMR, a service fee. For the period, the service fee is based on an annual rate of .25% of Service Class 2's average net assets.
For the period, Service Class 2 paid FDC $304,246, all of which was re-allowed to insurance companies for the distribution of shares and providing shareholder support services.
Transfer Agent Fees. Fidelity Investments Institutional Operations Company, Inc. (FIIOC), an affiliate of FMR, is the Fund's transfer, dividend disbursing, and shareholder servicing agent. FIIOC receives an asset-based fee with respect to each class. Each class with the exception of Investor Class pays a transfer agent fee, excluding out of pocket expenses, equal to an annual rate of .07% of average net assets. Investor Class pays a monthly asset-based transfer agent fee of .18% of average net assets. The total transfer agent fees paid by each class to FIIOC, including out of pocket expenses, were as follows:
Initial Class | $ 198,809 | |
Service Class 2 | 80,600 | |
Investor Class | 149,821 | |
| $ 429,230 | |
Effective February 1, 2008, the Board of Trustees approved a decrease to Investor Class' asset-based fee from .18% to .15% of average net assets.
Accounting and Security Lending Fees. Fidelity Service Company, Inc. (FSC), an affiliate of FMR, maintains the Fund's accounting records. The accounting fee is based on the level of average net assets for the month. Under a separate contract, FSC administers the security lending program. The security lending fee is based on the number and duration of lending transactions.
Brokerage Commissions. The Fund placed a portion of its portfolio transactions with brokerage firms which are affiliates of the investment adviser. The commissions paid to these affiliated firms were $2,644 for the period.
Interfund Lending Program. Pursuant to an Exemptive Order issued by the SEC, the Fund, along with other registered investment companies having management contracts with FMR, may participate in an interfund lending program. This program provides an alternative credit facility allowing the funds to borrow from, or lend money to, other participating affiliated funds. At period end, there were no interfund loans outstanding. The Fund's activity in this program during the period for which loans were outstanding was as follows:
Borrower or Lender | Average Daily Loan Balance | Weighted Average Interest Rate | Interest Expense |
Borrower | $ 4,464,563 | 5.37% | $ 10,659 |
Annual Report
7. Committed Line of Credit.
The Fund participates with other funds managed by FMR in a $4.2 billion credit facility (the "line of credit") to be utilized for temporary or emergency purposes to fund shareholder redemptions or for other short-term liquidity purposes. The Fund has agreed to pay commitment fees on its pro rata portion of the line of credit, which amounted to $920 and is reflected in Miscellaneous Expense on the Statement of Operations. During the period, there were no borrowings on this line of credit.
8. Security Lending.
The Fund lends portfolio securities from time to time in order to earn additional income. On the settlement date of the loan, the Fund receives collateral (in the form of U.S. Treasury obligations, letters of credit and/or cash) against the loaned securities and maintains collateral in an amount not less than 100% of the market value of the loaned securities during the period of the loan. The market value of the loaned securities is determined at the close of business of the Fund and any additional required collateral is delivered to the Fund on the next business day. If the borrower defaults on its obligation to return the securities loaned because of insolvency or other reasons, a fund could experience delays and costs in recovering the securities loaned or in gaining access to the collateral. Any cash collateral received is invested in the Fidelity Securities Lending Cash Central Fund. The value of loaned securities and cash collateral at period end are disclosed on the Fund's Statement of Assets and Liabilities. Security lending income represents the income earned on investing cash collateral, less fees and expenses associated with the loan, plus any premium payments that may be received on the loan of certain types of securities. Security lending income is presented in the Statement of Operations as a component of income from Fidelity Central Funds. Net income from lending portfolio securities during the period amounted to $38,940.
9. Expense Reductions.
Many of the brokers with whom FMR places trades on behalf of the Fund provided services to the Fund in addition to trade execution. These services included payments of certain expenses on behalf of the Fund totaling $6,344 for the period.
10. Other.
The Fund's organizational documents provide former and current trustees and officers with a limited indemnification against liabilities arising in connection with the performance of their duties to the Fund. In the normal course of business, the Fund may also enter into contracts that provide general indemnifications. The Fund's maximum exposure under these arrangements is unknown as this would be dependent on future claims that may be made against the Fund. The risk of material loss from such claims is considered remote.
At the end of the period, FMR or its affiliates were the owners of record of 72% of the total outstanding shares of the Fund and one otherwise unaffiliated shareholder was the owner of record of 28% of the total outstanding shares of the Fund.
The United States Securities and Exchange Commission ("SEC") is conducting an investigation of FMR (covering the years 2002 to 2004) arising from gifts, gratuities and business entertainment provided by certain brokers to certain individuals who were employed on FMR's domestic equity trading desk during that period. FMR is in discussions with the SEC staff regarding the possible resolution of the matter, but as of period-end no final resolution has been reached.
In December 2006, the Independent Trustees completed their own investigation of the matter with the assistance of independent counsel. The Independent Trustees and FMR agree that, despite the absence of proof that the Fidelity mutual funds experienced diminished execution quality as a result of the improper receipt of gifts and business entertainment, the conduct at issue was serious and is worthy of redress. Accordingly, the Independent Trustees have requested and FMR has agreed to pay $42 million to Fidelity mutual funds, plus interest to be determined at the time that payment is made. A method of allocating this payment among the funds has not yet been determined. The total payment to the Fund is not anticipated to have a material impact on the Fund's net assets. In addition, FMR reimbursed related legal expenses which are recorded in the accompanying Statement of Operations as an expense reduction.
Annual Report
Notes to Financial Statements - continued
11. Distributions to Shareholders.
Distributions to shareholders of each class were as follows:
Years ended December 31, | 2007 | 2006 |
From net investment income | | |
Initial Class | $ 816,831 | $ 2,085,944 |
Service Class 2 | 167,443 | 417,004 |
Investor Class | 216,249 | 341,464 |
Total | $ 1,200,523 | $ 2,844,412 |
From net realized gain | | |
Initial Class | $ 14,471,944 | $ 38,831,658 |
Service Class 2 | 7,591,179 | 8,989,384 |
Investor Class | 5,018,366 | 6,533,179 |
Total | $ 27,081,489 | $ 54,354,221 |
12. Share Transactions.
Transactions for each class of shares were as follows:
| Shares | Dollars |
Years ended December 31, | 2007 | 2006 | 2007 | 2006 |
Initial Class | | | | |
Shares sold | 1,857,099 | 3,276,992 | $ 44,454,803 | $ 71,557,806 |
Reinvestment of distributions | 597,904 | 2,133,823 | 15,288,775 | 40,917,603 |
Shares redeemed | (3,787,008) | (8,345,943) | (77,567,833) | (169,302,328) |
Net increase (decrease) | (1,332,005) | (2,935,128) | $ (17,824,255) | $ (56,826,919) |
Service Class 2 | | | | |
Shares sold | 4,400,682 | 3,062,096 | $ 102,772,658 | $ 65,681,537 |
Reinvestment of distributions | 300,833 | 493,393 | 7,758,622 | 9,406,387 |
Shares redeemed | (1,072,210) | (921,256) | (23,413,472) | (18,804,698) |
Net increase (decrease) | 3,629,305 | 2,634,233 | $ 87,117,808 | $ 56,283,226 |
Investor Class | | | | |
Shares sold | 2,764,988 | 1,990,866 | $ 64,717,111 | $ 42,583,288 |
Reinvestment of distributions | 202,756 | 360,165 | 5,234,615 | 6,874,643 |
Shares redeemed | (720,765) | (512,058) | (14,900,703) | (10,362,346) |
Net increase (decrease) | 2,246,979 | 1,838,973 | $ 55,051,023 | $ 39,095,585 |
Annual Report
Report of Independent Registered Public Accounting Firm
To the Trustees of Variable Insurance Products Fund IV and the Shareholders of VIP Energy Portfolio:
In our opinion, the accompanying statement of assets and liabilities, including the schedule of investments, and the related statements of operations and of changes in net assets and the financial highlights present fairly, in all material respects, the financial position of VIP Energy Portfolio (a fund of Variable Insurance Products Fund IV) at December 31, 2007, the results of its operations for the year then ended, the changes in its net assets for each of the two years in the period then ended and the financial highlights for each of the periods indicated, in conformity with accounting principles generally accepted in the United States of America. These financial statements and financial highlights (hereafter referred to as "financial statements") are the responsibility of the VIP Energy Portfolio's management. Our responsibility is to express an opinion on these financial statements based on our audits. We conducted our audits of these financial statements in accordance with the standards of the Public Company Accounting Oversight Board (United States). Those standards require that we plan and perform the audit to obtain reasonable assurance about whether the financial statements are free of material misstatement. An audit includes examining, on a test basis, evidence supporting the amounts and disclosures in the financial statements, assessing the accounting principles used and significant estimates made by management, and evaluating the overall financial statement presentation. We believe that our audits, which included confirmation of securities at December 31, 2007 by correspondence with the custodian and brokers, provide a reasonable basis for our opinion.
/s/ PricewaterhouseCoopers LLP
PricewaterhouseCoopers LLP
Boston, Massachusetts
February 14, 2008
Annual Report
Trustees and Officers
The Trustees, Members of the Advisory Board, and executive officers of the trust and fund, as applicable, are listed below. The Board of Trustees governs the fund and is responsible for protecting the interests of shareholders. The Trustees are experienced executives who meet periodically throughout the year to oversee the fund's activities, review contractual arrangements with companies that provide services to the fund, and review the fund's performance. Except for James C. Curvey, each of the Trustees oversees 373 funds advised by FMR or an affiliate. Mr. Curvey oversees 368 funds advised by FMR or an affiliate.
The Trustees hold office without limit in time except that (a) any Trustee may resign; (b) any Trustee may be removed by written instrument, signed by at least two-thirds of the number of Trustees prior to such removal; (c) any Trustee who requests to be retired or who has become incapacitated by illness or injury may be retired by written instrument signed by a majority of the other Trustees; and (d) any Trustee may be removed at any special meeting of shareholders by a two-thirds vote of the outstanding voting securities of the trust. Each Trustee who is not an interested person (as defined in the 1940 Act) (Independent Trustee), shall retire not later than the last day of the calendar year in which his or her 72nd birthday occurs. The Independent Trustees may waive this mandatory retirement age policy with respect to individual Trustees. The executive officers and Advisory Board Members hold office without limit in time, except that any officer and Advisory Board Member may resign or may be removed by a vote of a majority of the Trustees at any regular meeting or any special meeting of the Trustees. Except as indicated, each individual has held the office shown or other offices in the same company for the past five years.
The fund's Statement of Additional Information (SAI) includes more information about the Trustees. To request a free copy, call Fidelity at 1-877-208-0098.
Interested Trustees*:
Correspondence intended for each Trustee who is an interested person may be sent to Fidelity Investments, 82 Devonshire Street, Boston, Massachusetts 02109.
Name, Age; Principal Occupation |
Edward C. Johnson 3d (77) |
| Year of Election or Appointment: 1983 Mr. Johnson is Chairman of the Board of Trustees. Mr. Johnson serves as President (2006-present), Chief Executive Officer, Chairman, and a Director of FMR LLC; Chairman and a Director of FMR; Chairman and a Director of Fidelity Research & Analysis Company (FRAC); Chairman and a Director of Fidelity Investments Money Management, Inc.; and Chairman (2001-present) and a Director of FMR Co., Inc. In addition, Mr. Johnson serves as Chairman and Director of Fidelity International Limited (FIL). Mr. Edward C. Johnson 3d and Mr. Arthur E. Johnson are not related. |
James C. Curvey (72) |
| Year of Election or Appointment: 2007 Mr. Curvey also serves as Trustee (2007-present) or Member of the Advisory Board (2007-present) of other investment companies advised by FMR. Mr. Curvey is a Director of FMR and FMR Co., Inc. (2007-present). Mr. Curvey is also Vice Chairman (2006-present) and Director of FMR LLC. Mr. Curvey joined Fidelity in 1982 and served in numerous senior management positions, including President and Chief Operating Officer of FMR LLC (1997-2000) and President of Fidelity Strategic Investments (2000-2002). In addition, he serves as a member of the Board of Directors of Geerlings & Wade, Inc. (wine distribution). |
* Trustees have been determined to be "Interested Trustees" by virtue of, among other things, their affiliation with the trust or various entities under common control with FMR. FMR Corp. merged with and into FMR LLC on October 1, 2007. Any references to FMR LLC for prior periods are deemed to be references to the prior entity.
Independent Trustees:
Correspondence intended for each Independent Trustee (that is, the Trustees other than the Interested Trustees) may be sent to Fidelity Investments, P.O. Box 55235, Boston, Massachusetts 02205-5235.
Name, Age; Principal Occupation |
Dennis J. Dirks (59) |
| Year of Election or Appointment: 2005 Prior to his retirement in May 2003, Mr. Dirks was Chief Operating Officer and a member of the Board of The Depository Trust & Clearing Corporation (DTCC) (1999-2003). He also served as President, Chief Operating Officer, and Board member of The Depository Trust Company (DTC) (1999-2003) and President and Board member of the National Securities Clearing Corporation (NSCC) (1999-2003). In addition, Mr. Dirks served as Chief Executive Officer and Board member of the Government Securities Clearing Corporation (2001-2003) and Chief Executive Officer and Board member of the Mortgage-Backed Securities Clearing Corporation (2001-2003). Mr. Dirks also serves as a Trustee and a member of the Finance Committee of Manhattan College (2005-present) and a Trustee and a member of the Finance Committee of AHRC of Nassau County (2006-present). |
Albert R. Gamper, Jr. (65) |
| Year of Election or Appointment: 2006 Prior to his retirement in December 2004, Mr. Gamper served as Chairman of the Board of CIT Group Inc. (commercial finance). During his tenure with CIT Group Inc. Mr. Gamper served in numerous senior management positions, including Chairman (1987-1989; 1999-2001; 2002-2004), Chief Executive Officer (1987-2004), and President (1989-2002). He currently serves as a member of the Board of Directors of Public Service Enterprise Group (utilities, 2001-present), Chairman of the Board of Governors, Rutgers University (2004-present), and Chairman of the Board of Saint Barnabas Health Care System. |
George H. Heilmeier (71) |
| Year of Election or Appointment: 2004 Dr. Heilmeier is Chairman Emeritus of Telcordia Technologies (communication software and systems), where prior to his retirement, he served as company Chairman and Chief Executive Officer. He currently serves on the Boards of Directors of The Mitre Corporation (systems engineering and information technology support for the government), and HRL Laboratories (private research and development, 2004-present). He is Chairman of the General Motors Science & Technology Advisory Board and a Life Fellow of the Institute of Electrical and Electronics Engineers (IEEE). Dr. Heilmeier is a member of the Defense Science Board and the National Security Agency Advisory Board. He is also a member of the National Academy of Engineering, the American Academy of Arts and Sciences, and the Board of Overseers of the School of Engineering and Applied Science of the University of Pennsylvania. Previously, Dr. Heilmeier served as a Director of TRW Inc. (automotive, space, defense, and information technology, 1992-2002), Compaq (1994-2002), Automatic Data Processing, Inc. (ADP) (technology-based business outsourcing, 1995-2002), INET Technologies Inc. (telecommunications network surveillance, 2001-2004), and Teletech Holdings (customer management services). He is the recipient of the 2005 Kyoto Prize in Advanced Technology for his invention of the liquid crystal display, and a member of the Consumer Electronics Hall of Fame. |
James H. Keyes (67) |
| Year of Election or Appointment: 2007 Prior to his retirement in 2003, Mr. Keyes was Chairman, President, and Chief Executive Officer of Johnson Controls, Inc. (automotive supplier, 1993-2003). He currently serves as a member of the boards of LSI Logic Corporation (semiconductor technologies), Navistar International Corporation (manufacture and sale of trucks, buses, and diesel engines, 2002-present), and Pitney Bowes, Inc. (integrated mail, messaging, and document management solutions). |
Marie L. Knowles (61) |
| Year of Election or Appointment: 2001 Prior to Ms. Knowles' retirement in June 2000, she served as Executive Vice President and Chief Financial Officer of Atlantic Richfield Company (ARCO) (diversified energy, 1996-2000). From 1993 to 1996, she was a Senior Vice President of ARCO and President of ARCO Transportation Company. She served as a Director of ARCO from 1996 to 1998. She currently serves as a Director of Phelps Dodge Corporation (copper mining and manufacturing) and McKesson Corporation (healthcare service, 2002-present). Ms. Knowles is a Trustee of the Brookings Institution and the Catalina Island Conservancy and also serves as a member of the Advisory Board for the School of Engineering of the University of Southern California. |
Ned C. Lautenbach (63) |
| Year of Election or Appointment: 2000 Mr. Lautenbach is Chairman of the Independent Trustees (2006-present). Mr. Lautenbach has been a partner of Clayton, Dubilier & Rice, Inc. (private equity investment firm) since September 1998. Previously, Mr. Lautenbach was with the International Business Machines Corporation (IBM) from 1968 until his retirement in 1998. Mr. Lautenbach serves as a Director of Sony Corporation (2006-present) and Eaton Corporation (diversified industrial) as well as the Philharmonic Center for the Arts in Naples, Florida. He also is a member of the Board of Trustees of Fairfield University (2005-present), as well as a member of the Council on Foreign Relations. |
Cornelia M. Small (63) |
| Year of Election or Appointment: 2005 Ms. Small is a member (2000-present) and Chairperson (2002-present) of the Investment Committee, and a member (2002-
present) of the Board of Trustees of Smith College. Previously, she served as Chief Investment Officer (1999-2000), Director of Global Equity Investments (1996-1999), and a member of the Board of Directors of Scudder, Stevens & Clark (1990-1997) and Scudder Kemper Investments (1997-1999). In addition, Ms. Small served as Co-Chair (2000-2003) of the Annual Fund for the Fletcher School of Law and Diplomacy. |
William S. Stavropoulos (68) |
| Year of Election or Appointment: 2001 Mr. Stavropoulos is Chairman Emeritus of the Board of Directors of The Dow Chemical Company. Since joining The Dow Chemical Company in 1967, Mr. Stavropoulos served in numerous senior management positions, including President (1993-2000; 2002-2003), CEO (1995-2000; 2002-2004), and Chairman of the Executive Committee (2000-2004). Currently, he is a Director of NCR Corporation (data warehousing and technology solutions), Chemical Financial Corporation, Maersk Inc. (industrial conglomerate, 2002-present), Tyco International, Inc. (multinational manufacturing and services, 2007-present), and a member of the Advisory Board for Metalmark Capital (private equity investment firm, 2005-present). He is a special advisor to Clayton, Dubilier & Rice, Inc., a private equity investment firm. He also serves as a member of the Board of Trustees of the American Enterprise Institute for Public Policy Research. In addition, Mr. Stavropoulos is a member of The Business Council, J.P. Morgan International Council and the University of Notre Dame Advisory Council for the College of Science. |
Kenneth L. Wolfe (68) |
| Year of Election or Appointment: 2005 Mr. Wolfe is Chairman and a Director of Hershey Foods Corporation (2007-present), where prior to his retirement in 2001, he was Chairman and Chief Executive Officer. Mr. Wolfe currently serves as a member of the board of Revlon Inc. (2004-present). Previously, Mr. Wolfe served as a member of the boards of Adelphia Communications Corporation (2003-2006) and Bausch & Lomb, Inc. (1993-2007). |
Advisory Board Members and Executive Officers**:
Correspondence intended for Mr. Mauriello, Mr. Thomas, Mr. Wiley, Mr. Lacy, and Mr. Arthur Johnson may be sent to Fidelity Investments, P.O. Box 55235, Boston, Massachusetts 02205-5235. Correspondence intended for each executive officer and Mr. Lynch may be sent to Fidelity Investments, 82 Devonshire Street, Boston, Massachusetts 02109.
Name, Age; Principal Occupation |
Arthur E. Johnson (60) |
| Year of Election or Appointment: 2008 Member of the Advisory Board of Variable Insurance Products Fund IV. Mr. Johnson serves as Senior Vice President of Corporate Strategic Development of Lockheed Martin Corporation (defense contractor). In addition, Mr. Johnson serves as a member of the Board of Directors of AGL Resources, Inc. (holding company, 2002-present), and IKON Office Solutions, Inc. (document management systems and services). Mr. Arthur E. Johnson and Mr. Edward C. Johnson 3d are not related. |
Alan J. Lacy (54) |
| Year of Election or Appointment: 2008 Member of the Advisory Board of Variable Insurance Products Fund IV. Mr. Lacy serves as Senior Adviser (2007-present) of Oak Hill Capital Partners, L.P. (a private equity firm). Mr. Lacy also served as Vice Chairman and Chief Executive Officer of Sears Holdings Corporation and Sears, Roebuck and Co. (retail, 2005-2006; 2000-2005). In addition, Mr. Lacy serves as a member of the Board of Directors of The Western Union Company (global money transfer, 2006-present) and Bristol-Myers Squibb (global pharmaceuticals, 2007-present). Mr. Lacy is a Trustee of the National Parks Conservation Association and The Field Museum of Natural History. |
Peter S. Lynch (63) |
| Year of Election or Appointment: 2003 Member of the Advisory Board of Variable Insurance Products Fund IV. Mr. Lynch is Vice Chairman and a Director of FMR, and Vice Chairman (2001-present) and a Director of FMR Co., Inc. Previously, Mr. Lynch served as a Trustee of the Fidelity funds (1990-2003). In addition, he serves as a Trustee of Boston College and as the Chairman of the Inner-City Scholarship Fund. |
Joseph Mauriello (63) |
| Year of Election or Appointment: 2007 Member of the Advisory Board of Variable Insurance Products Fund IV. Prior to his retirement in January 2006, Mr. Mauriello served in numerous senior management positions including Deputy Chairman and Chief Operating Officer (2004-2005), and Vice Chairman of Financial Services (2002-2004) of KPMG LLP US (professional services firm, 1965-2005). Mr. Mauriello currently serves as a member of the Board of Directors of XL Capital Ltd. (global insurance and re-insurance company, 2006-present) and of Arcadia Resources Inc. (health care services and products, 2007-present). He also served as a Director of the Hamilton Funds of the Bank of New York (2006-2007). |
David M. Thomas (58) |
| Year of Election or Appointment: 2007 Member of the Advisory Board of Variable Insurance Products Fund IV. Previously, Mr. Thomas served as Executive Chairman (2005-2006) and Chairman and Chief Executive Officer (2000-2005) of IMS Health, Inc. (pharmaceutical and healthcare information solutions). In addition, Mr. Thomas serves as a member of the Board of Directors of Fortune Brands, Inc. (consumer products holding company), and Interpublic Group of Companies, Inc. (marketing communication, 2004-present). |
Michael E. Wiley (57) |
| Year of Election or Appointment: 2007 Member of the Advisory Board of Variable Insurance Products Fund IV. Mr. Wiley also serves as a member of the Board of Trustees of the University of Tulsa (2000-2006; 2007-present). He serves as a Director of Tesoro Corporation (independent oil refiner and marketer, 2005-present), and a Director of Bill Barrett Corporation (exploration and production company, 2005-present). In addition, he also serves as a Director of Post Oak Bank (privately-held bank, 2004-present). Previously, Mr. Wiley served as a Sr. Energy Advisor of Katzenbach Partners, LLC (consulting firm, 2006-2007), as an Advisory Director of Riverstone Holdings (private investment firm), Chairman, President, and CEO of Baker Hughes, Inc. (oilfield services company, 2000-2004), and as Director of Spinnaker Exploration Company (exploration and production company, 2001-2005). |
Kimberley H. Monasterio (44) |
| Year of Election or Appointment: 2007 President and Treasurer of VIP Energy. Ms. Monasterio also serves as President and Treasurer of other Fidelity funds (2007-present) and is an employee of FMR (2004-present). Previously, Ms. Monasterio served as Deputy Treasurer of the Fidelity funds (2004-2006). Before joining Fidelity Investments, Ms. Monasterio served as Treasurer (2000-2004) and Chief Financial Officer (2002-2004) of the Franklin Templeton Funds and Senior Vice President of Franklin Templeton Services, LLC (2000-2004). |
Brian B. Hogan (43) |
| Year of Election or Appointment: 2007 Vice President of VIP Energy. Mr. Hogan also serves as Vice President of Sector Funds (2007-present). Mr. Hogan is Senior Vice President of Equity Research (2006-present). Mr. Hogan also serves as Vice President of FMR and FMR Co., Inc. Previously, Mr. Hogan served as a portfolio manager. |
Eric D. Roiter (59) |
| Year of Election or Appointment: 2001 Secretary of VIP Energy. He also serves as Secretary of other Fidelity funds; Vice President, General Counsel, and Secretary of FMR Co., Inc. (2001-present) and FMR; Assistant Secretary of Fidelity Management & Research (U.K.) Inc. (2001-present), Fidelity Research & Analysis Company (2001-present), and Fidelity Investments Money Management, Inc. (2001-present). Mr. Roiter is an Adjunct Member, Faculty of Law, at Boston College Law School (2003-present). Previously, Mr. Roiter served as Vice President and Secretary of Fidelity Distributors Corporation (FDC) (1998-2005). |
John B. McGinty, Jr. (45) |
| Year of Election or Appointment: 2008 Assistant Secretary of VIP Energy. Mr. McGinty also serves as Assistant Secretary of other Fidelity funds (2008-present), and is an employee of FMR LLC (2004-present). Mr. McGinty also serves as Senior Vice President, Secretary, and Chief Legal Officer of FDC (2007-present). Before joining Fidelity Investments, Mr. McGinty practiced law at Ropes & Gray, LLP. |
R. Stephen Ganis (41) |
| Year of Election or Appointment: 2006 Anti-Money Laundering (AML) officer of VIP Energy. Mr. Ganis also serves as AML officer of other Fidelity funds (2006-present) and FMR LLC (2003-present). Before joining Fidelity Investments, Mr. Ganis practiced law at Goodwin Procter, LLP (2000-2002). |
Joseph B. Hollis (59) |
| Year of Election or Appointment: 2006 Chief Financial Officer of VIP Energy. Mr. Hollis also serves as Chief Financial Officer of other Fidelity funds. Mr. Hollis is President of Fidelity Pricing and Cash Management Services (FPCMS) (2005-present). Mr. Hollis also serves as President and Director of Fidelity Service Company, Inc. (2006-present). Previously, Mr. Hollis served as Senior Vice President of Cash Management Services (1999-2002) and Investment Management Operations (2002-2005). |
Kenneth A. Rathgeber (60) |
| Year of Election or Appointment: 2004 Chief Compliance Officer of VIP Energy. Mr. Rathgeber also serves as Chief Compliance Officer of other Fidelity funds (2004-present) and Executive Vice President of Risk Oversight for Fidelity Investments (2002-present). He is Chief Compliance Officer of FMR (2005-present), FMR Co., Inc. (2005-present), Fidelity Management & Research (U.K.) Inc. (2005-present), Fidelity Research & Analysis Company (2005-present), Fidelity Investments Money Management, Inc. (2005-present), and Strategic Advisers, Inc. (2005-present). Previously, Mr. Rathgeber served as Executive Vice President and Chief Operating Officer for Fidelity Investments Institutional Services Company, Inc. (1998-2002). |
Bryan A. Mehrmann (46) |
| Year of Election or Appointment: 2005 Deputy Treasurer of VIP Energy. Mr. Mehrmann also serves as Deputy Treasurer of other Fidelity funds (2005-present) and is an employee of FMR. Previously, Mr. Mehrmann served as Vice President of Fidelity Investments Institutional Services Group (FIIS)/Fidelity Investments Institutional Operations Corporation, Inc. (FIIOC) Client Services (1998-2004). |
Kenneth B. Robins (38) |
| Year of Election or Appointment: 2005 Deputy Treasurer of VIP Energy. Mr. Robins also serves as Deputy Treasurer of other Fidelity funds (2005-present) and is an employee of FMR (2004-present). Before joining Fidelity Investments, Mr. Robins worked at KPMG LLP, where he was a partner in KPMG's department of professional practice (2002-2004) and a Senior Manager (1999-2000). In addition, Mr. Robins served as Assistant Chief Accountant, United States Securities and Exchange Commission (2000-2002). |
Robert G. Byrnes (41) |
| Year of Election or Appointment: 2005 Assistant Treasurer of VIP Energy. Mr. Byrnes also serves as Assistant Treasurer of other Fidelity funds (2005-present) and is an employee of FMR (2005-present). Previously, Mr. Byrnes served as Vice President of FPCMS (2003-2005). Before joining Fidelity Investments, Mr. Byrnes worked at Deutsche Asset Management where he served as Vice President of the Investment Operations Group (2000-2003). |
Peter L. Lydecker (53) |
| Year of Election or Appointment: 2004 Assistant Treasurer of VIP Energy. Mr. Lydecker also serves as Assistant Treasurer of other Fidelity funds (2004) and is an employee of FMR. |
Paul M. Murphy (60) |
| Year of Election or Appointment: 2007 Assistant Treasurer of VIP Energy. Mr. Murphy also serves as Assistant Treasurer of other Fidelity funds (2007-present) and is an employee of FMR (2007-present). Previously, Mr. Murphy served as Chief Financial Officer of the Fidelity Funds (2005-2006), Vice President and Associate General Counsel of FMR (2007), and Senior Vice President of Fidelity Pricing and Cash Management Services Group (FPCMS) (1994-2007). |
Gary W. Ryan (49) |
| Year of Election or Appointment: 2005 Assistant Treasurer of VIP Energy. Mr. Ryan also serves as Assistant Treasurer of other Fidelity funds (2005-present) and is an employee of FMR (2005-present). Previously, Mr. Ryan served as Vice President of Fund Reporting in FPCMS (1999-2005). |
** FMR Corp. merged with and into FMR LLC on October 1, 2007. Any references to FMR LLC for prior periods are deemed to be references to the prior entity.
Annual Report
Distributions
The Board of Trustees of VIP Energy Portfolio voted to pay to shareholders of record at the opening of business on record date, the following distributions per share derived from capital gains realized from sales of portfolio securities:
| Pay Date | Record Date | Capital Gains |
Initial Class | 02/08/08 | 02/08/08 | $0.33 |
Investor Class | 02/08/08 | 02/08/08 | $0.33 |
The fund hereby designates as a capital gain dividend with respect to the taxable year ended December 31, 2007, $27,668,400, or, if subsequently determined to be different, the net capital gain of such year.
A percentage of the dividends distributed during the fiscal year for the following classes qualifies for the dividends-received deduction for corporate shareholders:
| February | December |
Initial Class | 20% | 72% |
Investor Class | 20% | 78% |
The fund will notify shareholders in January 2008 of amounts for use in preparing 2007 income tax returns.
Annual Report
Board Approval of Investment Advisory Contracts and Management Fees
VIP Energy Portfolio
Each year, typically in July, the Board of Trustees, including the Independent Trustees (together, the Board), votes on the renewal of the management contract and sub-advisory agreements (together, the Advisory Contracts) for the fund. The Board, assisted by the advice of fund counsel and Independent Trustees' counsel, requests and considers a broad range of information throughout the year.
The Board meets regularly each month except August and takes into account throughout the year matters bearing on Advisory Contracts. The Board, acting directly and through its separate committees, considers at each of its meetings factors that are relevant to the annual renewal of the fund's Advisory Contracts, including the services and support provided to the fund and its shareholders. At the time of the renewal, the Board had 12 standing committees, each composed of Independent Trustees with varying backgrounds, to which the Board has assigned specific subject matter responsibilities in order to enhance effective decision-making by the Board. Each committee has adopted a written charter outlining the structure and purposes of the committee. One such committee, the Equity Contract Committee, meets periodically as needed throughout the year to consider matters specifically related to the annual renewal of Advisory Contracts. The committee requests and receives information on, and makes recommendations to the Independent Trustees concerning, the approval and annual review of the Advisory Contracts.
At its July 2007 meeting, the Board of Trustees, including the Independent Trustees, unanimously determined to renew the Advisory Contracts for the fund. In reaching its determination, the Board considered all factors it believed relevant, including (i) the nature, extent, and quality of the services to be provided to the fund and its shareholders (including the investment performance of the fund); (ii) the competitiveness of the management fee and total expenses of the fund; (iii) the total costs of the services to be provided by and the profits to be realized by the investment adviser and its affiliates from the relationship with the fund; (iv) the extent to which economies of scale would be realized as the fund grows; and (v) whether fee levels reflect these economies of scale, if any, for the benefit of fund shareholders. The Board also approved amendments to the fund's agreements with foreign sub-advisers to clarify that each sub-adviser provides services as an independent contractor.
In determining whether to renew the Advisory Contracts for the fund, the Board ultimately reached a determination, with the assistance of fund counsel and Independent Trustees' counsel, that the renewal of the Advisory Contracts and the compensation to be received by Fidelity under the management contract is consistent with Fidelity's fiduciary duty under applicable law. In addition to evaluating the specific factors noted above, the Board, in reaching its determination, is aware that shareholders in the fund have a broad range of investment choices available to them, including a wide choice among mutual funds offered by competitors to Fidelity, and that the fund's shareholders, with the opportunity to review and weigh the disclosure provided by the fund in its prospectus and other public disclosures, have chosen to invest in this fund, managed by Fidelity.
Nature, Extent, and Quality of Services Provided. The Board considered staffing within the investment adviser, FMR, and the sub-advisers (together, the Investment Advisers), including the background of the fund's portfolio manager and the fund's investment objective and discipline. The Independent Trustees also had discussions with senior management of Fidelity's investment operations and investment groups. The Board considered the structure of the portfolio manager compensation program and whether this structure provides appropriate incentives.
Resources Dedicated to Investment Management and Support Services. The Board reviewed the size, education, and experience of the Investment Advisers' investment staff, their use of technology, and the Investment Advisers' approach to recruiting, training, and retaining portfolio managers and other research, advisory, and management personnel. The Board considered Fidelity's extensive global research capabilities that enable the Investment Advisers to aggregate data from various sources in an effort to produce positive investment results. The Board noted that Fidelity's analysts have access to a variety of technological tools that enable them to perform both fundamental and quantitative analysis and to specialize in various disciplines. The Board also considered that Fidelity's portfolio managers and analysts have access to daily portfolio attribution that allows for monitoring of a fund's portfolio, as well as an electronic communication system that provides immediate real-time access to research concerning issuers and credit enhancers.
Shareholder and Administrative Services. The Board considered (i) the nature, extent, quality, and cost of advisory, administrative, distribution, and shareholder services performed by the Investment Advisers and their affiliates under the Advisory Contracts and under separate agreements covering transfer agency, pricing and bookkeeping, and securities lending services for the fund; (ii) the nature and extent of the Investment Advisers' supervision of third party service providers, principally custodians and subcustodians; and (iii) the resources devoted to, and the record of compliance with, the fund's compliance policies and procedures. The Board reviewed the allocation of fund brokerage, including allocations to brokers affiliated with the Investment Advisers, the use of brokerage commissions to pay fund expenses, and the use of "soft" commission dollars to pay for research services. The Board also considered that Fidelity voluntarily pays for market data out of its own resources. The Board also considered the agreement reached between the Independent Trustees and Fidelity in December 2006 following an independent review of matters relating to receipt of travel, entertainment, gifts and gratuities in violation of Fidelity policies.
The Board noted that the growth of fund assets across the complex allows Fidelity to reinvest in the development of services designed to enhance the value or convenience of the Fidelity funds as investment vehicles. These services include 24-hour access to account information and market information through phone representatives and over the Internet, and investor education materials and asset allocation tools.
Annual Report
Investment in a Large Fund Family. The Board considered the benefits to shareholders of investing in a Fidelity fund, including the benefits of investing in a fund that is part of a large family of funds offering a variety of investment disciplines and providing for a large variety of mutual fund investor services. The Board noted that, since the last Advisory Contract renewals in July 2006, Fidelity has taken a number of actions that benefited particular funds, including (i) dedicating additional resources to investment research and to restructure the investment research teams; (ii) contractually agreeing to reduce the management fee on Fidelity Advisor Floating Rate High Income Fund; (iii) contractually agreeing to reduce the management fees on Fidelity's California, Massachusetts, New Jersey, and New York AMT Tax-Free Money Market Funds, launching new Institutional Classes and Service Classes of these funds, and contractually agreeing to impose expense limitations on these funds; (iv) eliminating the exchange fee on the Fidelity Select Portfolios and reducing the pricing and bookkeeping fee rates for these funds; (v) reducing the maximum transfer agency fee rates on high income funds and certain equity funds; (vi) proposing amended management contracts that, if approved by shareholders, will add a performance adjustment component to the management fees paid by 18 Fidelity Advisor equity funds; (vii) contractually agreeing to reduce fees for Ultra-Short Central Fund and the money market Central Funds; (viii) waiving the Fidelity Advisor funds' contingent deferred sales charge on certain redemptions made through systematic withdrawal programs; and (ix) amending the management contracts for equity and fixed-income funds whose management contracts incorporate a "group fee" structure by adding four new fee "breakpoints" to the group fee rate schedules.
Investment Performance and Compliance. The Board considered whether the fund has operated within its investment objective, as well as its record of compliance with its investment restrictions. It also reviewed the fund's absolute investment performance for each class, as well as the fund's relative investment performance for each class measured against a third-party-sponsored index that reflects the market sector in which the fund invests over multiple periods. The Board noted that FMR does not believe that a meaningful peer group exists against which to compare the fund's performance. The Board also noted that in 2006 FMR implemented changes to the sector fund product line, which included a change to the fund's index. The following charts considered by the Board show, over the one-, three-, and five-year periods ended December 31, 2006, as available, the cumulative total returns of Initial Class and Service Class 2 of the fund and the cumulative total returns of a third-party-sponsored index ("benchmark"). The returns of Initial Class and Service Class 2 show the performance of the highest and lowest performing classes, respectively.
VIP Energy Portfolio

The Board stated that the relative investment performance of Initial Class of the fund compared favorably to its benchmark for the three- and five-year periods, although the fund's one-year cumulative total return was lower than its benchmark. The Board considered that the variations in performance among the fund's classes reflect the variations in class expenses, which result in lower performance for higher expense classes.
The Board considered that FMR has taken steps to refocus and strengthen equity research, equity portfolio management, and compliance.
Based on its review, and giving particular weight to the nature and quality of the resources dedicated by the Investment Advisers to maintain and improve relative performance, the Board concluded that the nature, extent, and quality of the services provided to the fund will benefit the fund's shareholders, particularly in light of the Board's view that the fund's shareholders benefit from investing in a fund that is part of a large family of funds offering a variety of investment disciplines and services.
Competitiveness of Management Fee and Total Fund Expenses. The Board considered the fund's management fee and total expenses compared to "mapped groups" of competitive funds and classes. Fidelity creates "mapped groups" by combining similar Lipper investment objective categories that have comparable management fee characteristics. Combining Lipper investment objective categories aids the Board's management fee and total expense comparisons by broadening the competitive group used for comparison and by reducing the number of universes to which various Fidelity funds are compared. The Board also considered supplemental information about how the fund's management fee and total expenses ranked relative to groups based on Lipper classifications, which take into account a fund's market capitalization and style.
Annual Report
Board Approval of Investment Advisory Contracts and Management Fees - continued
The Board considered two proprietary management fee comparisons for the 12-month periods shown in the chart below. The group of Lipper funds used by the Board for management fee comparisons is referred to below as the "Total Mapped Group." The Total Mapped Group comparison focuses on a fund's standing relative to the total universe of comparable funds available to investors, in terms of gross management fees before expense reimbursements or caps. "TMG %" represents the percentage of funds in the Total Mapped Group that had management fees that were lower than the fund's. For example, a TMG % of 9% means that 91% of the funds in the Total Mapped Group had higher management fees than the fund. The "Asset-Size Peer Group" (ASPG) comparison focuses on a fund's standing relative to non-Fidelity funds similar in size to the fund within the Total Mapped Group. The ASPG represents at least 15% of the funds in the Total Mapped Group with comparable asset size and management fee characteristics, subject to a minimum of 50 funds (or all funds in the Total Mapped Group if fewer than 50). Additional information, such as the ASPG quartile in which the fund's management fee ranked, is also included in the chart and considered by the Board.
VIP Energy Portfolio

The Board noted that the fund's management fee ranked below the median of its Total Mapped Group and below the median of its ASPG for 2006.
Based on its review, the Board concluded that the fund's management fee was fair and reasonable in light of the services that the fund receives and the other factors considered.
In its review of each class's total expenses, the Board considered the fund's management fee as well as other fund or class expenses, as applicable, such as transfer agent fees, pricing and bookkeeping fees, fund-paid 12b-1 fees, and custodial, legal, and audit fees. The Board also noted the effects of any waivers and reimbursements on fees and expenses. As part of its review, the Board also considered current and historical total expenses of each class of the fund compared to competitive fund median expenses. Each class of the fund is compared to those funds and classes in the Total Mapped Group (used by the Board for management fee comparisons) that have a similar sales load structure.
The Board noted that the total expenses of each class ranked below its competitive median for 2006.
In its review of total expenses, the Board also considered Fidelity fee structures and other information on clients that FMR and its affiliates service in other competitive markets, such as other mutual funds advised or subadvised by FMR or its affiliates, pension plan clients, and other institutional clients.
Based on its review, the Board concluded that the total expenses of each class of the fund were reasonable in light of the services that the fund and its shareholders receive and the other factors considered.
Costs of the Services and Profitability. The Board considered the revenues earned and the expenses incurred by Fidelity in conducting the business of developing, marketing, distributing, managing, administering and servicing the fund and its shareholders. The Board also considered the level of Fidelity's profits in respect of all the Fidelity funds.
Annual Report
On an annual basis, FMR presents to the Board Fidelity's profitability for the fund. Fidelity calculates the profitability for each fund, as well as aggregate profitability for groups of Fidelity funds and all Fidelity funds, using a series of detailed revenue and cost allocation methodologies which originate with the audited books and records of Fidelity. The Audit Committee of the Board reviews any significant changes from the prior year's methodologies.
PricewaterhouseCoopers LLP (PwC), independent registered public accounting firm and auditor to Fidelity and certain Fidelity funds, has been engaged annually by the Board as part of the Board's assessment of the results of Fidelity's profitability analysis. PwC's engagement includes the review and assessment of Fidelity's methodologies used in determining the revenues and expenses attributable to Fidelity's mutual fund business, and completion of agreed-upon procedures surrounding the mathematical accuracy of fund profitability and its conformity to allocation methodologies. After considering PwC's reports issued under the engagement and information provided by Fidelity, the Board believes that while other allocation methods may also be reasonable, Fidelity's profitability methodologies are reasonable in all material respects.
The Board has also reviewed Fidelity's non-fund businesses and any fall-out benefits related to the mutual fund business as well as cases where Fidelity's affiliates may benefit from or be related to the fund's business.
The Board considered the costs of the services provided by and the profits realized by Fidelity in connection with the operation of the fund and determined that the amount of profit is a fair entrepreneurial profit for the management of the fund.
Economies of Scale. The Board considered whether there have been economies of scale in respect of the management of the Fidelity funds, whether the Fidelity funds (including the fund) have appropriately benefited from any such economies of scale, and whether there is potential for realization of any further economies of scale. The Board considered the extent to which the fund will benefit from economies of scale through increased services to the fund, through waivers or reimbursements, or through fee or expense reductions.
The Board recognized that the fund's management contract incorporates a "group fee" structure, which provides for lower group fee rates as total fund assets under FMR's management increase, and for higher group fee rates as total fund assets under FMR's management decrease. FMR determines the group fee rates based on a tiered asset "breakpoint" schedule. In connection with the renewal of the fund's management contract, the Board approved amendments to the fund's management contract that added four new fee breakpoints to the group fee rate schedule for assets under FMR's management above $1,386 billion. The Board considered that the group fee rate declines under both the present and amended schedules, but that under the amended schedule, the group fee rate declines faster as assets under FMR's management exceed $1,386 billion. The Board considered that the group fee is designed to deliver the benefits of economies of scale to fund shareholders when total fund assets increase, even if assets of any particular fund are unchanged or have declined, because some portion of Fidelity's costs are attributable to services provided to all Fidelity funds, and all funds benefit if those costs can be allocated among more assets. The Board concluded that, given the group fee structure, fund shareholders will achieve a certain level of economies of scale as assets under FMR's management increase at the fund complex level, regardless of whether Fidelity achieves any such economies of scale.
The Board further concluded that any potential economies of scale are being shared between fund shareholders and Fidelity in an appropriate manner.
Additional Information Requested by the Board. In order to develop fully the factual basis for consideration of the Fidelity funds' Advisory Contracts, the Board requested and received additional information on several topics, including (i) fund performance trends and actions to be taken by FMR to improve certain funds' overall performance; (ii) Fidelity's portfolio manager compensation structure, including its effects on fund profitability and the extent to which portfolio manager compensation is linked to fund performance; (iii) Fidelity's fee structures; (iv) the funds' sub-advisory arrangements; and (v) accounts managed by Fidelity other than the Fidelity funds.
Based on its evaluation of all of the conclusions noted above, and after considering all material factors, the Board ultimately concluded that the advisory fee structures are fair and reasonable, and that the fund's Advisory Contracts should be renewed.
Annual Report
Investment Adviser
Fidelity Management & Research Company
Boston, MA
Investment Sub-Advisers
FMR Co., Inc.
Fidelity Management & Research (U.K.) Inc.
Fidelity Research & Analysis Company
Fidelity Investments Japan Limited
Fidelity International Investment Advisors
Fidelity International Investment Advisors
(U.K.) Limited
General Distributor
Fidelity Distributors Corporation
Boston, MA
Transfer and Service Agents
Fidelity Investments Institutional Operations Company, Inc.
Boston, MA
Fidelity Service Company, Inc.
Boston, MA
Custodian
State Street Bank & Trust Co.
Quincy, MA
VNRIC-ANN-0208
1.817379.102
Fidelity® Variable Insurance Products:
Energy Portfolio: Service Class 2
Annual Report
December 31, 2007
(2_fidelity_logos) (Registered_Trademark)
Contents
Performance | <Click Here> | How the fund has done over time. |
Management's Discussion | <Click Here> | The manager's review of fund performance, strategy and outlook. |
Shareholder Expense Example | <Click Here> | An example of shareholder expenses. |
Investment Changes | <Click Here> | A summary of major shifts in the fund's investments over the past six months. |
Investments | <Click Here> | A complete list of the fund's investments with their
market values. |
Financial Statements | <Click Here> | Statements of assets and liabilities, operations, and
changes in net assets, as well as financial highlights. |
Notes | <Click Here> | Notes to the financial statements. |
Report of Independent Registered Public Accounting Firm | <Click Here> | |
Trustees and Officers | <Click Here> | |
Distributions | <Click Here> | |
Board Approval of Investment Advisory Contracts and Management Fees | <Click Here> | |
| | |
To view a fund's proxy voting guidelines and proxy voting record for the 12-month period ended June 30, visit http://www.fidelity.com (search for "proxy voting guidelines") or visit the Securities and Exchange Commission's (SEC) web site at http://www.sec.gov. You may also call 1-877-208-0098 to request a free copy of the proxy voting guidelines.
Fidelity Variable Insurance Products are separate account options which are purchased through a variable insurance contract.
Standard & Poor's, S&P and S&P 500 are registered service marks of The McGraw-Hill Companies, Inc. and have been licensed for use by Fidelity Distributors Corporation.
Other third party marks appearing herein are the property of their respective owners.
All other marks appearing herein are registered or unregistered trademarks or service marks of FMR LLC or an affiliated company.
This report and the financial statements contained herein are submitted for the general information of the shareholders of the fund. This report is not authorized for distribution to prospective investors in the fund unless preceded or accompanied by an effective prospectus.
A fund files its complete schedule of portfolio holdings with the SEC for the first and third quarters of each fiscal year on Form N-Q. Forms N-Q are available on the SEC's web site at http://www.sec.gov. A fund's Forms N-Q may be reviewed and copied at the SEC's Public Reference Room in Washington, DC. Information regarding the operation of the SEC's Public Reference Room may be obtained by calling 1-800-SEC-0330. For a complete list of the fund's portfolio holdings, view the most recent holdings listing, semiannual report, or annual report on Fidelity's web site at http://www.fidelity.com or http://www.advisor.fidelity.com, as applicable.
NOT FDIC INSURED · MAY LOSE VALUE · NO BANK GUARANTEE
Neither the fund nor Fidelity Distributors Corporation is a bank.
Annual Report
Performance: The Bottom Line
Average annual total return reflects the change in the value of an investment, assuming reinvestment of the class' dividend income and capital gains (the profits earned upon the sale of securities that have grown in value, if any) and assuming a constant rate of performance each year. During periods of reimbursement by Fidelity, a fund's total return will be greater than it would be had the reimbursement not occurred. Performance numbers are net of all underlying fund operating expenses, but do not include any insurance charges imposed by your insurance company's separate account. If performance information included the effect of these additional charges, the total returns would have been lower. How a fund did yesterday is no guarantee of how it will do tomorrow.
Average Annual Total Returns
Periods ended December 31, 2007 | Past 1
year | Past 5
years | Life of
fundA |
VIP Energy - Service Class 2 B, C | 45.64% | 32.05% | 21.09% |
A From July 19, 2001.
B The initial offering of Service Class 2 shares took place on April 6, 2005. Performance for Service Class 2 shares reflects an asset-based service fee (12b-1 fee). Returns prior to April 6, 2005 are those of Initial Class and do not include the effects of Service Class 2's 12b-1 fee. Had Service Class 2's 12b-1 fee been reflected, returns prior to April 6, 2005 would have been lower.
C Prior to October 1, 2006, VIP Energy operated under certain different investment policies. The historical performance for the fund may not represent its current investment policies.
$10,000 Over Life of Fund
Let's say hypothetically that $10,000 was invested in VIP Energy Portfolio - Service Class 2 on July 19, 2001, when the fund started. The chart shows how the value of your investment would have changed, and also shows how the Standard & Poor's 500SM Index (S&P 500®) performed over the same period. The initial offering of Service Class 2 took place on April 6, 2005. See above for additional information regarding the performance of Service Class 2.
Annual Report
Management's Discussion of Fund Performance
Comments from John Dowd, Portfolio Manager of VIP Energy Portfolio
U.S. equity markets, as measured by the bellwether Dow Jones Industrial AverageSM and the Standard & Poor's 500SM Index, registered their fifth consecutive year of positive returns in 2007, as the Dow rose 8.88% and the S&P 500® index advanced 5.49%. The tech-heavy NASDAQ Composite® Index did even better, increasing 10.55%. However, credit-and recession-related concerns carved deeply into stock prices late in 2007, pushing some major market measures into negative territory for the year overall, particularly smaller-cap and value-oriented benchmarks. Based largely on a weak U.S. dollar that boosted returns for U.S. investors, the Morgan Stanley Capital InternationalSM Europe, Australasia, and Far East (MSCI® EAFE®) Index - a gauge of developed stock markets outside the United States and Canada - beat most domestic equity measures, gaining 11.33%. Several European countries had outstanding performance, including Finland and Germany, while Australia also did very well. However, fallout from the credit crunch and concerns about export growth tempered U.K. stocks, while fears that Japanese financial companies would become embroiled in the U.S. subprime mortgage crisis contributed to a loss of more than 4% for the Japanese portion of the index. The emerging-markets stock asset class soared 39.78% according to the MSCI Emerging Markets index. The U.S. investment-grade bond market climbed 6.97% as measured by the Lehman Brothers® U.S. Aggregate Index, beating the 2.53% gain for the Merrill Lynch® U.S. High Yield Master II Constrained Index. The emerging-markets bond category shook off a sluggish first half of 2007 to finish the year with a respectable gain of 6.28% as measured by the J.P. Morgan Emerging Markets Bond Index (EMBI) Global, while the Citigroup® Non-U.S. Group of 7 Index - representing the debt performance of major global economies, excluding the United States - rose 13.05%.
For the 12 months ending December 31, 2007, the fund solidly outperformed the 34.42% gain of the Morgan Stanley Capital International (MSCI®) US Investable Market Energy Index and the S&P 500. (For specific portfolio performance results, please refer to the performance section of this report.) Despite an overweighting in oil and gas refining and marketing stocks, which underperformed other groups in the sector, and a couple of missed opportunities in oil-related stocks, superior stock selection and beneficial industry overweightings propelled the fund's return past that of the MSCI index. In terms of subsectors, the fund's overweightings included oil and gas equipment and services, coal and consumable fuels, oil and gas exploration and production, and oil and gas drilling. Overweighted positions in oil rig manufacturer National Oilwell Varco, natural gas producer Range Resources, and U.S. coal producer CONSOL Energy made these stocks top contributors. An out-of-benchmark position in Danish wind turbine maker Vestas Wind Systems also worked well, as did a big underweighting in integrated oil company Exxon Mobil, which helped relative returns when this major index component underperformed the sector as a whole. Conversely, an overweighted position in oil and gas exploration/production company Plains Exploration & Production detracted, as did untimely ownership of refining company Tesoro and underweightings in oil and gas exploration/production company Apache and integrated oil company Occidental Petroleum: All three delivered strong returns. Oilfield services provider Baker Hughes also hurt fund results.
The views expressed above reflect those of the portfolio manager(s) only through the end of the period as stated on the cover of this report and do not necessarily represent the views of Fidelity or any other person in the Fidelity organization. Any such views are subject to change at any time based upon market or other conditions and Fidelity disclaims any responsibility to update such views. These views may not be relied on as investment advice and, because investment decisions for a Fidelity fund are based on numerous factors, may not be relied on as an indication of trading intent on behalf of any Fidelity fund.
Annual Report
Shareholder Expense Example
As a shareholder of the Fund, you incur two types of costs: (1) transaction costs, including redemption fees, and (2) ongoing costs, including management fees, distribution and/or service (12b-1) fees and other Fund expenses. This Example is intended to help you understand your ongoing costs (in dollars) of investing in the Fund and to compare these costs with the ongoing costs of investing in other mutual funds.
The Example is based on an investment of $1,000 invested at the beginning of the period and held for the entire period (July 1, 2007 to December 31, 2007).
Actual Expenses
The first line of the accompanying table for each class of the Fund provides information about actual account values and actual expenses. You may use the information in this line, together with the amount you invested, to estimate the expenses that you paid over the period. Simply divide your account value by $1,000.00 (for example, an $8,600 account value divided by $1,000.00 = 8.6), then multiply the result by the number in the first line for a class of the Fund under the heading entitled "Expenses Paid During Period" to estimate the expenses you paid on your account during this period. The estimate of expenses does not include any fees or other expenses of any variable annuity or variable life insurance product. If they were, the estimate of expenses you paid during the period would be higher, and your ending account value would be lower. In addition, the Fund, as a shareholder in the underlying Fidelity Central Funds, will indirectly bear its pro rata share of the fees and expenses incurred by the underlying Fidelity Central Funds. These fees and expenses are not included in the Fund's annualized expense ratio used to calculate the expense estimate in the table below.
Hypothetical Example for Comparison Purposes
The second line of the accompanying table for each class of the Fund provides information about hypothetical account values and hypothetical expenses based on a Class' actual expense ratio and an assumed rate of return of 5% per year before expenses, which is not the Class' actual return. The hypothetical account values and expenses may not be used to estimate the actual ending account balance or expenses you paid for the period. You may use this information to compare the ongoing costs of investing in the Fund and other funds. To do so, compare this 5% hypothetical example with the 5% hypothetical examples that appear in the shareholder reports of the other funds. The estimate of expenses does not include any fees or other expenses of any variable annuity or variable life insurance product. If they were, the estimate of expenses you paid during the period would be higher, and your ending account value would be lower. In addition, the Fund, as a shareholder in the underlying Fidelity Central Funds, will indirectly bear its pro rata share of the fees and expenses incurred by the underlying Fidelity Central Funds. These fees and expenses are not included in the Fund's annualized expense ratio used to calculate the expense estimate in the table below.
Please note that the expenses shown in the table are meant to highlight your ongoing costs only and do not reflect any transaction costs. Therefore, the second line of the table is useful in comparing ongoing costs only, and will not help you determine the relative total costs of owning different funds. In addition, if these transactional costs were included, your costs would have been higher.
| Beginning
Account Value
July 1, 2007 | Ending
Account Value
December 31, 2007 | Expenses Paid
During Period*
July 1, 2007
to December 31, 2007 |
Initial Class | | | |
Actual | $ 1,000.00 | $ 1,185.30 | $ 3.75 |
HypotheticalA | $ 1,000.00 | $ 1,021.78 | $ 3.47 |
Service Class 2 | | | |
Actual | $ 1,000.00 | $ 1,183.90 | $ 5.17 |
HypotheticalA | $ 1,000.00 | $ 1,020.47 | $ 4.79 |
Investor Class | | | |
Actual | $ 1,000.00 | $ 1,185.00 | $ 4.41 |
HypotheticalA | $ 1,000.00 | $ 1,021.17 | $ 4.08 |
A 5% return per year before expenses
* Expenses are equal to each Class' annualized expense ratio (shown in the table below); multiplied by the average account value over the period, multiplied by 184/365 (to reflect the one-half year period).
| Annualized
Expense Ratio |
Initial Class | .68% |
Service Class 2 | .94% |
Investor Class | .80% |
Annual Report
Investment Changes
Top Ten Stocks as of December 31, 2007 |
| % of fund's
net assets | % of fund's net assets
6 months ago |
Exxon Mobil Corp. | 14.3 | 13.2 |
Valero Energy Corp. | 6.8 | 7.0 |
National Oilwell Varco, Inc. | 6.3 | 4.6 |
Schlumberger Ltd. (NY Shares) | 6.0 | 6.7 |
CONSOL Energy, Inc. | 4.1 | 1.2 |
Peabody Energy Corp. | 3.9 | 1.2 |
Range Resources Corp. | 3.6 | 3.3 |
Transocean, Inc. | 3.4 | 2.4 |
Cabot Oil & Gas Corp. | 3.0 | 2.9 |
Ultra Petroleum Corp. | 2.7 | 2.8 |
| 54.1 | |
Top Industries (% of fund's net assets) |
As of December 31, 2007 |
| Oil, Gas & Consumable Fuels | 67.5% | |
| Energy Equipment & Services | 27.5% | |
| Electrical Equipment | 2.9% | |
| Construction & Engineering | 0.8% | |
| Independent Power Producers & Energy Traders | 0.3% | |
| All Others* | 1.0% | |

|
As of June 30, 2007 |
| Oil, Gas & Consumable Fuels | 64.3% | |
| Energy Equipment & Services | 31.5% | |
| Electrical Equipment | 1.5% | |
| Construction & Engineering | 1.0% | |
| Multi-utilities | 0.2% | |
| All Others* | 1.5% | |

* Includes short-term investments and net other assets. |
Annual Report
Investments December 31, 2007
Showing Percentage of Net Assets
Common Stocks - 99.4% |
| Shares | | Value |
COMMERCIAL SERVICES & SUPPLIES - 0.0% |
Environmental & Facility Services - 0.0% |
Fuel Tech, Inc. (a) | 10,149 | | $ 229,875 |
CONSTRUCTION & ENGINEERING - 0.8% |
Construction & Engineering - 0.8% |
Chicago Bridge & Iron Co. NV (NY Shares) | 11,800 | | 713,192 |
Jacobs Engineering Group, Inc. (a) | 52,000 | | 4,971,720 |
| | 5,684,912 |
ELECTRICAL EQUIPMENT - 2.9% |
Electrical Components & Equipment - 1.0% |
First Solar, Inc. (a) | 1,400 | | 373,996 |
JA Solar Holdings Co. Ltd. ADR | 33,200 | | 2,317,692 |
Q-Cells AG (a) | 8,600 | | 1,224,962 |
Renewable Energy Corp. AS (a) | 35,900 | | 1,823,240 |
Sunpower Corp. Class A (a) | 500 | | 65,195 |
Suntech Power Holdings Co. Ltd. sponsored ADR (a) | 11,100 | | 913,752 |
| | 6,718,837 |
Heavy Electrical Equipment - 1.9% |
Suzlon Energy Ltd. | 44,088 | | 2,166,975 |
Vestas Wind Systems AS (a) | 102,783 | | 11,104,173 |
| | 13,271,148 |
TOTAL ELECTRICAL EQUIPMENT | | 19,989,985 |
ENERGY EQUIPMENT & SERVICES - 27.5% |
Oil & Gas Drilling - 8.1% |
Atwood Oceanics, Inc. (a) | 50,200 | | 5,032,048 |
Diamond Offshore Drilling, Inc. | 65,100 | | 9,244,200 |
Nabors Industries Ltd. (a) | 32,600 | | 892,914 |
Noble Corp. | 202,960 | | 11,469,270 |
Pride International, Inc. (a) | 163,100 | | 5,529,090 |
Transocean, Inc. (a) | 161,647 | | 23,139,768 |
| | 55,307,290 |
Oil & Gas Equipment & Services - 19.4% |
Aker Kvaerner ASA | 18,250 | | 485,256 |
Baker Hughes, Inc. | 80 | | 6,488 |
Cameron International Corp. (a) | 73,400 | | 3,532,742 |
Compagnie Generale de Geophysique SA (a) | 22,100 | | 6,289,284 |
Emer International Group Ltd. (a) | 342,000 | | 235,980 |
Expro International Group PLC | 98,500 | | 2,021,630 |
Exterran Holdings, Inc. (a) | 44,295 | | 3,623,331 |
FMC Technologies, Inc. (a) | 92,020 | | 5,217,534 |
Grant Prideco, Inc. (a) | 1,600 | | 88,816 |
NATCO Group, Inc. Class A (a) | 2,500 | | 135,375 |
National Oilwell Varco, Inc. (a) | 579,478 | | 42,568,454 |
Oceaneering International, Inc. (a) | 69,857 | | 4,704,869 |
Oil States International, Inc. (a) | 29,400 | | 1,003,128 |
Petroleum Geo-Services ASA | 22,200 | | 644,411 |
ProSafe ASA | 35,700 | | 620,784 |
|
| Shares | | Value |
Saipem SpA | 36,400 | | $ 1,456,078 |
Schlumberger Ltd. (NY Shares) | 417,120 | | 41,032,094 |
Smith International, Inc. | 117,180 | | 8,653,743 |
Subsea 7, Inc. (a) | 56,500 | | 1,263,180 |
Superior Energy Services, Inc. (a) | 108,300 | | 3,727,686 |
Weatherford International Ltd. (a) | 52,800 | | 3,622,080 |
WorleyParsons Ltd. | 17,476 | | 795,976 |
| | 131,728,919 |
TOTAL ENERGY EQUIPMENT & SERVICES | | 187,036,209 |
GAS UTILITIES - 0.1% |
Gas Utilities - 0.1% |
Questar Corp. | 12,300 | | 665,430 |
INDEPENDENT POWER PRODUCERS & ENERGY TRADERS - 0.3% |
Independent Power Producers & Energy Traders - 0.3% |
AES Corp. (a) | 26,800 | | 573,252 |
Constellation Energy Group, Inc. | 6,900 | | 707,457 |
NRG Energy, Inc. (a) | 12,400 | | 537,416 |
| | 1,818,125 |
INDUSTRIAL CONGLOMERATES - 0.2% |
Industrial Conglomerates - 0.2% |
McDermott International, Inc. (a) | 26,100 | | 1,540,683 |
OIL, GAS & CONSUMABLE FUELS - 67.5% |
Coal & Consumable Fuels - 9.8% |
Alpha Natural Resources, Inc. (a) | 5,600 | | 181,888 |
Arch Coal, Inc. | 130,150 | | 5,847,640 |
CONSOL Energy, Inc. | 391,130 | | 27,973,618 |
Foundation Coal Holdings, Inc. | 80,000 | | 4,200,000 |
International Coal Group, Inc. (a) | 20,500 | | 109,880 |
Massey Energy Co. | 55,800 | | 1,994,850 |
Natural Resource Partners LP | 2,700 | | 87,642 |
Peabody Energy Corp. | 430,670 | | 26,546,499 |
| | 66,942,017 |
Integrated Oil & Gas - 26.1% |
Chevron Corp. | 166,980 | | 15,584,243 |
ConocoPhillips | 179,375 | | 15,838,813 |
Exxon Mobil Corp. | 1,042,711 | | 97,691,590 |
Hess Corp. | 97,800 | | 9,864,108 |
Marathon Oil Corp. | 222,100 | | 13,517,006 |
Occidental Petroleum Corp. | 159,600 | | 12,287,604 |
Petroleo Brasileiro SA - Petrobras sponsored ADR | 92,500 | | 10,659,700 |
Suncor Energy, Inc. | 18,000 | | 1,954,990 |
| | 177,398,054 |
Oil & Gas Exploration & Production - 20.1% |
American Oil & Gas, Inc. NV (a) | 50,739 | | 294,286 |
Apache Corp. | 16,000 | | 1,720,640 |
Aurora Oil & Gas Corp. (a) | 198,107 | | 307,066 |
Cabot Oil & Gas Corp. | 508,318 | | 20,520,798 |
Canadian Natural Resources Ltd. | 39,200 | | 2,863,606 |
Common Stocks - continued |
| Shares | | Value |
OIL, GAS & CONSUMABLE FUELS - CONTINUED |
Oil & Gas Exploration & Production - continued |
Chesapeake Energy Corp. (d) | 291,100 | | $ 11,411,120 |
Concho Resources, Inc. | 88,544 | | 1,824,892 |
EOG Resources, Inc. | 138,000 | | 12,316,500 |
EXCO Resources, Inc. (a) | 3,700 | | 57,276 |
Goodrich Petroleum Corp. (a) | 17,600 | | 398,112 |
Kodiak Oil & Gas Corp. (a) | 101,700 | | 223,740 |
Newfield Exploration Co. (a) | 13,900 | | 732,530 |
Noble Energy, Inc. | 52,800 | | 4,198,656 |
Petrohawk Energy Corp. (a) | 256,200 | | 4,434,822 |
Plains Exploration & Production Co. (a) | 5,100 | | 275,400 |
Quicksilver Resources, Inc. (a) | 190,384 | | 11,344,983 |
Range Resources Corp. | 480,700 | | 24,688,752 |
Southwestern Energy Co. (a) | 120,100 | | 6,691,972 |
Ultra Petroleum Corp. (a) | 260,500 | | 18,625,750 |
Vanguard Natural Resources LLC | 3,400 | | 54,400 |
XTO Energy, Inc. | 269,150 | | 13,823,544 |
| | 136,808,845 |
Oil & Gas Refining & Marketing - 9.3% |
Holly Corp. | 15,500 | | 788,795 |
Petroplus Holdings AG | 17,752 | | 1,373,732 |
Sunoco, Inc. | 51,236 | | 3,711,536 |
Tesoro Corp. | 205,400 | | 9,797,580 |
Valero Energy Corp. | 660,324 | | 46,242,490 |
Western Refining, Inc. | 49,606 | | 1,200,961 |
| | 63,115,094 |
Oil & Gas Storage & Transport - 2.2% |
El Paso Pipeline Partners LP | 46,700 | | 1,169,835 |
Williams Companies, Inc. | 387,350 | | 13,859,383 |
| | 15,029,218 |
TOTAL OIL, GAS & CONSUMABLE FUELS | | 459,293,228 |
|
| Shares | | Value |
SOFTWARE - 0.1% |
Application Software - 0.1% |
Zhongyu Gas Holdings Ltd. (a) | 3,174,000 | | $ 500,702 |
TOTAL COMMON STOCKS (Cost $455,773,491) | 676,759,149 |
Money Market Funds - 3.0% |
| | | |
Fidelity Cash Central Fund, 4.58% (b) | 11,655,181 | | 11,655,181 |
Fidelity Securities Lending Cash Central Fund, 4.65% (b)(c) | 8,707,500 | | 8,707,500 |
TOTAL MONEY MARKET FUNDS (Cost $20,362,681) | 20,362,681 |
TOTAL INVESTMENT PORTFOLIO - 102.4% (Cost $476,136,172) | | 697,121,830 |
NET OTHER ASSETS - (2.4)% | | (16,183,460) |
NET ASSETS - 100% | $ 680,938,370 |
Legend |
(a) Non-income producing |
(b) Affiliated fund that is available only to investment companies and other accounts managed by Fidelity Investments. The rate quoted is the annualized seven-day yield of the fund at period end. A complete unaudited listing of the fund's holdings as of its most recent quarter end is available upon request. |
(c) Investment made with cash collateral received from securities on loan. |
(d) Security or a portion of the security is on loan at period end. |
Affiliated Central Funds |
Information regarding fiscal year to date income earned by the Fund from investments in Fidelity Central Funds is as follows: |
Fund | Income earned |
Fidelity Cash Central Fund | $ 298,269 |
Fidelity Securities Lending Cash Central Fund | 38,940 |
Total | $ 337,209 |
Distribution of investments by country of issue, as a percentage of total net assets, is as follows: |
United States of America | 81.9% |
Netherlands Antilles | 6.0% |
Canada | 3.4% |
Cayman Islands | 2.4% |
Denmark | 1.6% |
Brazil | 1.6% |
Others (individually less than 1%) | 3.1% |
| 100.0% |
See accompanying notes which are an integral part of the financial statements.
Annual Report
Financial Statements
Statement of Assets and Liabilities
| December 31, 2007 |
| | |
Assets | | |
Investment in securities, at value
(including securities loaned of $8,428,000) - See accompanying schedule: Unaffiliated issuers
(cost $455,773,491) | $ 676,759,149 | |
Fidelity Central Funds
(cost $20,362,681) | 20,362,681 | |
Total Investments
(cost $476,136,172) | | $ 697,121,830 |
Foreign currency held at value
(cost $12) | | 7 |
Receivable for investments sold | | 1,101,868 |
Receivable for fund shares sold | | 1,819,664 |
Dividends receivable | | 261,823 |
Distributions receivable from Fidelity Central Funds | | 27,918 |
Prepaid expenses | | 1,924 |
Other receivables | | 3,680 |
Total assets | | 700,338,714 |
| | |
Liabilities | | |
Payable for investments purchased | $ 9,915,469 | |
Payable for fund shares redeemed | 221,813 | |
Accrued management fee | 298,944 | |
Distribution fees payable | 38,203 | |
Other affiliated payables | 66,554 | |
Other payables and accrued expenses | 151,861 | |
Collateral on securities loaned, at value | 8,707,500 | |
Total liabilities | | 19,400,344 |
| | |
Net Assets | | $ 680,938,370 |
Net Assets consist of: | | |
Paid in capital | | $ 453,304,513 |
Accumulated undistributed net realized gain (loss) on investments and foreign currency transactions | | 6,745,419 |
Net unrealized appreciation (depreciation) on investments and assets and liabilities in foreign currencies | | 220,888,438 |
Net Assets | | $ 680,938,370 |
Initial Class:
Net Asset Value, offering price and redemption price per share ($355,853,699 ÷ 13,402,854 shares) | | $ 26.55 |
| | |
Service Class 2:
Net Asset Value, offering price and redemption price per share ($193,886,517 ÷ 7,333,146 shares) | | $ 26.44 |
| | |
Investor Class:
Net Asset Value, offering price and redemption price per share ($131,198,154 ÷ 4,953,466 shares) | | $ 26.49 |
Statement of Operations
| Year ended December 31, 2007 |
| | |
Investment Income | | |
Dividends | | $ 4,723,121 |
Interest | | 63 |
Income from Fidelity Central Funds | | 337,209 |
Total income | | 5,060,393 |
| | |
Expenses | | |
Management fee | $ 2,786,723 | |
Transfer agent fees | 429,230 | |
Distribution fees | 304,246 | |
Accounting and security
lending fees | 193,018 | |
Custodian fees and expenses | 34,197 | |
Independent trustees' compensation | 1,681 | |
Registration fees | 400 | |
Audit | 42,713 | |
Legal | 4,313 | |
Interest | 10,659 | |
Miscellaneous | 86,199 | |
Total expenses before reductions | 3,893,379 | |
Expense reductions | (6,437) | 3,886,942 |
Net investment income (loss) | | 1,173,451 |
Realized and Unrealized Gain (Loss) Net realized gain (loss) on: | | |
Investment securities: | | |
Unaffiliated issuers (net of foreign taxes of $3,663) | 35,802,209 | |
Foreign currency transactions | 4,263 | |
Total net realized gain (loss) | | 35,806,472 |
Change in net unrealized appreciation (depreciation) on: Investment securities (net of increase in deferred foreign taxes of $97,338) | 145,447,842 | |
Assets and liabilities in foreign currencies | 63 | |
Total change in net unrealized appreciation (depreciation) | | 145,447,905 |
Net gain (loss) | | 181,254,377 |
Net increase (decrease) in net assets resulting from operations | | $ 182,427,828 |
See accompanying notes which are an integral part of the financial statements.
Annual Report
Financial Statements - continued
Statement of Changes in Net Assets
| Year ended
December 31,
2007 | Year ended
December 31,
2006 |
Increase (Decrease) in Net Assets | | |
Operations | | |
Net investment income (loss) | $ 1,173,451 | $ 1,751,602 |
Net realized gain (loss) | 35,806,472 | 50,115,511 |
Change in net unrealized appreciation (depreciation) | 145,447,905 | (2,183,254) |
Net increase (decrease) in net assets resulting from operations | 182,427,828 | 49,683,859 |
Distributions to shareholders from net investment income | (1,200,523) | (2,844,412) |
Distributions to shareholders from net realized gain | (27,081,489) | (54,354,221) |
Total distributions | (28,282,012) | (57,198,633) |
Share transactions - net increase (decrease) | 124,344,576 | 38,551,892 |
Redemption fees | 169,727 | 261,131 |
Total increase (decrease) in net assets | 278,660,119 | 31,298,249 |
| | |
Net Assets | | |
Beginning of period | 402,278,251 | 370,980,002 |
End of period | $ 680,938,370 | $ 402,278,251 |
Financial Highlights - Initial Class
Years ended December 31, | 2007 | 2006 | 2005 | 2004 | 2003 |
Selected Per-Share Data | | | | | |
Net asset value, beginning of period | $ 19.04 | $ 18.92 | $ 13.62 | $ 11.04 | $ 8.49 |
Income from Investment Operations | | | | | |
Net investment income (loss) C | .07 | .09 | .10 | .10 | .05 |
Net realized and unrealized gain (loss) | 8.62 | 3.09 | 6.20 | 2.53 | 2.54 |
Total from investment operations | 8.69 | 3.18 | 6.30 | 2.63 | 2.59 |
Distributions from net investment income | (.06) | (.16) | (.08) | (.07) | (.05) |
Distributions from net realized gain | (1.13) | (2.91) | (.94) | - | - |
Total distributions | (1.19) | (3.07) | (1.02) | (.07) | (.05) |
Redemption fees added to paid in capital C | .01 | .01 | .02 | .02 | .01 |
Net asset value, end of period | $ 26.55 | $ 19.04 | $ 18.92 | $ 13.62 | $ 11.04 |
Total Return A, B | 45.97% | 16.91% | 46.31% | 23.96% | 30.61% |
Ratios to Average Net Assets D, F | | | | | |
Expenses before reductions | .70% | .71% | .72% | .78% | 1.26% |
Expenses net of fee waivers, if any | .70% | .71% | .72% | .78% | 1.26% |
Expenses net of all reductions | .70% | .70% | .66% | .74% | 1.25% |
Net investment income (loss) | .31% | .43% | .56% | .80% | .56% |
Supplemental Data | | | | | |
Net assets, end of period (000 omitted) | $ 355,854 | $ 280,537 | $ 334,368 | $ 125,781 | $ 31,624 |
Portfolio turnover rate E | 61% | 151% | 107% | 87% | 73% |
A Total returns do not reflect charges attributable to your insurance company's separate account. Inclusion of these charges would reduce the total returns shown.
B Total returns would have been lower had certain expenses not been reduced during the periods shown.
C Calculated based on average shares outstanding during the period.
D Fees and expenses of the underlying Fidelity Central Funds are not included in the Fund's expense ratio. The Fund indirectly bears its proportionate share of the expenses of any underlying Fidelity Central Funds.
E Amount does not include the portfolio activity of any underlying Fidelity Central Funds.
F Expense ratios reflect operating expenses of the class. Expenses before reductions do not reflect amounts reimbursed by the investment adviser or reductions from brokerage service arrangements or other expense offset arrangements and do not represent the amount paid by the class during periods when reimbursements or reductions occur. Expenses net of fee waivers reflect expenses after reimbursement by the investment adviser but prior to reductions from brokerage service arrangements or other expense offset arrangements. Expenses net of all reductions represent the net expenses paid by the class.
See accompanying notes which are an integral part of the financial statements.
Annual Report
Financial Highlights - Service Class 2
Years ended December 31, | 2007 | 2006 | 2005 H |
Selected Per-Share Data | | | |
Net asset value, beginning of period | $ 18.98 | $ 18.90 | $ 15.80 |
Income from Investment Operations | | | |
Net investment income (loss) E | .02 | .04 | .04 |
Net realized and unrealized gain (loss) | 8.58 | 3.07 | 4.04 |
Total from investment operations | 8.60 | 3.11 | 4.08 |
Distributions from net investment income | (.02) | (.13) | (.07) |
Distributions from net realized gain | (1.13) | (2.91) | (.92) |
Total distributions | (1.15) | (3.04) | (.99) |
Redemption fees added to paid in capital E | .01 | .01 | .01 |
Net asset value, end of period | $ 26.44 | $ 18.98 | $ 18.90 |
Total Return B, C,D | 45.64% | 16.55% | 25.80% |
Ratios to Average Net Assets F, I | | | |
Expenses before reductions | .95% | .96% | .97% A |
Expenses net of fee waivers, if any | .95% | .96% | .97% A |
Expenses net of all reductions | .94% | .95% | .91% A |
Net investment income (loss) | .07% | .18% | .31% A |
Supplemental Data | | | |
Net assets, end of period (000 omitted) | $ 193,887 | $ 70,305 | $ 20,211 |
Portfolio turnover rate G | 61% | 151% | 107% |
A Annualized
B Total returns for periods of less than one year are not annualized.
C Total returns do not reflect charges attributable to your insurance company's separate account. Inclusion of these charges would reduce the total returns shown.
D Total returns would have been lower had certain expenses not been reduced during the periods shown.
E Calculated based on average shares outstanding during the period.
F Fees and expenses of the underlying Fidelity Central Funds are not included in the Fund's expense ratio. The Fund indirectly bears its proportionate share of the expenses of any underlying Fidelity Central Funds.
G Amount does not include the portfolio activity of any underlying Fidelity Central Funds.
H For the period April 6, 2005 (commencement of sale of shares) to December 31, 2005.
I Expense ratios reflect operating expenses of the class. Expenses before reductions do not reflect amounts reimbursed by the investment adviser or reductions from brokerage service arrangements or other expense offset arrangements and do not represent the amount paid by the class during periods when reimbursements or reductions occur. Expense ratios before reductions for start-up periods may not be representative of longer-term operating periods. Expenses net of fee waivers reflect expenses after reimbursement by the investment adviser but prior to reductions from brokerage service arrangements or other expense offset arrangements. Expenses net of all reductions represent the net expenses paid by the class.
Financial Highlights - Investor Class
Years ended December 31, | 2007 | 2006 | 2005H |
Selected Per-Share Data | | | |
Net asset value, beginning of period | $ 19.00 | $ 18.91 | $ 16.76 |
Income from Investment Operations | | | |
Net investment income (loss)E | .05 | .06 | .03 |
Net realized and unrealized gain (loss) | 8.61 | 3.08 | 3.11 |
Total from investment operations | 8.66 | 3.14 | 3.14 |
Distributions from net investment income | (.05) | (.15) | (.08) |
Distributions from net realized gain | (1.13) | (2.91) | (.92) |
Total distributions | (1.18) | (3.06) | (1.00) |
Redemption fees added to paid in capitalE | .01 | .01 | .01 |
Net asset value, end of period | $ 26.49 | $ 19.00 | $ 18.91 |
Total ReturnB, C,D | 45.88% | 16.69% | 18.73% |
Ratios to Average Net AssetsF, I | | | |
Expenses before reductions | .81% | .84% | .91%A |
Expenses net of fee waivers, if any | .81% | .84% | .91%A |
Expenses net of all reductions | .81% | .82% | .85%A |
Net investment income (loss) | .20% | .31% | .37%A |
Supplemental Data | | | |
Net assets, end of period (000 omitted) | $ 131,198 | $ 51,436 | $ 16,402 |
Portfolio turnover rateG | 61% | 151% | 107% |
A Annualized
B Total returns for periods of less than one year are not annualized.
C Total returns do not reflect charges attributable to your insurance company's separate account. Inclusion of these charges would reduce the total returns shown.
D Total returns would have been lower had certain expenses not been reduced during the periods shown.
E Calculated based on average shares outstanding during the period.
F Fees and expenses of the underlying Fidelity Central Funds are not included in the Fund's expense ratio. The Fund indirectly bears its proportionate share of the expenses of any underlying Fidelity Central Funds.
G Amount does not include the portfolio activity of any underlying Fidelity Central Funds.
H For the period July 21, 2005 (commencement of sale of shares) to December 31, 2005.
I Expense ratios reflect operating expenses of the class. Expenses before reductions do not reflect amounts reimbursed by the investment adviser or reductions from brokerage service arrangements or other expense offset arrangements and do not represent the amount paid by the class during periods when reimbursements or reductions occur. Expense ratios before reductions for start-up periods may not be representative of longer-term operating periods. Expenses net of fee waivers reflect expenses after reimbursement by the investment adviser but prior to reductions from brokerage service arrangements or other expense offset arrangements. Expenses net of all reductions represent the net expenses paid by the class.
See accompanying notes which are an integral part of the financial statements.
Annual Report
Notes to Financial Statements
For the period ended December 31, 2007
1. Organization.
VIP Energy Portfolio (the Fund) is a non-diversified fund of Variable Insurance Products Fund IV (the trust) and is authorized to issue an unlimited number of shares. The trust is registered under the Investment Company Act of 1940, as amended (the 1940 Act), as an open-end management investment company organized as a Massachusetts business trust. Shares of the Fund may only be purchased by insurance companies for the purpose of funding variable annuity or variable life insurance contracts. The Fund offers the following classes of shares: Initial Class shares, Service Class 2 shares, and Investor Class shares. All classes have equal rights and voting privileges, except for matters affecting a single class. Investment income, realized and unrealized capital gains and losses, the common expenses of the Fund, and certain fund-level expense reductions, if any, are allocated on a pro rata basis to each class based on the relative net assets of each class to the total net assets of the Fund. Each class differs with respect to transfer agent and distribution and service plan fees incurred. Certain expense reductions also differ by class.
2. Investments in Fidelity Central Funds.
The Fund may invest in Fidelity Central Funds, which are open-end investment companies available only to other investment companies and accounts managed by Fidelity Management & Research Company (FMR) and its affiliates. The Fund's Schedule of Investments lists each of the Fidelity Central Funds as an investment of the Fund, but does not include the underlying holdings of each Fidelity Central Fund. As an Investing Fund, the Fund indirectly bears its proportionate share of the expenses of the underlying Fidelity Central Funds.
The Money Market Central Funds seek preservation of capital and current income and are managed by Fidelity Investments Money Management, Inc. (FIMM), an affiliate of FMR.
A complete list of holdings for each Fidelity Central Fund is available upon request or at the SEC's web site at www.sec.gov. In addition, the financial statements of the Fidelity Central Funds, which are not covered by the Fund's Report of Independent Registered Public Accounting Firm, are available on the SEC's web site or upon request.
3. Significant Accounting Policies.
The financial statements have been prepared in conformity with accounting principles generally accepted in the United States of America, which require management to make certain estimates and assumptions at the date of the financial statements. The following summarizes the significant accounting policies of the Fund:
Security Valuation. Investments are valued and net asset value (NAV) per share is calculated (NAV calculation) as of the close of business of the New York Stock Exchange (NYSE), normally 4:00 p.m. Eastern time. Wherever possible, the Fund uses independent pricing services approved by the Board of Trustees to value its investments.
Equity securities, including restricted securities, for which market quotations are readily available, are valued at the last reported sale price or official closing price as reported by an independent pricing service on the primary market or exchange on which they are traded. In the event there were no sales during the day or closing prices are not available, securities are valued at the last quoted bid price. Investments in open-end mutual funds, including the Fidelity Central Funds, are valued at their closing net asset value each business day. Short-term securities with remaining maturities of sixty days or less for which quotations are not readily available are valued at amortized cost, which approximates value.
When current market prices or quotations are not readily available or do not accurately reflect fair value, valuations may be determined in accordance with procedures adopted by the Board of Trustees. For example, when developments occur between the close of a market and the close of the NYSE that may materially affect the value of some or all of the securities, or when trading in a security is halted, those securities may be fair valued. Factors used in the determination of fair value may include monitoring news to identify significant market or security specific events such as changes in the value of U.S. securities markets, reviewing developments in foreign markets and evaluating the performance of ADRs, futures contracts and exchange-traded funds. Because the Fund's utilization of fair value pricing depends on market activity, the frequency with which fair value pricing is used cannot be predicted and may be utilized to a significant extent. The value of securities used for NAV calculation under fair value pricing may differ from published prices for the same securities.
Foreign Currency. The Fund uses foreign currency contracts to facilitate transactions in foreign-denominated securities. Losses from these transactions may arise from changes in the value of the foreign currency or if the counterparties do not perform under the contracts' terms.
Foreign-denominated assets, including investment securities, and liabilities are translated into U.S. dollars at the exchange rate at period end. Purchases and sales of investment securities, income and dividends received and expenses denominated in foreign currencies are translated into U.S. dollars at the exchange rate in effect on the transaction date.
The effects of exchange rate fluctuations on investments are included with the net realized and unrealized gain (loss) on investment securities. Other foreign currency transactions resulting in realized and unrealized gain (loss) are disclosed separately.
Annual Report
3. Significant Accounting Policies - continued
Investment Transactions and Income. For financial reporting purposes, the Fund's investment holdings and NAV include trades executed through the end of the last business day of the period. The NAV for processing shareholder transactions includes trades executed through the end of the prior business day. Gains and losses on securities sold are determined on the basis of identified cost. Dividend income is recorded on the ex-dividend date, except for certain dividends from foreign securities where the ex-dividend date may have passed, which are recorded as soon as the Fund is informed of the ex-dividend date. Non-cash dividends included in dividend income, if any, are recorded at the fair market value of the securities received. Distributions received on securities that represent a return of capital or capital gain are recorded as a reduction of cost of investments and/or as a realized gain. The Fund estimates the components of distributions received that may be considered return of capital distributions or capital gain distributions. Interest income and distributions from the Fidelity Central Funds are accrued as earned. Interest income includes coupon interest and amortization of premium and accretion of discount on debt securities. Investment income is recorded net of foreign taxes withheld where recovery of such taxes is uncertain.
Expenses. Most expenses of the trust can be directly attributed to a fund. Expenses which cannot be directly attributed are apportioned among each Fund in the trust. Expense estimates are accrued in the period to which they relate and adjustments are made when actual amounts are known.
Income Tax Information and Distributions to Shareholders. Each year, the Fund intends to qualify as a regulated investment company by distributing substantially all of its taxable income and realized gains under Subchapter M of the Internal Revenue Code and filing its U.S. federal tax return. As a result, no provision for income taxes is required. The Fund adopted the provisions of FASB Interpretation No. 48, Accounting for Uncertainties in Income Taxes (FIN 48), on June 29, 2007. FIN 48 sets forth a minimum threshold for financial statement recognition of the benefit of a tax position taken or expected to be taken in a tax return. The implementation of FIN 48 did not result in any unrecognized tax benefits in the accompanying financial statements. Each of the Fund's federal tax returns for the prior three fiscal years remains subject to examination by the Internal Revenue Service. Foreign taxes are provided for based on the Fund's understanding of the tax rules and rates that exist in the foreign markets in which it invests.
Distributions are recorded on the ex-dividend date. Income dividends and capital gain distributions are declared separately for each class. Income and capital gain distributions are determined in accordance with income tax regulations, which may differ from generally accepted accounting principles.
Capital accounts within the financial statements are adjusted for permanent book-tax differences. These adjustments have no impact on net assets or the results of operations. Temporary book-tax differences will reverse in a subsequent period.
Book-tax differences are primarily due to short-term capital gains, foreign currency transactions, certain foreign taxes, passive foreign investment companies (PFIC), partnerships and losses deferred due to wash sales.
The tax-basis components of distributable earnings and the federal tax cost as of period end were as follows:
Unrealized appreciation | $ 224,430,603 |
Unrealized depreciation | (4,976,707) |
Net unrealized appreciation (depreciation) | 219,453,896 |
Undistributed ordinary income | 2,153,224 |
Undistributed long-term capital gain | 6,026,721 |
| |
Cost for federal income tax purposes | $ 477,667,934 |
The tax character of distributions paid was as follows:
| December 31, 2007 | December 31, 2006 |
Ordinary Income | $ 5,047,984 | $ 27,103,286 |
Long-term Capital Gains | 23,234,028 | 30,095,347 |
Total | $ 28,282,012 | $ 57,198,633 |
Trading (Redemption) Fees. Shares held less than 60 days are subject to a redemption fee equal to 1% of the proceeds of the redeemed shares. All redemption fees, including any estimated redemption fees paid by FMR, are retained by the Fund and accounted for as an addition to paid in capital.
New Accounting Pronouncement. In September 2006, Statement of Financial Accounting Standards No. 157, Fair Value Measurements (SFAS 157), was issued and is effective for fiscal years beginning after November 15, 2007. SFAS 157 defines fair value, establishes a framework for measuring fair value and expands disclosures about fair value measurements. Management is currently evaluating the impact the adoption of SFAS 157 will have on the Fund's financial statement disclosures.
Annual Report
Notes to Financial Statements - continued
4. Operating Policies.
Repurchase Agreements. FMR has received an Exemptive Order from the Securities and Exchange Commission (the SEC) which permits the Fund and other affiliated entities of FMR to transfer uninvested cash balances into joint trading accounts which are then invested in repurchase agreements. The Fund may also invest directly with institutions in repurchase agreements. Repurchase agreements are collateralized by government or non-government securities. Upon settlement date, collateral is held in segregated accounts with custodian banks and may be obtained in the event of a default of the counterparty. The Fund monitors, on a daily basis, the value of the collateral to ensure it is at least equal to the principal amount of the repurchase agreement (including accrued interest). In the event of a default by the counterparty, realization of the collateral proceeds could be delayed, during which time the value of the collateral may decline.
5. Purchases and Sales of Investments.
Purchases and sales of securities, other than short-term securities, aggregated $397,673,505 and $302,722,825, respectively.
6. Fees and Other Transactions with Affiliates.
Management Fee. FMR and its affiliates provide the Fund with investment management related services for which the Fund pays a monthly management fee. The management fee is the sum of an individual fund fee rate that is based on an annual rate of .30% of the Fund's average net assets and a group fee rate that averaged .26% during the period. The group fee rate is based upon the average net assets of all the mutual funds advised by FMR. The group fee rate decreases as assets under management increase and increases as assets under management decrease. For the period, the total annual management fee rate was .56% of the Fund's average net assets.
Distribution and Service Plan. In accordance with Rule 12b-1 of the 1940 Act, the Fund has adopted a separate 12b-1 Plan for Service Class 2 shares. Service Class 2 pays Fidelity Distributors Corporation (FDC), an affiliate of FMR, a service fee. For the period, the service fee is based on an annual rate of .25% of Service Class 2's average net assets.
For the period, Service Class 2 paid FDC $304,246, all of which was re-allowed to insurance companies for the distribution of shares and providing shareholder support services.
Transfer Agent Fees. Fidelity Investments Institutional Operations Company, Inc. (FIIOC), an affiliate of FMR, is the Fund's transfer, dividend disbursing, and shareholder servicing agent. FIIOC receives an asset-based fee with respect to each class. Each class with the exception of Investor Class pays a transfer agent fee, excluding out of pocket expenses, equal to an annual rate of .07% of average net assets. Investor Class pays a monthly asset-based transfer agent fee of .18% of average net assets. The total transfer agent fees paid by each class to FIIOC, including out of pocket expenses, were as follows:
Initial Class | $ 198,809 | |
Service Class 2 | 80,600 | |
Investor Class | 149,821 | |
| $ 429,230 | |
Effective February 1, 2008, the Board of Trustees approved a decrease to Investor Class' asset-based fee from .18% to .15% of average net assets.
Accounting and Security Lending Fees. Fidelity Service Company, Inc. (FSC), an affiliate of FMR, maintains the Fund's accounting records. The accounting fee is based on the level of average net assets for the month. Under a separate contract, FSC administers the security lending program. The security lending fee is based on the number and duration of lending transactions.
Brokerage Commissions. The Fund placed a portion of its portfolio transactions with brokerage firms which are affiliates of the investment adviser. The commissions paid to these affiliated firms were $2,644 for the period.
Interfund Lending Program. Pursuant to an Exemptive Order issued by the SEC, the Fund, along with other registered investment companies having management contracts with FMR, may participate in an interfund lending program. This program provides an alternative credit facility allowing the funds to borrow from, or lend money to, other participating affiliated funds. At period end, there were no interfund loans outstanding. The Fund's activity in this program during the period for which loans were outstanding was as follows:
Borrower or Lender | Average Daily Loan Balance | Weighted Average Interest Rate | Interest Expense |
Borrower | $ 4,464,563 | 5.37% | $ 10,659 |
Annual Report
7. Committed Line of Credit.
The Fund participates with other funds managed by FMR in a $4.2 billion credit facility (the "line of credit") to be utilized for temporary or emergency purposes to fund shareholder redemptions or for other short-term liquidity purposes. The Fund has agreed to pay commitment fees on its pro rata portion of the line of credit, which amounted to $920 and is reflected in Miscellaneous Expense on the Statement of Operations. During the period, there were no borrowings on this line of credit.
8. Security Lending.
The Fund lends portfolio securities from time to time in order to earn additional income. On the settlement date of the loan, the Fund receives collateral (in the form of U.S. Treasury obligations, letters of credit and/or cash) against the loaned securities and maintains collateral in an amount not less than 100% of the market value of the loaned securities during the period of the loan. The market value of the loaned securities is determined at the close of business of the Fund and any additional required collateral is delivered to the Fund on the next business day. If the borrower defaults on its obligation to return the securities loaned because of insolvency or other reasons, a fund could experience delays and costs in recovering the securities loaned or in gaining access to the collateral. Any cash collateral received is invested in the Fidelity Securities Lending Cash Central Fund. The value of loaned securities and cash collateral at period end are disclosed on the Fund's Statement of Assets and Liabilities. Security lending income represents the income earned on investing cash collateral, less fees and expenses associated with the loan, plus any premium payments that may be received on the loan of certain types of securities. Security lending income is presented in the Statement of Operations as a component of income from Fidelity Central Funds. Net income from lending portfolio securities during the period amounted to $38,940.
9. Expense Reductions.
Many of the brokers with whom FMR places trades on behalf of the Fund provided services to the Fund in addition to trade execution. These services included payments of certain expenses on behalf of the Fund totaling $6,344 for the period.
10. Other.
The Fund's organizational documents provide former and current trustees and officers with a limited indemnification against liabilities arising in connection with the performance of their duties to the Fund. In the normal course of business, the Fund may also enter into contracts that provide general indemnifications. The Fund's maximum exposure under these arrangements is unknown as this would be dependent on future claims that may be made against the Fund. The risk of material loss from such claims is considered remote.
At the end of the period, FMR or its affiliates were the owners of record of 72% of the total outstanding shares of the Fund and one otherwise unaffiliated shareholder was the owner of record of 28% of the total outstanding shares of the Fund.
The United States Securities and Exchange Commission ("SEC") is conducting an investigation of FMR (covering the years 2002 to 2004) arising from gifts, gratuities and business entertainment provided by certain brokers to certain individuals who were employed on FMR's domestic equity trading desk during that period. FMR is in discussions with the SEC staff regarding the possible resolution of the matter, but as of period-end no final resolution has been reached.
In December 2006, the Independent Trustees completed their own investigation of the matter with the assistance of independent counsel. The Independent Trustees and FMR agree that, despite the absence of proof that the Fidelity mutual funds experienced diminished execution quality as a result of the improper receipt of gifts and business entertainment, the conduct at issue was serious and is worthy of redress. Accordingly, the Independent Trustees have requested and FMR has agreed to pay $42 million to Fidelity mutual funds, plus interest to be determined at the time that payment is made. A method of allocating this payment among the funds has not yet been determined. The total payment to the Fund is not anticipated to have a material impact on the Fund's net assets. In addition, FMR reimbursed related legal expenses which are recorded in the accompanying Statement of Operations as an expense reduction.
Annual Report
Notes to Financial Statements - continued
11. Distributions to Shareholders.
Distributions to shareholders of each class were as follows:
Years ended December 31, | 2007 | 2006 |
From net investment income | | |
Initial Class | $ 816,831 | $ 2,085,944 |
Service Class 2 | 167,443 | 417,004 |
Investor Class | 216,249 | 341,464 |
Total | $ 1,200,523 | $ 2,844,412 |
From net realized gain | | |
Initial Class | $ 14,471,944 | $ 38,831,658 |
Service Class 2 | 7,591,179 | 8,989,384 |
Investor Class | 5,018,366 | 6,533,179 |
Total | $ 27,081,489 | $ 54,354,221 |
12. Share Transactions.
Transactions for each class of shares were as follows:
| Shares | Dollars |
Years ended December 31, | 2007 | 2006 | 2007 | 2006 |
Initial Class | | | | |
Shares sold | 1,857,099 | 3,276,992 | $ 44,454,803 | $ 71,557,806 |
Reinvestment of distributions | 597,904 | 2,133,823 | 15,288,775 | 40,917,603 |
Shares redeemed | (3,787,008) | (8,345,943) | (77,567,833) | (169,302,328) |
Net increase (decrease) | (1,332,005) | (2,935,128) | $ (17,824,255) | $ (56,826,919) |
Service Class 2 | | | | |
Shares sold | 4,400,682 | 3,062,096 | $ 102,772,658 | $ 65,681,537 |
Reinvestment of distributions | 300,833 | 493,393 | 7,758,622 | 9,406,387 |
Shares redeemed | (1,072,210) | (921,256) | (23,413,472) | (18,804,698) |
Net increase (decrease) | 3,629,305 | 2,634,233 | $ 87,117,808 | $ 56,283,226 |
Investor Class | | | | |
Shares sold | 2,764,988 | 1,990,866 | $ 64,717,111 | $ 42,583,288 |
Reinvestment of distributions | 202,756 | 360,165 | 5,234,615 | 6,874,643 |
Shares redeemed | (720,765) | (512,058) | (14,900,703) | (10,362,346) |
Net increase (decrease) | 2,246,979 | 1,838,973 | $ 55,051,023 | $ 39,095,585 |
Annual Report
Report of Independent Registered Public Accounting Firm
To the Trustees of Variable Insurance Products Fund IV and the Shareholders of VIP Energy Portfolio:
In our opinion, the accompanying statement of assets and liabilities, including the schedule of investments, and the related statements of operations and of changes in net assets and the financial highlights present fairly, in all material respects, the financial position of VIP Energy Portfolio (a fund of Variable Insurance Products Fund IV) at December 31, 2007, the results of its operations for the year then ended, the changes in its net assets for each of the two years in the period then ended and the financial highlights for each of the periods indicated, in conformity with accounting principles generally accepted in the United States of America. These financial statements and financial highlights (hereafter referred to as "financial statements") are the responsibility of the VIP Energy Portfolio's management. Our responsibility is to express an opinion on these financial statements based on our audits. We conducted our audits of these financial statements in accordance with the standards of the Public Company Accounting Oversight Board (United States). Those standards require that we plan and perform the audit to obtain reasonable assurance about whether the financial statements are free of material misstatement. An audit includes examining, on a test basis, evidence supporting the amounts and disclosures in the financial statements, assessing the accounting principles used and significant estimates made by management, and evaluating the overall financial statement presentation. We believe that our audits, which included confirmation of securities at December 31, 2007 by correspondence with the custodian and brokers, provide a reasonable basis for our opinion.
/s/ PricewaterhouseCoopers LLP
PricewaterhouseCoopers LLP
Boston, Massachusetts
February 14, 2008
Annual Report
Trustees and Officers
The Trustees, Members of the Advisory Board, and executive officers of the trust and fund, as applicable, are listed below. The Board of Trustees governs the fund and is responsible for protecting the interests of shareholders. The Trustees are experienced executives who meet periodically throughout the year to oversee the fund's activities, review contractual arrangements with companies that provide services to the fund, and review the fund's performance. Except for James C. Curvey, each of the Trustees oversees 373 funds advised by FMR or an affiliate. Mr. Curvey oversees 368 funds advised by FMR or an affiliate.
The Trustees hold office without limit in time except that (a) any Trustee may resign; (b) any Trustee may be removed by written instrument, signed by at least two-thirds of the number of Trustees prior to such removal; (c) any Trustee who requests to be retired or who has become incapacitated by illness or injury may be retired by written instrument signed by a majority of the other Trustees; and (d) any Trustee may be removed at any special meeting of shareholders by a two-thirds vote of the outstanding voting securities of the trust. Each Trustee who is not an interested person (as defined in the 1940 Act) (Independent Trustee), shall retire not later than the last day of the calendar year in which his or her 72nd birthday occurs. The Independent Trustees may waive this mandatory retirement age policy with respect to individual Trustees. The executive officers and Advisory Board Members hold office without limit in time, except that any officer and Advisory Board Member may resign or may be removed by a vote of a majority of the Trustees at any regular meeting or any special meeting of the Trustees. Except as indicated, each individual has held the office shown or other offices in the same company for the past five years.
The fund's Statement of Additional Information (SAI) includes more information about the Trustees. To request a free copy, call Fidelity at 1-877-208-0098.
Interested Trustees*:
Correspondence intended for each Trustee who is an interested person may be sent to Fidelity Investments, 82 Devonshire Street, Boston, Massachusetts 02109.
Name, Age; Principal Occupation |
Edward C. Johnson 3d (77) |
| Year of Election or Appointment: 1983 Mr. Johnson is Chairman of the Board of Trustees. Mr. Johnson serves as President (2006-present), Chief Executive Officer, Chairman, and a Director of FMR LLC; Chairman and a Director of FMR; Chairman and a Director of Fidelity Research & Analysis Company (FRAC); Chairman and a Director of Fidelity Investments Money Management, Inc.; and Chairman (2001-present) and a Director of FMR Co., Inc. In addition, Mr. Johnson serves as Chairman and Director of Fidelity International Limited (FIL). Mr. Edward C. Johnson 3d and Mr. Arthur E. Johnson are not related. |
James C. Curvey (72) |
| Year of Election or Appointment: 2007 Mr. Curvey also serves as Trustee (2007-present) or Member of the Advisory Board (2007-present) of other investment companies advised by FMR. Mr. Curvey is a Director of FMR and FMR Co., Inc. (2007-present). Mr. Curvey is also Vice Chairman (2006-present) and Director of FMR LLC. Mr. Curvey joined Fidelity in 1982 and served in numerous senior management positions, including President and Chief Operating Officer of FMR LLC (1997-2000) and President of Fidelity Strategic Investments (2000-2002). In addition, he serves as a member of the Board of Directors of Geerlings & Wade, Inc. (wine distribution). |
* Trustees have been determined to be "Interested Trustees" by virtue of, among other things, their affiliation with the trust or various entities under common control with FMR. FMR Corp. merged with and into FMR LLC on October 1, 2007. Any references to FMR LLC for prior periods are deemed to be references to the prior entity.
Independent Trustees:
Correspondence intended for each Independent Trustee (that is, the Trustees other than the Interested Trustees) may be sent to Fidelity Investments, P.O. Box 55235, Boston, Massachusetts 02205-5235.
Name, Age; Principal Occupation |
Dennis J. Dirks (59) |
| Year of Election or Appointment: 2005 Prior to his retirement in May 2003, Mr. Dirks was Chief Operating Officer and a member of the Board of The Depository Trust & Clearing Corporation (DTCC) (1999-2003). He also served as President, Chief Operating Officer, and Board member of The Depository Trust Company (DTC) (1999-2003) and President and Board member of the National Securities Clearing Corporation (NSCC) (1999-2003). In addition, Mr. Dirks served as Chief Executive Officer and Board member of the Government Securities Clearing Corporation (2001-2003) and Chief Executive Officer and Board member of the Mortgage-Backed Securities Clearing Corporation (2001-2003). Mr. Dirks also serves as a Trustee and a member of the Finance Committee of Manhattan College (2005-present) and a Trustee and a member of the Finance Committee of AHRC of Nassau County (2006-present). |
Albert R. Gamper, Jr. (65) |
| Year of Election or Appointment: 2006 Prior to his retirement in December 2004, Mr. Gamper served as Chairman of the Board of CIT Group Inc. (commercial finance). During his tenure with CIT Group Inc. Mr. Gamper served in numerous senior management positions, including Chairman (1987-1989; 1999-2001; 2002-2004), Chief Executive Officer (1987-2004), and President (1989-2002). He currently serves as a member of the Board of Directors of Public Service Enterprise Group (utilities, 2001-present), Chairman of the Board of Governors, Rutgers University (2004-present), and Chairman of the Board of Saint Barnabas Health Care System. |
George H. Heilmeier (71) |
| Year of Election or Appointment: 2004 Dr. Heilmeier is Chairman Emeritus of Telcordia Technologies (communication software and systems), where prior to his retirement, he served as company Chairman and Chief Executive Officer. He currently serves on the Boards of Directors of The Mitre Corporation (systems engineering and information technology support for the government), and HRL Laboratories (private research and development, 2004-present). He is Chairman of the General Motors Science & Technology Advisory Board and a Life Fellow of the Institute of Electrical and Electronics Engineers (IEEE). Dr. Heilmeier is a member of the Defense Science Board and the National Security Agency Advisory Board. He is also a member of the National Academy of Engineering, the American Academy of Arts and Sciences, and the Board of Overseers of the School of Engineering and Applied Science of the University of Pennsylvania. Previously, Dr. Heilmeier served as a Director of TRW Inc. (automotive, space, defense, and information technology, 1992-2002), Compaq (1994-2002), Automatic Data Processing, Inc. (ADP) (technology-based business outsourcing, 1995-2002), INET Technologies Inc. (telecommunications network surveillance, 2001-2004), and Teletech Holdings (customer management services). He is the recipient of the 2005 Kyoto Prize in Advanced Technology for his invention of the liquid crystal display, and a member of the Consumer Electronics Hall of Fame. |
James H. Keyes (67) |
| Year of Election or Appointment: 2007 Prior to his retirement in 2003, Mr. Keyes was Chairman, President, and Chief Executive Officer of Johnson Controls, Inc. (automotive supplier, 1993-2003). He currently serves as a member of the boards of LSI Logic Corporation (semiconductor technologies), Navistar International Corporation (manufacture and sale of trucks, buses, and diesel engines, 2002-present), and Pitney Bowes, Inc. (integrated mail, messaging, and document management solutions). |
Marie L. Knowles (61) |
| Year of Election or Appointment: 2001 Prior to Ms. Knowles' retirement in June 2000, she served as Executive Vice President and Chief Financial Officer of Atlantic Richfield Company (ARCO) (diversified energy, 1996-2000). From 1993 to 1996, she was a Senior Vice President of ARCO and President of ARCO Transportation Company. She served as a Director of ARCO from 1996 to 1998. She currently serves as a Director of Phelps Dodge Corporation (copper mining and manufacturing) and McKesson Corporation (healthcare service, 2002-present). Ms. Knowles is a Trustee of the Brookings Institution and the Catalina Island Conservancy and also serves as a member of the Advisory Board for the School of Engineering of the University of Southern California. |
Ned C. Lautenbach (63) |
| Year of Election or Appointment: 2000 Mr. Lautenbach is Chairman of the Independent Trustees (2006-present). Mr. Lautenbach has been a partner of Clayton, Dubilier & Rice, Inc. (private equity investment firm) since September 1998. Previously, Mr. Lautenbach was with the International Business Machines Corporation (IBM) from 1968 until his retirement in 1998. Mr. Lautenbach serves as a Director of Sony Corporation (2006-present) and Eaton Corporation (diversified industrial) as well as the Philharmonic Center for the Arts in Naples, Florida. He also is a member of the Board of Trustees of Fairfield University (2005-present), as well as a member of the Council on Foreign Relations. |
Cornelia M. Small (63) |
| Year of Election or Appointment: 2005 Ms. Small is a member (2000-present) and Chairperson (2002-present) of the Investment Committee, and a member (2002-
present) of the Board of Trustees of Smith College. Previously, she served as Chief Investment Officer (1999-2000), Director of Global Equity Investments (1996-1999), and a member of the Board of Directors of Scudder, Stevens & Clark (1990-1997) and Scudder Kemper Investments (1997-1999). In addition, Ms. Small served as Co-Chair (2000-2003) of the Annual Fund for the Fletcher School of Law and Diplomacy. |
William S. Stavropoulos (68) |
| Year of Election or Appointment: 2001 Mr. Stavropoulos is Chairman Emeritus of the Board of Directors of The Dow Chemical Company. Since joining The Dow Chemical Company in 1967, Mr. Stavropoulos served in numerous senior management positions, including President (1993-2000; 2002-2003), CEO (1995-2000; 2002-2004), and Chairman of the Executive Committee (2000-2004). Currently, he is a Director of NCR Corporation (data warehousing and technology solutions), Chemical Financial Corporation, Maersk Inc. (industrial conglomerate, 2002-present), Tyco International, Inc. (multinational manufacturing and services, 2007-present), and a member of the Advisory Board for Metalmark Capital (private equity investment firm, 2005-present). He is a special advisor to Clayton, Dubilier & Rice, Inc., a private equity investment firm. He also serves as a member of the Board of Trustees of the American Enterprise Institute for Public Policy Research. In addition, Mr. Stavropoulos is a member of The Business Council, J.P. Morgan International Council and the University of Notre Dame Advisory Council for the College of Science. |
Kenneth L. Wolfe (68) |
| Year of Election or Appointment: 2005 Mr. Wolfe is Chairman and a Director of Hershey Foods Corporation (2007-present), where prior to his retirement in 2001, he was Chairman and Chief Executive Officer. Mr. Wolfe currently serves as a member of the board of Revlon Inc. (2004-present). Previously, Mr. Wolfe served as a member of the boards of Adelphia Communications Corporation (2003-2006) and Bausch & Lomb, Inc. (1993-2007). |
Advisory Board Members and Executive Officers**:
Correspondence intended for Mr. Mauriello, Mr. Thomas, Mr. Wiley, Mr. Lacy, and Mr. Arthur Johnson may be sent to Fidelity Investments, P.O. Box 55235, Boston, Massachusetts 02205-5235. Correspondence intended for each executive officer and Mr. Lynch may be sent to Fidelity Investments, 82 Devonshire Street, Boston, Massachusetts 02109.
Name, Age; Principal Occupation |
Arthur E. Johnson (60) |
| Year of Election or Appointment: 2008 Member of the Advisory Board of Variable Insurance Products Fund IV. Mr. Johnson serves as Senior Vice President of Corporate Strategic Development of Lockheed Martin Corporation (defense contractor). In addition, Mr. Johnson serves as a member of the Board of Directors of AGL Resources, Inc. (holding company, 2002-present), and IKON Office Solutions, Inc. (document management systems and services). Mr. Arthur E. Johnson and Mr. Edward C. Johnson 3d are not related. |
Alan J. Lacy (54) |
| Year of Election or Appointment: 2008 Member of the Advisory Board of Variable Insurance Products Fund IV. Mr. Lacy serves as Senior Adviser (2007-present) of Oak Hill Capital Partners, L.P. (a private equity firm). Mr. Lacy also served as Vice Chairman and Chief Executive Officer of Sears Holdings Corporation and Sears, Roebuck and Co. (retail, 2005-2006; 2000-2005). In addition, Mr. Lacy serves as a member of the Board of Directors of The Western Union Company (global money transfer, 2006-present) and Bristol-Myers Squibb (global pharmaceuticals, 2007-present). Mr. Lacy is a Trustee of the National Parks Conservation Association and The Field Museum of Natural History. |
Peter S. Lynch (63) |
| Year of Election or Appointment: 2003 Member of the Advisory Board of Variable Insurance Products Fund IV. Mr. Lynch is Vice Chairman and a Director of FMR, and Vice Chairman (2001-present) and a Director of FMR Co., Inc. Previously, Mr. Lynch served as a Trustee of the Fidelity funds (1990-2003). In addition, he serves as a Trustee of Boston College and as the Chairman of the Inner-City Scholarship Fund. |
Joseph Mauriello (63) |
| Year of Election or Appointment: 2007 Member of the Advisory Board of Variable Insurance Products Fund IV. Prior to his retirement in January 2006, Mr. Mauriello served in numerous senior management positions including Deputy Chairman and Chief Operating Officer (2004-2005), and Vice Chairman of Financial Services (2002-2004) of KPMG LLP US (professional services firm, 1965-2005). Mr. Mauriello currently serves as a member of the Board of Directors of XL Capital Ltd. (global insurance and re-insurance company, 2006-present) and of Arcadia Resources Inc. (health care services and products, 2007-present). He also served as a Director of the Hamilton Funds of the Bank of New York (2006-2007). |
David M. Thomas (58) |
| Year of Election or Appointment: 2007 Member of the Advisory Board of Variable Insurance Products Fund IV. Previously, Mr. Thomas served as Executive Chairman (2005-2006) and Chairman and Chief Executive Officer (2000-2005) of IMS Health, Inc. (pharmaceutical and healthcare information solutions). In addition, Mr. Thomas serves as a member of the Board of Directors of Fortune Brands, Inc. (consumer products holding company), and Interpublic Group of Companies, Inc. (marketing communication, 2004-present). |
Michael E. Wiley (57) |
| Year of Election or Appointment: 2007 Member of the Advisory Board of Variable Insurance Products Fund IV. Mr. Wiley also serves as a member of the Board of Trustees of the University of Tulsa (2000-2006; 2007-present). He serves as a Director of Tesoro Corporation (independent oil refiner and marketer, 2005-present), and a Director of Bill Barrett Corporation (exploration and production company, 2005-present). In addition, he also serves as a Director of Post Oak Bank (privately-held bank, 2004-present). Previously, Mr. Wiley served as a Sr. Energy Advisor of Katzenbach Partners, LLC (consulting firm, 2006-2007), as an Advisory Director of Riverstone Holdings (private investment firm), Chairman, President, and CEO of Baker Hughes, Inc. (oilfield services company, 2000-2004), and as Director of Spinnaker Exploration Company (exploration and production company, 2001-2005). |
Kimberley H. Monasterio (44) |
| Year of Election or Appointment: 2007 President and Treasurer of VIP Energy. Ms. Monasterio also serves as President and Treasurer of other Fidelity funds (2007-present) and is an employee of FMR (2004-present). Previously, Ms. Monasterio served as Deputy Treasurer of the Fidelity funds (2004-2006). Before joining Fidelity Investments, Ms. Monasterio served as Treasurer (2000-2004) and Chief Financial Officer (2002-2004) of the Franklin Templeton Funds and Senior Vice President of Franklin Templeton Services, LLC (2000-2004). |
Brian B. Hogan (43) |
| Year of Election or Appointment: 2007 Vice President of VIP Energy. Mr. Hogan also serves as Vice President of Sector Funds (2007-present). Mr. Hogan is Senior Vice President of Equity Research (2006-present). Mr. Hogan also serves as Vice President of FMR and FMR Co., Inc. Previously, Mr. Hogan served as a portfolio manager. |
Eric D. Roiter (59) |
| Year of Election or Appointment: 2001 Secretary of VIP Energy. He also serves as Secretary of other Fidelity funds; Vice President, General Counsel, and Secretary of FMR Co., Inc. (2001-present) and FMR; Assistant Secretary of Fidelity Management & Research (U.K.) Inc. (2001-present), Fidelity Research & Analysis Company (2001-present), and Fidelity Investments Money Management, Inc. (2001-present). Mr. Roiter is an Adjunct Member, Faculty of Law, at Boston College Law School (2003-present). Previously, Mr. Roiter served as Vice President and Secretary of Fidelity Distributors Corporation (FDC) (1998-2005). |
John B. McGinty, Jr. (45) |
| Year of Election or Appointment: 2008 Assistant Secretary of VIP Energy. Mr. McGinty also serves as Assistant Secretary of other Fidelity funds (2008-present), and is an employee of FMR LLC (2004-present). Mr. McGinty also serves as Senior Vice President, Secretary, and Chief Legal Officer of FDC (2007-present). Before joining Fidelity Investments, Mr. McGinty practiced law at Ropes & Gray, LLP. |
R. Stephen Ganis (41) |
| Year of Election or Appointment: 2006 Anti-Money Laundering (AML) officer of VIP Energy. Mr. Ganis also serves as AML officer of other Fidelity funds (2006-present) and FMR LLC (2003-present). Before joining Fidelity Investments, Mr. Ganis practiced law at Goodwin Procter, LLP (2000-2002). |
Joseph B. Hollis (59) |
| Year of Election or Appointment: 2006 Chief Financial Officer of VIP Energy. Mr. Hollis also serves as Chief Financial Officer of other Fidelity funds. Mr. Hollis is President of Fidelity Pricing and Cash Management Services (FPCMS) (2005-present). Mr. Hollis also serves as President and Director of Fidelity Service Company, Inc. (2006-present). Previously, Mr. Hollis served as Senior Vice President of Cash Management Services (1999-2002) and Investment Management Operations (2002-2005). |
Kenneth A. Rathgeber (60) |
| Year of Election or Appointment: 2004 Chief Compliance Officer of VIP Energy. Mr. Rathgeber also serves as Chief Compliance Officer of other Fidelity funds (2004-present) and Executive Vice President of Risk Oversight for Fidelity Investments (2002-present). He is Chief Compliance Officer of FMR (2005-present), FMR Co., Inc. (2005-present), Fidelity Management & Research (U.K.) Inc. (2005-present), Fidelity Research & Analysis Company (2005-present), Fidelity Investments Money Management, Inc. (2005-present), and Strategic Advisers, Inc. (2005-present). Previously, Mr. Rathgeber served as Executive Vice President and Chief Operating Officer for Fidelity Investments Institutional Services Company, Inc. (1998-2002). |
Bryan A. Mehrmann (46) |
| Year of Election or Appointment: 2005 Deputy Treasurer of VIP Energy. Mr. Mehrmann also serves as Deputy Treasurer of other Fidelity funds (2005-present) and is an employee of FMR. Previously, Mr. Mehrmann served as Vice President of Fidelity Investments Institutional Services Group (FIIS)/Fidelity Investments Institutional Operations Corporation, Inc. (FIIOC) Client Services (1998-2004). |
Kenneth B. Robins (38) |
| Year of Election or Appointment: 2005 Deputy Treasurer of VIP Energy. Mr. Robins also serves as Deputy Treasurer of other Fidelity funds (2005-present) and is an employee of FMR (2004-present). Before joining Fidelity Investments, Mr. Robins worked at KPMG LLP, where he was a partner in KPMG's department of professional practice (2002-2004) and a Senior Manager (1999-2000). In addition, Mr. Robins served as Assistant Chief Accountant, United States Securities and Exchange Commission (2000-2002). |
Robert G. Byrnes (41) |
| Year of Election or Appointment: 2005 Assistant Treasurer of VIP Energy. Mr. Byrnes also serves as Assistant Treasurer of other Fidelity funds (2005-present) and is an employee of FMR (2005-present). Previously, Mr. Byrnes served as Vice President of FPCMS (2003-2005). Before joining Fidelity Investments, Mr. Byrnes worked at Deutsche Asset Management where he served as Vice President of the Investment Operations Group (2000-2003). |
Peter L. Lydecker (53) |
| Year of Election or Appointment: 2004 Assistant Treasurer of VIP Energy. Mr. Lydecker also serves as Assistant Treasurer of other Fidelity funds (2004) and is an employee of FMR. |
Paul M. Murphy (60) |
| Year of Election or Appointment: 2007 Assistant Treasurer of VIP Energy. Mr. Murphy also serves as Assistant Treasurer of other Fidelity funds (2007-present) and is an employee of FMR (2007-present). Previously, Mr. Murphy served as Chief Financial Officer of the Fidelity Funds (2005-2006), Vice President and Associate General Counsel of FMR (2007), and Senior Vice President of Fidelity Pricing and Cash Management Services Group (FPCMS) (1994-2007). |
Gary W. Ryan (49) |
| Year of Election or Appointment: 2005 Assistant Treasurer of VIP Energy. Mr. Ryan also serves as Assistant Treasurer of other Fidelity funds (2005-present) and is an employee of FMR (2005-present). Previously, Mr. Ryan served as Vice President of Fund Reporting in FPCMS (1999-2005). |
** FMR Corp. merged with and into FMR LLC on October 1, 2007. Any references to FMR LLC for prior periods are deemed to be references to the prior entity.
Annual Report
Distributions
The Board of Trustees of VIP Energy Portfolio voted to pay to shareholders of record at the opening of business on record date, the following distributions per share derived from capital gains realized from sales of portfolio securities:
| Pay Date | Record Date | Capital Gains |
Service Class 2 | 02/08/08 | 02/08/08 | $0.33 |
The fund hereby designates as a capital gain dividend with respect to the taxable year ended December 31, 2007, $27,668,400, or, if subsequently determined to be different, the net capital gain of such year.
A percentage of the dividends distributed during the fiscal year for the following classes qualifies for the dividends-received deduction for corporate shareholders:
| February | December |
Service Class 2 | 20% | 89% |
The fund will notify shareholders in January 2008 of amounts for use in preparing 2007 income tax returns.
Annual Report
Board Approval of Investment Advisory Contracts and Management Fees
VIP Energy Portfolio
Each year, typically in July, the Board of Trustees, including the Independent Trustees (together, the Board), votes on the renewal of the management contract and sub-advisory agreements (together, the Advisory Contracts) for the fund. The Board, assisted by the advice of fund counsel and Independent Trustees' counsel, requests and considers a broad range of information throughout the year.
The Board meets regularly each month except August and takes into account throughout the year matters bearing on Advisory Contracts. The Board, acting directly and through its separate committees, considers at each of its meetings factors that are relevant to the annual renewal of the fund's Advisory Contracts, including the services and support provided to the fund and its shareholders. At the time of the renewal, the Board had 12 standing committees, each composed of Independent Trustees with varying backgrounds, to which the Board has assigned specific subject matter responsibilities in order to enhance effective decision-making by the Board. Each committee has adopted a written charter outlining the structure and purposes of the committee. One such committee, the Equity Contract Committee, meets periodically as needed throughout the year to consider matters specifically related to the annual renewal of Advisory Contracts. The committee requests and receives information on, and makes recommendations to the Independent Trustees concerning, the approval and annual review of the Advisory Contracts.
At its July 2007 meeting, the Board of Trustees, including the Independent Trustees, unanimously determined to renew the Advisory Contracts for the fund. In reaching its determination, the Board considered all factors it believed relevant, including (i) the nature, extent, and quality of the services to be provided to the fund and its shareholders (including the investment performance of the fund); (ii) the competitiveness of the management fee and total expenses of the fund; (iii) the total costs of the services to be provided by and the profits to be realized by the investment adviser and its affiliates from the relationship with the fund; (iv) the extent to which economies of scale would be realized as the fund grows; and (v) whether fee levels reflect these economies of scale, if any, for the benefit of fund shareholders. The Board also approved amendments to the fund's agreements with foreign sub-advisers to clarify that each sub-adviser provides services as an independent contractor.
In determining whether to renew the Advisory Contracts for the fund, the Board ultimately reached a determination, with the assistance of fund counsel and Independent Trustees' counsel, that the renewal of the Advisory Contracts and the compensation to be received by Fidelity under the management contract is consistent with Fidelity's fiduciary duty under applicable law. In addition to evaluating the specific factors noted above, the Board, in reaching its determination, is aware that shareholders in the fund have a broad range of investment choices available to them, including a wide choice among mutual funds offered by competitors to Fidelity, and that the fund's shareholders, with the opportunity to review and weigh the disclosure provided by the fund in its prospectus and other public disclosures, have chosen to invest in this fund, managed by Fidelity.
Nature, Extent, and Quality of Services Provided. The Board considered staffing within the investment adviser, FMR, and the sub-advisers (together, the Investment Advisers), including the background of the fund's portfolio manager and the fund's investment objective and discipline. The Independent Trustees also had discussions with senior management of Fidelity's investment operations and investment groups. The Board considered the structure of the portfolio manager compensation program and whether this structure provides appropriate incentives.
Resources Dedicated to Investment Management and Support Services. The Board reviewed the size, education, and experience of the Investment Advisers' investment staff, their use of technology, and the Investment Advisers' approach to recruiting, training, and retaining portfolio managers and other research, advisory, and management personnel. The Board considered Fidelity's extensive global research capabilities that enable the Investment Advisers to aggregate data from various sources in an effort to produce positive investment results. The Board noted that Fidelity's analysts have access to a variety of technological tools that enable them to perform both fundamental and quantitative analysis and to specialize in various disciplines. The Board also considered that Fidelity's portfolio managers and analysts have access to daily portfolio attribution that allows for monitoring of a fund's portfolio, as well as an electronic communication system that provides immediate real-time access to research concerning issuers and credit enhancers.
Shareholder and Administrative Services. The Board considered (i) the nature, extent, quality, and cost of advisory, administrative, distribution, and shareholder services performed by the Investment Advisers and their affiliates under the Advisory Contracts and under separate agreements covering transfer agency, pricing and bookkeeping, and securities lending services for the fund; (ii) the nature and extent of the Investment Advisers' supervision of third party service providers, principally custodians and subcustodians; and (iii) the resources devoted to, and the record of compliance with, the fund's compliance policies and procedures. The Board reviewed the allocation of fund brokerage, including allocations to brokers affiliated with the Investment Advisers, the use of brokerage commissions to pay fund expenses, and the use of "soft" commission dollars to pay for research services. The Board also considered that Fidelity voluntarily pays for market data out of its own resources. The Board also considered the agreement reached between the Independent Trustees and Fidelity in December 2006 following an independent review of matters relating to receipt of travel, entertainment, gifts and gratuities in violation of Fidelity policies.
The Board noted that the growth of fund assets across the complex allows Fidelity to reinvest in the development of services designed to enhance the value or convenience of the Fidelity funds as investment vehicles. These services include 24-hour access to account information and market information through phone representatives and over the Internet, and investor education materials and asset allocation tools.
Annual Report
Investment in a Large Fund Family. The Board considered the benefits to shareholders of investing in a Fidelity fund, including the benefits of investing in a fund that is part of a large family of funds offering a variety of investment disciplines and providing for a large variety of mutual fund investor services. The Board noted that, since the last Advisory Contract renewals in July 2006, Fidelity has taken a number of actions that benefited particular funds, including (i) dedicating additional resources to investment research and to restructure the investment research teams; (ii) contractually agreeing to reduce the management fee on Fidelity Advisor Floating Rate High Income Fund; (iii) contractually agreeing to reduce the management fees on Fidelity's California, Massachusetts, New Jersey, and New York AMT Tax-Free Money Market Funds, launching new Institutional Classes and Service Classes of these funds, and contractually agreeing to impose expense limitations on these funds; (iv) eliminating the exchange fee on the Fidelity Select Portfolios and reducing the pricing and bookkeeping fee rates for these funds; (v) reducing the maximum transfer agency fee rates on high income funds and certain equity funds; (vi) proposing amended management contracts that, if approved by shareholders, will add a performance adjustment component to the management fees paid by 18 Fidelity Advisor equity funds; (vii) contractually agreeing to reduce fees for Ultra-Short Central Fund and the money market Central Funds; (viii) waiving the Fidelity Advisor funds' contingent deferred sales charge on certain redemptions made through systematic withdrawal programs; and (ix) amending the management contracts for equity and fixed-income funds whose management contracts incorporate a "group fee" structure by adding four new fee "breakpoints" to the group fee rate schedules.
Investment Performance and Compliance. The Board considered whether the fund has operated within its investment objective, as well as its record of compliance with its investment restrictions. It also reviewed the fund's absolute investment performance for each class, as well as the fund's relative investment performance for each class measured against a third-party-sponsored index that reflects the market sector in which the fund invests over multiple periods. The Board noted that FMR does not believe that a meaningful peer group exists against which to compare the fund's performance. The Board also noted that in 2006 FMR implemented changes to the sector fund product line, which included a change to the fund's index. The following charts considered by the Board show, over the one-, three-, and five-year periods ended December 31, 2006, as available, the cumulative total returns of Initial Class and Service Class 2 of the fund and the cumulative total returns of a third-party-sponsored index ("benchmark"). The returns of Initial Class and Service Class 2 show the performance of the highest and lowest performing classes, respectively.
VIP Energy Portfolio
The Board stated that the relative investment performance of Initial Class of the fund compared favorably to its benchmark for the three- and five-year periods, although the fund's one-year cumulative total return was lower than its benchmark. The Board considered that the variations in performance among the fund's classes reflect the variations in class expenses, which result in lower performance for higher expense classes.
The Board considered that FMR has taken steps to refocus and strengthen equity research, equity portfolio management, and compliance.
Based on its review, and giving particular weight to the nature and quality of the resources dedicated by the Investment Advisers to maintain and improve relative performance, the Board concluded that the nature, extent, and quality of the services provided to the fund will benefit the fund's shareholders, particularly in light of the Board's view that the fund's shareholders benefit from investing in a fund that is part of a large family of funds offering a variety of investment disciplines and services.
Competitiveness of Management Fee and Total Fund Expenses. The Board considered the fund's management fee and total expenses compared to "mapped groups" of competitive funds and classes. Fidelity creates "mapped groups" by combining similar Lipper investment objective categories that have comparable management fee characteristics. Combining Lipper investment objective categories aids the Board's management fee and total expense comparisons by broadening the competitive group used for comparison and by reducing the number of universes to which various Fidelity funds are compared. The Board also considered supplemental information about how the fund's management fee and total expenses ranked relative to groups based on Lipper classifications, which take into account a fund's market capitalization and style.
Annual Report
Board Approval of Investment Advisory Contracts and Management Fees - continued
The Board considered two proprietary management fee comparisons for the 12-month periods shown in the chart below. The group of Lipper funds used by the Board for management fee comparisons is referred to below as the "Total Mapped Group." The Total Mapped Group comparison focuses on a fund's standing relative to the total universe of comparable funds available to investors, in terms of gross management fees before expense reimbursements or caps. "TMG %" represents the percentage of funds in the Total Mapped Group that had management fees that were lower than the fund's. For example, a TMG % of 9% means that 91% of the funds in the Total Mapped Group had higher management fees than the fund. The "Asset-Size Peer Group" (ASPG) comparison focuses on a fund's standing relative to non-Fidelity funds similar in size to the fund within the Total Mapped Group. The ASPG represents at least 15% of the funds in the Total Mapped Group with comparable asset size and management fee characteristics, subject to a minimum of 50 funds (or all funds in the Total Mapped Group if fewer than 50). Additional information, such as the ASPG quartile in which the fund's management fee ranked, is also included in the chart and considered by the Board.
VIP Energy Portfolio
The Board noted that the fund's management fee ranked below the median of its Total Mapped Group and below the median of its ASPG for 2006.
Based on its review, the Board concluded that the fund's management fee was fair and reasonable in light of the services that the fund receives and the other factors considered.
In its review of each class's total expenses, the Board considered the fund's management fee as well as other fund or class expenses, as applicable, such as transfer agent fees, pricing and bookkeeping fees, fund-paid 12b-1 fees, and custodial, legal, and audit fees. The Board also noted the effects of any waivers and reimbursements on fees and expenses. As part of its review, the Board also considered current and historical total expenses of each class of the fund compared to competitive fund median expenses. Each class of the fund is compared to those funds and classes in the Total Mapped Group (used by the Board for management fee comparisons) that have a similar sales load structure.
The Board noted that the total expenses of each class ranked below its competitive median for 2006.
In its review of total expenses, the Board also considered Fidelity fee structures and other information on clients that FMR and its affiliates service in other competitive markets, such as other mutual funds advised or subadvised by FMR or its affiliates, pension plan clients, and other institutional clients.
Based on its review, the Board concluded that the total expenses of each class of the fund were reasonable in light of the services that the fund and its shareholders receive and the other factors considered.
Costs of the Services and Profitability. The Board considered the revenues earned and the expenses incurred by Fidelity in conducting the business of developing, marketing, distributing, managing, administering and servicing the fund and its shareholders. The Board also considered the level of Fidelity's profits in respect of all the Fidelity funds.
Annual Report
On an annual basis, FMR presents to the Board Fidelity's profitability for the fund. Fidelity calculates the profitability for each fund, as well as aggregate profitability for groups of Fidelity funds and all Fidelity funds, using a series of detailed revenue and cost allocation methodologies which originate with the audited books and records of Fidelity. The Audit Committee of the Board reviews any significant changes from the prior year's methodologies.
PricewaterhouseCoopers LLP (PwC), independent registered public accounting firm and auditor to Fidelity and certain Fidelity funds, has been engaged annually by the Board as part of the Board's assessment of the results of Fidelity's profitability analysis. PwC's engagement includes the review and assessment of Fidelity's methodologies used in determining the revenues and expenses attributable to Fidelity's mutual fund business, and completion of agreed-upon procedures surrounding the mathematical accuracy of fund profitability and its conformity to allocation methodologies. After considering PwC's reports issued under the engagement and information provided by Fidelity, the Board believes that while other allocation methods may also be reasonable, Fidelity's profitability methodologies are reasonable in all material respects.
The Board has also reviewed Fidelity's non-fund businesses and any fall-out benefits related to the mutual fund business as well as cases where Fidelity's affiliates may benefit from or be related to the fund's business.
The Board considered the costs of the services provided by and the profits realized by Fidelity in connection with the operation of the fund and determined that the amount of profit is a fair entrepreneurial profit for the management of the fund.
Economies of Scale. The Board considered whether there have been economies of scale in respect of the management of the Fidelity funds, whether the Fidelity funds (including the fund) have appropriately benefited from any such economies of scale, and whether there is potential for realization of any further economies of scale. The Board considered the extent to which the fund will benefit from economies of scale through increased services to the fund, through waivers or reimbursements, or through fee or expense reductions.
The Board recognized that the fund's management contract incorporates a "group fee" structure, which provides for lower group fee rates as total fund assets under FMR's management increase, and for higher group fee rates as total fund assets under FMR's management decrease. FMR determines the group fee rates based on a tiered asset "breakpoint" schedule. In connection with the renewal of the fund's management contract, the Board approved amendments to the fund's management contract that added four new fee breakpoints to the group fee rate schedule for assets under FMR's management above $1,386 billion. The Board considered that the group fee rate declines under both the present and amended schedules, but that under the amended schedule, the group fee rate declines faster as assets under FMR's management exceed $1,386 billion. The Board considered that the group fee is designed to deliver the benefits of economies of scale to fund shareholders when total fund assets increase, even if assets of any particular fund are unchanged or have declined, because some portion of Fidelity's costs are attributable to services provided to all Fidelity funds, and all funds benefit if those costs can be allocated among more assets. The Board concluded that, given the group fee structure, fund shareholders will achieve a certain level of economies of scale as assets under FMR's management increase at the fund complex level, regardless of whether Fidelity achieves any such economies of scale.
The Board further concluded that any potential economies of scale are being shared between fund shareholders and Fidelity in an appropriate manner.
Additional Information Requested by the Board. In order to develop fully the factual basis for consideration of the Fidelity funds' Advisory Contracts, the Board requested and received additional information on several topics, including (i) fund performance trends and actions to be taken by FMR to improve certain funds' overall performance; (ii) Fidelity's portfolio manager compensation structure, including its effects on fund profitability and the extent to which portfolio manager compensation is linked to fund performance; (iii) Fidelity's fee structures; (iv) the funds' sub-advisory arrangements; and (v) accounts managed by Fidelity other than the Fidelity funds.
Based on its evaluation of all of the conclusions noted above, and after considering all material factors, the Board ultimately concluded that the advisory fee structures are fair and reasonable, and that the fund's Advisory Contracts should be renewed.
Annual Report
Investment Adviser
Fidelity Management & Research Company
Boston, MA
Investment Sub-Advisers
FMR Co., Inc.
Fidelity Management & Research (U.K.) Inc.
Fidelity Research & Analysis Company
Fidelity Investments Japan Limited
Fidelity International Investment Advisors
Fidelity International Investment Advisors
(U.K.) Limited
General Distributor
Fidelity Distributors Corporation
Boston, MA
Transfer and Service Agent
Fidelity Investments Institutional Operations Company, Inc.
Boston, MA
Fidelity Service Company, Inc.
Boston, MA
Custodian
State Street Bank & Trust Co.
Quincy, MA
VNR2-ANN-0208
1.826359.103
Fidelity® Variable Insurance Products:
Financial Services Portfolio
Annual Report
December 31, 2007
(2_fidelity_logos) (Registered_Trademark)
Contents
Performance | <Click Here> | How the fund has done over time. |
Management's Discussion | <Click Here> | The manager's review of fund performance, strategy and outlook. |
Shareholder Expense Example | <Click Here> | An example of shareholder expenses. |
Investment Changes | <Click Here> | A summary of major shifts in the fund's investments over the past six months. |
Investments | <Click Here> | A complete list of the fund's investments with their
market values. |
Financial Statements | <Click Here> | Statements of assets and liabilities, operations, and
changes in net assets, as well as financial highlights. |
Notes | <Click Here> | Notes to the financial statements. |
Report of Independent Registered Public Accounting Firm | <Click Here> | |
Trustees and Officers | <Click Here> | |
Distributions | <Click Here> | |
Board Approval of Investment Advisory Contracts and Management Fees | <Click Here> | |
To view a fund's proxy voting guidelines and proxy voting record for the 12-month period ended June 30, visit http://www.fidelity.com (search for "proxy voting guidelines") or visit the Securities and Exchange Commission's (SEC) web site at http://www.sec.gov. You may also call 1-877-208-0098 to request a free copy of the proxy voting guidelines.
Fidelity Variable Insurance Products are separate account options which are purchased through a variable insurance contract.
Standard & Poor's, S&P and S&P 500 are registered service marks of The McGraw-Hill Companies, Inc. and have been licensed for use by Fidelity Distributors Corporation.
Other third party marks appearing herein are the property of their respective owners.
All other marks appearing herein are registered or unregistered trademarks or service marks of FMR LLC or an affiliated company.
This report and the financial statements contained herein are submitted for the general information of the shareholders of the fund. This report is not authorized for distribution to prospective investors in the fund unless preceded or accompanied by an effective prospectus.
A fund files its complete schedule of portfolio holdings with the SEC for the first and third quarters of each fiscal year on Form N-Q. Forms N-Q are available on the SEC's web site at http://www.sec.gov. A fund's Forms N-Q may be reviewed and copied at the SEC's Public Reference Room in Washington, DC. Information regarding the operation of the SEC's Public Reference Room may be obtained by calling 1-800-SEC-0330. For a complete list of the fund's portfolio holdings, view the most recent holdings listing, semiannual report, or annual report on Fidelity's web site at http://www.fidelity.com or http://www.advisor.fidelity.com, as applicable.
NOT FDIC INSURED · MAY LOSE VALUE · NO BANK GUARANTEE
Neither the fund nor Fidelity Distributors Corporation is a bank.
Annual Report
Performance: The Bottom Line
Average annual total return reflects the change in the value of an investment, assuming reinvestment of the class' dividend income and capital gains (the profits earned upon the sale of securities that have grown in value, if any) and assuming a constant rate of performance each year. During periods of reimbursement by Fidelity, a fund's total return will be greater than it would be had the reimbursement not occurred. Performance numbers are net of all underlying fund operating expenses, but do not include any insurance charges imposed by your insurance company's separate account. If performance information included the effect of these additional charges, the total returns would have been lower. How a fund did yesterday is no guarantee of how it will do tomorrow.
Average Annual Total Returns
Periods ended December 31, 2007 | Past 1
year | Past 5
years | Life of fund A |
VIP Financial Services - Initial Class | -13.43% | 9.61% | 4.81% |
VIP Financial Services - Investor Class B | -13.60% | 9.54% | 4.75% |
A From July 18, 2001.
B The initial offering of Investor Class shares took place on July 21, 2005. Returns prior to July 21, 2005 are those of Initial Class. If Investor Class's transfer agent fee had been reflected, returns prior to July 21, 2005 would have been lower.
$10,000 Over Life of Fund
Let's say hypothetically that $10,000 was invested in VIP Financial Services Portfolio - Initial Class on July 18, 2001, when the fund started. The chart shows how the value of your investment would have changed, and also shows how the Standard & Poor's 500SM Index (S&P 500®) performed over the same period.
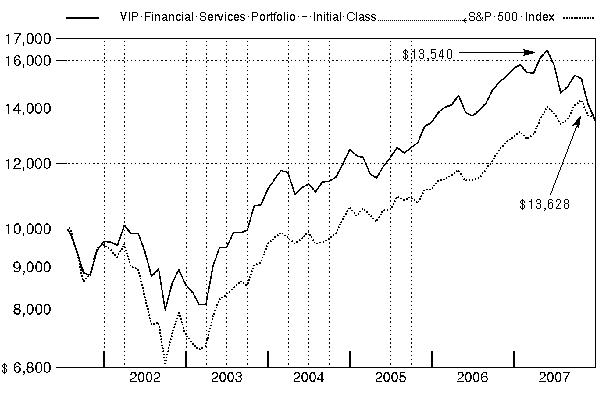
Annual Report
Management's Discussion of Fund Performance
Comments from Richard Manuel, who will become sole Portfolio Manager of VIP Financial Services Portfolio on January 11, 2008.
U.S. equity markets, as measured by the bellwether Dow Jones Industrial AverageSM and the Standard & Poor's 500SM Index, registered their fifth consecutive year of positive returns in 2007, as the Dow rose 8.88% and the S&P 500® index advanced 5.49%. The tech-heavy NASDAQ Composite® Index did even better, increasing 10.55%. However, credit- and recession-related concerns carved deeply into stock prices late in 2007, pushing some major market measures into negative territory for the year overall, particularly smaller-cap and value-oriented benchmarks. Based largely on a weak U.S. dollar that boosted returns for U.S. investors, the Morgan Stanley Capital InternationalSM Europe, Australasia, and Far East (MSCI® EAFE®) Index - a gauge of developed stock markets outside the United States and Canada - beat most domestic equity measures, gaining 11.33%. Several European countries had outstanding performance, including Finland and Germany, while Australia also did very well. However, fallout from the credit crunch and concerns about export growth tempered U.K. stocks, while fears that Japanese financial companies would become embroiled in the U.S. subprime mortgage crisis contributed to a loss of more than 4% for the Japanese portion of the index. The emerging-markets stock asset class soared 39.78% according to the MSCI Emerging Markets index. The U.S. investment-grade bond market climbed 6.97% as measured by the Lehman Brothers® U.S. Aggregate Index, beating the 2.53% gain for the Merrill Lynch® U.S. High Yield Master II Constrained Index. The emerging-markets bond category shook off a sluggish first half of 2007 to finish the year with a respectable gain of 6.28% as measured by the J.P. Morgan Emerging Markets Bond Index (EMBI) Global, while the Citigroup® Non-U.S. Group of 7 Index - representing the debt performance of major global economies, excluding the United States - rose 13.05%.
For the year ending December 31, 2007, the fund beat the -17.34% return of the Morgan Stanley Capital InternationalSM (MSCI®) US Investable Market Financials Index, but lagged the S&P 500 index. (For specific portfolio performance results, please refer to the performance section of this report.) Growing defaults and delinquencies in the subprime mortgage market triggered credit and liquidity concerns that severely pressured the sector. Good stock selection and positive industry positioning helped the fund hold up better than the MSCI index, with the biggest gains coming from an overweighting in reinsurance stocks. Thrifts and mortgage finance companies, which also were an overweighting, detracted from returns. The fund was helped by Platinum Underwriters and Endurance Specialty, reinsurers that benefited from better-than-expected industry pricing and a mild hurricane season. An underweighting in Citigroup, the world's largest financial company, further aided relative returns, as subprime mortgage exposure sank the stock. Among the biggest detractors were stocks hit hard by the subprime meltdown, including Countrywide Financial, a leading mortgage originator; MBIA, a bond insurer; and Radian, a mortgage and bond insurer. I sold the fund's stake in Radian before the period end.
The views expressed above reflect those of the portfolio manager(s) only through the end of the period as stated on the cover of this report and do not necessarily represent the views of Fidelity or any other person in the Fidelity organization. Any such views are subject to change at any time based upon market or other conditions and Fidelity disclaims any responsibility to update such views. These views may not be relied on as investment advice and, because investment decisions for a Fidelity fund are based on numerous factors, may not be relied on as an indication of trading intent on behalf of any Fidelity fund.
Annual Report
Shareholder Expense Example
As a shareholder of the Fund, you incur two types of costs: (1) transaction costs, including redemption fees, and (2) ongoing costs, including management fees and other Fund expenses. This Example is intended to help you understand your ongoing costs (in dollars) of investing in the Fund and to compare these costs with the ongoing costs of investing in other mutual funds.
The Example is based on an investment of $1,000 invested at the beginning of the period and held for the entire period (July 1, 2007 to December 31, 2007).
Actual Expenses
The first line of the accompanying table for each class of the Fund provides information about actual account values and actual expenses. You may use the information in this line, together with the amount you invested, to estimate the expenses that you paid over the period. Simply divide your account value by $1,000.00 (for example, an $8,600 account value divided by $1,000.00 = 8.6), then multiply the result by the number in the first line for a class of the Fund under the heading entitled "Expenses Paid During Period" to estimate the expenses you paid on your account during this period. The estimate of expenses does not include any fees or other expenses of any variable annuity or variable life insurance product. If they were, the estimate of expenses you paid during the period would be higher, and your ending account value would be lower. In addition, the Fund, as a shareholder in the underlying Fidelity Central Funds, will indirectly bear its pro rata share of the fees and expenses incurred by the underlying Fidelity Central Funds. These fees and expenses are not included in the Fund's annualized expense ratio used to calculate the expense estimate in the table below.
Hypothetical Example for Comparison Purposes
The second line of the accompanying table for each class of the Fund provides information about hypothetical account values and hypothetical expenses based on a Class' actual expense ratio and an assumed rate of return of 5% per year before expenses, which is not the Class' actual return. The hypothetical account values and expenses may not be used to estimate the actual ending account balance or expenses you paid for the period. You may use this information to compare the ongoing costs of investing in the Fund and other funds. To do so, compare this 5% hypothetical example with the 5% hypothetical examples that appear in the shareholder reports of the other funds. The estimate of expenses does not include any fees or other expenses of any variable annuity or variable life insurance product. If they were, the estimate of expenses you paid during the period would be higher, and your ending account value would be lower. In addition, the Fund, as a shareholder in the underlying Fidelity Central Funds, will indirectly bear its pro rata share of the fees and expenses incurred by the underlying Fidelity Central Funds. These fees and expenses are not included in the Fund's annualized expense ratio used to calculate the expense estimate in the table below.
Please note that the expenses shown in the table are meant to highlight your ongoing costs only and do not reflect any transaction costs. Therefore, the second line of the table is useful in comparing ongoing costs only, and will not help you determine the relative total costs of owning different funds. In addition, if these transactional costs were included, your costs would have been higher.
| Beginning
Account Value
July 1, 2007 | Ending
Account Value
December 31, 2007 | Expenses Paid
During Period*
July 1, 2007 to
December 31, 2007 |
Initial Class | | | |
Actual | $ 1,000.00 | $ 857.30 | $ 4.49 |
Hypothetical A | $ 1,000.00 | $ 1,020.37 | $ 4.89 |
Investor Class | | | |
Actual | $ 1,000.00 | $ 856.60 | $ 5.01 |
Hypothetical A | $ 1,000.00 | $ 1,019.81 | $ 5.45 |
A 5% return per year before expenses
* Expenses are equal to each Class' annualized expense ratio (shown in the table below); multiplied by the average account value over the period, multiplied by 184/365 (to reflect the one-half year period).
| Annualized
Expense Ratio |
Initial Class | .96% |
Investor Class | 1.07% |
Annual Report
Investment Changes
Top Ten Stocks as of December 31, 2007 |
| % of fund's
net assets | % of fund's net assets
6 months ago |
American International Group, Inc. | 6.5 | 7.0 |
JPMorgan Chase & Co. | 5.3 | 5.5 |
Wells Fargo & Co. | 4.9 | 5.2 |
Citigroup, Inc. | 4.7 | 5.4 |
Bank of America Corp. | 4.7 | 5.4 |
ACE Ltd. | 3.0 | 2.7 |
State Street Corp. | 3.0 | 1.4 |
Platinum Underwriters Holdings Ltd. | 2.7 | 3.4 |
MetLife, Inc. | 2.7 | 2.4 |
Endurance Specialty Holdings Ltd. | 2.2 | 3.2 |
| 39.7 | |
Top Industries (% of fund's net assets) |
As of December 31, 2007 |
 | Insurance | 32.5% | |
 | Capital Markets | 18.6% | |
 | Diversified Financial Services | 18.1% | |
 | Commercial Banks | 10.9% | |
 | Real Estate Investment Trusts | 4.9% | |
 | All Others* | 15.0% | |

|
As of June 30, 2007 |
| Insurance | 31.5% | |
| Diversified Financial Services | 18.4% | |
| Capital Markets | 16.7% | |
| Commercial Banks | 15.2% | |
| Thrifts & Mortgage Finance | 9.5% | |
| All Others* | 8.7% | |

* Includes short-term investments and net other assets. |
Annual Report
Investments December 31, 2007
Showing Percentage of Net Assets
Common Stocks - 94.6% |
| Shares | | Value |
CAPITAL MARKETS - 18.6% |
Asset Management & Custody Banks - 10.3% |
Bank of New York Mellon Corp. | 11,000 | | $ 536,360 |
EFG International | 5,770 | | 231,655 |
Fortress Investment Group LLC (d) | 5,600 | | 87,248 |
Franklin Resources, Inc. | 4,900 | | 560,707 |
GLG Partners, Inc. (a) | 7,500 | | 102,000 |
Janus Capital Group, Inc. | 9,800 | | 321,930 |
Julius Baer Holding AG | 2,287 | | 188,885 |
KKR Private Equity Investors, LP | 2,800 | | 50,120 |
KKR Private Equity Investors, LP Restricted Depositary Units (e) | 4,300 | | 76,970 |
Legg Mason, Inc. | 1,200 | | 87,780 |
State Street Corp. | 12,767 | | 1,036,680 |
T. Rowe Price Group, Inc. | 2,200 | | 133,936 |
The Blackstone Group LP | 5,300 | | 117,289 |
| | 3,531,560 |
Diversified Capital Markets - 0.6% |
UBS AG (NY Shares) | 4,300 | | 197,800 |
Investment Banking & Brokerage - 7.7% |
Bear Stearns Companies, Inc. | 3,500 | | 308,875 |
Charles Schwab Corp. | 18,900 | | 482,895 |
Goldman Sachs Group, Inc. | 2,300 | | 494,615 |
Lazard Ltd. Class A | 2,500 | | 101,700 |
Lehman Brothers Holdings, Inc. | 8,800 | | 575,872 |
Merrill Lynch & Co., Inc. | 5,700 | | 305,976 |
MF Global Ltd. | 2,400 | | 75,528 |
Morgan Stanley | 5,010 | | 266,081 |
| | 2,611,542 |
TOTAL CAPITAL MARKETS | | 6,340,902 |
COMMERCIAL BANKS - 10.9% |
Diversified Banks - 8.2% |
ICICI Bank Ltd. sponsored ADR | 1,300 | | 79,950 |
U.S. Bancorp, Delaware | 14,100 | | 447,534 |
Wachovia Corp. | 16,097 | | 612,169 |
Wells Fargo & Co. | 54,700 | | 1,651,393 |
| | 2,791,046 |
Regional Banks - 2.7% |
Cathay General Bancorp | 4,698 | | 124,450 |
Center Financial Corp., California | 6,800 | | 83,776 |
Colonial Bancgroup, Inc. | 2,050 | | 27,757 |
Nara Bancorp, Inc. | 4,300 | | 50,181 |
PNC Financial Services Group, Inc. | 9,600 | | 630,240 |
Wintrust Financial Corp. | 400 | | 13,252 |
| | 929,656 |
TOTAL COMMERCIAL BANKS | | 3,720,702 |
CONSUMER FINANCE - 3.9% |
Consumer Finance - 3.9% |
American Express Co. | 13,940 | | 725,159 |
|
| Shares | | Value |
Capital One Financial Corp. (d) | 5,100 | | $ 241,026 |
Discover Financial Services | 13,555 | | 204,409 |
Dollar Financial Corp. (a) | 5,510 | | 169,102 |
| | 1,339,696 |
DIVERSIFIED FINANCIAL SERVICES - 18.1% |
Other Diversifed Financial Services - 14.7% |
Bank of America Corp. | 38,549 | | 1,590,532 |
Citigroup, Inc. | 54,430 | | 1,602,419 |
JPMorgan Chase & Co. | 41,638 | | 1,817,499 |
| | 5,010,450 |
Specialized Finance - 3.4% |
CME Group, Inc. | 887 | | 608,482 |
Deutsche Boerse AG | 1,900 | | 376,416 |
JSE Ltd. | 3,400 | | 43,114 |
MarketAxess Holdings, Inc. (a) | 10,100 | | 129,583 |
| | 1,157,595 |
TOTAL DIVERSIFIED FINANCIAL SERVICES | | 6,168,045 |
INSURANCE - 32.5% |
Insurance Brokers - 1.0% |
National Financial Partners Corp. | 5,400 | | 246,294 |
Willis Group Holdings Ltd. | 2,300 | | 87,331 |
| | 333,625 |
Life & Health Insurance - 7.6% |
AFLAC, Inc. | 8,400 | | 526,092 |
MetLife, Inc. | 14,910 | | 918,754 |
Principal Financial Group, Inc. | 7,200 | | 495,648 |
Prudential Financial, Inc. | 6,900 | | 641,976 |
| | 2,582,470 |
Multi-Line Insurance - 8.5% |
American International Group, Inc. | 38,310 | | 2,233,473 |
Assurant, Inc. | 3,000 | | 200,700 |
Hartford Financial Services Group, Inc. | 5,560 | | 484,776 |
| | 2,918,949 |
Property & Casualty Insurance - 8.2% |
ACE Ltd. | 16,850 | | 1,040,993 |
AMBAC Financial Group, Inc. | 2,100 | | 54,117 |
Argo Group International Holdings, Ltd. (a) | 4,344 | | 183,013 |
Aspen Insurance Holdings Ltd. | 11,600 | | 334,544 |
Axis Capital Holdings Ltd. | 11,300 | | 440,361 |
MBIA, Inc. | 8,660 | | 161,336 |
The Travelers Companies, Inc. | 5,300 | | 285,140 |
United America Indemnity Ltd. Class A (a) | 8,200 | | 163,344 |
XL Capital Ltd. Class A | 2,600 | | 130,806 |
| | 2,793,654 |
Reinsurance - 7.2% |
Endurance Specialty Holdings Ltd. | 18,160 | | 757,817 |
Everest Re Group Ltd. | 1,000 | | 100,400 |
Common Stocks - continued |
| Shares | | Value |
INSURANCE - CONTINUED |
Reinsurance - continued |
IPC Holdings Ltd. | 5,700 | | $ 164,559 |
Max Capital Group Ltd. | 7,599 | | 212,696 |
Montpelier Re Holdings Ltd. | 2,000 | | 34,020 |
PartnerRe Ltd. | 1,700 | | 140,301 |
Platinum Underwriters Holdings Ltd. | 26,100 | | 928,116 |
RenaissanceRe Holdings Ltd. | 2,100 | | 126,504 |
| | 2,464,413 |
TOTAL INSURANCE | | 11,093,111 |
REAL ESTATE INVESTMENT TRUSTS - 4.9% |
Mortgage REITs - 1.0% |
Annaly Capital Management, Inc. | 19,300 | | 350,874 |
Residential REITs - 1.1% |
Equity Lifestyle Properties, Inc. | 4,800 | | 219,216 |
UDR, Inc. | 7,600 | | 150,860 |
| | 370,076 |
Retail REITs - 2.8% |
CBL & Associates Properties, Inc. | 2,600 | | 62,166 |
Developers Diversified Realty Corp. | 8,800 | | 336,952 |
General Growth Properties, Inc. | 8,700 | | 358,266 |
Simon Property Group, Inc. | 2,400 | | 208,464 |
| | 965,848 |
TOTAL REAL ESTATE INVESTMENT TRUSTS | | 1,686,798 |
REAL ESTATE MANAGEMENT & DEVELOPMENT - 1.0% |
Real Estate Management & Development - 1.0% |
Mitsubishi Estate Co. Ltd. | 15,000 | | 358,015 |
THRIFTS & MORTGAGE FINANCE - 4.7% |
Thrifts & Mortgage Finance - 4.7% |
BankUnited Financial Corp. Class A (d) | 4,500 | | 31,050 |
Countrywide Financial Corp. | 27,395 | | 244,911 |
Fannie Mae | 10,550 | | 421,789 |
FirstFed Financial Corp. (a)(d) | 4,600 | | 164,772 |
|
| Shares | | Value |
Freddie Mac | 10,800 | | $ 367,956 |
Hudson City Bancorp, Inc. | 18,279 | | 274,551 |
Washington Mutual, Inc. (d) | 8,700 | | 118,407 |
| | 1,623,436 |
TOTAL COMMON STOCKS (Cost $29,580,426) | 32,330,705 |
Money Market Funds - 6.5% |
| | | |
Fidelity Cash Central Fund, 4.58% (b) | 1,911,930 | | 1,911,930 |
Fidelity Securities Lending Cash Central Fund, 4.65% (b)(c) | 292,108 | | 292,108 |
TOTAL MONEY MARKET FUNDS (Cost $2,204,038) | 2,204,038 |
TOTAL INVESTMENT PORTFOLIO - 101.1% (Cost $31,784,464) | | 34,534,743 |
NET OTHER ASSETS - (1.1)% | | (373,500) |
NET ASSETS - 100% | $ 34,161,243 |
Legend |
(a) Non-income producing |
(b) Affiliated fund that is available only to investment companies and other accounts managed by Fidelity Investments. The rate quoted is the annualized seven-day yield of the fund at period end. A complete unaudited listing of the fund's holdings as of its most recent quarter end is available upon request. |
(c) Investment made with cash collateral received from securities on loan. |
(d) Security or a portion of the security is on loan at period end. |
(e) Security exempt from registration under Rule 144A of the Securities Act of 1933. These securities may be resold in transactions exempt from registration, normally to qualified institutional buyers. At the end of the period, the value of these securities amounted to $76,970 or 0.2% of net assets. |
Affiliated Central Funds |
Information regarding fiscal year to date income earned by the Fund from investments in Fidelity Central Funds is as follows: |
Fund | Income earned |
Fidelity Cash Central Fund | $ 17,999 |
Fidelity Securities Lending Cash Central Fund | 9,040 |
Total | $ 27,039 |
Distribution of investments by country of issue, as a percentage of total net assets, is as follows: |
United States of America | 81.1% |
Bermuda | 10.8% |
Cayman Islands | 3.5% |
Switzerland | 1.9% |
Germany | 1.1% |
Japan | 1.0% |
Others (individually less than 1%) | 0.6% |
| 100.0% |
See accompanying notes which are an integral part of the financial statements.
Annual Report
Financial Statements
Statement of Assets and Liabilities
| December 31, 2007 |
Assets | | |
Investment in securities, at value (including securities loaned of $288,612) - See accompanying schedule: Unaffiliated issuers (cost $29,580,426) | $ 32,330,705 | |
Fidelity Central Funds (cost $2,204,038) | 2,204,038 | |
Total Investments (cost $31,784,464) | | $ 34,534,743 |
Receivable for fund shares sold | | 89,967 |
Dividends receivable | | 41,433 |
Distributions receivable from Fidelity Central Funds | | 8,464 |
Prepaid expenses | | 106 |
Other receivables | | 143 |
Total assets | | 34,674,856 |
| | |
Liabilities | | |
Payable for investments purchased | $ 11,565 | |
Payable for fund shares redeemed | 152,583 | |
Accrued management fee | 15,563 | |
Other affiliated payables | 3,927 | |
Other payables and accrued expenses | 37,867 | |
Collateral on securities loaned, at value | 292,108 | |
Total liabilities | | 513,613 |
| | |
Net Assets | | $ 34,161,243 |
Net Assets consist of: | | |
Paid in capital | | $ 29,324,320 |
Distributions in excess of net investment income | | (29,976) |
Accumulated undistributed net realized gain (loss) on investments and foreign currency transactions | | 2,116,615 |
Net unrealized appreciation (depreciation) on investments and assets and liabilities in foreign currencies | | 2,750,284 |
Net Assets | | $ 34,161,243 |
Statement of Assets and Liabilities - continued
| December 31, 2007 |
Initial Class:
Net Asset Value, offering price and redemption price per share ($23,631,024 ÷ 2,042,462 shares) | | $ 11.57 |
| | |
Investor Class:
Net Asset Value, offering price and redemption price per share ($10,530,219 ÷ 912,268
shares) | | $ 11.54 |
See accompanying notes which are an integral part of the financial statements.
Annual Report
Statement of Operations
| Year ended December 31, 2007 |
Investment Income |
|
|
Dividends | | $ 1,000,297 |
Interest | | 19 |
Income from Fidelity Central Funds | | 27,039 |
Total income | | 1,027,355 |
| | |
Expenses | | |
Management fee | $ 245,461 | |
Transfer agent fees | 49,500 | |
Accounting and security lending fees | 17,462 | |
Custodian fees and expenses | 20,619 | |
Independent trustees' compensation | 157 | |
Audit | 50,171 | |
Legal | 375 | |
Miscellaneous | 10,432 | |
Total expenses before reductions | 394,177 | |
Expense reductions | (234) | 393,943 |
Net investment income (loss) | | 633,412 |
Realized and Unrealized Gain (Loss) Net realized gain (loss) on: | | |
Investment securities: | | |
Unaffiliated issuers | 2,286,521 | |
Foreign currency transactions | 1,198 | |
Total net realized gain (loss) | | 2,287,719 |
Change in net unrealized appreciation (depreciation) on: Investment securities | (7,585,707) | |
Assets and liabilities in foreign currencies | 10 | |
Total change in net unrealized appreciation (depreciation) | | (7,585,697) |
Net gain (loss) | | (5,297,978) |
Net increase (decrease) in net assets resulting from operations | | $ (4,664,566) |
Statement of Changes in Net Assets
| Year ended
December 31, 2007 | Year ended
December 31, 2006 |
Increase (Decrease) in Net Assets | | |
Operations | | |
Net investment income (loss) | $ 633,412 | $ 540,076 |
Net realized gain (loss) | 2,287,719 | 3,297,954 |
Change in net unrealized appreciation (depreciation) | (7,585,697) | 2,439,074 |
Net increase (decrease) in net assets resulting from operations | (4,664,566) | 6,277,104 |
Distributions to shareholders from net investment income | (1,168,511) | (428,612) |
Distributions to shareholders from net realized gain | (3,386,321) | (703,305) |
Total distributions | (4,554,832) | (1,131,917) |
Share transactions - net increase (decrease) | (14,452,083) | 17,738,147 |
Redemption fees | 22,111 | 18,458 |
Total increase (decrease) in net assets | (23,649,370) | 22,901,792 |
| | |
Net Assets | | |
Beginning of period | 57,810,613 | 34,908,821 |
End of period (including distributions in excess of net investment income of $29,976 and undistributed net investment income of $523,852, respectively) | $ 34,161,243 | $ 57,810,613 |
See accompanying notes which are an integral part of the financial statements.
Annual Report
Financial Highlights - Initial Class
Years ended December 31, | 2007 | 2006 | 2005 | 2004 | 2003 |
Selected Per-Share Data | | | | | |
Net asset value, beginning of period | $ 14.60 | $ 12.98 | $ 12.19 | $ 10.91 | $ 8.44 |
Income from Investment Operations | | | | | |
Net investment income (loss) C | .20 | .18 | .16 | .12 | .10 |
Net realized and unrealized gain (loss) | (2.02) | 1.86 | .77 | 1.15 | 2.47 |
Total from investment operations | (1.82) | 2.04 | .93 | 1.27 | 2.57 |
Distributions from net investment income | (.36) | (.16) | (.14) | - | (.11) |
Distributions from net realized gain | (.86) | (.27) | - | - | - |
Total distributions | (1.22) | (.43) | (.14) | - | (.11) |
Redemption fees added to paid in capital C | .01 | .01 | - G | .01 | .01 |
Net asset value, end of period | $ 11.57 | $ 14.60 | $ 12.98 | $ 12.19 | $ 10.91 |
Total Return A, B | (13.43)% | 16.29% | 7.71% | 11.73% | 30.59% |
Ratios to Average Net Assets D, F | | | | | |
Expenses before reductions | .87% | .86% | .86% | .85% | .97% |
Expenses net of fee waivers, if any | .87% | .86% | .86% | .85% | .97% |
Expenses net of all reductions | .87% | .85% | .85% | .83% | .96% |
Net investment income (loss) | 1.48% | 1.36% | 1.31% | 1.10% | 1.06% |
Supplemental Data | | | | | |
Net assets, end of period (000 omitted) | $ 23,631 | $ 44,781 | $ 32,776 | $ 41,595 | $ 40,900 |
Portfolio turnover rate E | 48% | 68% | 59% | 98% | 66% |
A Total returns do not reflect charges attributable to your insurance company's separate account. Inclusion of these charges would reduce the total returns shown.
B Total returns would have been lower had certain expenses not been reduced during the periods shown.
C Calculated based on average shares outstanding during the period.
D Fees and expenses of the underlying Fidelity Central Funds are not included in the Fund's expense ratio. The Fund indirectly bears its proportionate share of the expenses of any underlying Fidelity Central Funds.
E Amount does not include the portfolio activity of any underlying Fidelity Central Funds.
F Expense ratios reflect operating expenses of the class. Expenses before reductions do not reflect amounts reimbursed by the investment adviser or reductions from brokerage service arrangements or other expense offset arrangements and do not represent the amount paid by the class during periods when reimbursements or reductions occur. Expenses net of fee waivers reflect expenses after reimbursement by the investment adviser but prior to reductions from brokerage service arrangements or other expense offset arrangements. Expenses net of all reductions represent the net expenses paid by the class.
G Amount represents less than $.01 per share.
Financial Highlights - Investor Class
Years ended December 31, | 2007 | 2006 | 2005 H |
Selected Per-Share Data | | | |
Net asset value, beginning of period | $ 14.57 | $ 12.98 | $ 12.07 |
Income from Investment Operations | | | |
Net investment income (loss) E | .18 | .16 | .05 |
Net realized and unrealized gain (loss) | (2.02) | 1.86 | .86 |
Total from investment operations | (1.84) | 2.02 | .91 |
Distributions from net investment income | (.34) | (.17) | - |
Distributions from net realized gain | (.86) | (.27) | - |
Total distributions | (1.20) | (.44) | - |
Redemption fees added to paid in capital E | .01 | .01 | - J |
Net asset value, end of period | $ 11.54 | $ 14.57 | $ 12.98 |
Total Return B, C, D | (13.60)% | 16.12% | 7.54% |
Ratios to Average Net Assets F, I | | | |
Expenses before reductions | .99% | 1.00% | 1.18% A |
Expenses net of fee waivers, if any | .99% | 1.00% | 1.18% A |
Expenses net of all reductions | .99% | .99% | 1.16% A |
Net investment income (loss) | 1.36% | 1.22% | .95% A |
Supplemental Data | | | |
Net assets, end of period (000 omitted) | $ 10,530 | $ 13,030 | $ 2,133 |
Portfolio turnover rate G | 48% | 68% | 59% |
A Annualized
B Total returns for periods of less than one year are not annualized.
C Total returns do not reflect charges attributable to your insurance company's separate account. Inclusion of these charges would reduce the total returns shown.
D Total returns would have been lower had certain expenses not been reduced during the periods shown.
E Calculated based on average shares outstanding during the period.
F Fees and expenses of the underlying Fidelity Central Funds are not included in the Fund's expense ratio. The Fund indirectly bears its proportionate share of the expenses of any underlying Fidelity Central Funds.
G Amount does not include the portfolio activity of any underlying Fidelity Central Funds.
H For the period July 21, 2005 (commencement of sale of shares) to December 31, 2005.
I Expense ratios reflect operating expenses of the class. Expenses before reductions do not reflect amounts reimbursed by the investment adviser or reductions from brokerage service arrangements or other expense offset arrangements and do not represent the amount paid by the class during periods when reimbursements or reductions occur. Expense ratios before reductions for start-up periods may not be representative of longer-term operating periods. Expenses net of fee waivers reflect expenses after reimbursement by the investment adviser but prior to reductions from brokerage service arrangements or other expense offset arrangements. Expenses net of all reductions represent the net expenses paid by the class.
J Amount represents less than $.01 per share.
See accompanying notes which are an integral part of the financial statements.
Annual Report
Notes to Financial Statements
For the period ended December 31, 2007
1. Organization.
VIP Financial Services Portfolio (the Fund) is a non-diversified fund of Variable Insurance Products Fund IV (the trust) and is authorized to issue an unlimited number of shares. The trust is registered under the Investment Company Act of 1940, as amended (the 1940 Act), as an open-end management investment company organized as a Massachusetts business trust. Shares of the Fund may only be purchased by insurance companies for the purpose of funding variable annuity or variable life insurance contracts. The Fund offers the following classes of shares: Initial Class shares and Investor Class shares. All classes have equal rights and voting privileges, except for matters affecting a single class. Investment income, realized and unrealized capital gains and losses, the common expenses of the Fund, and certain fund-level expense reductions, if any, are allocated on a pro rata basis to each class based on the relative net assets of each class to the total net assets of the Fund. Each class differs with respect to transfer agent fees incurred. Certain expense reductions also differ by class. The Fund's investments in emerging markets can be subject to social, economic, regulatory and political uncertainties and can be extremely volatile.
2. Investments in Fidelity Central Funds.
The Fund may invest in Fidelity Central Funds, which are open-end investment companies available only to other investment companies and accounts managed by Fidelity Management & Research Company (FMR) and its affiliates. The Fund's Schedule of Investments lists each of the Fidelity Central Funds as an investment of the Fund, but does not include the underlying holdings of each Fidelity Central Fund. As an Investing Fund, the Fund indirectly bears its proportionate share of the expenses of the underlying Fidelity Central Funds.
The Money Market Central Funds seek preservation of capital and current income and are managed by Fidelity Investments Money Management, Inc. (FIMM), an affiliate of FMR.
A complete list of holdings for each Fidelity Central Fund is available upon request or at the SEC's web site at www.sec.gov. In addition, the financial statements of the Fidelity Central Funds, which are not covered by the Fund's Report of Independent Registered Public Accounting Firm, are available on the SEC's web site or upon request.
3. Significant Accounting Policies.
The financial statements have been prepared in conformity with accounting principles generally accepted in the United States of America, which require management to make certain estimates and assumptions at the date of the financial statements. The following summarizes the significant accounting policies of the Fund:
Security Valuation. Investments are valued and net asset value (NAV) per share is calculated (NAV calculation) as of the close of business of the New York Stock Exchange (NYSE), normally 4:00 p.m. Eastern time. Wherever possible, the Fund uses independent pricing services approved by the Board of Trustees to value its investments.
Equity securities, including restricted securities, for which market quotations are readily available, are valued at the last reported sale price or official closing price as reported by an independent pricing service on the primary market or exchange on which they are traded. In the event there were no sales during the day or closing prices are not available, securities are valued at the last quoted bid price. Investments in open-end mutual funds, including the Fidelity Central Funds, are valued at their closing net asset value each business day. Short-term securities with remaining maturities of sixty days or less for which quotations are not readily available are valued at amortized cost, which approximates value.
When current market prices or quotations are not readily available or do not accurately reflect fair value, valuations may be determined in accordance with procedures adopted by the Board of Trustees. For example, when developments occur between the close of a market and the close of the NYSE that may materially affect the value of some or all of the securities, or when trading in a security is halted, those securities may be fair valued. Factors used in the determination of fair value may include monitoring news to identify significant market or security specific events such as changes in the value of U.S. securities markets, reviewing developments in foreign markets and evaluating the performance of ADRs, futures contracts and exchange-traded funds. Because the Fund's utilization of fair value pricing depends on market activity, the frequency with which fair value pricing is used cannot be predicted and may be utilized to a significant extent. The value of securities used for NAV calculation under fair value pricing may differ from published prices for the same securities.
Foreign Currency. The Fund uses foreign currency contracts to facilitate transactions in foreign-denominated securities. Losses from these transactions may arise from changes in the value of the foreign currency or if the counterparties do not perform under the contracts' terms.
Foreign-denominated assets, including investment securities, and liabilities are translated into U.S. dollars at the exchange rate at period end. Purchases and sales of investment securities, income and dividends received and expenses denominated in foreign currencies are translated into U.S. dollars at the exchange rate in effect on the transaction date.
The effects of exchange rate fluctuations on investments are included with the net realized and unrealized gain (loss) on investment securities. Other foreign currency transactions resulting in realized and unrealized gain (loss) are disclosed separately.
Annual Report
Notes to Financial Statements - continued
3. Significant Accounting Policies - continued
Investment Transactions and Income. For financial reporting purposes, the Fund's investment holdings and NAV include trades executed through the end of the last business day of the period. The NAV for processing shareholder transactions includes trades executed through the end of the prior business day. Gains and losses on securities sold are determined on the basis of identified cost and may include proceeds received from litigation. Dividend income is recorded on the ex-dividend date, except for certain dividends from foreign securities where the ex-dividend date may have passed, which are recorded as soon as the Fund is informed of the ex-dividend date. Non-cash dividends included in dividend income, if any, are recorded at the fair market value of the securities received. Distributions received on securities that represent a return of capital or capital gain are recorded as a reduction of cost of investments and/or as a realized gain. The Fund estimates the components of distributions received that may be considered return of capital distributions or capital gain distributions. Interest income and distributions from the Fidelity Central Funds are accrued as earned. Interest income includes coupon interest and amortization of premium and accretion of discount on debt securities. Investment income is recorded net of foreign taxes withheld where recovery of such taxes is uncertain.
Expenses. Most expenses of the trust can be directly attributed to a fund. Expenses which cannot be directly attributed are apportioned among each Fund in the trust. Expense estimates are accrued in the period to which they relate and adjustments are made when actual amounts are known.
Income Tax Information and Distributions to Shareholders. Each year, the Fund intends to qualify as a regulated investment company by distributing substantially all of its taxable income and realized gains under Subchapter M of the Internal Revenue Code and filing its U.S. federal tax return. As a result, no provision for income taxes is required. The Fund adopted the provisions of FASB Interpretation No. 48, Accounting for Uncertainties in Income Taxes (FIN 48), on June 29, 2007. FIN 48 sets forth a minimum threshold for financial statement recognition of the benefit of a tax position taken or expected to be taken in a tax return. The implementation of FIN 48 did not result in any unrecognized tax benefits in the accompanying financial statements. Each of the Fund's federal tax returns for the prior three fiscal years remains subject to examination by the Internal Revenue Service. Foreign taxes are provided for based on the Fund's understanding of the tax rules and rates that exist in the foreign markets in which it invests.
Distributions are recorded on the ex-dividend date. Income dividends and capital gain distributions are declared separately for each class. Income and capital gain distributions are determined in accordance with income tax regulations, which may differ from generally accepted accounting principles.
Capital accounts within the financial statements are adjusted for permanent book-tax differences. These adjustments have no impact on net assets or the results of operations. Temporary book-tax differences will reverse in a subsequent period.
Book-tax differences are primarily due to foreign currency transactions, partnerships and losses deferred due to wash sales and excise tax regulations.
The tax-basis components of distributable earnings and the federal tax cost as of period end were as follows:
Unrealized appreciation | $ 5,915,864 |
Unrealized depreciation | (3,353,548) |
Net unrealized appreciation (depreciation) | 2,562,316 |
Undistributed ordinary income | 628,630 |
Undistributed long-term capital gain | 1,829,855 |
| |
Cost for federal income tax purposes | $ 31,972,427 |
The tax character of distributions paid was as follows:
| December 31, 2007 | December 31, 2006 |
Ordinary Income | $ 1,630,820 | $ 454,660 |
Long-term Capital Gains | 2,924,012 | 677,257 |
Total | $ 4,554,832 | $ 1,131,917 |
Trading (Redemption) Fees. Shares held less than 60 days are subject to a redemption fee equal to 1% of the proceeds of the redeemed shares. All redemption fees, including any estimated redemption fees paid by FMR, are retained by the Fund and accounted for as an addition to paid in capital.
New Accounting Pronouncement. In September 2006, Statement of Financial Accounting Standards No. 157, Fair Value Measurements (SFAS 157), was issued and is effective for fiscal years beginning after November 15, 2007. SFAS 157 defines fair value, establishes a framework for measuring fair value and expands disclosures about fair value measurements. Management is currently evaluating the impact the adoption of SFAS 157 will have on the Fund's financial statement disclosures.
Annual Report
4. Operating Policies.
Repurchase Agreements. FMR has received an Exemptive Order from the Securities and Exchange Commission (the SEC) which permits the Fund and other affiliated entities of FMR to transfer uninvested cash balances into joint trading accounts which are then invested in repurchase agreements. The Fund may also invest directly with institutions in repurchase agreements. Repurchase agreements are collateralized by government or non-government securities. Upon settlement date, collateral is held in segregated accounts with custodian banks and may be obtained in the event of a default of the counterparty. The Fund monitors, on a daily basis, the value of the collateral to ensure it is at least equal to the principal amount of the repurchase agreement (including accrued interest). In the event of a default by the counterparty, realization of the collateral proceeds could be delayed, during which time the value of the collateral may decline.
Restricted Securities. The Fund may invest in securities that are subject to legal or contractual restrictions on resale. These securities generally may be resold in transactions exempt from registration or to the public if the securities are registered. Disposal of these securities may involve time-consuming negotiations and expense, and prompt sale at an acceptable price may be difficult. Information regarding restricted securities is included at the end of the Fund's Schedule of Investments.
5. Purchases and Sales of Investments.
Purchases and sales of securities, other than short-term securities, aggregated $20,997,468 and $40,905,190, respectively.
6. Fees and Other Transactions with Affiliates.
Management Fee. FMR and its affiliates provide the Fund with investment management related services for which the Fund pays a monthly management fee. The management fee is the sum of an individual fund fee rate that is based on an annual rate of .30% of the Fund's average net assets and a group fee rate that averaged .26% during the period. The group fee rate is based upon the average net assets of all the mutual funds advised by FMR. The group fee rate decreases as assets under management increase and increases as assets under management decrease. For the period, the total annual management fee rate was .56% of the Fund's average net assets.
Transfer Agent Fees. Fidelity Investments Institutional Operations Company, Inc. (FIIOC), an affiliate of FMR, is the Fund's transfer, dividend disbursing, and shareholder servicing agent. FIIOC receives an asset-based fee with respect to each class. Each class with the exception of Investor Class pays a transfer agent fee, excluding out of pocket expenses, equal to an annual rate of .07% of average net assets. Investor Class pays a monthly asset-based transfer agent fee of .18% of average net assets. The total transfer agent fees paid by each class to FIIOC, including out of pocket expenses, were as follows:
Initial Class | $ 24,908 |
Investor Class | 24,592 |
| $ 49,500 |
Effective February 1, 2008, the Board of Trustees approved a decrease to Investor Class' asset-based fee from .18% to .15% of average net assets.
Accounting and Security Lending Fees. Fidelity Service Company, Inc. (FSC), an affiliate of FMR, maintains the Fund's accounting records. The accounting fee is based on the level of average net assets for the month. Under a separate contract, FSC administers the security lending program. The security lending fee is based on the number and duration of lending transactions.
Brokerage Commissions. The Fund placed a portion of its portfolio transactions with brokerage firms which are affiliates of the investment adviser. The commissions paid to these affiliated firms were $1,093 for the period.
7. Committed Line of Credit.
The Fund participates with other funds managed by FMR in a $4.2 billion credit facility (the "line of credit") to be utilized for temporary or emergency purposes to fund shareholder redemptions or for other short-term liquidity purposes. The Fund has agreed to pay commitment fees on its pro rata portion of the line of credit, which amounted to $106 and is reflected in Miscellaneous Expense on the Statement of Operations. During the period, there were no borrowings on this line of credit.
Annual Report
Notes to Financial Statements - continued
8. Security Lending.
The Fund lends portfolio securities from time to time in order to earn additional income. On the settlement date of the loan, the Fund receives collateral (in the form of U.S. Treasury obligations, letters of credit and/or cash) against the loaned securities and maintains collateral in an amount not less than 100% of the market value of the loaned securities during the period of the loan. The market value of the loaned securities is determined at the close of business of the Fund and any additional required collateral is delivered to the Fund on the next business day. If the borrower defaults on its obligation to return the securities loaned because of insolvency or other reasons, a fund could experience delays and costs in recovering the securities loaned or in gaining access to the collateral. Any cash collateral received is invested in the Fidelity Securities Lending Cash Central Fund. The value of loaned securities and cash collateral at period end are disclosed on the Fund's Statement of Assets and Liabilities. Security lending income represents the income earned on investing cash collateral, less fees and expenses associated with the loan, plus any premium payments that may be received on the loan of certain types of securities. Security lending income is presented in the Statement of Operations as a component of income from Fidelity Central Funds. Net income from lending portfolio securities during the period amounted to $9,040.
9. Expense Reductions.
Many of the brokers with whom FMR places trades on behalf of the Fund provided services to the Fund in addition to trade execution. These services included payments of certain expenses on behalf of the Fund totaling $221 for the period.
10. Other.
The Fund's organizational documents provide former and current trustees and officers with a limited indemnification against liabilities arising in connection with the performance of their duties to the Fund. In the normal course of business, the Fund may also enter into contracts that provide general indemnifications. The Fund's maximum exposure under these arrangements is unknown as this would be dependent on future claims that may be made against the Fund. The risk of material loss from such claims is considered remote.
At the end of the period, FMR or its affiliates were the owners of record of 100% of the total outstanding shares of the Fund.
The United States Securities and Exchange Commission ("SEC") is conducting an investigation of FMR (covering the years 2002 to 2004) arising from gifts, gratuities and business entertainment provided by certain brokers to certain individuals who were employed on FMR's domestic equity trading desk during that period. FMR is in discussions with the SEC staff regarding the possible resolution of the matter, but as of period-end no final resolution has been reached.
In December 2006, the Independent Trustees completed their own investigation of the matter with the assistance of independent counsel. The Independent Trustees and FMR agree that, despite the absence of proof that the Fidelity mutual funds experienced diminished execution quality as a result of the improper receipt of gifts and business entertainment, the conduct at issue was serious and is worthy of redress. Accordingly, the Independent Trustees have requested and FMR has agreed to pay $42 million to Fidelity mutual funds, plus interest to be determined at the time that payment is made. A method of allocating this payment among the funds has not yet been determined. The total payment to the Fund is not anticipated to have a material impact on the Fund's net assets. In addition, FMR reimbursed related legal expenses which are recorded in the accompanying Statement of Operations as an expense reduction.
11. Distributions to Shareholders.
Distributions to shareholders of each class were as follows:
Years ended December 31, | 2007 | 2006 |
From net investment income | | |
Initial Class | $ 852,438 | $ 393,932 |
Investor Class | 316,073 | 34,680 |
Total | $ 1,168,511 | $ 428,612 |
From net realized gain | | |
Initial Class | $ 2,557,827 | $ 648,547 |
Investor Class | 828,494 | 54,758 |
Total | $ 3,386,321 | $ 703,305 |
Annual Report
12. Share Transactions.
Transactions for each class of shares were as follows:
| Shares | Dollars |
Years ended December 31, | 2007 | 2006 | 2007 | 2006 |
Initial Class | | | | |
Shares sold | 684,091 | 1,476,307 | $ 8,719,511 | $ 20,458,429 |
Reinvestment of distributions | 252,303 | 81,317 | 3,410,265 | 1,042,479 |
Shares redeemed | (1,960,660) | (1,015,687) | (26,730,674) | (13,691,216) |
Net increase (decrease) | (1,024,266) | 541,937 | $ (14,600,898) | $ 7,809,692 |
Investor Class | | | | |
Shares sold | 558,928 | 822,641 | $ 7,421,183 | $ 11,174,887 |
Reinvestment of distributions | 85,449 | 6,987 | 1,144,567 | 89,437 |
Shares redeemed | (626,618) | (99,504) | (8,416,935) | (1,335,869) |
Net increase (decrease) | 17,759 | 730,124 | $ 148,815 | $ 9,928,455 |
Annual Report
Report of Independent Registered Public Accounting Firm
To the Trustees of Variable Insurance Products Fund IV and the Shareholders of VIP Financial Services Portfolio:
In our opinion, the accompanying statement of assets and liabilities, including the schedule of investments, and the related statements of operations and of changes in net assets and the financial highlights present fairly, in all material respects, the financial position of VIP Financial Services Portfolio (a fund of Variable Insurance Products Fund IV) at December 31, 2007, the results of its operations for the year then ended, the changes in its net assets for each of the two years in the period then ended and the financial highlights for each of the periods indicated, in conformity with accounting principles generally accepted in the United States of America. These financial statements and financial highlights (hereafter referred to as "financial statements") are the responsibility of the VIP Financial Services Portfolio's management. Our responsibility is to express an opinion on these financial statements based on our audits. We conducted our audits of these financial statements in accordance with the standards of the Public Company Accounting Oversight Board (United States). Those standards require that we plan and perform the audit to obtain reasonable assurance about whether the financial statements are free of material misstatement. An audit includes examining, on a test basis, evidence supporting the amounts and disclosures in the financial statements, assessing the accounting principles used and significant estimates made by management, and evaluating the overall financial statement presentation. We believe that our audits, which included confirmation of securities at December 31, 2007 by correspondence with the custodian and brokers, provide a reasonable basis for our opinion.
/s/ PricewaterhouseCoopers LLP
PricewaterhouseCoopers LLP
Boston, Massachusetts
February 19, 2008
Annual Report
Trustees and Officers
The Trustees, Members of the Advisory Board, and executive officers of the trust and fund, as applicable, are listed below. The Board of Trustees governs the fund and is responsible for protecting the interests of shareholders. The Trustees are experienced executives who meet periodically throughout the year to oversee the fund's activities, review contractual arrangements with companies that provide services to the fund, and review the fund's performance. Except for James C. Curvey, each of the Trustees oversees 373 funds advised by FMR or an affiliate. Mr. Curvey oversees 368 funds advised by FMR or an affiliate.
The Trustees hold office without limit in time except that (a) any Trustee may resign; (b) any Trustee may be removed by written instrument, signed by at least two-thirds of the number of Trustees prior to such removal; (c) any Trustee who requests to be retired or who has become incapacitated by illness or injury may be retired by written instrument signed by a majority of the other Trustees; and (d) any Trustee may be removed at any special meeting of shareholders by a two-thirds vote of the outstanding voting securities of the trust. Each Trustee who is not an interested person (as defined in the 1940 Act) (Independent Trustee), shall retire not later than the last day of the calendar year in which his or her 72nd birthday occurs. The Independent Trustees may waive this mandatory retirement age policy with respect to individual Trustees. The executive officers and Advisory Board Members hold office without limit in time, except that any officer and Advisory Board Member may resign or may be removed by a vote of a majority of the Trustees at any regular meeting or any special meeting of the Trustees. Except as indicated, each individual has held the office shown or other offices in the same company for the past five years.
The fund's Statement of Additional Information (SAI) includes more information about the Trustees. To request a free copy, call Fidelity at 1-877-208-0098.
Interested Trustees*:
Correspondence intended for each Trustee who is an interested person may be sent to Fidelity Investments, 82 Devonshire Street, Boston, Massachusetts 02109.
Name, Age; Principal Occupation |
Edward C. Johnson 3d (77) |
| Year of Election or Appointment: 1983 Mr. Johnson is Chairman of the Board of Trustees. Mr. Johnson serves as President (2006-present), Chief Executive Officer, Chairman, and a Director of FMR LLC; Chairman and a Director of FMR; Chairman and a Director of Fidelity Research & Analysis Company (FRAC); Chairman and a Director of Fidelity Investments Money Management, Inc.; and Chairman (2001-present) and a Director of FMR Co., Inc. In addition, Mr. Johnson serves as Chairman and Director of Fidelity International Limited (FIL). Mr. Edward C. Johnson 3d and Mr. Arthur E. Johnson are not related. |
James C. Curvey (72) |
| Year of Election or Appointment: 2007 Mr. Curvey also serves as Trustee (2007-present) or Member of the Advisory Board (2007-present) of other investment companies advised by FMR. Mr. Curvey is a Director of FMR and FMR Co., Inc. (2007-present). Mr. Curvey is also Vice Chairman (2006-present) and Director of FMR LLC. Mr. Curvey joined Fidelity in 1982 and served in numerous senior management positions, including President and Chief Operating Officer of FMR LLC (1997-2000) and President of Fidelity Strategic Investments (2000-2002). In addition, he serves as a member of the Board of Directors of Geerlings & Wade, Inc. (wine distribution). |
* Trustees have been determined to be "Interested Trustees" by virtue of, among other things, their affiliation with the trust or various entities under common control with FMR. FMR Corp. merged with and into FMR LLC on October 1, 2007. Any references to FMR LLC for prior periods are deemed to be references to the prior entity.
Independent Trustees:
Correspondence intended for each Independent Trustee (that is, the Trustees other than the Interested Trustees) may be sent to Fidelity Investments, P.O. Box 55235, Boston, Massachusetts 02205-5235.
Name, Age; Principal Occupation |
Dennis J. Dirks (59) |
| Year of Election or Appointment: 2005 Prior to his retirement in May 2003, Mr. Dirks was Chief Operating Officer and a member of the Board of The Depository Trust & Clearing Corporation (DTCC) (1999-2003). He also served as President, Chief Operating Officer, and Board member of The Depository Trust Company (DTC) (1999-2003) and President and Board member of the National Securities Clearing Corporation (NSCC) (1999-2003). In addition, Mr. Dirks served as Chief Executive Officer and Board member of the Government Securities Clearing Corporation (2001-2003) and Chief Executive Officer and Board member of the Mortgage-Backed Securities Clearing Corporation (2001-2003). Mr. Dirks also serves as a Trustee and a member of the Finance Committee of Manhattan College (2005-present) and a Trustee and a member of the Finance Committee of AHRC of Nassau County (2006-present). |
Albert R. Gamper, Jr. (65) |
| Year of Election or Appointment: 2006 Prior to his retirement in December 2004, Mr. Gamper served as Chairman of the Board of CIT Group Inc. (commercial finance). During his tenure with CIT Group Inc. Mr. Gamper served in numerous senior management positions, including Chairman (1987-1989; 1999-2001; 2002-2004), Chief Executive Officer (1987-2004), and President (1989-2002). He currently serves as a member of the Board of Directors of Public Service Enterprise Group (utilities, 2001-present), Chairman of the Board of Governors, Rutgers University (2004-present), and Chairman of the Board of Saint Barnabas Health Care System. |
George H. Heilmeier (71) |
| Year of Election or Appointment: 2004 Dr. Heilmeier is Chairman Emeritus of Telcordia Technologies (communication software and systems), where prior to his retirement, he served as company Chairman and Chief Executive Officer. He currently serves on the Boards of Directors of The Mitre Corporation (systems engineering and information technology support for the government), and HRL Laboratories (private research and development, 2004-present). He is Chairman of the General Motors Science & Technology Advisory Board and a Life Fellow of the Institute of Electrical and Electronics Engineers (IEEE). Dr. Heilmeier is a member of the Defense Science Board and the National Security Agency Advisory Board. He is also a member of the National Academy of Engineering, the American Academy of Arts and Sciences, and the Board of Overseers of the School of Engineering and Applied Science of the University of Pennsylvania. Previously, Dr. Heilmeier served as a Director of TRW Inc. (automotive, space, defense, and information technology, 1992-2002), Compaq (1994-2002), Automatic Data Processing, Inc. (ADP) (technology-based business outsourcing, 1995-2002), INET Technologies Inc. (telecommunications network surveillance, 2001-2004), and Teletech Holdings (customer management services). He is the recipient of the 2005 Kyoto Prize in Advanced Technology for his invention of the liquid crystal display, and a member of the Consumer Electronics Hall of Fame. |
James H. Keyes (67) |
| Year of Election or Appointment: 2007 Prior to his retirement in 2003, Mr. Keyes was Chairman, President, and Chief Executive Officer of Johnson Controls, Inc. (automotive supplier, 1993-2003). He currently serves as a member of the boards of LSI Logic Corporation (semiconductor technologies), Navistar International Corporation (manufacture and sale of trucks, buses, and diesel engines, 2002-present), and Pitney Bowes, Inc. (integrated mail, messaging, and document management solutions). |
Marie L. Knowles (61) |
| Year of Election or Appointment: 2001 Prior to Ms. Knowles' retirement in June 2000, she served as Executive Vice President and Chief Financial Officer of Atlantic Richfield Company (ARCO) (diversified energy, 1996-2000). From 1993 to 1996, she was a Senior Vice President of ARCO and President of ARCO Transportation Company. She served as a Director of ARCO from 1996 to 1998. She currently serves as a Director of Phelps Dodge Corporation (copper mining and manufacturing) and McKesson Corporation (healthcare service, 2002-present). Ms. Knowles is a Trustee of the Brookings Institution and the Catalina Island Conservancy and also serves as a member of the Advisory Board for the School of Engineering of the University of Southern California. |
Ned C. Lautenbach (63) |
| Year of Election or Appointment: 2000 Mr. Lautenbach is Chairman of the Independent Trustees (2006-present). Mr. Lautenbach has been a partner of Clayton, Dubilier & Rice, Inc. (private equity investment firm) since September 1998. Previously, Mr. Lautenbach was with the International Business Machines Corporation (IBM) from 1968 until his retirement in 1998. Mr. Lautenbach serves as a Director of Sony Corporation (2006-present) and Eaton Corporation (diversified industrial) as well as the Philharmonic Center for the Arts in Naples, Florida. He also is a member of the Board of Trustees of Fairfield University (2005-present), as well as a member of the Council on Foreign Relations. |
Cornelia M. Small (63) |
| Year of Election or Appointment: 2005 Ms. Small is a member (2000-present) and Chairperson (2002-present) of the Investment Committee, and a member (2002-
present) of the Board of Trustees of Smith College. Previously, she served as Chief Investment Officer (1999-2000), Director of Global Equity Investments (1996-1999), and a member of the Board of Directors of Scudder, Stevens & Clark (1990-1997) and Scudder Kemper Investments (1997-1999). In addition, Ms. Small served as Co-Chair (2000-2003) of the Annual Fund for the Fletcher School of Law and Diplomacy. |
William S. Stavropoulos (68) |
| Year of Election or Appointment: 2001 Mr. Stavropoulos is Chairman Emeritus of the Board of Directors of The Dow Chemical Company. Since joining The Dow Chemical Company in 1967, Mr. Stavropoulos served in numerous senior management positions, including President (1993-2000; 2002-2003), CEO (1995-2000; 2002-2004), and Chairman of the Executive Committee (2000-2004). Currently, he is a Director of NCR Corporation (data warehousing and technology solutions), Chemical Financial Corporation, Maersk Inc. (industrial conglomerate, 2002-present), Tyco International, Inc. (multinational manufacturing and services, 2007-present), and a member of the Advisory Board for Metalmark Capital (private equity investment firm, 2005-present). He is a special advisor to Clayton, Dubilier & Rice, Inc., a private equity investment firm. He also serves as a member of the Board of Trustees of the American Enterprise Institute for Public Policy Research. In addition, Mr. Stavropoulos is a member of The Business Council, J.P. Morgan International Council and the University of Notre Dame Advisory Council for the College of Science. |
Kenneth L. Wolfe (68) |
| Year of Election or Appointment: 2005 Mr. Wolfe is Chairman and a Director of Hershey Foods Corporation (2007-present), where prior to his retirement in 2001, he was Chairman and Chief Executive Officer. Mr. Wolfe currently serves as a member of the board of Revlon Inc. (2004-present). Previously, Mr. Wolfe served as a member of the boards of Adelphia Communications Corporation (2003-2006) and Bausch & Lomb, Inc. (1993-2007). |
Advisory Board Members and Executive Officers**:
Correspondence intended for Mr. Mauriello, Mr. Thomas, Mr. Wiley, Mr. Lacy, and Mr. Arthur Johnson may be sent to Fidelity Investments, P.O. Box 55235, Boston, Massachusetts 02205-5235. Correspondence intended for each executive officer and Mr. Lynch may be sent to Fidelity Investments, 82 Devonshire Street, Boston, Massachusetts 02109.
Name, Age; Principal Occupation |
Arthur E. Johnson (60) |
| Year of Election or Appointment: 2008 Member of the Advisory Board of Variable Insurance Products Fund IV. Mr. Johnson serves as Senior Vice President of Corporate Strategic Development of Lockheed Martin Corporation (defense contractor). In addition, Mr. Johnson serves as a member of the Board of Directors of AGL Resources, Inc. (holding company, 2002-present), and IKON Office Solutions, Inc. (document management systems and services). Mr. Arthur E. Johnson and Mr. Edward C. Johnson 3d are not related. |
Alan J. Lacy (54) |
| Year of Election or Appointment: 2008 Member of the Advisory Board of Variable Insurance Products Fund IV. Mr. Lacy serves as Senior Adviser (2007-present) of Oak Hill Capital Partners, L.P. (a private equity firm). Mr. Lacy also served as Vice Chairman and Chief Executive Officer of Sears Holdings Corporation and Sears, Roebuck and Co. (retail, 2005-2006; 2000-2005). In addition, Mr. Lacy serves as a member of the Board of Directors of The Western Union Company (global money transfer, 2006-present) and Bristol-Myers Squibb (global pharmaceuticals, 2007-present). Mr. Lacy is a Trustee of the National Parks Conservation Association and The Field Museum of Natural History. |
Peter S. Lynch (63) |
| Year of Election or Appointment: 2003 Member of the Advisory Board of Variable Insurance Products Fund IV. Mr. Lynch is Vice Chairman and a Director of FMR, and Vice Chairman (2001-present) and a Director of FMR Co., Inc. Previously, Mr. Lynch served as a Trustee of the Fidelity funds (1990-2003). In addition, he serves as a Trustee of Boston College and as the Chairman of the Inner-City Scholarship Fund. |
Joseph Mauriello (63) |
| Year of Election or Appointment: 2007 Member of the Advisory Board of Variable Insurance Products Fund IV. Prior to his retirement in January 2006, Mr. Mauriello served in numerous senior management positions including Deputy Chairman and Chief Operating Officer (2004-2005), and Vice Chairman of Financial Services (2002-2004) of KPMG LLP US (professional services firm, 1965-2005). Mr. Mauriello currently serves as a member of the Board of Directors of XL Capital Ltd. (global insurance and re-insurance company, 2006-present) and of Arcadia Resources Inc. (health care services and products, 2007-present). He also served as a Director of the Hamilton Funds of the Bank of New York (2006-2007). |
David M. Thomas (58) |
| Year of Election or Appointment: 2007 Member of the Advisory Board of Variable Insurance Products Fund IV. Previously, Mr. Thomas served as Executive Chairman (2005-2006) and Chairman and Chief Executive Officer (2000-2005) of IMS Health, Inc. (pharmaceutical and healthcare information solutions). In addition, Mr. Thomas serves as a member of the Board of Directors of Fortune Brands, Inc. (consumer products holding company), and Interpublic Group of Companies, Inc. (marketing communication, 2004-present). |
Michael E. Wiley (57) |
| Year of Election or Appointment: 2007 Member of the Advisory Board of Variable Insurance Products Fund IV. Mr. Wiley also serves as a member of the Board of Trustees of the University of Tulsa (2000-2006; 2007-present). He serves as a Director of Tesoro Corporation (independent oil refiner and marketer, 2005-present), and a Director of Bill Barrett Corporation (exploration and production company, 2005-present). In addition, he also serves as a Director of Post Oak Bank (privately-held bank, 2004-present). Previously, Mr. Wiley served as a Sr. Energy Advisor of Katzenbach Partners, LLC (consulting firm, 2006-2007), as an Advisory Director of Riverstone Holdings (private investment firm), Chairman, President, and CEO of Baker Hughes, Inc. (oilfield services company, 2000-2004), and as Director of Spinnaker Exploration Company (exploration and production company, 2001-2005). |
Kimberley H. Monasterio (44) |
| Year of Election or Appointment: 2007 President and Treasurer of VIP Financial Services. Ms. Monasterio also serves as President and Treasurer of other Fidelity funds (2007-present) and is an employee of FMR (2004-present). Previously, Ms. Monasterio served as Deputy Treasurer of the Fidelity funds (2004-2006). Before joining Fidelity Investments, Ms. Monasterio served as Treasurer (2000-2004) and Chief Financial Officer (2002-2004) of the Franklin Templeton Funds and Senior Vice President of Franklin Templeton Services, LLC (2000-2004). |
Brian B. Hogan (43) |
| Year of Election or Appointment: 2007 Vice President of VIP Financial Services. Mr. Hogan also serves as Vice President of Sector Funds (2007-present). Mr. Hogan is Senior Vice President of Equity Research (2006-present). Mr. Hogan also serves as Vice President of FMR and FMR Co., Inc. Previously, Mr. Hogan served as a portfolio manager. |
Eric D. Roiter (59) |
| Year of Election or Appointment: 2001 Secretary of VIP Financial Services. He also serves as Secretary of other Fidelity funds; Vice President, General Counsel, and Secretary of FMR Co., Inc. (2001-present) and FMR; Assistant Secretary of Fidelity Management & Research (U.K.) Inc. (2001-
present), Fidelity Research & Analysis Company (2001-present), and Fidelity Investments Money Management, Inc. (2001-present). Mr. Roiter is an Adjunct Member, Faculty of Law, at Boston College Law School (2003-present). Previously, Mr. Roiter served as Vice President and Secretary of Fidelity Distributors Corporation (FDC) (1998-2005). |
John B. McGinty, Jr. (45) |
| Year of Election or Appointment: 2008 Assistant Secretary of VIP Financial Services. Mr. McGinty also serves as Assistant Secretary of other Fidelity funds (2008-present) and is an employee of FMR LLC (2004-present). Mr. McGinty also serves as Senior Vice President, Secretary, and Chief Legal Officer of FDC (2007-present). Before joining Fidelity Investments, Mr. McGinty practiced law at Ropes & Gray, LLP. |
R. Stephen Ganis (41) |
| Year of Election or Appointment: 2006 Anti-Money Laundering (AML) officer of VIP Financial Services. Mr. Ganis also serves as AML officer of other Fidelity funds (2006-present) and FMR LLC (2003-present). Before joining Fidelity Investments, Mr. Ganis practiced law at Goodwin Procter, LLP (2000-2002). |
Joseph B. Hollis (59) |
| Year of Election or Appointment: 2006 Chief Financial Officer of VIP Financial Services. Mr. Hollis also serves as Chief Financial Officer of other Fidelity funds. Mr. Hollis is President of Fidelity Pricing and Cash Management Services (FPCMS) (2005-present). Mr. Hollis also serves as President and Director of Fidelity Service Company, Inc. (2006-present). Previously, Mr. Hollis served as Senior Vice President of Cash Management Services (1999-2002) and Investment Management Operations (2002-2005). |
Kenneth A. Rathgeber (60) |
| Year of Election or Appointment: 2004 Chief Compliance Officer of VIP Financial Services. Mr. Rathgeber also serves as Chief Compliance Officer of other Fidelity funds (2004-present) and Executive Vice President of Risk Oversight for Fidelity Investments (2002-present). He is Chief Compliance Officer of FMR (2005-present), FMR Co., Inc. (2005-present), Fidelity Management & Research (U.K.) Inc. (2005-present), Fidelity Research & Analysis Company (2005-present), Fidelity Investments Money Management, Inc. (2005-present), and Strategic Advisers, Inc. (2005-present). Previously, Mr. Rathgeber served as Executive Vice President and Chief Operating Officer for Fidelity Investments Institutional Services Company, Inc. (1998-2002). |
Bryan A. Mehrmann (46) |
| Year of Election or Appointment: 2005 Deputy Treasurer of VIP Financial Services. Mr. Mehrmann also serves as Deputy Treasurer of other Fidelity funds (2005-present) and is an employee of FMR. Previously, Mr. Mehrmann served as Vice President of Fidelity Investments Institutional Services Group (FIIS)/Fidelity Investments Institutional Operations Corporation, Inc. (FIIOC) Client Services (1998-2004). |
Kenneth B. Robins (38) |
| Year of Election or Appointment: 2005 Deputy Treasurer of VIP Financial Services. Mr. Robins also serves as Deputy Treasurer of other Fidelity funds (2005-present) and is an employee of FMR (2004-present). Before joining Fidelity Investments, Mr. Robins worked at KPMG LLP, where he was a partner in KPMG's department of professional practice (2002-2004) and a Senior Manager (1999-2000). In addition, Mr. Robins served as Assistant Chief Accountant, United States Securities and Exchange Commission (2000-2002). |
Robert G. Byrnes (41) |
| Year of Election or Appointment: 2005 Assistant Treasurer of VIP Financial Services. Mr. Byrnes also serves as Assistant Treasurer of other Fidelity funds (2005-present) and is an employee of FMR (2005-present). Previously, Mr. Byrnes served as Vice President of FPCMS (2003-2005). Before joining Fidelity Investments, Mr. Byrnes worked at Deutsche Asset Management where he served as Vice President of the Investment Operations Group (2000-2003). |
Peter L. Lydecker (53) |
| Year of Election or Appointment: 2004 Assistant Treasurer of VIP Financial Services. Mr. Lydecker also serves as Assistant Treasurer of other Fidelity funds (2004) and is an employee of FMR. |
Paul M. Murphy (60) |
| Year of Election or Appointment: 2007 Assistant Treasurer of VIP Financial Services. Mr. Murphy also serves as Assistant Treasurer of other Fidelity funds (2007-present) and is an employee of FMR (2007-present). Previously, Mr. Murphy served as Chief Financial Officer of the Fidelity Funds (2005-2006), Vice President and Associate General Counsel of FMR (2007), and Senior Vice President of Fidelity Pricing and Cash Management Services Group (FPCMS) (1994-2007). |
Gary W. Ryan (49) |
| Year of Election or Appointment: 2005 Assistant Treasurer of VIP Financial Services. Mr. Ryan also serves as Assistant Treasurer of other Fidelity funds (2005-present) and is an employee of FMR (2005-present). Previously, Mr. Ryan served as Vice President of Fund Reporting in FPCMS (1999-2005). |
** FMR Corp. merged with and into FMR LLC on October 1, 2007. Any references to FMR LLC for prior periods are deemed to be references to the prior entity.
Annual Report
Distributions
The Board of Trustees of VIP Financial Services Portfolio voted to pay to shareholders of record at the opening of business on record date, the following distributions per share derived from capital gains realized from sales of portfolio securities:
| Pay Date | Record Date | Capital Gains |
Initial Class | 02/15/2008 | 02/15/2008 | $0.740 |
Investor Class | 02/15/2008 | 02/15/2008 | $0.740 |
The fund hereby designates as a capital gain dividend with respect to the taxable year ended December 31 2007, $1,829,855 or, if subsequently determined to be different, the net capital gain of such year.
Initial Class designates 59%, 99% and 100%; Investor Class designates 60%, 99% and 100%; of the dividends distributed in February 2007, September 2007 and December 2007, respectively, as qualifying for the dividends-received deduction for corporate shareholders.
The fund will notify shareholders in January 2008 of amounts for use in preparing 2007 income tax returns.
Annual Report
Board Approval of Investment Advisory Contracts and Management Fees
VIP Financial Services Portfolio
Each year, typically in July, the Board of Trustees, including the Independent Trustees (together, the Board), votes on the renewal of the management contract and sub-advisory agreements (together, the Advisory Contracts) for the fund. The Board, assisted by the advice of fund counsel and Independent Trustees' counsel, requests and considers a broad range of information throughout the year.
The Board meets regularly each month except August and takes into account throughout the year matters bearing on Advisory Contracts. The Board, acting directly and through its separate committees, considers at each of its meetings factors that are relevant to the annual renewal of the fund's Advisory Contracts, including the services and support provided to the fund and its shareholders. At the time of the renewal, the Board had 12 standing committees, each composed of Independent Trustees with varying backgrounds, to which the Board has assigned specific subject matter responsibilities in order to enhance effective decision-making by the Board. Each committee has adopted a written charter outlining the structure and purposes of the committee. One such committee, the Equity Contract Committee, meets periodically as needed throughout the year to consider matters specifically related to the annual renewal of Advisory Contracts. The committee requests and receives information on, and makes recommendations to the Independent Trustees concerning, the approval and annual review of the Advisory Contracts.
At its July 2007 meeting, the Board of Trustees, including the Independent Trustees, unanimously determined to renew the Advisory Contracts for the fund. In reaching its determination, the Board considered all factors it believed relevant, including (i) the nature, extent, and quality of the services to be provided to the fund and its shareholders (including the investment performance of the fund); (ii) the competitiveness of the management fee and total expenses of the fund; (iii) the total costs of the services to be provided by and the profits to be realized by the investment adviser and its affiliates from the relationship with the fund; (iv) the extent to which economies of scale would be realized as the fund grows; and (v) whether fee levels reflect these economies of scale, if any, for the benefit of fund shareholders. The Board also approved amendments to the fund's agreements with foreign sub-advisers to clarify that each sub-adviser provides services as an independent contractor.
In determining whether to renew the Advisory Contracts for the fund, the Board ultimately reached a determination, with the assistance of fund counsel and Independent Trustees' counsel, that the renewal of the Advisory Contracts and the compensation to be received by Fidelity under the management contract is consistent with Fidelity's fiduciary duty under applicable law. In addition to evaluating the specific factors noted above, the Board, in reaching its determination, is aware that shareholders in the fund have a broad range of investment choices available to them, including a wide choice among mutual funds offered by competitors to Fidelity, and that the fund's shareholders, with the opportunity to review and weigh the disclosure provided by the fund in its prospectus and other public disclosures, have chosen to invest in this fund, managed by Fidelity.
Nature, Extent, and Quality of Services Provided. The Board considered staffing within the investment adviser, FMR, and the sub-advisers (together, the Investment Advisers), including the backgrounds of the fund's portfolio managers and the fund's investment objective and discipline. The Independent Trustees also had discussions with senior management of Fidelity's investment operations and investment groups. The Board considered the structure of the portfolio manager compensation program and whether this structure provides appropriate incentives.
Resources Dedicated to Investment Management and Support Services. The Board reviewed the size, education, and experience of the Investment Advisers' investment staff, their use of technology, and the Investment Advisers' approach to recruiting, training, and retaining portfolio managers and other research, advisory, and management personnel. The Board considered Fidelity's extensive global research capabilities that enable the Investment Advisers to aggregate data from various sources in an effort to produce positive investment results. The Board noted that Fidelity's analysts have access to a variety of technological tools that enable them to perform both fundamental and quantitative analysis and to specialize in various disciplines. The Board also considered that Fidelity's portfolio managers and analysts have access to daily portfolio attribution that allows for monitoring of a fund's portfolio, as well as an electronic communication system that provides immediate real-time access to research concerning issuers and credit enhancers.
Shareholder and Administrative Services. The Board considered (i) the nature, extent, quality, and cost of advisory, administrative, distribution, and shareholder services performed by the Investment Advisers and their affiliates under the Advisory Contracts and under separate agreements covering transfer agency, pricing and bookkeeping, and securities lending services for the fund; (ii) the nature and extent of the Investment Advisers' supervision of third party service providers, principally custodians and subcustodians; and (iii) the resources devoted to, and the record of compliance with, the fund's compliance policies and procedures. The Board reviewed the allocation of fund brokerage, including allocations to brokers affiliated with the Investment Advisers, the use of brokerage commissions to pay fund expenses, and the use of "soft" commission dollars to pay for research services. The Board also considered that Fidelity voluntarily pays for market data out of its own resources. The Board also considered the agreement reached between the Independent Trustees and Fidelity in December 2006 following an independent review of matters relating to receipt of travel, entertainment, gifts and gratuities in violation of Fidelity policies.
The Board noted that the growth of fund assets across the complex allows Fidelity to reinvest in the development of services designed to enhance the value or convenience of the Fidelity funds as investment vehicles. These services include 24-hour access to account information and market information through phone representatives and over the Internet, and investor education materials and asset allocation tools.
Annual Report
Board Approval of Investment Advisory Contracts and Management Fees - continued
Investment in a Large Fund Family. The Board considered the benefits to shareholders of investing in a Fidelity fund, including the benefits of investing in a fund that is part of a large family of funds offering a variety of investment disciplines and providing for a large variety of mutual fund investor services. The Board noted that, since the last Advisory Contract renewals in July 2006, Fidelity has taken a number of actions that benefited particular funds, including (i) dedicating additional resources to investment research and to restructure the investment research teams; (ii) contractually agreeing to reduce the management fee on Fidelity Advisor Floating Rate High Income Fund; (iii) contractually agreeing to reduce the management fees on Fidelity's California, Massachusetts, New Jersey, and New York AMT Tax-Free Money Market Funds, launching new Institutional Classes and Service Classes of these funds, and contractually agreeing to impose expense limitations on these funds; (iv) eliminating the exchange fee on the Fidelity Select Portfolios and reducing the pricing and bookkeeping fee rates for these funds; (v) reducing the maximum transfer agency fee rates on high income funds and certain equity funds; (vi) proposing amended management contracts that, if approved by shareholders, will add a performance adjustment component to the management fees paid by 18 Fidelity Advisor equity funds; (vii) contractually agreeing to reduce fees for Ultra-Short Central Fund and the money market Central Funds; (viii) waiving the Fidelity Advisor funds' contingent deferred sales charge on certain redemptions made through systematic withdrawal programs; and (ix) amending the management contracts for equity and fixed-income funds whose management contracts incorporate a "group fee" structure by adding four new fee "breakpoints" to the group fee rate schedules.
Investment Performance and Compliance. The Board considered whether the fund has operated within its investment objective, as well as its record of compliance with its investment restrictions. It also reviewed the fund's absolute investment performance for each class, as well as the fund's relative investment performance for each class measured against a third-party-sponsored index that reflects the market sector in which the fund invests over multiple periods. The Board noted that FMR does not believe that a meaningful peer group exists against which to compare the fund's performance. The Board also noted that in 2006 FMR implemented changes to the sector fund product line, which included a change to the fund's index. The following charts considered by the Board show, over the one-, three-, and five-year periods ended December 31, 2006, as available, the cumulative total returns of Initial Class and Investor Class of the fund and the cumulative total returns of a third-party-sponsored index ("benchmark").
VIP Financial Services Portfolio
The Board stated that the relative investment performance of the fund was lower than its benchmark for all the periods shown. The Board considered that the variations in performance between the fund's classes reflect the variations in class expenses, which result in lower performance for the higher expense class. The Board discussed with FMR actions to be taken by FMR to improve the fund's below-benchmark performance.
The Board considered that FMR has taken steps to refocus and strengthen equity research, equity portfolio management, and compliance.
Based on its review, and giving particular weight to the nature and quality of the resources dedicated by the Investment Advisers to maintain and improve relative performance, the Board concluded that the nature, extent, and quality of the services provided to the fund will benefit the fund's shareholders, particularly in light of the Board's view that the fund's shareholders benefit from investing in a fund that is part of a large family of funds offering a variety of investment disciplines and services.
Competitiveness of Management Fee and Total Fund Expenses. The Board considered the fund's management fee and total expenses compared to "mapped groups" of competitive funds and classes. Fidelity creates "mapped groups" by combining similar Lipper investment objective categories that have comparable management fee characteristics. Combining Lipper investment objective categories aids the Board's management fee and total expense comparisons by broadening the competitive group used for comparison and by reducing the number of universes to which various Fidelity funds are compared. The Board also considered supplemental information about how the fund's management fee and total expenses ranked relative to groups based on Lipper classifications, which take into account a fund's market capitalization and style.
Annual Report
The Board considered two proprietary management fee comparisons for the 12-month periods shown in the chart below. The group of Lipper funds used by the Board for management fee comparisons is referred to below as the "Total Mapped Group." The Total Mapped Group comparison focuses on a fund's standing relative to the total universe of comparable funds available to investors, in terms of gross management fees before expense reimbursements or caps. "TMG %" represents the percentage of funds in the Total Mapped Group that had management fees that were lower than the fund's. For example, a TMG % of 9% means that 91% of the funds in the Total Mapped Group had higher management fees than the fund. The "Asset-Size Peer Group" (ASPG) comparison focuses on a fund's standing relative to non-Fidelity funds similar in size to the fund within the Total Mapped Group. The ASPG represents at least 15% of the funds in the Total Mapped Group with comparable asset size and management fee characteristics, subject to a minimum of 50 funds (or all funds in the Total Mapped Group if fewer than 50). Additional information, such as the ASPG quartile in which the fund's management fee ranked, is also included in the chart and considered by the Board.
VIP Financial Services Portfolio
The Board noted that the fund's management fee ranked below the median of its Total Mapped Group and below the median of its ASPG for 2006.
Based on its review, the Board concluded that the fund's management fee was fair and reasonable in light of the services that the fund receives and the other factors considered.
In its review of each class's total expenses, the Board considered the fund's management fee as well as other fund or class expenses, as applicable, such as transfer agent fees, pricing and bookkeeping fees, and custodial, legal, and audit fees. The Board also noted the effects of any waivers and reimbursements on fees and expenses. As part of its review, the Board also considered current and historical total expenses of each class of the fund compared to competitive fund median expenses. Each class of the fund is compared to those funds and classes in the Total Mapped Group (used by the Board for management fee comparisons) that have a similar sales load structure.
The Board noted that the total expenses of each class ranked below its competitive median for 2006.
In its review of total expenses, the Board also considered Fidelity fee structures and other information on clients that FMR and its affiliates service in other competitive markets, such as other mutual funds advised or subadvised by FMR or its affiliates, pension plan clients, and other institutional clients.
Based on its review, the Board concluded that the total expenses of each class of the fund were reasonable in light of the services that the fund and its shareholders receive and the other factors considered.
Costs of the Services and Profitability. The Board considered the revenues earned and the expenses incurred by Fidelity in conducting the business of developing, marketing, distributing, managing, administering and servicing the fund and its shareholders. The Board also considered the level of Fidelity's profits in respect of all the Fidelity funds.
Annual Report
Board Approval of Investment Advisory Contracts and Management Fees - continued
On an annual basis, FMR presents to the Board Fidelity's profitability for the fund. Fidelity calculates the profitability for each fund, as well as aggregate profitability for groups of Fidelity funds and all Fidelity funds, using a series of detailed revenue and cost allocation methodologies which originate with the audited books and records of Fidelity. The Audit Committee of the Board reviews any significant changes from the prior year's methodologies.
PricewaterhouseCoopers LLP (PwC), independent registered public accounting firm and auditor to Fidelity and certain Fidelity funds, has been engaged annually by the Board as part of the Board's assessment of the results of Fidelity's profitability analysis. PwC's engagement includes the review and assessment of Fidelity's methodologies used in determining the revenues and expenses attributable to Fidelity's mutual fund business, and completion of agreed-upon procedures surrounding the mathematical accuracy of fund profitability and its conformity to allocation methodologies. After considering PwC's reports issued under the engagement and information provided by Fidelity, the Board believes that while other allocation methods may also be reasonable, Fidelity's profitability methodologies are reasonable in all material respects.
The Board has also reviewed Fidelity's non-fund businesses and any fall-out benefits related to the mutual fund business as well as cases where Fidelity's affiliates may benefit from or be related to the fund's business.
The Board considered the costs of the services provided by and the profits realized by Fidelity in connection with the operation of the fund and determined that the amount of profit is a fair entrepreneurial profit for the management of the fund.
Economies of Scale. The Board considered whether there have been economies of scale in respect of the management of the Fidelity funds, whether the Fidelity funds (including the fund) have appropriately benefited from any such economies of scale, and whether there is potential for realization of any further economies of scale. The Board considered the extent to which the fund will benefit from economies of scale through increased services to the fund, through waivers or reimbursements, or through fee or expense reductions.
The Board recognized that the fund's management contract incorporates a "group fee" structure, which provides for lower group fee rates as total fund assets under FMR's management increase, and for higher group fee rates as total fund assets under FMR's management decrease. FMR determines the group fee rates based on a tiered asset "breakpoint" schedule. In connection with the renewal of the fund's management contract, the Board approved amendments to the fund's management contract that added four new fee breakpoints to the group fee rate schedule for assets under FMR's management above $1,386 billion. The Board considered that the group fee rate declines under both the present and amended schedules, but that under the amended schedule, the group fee rate declines faster as assets under FMR's management exceed $1,386 billion. The Board considered that the group fee is designed to deliver the benefits of economies of scale to fund shareholders when total fund assets increase, even if assets of any particular fund are unchanged or have declined, because some portion of Fidelity's costs are attributable to services provided to all Fidelity funds, and all funds benefit if those costs can be allocated among more assets. The Board concluded that, given the group fee structure, fund shareholders will achieve a certain level of economies of scale as assets under FMR's management increase at the fund complex level, regardless of whether Fidelity achieves any such economies of scale.
The Board further concluded that any potential economies of scale are being shared between fund shareholders and Fidelity in an appropriate manner.
Additional Information Requested by the Board. In order to develop fully the factual basis for consideration of the Fidelity funds' Advisory Contracts, the Board requested and received additional information on several topics, including (i) fund performance trends and actions to be taken by FMR to improve certain funds' overall performance; (ii) Fidelity's portfolio manager compensation structure, including its effects on fund profitability and the extent to which portfolio manager compensation is linked to fund performance; (iii) Fidelity's fee structures; (iv) the funds' sub-advisory arrangements; and (v) accounts managed by Fidelity other than the Fidelity funds.
Based on its evaluation of all of the conclusions noted above, and after considering all material factors, the Board ultimately concluded that the advisory fee structures are fair and reasonable, and that the fund's Advisory Contracts should be renewed.
Annual Report
Annual Report
Annual Report
Annual Report
Investment Adviser
Fidelity Management & Research Company
Boston, MA
Investment Sub-Advisers
FMR Co., Inc.
Fidelity Management & Research (U.K.) Inc.
Fidelity Research & Analysis Company
Fidelity Investments Japan Limited
Fidelity International Investment Advisors
Fidelity International Investment Advisors
(U.K.) Limited
General Distributor
Fidelity Distributors Corporation
Boston, MA
Transfer and Service Agents
Fidelity Investments Institutional Operations Company, Inc.
Boston, MA
Fidelity Service Company, Inc.
Boston, MA
Custodian
JPMorgan Chase Bank
New York, NY
VFSIC-ANN-0208
1.817367.102
Fidelity® Variable Insurance Products:
Growth Stock Portfolio
Annual Report
December 31, 2007
(2_fidelity_logos) (Registered_Trademark)
Contents
Performance | <Click Here> | How the fund has done over time. |
Management's Discussion | <Click Here> | The manager's review of fund performance, strategy and outlook. |
Shareholder Expense Example | <Click Here> | An example of shareholder expenses. |
Investment Changes | <Click Here> | A summary of major shifts in the fund's investments over the past six months. |
Investments | <Click Here> | A complete list of the fund's investments with their
market values. |
Financial Statements | <Click Here> | Statements of assets and liabilities, operations, and
changes in net assets, as well as financial highlights. |
Notes | <Click Here> | Notes to the financial statements. |
Report of Independent Registered Public Accounting Firm | <Click Here> | |
Trustees and Officers | <Click Here> | |
Distributions | <Click Here> | |
Board Approval of Investment Advisory Contracts and Management Fees | <Click Here> | |
| | |
To view a fund's proxy voting guidelines and proxy voting record for the 12-month period ended June 30, visit http://www.fidelity.com (search for "proxy voting results") or visit the Securities and Exchange Commission's (SEC) web site at http://www.sec.gov. You may also call 1-877-208-0098 to request a free copy of the proxy voting guidelines.
Fidelity Variable Insurance Products are separate account options which are purchased through a variable insurance contract.
Standard & Poor's, S&P and S&P 500 are registered service marks of The McGraw-Hill Companies, Inc. and have been licensed for use by Fidelity Distributors Corporation.
Other third party marks appearing herein are the property of their respective owners.
All other marks appearing herein are registered or unregistered trademarks or service marks of FMR LLC or an affiliated company.
This report and the financial statements contained herein are submitted for the general information of the shareholders of the fund. This report is not authorized for distribution to prospective investors in the fund unless preceded or accompanied by an effective prospectus.
A fund files its complete schedule of portfolio holdings with the SEC for the first and third quarters of each fiscal year on Form N-Q. Forms N-Q are available on the SEC's web site at http://www.sec.gov. A fund's Forms N-Q may be reviewed and copied at the SEC's Public Reference Room in Washington, DC. Information regarding the operation of the SEC's Public Reference Room may be obtained by calling 1-800-SEC-0330. For a complete list of a fund's portfolio holdings, view the most recent holdings listing, semiannual report, or annual report on Fidelity's web site at http://www.fidelity.com or http://www.advisor.fidelity.com, as applicable.
NOT FDIC INSURED · MAY LOSE VALUE · NO BANK GUARANTEE
Neither the fund nor Fidelity Distributors Corporation is a bank.
Annual Report
Performance: The Bottom Line
Average annual total return reflects the change in the value of an investment, assuming reinvestment of the class' dividend income and capital gains (the profits earned upon the sale of securities that have grown in value, if any) and assuming a constant rate of performance each year. During periods of reimbursement by Fidelity, a fund's total return will be greater than it would be had the reimbursement not occurred. Performance numbers are net of all underlying fund operating expenses, but do not include any insurance charges imposed by your insurance company's separate account. If performance information included the effect of these additional charges, the total returns would have been lower. How a fund did yesterday is no guarantee of how it will do tomorrow.
Average Annual Total Returns
Periods ended December 31, 2007 | | Past 1
year | Past 5
years | Life of
fund A |
VIP Growth Stock - Initial Class | | 22.67% | 11.99% | 11.13% |
VIP Growth Stock - Service Class B | | 22.60% | 11.89% | 11.03% |
VIP Growth Stock - Service Class 2 C | | 22.31% | 11.71% | 10.85% |
VIP Growth Stock - Investor Class D | | 22.45% | 11.92% | 11.05% |
A From December 11, 2002
B Performance for Service Class shares reflects an asset-based service fee (12b-1 fee).
C Performance for Service Class 2 shares reflects an asset-based service fee (12b-1 fee).
D The initial offering of Investor Class shares took place on July 21, 2005. Returns prior to July 21, 2005 are those of Initial Class. If Investor Class's transfer agent fee had been reflected, returns prior to July 21, 2005 would have been lower.
$10,000 Over Life of Fund
Let's say hypothetically that $10,000 was invested in VIP Growth Stock Portfolio - Initial Class on December 11, 2002, when the fund started. The chart shows how the value of your investment would have changed, and also shows how the Russell 1000® Growth Index performed over the same period.
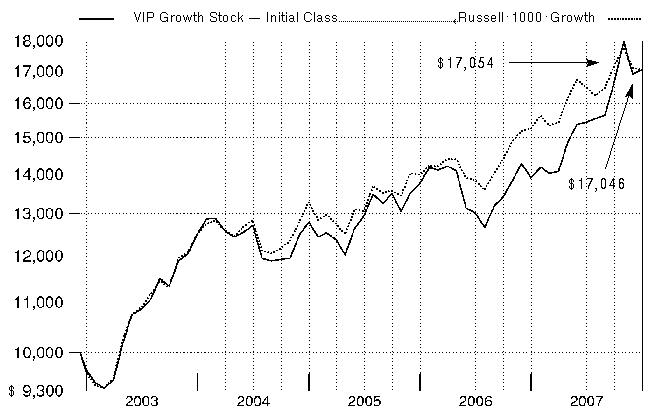
Annual Report
Management's Discussion of Fund Performance
Comments from Jeffrey Feingold, Portfolio Manager of VIP Growth Stock Portfolio
U.S. equity markets, as measured by the bellwether Dow Jones Industrial AverageSM and the Standard & Poor's 500SM Index, registered their fifth consecutive year of positive returns in 2007, as the Dow rose 8.88% and the S&P 500® index advanced 5.49%. The tech-heavy NASDAQ Composite® Index did even better, increasing 10.55%. However, credit- and recession-related concerns carved deeply into stock prices late in 2007, pushing some major market measures into negative territory for the year overall, particularly smaller-cap and value-oriented benchmarks. Based largely on a weak U.S. dollar that boosted returns for U.S. investors, the Morgan Stanley Capital InternationalSM Europe, Australasia, and Far East (MSCI® EAFE®) Index - a gauge of developed stock markets outside the United States and Canada - beat most domestic equity measures, gaining 11.33%. Several European countries had outstanding performance, including Finland and Germany, while Australia also did very well. However, fallout from the credit crunch and concerns about export growth tempered U.K. stocks, while fears that Japanese financial companies would become embroiled in the U.S. subprime mortgage crisis contributed to a loss of more than 4% for the Japanese portion of the index. The emerging-markets stock asset class soared 39.78% according to the MSCI Emerging Markets index. The U.S. investment-grade bond market climbed 6.97% as measured by the Lehman Brothers® U.S. Aggregate Index, beating the 2.53% gain for the Merrill Lynch® U.S. High Yield Master II Constrained Index. The emerging-markets bond category shook off a sluggish first half of 2007 to finish the year with a respectable gain of 6.28% as measured by the J.P. Morgan Emerging Markets Bond Index (EMBI) Global, while the Citigroup® Non-U.S. Group of 7 Index - representing the debt performance of major global economies, excluding the United States - rose 13.05%.
For the year ending December 31, 2007, the fund nicely outpaced both the Russell 1000® Growth Index, which returned 11.81%, and the S&P 500® index. (For specific portfolio performance results, please refer to the performance section of this report.) Strong stock selection, along with positive sector allocation, drove the outperformance. Both large- and small-capitalization stocks added to returns, as did currency fluctuations from foreign holdings. The biggest gains came from the industrials sector - especially capital goods - as well as from materials and energy. Winners included Q-Cells in Germany and Norway's Renewable Energy, which both benefited from strong supply-chain execution and growing demand for their solar power products. ABB in Switzerland, which makes power transmission and distribution equipment, rallied as infrastructure spending increased. Within materials, Monsanto, which supplies seed for farmers, climbed as worldwide demand for food grew. On the downside were consumer discretionary stocks, such as JCPenney, a retailer hurt by the consumer spending slowdown. Elsewhere, Nastech Pharmaceutical, an out-of-index biotechnology company, fell after adding an extra clinical trial for a promising drug and proceeding with an ill-timed secondary share offering. I sold Nastech before period end.
The views expressed above reflect those of the portfolio manager(s) only through the end of the period as stated on the cover of this report and do not necessarily represent the views of Fidelity or any other person in the Fidelity organization. Any such views are subject to change at any time based upon market or other conditions and Fidelity disclaims any responsibility to update such views. These views may not be relied on as investment advice and, because investment decisions for a Fidelity fund are based on numerous factors, may not be relied on as an indication of trading intent on behalf of any Fidelity fund.
Annual Report
Shareholder Expense Example
As a shareholder of the Fund, you incur two types of costs: (1) transaction costs, and (2) ongoing costs, including management fees, distribution and/or service (12b-1) fees and other Fund expenses. This Example is intended to help you understand your ongoing costs (in dollars) of investing in the Fund and to compare these costs with the ongoing costs of investing in other mutual funds.
The Example is based on an investment of $1,000 invested at the beginning of the period and held for the entire period (July 1, 2007 to December 31, 2007).
Actual Expenses
The first line of the accompanying table for each class of the Fund provides information about actual account values and actual expenses. You may use the information in this line, together with the amount you invested, to estimate the expenses that you paid over the period. Simply divide your account value by $1,000.00 (for example, an $8,600 account value divided by $1,000.00 = 8.6), then multiply the result by the number in the first line for a class of the Fund under the heading entitled "Expenses Paid During Period" to estimate the expenses you paid on your account during this period. The estimate of expenses does not include any fees or other expenses of any variable annuity or variable life insurance product. If they were, the estimate of expenses you paid during the period would be higher, and your ending account value would be lower. In addition, the Fund, as a shareholder in the underlying Fidelity Central Funds, will indirectly bear its pro rata share of the fees and expenses incurred by the underlying Fidelity Central Funds. These fees and expenses are not included in the Fund's annualized expense ratio used to calculate the expense estimate in the table below.
Hypothetical Example for Comparison Purposes
The second line of the accompanying table for each class of the Fund provides information about hypothetical account values and hypothetical expenses based on a Class' actual expense ratio and an assumed rate of return of 5% per year before expenses, which is not the Class' actual return. The hypothetical account values and expenses may not be used to estimate the actual ending account balance or expenses you paid for the period. You may use this information to compare the ongoing costs of investing in the Fund and other funds. To do so, compare this 5% hypothetical example with the 5% hypothetical examples that appear in the shareholder reports of the other funds. The estimate of expenses does not include any fees or other expenses of any variable annuity or variable life insurance product. If they were, the estimate of expenses you paid during the period would be higher, and your ending account value would be lower. In addition, the Fund, as a shareholder in the underlying Fidelity Central Funds, will indirectly bear its pro rata share of the fees and expenses incurred by the underlying Fidelity Central Funds. These fees and expenses are not included in the Fund's annualized expense ratio used to calculate the expense estimate in the table below.
Please note that the expenses shown in the table are meant to highlight your ongoing costs only and do not reflect any transaction costs. Therefore, the second line of the table is useful in comparing ongoing costs only, and will not help you determine the relative total costs of owning different funds.
| Beginning
Account Value
July 1, 2007 | Ending
Account Value
December 31, 2007 | Expenses Paid
During Period*
July 1, 2007 to
December 31, 2007 |
Initial Class | | | |
Actual | $ 1,000.00 | $ 1,104.90 | $ 4.51 |
HypotheticalA | $ 1,000.00 | $ 1,020.92 | $ 4.33 |
Service Class | | | |
Actual | $ 1,000.00 | $ 1,104.70 | $ 5.04 |
HypotheticalA | $ 1,000.00 | $ 1,020.42 | $ 4.84 |
Service Class 2 | | | |
Actual | $ 1,000.00 | $ 1,103.90 | $ 5.83 |
HypotheticalA | $ 1,000.00 | $ 1,019.66 | $ 5.60 |
Investor Class | | | |
Actual | $ 1,000.00 | $ 1,104.50 | $ 5.30** |
HypotheticalA | $ 1,000.00 | $ 1,020.16 | $ 5.09** |
A 5% return per year before expenses
* Expenses are equal to each Class' annualized expense ratio (shown in the table below); multiplied by the average account value over the period, multiplied by 184/365 (to reflect the one-half year period).
| Annualized
Expense Ratio |
Initial Class | .85% |
Service Class | .95% |
Service Class 2 | 1.10% |
Investor Class | 1.00%** |
** If changes to transfer agent contracts and voluntary expense limitations, effective February 1, 2008 had been in effect during the entire period, the annualized expense ratio would have been .93% and the expenses paid in the actual and hypothetical examples above would have been $4.93 and $4.74, respectively.
Annual Report
Investment Changes
Top Ten Stocks as of December 31, 2007 |
| % of fund's
net assets | % of fund's net assets
6 months ago |
Google, Inc. Class A (sub. vtg.) | 4.1 | 3.5 |
Monsanto Co. | 3.6 | 2.2 |
Cisco Systems, Inc. | 3.6 | 3.0 |
Apple, Inc. | 3.2 | 3.2 |
Inverness Medical Innovations, Inc. | 3.1 | 1.0 |
Research In Motion Ltd. | 2.3 | 0.8 |
Hewlett-Packard Co. | 2.2 | 0.0 |
Microsoft Corp. | 1.8 | 0.0 |
Siemens AG sponsored ADR | 1.7 | 1.1 |
Nintendo Co. Ltd. | 1.7 | 0.7 |
| 27.3 | |
Top Five Market Sectors as of December 31, 2007 |
| % of fund's
net assets | % of fund's net assets
6 months ago |
Information Technology | 31.5 | 30.0 |
Health Care | 16.0 | 15.5 |
Industrials | 13.1 | 14.9 |
Consumer Discretionary | 7.8 | 9.9 |
Consumer Staples | 6.9 | 7.7 |
Asset Allocation (% of fund's net assets) |
As of December 31, 2007 * | As of June 30, 2007 ** |
 | Stocks 96.1% | | | Stocks 97.8% | |
 | Short-Term
Investments and
Net Other Assets 3.9% | | | Short-Term
Investments and
Net Other Assets 2.2% | |
* Foreign
investments | 23.6% | | ** Foreign
investments | 15.8% | |

Annual Report
Investments December 31, 2007
Showing Percentage of Net Assets
Common Stocks - 96.1% |
| Shares | | Value |
CONSUMER DISCRETIONARY - 7.8% |
Distributors - 0.1% |
Li & Fung Ltd. | 12,000 | | $ 48,480 |
Diversified Consumer Services - 0.4% |
New Oriental Education & Technology Group, Inc. sponsored ADR (a) | 1,600 | | 128,944 |
Hotels, Restaurants & Leisure - 1.6% |
McDonald's Corp. | 8,200 | | 483,062 |
Household Durables - 0.6% |
Garmin Ltd. | 2,000 | | 194,000 |
Internet & Catalog Retail - 1.0% |
Blue Nile, Inc. (a) | 2,100 | | 142,926 |
Priceline.com, Inc. (a) | 1,400 | | 160,804 |
| | 303,730 |
Multiline Retail - 1.2% |
JCPenney Co., Inc. | 1,200 | | 52,788 |
Nordstrom, Inc. | 500 | | 18,365 |
Pantaloon Retail India Ltd. | 1,091 | | 27,674 |
Target Corp. | 5,500 | | 275,000 |
| | 373,827 |
Specialty Retail - 0.7% |
The Men's Wearhouse, Inc. | 200 | | 5,396 |
TJX Companies, Inc. | 6,900 | | 198,237 |
| | 203,633 |
Textiles, Apparel & Luxury Goods - 2.2% |
Coach, Inc. (a) | 2,900 | | 88,682 |
Crocs, Inc. (a) | 3,800 | | 139,878 |
G-III Apparel Group Ltd. (a) | 11,300 | | 166,901 |
Polo Ralph Lauren Corp. Class A | 2,400 | | 148,296 |
Titan Industries Ltd. | 1,900 | | 75,335 |
Under Armour, Inc. Class A (sub. vtg.) (a)(d) | 1,000 | | 43,670 |
| | 662,762 |
TOTAL CONSUMER DISCRETIONARY | | 2,398,438 |
CONSUMER STAPLES - 6.9% |
Beverages - 2.6% |
Molson Coors Brewing Co. Class B | 8,600 | | 443,932 |
PepsiCo, Inc. | 3,900 | | 296,010 |
United Spirits Ltd. | 1,213 | | 61,520 |
| | 801,462 |
Food & Staples Retailing - 0.7% |
Costco Wholesale Corp. | 3,300 | | 230,208 |
Food Products - 0.6% |
Nestle SA sponsored ADR | 1,400 | | 160,300 |
Smart Balance, Inc. (a) | 1,200 | | 13,116 |
| | 173,416 |
Household Products - 1.3% |
Procter & Gamble Co. | 5,300 | | 389,126 |
|
| Shares | | Value |
Personal Products - 1.7% |
Avon Products, Inc. | 10,400 | | $ 411,112 |
Dabur India Ltd. | 15,600 | | 45,211 |
Marico Ltd. | 32,800 | | 57,185 |
| | 513,508 |
TOTAL CONSUMER STAPLES | | 2,107,720 |
ENERGY - 6.4% |
Energy Equipment & Services - 2.3% |
Expro International Group PLC | 3,200 | | 65,677 |
National Oilwell Varco, Inc. (a) | 3,546 | | 260,489 |
Schlumberger Ltd. (NY Shares) | 3,900 | | 383,643 |
| | 709,809 |
Oil, Gas & Consumable Fuels - 4.1% |
CONSOL Energy, Inc. | 2,300 | | 164,496 |
EOG Resources, Inc. | 1,900 | | 169,575 |
Exxon Mobil Corp. | 2,900 | | 271,701 |
Nova Biosource Fuels, Inc. (a)(d) | 36,400 | | 105,560 |
Peabody Energy Corp. | 2,500 | | 154,100 |
Suncor Energy, Inc. | 900 | | 97,749 |
Ultra Petroleum Corp. (a) | 1,300 | | 92,950 |
Valero Energy Corp. | 2,800 | | 196,084 |
| | 1,252,215 |
TOTAL ENERGY | | 1,962,024 |
FINANCIALS - 4.4% |
Capital Markets - 2.6% |
Goldman Sachs Group, Inc. | 800 | | 172,040 |
Janus Capital Group, Inc. | 4,700 | | 154,395 |
Lehman Brothers Holdings, Inc. | 7,200 | | 471,168 |
| | 797,603 |
Diversified Financial Services - 1.8% |
Bolsa de Mercadorias & Futuros - BM&F SA | 6,800 | | 94,551 |
Bovespa Holding SA | 4,800 | | 89,906 |
CME Group, Inc. | 400 | | 274,400 |
JSE Ltd. | 7,100 | | 90,032 |
| | 548,889 |
TOTAL FINANCIALS | | 1,346,492 |
HEALTH CARE - 16.0% |
Biotechnology - 4.2% |
Alexion Pharmaceuticals, Inc. (a) | 1,100 | | 82,533 |
Alkermes, Inc. (a) | 600 | | 9,354 |
Alnylam Pharmaceuticals, Inc. (a) | 4,300 | | 125,044 |
Amylin Pharmaceuticals, Inc. (a) | 4,400 | | 162,800 |
Celgene Corp. (a) | 3,100 | | 143,251 |
Cougar Biotechnology, Inc. (a) | 1,400 | | 45,780 |
CSL Ltd. | 14,640 | | 466,251 |
Common Stocks - continued |
| Shares | | Value |
HEALTH CARE - continued |
Biotechnology - continued |
Gilead Sciences, Inc. (a) | 4,600 | | $ 211,646 |
Theravance, Inc. (a) | 1,300 | | 25,350 |
| | 1,272,009 |
Health Care Equipment & Supplies - 6.3% |
Becton, Dickinson & Co. | 2,500 | | 208,950 |
C.R. Bard, Inc. | 2,000 | | 189,600 |
Integra LifeSciences Holdings Corp. (a) | 2,500 | | 104,825 |
Inverness Medical Innovations, Inc. (a) | 16,825 | | 945,229 |
Meridian Bioscience, Inc. | 2,300 | | 69,184 |
St. Jude Medical, Inc. (a) | 8,800 | | 357,632 |
Zoll Medical Corp. (a) | 2,400 | | 64,128 |
| | 1,939,548 |
Health Care Providers & Services - 0.5% |
athenahealth, Inc. | 100 | | 3,600 |
Express Scripts, Inc. (a) | 2,300 | | 167,900 |
| | 171,500 |
Health Care Technology - 2.0% |
Cerner Corp. (a) | 5,188 | | 292,603 |
Eclipsys Corp. (a) | 12,300 | | 311,313 |
| | 603,916 |
Life Sciences Tools & Services - 1.3% |
Affymetrix, Inc. (a) | 1,400 | | 32,396 |
Illumina, Inc. (a) | 1,800 | | 106,668 |
QIAGEN NV (a) | 11,800 | | 248,390 |
| | 387,454 |
Pharmaceuticals - 1.7% |
Allergan, Inc. | 3,600 | | 231,264 |
Merck & Co., Inc. | 4,900 | | 284,739 |
| | 516,003 |
TOTAL HEALTH CARE | | 4,890,430 |
INDUSTRIALS - 13.1% |
Aerospace & Defense - 2.2% |
General Dynamics Corp. | 3,600 | | 320,364 |
Raytheon Co. | 5,900 | | 358,130 |
| | 678,494 |
Commercial Services & Supplies - 0.6% |
Fuel Tech, Inc. (a) | 7,525 | | 170,441 |
Construction & Engineering - 0.8% |
Fluor Corp. | 1,000 | | 145,720 |
Larsen & Toubro Ltd. | 991 | | 104,806 |
| | 250,526 |
Electrical Equipment - 7.0% |
ABB Ltd. sponsored ADR | 16,200 | | 466,560 |
Alstom SA | 2,000 | | 429,064 |
American Superconductor Corp. (a)(d) | 12,700 | | 347,218 |
Bharat Heavy Electricals Ltd. | 1,288 | | 84,649 |
|
| Shares | | Value |
Crompton Greaves Ltd. | 5,200 | | $ 51,914 |
FuelCell Energy, Inc. (a)(d) | 5,700 | | 56,544 |
Q-Cells AG (a)(d) | 2,200 | | 313,362 |
Renewable Energy Corp. AS (a) | 6,050 | | 307,259 |
Satcon Technology Corp. (a) | 31,300 | | 51,645 |
Suzlon Energy Ltd. | 300 | | 14,745 |
| | 2,122,960 |
Industrial Conglomerates - 2.2% |
Murray & Roberts Holdings Ltd. | 9,500 | | 141,235 |
Siemens AG sponsored ADR | 3,400 | | 535,024 |
| | 676,259 |
Machinery - 0.3% |
Hansen Transmission International NV | 17,200 | | 98,421 |
TOTAL INDUSTRIALS | | 3,997,101 |
INFORMATION TECHNOLOGY - 31.5% |
Communications Equipment - 8.3% |
Cisco Systems, Inc. (a) | 40,300 | | 1,090,921 |
Corning, Inc. | 50 | | 1,200 |
Infinera Corp. | 3,000 | | 44,520 |
Juniper Networks, Inc. (a) | 14,800 | | 491,360 |
Polycom, Inc. (a) | 7,700 | | 213,906 |
Research In Motion Ltd. (a) | 6,205 | | 703,647 |
| | 2,545,554 |
Computers & Peripherals - 6.2% |
Apple, Inc. (a) | 4,900 | | 970,592 |
Hewlett-Packard Co. | 13,450 | | 678,956 |
Network Appliance, Inc. (a) | 4,200 | | 104,832 |
Western Digital Corp. (a) | 4,500 | | 135,945 |
| | 1,890,325 |
Electronic Equipment & Instruments - 0.7% |
Agilent Technologies, Inc. (a) | 4,900 | | 180,026 |
Hon Hai Precision Industry Co. Ltd. (Foxconn) | 5,000 | | 31,144 |
| | 211,170 |
Internet Software & Services - 6.2% |
Alibaba.com Ltd. | 3,000 | | 10,639 |
Equinix, Inc. (a) | 3,100 | | 313,317 |
Google, Inc. Class A (sub. vtg.) (a) | 1,820 | | 1,258,491 |
Omniture, Inc. (a) | 4,300 | | 143,147 |
ValueClick, Inc. (a) | 6,500 | | 142,350 |
Visual Sciences, Inc. (a) | 1,500 | | 27,720 |
| | 1,895,664 |
IT Services - 2.3% |
Cognizant Technology Solutions Corp. Class A (a) | 13,260 | | 450,044 |
CyberSource Corp. (a) | 1,900 | | 33,763 |
Genpact Ltd. | 9,600 | | 146,208 |
Syntel, Inc. | 1,800 | | 69,336 |
| | 699,351 |
Common Stocks - continued |
| Shares | | Value |
INFORMATION TECHNOLOGY - continued |
Semiconductors & Semiconductor Equipment - 1.7% |
Applied Materials, Inc. | 8,200 | | $ 145,632 |
Intel Corp. | 12,500 | | 333,250 |
Richtek Technology Corp. | 4,000 | | 36,139 |
| | 515,021 |
Software - 6.1% |
Adobe Systems, Inc. (a) | 5,700 | | 243,561 |
BladeLogic, Inc. | 500 | | 14,785 |
Gameloft (a) | 1,900 | | 16,637 |
GSE Systems, Inc. (a) | 6,700 | | 68,608 |
Microsoft Corp. | 15,300 | | 544,680 |
Nintendo Co. Ltd. | 900 | | 533,160 |
Nuance Communications, Inc. (a) | 3,400 | | 63,512 |
Oracle Corp. (a) | 1,950 | | 44,031 |
Salesforce.com, Inc. (a) | 900 | | 56,421 |
VMware, Inc. Class A (d) | 3,225 | | 274,093 |
| | 1,859,488 |
TOTAL INFORMATION TECHNOLOGY | | 9,616,573 |
MATERIALS - 5.9% |
Chemicals - 5.4% |
Calgon Carbon Corp. (a)(d) | 7,200 | | 114,408 |
Monsanto Co. | 9,800 | | 1,094,562 |
Potash Corp. of Saskatchewan, Inc. | 2,100 | | 302,316 |
The Mosaic Co. (a) | 1,600 | | 150,944 |
| | 1,662,230 |
Metals & Mining - 0.5% |
Gold Fields Ltd. sponsored ADR | 800 | | 11,360 |
Goldcorp, Inc. | 500 | | 17,010 |
Kinross Gold Corp. (a) | 800 | | 14,735 |
Lihir Gold Ltd. (a) | 4,600 | | 14,545 |
Titanium Metals Corp. | 2,500 | | 66,125 |
Yamana Gold, Inc. | 1,100 | | 14,271 |
| | 138,046 |
TOTAL MATERIALS | | 1,800,276 |
TELECOMMUNICATION SERVICES - 2.5% |
Wireless Telecommunication Services - 2.5% |
America Movil SAB de CV Series L sponsored ADR | 3,800 | | 233,282 |
|
| Shares | | Value |
American Tower Corp. Class A (a) | 12,000 | | $ 511,200 |
Bharti Airtel Ltd. (a) | 1,257 | | 31,785 |
| | 776,267 |
UTILITIES - 1.6% |
Electric Utilities - 0.5% |
Electricite de France | 800 | | 95,130 |
Public Power Corp. of Greece | 1,100 | | 57,792 |
| | 152,922 |
Independent Power Producers & Energy Traders - 1.1% |
AES Corp. (a) | 15,300 | | 327,267 |
TOTAL UTILITIES | | 480,189 |
TOTAL COMMON STOCKS (Cost $25,605,901) | 29,375,510 |
Money Market Funds - 8.1% |
| | | |
Fidelity Cash Central Fund, 4.58% (b) | 1,399,994 | | 1,399,994 |
Fidelity Securities Lending Cash Central Fund, 4.65% (b)(c) | 1,059,900 | | 1,059,900 |
TOTAL MONEY MARKET FUNDS (Cost $2,459,894) | 2,459,894 |
TOTAL INVESTMENT
PORTFOLIO - 104.2% (Cost $28,065,795) | | 31,835,404 |
NET OTHER ASSETS - (4.2)% | | (1,281,079) |
NET ASSETS - 100% | $ 30,554,325 |
Legend |
(a) Non-income producing |
(b) Affiliated fund that is available only to investment companies and other accounts managed by Fidelity Investments. The rate quoted is the annualized seven-day yield of the fund at period end. A complete unaudited listing of the fund's holdings as of its most recent quarter end is available upon request. |
(c) Investment made with cash collateral received from securities on loan. |
(d) Security or a portion of the security is on loan at period end. |
Affiliated Central Funds |
Information regarding fiscal year to date income earned by the Fund from investments in Fidelity Central Funds is as follows: |
Fund | Income earned |
Fidelity Cash Central Fund | $ 27,246 |
Fidelity Securities Lending Cash Central Fund | 18,056 |
Total | $ 45,302 |
Other Information |
Distribution of investments by country of issue, as a percentage of total net assets, is as follows: |
United States of America | 76.4% |
Canada | 4.1% |
Germany | 2.7% |
Switzerland | 2.0% |
India | 2.0% |
France | 1.8% |
Japan | 1.7% |
Australia | 1.5% |
Netherlands Antilles | 1.3% |
Cayman Islands | 1.0% |
Norway | 1.0% |
Others (individually less than 1%) | 4.5% |
| 100.0% |
See accompanying notes which are an integral part of the financial statements.
Annual Report
Financial Statements
Statement of Assets and Liabilities
| December 31, 2007 |
Assets | | |
Investment in securities, at value
(including securities loaned of $1,007,113) -
See accompanying schedule: Unaffiliated issuers
(cost $25,605,901) | $ 29,375,510 | |
Fidelity Central Funds
(cost $2,459,894) | 2,459,894 | |
Total Investments (cost $28,065,795) | | $ 31,835,404 |
Foreign currency held at value
(cost $1,079) | | 1,096 |
Receivable for investments sold | | 142,092 |
Receivable for fund shares sold | | 30 |
Dividends receivable | | 6,541 |
Distributions receivable from Fidelity Central Funds | | 9,664 |
Prepaid expenses | | 73 |
Receivable from investment adviser for expense reductions | | 4,571 |
Other receivables | | 378 |
Total assets | | 31,999,849 |
| | |
Liabilities | | |
Payable to custodian bank | $ 8,308 | |
Payable for investments purchased | 236,764 | |
Payable for fund shares redeemed | 64,332 | |
Accrued management fee | 13,856 | |
Distribution fees payable | 1,260 | |
Other affiliated payables | 3,466 | |
Other payables and accrued
expenses | 57,638 | |
Collateral on securities loaned, at value | 1,059,900 | |
Total liabilities | | 1,445,524 |
| | |
Net Assets | | $ 30,554,325 |
Net Assets consist of: | | |
Paid in capital | | $ 26,908,466 |
Accumulated undistributed net realized gain (loss) on investments and foreign currency transactions | | (116,677) |
Net unrealized appreciation (depreciation) on investments and assets and liabilities in foreign currencies | | 3,762,536 |
Net Assets | | $ 30,554,325 |
Statement of Assets and Liabilities - continued
| December 31, 2007 |
| | |
Initial Class:
Net Asset Value, offering price and redemption price per share ($13,751,972 ÷ 971,763
shares) | | $ 14.15 |
| | |
Service Class:
Net Asset Value, offering price and redemption price per share ($2,545,180 ÷ 180,823
shares) | | $ 14.08 |
| | |
Service Class 2:
Net Asset Value, offering price and redemption price per share ($5,115,656 ÷ 366,452
shares) | | $ 13.96 |
| | |
Investor Class:
Net Asset Value, offering price and redemption price per share
($9,141,517 ÷ 648,274
shares) | | $ 14.10 |
See accompanying notes which are an integral part of the financial statements.
Annual Report
Financial Statements - continued
Statement of Operations
| Year ended December 31, 2007 |
Investment Income | | |
Dividends | | $ 115,681 |
Interest | | 280 |
Income from Fidelity Central Funds (including $18,056 from security lending) | | 45,302 |
Total income | | 161,263 |
| | |
Expenses | | |
Management fee | $ 106,536 | |
Transfer agent fees | 25,671 | |
Distribution fees | 12,375 | |
Accounting and security lending fees | 7,567 | |
Custodian fees and expenses | 17,441 | |
Independent trustees' compensation | 63 | |
Audit | 51,287 | |
Legal | 318 | |
Miscellaneous | 7,573 | |
Total expenses before reductions | 228,831 | |
Expense reductions | (48,148) | 180,683 |
Net investment income (loss) | | (19,420) |
Realized and Unrealized Gain (Loss) Net realized gain (loss) on: | | |
Investment securities: | | |
Unaffiliated issuers (net of foreign taxes of $123) | 1,504,103 | |
Foreign currency transactions | (953) | |
Total net realized gain (loss) | | 1,503,150 |
Change in net unrealized appreciation (depreciation) on: Investment securities (net of increase in deferred foreign taxes of $6,736) | 2,205,825 | |
Assets and liabilities in foreign currencies | (337) | |
Total change in net unrealized appreciation (depreciation) | | 2,205,488 |
Net gain (loss) | | 3,708,638 |
Net increase (decrease) in net assets resulting from operations | | $ 3,689,218 |
Statement of Changes in Net Assets
| Year ended
December 31,
2007 | Year ended
December 31,
2006 |
Increase (Decrease) in Net Assets | | |
Operations | | |
Net investment income (loss) | $ (19,420) | $ (7,763) |
Net realized gain (loss) | 1,503,150 | (5,272) |
Change in net unrealized appreciation (depreciation) | 2,205,488 | (328,011) |
Net increase (decrease) in net assets resulting from operations | 3,689,218 | (341,046) |
Distributions to shareholders from net investment income | - | (7,983) |
Distributions to shareholders from net realized gain | (1,360,022) | - |
Total distributions | (1,360,022) | (7,983) |
Share transactions - net increase (decrease) | 11,664,213 | (12,833,989) |
Total increase (decrease) in net assets | 13,993,409 | (13,183,018) |
| | |
Net Assets | | |
Beginning of period | 16,560,916 | 29,743,934 |
End of period | $ 30,554,325 | $ 16,560,916 |
See accompanying notes which are an integral part of the financial statements.
Annual Report
Financial Highlights - Initial Class
Years ended December 31, | 2007 | 2006 | 2005 | 2004 | 2003 |
Selected Per-Share Data | | | | | |
Net asset value, beginning of period | $ 12.07 | $ 11.94 | $ 11.14 | $ 11.79 | $ 9.68 |
Income from Investment Operations | | | | | |
Net investment income (loss) C | - I | - I | .01 | .04 F | (.01) |
Net realized and unrealized gain (loss) | 2.74 | .13 G | .83 | .23 | 2.81 |
Total from investment operations | 2.74 | .13 | .84 | .27 | 2.80 |
Distributions from net investment income | - | - I | (.01) | (.02) | (.01) |
Distributions from net realized gain | (.66) | - | (.04) | (.90) | (.68) |
Total distributions | (.66) | - | (.04) J | (.92) | (.69) |
Net asset value, end of period | $ 14.15 | $ 12.07 | $ 11.94 | $ 11.14 | $ 11.79 |
Total Return A,B | 22.67% | 1.12% | 7.57% | 2.31% | 29.05% |
Ratios to Average Net Assets D,H | | | | | |
Expenses before reductions | 1.10% | .98% | 1.01% | 1.94% | 2.68% |
Expenses net of fee waivers, if any | .85% | .86% | .85% | 1.00% | 1.14% |
Expenses net of all reductions | .84% | .86% | .81% | .95% | 1.09% |
Net investment income (loss) | -% K | .03% | .12% | .35% | (.07)% |
Supplemental Data | | | | | |
Net assets, end of period (000 omitted) | $ 13,752 | $ 7,414 | $ 22,750 | $ 1,938 | $ 1,885 |
Portfolio turnover rate E | 167% | 93% | 91% | 151% | 149% |
A Total returns do not reflect charges attributable to your insurance company's separate account. Inclusion of these charges would reduce the total returns shown. B Total returns would have been lower had certain expenses not been reduced during the periods shown. C Calculated based on average shares outstanding during the period. D Fees and expenses of the underlying Fidelity Central Funds are not included in the Fund's expense ratio. The Fund indirectly bears its proportionate share of the expenses of any underlying Fidelity Central Funds. E Amount does not include the portfolio activity of any underlying Fidelity Central Funds. F Investment income per share reflects a special dividend which amounted to $.05 per share. G The amount shown for a share outstanding does not correspond with the aggregate net gain (loss) on investments for the period due to the timing of sales and repurchases of shares in relation to fluctuating market values of the investments of the Fund. H Expense ratios reflect operating expenses of the class. Expenses before reductions do not reflect amounts reimbursed by the investment adviser or reductions from brokerage service arrangements or other expense offset arrangements and do not represent the amount paid by the class during periods when reimbursements or reductions occur. Expenses net of fee waivers reflect expenses after reimbursement by the investment adviser but prior to reductions from brokerage service arrangements or other expense offset arrangements. Expenses net of all reductions represent the net expenses paid by the class. I Amount represents less than $.01 per share. J Total distributions of $.040 per share is comprised of distributions from net investment income of $.005 and distributions from net realized gain of $.035 per share. K Amount represents less than .01%. |
Financial Highlights - Service Class
Years ended December 31, | 2007 | 2006 | 2005 | 2004 | 2003 |
Selected Per-Share Data | | | | | |
Net asset value, beginning of period | $ 12.02 | $ 11.90 | $ 11.12 | $ 11.77 | $ 9.68 |
Income from Investment Operations | | | | | |
Net investment income (loss) C | (.01) | (.01) | - J | .03 F | (.02) |
Net realized and unrealized gain (loss) | 2.73 | .13 G | .82 | .24 | 2.80 |
Total from investment operations | 2.72 | .12 | .82 | .27 | 2.78 |
Distributions from net investment income | - | - | (.01) | (.02) | (.01) |
Distributions from net realized gain | (.66) | - | (.04) | (.90) | (.68) |
Total distributions | (.66) | - | (.04) I | (.92) | (.69) |
Net asset value, end of period | $ 14.08 | $ 12.02 | $ 11.90 | $ 11.12 | $ 11.77 |
Total Return A,B | 22.60% | 1.01% | 7.41% | 2.32% | 28.85% |
Ratios to Average Net Assets D,H | | | | | |
Expenses before reductions | 1.17% | 1.16% | 1.36% | 1.97% | 2.74% |
Expenses net of fee waivers, if any | .95% | .96% | .97% | 1.10% | 1.24% |
Expenses net of all reductions | .95% | .95% | .92% | 1.05% | 1.19% |
Net investment income (loss) | (.10)% | (.07)% | -%K | .25% | (.17)% |
Supplemental Data | | | | | |
Net assets, end of period (000 omitted) | $ 2,545 | $ 2,077 | $ 2,056 | $ 1,914 | $ 1,871 |
Portfolio turnover rate E | 167% | 93% | 91% | 151% | 149% |
A Total returns do not reflect charges attributable to your insurance company's separate account. Inclusion of these charges would reduce the total returns shown. B Total returns would have been lower had certain expenses not been reduced during the periods shown. C Calculated based on average shares outstanding during the period. D Fees and expenses of the underlying Fidelity Central Funds are not included in the Fund's expense ratio. The Fund indirectly bears its proportionate share of the expenses of any underlying Fidelity Central Funds. E Amount does not include the portfolio activity of any underlying Fidelity Central Funds. F Investment income per share reflects a special dividend which amounted to $.05 per share. G The amount shown for a share outstanding does not correspond with the aggregate net gain (loss) on investments for the period due to the timing of sales and repurchases of shares in relation to fluctuating market values of the investments of the Fund. H Expense ratios reflect operating expenses of the class. Expenses before reductions do not reflect amounts reimbursed by the investment adviser or reductions from brokerage service arrangements or other expense offset arrangements and do not represent the amount paid by the class during periods when reimbursements or reductions occur. Expenses net of fee waivers reflect expenses after reimbursement by the investment adviser but prior to reductions from brokerage service arrangements or other expense offset arrangements. Expenses net of all reductions represent the net expenses paid by the class. I Total distributions of $.040 per share is comprised of distributions from net investment income of $.005 and distributions from net realized gain of $.035 per share. J Amount represents less than $.01 per share. K Amount represents less than .01%. |
See accompanying notes which are an integral part of the financial statements.
Annual Report
Financial Highlights - Service Class 2
Years ended December 31, | 2007 | 2006 | 2005 | 2004 | 2003 |
Selected Per-Share Data | | | | | |
Net asset value, beginning of period | $ 11.95 | $ 11.84 | $ 11.08 | $ 11.75 | $ 9.68 |
Income from Investment Operations | | | | | |
Net investment income (loss) C | (.03) | (.03) | (.02) | .01 F | (.04) |
Net realized and unrealized gain (loss) | 2.70 | .14 G | .82 | .24 | 2.80 |
Total from investment operations | 2.67 | .11 | .80 | .25 | 2.76 |
Distributions from net investment income | - | - | (.01) | (.02) | (.01) |
Distributions from net realized gain | (.66) | - | (.04) | (.90) | (.68) |
Total distributions | (.66) | - | (.04) I | (.92) | (.69) |
Net asset value, end of period | $ 13.96 | $ 11.95 | $ 11.84 | $ 11.08 | $ 11.75 |
Total Return A,B | 22.31% | .93% | 7.25% | 2.14% | 28.64% |
Ratios to Average Net Assets D,H | | | | | |
Expenses before reductions | 1.38% | 1.35% | 1.51% | 2.12% | 2.89% |
Expenses net of fee waivers, if any | 1.10% | 1.11% | 1.12% | 1.25% | 1.39% |
Expenses net of all reductions | 1.09% | 1.10% | 1.07% | 1.20% | 1.34% |
Net investment income (loss) | (.25)% | (.22)% | (.15)% | .10% | (.33)% |
Supplemental Data | | | | | |
Net assets, end of period (000 omitted) | $ 5,116 | $ 3,220 | $ 2,729 | $ 2,544 | $ 2,491 |
Portfolio turnover rate E | 167% | 93% | 91% | 151% | 149% |
A Total returns do not reflect charges attributable to your insurance company's separate account. Inclusion of these charges would reduce the total returns shown. B Total returns would have been lower had certain expenses not been reduced during the periods shown. C Calculated based on average shares outstanding during the period. D Fees and expenses of the underlying Fidelity Central Funds are not included in the Fund's expense ratio. The Fund indirectly bears its proportionate share of the expenses of any underlying Fidelity Central Funds. E Amount does not include the portfolio activity of any underlying Fidelity Central Funds. F Investment income per share reflects a special dividend which amounted to $.05 per share. G The amount shown for a share outstanding does not correspond with the aggregate net gain (loss) on investments for the period due to the timing of sales and repurchases of shares in relation to fluctuating market values of the investments of the Fund. H Expense ratios reflect operating expenses of the class. Expenses before reductions do not reflect amounts reimbursed by the investment adviser or reductions from brokerage service arrangements or other expense offset arrangements and do not represent the amount paid by the class during periods when reimbursements or reductions occur. Expenses net of fee waivers reflect expenses after reimbursement by the investment adviser but prior to reductions from brokerage service arrangements or other expense offset arrangements. Expenses net of all reductions represent the net expenses paid by the class. I Total distributions of $.040 per share is comprised of distributions from net investment income of $.005 and distributions from net realized gain of $.035 per share. |
Financial Highlights - Investor Class
Years ended December 31, | 2007 | 2006 | 2005 I |
Selected Per-Share Data | | | |
Net asset value, beginning of period | $ 12.05 | $ 11.94 | $ 11.64 |
Income from Investment Operations | | | |
Net investment income (loss) E | (.02) | (.01) | - K |
Net realized and unrealized gain (loss) | 2.73 | .12 H | .30 |
Total from investment operations | 2.71 | .11 | .30 |
Distributions from net investment income | - | - K | - |
Distributions from net realized gain | (.66) | - | - |
Total distributions | (.66) | - | - |
Net asset value, end of period | $ 14.10 | $ 12.05 | $ 11.94 |
Total Return B,C,D | 22.45% | .95% | 2.58% |
Ratios to Average Net Assets F,J | | | |
Expenses before reductions | 1.22% | 1.21% | 1.16% A |
Expenses net of fee waivers, if any | 1.00% | 1.01% | 1.00% A |
Expenses net of all reductions | .99% | 1.01% | .96% A |
Net investment income (loss) | (.15)% | (.12)% | (.03)% A |
Supplemental Data | | | |
Net assets, end of period (000 omitted) | $ 9,142 | $ 3,849 | $ 2,209 |
Portfolio turnover rate G | 167% | 93% | 91% |
A Annualized B Total returns for periods of less than one year are not annualized. C Total returns do not reflect charges attributable to your insurance company's separate account. Inclusion of these charges would reduce the total returns shown. D Total returns would have been lower had certain expenses not been reduced during the periods shown. E Calculated based on average shares outstanding during the period. F Fees and expenses of the underlying Fidelity Central Funds are not included in the Fund's expense ratio. The Fund indirectly bears its proportionate share of the expenses of any underlying Fidelity Central Funds. G Amount does not include the portfolio activity of any underlying Fidelity Central Funds. H The amount shown for a share outstanding does not correspond with the aggregate net gain (loss) on investments for the period due to the timing of sales and repurchases of shares in relation to fluctuating market values of the investments of the Fund. I For the period July 21, 2005 (commencement of sale of shares) to December 31, 2005. J Expense ratios reflect operating expenses of the class. Expenses before reductions do not reflect amounts reimbursed by the investment adviser or reductions from brokerage service arrangements or other expense offset arrangements and do not represent the amount paid by the class during periods when reimbursements or reductions occur. Expense ratios before reductions for start-up periods may not be representative of longer-term operating periods. Expenses net of fee waivers reflect expenses after reimbursement by the investment adviser but prior to reductions from brokerage service arrangements or other expense offset arrangements. Expenses net of all reductions represent the net expenses paid by the class. K Amount represents less than $.01 per share. |
See accompanying notes which are an integral part of the financial statements.
Annual Report
Notes to Financial Statements
For the period ended December 31, 2007
1. Organization.
VIP Growth Stock Portfolio (the Fund) is a fund of Variable Insurance Products Fund IV (the trust) and is authorized to issue an unlimited number of shares. The trust is registered under the Investment Company Act of 1940, as amended (the 1940 Act), as an open-end management investment company organized as a Massachusetts business trust. Shares of the Fund may only be purchased by insurance companies for the purpose of funding variable annuity or variable life insurance contracts. The Fund offers the following classes of shares: Initial Class shares, Service Class shares, Service Class 2 shares and Investor Class shares. All classes have equal rights and voting privileges, except for matters affecting a single class. Investment income, realized and unrealized capital gains and losses, the common expenses of the Fund, and certain fund-level expense reductions, if any, are allocated on a pro rata basis to each class based on the relative net assets of each class to the total net assets of the Fund. Each class differs with respect to transfer agent and distribution and service plan fees incurred. Certain expense reductions also differ by class.
2. Investments in Fidelity Central Funds.
The Fund may invest in Fidelity Central Funds, which are open-end investment companies available only to other investment companies and accounts managed by Fidelity Management & Research Company (FMR) and its affiliates. The Fund's Schedule of Investments lists each of the Fidelity Central Funds as an investment of the Fund, but does not include the underlying holdings of each Fidelity Central Fund. As an Investing Fund, the Fund indirectly bears its proportionate share of the expenses of the underlying Fidelity Central Funds.
The Money Market Central Funds seek preservation of capital and current income and are managed by Fidelity Investments Money Management, Inc. (FIMM), an affiliate of FMR.
A complete list of holdings for each Fidelity Central Fund is available upon request or at the SEC's web site at www.sec.gov. In addition, the financial statements of the Fidelity Central Funds, which are not covered by the Fund's Report of Independent Registered Public Accounting Firm, are available on the SEC's web site or upon request.
3. Significant Accounting Policies.
The financial statements have been prepared in conformity with accounting principles generally accepted in the United States of America, which require management to make certain estimates and assumptions at the date of the financial statements. The following summarizes the significant accounting policies of the Fund:
Security Valuation. Investments are valued and net asset value (NAV) per share is calculated (NAV calculation) as of the close of business of the New York Stock Exchange (NYSE), normally 4:00 p.m. Eastern time. Wherever possible, the Fund uses independent pricing services approved by the Board of Trustees to value its investments.
Equity securities, including restricted securities, for which market quotations are readily available, are valued at the last reported sale price or official closing price as reported by an independent pricing service on the primary market or exchange on which they are traded. In the event there were no sales during the day or closing prices are not available, securities are valued at the last quoted bid price. Investments in open-end mutual funds, including the Fidelity Central Funds, are valued at their closing net asset value each business day. Short-term securities with remaining maturities of sixty days or less for which quotations are not readily available are valued at amortized cost, which approximates value.
When current market prices or quotations are not readily available or do not accurately reflect fair value, valuations may be determined in accordance with procedures adopted by the Board of Trustees. For example, when developments occur between the close of a market and the close of the NYSE that may materially affect the value of some or all of the securities, or when trading in a security is halted, those securities may be fair valued. Factors used in the determination of fair value may include monitoring news to identify significant market or security specific events such as changes in the value of U.S. securities markets, reviewing developments in foreign markets and evaluating the performance of ADRs, futures contracts and exchange-traded funds. Because the Fund's utilization of fair value pricing depends on market activity, the frequency with which fair value pricing is used cannot be predicted and may be utilized to a significant extent. The value of securities used for NAV calculation under fair value pricing may differ from published prices for the same securities.
Foreign Currency. The Fund uses foreign currency contracts to facilitate transactions in foreign-denominated securities. Losses from these transactions may arise from changes in the value of the foreign currency or if the counterparties do not perform under the contracts' terms.
Foreign-denominated assets, including investment securities, and liabilities are translated into U.S. dollars at the exchange rate at period end. Purchases and sales of investment securities, income and dividends received and expenses denominated in foreign currencies are translated into U.S. dollars at the exchange rate in effect on the transaction date.
The effects of exchange rate fluctuations on investments are included with the net realized and unrealized gain (loss) on investment securities. Other foreign currency transactions resulting in realized and unrealized gain (loss) are disclosed separately.
Annual Report
Notes to Financial Statements - continued
3. Significant Accounting Policies - continued
Investment Transactions and Income. For financial reporting purposes, the Fund's investment holdings and NAV include trades executed through the end of the last business day of the period. The NAV for processing shareholder transactions includes trades executed through the end of the prior business day. Gains and losses on securities sold are determined on the basis of identified cost and may include proceeds received from litigation. Dividend income is recorded on the ex-dividend date, except for certain dividends from foreign securities where the ex-dividend date may have passed, which are recorded as soon as the Fund is informed of the ex-dividend date. Non-cash dividends included in dividend income, if any, are recorded at the fair market value of the securities received. Distributions received on securities that represent a return of capital or capital gain are recorded as a reduction of cost of investments and/or as a realized gain. The Fund estimates the components of distributions received that may be considered return of capital distributions or capital gain distributions. Interest income and distributions from the Fidelity Central Funds are accrued as earned. Interest income includes coupon interest and amortization of premium and accretion of discount on debt securities. Investment income is recorded net of foreign taxes withheld where recovery of such taxes is uncertain.
Expenses. Most expenses of the trust can be directly attributed to a fund. Expenses which cannot be directly attributed are apportioned among each Fund in the trust. Expense estimates are accrued in the period to which they relate and adjustments are made when actual amounts are known.
Income Tax Information and Distributions to Shareholders. Each year, the Fund intends to qualify as a regulated investment company by distributing substantially all of its taxable income and realized gains under Subchapter M of the Internal Revenue Code and filing its U.S. federal tax return. As a result, no provision for income taxes is required. The Fund adopted the provisions of FASB Interpretation No. 48, Accounting for Uncertainties in Income Taxes (FIN 48) on June 29, 2007. FIN 48 sets forth a minimum threshold for financial statement recognition of the benefit of a tax position taken or expected to be taken in a tax return. The implementation of FIN 48 did not result in any unrecognized tax benefits in the accompanying financial statements. Each of the Fund's federal tax returns for the three fiscal years remains subject to examination by the Internal Revenue Service. Foreign taxes are provided for based on the Fund's understanding of the tax rules and rates that exist in the foreign markets in which it invests.
Distributions are recorded on the ex-dividend date. Income dividends and capital gain distributions are declared separately for each class. Income and capital gain distributions are determined in accordance with income tax regulations, which may differ from generally accepted accounting principles.
Capital accounts within the financial statements are adjusted for permanent book-tax differences. These adjustments have no impact on net assets or the results of operations. Temporary book-tax differences will reverse in a subsequent period.
Book-tax differences are primarily due to foreign currency transactions, partnerships, passive foreign investment companies (PFIC), capital loss carryforwards and losses deferred due to wash sales and excise tax regulations.
The tax-basis components of distributable earnings and the federal tax cost as of period end were as follows:
Unrealized appreciation | $ 4,587,169 |
Unrealized depreciation | (863,416) |
Net unrealized appreciation (depreciation) | 3,723,753 |
| |
Cost for federal income tax purposes | $ 28,111,651 |
The tax character of distributions paid was as follows:
| December 31, 2007 | December 31, 2006 |
Ordinary Income | $ - | $ 7,983 |
Long-term Capital Gains | 1,360,022 | - |
Total | $ 1,360,022 | $ 7,983 |
New Accounting Pronouncement. In September 2006, Statement of Financial Accounting Standards No. 157, Fair Value Measurements (SFAS 157), was issued and is effective for fiscal years beginning after November 15, 2007. SFAS 157 defines fair value, establishes a framework for measuring fair value and expands disclosures about fair value measurements. Management is currently evaluating the impact the adoption of SFAS 157 will have on the Fund's financial statement disclosures.
4. Operating Policies.
Repurchase Agreements. FMR has received an Exemptive Order from the Securities and Exchange Commission (the SEC) which permits the Fund and other affiliated entities of FMR to transfer uninvested cash balances into joint trading accounts which are then invested in repurchase agreements. The Fund may also invest directly with institutions in repurchase agreements. Repurchase agreements are collateralized by government or non-government securities. Upon settlement date, collateral is held in segregated accounts with custodian banks and may be obtained in the event of a default of the counterparty. The Fund monitors, on a daily basis, the value of the collateral to ensure it is at least equal to the principal amount of the
Annual Report
4. Operating Policies - continued
Repurchase Agreements - continued
repurchase agreement (including accrued interest). In the event of a default by the counterparty, realization of the collateral proceeds could be delayed, during which time the value of the collateral may decline.
5. Purchases and Sales of Investments.
Purchases and sales of securities, other than short-term securities, aggregated $40,837,353 and $31,594,728, respectively.
6. Fees and Other Transactions with Affiliates.
Management Fee. FMR and its affiliates provide the Fund with investment management related services for which the Fund pays a monthly management fee. The management fee is the sum of an individual fund fee rate that is based on an annual rate of .30% of the Fund's average net assets and a group fee rate that averaged .26% during the period. The group fee rate is based upon the average net assets of all the mutual funds advised by FMR. The group fee rate decreases as assets under management increase and increases as assets under management decrease. For the period, the total annual management fee rate was .56% of the Fund's average net assets.
Distribution and Service Plan. In accordance with Rule 12b-1 of the 1940 Act, the Fund has adopted separate 12b-1 Plans for each Service Class of shares. Each Service Class pays Fidelity Distributors Corporation (FDC), an affiliate of FMR, a service fee. For the period, the service fee is based on an annual rate of .10% of Service Class' average net assets and .25% of Service Class 2's average net assets.
For the period, each class paid FDC the following amounts, all of which were re-allowed to insurance companies for the distribution of shares and providing shareholder support services:
Service Class | $ 2,312 |
Service Class 2 | 10,063 |
| $ 12,375 |
Transfer Agent Fees. Fidelity Investments Institutional Operations Company, Inc. (FIIOC), an affiliate of FMR, is the Fund's transfer, dividend disbursing, and shareholder servicing agent. FIIOC receives an asset-based fee with respect to each class. Each class with the exception of Investor Class pays a transfer agent fee, excluding out of pocket expenses, equal to an annual rate of .07% of average net assets. Investor Class pays a monthly asset-based transfer agent fee of .18% of average net assets. The total transfer agent fees paid by each class to FIIOC, including out of pocket expenses, were as follows:
Initial Class | $ 8,162 |
Service Class | 1,526 |
Service Class 2 | 4,913 |
Investor Class | 11,070 |
| $ 25,671 |
Effective February 1, 2008, the Board of Trustees approved a decrease to Investor Class' asset-based fee from .18% to .15% of average net assets.
Accounting and Security Lending Fees. Fidelity Service Company, Inc. (FSC), an affiliate of FMR, maintains the Fund's accounting records. The accounting fee is based on the level of average net assets for the month. Under a separate contract, FSC administers the security lending program. The security lending fee is based on the number and duration of lending transactions.
Brokerage Commissions. The Fund placed a portion of its portfolio transactions with brokerage firms which are affiliates of the investment adviser. The commissions paid to these affiliated firms were $1,936 for the period.
7. Committed Line of Credit.
The Fund participates with other funds managed by FMR in a $4.2 billion credit facility (the "line of credit") to be utilized for temporary or emergency purposes to fund shareholder redemptions or for other short-term liquidity purposes. The Fund has agreed to pay commitment fees on its pro rata portion of the line of credit, which amounted to $35 and is reflected in Miscellaneous Expense on the Statement of Operations. During the period, there were no borrowings on this line of credit.
Annual Report
Notes to Financial Statements - continued
8. Security Lending.
The Fund lends portfolio securities from time to time in order to earn additional income. On the settlement date of the loan, the Fund receives collateral (in the form of U.S. Treasury obligations, letters of credit and/or cash) against the loaned securities and maintains collateral in an amount not less than 100% of the market value of the loaned securities during the period of the loan. The market value of the loaned securities is determined at the close of business of the Fund and any additional required collateral is delivered to the Fund on the next business day. If the borrower defaults on its obligation to return the securities loaned because of insolvency or other reasons, a fund could experience delays and costs in recovering the securities loaned or in gaining access to the collateral. Any cash collateral received is invested in the Fidelity Securities Lending Cash Central Fund. The value of loaned securities and cash collateral at period end are disclosed on the Fund's Statement of Assets and Liabilities. Security lending income represents the income earned on investing cash collateral, less fees and expenses associated with the loan, plus any premium payments that may be received on the loan of certain types of securities. Security lending income is presented in the Statement of Operations as a component of income from Fidelity Central Funds.
9. Expense Reductions.
FMR voluntarily agreed to reimburse each class to the extent annual operating expenses exceeded certain levels of average net assets as noted in the table below. Some expenses, for example interest expense, including commitment fees, are excluded from this reimbursement.
The following classes were in reimbursement during the period:
| Expense
Limitations | Reimbursement
from adviser |
Initial Class | .85% | $ 19,829 |
Service Class | .95% | 5,168 |
Service Class 2 | 1.10% | 11,287 |
Investor Class | 1.00% | 11,035 |
| | $ 47,319 |
Effective February 1, 2008, the expense limitation changed to .93% for Investor Class.
Many of the brokers with whom FMR places trades on behalf of the Fund provided services to the Fund in addition to trade execution. These services included payments of certain expenses on behalf of the Fund totaling $825 for the period.
10. Other.
The Fund's organizational documents provide former and current trustees and officers with a limited indemnification against liabilities arising in connection with the performance of their duties to the Fund. In the normal course of business, the Fund may also enter into contracts that provide general indemnifications. The Fund's maximum exposure under these arrangements is unknown as this would be dependent on future claims that may be made against the Fund. The risk of material loss from such claims is considered remote.
At the end of the period, FMR or its affiliates were the owners of record of 94% of the total outstanding shares of the Fund.
The United States Securities and Exchange Commission ("SEC") is conducting an investigation of FMR (covering the years 2002 to 2004) arising from gifts, gratuities and business entertainment provided by certain brokers to certain individuals who were employed on FMR's domestic equity trading desk during that period. FMR is in discussions with the SEC staff regarding the possible resolution of the matter, but as of period-end no final resolution has been reached.
In December 2006, the Independent Trustees completed their own investigation of the matter with the assistance of independent counsel. The Independent Trustees and FMR agree that, despite the absence of proof that the Fidelity mutual funds experienced diminished execution quality as a result of the improper receipt of gifts and business entertainment, the conduct at issue was serious and is worthy of redress. Accordingly, the Independent Trustees have requested and FMR has agreed to pay $42 million to Fidelity mutual funds, plus interest to be determined at the time that payment is made. A method of allocating this payment among the funds has not yet been determined. The total payment to the Fund is not anticipated to have a material impact on the Fund's net assets. In addition, FMR reimbursed related legal expenses which are recorded in the accompanying Statement of Operations as an expense reduction.
Annual Report
11. Distributions to Shareholders.
Distributions to shareholders of each class were as follows:
Years ended December 31, | 2007 | 2006 |
From net investment income | | |
Initial Class | $ - | $ 7,399 |
Investor Class | - | 584 |
Total | $ - | $ 7,983 |
From net realized gain | | |
Initial Class | $ 611,437 | $ - |
Service Class | 114,028 | - |
Service Class 2 | 230,890 | - |
Investor Class | 403,667 | - |
Total | $ 1,360,022 | $ - |
12. Share Transactions.
Transactions for each class of shares were as follows:
| Shares | Dollars |
Years ended December 31, | 2007 | 2006 | 2007 | 2006 |
Initial Class | | | | |
Shares sold | 548,074 | 205,736 | $ 7,846,894 | $ 2,451,301 |
Reinvestment of distributions | 42,938 | 611 | 611,437 | 7,399 |
Shares redeemed | (233,361) | (1,497,074) | (2,969,140) | (17,419,330) |
Net increase (decrease) | 357,651 | (1,290,727) | $ 5,489,191 | $ (14,960,630) |
Service Class | | | | |
Reinvestment of distributions | 8,053 | - | 114,028 | - |
Net increase (decrease) | 8,053 | - | $ 114,028 | $ - |
Service Class 2 | | | | |
Shares sold | 111,476 | 43,637 | $ 1,498,608 | $ 488,801 |
Reinvestment of distributions | 16,445 | - | 230,890 | - |
Shares redeemed | (30,981) | (4,553) | (410,132) | (51,413) |
Net increase (decrease) | 96,940 | 39,084 | $ 1,319,366 | $ 437,388 |
Investor Class | | | | |
Shares sold | 557,173 | 498,339 | $ 7,720,308 | $ 5,920,324 |
Reinvestment of distributions | 28,447 | 48 | 403,667 | 584 |
Shares redeemed | (256,772) | (364,011) | (3,382,347) | (4,231,655) |
Net increase (decrease) | 328,848 | 134,376 | $ 4,741,628 | $ 1,689,253 |
Annual Report
Report of Independent Registered Public Accounting Firm
To the Trustees of Variable Insurance Products Fund IV and the Shareholders of VIP Growth Stock Portfolio:
In our opinion, the accompanying statement of assets and liabilities, including the schedule of investments, and the related statements of operations and of changes in net assets and the financial highlights present fairly, in all material respects, the financial position of VIP Growth Stock Portfolio (a fund of Variable Insurance Products Fund IV) at December 31, 2007, the results of its operations for the year then ended, the changes in its net assets for each of the two years in the period then ended and the financial highlights for each of the periods indicated, in conformity with accounting principles generally accepted in the United States of America. These financial statements and financial highlights (hereafter referred to as "financial statements") are the responsibility of the VIP Growth Stock Portfolio's management. Our responsibility is to express an opinion on these financial statements based on our audits. We conducted our audits of these financial statements in accordance with the standards of the Public Company Accounting Oversight Board (United States). Those standards require that we plan and perform the audit to obtain reasonable assurance about whether the financial statements are free of material misstatement. An audit includes examining, on a test basis, evidence supporting the amounts and disclosures in the financial statements, assessing the accounting principles used and significant estimates made by management, and evaluating the overall financial statement presentation. We believe that our audits, which included confirmation of securities at December 31, 2007 by correspondence with the custodian and brokers, provide a reasonable basis for our opinion.
/s/ PricewaterhouseCoopers LLP
PricewaterhouseCoopers LLP
Boston, Massachusetts
February 15, 2008
Annual Report
Trustees and Officers
The Trustees, Members of the Advisory Board, and executive officers of the trust and fund, as applicable, are listed below. The Board of Trustees governs the fund and is responsible for protecting the interests of shareholders. The Trustees are experienced executives who meet periodically throughout the year to oversee the fund's activities, review contractual arrangements with companies that provide services to the fund, and review the fund's performance. Except for James C. Curvey, each of the Trustees oversees 373 funds advised by FMR or an affiliate. Mr. Curvey oversees 368 funds advised by FMR or an affiliate.
The Trustees hold office without limit in time except that (a) any Trustee may resign; (b) any Trustee may be removed by written instrument, signed by at least two-thirds of the number of Trustees prior to such removal; (c) any Trustee who requests to be retired or who has become incapacitated by illness or injury may be retired by written instrument signed by a majority of the other Trustees; and (d) any Trustee may be removed at any special meeting of shareholders by a two-thirds vote of the outstanding voting securities of the trust. Each Trustee who is not an interested person (as defined in the 1940 Act) (Independent Trustee), shall retire not later than the last day of the calendar year in which his or her 72nd birthday occurs. The Independent Trustees may waive this mandatory retirement age policy with respect to individual Trustees. The executive officers and Advisory Board Members hold office without limit in time, except that any officer and Advisory Board Member may resign or may be removed by a vote of a majority of the Trustees at any regular meeting or any special meeting of the Trustees. Except as indicated, each individual has held the office shown or other offices in the same company for the past five years.
The fund's Statement of Additional Information (SAI) includes more information about the Trustees. To request a free copy, call Fidelity at 1-877-208-0098.
Interested Trustees*:
Correspondence intended for each Trustee who is an interested person may be sent to Fidelity Investments, 82 Devonshire Street, Boston, Massachusetts 02109.
Name, Age; Principal Occupation |
Edward C. Johnson 3d (77) |
| Year of Election or Appointment: 1983 Mr. Johnson is Chairman of the Board of Trustees. Mr. Johnson serves as President (2006-present), Chief Executive Officer, Chairman, and a Director of FMR LLC; Chairman and a Director of FMR; Chairman and a Director of Fidelity Research & Analysis Company (FRAC); Chairman and a Director of Fidelity Investments Money Management, Inc.; and Chairman (2001-present) and a Director of FMR Co., Inc. In addition, Mr. Johnson serves as Chairman and Director of Fidelity International Limited (FIL). Mr. Edward C. Johnson 3d and Mr. Arthur E. Johnson are not related. |
James C. Curvey (72) |
| Year of Election or Appointment: 2007 Mr. Curvey also serves as Trustee (2007-present) or Member of the Advisory Board (2007-present) of other investment companies advised by FMR. Mr. Curvey is a Director of FMR and FMR Co., Inc. (2007-present). Mr. Curvey is also Vice Chairman (2006-
present) and Director of FMR LLC. Mr. Curvey joined Fidelity in 1982 and served in numerous senior management positions, including President and Chief Operating Officer of FMR LLC (1997-2000) and President of Fidelity Strategic Investments (2000-
2002). In addition, he serves as a member of the Board of Directors of Geerlings & Wade, Inc. (wine distribution). |
* Trustees have been determined to be "Interested Trustees" by virtue of, among other things, their affiliation with the trust or various entities under common control with FMR. FMR Corp. merged with and into FMR LLC on October 1, 2007. Any references to FMR LLC for prior periods are deemed to be references to the prior entity.
Independent Trustees:
Correspondence intended for each Independent Trustee (that is, the Trustees other than the Interested Trustees) may be sent to Fidelity Investments, P.O. Box 55235, Boston, Massachusetts 02205-5235.
Name, Age; Principal Occupation |
Dennis J. Dirks (59) |
| Year of Election or Appointment: 2005 Prior to his retirement in May 2003, Mr. Dirks was Chief Operating Officer and a member of the Board of The Depository Trust & Clearing Corporation (DTCC) (1999-2003). He also served as President, Chief Operating Officer, and Board member of The Depository Trust Company (DTC) (1999-2003) and President and Board member of the National Securities Clearing Corporation (NSCC) (1999-2003). In addition, Mr. Dirks served as Chief Executive Officer and Board member of the Government Securities Clearing Corporation (2001-2003) and Chief Executive Officer and Board member of the Mortgage-Backed Securities Clearing Corporation (2001-2003). Mr. Dirks also serves as a Trustee and a member of the Finance Committee of Manhattan College (2005-present) and a Trustee and a member of the Finance Committee of AHRC of Nassau County (2006-present). |
Albert R. Gamper, Jr. (65) |
| Year of Election or Appointment: 2006 Prior to his retirement in December 2004, Mr. Gamper served as Chairman of the Board of CIT Group Inc. (commercial finance). During his tenure with CIT Group Inc. Mr. Gamper served in numerous senior management positions, including Chairman (1987-
1989; 1999-2001; 2002-2004), Chief Executive Officer (1987-2004), and President (1989-2002). He currently serves as a member of the Board of Directors of Public Service Enterprise Group (utilities, 2001-present), Chairman of the Board of Governors, Rutgers University (2004-present), and Chairman of the Board of Saint Barnabas Health Care System. |
George H. Heilmeier (71) |
| Year of Election or Appointment: 2004 Dr. Heilmeier is Chairman Emeritus of Telcordia Technologies (communication software and systems), where prior to his retirement, he served as company Chairman and Chief Executive Officer. He currently serves on the Boards of Directors of The Mitre Corporation (systems engineering and information technology support for the government), and HRL Laboratories (private research and development, 2004-present). He is Chairman of the General Motors Science & Technology Advisory Board and a Life Fellow of the Institute of Electrical and Electronics Engineers (IEEE). Dr. Heilmeier is a member of the Defense Science Board and the National Security Agency Advisory Board. He is also a member of the National Academy of Engineering, the American Academy of Arts and Sciences, and the Board of Overseers of the School of Engineering and Applied Science of the University of Pennsylvania. Previously, Dr. Heilmeier served as a Director of TRW Inc. (automotive, space, defense, and information technology, 1992-2002), Compaq (1994-2002), Automatic Data Processing, Inc. (ADP) (technology-based business outsourcing, 1995-2002), INET Technologies Inc. (telecommunications network surveillance, 2001-2004), and Teletech Holdings (customer management services). He is the recipient of the 2005 Kyoto Prize in Advanced Technology for his invention of the liquid crystal display, and a member of the Consumer Electronics Hall of Fame. |
James H. Keyes (67) |
| Year of Election or Appointment: 2007 Prior to his retirement in 2003, Mr. Keyes was Chairman, President, and Chief Executive Officer of Johnson Controls, Inc. (automotive supplier, 1993-2003). He currently serves as a member of the boards of LSI Logic Corporation (semiconductor technologies), Navistar International Corporation (manufacture and sale of trucks, buses, and diesel engines, 2002-present), and Pitney Bowes, Inc. (integrated mail, messaging, and document management solutions). |
Marie L. Knowles (61) |
| Year of Election or Appointment: 2001 Prior to Ms. Knowles' retirement in June 2000, she served as Executive Vice President and Chief Financial Officer of Atlantic Richfield Company (ARCO) (diversified energy, 1996-2000). From 1993 to 1996, she was a Senior Vice President of ARCO and President of ARCO Transportation Company. She served as a Director of ARCO from 1996 to 1998. She currently serves as a Director of Phelps Dodge Corporation (copper mining and manufacturing) and McKesson Corporation (healthcare service, 2002-
present). Ms. Knowles is a Trustee of the Brookings Institution and the Catalina Island Conservancy and also serves as a member of the Advisory Board for the School of Engineering of the University of Southern California. |
Ned C. Lautenbach (63) |
| Year of Election or Appointment: 2000 Mr. Lautenbach is Chairman of the Independent Trustees (2006-present). Mr. Lautenbach has been a partner of Clayton, Dubilier & Rice, Inc. (private equity investment firm) since September 1998. Previously, Mr. Lautenbach was with the International Business Machines Corporation (IBM) from 1968 until his retirement in 1998. Mr. Lautenbach serves as a Director of Sony Corporation (2006-present) and Eaton Corporation (diversified industrial) as well as the Philharmonic Center for the Arts in Naples, Florida. He also is a member of the Board of Trustees of Fairfield University (2005-present), as well as a member of the Council on Foreign Relations. |
Cornelia M. Small (63) |
| Year of Election or Appointment: 2005 Ms. Small is a member (2000-present) and Chairperson (2002-present) of the Investment Committee, and a member (2002-
present) of the Board of Trustees of Smith College. Previously, she served as Chief Investment Officer (1999-2000), Director of Global Equity Investments (1996-1999), and a member of the Board of Directors of Scudder, Stevens & Clark (1990-1997) and Scudder Kemper Investments (1997-1999). In addition, Ms. Small served as Co-Chair (2000-2003) of the Annual Fund for the Fletcher School of Law and Diplomacy. |
William S. Stavropoulos (68) |
| Year of Election or Appointment: 2001 Mr. Stavropoulos is Chairman Emeritus of the Board of Directors of The Dow Chemical Company. Since joining The Dow Chemical Company in 1967, Mr. Stavropoulos served in numerous senior management positions, including President (1993-2000; 2002-2003), CEO (1995-2000; 2002-2004), and Chairman of the Executive Committee (2000-2004). Currently, he is a Director of NCR Corporation (data warehousing and technology solutions), Chemical Financial Corporation, Maersk Inc. (industrial conglomerate, 2002-present), Tyco International, Inc. (multinational manufacturing and services, 2007-present), and a member of the Advisory Board for Metalmark Capital (private equity investment firm, 2005-present). He is a special advisor to Clayton, Dubilier & Rice, Inc., a private equity investment firm. He also serves as a member of the Board of Trustees of the American Enterprise Institute for Public Policy Research. In addition, Mr. Stavropoulos is a member of The Business Council, J.P. Morgan International Council and the University of Notre Dame Advisory Council for the College of Science. |
Kenneth L. Wolfe (68) |
| Year of Election or Appointment: 2005 Mr. Wolfe is Chairman and a Director of Hershey Foods Corporation (2007-present), where prior to his retirement in 2001, he was Chairman and Chief Executive Officer. Mr. Wolfe currently serves as a member of the board of Revlon Inc. (2004-present). Previously, Mr. Wolfe served as a member of the boards of Adelphia Communications Corporation (2003-2006) and Bausch & Lomb, Inc. (1993-2007). |
Advisory Board Members and Executive Officers**:
Correspondence intended for Mr. Mauriello, Mr. Thomas, Mr. Wiley, Mr. Lacy, and Mr. Arthur Johnson may be sent to Fidelity Investments, P.O. Box 55235, Boston, Massachusetts 02205-5235. Correspondence intended for each executive officer and Mr. Lynch may be sent to Fidelity Investments, 82 Devonshire Street, Boston, Massachusetts 02109.
Name, Age; Principal Occupation |
Arthur E. Johnson (60) |
| Year of Election or Appointment: 2008 Member of the Advisory Board of Variable Insurance Products Fund IV. Mr. Johnson serves as Senior Vice President of Corporate Strategic Development of Lockheed Martin Corporation (defense contractor). In addition, Mr. Johnson serves as a member of the Board of Directors of AGL Resources, Inc. (holding company, 2002-present), and IKON Office Solutions, Inc. (document management systems and services). Mr. Arthur E. Johnson and Mr. Edward C. Johnson 3d are not related. |
Alan J. Lacy (54) |
| Year of Election or Appointment: 2008 Member of the Advisory Board of Variable Insurance Products Fund IV. Mr. Lacy serves as Senior Adviser (2007-present) of Oak Hill Capital Partners, L.P. (a private equity firm). Mr. Lacy also served as Vice Chairman and Chief Executive Officer of Sears Holdings Corporation and Sears, Roebuck and Co. (retail, 2005-2006; 2000-2005). In addition, Mr. Lacy serves as a member of the Board of Directors of The Western Union Company (global money transfer, 2006-present) and Bristol-Myers Squibb (global pharmaceuticals, 2007-present). Mr. Lacy is a Trustee of the National Parks Conservation Association and The Field Museum of Natural History. |
Peter S. Lynch (63) |
| Year of Election or Appointment: 2003 Member of the Advisory Board of Variable Insurance Products Fund IV. Mr. Lynch is Vice Chairman and a Director of FMR, and Vice Chairman (2001-present) and a Director of FMR Co., Inc. Previously, Mr. Lynch served as a Trustee of the Fidelity funds (1990-2003). In addition, he serves as a Trustee of Boston College and as the Chairman of the Inner-City Scholarship Fund. |
Joseph Mauriello (63) |
| Year of Election or Appointment: 2007 Member of the Advisory Board of Variable Insurance Products Fund IV. Prior to his retirement in January 2006, Mr. Mauriello served in numerous senior management positions including Deputy Chairman and Chief Operating Officer (2004-2005), and Vice Chairman of Financial Services (2002-2004) of KPMG LLP US (professional services firm, 1965-2005). Mr. Mauriello currently serves as a member of the Board of Directors of XL Capital Ltd. (global insurance and re-insurance company, 2006-
present) and of Arcadia Resources Inc. (health care services and products, 2007-present). He also served as a Director of the Hamilton Funds of the Bank of New York (2006-2007). |
David M. Thomas (58) |
| Year of Election or Appointment: 2007 Member of the Advisory Board of Variable Insurance Products Fund IV. Previously, Mr. Thomas served as Executive Chairman (2005-2006) and Chairman and Chief Executive Officer (2000-2005) of IMS Health, Inc. (pharmaceutical and healthcare information solutions). In addition, Mr. Thomas serves as a member of the Board of Directors of Fortune Brands, Inc. (consumer products holding company), and Interpublic Group of Companies, Inc. (marketing communication, 2004-present). |
Michael E. Wiley (57) |
| Year of Election or Appointment: 2007 Member of the Advisory Board of Variable Insurance Products Fund IV. Mr. Wiley also serves as a member of the Board of Trustees of the University of Tulsa (2000-2006; 2007-present). He serves as a Director of Tesoro Corporation (independent oil refiner and marketer, 2005-present), and a Director of Bill Barrett Corporation (exploration and production company, 2005-present). In addition, he also serves as a Director of Post Oak Bank (privately-held bank, 2004-present). Previously, Mr. Wiley served as a Sr. Energy Advisor of Katzenbach Partners, LLC (consulting firm, 2006-2007), as an Advisory Director of Riverstone Holdings (private investment firm), Chairman, President, and CEO of Baker Hughes, Inc. (oilfield services company, 2000-2004), and as Director of Spinnaker Exploration Company (exploration and production company, 2001-2005). |
Kimberley H. Monasterio (44) |
| Year of Election or Appointment: 2007 President and Treasurer of VIP Growth Stock. Ms. Monasterio also serves as President and Treasurer of other Fidelity funds (2007-
present) and is an employee of FMR (2004-present). Previously, Ms. Monasterio served as Deputy Treasurer of the Fidelity funds (2004-2006). Before joining Fidelity Investments, Ms. Monasterio served as Treasurer (2000-2004) and Chief Financial Officer (2002-2004) of the Franklin Templeton Funds and Senior Vice President of Franklin Templeton Services, LLC (2000-2004). |
Walter C. Donovan (45) |
| Year of Election or Appointment: 2007 Vice President of VIP Growth Stock. Mr. Donovan also serves as Vice President of Fidelity's Equity Funds (2007-present). Mr. Donovan also serves as Executive Vice President of FMR (2005-present) and FMR Co., Inc. (2005-present). Previously, Mr. Donovan served as Vice President of Fidelity's High Income Funds (2005-2007), Fixed-Income Funds (2005-2006), certain Asset Allocation Funds (2005-2006), certain Balanced Funds (2005-2006), and as Vice President and Director of Fidelity's International Equity Trading group (1998-2005). |
Bruce T. Herring (42) |
| Year of Election or Appointment: 2006 Vice President of VIP Growth Stock. Mr. Herring also serves as Vice President of certain Equity Funds (2006-present). Mr. Herring is Senior Vice President of FMR (2006-present) and Vice President of FMR Co., Inc. (2001-present). Previously, Mr. Herring served as a portfolio manager for Fidelity U.S. Equity Funds (2001-2005). |
Eric D. Roiter (59) |
| Year of Election or Appointment: 2002 Secretary of VIP Growth Stock. He also serves as Secretary of other Fidelity funds; Vice President, General Counsel, and Secretary of FMR Co., Inc. (2001-present) and FMR; Assistant Secretary of Fidelity Management & Research (U.K.) Inc. (2001-present), Fidelity Research & Analysis Company (2001-present), and Fidelity Investments Money Management, Inc. (2001-present). Mr. Roiter is an Adjunct Member, Faculty of Law, at Boston College Law School (2003-present). Previously, Mr. Roiter served as Vice President and Secretary of Fidelity Distributors Corporation (FDC) (1998-2005). |
John B. McGinty, Jr. (45) |
| Year of Election or Appointment: 2008 Assistant Secretary of VIP Growth Stock. Mr. McGinty also serves as Assistant Secretary of other Fidelity funds (2008-present) and is an employee of FMR LLC (2004-present). Mr. McGinty also serves as Senior Vice President, Secretary, and Chief Legal Officer of FDC (2007-present). Before joining Fidelity Investments, Mr. McGinty practiced law at Ropes & Gray, LLP. |
R. Stephen Ganis (41) |
| Year of Election or Appointment: 2006 Anti-Money Laundering (AML) officer of VIP Growth Stock. Mr. Ganis also serves as AML officer of other Fidelity funds (2006-present) and FMR LLC (2003-present). Before joining Fidelity Investments, Mr. Ganis practiced law at Goodwin Procter, LLP (2000-2002). |
Joseph B. Hollis (59) |
| Year of Election or Appointment: 2006 Chief Financial Officer of VIP Growth Stock. Mr. Hollis also serves as Chief Financial Officer of other Fidelity funds. Mr. Hollis is President of Fidelity Pricing and Cash Management Services (FPCMS) (2005-present). Mr. Hollis also serves as President and Director of Fidelity Service Company, Inc. (2006-present). Previously, Mr. Hollis served as Senior Vice President of Cash Management Services (1999-2002) and Investment Management Operations (2002-2005). |
Kenneth A. Rathgeber (60) |
| Year of Election or Appointment: 2004 Chief Compliance Officer of VIP Growth Stock. Mr. Rathgeber also serves as Chief Compliance Officer of other Fidelity funds (2004-present) and Executive Vice President of Risk Oversight for Fidelity Investments (2002-present). He is Chief Compliance Officer of FMR (2005-present), FMR Co., Inc. (2005-present), Fidelity Management & Research (U.K.) Inc. (2005-present), Fidelity Research & Analysis Company (2005-present), Fidelity Investments Money Management, Inc. (2005-present), and Strategic Advisers, Inc. (2005-present). Previously, Mr. Rathgeber served as Executive Vice President and Chief Operating Officer for Fidelity Investments Institutional Services Company, Inc. (1998-2002). |
Bryan A. Mehrmann (46) |
| Year of Election or Appointment: 2005 Deputy Treasurer of VIP Growth Stock. Mr. Mehrmann also serves as Deputy Treasurer of other Fidelity funds (2005-present) and is an employee of FMR. Previously, Mr. Mehrmann served as Vice President of Fidelity Investments Institutional Services Group (FIIS)/Fidelity Investments Institutional Operations Corporation, Inc. (FIIOC) Client Services (1998-2004). |
Kenneth B. Robins (38) |
| Year of Election or Appointment: 2005 Deputy Treasurer of VIP Growth Stock. Mr. Robins also serves as Deputy Treasurer of other Fidelity funds (2005-present) and is an employee of FMR (2004-present). Before joining Fidelity Investments, Mr. Robins worked at KPMG LLP, where he was a partner in KPMG's department of professional practice (2002-2004) and a Senior Manager (1999-2000). In addition, Mr. Robins served as Assistant Chief Accountant, United States Securities and Exchange Commission (2000-2002). |
Robert G. Byrnes (41) |
| Year of Election or Appointment: 2005 Assistant Treasurer of VIP Growth Stock. Mr. Byrnes also serves as Assistant Treasurer of other Fidelity funds (2005-present) and is an employee of FMR (2005-present). Previously, Mr. Byrnes served as Vice President of FPCMS (2003-2005). Before joining Fidelity Investments, Mr. Byrnes worked at Deutsche Asset Management where he served as Vice President of the Investment Operations Group (2000-2003). |
Peter L. Lydecker (53) |
| Year of Election or Appointment: 2004 Assistant Treasurer of VIP Growth Stock. Mr. Lydecker also serves as Assistant Treasurer of other Fidelity funds (2004) and is an employee of FMR. |
Paul M. Murphy (60) |
| Year of Election or Appointment: 2007 Assistant Treasurer of VIP Growth Stock. Mr. Murphy also serves as Assistant Treasurer of other Fidelity funds (2007-present) and is an employee of FMR (2007-present). Previously, Mr. Murphy served as Chief Financial Officer of the Fidelity Funds (2005-
2006), Vice President and Associate General Counsel of FMR (2007), and Senior Vice President of Fidelity Pricing and Cash Management Services Group (FPCMS) (1994-2007). |
Gary W. Ryan (49) |
| Year of Election or Appointment: 2005 Assistant Treasurer of VIP Growth Stock. Mr. Ryan also serves as Assistant Treasurer of other Fidelity funds (2005-present) and is an employee of FMR (2005-present). Previously, Mr. Ryan served as Vice President of Fund Reporting in FPCMS (1999-2005). |
** FMR Corp. merged with and into FMR LLC on October 1, 2007. Any references to FMR LLC for prior periods are deemed to be references to the prior entity.
Annual Report
Distributions
The fund will notify shareholders in January 2008 of amounts for use in preparing 2007 income tax returns.
The fund hereby designates as a capital gain dividend with respect to the taxable year ended December 31, 2007, $1,340,822 or, if subsequently determined to be different, the net capital gain of such year.
Annual Report
Board Approval of Investment Advisory Contracts and Management Fees
VIP Growth Stock Portfolio
Each year, typically in July, the Board of Trustees, including the Independent Trustees (together, the Board), votes on the renewal of the management contract and sub-advisory agreements (together, the Advisory Contracts) for the fund. The Board, assisted by the advice of fund counsel and Independent Trustees' counsel, requests and considers a broad range of information throughout the year.
The Board meets regularly each month except August and takes into account throughout the year matters bearing on Advisory Contracts. The Board, acting directly and through its separate committees, considers at each of its meetings factors that are relevant to the annual renewal of the fund's Advisory Contracts, including the services and support provided to the fund and its shareholders. At the time of the renewal, the Board had 12 standing committees, each composed of Independent Trustees with varying backgrounds, to which the Board has assigned specific subject matter responsibilities in order to enhance effective decision-making by the Board. Each committee has adopted a written charter outlining the structure and purposes of the committee. One such committee, the Equity Contract Committee, meets periodically as needed throughout the year to consider matters specifically related to the annual renewal of Advisory Contracts. The committee requests and receives information on, and makes recommendations to the Independent Trustees concerning, the approval and annual review of the Advisory Contracts.
At its July 2007 meeting, the Board of Trustees, including the Independent Trustees, unanimously determined to renew the Advisory Contracts for the fund. In reaching its determination, the Board considered all factors it believed relevant, including (i) the nature, extent, and quality of the services to be provided to the fund and its shareholders (including the investment performance of the fund); (ii) the competitiveness of the management fee and total expenses of the fund; (iii) the total costs of the services to be provided by and the profits to be realized by the investment adviser and its affiliates from the relationship with the fund; (iv) the extent to which economies of scale would be realized as the fund grows; and (v) whether fee levels reflect these economies of scale, if any, for the benefit of fund shareholders. The Board also approved amendments to the fund's agreements with foreign sub-advisers to clarify that each sub-adviser provides services as an independent contractor.
In determining whether to renew the Advisory Contracts for the fund, the Board ultimately reached a determination, with the assistance of fund counsel and Independent Trustees' counsel, that the renewal of the Advisory Contracts and the compensation to be received by Fidelity under the management contract is consistent with Fidelity's fiduciary duty under applicable law. In addition to evaluating the specific factors noted above, the Board, in reaching its determination, is aware that shareholders in the fund have a broad range of investment choices available to them, including a wide choice among mutual funds offered by competitors to Fidelity, and that the fund's shareholders, with the opportunity to review and weigh the disclosure provided by the fund in its prospectus and other public disclosures, have chosen to invest in this fund, managed by Fidelity.
Nature, Extent, and Quality of Services Provided. The Board considered staffing within the investment adviser, FMR, and the sub-advisers (together, the Investment Advisers), including the background of the fund's portfolio manager and the fund's investment objective and discipline. The Independent Trustees also had discussions with senior management of Fidelity's investment operations and investment groups. The Board considered the structure of the portfolio manager compensation program and whether this structure provides appropriate incentives.
Resources Dedicated to Investment Management and Support Services. The Board reviewed the size, education, and experience of the Investment Advisers' investment staff, their use of technology, and the Investment Advisers' approach to recruiting, training, and retaining portfolio managers and other research, advisory, and management personnel. The Board considered Fidelity's extensive global research capabilities that enable the Investment Advisers to aggregate data from various sources in an effort to produce positive investment results. The Board noted that Fidelity's analysts have access to a variety of technological tools that enable them to perform both fundamental and quantitative analysis and to specialize in various disciplines. The Board also considered that Fidelity's portfolio managers and analysts have access to daily portfolio attribution that allows for monitoring of a fund's portfolio, as well as an electronic communication system that provides immediate real-time access to research concerning issuers and credit enhancers.
Shareholder and Administrative Services. The Board considered (i) the nature, extent, quality, and cost of advisory, administrative, distribution, and shareholder services performed by the Investment Advisers and their affiliates under the Advisory Contracts and under separate agreements covering transfer agency, pricing and bookkeeping, and securities lending services for the fund; (ii) the nature and extent of the Investment Advisers' supervision of third party service providers, principally custodians and subcustodians; and (iii) the resources devoted to, and the record of compliance with, the fund's compliance policies and procedures. The Board reviewed the allocation of fund brokerage, including allocations to brokers affiliated with the Investment Advisers, the use of brokerage commissions to pay fund expenses, and the use of "soft" commission dollars to pay for research services. The Board also considered that Fidelity voluntarily pays for market data out of its own resources. The Board also considered the agreement reached between the Independent Trustees and Fidelity in December 2006 following an independent review of matters relating to receipt of travel, entertainment, gifts and gratuities in violation of Fidelity policies.
The Board noted that the growth of fund assets across the complex allows Fidelity to reinvest in the development of services designed to enhance the value or convenience of the Fidelity funds as investment vehicles. These services include 24-hour access to account information and market information through phone representatives and over the Internet, and investor education materials and asset allocation tools.
Annual Report
Board Approval of Investment Advisory Contracts and Management Fees - continued
Investment in a Large Fund Family. The Board considered the benefits to shareholders of investing in a Fidelity fund, including the benefits of investing in a fund that is part of a large family of funds offering a variety of investment disciplines and providing for a large variety of mutual fund investor services. The Board noted that, since the last Advisory Contract renewals in July 2006, Fidelity has taken a number of actions that benefited particular funds, including (i) dedicating additional resources to investment research and to restructure the investment research teams; (ii) contractually agreeing to reduce the management fee on Fidelity Advisor Floating Rate High Income Fund; (iii) contractually agreeing to reduce the management fees on Fidelity's California, Massachusetts, New Jersey, and New York AMT Tax-Free Money Market Funds, launching new Institutional Classes and Service Classes of these funds, and contractually agreeing to impose expense limitations on these funds; (iv) eliminating the exchange fee on the Fidelity Select Portfolios and reducing the pricing and bookkeeping fee rates for these funds; (v) reducing the maximum transfer agency fee rates on high income funds and certain equity funds; (vi) proposing amended management contracts that, if approved by shareholders, will add a performance adjustment component to the management fees paid by 18 Fidelity Advisor equity funds; (vii) contractually agreeing to reduce fees for Ultra-Short Central Fund and the money market Central Funds; (viii) waiving the Fidelity Advisor funds' contingent deferred sales charge on certain redemptions made through systematic withdrawal programs; and (ix) amending the management contracts for equity and fixed-income funds whose management contracts incorporate a "group fee" structure by adding four new fee "breakpoints" to the group fee rate schedules.
Investment Performance and Compliance. The Board considered whether the fund has operated within its investment objective, as well as its record of compliance with its investment restrictions. It also reviewed the fund's absolute investment performance for each class, as well as the fund's relative investment performance for each class measured against (i) a broad-based securities market index, and (ii) a peer group of mutual funds deemed appropriate by the Board over multiple periods. Because the fund had been in existence less than five calendar years, the following charts considered by the Board show, over the one- and three-year periods ended December 31, 2006, the cumulative total returns of Initial Class and Service Class 2 of the fund, the cumulative total returns of a broad-based securities market index ("benchmark"), and a range of cumulative total returns of a peer group of mutual funds identified by Morningstar, Inc. as having an investment style similar to that of the fund based on underlying portfolio holdings. The returns of Initial Class and Service Class 2 show the performance of the highest and lowest performing classes, respectively (based on three-year performance). The box within each chart shows the 25th percentile return (bottom of box) and the 75th percentile return (top of box) of the peer group. Returns shown above the box are in the first quartile and returns shown below the box are in the fourth quartile. The percentage beaten numbers noted below each chart correspond to the percentile box and represent the percentage of funds in the peer group whose performance was equal to or lower than that of the class indicated.
VIP Growth Stock Portfolio
The Board reviewed the fund's relative investment performance against its peer group and stated that the performance of Initial Class of the fund was in the fourth quartile for all the periods shown. The Board also stated that the investment performance of Initial Class of the fund was lower than its benchmark for all the periods shown. The Board considered that the variations in performance among the fund's classes reflect the variations in class expenses, which result in lower performance for higher expense classes. The Board discussed with FMR actions to be taken by FMR to improve the fund's disappointing performance relative to its peer group. The Board will continue to closely monitor the performance of the fund in the coming year and discuss with FMR other appropriate actions to address the performance of the fund.
The Board considered that FMR has taken steps to refocus and strengthen equity research, equity portfolio management, and compliance.
Annual Report
Based on its review, and giving particular weight to the nature and quality of the resources dedicated by the Investment Advisers to maintain and improve relative performance, the Board concluded that the nature, extent, and quality of the services provided to the fund will benefit the fund's shareholders, particularly in light of the Board's view that the fund's shareholders benefit from investing in a fund that is part of a large family of funds offering a variety of investment disciplines and services.
Competitiveness of Management Fee and Total Fund Expenses. The Board considered the fund's management fee and total expenses compared to "mapped groups" of competitive funds and classes. Fidelity creates "mapped groups" by combining similar Lipper investment objective categories that have comparable management fee characteristics. Combining Lipper investment objective categories aids the Board's management fee and total expense comparisons by broadening the competitive group used for comparison and by reducing the number of universes to which various Fidelity funds are compared. The Board also considered supplemental information about how the fund's management fee and total expenses ranked relative to groups based on Lipper classifications, which take into account a fund's market capitalization and style.
The Board considered two proprietary management fee comparisons for the 12-month (or shorter) periods shown in the chart below. The group of Lipper funds used by the Board for management fee comparisons is referred to below as the "Total Mapped Group." The Total Mapped Group comparison focuses on a fund's standing relative to the total universe of comparable funds available to investors, in terms of gross management fees before expense reimbursements or caps. "TMG %" represents the percentage of funds in the Total Mapped Group that had management fees that were lower than the fund's. For example, a TMG % of 9% means that 91% of the funds in the Total Mapped Group had higher management fees than the fund. The "Asset-Size Peer Group" (ASPG) comparison focuses on a fund's standing relative to non-Fidelity funds similar in size to the fund within the Total Mapped Group. The ASPG represents at least 15% of the funds in the Total Mapped Group with comparable asset size and management fee characteristics, subject to a minimum of 50 funds (or all funds in the Total Mapped Group if fewer than 50). Additional information, such as the ASPG quartile in which the fund's management fee ranked, is also included in the chart and considered by the Board.
VIP Growth Stock Portfolio
The Board noted that the fund's management fee ranked below the median of its Total Mapped Group and below the median of its ASPG for 2006.
Based on its review, the Board concluded that the fund's management fee was fair and reasonable in light of the services that the fund receives and the other factors considered.
In its review of each class's total expenses, the Board considered the fund's management fee as well as other fund or class expenses, as applicable, such as transfer agent fees, pricing and bookkeeping fees, fund-paid 12b-1 fees, and custodial, legal, and audit fees. The Board also noted the effects of any waivers and reimbursements on fees and expenses. As part of its review, the Board also considered current and historical total expenses of each class of the fund compared to competitive fund median expenses. Each class of the fund is compared to those funds and classes in the Total Mapped Group (used by the Board for management fee comparisons) that have a similar sales load structure.
The Board noted that the total expenses of Initial Class ranked below its competitive median for 2006, the total expenses of Service Class ranked equal to its competitive median for 2006, and the total expenses of each of Investor Class and Service Class 2 ranked above its competitive median for 2006. The Board considered that the total expenses of Investor Class were above the median primarily due to its higher transfer agent fee. The Board noted that the fund offers multiple classes, each of which has a different 12b-1 fee structure, and that the multiple structures are intended to offer a range of pricing options for the intermediary market. The Board also noted that the total expenses of the classes vary primarily by the level of their 12b-1 fees, although differences in transfer agent fees may also cause expenses to vary from class to class.
Annual Report
Board Approval of Investment Advisory Contracts and Management Fees - continued
In its review of total expenses, the Board also considered Fidelity fee structures and other information on clients that FMR and its affiliates service in other competitive markets, such as other mutual funds advised or subadvised by FMR or its affiliates, pension plan clients, and other institutional clients.
Based on its review, the Board concluded that the total expenses of each class of the fund were reasonable, although in some cases above the median of the universe presented for comparison, in light of the services that the fund and its shareholders receive and the other factors considered.
Costs of the Services and Profitability. The Board considered the revenues earned and the expenses incurred by Fidelity in conducting the business of developing, marketing, distributing, managing, administering and servicing the fund and its shareholders. The Board also considered the level of Fidelity's profits in respect of all the Fidelity funds.
On an annual basis, FMR presents to the Board Fidelity's profitability for the fund. Fidelity calculates the profitability for each fund, as well as aggregate profitability for groups of Fidelity funds and all Fidelity funds, using a series of detailed revenue and cost allocation methodologies which originate with the audited books and records of Fidelity. The Audit Committee of the Board reviews any significant changes from the prior year's methodologies.
PricewaterhouseCoopers LLP (PwC), independent registered public accounting firm and auditor to Fidelity and certain Fidelity funds, has been engaged annually by the Board as part of the Board's assessment of the results of Fidelity's profitability analysis. PwC's engagement includes the review and assessment of Fidelity's methodologies used in determining the revenues and expenses attributable to Fidelity's mutual fund business, and completion of agreed-upon procedures surrounding the mathematical accuracy of fund profitability and its conformity to allocation methodologies. After considering PwC's reports issued under the engagement and information provided by Fidelity, the Board believes that while other allocation methods may also be reasonable, Fidelity's profitability methodologies are reasonable in all material respects.
The Board has also reviewed Fidelity's non-fund businesses and any fall-out benefits related to the mutual fund business as well as cases where Fidelity's affiliates may benefit from or be related to the fund's business.
The Board considered the costs of the services provided by and the profits realized by Fidelity in connection with the operation of the fund and determined that the amount of profit is a fair entrepreneurial profit for the management of the fund.
Economies of Scale. The Board considered whether there have been economies of scale in respect of the management of the Fidelity funds, whether the Fidelity funds (including the fund) have appropriately benefited from any such economies of scale, and whether there is potential for realization of any further economies of scale. The Board considered the extent to which the fund will benefit from economies of scale through increased services to the fund, through waivers or reimbursements, or through fee or expense reductions.
The Board recognized that the fund's management contract incorporates a "group fee" structure, which provides for lower group fee rates as total fund assets under FMR's management increase, and for higher group fee rates as total fund assets under FMR's management decrease. FMR determines the group fee rates based on a tiered asset "breakpoint" schedule. In connection with the renewal of the fund's management contract, the Board approved amendments to the fund's management contract that added four new fee breakpoints to the group fee rate schedule for assets under FMR's management above $1,386 billion. The Board considered that the group fee rate declines under both the present and amended schedules, but that under the amended schedule, the group fee rate declines faster as assets under FMR's management exceed $1,386 billion. The Board considered that the group fee is designed to deliver the benefits of economies of scale to fund shareholders when total fund assets increase, even if assets of any particular fund are unchanged or have declined, because some portion of Fidelity's costs are attributable to services provided to all Fidelity funds, and all funds benefit if those costs can be allocated among more assets. The Board concluded that, given the group fee structure, fund shareholders will achieve a certain level of economies of scale as assets under FMR's management increase at the fund complex level, regardless of whether Fidelity achieves any such economies of scale.
The Board further concluded that any potential economies of scale are being shared between fund shareholders and Fidelity in an appropriate manner.
Additional Information Requested by the Board. In order to develop fully the factual basis for consideration of the Fidelity funds' Advisory Contracts, the Board requested and received additional information on several topics, including (i) fund performance trends and actions to be taken by FMR to improve certain funds' overall performance; (ii) Fidelity's portfolio manager compensation structure, including its effects on fund profitability and the extent to which portfolio manager compensation is linked to fund performance; (iii) Fidelity's fee structures; (iv) the funds' sub-advisory arrangements; and (v) accounts managed by Fidelity other than the Fidelity funds.
Based on its evaluation of all of the conclusions noted above, and after considering all material factors, the Board ultimately concluded that the advisory fee structures are fair and reasonable, and that the fund's Advisory Contracts should be renewed.
Annual Report
Annual Report
Investment Adviser
Fidelity Management & Research Company
Boston, MA
Investment Sub-Advisers
FMR Co., Inc.
Fidelity Management & Research (U.K.) Inc.
Fidelity Research & Analysis Company
Fidelity Investments Japan Limited
Fidelity International Investment Advisors
Fidelity International Investment Advisors
(U.K.) Limited
General Distributor
Fidelity Distributors Corporation
Boston, MA
Transfer and Service Agents
Fidelity Investments Institutional Operations Company, Inc.
Boston, MA
Fidelity Service Company, Inc.
Boston, MA
Custodian
Mellon Bank, N.A.
Pittsburgh, PA
VIPGR-ANN-0208
1.781993.105
Fidelity® Variable Insurance Products:
Health Care Portfolio
Annual Report
December 31, 2007
(2_fidelity_logos) (Registered_Trademark)
Contents
Performance | <Click Here> | How the fund has done over time. |
Management's Discussion | <Click Here> | The manager's review of fund performance, strategy and outlook. |
Shareholder Expense Example | <Click Here> | An example of shareholder expenses. |
Investment Changes | <Click Here> | A summary of major shifts in the fund's investments over the past six months. |
Investments | <Click Here> | A complete list of the fund's investments with their
market values. |
Financial Statements | <Click Here> | Statements of assets and liabilities, operations, and
changes in net assets, as well as financial highlights. |
Notes | <Click Here> | Notes to the financial statements. |
Report of Independent Registered Public Accounting Firm | <Click Here> | |
Trustees and Officers | <Click Here> | |
Distributions | <Click Here> | |
Board Approval of Investment Advisory Contracts and Management Fees | <Click Here> | |
| | |
To view a fund's proxy voting guidelines and proxy voting record for the 12-month period ended June 30, visit http://www.fidelity.com (search for "proxy voting guidelines") or visit the Securities and Exchange Commission's (SEC) web site at http://www.sec.gov. You may also call 1-877-208-0098 to request a free copy of the proxy voting guidelines.
Fidelity Variable Insurance Products are separate account options which are purchased through a variable insurance contract.
Standard & Poor's, S&P and S&P 500 are registered service marks of The McGraw-Hill Companies, Inc. and have been licensed for use by Fidelity Distributors Corporation.
Other third party marks appearing herein are the property of their respective owners.
All other marks appearing herein are registered or unregistered trademarks or service marks of FMR LLC or an affiliated company.
This report and the financial statements contained herein are submitted for the general information of the shareholders of the fund. This report is not authorized for distribution to prospective investors in the fund unless preceded or accompanied by an effective prospectus.
The fund files its complete schedule of portfolio holdings with the SEC for the first and third quarters of each fiscal year on Form N-Q. Forms N-Q are available on the SEC's web site at http://www.sec.gov. The fund's Forms N-Q may be reviewed and copied at the SEC's Public Reference Room in Washington, DC. Information regarding the operation of the SEC's Public Reference Room may be obtained by calling 1-800-SEC-0330. For a complete list of the fund's portfolio holdings, view the most recent holdings listing, semiannual report, or annual report on Fidelity's web site at http://www.fidelity.com or http://www.advisor.fidelity.com, as applicable.
NOT FDIC INSURED · MAY LOSE VALUE · NO BANK GUARANTEE
Neither the fund nor Fidelity Distributors Corporation is a bank.
Annual Report
Performance: The Bottom Line
Average annual total return reflects the change in the value of an investment, assuming reinvestment of the class' dividend income and capital gains (the profits earned upon the sale of securities that have grown in value, if any) and assuming a constant rate of performance each year. During periods of reimbursement by Fidelity, a fund's total return will be greater than it would be had the reimbursement not occurred. Performance numbers are net of all underlying fund operating expenses, but do not include any insurance charges imposed by your insurance company's separate account. If performance information included the effect of these additional charges, the total returns would have been lower. How a fund did yesterday is no guarantee of how it will do tomorrow.
Average Annual Total Returns
Periods ended December 31, 2007 | Past 1
year | Past 5
years | Life of fund A |
VIP Health Care - Initial Class | 10.21% | 11.67% | 6.15% |
VIP Health Care - Investor Class B | 10.01% | 11.59% | 6.09% |
A From July 18, 2001.
B The initial offering of Investor Class took place on July 21, 2005. Returns prior to July 21, 2005 are those of Initial Class. If Investor Class's transfer agent fee had been reflected, returns prior to July 21, 2005 would have been lower.
$10,000 Over Life of Fund
Let's say hypothetically that $10,000 was invested in VIP Health Care Portfolio - Initial Class on July 18, 2001, when the fund started. The chart shows how the value of your investment would have changed, and also shows how the Standard & Poor's 500SM Index (S&P 500®) performed over the same period.
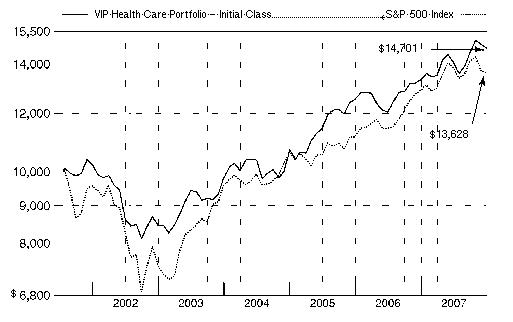
Annual Report
Management's Discussion of Fund Performance
Comments from Matthew Sabel, Portfolio Manager of VIP Health Care Portfolio
U.S. equity markets, as measured by the bellwether Dow Jones Industrial AverageSM and the Standard & Poor's 500SM Index, registered their fifth consecutive year of positive returns in 2007, as the Dow rose 8.88% and the S&P 500® index advanced 5.49%. The tech-heavy NASDAQ Composite® Index did even better, increasing 10.55%. However, credit- and recession-related concerns carved deeply into stock prices late in 2007, pushing some major market measures into negative territory for the year overall, particularly smaller-cap and value-oriented benchmarks. Based largely on a weak U.S. dollar that boosted returns for U.S. investors, the Morgan Stanley Capital InternationalSM Europe, Australasia, and Far East (MSCI® EAFE®) Index - a gauge of developed stock markets outside the United States and Canada - beat most domestic equity measures, gaining 11.33%. Several European countries had outstanding performance, including Finland and Germany, while Australia also did very well. However, fallout from the credit crunch and concerns about export growth tempered U.K. stocks, while fears that Japanese financial companies would become embroiled in the U.S. subprime mortgage crisis contributed to a loss of more than 4% for the Japanese portion of the index. The emerging-markets stock asset class soared 39.78% according to the MSCI Emerging Markets index. The U.S. investment-grade bond market climbed 6.97% as measured by the Lehman Brothers® U.S. Aggregate Index, beating the 2.53% gain for the Merrill Lynch® U.S. High Yield Master II Constrained Index. The emerging-markets bond category shook off a sluggish first half of 2007 to finish the year with a respectable gain of 6.28% as measured by the J.P. Morgan Emerging Markets Bond Index (EMBI) Global, while the Citigroup® Non-U.S. Group of 7 Index - representing the debt performance of major global economies, excluding the United States - rose 13.05%.
For the year that ended December 31, 2007, the fund solidly outperformed the 7.99% return of the Morgan Stanley Capital InternationalSM (MSCI®) US Investable Market Health Care Index and the S&P 500. (For specific portfolio performance results, please refer to the performance section of this report.) Strong stock selection in pharmaceuticals, health care supplies and health care distributors contributed to the fund's outperformance of the MSCI index. Overweighting life science tools and services also proved helpful. Further, currency fluctuations buoyed the returns of many of the fund's overseas holdings. Less-successful stock selection in health care services and health care facilities dampened returns. Significantly underweighting pharmaceutical firm Pfizer - not held at period end - was the top contributor. Underweighting health care equipment firms Medtronic and Boston Scientific also helped, as did overweightings in home diagnostic test manufacturer Inverness Medical Innovations, health care technology provider Cerner and health care equipment manufacturer Biosite, the latter of which was acquired by a competitor during the period. An out-of-benchmark position in chemical company Bayer contributed as well. Detractors included untimely ownership of two stocks - disease management company Healthways and pharmacy benefit manager Medco Health Solutions - as well as an investment in health care facilities firm Brookdale Senior Living and a holding since sold in pharmaceutical company Inyx, both of which declined. Underweighting pharmaceutical mega-cap and key index component Johnson & Johnson, which performed well late in the year, also hurt results.
The views expressed above reflect those of the portfolio manager(s) only through the end of the period as stated on the cover of this report and do not necessarily represent the views of Fidelity or any other person in the Fidelity organization. Any such views are subject to change at any time based upon market or other conditions and Fidelity disclaims any responsibility to update such views. These views may not be relied on as investment advice and, because investment decisions for a Fidelity fund are based on numerous factors, may not be relied on as an indication of trading intent on behalf of any Fidelity fund.
Annual Report
Shareholder Expense Example
As a shareholder of the Fund, you incur two types of costs: (1) transaction costs, including redemption fees, and (2) ongoing costs, including management fees and other Fund expenses. This Example is intended to help you understand your ongoing costs (in dollars) of investing in the Fund and to compare these costs with the ongoing costs of investing in other mutual funds.
The Example is based on an investment of $1,000 invested at the beginning of the period and held for the entire period (July 1, 2007 to December 31, 2007).
Actual Expenses
The first line of the accompanying table for each class of the Fund provides information about actual account values and actual expenses. You may use the information in this line, together with the amount you invested, to estimate the expenses that you paid over the period. Simply divide your account value by $1,000.00 (for example, an $8,600 account value divided by $1,000.00 = 8.6), then multiply the result by the number in the first line for a class of the Fund under the heading entitled "Expenses Paid During Period" to estimate the expenses you paid on your account during this period. The estimate of expenses does not include any fees or other expenses of any variable annuity or variable life insurance product. If they were, the estimate of expenses you paid during the period would be higher, and your ending account value would be lower. In addition, the Fund, as a shareholder in the underlying Fidelity Central Funds, will indirectly bear its pro rata share of the fees and expenses incurred by the underlying Fidelity Central Funds. These fees and expenses are not included in the Fund's annualized expense ratio used to calculate the expense estimate in the table below.
Hypothetical Example for Comparison Purposes
The second line of the accompanying table for each class of the Fund provides information about hypothetical account values and hypothetical expenses based on a Class' actual expense ratio and an assumed rate of return of 5% per year before expenses, which is not the Class' actual return. The hypothetical account values and expenses may not be used to estimate the actual ending account balance or expenses you paid for the period. You may use this information to compare the ongoing costs of investing in the Fund and other funds. To do so, compare this 5% hypothetical example with the 5% hypothetical examples that appear in the shareholder reports of the other funds. The estimate of expenses does not include any fees or other expenses of any variable annuity or variable life insurance product. If they were, the estimate of expenses you paid during the period would be higher, and your ending account value would be lower. In addition, the Fund, as a shareholder in the underlying Fidelity Central Funds, will indirectly bear its pro rata share of the fees and expenses incurred by the underlying Fidelity Central Funds. These fees and expenses are not included in the Fund's annualized expense ratio used to calculate the expense estimate in the table below.
Please note that the expenses shown in the table are meant to highlight your ongoing costs only and do not reflect any transaction costs. Therefore, the second line of the table is useful in comparing ongoing costs only, and will not help you determine the relative total costs of owning different funds. In addition, if these transactional costs were included, your costs would have been higher.
| Beginning
Account Value
July 1, 2007 | Ending
Account Value
December 31, 2007 | Expenses Paid
During Period*
July 1, 2007
to December 31, 2007 |
Initial Class | | | |
Actual | $ 1,000.00 | $ 1,047.00 | $ 4.44 |
HypotheticalA | $ 1,000.00 | $ 1,020.87 | $ 4.38 |
Investor Class | | | |
Actual | $ 1,000.00 | $ 1,046.20 | $ 5.05 |
HypotheticalA | $ 1,000.00 | $ 1,020.27 | $ 4.99 |
A 5% return per year before expenses
* Expenses are equal to each Class' annualized expense ratio (shown in the table below); multiplied by the average account value over the period, multiplied by 184/365 (to reflect the one-half year period).
| Annualized
Expense Ratio |
Initial Class | .86% |
Investor Class | .98% |
Annual Report
Investment Changes
Top Ten Stocks as of December 31, 2007 |
| % of fund's
net assets | % of fund's
net assets |
Merck & Co., Inc. | 6.7 | 7.1 |
UnitedHealth Group, Inc. | 4.7 | 4.1 |
Abbott Laboratories | 3.4 | 0.2 |
Wyeth | 3.3 | 2.3 |
Baxter International, Inc. | 2.9 | 0.9 |
Bristol-Myers Squibb Co. | 2.6 | 3.4 |
Becton, Dickinson & Co. | 2.6 | 2.9 |
Gilead Sciences, Inc. | 2.5 | 1.9 |
Allergan, Inc. | 2.4 | 2.3 |
McKesson Corp. | 2.1 | 1.8 |
| 33.2 | |
Top Industries (% of fund's net assets) |
As of December 31, 2007 |
| Pharmaceuticals | 25.7% | |
| Health Care Providers & Services | 20.5% | |
| Health Care Equipment & Supplies | 19.3% | |
| Biotechnology | 13.9% | |
| Life Sciences Tools & Services | 8.8% | |
| All Others* | 11.8% | |

|
As of June 30, 2007 |
| Pharmaceuticals | 34.7% | |
| Health Care Providers & Services | 21.3% | |
| Health Care Equipment & Supplies | 14.5% | |
| Biotechnology | 12.3% | |
| Life Sciences Tools & Services | 7.1% | |
| All Others* | 10.1% | |

* Includes short-term investments and net other assets. |
Annual Report
Investments December 31, 2007
Showing Percentage of Net Assets
Common Stocks - 95.0% |
| Shares | | Value |
BIOTECHNOLOGY - 13.9% |
Biotechnology - 13.9% |
3SBio, Inc. sponsored ADR | 4,098 | | $ 60,978 |
Alexion Pharmaceuticals, Inc. (a)(d) | 2,100 | | 157,563 |
Alnylam Pharmaceuticals, Inc. (a)(d) | 16,400 | | 476,912 |
Amgen, Inc. (a) | 30,325 | | 1,408,293 |
Amylin Pharmaceuticals, Inc. (a) | 5,400 | | 199,800 |
Arena Pharmaceuticals, Inc. (a) | 4,200 | | 32,886 |
Biogen Idec, Inc. (a) | 21,895 | | 1,246,263 |
BioMarin Pharmaceutical, Inc. (a) | 9,500 | | 336,300 |
Celgene Corp. (a) | 12,009 | | 554,936 |
Cephalon, Inc. (a) | 2,500 | | 179,400 |
Cougar Biotechnology, Inc. (a) | 1,506 | | 47,265 |
CSL Ltd. | 11,970 | | 381,217 |
CytRx Corp. (a) | 19,500 | | 55,380 |
deCODE genetics, Inc. (a)(d) | 28,204 | | 103,791 |
Genentech, Inc. (a) | 16,714 | | 1,121,008 |
Genmab AS (a) | 600 | | 36,286 |
Genzyme Corp. (a) | 10,200 | | 759,288 |
Gilead Sciences, Inc. (a) | 45,600 | | 2,098,056 |
Grifols SA | 2,792 | | 62,790 |
GTx, Inc. (a)(d) | 19,300 | | 276,955 |
Human Genome Sciences, Inc. (a) | 5,900 | | 61,596 |
Idera Pharmaceuticals, Inc. (a)(d) | 1,100 | | 14,410 |
ImClone Systems, Inc. (a) | 6,300 | | 270,900 |
Indevus Pharmaceuticals, Inc. (a) | 6,900 | | 47,955 |
Isis Pharmaceuticals, Inc. (a) | 15,214 | | 239,621 |
MannKind Corp. (a) | 3,610 | | 28,736 |
Millennium Pharmaceuticals, Inc. (a)(d) | 13,400 | | 200,732 |
Molecular Insight Pharmaceuticals, Inc. | 8,300 | | 75,198 |
Myriad Genetics, Inc. (a) | 1,700 | | 78,914 |
Omrix Biopharmaceuticals, Inc. (a) | 1,100 | | 38,214 |
ONYX Pharmaceuticals, Inc. (a) | 1,600 | | 88,992 |
Orchid Cellmark, Inc. (a) | 5,483 | | 27,415 |
OREXIGEN Therapeutics, Inc. | 1,800 | | 25,650 |
OSI Pharmaceuticals, Inc. (a) | 2,335 | | 113,271 |
PDL BioPharma, Inc. (a) | 5,143 | | 90,105 |
Pharmion Corp. (a) | 100 | | 6,286 |
Progenics Pharmaceuticals, Inc. (a) | 4,801 | | 86,754 |
Theravance, Inc. (a) | 5,400 | | 105,300 |
United Therapeutics Corp. (a) | 400 | | 39,060 |
Vanda Pharmaceuticals, Inc. (a) | 1,232 | | 8,476 |
Vertex Pharmaceuticals, Inc. (a) | 8,800 | | 204,424 |
Zymogenetics, Inc. (a) | 2,100 | | 24,507 |
| | 11,471,883 |
CHEMICALS - 1.5% |
Diversified Chemicals - 0.9% |
Bayer AG | 1,100 | | 100,100 |
Bayer AG sponsored ADR | 7,091 | | 645,281 |
| | 745,381 |
|
| Shares | | Value |
Fertilizers & Agricultural Chemicals - 0.6% |
Monsanto Co. | 1,200 | | $ 134,028 |
Potash Corp. of Saskatchewan, Inc. | 800 | | 115,168 |
The Mosaic Co. (a) | 2,900 | | 273,586 |
| | 522,782 |
TOTAL CHEMICALS | | 1,268,163 |
DIVERSIFIED CONSUMER SERVICES - 0.4% |
Specialized Consumer Services - 0.4% |
Carriage Services, Inc. Class A (a) | 30,000 | | 264,000 |
Service Corp. International | 7,000 | | 98,350 |
| | 362,350 |
FOOD & STAPLES RETAILING - 0.6% |
Drug Retail - 0.6% |
A&D Pharma Holdings NV (Reg. S) unit | 1,600 | | 36,193 |
China Nepstar Chain Drugstore Ltd. ADR | 2,100 | | 36,918 |
CVS Caremark Corp. | 10,942 | | 434,945 |
| | 508,056 |
FOOD PRODUCTS - 0.6% |
Agricultural Products - 0.6% |
Bunge Ltd. | 4,000 | | 465,640 |
HEALTH CARE EQUIPMENT & SUPPLIES - 19.3% |
Health Care Equipment - 16.3% |
American Medical Systems Holdings, Inc. (a)(d) | 10,300 | | 148,938 |
Aspect Medical Systems, Inc. (a)(d) | 27,400 | | 383,600 |
Baxter International, Inc. | 40,620 | | 2,357,991 |
Beckman Coulter, Inc. | 1,500 | | 109,200 |
Becton, Dickinson & Co. | 25,500 | | 2,131,290 |
Boston Scientific Corp. (a) | 29,500 | | 343,085 |
C.R. Bard, Inc. | 12,000 | | 1,137,600 |
Covidien Ltd. | 23,101 | | 1,023,143 |
Electro-Optical Sciences, Inc. (a) | 28,520 | | 128,625 |
Electro-Optical Sciences, Inc.: | | | |
warrants 11/2/11 (a)(e) | 7,563 | | 12,338 |
warrants 8/2/12 (a)(e) | 1,900 | | 3,120 |
Gen-Probe, Inc. (a) | 7,500 | | 471,975 |
Golden Meditech Co. Ltd. | 616,000 | | 274,933 |
Gyrus Group PLC (a) | 8,500 | | 104,707 |
Hillenbrand Industries, Inc. | 2,200 | | 122,606 |
I-Flow Corp. (a)(d) | 20,305 | | 320,413 |
Integra LifeSciences Holdings Corp. (a) | 9,900 | | 415,107 |
Intuitive Surgical, Inc. (a) | 500 | | 162,250 |
Invacare Corp. | 300 | | 7,560 |
Kinetic Concepts, Inc. (a) | 300 | | 16,068 |
Medtronic, Inc. | 11,900 | | 598,213 |
Mentor Corp. | 1,300 | | 50,830 |
Meridian Bioscience, Inc. | 2,000 | | 60,160 |
Mindray Medical International Ltd. sponsored ADR | 3,629 | | 155,938 |
Common Stocks - continued |
| Shares | | Value |
HEALTH CARE EQUIPMENT & SUPPLIES - CONTINUED |
Health Care Equipment - continued |
NeuroMetrix, Inc. (a)(d) | 7,900 | | $ 72,680 |
Northstar Neuroscience, Inc. (a) | 21,600 | | 200,880 |
Orthofix International NV (a) | 900 | | 52,173 |
Quidel Corp. (a) | 2,300 | | 44,781 |
Respironics, Inc. (a) | 2,700 | | 176,796 |
Sirona Dental Systems, Inc. (a) | 1,048 | | 35,087 |
Smith & Nephew PLC | 28,700 | | 329,591 |
Smith & Nephew PLC sponsored ADR | 5,500 | | 315,810 |
St. Jude Medical, Inc. (a) | 16,800 | | 682,752 |
Stryker Corp. | 10,100 | | 754,672 |
Symmetry Medical, Inc. (a) | 4,800 | | 83,664 |
The Spectranetics Corp. (a) | 7,091 | | 108,705 |
ThermoGenesis Corp. (a) | 14,749 | | 23,303 |
| | 13,420,584 |
Health Care Supplies - 3.0% |
Alcon, Inc. | 3,109 | | 444,711 |
Cooper Companies, Inc. | 2,057 | | 78,166 |
Haemonetics Corp. (a) | 700 | | 44,114 |
Immucor, Inc. (a) | 4,394 | | 149,352 |
Inverness Medical Innovations, Inc. (a) | 26,253 | | 1,474,894 |
Omega Pharma SA | 1,600 | | 111,381 |
Shandong Weigao Group Medical Polymer Co. Ltd. (H Shares) | 84,000 | | 193,918 |
TranS1, Inc. | 400 | | 6,588 |
| | 2,503,124 |
TOTAL HEALTH CARE EQUIPMENT & SUPPLIES | | 15,923,708 |
HEALTH CARE PROVIDERS & SERVICES - 20.5% |
Health Care Distributors & Services - 3.8% |
Celesio AG | 100 | | 6,202 |
Henry Schein, Inc. (a) | 8,100 | | 497,340 |
McKesson Corp. | 26,400 | | 1,729,464 |
Patterson Companies, Inc. (a) | 2,900 | | 98,455 |
Profarma Distribuidora de Produtos Farmaceuticos SA (a) | 36,000 | | 768,539 |
United Drug PLC (Ireland) | 7,500 | | 43,235 |
| | 3,143,235 |
Health Care Facilities - 2.3% |
Acibadem Saglik Hizmetleri AS | 38,888 | | 276,404 |
Apollo Hospitals Enterprise Ltd. | 14,645 | | 195,397 |
Bangkok Dusit Medical Service PCL (For. Reg.) | 2,700 | | 2,683 |
Brookdale Senior Living, Inc. | 7,263 | | 206,342 |
Bumrungrad Hospital PCL (For. Reg.) | 50,100 | | 60,182 |
Emeritus Corp. (a) | 16,069 | | 404,135 |
LifePoint Hospitals, Inc. (a) | 5,164 | | 153,577 |
Raffles Medical Group Ltd. | 7,000 | | 7,333 |
|
| Shares | | Value |
Sun Healthcare Group, Inc. (a) | 18,418 | | $ 316,237 |
Universal Health Services, Inc. Class B | 1,900 | | 97,280 |
VCA Antech, Inc. (a) | 3,180 | | 140,651 |
| | 1,860,221 |
Health Care Services - 4.1% |
athenahealth, Inc. | 100 | | 3,600 |
Diagnosticos da America SA | 26,200 | | 543,135 |
Emergency Medical Services Corp.
Class A (a) | 100 | | 2,928 |
Express Scripts, Inc. (a) | 17,600 | | 1,284,800 |
HAPC, Inc. (a) | 52,900 | | 219,535 |
HAPC, Inc. warrants 4/11/11 (a) | 9,800 | | 3,528 |
Health Grades, Inc. (a) | 41,466 | | 246,723 |
Healthways, Inc. (a) | 1,487 | | 86,900 |
HMS Holdings Corp. (a) | 5,000 | | 166,050 |
LHC Group, Inc. (a)(d) | 11,994 | | 299,610 |
Matria Healthcare, Inc. (a) | 500 | | 11,885 |
Nighthawk Radiology Holdings, Inc. (a) | 20,497 | | 431,462 |
Omnicare, Inc. | 3,669 | | 83,690 |
Rural/Metro Corp. (a) | 1,600 | | 3,424 |
Virtual Radiologic Corp. | 500 | | 10,140 |
| | 3,397,410 |
Managed Health Care - 10.3% |
Health Net, Inc. (a) | 13,000 | | 627,900 |
Healthspring, Inc. (a) | 4,500 | | 85,725 |
Humana, Inc. (a) | 20,554 | | 1,547,922 |
Medial Saude SA (a) | 30,000 | | 378,371 |
Triple-S Management Corp. | 6,000 | | 121,260 |
UnitedHealth Group, Inc. | 66,370 | | 3,862,734 |
Universal American Financial Corp. (a) | 40,563 | | 1,038,007 |
Wellcare Health Plans, Inc. (a) | 2,400 | | 101,784 |
WellPoint, Inc. (a) | 8,500 | | 745,705 |
| | 8,509,408 |
TOTAL HEALTH CARE PROVIDERS & SERVICES | | 16,910,274 |
HEALTH CARE TECHNOLOGY - 1.9% |
Health Care Technology - 1.9% |
Allscripts Healthcare Solutions, Inc. (a)(d) | 18,500 | | 359,270 |
Cerner Corp. (a) | 3,470 | | 195,708 |
Eclipsys Corp. (a) | 17,133 | | 433,636 |
HLTH Corp. (a) | 33,150 | | 444,210 |
MedAssets, Inc. | 2,200 | | 52,668 |
Vital Images, Inc. (a) | 3,700 | | 66,859 |
| | 1,552,351 |
INTERNET SOFTWARE & SERVICES - 0.3% |
Internet Software & Services - 0.3% |
WebMD Health Corp. Class A (a)(d) | 5,222 | | 214,468 |
LIFE SCIENCES TOOLS & SERVICES - 8.8% |
Life Sciences Tools & Services - 8.8% |
Affymetrix, Inc. (a) | 13,086 | | 302,810 |
AMAG Pharmaceuticals, Inc. | 6,651 | | 399,925 |
Common Stocks - continued |
| Shares | | Value |
LIFE SCIENCES TOOLS & SERVICES - CONTINUED |
Life Sciences Tools & Services - continued |
Applera Corp. - Applied Biosystems Group | 7,600 | | $ 257,792 |
Bruker BioSciences Corp. (a) | 36,203 | | 481,500 |
Charles River Laboratories International, Inc. (a) | 1,400 | | 92,120 |
Covance, Inc. (a) | 2,668 | | 231,102 |
Dishman Pharmaceuticals and
Chemicals Ltd. | 16,277 | | 152,794 |
Divi's Laboratories Ltd. (a) | 1,653 | | 78,701 |
Exelixis, Inc. (a) | 8,863 | | 76,488 |
Illumina, Inc. (a) | 6,304 | | 373,575 |
Invitrogen Corp. (a) | 4,600 | | 429,686 |
Lonza Group AG | 810 | | 98,203 |
Luminex Corp. (a)(d) | 3,465 | | 56,272 |
Millipore Corp. (a) | 1,450 | | 106,111 |
PerkinElmer, Inc. | 47,693 | | 1,240,972 |
Pharmaceutical Product Development, Inc. | 4,100 | | 165,517 |
QIAGEN NV (a) | 14,900 | | 313,645 |
Techne Corp. (a) | 1,200 | | 79,260 |
Thermo Fisher Scientific, Inc. (a) | 25,775 | | 1,486,702 |
Third Wave Technologies, Inc. (a) | 4,299 | | 41,485 |
Waters Corp. (a) | 9,900 | | 782,793 |
Wuxi Pharmatech Cayman, Inc. Sponsored ADR | 700 | | 20,468 |
| | 7,267,921 |
MACHINERY - 0.4% |
Industrial Machinery - 0.4% |
Pall Corp. | 7,500 | | 302,400 |
PERSONAL PRODUCTS - 0.5% |
Personal Products - 0.5% |
Bare Escentuals, Inc. (a) | 14,329 | | 347,478 |
Hengan International Group Co. Ltd. | 22,000 | | 98,755 |
| | 446,233 |
PHARMACEUTICALS - 25.7% |
Pharmaceuticals - 25.7% |
Abbott Laboratories | 49,300 | | 2,768,195 |
Adams Respiratory Therapeutics, Inc. (a) | 1,995 | | 119,181 |
Alembic Ltd. | 48,075 | | 117,061 |
Allergan, Inc. (d) | 30,500 | | 1,959,320 |
Aurobindo Pharma Ltd. | 9,136 | | 125,882 |
Barr Pharmaceuticals, Inc. (a) | 12,100 | | 642,510 |
Beijing Med-Pharm Corp. (a) | 3,800 | | 41,724 |
BioForm Medical, Inc. | 1,000 | | 6,830 |
BioMimetic Therapeutics, Inc. (a) | 26,945 | | 468,035 |
Bristol-Myers Squibb Co. | 81,200 | | 2,153,424 |
China Shineway Pharmaceutical Group Ltd. | 214,000 | | 155,071 |
Eczacibasi ILAC Sanayi TAS (a) | 10,000 | | 44,530 |
|
| Shares | | Value |
Elan Corp. PLC sponsored ADR (a) | 9,300 | | $ 204,414 |
Jazz Pharmaceuticals, Inc. (d) | 6,908 | | 101,548 |
Johnson & Johnson | 14,019 | | 935,067 |
Merck & Co., Inc. | 95,337 | | 5,540,034 |
Nastech Pharmaceutical Co., Inc. (a) | 300 | | 1,140 |
Nexmed, Inc. (a) | 19,851 | | 28,387 |
Novo Nordisk AS Series B
sponsored ADR | 5,200 | | 337,272 |
Perrigo Co. | 4,800 | | 168,048 |
Schering-Plough Corp. | 62,400 | | 1,662,336 |
Shire PLC sponsored ADR | 5,477 | | 377,639 |
Sirtris Pharmaceuticals, Inc. | 5,639 | | 77,198 |
Stada Arzneimittel AG | 800 | | 49,094 |
Sun Pharmaceutical Industries Ltd. | 1,491 | | 45,547 |
ULURU, Inc. (a) | 2,866 | | 7,767 |
Wyeth | 60,920 | | 2,692,055 |
XenoPort, Inc. (a) | 6,600 | | 368,808 |
| | 21,198,117 |
SOFTWARE - 0.1% |
Application Software - 0.1% |
Nuance Communications, Inc. (a) | 4,200 | | 78,456 |
Systems Software - 0.0% |
Quality Systems, Inc. | 352 | | 10,732 |
TOTAL SOFTWARE | | 89,188 |
TEXTILES, APPAREL & LUXURY GOODS - 0.1% |
Footwear - 0.1% |
China Hongxing Sports Ltd. | 171,000 | | 113,885 |
WATER UTILITIES - 0.4% |
Water Utilities - 0.4% |
Companhia de Saneamento Basico do Estado de Sao Paulo (SABESP) sponsored ADR | 7,500 | | 352,500 |
TOTAL COMMON STOCKS (Cost $65,655,715) | 78,447,137 |
Money Market Funds - 9.4% |
| | | |
Fidelity Cash Central Fund, 4.58% (b) | 4,289,106 | | 4,289,106 |
Fidelity Securities Lending Cash Central Fund, 4.65% (b)(c) | 3,523,252 | | 3,523,252 |
TOTAL MONEY MARKET FUNDS (Cost $7,812,358) | 7,812,358 |
TOTAL INVESTMENT PORTFOLIO - 104.4% (Cost $73,468,073) | | 86,259,495 |
NET OTHER ASSETS - (4.4)% | | (3,636,118) |
NET ASSETS - 100% | $ 82,623,377 |
Legend |
(a) Non-income producing |
(b) Affiliated fund that is available only to investment companies and other accounts managed by Fidelity Investments. The rate quoted is the annualized seven-day yield of the fund at period end. A complete unaudited listing of the fund's holdings as of its most recent quarter end is available upon request. |
(c) Investment made with cash collateral received from securities on loan. |
(d) Security or a portion of the security is on loan at period end. |
(e) Restricted securities - Investment in securities not registered under the Securities Act of 1933 (excluding 144A issues). At the end of the period, the value of restricted securities (excluding 144A issues) amounted to $15,458 or 0.0% of net assets. |
Additional information on each holding is as follows: |
Security | Acquisition Date | Acquisition Cost |
Electro-Optical Sciences, Inc.:
warrants 11/2/11 | 11/1/06 | $ 1 |
warrants 8/2/12 | 8/1/07 | $ 2 |
Affiliated Central Funds |
Information regarding fiscal year to date income earned by the Fund from investments in Fidelity Central Funds is as follows: |
Fund | Income earned |
Fidelity Cash Central Fund | $ 47,068 |
Fidelity Securities Lending Cash Central Fund | 46,812 |
Total | $ 93,880 |
Other Information |
Distribution of investments by country of issue, as a percentage of total net assets, is as follows: |
United States of America | 88.0% |
Brazil | 2.5% |
Bermuda | 1.8% |
United Kingdom | 1.4% |
Germany | 1.0% |
Others (individually less than 1%) | 5.3% |
| 100.0% |
See accompanying notes which are an integral part of the financial statements.
Annual Report
Financial Statements
Statement of Assets and Liabilities
| December 31, 2007 |
| | |
Assets | | |
Investment in securities, at value (including securities loaned of $3,401,124) -See accompanying schedule: Unaffiliated issuers (cost $65,655,715) | $ 78,447,137 | |
Fidelity Central Funds
(cost $7,812,358) | 7,812,358 | |
Total Investments (cost $73,468,073) | | $ 86,259,495 |
Cash | | 3,426 |
Foreign currency held at value
(cost $3,290) | | 3,290 |
Receivable for investments sold | | 40,264 |
Receivable for fund shares sold | | 45,587 |
Dividends receivable | | 70,001 |
Distributions receivable from Fidelity Central Funds | | 9,067 |
Prepaid expenses | | 249 |
Other receivables | | 931 |
Total assets | | 86,432,310 |
| | |
Liabilities | | |
Payable for investments purchased | $ 189,912 | |
Payable for fund shares redeemed | 561 | |
Accrued management fee | 36,979 | |
Other affiliated payables | 9,300 | |
Other payables and accrued expenses | 48,929 | |
Collateral on securities loaned, at value | 3,523,252 | |
Total liabilities | | 3,808,933 |
| | |
Net Assets | | $ 82,623,377 |
Net Assets consist of: | | |
Paid in capital | | $ 60,812,539 |
Undistributed net investment income | | 41,704 |
Accumulated undistributed net realized gain (loss) on investments and foreign currency transactions | | 8,983,932 |
Net unrealized appreciation (depreciation) on investments and assets and liabilities in foreign currencies | | 12,785,202 |
Net Assets | | $ 82,623,377 |
Statement of Assets and Liabilities - continued
| December 31, 2007 |
| | |
Initial Class:
Net Asset Value, offering price and redemption price per share ($55,675,567 ÷ 4,101,733 shares) | | $ 13.57 |
| | |
Investor Class:
Net Asset Value, offering price and redemption price per share ($26,947,810 ÷ 1,991,246 shares) | | $ 13.53 |
See accompanying notes which are an integral part of the financial statements.
Annual Report
Financial Statements - continued
Statement of Operations
| Year ended December 31, 2007 |
| | |
Investment Income | | |
Dividends | | $ 748,688 |
Interest | | 1,111 |
Income from Fidelity Central Funds (including $46,812 from security lending) | | 93,880 |
Total income | | 843,679 |
| | |
Expenses | | |
Management fee | $ 454,912 | |
Transfer agent fees | 84,020 | |
Accounting and security lending fees | 32,803 | |
Custodian fees and expenses | 41,354 | |
Independent trustees' compensation | 284 | |
Audit | 45,316 | |
Legal | 684 | |
Miscellaneous | 23,461 | |
Total expenses before reductions | 682,834 | |
Expense reductions | (4,580) | 678,254 |
Net investment income (loss) | | 165,425 |
Realized and Unrealized Gain (Loss) Net realized gain (loss) on: | | |
Investment securities: | | |
Unaffiliated issuers (net of foreign taxes of $4,778) | 9,190,376 | |
Foreign currency transactions | (9,271) | |
Total net realized gain (loss) | | 9,181,105 |
Change in net unrealized appreciation (depreciation) on: Investment securities (net of increase in deferred foreign taxes of $5,290) | (1,591,020) | |
Assets and liabilities in foreign currencies | 553 | |
Total change in net unrealized appreciation (depreciation) | | (1,590,467) |
Net gain (loss) | | 7,590,638 |
Net increase (decrease) in net assets resulting from operations | | $ 7,756,063 |
Statement of Changes in Net Assets
| Year ended
December 31,
2007 | Year ended
December 31,
2006 |
Increase (Decrease) in Net Assets | | |
Operations | | |
Net investment income (loss) | $ 165,425 | $ 315,318 |
Net realized gain (loss) | 9,181,105 | 10,231,619 |
Change in net unrealized appreciation (depreciation) | (1,590,467) | (5,490,932) |
Net increase (decrease) in net assets resulting from operations | 7,756,063 | 5,056,005 |
Distributions to shareholders from net investment income | (399,085) | (52,605) |
Distributions to shareholders from net realized gain | (5,172,213) | - |
Total distributions | (5,571,298) | (52,605) |
Share transactions - net increase (decrease) | (5,226,497) | (45,672,265) |
Redemption fees | 18,137 | 27,198 |
Total increase (decrease) in net assets | (3,023,595) | (40,641,667) |
| | |
Net Assets | | |
Beginning of period | 85,646,972 | 126,288,639 |
End of period (including undistributed net investment income of $41,704 and undistributed net investment income of $303,622, respectively) | $ 82,623,377 | $ 85,646,972 |
See accompanying notes which are an integral part of the financial statements.
Annual Report
Financial Highlights - Initial Class
Years ended December 31, | 2007 | 2006 | 2005 | 2004 | 2003 |
Selected Per-Share Data | | | | | |
Net asset value, beginning of period | $ 13.17 | $ 12.39 | $ 10.61 | $ 9.77 | $ 8.41 |
Income from Investment Operations | | | | | |
Net investment income (loss) C | .03 | .04 | .01 | .03 | .03 |
Net realized and unrealized gain (loss) | 1.25 | .75 | 1.80 | .84 | 1.33 |
Total from investment operations | 1.28 | .79 | 1.81 | .87 | 1.36 |
Distributions from net investment income | (.07) | (.01) | (.03) | (.04) | - |
Distributions from net realized gain | (.81) | - | - | - | - |
Total distributions | (.88) | (.01) | (.03) | (.04) | - |
Redemption fees added to paid in capital C | - G | - G | - G | .01 | - G |
Net asset value, end of period | $ 13.57 | $ 13.17 | $ 12.39 | $ 10.61 | $ 9.77 |
Total Return A, B | 10.21% | 6.34% | 17.05% | 8.97% | 16.17% |
Ratios to Average Net Assets D, F | | | | | |
Expenses before reductions | .81% | .77% | .75% | .77% | .89% |
Expenses net of fee waivers, if any | .81% | .77% | .75% | .77% | .89% |
Expenses net of all reductions | .80% | .76% | .70% | .76% | .85% |
Net investment income (loss) | .23% | .33% | .06% | .26% | .32% |
Supplemental Data | | | | | |
Net assets, end of period (000 omitted) | $ 55,676 | $ 69,418 | $ 118,928 | $ 65,718 | $ 52,603 |
Portfolio turnover rate E | 128% | 106% | 122% | 56% | 124% |
A Total returns do not reflect charges attributable to your insurance company's separate account. Inclusion of these charges would reduce the total returns shown.
B Total returns would have been lower had certain expenses not been reduced during the periods shown.
C Calculated based on average shares outstanding during the period.
D Fees and expenses of the underlying Fidelity Central Funds are not included in the Fund's expense ratio. The Fund indirectly bears its proportionate share of the expenses of any underlying Fidelity Central Funds.
E Amount does not include the portfolio activity of any underlying Fidelity Central Funds.
F Expense ratios reflect operating expenses of the class. Expenses before reductions do not reflect amounts reimbursed by the investment adviser or reductions from brokerage service arrangements or other expense offset arrangements and do not represent the amount paid by the class during periods when reimbursements or reductions occur. Expense ratios before reductions for start-up periods may not be representative of longer-term operating periods. Expenses net of fee waivers reflect expenses after reimbursement by the investment adviser but prior to reductions from brokerage service arrangements or other expense offset arrangements. Expenses net of all reductions represent the net expenses paid by the class.
G Amount represents less than $.01 per share.
Financial Highlights - Investor Class
Years ended December 31, | 2007 | 2006 | 2005 H |
Selected Per-Share Data | | | |
Net asset value, beginning of period | $ 13.14 | $ 12.37 | $ 11.64 |
Income from Investment Operations | | | |
Net investment income (loss) E | .01 | .03 | (.01) |
Net realized and unrealized gain (loss) | 1.24 | .75 | .74 |
Total from investment operations | 1.25 | .78 | .73 |
Distributions from net investment income | (.05) | (.01) | - |
Distributions from net realized gain | (.81) | - | - |
Total distributions | (.86) | (.01) | - |
Redemption fees added to paid in capital E, J | - | - | - |
Net asset value, end of period | $ 13.53 | $ 13.14 | $ 12.37 |
Total Return B, C, D | 10.01% | 6.30% | 6.27% |
Ratios to Average Net Assets F, I | | | |
Expenses before reductions | .93% | .90% | .93% A |
Expenses net of fee waivers, if any | .93% | .90% | .93% A |
Expenses net of all reductions | .92% | .89% | .89% A |
Net investment income (loss) | .11% | .20% | (.25)% A |
Supplemental Data | | | |
Net assets, end of period (000 omitted) | $ 26,948 | $ 16,229 | $ 7,360 |
Portfolio turnover rate G | 128% | 106% | 122% |
A Annualized
B Total returns for periods of less than one year are not annualized.
C Total returns do not reflect charges attributable to your insurance company's separate account. Inclusion of these charges would reduce the total returns shown.
D Total returns would have been lower had certain expenses not been reduced during the periods shown.
E Calculated based on average shares outstanding during the period.
F Fees and expenses of the underlying Fidelity Central Funds are not included in the Fund's expense ratio. The Fund indirectly bears its proportionate share of the expenses of any underlying Fidelity Central Funds.
G Amount does not include the portfolio activity of any underlying Fidelity Central Funds.
H For the period July 21, 2005 (commencement of sale of shares) to December 31, 2005.
I Expense ratios reflect operating expenses of the class. Expenses before reductions do not reflect amounts reimbursed by the investment adviser or reductions from brokerage service arrangements or other expense offset arrangements and do not represent the amount paid by the class during periods when reimbursements or reductions occur. Expense ratios before reductions for start-up periods may not be representative of longer-term operating periods. Expenses net of fee waivers reflect expenses after reimbursement by the investment adviser but prior to reductions from brokerage service arrangements or other expense offset arrangements. Expenses net of all reductions represent the net expenses paid by the class.
J Amount represents less than $.01 per share.
See accompanying notes which are an integral part of the financial statements.
Annual Report
Notes to Financial Statements
For the period ended December 31, 2007
1. Organization.
VIP Health Care Portfolio (the Fund) is a non-diversified fund of Variable Insurance Products Fund IV (the trust) and is authorized to issue an unlimited number of shares. The trust is registered under the Investment Company Act of 1940, as amended (the 1940 Act), as an open-end management investment company organized as a Massachusetts business trust. Shares of the Fund may only be purchased by insurance companies for the purpose of funding variable annuity or variable life insurance contracts. The Fund offers the following classes of shares: Initial Class shares and Investor Class shares. All classes have equal rights and voting privileges, except for matters affecting a single class. Investment income, realized and unrealized capital gains and losses, the common expenses of the Fund, and certain fund-level expense reductions, if any, are allocated on a pro rata basis to each class based on the relative net assets of each class to the total net assets of the Fund. Each class differs with respect to transfer agent fees incurred. Certain expense reductions also differ by class.
2. Investments in Fidelity Central Funds.
The Fund may invest in Fidelity Central Funds, which are open-end investment companies available only to other investment companies and accounts managed by Fidelity Management & Research Company (FMR) and its affiliates. The Fund's Schedule of Investments lists each of the Fidelity Central Funds as an investment of the Fund, but does not include the underlying holdings of each Fidelity Central Fund. As an Investing Fund, the Fund indirectly bears its proportionate share of the expenses of the underlying Fidelity Central Funds.
The Money Market Central Funds seek preservation of capital and current income and are managed by Fidelity Investments Money Management, Inc. (FIMM), an affiliate of FMR.
A complete list of holdings for each Fidelity Central Fund is available upon request or at the SEC's web site at www.sec.gov. In addition, the financial statements of the Fidelity Central Funds, which are not covered by the Fund's Report of Independent Registered Public Accounting Firm, are available on the SEC's web site or upon request.
3. Significant Accounting Policies.
The financial statements have been prepared in conformity with accounting principles generally accepted in the United States of America, which require management to make certain estimates and assumptions at the date of the financial statements. The following summarizes the significant accounting policies of the Fund:
Security Valuation. Investments are valued and net asset value (NAV) per share is calculated (NAV calculation) as of the close of business of the New York Stock Exchange (NYSE), normally 4:00 p.m. Eastern time. Wherever possible, the Fund uses independent pricing services approved by the Board of Trustees to value its investments.
Equity securities, including restricted securities, for which market quotations are readily available, are valued at the last reported sale price or official closing price as reported by an independent pricing service on the primary market or exchange on which they are traded. In the event there were no sales during the day or closing prices are not available, securities are valued at the last quoted bid price. Investments in open-end mutual funds, including the Fidelity Central Funds, are valued at their closing net asset value each business day. Short-term securities with remaining maturities of sixty days or less for which quotations are not readily available are valued at amortized cost, which approximates value.
When current market prices or quotations are not readily available or do not accurately reflect fair value, valuations may be determined in accordance with procedures adopted by the Board of Trustees. For example, when developments occur between the close of a market and the close of the NYSE that may materially affect the value of some or all of the securities, or when trading in a security is halted, those securities may be fair valued. Factors used in the determination of fair value may include monitoring news to identify significant market or security specific events such as changes in the value of U.S. securities markets, reviewing developments in foreign markets and evaluating the performance of ADRs, futures contracts and exchange-traded funds. Because the Fund's utilization of fair value pricing depends on market activity, the frequency with which fair value pricing is used cannot be predicted and may be utilized to a significant extent. The value of securities used for NAV calculation under fair value pricing may differ from published prices for the same securities.
Foreign Currency. The Fund uses foreign currency contracts to facilitate transactions in foreign-denominated securities. Losses from these transactions may arise from changes in the value of the foreign currency or if the counterparties do not perform under the contracts' terms.
Foreign-denominated assets, including investment securities, and liabilities are translated into U.S. dollars at the exchange rate at period end. Purchases and sales of investment securities, income and dividends received and expenses denominated in foreign currencies are translated into U.S. dollars at the exchange rate in effect on the transaction date.
The effects of exchange rate fluctuations on investments are included with the net realized and unrealized gain (loss) on investment securities. Other foreign currency transactions resulting in realized and unrealized gain (loss) are disclosed separately.
Annual Report
3. Significant Accounting Policies - continued
Investment Transactions and Income. For financial reporting purposes, the Fund's investment holdings and NAV include trades executed through the end of the last business day of the period. The NAV for processing shareholder transactions includes trades executed through the end of the prior business day. Gains and losses on securities sold are determined on the basis of identified cost and may include proceeds received from litigation. Dividend income is recorded on the ex-dividend date, except for certain dividends from foreign securities where the ex-dividend date may have passed, which are recorded as soon as the Fund is informed of the ex-dividend date. Non-cash dividends included in dividend income, if any, are recorded at the fair market value of the securities received. Distributions received on securities that represent a return of capital or capital gain are recorded as a reduction of cost of investments and/or as a realized gain. The Fund estimates the components of distributions received that may be considered return of capital distributions or capital gain distributions. As a result of a change in the estimate of the return of capital component of dividend income realized in the year ended December 31, 2006, dividend income has been reduced $94,180 with a corresponding increase to net unrealized appreciation (depreciation). The change in estimate has no impact on total net assets or total return of the Fund. Interest income and distributions from the Fidelity Central Funds are accrued as earned. Interest income includes coupon interest and amortization of premium and accretion of discount on debt securities. Investment income is recorded net of foreign taxes withheld where recovery of such taxes is uncertain.
Expenses. Most expenses of the trust can be directly attributed to a fund. Expenses which cannot be directly attributed are apportioned among each Fund in the trust. Expense estimates are accrued in the period to which they relate and adjustments are made when actual amounts are known.
Income Tax Information and Distributions to Shareholders. Each year, the Fund intends to qualify as a regulated investment company by distributing substantially all of its taxable income and realized gains under Subchapter M of the Internal Revenue Code and filing its U.S. federal tax return. As a result, no provision for income taxes is required. The Fund adopted the provisions of FASB Interpretation No. 48, Accounting for Uncertainties in Income Taxes (FIN 48), on June 29, 2007. FIN 48 sets forth a minimum threshold for financial statement recognition of the benefit of a tax position taken or expected to be taken in a tax return. The implementation of FIN 48 did not result in any unrecognized tax benefits in the accompanying financial statements. Each of the Fund's federal tax returns for the prior three fiscal years remains subject to examination by the Internal Revenue Service. Foreign taxes are provided for based on the Fund's understanding of the tax rules and rates that exist in the foreign markets in which it invests.
Distributions are recorded on the ex-dividend date. Income dividends and capital gain distributions are declared separately for each class. Income and capital gain distributions are determined in accordance with income tax regulations, which may differ from generally accepted accounting principles.
Capital accounts within the financial statements are adjusted for permanent book-tax differences. These adjustments have no impact on net assets or the results of operations. Temporary book-tax differences will reverse in a subsequent period.
Book-tax differences are primarily due to certain foreign taxes, foreign currency transactions and losses deferred due to wash sales.
The tax-basis components of distributable earnings and the federal tax cost as of period end were as follows:
Unrealized appreciation | $ 15,306,524 | |
Unrealized depreciation | (2,714,980) | |
Net unrealized appreciation (depreciation) | 12,591,544 | |
Undistributed ordinary income | 2,487,591 | |
Undistributed long-term capital gain | 6,731,703 | |
| | |
Cost for federal income tax purposes | $ 73,667,951 | |
The tax character of distributions paid was as follows:
| December 31, 2007 | December 31, 2006 |
Ordinary Income | $ 1,176,191 | $ 52,605 |
Long-term Capital Gains | 4,395,107 | - |
Total | $ 5,571,298 | $ 52,605 |
Trading (Redemption) Fees. Shares held less than 60 days are subject to a redemption fee equal to 1% of the proceeds of the redeemed shares. All redemption fees, including any estimated redemption fees paid by FMR, are retained by the Fund and accounted for as an addition to paid in capital.
New Accounting Pronouncement. In September 2006, Statement of Financial Accounting Standards No. 157, Fair Value Measurements (SFAS 157), was issued and is effective for fiscal years beginning after November 15, 2007. SFAS 157 defines fair value, establishes a framework for measuring fair value and expands disclosures about fair value measurements. Management is currently evaluating the impact the adoption of SFAS 157 will have on the Fund's financial statement disclosures.
Annual Report
Notes to Financial Statements - continued
4. Operating Policies.
Repurchase Agreements. FMR has received an Exemptive Order from the Securities and Exchange Commission (the SEC) which permits the Fund and other affiliated entities of FMR to transfer uninvested cash balances into joint trading accounts which are then invested in repurchase agreements. The Fund may also invest directly with institutions in repurchase agreements. Repurchase agreements are collateralized by government or non-government securities. Upon settlement date, collateral is held in segregated accounts with custodian banks and may be obtained in the event of a default of the counterparty. The Fund monitors, on a daily basis, the value of the collateral to ensure it is at least equal to the principal amount of the repurchase agreement (including accrued interest). In the event of a default by the counterparty, realization of the collateral proceeds could be delayed, during which time the value of the collateral may decline.
Restricted Securities. The Fund may invest in securities that are subject to legal or contractual restrictions on resale. These securities generally may be resold in transactions exempt from registration or to the public if the securities are registered. Disposal of these securities may involve time-consuming negotiations and expense, and prompt sale at an acceptable price may be difficult. Information regarding restricted securities is included at the end of the Fund's Schedule of Investments.
5. Purchases and Sales of Investments.
Purchases and sales of securities, other than short-term securities, aggregated $102,944,724 and $117,053,789, respectively.
6. Fees and Other Transactions with Affiliates.
Management Fee. FMR and its affiliates provide the Fund with investment management related services for which the Fund pays a monthly management fee. The management fee is the sum of an individual fund fee rate that is based on an annual rate of .30% of the Fund's average net assets and a group fee rate that averaged .26% during the period. The group fee rate is based upon the average net assets of all the mutual funds advised by FMR. The group fee rate decreases as assets under management increase and increases as assets under management decrease. For the period, the total annual management fee rate was .56% of the Fund's average net assets.
Transfer Agent Fees. Fidelity Investments Institutional Operations Company, Inc. (FIIOC), an affiliate of FMR, is the Fund's transfer, dividend disbursing, and shareholder servicing agent. FIIOC receives an asset-based fee with respect to each class. Each class with the exception of Investor Class pays a transfer agent fee, excluding out of pocket expenses, equal to an annual rate of .07% of average net assets. Investor Class pays a monthly asset-based transfer agent fee of .18% of average net assets. The total transfer agent fees paid by each class to FIIOC, including out of pocket expenses, were as follows:
Initial Class | $ 43,811 |
Investor Class | 40,209 |
| $ 84,020 |
Effective February 1, 2008, the Board of Trustees approved a decrease to Investor Class' asset-based fee from .18% to .15% of average net assets.
Accounting and Security Lending Fees. Fidelity Service Company, Inc. (FSC), an affiliate of FMR, maintains the Fund's accounting records. The accounting fee is based on the level of average net assets for the month. Under a separate contract, FSC administers the security lending program. The security lending fee is based on the number and duration of lending transactions.
Brokerage Commissions. The Fund placed a portion of its portfolio transactions with brokerage firms which are affiliates of the investment adviser. The commissions paid to these affiliated firms were $891 for the period.
7. Committed Line of Credit.
The Fund participates with other funds managed by FMR in a $4.2 billion credit facility (the "line of credit") to be utilized for temporary or emergency purposes to fund shareholder redemptions or for other short-term liquidity purposes. The Fund has agreed to pay commitment fees on its pro rata portion of the line of credit, which amounted to $180 and is reflected in Miscellaneous Expense on the Statement of Operations. During the period, there were no borrowings on this line of credit.
Annual Report
8. Security Lending.
The Fund lends portfolio securities from time to time in order to earn additional income. On the settlement date of the loan, the Fund receives collateral (in the form of U.S. Treasury obligations, letters of credit and/or cash) against the loaned securities and maintains collateral in an amount not less than 100% of the market value of the loaned securities during the period of the loan. The market value of the loaned securities is determined at the close of business of the Fund and any additional required collateral is delivered to the Fund on the next business day. If the borrower defaults on its obligation to return the securities loaned because of insolvency or other reasons, a fund could experience delays and costs in recovering the securities loaned or in gaining access to the collateral. Any cash collateral received is invested in the Fidelity Securities Lending Cash Central Fund. The value of loaned securities and cash collateral at period end are disclosed on the Fund's Statement of Assets and Liabilities. Security lending income represents the income earned on investing cash collateral, less fees and expenses associated with the loan, plus any premium payments that may be received on the loan of certain types of securities. Security lending income is presented in the Statement of Operations as a component of income from Fidelity Central Funds. Net income from lending portfolio securities during the period amounted to $46,812.
9. Expense Reductions.
Many of the brokers with whom FMR places trades on behalf of the Fund provided services to the Fund in addition to trade execution. These services included payments of certain expenses on behalf of the Fund totaling $4,559 for the period.
10. Other.
The Fund's organizational documents provide former and current trustees and officers with a limited indemnification against liabilities arising in connection with the performance of their duties to the Fund. In the normal course of business, the Fund may also enter into contracts that provide general indemnifications. The Fund's maximum exposure under these arrangements is unknown as this would be dependent on future claims that may be made against the Fund. The risk of material loss from such claims is considered remote.
At the end of the period, FMR or its affiliates were the owners of record of 100% of the total outstanding shares of the Fund.
The United States Securities and Exchange Commission ("SEC") is conducting an investigation of FMR (covering the years 2002 to 2004) arising from gifts, gratuities and business entertainment provided by certain brokers to certain individuals who were employed on FMR's domestic equity trading desk during that period. FMR is in discussions with the SEC staff regarding the possible resolution of the matter, but as of period-end no final resolution has been reached.
In December 2006, the Independent Trustees completed their own investigation of the matter with the assistance of independent counsel. The Independent Trustees and FMR agree that, despite the absence of proof that the Fidelity mutual funds experienced diminished execution quality as a result of the improper receipt of gifts and business entertainment, the conduct at issue was serious and is worthy of redress. Accordingly, the Independent Trustees have requested and FMR has agreed to pay $42 million to Fidelity mutual funds, plus interest to be determined at the time that payment is made. A method of allocating this payment among the funds has not yet been determined. The total payment to the Fund is not anticipated to have a material impact on the Fund's net assets. In addition, FMR reimbursed related legal expenses which are recorded in the accompanying Statement of Operations as an expense reduction.
11. Distributions to Shareholders.
Distributions to shareholders of each class were as follows:
Years ended December 31, | 2007 | 2006 |
From net investment income | | |
Initial Class | $ 326,177 | $ 45,607 |
Investor Class | 72,908 | 6,998 |
Total | $ 399,085 | $ 52,605 |
From net realized gain | | |
Initial Class | $ 4,069,153 | $ - |
Investor Class | 1,103,060 | - |
Total | $ 5,172,213 | $ - |
Annual Report
Notes to Financial Statements - continued
12. Share Transactions.
Transactions for each class of shares were as follows:
| Shares | Dollars |
Years ended December 31, | 2007 | 2006 | 2007 | 2006 |
Initial Class | | | | |
Shares sold | 366,144 | 473,551 | $ 4,856,177 | $ 5,954,403 |
Reinvestment of distributions | 346,986 | 3,681 | 4,395,330 | 45,607 |
Shares redeemed | (1,880,362) | (4,806,260) | (24,498,174) | (59,742,246) |
Net increase (decrease) | (1,167,232) | (4,329,028) | $ (15,246,667) | $ (53,742,236) |
Investor Class | | | | |
Shares sold | 1,102,519 | 994,136 | $ 14,551,900 | $ 12,464,919 |
Reinvestment of distributions | 93,172 | 566 | 1,175,968 | 6,998 |
Shares redeemed | (439,794) | (354,157) | (5,707,698) | (4,401,946) |
Net increase (decrease) | 755,897 | 640,545 | $ 10,020,170 | $ 8,069,971 |
Annual Report
Report of Independent Registered Public Accounting Firm
To the Trustees of Variable Insurance Products Fund IV and the Shareholders of VIP Health Care Portfolio:
In our opinion, the accompanying statement of assets and liabilities, including the schedule of investments, and the related statements of operations and of changes in net assets and the financial highlights present fairly, in all material respects, the financial position of VIP Health Care Portfolio (a fund of Variable Insurance Products Fund IV) at December 31, 2007, the results of its operations for the year then ended, the changes in its net assets for each of the two years in the period then ended and the financial highlights for each of the periods indicated, in conformity with accounting principles generally accepted in the United States of America. These financial statements and financial highlights (hereafter referred to as "financial statements") are the responsibility of the VIP Health Care Portfolio's management. Our responsibility is to express an opinion on these financial statements based on our audits. We conducted our audits of these financial statements in accordance with the standards of the Public Company Accounting Oversight Board (United States). Those standards require that we plan and perform the audit to obtain reasonable assurance about whether the financial statements are free of material misstatement. An audit includes examining, on a test basis, evidence supporting the amounts and disclosures in the financial statements, assessing the accounting principles used and significant estimates made by management, and evaluating the overall financial statement presentation. We believe that our audits, which included confirmation of securities at December 31, 2007 by correspondence with the custodian and brokers, provide a reasonable basis for our opinion.
/s/ PricewaterhouseCoopers LLP
PricewaterhouseCoopers LLP
Boston, Massachusetts
February 20, 2008
Annual Report
Trustees and Officers
The Trustees, Members of the Advisory Board, and executive officers of the trust and fund, as applicable, are listed below. The Board of Trustees governs the fund and is responsible for protecting the interests of shareholders. The Trustees are experienced executives who meet periodically throughout the year to oversee the fund's activities, review contractual arrangements with companies that provide services to the fund, and review the fund's performance. Except for James C. Curvey, each of the Trustees oversees 373 funds advised by FMR or an affiliate. Mr. Curvey oversees 368 funds advised by FMR or an affiliate.
The Trustees hold office without limit in time except that (a) any Trustee may resign; (b) any Trustee may be removed by written instrument, signed by at least two-thirds of the number of Trustees prior to such removal; (c) any Trustee who requests to be retired or who has become incapacitated by illness or injury may be retired by written instrument signed by a majority of the other Trustees; and (d) any Trustee may be removed at any special meeting of shareholders by a two-thirds vote of the outstanding voting securities of the trust. Each Trustee who is not an interested person (as defined in the 1940 Act) (Independent Trustee), shall retire not later than the last day of the calendar year in which his or her 72nd birthday occurs. The Independent Trustees may waive this mandatory retirement age policy with respect to individual Trustees. The executive officers and Advisory Board Members hold office without limit in time, except that any officer and Advisory Board Member may resign or may be removed by a vote of a majority of the Trustees at any regular meeting or any special meeting of the Trustees. Except as indicated, each individual has held the office shown or other offices in the same company for the past five years.
The fund's Statement of Additional Information (SAI) includes more information about the Trustees. To request a free copy, call Fidelity at 1-877-208-0098.
Interested Trustees*:
Correspondence intended for each Trustee who is an interested person may be sent to Fidelity Investments, 82 Devonshire Street, Boston, Massachusetts 02109.
Name, Age; Principal Occupation |
Edward C. Johnson 3d (77) |
| Year of Election or Appointment: 1983 Mr. Johnson is Chairman of the Board of Trustees. Mr. Johnson serves as President (2006-present), Chief Executive Officer, Chairman, and a Director of FMR LLC; Chairman and a Director of FMR; Chairman and a Director of Fidelity Research & Analysis Company (FRAC); Chairman and a Director of Fidelity Investments Money Management, Inc.; and Chairman (2001-present) and a Director of FMR Co., Inc. In addition, Mr. Johnson serves as Chairman and Director of Fidelity International Limited (FIL). Mr. Edward C. Johnson 3d and Mr. Arthur E. Johnson are not related. |
James C. Curvey (72) |
| Year of Election or Appointment: 2007 Mr. Curvey also serves as Trustee (2007-present) or Member of the Advisory Board (2007-present) of other investment companies advised by FMR. Mr. Curvey is a Director of FMR and FMR Co., Inc. (2007-present). Mr. Curvey is also Vice Chairman (2006-present) and Director of FMR LLC. Mr. Curvey joined Fidelity in 1982 and served in numerous senior management positions, including President and Chief Operating Officer of FMR LLC (1997-2000) and President of Fidelity Strategic Investments (2000-2002). In addition, he serves as a member of the Board of Directors of Geerlings & Wade, Inc. (wine distribution). |
* Trustees have been determined to be "Interested Trustees" by virtue of, among other things, their affiliation with the trust or various entities under common control with FMR. FMR Corp. merged with and into FMR LLC on October 1, 2007. Any references to FMR LLC for prior periods are deemed to be references to the prior entity.
Independent Trustees:
Correspondence intended for each Independent Trustee (that is, the Trustees other than the Interested Trustees) may be sent to Fidelity Investments, P.O. Box 55235, Boston, Massachusetts 02205-5235.
Name, Age; Principal Occupation |
Dennis J. Dirks (59) |
| Year of Election or Appointment: 2005 Prior to his retirement in May 2003, Mr. Dirks was Chief Operating Officer and a member of the Board of The Depository Trust & Clearing Corporation (DTCC) (1999-2003). He also served as President, Chief Operating Officer, and Board member of The Depository Trust Company (DTC) (1999-2003) and President and Board member of the National Securities Clearing Corporation (NSCC) (1999-2003). In addition, Mr. Dirks served as Chief Executive Officer and Board member of the Government Securities Clearing Corporation (2001-2003) and Chief Executive Officer and Board member of the Mortgage-Backed Securities Clearing Corporation (2001-2003). Mr. Dirks also serves as a Trustee and a member of the Finance Committee of Manhattan College (2005-present) and a Trustee and a member of the Finance Committee of AHRC of Nassau County (2006-present). |
Albert R. Gamper, Jr. (65) |
| Year of Election or Appointment: 2006 Prior to his retirement in December 2004, Mr. Gamper served as Chairman of the Board of CIT Group Inc. (commercial finance). During his tenure with CIT Group Inc. Mr. Gamper served in numerous senior management positions, including Chairman (1987-1989; 1999-2001; 2002-2004), Chief Executive Officer (1987-2004), and President (1989-2002). He currently serves as a member of the Board of Directors of Public Service Enterprise Group (utilities, 2001-present), Chairman of the Board of Governors, Rutgers University (2004-present), and Chairman of the Board of Saint Barnabas Health Care System. |
George H. Heilmeier (71) |
| Year of Election or Appointment: 2004 Dr. Heilmeier is Chairman Emeritus of Telcordia Technologies (communication software and systems), where prior to his retirement, he served as company Chairman and Chief Executive Officer. He currently serves on the Boards of Directors of The Mitre Corporation (systems engineering and information technology support for the government), and HRL Laboratories (private research and development, 2004-present). He is Chairman of the General Motors Science & Technology Advisory Board and a Life Fellow of the Institute of Electrical and Electronics Engineers (IEEE). Dr. Heilmeier is a member of the Defense Science Board and the National Security Agency Advisory Board. He is also a member of the National Academy of Engineering, the American Academy of Arts and Sciences, and the Board of Overseers of the School of Engineering and Applied Science of the University of Pennsylvania. Previously, Dr. Heilmeier served as a Director of TRW Inc. (automotive, space, defense, and information technology, 1992-2002), Compaq (1994-2002), Automatic Data Processing, Inc. (ADP) (technology-based business outsourcing, 1995-2002), INET Technologies Inc. (telecommunications network surveillance, 2001-2004), and Teletech Holdings (customer management services). He is the recipient of the 2005 Kyoto Prize in Advanced Technology for his invention of the liquid crystal display, and a member of the Consumer Electronics Hall of Fame. |
James H. Keyes (67) |
| Year of Election or Appointment: 2007 Prior to his retirement in 2003, Mr. Keyes was Chairman, President, and Chief Executive Officer of Johnson Controls, Inc. (automotive supplier, 1993-2003). He currently serves as a member of the boards of LSI Logic Corporation (semiconductor technologies), Navistar International Corporation (manufacture and sale of trucks, buses, and diesel engines, 2002-present), and Pitney Bowes, Inc. (integrated mail, messaging, and document management solutions). |
Marie L. Knowles (61) |
| Year of Election or Appointment: 2001 Prior to Ms. Knowles' retirement in June 2000, she served as Executive Vice President and Chief Financial Officer of Atlantic Richfield Company (ARCO) (diversified energy, 1996-2000). From 1993 to 1996, she was a Senior Vice President of ARCO and President of ARCO Transportation Company. She served as a Director of ARCO from 1996 to 1998. She currently serves as a Director of Phelps Dodge Corporation (copper mining and manufacturing) and McKesson Corporation (healthcare service, 2002-present). Ms. Knowles is a Trustee of the Brookings Institution and the Catalina Island Conservancy and also serves as a member of the Advisory Board for the School of Engineering of the University of Southern California. |
Ned C. Lautenbach (63) |
| Year of Election or Appointment: 2000 Mr. Lautenbach is Chairman of the Independent Trustees (2006-present). Mr. Lautenbach has been a partner of Clayton, Dubilier & Rice, Inc. (private equity investment firm) since September 1998. Previously, Mr. Lautenbach was with the International Business Machines Corporation (IBM) from 1968 until his retirement in 1998. Mr. Lautenbach serves as a Director of Sony Corporation (2006-present) and Eaton Corporation (diversified industrial) as well as the Philharmonic Center for the Arts in Naples, Florida. He also is a member of the Board of Trustees of Fairfield University (2005-present), as well as a member of the Council on Foreign Relations. |
Cornelia M. Small (63) |
| Year of Election or Appointment: 2005 Ms. Small is a member (2000-present) and Chairperson (2002-present) of the Investment Committee, and a member (2002-present) of the Board of Trustees of Smith College. Previously, she served as Chief Investment Officer (1999-2000), Director of Global Equity Investments (1996-1999), and a member of the Board of Directors of Scudder, Stevens & Clark (1990-1997) and Scudder Kemper Investments (1997-1999). In addition, Ms. Small served as Co-Chair (2000-2003) of the Annual Fund for the Fletcher School of Law and Diplomacy. |
William S. Stavropoulos (68) |
| Year of Election or Appointment: 2001 Mr. Stavropoulos is Chairman Emeritus of the Board of Directors of The Dow Chemical Company. Since joining The Dow Chemical Company in 1967, Mr. Stavropoulos served in numerous senior management positions, including President (1993-2000; 2002-2003), CEO (1995-2000; 2002-2004), and Chairman of the Executive Committee (2000-2004). Currently, he is a Director of NCR Corporation (data warehousing and technology solutions), Chemical Financial Corporation, Maersk Inc. (industrial conglomerate, 2002-present), Tyco International, Inc. (multinational manufacturing and services, 2007-present), and a member of the Advisory Board for Metalmark Capital (private equity investment firm, 2005-present). He is a special advisor to Clayton, Dubilier & Rice, Inc., a private equity investment firm. He also serves as a member of the Board of Trustees of the American Enterprise Institute for Public Policy Research. In addition, Mr. Stavropoulos is a member of The Business Council, J.P. Morgan International Council and the University of Notre Dame Advisory Council for the College of Science. |
Kenneth L. Wolfe (68) |
| Year of Election or Appointment: 2005 Mr. Wolfe is Chairman and a Director of Hershey Foods Corporation (2007-present), where prior to his retirement in 2001, he was Chairman and Chief Executive Officer. Mr. Wolfe currently serves as a member of the board of Revlon Inc. (2004-present). Previously, Mr. Wolfe served as a member of the boards of Adelphia Communications Corporation (2003-2006) and Bausch & Lomb, Inc. (1993-2007). |
Advisory Board Members and Executive Officers**:
Correspondence intended for Mr. Mauriello, Mr. Thomas, Mr. Wiley, Mr. Lacy, and Mr. Arthur Johnson may be sent to Fidelity Investments, P.O. Box 55235, Boston, Massachusetts 02205-5235. Correspondence intended for each executive officer and Mr. Lynch may be sent to Fidelity Investments, 82 Devonshire Street, Boston, Massachusetts 02109.
Name, Age; Principal Occupation |
Arthur E. Johnson (60) |
| Year of Election or Appointment: 2008 Member of the Advisory Board of Variable Insurance Products Fund IV. Mr. Johnson serves as Senior Vice President of Corporate Strategic Development of Lockheed Martin Corporation (defense contractor). In addition, Mr. Johnson serves as a member of the Board of Directors of AGL Resources, Inc. (holding company, 2002-present), and IKON Office Solutions, Inc. (document management systems and services). Mr. Arthur E. Johnson and Mr. Edward C. Johnson 3d are not related. |
Alan J. Lacy (54) |
| Year of Election or Appointment: 2008 Member of the Advisory Board of Variable Insurance Products Fund IV. Mr. Lacy serves as Senior Adviser (2007-present) of Oak Hill Capital Partners, L.P. (a private equity firm). Mr. Lacy also served as Vice Chairman and Chief Executive Officer of Sears Holdings Corporation and Sears, Roebuck and Co. (retail, 2005-2006; 2000-2005). In addition, Mr. Lacy serves as a member of the Board of Directors of The Western Union Company (global money transfer, 2006-present) and Bristol-Myers Squibb (global pharmaceuticals, 2007-present). Mr. Lacy is a Trustee of the National Parks Conservation Association and The Field Museum of Natural History. |
Peter S. Lynch (63) |
| Year of Election or Appointment: 2003 Member of the Advisory Board of Variable Insurance Products Fund IV. Mr. Lynch is Vice Chairman and a Director of FMR, and Vice Chairman (2001-present) and a Director of FMR Co., Inc. Previously, Mr. Lynch served as a Trustee of the Fidelity funds (1990-2003). In addition, he serves as a Trustee of Boston College and as the Chairman of the Inner-City Scholarship Fund. |
Joseph Mauriello (63) |
| Year of Election or Appointment: 2007 Member of the Advisory Board of Variable Insurance Products Fund IV. Prior to his retirement in January 2006, Mr. Mauriello served in numerous senior management positions including Deputy Chairman and Chief Operating Officer (2004-2005), and Vice Chairman of Financial Services (2002-2004) of KPMG LLP US (professional services firm, 1965-2005). Mr. Mauriello currently serves as a member of the Board of Directors of XL Capital Ltd. (global insurance and re-insurance company, 2006-present) and of Arcadia Resources Inc. (health care services and products, 2007-present). He also served as a Director of the Hamilton Funds of the Bank of New York (2006-2007). |
David M. Thomas (58) |
| Year of Election or Appointment: 2007 Member of the Advisory Board of Variable Insurance Products Fund IV. Previously, Mr. Thomas served as Executive Chairman (2005-2006) and Chairman and Chief Executive Officer (2000-2005) of IMS Health, Inc. (pharmaceutical and healthcare information solutions). In addition, Mr. Thomas serves as a member of the Board of Directors of Fortune Brands, Inc. (consumer products holding company), and Interpublic Group of Companies, Inc. (marketing communication, 2004-present). |
Michael E. Wiley (57) |
| Year of Election or Appointment: 2007 Member of the Advisory Board of Variable Insurance Products Fund IV. Mr. Wiley also serves as a member of the Board of Trustees of the University of Tulsa (2000-2006; 2007-present). He serves as a Director of Tesoro Corporation (independent oil refiner and marketer, 2005-present), and a Director of Bill Barrett Corporation (exploration and production company, 2005-present). In addition, he also serves as a Director of Post Oak Bank (privately-held bank, 2004-present). Previously, Mr. Wiley served as a Sr. Energy Advisor of Katzenbach Partners, LLC (consulting firm, 2006-2007), as an Advisory Director of Riverstone Holdings (private investment firm), Chairman, President, and CEO of Baker Hughes, Inc. (oilfield services company, 2000-2004), and as Director of Spinnaker Exploration Company (exploration and production company, 2001-2005). |
Kimberley H. Monasterio (44) |
| Year of Election or Appointment: 2007 President and Treasurer of VIP Health Care. Ms. Monasterio also serves as President and Treasurer of other Fidelity funds (2007-present) and is an employee of FMR (2004-present). Previously, Ms. Monasterio served as Deputy Treasurer of the Fidelity funds (2004-2006). Before joining Fidelity Investments, Ms. Monasterio served as Treasurer (2000-2004) and Chief Financial Officer (2002-2004) of the Franklin Templeton Funds and Senior Vice President of Franklin Templeton Services, LLC (2000-2004). |
Brian B. Hogan (43) |
| Year of Election or Appointment: 2007 Vice President of VIP Health Care. Mr. Hogan also serves as Vice President of Sector Funds (2007-present). Mr. Hogan is Senior Vice President of Equity Research (2006-present). Mr. Hogan also serves as Vice President of FMR and FMR Co., Inc. Previously, Mr. Hogan served as a portfolio manager. |
Eric D. Roiter (59) |
| Year of Election or Appointment: 2001 Secretary of VIP Health Care. He also serves as Secretary of other Fidelity funds; Vice President, General Counsel, and Secretary of FMR Co., Inc. (2001-present) and FMR; Assistant Secretary of Fidelity Management & Research (U.K.) Inc. (2001-present), Fidelity Research & Analysis Company (2001-present), and Fidelity Investments Money Management, Inc. (2001-present). Mr. Roiter is an Adjunct Member, Faculty of Law, at Boston College Law School (2003-present). Previously, Mr. Roiter served as Vice President and Secretary of Fidelity Distributors Corporation (FDC) (1998-2005). |
John B. McGinty, Jr. (45) |
| Year of Election or Appointment: 2008 Assistant Secretary of VIP Health Care. Mr. McGinty also serves as Assistant Secretary of other Fidelity funds (2008-present) and is an employee of FMR LLC (2004-present). Mr. McGinty also serves as Senior Vice President, Secretary, and Chief Legal Officer of FDC (2007-present). Before joining Fidelity Investments, Mr. McGinty practiced law at Ropes & Gray, LLP. |
R. Stephen Ganis (41) |
| Year of Election or Appointment: 2006 Anti-Money Laundering (AML) officer of VIP Health Care. Mr. Ganis also serves as AML officer of other Fidelity funds (2006-present) and FMR LLC (2003-present). Before joining Fidelity Investments, Mr. Ganis practiced law at Goodwin Procter, LLP (2000-2002). |
Joseph B. Hollis (59) |
| Year of Election or Appointment: 2006 Chief Financial Officer of VIP Health Care. Mr. Hollis also serves as Chief Financial Officer of other Fidelity funds. Mr. Hollis is President of Fidelity Pricing and Cash Management Services (FPCMS) (2005-present). Mr. Hollis also serves as President and Director of Fidelity Service Company, Inc. (2006-present). Previously, Mr. Hollis served as Senior Vice President of Cash Management Services (1999-2002) and Investment Management Operations (2002-2005). |
Kenneth A. Rathgeber (60) |
| Year of Election or Appointment: 2004 Chief Compliance Officer of VIP Health Care. Mr. Rathgeber also serves as Chief Compliance Officer of other Fidelity funds (2004-present) and Executive Vice President of Risk Oversight for Fidelity Investments (2002-present). He is Chief Compliance Officer of FMR (2005-present), FMR Co., Inc. (2005-present), Fidelity Management & Research (U.K.) Inc. (2005-present), Fidelity Research & Analysis Company (2005-present), Fidelity Investments Money Management, Inc. (2005-present), and Strategic Advisers, Inc. (2005-present). Previously, Mr. Rathgeber served as Executive Vice President and Chief Operating Officer for Fidelity Investments Institutional Services Company, Inc. (1998-2002). |
Bryan A. Mehrmann (46) |
| Year of Election or Appointment: 2005 Deputy Treasurer of VIP Health Care. Mr. Mehrmann also serves as Deputy Treasurer of other Fidelity funds (2005-present) and is an employee of FMR. Previously, Mr. Mehrmann served as Vice President of Fidelity Investments Institutional Services Group (FIIS)/Fidelity Investments Institutional Operations Corporation, Inc. (FIIOC) Client Services (1998-2004). |
Kenneth B. Robins (38) |
| Year of Election or Appointment: 2005 Deputy Treasurer of VIP Health Care. Mr. Robins also serves as Deputy Treasurer of other Fidelity funds (2005-present) and is an employee of FMR (2004-present). Before joining Fidelity Investments, Mr. Robins worked at KPMG LLP, where he was a partner in KPMG's department of professional practice (2002-2004) and a Senior Manager (1999-2000). In addition, Mr. Robins served as Assistant Chief Accountant, United States Securities and Exchange Commission (2000-2002). |
Robert G. Byrnes (41) |
| Year of Election or Appointment: 2005 Assistant Treasurer of VIP Health Care. Mr. Byrnes also serves as Assistant Treasurer of other Fidelity funds (2005-present) and is an employee of FMR (2005-present). Previously, Mr. Byrnes served as Vice President of FPCMS (2003-2005). Before joining Fidelity Investments, Mr. Byrnes worked at Deutsche Asset Management where he served as Vice President of the Investment Operations Group (2000-2003). |
Peter L. Lydecker (53) |
| Year of Election or Appointment: 2004 Assistant Treasurer of VIP Health Care. Mr. Lydecker also serves as Assistant Treasurer of other Fidelity funds (2004) and is an employee of FMR. |
Paul M. Murphy (60) |
| Year of Election or Appointment: 2007 Assistant Treasurer of VIP Health Care. Mr. Murphy also serves as Assistant Treasurer of other Fidelity funds (2007-present) and is an employee of FMR (2007-present). Previously, Mr. Murphy served as Chief Financial Officer of the Fidelity Funds (2005-2006), Vice President and Associate General Counsel of FMR (2007), and Senior Vice President of Fidelity Pricing and Cash Management Services Group (FPCMS) (1994-2007). |
Gary W. Ryan (49) |
| Year of Election or Appointment: 2005 Assistant Treasurer of VIP Health Care. Mr. Ryan also serves as Assistant Treasurer of other Fidelity funds (2005-present) and is an employee of FMR (2005-present). Previously, Mr. Ryan served as Vice President of Fund Reporting in FPCMS (1999-2005). |
** FMR Corp. merged with and into FMR LLC on October 1, 2007. Any references to FMR LLC for prior periods are deemed to be references to the prior entity.
Annual Report
Distributions
The Board of Trustees of VIP IV Health Care Portfolio voted to pay to shareholders of record at the opening of business on record date, the following distributions per share derived from capital gains realized from sales of portfolio securities, and dividends derived from net investment income:
| Pay Date | Record Date | Dividends | Capital Gains |
Initial Class | 2/15/08 | 2/15/08 | $0.01 | $1.37 |
Investor Class | 2/15/08 | 2/15/08 | $0.01 | $1.37 |
The fund hereby designates as a capital gain dividend with respect to the taxable year ended December 31, 2007, $6,731,703, or, if subsequently determined to be different, the net capital gain of such year.
Initial Class designates 97% and 100%; and Investor Class designate 100% and 100% of the dividends distributed in February 2007 and December 2007 respectively, as qualifying for the dividends-received deduction for corporate shareholders.
The fund will notify shareholders in January 2008 of amounts for use in preparing 2007 income tax returns.
Annual Report
Board Approval of Investment Advisory Contracts and Management Fees
VIP Health Care Portfolio
Each year, typically in July, the Board of Trustees, including the Independent Trustees (together, the Board), votes on the renewal of the management contract and sub-advisory agreements (together, the Advisory Contracts) for the fund. The Board, assisted by the advice of fund counsel and Independent Trustees' counsel, requests and considers a broad range of information throughout the year.
The Board meets regularly each month except August and takes into account throughout the year matters bearing on Advisory Contracts. The Board, acting directly and through its separate committees, considers at each of its meetings factors that are relevant to the annual renewal of the fund's Advisory Contracts, including the services and support provided to the fund and its shareholders. At the time of the renewal, the Board had 12 standing committees, each composed of Independent Trustees with varying backgrounds, to which the Board has assigned specific subject matter responsibilities in order to enhance effective decision-making by the Board. Each committee has adopted a written charter outlining the structure and purposes of the committee. One such committee, the Equity Contract Committee, meets periodically as needed throughout the year to consider matters specifically related to the annual renewal of Advisory Contracts. The committee requests and receives information on, and makes recommendations to the Independent Trustees concerning, the approval and annual review of the Advisory Contracts.
At its July 2007 meeting, the Board of Trustees, including the Independent Trustees, unanimously determined to renew the Advisory Contracts for the fund. In reaching its determination, the Board considered all factors it believed relevant, including (i) the nature, extent, and quality of the services to be provided to the fund and its shareholders (including the investment performance of the fund); (ii) the competitiveness of the management fee and total expenses of the fund; (iii) the total costs of the services to be provided by and the profits to be realized by the investment adviser and its affiliates from the relationship with the fund; (iv) the extent to which economies of scale would be realized as the fund grows; and (v) whether fee levels reflect these economies of scale, if any, for the benefit of fund shareholders. The Board also approved amendments to the fund's agreements with foreign sub-advisers to clarify that each sub-adviser provides services as an independent contractor.
In determining whether to renew the Advisory Contracts for the fund, the Board ultimately reached a determination, with the assistance of fund counsel and Independent Trustees' counsel, that the renewal of the Advisory Contracts and the compensation to be received by Fidelity under the management contract is consistent with Fidelity's fiduciary duty under applicable law. In addition to evaluating the specific factors noted above, the Board, in reaching its determination, is aware that shareholders in the fund have a broad range of investment choices available to them, including a wide choice among mutual funds offered by competitors to Fidelity, and that the fund's shareholders, with the opportunity to review and weigh the disclosure provided by the fund in its prospectus and other public disclosures, have chosen to invest in this fund, managed by Fidelity.
Nature, Extent, and Quality of Services Provided. The Board considered staffing within the investment adviser, FMR, and the sub-advisers (together, the Investment Advisers), including the background of the fund's portfolio manager and the fund's investment objective and discipline. The Independent Trustees also had discussions with senior management of Fidelity's investment operations and investment groups. The Board considered the structure of the portfolio manager compensation program and whether this structure provides appropriate incentives.
Resources Dedicated to Investment Management and Support Services. The Board reviewed the size, education, and experience of the Investment Advisers' investment staff, their use of technology, and the Investment Advisers' approach to recruiting, training, and retaining portfolio managers and other research, advisory, and management personnel. The Board considered Fidelity's extensive global research capabilities that enable the Investment Advisers to aggregate data from various sources in an effort to produce positive investment results. The Board noted that Fidelity's analysts have access to a variety of technological tools that enable them to perform both fundamental and quantitative analysis and to specialize in various disciplines. The Board also considered that Fidelity's portfolio managers and analysts have access to daily portfolio attribution that allows for monitoring of a fund's portfolio, as well as an electronic communication system that provides immediate real-time access to research concerning issuers and credit enhancers.
Shareholder and Administrative Services. The Board considered (i) the nature, extent, quality, and cost of advisory, administrative, distribution, and shareholder services performed by the Investment Advisers and their affiliates under the Advisory Contracts and under separate agreements covering transfer agency, pricing and bookkeeping, and securities lending services for the fund; (ii) the nature and extent of the Investment Advisers' supervision of third party service providers, principally custodians and subcustodians; and (iii) the resources devoted to, and the record of compliance with, the fund's compliance policies and procedures. The Board reviewed the allocation of fund brokerage, including allocations to brokers affiliated with the Investment Advisers, the use of brokerage commissions to pay fund expenses, and the use of "soft" commission dollars to pay for research services. The Board also considered that Fidelity voluntarily pays for market data out of its own resources. The Board also considered the agreement reached between the Independent Trustees and Fidelity in December 2006 following an independent review of matters relating to receipt of travel, entertainment, gifts and gratuities in violation of Fidelity policies.
The Board noted that the growth of fund assets across the complex allows Fidelity to reinvest in the development of services designed to enhance the value or convenience of the Fidelity funds as investment vehicles. These services include 24-hour access to account information and market information through phone representatives and over the Internet, and investor education materials and asset allocation tools.
Annual Report
Investment in a Large Fund Family. The Board considered the benefits to shareholders of investing in a Fidelity fund, including the benefits of investing in a fund that is part of a large family of funds offering a variety of investment disciplines and providing for a large variety of mutual fund investor services. The Board noted that, since the last Advisory Contract renewals in July 2006, Fidelity has taken a number of actions that benefited particular funds, including (i) dedicating additional resources to investment research and to restructure the investment research teams; (ii) contractually agreeing to reduce the management fee on Fidelity Advisor Floating Rate High Income Fund; (iii) contractually agreeing to reduce the management fees on Fidelity's California, Massachusetts, New Jersey, and New York AMT Tax-Free Money Market Funds, launching new Institutional Classes and Service Classes of these funds, and contractually agreeing to impose expense limitations on these funds; (iv) eliminating the exchange fee on the Fidelity Select Portfolios and reducing the pricing and bookkeeping fee rates for these funds; (v) reducing the maximum transfer agency fee rates on high income funds and certain equity funds; (vi) proposing amended management contracts that, if approved by shareholders, will add a performance adjustment component to the management fees paid by 18 Fidelity Advisor equity funds; (vii) contractually agreeing to reduce fees for Ultra-Short Central Fund and the money market Central Funds; (viii) waiving the Fidelity Advisor funds' contingent deferred sales charge on certain redemptions made through systematic withdrawal programs; and (ix) amending the management contracts for equity and fixed-income funds whose management contracts incorporate a "group fee" structure by adding four new fee "breakpoints" to the group fee rate schedules.
Investment Performance and Compliance. The Board considered whether the fund has operated within its investment objective, as well as its record of compliance with its investment restrictions. It also reviewed the fund's absolute investment performance for each class, as well as the fund's relative investment performance for each class measured against a third-party-sponsored index that reflects the market sector in which the fund invests over multiple periods. The Board noted that FMR does not believe that a meaningful peer group exists against which to compare the fund's performance. The Board also noted that in 2006 FMR implemented changes to the sector fund product line, which included a change to the fund's index. The following charts considered by the Board show, over the one-, three-, and five-year periods ended December 31, 2006, as available, the cumulative total returns of Initial Class and Investor Class of the fund and the cumulative total returns of a third-party-sponsored index ("benchmark").
VIP Health Care Portfolio

The Board stated that the relative investment performance of Initial Class of the fund compared favorably to its benchmark for all the periods shown. The Board considered that the variations in performance between the fund's classes reflect the variations in class expenses, which result in lower performance for the higher expense class.
The Board considered that FMR has taken steps to refocus and strengthen equity research, equity portfolio management, and compliance.
Based on its review, and giving particular weight to the nature and quality of the resources dedicated by the Investment Advisers to maintain and improve relative performance, the Board concluded that the nature, extent, and quality of the services provided to the fund will benefit the fund's shareholders, particularly in light of the Board's view that the fund's shareholders benefit from investing in a fund that is part of a large family of funds offering a variety of investment disciplines and services.
Competitiveness of Management Fee and Total Fund Expenses. The Board considered the fund's management fee and total expenses compared to "mapped groups" of competitive funds and classes. Fidelity creates "mapped groups" by combining similar Lipper investment objective categories that have comparable management fee characteristics. Combining Lipper investment objective categories aids the Board's management fee and total expense comparisons by broadening the competitive group used for comparison and by reducing the number of universes to which various Fidelity funds are compared. The Board also considered supplemental information about how the fund's management fee and total expenses ranked relative to groups based on Lipper classifications, which take into account a fund's market capitalization and style.
Annual Report
Board Approval of Investment Advisory Contracts and Management Fees - continued
The Board considered two proprietary management fee comparisons for the 12-month periods shown in the chart below. The group of Lipper funds used by the Board for management fee comparisons is referred to below as the "Total Mapped Group." The Total Mapped Group comparison focuses on a fund's standing relative to the total universe of comparable funds available to investors, in terms of gross management fees before expense reimbursements or caps. "TMG %" represents the percentage of funds in the Total Mapped Group that had management fees that were lower than the fund's. For example, a TMG % of 9% means that 91% of the funds in the Total Mapped Group had higher management fees than the fund. The "Asset-Size Peer Group" (ASPG) comparison focuses on a fund's standing relative to non-Fidelity funds similar in size to the fund within the Total Mapped Group. The ASPG represents at least 15% of the funds in the Total Mapped Group with comparable asset size and management fee characteristics, subject to a minimum of 50 funds (or all funds in the Total Mapped Group if fewer than 50). Additional information, such as the ASPG quartile in which the fund's management fee ranked, is also included in the chart and considered by the Board.
VIP Health Care Portfolio
The Board noted that the fund's management fee ranked below the median of its Total Mapped Group and below the median of its ASPG for 2006.
Based on its review, the Board concluded that the fund's management fee was fair and reasonable in light of the services that the fund receives and the other factors considered.
In its review of each class's total expenses, the Board considered the fund's management fee as well as other fund or class expenses, as applicable, such as transfer agent fees, pricing and bookkeeping fees, and custodial, legal, and audit fees. The Board also noted the effects of any waivers and reimbursements on fees and expenses. As part of its review, the Board also considered current and historical total expenses of each class of the fund compared to competitive fund median expenses. Each class of the fund is compared to those funds and classes in the Total Mapped Group (used by the Board for management fee comparisons) that have a similar sales load structure.
The Board noted that the total expenses of each class ranked below its competitive median for 2006.
In its review of total expenses, the Board also considered Fidelity fee structures and other information on clients that FMR and its affiliates service in other competitive markets, such as other mutual funds advised or subadvised by FMR or its affiliates, pension plan clients, and other institutional clients.
Based on its review, the Board concluded that the total expenses of each class of the fund were reasonable in light of the services that the fund and its shareholders receive and the other factors considered.
Costs of the Services and Profitability. The Board considered the revenues earned and the expenses incurred by Fidelity in conducting the business of developing, marketing, distributing, managing, administering and servicing the fund and its shareholders. The Board also considered the level of Fidelity's profits in respect of all the Fidelity funds.
Annual Report
On an annual basis, FMR presents to the Board Fidelity's profitability for the fund. Fidelity calculates the profitability for each fund, as well as aggregate profitability for groups of Fidelity funds and all Fidelity funds, using a series of detailed revenue and cost allocation methodologies which originate with the audited books and records of Fidelity. The Audit Committee of the Board reviews any significant changes from the prior year's methodologies.
PricewaterhouseCoopers LLP (PwC), independent registered public accounting firm and auditor to Fidelity and certain Fidelity funds, has been engaged annually by the Board as part of the Board's assessment of the results of Fidelity's profitability analysis. PwC's engagement includes the review and assessment of Fidelity's methodologies used in determining the revenues and expenses attributable to Fidelity's mutual fund business, and completion of agreed-upon procedures surrounding the mathematical accuracy of fund profitability and its conformity to allocation methodologies. After considering PwC's reports issued under the engagement and information provided by Fidelity, the Board believes that while other allocation methods may also be reasonable, Fidelity's profitability methodologies are reasonable in all material respects.
The Board has also reviewed Fidelity's non-fund businesses and any fall-out benefits related to the mutual fund business as well as cases where Fidelity's affiliates may benefit from or be related to the fund's business.
The Board considered the costs of the services provided by and the profits realized by Fidelity in connection with the operation of the fund and determined that the amount of profit is a fair entrepreneurial profit for the management of the fund.
Economies of Scale. The Board considered whether there have been economies of scale in respect of the management of the Fidelity funds, whether the Fidelity funds (including the fund) have appropriately benefited from any such economies of scale, and whether there is potential for realization of any further economies of scale. The Board considered the extent to which the fund will benefit from economies of scale through increased services to the fund, through waivers or reimbursements, or through fee or expense reductions.
The Board recognized that the fund's management contract incorporates a "group fee" structure, which provides for lower group fee rates as total fund assets under FMR's management increase, and for higher group fee rates as total fund assets under FMR's management decrease. FMR determines the group fee rates based on a tiered asset "breakpoint" schedule. In connection with the renewal of the fund's management contract, the Board approved amendments to the fund's management contract that added four new fee breakpoints to the group fee rate schedule for assets under FMR's management above $1,386 billion. The Board considered that the group fee rate declines under both the present and amended schedules, but that under the amended schedule, the group fee rate declines faster as assets under FMR's management exceed $1,386 billion. The Board considered that the group fee is designed to deliver the benefits of economies of scale to fund shareholders when total fund assets increase, even if assets of any particular fund are unchanged or have declined, because some portion of Fidelity's costs are attributable to services provided to all Fidelity funds, and all funds benefit if those costs can be allocated among more assets. The Board concluded that, given the group fee structure, fund shareholders will achieve a certain level of economies of scale as assets under FMR's management increase at the fund complex level, regardless of whether Fidelity achieves any such economies of scale.
The Board further concluded that any potential economies of scale are being shared between fund shareholders and Fidelity in an appropriate manner.
Additional Information Requested by the Board. In order to develop fully the factual basis for consideration of the Fidelity funds' Advisory Contracts, the Board requested and received additional information on several topics, including (i) fund performance trends and actions to be taken by FMR to improve certain funds' overall performance; (ii) Fidelity's portfolio manager compensation structure, including its effects on fund profitability and the extent to which portfolio manager compensation is linked to fund performance; (iii) Fidelity's fee structures; (iv) the funds' sub-advisory arrangements; and (v) accounts managed by Fidelity other than the Fidelity funds.
Based on its evaluation of all of the conclusions noted above, and after considering all material factors, the Board ultimately concluded that the advisory fee structures are fair and reasonable, and that the fund's Advisory Contracts should be renewed.
Annual Report
Annual Report
Annual Report
Investment Adviser
Fidelity Management & Research Company
Boston, MA
Investment Sub-Advisers
FMR Co., Inc.
Fidelity Management & Research (U.K.) Inc.
Fidelity Research & Analysis Company
Fidelity Investments Japan Limited
Fidelity International Investment Advisors
Fidelity International Investment Advisors
(U.K.) Limited
General Distributor
Fidelity Distributors Corporation
Boston, MA
Transfer and Service Agents
Fidelity Investments Institutional Operations Company, Inc.
Boston, MA
Fidelity Service Company, Inc.
Boston, MA
Custodian
JPMorgan Chase Bank
New York, NY
VHCIC-ANN-0208
1.817373.102
Fidelity® Variable Insurance Products:
Industrials Portfolio
Annual Report
December 31, 2007
(2_fidelity_logos) (Registered_Trademark)
Contents
Performance | <Click Here> | How the fund has done over time. |
Management's Discussion | <Click Here> | The manager's review of fund performance, strategy and outlook. |
Shareholder Expense Example | <Click Here> | An example of shareholder expenses. |
Investment Changes | <Click Here> | A summary of major shifts in the fund's investments over the past six months. |
Investments | <Click Here> | A complete list of the fund's investments with their
market values. |
Financial Statements | <Click Here> | Statements of assets and liabilities, operations, and
changes in net assets, as well as financial highlights. |
Notes | <Click Here> | Notes to the financial statements. |
Report of Independent Registered Public Accounting Firm | <Click Here> | |
Trustees and Officers | <Click Here> | |
Distributions | <Click Here> | |
Board Approval of Investment Advisory Contracts and Management Fees | <Click Here> | |
| | |
To view a fund's proxy voting guidelines and proxy voting record for the 12-month period ended June 30, visit http://www.fidelity.com (search for "proxy voting guidelines") or visit the Securities and Exchange Commission's (SEC) web site at http://www.sec.gov. You may also call 1-877-208-0098 to request a free copy of the proxy voting guidelines.
Fidelity Variable Insurance Products are separate account options which are purchased through a variable insurance contract.
Standard & Poor's, S&P and S&P 500 are registered service marks of The McGraw-Hill Companies, Inc. and have been licensed for use by Fidelity Distributors Corporation.
Other third party marks appearing herein are the property of their respective owners.
All other marks appearing herein are registered or unregistered trademarks or service marks of FMR LLC or an affiliated company.
This report and the financial statements contained herein are submitted for the general information of the shareholders of the fund. This report is not authorized for distribution to prospective investors in the fund unless preceded or accompanied by an effective prospectus.
A fund files its complete schedule of portfolio holdings with the SEC for the first and third quarters of each fiscal year on Form N-Q. Forms N-Q are available on the SEC's web site at http://www.sec.gov. A fund's Forms N-Q may be reviewed and copied at the SEC's Public Reference Room in Washington, DC. Information regarding the operation of the SEC's Public Reference Room may be obtained by calling 1-800-SEC-0330. For a complete list of the fund's portfolio holdings, view the most recent holdings listing, semiannual report, or annual report on Fidelity's web site at http://www.fidelity.com or http://www.advisor.fidelity.com, as applicable.
NOT FDIC INSURED · MAY LOSE VALUE · NO BANK GUARANTEE
Neither the fund nor Fidelity Distributors Corporation is a bank.
Annual Report
Performance: The Bottom Line
Average annual total return reflects the change in the value of an investment, assuming reinvestment of the class' dividend income and capital gains (the profits earned upon the sale of securities that have grown in value, if any) and assuming a constant rate of performance each year. During periods of reimbursement by Fidelity, a fund's total return will be greater than it would be had the reimbursement not occurred. Performance numbers are net of all underlying fund operating expenses, but do not include any insurance charges imposed by your insurance company's separate account. If performance information included the effect of these additional charges, the total returns would have been lower. How a fund did yesterday is no guarantee of how it will do tomorrow.
Average Annual Total Returns
Periods ended December 31, 2007 | Past 1
year | Past 5
years | Life of fund A |
VIP Industrials - Initial Class C | 18.21% | 21.53% | 12.54% |
VIP Industrials - Investor Class B,C | 18.12% | 21.45% | 12.48% |
A From July 18, 2001.
B The initial offering of Investor Class shares took place on July 21, 2005. Returns prior to July 21, 2005, are those of Initial Class. If Investor Class's transfer agent fee had been reflected, returns prior to July 21, 2005 would have been lower.
C Prior to October 1, 2006, VIP Industrials operated under certain different investment policies. The historical performance for the fund may not represent its current investment policies.
$10,000 Over Life of Fund
Let's say hypothetically that $10,000 was invested in VIP Industrials Portfolio - Initial Class on July 18, 2001, when the fund started. The chart shows how the value of your investment would have changed, and also shows how the Standard & Poor's 500SM Index (S&P 500®) performed over the same period.
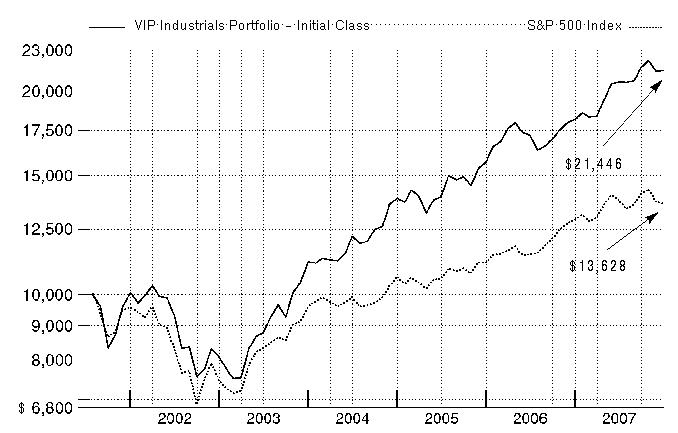
Annual Report
Management's Discussion of Fund Performance
Comments from Tobias Welo, Portfolio Manager of VIP Industrials Portfolio
U.S. equity markets, as measured by the bellwether Dow Jones Industrial AverageSM and the Standard & Poor's 500SM Index, registered their fifth consecutive year of positive returns in 2007, as the Dow rose 8.88% and the S&P 500® index advanced 5.49%. The tech-heavy NASDAQ Composite® Index did even better, increasing 10.55%. However, credit- and recession-related concerns carved deeply into stock prices late in 2007, pushing some major market measures into negative territory for the year overall, particularly smaller-cap and value-oriented benchmarks. Based largely on a weak U.S. dollar that boosted returns for U.S. investors, the Morgan Stanley Capital InternationalSM Europe, Australasia, and Far East (MSCI® EAFE®) Index - a gauge of developed stock markets outside the United States and Canada - beat most domestic equity measures, gaining 11.33%. Several European countries had outstanding performance, including Finland and Germany, while Australia also did very well. However, fallout from the credit crunch and concerns about export growth tempered U.K. stocks, while fears that Japanese financial companies would become embroiled in the U.S. subprime mortgage crisis contributed to a loss of more than 4% for the Japanese portion of the index. The emerging-markets stock asset class soared 39.78% according to the MSCI Emerging Markets index. The U.S. investment-grade bond market climbed 6.97% as measured by the Lehman Brothers® U.S. Aggregate Index, beating the 2.53% gain for the Merrill Lynch® U.S. High Yield Master II Constrained Index. The emerging-markets bond category shook off a sluggish first half of 2007 to finish the year with a respectable gain of 6.28% as measured by the J.P. Morgan Emerging Markets Bond Index (EMBI) Global, while the Citigroup® Non-U.S. Group of 7 Index - representing the debt performance of major global economies, excluding the United States - rose 13.05%.
During the past year, the fund handily outperformed the 13.40% return of the Morgan Stanley Capital InternationalSM (MSCI®) US Investable Market Industrials Index and more than tripled the S&P 500's gain. (For specific portfolio performance results, please refer to the performance section of this report.) Overweighted exposures and timely stock selection in construction and engineering and in heavy electrical equipment did a lot to boost our return relative to the MSCI index. Favorable stock selection in aerospace and defense and in industrial machinery proved beneficial as well. Two construction and engineering names - Shaw Group and Dutch holding Chicago Bridge & Iron - benefited from the build-out of energy infrastructure amid record highs in crude oil prices. Shaw Group was positioned to benefit from stronger demand for nuclear energy as well. In aerospace and defense, overweighting Honeywell International and not owning MSCI index component Boeing were the right calls. Switzerland-based ABB, a provider of power transmission and distribution equipment, further helped our results versus the index. Chicago Bridge & Iron and ABB were out-of-benchmark positions. Conversely, stock selection hurt in environmental and facility services and in airlines, while underweighting construction and farm machinery/heavy trucks also was detrimental. US Airways Group was the fund's largest detractor. Crude oil prices near $100 per barrel trumped a number of positive factors and dealt the stock a significant setback. Underweighting agricultural equipment maker and MSCI index component Deere & Co. - which I sold by period end - hurt performance. Waste management stock Allied Waste Industries and Masco, a well-managed building products supplier, were other notable detractors.
The views expressed above reflect those of the portfolio manager(s) only through the end of the period as stated on the cover of this report and do not necessarily represent the views of Fidelity or any other person in the Fidelity organization. Any such views are subject to change at any time based upon market or other conditions and Fidelity disclaims any responsibility to update such views. These views may not be relied on as investment advice and, because investment decisions for a Fidelity fund are based on numerous factors, may not be relied on as an indication of trading intent on behalf of any Fidelity fund.
Annual Report
Shareholder Expense Example
As a shareholder of the Fund, you incur two types of costs: (1) transaction costs, including redemption fees, and (2) ongoing costs, including management fees and other Fund expenses. This Example is intended to help you understand your ongoing costs (in dollars) of investing in the Fund and to compare these costs with the ongoing costs of investing in other mutual funds.
The Example is based on an investment of $1,000 invested at the beginning of the period and held for the entire period (July 1, 2007 to December 31, 2007).
Actual Expenses
The first line of the accompanying table for each class of the Fund provides information about actual account values and actual expenses. You may use the information in this line, together with the amount you invested, to estimate the expenses that you paid over the period. Simply divide your account value by $1,000.00 (for example, an $8,600 account value divided by $1,000.00 = 8.6), then multiply the result by the number in the first line for a class of the Fund under the heading entitled "Expenses Paid During Period" to estimate the expenses you paid on your account during this period. The estimate of expenses does not include any fees or other expenses of any variable annuity or variable life insurance product. If they were, the estimate of expenses you paid during the period would be higher, and your ending account value would be lower. In addition, the Fund, as a shareholder in the underlying Fidelity Central Funds, will indirectly bear its pro rata share of the fees and expenses incurred by the underlying Fidelity Central Funds. These fees and expenses are not included in the Fund's annualized expense ratio used to calculate the expense estimate in the table below.
Hypothetical Example for Comparison Purposes
The second line of the accompanying table for each class of the Fund provides information about hypothetical account values and hypothetical expenses based on a Class' actual expense ratio and an assumed rate of return of 5% per year before expenses, which is not the Class' actual return. The hypothetical account values and expenses may not be used to estimate the actual ending account balance or expenses you paid for the period. You may use this information to compare the ongoing costs of investing in the Fund and other funds. To do so, compare this 5% hypothetical example with the 5% hypothetical examples that appear in the shareholder reports of the other funds. The estimate of expenses does not include any fees or other expenses of any variable annuity or variable life insurance product. If they were, the estimate of expenses you paid during the period would be higher, and your ending account value would be lower. In addition, the Fund, as a shareholder in the underlying Fidelity Central Funds, will indirectly bear its pro rata share of the fees and expenses incurred by the underlying Fidelity Central Funds. These fees and expenses are not included in the Fund's annualized expense ratio used to calculate the expense estimate in the table below.
Please note that the expenses shown in the table are meant to highlight your ongoing costs only and do not reflect any transaction costs. Therefore, the second line of the table is useful in comparing ongoing costs only, and will not help you determine the relative total costs of owning different funds. In addition, if these transactional costs were included, your costs would have been higher.
| Beginning
Account Value
July 1, 2007 | Ending
Account Value
December 31, 2007 | Expenses Paid
During Period*
July 1, 2007 to
December 31, 2007 |
Initial Class | | | |
Actual | $ 1,000.00 | $ 1,039.70 | $ 3.96 |
HypotheticalA | $ 1,000.00 | $ 1,021.32 | $ 3.92 |
Investor Class | | | |
Actual | $ 1,000.00 | $ 1,039.10 | $ 4.63 |
HypotheticalA | $ 1,000.00 | $ 1,020.67 | $ 4.58 |
A 5% return per year before expenses
* Expenses are equal to each Class' annualized expense ratio (shown in the table below); multiplied by the average account value over the period, multiplied by 184/365 (to reflect the one-half year period).
| Annualized
Expense Ratio |
Initial Class | .77% |
Investor Class | .90% |
Annual Report
Investment Changes
Top Ten Stocks as of December 31, 2007 |
| % of fund's
net assets | % of fund's net assets
6 months ago |
General Electric Co. | 9.0 | 9.2 |
United Technologies Corp. | 5.6 | 7.8 |
Honeywell International, Inc. | 4.9 | 4.2 |
Lockheed Martin Corp. | 3.1 | 0.0 |
Danaher Corp. | 2.8 | 3.0 |
Siemens AG sponsored ADR | 2.2 | 1.1 |
The Brink's Co. | 1.9 | 1.6 |
Raytheon Co. | 1.9 | 2.2 |
Emerson Electric Co. | 1.9 | 3.0 |
Cummins, Inc. | 1.8 | 1.8 |
| 35.1 | |
Top Industries (% of fund's net assets) |
As of December 31, 2007 |
| Machinery | 22.2% | |
| Aerospace & Defense | 17.5% | |
| Industrial Conglomerates | 13.0% | |
| Electrical Equipment | 10.1% | |
| Commercial Services & Supplies | 9.7% | |
| All Others* | 27.5% | |

|
As of June 30, 2007 |
| Industrial Conglomerates | 19.9% | |
| Aerospace & Defense | 16.7% | |
| Machinery | 15.7% | |
| Road & Rail | 8.6% | |
| Electrical Equipment | 7.5% | |
| All Others* | 31.6% | |

* Includes short-term investments and net other assets. |
Annual Report
Investments December 31, 2007
Showing Percentage of Net Assets
Common Stocks - 98.0% |
| Shares | | Value |
AEROSPACE & DEFENSE - 17.5% |
Aerospace & Defense - 17.5% |
General Dynamics Corp. | 13,800 | | $ 1,228,062 |
Honeywell International, Inc. | 60,800 | | 3,743,456 |
Lockheed Martin Corp. | 22,200 | | 2,336,772 |
Raytheon Co. | 23,800 | | 1,444,660 |
Spirit AeroSystems Holdings, Inc. Class A | 9,300 | | 320,850 |
United Technologies Corp. | 56,299 | | 4,309,125 |
| | 13,382,925 |
AIR FREIGHT & LOGISTICS - 2.5% |
Air Freight & Logistics - 2.5% |
C.H. Robinson Worldwide, Inc. | 10,300 | | 557,436 |
FedEx Corp. | 14,800 | | 1,319,716 |
| | 1,877,152 |
AIRLINES - 1.8% |
Airlines - 1.8% |
Delta Air Lines, Inc. (a) | 30,895 | | 460,027 |
UAL Corp. | 13,100 | | 467,146 |
US Airways Group, Inc. (a) | 30,400 | | 447,184 |
| | 1,374,357 |
AUTO COMPONENTS - 2.4% |
Auto Parts & Equipment - 2.4% |
Johnson Controls, Inc. | 36,400 | | 1,311,856 |
WABCO Holdings, Inc. | 10,841 | | 543,026 |
| | 1,854,882 |
AUTOMOBILES - 1.7% |
Automobile Manufacturers - 1.7% |
DaimlerChrysler AG | 5,500 | | 525,965 |
Fiat SpA | 29,100 | | 751,481 |
| | 1,277,446 |
BUILDING PRODUCTS - 2.1% |
Building Products - 2.1% |
Lennox International, Inc. | 16,000 | | 662,720 |
Masco Corp. | 45,020 | | 972,882 |
| | 1,635,602 |
CHEMICALS - 2.8% |
Commodity Chemicals - 0.2% |
Calgon Carbon Corp. (a) | 8,470 | | 134,588 |
Industrial Gases - 0.8% |
Airgas, Inc. | 11,283 | | 587,957 |
Specialty Chemicals - 1.8% |
Albemarle Corp. | 15,950 | | 657,938 |
Nalco Holding Co. | 30,400 | | 735,072 |
| | 1,393,010 |
TOTAL CHEMICALS | | 2,115,555 |
|
| Shares | | Value |
COMMERCIAL SERVICES & SUPPLIES - 9.7% |
Commercial Printing - 0.7% |
R.R. Donnelley & Sons Co. | 14,800 | | $ 558,552 |
Diversified Commercial & Professional Services - 3.3% |
Corrections Corp. of America (a) | 16,400 | | 483,964 |
Equifax, Inc. | 15,800 | | 574,488 |
The Brink's Co. | 24,435 | | 1,459,747 |
| | 2,518,199 |
Environmental & Facility Services - 4.9% |
Allied Waste Industries, Inc. (a) | 114,100 | | 1,257,382 |
Fuel Tech, Inc. (a)(d) | 29,328 | | 664,279 |
Waste Connections, Inc. (a) | 19,900 | | 614,910 |
Waste Management, Inc. | 37,300 | | 1,218,591 |
| | 3,755,162 |
Human Resource & Employment Services - 0.8% |
Manpower, Inc. | 10,600 | | 603,140 |
TOTAL COMMERCIAL SERVICES & SUPPLIES | | 7,435,053 |
CONSTRUCTION & ENGINEERING - 4.4% |
Construction & Engineering - 4.4% |
Chicago Bridge & Iron Co. NV (NY Shares) | 15,300 | | 924,732 |
Fluor Corp. | 3,400 | | 495,448 |
Jacobs Engineering Group, Inc. (a) | 4,000 | | 382,440 |
Quanta Services, Inc. (a) | 20,078 | | 526,847 |
Shaw Group, Inc. (a) | 17,600 | | 1,063,744 |
| | 3,393,211 |
ELECTRICAL EQUIPMENT - 10.1% |
Electrical Components & Equipment - 7.1% |
Acuity Brands, Inc. | 6,300 | | 283,500 |
AMETEK, Inc. | 8,150 | | 381,746 |
Cooper Industries Ltd. Class A | 21,400 | | 1,131,632 |
Emerson Electric Co. | 25,200 | | 1,427,832 |
First Solar, Inc. (a) | 2,300 | | 614,422 |
General Cable Corp. (a)(d) | 3,400 | | 249,152 |
Nexans SA | 5,600 | | 698,761 |
SolarWorld AG | 4,000 | | 243,720 |
Sunpower Corp. Class A (a)(d) | 3,000 | | 391,170 |
| | 5,421,935 |
Heavy Electrical Equipment - 3.0% |
ABB Ltd. sponsored ADR | 26,300 | | 757,440 |
Alstom SA | 2,800 | | 600,689 |
Vestas Wind Systems AS (a) | 9,200 | | 993,923 |
| | 2,352,052 |
TOTAL ELECTRICAL EQUIPMENT | | 7,773,987 |
ELECTRONIC EQUIPMENT & INSTRUMENTS - 0.8% |
Electronic Equipment & Instruments - 0.8% |
Itron, Inc. (a) | 6,300 | | 604,611 |
Common Stocks - continued |
| Shares | | Value |
ENERGY EQUIPMENT & SERVICES - 0.2% |
Oil & Gas Equipment & Services - 0.2% |
FMC Technologies, Inc. (a) | 3,200 | | $ 181,440 |
INDEPENDENT POWER PRODUCERS & ENERGY TRADERS - 0.4% |
Independent Power Producers & Energy Traders - 0.4% |
NRG Energy, Inc. (a) | 6,600 | | 286,044 |
INDUSTRIAL CONGLOMERATES - 13.0% |
Industrial Conglomerates - 13.0% |
General Electric Co. | 185,519 | | 6,877,189 |
Orkla ASA (A Shares) | 10,600 | | 205,290 |
Siemens AG sponsored ADR | 10,800 | | 1,699,488 |
Tyco International Ltd. | 29,381 | | 1,164,957 |
| | 9,946,924 |
MACHINERY - 22.2% |
Construction & Farm Machinery & Heavy Trucks - 7.7% |
Bucyrus International, Inc. Class A | 9,560 | | 950,168 |
Cummins, Inc. | 11,200 | | 1,426,544 |
Navistar International Corp. (a) | 10,800 | | 585,360 |
Oshkosh Truck Co. | 19,000 | | 897,940 |
PACCAR, Inc. | 17,882 | | 974,211 |
Terex Corp. (a) | 16,100 | | 1,055,677 |
| | 5,889,900 |
Industrial Machinery - 14.5% |
Danaher Corp. | 24,200 | | 2,123,308 |
Eaton Corp. | 13,618 | | 1,320,265 |
Flowserve Corp. | 10,600 | | 1,019,720 |
Illinois Tool Works, Inc. | 26,300 | | 1,408,102 |
Ingersoll-Rand Co. Ltd. Class A | 29,000 | | 1,347,630 |
ITT Corp. | 14,600 | | 964,184 |
Pall Corp. | 13,300 | | 536,256 |
SPX Corp. (d) | 10,602 | | 1,090,416 |
Sulzer AG (Reg.) | 892 | | 1,310,491 |
| | 11,120,372 |
TOTAL MACHINERY | | 17,010,272 |
METALS & MINING - 0.7% |
Diversified Metals & Mining - 0.7% |
Titanium Metals Corp. (d) | 19,670 | | 520,272 |
ROAD & RAIL - 5.1% |
Railroads - 1.0% |
Union Pacific Corp. | 6,200 | | 778,844 |
Trucking - 4.1% |
Hertz Global Holdings, Inc. | 37,500 | | 595,875 |
|
| Shares | | Value |
Knight Transportation, Inc. | 21,300 | | $ 315,453 |
Landstar System, Inc. | 17,356 | | 731,555 |
Old Dominion Freight Lines, Inc. (a) | 21,466 | | 496,079 |
Ryder System, Inc. | 21,700 | | 1,020,117 |
| | 3,159,079 |
TOTAL ROAD & RAIL | | 3,937,923 |
TRADING COMPANIES & DISTRIBUTORS - 0.6% |
Trading Companies & Distributors - 0.6% |
Rush Enterprises, Inc. Class A (a) | 27,148 | | 493,551 |
TOTAL COMMON STOCKS (Cost $67,600,082) | 75,101,207 |
Nonconvertible Bonds - 0.0% |
| Principal Amount | | |
AIRLINES - 0.0% |
Airlines - 0.0% |
Delta Air Lines, Inc. 8.3% 12/15/29 (a)
(Cost $15,608) | | $ 540,000 | | 24,300 |
Money Market Funds - 4.8% |
| Shares | | |
Fidelity Cash Central Fund, 4.58% (b) | 1,128,814 | | 1,128,814 |
Fidelity Securities Lending Cash Central Fund, 4.65% (b)(c) | 2,562,965 | | 2,562,965 |
TOTAL MONEY MARKET FUNDS (Cost $3,691,779) | 3,691,779 |
TOTAL INVESTMENT PORTFOLIO - 102.8% (Cost $71,307,469) | | 78,817,286 |
NET OTHER ASSETS - (2.8)% | | (2,167,970) |
NET ASSETS - 100% | $ 76,649,316 |
Legend |
(a) Non-income producing |
(b) Affiliated fund that is available only to investment companies and other accounts managed by Fidelity Investments. The rate quoted is the annualized seven-day yield of the fund at period end. A complete unaudited listing of the fund's holdings as of its most recent quarter end is available upon request. |
(c) Investment made with cash collateral received from securities on loan. |
(d) Security or a portion of the security is on loan at period end. |
Affiliated Central Funds |
Information regarding fiscal year to date income earned by the Fund from investments in Fidelity Central Funds is as follows: |
Fund | Income earned |
Fidelity Cash Central Fund | $ 40,347 |
Fidelity Securities Lending Cash Central Fund | 15,783 |
Total | $ 56,130 |
Other Information |
Distribution of investments by country of issue, as a percentage of total net assets, is as follows: |
United States of America | 83.9% |
Bermuda | 4.8% |
Germany | 3.2% |
Switzerland | 2.7% |
France | 1.6% |
Denmark | 1.3% |
Netherlands | 1.2% |
Italy | 1.0% |
Others (individually less than 1%) | 0.3% |
| 100.0% |
See accompanying notes which are an integral part of the financial statements.
Annual Report
Financial Statements
Statement of Assets and Liabilities
| December 31, 2007 |
Assets | | |
Investment in securities, at value (including securities loaned of $2,492,879) - See accompanying schedule: Unaffiliated issuers (cost $67,615,690) | $ 75,125,507 | |
Fidelity Central Funds (cost $3,691,779) | 3,691,779 | |
Total Investments (cost $71,307,469) | | $ 78,817,286 |
Receivable for investments sold | | 333,537 |
Receivable for fund shares sold | | 424,309 |
Dividends receivable | | 121,598 |
Distributions receivable from Fidelity Central Funds | | 10,797 |
Prepaid expenses | | 232 |
Other receivables | | 343 |
Total assets | | 79,708,102 |
| | |
Liabilities | | |
Payable to custodian bank | $ 43,557 | |
Payable for investments purchased | 357,054 | |
Payable for fund shares redeemed | 11,261 | |
Accrued management fee | 34,741 | |
Other affiliated payables | 8,940 | |
Other payables and accrued expenses | 40,268 | |
Collateral on securities loaned, at value | 2,562,965 | |
Total liabilities | | 3,058,786 |
| | |
Net Assets | | $ 76,649,316 |
Net Assets consist of: | | |
Paid in capital | | $ 67,931,525 |
Accumulated undistributed net realized gain (loss) on investments and foreign currency transactions | | 1,208,158 |
Net unrealized appreciation (depreciation) on investments and assets and liabilities in foreign currencies | | 7,509,633 |
Net Assets | | $ 76,649,316 |
Statement of Assets and Liabilities - continued
| December 31, 2007 |
Initial Class:
Net Asset Value, offering price and redemption price per share ($50,586,450 ÷ 3,506,742 shares) | | $ 14.43 |
| | |
Investor Class:
Net Asset Value, offering price and redemption price per share ($26,062,866 ÷ 1,813,003 shares) | | $ 14.38 |
See accompanying notes which are an integral part of the financial statements.
Annual Report
Statement of Operations
| Year ended December 31, 2007 |
Investment Income | | |
Dividends | | $ 889,219 |
Interest | | 61 |
Income from Fidelity Central Funds | | 56,130 |
Total income | | 945,410 |
| | |
Expenses | | |
Management fee | $ 371,653 | |
Transfer agent fees | 70,423 | |
Accounting and security lending fees | 26,342 | |
Custodian fees and expenses | 17,443 | |
Independent trustees' compensation | 228 | |
Audit | 41,622 | |
Legal | 482 | |
Miscellaneous | 14,251 | |
Total expenses before reductions | 542,444 | |
Expense reductions | (793) | 541,651 |
Net investment income (loss) | | 403,759 |
Realized and Unrealized Gain (Loss) Net realized gain (loss) on: | | |
Investment securities: | | |
Unaffiliated issuers (net of foreign taxes of $8,451) | 9,949,640 | |
Foreign currency transactions | (4,835) | |
Total net realized gain (loss) | | 9,944,805 |
Change in net unrealized appreciation (depreciation) on: Investment securities | (99,750) | |
Assets and liabilities in foreign currencies | (219) | |
Total change in net unrealized appreciation (depreciation) | | (99,969) |
Net gain (loss) | | 9,844,836 |
Net increase (decrease) in net assets resulting from operations | | $ 10,248,595 |
Statement of Changes in Net Assets
| Year ended
December 31, 2007 | Year ended
December 31, 2006 |
Increase (Decrease) in Net Assets | | |
Operations | | |
Net investment income (loss) | $ 403,759 | $ 585,385 |
Net realized gain (loss) | 9,944,805 | 7,681,953 |
Change in net unrealized appreciation (depreciation) | (99,969) | (720,697) |
Net increase (decrease) in net assets resulting from operations | 10,248,595 | 7,546,641 |
Distributions to shareholders from net investment income | (396,466) | (587,778) |
Distributions to shareholders from net realized gain | (8,842,045) | (9,197,294) |
Total distributions | (9,238,511) | (9,785,072) |
Share transactions - net increase (decrease) | 11,529,518 | 14,031,048 |
Redemption fees | 20,061 | 29,081 |
Total increase (decrease) in net assets | 12,559,663 | 11,821,698 |
| | |
Net Assets | | |
Beginning of period | 64,089,653 | 52,267,955 |
End of period (including undistributed net investment income of $0 and $641, respectively) | $ 76,649,316 | $ 64,089,653 |
See accompanying notes which are an integral part of the financial statements.
Annual Report
Financial Highlights - Initial Class
Years ended December 31, | 2007 | 2006 | 2005 | 2004 | 2003 |
Selected Per-Share Data | | | | | |
Net asset value, beginning of period | $ 13.90 | $ 14.20 | $ 13.81 | $ 11.16 | $ 8.08 |
Income from Investment Operations | | | | | |
Net investment income (loss) C | .10 | .14 | .08 | .08 H | .03 |
Net realized and unrealized gain (loss) | 2.43 | 2.02 | 1.70 | 2.59 | 3.06 |
Total from investment operations | 2.53 | 2.16 | 1.78 | 2.67 | 3.09 |
Distributions from net investment income | (.09) | (.15) | (.10) | (.04) | (.02) |
Distributions from net realized gain | (1.91) | (2.33) | (1.30) | - | - |
Total distributions | (2.00) | (2.47) I | (1.40) | (.04) | (.02) |
Redemption fees added to paid in capital C | - G | .01 | .01 | .02 | .01 |
Net asset value, end of period | $ 14.43 | $ 13.90 | $ 14.20 | $ 13.81 | $ 11.16 |
Total Return A,B | 18.21% | 15.71% | 12.88% | 24.10% | 38.37% |
Ratios to Average Net Assets D,F | | | | | |
Expenses before reductions | .78% | .79% | .81% | .95% | 1.85% |
Expenses net of fee waivers, if any | .78% | .79% | .81% | .95% | 1.50% |
Expenses net of all reductions | .78% | .78% | .76% | .90% | 1.47% |
Net investment income (loss) | .64% | .95% | .53% | .63% H | .35% |
Supplemental Data | | | | | |
Net assets, end of period (000 omitted) | $ 50,586 | $ 51,332 | $ 50,332 | $ 62,299 | $ 19,618 |
Portfolio turnover rate E | 122% | 137% | 160% | 121% | 117% |
A Total returns do not reflect charges attributable to your insurance company's separate account. Inclusion of these charges would reduce the total returns shown.
B Total returns would have been lower had certain expenses not been reduced during the periods shown.
C Calculated based on average shares outstanding during the period.
D Fees and expenses of the underlying Fidelity Central Funds are not included in the Fund's expense ratio. The Fund indirectly bears its proportionate share of the expenses of any underlying Fidelity Central Funds.
E Amount does not include the portfolio activity of any underlying Fidelity Central Funds.
F Expense ratios reflect operating expenses of the class. Expenses before reductions do not reflect amounts reimbursed by the investment adviser or reductions from brokerage service arrangements or other expense offset arrangements and do not represent the amount paid by the class during periods when reimbursements or reductions occur. Expense ratios before reductions for start-up periods may not be representative of longer-term operating periods. Expenses net of fee waivers reflect expenses after reimbursement by the investment adviser but prior to reductions from brokerage service arrangements or other expense offset arrangements. Expenses net of all reductions represent the net expenses paid by the class.
G Amount represents less than $.01 per share.
H As a result in the change in the estimate of the return of capital components of dividend income realized in the year ended December 31, 2003, net investment income per share and the ratio of net investment income to average net assets for the year ended December 31, 2004 have been reduced by $.00 per share and .04%, respectively. The change in estimate has no impact on total net assets or total return of the class.
I Total distributions of $2.47 per share is comprised of distributions from net investment income of $.147 and distributions from net realized gain of $2.325 per share.
Financial Highlights - Investor Class
Years ended December 31, | 2007 | 2006 | 2005 H |
Selected Per-Share Data | | | |
Net asset value, beginning of period | $ 13.86 | $ 14.19 | $ 14.55 |
Income from Investment Operations | | | |
Net investment income (loss) E | .08 | .12 | .02 |
Net realized and unrealized gain (loss) | 2.43 | 2.00 | .96 |
Total from investment operations | 2.51 | 2.12 | .98 |
Distributions from net investment income | (.08) | (.14) | (.09) |
Distributions from net realized gain | (1.91) | (2.33) | (1.25) |
Total distributions | (1.99) | (2.46) K | (1.34) |
Redemption fees added to paid in capitalE | - J | .01 | - J |
Net asset value, end of period | $ 14.38 | $ 13.86 | $ 14.19 |
Total Return B,C,D | 18.12% | 15.43% | 6.65% |
Ratios to Average Net Assets F,I | | | |
Expenses before reductions | .90% | .92% | 1.08% A |
Expenses net of fee waivers, if any | .90% | .92% | 1.08% A |
Expenses net of all reductions | .90% | .92% | 1.03% A |
Net investment income (loss) | .52% | .81% | .31% A |
Supplemental Data | | | |
Net assets, end of period (000 omitted) | $ 26,063 | $ 12,758 | $ 1,936 |
Portfolio turnover rate G | 122% | 137% | 160% |
A Annualized
B Total returns for periods of less than one year are not annualized.
C Total returns do not reflect charges attributable to your insurance company's separate account. Inclusion of these charges would reduce the total returns shown.
D Total returns would have been lower had certain expenses not been reduced during the periods shown.
E Calculated based on average shares outstanding during the period.
F Fees and expenses of the underlying Fidelity Central Funds are not included in the Fund's expense ratio. The Fund indirectly bears its proportionate share of the expenses of any underlying Fidelity Central Funds.
G Amount does not include the portfolio activity of any underlying Fidelity Central Funds.
H For the period July 21, 2005 (commencement of sale of shares) to December 31, 2005.
I Expense ratios reflect operating expenses of the class. Expenses before reductions do not reflect amounts reimbursed by the investment adviser or reductions from brokerage service arrangements or other expense offset arrangements and do not represent the amount paid by the class during periods when reimbursements or reductions occur. Expense ratios before reductions for start-up periods may not be representative of longer-term operating periods. Expenses net of fee waivers reflect expenses after reimbursement by the investment adviser but prior to reductions from brokerage service arrangements or other expense offset arrangements. Expenses net of all reductions represent the net expenses paid by the class.
J Amount represents less than $.01 per share.
K Total distributions of $2.46 per share is comprised of distributions from net investment income of $.138 and distributions from net realized gain of $2.325 per share.
See accompanying notes which are an integral part of the financial statements.
Annual Report
Notes to Financial Statements
For the period ended December 31, 2007
1. Organization.
VIP Industrials Portfolio (the Fund) is a non-diversified fund of Variable Insurance Products Fund IV (the trust) and is authorized to issue an unlimited number of shares. The trust is registered under the Investment Company Act of 1940, as amended (the 1940 Act), as an open-end management investment company organized as a Massachusetts business trust. Shares of the Fund may only be purchased by insurance companies for the purpose of funding variable annuity or variable life insurance contracts. The Fund offers the following classes of shares: Initial Class shares and Investor Class shares. All classes have equal rights and voting privileges, except for matters affecting a single class. Investment income, realized and unrealized capital gains and losses, the common expenses of the Fund, and certain fund-level expense reductions, if any, are allocated on a pro rata basis to each class based on the relative net assets of each class to the total net assets of the Fund. Each class differs with respect to transfer agent fees incurred. Certain expense reductions also differ by class.
2. Investments in Fidelity Central Funds.
The Fund may invest in Fidelity Central Funds, which are open-end investment companies available only to other investment companies and accounts managed by Fidelity Management & Research Company (FMR) and its affiliates. The Fund's Schedule of Investments lists each of the Fidelity Central Funds as an investment of the Fund, but does not include the underlying holdings of each Fidelity Central Fund. As an Investing Fund, the Fund indirectly bears its proportionate share of the expenses of the underlying Fidelity Central Funds.
The Money Market Central Funds seek preservation of capital and current income and are managed by Fidelity Investments Money Management, Inc. (FIMM), an affiliate of FMR.
A complete list of holdings for each Fidelity Central Fund is available upon request or at the SEC's web site at www.sec.gov. In addition, the financial statements of the Fidelity Central Funds, which are not covered by the Fund's Report of Independent Registered Public Accounting Firm, are available on the SEC's web site or upon request.
3. Significant Accounting Policies.
The financial statements have been prepared in conformity with accounting principles generally accepted in the United States of America, which require management to make certain estimates and assumptions at the date of the financial statements. The following summarizes the significant accounting policies of the Fund:
Security Valuation. Investments are valued and net asset value (NAV) per share is calculated (NAV calculation) as of the close of business of the New York Stock Exchange (NYSE), normally 4:00 p.m. Eastern time. Wherever possible, the Fund uses independent pricing services approved by the Board of Trustees to value its investments.
Equity securities, including restricted securities, for which market quotations are readily available, are valued at the last reported sale price or official closing price as reported by an independent pricing service on the primary market or exchange on which they are traded. In the event there were no sales during the day or closing prices are not available, securities are valued at the last quoted bid price. Debt securities, including restricted securities, for which quotations are readily available, are valued by independent pricing services or by dealers who make markets in such securities. Pricing services consider yield or price of bonds of comparable quality, coupon, maturity and type as well as dealer supplied prices. Investments in open-end mutual funds, including the Fidelity Central Funds, are valued at their closing net asset value each business day. Short-term securities with remaining maturities of sixty days or less for which quotations are not readily available are valued at amortized cost, which approximates value.
When current market prices or quotations are not readily available or do not accurately reflect fair value, valuations may be determined in accordance with procedures adopted by the Board of Trustees. For example, when developments occur between the close of a market and the close of the NYSE that may materially affect the value of some or all of the securities, or when trading in a security is halted, those securities may be fair valued. Factors used in the determination of fair value may include monitoring news to identify significant market or security specific events such as changes in the value of U.S. securities markets, reviewing developments in foreign markets and evaluating the performance of ADRs, futures contracts and exchange-traded funds. Because the Fund's utilization of fair value pricing depends on market activity, the frequency with which fair value pricing is used cannot be predicted and may be utilized to a significant extent. The value of securities used for NAV calculation under fair value pricing may differ from published prices for the same securities.
Foreign Currency. The Fund uses foreign currency contracts to facilitate transactions in foreign-denominated securities. Losses from these transactions may arise from changes in the value of the foreign currency or if the counterparties do not perform under the contracts' terms.
Foreign-denominated assets, including investment securities, and liabilities are translated into U.S. dollars at the exchange rate at period end. Purchases and sales of investment securities, income and dividends received and expenses denominated in foreign currencies are translated into U.S. dollars at the exchange rate in effect on the transaction date.
Annual Report
Notes to Financial Statements - continued
3. Significant Accounting Policies - continued
Foreign Currency - continued
The effects of exchange rate fluctuations on investments are included with the net realized and unrealized gain (loss) on investment securities. Other foreign currency transactions resulting in realized and unrealized gain (loss) are disclosed separately.
Investment Transactions and Income. For financial reporting purposes, the Fund's investment holdings and NAV include trades executed through the end of the last business day of the period. The NAV for processing shareholder transactions includes trades executed through the end of the prior business day. Gains and losses on securities sold are determined on the basis of identified cost and may include proceeds received from litigation. Dividend income is recorded on the ex-dividend date, except for certain dividends from foreign securities where the ex-dividend date may have passed, which are recorded as soon as the Fund is informed of the ex-dividend date. Non-cash dividends included in dividend income, if any, are recorded at the fair market value of the securities received. Distributions received on securities that represent a return of capital or capital gain are recorded as a reduction of cost of investments and/or as a realized gain. The Fund estimates the components of distributions received that may be considered return of capital distributions or capital gain distributions. Interest income and distributions from the Fidelity Central Funds are accrued as earned. Interest income includes coupon interest and amortization of premium and accretion of discount on debt securities. Investment income is recorded net of foreign taxes withheld where recovery of such taxes is uncertain.
Expenses. Most expenses of the trust can be directly attributed to a fund. Expenses which cannot be directly attributed are apportioned among each Fund in the trust. Expense estimates are accrued in the period to which they relate and adjustments are made when actual amounts are known.
Income Tax Information and Distributions to Shareholders. Each year, the Fund intends to qualify as a regulated investment company by distributing substantially all of its taxable income and realized gains under Subchapter M of the Internal Revenue Code and filing its U.S. federal tax return. As a result, no provision for income taxes is required. The Fund adopted the provisions of FASB Interpretation No. 48, Accounting for Uncertainties in Income Taxes (FIN 48), on June 29, 2007. FIN 48 sets forth a minimum threshold for financial statement recognition of the benefit of a tax position taken or expected to be taken in a tax return. The implementation of FIN 48 did not result in any unrecognized tax benefits in the accompanying financial statements. Each of the Fund's federal tax returns for the prior three fiscal years remains subject to examination by the Internal Revenue Service. Foreign taxes are provided for based on the Fund's understanding of the tax rules and rates that exist in the foreign markets in which it invests.
Distributions are recorded on the ex-dividend date. Income dividends and capital gain distributions are declared separately for each class. Income and capital gain distributions are determined in accordance with income tax regulations, which may differ from generally accepted accounting principles.
Capital accounts within the financial statements are adjusted for permanent book-tax differences. These adjustments have no impact on net assets or the results of operations. Temporary book-tax differences will reverse in a subsequent period.
Book-tax differences are primarily due to foreign currency transactions, certain foreign taxes and losses deferred due to wash sales.
The tax-basis components of distributable earnings and the federal tax cost as of period end were as follows:
Unrealized appreciation | $ 11,173,012 |
Unrealized depreciation | (3,768,873) |
Net unrealized appreciation (depreciation) | 7,404,139 |
Undistributed ordinary income | 703,191 |
Undistributed long-term capital gain | 610,460 |
| |
Cost for federal income tax purposes | $ 71,413,147 |
The tax character of distributions paid was as follows:
| December 31, 2007 | December 31, 2006 |
Ordinary Income | $ 5,349,354 | $ 3,917,105 |
Long-term Capital Gains | 3,889,157 | 5,867,967 |
Total | $ 9,238,511 | $ 9,785,072 |
Trading (Redemption) Fees. Shares held less than 60 days are subject to a redemption fee equal to 1% of the proceeds of the redeemed shares. All redemption fees, including any estimated redemption fees paid by FMR, are retained by the Fund and accounted for as an addition to paid in capital.
New Accounting Pronouncement. In September 2006, Statement of Financial Accounting Standards No. 157, Fair Value Measurements (SFAS 157), was issued and is effective for fiscal years beginning after November 15, 2007. SFAS 157 defines fair value, establishes a framework for measuring fair value and expands disclosures about fair value measurements. Management is currently evaluating the impact the adoption of SFAS 157 will have on the Fund's financial statement disclosures.
Annual Report
4. Operating Policies.
Repurchase Agreements. FMR has received an Exemptive Order from the Securities and Exchange Commission (the SEC) which permits the Fund and other affiliated entities of FMR to transfer uninvested cash balances into joint trading accounts which are then invested in repurchase agreements. The Fund may also invest directly with institutions in repurchase agreements. Repurchase agreements are collateralized by government or non-government securities. Upon settlement date, collateral is held in segregated accounts with custodian banks and may be obtained in the event of a default of the counterparty. The Fund monitors, on a daily basis, the value of the collateral to ensure it is at least equal to the principal amount of the repurchase agreement (including accrued interest). In the event of a default by the counterparty, realization of the collateral proceeds could be delayed, during which time the value of the collateral may decline.
5. Purchases and Sales of Investments.
Purchases and sales of securities, other than short-term securities, aggregated $83,517,086 and $81,079,806, respectively.
6. Fees and Other Transactions with Affiliates.
Management Fee. FMR and its affiliates provide the Fund with investment management related services for which the Fund pays a monthly management fee. The management fee is the sum of an individual fund fee rate that is based on an annual rate of .30% of the Fund's average net assets and a group fee rate that averaged .26% during the period. The group fee rate is based upon the average net assets of all the mutual funds advised by FMR. The group fee rate decreases as assets under management increase and increases as assets under management decrease. For the period, the total annual management fee rate was .56% of the Fund's average net assets.
Transfer Agent Fees. Fidelity Investments Institutional Operations Company, Inc. (FIIOC), an affiliate of FMR, is the Fund's transfer, dividend disbursing, and shareholder servicing agent. FIIOC receives an asset-based fee with respect to each class. Each class with the exception of Investor Class pays a transfer agent fee, excluding out of pocket expenses, equal to an annual rate of .07% of average net assets. Investor Class pays a monthly asset-based transfer agent fee of .18% of average net assets. The total transfer agent fees paid by each class to FIIOC, including out of pocket expenses, were as follows:
Initial Class | $ 36,040 |
Investor Class | 34,383 |
| $ 70,423 |
Effective February 1, 2008, the Board of Trustees approved a decrease to Investor Class' asset-based fee from .18% to .15% of average net assets.
Accounting and Security Lending Fees. Fidelity Service Company, Inc. (FSC), an affiliate of FMR, maintains the Fund's accounting records. The accounting fee is based on the level of average net assets for the month. Under a separate contract, FSC administers the security lending program. The security lending fee is based on the number and duration of lending transactions.
Brokerage Commissions. The Fund placed a portion of its portfolio transactions with brokerage firms which are affiliates of the investment adviser. The commissions paid to these affiliated firms were $933 for the period.
7. Committed Line of Credit.
The Fund participates with other funds managed by FMR in a $4.2 billion credit facility (the "line of credit") to be utilized for temporary or emergency purposes to fund shareholder redemptions or for other short-term liquidity purposes. The Fund has agreed to pay commitment fees on its pro rata portion of the line of credit, which amounted to $135 and is reflected in Miscellaneous Expense on the Statement of Operations. During the period, there were no borrowings on this line of credit.
8. Security Lending.
The Fund lends portfolio securities from time to time in order to earn additional income. On the settlement date of the loan, the Fund receives collateral (in the form of U.S. Treasury obligations, letters of credit and/or cash) against the loaned securities and maintains collateral in an amount not less than 100% of the market value of the loaned securities during the period of the loan. The market value of the loaned securities is determined at the close of business of the Fund and any additional required collateral is delivered to the Fund on the next business day. If the borrower defaults on its obligation to return the securities loaned because of insolvency or other reasons, a fund could experience delays and costs in recovering the securities loaned or in gaining access to the collateral. Any cash collateral received is invested in the Fidelity Securities Lending Cash Central Fund. The value of loaned securities and cash collateral at period end are disclosed on the Fund's Statement of Assets and Liabilities. Security lending income represents the income earned on investing cash collateral, less fees and expenses associated with the loan, plus any premium payments that may be received on the loan of certain types of securities. Security lending income is presented in the Statement of Operations as a component of income from Fidelity Central Funds. Net income from lending portfolio securities during the period amounted to $15,783.
Annual Report
Notes to Financial Statements - continued
9. Expense Reductions.
Many of the brokers with whom FMR places trades on behalf of the Fund provided services to the Fund in addition to trade execution. These services included payments of certain expenses on behalf of the Fund totaling $778 for the period.
10. Other.
The Fund's organizational documents provide former and current trustees and officers with a limited indemnification against liabilities arising in connection with the performance of their duties to the Fund. In the normal course of business, the Fund may also enter into contracts that provide general indemnifications. The Fund's maximum exposure under these arrangements is unknown as this would be dependent on future claims that may be made against the Fund. The risk of material loss from such claims is considered remote.
At the end of the period, FMR or its affiliates were the owners of record of 100% of the total outstanding shares of the Fund.
The United States Securities and Exchange Commission ("SEC") is conducting an investigation of FMR (covering the years 2002 to 2004) arising from gifts, gratuities and business entertainment provided by certain brokers to certain individuals who were employed on FMR's domestic equity trading desk during that period. FMR is in discussions with the SEC staff regarding the possible resolution of the matter, but as of period-end no final resolution has been reached.
In December 2006, the Independent Trustees completed their own investigation of the matter with the assistance of independent counsel. The Independent Trustees and FMR agree that, despite the absence of proof that the Fidelity mutual funds experienced diminished execution quality as a result of the improper receipt of gifts and business entertainment, the conduct at issue was serious and is worthy of redress. Accordingly, the Independent Trustees have requested and FMR has agreed to pay $42 million to Fidelity mutual funds, plus interest to be determined at the time that payment is made. A method of allocating this payment among the funds has not yet been determined. The total payment to the Fund is not anticipated to have a material impact on the Fund's net assets. In addition, FMR reimbursed related legal expenses which are recorded in the accompanying Statement of Operations as an expense reduction.
11. Distributions to Shareholders.
Distributions to shareholders of each class were as follows:
Years ended December 31, | 2007 | 2006 |
From net investment income | | |
Initial Class | $ 272,670 | $ 477,491 |
Investor Class | 123,796 | 110,287 |
Total | $ 396,466 | $ 587,778 |
From net realized gain | | |
Initial Class | $ 5,872,517 | $ 7,633,932 |
Investor Class | 2,969,528 | 1,563,362 |
Total | $ 8,842,045 | $ 9,197,294 |
12. Share Transactions.
Transactions for each class of shares were as follows:
| Shares | Dollars |
Years ended December 31, | 2007 | 2006 | 2007 | 2006 |
Initial Class | | | | |
Shares sold | 515,158 | 971,069 | $ 8,136,966 | $ 14,819,374 |
Reinvestment of distributions | 425,160 | 581,159 | 6,145,187 | 8,111,423 |
Shares redeemed | (1,127,712) | (1,401,453) | (16,771,318) | (20,744,056) |
Net increase (decrease) | (187,394) | 150,775 | $ (2,489,165) | $ 2,186,741 |
Investor Class | | | | |
Shares sold | 981,693 | 853,271 | $ 15,432,146 | $ 12,967,127 |
Reinvestment of distributions | 214,711 | 120,766 | 3,093,324 | 1,673,649 |
Shares redeemed | (303,783) | (190,154) | (4,506,787) | (2,796,469) |
Net increase (decrease) | 892,621 | 783,883 | $ 14,018,683 | $ 11,844,307 |
Annual Report
Report of Independent Registered Public Accounting Firm
To the Trustees of Variable Insurance Products Fund IV and the Shareholders of VIP Industrials Portfolio:
In our opinion, the accompanying statement of assets and liabilities, including the schedule of investments, and the related statements of operations and of changes in net assets and the financial highlights present fairly, in all material respects, the financial position of VIP Industrials Portfolio (a fund of Variable Insurance Products Fund IV) at December 31, 2007, the results of its operations for the year then ended, the changes in its net assets for each of the two years in the period then ended and the financial highlights for each of the periods indicated, in conformity with accounting principles generally accepted in the United States of America. These financial statements and financial highlights (hereafter referred to as "financial statements") are the responsibility of the VIP Industrials Portfolio's management. Our responsibility is to express an opinion on these financial statements based on our audits. We conducted our audits of these financial statements in accordance with the standards of the Public Company Accounting Oversight Board (United States). Those standards require that we plan and perform the audit to obtain reasonable assurance about whether the financial statements are free of material misstatement. An audit includes examining, on a test basis, evidence supporting the amounts and disclosures in the financial statements, assessing the accounting principles used and significant estimates made by management, and evaluating the overall financial statement presentation. We believe that our audits, which included confirmation of securities at December 31, 2007 by correspondence with the custodian and brokers, provide a reasonable basis for our opinion.
/s/ PricewaterhouseCoopers LLP
PricewaterhouseCoopers LLP
Boston, Massachusetts
February 15, 2008
Annual Report
Trustees and Officers
The Trustees, Members of the Advisory Board, and executive officers of the trust and fund, as applicable, are listed below. The Board of Trustees governs the fund and is responsible for protecting the interests of shareholders. The Trustees are experienced executives who meet periodically throughout the year to oversee the fund's activities, review contractual arrangements with companies that provide services to the fund, and review the fund's performance. Except for James C. Curvey, each of the Trustees oversees 373 funds advised by FMR or an affiliate. Mr. Curvey oversees 368 funds advised by FMR or an affiliate.
The Trustees hold office without limit in time except that (a) any Trustee may resign; (b) any Trustee may be removed by written instrument, signed by at least two-thirds of the number of Trustees prior to such removal; (c) any Trustee who requests to be retired or who has become incapacitated by illness or injury may be retired by written instrument signed by a majority of the other Trustees; and (d) any Trustee may be removed at any special meeting of shareholders by a two-thirds vote of the outstanding voting securities of the trust. Each Trustee who is not an interested person (as defined in the 1940 Act) (Independent Trustee), shall retire not later than the last day of the calendar year in which his or her 72nd birthday occurs. The Independent Trustees may waive this mandatory retirement age policy with respect to individual Trustees. The executive officers and Advisory Board Members hold office without limit in time, except that any officer and Advisory Board Member may resign or may be removed by a vote of a majority of the Trustees at any regular meeting or any special meeting of the Trustees. Except as indicated, each individual has held the office shown or other offices in the same company for the past five years.
The fund's Statement of Additional Information (SAI) includes more information about the Trustees. To request a free copy, call Fidelity at 1-877-208-0098.
Interested Trustees*:
Correspondence intended for each Trustee who is an interested person may be sent to Fidelity Investments, 82 Devonshire Street, Boston, Massachusetts 02109.
Name, Age; Principal Occupation |
Edward C. Johnson 3d (77) |
| Year of Election or Appointment: 1983 Mr. Johnson is Chairman of the Board of Trustees. Mr. Johnson serves as President (2006-present), Chief Executive Officer, Chairman, and a Director of FMR LLC; Chairman and a Director of FMR; Chairman and a Director of Fidelity Research & Analysis Company (FRAC); Chairman and a Director of Fidelity Investments Money Management, Inc.; and Chairman (2001-present) and a Director of FMR Co., Inc. In addition, Mr. Johnson serves as Chairman and Director of Fidelity International Limited (FIL). Mr. Edward C. Johnson 3d and Mr. Arthur E. Johnson are not related. |
James C. Curvey (72) |
| Year of Election or Appointment: 2007 Mr. Curvey also serves as Trustee (2007-present) or Member of the Advisory Board (2007-present) of other investment companies advised by FMR. Mr. Curvey is a Director of FMR and FMR Co., Inc. (2007-present). Mr. Curvey is also Vice Chairman (2006-
present) and Director of FMR LLC. Mr. Curvey joined Fidelity in 1982 and served in numerous senior management positions, including President and Chief Operating Officer of FMR LLC (1997-2000) and President of Fidelity Strategic Investments (2000-
2002). In addition, he serves as a member of the Board of Directors of Geerlings & Wade, Inc. (wine distribution). |
* Trustees have been determined to be "Interested Trustees" by virtue of, among other things, their affiliation with the trust or various entities under common control with FMR. FMR Corp. merged with and into FMR LLC on October 1, 2007. Any references to FMR LLC for prior periods are deemed to be references to the prior entity.
Independent Trustees:
Correspondence intended for each Independent Trustee (that is, the Trustees other than the Interested Trustees) may be sent to Fidelity Investments, P.O. Box 55235, Boston, Massachusetts 02205-5235.
Name, Age; Principal Occupation |
Dennis J. Dirks (59) |
| Year of Election or Appointment: 2005 Prior to his retirement in May 2003, Mr. Dirks was Chief Operating Officer and a member of the Board of The Depository Trust & Clearing Corporation (DTCC) (1999-2003). He also served as President, Chief Operating Officer, and Board member of The Depository Trust Company (DTC) (1999-2003) and President and Board member of the National Securities Clearing Corporation (NSCC) (1999-2003). In addition, Mr. Dirks served as Chief Executive Officer and Board member of the Government Securities Clearing Corporation (2001-2003) and Chief Executive Officer and Board member of the Mortgage-Backed Securities Clearing Corporation (2001-2003). Mr. Dirks also serves as a Trustee and a member of the Finance Committee of Manhattan College (2005-present) and a Trustee and a member of the Finance Committee of AHRC of Nassau County (2006-present). |
Albert R. Gamper, Jr. (65) |
| Year of Election or Appointment: 2006 Prior to his retirement in December 2004, Mr. Gamper served as Chairman of the Board of CIT Group Inc. (commercial finance). During his tenure with CIT Group Inc. Mr. Gamper served in numerous senior management positions, including Chairman (1987-
1989; 1999-2001; 2002-2004), Chief Executive Officer (1987-2004), and President (1989-2002). He currently serves as a member of the Board of Directors of Public Service Enterprise Group (utilities, 2001-present), Chairman of the Board of Governors, Rutgers University (2004-present), and Chairman of the Board of Saint Barnabas Health Care System. |
George H. Heilmeier (71) |
| Year of Election or Appointment: 2004 Dr. Heilmeier is Chairman Emeritus of Telcordia Technologies (communication software and systems), where prior to his retirement, he served as company Chairman and Chief Executive Officer. He currently serves on the Boards of Directors of The Mitre Corporation (systems engineering and information technology support for the government), and HRL Laboratories (private research and development, 2004-present). He is Chairman of the General Motors Science & Technology Advisory Board and a Life Fellow of the Institute of Electrical and Electronics Engineers (IEEE). Dr. Heilmeier is a member of the Defense Science Board and the National Security Agency Advisory Board. He is also a member of the National Academy of Engineering, the American Academy of Arts and Sciences, and the Board of Overseers of the School of Engineering and Applied Science of the University of Pennsylvania. Previously, Dr. Heilmeier served as a Director of TRW Inc. (automotive, space, defense, and information technology, 1992-2002), Compaq (1994-2002), Automatic Data Processing, Inc. (ADP) (technology-based business outsourcing, 1995-2002), INET Technologies Inc. (telecommunications network surveillance, 2001-2004), and Teletech Holdings (customer management services). He is the recipient of the 2005 Kyoto Prize in Advanced Technology for his invention of the liquid crystal display, and a member of the Consumer Electronics Hall of Fame. |
James H. Keyes (67) |
| Year of Election or Appointment: 2007 Prior to his retirement in 2003, Mr. Keyes was Chairman, President, and Chief Executive Officer of Johnson Controls, Inc. (automotive supplier, 1993-2003). He currently serves as a member of the boards of LSI Logic Corporation (semiconductor technologies), Navistar International Corporation (manufacture and sale of trucks, buses, and diesel engines, 2002-present), and Pitney Bowes, Inc. (integrated mail, messaging, and document management solutions). |
Marie L. Knowles (61) |
| Year of Election or Appointment: 2001 Prior to Ms. Knowles' retirement in June 2000, she served as Executive Vice President and Chief Financial Officer of Atlantic Richfield Company (ARCO) (diversified energy, 1996-2000). From 1993 to 1996, she was a Senior Vice President of ARCO and President of ARCO Transportation Company. She served as a Director of ARCO from 1996 to 1998. She currently serves as a Director of Phelps Dodge Corporation (copper mining and manufacturing) and McKesson Corporation (healthcare service, 2002-
present). Ms. Knowles is a Trustee of the Brookings Institution and the Catalina Island Conservancy and also serves as a member of the Advisory Board for the School of Engineering of the University of Southern California. |
Ned C. Lautenbach (63) |
| Year of Election or Appointment: 2000 Mr. Lautenbach is Chairman of the Independent Trustees (2006-present). Mr. Lautenbach has been a partner of Clayton, Dubilier & Rice, Inc. (private equity investment firm) since September 1998. Previously, Mr. Lautenbach was with the International Business Machines Corporation (IBM) from 1968 until his retirement in 1998. Mr. Lautenbach serves as a Director of Sony Corporation (2006-present) and Eaton Corporation (diversified industrial) as well as the Philharmonic Center for the Arts in Naples, Florida. He also is a member of the Board of Trustees of Fairfield University (2005-present), as well as a member of the Council on Foreign Relations. |
Cornelia M. Small (63) |
| Year of Election or Appointment: 2005 Ms. Small is a member (2000-present) and Chairperson (2002-present) of the Investment Committee, and a member (2002-
present) of the Board of Trustees of Smith College. Previously, she served as Chief Investment Officer (1999-2000), Director of Global Equity Investments (1996-1999), and a member of the Board of Directors of Scudder, Stevens & Clark (1990-1997) and Scudder Kemper Investments (1997-1999). In addition, Ms. Small served as Co-Chair (2000-2003) of the Annual Fund for the Fletcher School of Law and Diplomacy. |
William S. Stavropoulos (68) |
| Year of Election or Appointment: 2001 Mr. Stavropoulos is Chairman Emeritus of the Board of Directors of The Dow Chemical Company. Since joining The Dow Chemical Company in 1967, Mr. Stavropoulos served in numerous senior management positions, including President (1993-2000; 2002-
2003), CEO (1995-2000; 2002-2004), and Chairman of the Executive Committee (2000-2004). Currently, he is a Director of NCR Corporation (data warehousing and technology solutions), Chemical Financial Corporation, Maersk Inc. (industrial conglomerate, 2002-present), Tyco International, Inc. (multinational manufacturing and services, 2007-present), and a member of the Advisory Board for Metalmark Capital (private equity investment firm, 2005-present). He is a special advisor to Clayton, Dubilier & Rice, Inc., a private equity investment firm. He also serves as a member of the Board of Trustees of the American Enterprise Institute for Public Policy Research. In addition, Mr. Stavropoulos is a member of The Business Council, J.P. Morgan International Council and the University of Notre Dame Advisory Council for the College of Science. |
Kenneth L. Wolfe (68) |
| Year of Election or Appointment: 2005 Mr. Wolfe is Chairman and a Director of Hershey Foods Corporation (2007-present), where prior to his retirement in 2001, he was Chairman and Chief Executive Officer. Mr. Wolfe currently serves as a member of the board of Revlon Inc. (2004-present). Previously, Mr. Wolfe served as a member of the boards of Adelphia Communications Corporation (2003-2006) and Bausch & Lomb, Inc. (1993-2007). |
Advisory Board Members and Executive Officers**:
Correspondence intended for Mr. Mauriello, Mr. Thomas, Mr. Wiley, Mr. Lacy, and Mr. Arthur Johnson may be sent to Fidelity Investments, P.O. Box 55235, Boston, Massachusetts 02205-5235. Correspondence intended for each executive officer and Mr. Lynch may be sent to Fidelity Investments, 82 Devonshire Street, Boston, Massachusetts 02109.
Name, Age; Principal Occupation |
Arthur E. Johnson (60) |
| Year of Election or Appointment: 2008 Member of the Advisory Board of Variable Insurance Products Fund IV. Mr. Johnson serves as Senior Vice President of Corporate Strategic Development of Lockheed Martin Corporation (defense contractor). In addition, Mr. Johnson serves as a member of the Board of Directors of AGL Resources, Inc. (holding company, 2002-present), and IKON Office Solutions, Inc. (document management systems and services). Mr. Arthur E. Johnson and Mr. Edward C. Johnson 3d are not related. |
Alan J. Lacy (54) |
| Year of Election or Appointment: 2008 Member of the Advisory Board of Variable Insurance Products Fund IV. Mr. Lacy serves as Senior Adviser (2007-present) of Oak Hill Capital Partners, L.P. (a private equity firm). Mr. Lacy also served as Vice Chairman and Chief Executive Officer of Sears Holdings Corporation and Sears, Roebuck and Co. (retail, 2005-2006; 2000-2005). In addition, Mr. Lacy serves as a member of the Board of Directors of The Western Union Company (global money transfer, 2006-present) and Bristol-Myers Squibb (global pharmaceuticals, 2007-present). Mr. Lacy is a Trustee of the National Parks Conservation Association and The Field Museum of Natural History. |
Peter S. Lynch (63) |
| Year of Election or Appointment: 2003 Member of the Advisory Board of Variable Insurance Products Fund IV. Mr. Lynch is Vice Chairman and a Director of FMR, and Vice Chairman (2001-present) and a Director of FMR Co., Inc. Previously, Mr. Lynch served as a Trustee of the Fidelity funds (1990-2003). In addition, he serves as a Trustee of Boston College and as the Chairman of the Inner-City Scholarship Fund. |
Joseph Mauriello (63) |
| Year of Election or Appointment: 2007 Member of the Advisory Board of Variable Insurance Products Fund IV. Prior to his retirement in January 2006, Mr. Mauriello served in numerous senior management positions including Deputy Chairman and Chief Operating Officer (2004-2005), and Vice Chairman of Financial Services (2002-2004) of KPMG LLP US (professional services firm, 1965-2005). Mr. Mauriello currently serves as a member of the Board of Directors of XL Capital Ltd. (global insurance and re-insurance company, 2006-
present) and of Arcadia Resources Inc. (health care services and products, 2007-present). He also served as a Director of the Hamilton Funds of the Bank of New York (2006-2007). |
David M. Thomas (58) |
| Year of Election or Appointment: 2007 Member of the Advisory Board of Variable Insurance Products Fund IV. Previously, Mr. Thomas served as Executive Chairman (2005-2006) and Chairman and Chief Executive Officer (2000-2005) of IMS Health, Inc. (pharmaceutical and healthcare information solutions). In addition, Mr. Thomas serves as a member of the Board of Directors of Fortune Brands, Inc. (consumer products holding company), and Interpublic Group of Companies, Inc. (marketing communication, 2004-present). |
Michael E. Wiley (57) |
| Year of Election or Appointment: 2007 Member of the Advisory Board of Variable Insurance Products Fund IV. Mr. Wiley also serves as a member of the Board of Trustees of the University of Tulsa (2000-2006; 2007-present). He serves as a Director of Tesoro Corporation (independent oil refiner and marketer, 2005-present), and a Director of Bill Barrett Corporation (exploration and production company, 2005-present). In addition, he also serves as a Director of Post Oak Bank (privately-held bank, 2004-present). Previously, Mr. Wiley served as a Sr. Energy Advisor of Katzenbach Partners, LLC (consulting firm, 2006-2007), as an Advisory Director of Riverstone Holdings (private investment firm), Chairman, President, and CEO of Baker Hughes, Inc. (oilfield services company, 2000-2004), and as Director of Spinnaker Exploration Company (exploration and production company, 2001-2005). |
Kimberley H. Monasterio (44) |
| Year of Election or Appointment: 2007 President and Treasurer of VIP Industrials. Ms. Monasterio also serves as President and Treasurer of other Fidelity funds (2007-present) and is an employee of FMR (2004-present). Previously, Ms. Monasterio served as Deputy Treasurer of the Fidelity funds (2004-2006). Before joining Fidelity Investments, Ms. Monasterio served as Treasurer (2000-2004) and Chief Financial Officer (2002-2004) of the Franklin Templeton Funds and Senior Vice President of Franklin Templeton Services, LLC (2000-2004). |
Brian B. Hogan (43) |
| Year of Election or Appointment: 2007 Vice President of VIP Industrials. Mr. Hogan also serves as Vice President of Sector Funds (2007-present). Mr. Hogan is Senior Vice President of Equity Research (2006-present). Mr. Hogan also serves as Vice President of FMR and FMR Co., Inc. Previously, Mr. Hogan served as a portfolio manager. |
Eric D. Roiter (59) |
| Year of Election or Appointment: 2001 Secretary of VIP Industrials. He also serves as Secretary of other Fidelity funds; Vice President, General Counsel, and Secretary of FMR Co., Inc. (2001-present) and FMR; Assistant Secretary of Fidelity Management & Research (U.K.) Inc. (2001-present), Fidelity Research & Analysis Company (2001-present), and Fidelity Investments Money Management, Inc. (2001-present). Mr. Roiter is an Adjunct Member, Faculty of Law, at Boston College Law School (2003-present). Previously, Mr. Roiter served as Vice President and Secretary of Fidelity Distributors Corporation (FDC) (1998-2005). |
John B. McGinty, Jr. (45) |
| Year of Election or Appointment: 2008 Assistant Secretary of VIP Industrials. Mr. McGinty also serves as Assistant Secretary of other Fidelity funds (2008-present) and is an employee of FMR LLC (2004-present). Mr. McGinty also serves as Senior Vice President, Secretary, and Chief Legal Officer of FDC (2007-present). Before joining Fidelity Investments, Mr. McGinty practiced law at Ropes & Gray, LLP. |
R. Stephen Ganis (41) |
| Year of Election or Appointment: 2006 Anti-Money Laundering (AML) officer of VIP Industrials. Mr. Ganis also serves as AML officer of other Fidelity funds (2006-present) and FMR LLC (2003-present). Before joining Fidelity Investments, Mr. Ganis practiced law at Goodwin Procter, LLP (2000-2002). |
Joseph B. Hollis (59) |
| Year of Election or Appointment: 2006 Chief Financial Officer of VIP Industrials. Mr. Hollis also serves as Chief Financial Officer of other Fidelity funds. Mr. Hollis is President of Fidelity Pricing and Cash Management Services (FPCMS) (2005-present). Mr. Hollis also serves as President and Director of Fidelity Service Company, Inc. (2006-present). Previously, Mr. Hollis served as Senior Vice President of Cash Management Services (1999-2002) and Investment Management Operations (2002-2005). |
Kenneth A. Rathgeber (60) |
| Year of Election or Appointment: 2004 Chief Compliance Officer of VIP Industrials. Mr. Rathgeber also serves as Chief Compliance Officer of other Fidelity funds (2004-present) and Executive Vice President of Risk Oversight for Fidelity Investments (2002-present). He is Chief Compliance Officer of FMR (2005-present), FMR Co., Inc. (2005-present), Fidelity Management & Research (U.K.) Inc. (2005-present), Fidelity Research & Analysis Company (2005-present), Fidelity Investments Money Management, Inc. (2005-present), and Strategic Advisers, Inc. (2005-present). Previously, Mr. Rathgeber served as Executive Vice President and Chief Operating Officer for Fidelity Investments Institutional Services Company, Inc. (1998-2002). |
Bryan A. Mehrmann (46) |
| Year of Election or Appointment: 2005 Deputy Treasurer of VIP Industrials. Mr. Mehrmann also serves as Deputy Treasurer of other Fidelity funds (2005-present) and is an employee of FMR. Previously, Mr. Mehrmann served as Vice President of Fidelity Investments Institutional Services Group (FIIS)/Fidelity Investments Institutional Operations Corporation, Inc. (FIIOC) Client Services (1998-2004). |
Kenneth B. Robins (38) |
| Year of Election or Appointment: 2005 Deputy Treasurer of VIP Industrials. Mr. Robins also serves as Deputy Treasurer of other Fidelity funds (2005-present) and is an employee of FMR (2004-present). Before joining Fidelity Investments, Mr. Robins worked at KPMG LLP, where he was a partner in KPMG's department of professional practice (2002-2004) and a Senior Manager (1999-2000). In addition, Mr. Robins served as Assistant Chief Accountant, United States Securities and Exchange Commission (2000-2002). |
Robert G. Byrnes (41) |
| Year of Election or Appointment: 2005 Assistant Treasurer of VIP Industrials. Mr. Byrnes also serves as Assistant Treasurer of other Fidelity funds (2005-present) and is an employee of FMR (2005-present). Previously, Mr. Byrnes served as Vice President of FPCMS (2003-2005). Before joining Fidelity Investments, Mr. Byrnes worked at Deutsche Asset Management where he served as Vice President of the Investment Operations Group (2000-2003). |
Peter L. Lydecker (53) |
| Year of Election or Appointment: 2004 Assistant Treasurer of VIP Industrials. Mr. Lydecker also serves as Assistant Treasurer of other Fidelity funds (2004) and is an employee of FMR. |
Paul M. Murphy (60) |
| Year of Election or Appointment: 2007 Assistant Treasurer of VIP Industrials. Mr. Murphy also serves as Assistant Treasurer of other Fidelity funds (2007-present) and is an employee of FMR (2007-present). Previously, Mr. Murphy served as Chief Financial Officer of the Fidelity Funds (2005-2006), Vice President and Associate General Counsel of FMR (2007), and Senior Vice President of Fidelity Pricing and Cash Management Services Group (FPCMS) (1994-2007). |
Gary W. Ryan (49) |
| Year of Election or Appointment: 2005 Assistant Treasurer of VIP Industrials. Mr. Ryan also serves as Assistant Treasurer of other Fidelity funds (2005-present) and is an employee of FMR (2005-present). Previously, Mr. Ryan served as Vice President of Fund Reporting in FPCMS (1999-2005). |
** FMR Corp. merged with and into FMR LLC on October 1, 2007. Any references to FMR LLC for prior periods are deemed to be references to the prior entity.
Annual Report
Distributions
The Board of Trustees of VIP Industrials Portfolio voted to pay to shareholders of record at the opening of business on record date, the following distributions per share derived from capital gains realized from sales of portfolio securities:
| Pay Date | Record Date | Capital Gains |
Initial Class | 02/15/08 | 02/15/08 | $0.260 |
Investor Class | 02/15/08 | 02/15/08 | $0.260 |
The fund hereby designates as a capital gain dividend with respect to the taxable year ended December 31 2007, $4,462,174 or, if subsequently determined to be different, the net capital gain of such year.
Initial Class and Investor Class designate 1% and 16% of the dividends distributed in February 2007 and December 2007, respectively, as qualifying for the dividends-received deduction for corporate shareholders.
The fund will notify shareholders in January 2008 of amounts for use in preparing 2007 income tax returns.
Annual Report
Board Approval of Investment Advisory Contracts and Management Fees
VIP Industrials Portfolio
Each year, typically in July, the Board of Trustees, including the Independent Trustees (together, the Board), votes on the renewal of the management contract and sub-advisory agreements (together, the Advisory Contracts) for the fund. The Board, assisted by the advice of fund counsel and Independent Trustees' counsel, requests and considers a broad range of information throughout the year.
The Board meets regularly each month except August and takes into account throughout the year matters bearing on Advisory Contracts. The Board, acting directly and through its separate committees, considers at each of its meetings factors that are relevant to the annual renewal of the fund's Advisory Contracts, including the services and support provided to the fund and its shareholders. At the time of the renewal, the Board had 12 standing committees, each composed of Independent Trustees with varying backgrounds, to which the Board has assigned specific subject matter responsibilities in order to enhance effective decision-making by the Board. Each committee has adopted a written charter outlining the structure and purposes of the committee. One such committee, the Equity Contract Committee, meets periodically as needed throughout the year to consider matters specifically related to the annual renewal of Advisory Contracts. The committee requests and receives information on, and makes recommendations to the Independent Trustees concerning, the approval and annual review of the Advisory Contracts.
At its July 2007 meeting, the Board of Trustees, including the Independent Trustees, unanimously determined to renew the Advisory Contracts for the fund. In reaching its determination, the Board considered all factors it believed relevant, including (i) the nature, extent, and quality of the services to be provided to the fund and its shareholders (including the investment performance of the fund); (ii) the competitiveness of the management fee and total expenses of the fund; (iii) the total costs of the services to be provided by and the profits to be realized by the investment adviser and its affiliates from the relationship with the fund; (iv) the extent to which economies of scale would be realized as the fund grows; and (v) whether fee levels reflect these economies of scale, if any, for the benefit of fund shareholders. The Board also approved amendments to the fund's agreements with foreign sub-advisers to clarify that each sub-adviser provides services as an independent contractor.
In determining whether to renew the Advisory Contracts for the fund, the Board ultimately reached a determination, with the assistance of fund counsel and Independent Trustees' counsel, that the renewal of the Advisory Contracts and the compensation to be received by Fidelity under the management contract is consistent with Fidelity's fiduciary duty under applicable law. In addition to evaluating the specific factors noted above, the Board, in reaching its determination, is aware that shareholders in the fund have a broad range of investment choices available to them, including a wide choice among mutual funds offered by competitors to Fidelity, and that the fund's shareholders, with the opportunity to review and weigh the disclosure provided by the fund in its prospectus and other public disclosures, have chosen to invest in this fund, managed by Fidelity.
Nature, Extent, and Quality of Services Provided. The Board considered staffing within the investment adviser, FMR, and the sub-advisers (together, the Investment Advisers), including the background of the fund's portfolio manager and the fund's investment objective and discipline. The Independent Trustees also had discussions with senior management of Fidelity's investment operations and investment groups. The Board considered the structure of the portfolio manager compensation program and whether this structure provides appropriate incentives.
Resources Dedicated to Investment Management and Support Services. The Board reviewed the size, education, and experience of the Investment Advisers' investment staff, their use of technology, and the Investment Advisers' approach to recruiting, training, and retaining portfolio managers and other research, advisory, and management personnel. The Board considered Fidelity's extensive global research capabilities that enable the Investment Advisers to aggregate data from various sources in an effort to produce positive investment results. The Board noted that Fidelity's analysts have access to a variety of technological tools that enable them to perform both fundamental and quantitative analysis and to specialize in various disciplines. The Board also considered that Fidelity's portfolio managers and analysts have access to daily portfolio attribution that allows for monitoring of a fund's portfolio, as well as an electronic communication system that provides immediate real-time access to research concerning issuers and credit enhancers.
Shareholder and Administrative Services. The Board considered (i) the nature, extent, quality, and cost of advisory, administrative, distribution, and shareholder services performed by the Investment Advisers and their affiliates under the Advisory Contracts and under separate agreements covering transfer agency, pricing and bookkeeping, and securities lending services for the fund; (ii) the nature and extent of the Investment Advisers' supervision of third party service providers, principally custodians and subcustodians; and (iii) the resources devoted to, and the record of compliance with, the fund's compliance policies and procedures. The Board reviewed the allocation of fund brokerage, including allocations to brokers affiliated with the Investment Advisers, the use of brokerage commissions to pay fund expenses, and the use of "soft" commission dollars to pay for research services. The Board also considered that Fidelity voluntarily pays for market data out of its own resources. The Board also considered the agreement reached between the Independent Trustees and Fidelity in December 2006 following an independent review of matters relating to receipt of travel, entertainment, gifts and gratuities in violation of Fidelity policies.
The Board noted that the growth of fund assets across the complex allows Fidelity to reinvest in the development of services designed to enhance the value or convenience of the Fidelity funds as investment vehicles. These services include 24-hour access to account information and market information through phone representatives and over the Internet, and investor education materials and asset allocation tools.
Annual Report
Investment in a Large Fund Family. The Board considered the benefits to shareholders of investing in a Fidelity fund, including the benefits of investing in a fund that is part of a large family of funds offering a variety of investment disciplines and providing for a large variety of mutual fund investor services. The Board noted that, since the last Advisory Contract renewals in July 2006, Fidelity has taken a number of actions that benefited particular funds, including (i) dedicating additional resources to investment research and to restructure the investment research teams; (ii) contractually agreeing to reduce the management fee on Fidelity Advisor Floating Rate High Income Fund; (iii) contractually agreeing to reduce the management fees on Fidelity's California, Massachusetts, New Jersey, and New York AMT Tax-Free Money Market Funds, launching new Institutional Classes and Service Classes of these funds, and contractually agreeing to impose expense limitations on these funds; (iv) eliminating the exchange fee on the Fidelity Select Portfolios and reducing the pricing and bookkeeping fee rates for these funds; (v) reducing the maximum transfer agency fee rates on high income funds and certain equity funds; (vi) proposing amended management contracts that, if approved by shareholders, will add a performance adjustment component to the management fees paid by 18 Fidelity Advisor equity funds; (vii) contractually agreeing to reduce fees for Ultra-Short Central Fund and the money market Central Funds; (viii) waiving the Fidelity Advisor funds' contingent deferred sales charge on certain redemptions made through systematic withdrawal programs; and (ix) amending the management contracts for equity and fixed-income funds whose management contracts incorporate a "group fee" structure by adding four new fee "breakpoints" to the group fee rate schedules.
Investment Performance and Compliance. The Board considered whether the fund has operated within its investment objective, as well as its record of compliance with its investment restrictions. It also reviewed the fund's absolute investment performance for each class, as well as the fund's relative investment performance for each class measured against a third-party-sponsored index that reflects the market sector in which the fund invests over multiple periods. The Board noted that FMR does not believe that a meaningful peer group exists against which to compare the fund's performance. The Board also noted that in 2006 FMR implemented changes to the sector fund product line, which included a change to the fund's index. The following charts considered by the Board show, over the one-, three-, and five-year periods ended December 31, 2006, as available, the cumulative total returns of Initial Class and Investor Class of the fund and the cumulative total returns of a third-party-sponsored index ("benchmark").
VIP Industrials Portfolio
The Board stated that the relative investment performance of Initial Class of the fund compared favorably to its benchmark for all the periods shown. The Board considered that the variations in performance between the fund's classes reflect the variations in class expenses, which result in lower performance for the higher expense class.
The Board considered that FMR has taken steps to refocus and strengthen equity research, equity portfolio management, and compliance.
Based on its review, and giving particular weight to the nature and quality of the resources dedicated by the Investment Advisers to maintain and improve relative performance, the Board concluded that the nature, extent, and quality of the services provided to the fund will benefit the fund's shareholders, particularly in light of the Board's view that the fund's shareholders benefit from investing in a fund that is part of a large family of funds offering a variety of investment disciplines and services.
Competitiveness of Management Fee and Total Fund Expenses. The Board considered the fund's management fee and total expenses compared to "mapped groups" of competitive funds and classes. Fidelity creates "mapped groups" by combining similar Lipper investment objective categories that have comparable management fee characteristics. Combining Lipper investment objective categories aids the Board's management fee and total expense comparisons by broadening the competitive group used for comparison and by reducing the number of universes to which various Fidelity funds are compared. The Board also considered supplemental information about how the fund's management fee and total expenses ranked relative to groups based on Lipper classifications, which take into account a fund's market capitalization and style.
Annual Report
Board Approval of Investment Advisory Contracts and Management Fees - continued
The Board considered two proprietary management fee comparisons for the 12-month periods shown in the chart below. The group of Lipper funds used by the Board for management fee comparisons is referred to below as the "Total Mapped Group." The Total Mapped Group comparison focuses on a fund's standing relative to the total universe of comparable funds available to investors, in terms of gross management fees before expense reimbursements or caps. "TMG %" represents the percentage of funds in the Total Mapped Group that had management fees that were lower than the fund's. For example, a TMG % of 8% means that 92% of the funds in the Total Mapped Group had higher management fees than the fund. The "Asset-Size Peer Group" (ASPG) comparison focuses on a fund's standing relative to non-Fidelity funds similar in size to the fund within the Total Mapped Group. The ASPG represents at least 15% of the funds in the Total Mapped Group with comparable asset size and management fee characteristics, subject to a minimum of 50 funds (or all funds in the Total Mapped Group if fewer than 50). Additional information, such as the ASPG quartile in which the fund's management fee ranked, is also included in the chart and considered by the Board.
VIP Industrials Portfolio
The Board noted that the fund's management fee ranked below the median of its Total Mapped Group and below the median of its ASPG for 2006.
Based on its review, the Board concluded that the fund's management fee was fair and reasonable in light of the services that the fund receives and the other factors considered.
In its review of each class's total expenses, the Board considered the fund's management fee as well as other fund or class expenses, as applicable, such as transfer agent fees, pricing and bookkeeping fees, and custodial, legal, and audit fees. The Board also noted the effects of any waivers and reimbursements on fees and expenses. As part of its review, the Board also considered current and historical total expenses of each class of the fund compared to competitive fund median expenses. Each class of the fund is compared to those funds and classes in the Total Mapped Group (used by the Board for management fee comparisons) that have a similar sales load structure.
The Board noted that the total expenses of each class ranked below its competitive median for 2006.
In its review of total expenses, the Board also considered Fidelity fee structures and other information on clients that FMR and its affiliates service in other competitive markets, such as other mutual funds advised or subadvised by FMR or its affiliates, pension plan clients, and other institutional clients.
Based on its review, the Board concluded that the total expenses of each class of the fund were reasonable in light of the services that the fund and its shareholders receive and the other factors considered.
Costs of the Services and Profitability. The Board considered the revenues earned and the expenses incurred by Fidelity in conducting the business of developing, marketing, distributing, managing, administering and servicing the fund and its shareholders. The Board also considered the level of Fidelity's profits in respect of all the Fidelity funds.
Annual Report
On an annual basis, FMR presents to the Board Fidelity's profitability for the fund. Fidelity calculates the profitability for each fund, as well as aggregate profitability for groups of Fidelity funds and all Fidelity funds, using a series of detailed revenue and cost allocation methodologies which originate with the audited books and records of Fidelity. The Audit Committee of the Board reviews any significant changes from the prior year's methodologies.
PricewaterhouseCoopers LLP (PwC), independent registered public accounting firm and auditor to Fidelity and certain Fidelity funds, has been engaged annually by the Board as part of the Board's assessment of the results of Fidelity's profitability analysis. PwC's engagement includes the review and assessment of Fidelity's methodologies used in determining the revenues and expenses attributable to Fidelity's mutual fund business, and completion of agreed-upon procedures surrounding the mathematical accuracy of fund profitability and its conformity to allocation methodologies. After considering PwC's reports issued under the engagement and information provided by Fidelity, the Board believes that while other allocation methods may also be reasonable, Fidelity's profitability methodologies are reasonable in all material respects.
The Board has also reviewed Fidelity's non-fund businesses and any fall-out benefits related to the mutual fund business as well as cases where Fidelity's affiliates may benefit from or be related to the fund's business.
The Board considered the costs of the services provided by and the profits realized by Fidelity in connection with the operation of the fund and determined that the amount of profit is a fair entrepreneurial profit for the management of the fund.
Economies of Scale. The Board considered whether there have been economies of scale in respect of the management of the Fidelity funds, whether the Fidelity funds (including the fund) have appropriately benefited from any such economies of scale, and whether there is potential for realization of any further economies of scale. The Board considered the extent to which the fund will benefit from economies of scale through increased services to the fund, through waivers or reimbursements, or through fee or expense reductions.
The Board recognized that the fund's management contract incorporates a "group fee" structure, which provides for lower group fee rates as total fund assets under FMR's management increase, and for higher group fee rates as total fund assets under FMR's management decrease. FMR determines the group fee rates based on a tiered asset "breakpoint" schedule. In connection with the renewal of the fund's management contract, the Board approved amendments to the fund's management contract that added four new fee breakpoints to the group fee rate schedule for assets under FMR's management above $1,386 billion. The Board considered that the group fee rate declines under both the present and amended schedules, but that under the amended schedule, the group fee rate declines faster as assets under FMR's management exceed $1,386 billion. The Board considered that the group fee is designed to deliver the benefits of economies of scale to fund shareholders when total fund assets increase, even if assets of any particular fund are unchanged or have declined, because some portion of Fidelity's costs are attributable to services provided to all Fidelity funds, and all funds benefit if those costs can be allocated among more assets. The Board concluded that, given the group fee structure, fund shareholders will achieve a certain level of economies of scale as assets under FMR's management increase at the fund complex level, regardless of whether Fidelity achieves any such economies of scale.
The Board further concluded that any potential economies of scale are being shared between fund shareholders and Fidelity in an appropriate manner.
Additional Information Requested by the Board. In order to develop fully the factual basis for consideration of the Fidelity funds' Advisory Contracts, the Board requested and received additional information on several topics, including (i) fund performance trends and actions to be taken by FMR to improve certain funds' overall performance; (ii) Fidelity's portfolio manager compensation structure, including its effects on fund profitability and the extent to which portfolio manager compensation is linked to fund performance; (iii) Fidelity's fee structures; (iv) the funds' sub-advisory arrangements; and (v) accounts managed by Fidelity other than the Fidelity funds.
Based on its evaluation of all of the conclusions noted above, and after considering all material factors, the Board ultimately concluded that the advisory fee structures are fair and reasonable, and that the fund's Advisory Contracts should be renewed.
Annual Report
Investment Adviser
Fidelity Management & Research Company
Boston, MA
Investment Sub-Advisers
FMR Co., Inc.
Fidelity Management & Research (U.K.) Inc.
Fidelity Research & Analysis Company
Fidelity Investments Japan Limited
Fidelity International Investment Advisors
Fidelity International Investment Advisors
(U.K.) Limited
General Distributor
Fidelity Distributors Corporation
Boston, MA
Transfer and Service Agents
Fidelity Investments Institutional Operations Company, Inc.
Boston, MA
Fidelity Service Company, Inc.
Boston, MA
Custodian
JPMorgan Chase Bank
New York, NY
VCYLIC-ANN-0208
1.817361.102
Fidelity® Variable Insurance Products:
International Capital Appreciation Portfolio
Annual Report
December 31, 2007
(2_fidelity_logos) (Registered_Trademark)
Contents
Performance | <Click Here> | How the fund has done over time. |
Management's Discussion | <Click Here> | The manager's review of fund performance, strategy and outlook. |
Shareholder Expense Example | <Click Here> | An example of shareholder expenses. |
Investment Changes | <Click Here> | A summary of major shifts in the fund's investments over
the past six months. |
Investments | <Click Here> | A complete list of the fund's investments with their
market values. |
Financial Statements | <Click Here> | Statements of assets and liabilities, operations, and
changes in net assets, as well as financial highlights. |
Notes | <Click Here> | Notes to the financial statements. |
Report of Independent Registered Public Accounting Firm | <Click Here> | |
Trustees and Officers | <Click Here> | |
Distributions | <Click Here> | |
Board Approval of Investment Advisory Contracts and Management Fees | <Click Here> | |
| | |
To view a fund's proxy voting guidelines and proxy voting record for the 12-month period ended June 30, visit http://www.fidelity.com (search for "proxy voting guidelines") or visit the Securities and Exchange Commission's (SEC) web site at http://www.sec.gov. You may also call 1-877-208-0098 to request a free copy of the proxy voting guidelines.
Fidelity Variable Insurance Products are separate account options which are purchased through a variable insurance contract.
Standard & Poor's, S&P and S&P 500 are registered service marks of The McGraw-Hill Companies, Inc. and have been licensed for use by Fidelity Distributors Corporation.
Other third party marks appearing herein are the property of their respective owners.
All other marks appearing herein are registered or unregistered trademarks or service marks of FMR LLC or an affiliated company.
This report and the financial statements contained herein are submitted for the general information of the shareholders of the fund. This report is not authorized for distribution to prospective investors in the fund unless preceded or accompanied by an effective prospectus.
A fund files its complete schedule of portfolio holdings with the SEC for the first and third quarters of each fiscal year on Form N-Q. Forms N-Q are available on the SEC's web site at http://www.sec.gov. A fund's Forms N-Q may be reviewed and copied at the SEC's Public Reference Room in Washington, DC. Information regarding the operation of the SEC's Public Reference Room may be obtained by calling 1-800-SEC-0330. For a complete list of a fund's portfolio holdings, view the most recent holdings listing, semiannual report, or annual report on Fidelity's web site at http://www.fidelity.com or http://www.advisor.fidelity.com, as applicable.
NOT FDIC INSURED · MAY LOSE VALUE · NO BANK GUARANTEE
Neither the fund nor Fidelity Distributors Corporation is a bank.
Annual Report
Performance: The Bottom Line
Average annual total return reflects the change in the value of an investment, assuming reinvestment of the class' dividend income and capital gains (the profits earned upon the sale of securities that have grown in value, if any) and assuming a constant rate of performance each year. During periods of reimbursement by Fidelity, a fund's total return will be greater than it would be had the reimbursement not occurred. Performance numbers are net of all underlying fund operating expenses, but do not include any insurance charges imposed by your insurance company's separate account. If performance information included the effect of these additional charges, the total returns would have been lower. How a fund did yesterday is no guarantee of how it will do tomorrow.
Average Annual Total Returns
Periods ended December 31, 2007 | Past 1 Year | Life of
FundA |
VIP International Capital Appreciation - Initial Class | 5.17% | 11.38% |
VIP International Capital Appreciation - Service Class | 5.06% | 11.25% |
VIP International Capital Appreciation - Service Class 2 | 4.89% | 11.09% |
VIP International Capital Appreciation - Initial Class R | 5.17% | 11.38% |
VIP International Capital Appreciation - Service Class R | 5.06% | 11.25% |
VIP International Capital Appreciation - Service Class 2R | 4.90% | 11.09% |
VIP International Capital Appreciation - Investor Class R B | 5.07% | 11.26% |
A From December 22, 2004.
B The initial offering of Investor Class R shares took place on July 21, 2005. Returns prior to July 21, 2005 are those of Initial Class R. If Investor Class R's transfer agent fee had been reflected, returns prior to July 21, 2005 would have been lower.
$10,000 Over Life of Fund
Let's say hypothetically that $10,000 was invested in VIP International Capital Appreciation Portfolio - Initial Class on December 22, 2004, when the fund started. The chart shows how the value of your investment would have changed, and also shows how the Morgan Stanley Capital InternationalSM All Country World (MSCI® ACWI) ex USA Index performed over the same period.
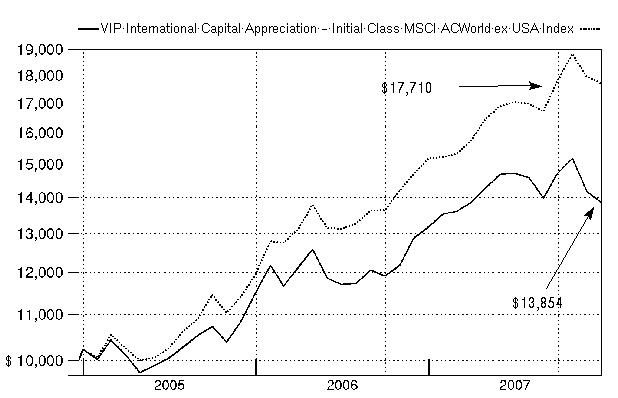
Annual Report
Management's Discussion of Fund Performance
Comments from Sammy Simnegar, who will become Portfolio Manager of VIP International Capital Appreciation Portfolio on
January 1, 2008
U.S. equity markets, as measured by the bellwether Dow Jones Industrial AverageSM and the Standard & Poor's 500SM Index, registered their fifth consecutive year of positive returns in 2007, as the Dow rose 8.88% and the S&P 500® index advanced 5.49%. The tech-heavy NASDAQ Composite® Index did even better, increasing 10.55%. However, credit- and recession-related concerns carved deeply into stock prices late in 2007, pushing some major market measures into negative territory for the year overall, particularly smaller-cap and value-oriented benchmarks. Based largely on a weak U.S. dollar that boosted returns for U.S. investors, the Morgan Stanley Capital InternationalSM Europe, Australasia, and Far East (MSCI® EAFE®) Index - a gauge of developed stock markets outside the United States and Canada - beat most domestic equity measures, gaining 11.33%. Several European countries had outstanding performance, including Finland and Germany, while Australia also did very well. However, fallout from the credit crunch and concerns about export growth tempered U.K. stocks, while fears that Japanese financial companies would become embroiled in the U.S. subprime mortgage crisis contributed to a loss of more than 4% for the Japanese portion of the index. The emerging-markets stock asset class soared 39.78% according to the MSCI Emerging Markets index. The U.S. investment-grade bond market climbed 6.97% as measured by the Lehman Brothers® U.S. Aggregate Index, beating the 2.53% gain for the Merrill Lynch® U.S. High Yield Master II Constrained Index. The emerging-markets bond category shook off a sluggish first half of 2007 to finish the year with a respectable gain of 6.28% as measured by the J.P. Morgan Emerging Markets Bond Index (EMBI) Global, while the Citigroup® Non-U.S. Group of 7 Index - representing the debt performance of major global economies, excluding the United States - rose 13.05%.
VIP International Capital Appreciation Portfolio had disappointing results for the calendar year, trailing well behind the 16.80% return of the MSCI All Country World ex USA Index. (For specific portfolio performance results, please refer to the performance section of this report.) I believe there were three major variables that help explain why the fund underperformed as it did. First, it had a fairly substantial overweighting in Japan, which was the only regional market in the index that had negative performance during the period. Second, the Japanese stocks held in the portfolio - many of which were deeply undervalued names - tended to underperform to an even greater degree than did the Japanese market itself. Lastly, although the fund was overweighted in materials - the index's strongest sector during the period - it held some of the weakest-performing names in that group, which was far and away the biggest detracting factor. Among the stocks that hurt relative performance the worst were North American paper producers Catalyst Paper and AbitibiBowater; South African miner Gold Fields; and Japanese home and garden equipment maker Kubota. On the positive side of the ledger, good stock selection in the automobiles and components segment of consumer discretionary, along with solid picks in energy and an underweighting in the weak financials sector, offset some of the downside, with productive results from such stocks as Saskatchewan Wheat Pool, the Canadian grain handler; CNH Global, the Amsterdam-based maker of farm equipment; and Fiat, the Italian automaker. Favorable currency movements also helped. Several of these stocks were out-of-index holdings, and several were no longer held in the portfolio at period end.
The views expressed above reflect those of the portfolio manager(s) only through the end of the period as stated on the cover of this report and do not necessarily represent the views of Fidelity or any other person in the Fidelity organization. Any such views are subject to change at any time based upon market or other conditions and Fidelity disclaims any responsibility to update such views. These views may not be relied on as investment advice and, because investment decisions for a Fidelity fund are based on numerous factors, may not be relied on as an indication of trading intent on behalf of any Fidelity fund.
Annual Report
Shareholder Expense Example
As a shareholder of the Fund, you incur two types of costs: (1) transaction costs, including redemption fees, and (2) ongoing costs, including management fees, distribution and/or service (12b-1) fees and other Fund expenses. This Example is intended to help you understand your ongoing costs (in dollars) of investing in the Fund and to compare these costs with the ongoing costs of investing in other mutual funds.
The Example is based on an investment of $1,000 invested at the beginning of the period and held for the entire period (July 1, 2007 to December 31, 2007).
Actual Expenses
The first line of the accompanying table for each class of the Fund provides information about actual account values and actual expenses. You may use the information in this line, together with the amount you invested, to estimate the expenses that you paid over the period. Simply divide your account value by $1,000.00 (for example, an $8,600 account value divided by $1,000.00 = 8.6), then multiply the result by the number in the first line for a class of the Fund under the heading entitled "Expenses Paid During Period" to estimate the expenses you paid on your account during this period. The estimate of expenses does not include any fees or other expenses of any variable annuity or variable life insurance product. If they were, the estimate of expenses you paid during the period would be higher, and your ending account value would be lower. In addition, the Fund, as a shareholder in the underlying Fidelity Central Funds, will indirectly bear its pro rata share of the fees and expenses incurred by the underlying Fidelity Central Funds. These fees and expenses are not included in the Fund's annualized expense ratio used to calculate the expense estimate in the table below.
Hypothetical Example for Comparison Purposes
The second line of the accompanying table for each class of the Fund provides information about hypothetical account values and hypothetical expenses based on a Class' actual expense ratio and an assumed rate of return of 5% per year before expenses, which is not the Class' actual return. The hypothetical account values and expenses may not be used to estimate the actual ending account balance or expenses you paid for the period. You may use this information to compare the ongoing costs of investing in the Fund and other funds. To do so, compare this 5% hypothetical example with the 5% hypothetical examples that appear in the shareholder reports of the other funds. The estimate of expenses does not include any fees or other expenses of any variable annuity or variable life insurance product. If they were, the estimate of expenses you paid during the period would be higher, and your ending account value would be lower. In addition, the Fund, as a shareholder in the underlying Fidelity Central Funds, will indirectly bear its pro rata share of the fees and expenses incurred by the underlying Fidelity Central Funds. These fees and expenses are not included in the Fund's annualized expense ratio used to calculate the expense estimate in the table below.
Please note that the expenses shown in the table are meant to highlight your ongoing costs only and do not reflect any transaction costs. Therefore, the second line of the table is useful in comparing ongoing costs only, and will not help you determine the relative total costs of owning different funds. In addition, if these transactional costs were included, your costs would have been higher.
| Beginning
Account Value
July 1, 2007 | Ending
Account Value
December 31, 2007 | Expenses Paid
During Period*
July 1, 2007 to
December 31, 2007 |
Initial Class | | | |
Actual | $ 1,000.00 | $ 941.40 | $ 5.38 |
Hypothetical A | $ 1,000.00 | $ 1,019.66 | $ 5.60 |
Service Class | | | |
Actual | $ 1,000.00 | $ 941.00 | $ 5.87 |
Hypothetical A | $ 1,000.00 | $ 1,019.16 | $ 6.11 |
Service Class 2 | | | |
Actual | $ 1,000.00 | $ 940.20 | $ 6.60 |
Hypothetical A | $ 1,000.00 | $ 1,018.40 | $ 6.87 |
Initial Class R | | | |
Actual | $ 1,000.00 | $ 941.40 | $ 5.38 |
Hypothetical A | $ 1,000.00 | $ 1,019.66 | $ 5.60 |
Service Class R | | | |
Actual | $ 1,000.00 | $ 941.00 | $ 5.87 |
Hypothetical A | $ 1,000.00 | $ 1,019.16 | $ 6.11 |
Service Class 2R | | | |
Actual | $ 1,000.00 | $ 940.30 | $ 6.60 |
Hypothetical A | $ 1,000.00 | $ 1,018.40 | $ 6.87 |
Investor Class R | | | |
Actual | $ 1,000.00 | $ 940.90 | $ 5.92 |
Hypothetical A | $ 1,000.00 | $ 1,019.11 | $ 6.16 |
A 5% return per year before expenses
* Expenses are equal to each Class' annualized expense ratio (shown in the table below); multiplied by the average account value over the period, multiplied by 184/365 (to reflect the one-half year period).
Annual Report
Shareholder Expense Example - continued
| Annualized
Expense Ratio |
Initial Class | 1.10% |
Service Class | 1.20% |
Service Class 2 | 1.35% |
Initial Class R | 1.10% |
Service Class R | 1.20% |
Service Class 2R | 1.35% |
Investor Class R | 1.21% |
Annual Report
Investment Changes
Geographic Diversification (% of fund's net assets) |
As of December 31, 2007 |
| Japan | 18.0% | |
 | United Kingdom | 12.3% | |
| Germany | 11.0% | |
 | United States of America | 8.1% | |
| Switzerland | 7.5% | |
 | Canada | 6.5% | |
| France | 4.0% | |
 | Spain | 3.2% | |
| Cayman Islands | 2.6% | |
| Other | 26.8% | |

Percentages are adjusted for the effect of futures contracts, if applicable. |
|
As of June 30, 2007 |
| United States of America | 20.6% | |
| Japan | 20.6% | |
| Canada | 19.8% | |
| Hong Kong | 5.7% | |
| Netherlands | 4.3% | |
| South Africa | 4.0% | |
| Germany | 3.9% | |
| Switzerland | 2.7% | |
| Argentina | 2.3% | |
| Other | 16.1% | |

Percentages are adjusted for the effect of futures contracts, if applicable. |
Asset Allocation |
| % of fund's
net assets | % of fund's net assets
6 months ago |
Stocks | 94.4 | 86.1 |
Bonds | 0.0 | 2.9 |
Short-Term Investments and Net Other Assets | 5.6 | 11.0 |
Top Ten Stocks as of December 31, 2007 |
| % of fund's
net assets | % of fund's net assets
6 months ago |
E.ON AG (Germany, Electric Utilities) | 3.3 | 2.6 |
Shinsei Bank Ltd. (Japan, Commercial Banks) | 2.8 | 2.2 |
Actelion Ltd. (Reg.) (Switzerland, Biotechnology) | 2.0 | 1.7 |
Saskatchewan Wheat Pool, Inc. (Canada, Food Products) | 2.0 | 2.7 |
Takeda Pharmaceutical Co. Ltd. (Japan, Pharmaceuticals) | 1.9 | 3.8 |
SFCG Co. Ltd. (Japan, Consumer Finance) | 1.8 | 1.5 |
Royal Dutch Shell PLC Class A (United Kingdom, Oil, Gas & Consumable Fuels) | 1.7 | 0.0 |
UBS AG (NY Shares) (Switzerland, Capital Markets) | 1.6 | 0.0 |
Vodafone Group PLC sponsored ADR (United Kingdom, Wireless Telecommunication Services) | 1.6 | 0.0 |
Banco Santander SA (Spain, Commercial Banks) | 1.5 | 0.0 |
| 20.2 | |
Market Sectors as of December 31, 2007 |
| % of fund's
net assets | % of fund's net assets
6 months ago |
Financials | 24.9 | 14.9 |
Materials | 11.4 | 20.0 |
Health Care | 8.6 | 10.0 |
Energy | 8.6 | 8.9 |
Industrials | 8.0 | 9.7 |
Consumer Discretionary | 7.5 | 6.8 |
Consumer Staples | 7.1 | 10.7 |
Telecommunication Services | 6.7 | 1.7 |
Information Technology | 6.1 | 0.8 |
Utilities | 5.5 | 2.6 |
Annual Report
Investments December 31, 2007
Showing Percentage of Net Assets
Common Stocks - 94.0% |
| Shares | | Value |
Argentina - 0.3% |
Inversiones y Representaciones SA sponsored GDR (a) | 13,200 | | $ 192,192 |
Australia - 1.9% |
ABB Grain Ltd. | 279 | | 2,065 |
Babcock & Brown Ltd. | 9,935 | | 236,261 |
Commonwealth Bank of Australia | 7,536 | | 390,106 |
CSL Ltd. | 8,196 | | 261,024 |
Leighton Holdings Ltd. | 4,541 | | 243,421 |
Macquarie Group Ltd. | 4,045 | | 269,978 |
Newcrest Mining Ltd. | 1 | | 29 |
TOTAL AUSTRALIA | | 1,402,884 |
Austria - 0.3% |
voestalpine AG | 3,300 | | 238,152 |
Brazil - 2.2% |
Companhia Vale do Rio Doce (PN-A) sponsored ADR | 16,500 | | 461,670 |
MRV Engenharia e Participacoes SA | 8,500 | | 181,699 |
Petroleo Brasileiro SA - Petrobras (PN) sponsored ADR (non-vtg.) | 5,400 | | 519,588 |
Redecard SA | 11,000 | | 179,213 |
Uniao de Bancos Brasileiros SA (Unibanco) GDR | 2,200 | | 307,208 |
TOTAL BRAZIL | | 1,649,378 |
Canada - 6.5% |
Addax Petroleum, Inc. | 8,000 | | 345,831 |
Canadian Natural Resources Ltd. | 4,400 | | 321,425 |
Canadian Western Bank, Edmonton | 8,600 | | 271,360 |
Canfor Corp. | 13,400 | | 117,741 |
European Goldfields Ltd. (a) | 48,700 | | 268,609 |
IAMGOLD Corp. | 109,900 | | 894,863 |
Research In Motion Ltd. (a) | 3,000 | | 340,200 |
Saputo, Inc. | 7,900 | | 237,187 |
Saskatchewan Wheat Pool, Inc. (a)(e) | 109,800 | | 1,473,136 |
Suncor Energy, Inc. | 3,300 | | 358,415 |
Uranium One, Inc. (a) | 19,400 | | 172,414 |
TOTAL CANADA | | 4,801,181 |
Cayman Islands - 2.6% |
Agile Property Holdings Ltd. | 124,000 | | 225,828 |
Apex Silver Mines Ltd. (a) | 22,000 | | 335,280 |
Chaoda Modern Agriculture (Holdings) Ltd. | 214,000 | | 193,769 |
Hutchison Telecommunications International Ltd. | 634,000 | | 952,980 |
Lee & Man Paper Manufacturing Ltd. | 50,400 | | 221,390 |
TOTAL CAYMAN ISLANDS | | 1,929,247 |
China - 0.9% |
China Construction Bank Corp. (H Shares) | 379,000 | | 321,298 |
|
| Shares | | Value |
China Cosco Holdings Co. Ltd.
(H Shares) | 35,500 | | $ 98,117 |
China Resources Land Ltd. | 126,000 | | 278,596 |
TOTAL CHINA | | 698,011 |
Cyprus - 0.4% |
Marfin Popular Bank Public Co. | 19,700 | | 261,627 |
Czech Republic - 1.0% |
Ceske Energeticke Zavody AS | 3,400 | | 254,818 |
Philip Morris CR AS | 1,150 | | 494,539 |
TOTAL CZECH REPUBLIC | | 749,357 |
Denmark - 0.4% |
Vestas Wind Systems AS (a) | 2,400 | | 259,284 |
Finland - 1.3% |
Nokia Corp. sponsored ADR | 25,700 | | 986,623 |
France - 4.0% |
AXA SA | 12,900 | | 512,259 |
Bouygues SA | 3,200 | | 266,195 |
Electricite de France | 2,100 | | 249,715 |
Eutelsat Communications | 2,200 | | 65,337 |
Renault SA | 2,600 | | 368,099 |
Sanofi-Aventis sponsored ADR | 13,571 | | 617,888 |
Suez SA (France) | 6,600 | | 452,100 |
Vivendi | 8,960 | | 410,332 |
TOTAL FRANCE | | 2,941,925 |
Germany - 11.0% |
Allianz AG (Reg.) | 4,000 | | 850,000 |
Bayer AG | 4,800 | | 436,800 |
Beiersdorf AG | 2,800 | | 216,575 |
DaimlerChrysler AG | 7,900 | | 755,477 |
Deutsche Boerse AG | 1,600 | | 316,982 |
E.ON AG | 11,500 | | 2,451,584 |
Fresenius AG | 2,500 | | 204,316 |
K&S AG | 1,000 | | 237,517 |
Lanxess AG | 9,200 | | 451,130 |
MAN AG | 1,600 | | 265,728 |
RWE AG | 3,100 | | 434,317 |
Siemens AG sponsored ADR | 5,700 | | 896,952 |
SolarWorld AG | 3,800 | | 231,534 |
United Internet AG | 9,000 | | 218,691 |
Wacker Chemie AG | 800 | | 230,819 |
TOTAL GERMANY | | 8,198,422 |
Greece - 1.0% |
Coca-Cola Hellenic Bottling Co. SA (Bearer) | 6,600 | | 285,108 |
National Bank of Greece SA | 5,350 | | 366,810 |
Public Power Corp. of Greece | 2,300 | | 120,838 |
TOTAL GREECE | | 772,756 |
Hong Kong - 1.1% |
CNPC (Hong Kong) Ltd. | 480,000 | | 307,191 |
Common Stocks - continued |
| Shares | | Value |
Hong Kong - continued |
Hong Kong Exchanges & Clearing Ltd. | 10,500 | | $ 297,880 |
Li & Fung Ltd. | 56,000 | | 226,238 |
TOTAL HONG KONG | | 831,309 |
Hungary - 0.3% |
OTP Bank Ltd. | 4,900 | | 248,434 |
India - 1.3% |
Bharti Airtel Ltd. (a) | 7,050 | | 178,267 |
Housing Development Finance Corp. Ltd. | 2,666 | | 194,698 |
Reliance Industries Ltd. | 3,538 | | 258,825 |
Satyam Computer Services Ltd. | 16,095 | | 184,620 |
Sun Pharmaceutical Industries Ltd. | 5,894 | | 180,051 |
TOTAL INDIA | | 996,461 |
Israel - 1.1% |
Check Point Software Technologies Ltd. (a) | 12,200 | | 267,912 |
Israel Chemicals Ltd. | 19,600 | | 249,117 |
Partner Communications Co. Ltd. ADR | 13,100 | | 289,248 |
TOTAL ISRAEL | | 806,277 |
Italy - 0.4% |
Fiat SpA | 10,200 | | 263,406 |
Japan - 18.0% |
Aioi Insurance Co. Ltd. | 21,000 | | 99,295 |
Canon, Inc. | 11,300 | | 517,879 |
Denso Corp. | 5,000 | | 203,836 |
Ibiden Co. Ltd. | 2,800 | | 193,964 |
Japan Tobacco, Inc. | 37 | | 219,164 |
Konica Minolta Holdings, Inc. | 10,500 | | 184,406 |
Kubota Corp. | 35,000 | | 235,956 |
Makita Corp. | 4,100 | | 171,716 |
Marubeni Corp. | 15,000 | | 105,294 |
Millea Holdings, Inc. | 28,163 | | 937,828 |
Mitsubishi Corp. | 5,500 | | 149,123 |
Mitsubishi Electric Corp. | 20,000 | | 207,515 |
Mitsubishi Estate Co. Ltd. | 10,000 | | 238,677 |
Mitsui & Co. Ltd. | 7,000 | | 146,441 |
Mitsui Fudosan Co. Ltd. | 10,000 | | 216,051 |
Mitsui Marine & Fire Insurance Co. Ltd. | 90,000 | | 872,956 |
NGK Insulators Ltd. | 7,000 | | 188,016 |
Nikon Corp. | 5,000 | | 170,397 |
Nintendo Co. Ltd. | 500 | | 296,200 |
Nissin Healthcare Food Service Co. | 5,200 | | 59,442 |
ORIX Corp. | 1,210 | | 203,872 |
Parco Co. Ltd. | 54,300 | | 675,485 |
Seino Holdings Co. Ltd. | 24,200 | | 163,128 |
SFCG Co. Ltd. | 9,460 | | 1,308,531 |
Shinsei Bank Ltd. | 582,000 | | 2,116,733 |
Sumitomo Metal Mining Co. Ltd. | 11,000 | | 186,305 |
Sumitomo Mitsui Financial Group, Inc. | 59 | | 437,399 |
Takeda Pharmaceutical Co. Ltd. | 24,000 | | 1,404,615 |
|
| Shares | | Value |
Terumo Corp. | 3,300 | | $ 172,347 |
Tokyo Steel Manufacturing Co. Ltd. | 12,400 | | 137,356 |
Toyota Motor Corp. sponsored ADR | 9,100 | | 966,147 |
USS Co. Ltd. | 3,820 | | 237,662 |
TOTAL JAPAN | | 13,423,736 |
Korea (South) - 1.6% |
Daewoo Shipbuilding & Marine Engineering Co. Ltd. | 1,720 | | 94,810 |
Hyundai Heavy Industries Co. Ltd. | 260 | | 122,904 |
Kookmin Bank | 2,820 | | 207,862 |
KT&G Corp. | 2,110 | | 179,646 |
LG.Philips LCD Co. Ltd. sponsored ADR (a) | 15,500 | | 402,690 |
SK Energy Co. Ltd. | 1,010 | | 195,289 |
TOTAL KOREA (SOUTH) | | 1,203,201 |
Luxembourg - 0.6% |
Evraz Group SA GDR | 2,700 | | 209,250 |
Oriflame Cosmetics SA unit | 4,200 | | 268,273 |
TOTAL LUXEMBOURG | | 477,523 |
Malaysia - 0.3% |
KNM Group Bhd | 105,300 | | 245,180 |
Mexico - 1.1% |
America Movil SAB de CV Series L sponsored ADR | 6,100 | | 374,479 |
Desarrolladora Homex Sab de CV (a) | 34,300 | | 282,702 |
Grupo Mexico SA de CV Series B | 30,077 | | 188,849 |
TOTAL MEXICO | | 846,030 |
Netherlands - 1.4% |
Heineken NV (Bearer) | 3,900 | | 249,210 |
Koninklijke KPN NV | 19,900 | | 361,283 |
Koninklijke Philips Electronics NV | 9,800 | | 418,950 |
TOTAL NETHERLANDS | | 1,029,443 |
Norway - 1.0% |
Aker Kvaerner ASA | 8,750 | | 232,657 |
Petroleum Geo-Services ASA | 8,100 | | 235,123 |
Yara International ASA | 5,200 | | 240,648 |
TOTAL NORWAY | | 708,428 |
Russia - 1.7% |
Lukoil Oil Co. sponsored ADR | 3,400 | | 293,420 |
OAO Gazprom sponsored ADR | 11,500 | | 647,450 |
Sberbank (Savings Bank of the Russian Federation) GDR | 628 | | 340,023 |
TOTAL RUSSIA | | 1,280,893 |
Singapore - 0.2% |
Keppel Corp. Ltd. | 15,000 | | 135,280 |
South Africa - 2.1% |
African Bank Investments Ltd. | 61,800 | | 297,250 |
Bidvest Group Ltd. | 7,900 | | 138,750 |
Common Stocks - continued |
| Shares | | Value |
South Africa - continued |
Exxaro Resources Ltd. | 22,982 | | $ 346,527 |
Gold Fields Ltd. sponsored ADR | 23,500 | | 333,700 |
MTN Group Ltd. | 16,800 | | 313,575 |
Murray & Roberts Holdings Ltd. | 10,000 | | 148,669 |
TOTAL SOUTH AFRICA | | 1,578,471 |
Spain - 3.2% |
Banco Santander SA | 51,600 | | 1,111,464 |
Grifols SA | 11,896 | | 267,533 |
Grupo Acciona SA | 800 | | 253,177 |
Telefonica SA | 24,000 | | 780,720 |
TOTAL SPAIN | | 2,412,894 |
Sweden - 1.0% |
Alfa Laval AB | 4,100 | | 230,814 |
Swedish Match Co. | 10,000 | | 238,950 |
TeliaSonera AB | 29,000 | | 271,351 |
TOTAL SWEDEN | | 741,115 |
Switzerland - 7.5% |
ABB Ltd. (Reg.) | 18,552 | | 533,986 |
Actelion Ltd. (Reg.) (a) | 32,909 | | 1,511,439 |
Roche Holding AG (participation certificate) | 3,956 | | 675,685 |
Swiss Life Holding | 963 | | 240,474 |
Syngenta AG (Switzerland) | 1,432 | | 362,726 |
The Swatch Group AG (Reg.) | 6,805 | | 401,407 |
UBS AG (NY Shares) | 25,500 | | 1,173,000 |
Zurich Financial Services AG (Reg.) | 2,413 | | 707,952 |
TOTAL SWITZERLAND | | 5,606,669 |
Taiwan - 0.7% |
Acer, Inc. | 123,000 | | 240,842 |
AU Optronics Corp. sponsored ADR | 13,200 | | 253,440 |
Taiwan Mobile Co. Ltd. | 9,000 | | 12,072 |
TOTAL TAIWAN | | 506,354 |
Turkey - 0.8% |
Tupras-Turkiye Petrol Rafinerileri AS | 10,000 | | 293,299 |
Turkiye Garanti Bankasi AS | 29,600 | | 266,153 |
TOTAL TURKEY | | 559,452 |
United Kingdom - 12.3% |
BAE Systems PLC | 39,800 | | 393,802 |
BG Group PLC | 21,500 | | 491,275 |
British American Tobacco PLC | 14,100 | | 553,848 |
Cairn Energy PLC (a) | 1,900 | | 116,044 |
International Power PLC | 27,300 | | 251,843 |
Lloyds TSB Group PLC | 49,800 | | 467,021 |
Man Group plc | 30,050 | | 339,721 |
Marks & Spencer Group PLC | 23,800 | | 264,807 |
Meggitt PLC | 43,800 | | 289,572 |
Reckitt Benckiser Group PLC | 5,200 | | 301,063 |
Rio Tinto PLC sponsored ADR | 2,300 | | 965,770 |
|
| Shares | | Value |
Royal Dutch Shell PLC Class A | 30,600 | | $ 1,283,438 |
Shire PLC | 14,000 | | 321,767 |
Sibir Energy PLC | 8,200 | | 93,680 |
Standard Chartered PLC | 19,300 | | 707,104 |
Tesco PLC | 50,200 | | 476,009 |
Vedanta Resources PLC | 5,400 | | 219,515 |
Vodafone Group PLC sponsored ADR | 31,100 | | 1,160,652 |
Xstrata PLC | 5,900 | | 416,146 |
TOTAL UNITED KINGDOM | | 9,113,077 |
United States of America - 2.5% |
AbitibiBowater, Inc. (d) | 36,661 | | 755,583 |
Apple, Inc. (a) | 1,300 | | 257,504 |
Synthes, Inc. | 6,536 | | 810,872 |
TOTAL UNITED STATES OF AMERICA | | 1,823,959 |
TOTAL COMMON STOCKS (Cost $69,597,475) | 69,918,631 |
Nonconvertible Preferred Stocks - 0.4% |
| | | |
Italy - 0.4% |
Istituto Finanziario Industriale SpA (IFI) (a)
(Cost $379,929) | 9,600 | | 326,439 |
Money Market Funds - 7.0% |
| | | |
Fidelity Cash Central Fund, 4.58% (b) | 4,020,226 | | 4,020,226 |
Fidelity Securities Lending Cash Central Fund, 4.65% (b)(c) | 1,199,356 | | 1,199,356 |
TOTAL MONEY MARKET FUNDS (Cost $5,219,582) | 5,219,582 |
TOTAL INVESTMENT PORTFOLIO - 101.4% (Cost $75,196,986) | | 75,464,652 |
NET OTHER ASSETS - (1.4)% | | (1,063,363) |
NET ASSETS - 100% | $ 74,401,289 |
Legend |
(a) Non-income producing |
(b) Affiliated fund that is available only to investment companies and other accounts managed by Fidelity Investments. The rate quoted is the annualized seven-day yield of the fund at period end. A complete unaudited listing of the fund's holdings as of its most recent quarter end is available upon request. |
(c) Investment made with cash collateral received from securities on loan. |
(d) Security or a portion of the security is on loan at period end. |
(e) Security exempt from registration under Rule 144A of the Securities Act of 1933. These securities may be resold in transactions exempt from registration, normally to qualified institutional buyers. At the end of the period, the value of these securities amounted to $1,473,136 or 2.0% of net assets. |
Affiliated Central Funds |
Information regarding fiscal year to date income earned by the Fund from investments in Fidelity Central Funds is as follows: |
Fund | Income earned |
Fidelity Cash Central Fund | $ 376,533 |
Fidelity Securities Lending Cash Central Fund | 35,702 |
Total | $ 412,235 |
Income Tax Information |
The fund intends to elect to defer to its fiscal year ending December 31, 2008 approximately $4,337,018 of losses recognized during the period November 1, 2007 to December 31, 2007. |
See accompanying notes which are an integral part of the financial statements.
Annual Report
Financial Statements
Statement of Assets and Liabilities
| December 31, 2007 |
Assets | | |
Investment in securities, at value (including securities loaned of $1,149,708) - See accompanying schedule: Unaffiliated issuers (cost $69,977,404) | $ 70,245,070 | |
Fidelity Central Funds (cost $5,219,582) | 5,219,582 | |
Total Investments (cost $75,196,986) | | $ 75,464,652 |
Cash | | 570,385 |
Foreign currency held at value (cost $471,273) | | 471,273 |
Receivable for investments sold | | 13,450,758 |
Receivable for fund shares sold | | 5,210 |
Dividends receivable | | 53,102 |
Distributions receivable from Fidelity Central Funds | | 34,769 |
Prepaid expenses | | 250 |
Other receivables | | 6,197 |
Total assets | | 90,056,596 |
| | |
Liabilities | | |
Payable for investments purchased | $ 14,179,337 | |
Payable for fund shares redeemed | 159,756 | |
Accrued management fee | 44,896 | |
Distribution fees payable | 299 | |
Other affiliated payables | 11,145 | |
Other payables and accrued expenses | 60,518 | |
Collateral on securities loaned, at value | 1,199,356 | |
Total liabilities | | 15,655,307 |
| | |
Net Assets | | $ 74,401,289 |
Net Assets consist of: | | |
Paid in capital | | $ 78,660,817 |
Distributions in excess of net investment income | | (2,078) |
Accumulated undistributed net realized gain (loss) on investments and foreign currency transactions | | (4,507,039) |
Net unrealized appreciation (depreciation) on investments and assets and liabilities in foreign currencies | | 249,589 |
Net Assets | | $ 74,401,289 |
Statement of Assets and Liabilities - continued
| December 31, 2007 |
Initial Class:
Net Asset Value, offering price and redemption price per share ($1,409,020 ÷ 123,197 shares) | | $ 11.44 |
| | |
Service Class:
Net Asset Value, offering price and redemption price per share ($414,251 ÷ 36,237 shares) | | $ 11.43 |
| | |
Service Class 2:
Net Asset Value, offering price and redemption price per share ($549,771 ÷ 48,108 shares) | | $ 11.43 |
| | |
Initial Class R:
Net Asset Value, offering price and redemption price per share ($32,344,785 ÷ 2,827,355 shares) | | $ 11.44 |
| | |
Service Class R:
Net Asset Value, offering price and redemption price per share ($414,251 ÷ 36,237 shares) | | $ 11.43 |
| | |
Service Class 2R:
Net Asset Value, offering price and redemption price per share ($549,827 ÷ 48,111 shares) | | $ 11.43 |
| | |
Investor Class R:
Net Asset Value, offering price and redemption price per share ($38,719,384 ÷ 3,393,838 shares) | | $ 11.41 |
See accompanying notes which are an integral part of the financial statements.
Annual Report
Statement of Operations
| Year ended December 31, 2007 |
Investment Income | | |
Dividends | | $ 833,047 |
Special dividends | | 94,302 |
Interest | | 19,005 |
Income from Fidelity Central Funds | | 412,235 |
| | 1,358,589 |
Less foreign taxes withheld | | (89,266) |
Total income | | 1,269,323 |
| | |
Expenses | | |
Management fee | $ 475,959 | |
Transfer agent fees | 92,264 | |
Distribution fees | 3,706 | |
Accounting and security lending fees | 35,326 | |
Custodian fees and expenses | 93,458 | |
Independent trustees' compensation | 225 | |
Audit | 70,907 | |
Legal | 7,299 | |
Miscellaneous | 10,195 | |
Total expenses before reductions | 789,339 | |
Expense reductions | (27,888) | 761,451 |
Net investment income (loss) | | 507,872 |
Realized and Unrealized Gain (Loss) Net realized gain (loss) on: | | |
Investment securities: | | |
Unaffiliated issuers (net of foreign taxes of $42,298) | 4,821,806 | |
Foreign currency transactions | 290,818 | |
Total net realized gain (loss) | | 5,112,624 |
Change in net unrealized appreciation (depreciation) on: Investment securities (net of increase in deferred foreign taxes of $2,381) | (4,336,014) | |
Assets and liabilities in foreign currencies | (16,820) | |
Total change in net unrealized appreciation (depreciation) | | (4,352,834) |
Net gain (loss) | | 759,790 |
Net increase (decrease) in net assets resulting from operations | | $ 1,267,662 |
Statement of Changes in Net Assets
| Year ended
December 31, 2007 | Year ended
December 31, 2006 |
Increase (Decrease) in Net Assets | | |
Operations | | |
Net investment income (loss) | $ 507,872 | $ 325,722 |
Net realized gain (loss) | 5,112,624 | 1,311,750 |
Change in net unrealized appreciation (depreciation) | (4,352,834) | 3,055,530 |
Net increase (decrease) in net assets resulting from operations | 1,267,662 | 4,693,002 |
Distributions to shareholders from net investment income | (488,571) | (324,160) |
Distributions to shareholders from net realized gain | (9,900,180) | (1,106,887) |
Total distributions | (10,388,751) | (1,431,047) |
Share transactions - net increase (decrease) | 38,585,498 | 20,509,608 |
Redemption fees | 18,995 | 15,654 |
Total increase (decrease) in net assets | 29,483,404 | 23,787,217 |
| | |
Net Assets | | |
Beginning of period | 44,917,885 | 21,130,668 |
End of period (including distributions in excess of net investment income of $2,078 and undistributed net investment income of $1,561, respectively) | $ 74,401,289 | $ 44,917,885 |
See accompanying notes which are an integral part of the financial statements.
Annual Report
Financial Highlights - Initial Class
Years ended December 31, | 2007 | 2006 | 2005 | 2004 I |
Selected Per-Share Data | | | | |
Net asset value, beginning of period | $ 12.68 | $ 11.46 | $ 10.24 | $ 10.00 |
Income from Investment Operations | | | | |
Net investment income (loss) E | .11 H | .11 | .06 | - |
Net realized and unrealized gain (loss) | .53 | 1.54 | 1.21 | .24 |
Total from investment operations | .64 | 1.65 | 1.27 | .24 |
Distributions from net investment income | (.09) | (.10) | (.02) | - |
Distributions from net realized gain | (1.79) | (.34) | (.02) | - |
Total distributions | (1.88) | (.43) M | (.05) L | - |
Redemption fees added to paid in capitalE | - K | - K | - K | - |
Net asset value, end of period | $ 11.44 | $ 12.68 | $ 11.46 | $ 10.24 |
Total Return B,C,D | 5.17% | 14.49% | 12.37% | 2.40% |
Ratios to Average Net Assets F,J | | | | |
Expenses before reductions | 1.20% | 1.80% | 3.55% | 43.27% A |
Expenses net of fee waivers, if any | 1.10% | 1.10% | 1.10% | 1.10% A |
Expenses net of all reductions | 1.07% | 1.00% | .91% | .92% A |
Net investment income (loss) | .82% H | .95% | .53% | .80% A |
Supplemental Data | | | | |
Net assets, end of period (000 omitted) | $ 1,409 | $ 1,357 | $ 9,367 | $ 307 |
Portfolio turnover rate G | 224% | 185% | 176% | 52% A |
A Annualized B Total returns for periods of less than one year are not annualized. C Total returns do not reflect charges attributable to your insurance company's separate account. Inclusion of these charges would reduce the total returns shown. D Total returns would have been lower had certain expenses not been reduced during the periods shown. E Calculated based on average shares outstanding during the period. F Fees and expenses of the underlying Fidelity Central Funds are not included in the Fund's expense ratio. The Fund indirectly bears its proportionate share of the expenses of any underlying Fidelity Central Funds. G Amount does not include the portfolio activity of any underlying Fidelity Central Funds. H Investment income per share reflects a special dividend which amounted to $.02 per share. Excluding the special dividend, the ratio of net investment income (loss) to average net assets would have been .68%. I For the period December 22, 2004 (commencement of operations) to December 31, 2004. J Expense ratios reflect operating expenses of the class. Expenses before reductions do not reflect amounts reimbursed by the investment adviser or reductions from brokerage service arrangements or other expense offset arrangements and do not represent the amount paid by the class during periods when reimbursements or reductions occur. Expenses net of fee waivers reflect expenses after reimbursement by the investment adviser but prior to reductions from brokerage service arrangements or other expense offset arrangements. Expenses net of all reductions represent the net expenses paid by the class. K Amount represents less than $.01 per share. L Total distributions of $.05 per share is comprised of distributions from net investment income of $.022 and distributions from net realized gain of $.023 per share. M Total distributions of $.43 per share is comprised of distributions from net investment income of $.095 and distributions from net realized gain of $.335 per share. |
Financial Highlights - Service Class
Years ended December 31, | 2007 | 2006 | 2005 | 2004 I |
Selected Per-Share Data | | | | |
Net asset value, beginning of period | $ 12.67 | $ 11.46 | $ 10.24 | $ 10.00 |
Income from Investment Operations | | | | |
Net investment income (loss) E | .10H | .10 | .10 | -K |
Net realized and unrealized gain (loss) | .53 | 1.53 | 1.16 | .24 |
Total from investment operations | .63 | 1.63 | 1.26 | .24 |
Distributions from net investment income | (.08) | (.08) | (.01) | - |
Distributions from net realized gain | (1.79) | (.34) | (.02) | - |
Total distributions | (1.87) | (.42) M | (.04) L | - |
Redemption fees added to paid in capitalE | - K | - K | - K | - |
Net asset value, end of period | $ 11.43 | $ 12.67 | $ 11.46 | $ 10.24 |
Total Return B,C,D | 5.06% | 14.30% | 12.27% | 2.40% |
Ratios to Average Net Assets F,J | | | | |
Expenses before reductions | 1.20% | 1.62% | 4.35% | 43.36% A |
Expenses net of fee waivers, if any | 1.20% | 1.20% | 1.20% | 1.20% A |
Expenses net of all reductions | 1.16% | 1.10% | 1.01% | 1.01% A |
Net investment income (loss) | .72% H | .85% | .98% | .71% A |
Supplemental Data | | | | |
Net assets, end of period (000 omitted) | $ 414 | $ 394 | $ 345 | $ 307 |
Portfolio turnover rate G | 224% | 185% | 176% | 52% A |
A Annualized B Total returns for periods of less than one year are not annualized. C Total returns do not reflect charges attributable to your insurance company's separate account. Inclusion of these charges would reduce the total returns shown. D Total returns would have been lower had certain expenses not been reduced during the periods shown. E Calculated based on average shares outstanding during the period. F Fees and expenses of the underlying Fidelity Central Funds are not included in the Fund's expense ratio. The Fund indirectly bears its proportionate share of the expenses of any underlying Fidelity Central Funds. G Amount does not include the portfolio activity of any underlying Fidelity Central Funds. H Investment income per share reflects a special dividend which amounted to $.02 per share. Excluding the special dividend, the ratio of net investment income (loss) to average net assets would have been .58%. I For the period December 22, 2004 (commencement of operations) to December 31, 2004. J Expense ratios reflect operating expenses of the class. Expenses before reductions do not reflect amounts reimbursed by the investment adviser or reductions from brokerage service arrangements or other expense offset arrangements and do not represent the amount paid by the class during periods when reimbursements or reductions occur. Expenses net of fee waivers reflect expenses after reimbursement by the investment adviser but prior to reductions from brokerage service arrangements or other expense offset arrangements. Expenses net of all reductions represent the net expenses paid by the class. K Amount represents less than $.01 per share. L Total distributions of $.04 per share is comprised of distributions from net investment income of $.012 and distributions from net realized gain of $.023 per share. M Total distributions of $.42 per share is comprised of distributions from net investment income of $.084 and distributions from net realized gain of $.335 per share. |
See accompanying notes which are an integral part of the financial statements.
Annual Report
Financial Highlights - Service Class 2
Years ended December 31, | 2007 | 2006 | 2005 | 2004 I |
Selected Per-Share Data | | | | |
Net asset value, beginning of period | $ 12.67 | $ 11.46 | $ 10.24 | $ 10.00 |
Income from Investment Operations | | | | |
Net investment income (loss) E | .08 H | .08 | .09 | - |
Net realized and unrealized gain (loss) | .53 | 1.53 | 1.15 | .24 |
Total from investment operations | .61 | 1.61 | 1.24 | .24 |
Distributions from net investment income | (.06) | (.07) | - | - |
Distributions from net realized gain | (1.79) | (.34) | (.02) | - |
Total distributions | (1.85) | (.40) M | (.02) L | - |
Redemption fees added to paid in capital E | - K | - K | - K | - |
Net asset value, end of period | $ 11.43 | $ 12.67 | $ 11.46 | $ 10.24 |
Total Return B,C,D | 4.89% | 14.14% | 12.12% | 2.40% |
Ratios to Average Net Assets F,J | | | | |
Expenses before reductions | 1.41% | 1.77% | 4.50% | 43.51% A |
Expenses net of fee waivers, if any | 1.35% | 1.35% | 1.35% | 1.35% A |
Expenses net of all reductions | 1.32% | 1.25% | 1.16% | 1.17% A |
Net investment income (loss) | .57% H | .70% | .83% | .55% A |
Supplemental Data | | | | |
Net assets, end of period (000 omitted) | $ 550 | $ 524 | $ 459 | $ 410 |
Portfolio turnover rate G | 224% | 185% | 176% | 52% A |
A Annualized B Total returns for periods of less than one year are not annualized. C Total returns do not reflect charges attributable to your insurance company's separate account. Inclusion of these charges would reduce the total returns shown. D Total returns would have been lower had certain expenses not been reduced during the periods shown. E Calculated based on average shares outstanding during the period. F Fees and expenses of the underlying Fidelity Central Funds are not included in the Fund's expense ratio. The Fund indirectly bears its proportionate share of the expenses of any underlying Fidelity Central Funds. G Amount does not include the portfolio activity of any underlying Fidelity Central Funds. H Investment income per share reflects a special dividend which amounted to $.02 per share. Excluding the special dividend, the ratio of net investment income (loss) to average net assets would have been .43%. I For the period December 22, 2004 (commencement of operations) to December 31, 2004 J Expense ratios reflect operating expenses of the class. Expenses before reductions do not reflect amounts reimbursed by the investment adviser or reductions from brokerage service arrangements or other expense offset arrangements and do not represent the amount paid by the class during periods when reimbursements or reductions occur. Expenses net of fee waivers reflect expenses after reimbursement by the investment adviser but prior to reductions from brokerage service arrangements or other expense offset arrangements. Expenses net of all reductions represent the net expenses paid by the class. K Amount represents less than $.01 per share. L Total distributions of $.02 per share is comprised of distributions from net investment income of $.00 and distributions from net realized gain of $.02 per share. M Total distributions of $.40 per share is comprised of distributions from net investment income of $.066 and distributions from net realized gain of $.335 per share. |
Financial Highlights - Initial Class R
Years ended December 31, | 2007 | 2006 | 2005 | 2004 I |
Selected Per-Share Data | | | | |
Net asset value, beginning of period | $ 12.68 | $ 11.46 | $ 10.24 | $ 10.00 |
Income from Investment Operations | | | | |
Net investment income (loss) E | .11 H | .11 | .11 | - K |
Net realized and unrealized gain (loss) | .53 | 1.54 | 1.16 | .24 |
Total from investment operations | .64 | 1.65 | 1.27 | .24 |
Distributions from net investment income | (.09) | (.10) | (.02) | - |
Distributions from net realized gain | (1.79) | (.34) | (.02) | - |
Total distributions | (1.88) | (.43) M | (.05) L | - |
Redemption fees added to paid in capital E | - K | - K | - K | - |
Net asset value, end of period | $ 11.44 | $ 12.68 | $ 11.46 | $ 10.24 |
Total Return B,C,D | 5.17% | 14.50% | 12.37% | 2.40% |
Ratios to Average Net Assets F,J | | | | |
Expenses before reductions | 1.11% | 1.46% | 4.25% | 43.27% A |
Expenses net of fee waivers, if any | 1.10% | 1.10% | 1.10% | 1.10% A |
Expenses net of all reductions | 1.06% | 1.00% | .91% | .92% A |
Net investment income (loss) | .82% H | .95% | 1.08% | .80% A |
Supplemental Data | | | | |
Net assets, end of period (000 omitted) | $ 32,345 | $ 17,219 | $ 345 | $ 307 |
Portfolio turnover rate G | 224% | 185% | 176% | 52% A |
A Annualized B Total returns for periods of less than one year are not annualized. C Total returns do not reflect charges attributable to your insurance company's separate account. Inclusion of these charges would reduce the total returns shown. D Total returns would have been lower had certain expenses not been reduced during the periods shown. E Calculated based on average shares outstanding during the period. F Fees and expenses of the underlying Fidelity Central Funds are not included in the Fund's expense ratio. The Fund indirectly bears its proportionate share of the expenses of any underlying Fidelity Central Funds. G Amount does not include the portfolio activity of any underlying Fidelity Central Funds. H Investment income per share reflects a special dividend which amounted to $.02 per share. Excluding the special dividend, the ratio of net investment income (loss) to average net assets would have been .68%. I For the period December 22, 2004 (commencement of operations) to December 31, 2004. J Expense ratios reflect operating expenses of the class. Expenses before reductions do not reflect amounts reimbursed by the investment adviser or reductions from brokerage service arrangements or other expense offset arrangements and do not represent the amount paid by the class during periods when reimbursements or reductions occur. Expenses net of fee waivers reflect expenses after reimbursement by the investment adviser but prior to reductions from brokerage service arrangements or other expense offset arrangements. Expenses net of all reductions represent the net expenses paid by the class. K Amount represents less than $.01 per share. L Total distributions of $.05 per share is comprised of distributions from net investment income of $.022 and distributions from net realized gain of $.023 per share. M Total distributions of $.43 per share is comprised of distributions from net investment income of $.096 and distributions from net realized gain of $.335 per share. |
See accompanying notes which are an integral part of the financial statements.
Annual Report
Financial Highlights - Service Class R
Years ended December 31, | 2007 | 2006 | 2005 | 2004 I |
Selected Per-Share Data | | | | |
Net asset value, beginning of period | $ 12.67 | $ 11.46 | $ 10.24 | $ 10.00 |
Income from Investment Operations | | | | |
Net investment income (loss) E | .10 H | .10 | .10 | - K |
Net realized and unrealized gain (loss) | .53 | 1.53 | 1.16 | .24 |
Total from investment operations | .63 | 1.63 | 1.26 | .24 |
Distributions from net investment income | (.08) | (.08) | (.01) | - |
Distributions from net realized gain | (1.79) | (.34) | (.02) | - |
Total distributions | (1.87) | (.42) M | (.04) L | - |
Redemption fees added to paid in capital E | - K | - K | - K | - |
Net asset value, end of period | $ 11.43 | $ 12.67 | $ 11.46 | $ 10.24 |
Total Return B,C,D | 5.06% | 14.30% | 12.27% | 2.40% |
Ratios to Average Net Assets F,J | | | | |
Expenses before reductions | 1.20% | 1.62% | 4.35% | 43.36% A |
Expenses net of fee waivers, if any | 1.20% | 1.20% | 1.20% | 1.20% A |
Expenses net of all reductions | 1.16% | 1.10% | 1.01% | 1.01% A |
Net investment income (loss) | .72% H | .85% | .98% | .71% A |
Supplemental Data | | | | |
Net assets, end of period (000 omitted) | $ 414 | $ 394 | $ 345 | $ 307 |
Portfolio turnover rate G | 224% | 185% | 176% | 52% A |
A Annualized B Total returns for periods of less than one year are not annualized. C Total returns do not reflect charges attributable to your insurance company's separate account. Inclusion of these charges would reduce the total returns shown. D Total returns would have been lower had certain expenses not been reduced during the periods shown. E Calculated based on average shares outstanding during the period. F Fees and expenses of the underlying Fidelity Central Funds are not included in the Fund's expense ratio. The Fund indirectly bears its proportionate share of the expenses of any underlying Fidelity Central Funds. G Amount does not include the portfolio activity of any underlying Fidelity Central Funds. H Investment income per share reflects a special dividend which amounted to $.02 per share. Excluding the special dividend, the ratio of net investment income (loss) to average net assets would have been .58%. I For the period December 22, 2004 (commencement of operations) to December 31, 2004. J Expense ratios reflect operating expenses of the class. Expenses before reductions do not reflect amounts reimbursed by the investment adviser or reductions from brokerage service arrangements or other expense offset arrangements and do not represent the amount paid by the class during periods when reimbursements or reductions occur. Expenses net of fee waivers reflect expenses after reimbursement by the investment adviser but prior to reductions from brokerage service arrangements or other expense offset arrangements. Expenses net of all reductions represent the net expenses paid by the class. K Amount represents less than $.01 per share. L Total distributions of $.04 per share is comprised of distributions from net investment income of $.012 and distributions from net realized gain of $.023 per share. M Total distributions of $.42 per share is comprised of distributions from net investment income of $.084 and distributions from net realized gain of $.335 per share. |
Financial Highlights - Service Class 2R
Years ended December 31, | 2007 | 2006 | 2005 | 2004 I |
Selected Per-Share Data | | | | |
Net asset value, beginning of period | $ 12.67 | $ 11.46 | $ 10.24 | $ 10.00 |
Income from Investment Operations | | | | |
Net investment income (loss) E | .08 H | .08 | .09 | - K |
Net realized and unrealized gain (loss) | .53 | 1.53 | 1.15 | .24 |
Total from investment operations | .61 | 1.61 | 1.24 | .24 |
Distributions from net investment income | (.06) | (.07) | - | - |
Distributions from net realized gain | (1.79) | (.34) | (.02) | - |
Total distributions | (1.85) | (.40) M | (.02) L | - |
Redemption fees added to paid in capital E | - K | - K | - K | - |
Net asset value, end of period | $ 11.43 | $ 12.67 | $ 11.46 | $ 10.24 |
Total Return B,C,D | 4.90% | 14.14% | 12.12% | 2.40% |
Ratios to Average Net Assets F,J | | | | |
Expenses before reductions | 1.35% | 1.77% | 4.50% | 43.51% A |
Expenses net of fee waivers, if any | 1.35% | 1.35% | 1.35% | 1.35% A |
Expenses net of all reductions | 1.31% | 1.25% | 1.16% | 1.17% A |
Net investment income (loss) | .57% H | .70% | .83% | .55% A |
Supplemental Data | | | | |
Net assets, end of period (000 omitted) | $ 550 | $ 524 | $ 459 | $ 410 |
Portfolio turnover rate G | 224% | 185% | 176% | 52% A |
A Annualized B Total returns for periods of less than one year are not annualized. C Total returns do not reflect charges attributable to your insurance company's separate account. Inclusion of these charges would reduce the total returns shown. D Total returns would have been lower had certain expenses not been reduced during the periods shown. E Calculated based on average shares outstanding during the period. F Fees and expenses of the underlying Fidelity Central Funds are not included in the Fund's expense ratio. The Fund indirectly bears its proportionate share of the expenses of any underlying Fidelity Central Funds. G Amount does not include the portfolio activity of any underlying Fidelity Central Funds. H Investment income per share reflects a special dividend which amounted to $.02 per share. Excluding the special dividend, the ratio of net investment income (loss) to average net assets would have been .43%. I For the period December 22, 2004 (commencement of operations) to December 31, 2004. J Expense ratios reflect operating expenses of the class. Expenses before reductions do not reflect amounts reimbursed by the investment adviser or reductions from brokerage service arrangements or other expense offset arrangements and do not represent the amount paid by the class during periods when reimbursements or reductions occur. Expenses net of fee waivers reflect expenses after reimbursement by the investment adviser but prior to reductions from brokerage service arrangements or other expense offset arrangements. Expenses net of all reductions represent the net expenses paid by the class. K Amount represents less than $.01 per share. L Total distributions of $.02 per share is comprised of distributions from net investment income of $.00 and distributions from net realized gain of $.02 per share. M Total distributions of $.40 per share is comprised of distributions from net investment income of $.066 and distributions from net realized gain of $.335 per share. |
See accompanying notes which are an integral part of the financial statements.
Annual Report
Financial Highlights - Investor Class R
Years ended December 31, | 2007 | 2006 | 2005 I |
Selected Per-Share Data | | | |
Net asset value, beginning of period | $ 12.65 | $ 11.46 | $ 10.32 |
Income from Investment Operations | | | |
Net investment income (loss) E | .09 H | .09 | .01 |
Net realized and unrealized gain (loss) | .54 | 1.53 | 1.16 |
Total from investment operations | .63 | 1.62 | 1.17 |
Distributions from net investment income | (.08) | (.10) | (.02) |
Distributions from net realized gain | (1.79) | (.34) | (.01) |
Total distributions | (1.87) | (.43) M | (.03) L |
Redemption fees added to paid in capital E,K | - | - | - |
Net asset value, end of period | $ 11.41 | $ 12.65 | $ 11.46 |
Total Return B,C,D | 5.07% | 14.23% | 11.39% |
Ratios to Average Net Assets F,J | | | |
Expenses before reductions | 1.22% | 1.61% | 2.19% A |
Expenses net of fee waivers, if any | 1.22% | 1.25% | 1.25% A |
Expenses net of all reductions | 1.18% | 1.15% | 1.06% A |
Net investment income (loss) | .71% H | .80% | .31% A |
Supplemental Data | | | |
Net assets, end of period (000 omitted) | $ 38,719 | $ 24,505 | $ 9,810 |
Portfolio turnover rate G | 224% | 185% | 176% |
A Annualized B Total returns for periods of less than one year are not annualized. C Total returns do not reflect charges attributable to your insurance company's separate account. Inclusion of these charges would reduce the total returns shown. D Total returns would have been lower had certain expenses not been reduced during the periods shown. E Calculated based on average shares outstanding during the period. F Fees and expenses of the underlying Fidelity Central Funds are not included in the Fund's expense ratio. The Fund indirectly bears its proportionate share of the expenses of any underlying Fidelity Central Funds. G Amount does not include the portfolio activity of any underlying Fidelity Central Funds. H Investment income per share reflects a special dividend which amounted to $.02 per share. Excluding the special dividend, the ratio of net investment income (loss) to average net assets would have been .57%. I For the period July 21, 2005 (commencement of sale of shares) to December 31, 2005. J Expense ratios reflect operating expenses of the class. Expenses before reductions do not reflect amounts reimbursed by the investment adviser or reductions from brokerage service arrangements or other expense offset arrangements and do not represent the amount paid by the class during periods when reimbursements or reductions occur. Expense ratios before reductions for start-up periods may not be representative of longer-term operating periods. Expenses net of fee waivers reflect expenses after reimbursement by the investment adviser but prior to reductions from brokerage service arrangements or other expense offset arrangements. Expenses net of all reductions represent the net expenses paid by the class. K Amount represents less than $.01 per share. L Total distributions of $.03 per share is comprised of distributions from net investment income of $.022 and distributions from net realized gain of $.013 per share. M Total distributions of $.43 per share is comprised of distributions from net investment income of $.095 and distributions from net realized gain of $.335 per share. |
See accompanying notes which are an integral part of the financial statements.
Annual Report
Notes to Financial Statements
For the period ended December 31, 2007
1. Organization.
VIP International Capital Appreciation Portfolio (the Fund) is a fund of Variable Insurance Products Fund IV (the trust) and is authorized to issue an unlimited number of shares. The trust is registered under the Investment Company Act of 1940, as amended (the 1940 Act), as an open-end management investment company organized as a Massachusetts business trust. Shares of the Fund may only be purchased by insurance companies for the purpose of funding variable annuity or variable life insurance contracts. The Fund offers the following classes of shares: Initial Class shares, Service Class shares, Service Class 2 shares, Initial Class R shares, Service Class R shares, Service Class 2R shares, and Investor Class R shares. All classes have equal rights and voting privileges, except for matters affecting a single class. Investment income, realized and unrealized capital gains and losses, the common expenses of the Fund, and certain fund-level expense reductions, if any, are allocated on a pro rata basis to each class based on the relative net assets of each class to the total net assets of the Fund. Each class differs with respect to transfer agent and distribution and service plan fees incurred. Certain expense reductions also differ by class. The Fund's investments in emerging markets can be subject to social, economic, regulatory, and political uncertainties and can be extremely volatile.
2. Investments in Fidelity Central Funds.
The Fund may invest in Fidelity Central Funds, which are open-end investment companies available only to other investment companies and accounts managed by Fidelity Management & Research Company (FMR) and its affiliates. The Fund's Schedule of Investments lists each of the Fidelity Central Funds as an investment of the Fund, but does not include the underlying holdings of each Fidelity Central Fund. As an Investing Fund, the Fund indirectly bears its proportionate share of the expenses of the underlying Fidelity Central Funds.
The Money Market Central Funds seek preservation of capital and current income and are managed by Fidelity Investments Money Management, Inc. (FIMM), an affiliate of FMR.
A complete list of holdings for each Fidelity Central Fund is available upon request or at the SEC's web site at www.sec.gov. In addition, the financial statements of the Fidelity Central Funds, which are not covered by the Fund's Report of Independent Registered Public Accounting Firm, are available on the SEC's web site or upon request.
3. Significant Accounting Policies.
The financial statements have been prepared in conformity with accounting principles generally accepted in the United States of America, which require management to make certain estimates and assumptions at the date of the financial statements. The following summarizes the significant accounting policies of the Fund:
Security Valuation. Investments are valued and net asset value (NAV) per share is calculated (NAV calculation) as of the close of business of the New York Stock Exchange (NYSE), normally 4:00 p.m. Eastern time. Wherever possible, the Fund uses independent pricing services approved by the Board of Trustees to value its investments. Equity securities, including restricted securities, for which market quotations are readily available, are valued at the last reported sale price or official closing price as reported by an independent pricing service on the primary market or exchange on which they are traded. In the event there were no sales during the day or closing prices are not available, securities are valued at the last quoted bid price. Investments in open-end mutual funds, including the Fidelity Central Funds, are valued at their closing net asset value each business day. Short-term securities with remaining maturities of sixty days or less for which quotations are not readily available are valued at amortized cost, which approximates value.
When current market prices or quotations are not readily available or do not accurately reflect fair value, valuations may be determined in accordance with procedures adopted by the Board of Trustees. For example, when developments occur between the close of a market and the close of the NYSE that may materially affect the value of some or all of the securities, or when trading in a security is halted, those securities may be fair valued. Factors used in the determination of fair value may include monitoring news to identify significant market or security specific events such as changes in the value of U.S. securities markets, reviewing developments in foreign markets and evaluating the performance of ADRs, futures contracts and exchange-traded funds. Because the Fund's utilization of fair value pricing depends on market activity, the frequency with which fair value pricing is used cannot be predicted and may be utilized to a significant extent. The value of securities used for NAV calculation under fair value pricing may differ from published prices for the same securities.
Annual Report
3. Significant Accounting Policies - continued
Foreign Currency. The Fund uses foreign currency contracts to facilitate transactions in foreign-denominated securities. Losses from these transactions may arise from changes in the value of the foreign currency or if the counterparties do not perform under the contracts' terms.
Foreign-denominated assets, including investment securities, and liabilities are translated into U.S. dollars at the exchange rate at period end. Purchases and sales of investment securities, income and dividends received and expenses denominated in foreign currencies are translated into U.S. dollars at the exchange rate in effect on the transaction date.
The effects of exchange rate fluctuations on investments are included with the net realized and unrealized gain (loss) on investment securities. Other foreign currency transactions resulting in realized and unrealized gain (loss) are disclosed separately.
Investment Transactions and Income. For financial reporting purposes, the Fund's investment holdings and NAV include trades executed through the end of the last business day of the period. The NAV for processing shareholder transactions includes trades executed through the end of the prior business day. Gains and losses on securities sold are determined on the basis of identified cost. Dividend income is recorded on the ex-dividend date, except for certain dividends from foreign securities where the ex-dividend date may have passed, which are recorded as soon as the Fund is informed of the ex-dividend date. Non-cash dividends included in dividend income, if any, are recorded at the fair market value of the securities received. Interest income and distributions from the Fidelity Central Funds are accrued as earned. Interest income includes coupon interest and amortization of premium and accretion of discount on debt securities. Investment income is recorded net of foreign taxes withheld where recovery of such taxes is uncertain.
Expenses. Most expenses of the trust can be directly attributed to a fund. Expenses which cannot be directly attributed are apportioned among each Fund in the trust. Expense estimates are accrued in the period to which they relate and adjustments are made when actual amounts are known.
Income Tax Information and Distributions to Shareholders. Each year, the Fund intends to qualify as a regulated investment company by distributing substantially all of its taxable income and realized gains under Subchapter M of the Internal Revenue Code and filing its U.S. federal tax return. As a result, no provision for income taxes is required. The Fund adopted the provisions of FASB Interpretation No. 48, Accounting for Uncertainties in Income Taxes (FIN 48) on June 29, 2007. FIN 48 sets forth a minimum threshold for financial statement recognition of the benefit of a tax position taken or expected to be taken in a tax return. The implementation of FIN 48 did not result in any unrecognized tax benefits in the accompanying financial statements. Each of the Fund's federal tax returns for the prior three fiscal years remains subject to examination by the Internal Revenue Service. Foreign taxes are provided for based on the Fund's understanding of the tax rules and rates that exist in the foreign markets in which it invests.
Distributions are recorded on the ex-dividend date. Income dividends and capital gain distributions are declared separately for each class. Income and capital gain distributions are determined in accordance with income tax regulations, which may differ from generally accepted accounting principles.
Capital accounts within the financial statements are adjusted for permanent book-tax differences. These adjustments have no impact on net assets or the results of operations. Temporary book-tax differences will reverse in a subsequent period.
Book-tax differences are primarily due to foreign currency transactions, certain foreign taxes, passive foreign investment companies (PFIC), market discount and losses deferred due to wash sales and excise tax regulations.
The tax-basis components of distributable earnings and the federal tax cost as of period end were as follows:
Unrealized appreciation | $ 3,181,295 |
Unrealized depreciation | (3,410,440) |
Net unrealized appreciation (depreciation) | (229,145) |
Undistributed ordinary income | 289,197 |
Undistributed long term capital gain | 17,432 |
| |
Cost for federal income tax purposes | $ 75,693,797 |
The tax character of distributions paid was as follows:
| December 31, 2007 | December 31, 2006 |
Ordinary Income | $ 9,196,187 | $ 779,358 |
Long-term Capital Gains | 1,192,564 | 651,689 |
Total | $ 10,388,751 | $ 1,431,047 |
Trading (Redemption) Fees. Initial Class R shares, Service Class R shares, Service Class 2 R shares and Investor Class R shares held less than 60 days are subject to a redemption fee equal to 1% of the proceeds of the redeemed shares. All redemption fees, including any estimated redemption fees paid by FMR, are retained by the Fund and accounted for as an addition to paid in capital.
Annual Report
Notes to Financial Statements - continued
3. Significant Accounting Policies - continued
New Accounting Pronouncement. In September 2006, Statement of Financial Accounting Standards No. 157, Fair Value Measurements (SFAS 157), was issued and is effective for fiscal years beginning after November 15, 2007. SFAS 157 defines fair value, establishes a framework for measuring fair value and expands disclosures about fair value measurements. Management is currently evaluating the impact the adoption of SFAS 157 will have on the Fund's financial statement disclosures.
4. Operating Policies.
Repurchase Agreements. FMR has received an Exemptive Order from the Securities and Exchange Commission (the SEC) which permits the Fund and other affiliated entities of FMR to transfer uninvested cash balances into joint trading accounts which are then invested in repurchase agreements. The Fund may also invest directly with institutions in repurchase agreements. Repurchase agreements are collateralized by government or non-government securities. Upon settlement date, collateral is held in segregated accounts with custodian banks and may be obtained in the event of a default of the counterparty. The Fund monitors, on a daily basis, the value of the collateral to ensure it is at least equal to the principal amount of the repurchase agreement (including accrued interest). In the event of a default by the counterparty, realization of the collateral proceeds could be delayed, during which time the value of the collateral may decline.
Restricted Securities. The Fund may invest in securities that are subject to legal or contractual restrictions on resale. These securities generally may be resold in transactions exempt from registration or to the public if the securities are registered. Disposal of these securities may involve time-consuming negotiations and expense, and prompt sale at an acceptable price may be difficult. Information regarding restricted securities is included at the end of the Fund's Schedule of Investments.
5. Purchases and Sales of Investments.
Purchases and sales of securities, other than short-term securities, aggregated $159,574,551 and $130,407,995, respectively.
6. Fees and Other Transactions with Affiliates.
Management Fee. FMR and its affiliates provide the Fund with investment management related services for which the Fund pays a monthly management fee. The management fee is the sum of an individual fund fee rate that is based on an annual rate of .45% of the Fund's average net assets and a group fee rate that averaged .26% during the period. The group fee rate is based upon the average net assets of all the mutual funds advised by FMR. The group fee rate decreases as assets under management increase and increases as assets under management decrease. For the period, the total annual management fee rate was .71% of the Fund's average net assets.
Distribution and Service Plan. In accordance with Rule 12b-1 of the 1940 Act, the Fund has adopted separate 12b-1 Plans for each Service Class of shares. Each Service Class pays Fidelity Distributors Corporation (FDC), an affiliate of FMR, a service fee. For the period, the service fee is based on an annual rate of .10% of Service Class' and Service Class R's average net assets and .25% of Service Class 2's and Service Class 2R's average net assets.
For the period, each class paid FDC the following amounts, all of which were re-allowed to insurance companies for the distribution of shares and providing shareholder support services:
Service Class | $ 422 |
Service Class 2 | 1,454 |
Service Class R | 422 |
Service Class 2 R | 1,408 |
| $ 3,706 |
Annual Report
6. Fees and Other Transactions with Affiliates - continued
Transfer Agent Fees. Fidelity Investments Institutional Operations Company, Inc. (FIIOC), an affiliate of FMR, is the Fund's transfer, dividend disbursing, and shareholder servicing agent. FIIOC receives an asset-based fee with respect to each class. Each class with the exception of Investor Class pays a transfer agent fee, excluding out of pocket expenses, equal to an annual rate of .07% of average net assets. Investor Class R pays a monthly asset-based transfer agent fee of .18% of average net assets. The total transfer agent fees paid by each class to FIIOC, including out of pocket expenses, were as follows:
Initial Class | $ 2,238 |
Service Class | 279 |
Service Class 2 | 768 |
Initial Class R | 22,074 |
Service Class R | 279 |
Service Class 2R | 371 |
Investor Class R | 66,255 |
| $ 92,264 |
Effective February 1, 2008, the Board of Trustees approved a decrease to Investor Class' asset-based fee from .18% to.15% of average net assets.
Accounting and Security Lending Fees. Fidelity Service Company, Inc. (FSC), an affiliate of FMR, maintains the Fund's accounting records. The accounting fee is based on the level of average net assets for the month. Under a separate contract, FSC administers the security lending program. The security lending fee is based on the number and duration of lending transactions.
Brokerage Commissions. The Fund placed a portion of its portfolio transactions with brokerage firms which are affiliates of the investment adviser. The commissions paid to these affiliated firms were $76 for the period.
7. Committed Line of Credit.
The Fund participates with other funds managed by FMR in a $4.2 billion credit facility (the "line of credit") to be utilized for temporary or emergency purposes to fund shareholder redemptions or for other short-term liquidity purposes. The Fund has agreed to pay commitment fees on its pro rata portion of the line of credit, which amounted to $118 and is reflected in Miscellaneous Expense on the Statement of Operations. During the period, there were no borrowings on this line of credit.
8. Security Lending.
The Fund lends portfolio securities from time to time in order to earn additional income. On the settlement date of the loan, the Fund receives collateral (in the form of U.S. Treasury obligations, letters of credit and/or cash) against the loaned securities and maintains collateral in an amount not less than 100% of the market value of the loaned securities during the period of the loan. The market value of the loaned securities is determined at the close of business of the Fund and any additional required collateral is delivered to the Fund on the next business day. If the borrower defaults on its obligation to return the securities loaned because of insolvency or other reasons, a fund could experience delays and costs in recovering the securities loaned or in gaining access to the collateral. Any cash collateral received is invested in the Fidelity Securities Lending Cash Central Fund. The value of loaned securities and cash collateral at period end are disclosed on the Fund's Statement of Assets and Liabilities. Security lending income represents the income earned on investing cash collateral, less fees and expenses associated with the loan, plus any premium payments that may be received on the loan of certain types of securities. Security lending income is presented in the Statement of Operations as a component of income from Fidelity Central Funds. Net income from lending portfolio securities during the period amounted to $35,702.
9. Expense Reductions.
FMR voluntarily agreed to reimburse each class to the extent annual operating expenses exceeded certain levels of average net assets as noted in the table below. Some expenses, for example interest expense, including commitment fees, are excluded from this reimbursement.
Annual Report
Notes to Financial Statements - continued
9. Expense Reductions - continued
The following classes were in reimbursement during the period:
| Expense
Limitations | Reimbursement
from adviser |
Initial Class | 1.10% | $ 1,250 |
Service Class 2 | 1.35% | 325 |
Initial Class R | 1.10% | 849 |
| | $ 2,424 |
Many of the brokers with whom FMR places trades on behalf of the Fund provided services to the Fund in addition to trade execution. These services included payments of certain expenses on behalf of the Fund totaling $25,157 for the period. In addition, through arrangements with the Fund's custodian, credits realized as a result of uninvested cash balances were used to reduce the Fund's expenses. During the period, these credits reduced the Fund's custody expenses by $307.
10. Other.
The Fund's organizational documents provide former and current trustees and officers with a limited indemnification against liabilities arising in connection with the performance of their duties to the Fund. In the normal course of business, the Fund may also enter into contracts that provide general indemnifications. The Fund's maximum exposure under these arrangements is unknown as this would be dependent on future claims that may be made against the Fund. The risk of material loss from such claims is considered remote.
At the end of the period, FMR or its affiliates were the owners of record of 99% of the total outstanding shares of the fund.
11. Distributions to Shareholders.
Distributions to shareholders of each class were as follows:
Years ended December 31, | 2007 | 2006 |
From net investment income | | |
Initial Class | $ 9,981 | $ 9,863 |
Service Class | 2,513 | 2,538 |
Service Class 2 | 2,465 | 2,655 |
Initial Class R | 232,391 | 126,136 |
Service Class R | 2,513 | 2,538 |
Service Class 2R | 2,506 | 2,655 |
Investor Class R | 236,202 | 177,775 |
Total | $ 488,571 | $ 324,160 |
From net realized gain | | |
Initial Class | $ 188,994 | $ 82,024 |
Service Class | 56,040 | 10,116 |
Service Class 2 | 75,317 | 13,470 |
Initial Class R | 4,287,821 | 382,391 |
Service Class R | 56,040 | 10,116 |
Service Class 2R | 74,517 | 13,470 |
Investor Class R | 5,161,451 | 595,300 |
Total | $ 9,900,180 | $ 1,106,887 |
12. Share Transactions.
Transactions for each class of shares were as follows:
| Shares | Dollars |
Years ended December 31, | 2007 | 2006 | 2007 | 2006 |
Initial Class | | | | |
Shares sold | 57,013 | 551,473 | $ 797,148 | $ 6,530,542 |
Reinvestment of distributions | 17,391 | 7,645 | 198,975 | 91,887 |
Shares redeemed | (58,226) | (1,269,330) | (765,491) | (14,879,275) |
Net increase (decrease) | 16,178 | (710,212) | $ 230,632 | $ (8,256,846) |
Annual Report
12. Share Transactions - continued
| Shares | Dollars |
Years ended December 31, | 2007 | 2006 | 2007 | 2006 |
Service Class | | | | |
Reinvestment of distributions | 5,121 | 1,019 | 58,553 | 12,654 |
Net increase (decrease) | 5,121 | 1,019 | $ 58,553 | $ 12,654 |
Service Class 2 | | | | |
Shares sold | 6,394 | - | $ 84,142 | $ - |
Reinvestment of distributions | 6,793 | 1,300 | 77,782 | 16,125 |
Shares redeemed | (6,455) | - | (88,305) | - |
Net increase (decrease) | 6,732 | 1,300 | $ 73,619 | $ 16,125 |
Initial Class R | | | | |
Shares sold | 1,656,294 | 1,743,214 | $ 22,491,075 | $ 20,660,150 |
Reinvestment of distributions | 396,233 | 40,625 | 4,520,212 | 508,526 |
Shares redeemed | (583,136) | (455,998) | (7,820,250) | (5,371,545) |
Net increase (decrease) | 1,469,391 | 1,327,841 | $ 19,191,037 | $ 15,797,131 |
Service Class R | | | | |
Reinvestment of distributions | 5,121 | 1,019 | 58,553 | 12,654 |
Net increase (decrease) | 5,121 | 1,019 | $ 58,553 | $ 12,654 |
Service Class 2R | | | | |
Reinvestment of distributions | 6,735 | 1,300 | 77,024 | 16,125 |
Net increase (decrease) | 6,735 | 1,300 | $ 77,024 | $ 16,125 |
Investor Class R | | | | |
Shares sold | 1,585,891 | 1,447,148 | $ 21,572,358 | $ 17,211,509 |
Reinvestment of distributions | 473,946 | 62,199 | 5,397,653 | 773,075 |
Shares redeemed | (602,827) | (428,813) | (8,073,931) | (5,072,819) |
Net increase (decrease) | 1,457,010 | 1,080,534 | $ 18,896,080 | $ 12,911,765 |
Annual Report
Report of Independent Registered Public Accounting Firm
To the Trustees of Variable Insurance Products Fund IV and the Shareholders of VIP International Capital Appreciation Portfolio:
In our opinion, the accompanying statement of assets and liabilities, including the schedule of investments, and the related statements of operations and of changes in net assets and the financial highlights present fairly, in all material respects, the financial position of VIP International Capital Appreciation Portfolio (a fund of Variable Insurance Products Fund IV) at December 31, 2007, the results of its operations for the year then ended, the changes in its net assets for each of the two years in the period then ended and the financial highlights for each of the periods indicated, in conformity with accounting principles generally accepted in the United States of America. These financial statements and financial highlights (hereafter referred to as "financial statements") are the responsibility of the VIP International Capital Appreciation Portfolio's management. Our responsibility is to express an opinion on these financial statements based on our audits. We conducted our audits of these financial statements in accordance with the standards of the Public Company Accounting Oversight Board (United States). Those standards require that we plan and perform the audit to obtain reasonable assurance about whether the financial statements are free of material misstatement. An audit includes examining, on a test basis, evidence supporting the amounts and disclosures in the financial statements, assessing the accounting principles used and significant estimates made by management, and evaluating the overall financial statement presentation. We believe that our audits, which included confirmation of securities at December 31, 2007 by correspondence with the custodian and brokers, provide a reasonable basis for our opinion.
/s/ Pricewaterhouse Coopers LLP
PricewaterhouseCoopers LLP
Boston, Massachusetts
February 22, 2008
Annual Report
Trustees and Officers
The Trustees, Members of the Advisory Board, and executive officers of the trust and fund, as applicable, are listed below. The Board of Trustees governs the fund and is responsible for protecting the interests of shareholders. The Trustees are experienced executives who meet periodically throughout the year to oversee the fund's activities, review contractual arrangements with companies that provide services to the fund, and review the fund's performance. Except for James C. Curvey, each of the Trustees oversees 373 funds advised by FMR or an affiliate. Mr. Curvey oversees 368 funds advised by FMR or an affiliate.
The Trustees hold office without limit in time except that (a) any Trustee may resign; (b) any Trustee may be removed by written instrument, signed by at least two-thirds of the number of Trustees prior to such removal; (c) any Trustee who requests to be retired or who has become incapacitated by illness or injury may be retired by written instrument signed by a majority of the other Trustees; and (d) any Trustee may be removed at any special meeting of shareholders by a two-thirds vote of the outstanding voting securities of the trust. Each Trustee who is not an interested person (as defined in the 1940 Act) (Independent Trustee), shall retire not later than the last day of the calendar year in which his or her 72nd birthday occurs. The Independent Trustees may waive this mandatory retirement age policy with respect to individual Trustees. The executive officers and Advisory Board Members hold office without limit in time, except that any officer and Advisory Board Member may resign or may be removed by a vote of a majority of the Trustees at any regular meeting or any special meeting of the Trustees. Except as indicated, each individual has held the office shown or other offices in the same company for the past five years.
The fund's Statement of Additional Information (SAI) includes more information about the Trustees. To request a free copy, call Fidelity at 1-877-208-0098.
Interested Trustees*:
Correspondence intended for each Trustee who is an interested person may be sent to Fidelity Investments, 82 Devonshire Street, Boston, Massachusetts 02109.
Name, Age; Principal Occupation |
Edward C. Johnson 3d (77) |
| Year of Election or Appointment: 1983 Mr. Johnson is Chairman of the Board of Trustees. Mr. Johnson serves as President (2006-present), Chief Executive Officer, Chairman, and a Director of FMR LLC; Chairman and a Director of FMR; Chairman and a Director of Fidelity Research & Analysis Company (FRAC); Chairman and a Director of Fidelity Investments Money Management, Inc.; and Chairman (2001-present) and a Director of FMR Co., Inc. In addition, Mr. Johnson serves as Chairman and Director of Fidelity International Limited (FIL). Mr. Edward C. Johnson 3d and Mr. Arthur E. Johnson are not related. |
James C. Curvey (72) |
| Year of Election or Appointment: 2007 Mr. Curvey also serves as Trustee (2007-present) or Member of the Advisory Board (2007-present) of other investment companies advised by FMR. Mr. Curvey is a Director of FMR and FMR Co., Inc. (2007-present). Mr. Curvey is also Vice Chairman (2006-
present) and Director of FMR LLC. Mr. Curvey joined Fidelity in 1982 and served in numerous senior management positions, including President and Chief Operating Officer of FMR LLC (1997-2000) and President of Fidelity Strategic Investments (2000-
2002). In addition, he serves as a member of the Board of Directors of Geerlings & Wade, Inc. (wine distribution). |
* Trustees have been determined to be "Interested Trustees" by virtue of, among other things, their affiliation with the trust or various entities under common control with FMR. FMR Corp. merged with and into FMR LLC on October 1, 2007. Any references to FMR LLC for prior periods are deemed to be references to the prior entity.
Independent Trustees:
Correspondence intended for each Independent Trustee (that is, the Trustees other than the Interested Trustees) may be sent to Fidelity Investments, P.O. Box 55235, Boston, Massachusetts 02205-5235.
Name, Age; Principal Occupation |
Dennis J. Dirks (59) |
| Year of Election or Appointment: 2005 Prior to his retirement in May 2003, Mr. Dirks was Chief Operating Officer and a member of the Board of The Depository Trust & Clearing Corporation (DTCC) (1999-2003). He also served as President, Chief Operating Officer, and Board member of The Depository Trust Company (DTC) (1999-2003) and President and Board member of the National Securities Clearing Corporation (NSCC) (1999-2003). In addition, Mr. Dirks served as Chief Executive Officer and Board member of the Government Securities Clearing Corporation (2001-2003) and Chief Executive Officer and Board member of the Mortgage-Backed Securities Clearing Corporation (2001-2003). Mr. Dirks also serves as a Trustee and a member of the Finance Committee of Manhattan College (2005-present) and a Trustee and a member of the Finance Committee of AHRC of Nassau County (2006-present). |
Albert R. Gamper, Jr. (65) |
| Year of Election or Appointment: 2006 Prior to his retirement in December 2004, Mr. Gamper served as Chairman of the Board of CIT Group Inc. (commercial finance). During his tenure with CIT Group Inc. Mr. Gamper served in numerous senior management positions, including Chairman (1987-
1989; 1999-2001; 2002-2004), Chief Executive Officer (1987-2004), and President (1989-2002). He currently serves as a member of the Board of Directors of Public Service Enterprise Group (utilities, 2001-present), Chairman of the Board of Governors, Rutgers University (2004-present), and Chairman of the Board of Saint Barnabas Health Care System. |
George H. Heilmeier (71) |
| Year of Election or Appointment: 2004 Dr. Heilmeier is Chairman Emeritus of Telcordia Technologies (communication software and systems), where prior to his retirement, he served as company Chairman and Chief Executive Officer. He currently serves on the Boards of Directors of The Mitre Corporation (systems engineering and information technology support for the government), and HRL Laboratories (private research and development, 2004-present). He is Chairman of the General Motors Science & Technology Advisory Board and a Life Fellow of the Institute of Electrical and Electronics Engineers (IEEE). Dr. Heilmeier is a member of the Defense Science Board and the National Security Agency Advisory Board. He is also a member of the National Academy of Engineering, the American Academy of Arts and Sciences, and the Board of Overseers of the School of Engineering and Applied Science of the University of Pennsylvania. Previously, Dr. Heilmeier served as a Director of TRW Inc. (automotive, space, defense, and information technology, 1992-2002), Compaq (1994-2002), Automatic Data Processing, Inc. (ADP) (technology-based business outsourcing, 1995-2002), INET Technologies Inc. (telecommunications network surveillance, 2001-2004), and Teletech Holdings (customer management services). He is the recipient of the 2005 Kyoto Prize in Advanced Technology for his invention of the liquid crystal display, and a member of the Consumer Electronics Hall of Fame. |
James H. Keyes (67) |
| Year of Election or Appointment: 2007 Prior to his retirement in 2003, Mr. Keyes was Chairman, President, and Chief Executive Officer of Johnson Controls, Inc. (automotive supplier, 1993-2003). He currently serves as a member of the boards of LSI Logic Corporation (semiconductor technologies), Navistar International Corporation (manufacture and sale of trucks, buses, and diesel engines, 2002-present), and Pitney Bowes, Inc. (integrated mail, messaging, and document management solutions). |
Marie L. Knowles (61) |
| Year of Election or Appointment: 2001 Prior to Ms. Knowles' retirement in June 2000, she served as Executive Vice President and Chief Financial Officer of Atlantic Richfield Company (ARCO) (diversified energy, 1996-2000). From 1993 to 1996, she was a Senior Vice President of ARCO and President of ARCO Transportation Company. She served as a Director of ARCO from 1996 to 1998. She currently serves as a Director of Phelps Dodge Corporation (copper mining and manufacturing) and McKesson Corporation (healthcare service, 2002-present). Ms. Knowles is a Trustee of the Brookings Institution and the Catalina Island Conservancy and also serves as a member of the Advisory Board for the School of Engineering of the University of Southern California. |
Ned C. Lautenbach (63) |
| Year of Election or Appointment: 2000 Mr. Lautenbach is Chairman of the Independent Trustees (2006-present). Mr. Lautenbach has been a partner of Clayton, Dubilier & Rice, Inc. (private equity investment firm) since September 1998. Previously, Mr. Lautenbach was with the International Business Machines Corporation (IBM) from 1968 until his retirement in 1998. Mr. Lautenbach serves as a Director of Sony Corporation (2006-present) and Eaton Corporation (diversified industrial) as well as the Philharmonic Center for the Arts in Naples, Florida. He also is a member of the Board of Trustees of Fairfield University (2005-present), as well as a member of the Council on Foreign Relations. |
Cornelia M. Small (63) |
| Year of Election or Appointment: 2005 Ms. Small is a member (2000-present) and Chairperson (2002-present) of the Investment Committee, and a member (2002-
present) of the Board of Trustees of Smith College. Previously, she served as Chief Investment Officer (1999-2000), Director of Global Equity Investments (1996-1999), and a member of the Board of Directors of Scudder, Stevens & Clark (1990-1997) and Scudder Kemper Investments (1997-1999). In addition, Ms. Small served as Co-Chair (2000-2003) of the Annual Fund for the Fletcher School of Law and Diplomacy. |
William S. Stavropoulos (68) |
| Year of Election or Appointment: 2001 Mr. Stavropoulos is Chairman Emeritus of the Board of Directors of The Dow Chemical Company. Since joining The Dow Chemical Company in 1967, Mr. Stavropoulos served in numerous senior management positions, including President (1993-2000; 2002-2003), CEO (1995-2000; 2002-2004), and Chairman of the Executive Committee (2000-2004). Currently, he is a Director of NCR Corporation (data warehousing and technology solutions), Chemical Financial Corporation, Maersk Inc. (industrial conglomerate, 2002-present), Tyco International, Inc. (multinational manufacturing and services, 2007-present), and a member of the Advisory Board for Metalmark Capital (private equity investment firm, 2005-present). He is a special advisor to Clayton, Dubilier & Rice, Inc., a private equity investment firm. He also serves as a member of the Board of Trustees of the American Enterprise Institute for Public Policy Research. In addition, Mr. Stavropoulos is a member of The Business Council, J.P. Morgan International Council and the University of Notre Dame Advisory Council for the College of Science. |
Kenneth L. Wolfe (68) |
| Year of Election or Appointment: 2005 Mr. Wolfe is Chairman and a Director of Hershey Foods Corporation (2007-present), where prior to his retirement in 2001, he was Chairman and Chief Executive Officer. Mr. Wolfe currently serves as a member of the board of Revlon Inc. (2004-present). Previously, Mr. Wolfe served as a member of the boards of Adelphia Communications Corporation (2003-2006) and Bausch & Lomb, Inc. (1993-2007). |
Advisory Board Members and Executive Officers**:
Correspondence intended for Mr. Mauriello, Mr. Thomas, Mr. Wiley, Mr. Lacy, and Mr. Arthur Johnson may be sent to Fidelity Investments, P.O. Box 55235, Boston, Massachusetts 02205-5235. Correspondence intended for each executive officer and Mr. Lynch may be sent to Fidelity Investments, 82 Devonshire Street, Boston, Massachusetts 02109.
Name, Age; Principal Occupation |
Arthur E. Johnson (60) |
| Year of Election or Appointment: 2008 Member of the Advisory Board of Variable Insurance Products Fund IV. Mr. Johnson serves as Senior Vice President of Corporate Strategic Development of Lockheed Martin Corporation (defense contractor). In addition, Mr. Johnson serves as a member of the Board of Directors of AGL Resources, Inc. (holding company, 2002-present), and IKON Office Solutions, Inc. (document management systems and services). Mr. Arthur E. Johnson and Mr. Edward C. Johnson 3d are not related. |
Alan J. Lacy (54) |
| Year of Election or Appointment: 2008 Member of the Advisory Board of Variable Insurance Products Fund IV. Mr. Lacy serves as Senior Adviser (2007-present) of Oak Hill Capital Partners, L.P. (a private equity firm). Mr. Lacy also served as Vice Chairman and Chief Executive Officer of Sears Holdings Corporation and Sears, Roebuck and Co. (retail, 2005-2006; 2000-2005). In addition, Mr. Lacy serves as a member of the Board of Directors of The Western Union Company (global money transfer, 2006-present) and Bristol-Myers Squibb (global pharmaceuticals, 2007-present). Mr. Lacy is a Trustee of the National Parks Conservation Association and The Field Museum of Natural History. |
Peter S. Lynch (63) |
| Year of Election or Appointment: 2003 Member of the Advisory Board of Variable Insurance Products Fund IV. Mr. Lynch is Vice Chairman and a Director of FMR, and Vice Chairman (2001-present) and a Director of FMR Co., Inc. Previously, Mr. Lynch served as a Trustee of the Fidelity funds (1990-2003). In addition, he serves as a Trustee of Boston College and as the Chairman of the Inner-City Scholarship Fund. |
Joseph Mauriello (63) |
| Year of Election or Appointment: 2007 Member of the Advisory Board of Variable Insurance Products Fund IV. Prior to his retirement in January 2006, Mr. Mauriello served in numerous senior management positions including Deputy Chairman and Chief Operating Officer (2004-2005), and Vice Chairman of Financial Services (2002-2004) of KPMG LLP US (professional services firm, 1965-2005). Mr. Mauriello currently serves as a member of the Board of Directors of XL Capital Ltd. (global insurance and re-insurance company, 2006-
present) and of Arcadia Resources Inc. (health care services and products, 2007-present). He also served as a Director of the Hamilton Funds of the Bank of New York (2006-2007). |
David M. Thomas (58) |
| Year of Election or Appointment: 2007 Member of the Advisory Board of Variable Insurance Products Fund IV. Previously, Mr. Thomas served as Executive Chairman (2005-2006) and Chairman and Chief Executive Officer (2000-2005) of IMS Health, Inc. (pharmaceutical and healthcare information solutions). In addition, Mr. Thomas serves as a member of the Board of Directors of Fortune Brands, Inc. (consumer products holding company), and Interpublic Group of Companies, Inc. (marketing communication, 2004-present). |
Michael E. Wiley (57) |
| Year of Election or Appointment: 2007 Member of the Advisory Board of Variable Insurance Products Fund IV. Mr. Wiley also serves as a member of the Board of Trustees of the University of Tulsa (2000-2006; 2007-present). He serves as a Director of Tesoro Corporation (independent oil refiner and marketer, 2005-present), and a Director of Bill Barrett Corporation (exploration and production company, 2005-present). In addition, he also serves as a Director of Post Oak Bank (privately-held bank, 2004-present). Previously, Mr. Wiley served as a Sr. Energy Advisor of Katzenbach Partners, LLC (consulting firm, 2006-2007), as an Advisory Director of Riverstone Holdings (private investment firm), Chairman, President, and CEO of Baker Hughes, Inc. (oilfield services company, 2000-2004), and as Director of Spinnaker Exploration Company (exploration and production company, 2001-2005). |
Kimberley H. Monasterio (44) |
| Year of Election or Appointment: 2007 President and Treasurer of VIP International Capital Appreciation. Ms. Monasterio also serves as President and Treasurer of other Fidelity funds (2007-present) and is an employee of FMR (2004-present). Previously, Ms. Monasterio served as Deputy Treasurer of the Fidelity funds (2004-2006). Before joining Fidelity Investments, Ms. Monasterio served as Treasurer (2000-2004) and Chief Financial Officer (2002-2004) of the Franklin Templeton Funds and Senior Vice President of Franklin Templeton Services, LLC (2000-2004). |
Walter C. Donovan (45) |
| Year of Election or Appointment: 2007 Vice President of VIP International Capital Appreciation. Mr. Donovan also serves as Vice President of Fidelity's Equity Funds (2007-present). Mr. Donovan also serves as Executive Vice President of FMR (2005-present) and FMR Co., Inc. (2005-present). Previously, Mr. Donovan served as Vice President of Fidelity's High Income Funds (2005-2007), Fixed-Income Funds (2005-2006), certain Asset Allocation Funds (2005-2006), certain Balanced Funds (2005-2006), and as Vice President and Director of Fidelity's International Equity Trading group (1998-2005). |
Eric M. Wetlaufer (45) |
| Year of Election or Appointment: 2006 Vice President of VIP International Capital Appreciation. Mr. Wetlaufer also serves as Vice President of certain International Equity Funds (2006-present). Mr. Wetlaufer is Senior Vice President of FMR (2006-present) and FMR Co., Inc. (2006-present), and President and Director of Fidelity Management & Research (U.K.) Inc. (2006-present) and Fidelity Research & Analysis Company (2006-present). Before joining Fidelity Investments in 2005, Mr. Wetlaufer was a partner in Oxhead Capital Management (2004-2005). Previously, Mr. Wetlaufer served as a Chief Investment Officer of Putnam Investments (1997-2003). |
Eric D. Roiter (59) |
| Year of Election or Appointment: 2004 Secretary of VIP International Capital Appreciation. He also serves as Secretary of other Fidelity funds; Vice President, General Counsel, and Secretary of FMR Co., Inc. (2001-present) and FMR; Assistant Secretary of Fidelity Management & Research (U.K.) Inc. (2001-present), Fidelity Research & Analysis Company (2001-present), and Fidelity Investments Money Management, Inc. (2001-present). Mr. Roiter is an Adjunct Member, Faculty of Law, at Boston College Law School (2003-present). Previously, Mr. Roiter served as Vice President and Secretary of Fidelity Distributors Corporation (FDC) (1998-2005). |
John B. McGinty, Jr. (45) |
| Year of Election or Appointment: 2008 Assistant Secretary of VIP International Capital Appreciation. Mr. McGinty also serves as Assistant Secretary of other Fidelity funds (2008-present) and is an employee of FMR LLC (2004-present). Mr. McGinty also serves as Senior Vice President, Secretary, and Chief Legal Officer of FDC (2007-present). Before joining Fidelity Investments, Mr. McGinty practiced law at Ropes & Gray, LLP. |
R. Stephen Ganis (41) |
| Year of Election or Appointment: 2006 Anti-Money Laundering (AML) officer of VIP International Capital Appreciation. Mr. Ganis also serves as AML officer of other Fidelity funds (2006-present) and FMR LLC (2003-present). Before joining Fidelity Investments, Mr. Ganis practiced law at Goodwin Procter, LLP (2000-2002). |
Joseph B. Hollis (59) |
| Year of Election or Appointment: 2006 Chief Financial Officer of VIP International Capital Appreciation. Mr. Hollis also serves as Chief Financial Officer of other Fidelity funds. Mr. Hollis is President of Fidelity Pricing and Cash Management Services (FPCMS) (2005-present). Mr. Hollis also serves as President and Director of Fidelity Service Company, Inc. (2006-present). Previously, Mr. Hollis served as Senior Vice President of Cash Management Services (1999-2002) and Investment Management Operations (2002-2005). |
Kenneth A. Rathgeber (60) |
| Year of Election or Appointment: 2004 Chief Compliance Officer of VIP International Capital Appreciation. Mr. Rathgeber also serves as Chief Compliance Officer of other Fidelity funds (2004-present) and Executive Vice President of Risk Oversight for Fidelity Investments (2002-present). He is Chief Compliance Officer of FMR (2005-present), FMR Co., Inc. (2005-present), Fidelity Management & Research (U.K.) Inc. (2005-present), Fidelity Research & Analysis Company (2005-present), Fidelity Investments Money Management, Inc. (2005-
present), and Strategic Advisers, Inc. (2005-present). Previously, Mr. Rathgeber served as Executive Vice President and Chief Operating Officer for Fidelity Investments Institutional Services Company, Inc. (1998-2002). |
Bryan A. Mehrmann (46) |
| Year of Election or Appointment: 2005 Deputy Treasurer of VIP International Capital Appreciation. Mr. Mehrmann also serves as Deputy Treasurer of other Fidelity funds (2005-present) and is an employee of FMR. Previously, Mr. Mehrmann served as Vice President of Fidelity Investments Institutional Services Group (FIIS)/Fidelity Investments Institutional Operations Corporation, Inc. (FIIOC) Client Services (1998-2004). |
Kenneth B. Robins (38) |
| Year of Election or Appointment: 2005 Deputy Treasurer of VIP International Capital Appreciation. Mr. Robins also serves as Deputy Treasurer of other Fidelity funds (2005-present) and is an employee of FMR (2004-present). Before joining Fidelity Investments, Mr. Robins worked at KPMG LLP, where he was a partner in KPMG's department of professional practice (2002-2004) and a Senior Manager (1999-2000). In addition, Mr. Robins served as Assistant Chief Accountant, United States Securities and Exchange Commission (2000-2002). |
Robert G. Byrnes (41) |
| Year of Election or Appointment: 2005 Assistant Treasurer of VIP International Capital Appreciation. Mr. Byrnes also serves as Assistant Treasurer of other Fidelity funds (2005-present) and is an employee of FMR (2005-present). Previously, Mr. Byrnes served as Vice President of FPCMS (2003-
2005). Before joining Fidelity Investments, Mr. Byrnes worked at Deutsche Asset Management where he served as Vice President of the Investment Operations Group (2000-2003). |
Peter L. Lydecker (53) |
| Year of Election or Appointment: 2004 Assistant Treasurer of VIP International Capital Appreciation. Mr. Lydecker also serves as Assistant Treasurer of other Fidelity funds (2004) and is an employee of FMR. |
Paul M. Murphy (60) |
| Year of Election or Appointment: 2007 Assistant Treasurer of VIP International Capital Appreciation. Mr. Murphy also serves as Assistant Treasurer of other Fidelity funds (2007-present) and is an employee of FMR (2007-present). Previously, Mr. Murphy served as Chief Financial Officer of the Fidelity Funds (2005-2006), Vice President and Associate General Counsel of FMR (2007), and Senior Vice President of Fidelity Pricing and Cash Management Services Group (FPCMS) (1994-2007). |
Gary W. Ryan (49) |
| Year of Election or Appointment: 2005 Assistant Treasurer of VIP International Capital Appreciation. Mr. Ryan also serves as Assistant Treasurer of other Fidelity funds (2005-present) and is an employee of FMR (2005-present). Previously, Mr. Ryan served as Vice President of Fund Reporting in FPCMS (1999-2005). |
** FMR Corp. merged with and into FMR LLC on October 1, 2007. Any references to FMR LLC for prior periods are deemed to be references to the prior entity.
Annual Report
Distributions
The Board of Trustees of VIP International Capital Appreciation Portfolio voted to pay to shareholders of record at the opening of business on record date, the following distributions per share derived from capital gains realized from sales of portfolio securities:
| Pay Date | Record Date | Capital Gains |
Initial Class | 02/08/08 | 02/08/08 | $0.055 |
Service Class | 02/08/08 | 02/08/08 | $0.055 |
Service Class 2 | 02/08/08 | 02/08/08 | $0.055 |
The fund hereby designates as a capital gain dividend with respect to the taxable year ended December 31, 2007, $1,162,866, or, if subsequently determined to be different, the net capital gain of such year.
The amounts per share which represent income derived from sources within, and taxes paid to, forrign countries or possessions of the United States are as follows:
| Pay Date | Income | Taxes |
Initial Class | 12/21/07 | $0.159 | $0.023 |
Service Class | 12/21/07 | $0.157 | $0.023 |
Service Class 2 | 12/21/07 | $0.155 | $0.023 |
The fund will notify shareholders in January 2008 of amounts for use in preparing 2007 income tax returns.
Annual Report
Board Approval of Investment Advisory Contracts and Management Fees
VIP International Capital Appreciation Portfolio
Each year, typically in July, the Board of Trustees, including the Independent Trustees (together, the Board), votes on the renewal of the management contract and sub-advisory agreements (together, the Advisory Contracts) for the fund. The Board, assisted by the advice of fund counsel and Independent Trustees' counsel, requests and considers a broad range of information throughout the year.
The Board meets regularly each month except August and takes into account throughout the year matters bearing on Advisory Contracts. The Board, acting directly and through its separate committees, considers at each of its meetings factors that are relevant to the annual renewal of the fund's Advisory Contracts, including the services and support provided to the fund and its shareholders. At the time of the renewal, the Board had 12 standing committees, each composed of Independent Trustees with varying backgrounds, to which the Board has assigned specific subject matter responsibilities in order to enhance effective decision-making by the Board. Each committee has adopted a written charter outlining the structure and purposes of the committee. One such committee, the Equity Contract Committee, meets periodically as needed throughout the year to consider matters specifically related to the annual renewal of Advisory Contracts. The committee requests and receives information on, and makes recommendations to the Independent Trustees concerning, the approval and annual review of the Advisory Contracts.
At its July 2007 meeting, the Board of Trustees, including the Independent Trustees, unanimously determined to renew the Advisory Contracts for the fund. In reaching its determination, the Board considered all factors it believed relevant, including (i) the nature, extent, and quality of the services to be provided to the fund and its shareholders (including the investment performance of the fund); (ii) the competitiveness of the management fee and total expenses of the fund; (iii) the total costs of the services to be provided by and the profits to be realized by the investment adviser and its affiliates from the relationship with the fund; (iv) the extent to which economies of scale would be realized as the fund grows; and (v) whether fee levels reflect these economies of scale, if any, for the benefit of fund shareholders. The Board also approved amendments to the fund's agreements with foreign sub-advisers to clarify that each sub-adviser provides services as an independent contractor.
In determining whether to renew the Advisory Contracts for the fund, the Board ultimately reached a determination, with the assistance of fund counsel and Independent Trustees' counsel, that the renewal of the Advisory Contracts and the compensation to be received by Fidelity under the management contract is consistent with Fidelity's fiduciary duty under applicable law. In addition to evaluating the specific factors noted above, the Board, in reaching its determination, is aware that shareholders in the fund have a broad range of investment choices available to them, including a wide choice among mutual funds offered by competitors to Fidelity, and that the fund's shareholders, with the opportunity to review and weigh the disclosure provided by the fund in its prospectus and other public disclosures, have chosen to invest in this fund, managed by Fidelity.
Nature, Extent, and Quality of Services Provided. The Board considered staffing within the investment adviser, FMR, and the sub-advisers (together, the Investment Advisers), including the backgrounds of the fund's portfolio managers and the fund's investment objective and discipline. The Independent Trustees also had discussions with senior management of Fidelity's investment operations and investment groups. The Board considered the structure of the portfolio manager compensation program and whether this structure provides appropriate incentives.
Resources Dedicated to Investment Management and Support Services. The Board reviewed the size, education, and experience of the Investment Advisers' investment staff, their use of technology, and the Investment Advisers' approach to recruiting, training, and retaining portfolio managers and other research, advisory, and management personnel. The Board considered Fidelity's extensive global research capabilities that enable the Investment Advisers to aggregate data from various sources in an effort to produce positive investment results. The Board noted that Fidelity's analysts have access to a variety of technological tools that enable them to perform both fundamental and quantitative analysis and to specialize in various disciplines. The Board also considered that Fidelity's portfolio managers and analysts have access to daily portfolio attribution that allows for monitoring of a fund's portfolio, as well as an electronic communication system that provides immediate real-time access to research concerning issuers and credit enhancers.
Shareholder and Administrative Services. The Board considered (i) the nature, extent, quality, and cost of advisory, administrative, distribution, and shareholder services performed by the Investment Advisers and their affiliates under the Advisory Contracts and under separate agreements covering transfer agency, pricing and bookkeeping, and securities lending services for the fund; (ii) the nature and extent of the Investment Advisers' supervision of third party service providers, principally custodians and subcustodians; and (iii) the resources devoted to, and the record of compliance with, the fund's compliance policies and procedures. The Board reviewed the allocation of fund brokerage, including allocations to brokers affiliated with the Investment Advisers, the use of brokerage commissions to pay fund expenses, and the use of "soft" commission dollars to pay for research services. The Board also considered that Fidelity voluntarily pays for market data out of its own resources.
The Board noted that the growth of fund assets across the complex allows Fidelity to reinvest in the development of services designed to enhance the value or convenience of the Fidelity funds as investment vehicles. These services include 24-hour access to account information and market information through phone representatives and over the Internet, and investor education materials and asset allocation tools.
Investment in a Large Fund Family. The Board considered the benefits to shareholders of investing in a Fidelity fund, including the benefits of investing in a fund that is part of a large family of funds offering a variety of investment disciplines and providing for a large variety of mutual fund investor services. The Board noted that, since the last Advisory Contract renewals in July 2006, Fidelity has taken a number of actions that benefited particular funds, including (i) dedicating additional resources to investment research and to restructure the investment research teams; (ii) contractually agreeing to reduce the management fee on Fidelity Advisor Floating Rate High Income Fund; (iii) contractually agreeing to reduce the management fees on Fidelity's California, Massachusetts, New Jersey, and New York AMT Tax-Free Money Market Funds, launching new Institutional Classes and Service Classes of these funds, and contractually agreeing to impose expense limitations on these funds; (iv) eliminating the exchange fee on the Fidelity Select Portfolios and reducing the pricing and bookkeeping fee rates for these funds; (v) reducing the maximum transfer agency fee rates on high income funds and certain equity funds; (vi) proposing amended management contracts that, if approved by shareholders, will add a performance adjustment component to the management fees paid by 18 Fidelity Advisor equity funds; (vii) contractually agreeing to reduce fees for Ultra-Short Central Fund and the money market Central Funds; (viii) waiving the Fidelity Advisor funds' contingent deferred sales charge on certain redemptions made through systematic withdrawal programs; and (ix) amending the management contracts for equity and fixed-income funds whose management contracts incorporate a "group fee" structure by adding four new fee "breakpoints" to the group fee rate schedules.
Annual Report
Board Approval of Investment Advisory Contracts and Management Fees - continued
Investment Performance and Compliance. The Board considered whether the fund has operated within its investment objective, as well as its record of compliance with its investment restrictions. It also reviewed the fund's absolute investment performance for each class, as well as the fund's relative investment performance for each class measured against (i) a broad-based securities market index, and (ii) a custom peer group of mutual funds deemed appropriate by the Board. Because the fund had been in existence less than three calendar years, the following chart considered by the Board shows, for the one-year period ended December 31, 2006, the total returns of Initial Class R and Service Class 2 of the fund, the total returns of a broad-based securities market index ("benchmark"), and a range of total returns of a custom peer group of mutual funds defined by FMR based on categories assigned by Morningstar, Inc. The returns of Initial Class R and Service Class 2 show the performance of the highest and lowest performing classes, respectively. The box within the chart shows the 25th percentile return (bottom of box) and the 75th percentile return (top of box) of the peer group. Returns shown above the box are in the first quartile and returns shown below the box are in the fourth quartile. The percentage beaten numbers noted below the chart correspond to the percentile box and represent the percentage of funds in the peer group whose performance was equal to or lower than that of the class indicated. The fund's custom peer group, defined by FMR, is a peer group that FMR believes provides a more meaningful performance comparison than the peer group assigned by Morningstar, Inc. Morningstar, Inc. assigns mutual funds to categories based on their investment styles as measured by their underlying portfolio holdings.
VIP International Capital Appreciation Portfolio
The Board reviewed the fund's relative investment performance against its peer group and stated that the performance of Initial Class R of the fund was in the fourth quartile for the period shown. The Board also stated that the investment performance of the fund was lower than its benchmark for the period shown. The Board considered that the variations in performance among the fund's classes reflect the variations in class expenses, which result in lower performance for higher expense classes. The Board stated that it is difficult to evaluate in any comprehensive fashion the performance of the fund, in light of its relatively recent commencement of operations.
The Board considered that FMR has taken steps to refocus and strengthen equity research, equity portfolio management, and compliance.
Based on its review, and giving particular weight to the nature and quality of the resources dedicated by the Investment Advisers to maintain and improve relative performance, the Board concluded that the nature, extent, and quality of the services provided to the fund will benefit the fund's shareholders, particularly in light of the Board's view that the fund's shareholders benefit from investing in a fund that is part of a large family of funds offering a variety of investment disciplines and services.
Annual Report
Competitiveness of Management Fee and Total Fund Expenses. The Board considered the fund's management fee and total expenses compared to "mapped groups" of competitive funds and classes. Fidelity creates "mapped groups" by combining similar Lipper investment objective categories that have comparable management fee characteristics. Combining Lipper investment objective categories aids the Board's management fee and total expense comparisons by broadening the competitive group used for comparison and by reducing the number of universes to which various Fidelity funds are compared. The Board also considered supplemental information about how the fund's management fee and total expenses ranked relative to groups based on Lipper classifications, which take into account a fund's market capitalization and style.
The Board considered two proprietary management fee comparisons for the 12-month (or shorter) periods shown in the chart below. The group of Lipper funds used by the Board for management fee comparisons is referred to below as the "Total Mapped Group." The Total Mapped Group comparison focuses on a fund's standing relative to the total universe of comparable funds available to investors, in terms of gross management fees before expense reimbursements or caps. "TMG %" represents the percentage of funds in the Total Mapped Group that had management fees that were lower than the fund's. For example, a TMG % of 12% means that 88% of the funds in the Total Mapped Group had higher management fees than the fund. The "Asset-Size Peer Group" (ASPG) comparison focuses on a fund's standing relative to non-Fidelity funds similar in size to the fund within the Total Mapped Group. The ASPG represents at least 15% of the funds in the Total Mapped Group with comparable asset size and management fee characteristics, subject to a minimum of 50 funds (or all funds in the Total Mapped Group if fewer than 50). Additional information, such as the ASPG quartile in which the fund's management fee ranked, is also included in the chart and considered by the Board.
VIP International Capital Appreciation Portfolio
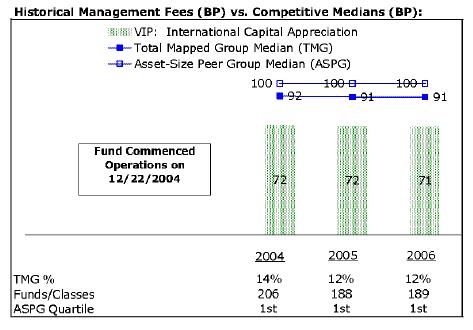
The Board noted that the fund's management fee ranked below the median of its Total Mapped Group and below the median of its ASPG for 2006.
Based on its review, the Board concluded that the fund's management fee was fair and reasonable in light of the services that the fund receives and the other factors considered.
In its review of each class's total expenses, the Board considered the fund's management fee as well as other fund or class expenses, as applicable, such as transfer agent fees, pricing and bookkeeping fees, fund-paid 12b-1 fees, and custodial, legal, and audit fees. The Board also noted the effects of any waivers and reimbursements on fees and expenses. As part of its review, the Board also considered current and historical total expenses of each class of the fund compared to competitive fund median expenses. Each class of the fund is compared to those funds and classes in the Total Mapped Group (used by the Board for management fee comparisons) that have a similar sales load structure.
The Board noted that the total expenses of each of Initial Class and Initial Class R ranked below its competitive median for 2006, and the total expenses of each of Investor Class R, Service Class, Service Class 2, Service Class R and Service Class 2 R ranked above its competitive median for 2006. The Board considered that the total expenses of Investor Class R were above the median primarily due to its higher transfer agent fee. The Board noted that the fund offers multiple classes, each of which has a different 12b-1 fee structure, and that the multiple structures are intended to offer a range of pricing options for the intermediary market. The Board also noted that the total expenses of the classes vary primarily by the level of their 12b-1 fees, although differences in transfer agent fees may also cause expenses to vary from class to class.
In its review of total expenses, the Board also considered Fidelity fee structures and other information on clients that FMR and its affiliates service in other competitive markets, such as other mutual funds advised or subadvised by FMR or its affiliates, pension plan clients, and other institutional clients.
Annual Report
Board Approval of Investment Advisory Contracts and Management Fees - continued
Based on its review, the Board concluded that the total expenses of each class of the fund were reasonable, although in some cases above the median of the universe presented for comparison, in light of the services that the fund and its shareholders receive and the other factors considered.
Costs of the Services and Profitability. The Board considered the revenues earned and the expenses incurred by Fidelity in conducting the business of developing, marketing, distributing, managing, administering and servicing the fund and its shareholders. The Board also considered the level of Fidelity's profits in respect of all the Fidelity funds.
On an annual basis, FMR presents to the Board Fidelity's profitability for the fund. Fidelity calculates the profitability for each fund, as well as aggregate profitability for groups of Fidelity funds and all Fidelity funds, using a series of detailed revenue and cost allocation methodologies which originate with the audited books and records of Fidelity. The Audit Committee of the Board reviews any significant changes from the prior year's methodologies.
PricewaterhouseCoopers LLP (PwC), independent registered public accounting firm and auditor to Fidelity and certain Fidelity funds, has been engaged annually by the Board as part of the Board's assessment of the results of Fidelity's profitability analysis. PwC's engagement includes the review and assessment of Fidelity's methodologies used in determining the revenues and expenses attributable to Fidelity's mutual fund business, and completion of agreed-upon procedures surrounding the mathematical accuracy of fund profitability and its conformity to allocation methodologies. After considering PwC's reports issued under the engagement and information provided by Fidelity, the Board believes that while other allocation methods may also be reasonable, Fidelity's profitability methodologies are reasonable in all material respects.
The Board has also reviewed Fidelity's non-fund businesses and any fall-out benefits related to the mutual fund business as well as cases where Fidelity's affiliates may benefit from or be related to the fund's business.
The Board considered the costs of the services provided by and the profits realized by Fidelity in connection with the operation of the fund and determined that the amount of profit is a fair entrepreneurial profit for the management of the fund.
Economies of Scale. The Board considered whether there have been economies of scale in respect of the management of the Fidelity funds, whether the Fidelity funds (including the fund) have appropriately benefited from any such economies of scale, and whether there is potential for realization of any further economies of scale. The Board considered the extent to which the fund will benefit from economies of scale through increased services to the fund, through waivers or reimbursements, or through fee or expense reductions.
The Board recognized that the fund's management contract incorporates a "group fee" structure, which provides for lower group fee rates as total fund assets under FMR's management increase, and for higher group fee rates as total fund assets under FMR's management decrease. FMR determines the group fee rates based on a tiered asset "breakpoint" schedule. In connection with the renewal of the fund's management contract, the Board approved amendments to the fund's management contract that added four new fee breakpoints to the group fee rate schedule for assets under FMR's management above $1,386 billion. The Board considered that the group fee rate declines under both the present and amended schedules, but that under the amended schedule, the group fee rate declines faster as assets under FMR's management exceed $1,386 billion. The Board considered that the group fee is designed to deliver the benefits of economies of scale to fund shareholders when total fund assets increase, even if assets of any particular fund are unchanged or have declined, because some portion of Fidelity's costs are attributable to services provided to all Fidelity funds, and all funds benefit if those costs can be allocated among more assets. The Board concluded that, given the group fee structure, fund shareholders will achieve a certain level of economies of scale as assets under FMR's management increase at the fund complex level, regardless of whether Fidelity achieves any such economies of scale.
The Board further concluded that any potential economies of scale are being shared between fund shareholders and Fidelity in an appropriate manner.
Additional Information Requested by the Board. In order to develop fully the factual basis for consideration of the Fidelity funds' Advisory Contracts, the Board requested and received additional information on several topics, including (i) fund performance trends and actions to be taken by FMR to improve certain funds' overall performance; (ii) Fidelity's portfolio manager compensation structure, including its effects on fund profitability and the extent to which portfolio manager compensation is linked to fund performance; (iii) Fidelity's fee structures; (iv) the funds' sub-advisory arrangements; and (v) accounts managed by Fidelity other than the Fidelity funds.
Based on its evaluation of all of the conclusions noted above, and after considering all material factors, the Board ultimately concluded that the advisory fee structures are fair and reasonable, and that the fund's Advisory Contracts should be renewed.
Annual Report
Annual Report
Investment Adviser
Fidelity Management & Research Company
Boston, MA
Investment Sub-Advisers
FMR Co., Inc.
Fidelity Management & Research (U.K.) Inc.
Fidelity Research & Analysis Company
Fidelity International Investment Advisors
Fidelity International Investment Advisors (U.K.) Limited
Fidelity Investments Japan Limited
General Distributor
Fidelity Distributors Corporation
Boston, MA
Transfer and Shareholder Servicing Agents
Fidelity Investments Institutional Operations Company, Inc.
Boston, MA
Fidelity Service Company, Inc.
Boston, MA
Custodian
Brown Brothers Harriman & Co.
Boston, MA
VIPCAP-ANN-0208
1.811843.103
Fidelity® Variable Insurance Products:
International Capital Appreciation Portfolio - Class R
Annual Report
December 31, 2007
(2_fidelity_logos) (Registered_Trademark)
Contents
Performance | <Click Here> | How the fund has done over time. |
Management's Discussion | <Click Here> | The manager's review of fund performance, strategy and outlook. |
Shareholder Expense Example | <Click Here> | An example of shareholder expenses. |
Investment Changes | <Click Here> | A summary of major shifts in the fund's investments over
the past six months. |
Investments | <Click Here> | A complete list of the fund's investments with their
market values. |
Financial Statements | <Click Here> | Statements of assets and liabilities, operations, and
changes in net assets, as well as financial highlights. |
Notes | <Click Here> | Notes to the financial statements. |
Report of Independent Registered Public Accounting Firm | <Click Here> | |
Trustees and Officers | <Click Here> | |
Distributions | <Click Here> | |
Board Approval of Investment Advisory Contracts and Management Fees | <Click Here> | |
| | |
To view a fund's proxy voting guidelines and proxy voting record for the 12-month period ended June 30, visit http://www.fidelity.com (search for "proxy voting guidelines") or visit the Securities and Exchange Commission's (SEC) web site at http://www.sec.gov. You may also call 1-877-208-0098 to request a free copy of the proxy voting guidelines.
Fidelity Variable Insurance Products are separate account options which are purchased through a variable insurance contract.
Standard & Poor's, S&P and S&P 500 are registered service marks of The McGraw-Hill Companies, Inc. and have been licensed for use by Fidelity Distributors Corporation.
Other third party marks appearing herein are the property of their respective owners.
All other marks appearing herein are registered or unregistered trademarks or service marks of FMR LLC or an affiliated company.
This report and the financial statements contained herein are submitted for the general information of the shareholders of the fund. This report is not authorized for distribution to prospective investors in the fund unless preceded or accompanied by an effective prospectus.
A fund files its complete schedule of portfolio holdings with the SEC for the first and third quarters of each fiscal year on Form N-Q. Forms N-Q are available on the SEC's web site at http://www.sec.gov. A fund's Forms N-Q may be reviewed and copied at the SEC's Public Reference Room in Washington, DC. Information regarding the operation of the SEC's Public Reference Room may be obtained by calling 1-800-SEC-0330. For a complete list of a fund's portfolio holdings, view the most recent holdings listing, semiannual report, or annual report on Fidelity's web site at http://www.fidelity.com or http://www.advisor.fidelity.com, as applicable.
NOT FDIC INSURED · MAY LOSE VALUE · NO BANK GUARANTEE
Neither the fund nor Fidelity Distributors Corporation is a bank.
Annual Report
Performance: The Bottom Line
Average annual total return reflects the change in the value of an investment, assuming reinvestment of a class' dividend income and capital gains (the profits earned upon the sale of securities that have grown in value, if any) and assuming a constant rate of performance each year. During periods of reimbursement by Fidelity, a fund's total return will be greater than it would be had the reimbursement not occurred. Performance numbers are net of all underlying fund operating expenses, but do not include any insurance charges imposed by your insurance company's separate account. If performance information included the effect of these additional charges, the total returns would be lower. How a fund did yesterday is no guarantee of how it will do tomorrow.
Average Annual Total Returns
Periods ended December 31, 2007 | Past 1 Year | Life of
FundA |
VIP International Capital Appreciation - Initial Class | 5.17% | 11.38% |
VIP International Capital Appreciation - Service Class | 5.06% | 11.25% |
VIP International Capital Appreciation - Service Class 2 | 4.89% | 11.09% |
VIP International Capital Appreciation - Initial Class R | 5.17% | 11.38% |
VIP International Capital Appreciation - Service Class R | 5.06% | 11.25% |
VIP International Capital Appreciation - Service Class 2R | 4.90% | 11.09% |
VIP International Capital Appreciation - Investor Class R B | 5.07% | 11.26% |
A From December 22, 2004.
B The initial offering of Investor Class R shares took place on July 21, 2005. Returns prior to July 21, 2005 are those of Initial Class R. If Investor Class R's transfer agent fee had been reflected, returns prior to July 21, 2005 would have been lower.
$10,000 Over Life of Fund
Let's say hypothetically that $10,000 was invested in VIP International Capital Appreciation Portfolio - Initial Class R on December 22, 2004, when the fund started. The chart shows how the value of your investment would have changed, and also shows how the Morgan Stanley Capital InternationalSM All Country World (MSCI® ACWI) ex USA Index performed over the same period.

Annual Report
Management's Discussion of Fund Performance
Comments from Sammy Simnegar, who will become Portfolio Manager of VIP International Capital Appreciation Portfolio on
January 1, 2008
U.S. equity markets, as measured by the bellwether Dow Jones Industrial AverageSM and the Standard & Poor's 500SM Index, registered their fifth consecutive year of positive returns in 2007, as the Dow rose 8.88% and the S&P 500® index advanced 5.49%. The tech-heavy NASDAQ Composite® Index did even better, increasing 10.55%. However, credit- and recession-related concerns carved deeply into stock prices late in 2007, pushing some major market measures into negative territory for the year overall, particularly smaller-cap and value-oriented benchmarks. Based largely on a weak U.S. dollar that boosted returns for U.S. investors, the Morgan Stanley Capital InternationalSM Europe, Australasia, and Far East (MSCI® EAFE®) Index - a gauge of developed stock markets outside the United States and Canada - beat most domestic equity measures, gaining 11.33%. Several European countries had outstanding performance, including Finland and Germany, while Australia also did very well. However, fallout from the credit crunch and concerns about export growth tempered U.K. stocks, while fears that Japanese financial companies would become embroiled in the U.S. subprime mortgage crisis contributed to a loss of more than 4% for the Japanese portion of the index. The emerging-markets stock asset class soared 39.78% according to the MSCI Emerging Markets index. The U.S. investment-grade bond market climbed 6.97% as measured by the Lehman Brothers® U.S. Aggregate Index, beating the 2.53% gain for the Merrill Lynch® U.S. High Yield Master II Constrained Index. The emerging-markets bond category shook off a sluggish first half of 2007 to finish the year with a respectable gain of 6.28% as measured by the J.P. Morgan Emerging Markets Bond Index (EMBI) Global, while the Citigroup® Non-U.S. Group of 7 Index - representing the debt performance of major global economies, excluding the United States - rose 13.05%.
VIP International Capital Appreciation Portfolio had disappointing results for the calendar year, trailing well behind the 16.80% return of the MSCI All Country World ex USA Index. (For specific portfolio performance results, please refer to the performance section of this report.) I believe there were three major variables that help explain why the fund underperformed as it did. First, it had a fairly substantial overweighting in Japan, which was the only regional market in the index that had negative performance during the period. Second, the Japanese stocks held in the portfolio - many of which were deeply undervalued names - tended to underperform to an even greater degree than did the Japanese market itself. Lastly, although the fund was overweighted in materials - the index's strongest sector during the period - it held some of the weakest-performing names in that group, which was far and away the biggest detracting factor. Among the stocks that hurt relative performance the worst were North American paper producers Catalyst Paper and AbitibiBowater; South African miner Gold Fields; and Japanese home and garden equipment maker Kubota. On the positive side of the ledger, good stock selection in the automobiles and components segment of consumer discretionary, along with solid picks in energy and an underweighting in the weak financials sector, offset some of the downside, with productive results from such stocks as Saskatchewan Wheat Pool, the Canadian grain handler; CNH Global, the Amsterdam-based maker of farm equipment; and Fiat, the Italian automaker. Favorable currency movements also helped. Several of these stocks were out-of-index holdings, and several were no longer held in the portfolio at period end.
The views expressed above reflect those of the portfolio manager(s) only through the end of the period as stated on the cover of this report and do not necessarily represent the views of Fidelity or any other person in the Fidelity organization. Any such views are subject to change at any time based upon market or other conditions and Fidelity disclaims any responsibility to update such views. These views may not be relied on as investment advice and, because investment decisions for a Fidelity fund are based on numerous factors, may not be relied on as an indication of trading intent on behalf of any Fidelity fund.
Annual Report
Shareholder Expense Example
As a shareholder of the Fund, you incur two types of costs: (1) transaction costs, including redemption fees, and (2) ongoing costs, including management fees, distribution and/or service (12b-1) fees and other Fund expenses. This Example is intended to help you understand your ongoing costs (in dollars) of investing in the Fund and to compare these costs with the ongoing costs of investing in other mutual funds.
The Example is based on an investment of $1,000 invested at the beginning of the period and held for the entire period (July 1, 2007 to December 31, 2007).
Actual Expenses
The first line of the accompanying table for each class of the Fund provides information about actual account values and actual expenses. You may use the information in this line, together with the amount you invested, to estimate the expenses that you paid over the period. Simply divide your account value by $1,000.00 (for example, an $8,600 account value divided by $1,000.00 = 8.6), then multiply the result by the number in the first line for a class of the Fund under the heading entitled "Expenses Paid During Period" to estimate the expenses you paid on your account during this period. The estimate of expenses does not include any fees or other expenses of any variable annuity or variable life insurance product. If they were, the estimate of expenses you paid during the period would be higher, and your ending account value would be lower. In addition, the Fund, as a shareholder in the underlying Fidelity Central Funds, will indirectly bear its pro rata share of the fees and expenses incurred by the underlying Fidelity Central Funds. These fees and expenses are not included in the Fund's annualized expense ratio used to calculate the expense estimate in the table below.
Hypothetical Example for Comparison Purposes
The second line of the accompanying table for each class of the Fund provides information about hypothetical account values and hypothetical expenses based on a Class' actual expense ratio and an assumed rate of return of 5% per year before expenses, which is not the Class' actual return. The hypothetical account values and expenses may not be used to estimate the actual ending account balance or expenses you paid for the period. You may use this information to compare the ongoing costs of investing in the Fund and other funds. To do so, compare this 5% hypothetical example with the 5% hypothetical examples that appear in the shareholder reports of the other funds. The estimate of expenses does not include any fees or other expenses of any variable annuity or variable life insurance product. If they were, the estimate of expenses you paid during the period would be higher, and your ending account value would be lower. In addition, the Fund, as a shareholder in the underlying Fidelity Central Funds, will indirectly bear its pro rata share of the fees and expenses incurred by the underlying Fidelity Central Funds. These fees and expenses are not included in the Fund's annualized expense ratio used to calculate the expense estimate in the table below.
Please note that the expenses shown in the table are meant to highlight your ongoing costs only and do not reflect any transaction costs. Therefore, the second line of the table is useful in comparing ongoing costs only, and will not help you determine the relative total costs of owning different funds. In addition, if these transactional costs were included, your costs would have been higher.
| Beginning
Account Value
July 1, 2007 | Ending
Account Value
December 31, 2007 | Expenses Paid
During Period*
July 1, 2007 to
December 31, 2007 |
Initial Class | | | |
Actual | $ 1,000.00 | $ 941.40 | $ 5.38 |
Hypothetical A | $ 1,000.00 | $ 1,019.66 | $ 5.60 |
Service Class | | | |
Actual | $ 1,000.00 | $ 941.00 | $ 5.87 |
Hypothetical A | $ 1,000.00 | $ 1,019.16 | $ 6.11 |
Service Class 2 | | | |
Actual | $ 1,000.00 | $ 940.20 | $ 6.60 |
Hypothetical A | $ 1,000.00 | $ 1,018.40 | $ 6.87 |
Initial Class R | | | |
Actual | $ 1,000.00 | $ 941.40 | $ 5.38 |
Hypothetical A | $ 1,000.00 | $ 1,019.66 | $ 5.60 |
Service Class R | | | |
Actual | $ 1,000.00 | $ 941.00 | $ 5.87 |
Hypothetical A | $ 1,000.00 | $ 1,019.16 | $ 6.11 |
Service Class 2R | | | |
Actual | $ 1,000.00 | $ 940.30 | $ 6.60 |
Hypothetical A | $ 1,000.00 | $ 1,018.40 | $ 6.87 |
Investor Class R | | | |
Actual | $ 1,000.00 | $ 940.90 | $ 5.92 |
Hypothetical A | $ 1,000.00 | $ 1,019.11 | $ 6.16 |
A 5% return per year before expenses
* Expenses are equal to each Class' annualized expense ratio (shown in the table below); multiplied by the average account value over the period, multiplied by 184/365 (to reflect the one-half year period).
Annual Report
Shareholder Expense Example - continued
| Annualized
Expense Ratio |
Initial Class | 1.10% |
Service Class | 1.20% |
Service Class 2 | 1.35% |
Initial Class R | 1.10% |
Service Class R | 1.20% |
Service Class 2R | 1.35% |
Investor Class R | 1.21% |
Annual Report
Investment Changes
Geographic Diversification (% of fund's net assets) |
As of December 31, 2007 |
| Japan | 18.0% | |
| United Kingdom | 12.3% | |
| Germany | 11.0% | |
| United States of America | 8.1% | |
| Switzerland | 7.5% | |
| Canada | 6.5% | |
| France | 4.0% | |
| Spain | 3.2% | |
| Cayman Islands | 2.6% | |
| Other | 26.8% | |

Percentages are adjusted for the effect of futures contracts, if applicable. |
|
As of June 30, 2007 |
| United States of America | 20.6% | |
| Japan | 20.6% | |
| Canada | 19.8% | |
| Hong Kong | 5.7% | |
| Netherlands | 4.3% | |
| South Africa | 4.0% | |
| Germany | 3.9% | |
| Switzerland | 2.7% | |
| Argentina | 2.3% | |
| Other | 16.1% | |

Percentages are adjusted for the effect of futures contracts, if applicable. |
Asset Allocation |
| % of fund's
net assets | % of fund's net assets
6 months ago |
Stocks | 94.4 | 86.1 |
Bonds | 0.0 | 2.9 |
Short-Term Investments and Net Other Assets | 5.6 | 11.0 |
Top Ten Stocks as of December 31, 2007 |
| % of fund's
net assets | % of fund's net assets
6 months ago |
E.ON AG (Germany, Electric Utilities) | 3.3 | 2.6 |
Shinsei Bank Ltd. (Japan, Commercial Banks) | 2.8 | 2.2 |
Actelion Ltd. (Reg.) (Switzerland, Biotechnology) | 2.0 | 1.7 |
Saskatchewan Wheat Pool, Inc. (Canada, Food Products) | 2.0 | 2.7 |
Takeda Pharmaceutical Co. Ltd. (Japan, Pharmaceuticals) | 1.9 | 3.8 |
SFCG Co. Ltd. (Japan, Consumer Finance) | 1.8 | 1.5 |
Royal Dutch Shell PLC Class A (United Kingdom, Oil, Gas & Consumable Fuels) | 1.7 | 0.0 |
UBS AG (NY Shares) (Switzerland, Capital Markets) | 1.6 | 0.0 |
Vodafone Group PLC sponsored ADR (United Kingdom, Wireless Telecommunication Services) | 1.6 | 0.0 |
Banco Santander SA (Spain, Commercial Banks) | 1.5 | 0.0 |
| 20.2 | |
Market Sectors as of December 31, 2007 |
| % of fund's
net assets | % of fund's net assets
6 months ago |
Financials | 24.9 | 14.9 |
Materials | 11.4 | 20.0 |
Health Care | 8.6 | 10.0 |
Energy | 8.6 | 8.9 |
Industrials | 8.0 | 9.7 |
Consumer Discretionary | 7.5 | 6.8 |
Consumer Staples | 7.1 | 10.7 |
Telecommunication Services | 6.7 | 1.7 |
Information Technology | 6.1 | 0.8 |
Utilities | 5.5 | 2.6 |
Annual Report
Investments December 31, 2007
Showing Percentage of Net Assets
Common Stocks - 94.0% |
| Shares | | Value |
Argentina - 0.3% |
Inversiones y Representaciones SA sponsored GDR (a) | 13,200 | | $ 192,192 |
Australia - 1.9% |
ABB Grain Ltd. | 279 | | 2,065 |
Babcock & Brown Ltd. | 9,935 | | 236,261 |
Commonwealth Bank of Australia | 7,536 | | 390,106 |
CSL Ltd. | 8,196 | | 261,024 |
Leighton Holdings Ltd. | 4,541 | | 243,421 |
Macquarie Group Ltd. | 4,045 | | 269,978 |
Newcrest Mining Ltd. | 1 | | 29 |
TOTAL AUSTRALIA | | 1,402,884 |
Austria - 0.3% |
voestalpine AG | 3,300 | | 238,152 |
Brazil - 2.2% |
Companhia Vale do Rio Doce (PN-A) sponsored ADR | 16,500 | | 461,670 |
MRV Engenharia e Participacoes SA | 8,500 | | 181,699 |
Petroleo Brasileiro SA - Petrobras (PN) sponsored ADR (non-vtg.) | 5,400 | | 519,588 |
Redecard SA | 11,000 | | 179,213 |
Uniao de Bancos Brasileiros SA (Unibanco) GDR | 2,200 | | 307,208 |
TOTAL BRAZIL | | 1,649,378 |
Canada - 6.5% |
Addax Petroleum, Inc. | 8,000 | | 345,831 |
Canadian Natural Resources Ltd. | 4,400 | | 321,425 |
Canadian Western Bank, Edmonton | 8,600 | | 271,360 |
Canfor Corp. | 13,400 | | 117,741 |
European Goldfields Ltd. (a) | 48,700 | | 268,609 |
IAMGOLD Corp. | 109,900 | | 894,863 |
Research In Motion Ltd. (a) | 3,000 | | 340,200 |
Saputo, Inc. | 7,900 | | 237,187 |
Saskatchewan Wheat Pool, Inc. (a)(e) | 109,800 | | 1,473,136 |
Suncor Energy, Inc. | 3,300 | | 358,415 |
Uranium One, Inc. (a) | 19,400 | | 172,414 |
TOTAL CANADA | | 4,801,181 |
Cayman Islands - 2.6% |
Agile Property Holdings Ltd. | 124,000 | | 225,828 |
Apex Silver Mines Ltd. (a) | 22,000 | | 335,280 |
Chaoda Modern Agriculture (Holdings) Ltd. | 214,000 | | 193,769 |
Hutchison Telecommunications International Ltd. | 634,000 | | 952,980 |
Lee & Man Paper Manufacturing Ltd. | 50,400 | | 221,390 |
TOTAL CAYMAN ISLANDS | | 1,929,247 |
China - 0.9% |
China Construction Bank Corp. (H Shares) | 379,000 | | 321,298 |
|
| Shares | | Value |
China Cosco Holdings Co. Ltd.
(H Shares) | 35,500 | | $ 98,117 |
China Resources Land Ltd. | 126,000 | | 278,596 |
TOTAL CHINA | | 698,011 |
Cyprus - 0.4% |
Marfin Popular Bank Public Co. | 19,700 | | 261,627 |
Czech Republic - 1.0% |
Ceske Energeticke Zavody AS | 3,400 | | 254,818 |
Philip Morris CR AS | 1,150 | | 494,539 |
TOTAL CZECH REPUBLIC | | 749,357 |
Denmark - 0.4% |
Vestas Wind Systems AS (a) | 2,400 | | 259,284 |
Finland - 1.3% |
Nokia Corp. sponsored ADR | 25,700 | | 986,623 |
France - 4.0% |
AXA SA | 12,900 | | 512,259 |
Bouygues SA | 3,200 | | 266,195 |
Electricite de France | 2,100 | | 249,715 |
Eutelsat Communications | 2,200 | | 65,337 |
Renault SA | 2,600 | | 368,099 |
Sanofi-Aventis sponsored ADR | 13,571 | | 617,888 |
Suez SA (France) | 6,600 | | 452,100 |
Vivendi | 8,960 | | 410,332 |
TOTAL FRANCE | | 2,941,925 |
Germany - 11.0% |
Allianz AG (Reg.) | 4,000 | | 850,000 |
Bayer AG | 4,800 | | 436,800 |
Beiersdorf AG | 2,800 | | 216,575 |
DaimlerChrysler AG | 7,900 | | 755,477 |
Deutsche Boerse AG | 1,600 | | 316,982 |
E.ON AG | 11,500 | | 2,451,584 |
Fresenius AG | 2,500 | | 204,316 |
K&S AG | 1,000 | | 237,517 |
Lanxess AG | 9,200 | | 451,130 |
MAN AG | 1,600 | | 265,728 |
RWE AG | 3,100 | | 434,317 |
Siemens AG sponsored ADR | 5,700 | | 896,952 |
SolarWorld AG | 3,800 | | 231,534 |
United Internet AG | 9,000 | | 218,691 |
Wacker Chemie AG | 800 | | 230,819 |
TOTAL GERMANY | | 8,198,422 |
Greece - 1.0% |
Coca-Cola Hellenic Bottling Co. SA (Bearer) | 6,600 | | 285,108 |
National Bank of Greece SA | 5,350 | | 366,810 |
Public Power Corp. of Greece | 2,300 | | 120,838 |
TOTAL GREECE | | 772,756 |
Hong Kong - 1.1% |
CNPC (Hong Kong) Ltd. | 480,000 | | 307,191 |
Common Stocks - continued |
| Shares | | Value |
Hong Kong - continued |
Hong Kong Exchanges & Clearing Ltd. | 10,500 | | $ 297,880 |
Li & Fung Ltd. | 56,000 | | 226,238 |
TOTAL HONG KONG | | 831,309 |
Hungary - 0.3% |
OTP Bank Ltd. | 4,900 | | 248,434 |
India - 1.3% |
Bharti Airtel Ltd. (a) | 7,050 | | 178,267 |
Housing Development Finance Corp. Ltd. | 2,666 | | 194,698 |
Reliance Industries Ltd. | 3,538 | | 258,825 |
Satyam Computer Services Ltd. | 16,095 | | 184,620 |
Sun Pharmaceutical Industries Ltd. | 5,894 | | 180,051 |
TOTAL INDIA | | 996,461 |
Israel - 1.1% |
Check Point Software Technologies Ltd. (a) | 12,200 | | 267,912 |
Israel Chemicals Ltd. | 19,600 | | 249,117 |
Partner Communications Co. Ltd. ADR | 13,100 | | 289,248 |
TOTAL ISRAEL | | 806,277 |
Italy - 0.4% |
Fiat SpA | 10,200 | | 263,406 |
Japan - 18.0% |
Aioi Insurance Co. Ltd. | 21,000 | | 99,295 |
Canon, Inc. | 11,300 | | 517,879 |
Denso Corp. | 5,000 | | 203,836 |
Ibiden Co. Ltd. | 2,800 | | 193,964 |
Japan Tobacco, Inc. | 37 | | 219,164 |
Konica Minolta Holdings, Inc. | 10,500 | | 184,406 |
Kubota Corp. | 35,000 | | 235,956 |
Makita Corp. | 4,100 | | 171,716 |
Marubeni Corp. | 15,000 | | 105,294 |
Millea Holdings, Inc. | 28,163 | | 937,828 |
Mitsubishi Corp. | 5,500 | | 149,123 |
Mitsubishi Electric Corp. | 20,000 | | 207,515 |
Mitsubishi Estate Co. Ltd. | 10,000 | | 238,677 |
Mitsui & Co. Ltd. | 7,000 | | 146,441 |
Mitsui Fudosan Co. Ltd. | 10,000 | | 216,051 |
Mitsui Marine & Fire Insurance Co. Ltd. | 90,000 | | 872,956 |
NGK Insulators Ltd. | 7,000 | | 188,016 |
Nikon Corp. | 5,000 | | 170,397 |
Nintendo Co. Ltd. | 500 | | 296,200 |
Nissin Healthcare Food Service Co. | 5,200 | | 59,442 |
ORIX Corp. | 1,210 | | 203,872 |
Parco Co. Ltd. | 54,300 | | 675,485 |
Seino Holdings Co. Ltd. | 24,200 | | 163,128 |
SFCG Co. Ltd. | 9,460 | | 1,308,531 |
Shinsei Bank Ltd. | 582,000 | | 2,116,733 |
Sumitomo Metal Mining Co. Ltd. | 11,000 | | 186,305 |
Sumitomo Mitsui Financial Group, Inc. | 59 | | 437,399 |
Takeda Pharmaceutical Co. Ltd. | 24,000 | | 1,404,615 |
|
| Shares | | Value |
Terumo Corp. | 3,300 | | $ 172,347 |
Tokyo Steel Manufacturing Co. Ltd. | 12,400 | | 137,356 |
Toyota Motor Corp. sponsored ADR | 9,100 | | 966,147 |
USS Co. Ltd. | 3,820 | | 237,662 |
TOTAL JAPAN | | 13,423,736 |
Korea (South) - 1.6% |
Daewoo Shipbuilding & Marine Engineering Co. Ltd. | 1,720 | | 94,810 |
Hyundai Heavy Industries Co. Ltd. | 260 | | 122,904 |
Kookmin Bank | 2,820 | | 207,862 |
KT&G Corp. | 2,110 | | 179,646 |
LG.Philips LCD Co. Ltd. sponsored ADR (a) | 15,500 | | 402,690 |
SK Energy Co. Ltd. | 1,010 | | 195,289 |
TOTAL KOREA (SOUTH) | | 1,203,201 |
Luxembourg - 0.6% |
Evraz Group SA GDR | 2,700 | | 209,250 |
Oriflame Cosmetics SA unit | 4,200 | | 268,273 |
TOTAL LUXEMBOURG | | 477,523 |
Malaysia - 0.3% |
KNM Group Bhd | 105,300 | | 245,180 |
Mexico - 1.1% |
America Movil SAB de CV Series L sponsored ADR | 6,100 | | 374,479 |
Desarrolladora Homex Sab de CV (a) | 34,300 | | 282,702 |
Grupo Mexico SA de CV Series B | 30,077 | | 188,849 |
TOTAL MEXICO | | 846,030 |
Netherlands - 1.4% |
Heineken NV (Bearer) | 3,900 | | 249,210 |
Koninklijke KPN NV | 19,900 | | 361,283 |
Koninklijke Philips Electronics NV | 9,800 | | 418,950 |
TOTAL NETHERLANDS | | 1,029,443 |
Norway - 1.0% |
Aker Kvaerner ASA | 8,750 | | 232,657 |
Petroleum Geo-Services ASA | 8,100 | | 235,123 |
Yara International ASA | 5,200 | | 240,648 |
TOTAL NORWAY | | 708,428 |
Russia - 1.7% |
Lukoil Oil Co. sponsored ADR | 3,400 | | 293,420 |
OAO Gazprom sponsored ADR | 11,500 | | 647,450 |
Sberbank (Savings Bank of the Russian Federation) GDR | 628 | | 340,023 |
TOTAL RUSSIA | | 1,280,893 |
Singapore - 0.2% |
Keppel Corp. Ltd. | 15,000 | | 135,280 |
South Africa - 2.1% |
African Bank Investments Ltd. | 61,800 | | 297,250 |
Bidvest Group Ltd. | 7,900 | | 138,750 |
Common Stocks - continued |
| Shares | | Value |
South Africa - continued |
Exxaro Resources Ltd. | 22,982 | | $ 346,527 |
Gold Fields Ltd. sponsored ADR | 23,500 | | 333,700 |
MTN Group Ltd. | 16,800 | | 313,575 |
Murray & Roberts Holdings Ltd. | 10,000 | | 148,669 |
TOTAL SOUTH AFRICA | | 1,578,471 |
Spain - 3.2% |
Banco Santander SA | 51,600 | | 1,111,464 |
Grifols SA | 11,896 | | 267,533 |
Grupo Acciona SA | 800 | | 253,177 |
Telefonica SA | 24,000 | | 780,720 |
TOTAL SPAIN | | 2,412,894 |
Sweden - 1.0% |
Alfa Laval AB | 4,100 | | 230,814 |
Swedish Match Co. | 10,000 | | 238,950 |
TeliaSonera AB | 29,000 | | 271,351 |
TOTAL SWEDEN | | 741,115 |
Switzerland - 7.5% |
ABB Ltd. (Reg.) | 18,552 | | 533,986 |
Actelion Ltd. (Reg.) (a) | 32,909 | | 1,511,439 |
Roche Holding AG (participation certificate) | 3,956 | | 675,685 |
Swiss Life Holding | 963 | | 240,474 |
Syngenta AG (Switzerland) | 1,432 | | 362,726 |
The Swatch Group AG (Reg.) | 6,805 | | 401,407 |
UBS AG (NY Shares) | 25,500 | | 1,173,000 |
Zurich Financial Services AG (Reg.) | 2,413 | | 707,952 |
TOTAL SWITZERLAND | | 5,606,669 |
Taiwan - 0.7% |
Acer, Inc. | 123,000 | | 240,842 |
AU Optronics Corp. sponsored ADR | 13,200 | | 253,440 |
Taiwan Mobile Co. Ltd. | 9,000 | | 12,072 |
TOTAL TAIWAN | | 506,354 |
Turkey - 0.8% |
Tupras-Turkiye Petrol Rafinerileri AS | 10,000 | | 293,299 |
Turkiye Garanti Bankasi AS | 29,600 | | 266,153 |
TOTAL TURKEY | | 559,452 |
United Kingdom - 12.3% |
BAE Systems PLC | 39,800 | | 393,802 |
BG Group PLC | 21,500 | | 491,275 |
British American Tobacco PLC | 14,100 | | 553,848 |
Cairn Energy PLC (a) | 1,900 | | 116,044 |
International Power PLC | 27,300 | | 251,843 |
Lloyds TSB Group PLC | 49,800 | | 467,021 |
Man Group plc | 30,050 | | 339,721 |
Marks & Spencer Group PLC | 23,800 | | 264,807 |
Meggitt PLC | 43,800 | | 289,572 |
Reckitt Benckiser Group PLC | 5,200 | | 301,063 |
Rio Tinto PLC sponsored ADR | 2,300 | | 965,770 |
|
| Shares | | Value |
Royal Dutch Shell PLC Class A | 30,600 | | $ 1,283,438 |
Shire PLC | 14,000 | | 321,767 |
Sibir Energy PLC | 8,200 | | 93,680 |
Standard Chartered PLC | 19,300 | | 707,104 |
Tesco PLC | 50,200 | | 476,009 |
Vedanta Resources PLC | 5,400 | | 219,515 |
Vodafone Group PLC sponsored ADR | 31,100 | | 1,160,652 |
Xstrata PLC | 5,900 | | 416,146 |
TOTAL UNITED KINGDOM | | 9,113,077 |
United States of America - 2.5% |
AbitibiBowater, Inc. (d) | 36,661 | | 755,583 |
Apple, Inc. (a) | 1,300 | | 257,504 |
Synthes, Inc. | 6,536 | | 810,872 |
TOTAL UNITED STATES OF AMERICA | | 1,823,959 |
TOTAL COMMON STOCKS (Cost $69,597,475) | 69,918,631 |
Nonconvertible Preferred Stocks - 0.4% |
| | | |
Italy - 0.4% |
Istituto Finanziario Industriale SpA (IFI) (a)
(Cost $379,929) | 9,600 | | 326,439 |
Money Market Funds - 7.0% |
| | | |
Fidelity Cash Central Fund, 4.58% (b) | 4,020,226 | | 4,020,226 |
Fidelity Securities Lending Cash Central Fund, 4.65% (b)(c) | 1,199,356 | | 1,199,356 |
TOTAL MONEY MARKET FUNDS (Cost $5,219,582) | 5,219,582 |
TOTAL INVESTMENT PORTFOLIO - 101.4% (Cost $75,196,986) | | 75,464,652 |
NET OTHER ASSETS - (1.4)% | | (1,063,363) |
NET ASSETS - 100% | $ 74,401,289 |
Legend |
(a) Non-income producing |
(b) Affiliated fund that is available only to investment companies and other accounts managed by Fidelity Investments. The rate quoted is the annualized seven-day yield of the fund at period end. A complete unaudited listing of the fund's holdings as of its most recent quarter end is available upon request. |
(c) Investment made with cash collateral received from securities on loan. |
(d) Security or a portion of the security is on loan at period end. |
(e) Security exempt from registration under Rule 144A of the Securities Act of 1933. These securities may be resold in transactions exempt from registration, normally to qualified institutional buyers. At the end of the period, the value of these securities amounted to $1,473,136 or 2.0% of net assets. |
Affiliated Central Funds |
Information regarding fiscal year to date income earned by the Fund from investments in Fidelity Central Funds is as follows: |
Fund | Income earned |
Fidelity Cash Central Fund | $ 376,533 |
Fidelity Securities Lending Cash Central Fund | 35,702 |
Total | $ 412,235 |
Income Tax Information |
The fund intends to elect to defer to its fiscal year ending December 31, 2008 approximately $4,337,018 of losses recognized during the period November 1, 2007 to December 31, 2007. |
See accompanying notes which are an integral part of the financial statements.
Annual Report
Financial Statements
Statement of Assets and Liabilities
| December 31, 2007 |
Assets | | |
Investment in securities, at value (including securities loaned of $1,149,708) - See accompanying schedule: Unaffiliated issuers (cost $69,977,404) | $ 70,245,070 | |
Fidelity Central Funds (cost $5,219,582) | 5,219,582 | |
Total Investments (cost $75,196,986) | | $ 75,464,652 |
Cash | | 570,385 |
Foreign currency held at value (cost $471,273) | | 471,273 |
Receivable for investments sold | | 13,450,758 |
Receivable for fund shares sold | | 5,210 |
Dividends receivable | | 53,102 |
Distributions receivable from Fidelity Central Funds | | 34,769 |
Prepaid expenses | | 250 |
Other receivables | | 6,197 |
Total assets | | 90,056,596 |
| | |
Liabilities | | |
Payable for investments purchased | $ 14,179,337 | |
Payable for fund shares redeemed | 159,756 | |
Accrued management fee | 44,896 | |
Distribution fees payable | 299 | |
Other affiliated payables | 11,145 | |
Other payables and accrued expenses | 60,518 | |
Collateral on securities loaned, at value | 1,199,356 | |
Total liabilities | | 15,655,307 |
| | |
Net Assets | | $ 74,401,289 |
Net Assets consist of: | | |
Paid in capital | | $ 78,660,817 |
Distributions in excess of net investment income | | (2,078) |
Accumulated undistributed net realized gain (loss) on investments and foreign currency transactions | | (4,507,039) |
Net unrealized appreciation (depreciation) on investments and assets and liabilities in foreign currencies | | 249,589 |
Net Assets | | $ 74,401,289 |
Statement of Assets and Liabilities - continued
| December 31, 2007 |
Initial Class:
Net Asset Value, offering price and redemption price per share ($1,409,020 ÷ 123,197 shares) | | $ 11.44 |
| | |
Service Class:
Net Asset Value, offering price and redemption price per share ($414,251 ÷ 36,237 shares) | | $ 11.43 |
| | |
Service Class 2:
Net Asset Value, offering price and redemption price per share ($549,771 ÷ 48,108 shares) | | $ 11.43 |
| | |
Initial Class R:
Net Asset Value, offering price and redemption price per share ($32,344,785 ÷ 2,827,355 shares) | | $ 11.44 |
| | |
Service Class R:
Net Asset Value, offering price and redemption price per share ($414,251 ÷ 36,237 shares) | | $ 11.43 |
| | |
Service Class 2R:
Net Asset Value, offering price and redemption price per share ($549,827 ÷ 48,111 shares) | | $ 11.43 |
| | |
Investor Class R:
Net Asset Value, offering price and redemption price per share ($38,719,384 ÷ 3,393,838 shares) | | $ 11.41 |
See accompanying notes which are an integral part of the financial statements.
Annual Report
Statement of Operations
| Year ended December 31, 2007 |
Investment Income | | |
Dividends | | $ 833,047 |
Special dividends | | 94,302 |
Interest | | 19,005 |
Income from Fidelity Central Funds | | 412,235 |
| | 1,358,589 |
Less foreign taxes withheld | | (89,266) |
Total income | | 1,269,323 |
| | |
Expenses | | |
Management fee | $ 475,959 | |
Transfer agent fees | 92,264 | |
Distribution fees | 3,706 | |
Accounting and security lending fees | 35,326 | |
Custodian fees and expenses | 93,458 | |
Independent trustees' compensation | 225 | |
Audit | 70,907 | |
Legal | 7,299 | |
Miscellaneous | 10,195 | |
Total expenses before reductions | 789,339 | |
Expense reductions | (27,888) | 761,451 |
Net investment income (loss) | | 507,872 |
Realized and Unrealized Gain (Loss) Net realized gain (loss) on: | | |
Investment securities: | | |
Unaffiliated issuers (net of foreign taxes of $42,298) | 4,821,806 | |
Foreign currency transactions | 290,818 | |
Total net realized gain (loss) | | 5,112,624 |
Change in net unrealized appreciation (depreciation) on: Investment securities (net of increase in deferred foreign taxes of $2,381) | (4,336,014) | |
Assets and liabilities in foreign currencies | (16,820) | |
Total change in net unrealized appreciation (depreciation) | | (4,352,834) |
Net gain (loss) | | 759,790 |
Net increase (decrease) in net assets resulting from operations | | $ 1,267,662 |
Statement of Changes in Net Assets
| Year ended
December 31, 2007 | Year ended
December 31, 2006 |
Increase (Decrease) in Net Assets | | |
Operations | | |
Net investment income (loss) | $ 507,872 | $ 325,722 |
Net realized gain (loss) | 5,112,624 | 1,311,750 |
Change in net unrealized appreciation (depreciation) | (4,352,834) | 3,055,530 |
Net increase (decrease) in net assets resulting from operations | 1,267,662 | 4,693,002 |
Distributions to shareholders from net investment income | (488,571) | (324,160) |
Distributions to shareholders from net realized gain | (9,900,180) | (1,106,887) |
Total distributions | (10,388,751) | (1,431,047) |
Share transactions - net increase (decrease) | 38,585,498 | 20,509,608 |
Redemption fees | 18,995 | 15,654 |
Total increase (decrease) in net assets | 29,483,404 | 23,787,217 |
| | |
Net Assets | | |
Beginning of period | 44,917,885 | 21,130,668 |
End of period (including distributions in excess of net investment income of $2,078 and undistributed net investment income of $1,561, respectively) | $ 74,401,289 | $ 44,917,885 |
See accompanying notes which are an integral part of the financial statements.
Annual Report
Financial Highlights - Initial Class
Years ended December 31, | 2007 | 2006 | 2005 | 2004 I |
Selected Per-Share Data | | | | |
Net asset value, beginning of period | $ 12.68 | $ 11.46 | $ 10.24 | $ 10.00 |
Income from Investment Operations | | | | |
Net investment income (loss) E | .11 H | .11 | .06 | - |
Net realized and unrealized gain (loss) | .53 | 1.54 | 1.21 | .24 |
Total from investment operations | .64 | 1.65 | 1.27 | .24 |
Distributions from net investment income | (.09) | (.10) | (.02) | - |
Distributions from net realized gain | (1.79) | (.34) | (.02) | - |
Total distributions | (1.88) | (.43) M | (.05) L | - |
Redemption fees added to paid in capitalE | - K | - K | - K | - |
Net asset value, end of period | $ 11.44 | $ 12.68 | $ 11.46 | $ 10.24 |
Total Return B,C,D | 5.17% | 14.49% | 12.37% | 2.40% |
Ratios to Average Net Assets F,J | | | | |
Expenses before reductions | 1.20% | 1.80% | 3.55% | 43.27% A |
Expenses net of fee waivers, if any | 1.10% | 1.10% | 1.10% | 1.10% A |
Expenses net of all reductions | 1.07% | 1.00% | .91% | .92% A |
Net investment income (loss) | .82% H | .95% | .53% | .80% A |
Supplemental Data | | | | |
Net assets, end of period (000 omitted) | $ 1,409 | $ 1,357 | $ 9,367 | $ 307 |
Portfolio turnover rate G | 224% | 185% | 176% | 52% A |
A Annualized B Total returns for periods of less than one year are not annualized. C Total returns do not reflect charges attributable to your insurance company's separate account. Inclusion of these charges would reduce the total returns shown. D Total returns would have been lower had certain expenses not been reduced during the periods shown. E Calculated based on average shares outstanding during the period. F Fees and expenses of the underlying Fidelity Central Funds are not included in the Fund's expense ratio. The Fund indirectly bears its proportionate share of the expenses of any underlying Fidelity Central Funds. G Amount does not include the portfolio activity of any underlying Fidelity Central Funds. H Investment income per share reflects a special dividend which amounted to $.02 per share. Excluding the special dividend, the ratio of net investment income (loss) to average net assets would have been .68%. I For the period December 22, 2004 (commencement of operations) to December 31, 2004. J Expense ratios reflect operating expenses of the class. Expenses before reductions do not reflect amounts reimbursed by the investment adviser or reductions from brokerage service arrangements or other expense offset arrangements and do not represent the amount paid by the class during periods when reimbursements or reductions occur. Expenses net of fee waivers reflect expenses after reimbursement by the investment adviser but prior to reductions from brokerage service arrangements or other expense offset arrangements. Expenses net of all reductions represent the net expenses paid by the class. K Amount represents less than $.01 per share. L Total distributions of $.05 per share is comprised of distributions from net investment income of $.022 and distributions from net realized gain of $.023 per share. M Total distributions of $.43 per share is comprised of distributions from net investment income of $.095 and distributions from net realized gain of $.335 per share. |
Financial Highlights - Service Class
Years ended December 31, | 2007 | 2006 | 2005 | 2004 I |
Selected Per-Share Data | | | | |
Net asset value, beginning of period | $ 12.67 | $ 11.46 | $ 10.24 | $ 10.00 |
Income from Investment Operations | | | | |
Net investment income (loss) E | .10H | .10 | .10 | -K |
Net realized and unrealized gain (loss) | .53 | 1.53 | 1.16 | .24 |
Total from investment operations | .63 | 1.63 | 1.26 | .24 |
Distributions from net investment income | (.08) | (.08) | (.01) | - |
Distributions from net realized gain | (1.79) | (.34) | (.02) | - |
Total distributions | (1.87) | (.42) M | (.04) L | - |
Redemption fees added to paid in capitalE | - K | - K | - K | - |
Net asset value, end of period | $ 11.43 | $ 12.67 | $ 11.46 | $ 10.24 |
Total Return B,C,D | 5.06% | 14.30% | 12.27% | 2.40% |
Ratios to Average Net Assets F,J | | | | |
Expenses before reductions | 1.20% | 1.62% | 4.35% | 43.36% A |
Expenses net of fee waivers, if any | 1.20% | 1.20% | 1.20% | 1.20% A |
Expenses net of all reductions | 1.16% | 1.10% | 1.01% | 1.01% A |
Net investment income (loss) | .72% H | .85% | .98% | .71% A |
Supplemental Data | | | | |
Net assets, end of period (000 omitted) | $ 414 | $ 394 | $ 345 | $ 307 |
Portfolio turnover rate G | 224% | 185% | 176% | 52% A |
A Annualized B Total returns for periods of less than one year are not annualized. C Total returns do not reflect charges attributable to your insurance company's separate account. Inclusion of these charges would reduce the total returns shown. D Total returns would have been lower had certain expenses not been reduced during the periods shown. E Calculated based on average shares outstanding during the period. F Fees and expenses of the underlying Fidelity Central Funds are not included in the Fund's expense ratio. The Fund indirectly bears its proportionate share of the expenses of any underlying Fidelity Central Funds. G Amount does not include the portfolio activity of any underlying Fidelity Central Funds. H Investment income per share reflects a special dividend which amounted to $.02 per share. Excluding the special dividend, the ratio of net investment income (loss) to average net assets would have been .58%. I For the period December 22, 2004 (commencement of operations) to December 31, 2004. J Expense ratios reflect operating expenses of the class. Expenses before reductions do not reflect amounts reimbursed by the investment adviser or reductions from brokerage service arrangements or other expense offset arrangements and do not represent the amount paid by the class during periods when reimbursements or reductions occur. Expenses net of fee waivers reflect expenses after reimbursement by the investment adviser but prior to reductions from brokerage service arrangements or other expense offset arrangements. Expenses net of all reductions represent the net expenses paid by the class. K Amount represents less than $.01 per share. L Total distributions of $.04 per share is comprised of distributions from net investment income of $.012 and distributions from net realized gain of $.023 per share. M Total distributions of $.42 per share is comprised of distributions from net investment income of $.084 and distributions from net realized gain of $.335 per share. |
See accompanying notes which are an integral part of the financial statements.
Annual Report
Financial Highlights - Service Class 2
Years ended December 31, | 2007 | 2006 | 2005 | 2004 I |
Selected Per-Share Data | | | | |
Net asset value, beginning of period | $ 12.67 | $ 11.46 | $ 10.24 | $ 10.00 |
Income from Investment Operations | | | | |
Net investment income (loss) E | .08 H | .08 | .09 | - |
Net realized and unrealized gain (loss) | .53 | 1.53 | 1.15 | .24 |
Total from investment operations | .61 | 1.61 | 1.24 | .24 |
Distributions from net investment income | (.06) | (.07) | - | - |
Distributions from net realized gain | (1.79) | (.34) | (.02) | - |
Total distributions | (1.85) | (.40) M | (.02) L | - |
Redemption fees added to paid in capital E | - K | - K | - K | - |
Net asset value, end of period | $ 11.43 | $ 12.67 | $ 11.46 | $ 10.24 |
Total Return B,C,D | 4.89% | 14.14% | 12.12% | 2.40% |
Ratios to Average Net Assets F,J | | | | |
Expenses before reductions | 1.41% | 1.77% | 4.50% | 43.51% A |
Expenses net of fee waivers, if any | 1.35% | 1.35% | 1.35% | 1.35% A |
Expenses net of all reductions | 1.32% | 1.25% | 1.16% | 1.17% A |
Net investment income (loss) | .57% H | .70% | .83% | .55% A |
Supplemental Data | | | | |
Net assets, end of period (000 omitted) | $ 550 | $ 524 | $ 459 | $ 410 |
Portfolio turnover rate G | 224% | 185% | 176% | 52% A |
A Annualized B Total returns for periods of less than one year are not annualized. C Total returns do not reflect charges attributable to your insurance company's separate account. Inclusion of these charges would reduce the total returns shown. D Total returns would have been lower had certain expenses not been reduced during the periods shown. E Calculated based on average shares outstanding during the period. F Fees and expenses of the underlying Fidelity Central Funds are not included in the Fund's expense ratio. The Fund indirectly bears its proportionate share of the expenses of any underlying Fidelity Central Funds. G Amount does not include the portfolio activity of any underlying Fidelity Central Funds. H Investment income per share reflects a special dividend which amounted to $.02 per share. Excluding the special dividend, the ratio of net investment income (loss) to average net assets would have been .43%. I For the period December 22, 2004 (commencement of operations) to December 31, 2004 J Expense ratios reflect operating expenses of the class. Expenses before reductions do not reflect amounts reimbursed by the investment adviser or reductions from brokerage service arrangements or other expense offset arrangements and do not represent the amount paid by the class during periods when reimbursements or reductions occur. Expenses net of fee waivers reflect expenses after reimbursement by the investment adviser but prior to reductions from brokerage service arrangements or other expense offset arrangements. Expenses net of all reductions represent the net expenses paid by the class. K Amount represents less than $.01 per share. L Total distributions of $.02 per share is comprised of distributions from net investment income of $.00 and distributions from net realized gain of $.02 per share. M Total distributions of $.40 per share is comprised of distributions from net investment income of $.066 and distributions from net realized gain of $.335 per share. |
Financial Highlights - Initial Class R
Years ended December 31, | 2007 | 2006 | 2005 | 2004 I |
Selected Per-Share Data | | | | |
Net asset value, beginning of period | $ 12.68 | $ 11.46 | $ 10.24 | $ 10.00 |
Income from Investment Operations | | | | |
Net investment income (loss) E | .11 H | .11 | .11 | - K |
Net realized and unrealized gain (loss) | .53 | 1.54 | 1.16 | .24 |
Total from investment operations | .64 | 1.65 | 1.27 | .24 |
Distributions from net investment income | (.09) | (.10) | (.02) | - |
Distributions from net realized gain | (1.79) | (.34) | (.02) | - |
Total distributions | (1.88) | (.43) M | (.05) L | - |
Redemption fees added to paid in capital E | - K | - K | - K | - |
Net asset value, end of period | $ 11.44 | $ 12.68 | $ 11.46 | $ 10.24 |
Total Return B,C,D | 5.17% | 14.50% | 12.37% | 2.40% |
Ratios to Average Net Assets F,J | | | | |
Expenses before reductions | 1.11% | 1.46% | 4.25% | 43.27% A |
Expenses net of fee waivers, if any | 1.10% | 1.10% | 1.10% | 1.10% A |
Expenses net of all reductions | 1.06% | 1.00% | .91% | .92% A |
Net investment income (loss) | .82% H | .95% | 1.08% | .80% A |
Supplemental Data | | | | |
Net assets, end of period (000 omitted) | $ 32,345 | $ 17,219 | $ 345 | $ 307 |
Portfolio turnover rate G | 224% | 185% | 176% | 52% A |
A Annualized B Total returns for periods of less than one year are not annualized. C Total returns do not reflect charges attributable to your insurance company's separate account. Inclusion of these charges would reduce the total returns shown. D Total returns would have been lower had certain expenses not been reduced during the periods shown. E Calculated based on average shares outstanding during the period. F Fees and expenses of the underlying Fidelity Central Funds are not included in the Fund's expense ratio. The Fund indirectly bears its proportionate share of the expenses of any underlying Fidelity Central Funds. G Amount does not include the portfolio activity of any underlying Fidelity Central Funds. H Investment income per share reflects a special dividend which amounted to $.02 per share. Excluding the special dividend, the ratio of net investment income (loss) to average net assets would have been .68%. I For the period December 22, 2004 (commencement of operations) to December 31, 2004. J Expense ratios reflect operating expenses of the class. Expenses before reductions do not reflect amounts reimbursed by the investment adviser or reductions from brokerage service arrangements or other expense offset arrangements and do not represent the amount paid by the class during periods when reimbursements or reductions occur. Expenses net of fee waivers reflect expenses after reimbursement by the investment adviser but prior to reductions from brokerage service arrangements or other expense offset arrangements. Expenses net of all reductions represent the net expenses paid by the class. K Amount represents less than $.01 per share. L Total distributions of $.05 per share is comprised of distributions from net investment income of $.022 and distributions from net realized gain of $.023 per share. M Total distributions of $.43 per share is comprised of distributions from net investment income of $.096 and distributions from net realized gain of $.335 per share. |
See accompanying notes which are an integral part of the financial statements.
Annual Report
Financial Highlights - Service Class R
Years ended December 31, | 2007 | 2006 | 2005 | 2004 I |
Selected Per-Share Data | | | | |
Net asset value, beginning of period | $ 12.67 | $ 11.46 | $ 10.24 | $ 10.00 |
Income from Investment Operations | | | | |
Net investment income (loss) E | .10 H | .10 | .10 | - K |
Net realized and unrealized gain (loss) | .53 | 1.53 | 1.16 | .24 |
Total from investment operations | .63 | 1.63 | 1.26 | .24 |
Distributions from net investment income | (.08) | (.08) | (.01) | - |
Distributions from net realized gain | (1.79) | (.34) | (.02) | - |
Total distributions | (1.87) | (.42) M | (.04) L | - |
Redemption fees added to paid in capital E | - K | - K | - K | - |
Net asset value, end of period | $ 11.43 | $ 12.67 | $ 11.46 | $ 10.24 |
Total Return B,C,D | 5.06% | 14.30% | 12.27% | 2.40% |
Ratios to Average Net Assets F,J | | | | |
Expenses before reductions | 1.20% | 1.62% | 4.35% | 43.36% A |
Expenses net of fee waivers, if any | 1.20% | 1.20% | 1.20% | 1.20% A |
Expenses net of all reductions | 1.16% | 1.10% | 1.01% | 1.01% A |
Net investment income (loss) | .72% H | .85% | .98% | .71% A |
Supplemental Data | | | | |
Net assets, end of period (000 omitted) | $ 414 | $ 394 | $ 345 | $ 307 |
Portfolio turnover rate G | 224% | 185% | 176% | 52% A |
A Annualized B Total returns for periods of less than one year are not annualized. C Total returns do not reflect charges attributable to your insurance company's separate account. Inclusion of these charges would reduce the total returns shown. D Total returns would have been lower had certain expenses not been reduced during the periods shown. E Calculated based on average shares outstanding during the period. F Fees and expenses of the underlying Fidelity Central Funds are not included in the Fund's expense ratio. The Fund indirectly bears its proportionate share of the expenses of any underlying Fidelity Central Funds. G Amount does not include the portfolio activity of any underlying Fidelity Central Funds. H Investment income per share reflects a special dividend which amounted to $.02 per share. Excluding the special dividend, the ratio of net investment income (loss) to average net assets would have been .58%. I For the period December 22, 2004 (commencement of operations) to December 31, 2004. J Expense ratios reflect operating expenses of the class. Expenses before reductions do not reflect amounts reimbursed by the investment adviser or reductions from brokerage service arrangements or other expense offset arrangements and do not represent the amount paid by the class during periods when reimbursements or reductions occur. Expenses net of fee waivers reflect expenses after reimbursement by the investment adviser but prior to reductions from brokerage service arrangements or other expense offset arrangements. Expenses net of all reductions represent the net expenses paid by the class. K Amount represents less than $.01 per share. L Total distributions of $.04 per share is comprised of distributions from net investment income of $.012 and distributions from net realized gain of $.023 per share. M Total distributions of $.42 per share is comprised of distributions from net investment income of $.084 and distributions from net realized gain of $.335 per share. |
Financial Highlights - Service Class 2R
Years ended December 31, | 2007 | 2006 | 2005 | 2004 I |
Selected Per-Share Data | | | | |
Net asset value, beginning of period | $ 12.67 | $ 11.46 | $ 10.24 | $ 10.00 |
Income from Investment Operations | | | | |
Net investment income (loss) E | .08 H | .08 | .09 | - K |
Net realized and unrealized gain (loss) | .53 | 1.53 | 1.15 | .24 |
Total from investment operations | .61 | 1.61 | 1.24 | .24 |
Distributions from net investment income | (.06) | (.07) | - | - |
Distributions from net realized gain | (1.79) | (.34) | (.02) | - |
Total distributions | (1.85) | (.40) M | (.02) L | - |
Redemption fees added to paid in capital E | - K | - K | - K | - |
Net asset value, end of period | $ 11.43 | $ 12.67 | $ 11.46 | $ 10.24 |
Total Return B,C,D | 4.90% | 14.14% | 12.12% | 2.40% |
Ratios to Average Net Assets F,J | | | | |
Expenses before reductions | 1.35% | 1.77% | 4.50% | 43.51% A |
Expenses net of fee waivers, if any | 1.35% | 1.35% | 1.35% | 1.35% A |
Expenses net of all reductions | 1.31% | 1.25% | 1.16% | 1.17% A |
Net investment income (loss) | .57% H | .70% | .83% | .55% A |
Supplemental Data | | | | |
Net assets, end of period (000 omitted) | $ 550 | $ 524 | $ 459 | $ 410 |
Portfolio turnover rate G | 224% | 185% | 176% | 52% A |
A Annualized B Total returns for periods of less than one year are not annualized. C Total returns do not reflect charges attributable to your insurance company's separate account. Inclusion of these charges would reduce the total returns shown. D Total returns would have been lower had certain expenses not been reduced during the periods shown. E Calculated based on average shares outstanding during the period. F Fees and expenses of the underlying Fidelity Central Funds are not included in the Fund's expense ratio. The Fund indirectly bears its proportionate share of the expenses of any underlying Fidelity Central Funds. G Amount does not include the portfolio activity of any underlying Fidelity Central Funds. H Investment income per share reflects a special dividend which amounted to $.02 per share. Excluding the special dividend, the ratio of net investment income (loss) to average net assets would have been .43%. I For the period December 22, 2004 (commencement of operations) to December 31, 2004. J Expense ratios reflect operating expenses of the class. Expenses before reductions do not reflect amounts reimbursed by the investment adviser or reductions from brokerage service arrangements or other expense offset arrangements and do not represent the amount paid by the class during periods when reimbursements or reductions occur. Expenses net of fee waivers reflect expenses after reimbursement by the investment adviser but prior to reductions from brokerage service arrangements or other expense offset arrangements. Expenses net of all reductions represent the net expenses paid by the class. K Amount represents less than $.01 per share. L Total distributions of $.02 per share is comprised of distributions from net investment income of $.00 and distributions from net realized gain of $.02 per share. M Total distributions of $.40 per share is comprised of distributions from net investment income of $.066 and distributions from net realized gain of $.335 per share. |
See accompanying notes which are an integral part of the financial statements.
Annual Report
Financial Highlights - Investor Class R
Years ended December 31, | 2007 | 2006 | 2005 I |
Selected Per-Share Data | | | |
Net asset value, beginning of period | $ 12.65 | $ 11.46 | $ 10.32 |
Income from Investment Operations | | | |
Net investment income (loss) E | .09 H | .09 | .01 |
Net realized and unrealized gain (loss) | .54 | 1.53 | 1.16 |
Total from investment operations | .63 | 1.62 | 1.17 |
Distributions from net investment income | (.08) | (.10) | (.02) |
Distributions from net realized gain | (1.79) | (.34) | (.01) |
Total distributions | (1.87) | (.43) M | (.03) L |
Redemption fees added to paid in capital E,K | - | - | - |
Net asset value, end of period | $ 11.41 | $ 12.65 | $ 11.46 |
Total Return B,C,D | 5.07% | 14.23% | 11.39% |
Ratios to Average Net Assets F,J | | | |
Expenses before reductions | 1.22% | 1.61% | 2.19% A |
Expenses net of fee waivers, if any | 1.22% | 1.25% | 1.25% A |
Expenses net of all reductions | 1.18% | 1.15% | 1.06% A |
Net investment income (loss) | .71% H | .80% | .31% A |
Supplemental Data | | | |
Net assets, end of period (000 omitted) | $ 38,719 | $ 24,505 | $ 9,810 |
Portfolio turnover rate G | 224% | 185% | 176% |
A Annualized B Total returns for periods of less than one year are not annualized. C Total returns do not reflect charges attributable to your insurance company's separate account. Inclusion of these charges would reduce the total returns shown. D Total returns would have been lower had certain expenses not been reduced during the periods shown. E Calculated based on average shares outstanding during the period. F Fees and expenses of the underlying Fidelity Central Funds are not included in the Fund's expense ratio. The Fund indirectly bears its proportionate share of the expenses of any underlying Fidelity Central Funds. G Amount does not include the portfolio activity of any underlying Fidelity Central Funds. H Investment income per share reflects a special dividend which amounted to $.02 per share. Excluding the special dividend, the ratio of net investment income (loss) to average net assets would have been .57%. I For the period July 21, 2005 (commencement of sale of shares) to December 31, 2005. J Expense ratios reflect operating expenses of the class. Expenses before reductions do not reflect amounts reimbursed by the investment adviser or reductions from brokerage service arrangements or other expense offset arrangements and do not represent the amount paid by the class during periods when reimbursements or reductions occur. Expense ratios before reductions for start-up periods may not be representative of longer-term operating periods. Expenses net of fee waivers reflect expenses after reimbursement by the investment adviser but prior to reductions from brokerage service arrangements or other expense offset arrangements. Expenses net of all reductions represent the net expenses paid by the class. K Amount represents less than $.01 per share. L Total distributions of $.03 per share is comprised of distributions from net investment income of $.022 and distributions from net realized gain of $.013 per share. M Total distributions of $.43 per share is comprised of distributions from net investment income of $.095 and distributions from net realized gain of $.335 per share. |
See accompanying notes which are an integral part of the financial statements.
Annual Report
Notes to Financial Statements
For the period ended December 31, 2007
1. Organization.
VIP International Capital Appreciation Portfolio (the Fund) is a fund of Variable Insurance Products Fund IV (the trust) and is authorized to issue an unlimited number of shares. The trust is registered under the Investment Company Act of 1940, as amended (the 1940 Act), as an open-end management investment company organized as a Massachusetts business trust. Shares of the Fund may only be purchased by insurance companies for the purpose of funding variable annuity or variable life insurance contracts. The Fund offers the following classes of shares: Initial Class shares, Service Class shares, Service Class 2 shares, Initial Class R shares, Service Class R shares, Service Class 2R shares, and Investor Class R shares. All classes have equal rights and voting privileges, except for matters affecting a single class. Investment income, realized and unrealized capital gains and losses, the common expenses of the Fund, and certain fund-level expense reductions, if any, are allocated on a pro rata basis to each class based on the relative net assets of each class to the total net assets of the Fund. Each class differs with respect to transfer agent and distribution and service plan fees incurred. Certain expense reductions also differ by class. The Fund's investments in emerging markets can be subject to social, economic, regulatory, and political uncertainties and can be extremely volatile.
2. Investments in Fidelity Central Funds.
The Fund may invest in Fidelity Central Funds, which are open-end investment companies available only to other investment companies and accounts managed by Fidelity Management & Research Company (FMR) and its affiliates. The Fund's Schedule of Investments lists each of the Fidelity Central Funds as an investment of the Fund, but does not include the underlying holdings of each Fidelity Central Fund. As an Investing Fund, the Fund indirectly bears its proportionate share of the expenses of the underlying Fidelity Central Funds.
The Money Market Central Funds seek preservation of capital and current income and are managed by Fidelity Investments Money Management, Inc. (FIMM), an affiliate of FMR.
A complete list of holdings for each Fidelity Central Fund is available upon request or at the SEC's web site at www.sec.gov. In addition, the financial statements of the Fidelity Central Funds, which are not covered by the Fund's Report of Independent Registered Public Accounting Firm, are available on the SEC's web site or upon request.
3. Significant Accounting Policies.
The financial statements have been prepared in conformity with accounting principles generally accepted in the United States of America, which require management to make certain estimates and assumptions at the date of the financial statements. The following summarizes the significant accounting policies of the Fund:
Security Valuation. Investments are valued and net asset value (NAV) per share is calculated (NAV calculation) as of the close of business of the New York Stock Exchange (NYSE), normally 4:00 p.m. Eastern time. Wherever possible, the Fund uses independent pricing services approved by the Board of Trustees to value its investments. Equity securities, including restricted securities, for which market quotations are readily available, are valued at the last reported sale price or official closing price as reported by an independent pricing service on the primary market or exchange on which they are traded. In the event there were no sales during the day or closing prices are not available, securities are valued at the last quoted bid price. Investments in open-end mutual funds, including the Fidelity Central Funds, are valued at their closing net asset value each business day. Short-term securities with remaining maturities of sixty days or less for which quotations are not readily available are valued at amortized cost, which approximates value.
When current market prices or quotations are not readily available or do not accurately reflect fair value, valuations may be determined in accordance with procedures adopted by the Board of Trustees. For example, when developments occur between the close of a market and the close of the NYSE that may materially affect the value of some or all of the securities, or when trading in a security is halted, those securities may be fair valued. Factors used in the determination of fair value may include monitoring news to identify significant market or security specific events such as changes in the value of U.S. securities markets, reviewing developments in foreign markets and evaluating the performance of ADRs, futures contracts and exchange-traded funds. Because the Fund's utilization of fair value pricing depends on market activity, the frequency with which fair value pricing is used cannot be predicted and may be utilized to a significant extent. The value of securities used for NAV calculation under fair value pricing may differ from published prices for the same securities.
Annual Report
3. Significant Accounting Policies - continued
Foreign Currency. The Fund uses foreign currency contracts to facilitate transactions in foreign-denominated securities. Losses from these transactions may arise from changes in the value of the foreign currency or if the counterparties do not perform under the contracts' terms.
Foreign-denominated assets, including investment securities, and liabilities are translated into U.S. dollars at the exchange rate at period end. Purchases and sales of investment securities, income and dividends received and expenses denominated in foreign currencies are translated into U.S. dollars at the exchange rate in effect on the transaction date.
The effects of exchange rate fluctuations on investments are included with the net realized and unrealized gain (loss) on investment securities. Other foreign currency transactions resulting in realized and unrealized gain (loss) are disclosed separately.
Investment Transactions and Income. For financial reporting purposes, the Fund's investment holdings and NAV include trades executed through the end of the last business day of the period. The NAV for processing shareholder transactions includes trades executed through the end of the prior business day. Gains and losses on securities sold are determined on the basis of identified cost. Dividend income is recorded on the ex-dividend date, except for certain dividends from foreign securities where the ex-dividend date may have passed, which are recorded as soon as the Fund is informed of the ex-dividend date. Non-cash dividends included in dividend income, if any, are recorded at the fair market value of the securities received. Interest income and distributions from the Fidelity Central Funds are accrued as earned. Interest income includes coupon interest and amortization of premium and accretion of discount on debt securities. Investment income is recorded net of foreign taxes withheld where recovery of such taxes is uncertain.
Expenses. Most expenses of the trust can be directly attributed to a fund. Expenses which cannot be directly attributed are apportioned among each Fund in the trust. Expense estimates are accrued in the period to which they relate and adjustments are made when actual amounts are known.
Income Tax Information and Distributions to Shareholders. Each year, the Fund intends to qualify as a regulated investment company by distributing substantially all of its taxable income and realized gains under Subchapter M of the Internal Revenue Code and filing its U.S. federal tax return. As a result, no provision for income taxes is required. The Fund adopted the provisions of FASB Interpretation No. 48, Accounting for Uncertainties in Income Taxes (FIN 48) on June 29, 2007. FIN 48 sets forth a minimum threshold for financial statement recognition of the benefit of a tax position taken or expected to be taken in a tax return. The implementation of FIN 48 did not result in any unrecognized tax benefits in the accompanying financial statements. Each of the Fund's federal tax returns for the prior three fiscal years remains subject to examination by the Internal Revenue Service. Foreign taxes are provided for based on the Fund's understanding of the tax rules and rates that exist in the foreign markets in which it invests.
Distributions are recorded on the ex-dividend date. Income dividends and capital gain distributions are declared separately for each class. Income and capital gain distributions are determined in accordance with income tax regulations, which may differ from generally accepted accounting principles.
Capital accounts within the financial statements are adjusted for permanent book-tax differences. These adjustments have no impact on net assets or the results of operations. Temporary book-tax differences will reverse in a subsequent period.
Book-tax differences are primarily due to foreign currency transactions, certain foreign taxes, passive foreign investment companies (PFIC), market discount and losses deferred due to wash sales and excise tax regulations.
The tax-basis components of distributable earnings and the federal tax cost as of period end were as follows:
Unrealized appreciation | $ 3,181,295 |
Unrealized depreciation | (3,410,440) |
Net unrealized appreciation (depreciation) | (229,145) |
Undistributed ordinary income | 289,197 |
Undistributed long term capital gain | 17,432 |
| |
Cost for federal income tax purposes | $ 75,693,797 |
The tax character of distributions paid was as follows:
| December 31, 2007 | December 31, 2006 |
Ordinary Income | $ 9,196,187 | $ 779,358 |
Long-term Capital Gains | 1,192,564 | 651,689 |
Total | $ 10,388,751 | $ 1,431,047 |
Trading (Redemption) Fees. Initial Class R shares, Service Class R shares, Service Class 2 R shares and Investor Class R shares held less than 60 days are subject to a redemption fee equal to 1% of the proceeds of the redeemed shares. All redemption fees, including any estimated redemption fees paid by FMR, are retained by the Fund and accounted for as an addition to paid in capital.
Annual Report
Notes to Financial Statements - continued
3. Significant Accounting Policies - continued
New Accounting Pronouncement. In September 2006, Statement of Financial Accounting Standards No. 157, Fair Value Measurements (SFAS 157), was issued and is effective for fiscal years beginning after November 15, 2007. SFAS 157 defines fair value, establishes a framework for measuring fair value and expands disclosures about fair value measurements. Management is currently evaluating the impact the adoption of SFAS 157 will have on the Fund's financial statement disclosures.
4. Operating Policies.
Repurchase Agreements. FMR has received an Exemptive Order from the Securities and Exchange Commission (the SEC) which permits the Fund and other affiliated entities of FMR to transfer uninvested cash balances into joint trading accounts which are then invested in repurchase agreements. The Fund may also invest directly with institutions in repurchase agreements. Repurchase agreements are collateralized by government or non-government securities. Upon settlement date, collateral is held in segregated accounts with custodian banks and may be obtained in the event of a default of the counterparty. The Fund monitors, on a daily basis, the value of the collateral to ensure it is at least equal to the principal amount of the repurchase agreement (including accrued interest). In the event of a default by the counterparty, realization of the collateral proceeds could be delayed, during which time the value of the collateral may decline.
Restricted Securities. The Fund may invest in securities that are subject to legal or contractual restrictions on resale. These securities generally may be resold in transactions exempt from registration or to the public if the securities are registered. Disposal of these securities may involve time-consuming negotiations and expense, and prompt sale at an acceptable price may be difficult. Information regarding restricted securities is included at the end of the Fund's Schedule of Investments.
5. Purchases and Sales of Investments.
Purchases and sales of securities, other than short-term securities, aggregated $159,574,551 and $130,407,995, respectively.
6. Fees and Other Transactions with Affiliates.
Management Fee. FMR and its affiliates provide the Fund with investment management related services for which the Fund pays a monthly management fee. The management fee is the sum of an individual fund fee rate that is based on an annual rate of .45% of the Fund's average net assets and a group fee rate that averaged .26% during the period. The group fee rate is based upon the average net assets of all the mutual funds advised by FMR. The group fee rate decreases as assets under management increase and increases as assets under management decrease. For the period, the total annual management fee rate was .71% of the Fund's average net assets.
Distribution and Service Plan. In accordance with Rule 12b-1 of the 1940 Act, the Fund has adopted separate 12b-1 Plans for each Service Class of shares. Each Service Class pays Fidelity Distributors Corporation (FDC), an affiliate of FMR, a service fee. For the period, the service fee is based on an annual rate of .10% of Service Class' and Service Class R's average net assets and .25% of Service Class 2's and Service Class 2R's average net assets.
For the period, each class paid FDC the following amounts, all of which were re-allowed to insurance companies for the distribution of shares and providing shareholder support services:
Service Class | $ 422 |
Service Class 2 | 1,454 |
Service Class R | 422 |
Service Class 2 R | 1,408 |
| $ 3,706 |
Annual Report
6. Fees and Other Transactions with Affiliates - continued
Transfer Agent Fees. Fidelity Investments Institutional Operations Company, Inc. (FIIOC), an affiliate of FMR, is the Fund's transfer, dividend disbursing, and shareholder servicing agent. FIIOC receives an asset-based fee with respect to each class. Each class with the exception of Investor Class pays a transfer agent fee, excluding out of pocket expenses, equal to an annual rate of .07% of average net assets. Investor Class R pays a monthly asset-based transfer agent fee of .18% of average net assets. The total transfer agent fees paid by each class to FIIOC, including out of pocket expenses, were as follows:
Initial Class | $ 2,238 |
Service Class | 279 |
Service Class 2 | 768 |
Initial Class R | 22,074 |
Service Class R | 279 |
Service Class 2R | 371 |
Investor Class R | 66,255 |
| $ 92,264 |
Effective February 1, 2008, the Board of Trustees approved a decrease to Investor Class' asset-based fee from .18% to.15% of average net assets.
Accounting and Security Lending Fees. Fidelity Service Company, Inc. (FSC), an affiliate of FMR, maintains the Fund's accounting records. The accounting fee is based on the level of average net assets for the month. Under a separate contract, FSC administers the security lending program. The security lending fee is based on the number and duration of lending transactions.
Brokerage Commissions. The Fund placed a portion of its portfolio transactions with brokerage firms which are affiliates of the investment adviser. The commissions paid to these affiliated firms were $76 for the period.
7. Committed Line of Credit.
The Fund participates with other funds managed by FMR in a $4.2 billion credit facility (the "line of credit") to be utilized for temporary or emergency purposes to fund shareholder redemptions or for other short-term liquidity purposes. The Fund has agreed to pay commitment fees on its pro rata portion of the line of credit, which amounted to $118 and is reflected in Miscellaneous Expense on the Statement of Operations. During the period, there were no borrowings on this line of credit.
8. Security Lending.
The Fund lends portfolio securities from time to time in order to earn additional income. On the settlement date of the loan, the Fund receives collateral (in the form of U.S. Treasury obligations, letters of credit and/or cash) against the loaned securities and maintains collateral in an amount not less than 100% of the market value of the loaned securities during the period of the loan. The market value of the loaned securities is determined at the close of business of the Fund and any additional required collateral is delivered to the Fund on the next business day. If the borrower defaults on its obligation to return the securities loaned because of insolvency or other reasons, a fund could experience delays and costs in recovering the securities loaned or in gaining access to the collateral. Any cash collateral received is invested in the Fidelity Securities Lending Cash Central Fund. The value of loaned securities and cash collateral at period end are disclosed on the Fund's Statement of Assets and Liabilities. Security lending income represents the income earned on investing cash collateral, less fees and expenses associated with the loan, plus any premium payments that may be received on the loan of certain types of securities. Security lending income is presented in the Statement of Operations as a component of income from Fidelity Central Funds. Net income from lending portfolio securities during the period amounted to $35,702.
9. Expense Reductions.
FMR voluntarily agreed to reimburse each class to the extent annual operating expenses exceeded certain levels of average net assets as noted in the table below. Some expenses, for example interest expense, including commitment fees, are excluded from this reimbursement.
Annual Report
Notes to Financial Statements - continued
9. Expense Reductions - continued
The following classes were in reimbursement during the period:
| Expense
Limitations | Reimbursement
from adviser |
Initial Class | 1.10% | $ 1,250 |
Service Class 2 | 1.35% | 325 |
Initial Class R | 1.10% | 849 |
| | $ 2,424 |
Many of the brokers with whom FMR places trades on behalf of the Fund provided services to the Fund in addition to trade execution. These services included payments of certain expenses on behalf of the Fund totaling $25,157 for the period. In addition, through arrangements with the Fund's custodian, credits realized as a result of uninvested cash balances were used to reduce the Fund's expenses. During the period, these credits reduced the Fund's custody expenses by $307.
10. Other.
The Fund's organizational documents provide former and current trustees and officers with a limited indemnification against liabilities arising in connection with the performance of their duties to the Fund. In the normal course of business, the Fund may also enter into contracts that provide general indemnifications. The Fund's maximum exposure under these arrangements is unknown as this would be dependent on future claims that may be made against the Fund. The risk of material loss from such claims is considered remote.
At the end of the period, FMR or its affiliates were the owners of record of 99% of the total outstanding shares of the fund.
11. Distributions to Shareholders.
Distributions to shareholders of each class were as follows:
Years ended December 31, | 2007 | 2006 |
From net investment income | | |
Initial Class | $ 9,981 | $ 9,863 |
Service Class | 2,513 | 2,538 |
Service Class 2 | 2,465 | 2,655 |
Initial Class R | 232,391 | 126,136 |
Service Class R | 2,513 | 2,538 |
Service Class 2R | 2,506 | 2,655 |
Investor Class R | 236,202 | 177,775 |
Total | $ 488,571 | $ 324,160 |
From net realized gain | | |
Initial Class | $ 188,994 | $ 82,024 |
Service Class | 56,040 | 10,116 |
Service Class 2 | 75,317 | 13,470 |
Initial Class R | 4,287,821 | 382,391 |
Service Class R | 56,040 | 10,116 |
Service Class 2R | 74,517 | 13,470 |
Investor Class R | 5,161,451 | 595,300 |
Total | $ 9,900,180 | $ 1,106,887 |
12. Share Transactions.
Transactions for each class of shares were as follows:
| Shares | Dollars |
Years ended December 31, | 2007 | 2006 | 2007 | 2006 |
Initial Class | | | | |
Shares sold | 57,013 | 551,473 | $ 797,148 | $ 6,530,542 |
Reinvestment of distributions | 17,391 | 7,645 | 198,975 | 91,887 |
Shares redeemed | (58,226) | (1,269,330) | (765,491) | (14,879,275) |
Net increase (decrease) | 16,178 | (710,212) | $ 230,632 | $ (8,256,846) |
Annual Report
Notes to Financial Statements - continued
12. Share Transactions - continued
| Shares | Dollars |
Years ended December 31, | 2007 | 2006 | 2007 | 2006 |
Service Class | | | | |
Reinvestment of distributions | 5,121 | 1,019 | 58,553 | 12,654 |
Net increase (decrease) | 5,121 | 1,019 | $ 58,553 | $ 12,654 |
Service Class 2 | | | | |
Shares sold | 6,394 | - | $ 84,142 | $ - |
Reinvestment of distributions | 6,793 | 1,300 | 77,782 | 16,125 |
Shares redeemed | (6,455) | - | (88,305) | - |
Net increase (decrease) | 6,732 | 1,300 | $ 73,619 | $ 16,125 |
Initial Class R | | | | |
Shares sold | 1,656,294 | 1,743,214 | $ 22,491,075 | $ 20,660,150 |
Reinvestment of distributions | 396,233 | 40,625 | 4,520,212 | 508,526 |
Shares redeemed | (583,136) | (455,998) | (7,820,250) | (5,371,545) |
Net increase (decrease) | 1,469,391 | 1,327,841 | $ 19,191,037 | $ 15,797,131 |
Service Class R | | | | |
Reinvestment of distributions | 5,121 | 1,019 | 58,553 | 12,654 |
Net increase (decrease) | 5,121 | 1,019 | $ 58,553 | $ 12,654 |
Service Class 2R | | | | |
Reinvestment of distributions | 6,735 | 1,300 | 77,024 | 16,125 |
Net increase (decrease) | 6,735 | 1,300 | $ 77,024 | $ 16,125 |
Investor Class R | | | | |
Shares sold | 1,585,891 | 1,447,148 | $ 21,572,358 | $ 17,211,509 |
Reinvestment of distributions | 473,946 | 62,199 | 5,397,653 | 773,075 |
Shares redeemed | (602,827) | (428,813) | (8,073,931) | (5,072,819) |
Net increase (decrease) | 1,457,010 | 1,080,534 | $ 18,896,080 | $ 12,911,765 |
Annual Report
Report of Independent Registered Public Accounting Firm
To the Trustees of Variable Insurance Products Fund IV and the Shareholders of VIP International Capital Appreciation Portfolio:
In our opinion, the accompanying statement of assets and liabilities, including the schedule of investments, and the related statements of operations and of changes in net assets and the financial highlights present fairly, in all material respects, the financial position of VIP International Capital Appreciation Portfolio (a fund of Variable Insurance Products Fund IV) at December 31, 2007, the results of its operations for the year then ended, the changes in its net assets for each of the two years in the period then ended and the financial highlights for each of the periods indicated, in conformity with accounting principles generally accepted in the United States of America. These financial statements and financial highlights (hereafter referred to as "financial statements") are the responsibility of the VIP International Capital Appreciation Portfolio's management. Our responsibility is to express an opinion on these financial statements based on our audits. We conducted our audits of these financial statements in accordance with the standards of the Public Company Accounting Oversight Board (United States). Those standards require that we plan and perform the audit to obtain reasonable assurance about whether the financial statements are free of material misstatement. An audit includes examining, on a test basis, evidence supporting the amounts and disclosures in the financial statements, assessing the accounting principles used and significant estimates made by management, and evaluating the overall financial statement presentation. We believe that our audits, which included confirmation of securities at December 31, 2007 by correspondence with the custodian and brokers, provide a reasonable basis for our opinion.
/s/ PricewaterhouseCoopers LLP
PricewaterhouseCoopers LLP
Boston, Massachusetts
February 22, 2008
Annual Report
Trustees and Officers
The Trustees, Members of the Advisory Board, and executive officers of the trust and fund, as applicable, are listed below. The Board of Trustees governs the fund and is responsible for protecting the interests of shareholders. The Trustees are experienced executives who meet periodically throughout the year to oversee the fund's activities, review contractual arrangements with companies that provide services to the fund, and review the fund's performance. Except for James C. Curvey, each of the Trustees oversees 373 funds advised by FMR or an affiliate. Mr. Curvey oversees 368 funds advised by FMR or an affiliate.
The Trustees hold office without limit in time except that (a) any Trustee may resign; (b) any Trustee may be removed by written instrument, signed by at least two-thirds of the number of Trustees prior to such removal; (c) any Trustee who requests to be retired or who has become incapacitated by illness or injury may be retired by written instrument signed by a majority of the other Trustees; and (d) any Trustee may be removed at any special meeting of shareholders by a two-thirds vote of the outstanding voting securities of the trust. Each Trustee who is not an interested person (as defined in the 1940 Act) (Independent Trustee), shall retire not later than the last day of the calendar year in which his or her 72nd birthday occurs. The Independent Trustees may waive this mandatory retirement age policy with respect to individual Trustees. The executive officers and Advisory Board Members hold office without limit in time, except that any officer and Advisory Board Member may resign or may be removed by a vote of a majority of the Trustees at any regular meeting or any special meeting of the Trustees. Except as indicated, each individual has held the office shown or other offices in the same company for the past five years.
The fund's Statement of Additional Information (SAI) includes more information about the Trustees. To request a free copy, call Fidelity at 1-877-208-0098.
Interested Trustees*:
Correspondence intended for each Trustee who is an interested person may be sent to Fidelity Investments, 82 Devonshire Street, Boston, Massachusetts 02109.
Name, Age; Principal Occupation |
Edward C. Johnson 3d (77) |
| Year of Election or Appointment: 1983 Mr. Johnson is Chairman of the Board of Trustees. Mr. Johnson serves as President (2006-present), Chief Executive Officer, Chairman, and a Director of FMR LLC; Chairman and a Director of FMR; Chairman and a Director of Fidelity Research & Analysis Company (FRAC); Chairman and a Director of Fidelity Investments Money Management, Inc.; and Chairman (2001-present) and a Director of FMR Co., Inc. In addition, Mr. Johnson serves as Chairman and Director of Fidelity International Limited (FIL). Mr. Edward C. Johnson 3d and Mr. Arthur E. Johnson are not related. |
James C. Curvey (72) |
| Year of Election or Appointment: 2007 Mr. Curvey also serves as Trustee (2007-present) or Member of the Advisory Board (2007-present) of other investment companies advised by FMR. Mr. Curvey is a Director of FMR and FMR Co., Inc. (2007-present). Mr. Curvey is also Vice Chairman (2006-
present) and Director of FMR LLC. Mr. Curvey joined Fidelity in 1982 and served in numerous senior management positions, including President and Chief Operating Officer of FMR LLC (1997-2000) and President of Fidelity Strategic Investments (2000-
2002). In addition, he serves as a member of the Board of Directors of Geerlings & Wade, Inc. (wine distribution). |
* Trustees have been determined to be "Interested Trustees" by virtue of, among other things, their affiliation with the trust or various entities under common control with FMR. FMR Corp. merged with and into FMR LLC on October 1, 2007. Any references to FMR LLC for prior periods are deemed to be references to the prior entity.
Independent Trustees:
Correspondence intended for each Independent Trustee (that is, the Trustees other than the Interested Trustees) may be sent to Fidelity Investments, P.O. Box 55235, Boston, Massachusetts 02205-5235.
Name, Age; Principal Occupation |
Dennis J. Dirks (59) |
| Year of Election or Appointment: 2005 Prior to his retirement in May 2003, Mr. Dirks was Chief Operating Officer and a member of the Board of The Depository Trust & Clearing Corporation (DTCC) (1999-2003). He also served as President, Chief Operating Officer, and Board member of The Depository Trust Company (DTC) (1999-2003) and President and Board member of the National Securities Clearing Corporation (NSCC) (1999-2003). In addition, Mr. Dirks served as Chief Executive Officer and Board member of the Government Securities Clearing Corporation (2001-2003) and Chief Executive Officer and Board member of the Mortgage-Backed Securities Clearing Corporation (2001-2003). Mr. Dirks also serves as a Trustee and a member of the Finance Committee of Manhattan College (2005-present) and a Trustee and a member of the Finance Committee of AHRC of Nassau County (2006-present). |
Albert R. Gamper, Jr. (65) |
| Year of Election or Appointment: 2006 Prior to his retirement in December 2004, Mr. Gamper served as Chairman of the Board of CIT Group Inc. (commercial finance). During his tenure with CIT Group Inc. Mr. Gamper served in numerous senior management positions, including Chairman (1987-
1989; 1999-2001; 2002-2004), Chief Executive Officer (1987-2004), and President (1989-2002). He currently serves as a member of the Board of Directors of Public Service Enterprise Group (utilities, 2001-present), Chairman of the Board of Governors, Rutgers University (2004-present), and Chairman of the Board of Saint Barnabas Health Care System. |
George H. Heilmeier (71) |
| Year of Election or Appointment: 2004 Dr. Heilmeier is Chairman Emeritus of Telcordia Technologies (communication software and systems), where prior to his retirement, he served as company Chairman and Chief Executive Officer. He currently serves on the Boards of Directors of The Mitre Corporation (systems engineering and information technology support for the government), and HRL Laboratories (private research and development, 2004-present). He is Chairman of the General Motors Science & Technology Advisory Board and a Life Fellow of the Institute of Electrical and Electronics Engineers (IEEE). Dr. Heilmeier is a member of the Defense Science Board and the National Security Agency Advisory Board. He is also a member of the National Academy of Engineering, the American Academy of Arts and Sciences, and the Board of Overseers of the School of Engineering and Applied Science of the University of Pennsylvania. Previously, Dr. Heilmeier served as a Director of TRW Inc. (automotive, space, defense, and information technology, 1992-2002), Compaq (1994-2002), Automatic Data Processing, Inc. (ADP) (technology-based business outsourcing, 1995-2002), INET Technologies Inc. (telecommunications network surveillance, 2001-2004), and Teletech Holdings (customer management services). He is the recipient of the 2005 Kyoto Prize in Advanced Technology for his invention of the liquid crystal display, and a member of the Consumer Electronics Hall of Fame. |
James H. Keyes (67) |
| Year of Election or Appointment: 2007 Prior to his retirement in 2003, Mr. Keyes was Chairman, President, and Chief Executive Officer of Johnson Controls, Inc. (automotive supplier, 1993-2003). He currently serves as a member of the boards of LSI Logic Corporation (semiconductor technologies), Navistar International Corporation (manufacture and sale of trucks, buses, and diesel engines, 2002-present), and Pitney Bowes, Inc. (integrated mail, messaging, and document management solutions). |
Marie L. Knowles (61) |
| Year of Election or Appointment: 2001 Prior to Ms. Knowles' retirement in June 2000, she served as Executive Vice President and Chief Financial Officer of Atlantic Richfield Company (ARCO) (diversified energy, 1996-2000). From 1993 to 1996, she was a Senior Vice President of ARCO and President of ARCO Transportation Company. She served as a Director of ARCO from 1996 to 1998. She currently serves as a Director of Phelps Dodge Corporation (copper mining and manufacturing) and McKesson Corporation (healthcare service, 2002-present). Ms. Knowles is a Trustee of the Brookings Institution and the Catalina Island Conservancy and also serves as a member of the Advisory Board for the School of Engineering of the University of Southern California. |
Ned C. Lautenbach (63) |
| Year of Election or Appointment: 2000 Mr. Lautenbach is Chairman of the Independent Trustees (2006-present). Mr. Lautenbach has been a partner of Clayton, Dubilier & Rice, Inc. (private equity investment firm) since September 1998. Previously, Mr. Lautenbach was with the International Business Machines Corporation (IBM) from 1968 until his retirement in 1998. Mr. Lautenbach serves as a Director of Sony Corporation (2006-present) and Eaton Corporation (diversified industrial) as well as the Philharmonic Center for the Arts in Naples, Florida. He also is a member of the Board of Trustees of Fairfield University (2005-present), as well as a member of the Council on Foreign Relations. |
Cornelia M. Small (63) |
| Year of Election or Appointment: 2005 Ms. Small is a member (2000-present) and Chairperson (2002-present) of the Investment Committee, and a member (2002-
present) of the Board of Trustees of Smith College. Previously, she served as Chief Investment Officer (1999-2000), Director of Global Equity Investments (1996-1999), and a member of the Board of Directors of Scudder, Stevens & Clark (1990-1997) and Scudder Kemper Investments (1997-1999). In addition, Ms. Small served as Co-Chair (2000-2003) of the Annual Fund for the Fletcher School of Law and Diplomacy. |
William S. Stavropoulos (68) |
| Year of Election or Appointment: 2001 Mr. Stavropoulos is Chairman Emeritus of the Board of Directors of The Dow Chemical Company. Since joining The Dow Chemical Company in 1967, Mr. Stavropoulos served in numerous senior management positions, including President (1993-2000; 2002-2003), CEO (1995-2000; 2002-2004), and Chairman of the Executive Committee (2000-2004). Currently, he is a Director of NCR Corporation (data warehousing and technology solutions), Chemical Financial Corporation, Maersk Inc. (industrial conglomerate, 2002-present), Tyco International, Inc. (multinational manufacturing and services, 2007-present), and a member of the Advisory Board for Metalmark Capital (private equity investment firm, 2005-present). He is a special advisor to Clayton, Dubilier & Rice, Inc., a private equity investment firm. He also serves as a member of the Board of Trustees of the American Enterprise Institute for Public Policy Research. In addition, Mr. Stavropoulos is a member of The Business Council, J.P. Morgan International Council and the University of Notre Dame Advisory Council for the College of Science. |
Kenneth L. Wolfe (68) |
| Year of Election or Appointment: 2005 Mr. Wolfe is Chairman and a Director of Hershey Foods Corporation (2007-present), where prior to his retirement in 2001, he was Chairman and Chief Executive Officer. Mr. Wolfe currently serves as a member of the board of Revlon Inc. (2004-present). Previously, Mr. Wolfe served as a member of the boards of Adelphia Communications Corporation (2003-2006) and Bausch & Lomb, Inc. (1993-2007). |
Advisory Board Members and Executive Officers**:
Correspondence intended for Mr. Mauriello, Mr. Thomas, Mr. Wiley, Mr. Lacy, and Mr. Arthur Johnson may be sent to Fidelity Investments, P.O. Box 55235, Boston, Massachusetts 02205-5235. Correspondence intended for each executive officer and Mr. Lynch may be sent to Fidelity Investments, 82 Devonshire Street, Boston, Massachusetts 02109.
Name, Age; Principal Occupation |
Arthur E. Johnson (60) |
| Year of Election or Appointment: 2008 Member of the Advisory Board of Variable Insurance Products Fund IV. Mr. Johnson serves as Senior Vice President of Corporate Strategic Development of Lockheed Martin Corporation (defense contractor). In addition, Mr. Johnson serves as a member of the Board of Directors of AGL Resources, Inc. (holding company, 2002-present), and IKON Office Solutions, Inc. (document management systems and services). Mr. Arthur E. Johnson and Mr. Edward C. Johnson 3d are not related. |
Alan J. Lacy (54) |
| Year of Election or Appointment: 2008 Member of the Advisory Board of Variable Insurance Products Fund IV. Mr. Lacy serves as Senior Adviser (2007-present) of Oak Hill Capital Partners, L.P. (a private equity firm). Mr. Lacy also served as Vice Chairman and Chief Executive Officer of Sears Holdings Corporation and Sears, Roebuck and Co. (retail, 2005-2006; 2000-2005). In addition, Mr. Lacy serves as a member of the Board of Directors of The Western Union Company (global money transfer, 2006-present) and Bristol-Myers Squibb (global pharmaceuticals, 2007-present). Mr. Lacy is a Trustee of the National Parks Conservation Association and The Field Museum of Natural History. |
Peter S. Lynch (63) |
| Year of Election or Appointment: 2003 Member of the Advisory Board of Variable Insurance Products Fund IV. Mr. Lynch is Vice Chairman and a Director of FMR, and Vice Chairman (2001-present) and a Director of FMR Co., Inc. Previously, Mr. Lynch served as a Trustee of the Fidelity funds (1990-2003). In addition, he serves as a Trustee of Boston College and as the Chairman of the Inner-City Scholarship Fund. |
Joseph Mauriello (63) |
| Year of Election or Appointment: 2007 Member of the Advisory Board of Variable Insurance Products Fund IV. Prior to his retirement in January 2006, Mr. Mauriello served in numerous senior management positions including Deputy Chairman and Chief Operating Officer (2004-2005), and Vice Chairman of Financial Services (2002-2004) of KPMG LLP US (professional services firm, 1965-2005). Mr. Mauriello currently serves as a member of the Board of Directors of XL Capital Ltd. (global insurance and re-insurance company, 2006-
present) and of Arcadia Resources Inc. (health care services and products, 2007-present). He also served as a Director of the Hamilton Funds of the Bank of New York (2006-2007). |
David M. Thomas (58) |
| Year of Election or Appointment: 2007 Member of the Advisory Board of Variable Insurance Products Fund IV. Previously, Mr. Thomas served as Executive Chairman (2005-2006) and Chairman and Chief Executive Officer (2000-2005) of IMS Health, Inc. (pharmaceutical and healthcare information solutions). In addition, Mr. Thomas serves as a member of the Board of Directors of Fortune Brands, Inc. (consumer products holding company), and Interpublic Group of Companies, Inc. (marketing communication, 2004-present). |
Michael E. Wiley (57) |
| Year of Election or Appointment: 2007 Member of the Advisory Board of Variable Insurance Products Fund IV. Mr. Wiley also serves as a member of the Board of Trustees of the University of Tulsa (2000-2006; 2007-present). He serves as a Director of Tesoro Corporation (independent oil refiner and marketer, 2005-present), and a Director of Bill Barrett Corporation (exploration and production company, 2005-present). In addition, he also serves as a Director of Post Oak Bank (privately-held bank, 2004-present). Previously, Mr. Wiley served as a Sr. Energy Advisor of Katzenbach Partners, LLC (consulting firm, 2006-2007), as an Advisory Director of Riverstone Holdings (private investment firm), Chairman, President, and CEO of Baker Hughes, Inc. (oilfield services company, 2000-2004), and as Director of Spinnaker Exploration Company (exploration and production company, 2001-2005). |
Kimberley H. Monasterio (44) |
| Year of Election or Appointment: 2007 President and Treasurer of VIP International Capital Appreciation. Ms. Monasterio also serves as President and Treasurer of other Fidelity funds (2007-present) and is an employee of FMR (2004-present). Previously, Ms. Monasterio served as Deputy Treasurer of the Fidelity funds (2004-2006). Before joining Fidelity Investments, Ms. Monasterio served as Treasurer (2000-2004) and Chief Financial Officer (2002-2004) of the Franklin Templeton Funds and Senior Vice President of Franklin Templeton Services, LLC (2000-2004). |
Walter C. Donovan (45) |
| Year of Election or Appointment: 2007 Vice President of VIP International Capital Appreciation. Mr. Donovan also serves as Vice President of Fidelity's Equity Funds (2007-present). Mr. Donovan also serves as Executive Vice President of FMR (2005-present) and FMR Co., Inc. (2005-present). Previously, Mr. Donovan served as Vice President of Fidelity's High Income Funds (2005-2007), Fixed-Income Funds (2005-2006), certain Asset Allocation Funds (2005-2006), certain Balanced Funds (2005-2006), and as Vice President and Director of Fidelity's International Equity Trading group (1998-2005). |
Eric M. Wetlaufer (45) |
| Year of Election or Appointment: 2006 Vice President of VIP International Capital Appreciation. Mr. Wetlaufer also serves as Vice President of certain International Equity Funds (2006-present). Mr. Wetlaufer is Senior Vice President of FMR (2006-present) and FMR Co., Inc. (2006-present), and President and Director of Fidelity Management & Research (U.K.) Inc. (2006-present) and Fidelity Research & Analysis Company (2006-present). Before joining Fidelity Investments in 2005, Mr. Wetlaufer was a partner in Oxhead Capital Management (2004-2005). Previously, Mr. Wetlaufer served as a Chief Investment Officer of Putnam Investments (1997-2003). |
Eric D. Roiter (59) |
| Year of Election or Appointment: 2004 Secretary of VIP International Capital Appreciation. He also serves as Secretary of other Fidelity funds; Vice President, General Counsel, and Secretary of FMR Co., Inc. (2001-present) and FMR; Assistant Secretary of Fidelity Management & Research (U.K.) Inc. (2001-present), Fidelity Research & Analysis Company (2001-present), and Fidelity Investments Money Management, Inc. (2001-present). Mr. Roiter is an Adjunct Member, Faculty of Law, at Boston College Law School (2003-present). Previously, Mr. Roiter served as Vice President and Secretary of Fidelity Distributors Corporation (FDC) (1998-2005). |
John B. McGinty, Jr. (45) |
| Year of Election or Appointment: 2008 Assistant Secretary of VIP International Capital Appreciation. Mr. McGinty also serves as Assistant Secretary of other Fidelity funds (2008-present) and is an employee of FMR LLC (2004-present). Mr. McGinty also serves as Senior Vice President, Secretary, and Chief Legal Officer of FDC (2007-present). Before joining Fidelity Investments, Mr. McGinty practiced law at Ropes & Gray, LLP. |
R. Stephen Ganis (41) |
| Year of Election or Appointment: 2006 Anti-Money Laundering (AML) officer of VIP International Capital Appreciation. Mr. Ganis also serves as AML officer of other Fidelity funds (2006-present) and FMR LLC (2003-present). Before joining Fidelity Investments, Mr. Ganis practiced law at Goodwin Procter, LLP (2000-2002). |
Joseph B. Hollis (59) |
| Year of Election or Appointment: 2006 Chief Financial Officer of VIP International Capital Appreciation. Mr. Hollis also serves as Chief Financial Officer of other Fidelity funds. Mr. Hollis is President of Fidelity Pricing and Cash Management Services (FPCMS) (2005-present). Mr. Hollis also serves as President and Director of Fidelity Service Company, Inc. (2006-present). Previously, Mr. Hollis served as Senior Vice President of Cash Management Services (1999-2002) and Investment Management Operations (2002-2005). |
Kenneth A. Rathgeber (60) |
| Year of Election or Appointment: 2004 Chief Compliance Officer of VIP International Capital Appreciation. Mr. Rathgeber also serves as Chief Compliance Officer of other Fidelity funds (2004-present) and Executive Vice President of Risk Oversight for Fidelity Investments (2002-present). He is Chief Compliance Officer of FMR (2005-present), FMR Co., Inc. (2005-present), Fidelity Management & Research (U.K.) Inc. (2005-present), Fidelity Research & Analysis Company (2005-present), Fidelity Investments Money Management, Inc. (2005-
present), and Strategic Advisers, Inc. (2005-present). Previously, Mr. Rathgeber served as Executive Vice President and Chief Operating Officer for Fidelity Investments Institutional Services Company, Inc. (1998-2002). |
Bryan A. Mehrmann (46) |
| Year of Election or Appointment: 2005 Deputy Treasurer of VIP International Capital Appreciation. Mr. Mehrmann also serves as Deputy Treasurer of other Fidelity funds (2005-present) and is an employee of FMR. Previously, Mr. Mehrmann served as Vice President of Fidelity Investments Institutional Services Group (FIIS)/Fidelity Investments Institutional Operations Corporation, Inc. (FIIOC) Client Services (1998-2004). |
Kenneth B. Robins (38) |
| Year of Election or Appointment: 2005 Deputy Treasurer of VIP International Capital Appreciation. Mr. Robins also serves as Deputy Treasurer of other Fidelity funds (2005-present) and is an employee of FMR (2004-present). Before joining Fidelity Investments, Mr. Robins worked at KPMG LLP, where he was a partner in KPMG's department of professional practice (2002-2004) and a Senior Manager (1999-2000). In addition, Mr. Robins served as Assistant Chief Accountant, United States Securities and Exchange Commission (2000-2002). |
Robert G. Byrnes (41) |
| Year of Election or Appointment: 2005 Assistant Treasurer of VIP International Capital Appreciation. Mr. Byrnes also serves as Assistant Treasurer of other Fidelity funds (2005-present) and is an employee of FMR (2005-present). Previously, Mr. Byrnes served as Vice President of FPCMS (2003-
2005). Before joining Fidelity Investments, Mr. Byrnes worked at Deutsche Asset Management where he served as Vice President of the Investment Operations Group (2000-2003). |
Peter L. Lydecker (53) |
| Year of Election or Appointment: 2004 Assistant Treasurer of VIP International Capital Appreciation. Mr. Lydecker also serves as Assistant Treasurer of other Fidelity funds (2004) and is an employee of FMR. |
Paul M. Murphy (60) |
| Year of Election or Appointment: 2007 Assistant Treasurer of VIP International Capital Appreciation. Mr. Murphy also serves as Assistant Treasurer of other Fidelity funds (2007-present) and is an employee of FMR (2007-present). Previously, Mr. Murphy served as Chief Financial Officer of the Fidelity Funds (2005-2006), Vice President and Associate General Counsel of FMR (2007), and Senior Vice President of Fidelity Pricing and Cash Management Services Group (FPCMS) (1994-2007). |
Gary W. Ryan (49) |
| Year of Election or Appointment: 2005 Assistant Treasurer of VIP International Capital Appreciation. Mr. Ryan also serves as Assistant Treasurer of other Fidelity funds (2005-present) and is an employee of FMR (2005-present). Previously, Mr. Ryan served as Vice President of Fund Reporting in FPCMS (1999-2005). |
** FMR Corp. merged with and into FMR LLC on October 1, 2007. Any references to FMR LLC for prior periods are deemed to be references to the prior entity.
Annual Report
Distributions
The Board of Trustees of VIP International Capital Appreciation Portfolio voted to pay to shareholders of record at the opening of business on record date, the following distributions per share derived from capital gains realized from sales of portfolio securities:
| Pay Date | Record Date | Capital Gains |
Initial Class R | 02/08/08 | 02/08/08 | $0.055 |
Service Class R | 02/08/08 | 02/08/08 | $0.055 |
Service Class 2R | 02/08/08 | 02/08/08 | $0.055 |
Investor Class R | 02/08/08 | 02/08/08 | $0.055 |
The fund hereby designates as a capital gain dividend with respect to the taxable year ended December 31, 2007, $1,162,866, or, if subsequently determined to be different, the net capital gain of such year.
The amounts per share which represent income derived from sources within, and taxes paid to, forrign countries or possessions of the United States are as follows:
| Pay Date | Income | Taxes |
Initial Class R | 12/21/07 | $0.159 | $0.023 |
Service Class R | 12/21/07 | $0.157 | $0.023 |
Service Class 2R | 12/21/07 | $0.155 | $0.023 |
Investor Class R | 12/21/07 | $0.157 | $0.023 |
The fund will notify shareholders in January 2008 of amounts for use in preparing 2007 income tax returns.
Annual Report
Board Approval of Investment Advisory Contracts and Management Fees
VIP International Capital Appreciation Portfolio
Each year, typically in July, the Board of Trustees, including the Independent Trustees (together, the Board), votes on the renewal of the management contract and sub-advisory agreements (together, the Advisory Contracts) for the fund. The Board, assisted by the advice of fund counsel and Independent Trustees' counsel, requests and considers a broad range of information throughout the year.
The Board meets regularly each month except August and takes into account throughout the year matters bearing on Advisory Contracts. The Board, acting directly and through its separate committees, considers at each of its meetings factors that are relevant to the annual renewal of the fund's Advisory Contracts, including the services and support provided to the fund and its shareholders. At the time of the renewal, the Board had 12 standing committees, each composed of Independent Trustees with varying backgrounds, to which the Board has assigned specific subject matter responsibilities in order to enhance effective decision-making by the Board. Each committee has adopted a written charter outlining the structure and purposes of the committee. One such committee, the Equity Contract Committee, meets periodically as needed throughout the year to consider matters specifically related to the annual renewal of Advisory Contracts. The committee requests and receives information on, and makes recommendations to the Independent Trustees concerning, the approval and annual review of the Advisory Contracts.
At its July 2007 meeting, the Board of Trustees, including the Independent Trustees, unanimously determined to renew the Advisory Contracts for the fund. In reaching its determination, the Board considered all factors it believed relevant, including (i) the nature, extent, and quality of the services to be provided to the fund and its shareholders (including the investment performance of the fund); (ii) the competitiveness of the management fee and total expenses of the fund; (iii) the total costs of the services to be provided by and the profits to be realized by the investment adviser and its affiliates from the relationship with the fund; (iv) the extent to which economies of scale would be realized as the fund grows; and (v) whether fee levels reflect these economies of scale, if any, for the benefit of fund shareholders. The Board also approved amendments to the fund's agreements with foreign sub-advisers to clarify that each sub-adviser provides services as an independent contractor.
In determining whether to renew the Advisory Contracts for the fund, the Board ultimately reached a determination, with the assistance of fund counsel and Independent Trustees' counsel, that the renewal of the Advisory Contracts and the compensation to be received by Fidelity under the management contract is consistent with Fidelity's fiduciary duty under applicable law. In addition to evaluating the specific factors noted above, the Board, in reaching its determination, is aware that shareholders in the fund have a broad range of investment choices available to them, including a wide choice among mutual funds offered by competitors to Fidelity, and that the fund's shareholders, with the opportunity to review and weigh the disclosure provided by the fund in its prospectus and other public disclosures, have chosen to invest in this fund, managed by Fidelity.
Nature, Extent, and Quality of Services Provided. The Board considered staffing within the investment adviser, FMR, and the sub-advisers (together, the Investment Advisers), including the backgrounds of the fund's portfolio managers and the fund's investment objective and discipline. The Independent Trustees also had discussions with senior management of Fidelity's investment operations and investment groups. The Board considered the structure of the portfolio manager compensation program and whether this structure provides appropriate incentives.
Resources Dedicated to Investment Management and Support Services. The Board reviewed the size, education, and experience of the Investment Advisers' investment staff, their use of technology, and the Investment Advisers' approach to recruiting, training, and retaining portfolio managers and other research, advisory, and management personnel. The Board considered Fidelity's extensive global research capabilities that enable the Investment Advisers to aggregate data from various sources in an effort to produce positive investment results. The Board noted that Fidelity's analysts have access to a variety of technological tools that enable them to perform both fundamental and quantitative analysis and to specialize in various disciplines. The Board also considered that Fidelity's portfolio managers and analysts have access to daily portfolio attribution that allows for monitoring of a fund's portfolio, as well as an electronic communication system that provides immediate real-time access to research concerning issuers and credit enhancers.
Shareholder and Administrative Services. The Board considered (i) the nature, extent, quality, and cost of advisory, administrative, distribution, and shareholder services performed by the Investment Advisers and their affiliates under the Advisory Contracts and under separate agreements covering transfer agency, pricing and bookkeeping, and securities lending services for the fund; (ii) the nature and extent of the Investment Advisers' supervision of third party service providers, principally custodians and subcustodians; and (iii) the resources devoted to, and the record of compliance with, the fund's compliance policies and procedures. The Board reviewed the allocation of fund brokerage, including allocations to brokers affiliated with the Investment Advisers, the use of brokerage commissions to pay fund expenses, and the use of "soft" commission dollars to pay for research services. The Board also considered that Fidelity voluntarily pays for market data out of its own resources.
The Board noted that the growth of fund assets across the complex allows Fidelity to reinvest in the development of services designed to enhance the value or convenience of the Fidelity funds as investment vehicles. These services include 24-hour access to account information and market information through phone representatives and over the Internet, and investor education materials and asset allocation tools.
Investment in a Large Fund Family. The Board considered the benefits to shareholders of investing in a Fidelity fund, including the benefits of investing in a fund that is part of a large family of funds offering a variety of investment disciplines and providing for a large variety of mutual fund investor services. The Board noted that, since the last Advisory Contract renewals in July 2006, Fidelity has taken a number of actions that benefited particular funds, including (i) dedicating additional resources to investment research and to restructure the investment research teams; (ii) contractually agreeing to reduce the management fee on Fidelity Advisor Floating Rate High Income Fund; (iii) contractually agreeing to reduce the management fees on Fidelity's California, Massachusetts, New Jersey, and New York AMT Tax-Free Money Market Funds, launching new Institutional Classes and Service Classes of these funds, and contractually agreeing to impose expense limitations on these funds; (iv) eliminating the exchange fee on the Fidelity Select Portfolios and reducing the pricing and bookkeeping fee rates for these funds; (v) reducing the maximum transfer agency fee rates on high income funds and certain equity funds; (vi) proposing amended management contracts that, if approved by shareholders, will add a performance adjustment component to the management fees paid by 18 Fidelity Advisor equity funds; (vii) contractually agreeing to reduce fees for Ultra-Short Central Fund and the money market Central Funds; (viii) waiving the Fidelity Advisor funds' contingent deferred sales charge on certain redemptions made through systematic withdrawal programs; and (ix) amending the management contracts for equity and fixed-income funds whose management contracts incorporate a "group fee" structure by adding four new fee "breakpoints" to the group fee rate schedules.
Annual Report
Board Approval of Investment Advisory Contracts and Management Fees - continued
Investment Performance and Compliance. The Board considered whether the fund has operated within its investment objective, as well as its record of compliance with its investment restrictions. It also reviewed the fund's absolute investment performance for each class, as well as the fund's relative investment performance for each class measured against (i) a broad-based securities market index, and (ii) a custom peer group of mutual funds deemed appropriate by the Board. Because the fund had been in existence less than three calendar years, the following chart considered by the Board shows, for the one-year period ended December 31, 2006, the total returns of Initial Class R and Service Class 2 of the fund, the total returns of a broad-based securities market index ("benchmark"), and a range of total returns of a custom peer group of mutual funds defined by FMR based on categories assigned by Morningstar, Inc. The returns of Initial Class R and Service Class 2 show the performance of the highest and lowest performing classes, respectively. The box within the chart shows the 25th percentile return (bottom of box) and the 75th percentile return (top of box) of the peer group. Returns shown above the box are in the first quartile and returns shown below the box are in the fourth quartile. The percentage beaten numbers noted below the chart correspond to the percentile box and represent the percentage of funds in the peer group whose performance was equal to or lower than that of the class indicated. The fund's custom peer group, defined by FMR, is a peer group that FMR believes provides a more meaningful performance comparison than the peer group assigned by Morningstar, Inc. Morningstar, Inc. assigns mutual funds to categories based on their investment styles as measured by their underlying portfolio holdings.
VIP International Capital Appreciation Portfolio

The Board reviewed the fund's relative investment performance against its peer group and stated that the performance of Initial Class R of the fund was in the fourth quartile for the period shown. The Board also stated that the investment performance of the fund was lower than its benchmark for the period shown. The Board considered that the variations in performance among the fund's classes reflect the variations in class expenses, which result in lower performance for higher expense classes. The Board stated that it is difficult to evaluate in any comprehensive fashion the performance of the fund, in light of its relatively recent commencement of operations.
The Board considered that FMR has taken steps to refocus and strengthen equity research, equity portfolio management, and compliance.
Based on its review, and giving particular weight to the nature and quality of the resources dedicated by the Investment Advisers to maintain and improve relative performance, the Board concluded that the nature, extent, and quality of the services provided to the fund will benefit the fund's shareholders, particularly in light of the Board's view that the fund's shareholders benefit from investing in a fund that is part of a large family of funds offering a variety of investment disciplines and services.
Annual Report
Competitiveness of Management Fee and Total Fund Expenses. The Board considered the fund's management fee and total expenses compared to "mapped groups" of competitive funds and classes. Fidelity creates "mapped groups" by combining similar Lipper investment objective categories that have comparable management fee characteristics. Combining Lipper investment objective categories aids the Board's management fee and total expense comparisons by broadening the competitive group used for comparison and by reducing the number of universes to which various Fidelity funds are compared. The Board also considered supplemental information about how the fund's management fee and total expenses ranked relative to groups based on Lipper classifications, which take into account a fund's market capitalization and style.
The Board considered two proprietary management fee comparisons for the 12-month (or shorter) periods shown in the chart below. The group of Lipper funds used by the Board for management fee comparisons is referred to below as the "Total Mapped Group." The Total Mapped Group comparison focuses on a fund's standing relative to the total universe of comparable funds available to investors, in terms of gross management fees before expense reimbursements or caps. "TMG %" represents the percentage of funds in the Total Mapped Group that had management fees that were lower than the fund's. For example, a TMG % of 12% means that 88% of the funds in the Total Mapped Group had higher management fees than the fund. The "Asset-Size Peer Group" (ASPG) comparison focuses on a fund's standing relative to non-Fidelity funds similar in size to the fund within the Total Mapped Group. The ASPG represents at least 15% of the funds in the Total Mapped Group with comparable asset size and management fee characteristics, subject to a minimum of 50 funds (or all funds in the Total Mapped Group if fewer than 50). Additional information, such as the ASPG quartile in which the fund's management fee ranked, is also included in the chart and considered by the Board.
VIP International Capital Appreciation Portfolio

The Board noted that the fund's management fee ranked below the median of its Total Mapped Group and below the median of its ASPG for 2006.
Based on its review, the Board concluded that the fund's management fee was fair and reasonable in light of the services that the fund receives and the other factors considered.
In its review of each class's total expenses, the Board considered the fund's management fee as well as other fund or class expenses, as applicable, such as transfer agent fees, pricing and bookkeeping fees, fund-paid 12b-1 fees, and custodial, legal, and audit fees. The Board also noted the effects of any waivers and reimbursements on fees and expenses. As part of its review, the Board also considered current and historical total expenses of each class of the fund compared to competitive fund median expenses. Each class of the fund is compared to those funds and classes in the Total Mapped Group (used by the Board for management fee comparisons) that have a similar sales load structure.
The Board noted that the total expenses of each of Initial Class and Initial Class R ranked below its competitive median for 2006, and the total expenses of each of Investor Class R, Service Class, Service Class 2, Service Class R and Service Class 2 R ranked above its competitive median for 2006. The Board considered that the total expenses of Investor Class R were above the median primarily due to its higher transfer agent fee. The Board noted that the fund offers multiple classes, each of which has a different 12b-1 fee structure, and that the multiple structures are intended to offer a range of pricing options for the intermediary market. The Board also noted that the total expenses of the classes vary primarily by the level of their 12b-1 fees, although differences in transfer agent fees may also cause expenses to vary from class to class.
In its review of total expenses, the Board also considered Fidelity fee structures and other information on clients that FMR and its affiliates service in other competitive markets, such as other mutual funds advised or subadvised by FMR or its affiliates, pension plan clients, and other institutional clients.
Annual Report
Board Approval of Investment Advisory Contracts and Management Fees - continued
Based on its review, the Board concluded that the total expenses of each class of the fund were reasonable, although in some cases above the median of the universe presented for comparison, in light of the services that the fund and its shareholders receive and the other factors considered.
Costs of the Services and Profitability. The Board considered the revenues earned and the expenses incurred by Fidelity in conducting the business of developing, marketing, distributing, managing, administering and servicing the fund and its shareholders. The Board also considered the level of Fidelity's profits in respect of all the Fidelity funds.
On an annual basis, FMR presents to the Board Fidelity's profitability for the fund. Fidelity calculates the profitability for each fund, as well as aggregate profitability for groups of Fidelity funds and all Fidelity funds, using a series of detailed revenue and cost allocation methodologies which originate with the audited books and records of Fidelity. The Audit Committee of the Board reviews any significant changes from the prior year's methodologies.
PricewaterhouseCoopers LLP (PwC), independent registered public accounting firm and auditor to Fidelity and certain Fidelity funds, has been engaged annually by the Board as part of the Board's assessment of the results of Fidelity's profitability analysis. PwC's engagement includes the review and assessment of Fidelity's methodologies used in determining the revenues and expenses attributable to Fidelity's mutual fund business, and completion of agreed-upon procedures surrounding the mathematical accuracy of fund profitability and its conformity to allocation methodologies. After considering PwC's reports issued under the engagement and information provided by Fidelity, the Board believes that while other allocation methods may also be reasonable, Fidelity's profitability methodologies are reasonable in all material respects.
The Board has also reviewed Fidelity's non-fund businesses and any fall-out benefits related to the mutual fund business as well as cases where Fidelity's affiliates may benefit from or be related to the fund's business.
The Board considered the costs of the services provided by and the profits realized by Fidelity in connection with the operation of the fund and determined that the amount of profit is a fair entrepreneurial profit for the management of the fund.
Economies of Scale. The Board considered whether there have been economies of scale in respect of the management of the Fidelity funds, whether the Fidelity funds (including the fund) have appropriately benefited from any such economies of scale, and whether there is potential for realization of any further economies of scale. The Board considered the extent to which the fund will benefit from economies of scale through increased services to the fund, through waivers or reimbursements, or through fee or expense reductions.
The Board recognized that the fund's management contract incorporates a "group fee" structure, which provides for lower group fee rates as total fund assets under FMR's management increase, and for higher group fee rates as total fund assets under FMR's management decrease. FMR determines the group fee rates based on a tiered asset "breakpoint" schedule. In connection with the renewal of the fund's management contract, the Board approved amendments to the fund's management contract that added four new fee breakpoints to the group fee rate schedule for assets under FMR's management above $1,386 billion. The Board considered that the group fee rate declines under both the present and amended schedules, but that under the amended schedule, the group fee rate declines faster as assets under FMR's management exceed $1,386 billion. The Board considered that the group fee is designed to deliver the benefits of economies of scale to fund shareholders when total fund assets increase, even if assets of any particular fund are unchanged or have declined, because some portion of Fidelity's costs are attributable to services provided to all Fidelity funds, and all funds benefit if those costs can be allocated among more assets. The Board concluded that, given the group fee structure, fund shareholders will achieve a certain level of economies of scale as assets under FMR's management increase at the fund complex level, regardless of whether Fidelity achieves any such economies of scale.
The Board further concluded that any potential economies of scale are being shared between fund shareholders and Fidelity in an appropriate manner.
Additional Information Requested by the Board. In order to develop fully the factual basis for consideration of the Fidelity funds' Advisory Contracts, the Board requested and received additional information on several topics, including (i) fund performance trends and actions to be taken by FMR to improve certain funds' overall performance; (ii) Fidelity's portfolio manager compensation structure, including its effects on fund profitability and the extent to which portfolio manager compensation is linked to fund performance; (iii) Fidelity's fee structures; (iv) the funds' sub-advisory arrangements; and (v) accounts managed by Fidelity other than the Fidelity funds.
Based on its evaluation of all of the conclusions noted above, and after considering all material factors, the Board ultimately concluded that the advisory fee structures are fair and reasonable, and that the fund's Advisory Contracts should be renewed.
Annual Report
Annual Report
Investment Adviser
Fidelity Management & Research Company
Boston, MA
Investment Sub-Advisers
FMR Co., Inc.
Fidelity Management & Research (U.K.) Inc.
Fidelity Research & Analysis Company
Fidelity International Investment Advisors
Fidelity International Investment Advisors (U.K.) Limited
Fidelity Investments Japan Limited
General Distributor
Fidelity Distributors Corporation
Boston, MA
Transfer and Service Agents
Fidelity Investments Institutional Operations Company, Inc.
Boston, MA
Fidelity Service Company, Inc.
Boston, MA
Custodian
Brown Brothers Harriman & Co.
Boston, MA
VIPCAR-ANN-0208
1.805787.103
Fidelity® Variable Insurance Products:
Materials Portfolio
Annual Report
December 31, 2007
(2_fidelity_logos) (Registered_Trademark)
Contents
Performance | <Click Here> | How the fund has done over time. |
Management's Discussion | <Click Here> | The manager's review of fund performance, strategy and outlook. |
Shareholder Expense Example | <Click Here> | An example of shareholder expenses. |
Investment Changes | <Click Here> | A summary of major shifts in the fund's investments over the past six months. |
Investments | <Click Here> | A complete list of the fund's investments with their
market values. |
Financial Statements | <Click Here> | Statements of assets and liabilities, operations, and
changes in net assets, as well as financial highlights. |
Notes | <Click Here> | Notes to the financial statements. |
Report of Independent Registered Public Accounting Firm | <Click Here> | |
Trustees and Officers | <Click Here> | |
Distributions | <Click Here> | |
To view a fund's proxy voting guidelines and proxy voting record for the 12-month period ended June 30, visit http://www.fidelity.com (search for "proxy voting guidelines") or visit the Securities and Exchange Commission's (SEC) web site at http://www.sec.gov. You may also call 1-877-208-0098 to request a free copy of the proxy voting guidelines.
Fidelity Variable Insurance Products are separate account options which are purchased through a variable insurance contract.
Standard & Poor's, S&P and S&P 500 are registered service marks of The McGraw-Hill Companies, Inc. and have been licensed for use by Fidelity Distributors Corporation.
Other third party marks appearing herein are the property of their respective owners.
All other marks appearing herein are registered or unregistered trademarks or service marks of FMR LLC or an affiliated company.
This report and the financial statements contained herein are submitted for the general information of the shareholders of the fund. This report is not authorized for distribution to prospective investors in the fund unless preceded or accompanied by an effective prospectus.
A fund files its complete schedule of portfolio holdings with the SEC for the first and third quarters of each fiscal year on Form N-Q. Forms N-Q are available on the SEC's web site at http://www.sec.gov. A fund's Forms N-Q may be reviewed and copied at the SEC's Public Reference Room in Washington, DC. Information regarding the operation of the SEC's Public Reference Room may be obtained by calling 1-800-SEC-0330. For a complete list of a fund's portfolio holdings, view the most recent holdings listing, semiannual report, or annual report on Fidelity's web site at http://www.fidelity.com or http://www.advisor.fidelity.com, as applicable.
NOT FDIC INSURED · MAY LOSE VALUE · NO BANK GUARANTEE
Neither the fund nor Fidelity Distributors Corporation is a bank.
Annual Report
Performance: The Bottom Line
Average annual total return reflects the change in the value of an investment, assuming reinvestment of the class' dividend income and capital gains (the profits earned upon the sale of securities that have grown in value, if any) and assuming a constant rate of performance each year. During periods of reimbursement by Fidelity, a fund's total return will be greater than it would be had the reimbursement not occurred. Performance numbers are net of all underlying fund operating expenses, but do not include any insurance charges imposed by your insurance company's separate account. If performance information included the effect of these additional charges, the total returns would have been lower. How a fund did yesterday is no guarantee of how it will do tomorrow.
Average annual total returns take VIP Materials Portfolio's cumulative total return and show you what would have happened if VIP Materials Portfolio shares had performed at a constant rate each year. These numbers will be reported once the fund is a year old.
$10,000 Over Life of Fund
Let's say hypothetically that $10,000 was invested in VIP Materials Portfolio - Initial Class on April 24, 2007, when the fund started. The chart shows how the value of your investment would have changed, and also shows how the Standard & Poor's 500SM Index (S&P 500®) performed over the same period.
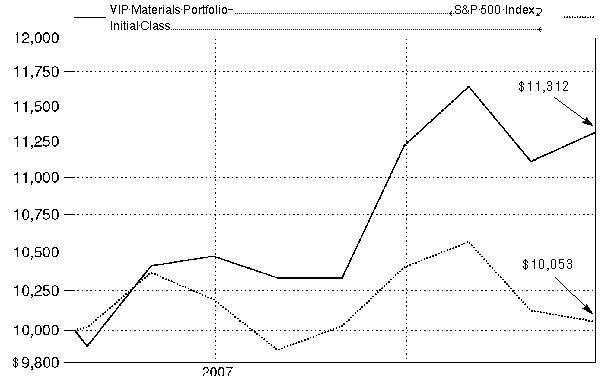
Annual Report
Management's Discussion of Fund Performance
Comments from Tobias Welo, who will become Portfolio Manager of VIP Materials Portfolio on January 9, 2008
U.S. equity markets, as measured by the bellwether Dow Jones Industrial AverageSM and the Standard & Poor's 500SM Index, registered their fifth consecutive year of positive returns in 2007, as the Dow rose 8.88% and the S&P 500® index advanced 5.49%. The tech-heavy NASDAQ Composite® Index did even better, increasing 10.55%. However, credit-and recession-related concerns carved deeply into stock prices late in 2007, pushing some major market measures into negative territory for the year overall, particularly smaller-cap and value-oriented benchmarks. Based largely on a weak U.S. dollar that boosted returns for U.S. investors, the Morgan Stanley Capital InternationalSM Europe, Australasia, and Far East (MSCI® EAFE®) Index - a gauge of developed stock markets outside the United States and Canada - beat most domestic equity measures, gaining 11.33%. Several European countries had outstanding performance, including Finland and Germany, while Australia also did very well. However, fallout from the credit crunch and concerns about export growth tempered U.K. stocks, while fears that Japanese financial companies would become embroiled in the U.S. subprime mortgage crisis contributed to a loss of more than 4% for the Japanese portion of the index. The emerging-markets stock asset class soared 39.78% according to the MSCI Emerging Markets index. The U.S. investment-grade bond market climbed 6.97% as measured by the Lehman Brothers® U.S. Aggregate Index, beating the 2.53% gain for the Merrill Lynch® U.S. High Yield Master II Constrained Index. The emerging-markets bond category shook off a sluggish first half of 2007 to finish the year with a respectable gain of 6.28% as measured by the J.P. Morgan Emerging Markets Bond Index (EMBI) Global, while the Citigroup® Non-U.S. Group of 7 Index - representing the debt performance of major global economies, excluding the United States - rose 13.05%.
From its inception on April 24, 2007, through December 31, 2007, the fund outperformed the 11.08% return for the Morgan Stanley Capital InternationalSM (MSCI®) US Investable Market Materials Index and the S&P 500, which returned 0.53% over the same time period. (For specific portfolio performance results, please refer to the performance section of this report.) Strong industry selection played a key role in the fund's solid performance. For example, the fund's sizable underweightings in weak-performing industries, such as construction materials, paper products and paper packaging, helped. In addition, good stock selection within these areas contributed. Stock picking and an underweighting in the lagging diversified chemicals group also aided results, as did the fund's modest allocation to cash amid price dips in materials stocks late in the period. Among individual holdings, Canada's Agrium - which wasn't part of the index - was the top contributor. The firm, which produces specialty fertilizers and agricultural nutrients, was boosted by steady agricultural demand and merger and acquisition news. Further, not owning certain poor-performing index components related to paper packaging and paper products aided results, including such names as Sealed Air, which was hampered by sluggish profits and rising costs, and Canadian pulp and paper producer Domtar, which struggled through falling earnings expectations. Among detractors, the fund's slight underweighting in the fertilizers/agricultural chemicals area hurt, as did stock selection within the group. Specifically, the fund's lack of exposure to fertilizer concern CF Industries and fertilizer supplier Terra Industries, both of which were up strongly, dampened results. Certain stock picks within diversified metals and mining and in specialty chemicals also detracted.
The views expressed above reflect those of the portfolio manager(s) only through the end of the period as stated on the cover of this report and do not necessarily represent the views of Fidelity or any other person in the Fidelity organization. Any such views are subject to change at any time based upon market or other conditions and Fidelity disclaims any responsibility to update such views. These views may not be relied on as investment advice and, because investment decisions for a Fidelity fund are based on numerous factors, may not be relied on as an indication of trading intent on behalf of any Fidelity fund.
Annual Report
Shareholder Expense Example
As a shareholder of the Fund, you incur two types of costs: (1) transaction costs, including redemption fees, and (2) ongoing costs, including management fees and other Fund expenses. This Example is intended to help you understand your ongoing costs (in dollars) of investing in the Fund and to compare these costs with the ongoing costs of investing in other mutual funds.
The Example is based on an investment of $1,000 invested at the beginning of the period and held for the entire period (July 1, 2007 to December 31, 2007).
Actual Expenses
The first line of the accompanying table for each class of the Fund provides information about actual account values and actual expenses. You may use the information in this line, together with the amount you invested, to estimate the expenses that you paid over the period. Simply divide your account value by $1,000.00 (for example, an $8,600 account value divided by $1,000.00 = 8.6), then multiply the result by the number in the first line for a class of the Fund under the heading entitled "Expenses Paid During Period" to estimate the expenses you paid on your account during this period. The estimate of expenses does not include any fees or other expenses of any variable annuity or variable life insurance product. If they were, the estimate of expenses you paid during the period would be higher, and your ending account value would be lower. In addition, the Fund, as a shareholder in the underlying Fidelity Central Funds, will indirectly bear its pro rata share of the fees and expenses incurred by the underlying Fidelity Central Funds. These fees and expenses are not included in the Fund's annualized expense ratio used to calculate the expense estimate in the table below.
Hypothetical Example for Comparison Purposes
The second line of the accompanying table for each class of the Fund provides information about hypothetical account values and hypothetical expenses based on a Class' actual expense ratio and an assumed rate of return of 5% per year before expenses, which is not the Class' actual return. The hypothetical account values and expenses may not be used to estimate the actual ending account balance or expenses you paid for the period. You may use this information to compare the ongoing costs of investing in the Fund and other funds. To do so, compare this 5% hypothetical example with the 5% hypothetical examples that appear in the shareholder reports of the other funds. The estimate of expenses does not include any fees or other expenses of any variable annuity or variable life insurance product. If they were, the estimate of expenses you paid during the period would be higher, and your ending account value would be lower. In addition, the Fund, as a shareholder in the underlying Fidelity Central Funds, will indirectly bear its pro rata share of the fees and expenses incurred by the underlying Fidelity Central Funds. These fees and expenses are not included in the Fund's annualized expense ratio used to calculate the expense estimate in the table below.
Please note that the expenses shown in the table are meant to highlight your ongoing costs only and do not reflect any transaction costs. Therefore, the second line of the table is useful in comparing ongoing costs only, and will not help you determine the relative total costs of owning different funds. In addition, if these transactional costs were included, your costs would have been higher.
| Beginning
Account Value
July 1, 2007 | Ending
Account Value
December 31, 2007 | Expenses Paid
During Period*
July 1, 2007 to
December 31, 2007 |
Initial Class | | | |
Actual | $ 1,000.00 | $ 1,080.40 | $ 5.24 |
HypotheticalA | $ 1,000.00 | $ 1,020.16 | $ 5.09 |
Investor Class | | | |
Actual | $ 1,000.00 | $ 1,079.70 | $ 6.03** |
HypotheticalA | $ 1,000.00 | $ 1,019.41 | $ 5.85** |
A 5% return per year before expenses
* Expenses are equal to each Class' annualized expense ratio (shown in the table below); multiplied by the average account value over the period, multiplied by 184/365 (to reflect the one-half year period).
| Annualized
Expense Ratio |
Initial Class | 1.00% |
Investor Class | 1.15%** |
** If changes to transfer agent contracts and voluntary expense limitations, effective February 1, 2008 had been in effect during the entire period, the annualized expense ratio would have been 1.08% and the expenses paid in the actual and hypothetical examples above would have been $5.66 and $5.50, respectively.
Annual Report
Investment Changes
Top Ten Stocks as of December 31, 2007 |
| % of fund's
net assets | % of fund's net assets
6 months ago |
Monsanto Co. | 10.1 | 7.2 |
E.I. du Pont de Nemours & Co. | 6.6 | 7.8 |
Dow Chemical Co. | 5.9 | 4.3 |
Freeport-McMoRan Copper & Gold, Inc. Class B | 5.9 | 4.4 |
Praxair, Inc. | 4.5 | 4.1 |
Alcoa, Inc. | 3.8 | 5.3 |
Air Products & Chemicals, Inc. | 3.4 | 3.4 |
Nucor Corp. | 2.7 | 2.8 |
Celanese Corp. Class A | 2.5 | 1.8 |
PPG Industries, Inc. | 2.2 | 2.4 |
| 47.6 | |
Top Industries (% of fund's net assets) |
As of December 31, 2007 |
| Chemicals | 56.2% | |
| Metals & Mining | 25.4% | |
| Paper & Forest Products | 4.6% | |
| Containers & Packaging | 3.5% | |
| Construction Materials | 1.5% | |
| All Others* | 8.8% | |

|
As of June 30, 2007 |
| Chemicals | 48.7% | |
| Metals & Mining | 29.6% | |
| Paper & Forest Products | 5.1% | |
| Containers & Packaging | 4.6% | |
| Construction Materials | 3.1% | |
| All Others* | 8.9% | |

* Includes short-term investments and net other assets. |
Annual Report
Investments December 31, 2007
Showing Percentage of Net Assets
Common Stocks - 94.1% |
| Shares | | Value |
CHEMICALS - 56.2% |
Commodity Chemicals - 4.2% |
Celanese Corp. Class A | 14,200 | | $ 600,944 |
Georgia Gulf Corp. | 8,433 | | 55,826 |
Spartech Corp. | 9,180 | | 129,438 |
Tronox, Inc.: | | | |
Class A | 12,700 | | 113,030 |
Class B | 15,271 | | 132,094 |
| | 1,031,332 |
Diversified Chemicals - 19.1% |
Cabot Corp. | 3,800 | | 126,692 |
Dow Chemical Co. | 36,700 | | 1,446,714 |
E.I. du Pont de Nemours & Co. | 36,700 | | 1,618,103 |
Eastman Chemical Co. | 3,300 | | 201,597 |
FMC Corp. | 3,800 | | 207,290 |
Hercules, Inc. | 17,000 | | 328,950 |
Huntsman Corp. | 3,900 | | 100,230 |
Olin Corp. | 6,000 | | 115,980 |
PPG Industries, Inc. | 7,800 | | 547,794 |
| | 4,693,350 |
Fertilizers & Agricultural Chemicals - 12.4% |
Agrium, Inc. | 1,900 | | 137,057 |
Monsanto Co. | 22,300 | | 2,490,687 |
The Mosaic Co. (a) | 4,400 | | 415,096 |
Uralkali JSC ADR (a)(c) | 200 | | 7,450 |
| | 3,050,290 |
Industrial Gases - 8.6% |
Air Products & Chemicals, Inc. | 8,300 | | 818,629 |
Airgas, Inc. | 3,400 | | 177,174 |
Praxair, Inc. | 12,500 | | 1,108,875 |
| | 2,104,678 |
Specialty Chemicals - 11.9% |
Albemarle Corp. | 5,700 | | 235,125 |
Chemtura Corp. | 13,400 | | 104,520 |
Cytec Industries, Inc. | 3,400 | | 209,372 |
Ecolab, Inc. | 10,100 | | 517,221 |
H.B. Fuller Co. | 6,800 | | 152,660 |
Innospec, Inc. | 8,107 | | 139,116 |
Lubrizol Corp. | 3,500 | | 189,560 |
Minerals Technologies, Inc. | 1,520 | | 101,764 |
Nalco Holding Co. | 9,400 | | 227,292 |
OMNOVA Solutions, Inc. (a) | 32,865 | | 144,935 |
Rockwood Holdings, Inc. (a) | 9,800 | | 325,556 |
Rohm & Haas Co. | 4,100 | | 217,587 |
Sigma Aldrich Corp. | 4,400 | | 240,240 |
Valspar Corp. | 3,200 | | 72,128 |
Zoltek Companies, Inc. (a) | 741 | | 31,767 |
| | 2,908,843 |
TOTAL CHEMICALS | | 13,788,493 |
|
| Shares | | Value |
CONSTRUCTION MATERIALS - 1.5% |
Construction Materials - 1.5% |
Martin Marietta Materials, Inc. | 600 | | $ 79,560 |
Polaris Minerals Corp. (a) | 3,100 | | 35,601 |
Polaris Minerals Corp. (a)(c) | 6,200 | | 71,201 |
Vulcan Materials Co. | 2,400 | | 189,816 |
| | 376,178 |
CONTAINERS & PACKAGING - 3.5% |
Metal & Glass Containers - 1.7% |
Ball Corp. | 1,900 | | 85,500 |
Crown Holdings, Inc. (a) | 3,600 | | 92,340 |
Owens-Illinois, Inc. (a) | 3,400 | | 168,300 |
Pactiv Corp. (a) | 2,600 | | 69,238 |
| | 415,378 |
Paper Packaging - 1.8% |
Bemis Co., Inc. | 2,600 | | 71,188 |
Packaging Corp. of America | 7,500 | | 211,500 |
Smurfit-Stone Container Corp. (a) | 7,800 | | 82,368 |
Temple-Inland, Inc. | 3,100 | | 64,635 |
| | 429,691 |
TOTAL CONTAINERS & PACKAGING | | 845,069 |
DIVERSIFIED FINANCIAL SERVICES - 0.1% |
Other Diversifed Financial Services - 0.1% |
Guaranty Financial Group, Inc. (a) | 1,033 | | 16,528 |
INDUSTRIAL CONGLOMERATES - 1.4% |
Industrial Conglomerates - 1.4% |
3M Co. | 4,200 | | 354,144 |
METALS & MINING - 25.4% |
Aluminum - 3.8% |
Alcoa, Inc. | 25,500 | | 932,025 |
Diversified Metals & Mining - 7.2% |
Freeport-McMoRan Copper & Gold, Inc. Class B | 14,000 | | 1,434,160 |
Rio Tinto PLC sponsored ADR | 200 | | 83,980 |
Titanium Metals Corp. | 9,700 | | 256,565 |
| | 1,774,705 |
Gold - 2.7% |
Goldcorp, Inc. | 7,400 | | 251,744 |
Newmont Mining Corp. | 8,100 | | 395,523 |
| | 647,267 |
Steel - 11.7% |
Allegheny Technologies, Inc. | 2,700 | | 233,280 |
ArcelorMittal SA (NY Reg.) Class A | 3,300 | | 255,255 |
Carpenter Technology Corp. | 4,400 | | 330,748 |
Commercial Metals Co. | 2,800 | | 82,460 |
Nucor Corp. | 11,300 | | 669,186 |
Reliance Steel & Aluminum Co. | 7,100 | | 384,820 |
Common Stocks - continued |
| Shares | | Value |
METALS & MINING - CONTINUED |
Steel - continued |
Steel Dynamics, Inc. | 8,300 | | $ 494,431 |
United States Steel Corp. | 3,400 | | 411,094 |
| | 2,861,274 |
TOTAL METALS & MINING | | 6,215,271 |
OIL, GAS & CONSUMABLE FUELS - 0.8% |
Coal & Consumable Fuels - 0.8% |
Cameco Corp. | 1,900 | | 75,671 |
Patriot Coal Corp. (a) | 190 | | 7,931 |
Peabody Energy Corp. | 2,000 | | 123,280 |
| | 206,882 |
PAPER & FOREST PRODUCTS - 4.6% |
Forest Products - 2.5% |
Deltic Timber Corp. | 2,100 | | 108,129 |
Weyerhaeuser Co. | 6,800 | | 501,432 |
| | 609,561 |
Paper Products - 2.1% |
Glatfelter | 7,965 | | 121,944 |
International Paper Co. | 9,500 | | 307,610 |
MeadWestvaco Corp. | 2,900 | | 90,770 |
| | 520,324 |
TOTAL PAPER & FOREST PRODUCTS | | 1,129,885 |
REAL ESTATE INVESTMENT TRUSTS - 0.5% |
Specialized REITs - 0.5% |
Potlatch Corp. | 2,700 | | 119,988 |
REAL ESTATE MANAGEMENT & DEVELOPMENT - 0.1% |
Real Estate Management & Development - 0.1% |
Forestar Real Estate Group, Inc. (a) | 1,033 | | 24,368 |
TOTAL COMMON STOCKS (Cost $21,928,275) | 23,076,806 |
Money Market Funds - 5.7% |
| | | |
Fidelity Cash Central Fund, 4.58% (b)
(Cost $1,386,031) | 1,386,031 | | 1,386,031 |
Cash Equivalents - 0.1% |
| Maturity Amount | | Value |
Investments in repurchase agreements in a joint trading account at 1.41%, dated 12/31/07 due 1/2/08 (Collateralized by U.S. Government Obligations) #
(Cost $34,000) | $ 34,003 | | $ 34,000 |
TOTAL INVESTMENT PORTFOLIO - 99.9% (Cost $23,348,306) | | 24,496,837 |
NET OTHER ASSETS - 0.1% | | 26,293 |
NET ASSETS - 100% | $ 24,523,130 |
Legend |
(a) Non-income producing |
(b) Affiliated fund that is available only to investment companies and other accounts managed by Fidelity Investments. The rate quoted is the annualized seven-day yield of the fund at period end. A complete unaudited listing of the fund's holdings as of its most recent quarter end is available upon request. |
(c) Security exempt from registration under Rule 144A of the Securities Act of 1933. These securities may be resold in transactions exempt from registration, normally to qualified institutional buyers. At the end of the period, the value of these securities amounted to $78,651 or 0.3% of net assets. |
# Additional Information on each counterparty to the repurchase agreement is as follows: |
Repurchase Agreement / Counterparty | Value |
$34,000 due 1/02/08 at 1.41% |
ABN AMRO Bank N.V., New York Branch | $ 14,850 |
Lehman Brothers, Inc. | 9,243 |
Merrill Lynch Government Securities, Inc. | 9,907 |
| $ 34,000 |
Affiliated Central Funds |
Information regarding fiscal year to date income earned by the Fund from investments in Fidelity Central Funds is as follows: |
Fund | Income earned |
Fidelity Cash Central Fund | $ 32,230 |
See accompanying notes which are an integral part of the financial statements.
Annual Report
Financial Statements
Statement of Assets and Liabilities
| December 31, 2007 |
| | |
Assets | | |
Investment in securities, at value (including repurchase agreements of $34,000) - See accompanying schedule: Unaffiliated issuers
(cost $21,962,275) | $ 23,110,806 | |
Fidelity Central Funds
(cost $1,386,031) | 1,386,031 | |
Total Investments (cost $23,348,306) | | $ 24,496,837 |
Receivable for investments sold | | 14,341 |
Receivable for fund shares sold | | 43,707 |
Dividends receivable | | 36,647 |
Distributions receivable from Fidelity Central Funds | | 3,218 |
Prepaid expenses | | 63 |
Other receivables | | 102 |
Total assets | | 24,594,915 |
| | |
Liabilities | | |
Payable to custodian bank | $ 14,236 | |
Payable for fund shares redeemed | 11,033 | |
Accrued management fee | 12,130 | |
Other affiliated payables | 3,135 | |
Other payables and accrued expenses | 31,251 | |
Total liabilities | | 71,785 |
| | |
Net Assets | | $ 24,523,130 |
Net Assets consist of: | | |
Paid in capital | | $ 23,328,583 |
Accumulated undistributed net realized gain (loss) on investments and foreign currency transactions | | 46,018 |
Net unrealized appreciation (depreciation) on investments and assets and liabilities in foreign currencies | | 1,148,529 |
Net Assets | | $ 24,523,130 |
Statement of Assets and Liabilities - continued
| December 31, 2007 |
| | |
Initial Class:
Net Asset Value, offering price and redemption price per share ($13,730,030 ÷ 1,233,630 shares) | | $ 11.13 |
| | |
Investor Class:
Net Asset Value, offering price and redemption price per share ($10,793,100 ÷ 970,030 shares) | | $ 11.13 |
See accompanying notes which are an integral part of the financial statements.
Annual Report
Statement of Operations
| For the period April 24, 2007 (commencement of operations) to December 31, 2007 |
| | |
Investment Income | | |
Dividends | | $ 191,497 |
Special dividends | | 31,775 |
Interest | | 1,671 |
Income from Fidelity Central Funds | | 32,230 |
Total income | | 257,173 |
| | |
Expenses | | |
Management fee | $ 61,394 | |
Transfer agent fees | 16,166 | |
Accounting fees and expenses | 4,285 | |
Custodian fees and expenses | 10,616 | |
Independent trustees' compensation | 31 | |
Audit | 32,937 | |
Legal | 14 | |
Miscellaneous | 553 | |
Total expenses before reductions | 125,996 | |
Expense reductions | (7,651) | 118,345 |
Net investment income (loss) | | 138,828 |
Realized and Unrealized Gain (Loss) Net realized gain (loss) on: | | |
Investment securities: | | |
Unaffiliated issuers | 296,264 | |
Foreign currency transactions | (1,179) | |
Total net realized gain (loss) | | 295,085 |
Change in net unrealized appreciation (depreciation) on: Investment securities | 1,148,531 | |
Assets and liabilities in foreign currencies | (2) | |
Total change in net unrealized appreciation (depreciation) | | 1,148,529 |
Net gain (loss) | | 1,443,614 |
Net increase (decrease) in net assets resulting from operations | | $ 1,582,442 |
Statement of Changes in Net Assets
| For the period
April 24, 2007 (commencement of operations) to
December 31, 2007 |
Increase (Decrease) in Net Assets | |
Operations | |
Net investment income (loss) | $ 138,828 |
Net realized gain (loss) | 295,085 |
Change in net unrealized appreciation (depreciation) | 1,148,529 |
Net increase (decrease) in net assets resulting from operations | 1,582,442 |
Distributions to shareholders from net investment income | (150,736) |
Distributions to shareholders from net realized gain | (237,160) |
Total distributions | (387,896) |
Share transactions - net increase (decrease) | 23,315,139 |
Redemption fees | 13,445 |
Total increase (decrease) in net assets | 24,523,130 |
| |
Net Assets | |
Beginning of period | - |
End of period | $ 24,523,130 |
See accompanying notes which are an integral part of the financial statements.
Annual Report
Financial Highlights - Initial Class
Period ended December 31, | 2007 I |
Selected Per-Share Data | |
Net asset value, beginning of period | $ 10.00 |
Income from Investment Operations | |
Net investment income (loss) | .10 H |
Net realized and unrealized gain (loss) E | 1.20 |
Total from investment operations | 1.30 |
Distributions from net investment income | (.07) |
Distributions from net realized gain | (.11) |
Total distributions | (.18) |
Redemption fees added to paid in capital E | .01 |
Net asset value, end of period | $ 11.13 |
Total Return B,C,D | 13.12% |
Ratios to Average Net Assets F,J | |
Expenses before reductions | 1.08% A |
Expenses net of fee waivers, if any | 1.00% A |
Expenses net of all reductions | 1.00% A |
Net investment income (loss) | 1.31% A,H |
Supplemental Data | |
Net assets, end of period (000 omitted) | $ 13,730 |
Portfolio turnover rate G | 35% A |
A Annualized B Total returns for periods of less than one year are not annualized. C Total returns do not reflect charges attributable to your insurance company's separate account. Inclusion of these charges would reduce the total returns shown. D Total returns would have been lower had certain expenses not been reduced during the periods shown. E Calculated based on average shares outstanding during the period. F Fees and expenses of the underlying Fidelity Central Funds are not included in the Fund's expense ratio. The Fund indirectly bears its proportionate share of the expenses of any underlying Fidelity Central Funds. G Amount does not include the portfolio activity of any underlying Fidelity Central Funds. H Investment income per share reflects a special dividend which amounted to $.02 per share. Excluding the special dividend, the ratio of net investment income (loss) to average net assets would have been 1.03%. I For the period April 24, 2007 (commencement of operations) to December 31, 2007. J Expense ratios reflect operating expenses of the class. Expenses before reductions do not reflect amounts reimbursed by the investment adviser or reductions from brokerage service arrangements or other expense offset arrangements and do not represent the amount paid by the class during periods when reimbursements or reductions occur. Expense ratios before reductions for start-up periods may not be representative of longer-term operating periods. Expenses net of fee waivers reflect expenses after reimbursement by the investment adviser but prior to reductions from brokerage service arrangements or other expense offset arrangements. Expenses net of all reductions represent the net expenses paid by the class. |
Financial Highlights - Investor Class
Period ended December 31, | 2007 I |
Selected Per-Share Data | |
Net asset value, beginning of period | $ 10.00 |
Income from Investment Operations | |
Net investment income (loss) | .09 H |
Net realized and unrealized gain (loss) E | 1.21 |
Total from investment operations | 1.30 |
Distributions from net investment income | (.07) |
Distributions from net realized gain | (.11) |
Total distributions | (.18) |
Redemption fees added to paid in capital E | .01 |
Net asset value, end of period | $ 11.13 |
Total Return B,C,D | 13.05% |
Ratios to Average Net Assets F,J | |
Expenses before reductions | 1.20% A |
Expenses net of fee waivers, if any | 1.15% A |
Expenses net of all reductions | 1.15% A |
Net investment income (loss) | 1.16% A,H |
Supplemental Data | |
Net assets, end of period (000 omitted) | $ 10,793 |
Portfolio turnover rate G | 35% A |
A Annualized B Total returns for periods of less than one year are not annualized. C Total returns do not reflect charges attributable to your insurance company's separate account. Inclusion of these charges would reduce the total returns shown. D Total returns would have been lower had certain expenses not been reduced during the periods shown. E Calculated based on average shares outstanding during the period. F Fees and expenses of the underlying Fidelity Central Funds are not included in the Fund's expense ratio. The Fund indirectly bears its proportionate share of the expenses of any underlying Fidelity Central Funds. G Amount does not include the portfolio activity of any underlying Fidelity Central Funds. H Investment income per share reflects a special dividend which amounted to $.02 per share. Excluding the special dividend, the ratio of net investment income (loss) to average net assets would have been .88%. I For the period April 24, 2007 (commencement of operations) to December 31, 2007. J Expense ratios reflect operating expenses of the class. Expenses before reductions do not reflect amounts reimbursed by the investment adviser or reductions from brokerage service arrangements or other expense offset arrangements and do not represent the amount paid by the class during periods when reimbursements or reductions occur. Expense ratios before reductions for start-up periods may not be representative of longer-term operating periods. Expenses net of fee waivers reflect expenses after reimbursement by the investment adviser but prior to reductions from brokerage service arrangements or other expense offset arrangements. Expenses net of all reductions represent the net expenses paid by the class. |
See accompanying notes which are an integral part of the financial statements.
Annual Report
Notes to Financial Statements
For the period ended December 31, 2007
1. Organization.
VIP Materials Portfolio (the Fund) is a non-diversified fund of Variable Insurance Products Fund IV (the trust) and is authorized to issue an unlimited number of shares. The trust is registered under the Investment Company Act of 1940, as amended (the 1940 Act), as an open-end management investment company organized as a Massachusetts business trust. Shares of the Fund may only be purchased by insurance companies for the purpose of funding variable annuity or variable life insurance contracts. The Fund offers the following classes of shares: Initial Class shares and Investor Class shares. All classes have equal rights and voting privileges, except for matters affecting a single class. Investment income, realized and unrealized capital gains and losses, the common expenses of the Fund, and certain fund-level expense reductions, if any, are allocated on a pro rata basis to each class based on the relative net assets of each class to the total net assets of the Fund. Each class differs with respect to transfer agent fees incurred. Certain expense reductions also differ by class.
2. Investments in Fidelity Central Funds.
The Fund may invest in Fidelity Central Funds, which are open-end investment companies available only to other investment companies and accounts managed by Fidelity Management & Research Company (FMR) and its affiliates. The Fund's Schedule of Investments lists each of the Fidelity Central Funds as an investment of the Fund, but does not include the underlying holdings of each Fidelity Central Fund. As an Investing Fund, the Fund indirectly bears its proportionate share of the expenses of the underlying Fidelity Central Funds.
The Money Market Central Funds seek preservation of capital and current income and are managed by Fidelity Investments Money Management, Inc. (FIMM), an affiliate of FMR.
A complete list of holdings for each Fidelity Central Fund is available upon request or at the SEC's web site at www.sec.gov. In addition, the financial statements of the Fidelity Central Funds, which are not covered by the Fund's Report of Independent Registered Public Accounting Firm, are available on the SEC's web site or upon request.
3. Significant Accounting Policies.
The financial statements have been prepared in conformity with accounting principles generally accepted in the United States of America, which require management to make certain estimates and assumptions at the date of the financial statements. The following summarizes the significant accounting policies of the Fund:
Security Valuation. Investments are valued and net asset value (NAV) per share is calculated (NAV calculation) as of the close of business of the New York Stock Exchange (NYSE), normally 4:00 p.m. Eastern time. Wherever possible, the Fund uses independent pricing services approved by the Board of Trustees to value its investments.
Equity securities, including restricted securities, for which market quotations are readily available, are valued at the last reported sale price or official closing price as reported by an independent pricing service on the primary market or exchange on which they are traded. In the event there were no sales during the day or closing prices are not available, securities are valued at the last quoted bid price. Investments in open-end mutual funds, including the Fidelity Central Funds, are valued at their closing net asset value each business day. Short-term securities with remaining maturities of sixty days or less for which quotations are not readily available are valued at amortized cost, which approximates value.
When current market prices or quotations are not readily available or do not accurately reflect fair value, valuations may be determined in accordance with procedures adopted by the Board of Trustees. For example, when developments occur between the close of a market and the close of the NYSE that may materially affect the value of some or all of the securities, or when trading in a security is halted, those securities may be fair valued. Factors used in the determination of fair value may include monitoring news to identify significant market or security specific events such as changes in the value of U.S. securities markets, reviewing developments in foreign markets and evaluating the performance of ADRs, futures contracts and exchange-traded funds. Because the Fund's utilization of fair value pricing depends on market activity, the frequency with which fair value pricing is used cannot be predicted and may be utilized to a significant extent. The value of securities used for NAV calculation under fair value pricing may differ from published prices for the same securities.
Foreign Currency. The Fund uses foreign currency contracts to facilitate transactions in foreign-denominated securities. Losses from these transactions may arise from changes in the value of the foreign currency or if the counterparties do not perform under the contracts' terms.
Foreign-denominated assets, including investment securities, and liabilities are translated into U.S. dollars at the exchange rate at period end. Purchases and sales of investment securities, income and dividends received and expenses denominated in foreign currencies are translated into U.S. dollars at the exchange rate in effect on the transaction date.
The effects of exchange rate fluctuations on investments are included with the net realized and unrealized gain (loss) on investment securities. Other foreign currency transactions resulting in realized and unrealized gain (loss) are disclosed separately.
Annual Report
Notes to Financial Statements - continued
3. Significant Accounting Policies - continued
Investment Transactions and Income. For financial reporting purposes, the Fund's investment holdings and NAV include trades executed through the end of the last business day of the period. The NAV for processing shareholder transactions includes trades executed through the end of the prior business day. Gains and losses on securities sold are determined on the basis of identified cost. Dividend income is recorded on the ex-dividend date, except for certain dividends from foreign securities where the ex-dividend date may have passed, which are recorded as soon as the Fund is informed of the ex-dividend date. Non-cash dividends included in dividend income, if any, are recorded at the fair market value of the securities received. Distributions received on securities that represent a return of capital or capital gain are recorded as a reduction of cost of investments and/or as a realized gain. The Fund estimates the components of distributions received that may be considered return of capital distributions or capital gain distributions.
Large, non-recurring dividends recognized by the Fund are presented separately on the Statement of Operations as "Special Dividends" and the impact of these dividends is presented in the Financial Highlights. Interest income and distributions from the Fidelity Central Funds are accrued as earned. Interest income includes coupon interest and amortization of premium and accretion of discount on debt securities. Investment income is recorded net of foreign taxes withheld where recovery of such taxes is uncertain.
Expenses. Most expenses of the trust can be directly attributed to a fund. Expenses which cannot be directly attributed are apportioned among each Fund in the trust. Expense estimates are accrued in the period to which they relate and adjustments are made when actual amounts are known.
Income Tax Information and Distributions to Shareholders. The Fund intends to qualify as a regulated investment company by distributing substantially all of its taxable income and realized gains under Subchapter M of the Internal Revenue Code and filing its U.S. federal tax return. As a result, no provision for income taxes is required. The Fund is subject to the provisions of FASB Interpretation No. 48, Accounting for Uncertainties in Income Taxes (FIN 48). FIN 48 sets forth a minimum threshold for financial statement recognition of the benefit of a tax position taken or expected to be taken in a tax return. There are no unrecognized tax benefits in the accompanying financial statements in connection with the tax positions expected to be taken in the initial filing of the Fund's federal tax return.
Distributions are recorded on the ex-dividend date. Income dividends and capital gain distributions are declared separately for each class. Income and capital gain distributions are determined in accordance with income tax regulations, which may differ from generally accepted accounting principles.
Capital accounts within the financial statements are adjusted for permanent book-tax differences. These adjustments have no impact on net assets or the results of operations. Temporary book-tax differences will reverse in a subsequent period.
Book-tax differences are primarily due to foreign currency transactions, passive foreign investment companies (PFIC), and losses deferred due to wash sales.
The tax-basis components of distributable earnings and the federal tax cost as of period end were as follows:
Unrealized appreciation | $ 2,513,625 | |
Unrealized depreciation | (1,440,176) | |
Net unrealized appreciation (depreciation) | 1,073,449 | |
Undistributed ordinary income | 118,790 | |
Undistributed long-term capital gain | 2,308 | |
| | |
Cost for federal income tax purposes | $ 23,423,388 | |
The tax character of distributions paid was as follows:
| December 31, 2007 |
Ordinary Income | $ 387,896 |
Trading (Redemption) Fees. Shares held less than 60 days are subject to a redemption fee equal to 1% of the proceeds of the redeemed shares. All redemption fees, including any estimated redemption fees paid by FMR, are retained by the Fund and accounted for as an addition to paid in capital.
New Accounting Pronouncement. In September 2006, Statement of Financial Accounting Standards No. 157, Fair Value Measurements (SFAS 157), was issued and is effective for fiscal years beginning after November 15, 2007. SFAS 157 defines fair value, establishes a framework for measuring fair value and expands disclosures about fair value measurements. Management is currently evaluating the impact the adoption of SFAS 157 will have on the Fund's financial statement disclosures.
Annual Report
4. Operating Policies.
Repurchase Agreements. FMR has received an Exemptive Order from the Securities and Exchange Commission (the SEC) which permits the Fund and other affiliated entities of FMR to transfer uninvested cash balances into joint trading accounts which are then invested in repurchase agreements. The Fund may also invest directly with institutions in repurchase agreements. Repurchase agreements are collateralized by government or non-government securities. Upon settlement date, collateral is held in segregated accounts with custodian banks and may be obtained in the event of a default of the counterparty. The Fund monitors, on a daily basis, the value of the collateral to ensure it is at least equal to the principal amount of the repurchase agreement (including accrued interest). In the event of a default by the counterparty, realization of the collateral proceeds could be delayed, during which time the value of the collateral may decline.
5. Purchases and Sales of Investments.
Purchases and sales of securities, other than short-term securities, aggregated $25,336,277 and $3,701,957, respectively.
6. Fees and Other Transactions with Affiliates.
Management Fee. FMR and its affiliates provide the Fund with investment management related services for which the Fund pays a monthly management fee. The management fee is the sum of an individual fund fee rate that is based on an annual rate of .30% of the Fund's average net assets and a group fee rate that averaged .26% during the period. The group fee rate is based upon the average net assets of all the mutual funds advised by FMR. The group fee rate decreases as assets under management increase and increases as assets under management decrease. For the period, the total annualized management fee rate was .56% of the Fund's average net assets.
Transfer Agent Fees. Fidelity Investments Institutional Operations Company, Inc. (FIIOC), an affiliate of FMR, is the Fund's transfer, dividend disbursing, and shareholder servicing agent. FIIOC receives an asset-based fee with respect to each class. Each class with the exception of Investor Class pays a transfer agent fee, excluding out of pocket expenses, equal to an annual rate of .07% of average net assets. Investor Class pays a monthly asset-based transfer agent fee of .18% of average net assets. The total transfer agent fees paid by each class to FIIOC, including out of pocket expenses, were as follows:
Initial Class | $ 5,771 |
Investor Class | 10,395 |
| $ 16,166 |
Effective February 1, 2008, the Board of Trustees approved a decrease to Investor Class' asset-based fee from .18% to .15% of average net assets.
Accounting Fees. Fidelity Service Company, Inc. (FSC), an affiliate of FMR, maintains the Fund's accounting records. The fee is based on the level of average net assets for the month.
Brokerage Commissions. The Fund placed a portion of its portfolio transactions with brokerage firms which are affiliates of the investment adviser. The commissions paid to these affiliated firms were $1,250 for the period.
7. Expense Reductions.
FMR voluntarily agreed to reimburse each class to the extent annual operating expenses exceeded certain levels of average net assets as noted in the table below. Some expenses, for example interest expense, are excluded from this reimbursement.
The following classes were in reimbursement during the period:
| Expense
Limitations | Reimbursement
from adviser |
| | |
Initial Class | 1.00% | $ 4,954 |
Investor Class | 1.15% | 2,595 |
| | $ 7,549 |
Effective February 1, 2008, the expense limitation changed to 1.08% for Investor Class.
In addition, through arrangements with the Fund's transfer agent, credits realized as a result of uninvested cash balances were used to reduce the Fund's expenses. During the period, these credits reduced the transfer agent expense as noted in the table below.
| Transfer Agent
expense reductions |
| |
Initial Class | $ 56 |
Investor Class | 46 |
| $ 102 |
Annual Report
Notes to Financial Statements - continued
8. Other.
The Fund's organizational documents provide former and current trustees and officers with a limited indemnification against liabilities arising in connection with the performance of their duties to the Fund. In the normal course of business, the Fund may also enter into contracts that provide general indemnifications. The Fund's maximum exposure under these arrangements is unknown as this would be dependent on future claims that may be made against the Fund. The risk of material loss from such claims is considered remote.
At the end of the period, FMR or its affiliates were the owners of record of 100% of the total outstanding shares of the Fund.
9. Distributions to Shareholders.
Distributions to shareholders of each class were as follows:
Year ended December 31, | 2007A |
From net investment income | |
Initial Class | $ 88,019 |
Investor Class | 62,717 |
Total | $ 150,736 |
From net realized gain | |
Initial Class | $ 132,632 |
Investor Class | 104,528 |
Total | $ 237,160 |
A For the period April 24, 2007 (commencement of operations) to December 31, 2007.
10. Share Transactions.
Transactions for each class of shares were as follows:
| Shares | Dollars |
Year ended December 31, | 2007A | 2007A |
Initial Class | | |
Shares sold | 1,343,772 | $ 14,140,777 |
Reinvestment of distributions | 19,701 | 220,651 |
Shares redeemed | (129,843) | (1,378,897) |
Net increase (decrease) | 1,233,630 | $ 12,982,531 |
Investor Class | | |
Shares sold | 1,131,664 | $ 11,981,220 |
Reinvestment of distributions | 14,932 | 167,245 |
Shares redeemed | (176,566) | (1,815,857) |
Net increase (decrease) | 970,030 | $ 10,332,608 |
A For the period April 24, 2007 (commencement of operations) to December 31, 2007.
Annual Report
Report of Independent Registered Public Accounting Firm
To the Trustees of Variable Insurance Products Fund IV and the Shareholders of VIP Materials Portfolio:
In our opinion, the accompanying statement of assets and liabilities, including the schedule of investments, and the related statements of operations and of changes in net assets and the financial highlights present fairly, in all material respects, the financial position of VIP Materials Portfolio (a fund of Variable Insurance Products Fund IV) at December 31, 2007, and the results of its operations for the year then ended, and the changes in its net assets and the financial highlights for the year then ended and for the period April 24, 2007 (commencement of operations) through December 31, 2007, in conformity with accounting principles generally accepted in the United States of America. These financial statements and financial highlights (hereafter referred to as "financial statements") are the responsibility of the VIP Materials Portfolio's management. Our responsibility is to express an opinion on these financial statements based on our audit. We conducted our audit of these financial statements in accordance with the standards of the Public Company Accounting Oversight Board (United States). Those standards require that we plan and perform the audit to obtain reasonable assurance about whether the financial statements are free of material misstatement. An audit includes examining, on a test basis, evidence supporting the amounts and disclosures in the financial statements, assessing the accounting principles used and significant estimates made by management, and evaluating the overall financial statement presentation. We believe that our audit, which included confirmation of securities at December 31, 2007 by correspondence with the custodian and brokers, provides a reasonable basis for our opinion.
/s/ PricewaterhouseCoopers LLP
PricewaterhouseCoopers LLP
Boston, Massachusetts
February 21, 2008
Annual Report
Trustees and Officers
The Trustees, Members of the Advisory Board, and executive officers of the trust and fund, as applicable, are listed below. The Board of Trustees governs the fund and is responsible for protecting the interests of shareholders. The Trustees are experienced executives who meet periodically throughout the year to oversee the fund's activities, review contractual arrangements with companies that provide services to the fund, and review the fund's performance. Except for James C. Curvey, each of the Trustees oversees 373 funds advised by FMR or an affiliate. Mr. Curvey oversees 368 funds advised by FMR or an affiliate.
The Trustees hold office without limit in time except that (a) any Trustee may resign; (b) any Trustee may be removed by written instrument, signed by at least two-thirds of the number of Trustees prior to such removal; (c) any Trustee who requests to be retired or who has become incapacitated by illness or injury may be retired by written instrument signed by a majority of the other Trustees; and (d) any Trustee may be removed at any special meeting of shareholders by a two-thirds vote of the outstanding voting securities of the trust. Each Trustee who is not an interested person (as defined in the 1940 Act) (Independent Trustee), shall retire not later than the last day of the calendar year in which his or her 72nd birthday occurs. The Independent Trustees may waive this mandatory retirement age policy with respect to individual Trustees. The executive officers and Advisory Board Members hold office without limit in time, except that any officer and Advisory Board Member may resign or may be removed by a vote of a majority of the Trustees at any regular meeting or any special meeting of the Trustees. Except as indicated, each individual has held the office shown or other offices in the same company for the past five years.
The fund's Statement of Additional Information (SAI) includes more information about the Trustees. To request a free copy, call Fidelity at 1-877-208-0098.
Interested Trustees*:
Correspondence intended for each Trustee who is an interested person may be sent to Fidelity Investments, 82 Devonshire Street, Boston, Massachusetts 02109.
Name, Age; Principal Occupation |
Edward C. Johnson 3d (77) |
| Year of Election or Appointment: 1983 Mr. Johnson is Chairman of the Board of Trustees. Mr. Johnson serves as President (2006-present), Chief Executive Officer, Chairman, and a Director of FMR LLC; Chairman and a Director of FMR; Chairman and a Director of Fidelity Research & Analysis Company (FRAC); Chairman and a Director of Fidelity Investments Money Management, Inc.; and Chairman (2001-present) and a Director of FMR Co., Inc. In addition, Mr. Johnson serves as Chairman and Director of Fidelity International Limited (FIL). Mr. Edward C. Johnson 3d and Mr. Arthur E. Johnson are not related. |
James C. Curvey (72) |
| Year of Election or Appointment: 2007 Mr. Curvey also serves as Trustee (2007-present) or Member of the Advisory Board (2007-present) of other investment companies advised by FMR. Mr. Curvey is a Director of FMR and FMR Co., Inc. (2007-present). Mr. Curvey is also Vice Chairman (2006-present) and Director of FMR LLC. Mr. Curvey joined Fidelity in 1982 and served in numerous senior management positions, including President and Chief Operating Officer of FMR LLC (1997-2000) and President of Fidelity Strategic Investments (2000-2002). In addition, he serves as a member of the Board of Directors of Geerlings & Wade, Inc. (wine distribution). |
* Trustees have been determined to be "Interested Trustees" by virtue of, among other things, their affiliation with the trust or various entities under common control with FMR. FMR Corp. merged with and into FMR LLC on October 1, 2007. Any references to FMR LLC for prior periods are deemed to be references to the prior entity.
Independent Trustees:
Correspondence intended for each Independent Trustee (that is, the Trustees other than the Interested Trustees) may be sent to Fidelity Investments, P.O. Box 55235, Boston, Massachusetts 02205-5235.
Name, Age; Principal Occupation |
Dennis J. Dirks (59) |
| Year of Election or Appointment: 2005 Prior to his retirement in May 2003, Mr. Dirks was Chief Operating Officer and a member of the Board of The Depository Trust & Clearing Corporation (DTCC) (1999-2003). He also served as President, Chief Operating Officer, and Board member of The Depository Trust Company (DTC) (1999-2003) and President and Board member of the National Securities Clearing Corporation (NSCC) (1999-2003). In addition, Mr. Dirks served as Chief Executive Officer and Board member of the Government Securities Clearing Corporation (2001-2003) and Chief Executive Officer and Board member of the Mortgage-Backed Securities Clearing Corporation (2001-2003). Mr. Dirks also serves as a Trustee and a member of the Finance Committee of Manhattan College (2005-present) and a Trustee and a member of the Finance Committee of AHRC of Nassau County (2006-present). |
Albert R. Gamper, Jr. (65) |
| Year of Election or Appointment: 2006 Prior to his retirement in December 2004, Mr. Gamper served as Chairman of the Board of CIT Group Inc. (commercial finance). During his tenure with CIT Group Inc. Mr. Gamper served in numerous senior management positions, including Chairman (1987-1989; 1999-2001; 2002-2004), Chief Executive Officer (1987-2004), and President (1989-2002). He currently serves as a member of the Board of Directors of Public Service Enterprise Group (utilities, 2001-present), Chairman of the Board of Governors, Rutgers University (2004-present), and Chairman of the Board of Saint Barnabas Health Care System. |
George H. Heilmeier (71) |
| Year of Election or Appointment: 2004 Dr. Heilmeier is Chairman Emeritus of Telcordia Technologies (communication software and systems), where prior to his retirement, he served as company Chairman and Chief Executive Officer. He currently serves on the Boards of Directors of The Mitre Corporation (systems engineering and information technology support for the government), and HRL Laboratories (private research and development, 2004-present). He is Chairman of the General Motors Science & Technology Advisory Board and a Life Fellow of the Institute of Electrical and Electronics Engineers (IEEE). Dr. Heilmeier is a member of the Defense Science Board and the National Security Agency Advisory Board. He is also a member of the National Academy of Engineering, the American Academy of Arts and Sciences, and the Board of Overseers of the School of Engineering and Applied Science of the University of Pennsylvania. Previously, Dr. Heilmeier served as a Director of TRW Inc. (automotive, space, defense, and information technology, 1992-2002), Compaq (1994-2002), Automatic Data Processing, Inc. (ADP) (technology-based business outsourcing, 1995-2002), INET Technologies Inc. (telecommunications network surveillance, 2001-2004), and Teletech Holdings (customer management services). He is the recipient of the 2005 Kyoto Prize in Advanced Technology for his invention of the liquid crystal display, and a member of the Consumer Electronics Hall of Fame. |
James H. Keyes (67) |
| Year of Election or Appointment: 2007 Prior to his retirement in 2003, Mr. Keyes was Chairman, President, and Chief Executive Officer of Johnson Controls, Inc. (automotive supplier, 1993-2003). He currently serves as a member of the boards of LSI Logic Corporation (semiconductor technologies), Navistar International Corporation (manufacture and sale of trucks, buses, and diesel engines, 2002-present), and Pitney Bowes, Inc. (integrated mail, messaging, and document management solutions). |
Marie L. Knowles (61) |
| Year of Election or Appointment: 2001 Prior to Ms. Knowles' retirement in June 2000, she served as Executive Vice President and Chief Financial Officer of Atlantic Richfield Company (ARCO) (diversified energy, 1996-2000). From 1993 to 1996, she was a Senior Vice President of ARCO and President of ARCO Transportation Company. She served as a Director of ARCO from 1996 to 1998. She currently serves as a Director of Phelps Dodge Corporation (copper mining and manufacturing) and McKesson Corporation (healthcare service, 2002-present). Ms. Knowles is a Trustee of the Brookings Institution and the Catalina Island Conservancy and also serves as a member of the Advisory Board for the School of Engineering of the University of Southern California. |
Ned C. Lautenbach (63) |
| Year of Election or Appointment: 2000 Mr. Lautenbach is Chairman of the Independent Trustees (2006-present). Mr. Lautenbach has been a partner of Clayton, Dubilier & Rice, Inc. (private equity investment firm) since September 1998. Previously, Mr. Lautenbach was with the International Business Machines Corporation (IBM) from 1968 until his retirement in 1998. Mr. Lautenbach serves as a Director of Sony Corporation (2006-present) and Eaton Corporation (diversified industrial) as well as the Philharmonic Center for the Arts in Naples, Florida. He also is a member of the Board of Trustees of Fairfield University (2005-present), as well as a member of the Council on Foreign Relations. |
Cornelia M. Small (63) |
| Year of Election or Appointment: 2005 Ms. Small is a member (2000-present) and Chairperson (2002-present) of the Investment Committee, and a member (2002-present) of the Board of Trustees of Smith College. Previously, she served as Chief Investment Officer (1999-2000), Director of Global Equity Investments (1996-1999), and a member of the Board of Directors of Scudder, Stevens & Clark (1990-1997) and Scudder Kemper Investments (1997-1999). In addition, Ms. Small served as Co-Chair (2000-2003) of the Annual Fund for the Fletcher School of Law and Diplomacy. |
William S. Stavropoulos (68) |
| Year of Election or Appointment: 2001 Mr. Stavropoulos is Chairman Emeritus of the Board of Directors of The Dow Chemical Company. Since joining The Dow Chemical Company in 1967, Mr. Stavropoulos served in numerous senior management positions, including President (1993-2000; 2002-2003), CEO (1995-2000; 2002-2004), and Chairman of the Executive Committee (2000-2004). Currently, he is a Director of NCR Corporation (data warehousing and technology solutions), Chemical Financial Corporation, Maersk Inc. (industrial conglomerate, 2002-present), Tyco International, Inc. (multinational manufacturing and services, 2007-present), and a member of the Advisory Board for Metalmark Capital (private equity investment firm, 2005-present). He is a special advisor to Clayton, Dubilier & Rice, Inc., a private equity investment firm. He also serves as a member of the Board of Trustees of the American Enterprise Institute for Public Policy Research. In addition, Mr. Stavropoulos is a member of The Business Council, J.P. Morgan International Council and the University of Notre Dame Advisory Council for the College of Science. |
Kenneth L. Wolfe (68) |
| Year of Election or Appointment: 2005 Mr. Wolfe is Chairman and a Director of Hershey Foods Corporation (2007-present), where prior to his retirement in 2001, he was Chairman and Chief Executive Officer. Mr. Wolfe currently serves as a member of the board of Revlon Inc. (2004-present). Previously, Mr. Wolfe served as a member of the boards of Adelphia Communications Corporation (2003-2006) and Bausch & Lomb, Inc. (1993-2007). |
Advisory Board Members and Executive Officers**:
Correspondence intended for Mr. Mauriello, Mr. Thomas, Mr. Wiley, Mr. Lacy, and Mr. Arthur Johnson may be sent to Fidelity Investments, P.O. Box 55235, Boston, Massachusetts 02205-5235. Correspondence intended for each executive officer and Mr. Lynch may be sent to Fidelity Investments, 82 Devonshire Street, Boston, Massachusetts 02109.
Name, Age; Principal Occupation |
Arthur E. Johnson (60) |
| Year of Election or Appointment: 2008 Member of the Advisory Board of Variable Insurance Products Fund IV. Mr. Johnson serves as Senior Vice President of Corporate Strategic Development of Lockheed Martin Corporation (defense contractor). In addition, Mr. Johnson serves as a member of the Board of Directors of AGL Resources, Inc. (holding company, 2002-present), and IKON Office Solutions, Inc. (document management systems and services). Mr. Arthur E. Johnson and Mr. Edward C. Johnson 3d are not related. |
Alan J. Lacy (54) |
| Year of Election or Appointment: 2008 Member of the Advisory Board of Variable Insurance Products Fund IV. Mr. Lacy serves as Senior Adviser (2007-present) of Oak Hill Capital Partners, L.P. (a private equity firm). Mr. Lacy also served as Vice Chairman and Chief Executive Officer of Sears Holdings Corporation and Sears, Roebuck and Co. (retail, 2005-2006; 2000-2005). In addition, Mr. Lacy serves as a member of the Board of Directors of The Western Union Company (global money transfer, 2006-present) and Bristol-Myers Squibb (global pharmaceuticals, 2007-present). Mr. Lacy is a Trustee of the National Parks Conservation Association and The Field Museum of Natural History. |
Peter S. Lynch (63) |
| Year of Election or Appointment: 2003 Member of the Advisory Board of Variable Insurance Products Fund IV. Mr. Lynch is Vice Chairman and a Director of FMR, and Vice Chairman (2001-present) and a Director of FMR Co., Inc. Previously, Mr. Lynch served as a Trustee of the Fidelity funds (1990-2003). In addition, he serves as a Trustee of Boston College and as the Chairman of the Inner-City Scholarship Fund. |
Joseph Mauriello (63) |
| Year of Election or Appointment: 2007 Member of the Advisory Board of Variable Insurance Products Fund IV. Prior to his retirement in January 2006, Mr. Mauriello served in numerous senior management positions including Deputy Chairman and Chief Operating Officer (2004-2005), and Vice Chairman of Financial Services (2002-2004) of KPMG LLP US (professional services firm, 1965-2005). Mr. Mauriello currently serves as a member of the Board of Directors of XL Capital Ltd. (global insurance and re-insurance company, 2006-present) and of Arcadia Resources Inc. (health care services and products, 2007-present). He also served as a Director of the Hamilton Funds of the Bank of New York (2006-2007). |
David M. Thomas (58) |
| Year of Election or Appointment: 2007 Member of the Advisory Board of Variable Insurance Products Fund IV. Previously, Mr. Thomas served as Executive Chairman (2005-2006) and Chairman and Chief Executive Officer (2000-2005) of IMS Health, Inc. (pharmaceutical and healthcare information solutions). In addition, Mr. Thomas serves as a member of the Board of Directors of Fortune Brands, Inc. (consumer products holding company), and Interpublic Group of Companies, Inc. (marketing communication, 2004-present). |
Michael E. Wiley (57) |
| Year of Election or Appointment: 2007 Member of the Advisory Board of Variable Insurance Products Fund IV. Mr. Wiley also serves as a member of the Board of Trustees of the University of Tulsa (2000-2006; 2007-present). He serves as a Director of Tesoro Corporation (independent oil refiner and marketer, 2005-present), and a Director of Bill Barrett Corporation (exploration and production company, 2005-present). In addition, he also serves as a Director of Post Oak Bank (privately-held bank, 2004-present). Previously, Mr. Wiley served as a Sr. Energy Advisor of Katzenbach Partners, LLC (consulting firm, 2006-2007), as an Advisory Director of Riverstone Holdings (private investment firm), Chairman, President, and CEO of Baker Hughes, Inc. (oilfield services company, 2000-2004), and as Director of Spinnaker Exploration Company (exploration and production company, 2001-2005). |
Kimberley H. Monasterio (44) |
| Year of Election or Appointment: 2007 President and Treasurer of VIP Materials. Ms. Monasterio also serves as President and Treasurer of other Fidelity funds (2007-present) and is an employee of FMR (2004-present). Previously, Ms. Monasterio served as Deputy Treasurer of the Fidelity funds (2004-2006). Before joining Fidelity Investments, Ms. Monasterio served as Treasurer (2000-2004) and Chief Financial Officer (2002-2004) of the Franklin Templeton Funds and Senior Vice President of Franklin Templeton Services, LLC (2000-2004). |
Brian B. Hogan (43) |
| Year of Election or Appointment: 2007 Vice President of VIP Materials. Mr. Hogan also serves as Vice President of Sector Funds (2007-present). Mr. Hogan is Senior Vice President of Equity Research (2006-present). Mr. Hogan also serves as Vice President of FMR and FMR Co., Inc. Previously, Mr. Hogan served as a portfolio manager. |
Eric D. Roiter (59) |
| Year of Election or Appointment: 2007 Secretary of VIP Materials. He also serves as Secretary of other Fidelity funds; Vice President, General Counsel, and Secretary of FMR Co., Inc. (2001-present) and FMR; Assistant Secretary of Fidelity Management & Research (U.K.) Inc. (2001-present), Fidelity Research & Analysis Company (2001-present), and Fidelity Investments Money Management, Inc. (2001-present). Mr. Roiter is an Adjunct Member, Faculty of Law, at Boston College Law School (2003-present). Previously, Mr. Roiter served as Vice President and Secretary of Fidelity Distributors Corporation (FDC) (1998-2005). |
John B. McGinty, Jr. (45) |
| Year of Election or Appointment: 2008 Assistant Secretary of VIP Materials. Mr. McGinty also serves as Assistant Secretary of other Fidelity funds (2008-present) and is an employee of FMR LLC (2004-present). Mr. McGinty also serves as Senior Vice President, Secretary, and Chief Legal Officer of FDC (2007-present). Before joining Fidelity Investments, Mr. McGinty practiced law at Ropes & Gray, LLP. |
R. Stephen Ganis (41) |
| Year of Election or Appointment: 2007 Anti-Money Laundering (AML) officer of VIP Materials. Mr. Ganis also serves as AML officer of other Fidelity funds (2006-present) and FMR LLC (2003-present). Before joining Fidelity Investments, Mr. Ganis practiced law at Goodwin Procter, LLP (2000-2002). |
Joseph B. Hollis (59) |
| Year of Election or Appointment: 2007 Chief Financial Officer of VIP Materials. Mr. Hollis also serves as Chief Financial Officer of other Fidelity funds. Mr. Hollis is President of Fidelity Pricing and Cash Management Services (FPCMS) (2005-present). Mr. Hollis also serves as President and Director of Fidelity Service Company, Inc. (2006-present). Previously, Mr. Hollis served as Senior Vice President of Cash Management Services (1999-2002) and Investment Management Operations (2002-2005). |
Kenneth A. Rathgeber (60) |
| Year of Election or Appointment: 2007 Chief Compliance Officer of VIP Materials. Mr. Rathgeber also serves as Chief Compliance Officer of other Fidelity funds (2004-present) and Executive Vice President of Risk Oversight for Fidelity Investments (2002-present). He is Chief Compliance Officer of FMR (2005-present), FMR Co., Inc. (2005-present), Fidelity Management & Research (U.K.) Inc. (2005-present), Fidelity Research & Analysis Company (2005-present), Fidelity Investments Money Management, Inc. (2005-present), and Strategic Advisers, Inc. (2005-present). Previously, Mr. Rathgeber served as Executive Vice President and Chief Operating Officer for Fidelity Investments Institutional Services Company, Inc. (1998-2002). |
Bryan A. Mehrmann (46) |
| Year of Election or Appointment: 2007 Deputy Treasurer of VIP Materials. Mr. Mehrmann also serves as Deputy Treasurer of other Fidelity funds (2005-present) and is an employee of FMR. Previously, Mr. Mehrmann served as Vice President of Fidelity Investments Institutional Services Group (FIIS)/Fidelity Investments Institutional Operations Corporation, Inc. (FIIOC) Client Services (1998-2004). |
Kenneth B. Robins (38) |
| Year of Election or Appointment: 2007 Deputy Treasurer of VIP Materials. Mr. Robins also serves as Deputy Treasurer of other Fidelity funds (2005-present) and is an employee of FMR (2004-present). Before joining Fidelity Investments, Mr. Robins worked at KPMG LLP, where he was a partner in KPMG's department of professional practice (2002-2004) and a Senior Manager (1999-2000). In addition, Mr. Robins served as Assistant Chief Accountant, United States Securities and Exchange Commission (2000-2002). |
Robert G. Byrnes (41) |
| Year of Election or Appointment: 2007 Assistant Treasurer of VIP Materials. Mr. Byrnes also serves as Assistant Treasurer of other Fidelity funds (2005-present) and is an employee of FMR (2005-present). Previously, Mr. Byrnes served as Vice President of FPCMS (2003-2005). Before joining Fidelity Investments, Mr. Byrnes worked at Deutsche Asset Management where he served as Vice President of the Investment Operations Group (2000-2003). |
Peter L. Lydecker (53) |
| Year of Election or Appointment: 2007 Assistant Treasurer of VIP Materials. Mr. Lydecker also serves as Assistant Treasurer of other Fidelity funds (2004) and is an employee of FMR. |
Paul M. Murphy (60) |
| Year of Election or Appointment: 2007 Assistant Treasurer of VIP Materials. Mr. Murphy also serves as Assistant Treasurer of other Fidelity funds (2007-present) and is an employee of FMR (2007-present). Previously, Mr. Murphy served as Chief Financial Officer of the Fidelity Funds (2005-2006), Vice President and Associate General Counsel of FMR (2007), and Senior Vice President of Fidelity Pricing and Cash Management Services Group (FPCMS) (1994-2007). |
Gary W. Ryan (49) |
| Year of Election or Appointment: 2007 Assistant Treasurer of VIP Materials. Mr. Ryan also serves as Assistant Treasurer of other Fidelity funds (2005-present) and is an employee of FMR (2005-present). Previously, Mr. Ryan served as Vice President of Fund Reporting in FPCMS (1999-2005). |
** FMR Corp. merged with and into FMR LLC on October 1, 2007. Any references to FMR LLC for prior periods are deemed to be references to the prior entity.
Annual Report
Distributions
The Board of Trustees of VIP Materials Portfolio voted to pay to shareholders of record at the opening of business on record date, the following distributions per share derived from capital gains realized from sales of portfolio securities:
| Pay Date | Record Date | Capital Gains |
Initial Class | 02/08/08 | 02/08/08 | $.06 |
Investor Class | 02/08/08 | 02/08/08 | $.06 |
The fund hereby designates as a capital gain dividend with respect to the taxable year ended December 31, 2007, $2,308, or, if subsequently determined to be different, the net capital gain of such year.
Initial Class designates 55% and Investor Class designates 58% of the dividends distributed in December 2007 during the fiscal year as qualifying for the dividends-received deduction for corporate shareholders.
The fund will notify shareholders in January 2008 of amounts for use in preparing 2007 income tax returns.
Annual Report
Investment Adviser
Fidelity Management & Research Company
Boston, MA
Investment Sub-Advisers
FMR Co., Inc.
Fidelity Management & Research (U.K.) Inc.
Fidelity Research & Analysis Company
Fidelity Investments Japan Limited
Fidelity International Investment Advisors
Fidelity International Investment Advisors (U.K.) Limited
General Distributor
Fidelity Distributors Corporation
Boston, MA
Transfer and Service Agents
Fidelity Investments Institutional Operations Company, Inc.
Boston, MA
Fidelity Service Company, Inc.
Boston, MA
Custodian
State Street Bank and Trust Company
Quincy, MA
VMATP-ANN-0208
1.850999.100
Fidelity® Variable Insurance Products:
Real Estate Portfolio
Annual Report
December 31, 2007
(2_fidelity_logos) (Registered_Trademark)
Contents
Performance | <Click Here> | How the fund has done over time. |
Management's Discussion | <Click Here> | The manager's review of fund performance, strategy and outlook. |
Shareholder Expense Example | <Click Here> | An example of shareholder expenses. |
Investment Changes | <Click Here> | A summary of major shifts in the fund's investments over the past six months. |
Investments | <Click Here> | A complete list of the fund's investments with their
market values. |
Financial Statements | <Click Here> | Statements of assets and liabilities, operations, and
changes in net assets, as well as financial highlights. |
Notes | <Click Here> | Notes to the financial statements. |
Report of Independent Registered Public Accounting Firm | <Click Here> | |
Trustees and Officers | <Click Here> | |
Distributions | <Click Here> | |
Board Approval of Investment Advisory Contracts and Management Fees | <Click Here> | |
| | |
To view a fund's proxy voting guidelines and proxy voting record for the 12-month period ended June 30, visit http://www.fidelity.com (search for "proxy voting results") or visit the Securities and Exchange Commission's (SEC) web site at http://www.sec.gov. You may also call 1-877-208-0098 to request a free copy of the proxy voting guidelines.
Fidelity Variable Insurance Products are separate account options which are purchased through a variable insurance contract.
Standard & Poor's, S&P and S&P 500 are registered service marks of The McGraw-Hill Companies, Inc. and have been licensed for use by Fidelity Distributors Corporation.
Other third party marks appearing herein are the property of their respective owners.
All other marks appearing herein are registered or unregistered trademarks or service marks of FMR LLC or an affiliated company.
This report and the financial statements contained herein are submitted for the general information of the shareholders of the fund. This report is not authorized for distribution to prospective investors in the fund unless preceded or accompanied by an effective prospectus.
A fund files its complete schedule of portfolio holdings with the SEC for the first and third quarters of each fiscal year on Form N-Q. Forms N-Q are available on the SEC's web site at http://www.sec.gov. A fund's Forms N-Q may be reviewed and copied at the SEC's Public Reference Room in Washington, DC. Information regarding the operation of the SEC's Public Reference Room may be obtained by calling 1-800-SEC-0330. For a complete list of a fund's portfolio holdings, view the most recent holdings listing, semiannual report, or annual report on Fidelity's web site at http://www.fidelity.com or http://www.advisor.fidelity.com, as applicable.
NOT FDIC INSURED · MAY LOSE VALUE · NO BANK GUARANTEE
Neither the fund nor Fidelity Distributors Corporation is a bank.
Annual Report
Performance: The Bottom Line
Average annual total return reflects the change in the value of an investment, assuming reinvestment of the class' dividend income and capital gains (the profits earned upon the sale of securities that have grown in value, if any) and assuming a constant rate of performance each year. During periods of reimbursement by Fidelity, a fund's total return will be greater than it would be had the reimbursement not occurred. Performance numbers are net of all underlying fund operating expenses, but do not include any insurance charges imposed by your insurance company's separate account. If performance information included the effect of these additional charges, the total returns would have been lower. How a fund did yesterday is no guarantee of how it will do tomorrow.
Average Annual Total Returns
Periods ended December 31, 2007 | | Past 1
year | Life of fund A |
VIP Real Estate - Initial Class | | -17.72% | 18.27% |
VIP Real Estate - Service Class B | | -17.80% | 18.15% |
VIP Real Estate - Service Class 2 C | | -17.91% | 17.98% |
VIP Real Estate - Investor Class D | | -17.83% | 18.19% |
A From November 6, 2002.
B Performance for Service Class shares reflects an asset-based service fee (12b-1 fee).
C Performance for Service Class 2 shares reflects an asset-based service fee (12b-1 fee).
D The initial offering of Investor Class shares took place on July 21, 2005. Returns prior to July 21, 2005 are those of Initial Class. If Investor Class's transfer agent fee had been reflected, returns prior to July 21, 2005 would have been lower.
$10,000 Over Life of Fund
Let's say hypothetically that $10,000 was invested in VIP Real Estate Portfolio - Initial Class on November 6, 2002, when the fund started. The chart shows how the value of your investment would have changed, and also shows how the Standard & Poor's 500SM Index performed over the same period.

Annual Report
Management's Discussion of Fund Performance
Comments from Samuel Wald, Portfolio Manager of VIP Real Estate Portfolio
U.S. equity markets, as measured by the bellwether Dow Jones Industrial AverageSM and the Standard & Poor's 500SM Index, registered their fifth consecutive year of positive returns in 2007, as the Dow rose 8.88% and the S&P 500® index advanced 5.49%. The tech-heavy NASDAQ Composite® Index did even better, increasing 10.55%. However, credit- and recession-related concerns carved deeply into stock prices late in 2007, pushing some major market measures into negative territory for the year overall, particularly smaller-cap and value-oriented benchmarks. Based largely on a weak U.S. dollar that boosted returns for U.S. investors, the Morgan Stanley Capital InternationalSM Europe, Australasia, and Far East (MSCI® EAFE®) Index - a gauge of developed stock markets outside the United States and Canada - beat most domestic equity measures, gaining 11.33%. Several European countries had outstanding performance, including Finland and Germany, while Australia also did very well. However, fallout from the credit crunch and concerns about export growth tempered U.K. stocks, while fears that Japanese financial companies would become embroiled in the U.S. subprime mortgage crisis contributed to a loss of more than 4% for the Japanese portion of the index. The emerging-markets stock asset class soared 39.78% according to the MSCI Emerging Markets index. The U.S. investment-grade bond market climbed 6.97% as measured by the Lehman Brothers® U.S. Aggregate Index, beating the 2.53% gain for the Merrill Lynch® U.S. High Yield Master II Constrained Index. The emerging-markets bond category shook off a sluggish first half of 2007 to finish the year with a respectable gain of 6.28% as measured by the J.P. Morgan Emerging Markets Bond Index (EMBI) Global, while the Citigroup® Non-U.S. Group of 7 Index - representing the debt performance of major global economies, excluding the United States - rose 13.05%.
In a difficult environment for real estate securities, the fund performed essentially in line with the Dow Jones Wilshire Real Estate Securities IndexSM, which fell 17.66% during the past year. However, the fund significantly trailed the broad stock market, as measured by the S&P 500. (For specific portfolio performance results, please refer to the performance section of this report.) It was the first time in seven years that real estate investment trusts (REITs) failed to outpace equities. Despite significant volatility in the REIT market, the fundamental backdrop for real estate remained decent. Demand for property showed modest signs of slowing as the year went on and the economy weakened, while supply generally was not a problem. The biggest challenge facing real estate during the year was seen in the capital markets. Following the subprime mortgage crisis in the residential housing market, worries about bad loans led to tightening credit standards across the board. Financing became more difficult to find as well as more expensive. Because real estate is such a capital-intensive asset class, uncertainty about the future cost and availability of capital weighed on REIT prices as the year went on. Relative to the Dow Jones Wilshire index, poor security selection was a negative, especially in apartments. For example, being significantly underweighted in apartment owner and manager Archstone-Smith Trust hampered results. Archstone was purchased at a premium price in one of many leveraged buyouts that took place during the year. Weak stock picks among retail strip centers, including an underweighting in Federal Realty Investment Trust, also detracted. This stock was no longer in the fund at period end. Overall, the fund's single biggest relative underperformer was Corporate Office Properties Trust. This office owner was hurt by a weaker-than-expected leasing environment in its core market of Washington, D.C. Also hurting the portfolio was maintaining almost no weighting in health care REIT Ventas, which benefited in part from its defensive nature. On the positive side, my top-performing stock in relative terms was Alexandria Real Estate Equities, an owner of laboratory space. I originally bought the stock because I felt that it was significantly undervalued. As the year went on, the market came to agree with my assessment. The same was true of Geo Group, an out-of-benchmark prison operator that rose off what I believed was a very attractive price. During the year, Geo grew quickly and benefited from a strong fundamental backdrop, including not enough prison beds to keep up with demand. The fund no longer owned Geo as of December 31, 2007. Lacking exposure to Liberty Property Trust helped as well. This suburban office REIT and index component fell in response to a deteriorating leasing environment and weaker earnings. Of final note, a small cash position worked significantly in the fund's favor during this challenging market environment.
The views expressed above reflect those of the portfolio manager(s) only through the end of the period as stated on the cover of this report and do not necessarily represent the views of Fidelity or any other person in the Fidelity organization. Any such views are subject to change at any time based upon market or other conditions and Fidelity disclaims any responsibility to update such views. These views may not be relied on as investment advice and, because investment decisions for a Fidelity fund are based on numerous factors, may not be relied on as an indication of trading intent on behalf of any Fidelity fund.
Annual Report
Shareholder Expense Example
As a shareholder of the Fund, you incur two types of costs: (1) transaction costs, and (2) ongoing costs, including management fees, distribution and/or service (12b-1) fees and other Fund expenses. This Example is intended to help you understand your ongoing costs (in dollars) of investing in the Fund and to compare these costs with the ongoing costs of investing in other mutual funds.
The Example is based on an investment of $1,000 invested at the beginning of the period and held for the entire period (July 1, 2007 to December 31, 2007).
Actual Expenses
The first line of the accompanying table for each class of the Fund provides information about actual account values and actual expenses. You may use the information in this line, together with the amount you invested, to estimate the expenses that you paid over the period. Simply divide your account value by $1,000.00 (for example, an $8,600 account value divided by $1,000.00 = 8.6), then multiply the result by the number in the first line for a class of the Fund under the heading entitled "Expenses Paid During Period" to estimate the expenses you paid on your account during this period. The estimate of expenses does not include any fees or other expenses of any variable annuity or variable life insurance product. If they were, the estimate of expenses you paid during the period would be higher, and your ending account value would be lower. In addition, the Fund, as a shareholder in the underlying Fidelity Central Funds, will indirectly bear its pro rata share of the fees and expenses incurred by the underlying Fidelity Central Funds. These fees and expenses are not included in the Fund's annualized expense ratio used to calculate the expense estimate in the table below.
Hypothetical Example for Comparison Purposes
The second line of the accompanying table for each class of the Fund provides information about hypothetical account values and hypothetical expenses based on a Class' actual expense ratio and an assumed rate of return of 5% per year before expenses, which is not the Class' actual return. The hypothetical account values and expenses may not be used to estimate the actual ending account balance or expenses you paid for the period. You may use this information to compare the ongoing costs of investing in the Fund and other funds. To do so, compare this 5% hypothetical example with the 5% hypothetical examples that appear in the shareholder reports of the other funds. The estimate of expenses does not include any fees or other expenses of any variable annuity or variable life insurance product. If they were, the estimate of expenses you paid during the period would be higher, and your ending account value would be lower. In addition, the Fund, as a shareholder in the underlying Fidelity Central Funds, will indirectly bear its pro rata share of the fees and expenses incurred by the underlying Fidelity Central Funds. These fees and expenses are not included in the Fund's annualized expense ratio used to calculate the expense estimate in the table below.
Please note that the expenses shown in the table are meant to highlight your ongoing costs only and do not reflect any transaction costs. Therefore, the second line of the table is useful in comparing ongoing costs only, and will not help you determine the relative total costs of owning different funds.
| Beginning
Account Value
July 1, 2007 | Ending
Account Value
December 31, 2007 | Expenses Paid
During Period*
July 1, 2007
to December 31, 2007 |
Initial Class | | | |
Actual | $ 1,000.00 | $ 880.40 | $ 3.46 |
HypotheticalA | $ 1,000.00 | $ 1,021.53 | $ 3.72 |
Service Class | | | |
Actual | $ 1,000.00 | $ 879.70 | $ 3.93 |
HypotheticalA | $ 1,000.00 | $ 1,021.02 | $ 4.23 |
Service Class 2 | | | |
Actual | $ 1,000.00 | $ 879.20 | $ 4.64 |
HypotheticalA | $ 1,000.00 | $ 1,020.27 | $ 4.99 |
Investor Class | | | |
Actual | $ 1,000.00 | $ 879.50 | $ 4.03 |
HypotheticalA | $ 1,000.00 | $ 1,020.92 | $ 4.33 |
A 5% return per year before expenses
* Expenses are equal to each Class' annualized expense ratio (shown in the table below); multiplied by the average account value over the period, multiplied by 184/365 (to reflect the one-half year period).
| Annualized
Expense Ratio |
Initial Class | .73% |
Service Class | .83% |
Service Class 2 | .98% |
Investor Class | .85% |
Annual Report
Investment Changes
Top Ten Stocks as of December 31, 2007 |
| % of fund's
net assets | % of fund's net assets
6 months ago |
Simon Property Group, Inc. | 8.6 | 6.6 |
ProLogis Trust | 7.8 | 5.6 |
Public Storage | 6.2 | 5.0 |
General Growth Properties, Inc. | 6.1 | 5.7 |
Boston Properties, Inc. | 4.1 | 3.1 |
Vornado Realty Trust | 4.0 | 6.3 |
Home Properties, Inc. | 3.7 | 3.3 |
Highwoods Properties, Inc. (SBI) | 3.3 | 2.5 |
Alexandria Real Estate Equities, Inc. | 3.1 | 3.8 |
Kimco Realty Corp. | 3.0 | 2.0 |
| 49.9 | |
Top Five REIT Sectors as of December 31, 2007 |
| % of fund's
net assets | % of fund's net assets
6 months ago |
REITs - Office Buildings | 18.0 | 18.3 |
REITs - Malls | 15.9 | 14.0 |
REITs - Industrial Buildings | 15.5 | 14.6 |
REITs - Apartments | 14.7 | 18.4 |
REITs - Shopping Centers | 11.6 | 13.0 |
Asset Allocation (% of fund's net assets) |
As of December 31, 2007* | As of June 30, 2007** |
| Stocks 98.0% | | | Stocks 96.8% | |
| Short-Term Investments and
Net Other Assets 2.0% | | | Short-Term Investments and
Net Other Assets 3.2% | |
* Foreign investments | 3.3% | | ** Foreign investments | 3.4% | |

Annual Report
Investments December 31, 2007
Showing Percentage of Net Assets
Common Stocks - 98.0% |
| Shares | | Value |
COMMERCIAL SERVICES & SUPPLIES - 0.3% |
Diversified Commercial & Professional Services - 0.3% |
Corrections Corp. of America (a) | 11,100 | | $ 327,561 |
HEALTH CARE PROVIDERS & SERVICES - 1.4% |
Health Care Facilities - 1.4% |
Capital Senior Living Corp. (a) | 27,700 | | 275,061 |
Emeritus Corp. (a) | 32,900 | | 827,435 |
Sun Healthcare Group, Inc. (a) | 25,000 | | 429,250 |
TOTAL HEALTH CARE FACILITIES | | 1,531,746 |
HOTELS, RESTAURANTS & LEISURE - 2.6% |
Hotels, Resorts & Cruise Lines - 2.6% |
Gaylord Entertainment Co. (a) | 17,100 | | 692,037 |
Starwood Hotels & Resorts Worldwide, Inc. | 47,800 | | 2,104,634 |
TOTAL HOTELS, RESORTS & CRUISE LINES | | 2,796,671 |
HOUSEHOLD DURABLES - 0.3% |
Homebuilding - 0.3% |
Centex Corp. | 11,200 | | 282,912 |
REAL ESTATE INVESTMENT TRUSTS - 90.1% |
REITs - Apartments - 14.7% |
Apartment Investment & Management Co. Class A | 75,700 | | 2,629,061 |
AvalonBay Communities, Inc. | 22,200 | | 2,089,908 |
BRE Properties, Inc. | 2,700 | | 109,431 |
Equity Residential (SBI) | 87,700 | | 3,198,419 |
Essex Property Trust, Inc. | 10,100 | | 984,649 |
GMH Communities Trust | 67,000 | | 369,840 |
Home Properties, Inc. | 88,500 | | 3,969,225 |
Pennsylvania Real Estate Investment Trust (SBI) | 42,100 | | 1,249,528 |
UDR, Inc. | 60,100 | | 1,192,985 |
TOTAL REITS - APARTMENTS | | 15,793,046 |
REITs - Factory Outlets - 2.5% |
Tanger Factory Outlet Centers, Inc. | 71,500 | | 2,696,265 |
REITs - Health Care Facilities - 4.8% |
HCP, Inc. | 72,000 | | 2,504,160 |
Healthcare Realty Trust, Inc. | 98,700 | | 2,505,993 |
Ventas, Inc. | 2,500 | | 113,125 |
TOTAL REITS - HEALTH CARE FACILITIES | | 5,123,278 |
|
| Shares | | Value |
REITs - Hotels - 4.7% |
Host Hotels & Resorts, Inc. | 124,047 | | $ 2,113,761 |
LaSalle Hotel Properties (SBI) | 90,500 | | 2,886,950 |
TOTAL REITS - HOTELS | | 5,000,711 |
REITs - Industrial Buildings - 15.5% |
DCT Industrial Trust, Inc. | 169,800 | | 1,580,838 |
ProLogis Trust | 132,416 | | 8,392,526 |
Public Storage | 91,040 | | 6,683,246 |
TOTAL REITS - INDUSTRIAL BUILDINGS | | 16,656,610 |
REITs - Malls - 15.9% |
General Growth Properties, Inc. | 159,451 | | 6,566,192 |
Simon Property Group, Inc. | 105,640 | | 9,175,891 |
Taubman Centers, Inc. | 25,700 | | 1,264,183 |
TOTAL REITS - MALLS | | 17,006,266 |
REITs - Management/Investment - 1.8% |
Digital Realty Trust, Inc. | 12,700 | | 487,299 |
Equity Lifestyle Properties, Inc. | 18,441 | | 842,200 |
Unibail-Rodamco | 2,800 | | 612,621 |
TOTAL REITS - MANAGEMENT/INVESTMENT | | 1,942,120 |
REITs - Mortgage - 0.6% |
MFA Mortgage Investments, Inc. | 69,900 | | 646,575 |
REITs - Office Buildings - 18.0% |
Alexandria Real Estate Equities, Inc. | 32,600 | | 3,314,442 |
Boston Properties, Inc. | 47,900 | | 4,397,699 |
Corporate Office Properties Trust (SBI) | 85,800 | | 2,702,700 |
Highwoods Properties, Inc. (SBI) | 121,300 | | 3,563,794 |
Kilroy Realty Corp. | 38,100 | | 2,093,976 |
Maguire Properties, Inc. | 4,400 | | 129,668 |
SL Green Realty Corp. | 32,900 | | 3,074,834 |
TOTAL REITS - OFFICE BUILDINGS | | 19,277,113 |
REITs - Shopping Centers - 11.6% |
Developers Diversified Realty Corp. | 58,100 | | 2,224,649 |
Equity One, Inc. | 10,600 | | 244,118 |
Inland Real Estate Corp. | 174,500 | | 2,470,920 |
Kimco Realty Corp. | 89,715 | | 3,265,626 |
Vornado Realty Trust | 48,300 | | 4,247,985 |
TOTAL REITS - SHOPPING CENTERS | | 12,453,298 |
TOTAL REAL ESTATE INVESTMENT TRUSTS | | 96,595,282 |
Common Stocks - continued |
| Shares | | Value |
REAL ESTATE MANAGEMENT & DEVELOPMENT - 3.3% |
Real Estate Management & Development - 3.3% |
Brookfield Properties Corp. | 151,850 | | $ 2,923,113 |
CB Richard Ellis Group, Inc. Class A (a) | 26,600 | | 573,230 |
TOTAL REAL ESTATE MANAGEMENT & DEVELOPMENT | | 3,496,343 |
TOTAL COMMON STOCKS (Cost $95,848,404) | 105,030,515 |
Money Market Funds - 1.7% |
| | | |
Fidelity Cash Central Fund, 4.58% (b)
(Cost $1,753,043) | 1,753,043 | | 1,753,043 |
TOTAL INVESTMENT PORTFOLIO - 99.7% (Cost $97,601,447) | | 106,783,558 |
NET OTHER ASSETS - 0.3% | | 350,759 |
NET ASSETS - 100% | $ 107,134,317 |
Legend |
(a) Non-income producing |
(b) Affiliated fund that is available only to investment companies and other accounts managed by Fidelity Investments. The rate quoted is the annualized seven-day yield of the fund at period end. A complete unaudited listing of the fund's holdings as of its most recent quarter end is available upon request. |
Affiliated Central Funds |
Information regarding fiscal year to date income earned by the Fund from investments in Fidelity Central Funds is as follows: |
Fund | Income earned |
Fidelity Cash Central Fund | $ 139,509 |
See accompanying notes which are an integral part of the financial statements.
Annual Report
Financial Statements
Statement of Assets and Liabilities
| December 31, 2007 |
| | |
Assets | | |
Investment in securities, at value - See accompanying schedule: Unaffiliated issuers
(cost $95,848,404) | $ 105,030,515 | |
Fidelity Central Funds
(cost $1,753,043) | 1,753,043 | |
Total Investments (cost $97,601,447) | | $ 106,783,558 |
Cash | | 18,451 |
Foreign currency held at value
(cost $447) | | 447 |
Receivable for investments sold | | 1,162,684 |
Receivable for fund shares sold | | 3,062 |
Dividends receivable | | 930,745 |
Distributions receivable from Fidelity Central Funds | | 6,465 |
Prepaid expenses | | 437 |
Other receivables | | 200 |
Total assets | | 108,906,049 |
| | |
Liabilities | | |
Payable for investments purchased | $ 1,359,384 | |
Payable for fund shares redeemed | 292,786 | |
Accrued management fee | 51,440 | |
Distribution fees payable | 1,057 | |
Other affiliated payables | 12,792 | |
Other payables and accrued expenses | 54,273 | |
Total liabilities | | 1,771,732 |
| | |
Net Assets | | $ 107,134,317 |
Net Assets consist of: | | |
Paid in capital | | $ 98,040,190 |
Undistributed net investment income | | 241,854 |
Accumulated undistributed net realized gain (loss) on investments and foreign currency transactions | | (329,838) |
Net unrealized appreciation (depreciation) on investments | | 9,182,111 |
Net Assets | | $ 107,134,317 |
Statement of Assets and Liabilities - continued
| December 31, 2007 |
| | |
Initial Class:
Net Asset Value, offering price and redemption price per share ($68,401,302 ÷ 4,757,361 shares) | | $ 14.38 |
| | |
Service Class:
Net Asset Value, offering price and redemption price per share ($3,542,964 ÷ 247,280 shares) | | $ 14.33 |
| | |
Service Class 2:
Net Asset Value, offering price and redemption price per share ($3,558,367 ÷ 249,262 shares) | | $ 14.28 |
| | |
Investor Class:
Net Asset Value, offering price and redemption price per share ($31,631,684 ÷ 2,205,993 shares) | | $ 14.34 |
See accompanying notes which are an integral part of the financial statements.
Annual Report
Financial Statements - continued
Statement of Operations
| Year ended December 31, 2007 |
| | |
Investment Income | | |
Dividends | | $ 3,821,258 |
Interest | | 976 |
Income from Fidelity Central Funds | | 139,509 |
Total income | | 3,961,743 |
| | |
Expenses | | |
Management fee | $ 1,142,516 | |
Transfer agent fees | 196,838 | |
Distribution fees | 14,616 | |
Accounting fees and expenses | 79,479 | |
Custodian fees and expenses | 35,774 | |
Independent trustees' compensation | 735 | |
Registration fees | 27 | |
Audit | 51,126 | |
Legal | 1,932 | |
Interest | 4,455 | |
Miscellaneous | 39,105 | |
Total expenses before reductions | 1,566,603 | |
Expense reductions | (1,028) | 1,565,575 |
Net investment income (loss) | | 2,396,168 |
Realized and Unrealized Gain (Loss) Net realized gain (loss) on: | | |
Investment securities: | | |
Unaffiliated issuers | 22,095,857 | |
Foreign currency transactions | 1,631 | |
Total net realized gain (loss) | | 22,097,488 |
Change in net unrealized appreciation (depreciation) on: Investment securities | (55,566,038) | |
Assets and liabilities in foreign currencies | (16) | |
Total change in net unrealized appreciation (depreciation) | | (55,566,054) |
Net gain (loss) | | (33,468,566) |
Net increase (decrease) in net assets resulting from operations | | $ (31,072,398) |
Statement of Changes in Net Assets
| Year ended
December 31,
2007 | Year ended
December 31,
2006 |
Increase (Decrease) in Net Assets | | |
Operations | | |
Net investment income (loss) | $ 2,396,168 | $ 3,398,816 |
Net realized gain (loss) | 22,097,488 | 21,788,357 |
Change in net unrealized appreciation (depreciation) | (55,566,054) | 34,798,480 |
Net increase (decrease) in net assets resulting from operations | (31,072,398) | 59,985,653 |
Distributions to shareholders from net investment income | (2,083,139) | (3,481,178) |
Distributions to shareholders from net realized gain | (26,825,176) | (20,674,753) |
Total distributions | (28,908,315) | (24,155,931) |
Share transactions - net increase (decrease) | (97,480,470) | 70,269,294 |
Total increase (decrease) in net assets | (157,461,183) | 106,099,016 |
| | |
Net Assets | | |
Beginning of period | 264,595,500 | 158,496,484 |
End of period (including undistributed net investment income of $241,854 and $0, respectively) | $ 107,134,317 | $ 264,595,500 |
See accompanying notes which are an integral part of the financial statements.
Annual Report
Financial Highlights - Initial Class
Years ended December 31, | 2007 | 2006 | 2005 | 2004 | 2003 |
Selected Per-Share Data | | | | | |
Net asset value, beginning of period | $ 22.74 | $ 18.48 | $ 17.46 | $ 13.30 | $ 10.15 |
Income from Investment Operations | | | | | |
Net investment income (loss) C | .27 | .38 | .38 | .45 | .48 F |
Net realized and unrealized gain (loss) | (4.15) | 6.23 | 2.25 | 4.08 | 2.89 |
Total from investment operations | (3.88) | 6.61 | 2.63 | 4.53 | 3.37 |
Distributions from net investment income | (.36) | (.33) | (.41) | (.31) | (.15) |
Distributions from net realized gain | (4.12) | (2.02) | (1.20) | (.06) | (.07) |
Total distributions | (4.48) | (2.35) | (1.61) H | (.37) | (.22) |
Net asset value, end of period | $ 14.38 | $ 22.74 | $ 18.48 | $ 17.46 | $ 13.30 |
Total Return A, B | (17.72)% | 36.71% | 15.12% | 34.14% | 33.21% |
Ratios to Average Net Assets D, G | | | | | |
Expenses before reductions | .74% | .72% | .74% | .77% | 1.72% |
Expenses net of fee waivers, if any | .74% | .72% | .74% | .77% | 1.03% |
Expenses net of all reductions | .74% | .71% | .71% | .74% | 1.00% |
Net investment income (loss) | 1.21% | 1.76% | 2.13% | 3.02% | 4.44% |
Supplemental Data | | | | | |
Net assets, end of period (000 omitted) | $ 68,401 | $ 205,802 | $ 145,065 | $ 147,779 | $ 45,320 |
Portfolio turnover rate E | 102% | 70% | 75% | 66% | 46% |
A Total returns do not reflect charges attributable to your insurance company's separate account. Inclusion of these charges would reduce the total returns shown.
B Total returns would have been lower had certain expenses not been reduced during the periods shown.
C Calculated based on average shares outstanding during the period.
D Fees and expenses of the underlying Fidelity Central Funds are not included in the Fund's expense ratio. The Fund indirectly bears its proportionate share of the expenses of any underlying Fidelity Central Funds.
E Amount does not include the portfolio activity of any underlying Fidelity Central Funds.
F Investment income per share reflects a special dividend which amounted to $.11 per share.
G Expense ratios reflect operating expenses of the class. Expenses before reductions do not reflect amounts reimbursed by the investment adviser or reductions from brokerage service arrangements or other expense offset arrangements and do not represent the amount paid by the class during periods when reimbursements or reductions occur. Expenses net of fee waivers reflect expenses after reimbursement by the investment adviser but prior to reductions from brokerage service arrangements or other expense offset arrangements. Expenses net of all reductions represent the net expenses paid by the class.
H Total distribution of $1.61 per share is comprised of distributions from net investment income of $.413 and distributions from net realized gain of $1.195 per share.
Financial Highlights - Service Class
Years ended December 31, | 2007 | 2006 | 2005 | 2004 | 2003 |
Selected Per-Share Data | | | | | |
Net asset value, beginning of period | $ 22.69 | $ 18.44 | $ 17.43 | $ 13.28 | $ 10.15 |
Income from Investment Operations | | | | | |
Net investment income (loss) C | .24 | .35 | .37 | .43 | .49 F |
Net realized and unrealized gain (loss) | (4.13) | 6.22 | 2.23 | 4.08 | 2.86 |
Total from investment operations | (3.89) | 6.57 | 2.60 | 4.51 | 3.35 |
Distributions from net investment income | (.35) | (.30) | (.40) | (.30) | (.15) |
Distributions from net realized gain | (4.12) | (2.02) | (1.20) | (.06) | (.07) |
Total distributions | (4.47) | (2.32) | (1.59) H | (.36) | (.22) |
Net asset value, end of period | $ 14.33 | $ 22.69 | $ 18.44 | $ 17.43 | $ 13.28 |
Total Return A, B | (17.80)% | 36.61% | 15.00% | 34.04% | 33.01% |
Ratios to Average Net Assets D, G | | | | | |
Expenses before reductions | .83% | .82% | .84% | .86% | 1.80% |
Expenses net of fee waivers, if any | .83% | .82% | .84% | .86% | 1.24% |
Expenses net of all reductions | .83% | .81% | .81% | .84% | 1.22% |
Net investment income (loss) | 1.12% | 1.66% | 2.03% | 2.92% | 4.23% |
Supplemental Data | | | | | |
Net assets, end of period (000 omitted) | $ 3,543 | $ 4,311 | $ 3,156 | $ 2,744 | $ 2,048 |
Portfolio turnover rate E | 102% | 70% | 75% | 66% | 46% |
A Total returns do not reflect charges attributable to your insurance company's separate account. Inclusion of these charges would reduce the total returns shown.
B Total returns would have been lower had certain expenses not been reduced during the periods shown.
C Calculated based on average shares outstanding during the period.
D Fees and expenses of the underlying Fidelity Central Funds are not included in the Fund's expense ratio. The Fund indirectly bears its proportionate share of the expenses of any underlying Fidelity Central Funds.
E Amount does not include the portfolio activity of any underlying Fidelity Central Funds.
F Investment income per share reflects a special dividend which amounted to $.11 per share.
G Expense ratios reflect operating expenses of the class. Expenses before reductions do not reflect amounts reimbursed by the investment adviser or reductions from brokerage service arrangements or other expense offset arrangements and do not represent the amount paid by the class during periods when reimbursements or reductions occur. Expenses net of fee waivers reflect expenses after reimbursement by the investment adviser but prior to reductions from brokerage service arrangements or other expense offset arrangements. Expenses net of all reductions represent the net expenses paid by the class.
H Total distribution of $1.59 per share is comprised of distributions from net investment income of $.397 and distributions from net realized gain of $1.195 per share.
See accompanying notes which are an integral part of the financial statements.
Annual Report
Financial Highlights - Service Class 2
Years ended December 31, | 2007 | 2006 | 2005 | 2004 | 2003 |
Selected Per-Share Data | | | | | |
Net asset value, beginning of period | $ 22.62 | $ 18.40 | $ 17.39 | $ 13.26 | $ 10.15 |
Income from Investment Operations | | | | | |
Net investment income (loss) C | .21 | .32 | .34 | .41 | .47 F |
Net realized and unrealized gain (loss) | (4.11) | 6.19 | 2.24 | 4.06 | 2.86 |
Total from investment operations | (3.90) | 6.51 | 2.58 | 4.47 | 3.33 |
Distributions from net investment income | (.32) | (.27) | (.37) | (.28) | (.15) |
Distributions from net realized gain | (4.12) | (2.02) | (1.20) | (.06) | (.07) |
Total distributions | (4.44) | (2.29) | (1.57) H | (.34) | (.22) |
Net asset value, end of period | $ 14.28 | $ 22.62 | $ 18.40 | $ 17.39 | $ 13.26 |
Total Return A, B | (17.91)% | 36.35% | 14.88% | 33.79% | 32.81% |
Ratios to Average Net Assets D, G | | | | | |
Expenses before reductions | .98% | .97% | .99% | 1.01% | 1.95% |
Expenses net of fee waivers, if any | .98% | .97% | .99% | 1.01% | 1.39% |
Expenses net of all reductions | .98% | .96% | .96% | .99% | 1.37% |
Net investment income (loss) | .97% | 1.51% | 1.88% | 2.77% | 4.08% |
Supplemental Data | | | | | |
Net assets, end of period (000 omitted) | $ 3,558 | $ 4,284 | $ 3,141 | $ 2,735 | $ 2,044 |
Portfolio turnover rate E | 102% | 70% | 75% | 66% | 46% |
A Total returns do not reflect charges attributable to your insurance company's separate account. Inclusion of these charges would reduce the total returns shown.
B Total returns would have been lower had certain expenses not been reduced during the periods shown.
C Calculated based on average shares outstanding during the period.
D Fees and expenses of the underlying Fidelity Central Funds are not included in the Fund's expense ratio. The Fund indirectly bears its proportionate share of the expenses of any underlying Fidelity Central Funds.
E Amount does not include the portfolio activity of any underlying Fidelity Central Funds.
F Investment income per share reflects a special dividend which amounted to $.11 per share.
G Expense ratios reflect operating expenses of the class. Expenses before reductions do not reflect amounts reimbursed by the investment adviser or reductions from brokerage service arrangements or other expense offset arrangements and do not represent the amount paid by the class during periods when reimbursements or reductions occur. Expenses net of fee waivers reflect expenses after reimbursement by the investment adviser but prior to reductions from brokerage service arrangements or other expense offset arrangements. Expenses net of all reductions represent the net expenses paid by the class.
H Total distribution of $1.57 per share is comprised of distributions from net investment income of $.37 and distributions from net realized gain of $1.195 per share.
Financial Highlights - Investor Class
Years ended December 31, | 2007 | 2006 | 2005 H |
Selected Per-Share Data | | | |
Net asset value, beginning of period | $ 22.69 | $ 18.46 | $ 19.25 |
Income from Investment Operations | | | |
Net investment income (loss) E | .24 | .35 | .17 |
Net realized and unrealized gain (loss) | (4.13) | 6.22 | .52 |
Total from investment operations | (3.89) | 6.57 | .69 |
Distributions from net investment income | (.34) | (.32) | (.42) |
Distributions from net realized gain | (4.12) | (2.02) | (1.06) |
Total distributions | (4.46) | (2.34) | (1.48) J |
Net asset value, end of period | $ 14.34 | $ 22.69 | $ 18.46 |
Total Return B, C, D | (17.83)% | 36.53% | 3.52% |
Ratios to Average Net Assets F, I | | | |
Expenses before reductions | .85% | .85% | .99% A |
Expenses net of fee waivers, if any | .85% | .85% | .99% A |
Expenses net of all reductions | .85% | .85% | .96% A |
Net investment income (loss) | 1.10% | 1.62% | 1.98% A |
Supplemental Data | | | |
Net assets, end of period (000 omitted) | $ 31,632 | $ 50,198 | $ 7,134 |
Portfolio turnover rate G | 102% | 70% | 75% |
A Annualized
B Total returns for periods of less than one year are not annualized.
C Total returns do not reflect charges attributable to your insurance company's separate account. Inclusion of these charges would reduce the total returns shown.
D Total returns would have been lower had certain expenses not been reduced during the periods shown.
E Calculated based on average shares outstanding during the period.
F Fees and expenses of the underlying Fidelity Central Funds are not included in the Fund's expense ratio. The Fund indirectly bears its proportionate share of the expenses of any underlying Fidelity Central Funds.
G Amount does not include the portfolio activity of any underlying Fidelity Central Funds.
H For the period July 21, 2005 (commencement of sale of shares) to December 31, 2005.
I Expense ratios reflect operating expenses of the class. Expenses before reductions do not reflect amounts reimbursed by the investment adviser or reductions from brokerage service arrangements or other expense offset arrangements and do not represent the amount paid by the class during periods when reimbursements or reductions occur. Expense ratios before reductions for start-up periods may not be representative of longer-term operating periods. Expenses net of fee waivers reflect expenses after reimbursement by the investment adviser but prior to reductions from brokerage service arrangements or other expense offset arrangements. Expenses net of all reductions represent the net expenses paid by the class.
J Total distribution of $1.48 per share is comprised of distributions from net investment income of $.419 and distributions from net realized gain of $1.06 per share.
See accompanying notes which are an integral part of the financial statements.
Annual Report
Notes to Financial Statements
For the period ended December 31, 2007
1. Organization.
VIP Real Estate Portfolio (the Fund) is a non-diversified fund of Variable Insurance Products Fund IV (the trust) and is authorized to issue an unlimited number of shares. The trust is registered under the Investment Company Act of 1940, as amended (the 1940 Act), as an open-end management investment company organized as a Massachusetts business trust. Shares of the Fund may only be purchased by insurance companies for the purpose of funding variable annuity or variable life insurance contracts. The Fund offers the following classes of shares: Initial Class shares, Service Class shares, Service Class 2 shares, and Investor Class shares. All classes have equal rights and voting privileges, except for matters affecting a single class. Investment income, realized and unrealized capital gains and losses, the common expenses of the Fund, and certain fund-level expense reductions, if any, are allocated on a pro rata basis to each class based on the relative net assets of each class to the total net assets of the Fund. Each class differs with respect to transfer agent and distribution and service plan fees incurred. Certain expense reductions also differ by class.
2. Investments in Fidelity Central Funds.
The Fund may invest in Fidelity Central Funds, which are open-end investment companies available only to other investment companies and accounts managed by Fidelity Management & Research Company (FMR) and its affiliates. The Fund's Schedule of Investments lists each of the Fidelity Central Funds as an investment of the Fund, but does not include the underlying holdings of each Fidelity Central Fund. As an Investing Fund, the Fund indirectly bears its proportionate share of the expenses of the underlying Fidelity Central Funds.
The Money Market Central Funds seek preservation of capital and current income and are managed by Fidelity Investments Money Management, Inc. (FIMM), an affiliate of FMR.
A complete list of holdings for each Fidelity Central Fund is available upon request or at the SEC's web site at www.sec.gov. In addition, the financial statements of the Fidelity Central Funds, which are not covered by the Fund's Report of Independent Registered Public Accounting Firm, are available on the SEC's web site or upon request.
3. Significant Accounting Policies.
The financial statements have been prepared in conformity with accounting principles generally accepted in the United States of America, which require management to make certain estimates and assumptions at the date of the financial statements. The following summarizes the significant accounting policies of the Fund:
Security Valuation. Investments are valued and net asset value (NAV) per share is calculated (NAV calculation) as of the close of business of the New York Stock Exchange (NYSE), normally 4:00 p.m. Eastern time. Wherever possible, the Fund uses independent pricing services approved by the Board of Trustees to value its investments.
Equity securities, including restricted securities, for which market quotations are readily available, are valued at the last reported sale price or official closing price as reported by an independent pricing service on the primary market or exchange on which they are traded. In the event there were no sales during the day or closing prices are not available, securities are valued at the last quoted bid price. Investments in open-end mutual funds, including the Fidelity Central Funds, are valued at their closing net asset value each business day. Short-term securities with remaining maturities of sixty days or less for which quotations are not readily available are valued at amortized cost, which approximates value.
When current market prices or quotations are not readily available or do not accurately reflect fair value, valuations may be determined in accordance with procedures adopted by the Board of Trustees. For example, when developments occur between the close of a market and the close of the NYSE that may materially affect the value of some or all of the securities, or when trading in a security is halted, those securities may be fair valued. Factors used in the determination of fair value may include monitoring news to identify significant market or security specific events such as changes in the value of U.S. securities markets, reviewing developments in foreign markets and evaluating the performance of ADRs, futures contracts and exchange-traded funds. Because the Fund's utilization of fair value pricing depends on market activity, the frequency with which fair value pricing is used cannot be predicted and may be utilized to a significant extent. The value of securities used for NAV calculation under fair value pricing may differ from published prices for the same securities.
Foreign Currency. The Fund uses foreign currency contracts to facilitate transactions in foreign-denominated securities. Losses from these transactions may arise from changes in the value of the foreign currency or if the counterparties do not perform under the contracts' terms.
Foreign-denominated assets, including investment securities, and liabilities are translated into U.S. dollars at the exchange rate at period end. Purchases and sales of investment securities, income and dividends received and expenses denominated in foreign currencies are translated into U.S. dollars at the exchange rate in effect on the transaction date.
The effects of exchange rate fluctuations on investments are included with the net realized and unrealized gain (loss) on investment securities. Other foreign currency transactions resulting in realized and unrealized gain (loss) are disclosed separately.
Annual Report
Notes to Financial Statements - continued
3. Significant Accounting Policies - continued
Investment Transactions and Income. For financial reporting purposes, the Fund's investment holdings and NAV include trades executed through the end of the last business day of the period. The NAV for processing shareholder transactions includes trades executed through the end of the prior business day. Gains and losses on securities sold are determined on the basis of identified cost. Dividend income is recorded on the ex-dividend date, except for certain dividends from foreign securities where the ex-dividend date may have passed, which are recorded as soon as the Fund is informed of the ex-dividend date. Non-cash dividends included in dividend income, if any, are recorded at the fair market value of the securities received. Distributions received on securities that represent a return of capital or capital gain are recorded as a reduction of cost of investments and/or as a realized gain. The Fund estimates the components of distributions received that may be considered return of capital distributions or capital gain distributions. Interest income and distributions from the Fidelity Central Funds are accrued as earned. Interest income includes coupon interest and amortization of premium and accretion of discount on debt securities. Investment income is recorded net of foreign taxes withheld where recovery of such taxes is uncertain.
Expenses. Most expenses of the trust can be directly attributed to a fund. Expenses which cannot be directly attributed are apportioned among each Fund in the trust. Expense estimates are accrued in the period to which they relate and adjustments are made when actual amounts are known.
Income Tax Information and Distributions to Shareholders. Each year, the Fund intends to qualify as a regulated investment company by distributing substantially all of its taxable income and realized gains under Subchapter M of the Internal Revenue Code and filing its U.S. federal tax return. As a result, no provision for income taxes is required. The Fund adopted the provisions of FASB Interpretation No. 48, Accounting for Uncertainties in Income Taxes (FIN 48), on June 29, 2007. FIN 48 sets forth a minimum threshold for financial statement recognition of the benefit of a tax position taken or expected to be taken in a tax return. The implementation of FIN 48 did not result in any unrecognized tax benefits in the accompanying financial statements. Each of the Fund's federal tax returns for the prior three fiscal years remains subject to examination by the Internal Revenue Service. Foreign taxes are provided for based on the Fund's understanding of the tax rules and rates that exist in the foreign markets in which it invests.
Distributions are recorded on the ex-dividend date. Income dividends and capital gain distributions are declared separately for each class. Income and capital gain distributions are determined in accordance with income tax regulations, which may differ from generally accepted accounting principles.
Capital accounts within the financial statements are adjusted for permanent book-tax differences. These adjustments have no impact on net assets or the results of operations. Temporary book-tax differences will reverse in a subsequent period.
Book-tax differences are primarily due foreign currency transactions and losses deferred due to wash sales.
The tax-basis components of distributable earnings and the federal tax cost as of period end were as follows:
Unrealized appreciation | $ 19,605,053 | |
Unrealized depreciation | (10,945,269) | |
Net unrealized appreciation (depreciation) | 8,659,784 | |
Undistributed ordinary income | 245,007 | |
Undistributed long-term capital gain | 189,338 | |
| | |
Cost for federal income tax purposes | $ 98,123,774 | |
The tax character of distributions paid was as follows:
| December 31, 2007 | December 31, 2006 |
Ordinary Income | $ 3,497,299 | $ 6,598,896 |
Long-term Capital Gains | 25,411,016 | 17,557,035 |
Total | $ 28,908,315 | $ 24,155,931 |
New Accounting Pronouncement. In September 2006, Statement of Financial Accounting Standards No. 157, Fair Value Measurements (SFAS 157), was issued and is effective for fiscal years beginning after November 15, 2007. SFAS 157 defines fair value, establishes a framework for measuring fair value and expands disclosures about fair value measurements. Management is currently evaluating the impact the adoption of SFAS 157 will have on the Fund's financial statement disclosures.
Annual Report
4. Operating Policies.
Repurchase Agreements. FMR has received an Exemptive Order from the Securities and Exchange Commission (the SEC) which permits the Fund and other affiliated entities of FMR to transfer uninvested cash balances into joint trading accounts which are then invested in repurchase agreements. The Fund may also invest directly with institutions in repurchase agreements. Repurchase agreements are collateralized by government or non-government securities. Upon settlement date, collateral is held in segregated accounts with custodian banks and may be obtained in the event of a default of the counterparty. The Fund monitors, on a daily basis, the value of the collateral to ensure it is at least equal to the principal amount of the repurchase agreement (including accrued interest). In the event of a default by the counterparty, realization of the collateral proceeds could be delayed, during which time the value of the collateral may decline.
5. Purchases and Sales of Investments.
Purchases and sales of securities, other than short-term securities, aggregated $202,709,148 and $320,191,900, respectively.
6. Fees and Other Transactions with Affiliates.
Management Fee. FMR and its affiliates provide the Fund with investment management related services for which the Fund pays a monthly management fee. The management fee is the sum of an individual fund fee rate that is based on an annual rate of .30% of the Fund's average net assets and a group fee rate that averaged .26% during the period. The group fee rate is based upon the average net assets of all the mutual funds advised by FMR. The group fee rate decreases as assets under management increase and increases as assets under management decrease. For the period, the total annual management fee rate was .56% of the Fund's average net assets.
Distribution and Service Plan. In accordance with Rule 12b-1 of the 1940 Act, the Fund has adopted separate 12b-1 Plans for each Service Class of shares. Each Service Class pays Fidelity Distributors Corporation (FDC), an affiliate of FMR, a service fee. For the period, the service fee is based on an annual rate of .10% of Service Class' average net assets and .25% of Service Class 2's average net assets.
For the period, each class paid FDC the following amounts, all of which were re-allowed to insurance companies for the distribution of shares and providing shareholder support services:
Service Class | $ 4,165 | |
Service Class 2 | 10,451 | |
| $ 14,616 | |
Transfer Agent Fees. Fidelity Investments Institutional Operations Company, Inc. (FIIOC), an affiliate of FMR, is the Fund's transfer, dividend disbursing, and shareholder servicing agent. FIIOC receives an asset-based fee with respect to each class. Each class with exception of Investor Class pays a transfer agent fee, excluding out of pocket expenses, equal to an annual rate of .07% of average net assets. Investor class pays a monthly asset-based fee of .18% of average net assets. The total transfer agent fees paid by each class to FIIOC, including out of pocket expenses, were as follows:
Initial Class | $ 100,789 | |
Service Class | 2,755 | |
Service Class 2 | 2,769 | |
Investor Class | 90,525 | |
| $ 196,838 | |
Effective February 1, 2008, the Board of Trustees approved a decrease to Investor Class' asset-based fee from .18% to .15% of average net assets.
Accounting Fees. Fidelity Service Company, Inc. (FSC), an affiliate of FMR, maintains the Fund's accounting records. The fee is based on the level of average net assets for the month.
Brokerage Commissions. The Fund placed a portion of its portfolio transactions with brokerage firms which are affiliates of the investment adviser. The commissions paid to these affiliated firms were $2,536 for the period.
Interfund Lending Program. Pursuant to an Exemptive Order issued by the SEC, the Fund, along with other registered investment companies having management contracts with FMR, may participate in an interfund lending program. This program provides an alternative credit facility allowing the funds to borrow from, or lend money to, other participating affiliated funds. At period end, there were no interfund loans outstanding. The Fund's activity in this program during the period for which loans were outstanding was as follows:
Borrower or Lender | Average Daily
Loan Balance | Weighted Average Interest Rate | Interest
Expense |
Borrower | $ 3,306,333 | 5.39% | $ 4,455 |
Annual Report
Notes to Financial Statements - continued
7. Committed Line of Credit.
The Fund participates with other funds managed by FMR in a $4.2 billion credit facility (the "line of credit") to be utilized for temporary or emergency purposes to fund shareholder redemptions or for other short-term liquidity purposes. The Fund has agreed to pay commitment fees on its pro rata portion of the line of credit, which amounted to $507 and is reflected in Miscellaneous Expense on the Statement of Operations. During the period, there were no borrowings on this line of credit.
8. Expense Reductions.
Many of the brokers with whom FMR places trades on behalf of the Fund provided services to the Fund in addition to trade execution. These services included payments of certain expenses on behalf of the Fund totaling $971 for the period.
9. Other.
The Fund's organizational documents provide former and current trustees and officers with a limited indemnification against liabilities arising in connection with the performance of their duties to the Fund. In the normal course of business, the Fund may also enter into contracts that provide general indemnifications. The Fund's maximum exposure under these arrangements is unknown as this would be dependent on future claims that may be made against the Fund. The risk of material loss from such claims is considered remote.
At the end of the period, FMR or its affiliates were the owners of record of 99% of the total outstanding shares of the Fund.
The United States Securities and Exchange Commission ("SEC") is conducting an investigation of FMR (covering the years 2002 to 2004) arising from gifts, gratuities and business entertainment provided by certain brokers to certain individuals who were employed on FMR's domestic equity trading desk during that period. FMR is in discussions with the SEC staff regarding the possible resolution of the matter, but as of period-end no final resolution has been reached.
In December 2006, the Independent Trustees completed their own investigation of the matter with the assistance of independent counsel. The Independent Trustees and FMR agree that, despite the absence of proof that the Fidelity mutual funds experienced diminished execution quality as a result of the improper receipt of gifts and business entertainment, the conduct at issue was serious and is worthy of redress. Accordingly, the Independent Trustees have requested and FMR has agreed to pay $42 million to Fidelity mutual funds, plus interest to be determined at the time that payment is made. A method of allocating this payment among the funds has not yet been determined. The total payment to the Fund is not anticipated to have a material impact on the Fund's net assets. In addition, FMR reimbursed related legal expenses which are recorded in the accompanying Statement of Operations as an expense reduction.
10. Distributions to Shareholders.
Distributions to shareholders of each class were as follows:
| Years ended December 31, |
| 2007 | 2006 |
From net investment income | | |
Initial Class | $ 1,365,795 | $ 2,781,183 |
Service Class | 68,258 | 53,234 |
Service Class 2 | 62,646 | 47,704 |
Investor Class | 586,440 | 599,057 |
Total | $ 2,083,139 | $ 3,481,178 |
From net realized gain | | |
Initial Class | $ 17,699,464 | $ 16,767,387 |
Service Class | 793,369 | 351,979 |
Service Class 2 | 800,493 | 351,224 |
Investor Class | 7,531,850 | 3,204,163 |
Total | $ 26,825,176 | $ 20,674,753 |
Annual Report
11. Share Transactions.
Transactions for each class of shares were as follows:
| Shares | Dollars |
| Years ended December 31, | Years ended December 31, |
| 2007 | 2006 | 2007 | 2006 |
Initial Class | | | | |
Shares sold | 1,009,853 | 2,250,474 | $ 24,565,352 | $ 50,672,505 |
Reinvestment of distributions | 1,205,003 | 905,495 | 19,065,259 | 19,548,570 |
Shares redeemed | (6,507,635) | (1,956,218) | (141,392,015) | (40,657,830) |
Net increase (decrease) | (4,292,779) | 1,199,751 | $ (97,761,404) | $ 29,563,245 |
Service Class | | | | |
Reinvestment of distributions | 57,280 | 18,859 | 861,626 | 405,213 |
Net increase (decrease) | 57,280 | 18,859 | $ 861,626 | $ 405,213 |
Service Class 2 | | | | |
Shares sold | 2,439 | - | $ 60,976 | $ - |
Reinvestment of distributions | 57,564 | 18,633 | 863,138 | 398,928 |
Shares redeemed | (138) | - | (3,144) | - |
Net increase (decrease) | 59,865 | 18,633 | $ 920,970 | $ 398,928 |
Investor Class | | | | |
Shares sold | 1,124,988 | 1,835,126 | $ 26,378,804 | $ 40,039,439 |
Reinvestment of distributions | 528,915 | 173,210 | 8,118,290 | 3,803,220 |
Shares redeemed | (1,660,061) | (182,665) | (35,998,756) | (3,940,751) |
Net increase (decrease) | (6,158) | 1,825,671 | $ (1,501,662) | $ 39,901,908 |
Annual Report
Report of Independent Registered Public Accounting Firm
To the Trustees of Variable Insurance Products Fund IV and the Shareholders of VIP Real Estate Portfolio:
In our opinion, the accompanying statement of assets and liabilities, including the schedule of investments, and the related statements of operations and of changes in net assets and the financial highlights present fairly, in all material respects, the financial position of VIP Real Estate Portfolio (a fund of Variable Insurance Products Fund IV) at December 31, 2007, the results of its operations for the year then ended, the changes in its net assets for each of the two years in the period then ended and the financial highlights for each of the periods indicated, in conformity with accounting principles generally accepted in the United States of America. These financial statements and financial highlights (hereafter referred to as "financial statements") are the responsibility of the VIP Real Estate Portfolio's management. Our responsibility is to express an opinion on these financial statements based on our audits. We conducted our audits of these financial statements in accordance with the standards of the Public Company Accounting Oversight Board (United States). Those standards require that we plan and perform the audit to obtain reasonable assurance about whether the financial statements are free of material misstatement. An audit includes examining, on a test basis, evidence supporting the amounts and disclosures in the financial statements, assessing the accounting principles used and significant estimates made by management, and evaluating the overall financial statement presentation. We believe that our audits, which included confirmation of securities at December 31, 2007 by correspondence with the custodian and brokers, provide a reasonable basis for our opinion.
/s/ PricewaterhouseCoopers LLP
PricewaterhouseCoopers LLP
Boston, Massachusetts
February 20, 2008
Annual Report
Trustees and Officers
The Trustees, Members of the Advisory Board, and executive officers of the trust and fund, as applicable, are listed below. The Board of Trustees governs the fund and is responsible for protecting the interests of shareholders. The Trustees are experienced executives who meet periodically throughout the year to oversee the fund's activities, review contractual arrangements with companies that provide services to the fund, and review the fund's performance. Except for James C. Curvey, each of the Trustees oversees 373 funds advised by FMR or an affiliate. Mr. Curvey oversees 368 funds advised by FMR or an affiliate.
The Trustees hold office without limit in time except that (a) any Trustee may resign; (b) any Trustee may be removed by written instrument, signed by at least two-thirds of the number of Trustees prior to such removal; (c) any Trustee who requests to be retired or who has become incapacitated by illness or injury may be retired by written instrument signed by a majority of the other Trustees; and (d) any Trustee may be removed at any special meeting of shareholders by a two-thirds vote of the outstanding voting securities of the trust. Each Trustee who is not an interested person (as defined in the 1940 Act) (Independent Trustee), shall retire not later than the last day of the calendar year in which his or her 72nd birthday occurs. The Independent Trustees may waive this mandatory retirement age policy with respect to individual Trustees. The executive officers and Advisory Board Members hold office without limit in time, except that any officer and Advisory Board Member may resign or may be removed by a vote of a majority of the Trustees at any regular meeting or any special meeting of the Trustees. Except as indicated, each individual has held the office shown or other offices in the same company for the past five years.
The fund's Statement of Additional Information (SAI) includes more information about the Trustees. To request a free copy, call Fidelity at 1-877-208-0098.
Interested Trustees*:
Correspondence intended for each Trustee who is an interested person may be sent to Fidelity Investments, 82 Devonshire Street, Boston, Massachusetts 02109.
Name, Age; Principal Occupation |
Edward C. Johnson 3d (77) |
| Year of Election or Appointment: 1983 Mr. Johnson is Chairman of the Board of Trustees. Mr. Johnson serves as President (2006-present), Chief Executive Officer, Chairman, and a Director of FMR LLC; Chairman and a Director of FMR; Chairman and a Director of Fidelity Research & Analysis Company (FRAC); Chairman and a Director of Fidelity Investments Money Management, Inc.; and Chairman (2001-present) and a Director of FMR Co., Inc. In addition, Mr. Johnson serves as Chairman and Director of Fidelity International Limited (FIL).
Mr. Edward C. Johnson 3d and Mr. Arthur E. Johnson are not related. |
James C. Curvey (72) |
| Year of Election or Appointment: 2007 Mr. Curvey also serves as Trustee (2007-present) or Member of the Advisory Board (2007-present) of other investment companies advised by FMR. Mr. Curvey is a Director of FMR and FMR Co., Inc. (2007-present). Mr. Curvey is also Vice Chairman (2006-present) and Director of FMR LLC. Mr. Curvey joined Fidelity in 1982 and served in numerous senior management positions, including President and Chief Operating Officer of FMR LLC (1997-2000) and President of Fidelity Strategic Investments (2000-2002). In addition, he serves as a member of the Board of Directors of Geerlings & Wade, Inc. (wine distribution). |
* Trustees have been determined to be "Interested Trustees" by virtue of, among other things, their affiliation with the trust or various entities under common control with FMR. FMR Corp. merged with and into FMR LLC on October 1, 2007. Any references to FMR LLC for prior periods are deemed to be references to the prior entity.
Independent Trustees:
Correspondence intended for each Independent Trustee (that is, the Trustees other than the Interested Trustees) may be sent to Fidelity Investments, P.O. Box 55235, Boston, Massachusetts 02205-5235.
Name, Age; Principal Occupation |
Dennis J. Dirks (59) |
| Year of Election or Appointment: 2005 Prior to his retirement in May 2003, Mr. Dirks was Chief Operating Officer and a member of the Board of The Depository Trust & Clearing Corporation (DTCC) (1999-2003). He also served as President, Chief Operating Officer, and Board member of The Depository Trust Company (DTC) (1999-2003) and President and Board member of the National Securities Clearing Corporation (NSCC) (1999-2003). In addition, Mr. Dirks served as Chief Executive Officer and Board member of the Government Securities Clearing Corporation (2001-2003) and Chief Executive Officer and Board member of the Mortgage-Backed Securities Clearing Corporation (2001-2003). Mr. Dirks also serves as a Trustee and a member of the Finance Committee of Manhattan College (2005-present) and a Trustee and a member of the Finance Committee of AHRC of Nassau County (2006-present). |
Albert R. Gamper, Jr. (65) |
| Year of Election or Appointment: 2006 Prior to his retirement in December 2004, Mr. Gamper served as Chairman of the Board of CIT Group Inc. (commercial finance). During his tenure with CIT Group Inc. Mr. Gamper served in numerous senior management positions, including Chairman (1987-1989; 1999-2001; 2002-2004), Chief Executive Officer (1987-2004), and President (1989-2002). He currently serves as a member of the Board of Directors of Public Service Enterprise Group (utilities, 2001-present), Chairman of the Board of Governors, Rutgers University (2004-present), and Chairman of the Board of Saint Barnabas Health Care System. |
George H. Heilmeier (71) |
| Year of Election or Appointment: 2004 Dr. Heilmeier is Chairman Emeritus of Telcordia Technologies (communication software and systems), where prior to his retirement, he served as company Chairman and Chief Executive Officer. He currently serves on the Boards of Directors of The Mitre Corporation (systems engineering and information technology support for the government), and HRL Laboratories (private research and development, 2004-present). He is Chairman of the General Motors Science & Technology Advisory Board and a Life Fellow of the Institute of Electrical and Electronics Engineers (IEEE). Dr. Heilmeier is a member of the Defense Science Board and the National Security Agency Advisory Board. He is also a member of the National Academy of Engineering, the American Academy of Arts and Sciences, and the Board of Overseers of the School of Engineering and Applied Science of the University of Pennsylvania. Previously, Dr. Heilmeier served as a Director of TRW Inc. (automotive, space, defense, and information technology, 1992-2002), Compaq (1994-2002), Automatic Data Processing, Inc. (ADP) (technology-based business outsourcing, 1995-2002), INET Technologies Inc. (telecommunications network surveillance, 2001-2004), and Teletech Holdings (customer management services). He is the recipient of the 2005 Kyoto Prize in Advanced Technology for his invention of the liquid crystal display, and a member of the Consumer Electronics Hall of Fame. |
James H. Keyes (67) |
| Year of Election or Appointment: 2007 Prior to his retirement in 2003, Mr. Keyes was Chairman, President, and Chief Executive Officer of Johnson Controls, Inc. (automotive supplier, 1993-2003). He currently serves as a member of the boards of LSI Logic Corporation (semiconductor technologies), Navistar International Corporation (manufacture and sale of trucks, buses, and diesel engines, 2002-present), and Pitney Bowes, Inc. (integrated mail, messaging, and document management solutions). |
Marie L. Knowles (61) |
| Year of Election or Appointment: 2001 Prior to Ms. Knowles' retirement in June 2000, she served as Executive Vice President and Chief Financial Officer of Atlantic Richfield Company (ARCO) (diversified energy, 1996-2000). From 1993 to 1996, she was a Senior Vice President of ARCO and President of ARCO Transportation Company. She served as a Director of ARCO from 1996 to 1998. She currently serves as a Director of Phelps Dodge Corporation (copper mining and manufacturing) and McKesson Corporation (healthcare service, 2002-present). Ms. Knowles is a Trustee of the Brookings Institution and the Catalina Island Conservancy and also serves as a member of the Advisory Board for the School of Engineering of the University of Southern California. |
Ned C. Lautenbach (63) |
| Year of Election or Appointment: 2000 Mr. Lautenbach is Chairman of the Independent Trustees (2006-present). Mr. Lautenbach has been a partner of Clayton, Dubilier & Rice, Inc. (private equity investment firm) since September 1998. Previously, Mr. Lautenbach was with the International Business Machines Corporation (IBM) from 1968 until his retirement in 1998. Mr. Lautenbach serves as a Director of Sony Corporation (2006-present) and Eaton Corporation (diversified industrial) as well as the Philharmonic Center for the Arts in Naples, Florida. He also is a member of the Board of Trustees of Fairfield University (2005-present), as well as a member of the Council on Foreign Relations. |
Cornelia M. Small (63) |
| Year of Election or Appointment: 2005 Ms. Small is a member (2000-present) and Chairperson (2002-present) of the Investment Committee, and a member (2002-present) of the Board of Trustees of Smith College. Previously, she served as Chief Investment Officer (1999-2000), Director of Global Equity Investments (1996-1999), and a member of the Board of Directors of Scudder, Stevens & Clark (1990-1997) and Scudder Kemper Investments (1997-1999). In addition, Ms. Small served as Co-Chair (2000-2003) of the Annual Fund for the Fletcher School of Law and Diplomacy. |
William S. Stavropoulos (68) |
| Year of Election or Appointment: 2001 Mr. Stavropoulos is Chairman Emeritus of the Board of Directors of The Dow Chemical Company. Since joining The Dow Chemical Company in 1967, Mr. Stavropoulos served in numerous senior management positions, including President (1993-2000; 2002-2003), CEO (1995-2000; 2002-2004), and Chairman of the Executive Committee (2000-2004). Currently, he is a Director of NCR Corporation (data warehousing and technology solutions), Chemical Financial Corporation, Maersk Inc. (industrial conglomerate, 2002-present), Tyco International, Inc. (multinational manufacturing and services, 2007-present), and a member of the Advisory Board for Metalmark Capital (private equity investment firm, 2005-present). He is a special advisor to Clayton, Dubilier & Rice, Inc., a private equity investment firm. He also serves as a member of the Board of Trustees of the American Enterprise Institute for Public Policy Research. In addition, Mr. Stavropoulos is a member of The Business Council, J.P. Morgan International Council and the University of Notre Dame Advisory Council for the College of Science. |
Kenneth L. Wolfe (68) |
| Year of Election or Appointment: 2005 Mr. Wolfe is Chairman and a Director of Hershey Foods Corporation (2007-present), where prior to his retirement in 2001, he was Chairman and Chief Executive Officer. Mr. Wolfe currently serves as a member of the board of Revlon Inc. (2004-present). Previously, Mr. Wolfe served as a member of the boards of Adelphia Communications Corporation (2003-2006) and Bausch & Lomb, Inc. (1993-2007). |
Advisory Board Members and Executive Officers**:
Correspondence intended for Mr. Mauriello, Mr. Thomas, Mr. Wiley, Mr. Lacy, and Mr. Arthur Johnson may be sent to Fidelity Investments, P.O. Box 55235, Boston, Massachusetts 02205-5235. Correspondence intended for each executive officer and Mr. Lynch may be sent to Fidelity Investments, 82 Devonshire Street, Boston, Massachusetts 02109.
Name, Age; Principal Occupation |
Arthur E. Johnson (60) |
| Year of Election or Appointment: 2008 Member of the Advisory Board of Variable Insurance Products Fund IV. Mr. Johnson serves as Senior Vice President of Corporate Strategic Development of Lockheed Martin Corporation (defense contractor). In addition, Mr. Johnson serves as a member of the Board of Directors of AGL Resources, Inc. (holding company, 2002-present), and IKON Office Solutions, Inc. (document management systems and services). Mr. Arthur E. Johnson and Mr. Edward C. Johnson 3d are not related. |
Alan J. Lacy (54) |
| Year of Election or Appointment: 2008 Member of the Advisory Board of Variable Insurance Products Fund IV. Mr. Lacy serves as Senior Adviser (2007-present) of Oak Hill Capital Partners, L.P. (a private equity firm). Mr. Lacy also served as Vice Chairman and Chief Executive Officer of Sears Holdings Corporation and Sears, Roebuck and Co. (retail, 2005-2006; 2000-2005). In addition, Mr. Lacy serves as a member of the Board of Directors of The Western Union Company (global money transfer, 2006-present) and Bristol-Myers Squibb (global pharmaceuticals, 2007-present). Mr. Lacy is a Trustee of the National Parks Conservation Association and The Field Museum of Natural History. |
Peter S. Lynch (63) |
| Year of Election or Appointment: 2003 Member of the Advisory Board of Variable Insurance Products Fund IV. Mr. Lynch is Vice Chairman and a Director of FMR, and Vice Chairman (2001-present) and a Director of FMR Co., Inc. Previously, Mr. Lynch served as a Trustee of the Fidelity funds (1990-2003). In addition, he serves as a Trustee of Boston College and as the Chairman of the Inner-City Scholarship Fund. |
Joseph Mauriello (63) |
| Year of Election or Appointment: 2007 Member of the Advisory Board of Variable Insurance Products Fund IV. Prior to his retirement in January 2006, Mr. Mauriello served in numerous senior management positions including Deputy Chairman and Chief Operating Officer (2004-2005), and Vice Chairman of Financial Services (2002-2004) of KPMG LLP US (professional services firm, 1965-2005). Mr. Mauriello currently serves as a member of the Board of Directors of XL Capital Ltd. (global insurance and re-insurance company, 2006-present) and of Arcadia Resources Inc. (health care services and products, 2007-present). He also served as a Director of the Hamilton Funds of the Bank of New York (2006-2007). |
David M. Thomas (58) |
| Year of Election or Appointment: 2007 Member of the Advisory Board of Variable Insurance Products Fund IV. Previously, Mr. Thomas served as Executive Chairman (2005-2006) and Chairman and Chief Executive Officer (2000-2005) of IMS Health, Inc. (pharmaceutical and healthcare information solutions). In addition, Mr. Thomas serves as a member of the Board of Directors of Fortune Brands, Inc. (consumer products holding company), and Interpublic Group of Companies, Inc. (marketing communication, 2004-present). |
Michael E. Wiley (57) |
| Year of Election or Appointment: 2007 Member of the Advisory Board of Variable Insurance Products Fund IV. Mr. Wiley also serves as a member of the Board of Trustees of the University of Tulsa (2000-2006; 2007-present). He serves as a Director of Tesoro Corporation (independent oil refiner and marketer, 2005-present), and a Director of Bill Barrett Corporation (exploration and production company, 2005-present). In addition, he also serves as a Director of Post Oak Bank (privately-held bank, 2004-present). Previously, Mr. Wiley served as a Sr. Energy Advisor of Katzenbach Partners, LLC (consulting firm, 2006-2007), as an Advisory Director of Riverstone Holdings (private investment firm), Chairman, President, and CEO of Baker Hughes, Inc. (oilfield services company, 2000-2004), and as Director of Spinnaker Exploration Company (exploration and production company, 2001-2005). |
Kimberley H. Monasterio (44) |
| Year of Election or Appointment: 2007 President and Treasurer of VIP Real Estate. Ms. Monasterio also serves as President and Treasurer of other Fidelity funds (2007-present) and is an employee of FMR (2004-present). Previously, Ms. Monasterio served as Deputy Treasurer of the Fidelity funds (2004-2006). Before joining Fidelity Investments, Ms. Monasterio served as Treasurer (2000-2004) and Chief Financial Officer (2002-2004) of the Franklin Templeton Funds and Senior Vice President of Franklin Templeton Services, LLC (2000-2004). |
Brian B. Hogan (43) |
| Year of Election or Appointment: 2007 Vice President of VIP Real Estate. Mr. Hogan also serves as Vice President of Sector Funds (2007-present). Mr. Hogan is Senior Vice President of Equity Research (2006-present). Mr. Hogan also serves as Vice President of FMR and FMR Co., Inc. Previously, Mr. Hogan served as a portfolio manager. |
Eric D. Roiter (59) |
| Year of Election or Appointment: 2002 Secretary of VIP Real Estate. He also serves as Secretary of other Fidelity funds; Vice President, General Counsel, and Secretary of FMR Co., Inc. (2001-present) and FMR; Assistant Secretary of Fidelity Management & Research (U.K.) Inc. (2001-present), Fidelity Research & Analysis Company (2001-present), and Fidelity Investments Money Management, Inc. (2001-present). Mr. Roiter is an Adjunct Member, Faculty of Law, at Boston College Law School (2003-present). Previously, Mr. Roiter served as Vice President and Secretary of Fidelity Distributors Corporation (FDC) (1998-2005). |
John B. McGinty, Jr. (45) |
| Year of Election or Appointment: 2008 Assistant Secretary of VIP Real Estate. Mr. McGinty also serves as Assistant Secretary of other Fidelity funds (2008-present), and is an employee of FMR LLC (2004-present). Mr. McGinty also serves as Senior Vice President, Secretary, and Chief Legal Officer of FDC (2007-present). Before joining Fidelity Investments, Mr. McGinty practiced law at Ropes & Gray, LLP. |
R. Stephen Ganis (41) |
| Year of Election or Appointment: 2006 Anti-Money Laundering (AML) officer of VIP Real Estate. Mr. Ganis also serves as AML officer of other Fidelity funds (2006-present) and FMR LLC (2003-present). Before joining Fidelity Investments, Mr. Ganis practiced law at Goodwin Procter, LLP (2000-2002). |
Joseph B. Hollis (59) |
| Year of Election or Appointment: 2006 Chief Financial Officer of VIP Real Estate. Mr. Hollis also serves as Chief Financial Officer of other Fidelity funds. Mr. Hollis is President of Fidelity Pricing and Cash Management Services (FPCMS) (2005-present). Mr. Hollis also serves as President and Director of Fidelity Service Company, Inc. (2006-present). Previously, Mr. Hollis served as Senior Vice President of Cash Management Services (1999-2002) and Investment Management Operations (2002-2005). |
Kenneth A. Rathgeber (60) |
| Year of Election or Appointment: 2004 Chief Compliance Officer of VIP Real Estate. Mr. Rathgeber also serves as Chief Compliance Officer of other Fidelity funds (2004-present) and Executive Vice President of Risk Oversight for Fidelity Investments (2002-present). He is Chief Compliance Officer of FMR (2005-present), FMR Co., Inc. (2005-present), Fidelity Management & Research (U.K.) Inc. (2005-present), Fidelity Research & Analysis Company (2005-present), Fidelity Investments Money Management, Inc. (2005-present), and Strategic Advisers, Inc. (2005-present). Previously, Mr. Rathgeber served as Executive Vice President and Chief Operating Officer for Fidelity Investments Institutional Services Company, Inc. (1998-2002). |
Bryan A. Mehrmann (46) |
| Year of Election or Appointment: 2005 Deputy Treasurer of VIP Real Estate. Mr. Mehrmann also serves as Deputy Treasurer of other Fidelity funds (2005-present) and is an employee of FMR. Previously, Mr. Mehrmann served as Vice President of Fidelity Investments Institutional Services Group (FIIS)/Fidelity Investments Institutional Operations Corporation, Inc. (FIIOC) Client Services (1998-2004). |
Kenneth B. Robins (38) |
| Year of Election or Appointment: 2005 Deputy Treasurer of VIP Real Estate. Mr. Robins also serves as Deputy Treasurer of other Fidelity funds (2005-present) and is an employee of FMR (2004-present). Before joining Fidelity Investments, Mr. Robins worked at KPMG LLP, where he was a partner in KPMG's department of professional practice (2002-2004) and a Senior Manager (1999-2000). In addition, Mr. Robins served as Assistant Chief Accountant, United States Securities and Exchange Commission (2000-2002). |
Robert G. Byrnes (41) |
| Year of Election or Appointment: 2005 Assistant Treasurer of VIP Real Estate. Mr. Byrnes also serves as Assistant Treasurer of other Fidelity funds (2005-present) and is an employee of FMR (2005-present). Previously, Mr. Byrnes served as Vice President of FPCMS (2003-2005). Before joining Fidelity Investments, Mr. Byrnes worked at Deutsche Asset Management where he served as Vice President of the Investment Operations Group (2000-2003). |
Peter L. Lydecker (53) |
| Year of Election or Appointment: 2004 Assistant Treasurer of VIP Real Estate. Mr. Lydecker also serves as Assistant Treasurer of other Fidelity funds (2004) and is an employee of FMR. |
Paul M. Murphy (60) |
| Year of Election or Appointment: 2007 Assistant Treasurer of VIP Real Estate. Mr. Murphy also serves as Assistant Treasurer of other Fidelity funds (2007-present) and is an employee of FMR (2007-present). Previously, Mr. Murphy served as Chief Financial Officer of the Fidelity Funds (2005-2006), Vice President and Associate General Counsel of FMR (2007), and Senior Vice President of Fidelity Pricing and Cash Management Services Group (FPCMS) (1994-2007). |
Gary W. Ryan (49) |
| Year of Election or Appointment: 2005 Assistant Treasurer of VIP Real Estate. Mr. Ryan also serves as Assistant Treasurer of other Fidelity funds (2005-present) and is an employee of FMR (2005-present). Previously, Mr. Ryan served as Vice President of Fund Reporting in FPCMS (1999-2005). |
** FMR Corp. merged with and into FMR LLC on October 1, 2007. Any references to FMR LLC for prior periods are deemed to be references to the prior entity.
Annual Report
Distributions
The Board of Trustees of VIP Real Estate Portfolio voted to pay to shareholders of record at the opening of business on record date, the following distributions per share derived from capital gains realized from sales of portfolio securities, and dividends derived from net investment income:
Fund | Pay Date | Record Date | Dividends | Capital Gains |
Initial Class | 02/15/08 | 02/15/08 | $.035 | $.03 |
Service Class | 02/15/08 | 02/15/08 | $.035 | $.03 |
Service Class 2 | 02/15/08 | 02/15/08 | $.035 | $.03 |
Investor Class | 02/15/08 | 02/15/08 | $.035 | $.03 |
The fund hereby designates as a capital gain dividend with respect to the taxable year ended December 31, 2007, $22,336,599, or, if subsequently determined to be different, the net capital gain of such year.
The fund will notify shareholders in January 2008 of amounts for use in preparing 2007 income tax returns.
Annual Report
Board Approval of Investment Advisory Contracts and Management Fees
VIP Real Estate Portfolio
Each year, typically in July, the Board of Trustees, including the Independent Trustees (together, the Board), votes on the renewal of the management contract and sub-advisory agreements (together, the Advisory Contracts) for the fund. The Board, assisted by the advice of fund counsel and Independent Trustees' counsel, requests and considers a broad range of information throughout the year.
The Board meets regularly each month except August and takes into account throughout the year matters bearing on Advisory Contracts. The Board, acting directly and through its separate committees, considers at each of its meetings factors that are relevant to the annual renewal of the fund's Advisory Contracts, including the services and support provided to the fund and its shareholders. At the time of the renewal, the Board had 12 standing committees, each composed of Independent Trustees with varying backgrounds, to which the Board has assigned specific subject matter responsibilities in order to enhance effective decision-making by the Board. Each committee has adopted a written charter outlining the structure and purposes of the committee. One such committee, the Equity Contract Committee, meets periodically as needed throughout the year to consider matters specifically related to the annual renewal of Advisory Contracts. The committee requests and receives information on, and makes recommendations to the Independent Trustees concerning, the approval and annual review of the Advisory Contracts.
At its July 2007 meeting, the Board of Trustees, including the Independent Trustees, unanimously determined to renew the Advisory Contracts for the fund. In reaching its determination, the Board considered all factors it believed relevant, including (i) the nature, extent, and quality of the services to be provided to the fund and its shareholders (including the investment performance of the fund); (ii) the competitiveness of the management fee and total expenses of the fund; (iii) the total costs of the services to be provided by and the profits to be realized by the investment adviser and its affiliates from the relationship with the fund; (iv) the extent to which economies of scale would be realized as the fund grows; and (v) whether fee levels reflect these economies of scale, if any, for the benefit of fund shareholders. The Board also approved amendments to the fund's agreements with foreign sub-advisers to clarify that each sub-adviser provides services as an independent contractor.
In determining whether to renew the Advisory Contracts for the fund, the Board ultimately reached a determination, with the assistance of fund counsel and Independent Trustees' counsel, that the renewal of the Advisory Contracts and the compensation to be received by Fidelity under the management contract is consistent with Fidelity's fiduciary duty under applicable law. In addition to evaluating the specific factors noted above, the Board, in reaching its determination, is aware that shareholders in the fund have a broad range of investment choices available to them, including a wide choice among mutual funds offered by competitors to Fidelity, and that the fund's shareholders, with the opportunity to review and weigh the disclosure provided by the fund in its prospectus and other public disclosures, have chosen to invest in this fund, managed by Fidelity.
Nature, Extent, and Quality of Services Provided. The Board considered staffing within the investment adviser, FMR, and the sub-advisers (together, the Investment Advisers), including the background of the fund's portfolio manager and the fund's investment objective and discipline. The Independent Trustees also had discussions with senior management of Fidelity's investment operations and investment groups. The Board considered the structure of the portfolio manager compensation program and whether this structure provides appropriate incentives.
Resources Dedicated to Investment Management and Support Services. The Board reviewed the size, education, and experience of the Investment Advisers' investment staff, their use of technology, and the Investment Advisers' approach to recruiting, training, and retaining portfolio managers and other research, advisory, and management personnel. The Board considered Fidelity's extensive global research capabilities that enable the Investment Advisers to aggregate data from various sources in an effort to produce positive investment results. The Board noted that Fidelity's analysts have access to a variety of technological tools that enable them to perform both fundamental and quantitative analysis and to specialize in various disciplines. The Board also considered that Fidelity's portfolio managers and analysts have access to daily portfolio attribution that allows for monitoring of a fund's portfolio, as well as an electronic communication system that provides immediate real-time access to research concerning issuers and credit enhancers.
Shareholder and Administrative Services. The Board considered (i) the nature, extent, quality, and cost of advisory, administrative, distribution, and shareholder services performed by the Investment Advisers and their affiliates under the Advisory Contracts and under separate agreements covering transfer agency, pricing and bookkeeping, and securities lending services for the fund; (ii) the nature and extent of the Investment Advisers' supervision of third party service providers, principally custodians and subcustodians; and (iii) the resources devoted to, and the record of compliance with, the fund's compliance policies and procedures. The Board reviewed the allocation of fund brokerage, including allocations to brokers affiliated with the Investment Advisers, the use of brokerage commissions to pay fund expenses, and the use of "soft" commission dollars to pay for research services. The Board also considered that Fidelity voluntarily pays for market data out of its own resources. The Board also considered the agreement reached between the Independent Trustees and Fidelity in December 2006 following an independent review of matters relating to receipt of travel, entertainment, gifts and gratuities in violation of Fidelity policies.
The Board noted that the growth of fund assets across the complex allows Fidelity to reinvest in the development of services designed to enhance the value or convenience of the Fidelity funds as investment vehicles. These services include 24-hour access to account information and market information through phone representatives and over the Internet, and investor education materials and asset allocation tools.
Annual Report
Board Approval of Investment Advisory Contracts and Management Fees - continued
Investment in a Large Fund Family. The Board considered the benefits to shareholders of investing in a Fidelity fund, including the benefits of investing in a fund that is part of a large family of funds offering a variety of investment disciplines and providing for a large variety of mutual fund investor services. The Board noted that, since the last Advisory Contract renewals in July 2006, Fidelity has taken a number of actions that benefited particular funds, including (i) dedicating additional resources to investment research and to restructure the investment research teams; (ii) contractually agreeing to reduce the management fee on Fidelity Advisor Floating Rate High Income Fund; (iii) contractually agreeing to reduce the management fees on Fidelity's California, Massachusetts, New Jersey, and New York AMT Tax-Free Money Market Funds, launching new Institutional Classes and Service Classes of these funds, and contractually agreeing to impose expense limitations on these funds; (iv) eliminating the exchange fee on the Fidelity Select Portfolios and reducing the pricing and bookkeeping fee rates for these funds; (v) reducing the maximum transfer agency fee rates on high income funds and certain equity funds; (vi) proposing amended management contracts that, if approved by shareholders, will add a performance adjustment component to the management fees paid by 18 Fidelity Advisor equity funds; (vii) contractually agreeing to reduce fees for Ultra-Short Central Fund and the money market Central Funds; (viii) waiving the Fidelity Advisor funds' contingent deferred sales charge on certain redemptions made through systematic withdrawal programs; and (ix) amending the management contracts for equity and fixed-income funds whose management contracts incorporate a "group fee" structure by adding four new fee "breakpoints" to the group fee rate schedules.
Investment Performance and Compliance. The Board considered whether the fund has operated within its investment objective, as well as its record of compliance with its investment restrictions. It also reviewed the fund's absolute investment performance for each class, as well as the fund's relative investment performance for each class measured against a broad-based securities market index over multiple periods. The Board noted that FMR does not believe that a meaningful peer group exists against which to compare the fund's performance. Because the fund had been in existence less than five calendar years, the following charts considered by the Board show, over the one- and three-year periods ended December 31, 2006, the cumulative total returns of Initial Class and Service Class 2 of the fund and the cumulative total returns of a broad-based securities market index ("benchmark"). The returns of Initial Class and Service Class 2 show the performance of the highest and lowest performing classes, respectively (based on three-year performance).
VIP Real Estate Portfolio
The Board stated that the relative investment performance of Initial Class of the fund compared favorably to its benchmark for all the periods shown. The Board considered that the variations in performance among the fund's classes reflect the variations in class expenses, which result in lower performance for higher expense classes.
The Board considered that FMR has taken steps to refocus and strengthen equity research, equity portfolio management, and compliance.
Based on its review, and giving particular weight to the nature and quality of the resources dedicated by the Investment Advisers to maintain and improve relative performance, the Board concluded that the nature, extent, and quality of the services provided to the fund will benefit the fund's shareholders, particularly in light of the Board's view that the fund's shareholders benefit from investing in a fund that is part of a large family of funds offering a variety of investment disciplines and services.
Competitiveness of Management Fee and Total Fund Expenses. The Board considered the fund's management fee and total expenses compared to "mapped groups" of competitive funds and classes. Fidelity creates "mapped groups" by combining similar Lipper investment objective categories that have comparable management fee characteristics. Combining Lipper investment objective categories aids the Board's management fee and total expense comparisons by broadening the competitive group used for comparison and by reducing the number of universes to which various Fidelity funds are compared. The Board also considered supplemental information about how the fund's management fee and total expenses ranked relative to groups based on Lipper classifications, which take into account a fund's market capitalization and style.
Annual Report
The Board considered two proprietary management fee comparisons for the 12-month (or shorter) periods shown in the chart below. The group of Lipper funds used by the Board for management fee comparisons is referred to below as the "Total Mapped Group." The Total Mapped Group comparison focuses on a fund's standing relative to the total universe of comparable funds available to investors, in terms of gross management fees before expense reimbursements or caps. "TMG %" represents the percentage of funds in the Total Mapped Group that had management fees that were lower than the fund's. For example, a TMG % of 9% means that 91% of the funds in the Total Mapped Group had higher management fees than the fund. The "Asset-Size Peer Group" (ASPG) comparison focuses on a fund's standing relative to non-Fidelity funds similar in size to the fund within the Total Mapped Group. The ASPG represents at least 15% of the funds in the Total Mapped Group with comparable asset size and management fee characteristics, subject to a minimum of 50 funds (or all funds in the Total Mapped Group if fewer than 50). Additional information, such as the ASPG quartile in which the fund's management fee ranked, is also included in the chart and considered by the Board.
VIP Real Estate Portfolio
The Board noted that the fund's management fee ranked below the median of its Total Mapped Group and below the median of its ASPG for 2006.
Based on its review, the Board concluded that the fund's management fee was fair and reasonable in light of the services that the fund receives and the other factors considered.
In its review of each class's total expenses, the Board considered the fund's management fee as well as other fund or class expenses, as applicable, such as transfer agent fees, pricing and bookkeeping fees, fund-paid 12b-1 fees, and custodial, legal, and audit fees. The Board also noted the effects of any waivers and reimbursements on fees and expenses. As part of its review, the Board also considered current and historical total expenses of each class of the fund compared to competitive fund median expenses. Each class of the fund is compared to those funds and classes in the Total Mapped Group (used by the Board for management fee comparisons) that have a similar sales load structure.
The Board noted that the total expenses of each class ranked below its competitive median for 2006.
In its review of total expenses, the Board also considered Fidelity fee structures and other information on clients that FMR and its affiliates service in other competitive markets, such as other mutual funds advised or subadvised by FMR or its affiliates, pension plan clients, and other institutional clients.
Based on its review, the Board concluded that the total expenses of each class of the fund were reasonable in light of the services that the fund and its shareholders receive and the other factors considered.
Costs of the Services and Profitability. The Board considered the revenues earned and the expenses incurred by Fidelity in conducting the business of developing, marketing, distributing, managing, administering and servicing the fund and its shareholders. The Board also considered the level of Fidelity's profits in respect of all the Fidelity funds.
Annual Report
Board Approval of Investment Advisory Contracts and Management Fees - continued
On an annual basis, FMR presents to the Board Fidelity's profitability for the fund. Fidelity calculates the profitability for each fund, as well as aggregate profitability for groups of Fidelity funds and all Fidelity funds, using a series of detailed revenue and cost allocation methodologies which originate with the audited books and records of Fidelity. The Audit Committee of the Board reviews any significant changes from the prior year's methodologies.
PricewaterhouseCoopers LLP (PwC), independent registered public accounting firm and auditor to Fidelity and certain Fidelity funds, has been engaged annually by the Board as part of the Board's assessment of the results of Fidelity's profitability analysis. PwC's engagement includes the review and assessment of Fidelity's methodologies used in determining the revenues and expenses attributable to Fidelity's mutual fund business, and completion of agreed-upon procedures surrounding the mathematical accuracy of fund profitability and its conformity to allocation methodologies. After considering PwC's reports issued under the engagement and information provided by Fidelity, the Board believes that while other allocation methods may also be reasonable, Fidelity's profitability methodologies are reasonable in all material respects.
The Board has also reviewed Fidelity's non-fund businesses and any fall-out benefits related to the mutual fund business as well as cases where Fidelity's affiliates may benefit from or be related to the fund's business.
The Board considered the costs of the services provided by and the profits realized by Fidelity in connection with the operation of the fund and determined that the amount of profit is a fair entrepreneurial profit for the management of the fund.
Economies of Scale. The Board considered whether there have been economies of scale in respect of the management of the Fidelity funds, whether the Fidelity funds (including the fund) have appropriately benefited from any such economies of scale, and whether there is potential for realization of any further economies of scale. The Board considered the extent to which the fund will benefit from economies of scale through increased services to the fund, through waivers or reimbursements, or through fee or expense reductions.
The Board recognized that the fund's management contract incorporates a "group fee" structure, which provides for lower group fee rates as total fund assets under FMR's management increase, and for higher group fee rates as total fund assets under FMR's management decrease. FMR determines the group fee rates based on a tiered asset "breakpoint" schedule. In connection with the renewal of the fund's management contract, the Board approved amendments to the fund's management contract that added four new fee breakpoints to the group fee rate schedule for assets under FMR's management above $1,386 billion. The Board considered that the group fee rate declines under both the present and amended schedules, but that under the amended schedule, the group fee rate declines faster as assets under FMR's management exceed $1,386 billion. The Board considered that the group fee is designed to deliver the benefits of economies of scale to fund shareholders when total fund assets increase, even if assets of any particular fund are unchanged or have declined, because some portion of Fidelity's costs are attributable to services provided to all Fidelity funds, and all funds benefit if those costs can be allocated among more assets. The Board concluded that, given the group fee structure, fund shareholders will achieve a certain level of economies of scale as assets under FMR's management increase at the fund complex level, regardless of whether Fidelity achieves any such economies of scale.
The Board further concluded that any potential economies of scale are being shared between fund shareholders and Fidelity in an appropriate manner.
Additional Information Requested by the Board. In order to develop fully the factual basis for consideration of the Fidelity funds' Advisory Contracts, the Board requested and received additional information on several topics, including (i) fund performance trends and actions to be taken by FMR to improve certain funds' overall performance; (ii) Fidelity's portfolio manager compensation structure, including its effects on fund profitability and the extent to which portfolio manager compensation is linked to fund performance; (iii) Fidelity's fee structures; (iv) the funds' sub-advisory arrangements; and (v) accounts managed by Fidelity other than the Fidelity funds.
Based on its evaluation of all of the conclusions noted above, and after considering all material factors, the Board ultimately concluded that the advisory fee structures are fair and reasonable, and that the fund's Advisory Contracts should be renewed.
Annual Report
Annual Report
Annual Report
Annual Report
Investment Adviser
Fidelity Management & Research Company
Boston, MA
Investment Sub-Advisers
FMR Co., Inc.
Fidelity Management & Research (U.K.) Inc.
Fidelity Research & Analysis Company
Fidelity Investments Japan Limited
Fidelity International Investment Advisors
Fidelity International Investment Advisors (U.K.) Ltd.
General Distributor
Fidelity Distributors Corporation
Boston, MA
Transfer and Service Agents
Fidelity Investments Institutional Operations Company, Inc.
Boston, MA
Fidelity Service Company, Inc.
Boston, MA
Custodian
Mellon Bank, N.A.
Pittsburgh, PA
VIPRE-ANN-0208
1.781992.105
Fidelity® Variable Insurance Products:
Technology Portfolio
Annual Report
December 31, 2007
(2_fidelity_logos) (Registered_Trademark)
Contents
Performance | <Click Here> | How the fund has done over time. |
Management's Discussion | <Click Here> | The manager's review of fund performance, strategy and outlook. |
Shareholder Expense Example | <Click Here> | An example of shareholder expenses. |
Investment Changes | <Click Here> | A summary of major shifts in the fund's investments over the past six months. |
Investments | <Click Here> | A complete list of the fund's investments with their
market values. |
Financial Statements | <Click Here> | Statements of assets and liabilities, operations, and
changes in net assets, as well as financial highlights. |
Notes | <Click Here> | Notes to the financial statements. |
Report of Independent Registered Public Accounting Firm | <Click Here> | |
Trustees and Officers | <Click Here> | |
Distributions | <Click Here> | |
Board Approval of Investment Advisory Contracts and Management Fees | <Click Here> | |
| | |
To view a fund's proxy voting guidelines and proxy voting record for the 12-month period ended June 30, visit http://www.fidelity.com (search for "proxy voting guidelines") or visit the Securities and Exchange Commission's (SEC) web site at http://www.sec.gov. You may also call 1-877-208-0098 to request a free copy of the proxy voting guidelines.
Fidelity Variable Insurance Products are separate account options which are purchased through a variable insurance contract.
Standard & Poor's, S&P and S&P 500 are registered service marks of The McGraw-Hill Companies, Inc. and have been licensed for use by Fidelity Distributors Corporation.
Other third party marks appearing herein are the property of their respective owners.
All other marks appearing herein are registered or unregistered trademarks or service marks of FMR LLC or an affiliated company.
This report and the financial statements contained herein are submitted for the general information of the shareholders of the fund. This report is not authorized for distribution to prospective investors in the fund unless preceded or accompanied by an effective prospectus.
The fund files its complete schedule of portfolio holdings with the SEC for the first and third quarters of each fiscal year on Form N-Q. Forms N-Q are available on the SEC's web site at http://www.sec.gov. The fund's Forms N-Q may be reviewed and copied at the SEC's Public Reference Room in Washington, DC. Information regarding the operation of the SEC's Public Reference Room may be obtained by calling 1-800-SEC-0330. For a complete list of the fund's portfolio holdings, view the most recent holdings listing, semiannual report, or annual report on Fidelity's web site at http://www.fidelity.com or http://www.advisor.fidelity.com, as applicable.
NOT FDIC INSURED · MAY LOSE VALUE · NO BANK GUARANTEE
Neither the fund nor Fidelity Distributors Corporation is a bank.
Annual Report
Performance: The Bottom Line
Average annual total return reflects the change in the value of an investment, assuming reinvestment of the class' dividend income and capital gains (the profits earned upon the sale of securities that have grown in value, if any) and assuming a constant rate of performance each year. During periods of reimbursement by Fidelity, a fund's total return will be greater than it would be had the reimbursement not occurred. Performance numbers are net of all underlying fund operating expenses, but do not include any insurance charges imposed by your insurance company's separate account. If performance information included the effect of these additional charges, the total returns would have been lower. How a fund did yesterday is no guarantee of how it will do tomorrow.
Average Annual Total Returns
Periods ended December 31, 2007 | Past 1
year | Past 5
years | Life of fund A |
VIP Technology - Initial Class | 15.36% | 17.22% | 4.11% |
VIP Technology - Investor Class B | 15.15% | 17.11% | 4.03% |
A From July 19, 2001.
B The initial offering of Investor Class shares took place on July 21, 2005. Returns prior to July 21, 2005 are those of Initial Class. If Investor Class's transfer agent fee had been reflected, returns prior to July 21, 2005 would have been lower.
$10,000 Over Life of Fund
Let's say hypothetically that $10,000 was invested in VIP Technology Portfolio - Initial Class on July 19, 2001, when the fund started. The chart shows how the value of your investment would have changed, and also shows how the Standard & Poor's 500SM Index (S&P 500®) performed over the same period.
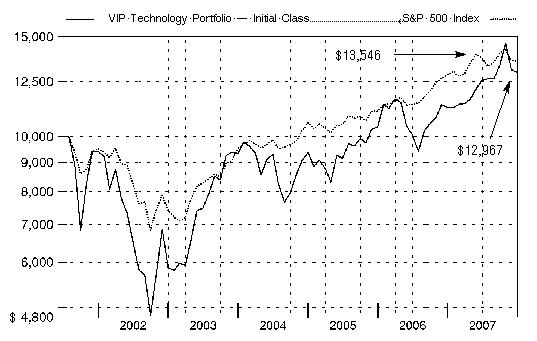
Annual Report
Management's Discussion of Fund Performance
Comments from Charlie Chai, Portfolio Manager of VIP Technology Portfolio
U.S. equity markets, as measured by the bellwether Dow Jones Industrial AverageSM and the Standard & Poor's 500SM Index, registered their fifth consecutive year of positive returns in 2007, as the Dow rose 8.88% and the S&P 500® index advanced 5.49%. The tech-heavy NASDAQ Composite® Index did even better, increasing 10.55%. However, credit- and recession-related concerns carved deeply into stock prices late in 2007, pushing some major market measures into negative territory for the year overall, particularly smaller-cap and value-oriented benchmarks. Based largely on a weak U.S. dollar that boosted returns for U.S. investors, the Morgan Stanley Capital InternationalSM Europe, Australasia, and Far East (MSCI® EAFE®) Index - a gauge of developed stock markets outside the United States and Canada - beat most domestic equity measures, gaining 11.33%. Several European countries had outstanding performance, including Finland and Germany, while Australia also did very well. However, fallout from the credit crunch and concerns about export growth tempered U.K. stocks, while fears that Japanese financial companies would become embroiled in the U.S. subprime mortgage crisis contributed to a loss of more than 4% for the Japanese portion of the index. The emerging-markets stock asset class soared 39.78% according to the MSCI Emerging Markets index. The U.S. investment-grade bond market climbed 6.97% as measured by the Lehman Brothers® U.S. Aggregate Index, beating the 2.53% gain for the Merrill Lynch® U.S. High Yield Master II Constrained Index. The emerging-markets bond category shook off a sluggish first half of 2007 to finish the year with a respectable gain of 6.28% as measured by the J.P. Morgan Emerging Markets Bond Index (EMBI) Global, while the Citigroup® Non-U.S. Group of 7 Index - representing the debt performance of major global economies, excluding the United States - rose 13.05%.
During the past year, the fund performed about in line with the 15.13% return of the Morgan Stanley Capital InternationalSM (MSCI®) US Investable Market Information Technology Index and topped the S&P 500. (For specific portfolio performance results, please refer to the performance section of this report.) Versus the MSCI index, the fund's results were aided by capable stock picking in the consumer electronics, application software, and electrical components and equipment groups. An overweighting in home entertainment software also helped. Additionally, given the fund's significant foreign exposure, the weak U.S. dollar benefited performance. Canada-based Research In Motion provided the largest boost to performance versus the index. The maker of the BlackBerry handheld messaging device continued to develop its core market of business users while rolling out new products aimed at the consumer market. Other contributors included Tele Atlas, a Dutch provider of digital map data, network equipment maker Juniper Networks and Canada's Sandvine, a provider of Internet traffic-monitoring equipment. Japan's Nintendo also helped. All the contributors I mentioned except for Juniper Networks were out-of-benchmark positions, and Tele Atlas was sold to lock in profits. Conversely, the fund's results were undermined significantly by unfavorable stock selection in the semiconductor space. From a capitalization perspective, our small-cap holdings were a drag on performance during a period in which investors grew increasingly defensive. Performance was hampered by Marvell Technology Group, a supplier of chips for both personal computers (PCs) and consumer electronics devices. The company reported a loss for its fiscal quarter ending October 27, 2007, and continued to restructure. The fund also was hurt by overweighting Advanced Micro Devices and underweighting its larger rival, Intel, both suppliers of chips to the PC market. The fund did not own Intel at period end. F5 Networks, a maker of software for application delivery networking, and South Korean handset component manufacturer Mogem, an out-of-benchmark position, also fared poorly.
The views expressed above reflect those of the portfolio manager(s) only through the end of the period as stated on the cover of this report and do not necessarily represent the views of Fidelity or any other person in the Fidelity organization. Any such views are subject to change at any time based upon market or other conditions and Fidelity disclaims any responsibility to update such views. These views may not be relied on as investment advice and, because investment decisions for a Fidelity fund are based on numerous factors, may not be relied on as an indication of trading intent on behalf of any Fidelity fund.
Annual Report
Shareholder Expense Example
As a shareholder of the Fund, you incur two types of costs: (1) transaction costs, including redemption fees, and (2) ongoing costs, including management fees and other Fund expenses. This Example is intended to help you understand your ongoing costs (in dollars) of investing in the Fund and to compare these costs with the ongoing costs of investing in other mutual funds.
The Example is based on an investment of $1,000 invested at the beginning of the period and held for the entire period (July 1, 2007 to December 31, 2007).
Actual Expenses
The first line of the accompanying table for each class of the Fund provides information about actual account values and actual expenses. You may use the information in this line, together with the amount you invested, to estimate the expenses that you paid over the period. Simply divide your account value by $1,000.00 (for example, an $8,600 account value divided by $1,000.00 = 8.6), then multiply the result by the number in the first line for a class of the Fund under the heading entitled "Expenses Paid During Period" to estimate the expenses you paid on your account during this period. The estimate of expenses does not include any fees or other expenses of any variable annuity or variable life insurance product. If they were, the estimate of expenses you paid during the period would be higher, and your ending account value would be lower. In addition, the Fund, as a shareholder in the underlying Fidelity Central Funds, will indirectly bear its pro rata share of the fees and expenses incurred by the underlying Fidelity Central Funds. These fees and expenses are not included in the Fund's annualized expense ratio used to calculate the expense estimate in the table below.
Hypothetical Example for Comparison Purposes
The second line of the accompanying table for each class of the Fund provides information about hypothetical account values and hypothetical expenses based on a Class' actual expense ratio and an assumed rate of return of 5% per year before expenses, which is not the Class' actual return. The hypothetical account values and expenses may not be used to estimate the actual ending account balance or expenses you paid for the period. You may use this information to compare the ongoing costs of investing in the Fund and other funds. To do so, compare this 5% hypothetical example with the 5% hypothetical examples that appear in the shareholder reports of the other funds. The estimate of expenses does not include any fees or other expenses of any variable annuity or variable life insurance product. If they were, the estimate of expenses you paid during the period would be higher, and your ending account value would be lower. In addition, the Fund, as a shareholder in the underlying Fidelity Central Funds, will indirectly bear its pro rata share of the fees and expenses incurred by the underlying Fidelity Central Funds. These fees and expenses are not included in the Fund's annualized expense ratio used to calculate the expense estimate in the table below.
Please note that the expenses shown in the table are meant to highlight your ongoing costs only and do not reflect any transaction costs. Therefore, the second line of the table is useful in comparing ongoing costs only, and will not help you determine the relative total costs of owning different funds. In addition, if these transactional costs were included, your costs would have been higher.
| Beginning
Account Value
July 1, 2007 | Ending
Account Value
December 31, 2007 | Expenses Paid
During Period*
July 1, 2007 to
December 31, 2007 |
Initial Class | | | |
Actual | $ 1,000.00 | $ 1,031.80 | $ 3.99 |
HypotheticalA | $ 1,000.00 | $ 1,021.27 | $ 3.97 |
Investor Class | | | |
Actual | $ 1,000.00 | $ 1,032.00 | $ 4.66 |
HypotheticalA | $ 1,000.00 | $ 1,020.62 | $ 4.63 |
A 5% return per year before expenses
* Expenses are equal to each Class' annualized expense ratio (shown in the table below); multiplied by the average account value over the period, multiplied by 184/365 (to reflect the one-half year period).
| Annualized
Expense Ratio |
Initial Class | .78% |
Investor Class | .91% |
Annual Report
Investment Changes
Top Ten Stocks as of December 31, 2007 |
| % of fund's
net assets | % of fund's net assets
6 months ago |
Apple, Inc. | 10.6 | 4.0 |
Cisco Systems, Inc. | 9.3 | 2.4 |
Google, Inc. Class A (sub. vtg.) | 6.5 | 5.9 |
Nintendo Co. Ltd. | 6.1 | 1.0 |
Marvell Technology Group Ltd. | 3.6 | 5.3 |
Research In Motion Ltd. | 3.1 | 2.3 |
Juniper Networks, Inc. | 3.1 | 2.3 |
F5 Networks, Inc. | 2.1 | 1.0 |
Nokia Corp. sponsored ADR | 2.1 | 0.5 |
New Oriental Education & Technology Group, Inc. sponsored ADR | 1.4 | 0.0 |
| 47.9 | |
Top Industries (% of fund's net assets) |
As of December 31, 2007 |
| Communications Equipment | 28.3% | |
| Semiconductors & Semiconductor Equipment | 18.3% | |
| Computers & Peripherals | 15.3% | |
| Software | 14.6% | |
| Internet Software & Services | 10.0% | |
| All Others* | 13.5% | |

|
As of June 30, 2007 |
| Semiconductors & Semiconductor Equipment | 30.7% | |
| Communications Equipment | 24.2% | |
| Computers & Peripherals | 12.4% | |
| Software | 11.6% | |
| Internet Software & Services | 9.9% | |
| All Others* | 11.2% | |

* Includes short-term investments and net other assets. |
Annual Report
Investments December 31, 2007
Showing Percentage of Net Assets
Common Stocks - 99.6% |
| Shares | | Value |
COMMERCIAL SERVICES & SUPPLIES - 0.4% |
Diversified Commercial & Professional Services - 0.2% |
China Security & Surveillance Technology, Inc. (a)(d) | 8,300 | | $ 181,272 |
Human Resource & Employment Services - 0.2% |
Kenexa Corp. (a) | 11,500 | | 223,330 |
TOTAL COMMERCIAL SERVICES & SUPPLIES | | 404,602 |
COMMUNICATIONS EQUIPMENT - 28.1% |
Communications Equipment - 28.1% |
Adtran, Inc. | 11,200 | | 239,456 |
ADVA AG Optical Networking (a) | 58,503 | | 291,997 |
Airvana, Inc. | 29,587 | | 160,657 |
Aruba Networks, Inc. | 900 | | 13,419 |
AudioCodes Ltd. (a) | 66,150 | | 334,719 |
Balda AG (a)(d) | 15,400 | | 204,520 |
Blue Coat Systems, Inc. (a) | 6,907 | | 227,033 |
Ciena Corp. (a) | 12,000 | | 409,320 |
Cisco Systems, Inc. (a) | 360,100 | | 9,747,907 |
CommScope, Inc. (a) | 1,600 | | 78,736 |
Comtech Group, Inc. (a) | 18,099 | | 291,575 |
Comverse Technology, Inc. (a) | 43,370 | | 748,133 |
CyberTAN Technology, Inc. | 30,000 | | 59,574 |
Delta Networks, Inc. | 195,000 | | 64,774 |
F5 Networks, Inc. (a) | 77,426 | | 2,208,190 |
Finisar Corp. (a) | 88,129 | | 127,787 |
Foundry Networks, Inc. (a) | 18,900 | | 331,128 |
Foxconn International Holdings Ltd. (a) | 342,000 | | 767,593 |
Harris Stratex Networks, Inc. Class A (a) | 22,600 | | 377,420 |
Infinera Corp. | 14,400 | | 213,696 |
Juniper Networks, Inc. (a) | 98,896 | | 3,283,347 |
Mogem Co. Ltd. | 31,554 | | 144,944 |
Nokia Corp. sponsored ADR | 56,200 | | 2,157,518 |
Optium Corp. (a)(d) | 19,700 | | 155,236 |
Powerwave Technologies, Inc. (a) | 115,000 | | 463,450 |
RADWARE Ltd. (a) | 9,303 | | 143,266 |
Research In Motion Ltd. (a) | 28,990 | | 3,287,466 |
Riverbed Technology, Inc. (a) | 17,900 | | 478,646 |
SIM Technology Group | 632,000 | | 145,090 |
Sonus Networks, Inc. (a)(d) | 232,200 | | 1,353,726 |
Starent Networks Corp. | 60,088 | | 1,096,606 |
| | 29,606,929 |
COMPUTERS & PERIPHERALS - 15.3% |
Computer Hardware - 12.7% |
3PAR, Inc. | 800 | | 10,240 |
Apple, Inc. (a) | 56,245 | | 11,141,006 |
Foxconn Technology Co. Ltd. | 14,000 | | 113,969 |
Hewlett-Packard Co. | 11,800 | | 595,664 |
|
| Shares | | Value |
High Tech Computer Corp. | 73,500 | | $ 1,357,586 |
Palm, Inc. | 22,600 | | 143,284 |
| | 13,361,749 |
Computer Storage & Peripherals - 2.6% |
ASUSTeK Computer, Inc. | 149,178 | | 448,040 |
Brocade Communications Systems, Inc. (a) | 47,700 | | 350,118 |
China Digital TV Holding Co. Ltd. ADR | 200 | | 5,396 |
Data Domain, Inc. | 300 | | 7,902 |
EMC Corp. (a) | 40,600 | | 752,318 |
Innolux Display Corp. | 80,235 | | 272,151 |
Netezza Corp. | 26,700 | | 368,460 |
Network Appliance, Inc. (a) | 20,100 | | 501,696 |
| | 2,706,081 |
TOTAL COMPUTERS & PERIPHERALS | | 16,067,830 |
DIVERSIFIED CONSUMER SERVICES - 1.4% |
Education Services - 1.4% |
New Oriental Education & Technology Group, Inc. sponsored ADR (a) | 18,300 | | 1,474,797 |
ELECTRICAL EQUIPMENT - 3.8% |
Electrical Components & Equipment - 3.8% |
First Solar, Inc. (a) | 4,400 | | 1,175,416 |
General Cable Corp. (a) | 1,100 | | 80,608 |
JA Solar Holdings Co. Ltd. ADR | 14,200 | | 991,302 |
Neo-Neon Holdings Ltd. | 658,000 | | 656,557 |
Q-Cells AG (a) | 200 | | 28,487 |
Suntech Power Holdings Co. Ltd. sponsored ADR (a) | 11,100 | | 913,752 |
Superior Essex, Inc. (a) | 5,660 | | 135,840 |
| | 3,981,962 |
ELECTRONIC EQUIPMENT & INSTRUMENTS - 2.2% |
Electronic Equipment & Instruments - 0.8% |
Chi Mei Optoelectronics Corp. | 150,080 | | 210,566 |
Chunghwa Picture Tubes LTD. (a) | 514,000 | | 178,307 |
Cyntec Co. Ltd. | 45,076 | | 66,301 |
ENE Technology, Inc. | 7,000 | | 23,851 |
Gia Tzoong Enterprise Co. Ltd. (a) | 300,000 | | 148,936 |
Motech Industries, Inc. GDR (a)(e) | 8,482 | | 77,815 |
TXC Corp. | 57,000 | | 100,361 |
| | 806,137 |
Electronic Manufacturing Services - 0.4% |
SMART Modular Technologies (WWH), Inc. (a) | 12,138 | | 123,565 |
Trimble Navigation Ltd. (a) | 10,400 | | 314,496 |
| | 438,061 |
Technology Distributors - 1.0% |
Ingram Micro, Inc. Class A (a) | 15,500 | | 279,620 |
Common Stocks - continued |
| Shares | | Value |
ELECTRONIC EQUIPMENT & INSTRUMENTS - CONTINUED |
Technology Distributors - continued |
Mellanox Technologies Ltd. | 25,300 | | $ 460,966 |
Mingyuan Medicare Development Co. Ltd. | 2,200,000 | | 321,658 |
| | 1,062,244 |
TOTAL ELECTRONIC EQUIPMENT & INSTRUMENTS | | 2,306,442 |
HEALTH CARE EQUIPMENT & SUPPLIES - 1.4% |
Health Care Equipment - 1.4% |
Mindray Medical International Ltd. sponsored ADR | 33,600 | | 1,443,792 |
Health Care Supplies - 0.0% |
Shandong Weigao Group Medical Polymer Co. Ltd. (H Shares) | 12,000 | | 27,703 |
TOTAL HEALTH CARE EQUIPMENT & SUPPLIES | | 1,471,495 |
HEALTH CARE PROVIDERS & SERVICES - 0.0% |
Health Care Services - 0.0% |
athenahealth, Inc. | 100 | | 3,600 |
HOTELS, RESTAURANTS & LEISURE - 2.1% |
Hotels, Resorts & Cruise Lines - 2.1% |
Ctrip.com International Ltd. sponsored ADR | 21,700 | | 1,247,099 |
Home Inns & Hotels Management, Inc. ADR (a) | 26,300 | | 937,332 |
| | 2,184,431 |
HOUSEHOLD DURABLES - 1.0% |
Consumer Electronics - 1.0% |
Directed Electronics, Inc. (a) | 8,772 | | 14,562 |
Garmin Ltd. | 4,900 | | 475,300 |
Harman International Industries, Inc. | 2,300 | | 169,533 |
TomTom Group BV (a) | 4,800 | | 360,764 |
| | 1,020,159 |
INTERNET SOFTWARE & SERVICES - 10.0% |
Internet Software & Services - 10.0% |
Akamai Technologies, Inc. (a) | 21,800 | | 754,280 |
Alibaba.com Ltd. | 95,500 | | 338,661 |
DealerTrack Holdings, Inc. (a) | 1,500 | | 50,205 |
Equinix, Inc. (a) | 2,600 | | 262,782 |
Google, Inc. Class A (sub. vtg.) (a) | 9,850 | | 6,811,078 |
Greenfield Online, Inc. (a) | 10,300 | | 150,483 |
LivePerson, Inc. (a) | 38,900 | | 207,726 |
Move, Inc. (a) | 25,400 | | 62,230 |
Omniture, Inc. (a) | 21,300 | | 709,077 |
Tencent Holdings Ltd. | 72,000 | | 545,280 |
ValueClick, Inc. (a) | 12,138 | | 265,822 |
Visual Sciences, Inc. (a) | 17,277 | | 319,279 |
| | 10,476,903 |
|
| Shares | | Value |
IT SERVICES - 0.8% |
Data Processing & Outsourced Services - 0.4% |
ExlService Holdings, Inc. (a) | 9,300 | | $ 214,644 |
WNS Holdings Ltd. ADR (a) | 10,000 | | 163,500 |
| | 378,144 |
IT Consulting & Other Services - 0.4% |
RightNow Technologies, Inc. (a) | 22,352 | | 354,279 |
Satyam Computer Services Ltd. sponsored ADR | 4,600 | | 122,912 |
| | 477,191 |
TOTAL IT SERVICES | | 855,335 |
MACHINERY - 0.2% |
Industrial Machinery - 0.2% |
Hi-P International Ltd. | 441,000 | | 146,852 |
Shin Zu Shing Co. Ltd. | 11,250 | | 69,033 |
| | 215,885 |
MEDIA - 0.0% |
Publishing - 0.0% |
Gemstar-TV Guide International, Inc. (a) | 178 | | 847 |
SEMICONDUCTORS & SEMICONDUCTOR EQUIPMENT - 18.3% |
Semiconductor Equipment - 3.0% |
Applied Materials, Inc. | 28,900 | | 513,264 |
Global Unichip Corp. | 43,317 | | 293,188 |
LTX Corp. (a) | 43,300 | | 137,694 |
MEMSIC, Inc. | 7,800 | | 79,014 |
Tessera Technologies, Inc. (a) | 26,200 | | 1,089,920 |
Varian Semiconductor Equipment Associates, Inc. (a) | 30,100 | | 1,113,700 |
| | 3,226,780 |
Semiconductors - 15.3% |
Advanced Analog Technology, Inc. | 48,260 | | 200,897 |
Advanced Micro Devices, Inc. (a)(d) | 99,164 | | 743,730 |
Altera Corp. | 27,300 | | 527,436 |
Anpec Electronics Corp. | 33,509 | | 74,189 |
Applied Micro Circuits Corp. (a) | 22,200 | | 194,028 |
Atheros Communications, Inc. (a) | 14,200 | | 433,668 |
Atmel Corp. (a) | 58,300 | | 251,856 |
AuthenTec, Inc. | 17,800 | | 258,634 |
Bright Led Electronics Corp. | 22,000 | | 55,560 |
Broadcom Corp. Class A (a) | 44,677 | | 1,167,857 |
Cavium Networks, Inc. | 45,091 | | 1,037,995 |
Conexant Systems, Inc. (a) | 225,919 | | 187,513 |
Cypress Semiconductor Corp. (a) | 25,000 | | 900,750 |
Diodes, Inc. (a) | 3,300 | | 99,231 |
Elan Microelectronics Corp. | 20,000 | | 39,223 |
Epistar Corp. | 236,200 | | 1,012,390 |
Faraday Technology Corp. | 30,000 | | 67,068 |
Formosa Epitaxy, Inc. (a) | 148,000 | | 146,038 |
Global Mixed-mode Technology, Inc. | 44,600 | | 292,245 |
Common Stocks - continued |
| Shares | | Value |
SEMICONDUCTORS & SEMICONDUCTOR EQUIPMENT - CONTINUED |
Semiconductors - continued |
Hittite Microwave Corp. (a) | 9,000 | | $ 429,840 |
Lanoptics Ltd. (a) | 10,700 | | 195,917 |
Marvell Technology Group Ltd. (a) | 268,400 | | 3,752,232 |
Maxim Integrated Products, Inc. | 5,000 | | 132,400 |
MediaTek, Inc. | 10,000 | | 129,818 |
Microchip Technology, Inc. | 11,100 | | 348,762 |
Mindspeed Technologies, Inc. (a) | 396,610 | | 483,864 |
MoSys, Inc. (a) | 3,300 | | 16,005 |
Omnivision Technologies, Inc. (a) | 41,400 | | 647,910 |
PLX Technology, Inc. (a) | 4,600 | | 42,780 |
PMC-Sierra, Inc. (a) | 45,900 | | 300,186 |
Powertech Technology, Inc. | 73,000 | | 259,991 |
Richtek Technology Corp. | 68,950 | | 622,953 |
Spreadtrum Communications, Inc. ADR (d) | 1,200 | | 14,712 |
Supertex, Inc. (a) | 12,268 | | 383,866 |
Taiwan Semiconductor Co. Ltd. | 61,000 | | 91,698 |
Taiwan Semiconductor Manufacturing Co. Ltd. | 414 | | 791 |
Xilinx, Inc. | 23,700 | | 518,319 |
| | 16,062,352 |
TOTAL SEMICONDUCTORS & SEMICONDUCTOR EQUIPMENT | | 19,289,132 |
SOFTWARE - 14.6% |
Application Software - 3.5% |
Ansys, Inc. (a) | 8,200 | | 339,972 |
BladeLogic, Inc. | 3,600 | | 106,452 |
Callidus Software, Inc. (a) | 54,919 | | 283,931 |
Concur Technologies, Inc. (a) | 7,800 | | 282,438 |
Global Digital Creations Holdings Ltd. (a) | 1,048,000 | | 228,495 |
Longtop Financial Technologies Ltd. ADR | 15,200 | | 359,936 |
Mentor Graphics Corp. (a) | 8,700 | | 93,786 |
Salesforce.com, Inc. (a) | 18,400 | | 1,153,496 |
Smith Micro Software, Inc. (a) | 55,200 | | 467,544 |
SuccessFactors, Inc. | 700 | | 8,274 |
Ulticom, Inc. (a) | 41,093 | | 328,744 |
| | 3,653,068 |
Home Entertainment Software - 8.3% |
Activision, Inc. (a) | 29,100 | | 864,270 |
Gameloft (a) | 32,800 | | 287,210 |
Nintendo Co. Ltd. | 10,800 | | 6,397,920 |
Take-Two Interactive Software, Inc. (a)(d) | 45,000 | | 830,250 |
THQ, Inc. (a) | 14,400 | | 405,936 |
| | 8,785,586 |
|
| Shares | | Value |
Systems Software - 2.8% |
Allot Communications Ltd. | 78,200 | | $ 379,270 |
Moldflow Corp. (a) | 9,600 | | 154,656 |
Sandvine Corp. (a) | 132,100 | | 507,898 |
Sandvine Corp. (U.K.) (a) | 109,688 | | 430,419 |
VMware, Inc. Class A (d) | 17,000 | | 1,444,830 |
| | 2,917,073 |
TOTAL SOFTWARE | | 15,355,727 |
TOTAL COMMON STOCKS (Cost $98,467,357) | 104,716,076 |
Convertible Bonds - 0.2% |
| Principal Amount | | |
COMMUNICATIONS EQUIPMENT - 0.2% |
Communications Equipment - 0.2% |
Ciena Corp. 0.25% 5/1/13
(Cost $157,875) | $ 150,000 | | 153,739 |
Money Market Funds - 3.1% |
| Shares | | |
Fidelity Cash Central Fund, 4.58% (b) | 1,012,015 | | 1,012,015 |
Fidelity Securities Lending Cash Central Fund, 4.65% (b)(c) | 2,276,980 | | 2,276,980 |
TOTAL MONEY MARKET FUNDS (Cost $3,288,995) | 3,288,995 |
TOTAL INVESTMENT
PORTFOLIO - 102.9% (Cost $101,914,227) | | 108,158,810 |
NET OTHER ASSETS - (2.9)% | | (3,004,234) |
NET ASSETS - 100% | $ 105,154,576 |
Legend |
(a) Non-income producing |
(b) Affiliated fund that is available only to investment companies and other accounts managed by Fidelity Investments. The rate quoted is the annualized seven-day yield of the fund at period end. A complete unaudited listing of the fund's holdings as of its most recent quarter end is available upon request. |
(c) Investment made with cash collateral received from securities on loan. |
(d) Security or a portion of the security is on loan at period end. |
(e) Security exempt from registration under Rule 144A of the Securities Act of 1933. These securities may be resold in transactions exempt from registration, normally to qualified institutional buyers. At the end of the period, the value of these securities amounted to $77,815 or 0.1% of net assets. |
Affiliated Central Funds |
Information regarding fiscal year to date income earned by the Fund from investments in Fidelity Central Funds is as follows: |
Fund | Income earned |
Fidelity Cash Central Fund | $ 82,011 |
Fidelity Securities Lending Cash Central Fund | 40,900 |
Total | $ 122,911 |
Distribution of investments by country of issue, as a percentage of total net assets, is as follows: |
United States of America | 64.5% |
Cayman Islands | 8.5% |
Taiwan | 6.3% |
Japan | 6.1% |
Bermuda | 4.2% |
Canada | 4.0% |
Finland | 2.1% |
Israel | 1.4% |
China | 1.4% |
Others (individually less than 1%) | 1.5% |
| 100.0% |
See accompanying notes which are an integral part of the financial statements.
Annual Report
Financial Statements
Statement of Assets and Liabilities
| December 31, 2007 |
Assets | | |
Investment in securities, at value
(including securities loaned of $2,243,104) -
See accompanying schedule: Unaffiliated issuers
(cost $98,625,232) | $ 104,869,815 | |
Fidelity Central Funds
(cost $3,288,995) | 3,288,995 | |
Total Investments
(cost $101,914,227) | | $ 108,158,810 |
Receivable for investments sold | | 234,804 |
Receivable for fund shares sold | | 130,204 |
Dividends receivable | | 2,999 |
Interest receivable | | 62 |
Distributions receivable from Fidelity Central Funds | | 9,723 |
Prepaid expenses | | 330 |
Other receivables | | 6,690 |
Total assets | | 108,543,622 |
| | |
Liabilities | | |
Payable for investments purchased | $ 941,477 | |
Payable for fund shares redeemed | 67,852 | |
Accrued management fee | 48,996 | |
Other affiliated payables | 12,493 | |
Other payables and accrued
expenses | 41,248 | |
Collateral on securities loaned,
at value | 2,276,980 | |
Total liabilities | | 3,389,046 |
| | |
Net Assets | | $ 105,154,576 |
Net Assets consist of: | | |
Paid in capital | | $ 86,852,089 |
Accumulated undistributed net realized gain (loss) on investments and foreign currency transactions | | 12,058,882 |
Net unrealized appreciation (depreciation) on investments and assets and liabilities in foreign currencies | | 6,243,605 |
Net Assets | | $ 105,154,576 |
Statement of Assets and Liabilities - continued
| December 31, 2007 |
Initial Class:
Net Asset Value, offering price and redemption price per share ($70,787,657 ÷ 6,424,959 shares) | | $ 11.02 |
| | |
Investor Class:
Net Asset Value, offering price and redemption price per share ($34,366,919 ÷ 3,133,297 shares) | | $ 10.97 |
See accompanying notes which are an integral part of the financial statements.
Annual Report
Financial Statements - continued
Statement of Operations
| Year ended December 31, 2007 |
Investment Income | | |
Dividends | | $ 174,392 |
Interest | | 110 |
Income from Fidelity Central Funds (including $40,900 from security lending) | | 122,911 |
Total income | | 297,413 |
| | |
Expenses | | |
Management fee | $ 465,797 | |
Transfer agent fees | 87,482 | |
Accounting and security lending fees | 33,234 | |
Custodian fees and expenses | 52,743 | |
Independent trustees' compensation | 284 | |
Audit | 40,263 | |
Legal | 624 | |
Miscellaneous | 21,617 | |
Total expenses before reductions | 702,044 | |
Expense reductions | (11,731) | 690,313 |
Net investment income (loss) | | (392,900) |
Realized and Unrealized Gain (Loss) Net realized gain (loss) on: | | |
Investment securities: | | |
Unaffiliated issuers | 13,167,497 | |
Foreign currency transactions | (14,166) | |
Total net realized gain (loss) | | 13,153,331 |
Change in net unrealized appreciation (depreciation) on: Investment securities | (3,983,820) | |
Assets and liabilities in foreign currencies | (1,007) | |
Total change in net unrealized appreciation (depreciation) | | (3,984,827) |
Net gain (loss) | | 9,168,504 |
Net increase (decrease) in net assets resulting from operations | | $ 8,775,604 |
Statement of Changes in Net Assets
| Year ended
December 31,
2007 | Year ended
December 31,
2006 |
Increase (Decrease) in Net Assets | | |
Operations | | |
Net investment income (loss) | $ (392,900) | $ (383,761) |
Net realized gain (loss) | 13,153,331 | 6,380,391 |
Change in net unrealized appreciation (depreciation) | (3,984,827) | (755,167) |
Net increase (decrease) in net assets resulting from operations | 8,775,604 | 5,241,463 |
Distributions to shareholders from net realized gain | (6,094,577) | (7,082,577) |
Share transactions - net increase (decrease) | 21,800,349 | (2,276,220) |
Redemption fees | 44,921 | 45,151 |
Total increase (decrease) in net assets | 24,526,297 | (4,072,183) |
| | |
Net Assets | | |
Beginning of period | 80,628,279 | 84,700,462 |
End of period | $ 105,154,576 | $ 80,628,279 |
See accompanying notes which are an integral part of the financial statements.
Annual Report
Financial Highlights - Initial Class
Years ended December 31, | 2007 | 2006 | 2005 | 2004 | 2003 |
Selected Per-Share Data | | | | | |
Net asset value, beginning of period | $ 10.37 | $ 10.35 | $ 9.37 | $ 9.33 | $ 5.86 |
Income from Investment Operations | | | | | |
Net investment income (loss) C | (.05) | (.04) | (.02) | .02 F | (.03) |
Net realized and unrealized gain (loss) | 1.52 | .88 | 1.04 | .01 | 3.49 |
Total from investment operations | 1.47 | .84 | 1.02 | .03 | 3.46 |
Distributions from net investment income | - | - | (.04) | - | - |
Distributions from net realized gain | (.83) | (.83) | - | - | - |
Total distributions | (.83) | (.83) | (.04) | - | - |
Redemption fees added to paid in capital C | .01 | .01 | - H | .01 | .01 |
Net asset value, end of period | $ 11.02 | $ 10.37 | $ 10.35 | $ 9.37 | $ 9.33 |
Total Return A,B | 15.36% | 8.19% | 10.88% | .43% | 59.22% |
Ratios to Average Net Assets D,G | | | | | |
Expenses before reductions | .81% | .80% | .79% | .75% | .83% |
Expenses net of fee waivers, if any | .81% | .80% | .79% | .75% | .83% |
Expenses net of all reductions | .79% | .77% | .62% | .68% | .75% |
Net investment income (loss) | (.44)% | (.43)% | (.24)% | .24% | (.34)% |
Supplemental Data | | | | | |
Net assets, end of period (000 omitted) | $ 70,788 | $ 64,689 | $ 78,892 | $ 116,831 | $ 167,274 |
Portfolio turnover rate E | 213% | 269% | 249% | 118% | 129% |
A Total returns do not reflect charges attributable to your insurance company's separate account. Inclusion of these charges would reduce the total returns shown.
B Total returns would have been lower had certain expenses not been reduced during the periods shown.
C Calculated based on average shares outstanding during the period.
D Fees and expenses of the underlying Fidelity Central Funds are not included in the Fund's expense ratio. The Fund indirectly bears its proportionate share of the expenses of any underlying Fidelity Central Funds.
E Amount does not include the portfolio activity of any underlying Fidelity Central Funds.
F Investment income per share reflects a special dividend which amounted to $.06 per share.
G Expense ratios reflect operating expenses of the class. Expenses before reductions do not reflect amounts reimbursed by the investment adviser or reductions from brokerage service arrangements or other expense offset arrangements and do not represent the amount paid by the class during periods when reimbursements or reductions occur. Expenses net of fee waivers reflect expenses after reimbursement by the investment adviser but prior to reductions from brokerage service arrangements or other expense offset arrangements. Expenses net of all reductions represent the net expenses paid by the class.
H Amount represents less than $.01 per share.
Financial Highlights - Investor Class
Years ended December 31, | 2007 | 2006 | 2005 H |
Selected Per-Share Data | | | |
Net asset value, beginning of period | $ 10.34 | $ 10.33 | $ 9.71 |
Income from Investment Operations | | | |
Net investment income (loss) E | (.06) | (.06) | (.02) |
Net realized and unrealized gain (loss) | 1.50 | .89 | .64 |
Total from investment operations | 1.44 | .83 | .62 |
Distributions from net realized gain | (.82) | (.83) | - |
Redemption fees added to paid in capital E | .01 | .01 | - J |
Net asset value, end of period | $ 10.97 | $ 10.34 | $ 10.33 |
Total Return B,C,D | 15.15% | 8.10% | 6.39% |
Ratios to Average Net Assets F,I | | | |
Expenses before reductions | .93% | .93% | .97% A |
Expenses net of fee waivers, if any | .93% | .93% | .97% A |
Expenses net of all reductions | .91% | .90% | .80% A |
Net investment income (loss) | (.56)% | (.56)% | (.45)% A |
Supplemental Data | | | |
Net assets, end of period (000 omitted) | $ 34,367 | $ 15,939 | $ 5,809 |
Portfolio turnover rate G | 213% | 269% | 249% |
A Annualized
B Total returns for periods of less than one year are not annualized.
C Total returns do not reflect charges attributable to your insurance company's separate account. Inclusion of these charges would reduce the total returns shown.
D Total returns would have been lower had certain expenses not been reduced during the periods shown.
E Calculated based on average shares outstanding during the period.
F Fees and expenses of the underlying Fidelity Central Funds are not included in the Fund's expense ratio. The Fund indirectly bears its proportionate share of the expenses of any underlying Fidelity Central Funds.
G Amount does not include the portfolio activity of any underlying Fidelity Central Funds.
H For the period July 21, 2005 (commencement of sale of shares) to December 31, 2005.
I Expense ratios reflect operating expenses of the class. Expenses before reductions do not reflect amounts reimbursed by the investment adviser or reductions from brokerage service arrangements or other expense offset arrangements and do not represent the amount paid by the class during periods when reimbursements or reductions occur. Expense ratios before reductions for start-up periods may not be representative of longer-term operating periods. Expenses net of fee waivers reflect expenses after reimbursement by the investment adviser but prior to reductions from brokerage service arrangements or other expense offset arrangements. Expenses net of all reductions represent the net expenses paid by the class.
J Amount represents less than $.01 per share.
See accompanying notes which are an integral part of the financial statements.
Annual Report
Notes to Financial Statements
For the period ended December 31, 2007
1. Organization.
VIP Technology Portfolio (the Fund) is a non-diversified fund of Variable Insurance Products Fund IV (the trust) and is authorized to issue an un-limited number of shares. The trust is registered under the Investment Company Act of 1940, as amended (the 1940 Act), as an open-end management investment company organized as a Massachusetts business trust. Shares of the Fund may only be purchased by insurance companies for the purpose of funding variable annuity or variable life insurance contracts. The Fund offers the following classes of shares: Initial Class shares and Investor Class shares. All classes have equal rights and voting privileges, except for matters affecting a single class. Investment income, realized and unrealized capital gains and losses, the common expenses of the Fund, and certain fund-level expense reductions, if any, are allocated on a pro rata basis to each class based on the relative net assets of each class to the total net assets of the Fund. Each class differs with respect to transfer agent fees incurred. Certain expense reductions also differ by class. The Fund's investments in emerging markets can be subject to social, economic, regulatory, and political uncertainties and can be extremely volatile.
2. Investments in Fidelity Central Funds.
The Fund may invest in Fidelity Central Funds, which are open-end investment companies available only to other investment companies and accounts managed by Fidelity Management & Research Company (FMR) and its affiliates. The Fund's Schedule of Investments lists each of the Fidelity Central Funds as an investment of the Fund, but does not include the underlying holdings of each Fidelity Central Fund. As an Investing Fund, the Fund indirectly bears its proportionate share of the expenses of the underlying Fidelity Central Funds.
The Money Market Central Funds seek preservation of capital and current income and are managed by Fidelity Investments Money Management, Inc. (FIMM), an affiliate of FMR.
A complete list of holdings for each Fidelity Central Fund is available upon request or at the SEC's web site at www.sec.gov. In addition, the financial statements of the Fidelity Central Funds, which are not covered by the Fund's Report of Independent Registered Public Accounting Firm, are available on the SEC's web site or upon request.
3. Significant Accounting Policies.
The financial statements have been prepared in conformity with accounting principles generally accepted in the United States of America, which require management to make certain estimates and assumptions at the date of the financial statements. The following summarizes the significant accounting policies of the Fund:
Security Valuation. Investments are valued and net asset value (NAV) per share is calculated (NAV calculation) as of the close of business of the New York Stock Exchange (NYSE), normally 4:00 p.m. Eastern time. Wherever possible, the Fund uses independent pricing services approved by the Board of Trustees to value its investments.
Equity securities, including restricted securities, for which market quotations are readily available, are valued at the last reported sale price or official closing price as reported by an independent pricing service on the primary market or exchange on which they are traded. In the event there were no sales during the day or closing prices are not available, securities are valued at the last quoted bid price. Debt securities, including restricted securities, for which quotations are readily available, are valued by independent pricing services or by dealers who make markets in such securities. Pricing services consider yield or price of bonds of comparable quality, coupon, maturity and type as well as dealer supplied prices. Investments in open-end mutual funds, including the Fidelity Central Funds, are valued at their closing net asset value each business day. Short-term securities with remaining maturities of sixty days or less for which quotations are not readily available are valued at amortized cost, which approximates value.
When current market prices or quotations are not readily available or do not accurately reflect fair value, valuations may be determined in accordance with procedures adopted by the Board of Trustees. For example, when developments occur between the close of a market and the close of the NYSE that may materially affect the value of some or all of the securities, or when trading in a security is halted, those securities may be fair valued. Factors used in the determination of fair value may include monitoring news to identify significant market or security specific events such as changes in the value of U.S. securities markets, reviewing developments in foreign markets and evaluating the performance of ADRs, futures contracts and exchange-traded funds. Because the Fund's utilization of fair value pricing depends on market activity, the frequency with which fair value pricing is used cannot be predicted and may be utilized to a significant extent. The value of securities used for NAV calculation under fair value pricing may differ from published prices for the same securities.
Foreign Currency. The Fund uses foreign currency contracts to facilitate transactions in foreign-denominated securities. Losses from these transactions may arise from changes in the value of the foreign currency or if the counterparties do not perform under the contracts' terms.
Foreign-denominated assets, including investment securities, and liabilities are translated into U.S. dollars at the exchange rate at period end. Purchases and sales of investment securities, income and dividends received and expenses denominated in foreign currencies are translated into U.S. dollars at the exchange rate in effect on the transaction date.
Annual Report
3. Significant Accounting Policies - continued
Foreign Currency - continued
The effects of exchange rate fluctuations on investments are included with the net realized and unrealized gain (loss) on investment securities. Other foreign currency transactions resulting in realized and unrealized gain (loss) are disclosed separately.
Investment Transactions and Income. For financial reporting purposes, the Fund's investment holdings and NAV include trades executed through the end of the last business day of the period. The NAV for processing shareholder transactions includes trades executed through the end of the prior business day. Gains and losses on securities sold are determined on the basis of identified cost and may include proceeds received from litigation. Dividend income is recorded on the ex-dividend date, except for certain dividends from foreign securities where the ex-dividend date may have passed, which are recorded as soon as the Fund is informed of the ex-dividend date. Non-cash dividends included in dividend income, if any, are recorded at the fair market value of the securities received. Distributions received on securities that represent a return of capital or capital gain are recorded as a reduction of cost of investments and/or as a realized gain. The Fund estimates the components of distributions received that may be considered return of capital distributions or capital gain distributions. Interest income and distributions from the Fidelity Central Funds are accrued as earned. Interest income includes coupon interest and amortization of premium and accretion of discount on debt securities. Investment income is recorded net of foreign taxes withheld where recovery of such taxes is uncertain.
Expenses. Most expenses of the trust can be directly attributed to a fund. Expenses which cannot be directly attributed are apportioned among each Fund in the trust. Expense estimates are accrued in the period to which they relate and adjustments are made when actual amounts are known.
Income Tax Information and Distributions to Shareholders. Each year, the Fund intends to qualify as a regulated investment company by distributing substantially all of its taxable income and realized gains under Subchapter M of the Internal Revenue Code and filing its U.S. federal tax return. As a result, no provision for income taxes is required. The Fund adopted the provisions of FASB Interpretation No. 48, Accounting for Uncertainties in Income Taxes (FIN 48), on June 29, 2007. FIN 48 sets forth a minimum threshold for financial statement recognition of the benefit of a tax position taken or expected to be taken in a tax return. The implementation of FIN 48 did not result in any unrecognized tax benefits in the accompanying financial statements. Each of the Fund's federal tax returns for the prior three fiscal years remains subject to examination by the Internal Revenue Service. Foreign taxes are provided for based on the Fund's understanding of the tax rules and rates that exist in the foreign markets in which it invests.
Distributions are recorded on the ex-dividend date. Income dividends and capital gain distributions are declared separately for each class. Income and capital gain distributions are determined in accordance with income tax regulations, which may differ from generally accepted accounting principles. In addition, the Fund will claim a portion of the payment made to redeeming shareholders as a distribution for income tax purposes.
Capital accounts within the financial statements are adjusted for permanent book-tax differences. These adjustments have no impact on net assets or the results of operations. Temporary book-tax differences will reverse in a subsequent period.
Book-tax differences are primarily due to foreign currency transactions, net operating losses and losses deferred due to wash sales.
The tax-basis components of distributable earnings and the federal tax cost as of period end were as follows:
Unrealized appreciation | $ 17,305,371 |
Unrealized depreciation | (11,347,019) |
Net unrealized appreciation (depreciation) | 5,958,352 |
Undistributed ordinary income | 6,685,441 |
Undistributed long-term capital gain | 5,719,800 |
| |
Cost for federal income tax purposes | $ 102,200,458 |
The tax character of distributions paid was as follows:
| December 31, 2007 | December 31, 2006 |
Ordinary Income | $ 3,662,874 | $ - |
Long-term Capital Gains | 2,431,703 | 7,082,577 |
Total | $ 6,094,577 | $ 7,082,577 |
Trading (Redemption) Fees. Shares held less than 60 days are subject to a redemption fee equal to 1% of the proceeds of the redeemed shares. All redemption fees, including any estimated redemption fees paid by FMR, are retained by the Fund and accounted for as an addition to paid in capital.
Annual Report
Notes to Financial Statements - continued
3. Significant Accounting Policies - continued
New Accounting Pronouncement. In September 2006, Statement of Financial Accounting Standards No. 157, Fair Value Measurements (SFAS 157), was issued and is effective for fiscal years beginning after November 15, 2007. SFAS 157 defines fair value, establishes a framework for measuring fair value and expands disclosures about fair value measurements. Management is currently evaluating the impact the adoption of SFAS 157 will have on the Fund's financial statement disclosures.
4. Operating Policies.
Repurchase Agreements. FMR has received an Exemptive Order from the Securities and Exchange Commission (the SEC) which permits the Fund and other affiliated entities of FMR to transfer uninvested cash balances into joint trading accounts which are then invested in repurchase agreements. The Fund may also invest directly with institutions in repurchase agreements. Repurchase agreements are collateralized by government or non-government securities. Upon settlement date, collateral is held in segregated accounts with custodian banks and may be obtained in the event of a default of the counterparty. The Fund monitors, on a daily basis, the value of the collateral to ensure it is at least equal to the principal amount of the repurchase agreement (including accrued interest). In the event of a default by the counterparty, realization of the collateral proceeds could be delayed, during which time the value of the collateral may decline.
Restricted Securities. The Fund may invest in securities that are subject to legal or contractual restrictions on resale. These securities generally may be resold in transactions exempt from registration or to the public if the securities are registered. Disposal of these securities may involve time-consuming negotiations and expense, and prompt sale at an acceptable price may be difficult. Information regarding restricted securities is included at the end of the Fund's Schedule of Investments.
5. Purchases and Sales of Investments.
Purchases and sales of securities, other than short-term securities, aggregated $192,679,244 and $177,071,052, respectively.
6. Fees and Other Transactions with Affiliates.
Management Fee. FMR and its affiliates provide the Fund with investment management related services for which the Fund pays a monthly management fee. The management fee is the sum of an individual fund fee rate that is based on an annual rate of .30% of the Fund's average net assets and a group fee rate that averaged .26% during the period. The group fee rate is based upon the average net assets of all the mutual funds advised by FMR. The group fee rate decreases as assets under management increase and increases as assets under management decrease. For the period, the total annual management fee rate was .56% of the Fund's average net assets.
Transfer Agent Fees. Fidelity Investments Institutional Operations Company, Inc. (FIIOC), an affiliate of FMR, is the Fund's transfer, dividend disbursing, and shareholder servicing agent. FIIOC receives an asset-based fee with respect to each class. Each class with the exception of Investor Class pays a transfer agent fee, excluding out of pocket expenses, equal to an annual rate of .07% of average net assets. Investor Class pays a monthly asset-based transfer agent fee of .18% of average net assets. The total transfer agent fees paid by each class to FIIOC, including out of pocket expenses, were as follows:
Initial Class | $ 43,529 |
Investor Class | 43,953 |
| $ 87,482 |
Effective February 1, 2008, the Board of Trustees approved a decrease to Investor Class' asset-based fee from .18% to .15% of average net assets.
Accounting and Security Lending Fees. Fidelity Service Company, Inc. (FSC), an affiliate of FMR, maintains the Fund's accounting records. The accounting fee is based on the level of average net assets for the month. Under a separate contract, FSC administers the security lending program. The security lending fee is based on the number and duration of lending transactions.
Brokerage Commissions. The Fund placed a portion of its portfolio transactions with brokerage firms which are affiliates of the investment adviser. The commissions paid to these affiliated firms were $7,484 for the period.
7. Committed Line of Credit.
The Fund participates with other funds managed by FMR in a $4.2 billion credit facility (the "line of credit") to be utilized for temporary or emergency purposes to fund shareholder redemptions or for other short-term liquidity purposes. The Fund has agreed to pay commitment fees on its pro rata portion of the line of credit, which amounted to $165 and is reflected in Miscellaneous Expense on the Statement of Operations. During the period, there were no borrowings on this line of credit.
Annual Report
8. Security Lending.
The Fund lends portfolio securities from time to time in order to earn additional income. On the settlement date of the loan, the Fund receives collateral (in the form of U.S. Treasury obligations, letters of credit and/or cash) against the loaned securities and maintains collateral in an amount not less than 100% of the market value of the loaned securities during the period of the loan. The market value of the loaned securities is determined at the close of business of the Fund and any additional required collateral is delivered to the Fund on the next business day. If the borrower defaults on its obligation to return the securities loaned because of insolvency or other reasons, a fund could experience delays and costs in recovering the securities loaned or in gaining access to the collateral. Any cash collateral received is invested in the Fidelity Securities Lending Cash Central Fund. The value of loaned securities and cash collateral at period end are disclosed on the Fund's Statement of Assets and Liabilities. Security lending income represents the income earned on investing cash collateral, less fees and expenses associated with the loan, plus any premium payments that may be received on the loan of certain types of securities. Security lending income is presented in the Statement of Operations as a component of income from Fidelity Central Funds.
9. Expense Reductions.
Many of the brokers with whom FMR places trades on behalf of the Fund provided services to the Fund in addition to trade execution. These services included payments of certain expenses on behalf of the Fund totaling $11,712 for the period.
10. Other.
The Fund's organizational documents provide former and current trustees and officers with a limited indemnification against liabilities arising in connection with the performance of their duties to the Fund. In the normal course of business, the Fund may also enter into contracts that provide general indemnifications. The Fund's maximum exposure under these arrangements is unknown as this would be dependent on future claims that may be made against the Fund. The risk of material loss from such claims is considered remote.
At the end of the period, FMR or its affiliates were the owners of record of 100% of the total outstanding shares of the Fund.
The United States Securities and Exchange Commission ("SEC") is conducting an investigation of FMR (covering the years 2002 to 2004) arising from gifts, gratuities and business entertainment provided by certain brokers to certain individuals who were employed on FMR's domestic equity trading desk during that period. FMR is in discussions with the SEC staff regarding the possible resolution of the matter, but as of period-end no final resolution has been reached.
In December 2006, the Independent Trustees completed their own investigation of the matter with the assistance of independent counsel. The Independent Trustees and FMR agree that, despite the absence of proof that the Fidelity mutual funds experienced diminished execution quality as a result of the improper receipt of gifts and business entertainment, the conduct at issue was serious and is worthy of redress. Accordingly, the Independent Trustees have requested and FMR has agreed to pay $42 million to Fidelity mutual funds, plus interest to be determined at the time that payment is made. A method of allocating this payment among the funds has not yet been determined. The total payment to the Fund is not anticipated to have a material impact on the Fund's net assets. In addition, FMR reimbursed related legal expenses which are recorded in the accompanying Statement of Operations as an expense reduction.
11. Distributions to Shareholders.
Distributions to shareholders of each class were as follows:
Years ended December 31, | 2007 | 2006 |
From net realized gain | | |
Initial Class | $ 4,693,279 | $ 6,484,203 |
Investor Class | 1,401,298 | 598,374 |
Total | $ 6,094,577 | $ 7,082,577 |
Annual Report
Notes to Financial Statements - continued
12. Share Transactions.
Transactions for each class of shares were as follows:
| Shares | Dollars |
Years ended December 31, | 2007 | 2006 | 2007 | 2006 |
Initial Class | | | | |
Shares sold | 2,595,070 | 2,223,212 | $ 28,838,207 | $ 22,500,191 |
Reinvestment of distributions | 484,843 | 627,099 | 4,693,279 | 6,484,203 |
Shares redeemed | (2,892,839) | (4,236,430) | (29,640,764) | (41,717,781) |
Net increase (decrease) | 187,074 | (1,386,119) | $ 3,890,722 | $ (12,733,387) |
Investor Class | | | | |
Shares sold | 2,580,889 | 1,405,935 | $ 28,186,641 | $ 14,461,192 |
Reinvestment of distributions | 145,212 | 57,982 | 1,401,298 | 598,374 |
Shares redeemed | (1,134,869) | (484,054) | (11,678,312) | (4,602,399) |
Net increase (decrease) | 1,591,232 | 979,863 | $ 17,909,627 | $ 10,457,167 |
Annual Report
Report of Independent Registered Public Accounting Firm
To the Trustees of Variable Insurance Products Fund IV and the Shareholders of VIP Technology Portfolio:
In our opinion, the accompanying statement of assets and liabilities, including the schedule of investments, and the related statements of operations and of changes in net assets and the financial highlights present fairly, in all material respects, the financial position of VIP Technology Portfolio (a fund of Variable Insurance Products Fund IV) at December 31, 2007, the results of its operations for the year then ended, the changes in its net assets for each of the two years in the period then ended and the financial highlights for each of the periods indicated, in conformity with accounting principles generally accepted in the United States of America. These financial statements and financial highlights (hereafter referred to as "financial statements") are the responsibility of the VIP Technology Portfolio's management. Our responsibility is to express an opinion on these financial statements based on our audits. We conducted our audits of these financial statements in accordance with the standards of the Public Company Accounting Oversight Board (United States). Those standards require that we plan and perform the audit to obtain reasonable assurance about whether the financial statements are free of material misstatement. An audit includes examining, on a test basis, evidence supporting the amounts and disclosures in the financial statements, assessing the accounting principles used and significant estimates made by management, and evaluating the overall financial statement presentation. We believe that our audits, which included confirmation of securities at December 31, 2007 by correspondence with the custodian and brokers, provide a reasonable basis for our opinion.
/s/ PricewaterhouseCoopers LLP
PricewaterhouseCoopers LLP
Boston, Massachusetts
February 19, 2008
Annual Report
Trustees and Officers
The Trustees, Members of the Advisory Board, and executive officers of the trust and fund, as applicable, are listed below. The Board of Trustees governs the fund and is responsible for protecting the interests of shareholders. The Trustees are experienced executives who meet periodically throughout the year to oversee the fund's activities, review contractual arrangements with companies that provide services to the fund, and review the fund's performance. Except for James C. Curvey, each of the Trustees oversees 373 funds advised by FMR or an affiliate. Mr. Curvey oversees 368 funds advised by FMR or an affiliate.
The Trustees hold office without limit in time except that (a) any Trustee may resign; (b) any Trustee may be removed by written instrument, signed by at least two-thirds of the number of Trustees prior to such removal; (c) any Trustee who requests to be retired or who has become incapacitated by illness or injury may be retired by written instrument signed by a majority of the other Trustees; and (d) any Trustee may be removed at any special meeting of shareholders by a two-thirds vote of the outstanding voting securities of the trust. Each Trustee who is not an interested person (as defined in the 1940 Act) (Independent Trustee), shall retire not later than the last day of the calendar year in which his or her 72nd birthday occurs. The Independent Trustees may waive this mandatory retirement age policy with respect to individual Trustees. The executive officers and Advisory Board Members hold office without limit in time, except that any officer and Advisory Board Member may resign or may be removed by a vote of a majority of the Trustees at any regular meeting or any special meeting of the Trustees. Except as indicated, each individual has held the office shown or other offices in the same company for the past five years.
The fund's Statement of Additional Information (SAI) includes more information about the Trustees. To request a free copy, call Fidelity at 1-877-208-0098.
Interested Trustees*:
Correspondence intended for each Trustee who is an interested person may be sent to Fidelity Investments, 82 Devonshire Street, Boston, Massachusetts 02109.
Name, Age; Principal Occupation |
Edward C. Johnson 3d (77) |
| Year of Election or Appointment: 1983 Mr. Johnson is Chairman of the Board of Trustees. Mr. Johnson serves as President (2006-present), Chief Executive Officer, Chairman, and a Director of FMR LLC; Chairman and a Director of FMR; Chairman and a Director of Fidelity Research & Analysis Company (FRAC); Chairman and a Director of Fidelity Investments Money Management, Inc.; and Chairman (2001-present) and a Director of FMR Co., Inc. In addition, Mr. Johnson serves as Chairman and Director of Fidelity International Limited (FIL). Mr. Edward C. Johnson 3d and Mr. Arthur E. Johnson are not related. |
James C. Curvey (72) |
| Year of Election or Appointment: 2007 Mr. Curvey also serves as Trustee (2007-present) or Member of the Advisory Board (2007-present) of other investment companies advised by FMR. Mr. Curvey is a Director of FMR and FMR Co., Inc. (2007-present). Mr. Curvey is also Vice Chairman (2006-
present) and Director of FMR LLC. Mr. Curvey joined Fidelity in 1982 and served in numerous senior management positions, including President and Chief Operating Officer of FMR LLC (1997-2000) and President of Fidelity Strategic Investments (2000-
2002). In addition, he serves as a member of the Board of Directors of Geerlings & Wade, Inc. (wine distribution). |
* Trustees have been determined to be "Interested Trustees" by virtue of, among other things, their affiliation with the trust or various entities under common control with FMR. FMR Corp. merged with and into FMR LLC on October 1, 2007. Any references to FMR LLC for prior periods are deemed to be references to the prior entity.
Independent Trustees:
Correspondence intended for each Independent Trustee (that is, the Trustees other than the Interested Trustees) may be sent to Fidelity Investments, P.O. Box 55235, Boston, Massachusetts 02205-5235.
Name, Age; Principal Occupation |
Dennis J. Dirks (59) |
| Year of Election or Appointment: 2005 Prior to his retirement in May 2003, Mr. Dirks was Chief Operating Officer and a member of the Board of The Depository Trust & Clearing Corporation (DTCC) (1999-2003). He also served as President, Chief Operating Officer, and Board member of The Depository Trust Company (DTC) (1999-2003) and President and Board member of the National Securities Clearing Corporation (NSCC) (1999-2003). In addition, Mr. Dirks served as Chief Executive Officer and Board member of the Government Securities Clearing Corporation (2001-2003) and Chief Executive Officer and Board member of the Mortgage-Backed Securities Clearing Corporation (2001-2003). Mr. Dirks also serves as a Trustee and a member of the Finance Committee of Manhattan College (2005-present) and a Trustee and a member of the Finance Committee of AHRC of Nassau County (2006-present). |
Albert R. Gamper, Jr. (65) |
| Year of Election or Appointment: 2006 Prior to his retirement in December 2004, Mr. Gamper served as Chairman of the Board of CIT Group Inc. (commercial finance). During his tenure with CIT Group Inc. Mr. Gamper served in numerous senior management positions, including Chairman (1987-
1989; 1999-2001; 2002-2004), Chief Executive Officer (1987-2004), and President (1989-2002). He currently serves as a member of the Board of Directors of Public Service Enterprise Group (utilities, 2001-present), Chairman of the Board of Governors, Rutgers University (2004-present), and Chairman of the Board of Saint Barnabas Health Care System. |
George H. Heilmeier (71) |
| Year of Election or Appointment: 2004 Dr. Heilmeier is Chairman Emeritus of Telcordia Technologies (communication software and systems), where prior to his retirement, he served as company Chairman and Chief Executive Officer. He currently serves on the Boards of Directors of The Mitre Corporation (systems engineering and information technology support for the government), and HRL Laboratories (private research and development, 2004-present). He is Chairman of the General Motors Science & Technology Advisory Board and a Life Fellow of the Institute of Electrical and Electronics Engineers (IEEE). Dr. Heilmeier is a member of the Defense Science Board and the National Security Agency Advisory Board. He is also a member of the National Academy of Engineering, the American Academy of Arts and Sciences, and the Board of Overseers of the School of Engineering and Applied Science of the University of Pennsylvania. Previously, Dr. Heilmeier served as a Director of TRW Inc. (automotive, space, defense, and information technology, 1992-2002), Compaq (1994-2002), Automatic Data Processing, Inc. (ADP) (technology-based business outsourcing, 1995-2002), INET Technologies Inc. (telecommunications network surveillance, 2001-2004), and Teletech Holdings (customer management services). He is the recipient of the 2005 Kyoto Prize in Advanced Technology for his invention of the liquid crystal display, and a member of the Consumer Electronics Hall of Fame. |
James H. Keyes (67) |
| Year of Election or Appointment: 2007 Prior to his retirement in 2003, Mr. Keyes was Chairman, President, and Chief Executive Officer of Johnson Controls, Inc. (automotive supplier, 1993-2003). He currently serves as a member of the boards of LSI Logic Corporation (semiconductor technologies), Navistar International Corporation (manufacture and sale of trucks, buses, and diesel engines, 2002-present), and Pitney Bowes, Inc. (integrated mail, messaging, and document management solutions). |
Marie L. Knowles (61) |
| Year of Election or Appointment: 2001 Prior to Ms. Knowles' retirement in June 2000, she served as Executive Vice President and Chief Financial Officer of Atlantic Richfield Company (ARCO) (diversified energy, 1996-2000). From 1993 to 1996, she was a Senior Vice President of ARCO and President of ARCO Transportation Company. She served as a Director of ARCO from 1996 to 1998. She currently serves as a Director of Phelps Dodge Corporation (copper mining and manufacturing) and McKesson Corporation (healthcare service, 2002-present). Ms. Knowles is a Trustee of the Brookings Institution and the Catalina Island Conservancy and also serves as a member of the Advisory Board for the School of Engineering of the University of Southern California. |
Ned C. Lautenbach (63) |
| Year of Election or Appointment: 2000 Mr. Lautenbach is Chairman of the Independent Trustees (2006-present). Mr. Lautenbach has been a partner of Clayton, Dubilier & Rice, Inc. (private equity investment firm) since September 1998. Previously, Mr. Lautenbach was with the International Business Machines Corporation (IBM) from 1968 until his retirement in 1998. Mr. Lautenbach serves as a Director of Sony Corporation (2006-present) and Eaton Corporation (diversified industrial) as well as the Philharmonic Center for the Arts in Naples, Florida. He also is a member of the Board of Trustees of Fairfield University (2005-present), as well as a member of the Council on Foreign Relations. |
Cornelia M. Small (63) |
| Year of Election or Appointment: 2005 Ms. Small is a member (2000-present) and Chairperson (2002-present) of the Investment Committee, and a member (2002-
present) of the Board of Trustees of Smith College. Previously, she served as Chief Investment Officer (1999-2000), Director of Global Equity Investments (1996-1999), and a member of the Board of Directors of Scudder, Stevens & Clark (1990-1997) and Scudder Kemper Investments (1997-1999). In addition, Ms. Small served as Co-Chair (2000-2003) of the Annual Fund for the Fletcher School of Law and Diplomacy. |
William S. Stavropoulos (68) |
| Year of Election or Appointment: 2001 Mr. Stavropoulos is Chairman Emeritus of the Board of Directors of The Dow Chemical Company. Since joining The Dow Chemical Company in 1967, Mr. Stavropoulos served in numerous senior management positions, including President (1993-2000; 2002-
2003), CEO (1995-2000; 2002-2004), and Chairman of the Executive Committee (2000-2004). Currently, he is a Director of NCR Corporation (data warehousing and technology solutions), Chemical Financial Corporation, Maersk Inc. (industrial conglomerate, 2002-present), Tyco International, Inc. (multinational manufacturing and services, 2007-present), and a member of the Advisory Board for Metalmark Capital (private equity investment firm, 2005-present). He is a special advisor to Clayton, Dubilier & Rice, Inc., a private equity investment firm. He also serves as a member of the Board of Trustees of the American Enterprise Institute for Public Policy Research. In addition, Mr. Stavropoulos is a member of The Business Council, J.P. Morgan International Council and the University of Notre Dame Advisory Council for the College of Science. |
Kenneth L. Wolfe (68) |
| Year of Election or Appointment: 2005 Mr. Wolfe is Chairman and a Director of Hershey Foods Corporation (2007-present), where prior to his retirement in 2001, he was Chairman and Chief Executive Officer. Mr. Wolfe currently serves as a member of the board of Revlon Inc. (2004-present). Previously, Mr. Wolfe served as a member of the boards of Adelphia Communications Corporation (2003-2006) and Bausch & Lomb, Inc. (1993-2007). |
Advisory Board Members and Executive Officers**:
Correspondence intended for Mr. Mauriello, Mr. Thomas, Mr. Wiley, Mr. Lacy, and Mr. Arthur Johnson may be sent to Fidelity Investments, P.O. Box 55235, Boston, Massachusetts 02205-5235. Correspondence intended for each executive officer and Mr. Lynch may be sent to Fidelity Investments, 82 Devonshire Street, Boston, Massachusetts 02109.
Name, Age; Principal Occupation |
Arthur E. Johnson (60) |
| Year of Election or Appointment: 2008 Member of the Advisory Board of Variable Insurance Products Fund IV. Mr. Johnson serves as Senior Vice President of Corporate Strategic Development of Lockheed Martin Corporation (defense contractor). In addition, Mr. Johnson serves as a member of the Board of Directors of AGL Resources, Inc. (holding company, 2002-present), and IKON Office Solutions, Inc. (document management systems and services). Mr. Arthur E. Johnson and Mr. Edward C. Johnson 3d are not related. |
Alan J. Lacy (54) |
| Year of Election or Appointment: 2008 Member of the Advisory Board of Variable Insurance Products Fund IV. Mr. Lacy serves as Senior Adviser (2007-present) of Oak Hill Capital Partners, L.P. (a private equity firm). Mr. Lacy also served as Vice Chairman and Chief Executive Officer of Sears Holdings Corporation and Sears, Roebuck and Co. (retail, 2005-2006; 2000-2005). In addition, Mr. Lacy serves as a member of the Board of Directors of The Western Union Company (global money transfer, 2006-present) and Bristol-Myers Squibb (global pharmaceuticals, 2007-present). Mr. Lacy is a Trustee of the National Parks Conservation Association and The Field Museum of Natural History. |
Peter S. Lynch (63) |
| Year of Election or Appointment: 2003 Member of the Advisory Board of Variable Insurance Products Fund IV. Mr. Lynch is Vice Chairman and a Director of FMR, and Vice Chairman (2001-present) and a Director of FMR Co., Inc. Previously, Mr. Lynch served as a Trustee of the Fidelity funds (1990-2003). In addition, he serves as a Trustee of Boston College and as the Chairman of the Inner-City Scholarship Fund. |
Joseph Mauriello (63) |
| Year of Election or Appointment: 2007 Member of the Advisory Board of Variable Insurance Products Fund IV. Prior to his retirement in January 2006, Mr. Mauriello served in numerous senior management positions including Deputy Chairman and Chief Operating Officer (2004-2005), and Vice Chairman of Financial Services (2002-2004) of KPMG LLP US (professional services firm, 1965-2005). Mr. Mauriello currently serves as a member of the Board of Directors of XL Capital Ltd. (global insurance and re-insurance company, 2006-
present) and of Arcadia Resources Inc. (health care services and products, 2007-present). He also served as a Director of the Hamilton Funds of the Bank of New York (2006-2007). |
David M. Thomas (58) |
| Year of Election or Appointment: 2007 Member of the Advisory Board of Variable Insurance Products Fund IV. Previously, Mr. Thomas served as Executive Chairman (2005-2006) and Chairman and Chief Executive Officer (2000-2005) of IMS Health, Inc. (pharmaceutical and healthcare information solutions). In addition, Mr. Thomas serves as a member of the Board of Directors of Fortune Brands, Inc. (consumer products holding company), and Interpublic Group of Companies, Inc. (marketing communication, 2004-present). |
Michael E. Wiley (57) |
| Year of Election or Appointment: 2007 Member of the Advisory Board of Variable Insurance Products Fund IV. Mr. Wiley also serves as a member of the Board of Trustees of the University of Tulsa (2000-2006; 2007-present). He serves as a Director of Tesoro Corporation (independent oil refiner and marketer, 2005-present), and a Director of Bill Barrett Corporation (exploration and production company, 2005-present). In addition, he also serves as a Director of Post Oak Bank (privately-held bank, 2004-present). Previously, Mr. Wiley served as a Sr. Energy Advisor of Katzenbach Partners, LLC (consulting firm, 2006-2007), as an Advisory Director of Riverstone Holdings (private investment firm), Chairman, President, and CEO of Baker Hughes, Inc. (oilfield services company, 2000-2004), and as Director of Spinnaker Exploration Company (exploration and production company, 2001-2005). |
Kimberley H. Monasterio (44) |
| Year of Election or Appointment: 2007 President and Treasurer of VIP Technology. Ms. Monasterio also serves as President and Treasurer of other Fidelity funds (2007-
present) and is an employee of FMR (2004-present). Previously, Ms. Monasterio served as Deputy Treasurer of the Fidelity funds (2004-2006). Before joining Fidelity Investments, Ms. Monasterio served as Treasurer (2000-2004) and Chief Financial Officer (2002-2004) of the Franklin Templeton Funds and Senior Vice President of Franklin Templeton Services, LLC (2000-2004). |
Brian B. Hogan (43) |
| Year of Election or Appointment: 2007 Vice President of VIP Technology. Mr. Hogan also serves as Vice President of Sector Funds (2007-present). Mr. Hogan is Senior Vice President of Equity Research (2006-present). Mr. Hogan also serves as Vice President of FMR and FMR Co., Inc. Previously, Mr. Hogan served as a portfolio manager. |
Eric D. Roiter (59) |
| Year of Election or Appointment: 2001 Secretary of VIP Technology. He also serves as Secretary of other Fidelity funds; Vice President, General Counsel, and Secretary of FMR Co., Inc. (2001-present) and FMR; Assistant Secretary of Fidelity Management & Research (U.K.) Inc. (2001-present), Fidelity Research & Analysis Company (2001-present), and Fidelity Investments Money Management, Inc. (2001-present). Mr. Roiter is an Adjunct Member, Faculty of Law, at Boston College Law School (2003-present). Previously, Mr. Roiter served as Vice President and Secretary of Fidelity Distributors Corporation (FDC) (1998-2005). |
John B. McGinty, Jr. (45) |
| Year of Election or Appointment: 2008 Assistant Secretary of VIP Technology. Mr. McGinty also serves as Assistant Secretary of other Fidelity funds (2008-present) and is an employee of FMR LLC (2004-present). Mr. McGinty also serves as Senior Vice President, Secretary, and Chief Legal Officer of FDC (2007-present). Before joining Fidelity Investments, Mr. McGinty practiced law at Ropes & Gray, LLP. |
R. Stephen Ganis (41) |
| Year of Election or Appointment: 2006 Anti-Money Laundering (AML) officer of VIP Technology. Mr. Ganis also serves as AML officer of other Fidelity funds (2006-
present) and FMR LLC (2003-present). Before joining Fidelity Investments, Mr. Ganis practiced law at Goodwin Procter, LLP (2000-2002). |
Joseph B. Hollis (59) |
| Year of Election or Appointment: 2006 Chief Financial Officer of VIP Technology. Mr. Hollis also serves as Chief Financial Officer of other Fidelity funds. Mr. Hollis is President of Fidelity Pricing and Cash Management Services (FPCMS) (2005-present). Mr. Hollis also serves as President and Director of Fidelity Service Company, Inc. (2006-present). Previously, Mr. Hollis served as Senior Vice President of Cash Management Services (1999-2002) and Investment Management Operations (2002-2005). |
Kenneth A. Rathgeber (60) |
| Year of Election or Appointment: 2004 Chief Compliance Officer of VIP Technology. Mr. Rathgeber also serves as Chief Compliance Officer of other Fidelity funds (2004-present) and Executive Vice President of Risk Oversight for Fidelity Investments (2002-present). He is Chief Compliance Officer of FMR (2005-present), FMR Co., Inc. (2005-present), Fidelity Management & Research (U.K.) Inc. (2005-present), Fidelity Research & Analysis Company (2005-present), Fidelity Investments Money Management, Inc. (2005-present), and Strategic Advisers, Inc. (2005-present). Previously, Mr. Rathgeber served as Executive Vice President and Chief Operating Officer for Fidelity Investments Institutional Services Company, Inc. (1998-2002). |
Bryan A. Mehrmann (46) |
| Year of Election or Appointment: 2005 Deputy Treasurer of VIP Technology. Mr. Mehrmann also serves as Deputy Treasurer of other Fidelity funds (2005-present) and is an employee of FMR. Previously, Mr. Mehrmann served as Vice President of Fidelity Investments Institutional Services Group (FIIS)/
Fidelity Investments Institutional Operations Corporation, Inc. (FIIOC) Client Services (1998-2004). |
Kenneth B. Robins (38) |
| Year of Election or Appointment: 2005 Deputy Treasurer of VIP Technology. Mr. Robins also serves as Deputy Treasurer of other Fidelity funds (2005-present) and is an employee of FMR (2004-present). Before joining Fidelity Investments, Mr. Robins worked at KPMG LLP, where he was a partner in KPMG's department of professional practice (2002-2004) and a Senior Manager (1999-2000). In addition, Mr. Robins served as Assistant Chief Accountant, United States Securities and Exchange Commission (2000-2002). |
Robert G. Byrnes (41) |
| Year of Election or Appointment: 2005 Assistant Treasurer of VIP Technology. Mr. Byrnes also serves as Assistant Treasurer of other Fidelity funds (2005-present) and is an employee of FMR (2005-present). Previously, Mr. Byrnes served as Vice President of FPCMS (2003-2005). Before joining Fidelity Investments, Mr. Byrnes worked at Deutsche Asset Management where he served as Vice President of the Investment Operations Group (2000-2003). |
Peter L. Lydecker (53) |
| Year of Election or Appointment: 2004 Assistant Treasurer of VIP Technology. Mr. Lydecker also serves as Assistant Treasurer of other Fidelity funds (2004) and is an employee of FMR. |
Paul M. Murphy (60) |
| Year of Election or Appointment: 2007 Assistant Treasurer of VIP Technology. Mr. Murphy also serves as Assistant Treasurer of other Fidelity funds (2007-present) and is an employee of FMR (2007-present). Previously, Mr. Murphy served as Chief Financial Officer of the Fidelity Funds (2005-2006), Vice President and Associate General Counsel of FMR (2007), and Senior Vice President of Fidelity Pricing and Cash Management Services Group (FPCMS) (1994-2007). |
Gary W. Ryan (49) |
| Year of Election or Appointment: 2005 Assistant Treasurer of VIP Technology. Mr. Ryan also serves as Assistant Treasurer of other Fidelity funds (2005-present) and is an employee of FMR (2005-present). Previously, Mr. Ryan served as Vice President of Fund Reporting in FPCMS (1999-2005). |
** FMR Corp. merged with and into FMR LLC on October 1, 2007. Any references to FMR LLC for prior periods are deemed to be references to the prior entity.
Annual Report
Distributions
The Board of Trustees of VIP IV Technology Portfolio voted to pay to shareholders of record at the opening of business on record date, the following distributions per share derived from capital gains realized from sales of portfolio securities:
| Pay Date | Record Date | Capital Gains |
Initial Class | 2/15/08 | 2/15/08 | $1.494 |
Investor Class | 2/15/08 | 2/15/08 | $1.485 |
The fund hereby designates as a capital gain dividend with respect to the taxable year ended December 31, 2007, $5,722,454, or, if sub-sequently determined to be different, the net capital gain of such year.
A percentage of the dividends distributed during the fiscal year for the following classes qualifies for the dividends-received deduction for corporate shareholders:
Initial Class | 3.7% |
Investor Class | 3.7% |
The fund will notify shareholders in January 2008 of amounts for use in preparing 2007 income tax returns.
Annual Report
Board Approval of Investment Advisory Contracts and Management Fees
VIP Technology Portfolio
Each year, typically in July, the Board of Trustees, including the Independent Trustees (together, the Board), votes on the renewal of the management contract and sub-advisory agreements (together, the Advisory Contracts) for the fund. The Board, assisted by the advice of fund counsel and Independent Trustees' counsel, requests and considers a broad range of information throughout the year.
The Board meets regularly each month except August and takes into account throughout the year matters bearing on Advisory Contracts. The Board, acting directly and through its separate committees, considers at each of its meetings factors that are relevant to the annual renewal of the fund's Advisory Contracts, including the services and support provided to the fund and its shareholders. At the time of the renewal, the Board had 12 standing committees, each composed of Independent Trustees with varying backgrounds, to which the Board has assigned specific subject matter responsibilities in order to enhance effective decision-making by the Board. Each committee has adopted a written charter outlining the structure and purposes of the committee. One such committee, the Equity Contract Committee, meets periodically as needed throughout the year to consider matters specifically related to the annual renewal of Advisory Contracts. The committee requests and receives information on, and makes recommendations to the Independent Trustees concerning, the approval and annual review of the Advisory Contracts.
At its July 2007 meeting, the Board of Trustees, including the Independent Trustees, unanimously determined to renew the Advisory Contracts for the fund. In reaching its determination, the Board considered all factors it believed relevant, including (i) the nature, extent, and quality of the services to be provided to the fund and its shareholders (including the investment performance of the fund); (ii) the competitiveness of the management fee and total expenses of the fund; (iii) the total costs of the services to be provided by and the profits to be realized by the investment adviser and its affiliates from the relationship with the fund; (iv) the extent to which economies of scale would be realized as the fund grows; and (v) whether fee levels reflect these economies of scale, if any, for the benefit of fund shareholders. The Board also approved amendments to the fund's agreements with foreign sub-advisers to clarify that each sub-adviser provides services as an independent contractor.
In determining whether to renew the Advisory Contracts for the fund, the Board ultimately reached a determination, with the assistance of fund counsel and Independent Trustees' counsel, that the renewal of the Advisory Contracts and the compensation to be received by Fidelity under the management contract is consistent with Fidelity's fiduciary duty under applicable law. In addition to evaluating the specific factors noted above, the Board, in reaching its determination, is aware that shareholders in the fund have a broad range of investment choices available to them, including a wide choice among mutual funds offered by competitors to Fidelity, and that the fund's shareholders, with the opportunity to review and weigh the disclosure provided by the fund in its prospectus and other public disclosures, have chosen to invest in this fund, managed by Fidelity.
Nature, Extent, and Quality of Services Provided. The Board considered staffing within the investment adviser, FMR, and the sub-advisers (together, the Investment Advisers), including the background of the fund's portfolio manager and the fund's investment objective and discipline. The Independent Trustees also had discussions with senior management of Fidelity's investment operations and investment groups. The Board considered the structure of the portfolio manager compensation program and whether this structure provides appropriate incentives.
Resources Dedicated to Investment Management and Support Services. The Board reviewed the size, education, and experience of the Investment Advisers' investment staff, their use of technology, and the Investment Advisers' approach to recruiting, training, and retaining portfolio managers and other research, advisory, and management personnel. The Board considered Fidelity's extensive global research capabilities that enable the Investment Advisers to aggregate data from various sources in an effort to produce positive investment results. The Board noted that Fidelity's analysts have access to a variety of technological tools that enable them to perform both fundamental and quantitative analysis and to specialize in various disciplines. The Board also considered that Fidelity's portfolio managers and analysts have access to daily portfolio attribution that allows for monitoring of a fund's portfolio, as well as an electronic communication system that provides immediate real-time access to research concerning issuers and credit enhancers.
Shareholder and Administrative Services. The Board considered (i) the nature, extent, quality, and cost of advisory, administrative, distribution, and shareholder services performed by the Investment Advisers and their affiliates under the Advisory Contracts and under separate agreements covering transfer agency, pricing and bookkeeping, and securities lending services for the fund; (ii) the nature and extent of the Investment Advisers' supervision of third party service providers, principally custodians and subcustodians; and (iii) the resources devoted to, and the record of compliance with, the fund's compliance policies and procedures. The Board reviewed the allocation of fund brokerage, including allocations to brokers affiliated with the Investment Advisers, the use of brokerage commissions to pay fund expenses, and the use of "soft" commission dollars to pay for research services. The Board also considered that Fidelity voluntarily pays for market data out of its own resources. The Board also considered the agreement reached between the Independent Trustees and Fidelity in December 2006 following an independent review of matters relating to receipt of travel, entertainment, gifts and gratuities in violation of Fidelity policies.
The Board noted that the growth of fund assets across the complex allows Fidelity to reinvest in the development of services designed to enhance the value or convenience of the Fidelity funds as investment vehicles. These services include 24-hour access to account information and market information through phone representatives and over the Internet, and investor education materials and asset allocation tools.
Annual Report
Investment in a Large Fund Family. The Board considered the benefits to shareholders of investing in a Fidelity fund, including the benefits of investing in a fund that is part of a large family of funds offering a variety of investment disciplines and providing for a large variety of mutual fund investor services. The Board noted that, since the last Advisory Contract renewals in July 2006, Fidelity has taken a number of actions that benefited particular funds, including (i) dedicating additional resources to investment research and to restructure the investment research teams; (ii) contractually agreeing to reduce the management fee on Fidelity Advisor Floating Rate High Income Fund; (iii) contractually agreeing to reduce the management fees on Fidelity's California, Massachusetts, New Jersey, and New York AMT Tax-Free Money Market Funds, launching new Institutional Classes and Service Classes of these funds, and contractually agreeing to impose expense limitations on these funds; (iv) eliminating the exchange fee on the Fidelity Select Portfolios and reducing the pricing and bookkeeping fee rates for these funds; (v) reducing the maximum transfer agency fee rates on high income funds and certain equity funds; (vi) proposing amended management contracts that, if approved by shareholders, will add a performance adjustment component to the management fees paid by 18 Fidelity Advisor equity funds; (vii) contractually agreeing to reduce fees for Ultra-Short Central Fund and the money market Central Funds; (viii) waiving the Fidelity Advisor funds' contingent deferred sales charge on certain redemptions made through systematic withdrawal programs; and (ix) amending the management contracts for equity and fixed-income funds whose management contracts incorporate a "group fee" structure by adding four new fee "breakpoints" to the group fee rate schedules.
Investment Performance and Compliance. The Board considered whether the fund has operated within its investment objective, as well as its record of compliance with its investment restrictions. It also reviewed the fund's absolute investment performance for each class, as well as the fund's relative investment performance for each class measured against a third-party-sponsored index that reflects the market sector in which the fund invests over multiple periods. The Board noted that FMR does not believe that a meaningful peer group exists against which to compare the fund's performance. The Board also noted that in 2006 FMR implemented changes to the sector fund product line, which included a change to the fund's index. The following charts considered by the Board show, over the one-, three-, and five-year periods ended December 31, 2006, as available, the cumulative total returns of Initial Class and Investor Class of the fund and the cumulative total returns of a third-party-sponsored index ("benchmark").
VIP Technology Portfolio
The Board stated that the relative investment performance of Initial Class of the fund compared favorably to its benchmark for the three- and five-year periods, although the fund's one-year cumulative total return was lower than its benchmark. The Board considered that the variations in performance between the fund's classes reflect the variations in class expenses, which result in lower performance for the higher expense class.
The Board considered that FMR has taken steps to refocus and strengthen equity research, equity portfolio management, and compliance.
Based on its review, and giving particular weight to the nature and quality of the resources dedicated by the Investment Advisers to maintain and improve relative performance, the Board concluded that the nature, extent, and quality of the services provided to the fund will benefit the fund's shareholders, particularly in light of the Board's view that the fund's shareholders benefit from investing in a fund that is part of a large family of funds offering a variety of investment disciplines and services.
Competitiveness of Management Fee and Total Fund Expenses. The Board considered the fund's management fee and total expenses compared to "mapped groups" of competitive funds and classes. Fidelity creates "mapped groups" by combining similar Lipper investment objective categories that have comparable management fee characteristics. Combining Lipper investment objective categories aids the Board's management fee and total expense comparisons by broadening the competitive group used for comparison and by reducing the number of universes to which various Fidelity funds are compared. The Board also considered supplemental information about how the fund's management fee and total expenses ranked relative to groups based on Lipper classifications, which take into account a fund's market capitalization and style.
Annual Report
Board Approval of Investment Advisory Contracts and Management Fees - continued
The Board considered two proprietary management fee comparisons for the 12-month periods shown in the chart below. The group of Lipper funds used by the Board for management fee comparisons is referred to below as the "Total Mapped Group." The Total Mapped Group comparison focuses on a fund's standing relative to the total universe of comparable funds available to investors, in terms of gross management fees before expense reimbursements or caps. "TMG %" represents the percentage of funds in the Total Mapped Group that had management fees that were lower than the fund's. For example, a TMG % of 9% means that 91% of the funds in the Total Mapped Group had higher management fees than the fund. The "Asset-Size Peer Group" (ASPG) comparison focuses on a fund's standing relative to non-Fidelity funds similar in size to the fund within the Total Mapped Group. The ASPG represents at least 15% of the funds in the Total Mapped Group with comparable asset size and management fee characteristics, subject to a minimum of 50 funds (or all funds in the Total Mapped Group if fewer than 50). Additional information, such as the ASPG quartile in which the fund's management fee ranked, is also included in the chart and considered by the Board.
VIP Technology Portfolio
The Board noted that the fund's management fee ranked below the median of its Total Mapped Group and below the median of its ASPG for 2006.
Based on its review, the Board concluded that the fund's management fee was fair and reasonable in light of the services that the fund receives and the other factors considered.
In its review of each class's total expenses, the Board considered the fund's management fee as well as other fund or class expenses, as applicable, such as transfer agent fees, pricing and bookkeeping fees, and custodial, legal, and audit fees. The Board also noted the effects of any waivers and reimbursements on fees and expenses. As part of its review, the Board also considered current and historical total expenses of each class of the fund compared to competitive fund median expenses. Each class of the fund is compared to those funds and classes in the Total Mapped Group (used by the Board for management fee comparisons) that have a similar sales load structure.
The Board noted that the total expenses of each class ranked below its competitive median for 2006.
In its review of total expenses, the Board also considered Fidelity fee structures and other information on clients that FMR and its affiliates service in other competitive markets, such as other mutual funds advised or subadvised by FMR or its affiliates, pension plan clients, and other institutional clients.
Based on its review, the Board concluded that the total expenses of each class of the fund were reasonable in light of the services that the fund and its shareholders receive and the other factors considered.
Costs of the Services and Profitability. The Board considered the revenues earned and the expenses incurred by Fidelity in conducting the business of developing, marketing, distributing, managing, administering and servicing the fund and its shareholders. The Board also considered the level of Fidelity's profits in respect of all the Fidelity funds.
Annual Report
On an annual basis, FMR presents to the Board Fidelity's profitability for the fund. Fidelity calculates the profitability for each fund, as well as aggregate profitability for groups of Fidelity funds and all Fidelity funds, using a series of detailed revenue and cost allocation methodologies which originate with the audited books and records of Fidelity. The Audit Committee of the Board reviews any significant changes from the prior year's methodologies.
PricewaterhouseCoopers LLP (PwC), independent registered public accounting firm and auditor to Fidelity and certain Fidelity funds, has been engaged annually by the Board as part of the Board's assessment of the results of Fidelity's profitability analysis. PwC's engagement includes the review and assessment of Fidelity's methodologies used in determining the revenues and expenses attributable to Fidelity's mutual fund business, and completion of agreed-upon procedures surrounding the mathematical accuracy of fund profitability and its conformity to allocation methodologies. After considering PwC's reports issued under the engagement and information provided by Fidelity, the Board believes that while other allocation methods may also be reasonable, Fidelity's profitability methodologies are reasonable in all material respects.
The Board has also reviewed Fidelity's non-fund businesses and any fall-out benefits related to the mutual fund business as well as cases where Fidelity's affiliates may benefit from or be related to the fund's business.
The Board considered the costs of the services provided by and the profits realized by Fidelity in connection with the operation of the fund and determined that the amount of profit is a fair entrepreneurial profit for the management of the fund.
Economies of Scale. The Board considered whether there have been economies of scale in respect of the management of the Fidelity funds, whether the Fidelity funds (including the fund) have appropriately benefited from any such economies of scale, and whether there is potential for realization of any further economies of scale. The Board considered the extent to which the fund will benefit from economies of scale through increased services to the fund, through waivers or reimbursements, or through fee or expense reductions.
The Board recognized that the fund's management contract incorporates a "group fee" structure, which provides for lower group fee rates as total fund assets under FMR's management increase, and for higher group fee rates as total fund assets under FMR's management decrease. FMR determines the group fee rates based on a tiered asset "breakpoint" schedule. In connection with the renewal of the fund's management contract, the Board approved amendments to the fund's management contract that added four new fee breakpoints to the group fee rate schedule for assets under FMR's management above $1,386 billion. The Board considered that the group fee rate declines under both the present and amended schedules, but that under the amended schedule, the group fee rate declines faster as assets under FMR's management exceed $1,386 billion. The Board considered that the group fee is designed to deliver the benefits of economies of scale to fund shareholders when total fund assets increase, even if assets of any particular fund are unchanged or have declined, because some portion of Fidelity's costs are attributable to services provided to all Fidelity funds, and all funds benefit if those costs can be allocated among more assets. The Board concluded that, given the group fee structure, fund shareholders will achieve a certain level of economies of scale as assets under FMR's management increase at the fund complex level, regardless of whether Fidelity achieves any such economies of scale.
The Board further concluded that any potential economies of scale are being shared between fund shareholders and Fidelity in an appropriate manner.
Additional Information Requested by the Board. In order to develop fully the factual basis for consideration of the Fidelity funds' Advisory Contracts, the Board requested and received additional information on several topics, including (i) fund performance trends and actions to be taken by FMR to improve certain funds' overall performance; (ii) Fidelity's portfolio manager compensation structure, including its effects on fund profitability and the extent to which portfolio manager compensation is linked to fund performance; (iii) Fidelity's fee structures; (iv) the funds' sub-advisory arrangements; and (v) accounts managed by Fidelity other than the Fidelity funds.
Based on its evaluation of all of the conclusions noted above, and after considering all material factors, the Board ultimately concluded that the advisory fee structures are fair and reasonable, and that the fund's Advisory Contracts should be renewed.
Annual Report
Annual Report
Annual Report
Investment Adviser
Fidelity Management & Research Company
Boston, MA
Investment Sub-Advisers
FMR Co., Inc.
Fidelity Management & Research (U.K.) Inc.
Fidelity Research & Analysis Company
Fidelity Investments Japan Limited
Fidelity International Investment Advisors
Fidelity International Investment Advisors
(U.K.) Limited
General Distributor
Fidelity Distributors Corporation
Boston, MA
Transfer and Service Agents
Fidelity Investments Institutional Operations Company, Inc.
Boston, MA
Fidelity Service Company, Inc.
Boston, MA
Custodian
JPMorgan Chase Bank
New York, NY
VTECIC-ANN-0208
1.817385.102
Fidelity® Variable Insurance Products:
Telecommunications Portfolio
Annual Report
December 31, 2007
(2_fidelity_logos) (Registered_Trademark)
Contents
Performance | <Click Here> | How the fund has done over time. |
Management's Discussion | <Click Here> | The manager's review of fund performance, strategy and outlook. |
Shareholder Expense Example | <Click Here> | An example of shareholder expenses. |
Investment Changes | <Click Here> | A summary of major shifts in the fund's investments over the past six months. |
Investments | <Click Here> | A complete list of the fund's investments with their
market values. |
Financial Statements | <Click Here> | Statements of assets and liabilities, operations, and
changes in net assets, as well as financial highlights. |
Notes | <Click Here> | Notes to the financial statements. |
Report of Independent Registered Public Accounting Firm | <Click Here> | |
Trustees and Officers | <Click Here> | |
Distributions | <Click Here> | |
To view a fund's proxy voting guidelines and proxy voting record for the 12-month period ended June 30, visit http://www.fidelity.com (search for "proxy voting guidelines") or visit the Securities and Exchange Commission's (SEC) web site at http://www.sec.gov. You may also call 1-877-208-0098 to request a free copy of the proxy voting guidelines.
Fidelity Variable Insurance Products are separate account options which are purchased through a variable insurance contract.
Standard & Poor's, S&P and S&P 500 are registered service marks of The McGraw-Hill Companies, Inc. and have been licensed for use by Fidelity Distributors Corporation.
Other third party marks appearing herein are the property of their respective owners.
All other marks appearing herein are registered or unregistered trademarks or service marks of FMR LLC or an affiliated company.
This report and the financial statements contained herein are submitted for the general information of the shareholders of the fund. This report is not authorized for distribution to prospective investors in the fund unless preceded or accompanied by an effective prospectus.
A fund files its complete schedule of portfolio holdings with the SEC for the first and third quarters of each fiscal year on Form N-Q. Forms N-Q are available on the SEC's web site at http://www.sec.gov. A fund's Forms N-Q may be reviewed and copied at the SEC's Public Reference Room in Washington, DC. Information regarding the operation of the SEC's Public Reference Room may be obtained by calling 1-800-SEC-0330. For a complete list of a fund's portfolio holdings, view the most recent holdings listing, semiannual report, or annual report on Fidelity's web site at http://www.fidelity.com or http://www.advisor.fidelity.com, as applicable.
NOT FDIC INSURED · MAY LOSE VALUE · NO BANK GUARANTEE
Neither the fund nor Fidelity Distributors Corporation is a bank.
Annual Report
Performance: The Bottom Line
Average annual total return reflects the change in the value of an investment, assuming reinvestment of the class' dividend income and capital gains (the profits earned upon the sale of securities that have grown in value, if any) and assuming a constant rate of performance each year. During periods of reimbursement by Fidelity, a fund's total return will be greater than it would be had the reimbursement not occurred. Performance numbers are net of all underlying fund operating expenses, but do not include any insurance charges imposed by your insurance company's separate account. If performance information included the effect of these additional charges, the total returns would have been lower. How a fund did yesterday is no guarantee of how it will do tomorrow.
Average annual total returns take VIP Telecommunications Portfolio's cumulative total return and show you what would have happened if VIP Telecommunications Portfolio shares had performed at a constant rate each year. These numbers will be reported once the fund is a year old.
$10,000 Over Life of Fund
Let's say hypothetically that $10,000 was invested in VIP Telecommunications Portfolio - Initial Class on April 24, 2007, when the fund started. The chart shows how the value of your investment would have changed, and also shows how the Standard & Poor's 500SM Index (S&P 500®) performed over the same period.
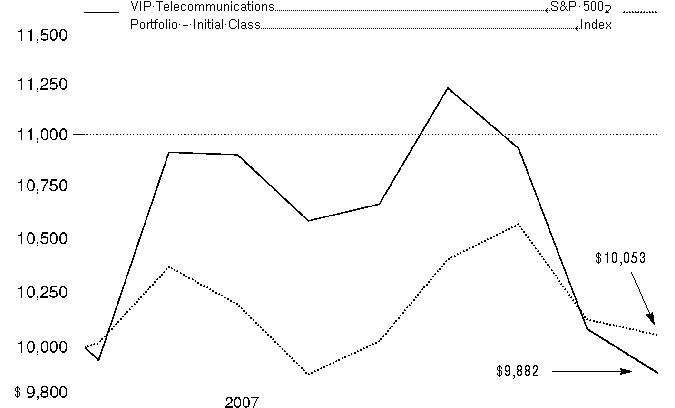
Annual Report
Management's Discussion of Fund Performance
Comments from Gavin Baker, Portfolio Manager of VIP Telecommunications Portfolio
U.S. equity markets, as measured by the bellwether Dow Jones Industrial AverageSM and the Standard & Poor's 500SM Index, registered their fifth consecutive year of positive returns in 2007, as the Dow rose 8.88% and the S&P 500® index advanced 5.49%. The tech-heavy NASDAQ Composite® Index did even better, increasing 10.55%. However, credit- and recession-related concerns carved deeply into stock prices late in 2007, pushing some major market measures into negative territory for the year overall, particularly smaller-cap and value-oriented benchmarks. Based largely on a weak U.S. dollar that boosted returns for U.S. investors, the Morgan Stanley Capital InternationalSM Europe, Australasia, and Far East (MSCI® EAFE®) Index - a gauge of developed stock markets outside the United States and Canada - beat most domestic equity measures, gaining 11.33%. Several European countries had outstanding performance, including Finland and Germany, while Australia also did very well. However, fallout from the credit crunch and concerns about export growth tempered U.K. stocks, while fears that Japanese financial companies would become embroiled in the U.S. subprime mortgage crisis contributed to a loss of more than 4% for the Japanese portion of the index. The emerging-markets stock asset class soared 39.78% according to the MSCI Emerging Markets index. The U.S. investment-grade bond market climbed 6.97% as measured by the Lehman Brothers® U.S. Aggregate Index, beating the 2.53% gain for the Merrill Lynch® U.S. High Yield Master II Constrained Index. The emerging-markets bond category shook off a sluggish first half of 2007 to finish the year with a respectable gain of 6.28% as measured by the J.P. Morgan Emerging Markets Bond Index (EMBI) Global, while the Citigroup® Non-U.S. Group of 7 Index - representing the debt performance of major global economies, excluding the United States - rose 13.05%.
From its inception on April 24, 2007, through December 31, 2007, the fund underperformed the 2.03% gain of the Morgan Stanley Capital InternationalSM (MSCI®) US Investable Market Telecommunications Services Index and the S&P 500, which returned 0.53%. (For specific portfolio performance results, please refer to the performance section of this report.) Relative to the MSCI index, the fund was hurt by heavily underweighting integrated telecommunication services stocks AT&T and Verizon, which did well. Poor stock selection in the integrated telecommunication services group detracted as well. The fund also increased its holdings and was overweighted in the alternative carriers group, which underperformed. In terms of individual detractors, alternative carrier Level 3 Communications hurt the fund. Integrated telecom services company Qwest Communications International and Internet software and services stock SAVVIS held back the fund's returns as well. On the other hand, the fund benefited from strong stock selection in the wireless telecommunication services group. Specifically, it was helped by underweighting Sprint Nextel, which performed poorly, and investing in United Kingdom-based Vodafone, a stock not included in the index that did well. The fund's top contributor was application software company Synchronoss Technologies, another out-of-benchmark position.
The views expressed above reflect those of the portfolio manager(s) only through the end of the period as stated on the cover of this report and do not necessarily represent the views of Fidelity or any other person in the Fidelity organization. Any such views are subject to change at any time based upon market or other conditions and Fidelity disclaims any responsibility to update such views. These views may not be relied on as investment advice and, because investment decisions for a Fidelity fund are based on numerous factors, may not be relied on as an indication of trading intent on behalf of any Fidelity fund.
Annual Report
Shareholder Expense Example
As a shareholder of the Fund, you incur two types of costs: (1) transaction costs, including redemption fees, and (2) ongoing costs, including management fees and other Fund expenses. This Example is intended to help you understand your ongoing costs (in dollars) of investing in the Fund and to compare these costs with the ongoing costs of investing in other mutual funds.
The Example is based on an investment of $1,000 invested at the beginning of the period and held for the entire period (July 1, 2007 to
December 31, 2007).
Actual Expenses
The first line of the accompanying table for each class of the Fund provides information about actual account values and actual expenses. You may use the information in this line, together with the amount you invested, to estimate the expenses that you paid over the period. Simply divide your account value by $1,000.00 (for example, an $8,600 account value divided by $1,000.00 = 8.6), then multiply the result by the number in the first line for a class of the Fund under the heading entitled "Expenses Paid During Period" to estimate the expenses you paid on your account during this period. The estimate of expenses does not include any fees or other expenses of any variable annuity or variable life insurance product. If they were, the estimate of expenses you paid during the period would be higher, and your ending account value would be lower. In addition, the Fund, as a shareholder in the underlying Fidelity Central Funds, will indirectly bear its pro rata share of the fees and expenses incurred by the underlying Fidelity Central Funds. These fees and expenses are not included in the Fund's annualized expense ratio used to calculate the expense estimate in the table below.
Hypothetical Example for Comparison Purposes
The second line of the accompanying table for each class of the Fund provides information about hypothetical account values and hypothetical expenses based on a Class' actual expense ratio and an assumed rate of return of 5% per year before expenses, which is not the Class' actual return. The hypothetical account values and expenses may not be used to estimate the actual ending account balance or expenses you paid for the period. You may use this information to compare the ongoing costs of investing in the Fund and other funds. To do so, compare this 5% hypothetical example with the 5% hypothetical examples that appear in the shareholder reports of the other funds. The estimate of expenses does not include any fees or other expenses of any variable annuity or variable life insurance product. If they were, the estimate of expenses you paid during the period would be higher, and your ending account value would be lower. In addition, the Fund, as a shareholder in the underlying Fidelity Central Funds, will indirectly bear its pro rata share of the fees and expenses incurred by the underlying Fidelity Central Funds. These fees and expenses are not included in the Fund's annualized expense ratio used to calculate the expense estimate in the table below.
Please note that the expenses shown in the table are meant to highlight your ongoing costs only and do not reflect any transaction costs. Therefore, the second line of the table is useful in comparing ongoing costs only, and will not help you determine the relative total costs of owning different funds. In addition, if these transactional costs were included, your costs would have been higher.
|
Beginning
Account Value
July 1, 2007
|
Ending
Account Value
December 31, 2007
| Expenses Paid
During Period*
July 1, 2007 to
December 31, 2007 |
Initial Class | | | |
Actual | $ 1,000.00 | $ 906.60 | $ 4.81 |
HypotheticalA | $ 1,000.00 | $ 1,020.16 | $ 5.09 |
Investor Class | | | |
Actual | $ 1,000.00 | $ 906.50 | $ 5.53** |
HypotheticalA | $ 1,000.00 | $ 1,019.41 | $ 5.85** |
A 5% return per year before expenses
* Expenses are equal to each Class' annualized expense ratio (shown in the table below); multiplied by the average account value over the period, multiplied by 184/365 (to reflect the one-half year period).
** If changes to transfer agent contracts and voluntary expense limitations, effective February 1, 2008 had been in effect during the entire period, the annualized expense ratio would have been 1.08% and the expenses paid in the actual and hypothetical examples above would have been $5.19 and $5.50, respectively.
| Annualized
Expense Ratio |
Initial Class | 1.00% |
Investor Class | 1.15% |
Annual Report
Investment Changes
Top Ten Stocks as of December 31, 2007 |
| % of fund's
net assets | % of fund's net assets
6 months ago |
AT&T, Inc. | 14.2 | 24.7 |
Qwest Communications International, Inc. | 9.5 | 9.9 |
Time Warner Telecom, Inc.
Class A (sub. vtg.) | 6.8 | 2.8 |
Verizon Communications, Inc. | 6.7 | 7.6 |
Level 3 Communications, Inc. | 6.3 | 4.8 |
NII Holdings, Inc. | 5.3 | 0.0 |
Global Crossing Ltd. | 5.1 | 0.6 |
Synchronoss Technologies, Inc. | 4.7 | 3.7 |
Vodafone Group PLC sponsored ADR | 4.3 | 2.3 |
SAVVIS, Inc. | 3.6 | 3.0 |
| 66.5 | |
Top Industries (% of fund's net assets) |
As of December 31, 2007 |
| Diversified Telecommunication Services | 59.8% | |
 | Wireless Telecommunication Services | 25.4% | |
| Software | 6.9% | |
| Communications Equipment | 4.4% | |
| Internet Software & Services | 3.6% | |
 | All Others* | (0.1)% | |

* All other industries, short-term investments and net other assets are not included in the pie chart. |
As of June 30, 2007 |
| Diversified Telecommunication Services | 59.7% | |
| Wireless Telecommunication Services | 25.9% | |
| Internet Software & Services | 4.9% | |
| Software | 4.9% | |
| Media | 1.5% | |
| All Others** | 3.1% | |

** Includes short-term investments and net other assets. |
Annual Report
Investments December 31, 2007
Showing Percentage of Net Assets
Common Stocks - 100.3% |
| Shares | | Value |
COMMUNICATIONS EQUIPMENT - 4.4% |
Communications Equipment - 4.4% |
Aruba Networks, Inc. | 3,305 | | $ 49,278 |
Infinera Corp. | 1,200 | | 17,808 |
Juniper Networks, Inc. (a) | 300 | | 9,960 |
Sonus Networks, Inc. (a) | 700 | | 4,081 |
Starent Networks Corp. | 15,604 | | 284,773 |
| | 365,900 |
DIVERSIFIED TELECOMMUNICATION SERVICES - 59.8% |
Alternative Carriers - 19.9% |
Cable & Wireless PLC | 300 | | 1,109 |
Cogent Communications Group, Inc. (a) | 2,100 | | 49,791 |
Global Crossing Ltd. (a) | 19,103 | | 421,221 |
Iliad Group SA | 635 | | 68,207 |
Level 3 Communications, Inc. (a) | 171,200 | | 520,448 |
PAETEC Holding Corp. (a) | 1,800 | | 17,550 |
Time Warner Telecom, Inc. Class A
(sub. vtg.) (a) | 27,558 | | 559,152 |
| | 1,637,478 |
Integrated Telecommunication Services - 39.9% |
AT&T, Inc. | 28,200 | | 1,171,991 |
BT Group PLC | 103 | | 555 |
Cbeyond, Inc. (a) | 2,586 | | 100,828 |
Cincinnati Bell, Inc. (a) | 9,500 | | 45,125 |
Embarq Corp. | 5,800 | | 287,274 |
FairPoint Communications, Inc. | 2,000 | | 26,040 |
NTELOS Holdings Corp. | 36 | | 1,069 |
Qwest Communications International, Inc. | 111,700 | | 783,017 |
Telefonica SA | 1,200 | | 39,036 |
Telefonica SA sponsored ADR | 2,400 | | 234,216 |
Telenor ASA | 1,400 | | 33,425 |
Telenor ASA sponsored ADR | 70 | | 5,037 |
Verizon Communications, Inc. | 12,700 | | 554,863 |
Windstream Corp. | 1,000 | | 13,020 |
| | 3,295,496 |
TOTAL DIVERSIFIED TELECOMMUNICATION SERVICES | | 4,932,974 |
ELECTRONIC EQUIPMENT & INSTRUMENTS - 0.1% |
Electronic Manufacturing Services - 0.1% |
Trimble Navigation Ltd. (a) | 200 | | 6,048 |
INTERNET SOFTWARE & SERVICES - 3.6% |
Internet Software & Services - 3.6% |
SAVVIS, Inc. (a) | 10,600 | | 295,846 |
MEDIA - 0.1% |
Broadcasting & Cable TV - 0.1% |
Virgin Media, Inc. | 500 | | 8,570 |
|
| Shares | | Value |
SOFTWARE - 6.9% |
Application Software - 4.7% |
Synchronoss Technologies, Inc. (a) | 10,937 | | $ 387,607 |
Home Entertainment Software - 2.2% |
Gameloft (a) | 17,314 | | 151,608 |
Glu Mobile, Inc. | 5,589 | | 29,175 |
| | 180,783 |
Systems Software - 0.0% |
Sandvine Corp. (a) | 100 | | 384 |
TOTAL SOFTWARE | | 568,774 |
WIRELESS TELECOMMUNICATION SERVICES - 25.4% |
Wireless Telecommunication Services - 25.4% |
America Movil SAB de CV Series L sponsored ADR | 2,200 | | 135,058 |
American Tower Corp. Class A (a) | 4,900 | | 208,740 |
Bharti Airtel Ltd. (a) | 6,838 | | 172,907 |
Centennial Communications Corp.
Class A (a) | 2,400 | | 22,296 |
Clearwire Corp. | 3,400 | | 46,614 |
Crown Castle International Corp. (a) | 5,900 | | 245,440 |
Leap Wireless International, Inc. (a) | 900 | | 41,976 |
MetroPCS Communications, Inc. | 357 | | 6,944 |
Millicom International Cellular SA (a) | 600 | | 70,764 |
NII Holdings, Inc. (a) | 9,000 | | 434,880 |
Orascom Telecom Holding SAE unit | 500 | | 41,500 |
SBA Communications Corp. Class A (a) | 4,836 | | 163,650 |
Sprint Nextel Corp. | 9,100 | | 119,483 |
Telephone & Data Systems, Inc. | 500 | | 31,300 |
Vodafone Group PLC sponsored ADR | 9,600 | | 358,272 |
| | 2,099,824 |
TOTAL COMMON STOCKS (Cost $8,975,873) | 8,277,936 |
Money Market Funds - 0.7% |
| | | |
Fidelity Cash Central Fund, 4.58% (b)
(Cost $58,827) | 58,827 | | 58,827 |
TOTAL INVESTMENT PORTFOLIO - 101.0% (Cost $9,034,700) | | 8,336,763 |
NET OTHER ASSETS - (1.0)% | | (82,532) |
NET ASSETS - 100% | $ 8,254,231 |
Legend |
(a) Non-income producing |
(b) Affiliated fund that is available only to investment companies and other accounts managed by Fidelity Investments. The rate quoted is the annualized seven-day yield of the fund at period end. A complete unaudited listing of the fund's holdings as of its most recent quarter end is available upon request. |
Affiliated Central Funds |
Information regarding fiscal year to date income earned by the Fund from investments in Fidelity Central Funds is as follows: |
Fund | Income earned |
Fidelity Cash Central Fund | $ 10,634 |
Other Information |
Distribution of investments by country of issue, as a percentage of total net assets, is as follows: |
United States of America | 79.1% |
Bermuda | 5.1% |
United Kingdom | 4.3% |
Spain | 3.3% |
France | 2.7% |
India | 2.1% |
Mexico | 1.6% |
Others (individually less than 1%) | 1.8% |
| 100.0% |
Income Tax Information |
The fund intends to elect to defer to its fiscal year ending December 31, 2008 approximately $185,327 of losses recognized during the period
November 1, 2007 to December 31, 2007. |
See accompanying notes which are an integral part of the financial statements.
Annual Report
Financial Statements
Statement of Assets and Liabilities
| December 31, 2007 |
| | |
Assets | | |
Investment in securities, at value - See accompanying schedule: Unaffiliated issuers
(cost $8,975,873) | $ 8,277,936 | |
Fidelity Central Funds
(cost $58,827) | 58,827 | |
Total Investments (cost $9,034,700) | | $ 8,336,763 |
Cash | | 7,209 |
Receivable for investments sold | | 757 |
Receivable for fund shares sold | | 8,078 |
Dividends receivable | | 6,813 |
Distributions receivable from Fidelity Central Funds | | 361 |
Prepaid expenses | | 40 |
Receivable from investment adviser for expense reductions | | 5,794 |
Total assets | | 8,365,815 |
| | |
Liabilities | | |
Payable for fund shares redeemed | 73,888 | |
Accrued management fee | 3,941 | |
Other affiliated payables | 1,171 | |
Other payables and accrued expenses | 32,584 | |
Total liabilities | | 111,584 |
| | |
Net Assets | | $ 8,254,231 |
Net Assets consist of: | | |
Paid in capital | | $ 9,198,192 |
Accumulated undistributed net realized gain (loss) on investments and foreign currency transactions | | (245,429) |
Net unrealized appreciation (depreciation) on investments and assets and liabilities in foreign currencies | | (698,532) |
Net Assets | | $ 8,254,231 |
Statement of Assets and Liabilities - continued
| December 31, 2007 |
| | |
Initial Class:
Net Asset Value, offering price and redemption price per share ($3,956,478 ÷ 422,536 shares) | | $ 9.36 |
| | |
Investor Class:
Net Asset Value, offering price and redemption price per share ($4,297,753 ÷ 459,539 shares) | | $ 9.35 |
See accompanying notes which are an integral part of the financial statements.
Annual Report
Financial Statements - continued
Statement of Operations
| For the period April 24, 2007
(commencement of operations) to December 31, 2007 |
| | |
Investment Income | | |
Dividends | | $ 101,456 |
Interest | | 1,810 |
Income from Fidelity Central Funds | | 10,634 |
Total income | | 113,900 |
| | |
Expenses | | |
Management fee | $ 38,302 | |
Transfer agent fees | 11,541 | |
Accounting fees and expenses | 2,675 | |
Custodian fees and expenses | 12,117 | |
Independent trustees' compensation | 21 | |
Audit | 32,927 | |
Legal | 11 | |
Miscellaneous | 2,346 | |
Total expenses before reductions | 99,940 | |
Expense reductions | (24,868) | 75,072 |
Net investment income (loss) | | 38,828 |
Realized and Unrealized Gain (Loss) Net realized gain (loss) on: | | |
Investment securities: | | |
Unaffiliated issuers (net of foreign taxes of $1,150) | 160,712 | |
Foreign currency transactions | 374 | |
Total net realized gain (loss) | | 161,086 |
Change in net unrealized appreciation (depreciation) on: Investment securities (net of increase in deferred foreign taxes of $593) | (698,530) | |
Assets and liabilities in foreign currencies | (2) | |
Total change in net unrealized appreciation (depreciation) | | (698,532) |
Net gain (loss) | | (537,446) |
Net increase (decrease) in net assets resulting from operations | | $ (498,618) |
Statement of Changes in Net Assets
| For the period
April 24, 2007
(commencement
of operations) to
December 31, 2007 |
Increase (Decrease) in Net Assets | |
Operations | |
Net investment income (loss) | $ 38,828 |
Net realized gain (loss) | 161,086 |
Change in net unrealized appreciation (depreciation) | (698,532) |
Net increase (decrease) in net assets resulting from operations | (498,618) |
Distributions to shareholders from net investment income | (41,369) |
Distributions to shareholders from net realized gain | (405,249) |
Total distributions | (446,618) |
Share transactions - net increase (decrease) | 9,194,365 |
Redemption fees | 5,102 |
Total increase (decrease) in net assets | 8,254,231 |
| |
Net Assets | |
Beginning of period | - |
End of period | $ 8,254,231 |
See accompanying notes which are an integral part of the financial statements.
Annual Report
Financial Highlights - Initial Class
Years ended December 31, | 2007 H |
Selected Per-Share Data | |
Net asset value, beginning of period | $ 10.00 |
Income from Investment Operations | |
Net investment income (loss) E | .05 |
Net realized and unrealized gain (loss) | (.17) |
Total from investment operations | (.12) |
Distributions from net investment income | (.05) |
Distributions from net realized gain | (.48) |
Total distributions | (.53) |
Redemption fees added to paid in capital E | .01 |
Net asset value, end of period | $ 9.36 |
Total Return B, C, D | (1.18)% |
Ratios to Average Net Assets F, I | |
Expenses before reductions | 1.37% A |
Expenses net of fee waivers, if any | 1.00% A |
Expenses net of all reductions | 1.00% A |
Net investment income (loss) | .63% A |
Supplemental Data | |
Net assets, end of period (000 omitted) | $ 3,956 |
Portfolio turnover rate G | 160% A |
A Annualized
B Total returns for periods of less than one year are not annualized.
C Total returns do not reflect charges attributable to your insurance company's separate account. Inclusion of these charges would reduce the total returns shown.
D Total returns would have been lower had certain expenses not been reduced during the periods shown.
E Calculated based on average shares outstanding during the period.
F Fees and expenses of the underlying Fidelity Central Funds are not included in the Fund's expense ratio. The Fund indirectly bears its proportionate share of the expenses of any underlying Fidelity Central Funds.
G Amount does not include the portfolio activity of any underlying Fidelity Central Funds.
H For the period April 24, 2007 (commencement of operations) to December 31, 2007.
I Expense ratios reflect operating expenses of the class. Expenses before reductions do not reflect amounts reimbursed by the investment adviser or expense offset arrangements and do not represent the amount paid by the class during periods when reimbursements or reductions occur. Expense ratios before reductions for start-up periods may not be representative of longer-term operating periods. Expenses net of fee waivers reflect expenses after reimbursement by the investment adviser but prior to reductions from expense offset arrangements. Expenses net of all reductions represent the net expenses paid by the class.
Financial Highlights - Investor Class
Years ended December 31, | 2007 H |
Selected Per-Share Data | |
Net asset value, beginning of period | $ 10.00 |
Income from Investment Operations | |
Net investment income (loss) E | .04 |
Net realized and unrealized gain (loss) | (.17) |
Total from investment operations | (.13) |
Distributions from net investment income | (.05) |
Distributions from net realized gain | (.48) |
Total distributions | (.53) |
Redemption fees added to paid in capital E | .01 |
Net asset value, end of period | $ 9.35 |
Total Return B, C, D | (1.28)% |
Ratios to Average Net Assets F, I | |
Expenses before reductions | 1.50% A |
Expenses net of fee waivers, if any | 1.15% A |
Expenses net of all reductions | 1.15% A |
Net investment income (loss) | .48% A |
Supplemental Data | |
Net assets, end of period (000 omitted) | $ 4,298 |
Portfolio turnover rate G | 160% A |
A Annualized
B Total returns for periods of less than one year are not annualized.
C Total returns do not reflect charges attributable to your insurance company's separate account. Inclusion of these charges would reduce the total returns shown.
D Total returns would have been lower had certain expenses not been reduced during the periods shown.
E Calculated based on average shares outstanding during the period.
F Fees and expenses of the underlying Fidelity Central Funds are not included in the Fund's expense ratio. The Fund indirectly bears its proportionate share of the expenses of any underlying Fidelity Central Funds.
G Amount does not include the portfolio activity of any underlying Fidelity Central Funds.
H For the period April 24, 2007 (commencement of operations) to December 31, 2007.
I Expense ratios reflect operating expenses of the class. Expenses before reductions do not reflect amounts reimbursed by the investment adviser or expense offset arrangements and do not represent the amount paid by the class during periods when reimbursements or reductions occur. Expense ratios before reductions for start-up periods may not be representative of longer-term operating periods. Expenses net of fee waivers reflect expenses after reimbursement by the investment adviser but prior to reductions from expense offset arrangements. Expenses net of all reductions represent the net expenses paid by the class.
See accompanying notes which are an integral part of the financial statements.
Annual Report
Notes to Financial Statements
For the period ended December 31, 2007
1. Organization.
VIP Telecommunications Portfolio (the Fund) is a non-diversified fund of Variable Insurance Products Fund IV, (the trust) and is authorized to issue an unlimited number of shares. The trust is registered under the Investment Company Act of 1940, as amended (the 1940 Act), as an open-end management investment company organized as a Massachusetts business trust. Shares of the Fund may only be purchased by insurance companies for the purpose of funding variable annuity or variable life insurance contracts. The Fund offers the following classes of shares: Initial Class shares and Investor Class shares. All classes have equal rights and voting privileges, except for matters affecting a single class. Investment income, realized and unrealized capital gains and losses, the common expenses of the Fund, and certain fund-level expense reductions, if any, are allocated on a pro rata basis to each class based on the relative net assets of each class to the total net assets of the Fund. Each class differs with respect to transfer agent fees incurred. Certain expense reductions also differ by class.
2. Investments in Fidelity Central Funds.
The Fund may invest in Fidelity Central Funds, which are open-end investment companies available only to other investment companies and accounts managed by Fidelity Management & Research Company (FMR) and its affiliates. The Fund's Schedule of Investments lists each of the Fidelity Central Funds as an investment of the Fund, but does not include the underlying holdings of each Fidelity Central Fund. As an Investing Fund, the Fund indirectly bears its proportionate share of the expenses of the underlying Fidelity Central Funds.
The Money Market Central Funds seek preservation of capital and current income and are managed by Fidelity Investments Money Management, Inc. (FIMM), an affiliate of FMR.
A complete list of holdings for each Fidelity Central Fund is available upon request or at the SEC's web site at www.sec.gov. In addition, the financial statements of the Fidelity Central Funds, which are not covered by the Fund's Report of Independent Registered Public Accounting Firm, are available on the SEC's web site or upon request.
3. Significant Accounting Policies.
The financial statements have been prepared in conformity with accounting principles generally accepted in the United States of America, which require management to make certain estimates and assumptions at the date of the financial statements. The following summarizes the significant accounting policies of the Fund:
Security Valuation. Investments are valued and net asset value (NAV) per share is calculated (NAV calculation) as of the close of business of the New York Stock Exchange (NYSE), normally 4:00 p.m. Eastern time. Wherever possible, the Fund uses independent pricing services approved by the Board of Trustees to value its investments.
Equity securities, including restricted securities, for which market quotations are readily available, are valued at the last reported sale price or official closing price as reported by an independent pricing service on the primary market or exchange on which they are traded. In the event there were no sales during the day or closing prices are not available, securities are valued at the last quoted bid price. Investments in open-end mutual funds, including the Fidelity Central Funds, are valued at their closing net asset value each business day. Short-term securities with remaining maturities of sixty days or less for which quotations are not readily available are valued at amortized cost, which approximates value.
When current market prices or quotations are not readily available or do not accurately reflect fair value, valuations may be determined in accordance with procedures adopted by the Board of Trustees. For example, when developments occur between the close of a market and the close of the NYSE that may materially affect the value of some or all of the securities, or when trading in a security is halted, those securities may be fair valued. Factors used in the determination of fair value may include monitoring news to identify significant market or security specific events such as changes in the value of U.S. securities markets, reviewing developments in foreign markets and evaluating the performance of ADRs, futures contracts and exchange-traded funds. Because the Fund's utilization of fair value pricing depends on market activity, the frequency with which fair value pricing is used cannot be predicted and may be utilized to a significant extent. The value of securities used for NAV calculation under fair value pricing may differ from published prices for the same securities.
Foreign Currency. The Fund uses foreign currency contracts to facilitate transactions in foreign-denominated securities. Losses from these transactions may arise from changes in the value of the foreign currency or if the counterparties do not perform under the contracts' terms.
Foreign-denominated assets, including investment securities, and liabilities are translated into U.S. dollars at the exchange rate at period end. Purchases and sales of investment securities, income and dividends received and expenses denominated in foreign currencies are translated into U.S. dollars at the exchange rate in effect on the transaction date.
The effects of exchange rate fluctuations on investments are included with the net realized and unrealized gain (loss) on investment securities. Other foreign currency transactions resulting in realized and unrealized gain (loss) are disclosed separately.
Annual Report
3. Significant Accounting Policies - continued
Investment Transactions and Income. For financial reporting purposes, the Fund's investment holdings and NAV include trades executed through the end of the last business day of the period. The NAV for processing shareholder transactions includes trades executed through the end of the prior business day. Gains and losses on securities sold are determined on the basis of identified cost. Dividend income is recorded on the ex-dividend date, except for certain dividends from foreign securities where the ex-dividend date may have passed, which are recorded as soon as the Fund is informed of the ex-dividend date. Non-cash dividends included in dividend income, if any, are recorded at the fair market value of the securities received. Interest income and distributions from the Fidelity Central Funds are accrued as earned. Interest income includes coupon interest and amortization of premium and accretion of discount on debt securities. Investment income is recorded net of foreign taxes withheld where recovery of such taxes is uncertain.
Expenses. Most expenses of the trust can be directly attributed to a fund. Expenses which cannot be directly attributed are apportioned among each Fund in the trust. Expense estimates are accrued in the period to which they relate and adjustments are made when actual amounts are known.
Income Tax Information and Distributions to Shareholders. The Fund intends to qualify as a regulated investment company by distributing substantially all of its taxable income and realized gains under Subchapter M of the Internal Revenue Code and filing its U.S. federal tax return. As a result, no provision for income taxes is required. The Fund is subject to the provisions of FASB Interpretation No. 48, Accounting for Uncertainties in Income Taxes (FIN 48). FIN 48 sets forth a minimum threshold for financial statement recognition of the benefit of a tax position taken or expected to be taken in a tax return. There are no unrecognized tax benefits in the accompanying financial statements in connection with the tax positions expected to be taken in the initial filing of the Fund's federal tax return. Foreign taxes are provided for based on the Fund's understanding of the tax rules and rates that exist in the foreign markets in which it invests.
Distributions are recorded on the ex-dividend date. Income dividends and capital gain distributions are declared separately for each class. Income and capital gain distributions are determined in accordance with income tax regulations, which may differ from generally accepted accounting principles.
Capital accounts within the financial statements are adjusted for permanent book-tax differences. These adjustments have no impact on net assets or the results of operations. Temporary book-tax differences will reverse in a subsequent period.
Book-tax differences are primarily due to foreign currency transactions, certain foreign taxes, losses deferred due to wash sales and excise tax regulations.
The tax-basis components of distributable earnings and the federal tax cost as of period end were as follows:
Unrealized appreciation | $ 453,845 |
Unrealized depreciation | (1,212,478) |
Net unrealized appreciation (depreciation) | (758,633) |
| |
Cost for federal income tax purposes | $ 9,095,396 |
The tax character of distributions paid was as follows:
| December 31, 2007 |
Ordinary Income | $ 446,618 |
Trading (Redemption) Fees. Shares held less than 60 days are subject to a redemption fee equal to 1% of the proceeds of the redeemed shares. All redemption fees, including any estimated redemption fees paid by FMR, are retained by the Fund and accounted for as an addition to paid in capital.
New Accounting Pronouncement. In September 2006, Statement of Financial Accounting Standards No. 157, Fair Value Measurements
(SFAS 157), was issued and is effective for fiscal years beginning after November 15, 2007. SFAS 157 defines fair value, establishes a framework for measuring fair value and expands disclosures about fair value measurements. Management is currently evaluating the impact the adoption of SFAS 157 will have on the Fund's financial statement disclosures.
Annual Report
Notes to Financial Statements - continued
4. Operating Policies.
Repurchase Agreements. FMR has received an Exemptive Order from the Securities and Exchange Commission (the SEC) which permits the Fund and other affiliated entities of FMR to transfer uninvested cash balances into joint trading accounts which are then invested in repurchase agreements. The Fund may also invest directly with institutions in repurchase agreements. Repurchase agreements are collateralized by government or non-government securities. Upon settlement date, collateral is held in segregated accounts with custodian banks and may be obtained in the event of a default of the counterparty. The Fund monitors, on a daily basis, the value of the collateral to ensure it is at least equal to the principal amount of the repurchase agreement (including accrued interest). In the event of a default by the counterparty, realization of the collateral proceeds could be delayed, during which time the value of the collateral may decline.
5. Purchases and Sales of Investments.
Purchases and sales of securities, other than short-term securities, aggregated $19,296,439 and $10,481,278, respectively.
6. Fees and Other Transactions with Affiliates.
Management Fee. FMR and its affiliates provide the Fund with investment management related services for which the Fund pays a monthly management fee. The management fee is the sum of an individual fund fee rate that is based on an annual rate of .30% of the Fund's average net assets and a group fee rate that averaged .26% during the period. The group fee rate is based upon the average net assets of all the mutual funds advised by FMR. The group fee rate decreases as assets under management increase and increases as assets under management decrease. For the period, the total annualized management fee rate was .56% of the Fund's average net assets.
Transfer Agent Fees. Fidelity Investments Institutional Operations Company, Inc. (FIIOC), an affiliate of FMR, is the Fund's transfer, dividend disbursing, and shareholder servicing agent. FIIOC receives an asset-based fee with respect to each class. Each class with the exception of Investor Class pays a transfer agent fee, excluding out of pocket expenses, equal to an annual rate of .07% of average net assets. Investor Class pays a monthly asset-based transfer agent fee of .18% of average net assets. The total transfer agent fees paid by each class to FIIOC, including out of pocket expenses, were as follows:
Initial Class | $ 3,778 |
Investor Class | 7,763 |
| $ 11,541 |
Effective February 1, 2008, the Board of Trustees approved a decrease to Investor Class' asset-based fee from .18% to .15% of average net assets.
Accounting Fees. Fidelity Service Company, Inc. (FSC), an affiliate of FMR, maintains the Fund's accounting records. The fee is based on the level of average net assets for the month.
Brokerage Commissions. The Fund placed a portion of its portfolio transactions with brokerage firms which are affiliates of the investment adviser. The commissions paid to these affiliated firms were $1,849 for the period.
7. Expense Reductions.
FMR voluntarily agreed to reimburse each class to the extent annual operating expenses exceeded certain levels of average net assets as noted in the table below. Some expenses, for example interest expense, are excluded from this reimbursement.
The following classes were in reimbursement during the period:
| Expense
Limitations | Reimbursement
from adviser |
| | |
Initial Class | 1.00% | $ 12,746 |
Investor Class | 1.15% | 12,122 |
| | $ 24,868 |
Effective February 1, 2008, the expense limitation changed to 1.08% for Investor Class.
8. Other.
The Fund's organizational documents provide former and current trustees and officers with a limited indemnification against liabilities arising in connection with the performance of their duties to the Fund. In the normal course of business, the Fund may also enter into contracts that provide general indemnifications. The Fund's maximum exposure under these arrangements is unknown as this would be dependent on future claims that may be made against the Fund. The risk of material loss from such claims is considered remote.
At the end of the period, FMR or its affiliates were the owners of record of 100% of the total outstanding shares of the Fund.
Annual Report
9. Distributions to Shareholders.
Distributions to shareholders of each class were as follows:
Year ended December 31, | 2007 A |
From net investment income | |
Initial Class | $ 19,585 |
Investor Class | 21,784 |
Total | $ 41,369 |
From net realized gain | |
Initial Class | $ 191,851 |
Investor Class | 213,398 |
Total | $ 405,249 |
A For the period April 24, 2007 (commencement of operations) to December 31, 2007.
10. Share Transactions.
Transactions for each class of shares were as follows:
| Shares | Dollars |
Years ended December 31, | 2007 A | 2007 A |
Initial Class | | |
Shares sold | 673,203 | $ 7,061,076 |
Reinvestment of distributions | 22,280 | 211,436 |
Shares redeemed | (272,947) | (2,817,196) |
Net increase (decrease) | 422,536 | $ 4,455,316 |
Investor Class | | |
Shares sold | 695,098 | $ 7,280,048 |
Reinvestment of distributions | 24,808 | 235,182 |
Shares redeemed | (260,367) | (2,776,181) |
Net increase (decrease) | 459,539 | $ 4,739,049 |
A For the period April 24, 2007 (commencement of operations) to December 31, 2007.
Annual Report
Report of Independent Registered Public Accounting Firm
To the Trustees of Variable Insurance Products Fund IV and the Shareholders of VIP Telecommunications Portfolio:
In our opinion, the accompanying statement of assets and liabilities, including the schedule of investments, and the related statements of operations and of changes in net assets and the financial highlights present fairly, in all material respects, the financial position of VIP Telecommunications Portfolio (a fund of Variable Insurance Products Fund IV) at December 31, 2007, and the results of its operations, the changes in its net assets and the financial highlights for the period April 24, 2007 (commencement of operations) through December 31, 2007, in conformity with accounting principles generally accepted in the United States of America. These financial statements and financial highlights (hereafter referred to as "financial statements") are the responsibility of the VIP Telecommunications Portfolio's management. Our responsibility is to express an opinion on these financial statements based on our audit. We conducted our audit of these financial statements in accordance with the standards of the Public Company Accounting Oversight Board (United States). Those standards require that we plan and perform the audit to obtain reasonable assurance about whether the financial statements are free of material misstatement. An audit includes examining, on a test basis, evidence supporting the amounts and disclosures in the financial statements, assessing the accounting principles used and significant estimates made by management, and evaluating the overall financial statement presentation. We believe that our audit, which included confirmation of securities at December 31, 2007 by correspondence with the custodian and brokers, provides a reasonable basis for our opinion.
/s/ PricewaterhouseCoopers LLP
PricewaterhouseCoopers LLP
Boston, Massachusetts
February 19, 2008
Annual Report
Trustees and Officers
The Trustees, Members of the Advisory Board, and executive officers of the trust and fund, as applicable, are listed below. The Board of Trustees governs the fund and is responsible for protecting the interests of shareholders. The Trustees are experienced executives who meet periodically throughout the year to oversee the fund's activities, review contractual arrangements with companies that provide services to the fund, and review the fund's performance. Except for James C. Curvey, each of the Trustees oversees 373 funds advised by FMR or an affiliate. Mr. Curvey oversees 368 funds advised by FMR or an affiliate.
The Trustees hold office without limit in time except that (a) any Trustee may resign; (b) any Trustee may be removed by written instrument, signed by at least two-thirds of the number of Trustees prior to such removal; (c) any Trustee who requests to be retired or who has become incapacitated by illness or injury may be retired by written instrument signed by a majority of the other Trustees; and (d) any Trustee may be removed at any special meeting of shareholders by a two-thirds vote of the outstanding voting securities of the trust. Each Trustee who is not an interested person (as defined in the 1940 Act) (Independent Trustee), shall retire not later than the last day of the calendar year in which his or her 72nd birthday occurs. The Independent Trustees may waive this mandatory retirement age policy with respect to individual Trustees. The executive officers and Advisory Board Members hold office without limit in time, except that any officer and Advisory Board Member may resign or may be removed by a vote of a majority of the Trustees at any regular meeting or any special meeting of the Trustees. Except as indicated, each individual has held the office shown or other offices in the same company for the past five years.
The fund's Statement of Additional Information (SAI) includes more information about the Trustees. To request a free copy, call Fidelity at 1-877-208-0098.
Interested Trustees*:
Correspondence intended for each Trustee who is an interested person may be sent to Fidelity Investments, 82 Devonshire Street, Boston, Massachusetts 02109.
Name, Age; Principal Occupation |
Edward C. Johnson 3d (77) |
| Year of Election or Appointment: 1983 Mr. Johnson is Chairman of the Board of Trustees. Mr. Johnson serves as President (2006-present), Chief Executive Officer, Chairman, and a Director of FMR LLC; Chairman and a Director of FMR; Chairman and a Director of Fidelity Research & Analysis Company (FRAC); Chairman and a Director of Fidelity Investments Money Management, Inc.; and Chairman (2001-present) and a Director of FMR Co., Inc. In addition, Mr. Johnson serves as Chairman and Director of Fidelity International Limited (FIL). Mr. Edward C. Johnson 3d and Mr. Arthur E. Johnson are not related. |
James C. Curvey (72) |
| Year of Election or Appointment: 2007 Mr. Curvey also serves as Trustee (2007-present) or Member of the Advisory Board (2007-present) of other investment companies advised by FMR. Mr. Curvey is a Director of FMR and FMR Co., Inc. (2007-present). Mr. Curvey is also Vice Chairman (2006-present) and Director of FMR LLC. Mr. Curvey joined Fidelity in 1982 and served in numerous senior management positions, including President and Chief Operating Officer of FMR LLC (1997-2000) and President of Fidelity Strategic Investments (2000-2002). In addition, he serves as a member of the Board of Directors of Geerlings & Wade, Inc. (wine distribution). |
* Trustees have been determined to be "Interested Trustees" by virtue of, among other things, their affiliation with the trust or various entities under common control with FMR. FMR Corp. merged with and into FMR LLC on October 1, 2007. Any references to FMR LLC for prior periods are deemed to be references to the prior entity.
Independent Trustees:
Correspondence intended for each Independent Trustee (that is, the Trustees other than the Interested Trustees) may be sent to Fidelity Investments, P.O. Box 55235, Boston, Massachusetts 02205-5235.
Name, Age; Principal Occupation |
Dennis J. Dirks (59) |
| Year of Election or Appointment: 2005 Prior to his retirement in May 2003, Mr. Dirks was Chief Operating Officer and a member of the Board of The Depository Trust & Clearing Corporation (DTCC) (1999-2003). He also served as President, Chief Operating Officer, and Board member of The Depository Trust Company (DTC) (1999-2003) and President and Board member of the National Securities Clearing Corporation (NSCC) (1999-2003). In addition, Mr. Dirks served as Chief Executive Officer and Board member of the Government Securities Clearing Corporation (2001-2003) and Chief Executive Officer and Board member of the Mortgage-Backed Securities Clearing Corporation (2001-2003). Mr. Dirks also serves as a Trustee and a member of the Finance Committee of Manhattan College (2005-present) and a Trustee and a member of the Finance Committee of AHRC of Nassau County (2006-present). |
Albert R. Gamper, Jr. (65) |
| Year of Election or Appointment: 2006 Prior to his retirement in December 2004, Mr. Gamper served as Chairman of the Board of CIT Group Inc. (commercial finance). During his tenure with CIT Group Inc. Mr. Gamper served in numerous senior management positions, including Chairman (1987-1989; 1999-2001; 2002-2004), Chief Executive Officer (1987-2004), and President (1989-2002). He currently serves as a member of the Board of Directors of Public Service Enterprise Group (utilities, 2001-present), Chairman of the Board of Governors, Rutgers University (2004-present), and Chairman of the Board of Saint Barnabas Health Care System. |
George H. Heilmeier (71) |
| Year of Election or Appointment: 2004 Dr. Heilmeier is Chairman Emeritus of Telcordia Technologies (communication software and systems), where prior to his retirement, he served as company Chairman and Chief Executive Officer. He currently serves on the Boards of Directors of The Mitre Corporation (systems engineering and information technology support for the government), and HRL Laboratories (private research and development, 2004-present). He is Chairman of the General Motors Science & Technology Advisory Board and a Life Fellow of the Institute of Electrical and Electronics Engineers (IEEE). Dr. Heilmeier is a member of the Defense Science Board and the National Security Agency Advisory Board. He is also a member of the National Academy of Engineering, the American Academy of Arts and Sciences, and the Board of Overseers of the School of Engineering and Applied Science of the University of Pennsylvania. Previously, Dr. Heilmeier served as a Director of TRW Inc. (automotive, space, defense, and information technology, 1992-2002), Compaq (1994-2002), Automatic Data Processing, Inc. (ADP) (technology-based business outsourcing, 1995-2002), INET Technologies Inc. (telecommunications network surveillance, 2001-2004), and Teletech Holdings (customer management services). He is the recipient of the 2005 Kyoto Prize in Advanced Technology for his invention of the liquid crystal display, and a member of the Consumer Electronics Hall of Fame. |
James H. Keyes (67) |
| Year of Election or Appointment: 2007 Prior to his retirement in 2003, Mr. Keyes was Chairman, President, and Chief Executive Officer of Johnson Controls, Inc. (automotive supplier, 1993-2003). He currently serves as a member of the boards of LSI Logic Corporation (semiconductor technologies), Navistar International Corporation (manufacture and sale of trucks, buses, and diesel engines, 2002-present), and Pitney Bowes, Inc. (integrated mail, messaging, and document management solutions). |
Marie L. Knowles (61) |
| Year of Election or Appointment: 2001 Prior to Ms. Knowles' retirement in June 2000, she served as Executive Vice President and Chief Financial Officer of Atlantic Richfield Company (ARCO) (diversified energy, 1996-2000). From 1993 to 1996, she was a Senior Vice President of ARCO and President of ARCO Transportation Company. She served as a Director of ARCO from 1996 to 1998. She currently serves as a Director of Phelps Dodge Corporation (copper mining and manufacturing) and McKesson Corporation (healthcare service, 2002-present). Ms. Knowles is a Trustee of the Brookings Institution and the Catalina Island Conservancy and also serves as a member of the Advisory Board for the School of Engineering of the University of Southern California. |
Ned C. Lautenbach (63) |
| Year of Election or Appointment: 2000 Mr. Lautenbach is Chairman of the Independent Trustees (2006-present). Mr. Lautenbach has been a partner of Clayton, Dubilier & Rice, Inc. (private equity investment firm) since September 1998. Previously, Mr. Lautenbach was with the International Business Machines Corporation (IBM) from 1968 until his retirement in 1998. Mr. Lautenbach serves as a Director of Sony Corporation (2006-present) and Eaton Corporation (diversified industrial) as well as the Philharmonic Center for the Arts in Naples, Florida. He also is a member of the Board of Trustees of Fairfield University (2005-present), as well as a member of the Council on Foreign Relations. |
Cornelia M. Small (63) |
| Year of Election or Appointment: 2005 Ms. Small is a member (2000-present) and Chairperson (2002-present) of the Investment Committee, and a member (2002-present) of the Board of Trustees of Smith College. Previously, she served as Chief Investment Officer (1999-2000), Director of Global Equity Investments (1996-1999), and a member of the Board of Directors of Scudder, Stevens & Clark (1990-1997) and Scudder Kemper Investments (1997-1999). In addition, Ms. Small served as Co-Chair (2000-2003) of the Annual Fund for the Fletcher School of Law and Diplomacy. |
William S. Stavropoulos (68) |
| Year of Election or Appointment: 2001 Mr. Stavropoulos is Chairman Emeritus of the Board of Directors of The Dow Chemical Company. Since joining The Dow Chemical Company in 1967, Mr. Stavropoulos served in numerous senior management positions, including President (1993-2000; 2002-2003), CEO (1995-2000; 2002-2004), and Chairman of the Executive Committee (2000-2004). Currently, he is a Director of NCR Corporation (data warehousing and technology solutions), Chemical Financial Corporation, Maersk Inc. (industrial conglomerate, 2002-present), Tyco International, Inc. (multinational manufacturing and services, 2007-present), and a member of the Advisory Board for Metalmark Capital (private equity investment firm, 2005-present). He is a special advisor to Clayton, Dubilier & Rice, Inc., a private equity investment firm. He also serves as a member of the Board of Trustees of the American Enterprise Institute for Public Policy Research. In addition, Mr. Stavropoulos is a member of The Business Council, J.P. Morgan International Council and the University of Notre Dame Advisory Council for the College of Science. |
Kenneth L. Wolfe (68) |
| Year of Election or Appointment: 2005 Mr. Wolfe is Chairman and a Director of Hershey Foods Corporation (2007-present), where prior to his retirement in 2001, he was Chairman and Chief Executive Officer. Mr. Wolfe currently serves as a member of the board of Revlon Inc. (2004-present). Previously, Mr. Wolfe served as a member of the boards of Adelphia Communications Corporation (2003-2006) and Bausch & Lomb, Inc. (1993-2007). |
Advisory Board Members and Executive Officers**:
Correspondence intended for Mr. Mauriello, Mr. Thomas, Mr. Wiley, Mr. Lacy, and Mr. Arthur Johnson may be sent to Fidelity Investments, P.O. Box 55235, Boston, Massachusetts 02205-5235. Correspondence intended for each executive officer and Mr. Lynch may be sent to Fidelity Investments, 82 Devonshire Street, Boston, Massachusetts 02109.
Name, Age; Principal Occupation |
Arthur E. Johnson (60) |
| Year of Election or Appointment: 2008 Member of the Advisory Board of Variable Insurance Products Fund IV. Mr. Johnson serves as Senior Vice President of Corporate Strategic Development of Lockheed Martin Corporation (defense contractor). In addition, Mr. Johnson serves as a member of the Board of Directors of AGL Resources, Inc. (holding company, 2002-present), and IKON Office Solutions, Inc. (document management systems and services). Mr. Arthur E. Johnson and Mr. Edward C. Johnson 3d are not related. |
Alan J. Lacy (54) |
| Year of Election or Appointment: 2008 Member of the Advisory Board of Variable Insurance Products Fund IV. Mr. Lacy serves as Senior Adviser (2007-present) of Oak Hill Capital Partners, L.P. (a private equity firm). Mr. Lacy also served as Vice Chairman and Chief Executive Officer of Sears Holdings Corporation and Sears, Roebuck and Co. (retail, 2005-2006; 2000-2005). In addition, Mr. Lacy serves as a member of the Board of Directors of The Western Union Company (global money transfer, 2006-present) and Bristol-Myers Squibb (global pharmaceuticals, 2007-present). Mr. Lacy is a Trustee of the National Parks Conservation Association and The Field Museum of Natural History. |
Peter S. Lynch (63) |
| Year of Election or Appointment: 2003 Member of the Advisory Board of Variable Insurance Products Fund IV. Mr. Lynch is Vice Chairman and a Director of FMR, and Vice Chairman (2001-present) and a Director of FMR Co., Inc. Previously, Mr. Lynch served as a Trustee of the Fidelity funds (1990-2003). In addition, he serves as a Trustee of Boston College and as the Chairman of the Inner-City Scholarship Fund. |
Joseph Mauriello (63) |
| Year of Election or Appointment: 2007 Member of the Advisory Board of Variable Insurance Products Fund IV. Prior to his retirement in January 2006, Mr. Mauriello served in numerous senior management positions including Deputy Chairman and Chief Operating Officer (2004-2005), and Vice Chairman of Financial Services (2002-2004) of KPMG LLP US (professional services firm, 1965-2005). Mr. Mauriello currently serves as a member of the Board of Directors of XL Capital Ltd. (global insurance and re-insurance company, 2006-present) and of Arcadia Resources Inc. (health care services and products, 2007-present). He also served as a Director of the Hamilton Funds of the Bank of New York (2006-2007). |
David M. Thomas (58) |
| Year of Election or Appointment: 2007 Member of the Advisory Board of Variable Insurance Products Fund IV. Previously, Mr. Thomas served as Executive Chairman (2005-2006) and Chairman and Chief Executive Officer (2000-2005) of IMS Health, Inc. (pharmaceutical and healthcare information solutions). In addition, Mr. Thomas serves as a member of the Board of Directors of Fortune Brands, Inc. (consumer products holding company), and Interpublic Group of Companies, Inc. (marketing communication, 2004-present). |
Michael E. Wiley (57) |
| Year of Election or Appointment: 2007 Member of the Advisory Board of Variable Insurance Products Fund IV. Mr. Wiley also serves as a member of the Board of Trustees of the University of Tulsa (2000-2006; 2007-present). He serves as a Director of Tesoro Corporation (independent oil refiner and marketer, 2005-present), and a Director of Bill Barrett Corporation (exploration and production company, 2005-present). In addition, he also serves as a Director of Post Oak Bank (privately-held bank, 2004-present). Previously, Mr. Wiley served as a Sr. Energy Advisor of Katzenbach Partners, LLC (consulting firm, 2006-2007), as an Advisory Director of Riverstone Holdings (private investment firm), Chairman, President, and CEO of Baker Hughes, Inc. (oilfield services company, 2000-2004), and as Director of Spinnaker Exploration Company (exploration and production company, 2001-2005). |
Kimberley H. Monasterio (44) |
| Year of Election or Appointment: 2007 President and Treasurer of VIP Telecommunications. Ms. Monasterio also serves as President and Treasurer of other Fidelity funds (2007-present) and is an employee of FMR (2004-present). Previously, Ms. Monasterio served as Deputy Treasurer of the Fidelity funds (2004-2006). Before joining Fidelity Investments, Ms. Monasterio served as Treasurer (2000-2004) and Chief Financial Officer (2002-2004) of the Franklin Templeton Funds and Senior Vice President of Franklin Templeton Services, LLC (2000-2004). |
Brian B. Hogan (43) |
| Year of Election or Appointment: 2007 Vice President of VIP Telecommunications. Mr. Hogan also serves as Vice President of Sector Funds (2007-present). Mr. Hogan is Senior Vice President of Equity Research (2006-present). Mr. Hogan also serves as Vice President of FMR and FMR Co., Inc. Previously, Mr. Hogan served as a portfolio manager. |
Eric D. Roiter (59) |
| Year of Election or Appointment: 2007 Secretary of VIP Telecommunications. He also serves as Secretary of other Fidelity funds; Vice President, General Counsel, and Secretary of FMR Co., Inc. (2001-present) and FMR; Assistant Secretary of Fidelity Management & Research (U.K.) Inc. (2001-present), Fidelity Research & Analysis Company (2001-present), and Fidelity Investments Money Management, Inc. (2001-present). Mr. Roiter is an Adjunct Member, Faculty of Law, at Boston College Law School (2003-present). Previously, Mr. Roiter served as Vice President and Secretary of Fidelity Distributors Corporation (FDC) (1998-2005). |
John B. McGinty, Jr. (45) |
| Year of Election or Appointment: 2008 Assistant Secretary of VIP Telecommunications. Mr. McGinty also serves as Assistant Secretary of other Fidelity funds (2008-present) and is an employee of FMR LLC (2004-present). Mr. McGinty also serves as Senior Vice President, Secretary, and Chief Legal Officer of FDC (2007-present). Before joining Fidelity Investments, Mr. McGinty practiced law at Ropes & Gray, LLP. |
R. Stephen Ganis (41) |
| Year of Election or Appointment: 2007 Anti-Money Laundering (AML) officer of VIP Telecommunications. Mr. Ganis also serves as AML officer of other Fidelity funds (2006-present) and FMR LLC (2003-present). Before joining Fidelity Investments, Mr. Ganis practiced law at Goodwin Procter, LLP (2000-2002). |
Joseph B. Hollis (59) |
| Year of Election or Appointment: 2007 Chief Financial Officer of VIP Telecommunications. Mr. Hollis also serves as Chief Financial Officer of other Fidelity funds. Mr. Hollis is President of Fidelity Pricing and Cash Management Services (FPCMS) (2005-present). Mr. Hollis also serves as President and Director of Fidelity Service Company, Inc. (2006-present). Previously, Mr. Hollis served as Senior Vice President of Cash Management Services (1999-2002) and Investment Management Operations (2002-2005). |
Kenneth A. Rathgeber (60) |
| Year of Election or Appointment: 2007 Chief Compliance Officer of VIP Telecommunications. Mr. Rathgeber also serves as Chief Compliance Officer of other Fidelity funds (2004-present) and Executive Vice President of Risk Oversight for Fidelity Investments (2002-present). He is Chief Compliance Officer of FMR (2005-present), FMR Co., Inc. (2005-present), Fidelity Management & Research (U.K.) Inc. (2005-present), Fidelity Research & Analysis Company (2005-present), Fidelity Investments Money Management, Inc. (2005-present), and Strategic Advisers, Inc. (2005-present). Previously, Mr. Rathgeber served as Executive Vice President and Chief Operating Officer for Fidelity Investments Institutional Services Company, Inc. (1998-2002). |
Bryan A. Mehrmann (46) |
| Year of Election or Appointment: 2007 Deputy Treasurer of VIP Telecommunications. Mr. Mehrmann also serves as Deputy Treasurer of other Fidelity funds (2005-present) and is an employee of FMR. Previously, Mr. Mehrmann served as Vice President of Fidelity Investments Institutional Services Group (FIIS)/Fidelity Investments Institutional Operations Corporation, Inc. (FIIOC) Client Services (1998-2004). |
Kenneth B. Robins (38) |
| Year of Election or Appointment: 2007 Deputy Treasurer of VIP Telecommunications. Mr. Robins also serves as Deputy Treasurer of other Fidelity funds (2005-present) and is an employee of FMR (2004-present). Before joining Fidelity Investments, Mr. Robins worked at KPMG LLP, where he was a partner in KPMG's department of professional practice (2002-2004) and a Senior Manager (1999-2000). In addition, Mr. Robins served as Assistant Chief Accountant, United States Securities and Exchange Commission (2000-2002). |
Robert G. Byrnes (41) |
| Year of Election or Appointment: 2007 Assistant Treasurer of VIP Telecommunications. Mr. Byrnes also serves as Assistant Treasurer of other Fidelity funds (2005-present) and is an employee of FMR (2005-present). Previously, Mr. Byrnes served as Vice President of FPCMS (2003-2005). Before joining Fidelity Investments, Mr. Byrnes worked at Deutsche Asset Management where he served as Vice President of the Investment Operations Group (2000-2003). |
Peter L. Lydecker (53) |
| Year of Election or Appointment: 2007 Assistant Treasurer of VIP Telecommunications. Mr. Lydecker also serves as Assistant Treasurer of other Fidelity funds (2004) and is an employee of FMR. |
Paul M. Murphy (60) |
| Year of Election or Appointment: 2007 Assistant Treasurer of VIP Telecommunications. Mr. Murphy also serves as Assistant Treasurer of other Fidelity funds (2007-present) and is an employee of FMR (2007-present). Previously, Mr. Murphy served as Chief Financial Officer of the Fidelity Funds (2005-2006), Vice President and Associate General Counsel of FMR (2007), and Senior Vice President of Fidelity Pricing and Cash Management Services Group (FPCMS) (1994-2007). |
Gary W. Ryan (49) |
| Year of Election or Appointment: 2007 Assistant Treasurer of VIP Telecommunications. Mr. Ryan also serves as Assistant Treasurer of other Fidelity funds (2005-present) and is an employee of FMR (2005-present). Previously, Mr. Ryan served as Vice President of Fund Reporting in FPCMS (1999-2005). |
** FMR Corp. merged with and into FMR LLC on October 1, 2007. Any references to FMR LLC for prior periods are deemed to be references to the prior entity.
Annual Report
Distributions
Initial Class and Investor Class each designate 16% of the dividends distributed in December 2007 as qualifying for the dividends-received deduction for corporate shareholders.
The fund will notify shareholders in January 2008 of amounts for use in preparing 2007 income tax returns.
Annual Report
Annual Report
Investment Adviser
Fidelity Management & Research Company
Boston, MA
Investment Sub-Advisers
FMR Co., Inc.
Fidelity Management & Research (U.K.) Inc.
Fidelity Research & Analysis Company
Fidelity Investments Japan Limited
Fidelity International Investment Advisors
Fidelity International Investment Advisors
(U.K.) Limited
General Distributor
Fidelity Distributors Corporation
Boston, MA
Transfer and Service Agents
Fidelity Investments Institutional Operations Company, Inc.
Boston, MA
Fidelity Service Company, Inc.
Boston, MA
Custodian
State Street Bank and Trust Company
Quincy, MA
VTELP-ANN-0208
1.851004.100
Fidelity® Variable Insurance Products:
Utilities Portfolio
Annual Report
December 31, 2007
(2_fidelity_logos) (Registered_Trademark)
Contents
Performance | <Click Here> | How the fund has done over time. |
Management's Discussion | <Click Here> | The manager's review of fund performance, strategy and outlook. |
Shareholder Expense Example | <Click Here> | An example of shareholder expenses. |
Investment Changes | <Click Here> | A summary of major shifts in the fund's investments over the past six months. |
Investments | <Click Here> | A complete list of the fund's investments with their
market values. |
Financial Statements | <Click Here> | Statements of assets and liabilities, operations, and
changes in net assets, as well as financial highlights. |
Notes | <Click Here> | Notes to the financial statements. |
Report of Independent Registered Public Accounting Firm | <Click Here> | |
Trustees and Officers | <Click Here> | |
Distributions | <Click Here> | |
Board Approval of Investment Advisory Contracts and Management Fees | <Click Here> | |
| | |
To view a fund's proxy voting guidelines and proxy voting record for the 12-month period ended June 30, visit http://www.fidelity.com (search for "proxy voting guidelines") or visit the Securities and Exchange Commission's (SEC) web site at http://www.sec.gov. You may also call 1-877-208-0098 to request a free copy of the proxy voting guidelines.
Fidelity Variable Insurance Products are separate account options which are purchased through a variable insurance contract.
Standard & Poor's, S&P and S&P 500 are registered service marks of The McGraw-Hill Companies, Inc. and have been licensed for use by Fidelity Distributors Corporation.
Other third party marks appearing herein are the property of their respective owners.
All other marks appearing herein are registered or unregistered trademarks or service marks of FMR LLC or an affiliated company.
This report and the financial statements contained herein are submitted for the general information of the shareholders of the fund. This report is not authorized for distribution to prospective investors in the fund unless preceded or accompanied by an effective prospectus.
A fund files its complete schedule of portfolio holdings with the SEC for the first and third quarters of each fiscal year on Form N-Q. Forms N-Q are available on the SEC's web site at http://www.sec.gov. A fund's Forms N-Q may be reviewed and copied at the SEC's Public Reference Room in Washington, DC. Information regarding the operation of the SEC's Public Reference Room may be obtained by calling 1-800-SEC-0330. For a complete list of the fund's portfolio holdings, view the most recent holdings listing, semiannual report, or annual report on Fidelity's web site at http://www.fidelity.com or http://www.advisor.fidelity.com, as applicable.
NOT FDIC INSURED · MAY LOSE VALUE · NO BANK GUARANTEE
Neither the fund nor Fidelity Distributors Corporation is a bank.
Annual Report
Performance: The Bottom Line
Average annual total return reflects the change in the value of an investment, assuming reinvestment of the class' dividend income and capital gains (the profits earned upon the sale of securities that have grown in value, if any) and assuming a constant rate of performance each year. During periods of reimbursement by Fidelity, a fund's total return will be greater than it would be had the reimbursement not occurred. Performance numbers are net of all underlying fund operating expenses, but do not include any insurance charges imposed by your insurance company's separate account. If performance information included the effect of these additional charges, the total returns would have been lower. How a fund did yesterday is no guarantee of how it will do tomorrow.
Average Annual Total Returns
Periods ended December 31, 2007 | Past 1
year | Past 5
years | Life of fund A |
VIP Utilities - Initial Class C | 20.67% | 22.32% | 8.10% |
VIP Utilities - Investor ClassB,C | 20.53% | 22.24% | 8.04% |
A From July 19, 2001.
B The initial offering of Investor Class shares took place on July 21, 2005. Returns prior to July 21, 2005 are those of Initial Class. If Investor Class's transfer agent fee had been reflected, returns prior to July 21, 2005 would have been lower.
C Prior to October 1, 2006, VIP Utilities operated under certain different investment policies. The historical performance for the fund may not represent its current investment policies.
$10,000 Over Life of Fund
Let's say hypothetically that $10,000 was invested in VIP Utilities Portfolio - Initial Class on July 19, 2001, when the fund started. The chart shows how the value of your investment would have changed, and also shows how the Standard & Poor's 500SM (S&P 500®) performed over the same period.

Annual Report
Management's Discussion of Fund Performance
Comments from Douglas Simmons, Portfolio Manager of VIP Utilities Portfolio
U.S. equity markets, as measured by the bellwether Dow Jones Industrial AverageSM and the Standard & Poor's 500SM Index, registered their fifth consecutive year of positive returns in 2007, as the Dow rose 8.88% and the S&P 500® index advanced 5.49%. The tech-heavy NASDAQ Composite® Index did even better, increasing 10.55%. However, credit- and recession-related concerns carved deeply into stock prices late in 2007, pushing some major market measures into negative territory for the year overall, particularly smaller-cap and value-oriented benchmarks. Based largely on a weak U.S. dollar that boosted returns for U.S. investors, the Morgan Stanley Capital InternationalSM Europe, Australasia, and Far East (MSCI® EAFE®) Index - a gauge of developed stock markets outside the United States and Canada - beat most domestic equity measures, gaining 11.33%. Several European countries had outstanding performance, including Finland and Germany, while Australia also did very well. However, fallout from the credit crunch and concerns about export growth tempered U.K. stocks, while fears that Japanese financial companies would become embroiled in the U.S. subprime mortgage crisis contributed to a loss of more than 4% for the Japanese portion of the index. The emerging-markets stock asset class soared 39.78% according to the MSCI Emerging Markets index. The U.S. investment-grade bond market climbed 6.97% as measured by the Lehman Brothers® U.S. Aggregate Index, beating the 2.53% gain for the Merrill Lynch® U.S. High Yield Master II Constrained Index. The emerging-markets bond category shook off a sluggish first half of 2007 to finish the year with a respectable gain of 6.28% as measured by the J.P. Morgan Emerging Markets Bond Index (EMBI) Global, while the Citigroup® Non-U.S. Group of 7 Index - representing the debt performance of major global economies, excluding the United States - rose 13.05%.
For the year ending December 31, 2007, the fund solidly outperformed the 17.50% gain of the Morgan Stanley Capital InternationalSM (MSCI®) US Investable Market Utilities Index and that of the S&P 500. Strong stock selection - primarily in the multi-utilities and electric utilities groups - helped the fund outperform the MSCI index, as did solid security selection and an overweighting in the independent power/energy trading area. The underperformance of a previously held out-of-benchmark position in oil/natural gas storage and transport company Spectra Energy detracted, as did the fund's small cash position. Top contributors included independent power/energy traders Constellation Energy and TXU - headquartered in Maryland and Texas, respectively (TXU was acquired during the period); electric utilities Entergy, with operations in the Southeast, and Pennsylvania-based Allegheny Energy. Underweighting and then selling index components Southern Company - an electric utility that provides power in the Southeast - and Virginia-based multi-utility Dominion Resources also helped. Other detractors included international independent power producer AES as well as untimely ownership of Atlanta-based Mirant and an underweighting in FPL Group, with operations in Florida.
The views expressed above reflect those of the portfolio manager(s) only through the end of the period as stated on the cover of this report and do not necessarily represent the views of Fidelity or any other person in the Fidelity organization. Any such views are subject to change at any time based upon market or other conditions and Fidelity disclaims any responsibility to update such views. These views may not be relied on as investment advice and, because investment decisions for a Fidelity fund are based on numerous factors, may not be relied on as an indication of trading intent on behalf of any Fidelity fund.
Annual Report
Shareholder Expense Example
As a shareholder of the Fund, you incur two types of costs: (1) transaction costs, including redemption fees, and (2) ongoing costs, including management fees and other Fund expenses. This Example is intended to help you understand your ongoing costs (in dollars) of investing in the Fund and to compare these costs with the ongoing costs of investing in other mutual funds.
The Example is based on an investment of $1,000 invested at the beginning of the period and held for the entire period (July 1, 2007 to December 31, 2007).
Actual Expenses
The first line of the accompanying table for each class of the Fund provides information about actual account values and actual expenses. You may use the information in this line, together with the amount you invested, to estimate the expenses that you paid over the period. Simply divide your account value by $1,000.00 (for example, an $8,600 account value divided by $1,000.00 = 8.6), then multiply the result by the number in the first line for a class of the Fund under the heading entitled "Expenses Paid During Period" to estimate the expenses you paid on your account during this period. The estimate of expenses does not include any fees or other expenses of any variable annuity or variable life insurance product. If they were, the estimate of expenses you paid during the period would be higher, and your ending account value would be lower. In addition, the Fund, as a shareholder in the underlying Fidelity Central Funds, will indirectly bear its pro rata share of the fees and expenses incurred by the underlying Fidelity Central Funds. These fees and expenses are not included in the Fund's annualized expense ratio used to calculate the expense estimate in the table below.
Hypothetical Example for Comparison Purposes
The second line of the accompanying table for each class of the Fund provides information about hypothetical account values and hypothetical expenses based on a Class' actual expense ratio and an assumed rate of return of 5% per year before expenses, which is not the Class' actual return. The hypothetical account values and expenses may not be used to estimate the actual ending account balance or expenses you paid for the period. You may use this information to compare the ongoing costs of investing in the Fund and other funds. To do so, compare this 5% hypothetical example with the 5% hypothetical examples that appear in the shareholder reports of the other funds. The estimate of expenses does not include any fees or other expenses of any variable annuity or variable life insurance product. If they were, the estimate of expenses you paid during the period would be higher, and your ending account value would be lower. In addition, the Fund, as a shareholder in the underlying Fidelity Central Funds, will indirectly bear its pro rata share of the fees and expenses incurred by the underlying Fidelity Central Funds. These fees and expenses are not included in the Fund's annualized expense ratio used to calculate the expense estimate in the table below.
Please note that the expenses shown in the table are meant to highlight your ongoing costs only and do not reflect any transaction costs. Therefore, the second line of the table is useful in comparing ongoing costs only, and will not help you determine the relative total costs of owning different funds. In addition, if these transactional costs were included, your costs would have been higher.
| Beginning
Account Value
July 1, 2007 | Ending
Account Value
December 31, 2007 | Expenses Paid
During Period*
July 1, 2007 to December 31, 2007 |
Initial Class | | | |
Actual | $ 1,000.00 | $ 1,082.40 | $ 3.88 |
HypotheticalA | $ 1,000.00 | $ 1,021.48 | $ 3.77 |
Investor Class | | | |
Actual | $ 1,000.00 | $ 1,081.80 | $ 4.51 |
HypotheticalA | $ 1,000.00 | $ 1,020.87 | $ 4.38 |
A 5% return per year before expenses
* Expenses are equal to each Class' annualized expense ratio (shown in the table below); multiplied by the average account value over the period, multiplied by 184/365 (to reflect the one-half year period).
| Annualized
Expense Ratio |
Initial Class | .74% |
Investor Class | .86% |
Annual Report
Investment Changes
Top Ten Stocks as of December 31, 2007 |
| % of fund's
net assets | % of fund's net assets
6 months ago |
PPL Corp. | 9.0 | 4.6 |
Exelon Corp. | 8.5 | 8.3 |
Constellation Energy Group, Inc. | 7.5 | 5.9 |
AES Corp. | 7.2 | 5.4 |
Entergy Corp. | 5.4 | 4.4 |
FPL Group, Inc. | 4.9 | 3.8 |
Allegheny Energy, Inc. | 4.4 | 1.4 |
FirstEnergy Corp. | 4.0 | 3.7 |
American Electric Power Co., Inc. | 4.0 | 4.1 |
NRG Energy, Inc. | 3.9 | 2.8 |
| 58.8 | |
Top Industries (% of fund's net assets) |
As of December 31, 2007 |
| Electric Utilities | 51.0% | |
| Independent Power Producers & Energy Traders | 20.9% | |
| Multi-utilities | 18.6% | |
| Gas Utilities | 5.4% | |
| Water Utilities | 0.6% | |
| All Others* | 3.5% | |

|
As of June 30, 2007 |
| Electric Utilities | 45.7% | |
| Multi-utilities | 25.1% | |
| Independent Power Producers & Energy Traders | 22.0% | |
| Gas Utilities | 5.3% | |
| Oil, Gas & Consumable Fuels | 1.3% | |
| All Others* | 0.6% | |

* Includes short-term investments and net other assets. |
Annual Report
Investments December 31, 2007
Showing Percentage of Net Assets
Common Stocks - 96.7% |
| Shares | | Value |
DIVERSIFIED FINANCIAL SERVICES - 0.2% |
Hicks Acquisition Co. I, Inc. unit | 23,100 | | $ 231,000 |
ELECTRIC UTILITIES - 51.0% |
Allegheny Energy, Inc. | 88,400 | | 5,623,124 |
American Electric Power Co., Inc. | 107,800 | | 5,019,168 |
DPL, Inc. | 28,400 | | 842,060 |
Edison International | 93,100 | | 4,968,747 |
Entergy Corp. | 57,100 | | 6,824,592 |
Exelon Corp. | 131,900 | | 10,768,316 |
FirstEnergy Corp. | 70,320 | | 5,086,949 |
FPL Group, Inc. | 91,100 | | 6,174,758 |
Great Plains Energy, Inc. | 19,500 | | 571,740 |
ITC Holdings Corp. | 9,700 | | 547,274 |
Northeast Utilities | 36,300 | | 1,136,553 |
Pepco Holdings, Inc. | 40,400 | | 1,184,932 |
PPL Corp. | 218,100 | | 11,360,828 |
Reliant Energy, Inc. (a) | 85,600 | | 2,246,144 |
Sierra Pacific Resources | 52,400 | | 889,752 |
Westar Energy, Inc. | 46,900 | | 1,216,586 |
| | 64,461,523 |
GAS UTILITIES - 5.4% |
Energen Corp. | 16,100 | | 1,034,103 |
Equitable Resources, Inc. | 29,200 | | 1,555,776 |
Questar Corp. | 34,800 | | 1,882,680 |
Southern Union Co. | 80,600 | | 2,366,416 |
| | 6,838,975 |
INDEPENDENT POWER PRODUCERS & ENERGY TRADERS - 20.9% |
AES Corp. (a) | 425,350 | | 9,098,237 |
Constellation Energy Group, Inc. | 91,900 | | 9,422,507 |
Dynegy, Inc. Class A (a) | 117,500 | | 838,950 |
Mirant Corp. (a) | 52,400 | | 2,042,552 |
NRG Energy, Inc. (a) | 115,200 | | 4,992,768 |
| | 26,395,014 |
|
| Shares | | Value |
MULTI-UTILITIES - 18.6% |
Ameren Corp. | 11,800 | | $ 639,678 |
CenterPoint Energy, Inc. | 93,500 | | 1,601,655 |
CMS Energy Corp. | 170,710 | | 2,966,940 |
OGE Energy Corp. | 27,300 | | 990,717 |
PG&E Corp. | 94,000 | | 4,050,460 |
Public Service Enterprise Group, Inc. | 49,400 | | 4,853,056 |
Sempra Energy | 78,300 | | 4,845,204 |
Wisconsin Energy Corp. | 25,900 | | 1,261,589 |
Xcel Energy, Inc. | 102,700 | | 2,317,939 |
| | 23,527,238 |
WATER UTILITIES - 0.6% |
Aqua America, Inc. | 33,400 | | 708,080 |
TOTAL COMMON STOCKS (Cost $100,278,254) | 122,161,830 |
Money Market Funds - 3.2% |
| | | |
Fidelity Cash Central Fund, 4.58% (b)
(Cost $3,993,512) | 3,993,512 | | 3,993,512 |
TOTAL INVESTMENT PORTFOLIO -99.9% (Cost $104,271,766) | | 126,155,342 |
NET OTHER ASSETS - 0.1% | | 145,879 |
NET ASSETS - 100% | $ 126,301,221 |
Legend |
(a) Non-income producing |
(b) Affiliated fund that is available only to investment companies and other accounts managed by Fidelity Investments. The rate quoted is the annualized seven-day yield of the fund at period end. A complete unaudited listing of the fund's holdings as of its most recent quarter end is available upon request. |
Affiliated Central Funds |
Information regarding fiscal year to date income earned by the Fund from investments in Fidelity Central Funds is as follows: |
Fund | Income earned |
Fidelity Cash Central Fund | $ 259,692 |
Fidelity Securities Lending Cash Central Fund | 24,528 |
Total | $ 284,220 |
See accompanying notes which are an integral part of the financial statements.
Annual Report
Financial Statements
Statement of Assets and Liabilities
| December 31, 2007 |
Assets | | |
Investment in securities, at value - See accompanying schedule: Unaffiliated issuers (cost $100,278,254) | $ 122,161,830 | |
Fidelity Central Funds (cost $3,993,512) | 3,993,512 | |
Total Investments (cost $104,271,766) | | $ 126,155,342 |
Receivable for fund shares sold | | 139,947 |
Dividends receivable | | 229,912 |
Distributions receivable from Fidelity Central Funds | | 17,935 |
Prepaid expenses | | 376 |
Total assets | | 126,543,512 |
| | |
Liabilities | | |
Payable for fund shares redeemed | 132,911 | |
Accrued management fee | 57,645 | |
Other affiliated payables | 14,626 | |
Other payables and accrued expenses | 37,109 | |
Total liabilities | | 242,291 |
| | |
Net Assets | | $ 126,301,221 |
Net Assets consist of: | | |
Paid in capital | | $ 104,335,594 |
Accumulated undistributed net realized gain (loss) on investments and foreign currency transactions | | 82,051 |
Net unrealized appreciation (depreciation) on investments | | 21,883,576 |
Net Assets | | $ 126,301,221 |
Statement of Assets and Liabilities - continued
| December 31, 2007 |
Initial Class:
Net Asset Value, offering price and redemption price per share ($84,105,098 ÷ 6,423,550 shares) | | $ 13.09 |
| | |
Investor Class:
Net Asset Value, offering price and redemption price per share ($42,196,123 ÷ 3,233,448 shares) | | $ 13.05 |
See accompanying notes which are an integral part of the financial statements.
Annual Report
Statement of Operations
| Year ended December 31, 2007 |
Investment Income | | |
Dividends | | $ 2,864,426 |
Interest | | 1,566 |
Income from Fidelity Central Funds | | 284,220 |
Total income | | 3,150,212 |
| | |
Expenses | | |
Management fee | $ 738,689 | |
Transfer agent fees | 135,073 | |
Accounting and security lending fees | 52,894 | |
Custodian fees and expenses | 13,324 | |
Independent trustees' compensation | 446 | |
Audit | 40,673 | |
Legal | 884 | |
Interest | 10,732 | |
Miscellaneous | 13,041 | |
Total expenses before reductions | 1,005,756 | |
Expense reductions | (238) | 1,005,518 |
Net investment income (loss) | | 2,144,694 |
Realized and Unrealized Gain (Loss) Net realized gain (loss) on: | | |
Investment securities: | | |
Unaffiliated issuers | 2,935,558 | |
Foreign currency transactions | (227) | |
Total net realized gain (loss) | | 2,935,331 |
Change in net unrealized appreciation (depreciation) on: Investment securities | 12,809,567 | |
Assets and liabilities in foreign currencies | 3 | |
Total change in net unrealized appreciation (depreciation) | | 12,809,570 |
Net gain (loss) | | 15,744,901 |
Net increase (decrease) in net assets resulting from operations | | $ 17,889,595 |
Statement of Changes in Net Assets
| Year ended
December 31, 2007 | Year ended
December 31, 2006 |
Increase (Decrease) in Net Assets | | |
Operations | | |
Net investment income (loss) | $ 2,144,694 | $ 1,077,629 |
Net realized gain (loss) | 2,935,331 | 7,784,777 |
Change in net unrealized appreciation (depreciation) | 12,809,570 | 4,939,241 |
Net increase (decrease) in net assets resulting from operations | 17,889,595 | 13,801,647 |
Distributions to shareholders from net investment income | (2,306,423) | (1,059,729) |
Distributions to shareholders from net realized gain | (2,632,223) | (8,079,817) |
Total distributions | (4,938,646) | (9,139,546) |
Share transactions - net increase (decrease) | 17,247,792 | 53,765,431 |
Redemption fees | 60,056 | 20,707 |
Total increase (decrease) in net assets | 30,258,797 | 58,448,239 |
| | |
Net Assets | | |
Beginning of period | 96,042,424 | 37,594,185 |
End of period | $ 126,301,221 | $ 96,042,424 |
See accompanying notes which are an integral part of the financial statements.
Annual Report
Financial Highlights - Initial Class
Years ended December 31, | 2007 | 2006 | 2005 | 2004 | 2003 |
Selected Per-Share Data | | | | | |
Net asset value, beginning of period | $ 11.29 | $ 9.53 | $ 9.14 | $ 7.42 | $ 5.95 |
Income from Investment Operations | | | | | |
Net investment income (loss) C | .21 | .24 | .17 | .17 F | .08 |
Net realized and unrealized gain (loss) | 2.12 | 2.76 | .71 | 1.65 | 1.45 |
Total from investment operations | 2.33 | 3.00 | .88 | 1.82 | 1.53 |
Distributions from net investment income | (.25) | (.14) | (.19) | (.11) | (.08) |
Distributions from net realized gain | (.29) | (1.10) | (.30) | - | - |
Total distributions | (.54) | (1.24) J | (.49) I | (.11) | (.08) |
Redemption fees added to paid in capital C | .01 | - H | - H | .01 | .02 |
Net asset value, end of period | $ 13.09 | $ 11.29 | $ 9.53 | $ 9.14 | $ 7.42 |
Total Return A,B | 20.67% | 31.79% | 9.54% | 24.61% | 26.17% |
Ratios to Average Net Assets D,G | | | | | |
Expenses before reductions | .73% | .81% | .83% | 1.04% | 1.71% |
Expenses net of fee waivers, if any | .73% | .81% | .83% | 1.04% | 1.50% |
Expenses net of all reductions | .73% | .80% | .80% | 1.00% | 1.46% |
Net investment income (loss) | 1.65% | 2.20% | 1.81% | 2.03% | 1.19% |
Supplemental Data | | | | | |
Net assets, end of period (000 omitted) | $ 84,105 | $ 77,153 | $ 36,444 | $ 38,182 | $ 11,700 |
Portfolio turnover rate E | 90% | 139% | 100% | 84% | 123% |
ATotal returns do not reflect charges attributable to your insurance company's separate account. Inclusion of these charges would reduce the total returns shown. BTotal returns would have been lower had certain expenses not been reduced during the periods shown. C Calculated based on average shares outstanding during the period. D Fees and expenses of the underlying Fidelity Central Funds are not included in the Fund's expense ratio. The Fund indirectly bears its proportionate share of the expenses of any underlying Fidelity Central Funds. E Amount does not include the portfolio activity of any underlying Fidelity Central Funds. F Investment income per share reflects a special dividend which amounted to $.05 per share. G Expense ratios reflect operating expenses of the class. Expenses before reductions do not reflect amounts reimbursed by the investment adviser or reductions from brokerage service arrangements or other expense offset arrangements and do not represent the amount paid by the class during periods when reimbursements or reductions occur. Expenses net of fee waivers reflect expenses after reimbursement by the investment adviser but prior to reductions from brokerage service arrangements or other expense offset arrangements. Expenses net of all reductions represent the net expenses paid by the class. HAmount represents less than $.01 per share. I Total distributions of $.49 per share is comprised of distributions from net investment income of $.193 and distributions from net realized gain of $.295 per share. J Total distributions of $1.24 per share is comprised of distributions from net investment income of $.139 and distributions from net realized gain of $1.105 per share. |
Financial Highlights - Investor Class
Years ended December 31, | 2007 | 2006 | 2005 H |
Selected Per-Share Data | | | |
Net asset value, beginning of period | $ 11.26 | $ 9.52 | $ 9.72 |
Income from Investment Operations | | | |
Net investment income (loss) E | .19 | .23 | .05 |
Net realized and unrealized gain (loss) | 2.12 | 2.75 | .24 |
Total from investment operations | 2.31 | 2.98 | .29 |
Distributions from net investment income | (.24) | (.13) | (.20) |
Distributions from net realized gain | (.29) | (1.10) | (.30) |
Total distributions | (.53) | (1.24)L | (.49) K |
Redemption fees added to paid in capital E | .01 | - J | - J |
Net asset value, end of period | $ 13.05 | $ 11.26 | $ 9.52 |
Total Return B,C,D | 20.53% | 31.56% | 2.94% |
Ratios to Average Net Assets F,I | | | |
Expenses before reductions | .84% | .96% | 1.16% A |
Expenses net of fee waivers, if any | .84% | .96% | 1.16% A |
Expenses net of all reductions | .84% | .96% | 1.12% A |
Net investment income (loss) | 1.53% | 2.04% | 1.09% A |
Supplemental Data | | | |
Net assets, end of period (000 omitted) | $ 42,196 | $ 18,889 | $ 1,150 |
Portfolio turnover rate G | 90% | 139% | 100% |
A Annualized B Total returns for periods of less than one year are not annualized. C Total returns do not reflect charges attributable to your insurance company's separate account. Inclusion of these charges would reduce the total returns shown. D Total returns would have been lower had certain expenses not been reduced during the periods shown. E Calculated based on average shares outstanding during the period. F Fees and expenses of the underlying Fidelity Central Funds are not included in the Fund's expense ratio. The Fund indirectly bears its proportionate share of the expenses of any underlying Fidelity Central Funds. G Amount does not include the portfolio activity of any underlying Fidelity Central Funds. H For the period July 21, 2005 (commencement of sale of shares) to December 31, 2005. I Expense ratios reflect operating expenses of the class. Expenses before reductions do not reflect amounts reimbursed by the investment adviser or reductions from brokerage service arrangements or other expense offset arrangements and do not represent the amount paid by the class during periods when reimbursements or reductions occur. Expense ratios before reductions for start-up periods may not be representative of longer-term operating periods. Expenses net of fee waivers reflect expenses after reimbursement by the investment adviser but prior to reductions from brokerage service arrangements or other expense offset arrangements. Expenses net of all reductions represent the net expenses paid by the class. J Amount represents less than $.01 per share. KTotal distributions of $.49 per share is comprised of distributions from net investment income of $.196 and distributions from net realized gain of $.295 per share. LTotal distributions of $1.24 per share is comprised of distributions from net investment income of $.134 and distributions from net realized gain of $1.105 per share. |
See accompanying notes which are an integral part of the financial statements.
Annual Report
Notes to Financial Statements
For the period ended December 31, 2007
1. Organization.
VIP Utilities Portfolio (the Fund) is a non-diversified fund of Variable Insurance Products Fund IV (the trust) and is authorized to issue an unlimited number of shares. The trust is registered under the Investment Company Act of 1940, as amended (the 1940 Act), as an open-end management investment company organized as a Massachusetts business trust. Shares of the Fund may only be purchased by insurance companies for the purpose of funding variable annuity or variable life insurance contracts. The Fund offers the following classes of shares: Initial Class shares and Investor Class shares. All classes have equal rights and voting privileges, except for matters affecting a single class. Investment income, realized and unrealized capital gains and losses, the common expenses of the Fund, and certain fund-level expense reductions, if any, are allocated on a pro rata basis to each class based on the relative net assets of each class to the total net assets of the Fund. Each class differs with respect to transfer agent fees incurred. Certain expense reductions also differ by class.
2. Investments in Fidelity Central Funds.
The Fund may invest in Fidelity Central Funds, which are open-end investment companies available only to other investment companies and accounts managed by Fidelity Management & Research Company (FMR) and its affiliates. The Fund's Schedule of Investments lists each of the Fidelity Central Funds as an investment of the Fund, but does not include the underlying holdings of each Fidelity Central Fund. As an Investing Fund, the Fund indirectly bears its proportionate share of the expenses of the underlying Fidelity Central Funds.
The Money Market Central Funds seek preservation of capital and current income and are managed by Fidelity Investments Money Management, Inc. (FIMM), an affiliate of FMR.
A complete list of holdings for each Fidelity Central Fund is available upon request or at the SEC's web site at www.sec.gov. In addition, the financial statements of the Fidelity Central Funds, which are not covered by the Fund's Report of Independent Registered Public Accounting Firm, are available on the SEC's web site or upon request.
3. Significant Accounting Policies.
The financial statements have been prepared in conformity with accounting principles generally accepted in the United States of America, which require management to make certain estimates and assumptions at the date of the financial statements. The following summarizes the significant accounting policies of the Fund:
Security Valuation. Investments are valued and net asset value (NAV) per share is calculated (NAV calculation) as of the close of business of the New York Stock Exchange (NYSE), normally 4:00 p.m. Eastern time. Wherever possible, the Fund uses independent pricing services approved by the Board of Trustees to value its investments.
Equity securities, including restricted securities, for which market quotations are readily available, are valued at the last reported sale price or official closing price as reported by an independent pricing service on the primary market or exchange on which they are traded. In the event there were no sales during the day or closing prices are not available, securities are valued at the last quoted bid price. Investments in open-end mutual funds, including the Fidelity Central Funds, are valued at their closing net asset value each business day. Short-term securities with remaining maturities of sixty days or less for which quotations are not readily available are valued at amortized cost, which approximates value.
When current market prices or quotations are not readily available or do not accurately reflect fair value, valuations may be determined in accordance with procedures adopted by the Board of Trustees. For example, when developments occur between the close of a market and the close of the NYSE that may materially affect the value of some or all of the securities, or when trading in a security is halted, those securities may be fair valued. Factors used in the determination of fair value may include monitoring news to identify significant market or security specific events such as changes in the value of U.S. securities markets, reviewing developments in foreign markets and evaluating the performance of ADRs, futures contracts and exchange-traded funds. Because the Fund's utilization of fair value pricing depends on market activity, the frequency with which fair value pricing is used cannot be predicted and may be utilized to a significant extent. The value of securities used for NAV calculation under fair value pricing may differ from published prices for the same securities.
Foreign Currency. The Fund uses foreign currency contracts to facilitate transactions in foreign-denominated securities. Losses from these transactions may arise from changes in the value of the foreign currency or if the counterparties do not perform under the contracts' terms.
Foreign-denominated assets, including investment securities, and liabilities are translated into U.S. dollars at the exchange rate at period end. Purchases and sales of investment securities, income and dividends received and expenses denominated in foreign currencies are translated into U.S. dollars at the exchange rate in effect on the transaction date.
The effects of exchange rate fluctuations on investments are included with the net realized and unrealized gain (loss) on investment securities. Other foreign currency transactions resulting in realized and unrealized gain (loss) are disclosed separately.
Annual Report
Notes to Financial Statements - continued
3. Significant Accounting Policies - continued
Investment Transactions and Income. For financial reporting purposes, the Fund's investment holdings and NAV include trades executed through the end of the last business day of the period. The NAV for processing shareholder transactions includes trades executed through the end of the prior business day. Gains and losses on securities sold are determined on the basis of identified cost and may include proceeds received from litigation. Dividend income is recorded on the ex-dividend date, except for certain dividends from foreign securities where the ex-dividend date may have passed, which are recorded as soon as the Fund is informed of the ex-dividend date. Non-cash dividends included in dividend income, if any, are recorded at the fair market value of the securities received. Distributions received on securities that represent a return of capital or capital gain are recorded as a reduction of cost of investments and/or as a realized gain. The Fund estimates the components of distributions received that may be considered return of capital distributions or capital gain distributions. Interest income and distributions from the Fidelity Central Funds are accrued as earned. Interest income includes coupon interest and amortization of premium and accretion of discount on debt securities. Investment income is recorded net of foreign taxes withheld where recovery of such taxes is uncertain.
Expenses. Most expenses of the trust can be directly attributed to a fund. Expenses which cannot be directly attributed are apportioned among each Fund in the trust. Expense estimates are accrued in the period to which they relate and adjustments are made when actual amounts are known.
Income Tax Information and Distributions to Shareholders. Each year, the Fund intends to qualify as a regulated investment company by distributing substantially all of its taxable income and realized gains under Subchapter M of the Internal Revenue Code and filing its U.S. federal tax return. As a result, no provision for income taxes is required. The Fund adopted the provisions of FASB Interpretation No. 48, Accounting for Uncertainties in Income Taxes (FIN 48), on June 29, 2007. FIN 48 sets forth a minimum threshold for financial statement recognition of the benefit of a tax position taken or expected to be taken in a tax return. The implementation of FIN 48 did not result in any unrecognized tax benefits in the accompanying financial statements. Each of the Fund's federal tax returns for the prior three fiscal years remains subject to examination by the Internal Revenue Service. Foreign taxes are provided for based on the Fund's understanding of the tax rules and rates that exist in the foreign markets in which it invests.
Distributions are recorded on the ex-dividend date. Income dividends and capital gain distributions are declared separately for each class. Income and capital gain distributions are determined in accordance with income tax regulations, which may differ from generally accepted accounting principles.
Capital accounts within the financial statements are adjusted for permanent book-tax differences. These adjustments have no impact on net assets or the results of operations. Temporary book-tax differences will reverse in a subsequent period.
Book-tax differences are primarily due to foreign currency transactions and losses deferred due to wash sales.
The tax-basis components of distributable earnings and the federal tax cost as of period end were as follows:
Unrealized appreciation | $ 23,198,615 |
Unrealized depreciation | (1,509,166) |
Net unrealized appreciation (depreciation) | 21,689,449 |
Undistributed ordinary income | 68,213 |
Undistributed long-term capital gain | 207,965 |
| |
Cost for federal income tax purposes | $ 104,465,893 |
The tax character of distributions paid was as follows:
| December 31, 2007 | December 31, 2006 |
Ordinary Income | $ 3,081,321 | $ 1,980,340 |
Long-term Capital Gains | 1,857,325 | 7,159,206 |
Total | $ 4,938,646 | $ 9,139,546 |
Trading (Redemption) Fees. Shares held less than 60 days are subject to a redemption fee equal to 1% of the proceeds of the redeemed shares. All redemption fees, including any estimated redemption fees paid by FMR, are retained by the Fund and accounted for as an addition to paid in capital.
New Accounting Pronouncement. In September 2006, Statement of Financial Accounting Standards No. 157, Fair Value Measurements (SFAS 157), was issued and is effective for fiscal years beginning after November 15, 2007. SFAS 157 defines fair value, establishes a framework for measuring fair value and expands disclosures about fair value measurements. Management is currently evaluating the impact the adoption of SFAS 157 will have on the Fund's financial statement disclosures.
Annual Report
4. Operating Policies.
Repurchase Agreements. FMR has received an Exemptive Order from the Securities and Exchange Commission (the SEC) which permits the Fund and other affiliated entities of FMR to transfer uninvested cash balances into joint trading accounts which are then invested in repurchase agreements. The Fund may also invest directly with institutions in repurchase agreements. Repurchase agreements are collateralized by government or non-government securities. Upon settlement date, collateral is held in segregated accounts with custodian banks and may be obtained in the event of a default of the counterparty. The Fund monitors, on a daily basis, the value of the collateral to ensure it is at least equal to the principal amount of the repurchase agreement (including accrued interest). In the event of a default by the counterparty, realization of the collateral proceeds could be delayed, during which time the value of the collateral may decline.
5. Purchases and Sales of Investments.
Purchases and sales of securities other than short-term securities, aggregated $130,307,392 and $114,050,958, respectively.
6. Fees and Other Transactions with Affiliates.
Management Fee. FMR and its affiliates provide the Fund with investment management related services for which the Fund pays a monthly management fee. The management fee is the sum of an individual fund fee rate that is based on an annual rate of .30% of the Fund's average net assets and a group fee rate that averaged .26% during the period. The group fee rate is based upon the average net assets of all the mutual funds advised by FMR. The group fee rate decreases as assets under management increase and increases as assets under management decrease. For the period, the total annual management fee rate was .56% of the Fund's average net assets.
Transfer Agent Fees. Fidelity Investments Institutional Operations Company, Inc. (FIIOC), an affiliate of FMR, is the Fund's transfer, dividend disbursing, and shareholder servicing agent. FIIOC receives an asset-based fee with respect to each class. Each class with the exception of Investor Class pays a transfer agent fee, excluding out of pocket expenses, equal to an annual rate of .07% of average net assets. Investor Class pays a monthly asset-based transfer agent fee of .18% of average net assets. The total transfer agent fees paid by each class to FIIOC, including out of pocket expenses, were as follows:
Initial Class | $ 68,227 |
Investor Class | 66,846 |
| $ 135,073 |
Effective February 1, 2008, the Board of Trustees approved a decrease to Investor Class' asset-based fee from .18% to .15% of average net assets.
Accounting and Security Lending Fees. Fidelity Service Company, Inc. (FSC), an affiliate of FMR, maintains the Fund's accounting records. The accounting fee is based on the level of average net assets for the month. Under a separate contract, FSC administers the security lending program. The security lending fee is based on the number and duration of lending transactions.
Brokerage Commissions. The Fund placed a portion of its portfolio transactions with brokerage firms which are affiliates of the investment adviser. The commissions paid to these affiliated firms were $360 for the period.
Interfund Lending Program. Pursuant to an Exemptive Order issued by the SEC, the Fund, along with other registered investment companies having management contracts with FMR, may participate in an interfund lending program. This program provides an alternative credit facility allowing the funds to borrow from, or lend money to, other participating affiliated funds. At period end, there were no interfund loans outstanding. The Fund's activity in this program during the period for which loans were outstanding was as follows:
Borrower or Lender | Average Daily Loan Balance | Weighted Average Interest Rate | Interest
Expense |
Borrower | $ 6,135,333 | 5.38% | $ 8,255 |
7. Committed Line of Credit.
The Fund participates with other funds managed by FMR in a $4.2 billion credit facility (the "line of credit") to be utilized for temporary or emergency purposes to fund shareholder redemptions or for other short-term liquidity purposes. The Fund has agreed to pay commitment fees on its pro rata portion of the line of credit, which amounted to $246 and is reflected in Miscellaneous Expense on the Statement of Operations. During the period, there were no borrowings on this line of credit.
Annual Report
Notes to Financial Statements - continued
8. Security Lending.
The Fund lends portfolio securities from time to time in order to earn additional income. On the settlement date of the loan, the Fund receives collateral (in the form of U.S. Treasury obligations, letters of credit and/or cash) against the loaned securities and maintains collateral in an amount not less than 100% of the market value of the loaned securities during the period of the loan. The market value of the loaned securities is determined at the close of business of the Fund and any additional required collateral is delivered to the Fund on the next business day. If the borrower defaults on its obligation to return the securities loaned because of insolvency or other reasons, a fund could experience delays and costs in recovering the securities loaned or in gaining access to the collateral. Any cash collateral received is invested in the Fidelity Securities Lending Cash Central Fund. At period end, there were no security loans outstanding. Security lending income represents the income earned on investing cash collateral, less fees and expenses associated with the loan, plus any premium payments that may be received on the loan of certain types of securities. Security lending income is presented in the Statement of Operations as a component of income from Fidelity Central Funds. Net income from lending portfolio securities during the period amounted to $24,528.
9. Bank Borrowings.
The Fund is permitted to have bank borrowings for temporary or emergency purposes to fund shareholder redemptions. The Fund has established borrowing arrangements with certain banks. The interest rate on the borrowings is the bank's base rate, as revised from time to time. The average daily loan balance during the period for which loans were outstanding amounted to $2,011,750. The weighted average interest rate was 5.41%. The interest expense amounted to $2,477 under the bank borrowing program. At period end, there were no bank borrowings outstanding.
10. Expense Reductions.
Many of the brokers with whom FMR places trades on behalf of the Fund provided services to the Fund in addition to trade execution. These services included payments of certain expenses on behalf of the Fund totaling $219 for the period.
11. Other.
The Fund's organizational documents provide former and current trustees and officers with a limited indemnification against liabilities arising in connection with the performance of their duties to the Fund. In the normal course of business, the Fund may also enter into contracts that provide general indemnifications. The Fund's maximum exposure under these arrangements is unknown as this would be dependent on future claims that may be made against the Fund. The risk of material loss from such claims is considered remote.
At the end of the period, FMR or its affiliates were the owners of record of 100% of the total outstanding shares of the Fund.
The United States Securities and Exchange Commission ("SEC") is conducting an investigation of FMR (covering the years 2002 to 2004) arising from gifts, gratuities and business entertainment provided by certain brokers to certain individuals who were employed on FMR's domestic equity trading desk during that period. FMR is in discussions with the SEC staff regarding the possible resolution of the matter, but as of period-end no final resolution has been reached.
In December 2006, the Independent Trustees completed their own investigation of the matter with the assistance of independent counsel. The Independent Trustees and FMR agree that, despite the absence of proof that the Fidelity mutual funds experienced diminished execution quality as a result of the improper receipt of gifts and business entertainment, the conduct at issue was serious and is worthy of redress. Accordingly, the Independent Trustees have requested and FMR has agreed to pay $42 million to Fidelity mutual funds, plus interest to be determined at the time that payment is made. A method of allocating this payment among the funds has not yet been determined. The total payment to the Fund is not anticipated to have a material impact on the Fund's net assets. In addition, FMR reimbursed related legal expenses which are recorded in the accompanying Statement of Operations as an expense reduction.
12. Distributions to Shareholders.
Distributions to shareholders of each class were as follows:
Years ended December 31, | 2007 | 2006 |
From net investment income | | |
Initial Class | $ 1,565,772 | $ 881,642 |
Investor Class | 740,651 | 178,087 |
Total | $ 2,306,423 | $ 1,059,729 |
Annual Report
12. Distributions to Shareholders - continued
Years ended December 31, | 2007 | 2006 |
From net realized gain | | |
Initial Class | $ 1,776,075 | $ 6,721,805 |
Investor Class | 856,148 | 1,358,012 |
Total | $ 2,632,223 | $ 8,079,817 |
13. Share Transactions.
Transactions for each class of shares were as follows:
| Shares | Dollars |
Years ended December 31, | 2007 | 2006 | 2007 | 2006 |
Initial Class | | | | |
Shares sold | 4,552,813 | 4,066,520 | $ 58,700,689 | $ 46,447,146 |
Reinvestment of distributions | 253,185 | 678,442 | 3,341,847 | 7,603,447 |
Shares redeemed | (5,217,379) | (1,733,462) | (65,354,798) | (18,008,301) |
Net increase (decrease) | (411,381) | 3,011,500 | $ (3,312,262) | $ 36,042,292 |
Investor Class | | | | |
Shares sold | 3,608,070 | 1,466,057 | $ 46,292,465 | $ 16,671,927 |
Reinvestment of distributions | 121,138 | 136,851 | 1,596,799 | 1,536,099 |
Shares redeemed | (2,173,696) | (45,800) | (27,329,210) | (484,887) |
Net increase (decrease) | 1,555,512 | 1,557,108 | $ 20,560,054 | $ 17,723,139 |
Annual Report
Report of Independent Registered Public Accounting Firm
To the Trustees of Variable Insurance Products Fund IV and the Shareholders of VIP Utilities Portfolio:
In our opinion, the accompanying statement of assets and liabilities, including the schedule of investments, and the related statements of operations and of changes in net assets and the financial highlights present fairly, in all material respects, the financial position of VIP Utilities Portfolio (a fund of Variable Insurance Products Fund IV) at December 31, 2007, the results of its operations for the year then ended, the changes in its net assets for each of the two years in the period then ended and the financial highlights for each of the periods indicated, in conformity with accounting principles generally accepted in the United States of America. These financial statements and financial highlights (hereafter referred to as "financial statements") are the responsibility of the VIP Utilities Portfolio's management. Our responsibility is to express an opinion on these financial statements based on our audits. We conducted our audits of these financial statements in accordance with the standards of the Public Company Accounting Oversight Board (United States). Those standards require that we plan and perform the audit to obtain reasonable assurance about whether the financial statements are free of material misstatement. An audit includes examining, on a test basis, evidence supporting the amounts and disclosures in the financial statements, assessing the accounting principles used and significant estimates made by management, and evaluating the overall financial statement presentation. We believe that our audits, which included confirmation of securities at December 31, 2007 by correspondence with the custodian and brokers, provide a reasonable basis for our opinion.
/s/ PricewaterhouseCoopers LLP
PricewaterhouseCoopers LLP
Boston, Massachusetts
February 19, 2008
Annual Report
Trustees and Officers
The Trustees, Members of the Advisory Board, and executive officers of the trust and fund, as applicable, are listed below. The Board of Trustees governs the fund and is responsible for protecting the interests of shareholders. The Trustees are experienced executives who meet periodically throughout the year to oversee the fund's activities, review contractual arrangements with companies that provide services to the fund, and review the fund's performance. Except for James C. Curvey, each of the Trustees oversees 373 funds advised by FMR or an affiliate. Mr. Curvey oversees 368 funds advised by FMR or an affiliate.
The Trustees hold office without limit in time except that (a) any Trustee may resign; (b) any Trustee may be removed by written instrument, signed by at least two-thirds of the number of Trustees prior to such removal; (c) any Trustee who requests to be retired or who has become incapacitated by illness or injury may be retired by written instrument signed by a majority of the other Trustees; and (d) any Trustee may be removed at any special meeting of shareholders by a two-thirds vote of the outstanding voting securities of the trust. Each Trustee who is not an interested person (as defined in the 1940 Act) (Independent Trustee), shall retire not later than the last day of the calendar year in which his or her 72nd birthday occurs. The Independent Trustees may waive this mandatory retirement age policy with respect to individual Trustees. The executive officers and Advisory Board Members hold office without limit in time, except that any officer and Advisory Board Member may resign or may be removed by a vote of a majority of the Trustees at any regular meeting or any special meeting of the Trustees. Except as indicated, each individual has held the office shown or other offices in the same company for the past five years.
The fund's Statement of Additional Information (SAI) includes more information about the Trustees. To request a free copy, call Fidelity at 1-877-208-0098.
Interested Trustees*:
Correspondence intended for each Trustee who is an interested person may be sent to Fidelity Investments, 82 Devonshire Street, Boston, Massachusetts 02109.
Name, Age; Principal Occupation |
Edward C. Johnson 3d (77) |
| Year of Election or Appointment: 1983 Mr. Johnson is Chairman of the Board of Trustees. Mr. Johnson serves as President (2006-present), Chief Executive Officer, Chairman, and a Director of FMR LLC; Chairman and a Director of FMR; Chairman and a Director of Fidelity Research & Analysis Company (FRAC); Chairman and a Director of Fidelity Investments Money Management, Inc.; and Chairman (2001-present) and a Director of FMR Co., Inc. In addition, Mr. Johnson serves as Chairman and Director of Fidelity International Limited (FIL). Mr. Edward C. Johnson 3d and Mr. Arthur E. Johnson are not related. |
James C. Curvey (72) |
| Year of Election or Appointment: 2007 Mr. Curvey also serves as Trustee (2007-present) or Member of the Advisory Board (2007-present) of other investment companies advised by FMR. Mr. Curvey is a Director of FMR and FMR Co., Inc. (2007-present). Mr. Curvey is also Vice Chairman (2006-
present) and Director of FMR LLC. Mr. Curvey joined Fidelity in 1982 and served in numerous senior management positions, including President and Chief Operating Officer of FMR LLC (1997-2000) and President of Fidelity Strategic Investments (2000-
2002). In addition, he serves as a member of the Board of Directors of Geerlings & Wade, Inc. (wine distribution). |
* Trustees have been determined to be "Interested Trustees" by virtue of, among other things, their affiliation with the trust or various entities under common control with FMR. FMR Corp. merged with and into FMR LLC on October 1, 2007. Any references to FMR LLC for prior periods are deemed to be references to the prior entity.
Independent Trustees:
Correspondence intended for each Independent Trustee (that is, the Trustees other than the Interested Trustees) may be sent to Fidelity Investments, P.O. Box 55235, Boston, Massachusetts 02205-5235.
Name, Age; Principal Occupation |
Dennis J. Dirks (59) |
| Year of Election or Appointment: 2005 Prior to his retirement in May 2003, Mr. Dirks was Chief Operating Officer and a member of the Board of The Depository Trust & Clearing Corporation (DTCC) (1999-2003). He also served as President, Chief Operating Officer, and Board member of The Depository Trust Company (DTC) (1999-2003) and President and Board member of the National Securities Clearing Corporation (NSCC) (1999-2003). In addition, Mr. Dirks served as Chief Executive Officer and Board member of the Government Securities Clearing Corporation (2001-2003) and Chief Executive Officer and Board member of the Mortgage-Backed Securities Clearing Corporation (2001-2003). Mr. Dirks also serves as a Trustee and a member of the Finance Committee of Manhattan College (2005-present) and a Trustee and a member of the Finance Committee of AHRC of Nassau County (2006-present). |
Albert R. Gamper, Jr. (65) |
| Year of Election or Appointment: 2006 Prior to his retirement in December 2004, Mr. Gamper served as Chairman of the Board of CIT Group Inc. (commercial finance). During his tenure with CIT Group Inc. Mr. Gamper served in numerous senior management positions, including Chairman (1987-
1989; 1999-2001; 2002-2004), Chief Executive Officer (1987-2004), and President (1989-2002). He currently serves as a member of the Board of Directors of Public Service Enterprise Group (utilities, 2001-present), Chairman of the Board of Governors, Rutgers University (2004-present), and Chairman of the Board of Saint Barnabas Health Care System. |
George H. Heilmeier (71) |
| Year of Election or Appointment: 2004 Dr. Heilmeier is Chairman Emeritus of Telcordia Technologies (communication software and systems), where prior to his retirement, he served as company Chairman and Chief Executive Officer. He currently serves on the Boards of Directors of The Mitre Corporation (systems engineering and information technology support for the government), and HRL Laboratories (private research and development, 2004-present). He is Chairman of the General Motors Science & Technology Advisory Board and a Life Fellow of the Institute of Electrical and Electronics Engineers (IEEE). Dr. Heilmeier is a member of the Defense Science Board and the National Security Agency Advisory Board. He is also a member of the National Academy of Engineering, the American Academy of Arts and Sciences, and the Board of Overseers of the School of Engineering and Applied Science of the University of Pennsylvania. Previously, Dr. Heilmeier served as a Director of TRW Inc. (automotive, space, defense, and information technology, 1992-2002), Compaq (1994-2002), Automatic Data Processing, Inc. (ADP) (technology-based business outsourcing, 1995-2002), INET Technologies Inc. (telecommunications network surveillance, 2001-2004), and Teletech Holdings (customer management services). He is the recipient of the 2005 Kyoto Prize in Advanced Technology for his invention of the liquid crystal display, and a member of the Consumer Electronics Hall of Fame. |
James H. Keyes (67) |
| Year of Election or Appointment: 2007 Prior to his retirement in 2003, Mr. Keyes was Chairman, President, and Chief Executive Officer of Johnson Controls, Inc. (automotive supplier, 1993-2003). He currently serves as a member of the boards of LSI Logic Corporation (semiconductor technologies), Navistar International Corporation (manufacture and sale of trucks, buses, and diesel engines, 2002-present), and Pitney Bowes, Inc. (integrated mail, messaging, and document management solutions). |
Marie L. Knowles (61) |
| Year of Election or Appointment: 2001 Prior to Ms. Knowles' retirement in June 2000, she served as Executive Vice President and Chief Financial Officer of Atlantic Richfield Company (ARCO) (diversified energy, 1996-2000). From 1993 to 1996, she was a Senior Vice President of ARCO and President of ARCO Transportation Company. She served as a Director of ARCO from 1996 to 1998. She currently serves as a Director of Phelps Dodge Corporation (copper mining and manufacturing) and McKesson Corporation (healthcare service, 2002-present). Ms. Knowles is a Trustee of the Brookings Institution and the Catalina Island Conservancy and also serves as a member of the Advisory Board for the School of Engineering of the University of Southern California. |
Ned C. Lautenbach (63) |
| Year of Election or Appointment: 2000 Mr. Lautenbach is Chairman of the Independent Trustees (2006-present). Mr. Lautenbach has been a partner of Clayton, Dubilier & Rice, Inc. (private equity investment firm) since September 1998. Previously, Mr. Lautenbach was with the International Business Machines Corporation (IBM) from 1968 until his retirement in 1998. Mr. Lautenbach serves as a Director of Sony Corporation (2006-present) and Eaton Corporation (diversified industrial) as well as the Philharmonic Center for the Arts in Naples, Florida. He also is a member of the Board of Trustees of Fairfield University (2005-present), as well as a member of the Council on Foreign Relations. |
Cornelia M. Small (63) |
| Year of Election or Appointment: 2005 Ms. Small is a member (2000-present) and Chairperson (2002-present) of the Investment Committee, and a member (2002-
present) of the Board of Trustees of Smith College. Previously, she served as Chief Investment Officer (1999-2000), Director of Global Equity Investments (1996-1999), and a member of the Board of Directors of Scudder, Stevens & Clark (1990-1997) and Scudder Kemper Investments (1997-1999). In addition, Ms. Small served as Co-Chair (2000-2003) of the Annual Fund for the Fletcher School of Law and Diplomacy. |
William S. Stavropoulos (68) |
| Year of Election or Appointment: 2001 Mr. Stavropoulos is Chairman Emeritus of the Board of Directors of The Dow Chemical Company. Since joining The Dow Chemical Company in 1967, Mr. Stavropoulos served in numerous senior management positions, including President (1993-2000; 2002-
2003), CEO (1995-2000; 2002-2004), and Chairman of the Executive Committee (2000-2004). Currently, he is a Director of NCR Corporation (data warehousing and technology solutions), Chemical Financial Corporation, Maersk Inc. (industrial conglomerate, 2002-present), Tyco International, Inc. (multinational manufacturing and services, 2007-present), and a member of the Advisory Board for Metalmark Capital (private equity investment firm, 2005-present). He is a special advisor to Clayton, Dubilier & Rice, Inc., a private equity investment firm. He also serves as a member of the Board of Trustees of the American Enterprise Institute for Public Policy Research. In addition, Mr. Stavropoulos is a member of The Business Council, J.P. Morgan International Council and the University of Notre Dame Advisory Council for the College of Science. |
Kenneth L. Wolfe (68) |
| Year of Election or Appointment: 2005 Mr. Wolfe is Chairman and a Director of Hershey Foods Corporation (2007-present), where prior to his retirement in 2001, he was Chairman and Chief Executive Officer. Mr. Wolfe currently serves as a member of the board of Revlon Inc. (2004-present). Previously, Mr. Wolfe served as a member of the boards of Adelphia Communications Corporation (2003-2006) and Bausch & Lomb, Inc. (1993-2007). |
Advisory Board Members and Executive Officers**:
Correspondence intended for Mr. Mauriello, Mr. Thomas, Mr. Wiley, Mr. Lacy, and Mr. Arthur Johnson may be sent to Fidelity Investments, P.O. Box 55235, Boston, Massachusetts 02205-5235. Correspondence intended for each executive officer and Mr. Lynch may be sent to Fidelity Investments, 82 Devonshire Street, Boston, Massachusetts 02109.
Name, Age; Principal Occupation |
Arthur E. Johnson (60) |
| Year of Election or Appointment: 2008 Member of the Advisory Board of Variable Insurance Products Fund IV. Mr. Johnson serves as Senior Vice President of Corporate Strategic Development of Lockheed Martin Corporation (defense contractor). In addition, Mr. Johnson serves as a member of the Board of Directors of AGL Resources, Inc. (holding company, 2002-present), and IKON Office Solutions, Inc. (document management systems and services). Mr. Arthur E. Johnson and Mr. Edward C. Johnson 3d are not related. |
Alan J. Lacy (54) |
| Year of Election or Appointment: 2008 Member of the Advisory Board of Variable Insurance Products Fund IV. Mr. Lacy serves as Senior Adviser (2007-present) of Oak Hill Capital Partners, L.P. (a private equity firm). Mr. Lacy also served as Vice Chairman and Chief Executive Officer of Sears Holdings Corporation and Sears, Roebuck and Co. (retail, 2005-2006; 2000-2005). In addition, Mr. Lacy serves as a member of the Board of Directors of The Western Union Company (global money transfer, 2006-present) and Bristol-Myers Squibb (global pharmaceuticals, 2007-present). Mr. Lacy is a Trustee of the National Parks Conservation Association and The Field Museum of Natural History. |
Peter S. Lynch (63) |
| Year of Election or Appointment: 2003 Member of the Advisory Board of Variable Insurance Products Fund IV. Mr. Lynch is Vice Chairman and a Director of FMR, and Vice Chairman (2001-present) and a Director of FMR Co., Inc. Previously, Mr. Lynch served as a Trustee of the Fidelity funds (1990-2003). In addition, he serves as a Trustee of Boston College and as the Chairman of the Inner-City Scholarship Fund. |
Joseph Mauriello (63) |
| Year of Election or Appointment: 2007 Member of the Advisory Board of Variable Insurance Products Fund IV. Prior to his retirement in January 2006, Mr. Mauriello served in numerous senior management positions including Deputy Chairman and Chief Operating Officer (2004-2005), and Vice Chairman of Financial Services (2002-2004) of KPMG LLP US (professional services firm, 1965-2005). Mr. Mauriello currently serves as a member of the Board of Directors of XL Capital Ltd. (global insurance and re-insurance company, 2006-
present) and of Arcadia Resources Inc. (health care services and products, 2007-present). He also served as a Director of the Hamilton Funds of the Bank of New York (2006-2007). |
David M. Thomas (58) |
| Year of Election or Appointment: 2007 Member of the Advisory Board of Variable Insurance Products Fund IV. Previously, Mr. Thomas served as Executive Chairman (2005-2006) and Chairman and Chief Executive Officer (2000-2005) of IMS Health, Inc. (pharmaceutical and healthcare information solutions). In addition, Mr. Thomas serves as a member of the Board of Directors of Fortune Brands, Inc. (consumer products holding company), and Interpublic Group of Companies, Inc. (marketing communication, 2004-present). |
Michael E. Wiley (57) |
| Year of Election or Appointment: 2007 Member of the Advisory Board of Variable Insurance Products Fund IV. Mr. Wiley also serves as a member of the Board of Trustees of the University of Tulsa (2000-2006; 2007-present). He serves as a Director of Tesoro Corporation (independent oil refiner and marketer, 2005-present), and a Director of Bill Barrett Corporation (exploration and production company, 2005-present). In addition, he also serves as a Director of Post Oak Bank (privately-held bank, 2004-present). Previously, Mr. Wiley served as a Sr. Energy Advisor of Katzenbach Partners, LLC (consulting firm, 2006-2007), as an Advisory Director of Riverstone Holdings (private investment firm), Chairman, President, and CEO of Baker Hughes, Inc. (oilfield services company, 2000-2004), and as Director of Spinnaker Exploration Company (exploration and production company, 2001-2005). |
Kimberley H. Monasterio (44) |
| Year of Election or Appointment: 2007 President and Treasurer of VIP Utilities. Ms. Monasterio also serves as President and Treasurer of other Fidelity funds (2007-
present) and is an employee of FMR (2004-present). Previously, Ms. Monasterio served as Deputy Treasurer of the Fidelity funds (2004-2006). Before joining Fidelity Investments, Ms. Monasterio served as Treasurer (2000-2004) and Chief Financial Officer (2002-2004) of the Franklin Templeton Funds and Senior Vice President of Franklin Templeton Services, LLC (2000-2004). |
Brian B. Hogan (43) |
| Year of Election or Appointment: 2007 Vice President of VIP Utilities. Mr. Hogan also serves as Vice President of Sector Funds (2007-present). Mr. Hogan is Senior Vice President of Equity Research (2006-present). Mr. Hogan also serves as Vice President of FMR and FMR Co., Inc. Previously, Mr. Hogan served as a portfolio manager. |
Eric D. Roiter (59) |
| Year of Election or Appointment: 2001 Secretary of VIP Utilities. He also serves as Secretary of other Fidelity funds; Vice President, General Counsel, and Secretary of FMR Co., Inc. (2001-present) and FMR; Assistant Secretary of Fidelity Management & Research (U.K.) Inc. (2001-present), Fidelity Research & Analysis Company (2001-present), and Fidelity Investments Money Management, Inc. (2001-present). Mr. Roiter is an Adjunct Member, Faculty of Law, at Boston College Law School (2003-present). Previously, Mr. Roiter served as Vice President and Secretary of Fidelity Distributors Corporation (FDC) (1998-2005). |
John B. McGinty, Jr. (45) |
| Year of Election or Appointment: 2008 Assistant Secretary of VIP Utilities. Mr. McGinty also serves as Assistant Secretary of other Fidelity funds (2008-present) and is an employee of FMR LLC (2004-present). Mr. McGinty also serves as Senior Vice President, Secretary, and Chief Legal Officer of FDC (2007-present). Before joining Fidelity Investments, Mr. McGinty practiced law at Ropes & Gray, LLP. |
R. Stephen Ganis (41) |
| Year of Election or Appointment: 2006 Anti-Money Laundering (AML) officer of VIP Utilities. Mr. Ganis also serves as AML officer of other Fidelity funds (2006-present) and FMR LLC (2003-present). Before joining Fidelity Investments, Mr. Ganis practiced law at Goodwin Procter, LLP (2000-2002). |
Joseph B. Hollis (59) |
| Year of Election or Appointment: 2006 Chief Financial Officer of VIP Utilities. Mr. Hollis also serves as Chief Financial Officer of other Fidelity funds. Mr. Hollis is President of Fidelity Pricing and Cash Management Services (FPCMS) (2005-present). Mr. Hollis also serves as President and Director of Fidelity Service Company, Inc. (2006-present). Previously, Mr. Hollis served as Senior Vice President of Cash Management Services (1999-2002) and Investment Management Operations (2002-2005). |
Kenneth A. Rathgeber (60) |
| Year of Election or Appointment: 2004 Chief Compliance Officer of VIP Utilities. Mr. Rathgeber also serves as Chief Compliance Officer of other Fidelity funds (2004-present) and Executive Vice President of Risk Oversight for Fidelity Investments (2002-present). He is Chief Compliance Officer of FMR (2005-present), FMR Co., Inc. (2005-present), Fidelity Management & Research (U.K.) Inc. (2005-present), Fidelity Research & Analysis Company (2005-present), Fidelity Investments Money Management, Inc. (2005-present), and Strategic Advisers, Inc. (2005-present). Previously, Mr. Rathgeber served as Executive Vice President and Chief Operating Officer for Fidelity Investments Institutional Services Company, Inc. (1998-2002). |
Bryan A. Mehrmann (46) |
| Year of Election or Appointment: 2005 Deputy Treasurer of VIP Utilities. Mr. Mehrmann also serves as Deputy Treasurer of other Fidelity funds (2005-present) and is an employee of FMR. Previously, Mr. Mehrmann served as Vice President of Fidelity Investments Institutional Services Group (FIIS)/Fidelity Investments Institutional Operations Corporation, Inc. (FIIOC) Client Services (1998-2004). |
Kenneth B. Robins (38) |
| Year of Election or Appointment: 2005 Deputy Treasurer of VIP Utilities. Mr. Robins also serves as Deputy Treasurer of other Fidelity funds (2005-present) and is an employee of FMR (2004-present). Before joining Fidelity Investments, Mr. Robins worked at KPMG LLP, where he was a partner in KPMG's department of professional practice (2002-2004) and a Senior Manager (1999-2000). In addition, Mr. Robins served as Assistant Chief Accountant, United States Securities and Exchange Commission (2000-2002). |
Robert G. Byrnes (41) |
| Year of Election or Appointment: 2005 Assistant Treasurer of VIP Utilities. Mr. Byrnes also serves as Assistant Treasurer of other Fidelity funds (2005-present) and is an employee of FMR (2005-present). Previously, Mr. Byrnes served as Vice President of FPCMS (2003-2005). Before joining Fidelity Investments, Mr. Byrnes worked at Deutsche Asset Management where he served as Vice President of the Investment Operations Group (2000-2003). |
Peter L. Lydecker (53) |
| Year of Election or Appointment: 2004 Assistant Treasurer of VIP Utilities. Mr. Lydecker also serves as Assistant Treasurer of other Fidelity funds (2004) and is an employee of FMR. |
Paul M. Murphy (60) |
| Year of Election or Appointment: 2007 Assistant Treasurer of VIP Utilities. Mr. Murphy also serves as Assistant Treasurer of other Fidelity funds (2007-present) and is an employee of FMR (2007-present). Previously, Mr. Murphy served as Chief Financial Officer of the Fidelity Funds (2005-2006), Vice President and Associate General Counsel of FMR (2007), and Senior Vice President of Fidelity Pricing and Cash Management Services Group (FPCMS) (1994-2007). |
Gary W. Ryan (49) |
| Year of Election or Appointment: 2005 Assistant Treasurer of VIP Utilities. Mr. Ryan also serves as Assistant Treasurer of other Fidelity funds (2005-present) and is an employee of FMR (2005-present). Previously, Mr. Ryan served as Vice President of Fund Reporting in FPCMS (1999-2005). |
** FMR Corp. merged with and into FMR LLC on October 1, 2007. Any references to FMR LLC for prior periods are deemed to be references to the prior entity.
Annual Report
Distributions
The Board of Trustees of VIP Utilities Portfolio voted to pay to shareholders of record at the opening of business on record date, the following distributions per share derived from capital gains realized from sales of portfolio securities:
| Pay Date | Record Date | Dividends | Capital Gains |
Initial Class | 02/15/08 | 02/15/08 | - | $0.03 |
Investor Class | 02/15/08 | 02/15/08 | - | $0.03 |
The fund hereby designates as a capital gain dividend with respect to the taxable year ended December 31, 2007, $2,065,290 or, if subsequently determined to be different, the net capital gain of such year.
Initial Class designates 28% and 92%, Investor Class designates 28% and 95% of the dividends distributed in February and December 2007 respectively as indicated in the Corporate Qualifying memo distributed by the Tax department, respectively during the fiscal year as qualifying for the dividends-received deduction for corporate shareholders.
The fund will notify shareholders in January 2008 of amounts for use in preparing 2007 income tax returns.
Annual Report
Board Approval of Investment Advisory Contracts and Management Fees
VIP Utilities Portfolio
Each year, typically in July, the Board of Trustees, including the Independent Trustees (together, the Board), votes on the renewal of the management contract and sub-advisory agreements (together, the Advisory Contracts) for the fund. The Board, assisted by the advice of fund counsel and Independent Trustees' counsel, requests and considers a broad range of information throughout the year.
The Board meets regularly each month except August and takes into account throughout the year matters bearing on Advisory Contracts. The Board, acting directly and through its separate committees, considers at each of its meetings factors that are relevant to the annual renewal of the fund's Advisory Contracts, including the services and support provided to the fund and its shareholders. At the time of the renewal, the Board had 12 standing committees, each composed of Independent Trustees with varying backgrounds, to which the Board has assigned specific subject matter responsibilities in order to enhance effective decision-making by the Board. Each committee has adopted a written charter outlining the structure and purposes of the committee. One such committee, the Equity Contract Committee, meets periodically as needed throughout the year to consider matters specifically related to the annual renewal of Advisory Contracts. The committee requests and receives information on, and makes recommendations to the Independent Trustees concerning, the approval and annual review of the Advisory Contracts.
At its July 2007 meeting, the Board of Trustees, including the Independent Trustees, unanimously determined to renew the Advisory Contracts for the fund. In reaching its determination, the Board considered all factors it believed relevant, including (i) the nature, extent, and quality of the services to be provided to the fund and its shareholders (including the investment performance of the fund); (ii) the competitiveness of the management fee and total expenses of the fund; (iii) the total costs of the services to be provided by and the profits to be realized by the investment adviser and its affiliates from the relationship with the fund; (iv) the extent to which economies of scale would be realized as the fund grows; and (v) whether fee levels reflect these economies of scale, if any, for the benefit of fund shareholders. The Board also approved amendments to the fund's agreements with foreign sub-advisers to clarify that each sub-adviser provides services as an independent contractor.
In determining whether to renew the Advisory Contracts for the fund, the Board ultimately reached a determination, with the assistance of fund counsel and Independent Trustees' counsel, that the renewal of the Advisory Contracts and the compensation to be received by Fidelity under the management contract is consistent with Fidelity's fiduciary duty under applicable law. In addition to evaluating the specific factors noted above, the Board, in reaching its determination, is aware that shareholders in the fund have a broad range of investment choices available to them, including a wide choice among mutual funds offered by competitors to Fidelity, and that the fund's shareholders, with the opportunity to review and weigh the disclosure provided by the fund in its prospectus and other public disclosures, have chosen to invest in this fund, managed by Fidelity.
Nature, Extent, and Quality of Services Provided. The Board considered staffing within the investment adviser, FMR, and the sub-advisers (together, the Investment Advisers), including the background of the fund's portfolio manager and the fund's investment objective and discipline. The Independent Trustees also had discussions with senior management of Fidelity's investment operations and investment groups. The Board considered the structure of the portfolio manager compensation program and whether this structure provides appropriate incentives.
Resources Dedicated to Investment Management and Support Services. The Board reviewed the size, education, and experience of the Investment Advisers' investment staff, their use of technology, and the Investment Advisers' approach to recruiting, training, and retaining portfolio managers and other research, advisory, and management personnel. The Board considered Fidelity's extensive global research capabilities that enable the Investment Advisers to aggregate data from various sources in an effort to produce positive investment results. The Board noted that Fidelity's analysts have access to a variety of technological tools that enable them to perform both fundamental and quantitative analysis and to specialize in various disciplines. The Board also considered that Fidelity's portfolio managers and analysts have access to daily portfolio attribution that allows for monitoring of a fund's portfolio, as well as an electronic communication system that provides immediate real-time access to research concerning issuers and credit enhancers.
Shareholder and Administrative Services. The Board considered (i) the nature, extent, quality, and cost of advisory, administrative, distribution, and shareholder services performed by the Investment Advisers and their affiliates under the Advisory Contracts and under separate agreements covering transfer agency, pricing and bookkeeping, and securities lending services for the fund; (ii) the nature and extent of the Investment Advisers' supervision of third party service providers, principally custodians and subcustodians; and (iii) the resources devoted to, and the record of compliance with, the fund's compliance policies and procedures. The Board reviewed the allocation of fund brokerage, including allocations to brokers affiliated with the Investment Advisers, the use of brokerage commissions to pay fund expenses, and the use of "soft" commission dollars to pay for research services. The Board also considered that Fidelity voluntarily pays for market data out of its own resources. The Board also considered the agreement reached between the Independent Trustees and Fidelity in December 2006 following an independent review of matters relating to receipt of travel, entertainment, gifts and gratuities in violation of Fidelity policies.
The Board noted that the growth of fund assets across the complex allows Fidelity to reinvest in the development of services designed to enhance the value or convenience of the Fidelity funds as investment vehicles. These services include 24-hour access to account information and market information through phone representatives and over the Internet, and investor education materials and asset allocation tools.
Annual Report
Board Approval of Investment Advisory Contracts and Management Fees - continued
Investment in a Large Fund Family. The Board considered the benefits to shareholders of investing in a Fidelity fund, including the benefits of investing in a fund that is part of a large family of funds offering a variety of investment disciplines and providing for a large variety of mutual fund investor services. The Board noted that, since the last Advisory Contract renewals in July 2006, Fidelity has taken a number of actions that benefited particular funds, including (i) dedicating additional resources to investment research and to restructure the investment research teams; (ii) contractually agreeing to reduce the management fee on Fidelity Advisor Floating Rate High Income Fund; (iii) contractually agreeing to reduce the management fees on Fidelity's California, Massachusetts, New Jersey, and New York AMT Tax-Free Money Market Funds, launching new Institutional Classes and Service Classes of these funds, and contractually agreeing to impose expense limitations on these funds; (iv) eliminating the exchange fee on the Fidelity Select Portfolios and reducing the pricing and bookkeeping fee rates for these funds; (v) reducing the maximum transfer agency fee rates on high income funds and certain equity funds; (vi) proposing amended management contracts that, if approved by shareholders, will add a performance adjustment component to the management fees paid by 18 Fidelity Advisor equity funds; (vii) contractually agreeing to reduce fees for Ultra-Short Central Fund and the money market Central Funds; (viii) waiving the Fidelity Advisor funds' contingent deferred sales charge on certain redemptions made through systematic withdrawal programs; and (ix) amending the management contracts for equity and fixed-income funds whose management contracts incorporate a "group fee" structure by adding four new fee "breakpoints" to the group fee rate schedules.
Investment Performance and Compliance. The Board considered whether the fund has operated within its investment objective, as well as its record of compliance with its investment restrictions. It also reviewed the fund's absolute investment performance for each class, as well as the fund's relative investment performance for each class measured against a third-party-sponsored index that reflects the market sector in which the fund invests over multiple periods. The Board noted that FMR does not believe that a meaningful peer group exists against which to compare the fund's performance. The Board also noted that in 2006 FMR implemented changes to the sector fund product line, which included a change to the fund's index. The following charts considered by the Board show, over the one-, three-, and five-year periods ended December 31, 2006, as available, the cumulative total returns of Initial Class and Investor Class of the fund and the cumulative total returns of a third-party-sponsored index ("benchmark").
VIP Utilities Portfolio
The Board stated that the relative investment performance of Initial Class of the fund compared favorably to its benchmark for all the periods shown. The Board considered that the variations in performance between the fund's classes reflect the variations in class expenses, which result in lower performance for the higher expense class.
The Board considered that FMR has taken steps to refocus and strengthen equity research, equity portfolio management, and compliance.
Based on its review, and giving particular weight to the nature and quality of the resources dedicated by the Investment Advisers to maintain and improve relative performance, the Board concluded that the nature, extent, and quality of the services provided to the fund will benefit the fund's shareholders, particularly in light of the Board's view that the fund's shareholders benefit from investing in a fund that is part of a large family of funds offering a variety of investment disciplines and services.
Competitiveness of Management Fee and Total Fund Expenses. The Board considered the fund's management fee and total expenses compared to "mapped groups" of competitive funds and classes. Fidelity creates "mapped groups" by combining similar Lipper investment objective categories that have comparable management fee characteristics. Combining Lipper investment objective categories aids the Board's management fee and total expense comparisons by broadening the competitive group used for comparison and by reducing the number of universes to which various Fidelity funds are compared. The Board also considered supplemental information about how the fund's management fee and total expenses ranked relative to groups based on Lipper classifications, which take into account a fund's market capitalization and style.
Annual Report
The Board considered two proprietary management fee comparisons for the 12-month periods shown in the chart below. The group of Lipper funds used by the Board for management fee comparisons is referred to below as the "Total Mapped Group." The Total Mapped Group comparison focuses on a fund's standing relative to the total universe of comparable funds available to investors, in terms of gross management fees before expense reimbursements or caps. "TMG %" represents the percentage of funds in the Total Mapped Group that had management fees that were lower than the fund's. For example, a TMG % of 9% means that 91% of the funds in the Total Mapped Group had higher management fees than the fund. The "Asset-Size Peer Group" (ASPG) comparison focuses on a fund's standing relative to non-Fidelity funds similar in size to the fund within the Total Mapped Group. The ASPG represents at least 15% of the funds in the Total Mapped Group with comparable asset size and management fee characteristics, subject to a minimum of 50 funds (or all funds in the Total Mapped Group if fewer than 50). Additional information, such as the ASPG quartile in which the fund's management fee ranked, is also included in the chart and considered by the Board.
VIP Utilities Portfolio

The Board noted that the fund's management fee ranked below the median of its Total Mapped Group and below the median of its ASPG for 2006.
Based on its review, the Board concluded that the fund's management fee was fair and reasonable in light of the services that the fund receives and the other factors considered.
In its review of each class's total expenses, the Board considered the fund's management fee as well as other fund or class expenses, as applicable, such as transfer agent fees, pricing and bookkeeping fees, and custodial, legal, and audit fees. The Board also noted the effects of any waivers and reimbursements on fees and expenses. As part of its review, the Board also considered current and historical total expenses of each class of the fund compared to competitive fund median expenses. Each class of the fund is compared to those funds and classes in the Total Mapped Group (used by the Board for management fee comparisons) that have a similar sales load structure.
The Board noted that the total expenses of each class ranked below its competitive median for 2006.
In its review of total expenses, the Board also considered Fidelity fee structures and other information on clients that FMR and its affiliates service in other competitive markets, such as other mutual funds advised or subadvised by FMR or its affiliates, pension plan clients, and other institutional clients.
Based on its review, the Board concluded that the total expenses of each class of the fund were reasonable in light of the services that the fund and its shareholders receive and the other factors considered.
Costs of the Services and Profitability. The Board considered the revenues earned and the expenses incurred by Fidelity in conducting the business of developing, marketing, distributing, managing, administering and servicing the fund and its shareholders. The Board also considered the level of Fidelity's profits in respect of all the Fidelity funds.
Annual Report
Board Approval of Investment Advisory Contracts and Management Fees - continued
On an annual basis, FMR presents to the Board Fidelity's profitability for the fund. Fidelity calculates the profitability for each fund, as well as aggregate profitability for groups of Fidelity funds and all Fidelity funds, using a series of detailed revenue and cost allocation methodologies which originate with the audited books and records of Fidelity. The Audit Committee of the Board reviews any significant changes from the prior year's methodologies.
PricewaterhouseCoopers LLP (PwC), independent registered public accounting firm and auditor to Fidelity and certain Fidelity funds, has been engaged annually by the Board as part of the Board's assessment of the results of Fidelity's profitability analysis. PwC's engagement includes the review and assessment of Fidelity's methodologies used in determining the revenues and expenses attributable to Fidelity's mutual fund business, and completion of agreed-upon procedures surrounding the mathematical accuracy of fund profitability and its conformity to allocation methodologies. After considering PwC's reports issued under the engagement and information provided by Fidelity, the Board believes that while other allocation methods may also be reasonable, Fidelity's profitability methodologies are reasonable in all material respects.
The Board has also reviewed Fidelity's non-fund businesses and any fall-out benefits related to the mutual fund business as well as cases where Fidelity's affiliates may benefit from or be related to the fund's business.
The Board considered the costs of the services provided by and the profits realized by Fidelity in connection with the operation of the fund and determined that the amount of profit is a fair entrepreneurial profit for the management of the fund.
Economies of Scale. The Board considered whether there have been economies of scale in respect of the management of the Fidelity funds, whether the Fidelity funds (including the fund) have appropriately benefited from any such economies of scale, and whether there is potential for realization of any further economies of scale. The Board considered the extent to which the fund will benefit from economies of scale through increased services to the fund, through waivers or reimbursements, or through fee or expense reductions.
The Board recognized that the fund's management contract incorporates a "group fee" structure, which provides for lower group fee rates as total fund assets under FMR's management increase, and for higher group fee rates as total fund assets under FMR's management decrease. FMR determines the group fee rates based on a tiered asset "breakpoint" schedule. In connection with the renewal of the fund's management contract, the Board approved amendments to the fund's management contract that added four new fee breakpoints to the group fee rate schedule for assets under FMR's management above $1,386 billion. The Board considered that the group fee rate declines under both the present and amended schedules, but that under the amended schedule, the group fee rate declines faster as assets under FMR's management exceed $1,386 billion. The Board considered that the group fee is designed to deliver the benefits of economies of scale to fund shareholders when total fund assets increase, even if assets of any particular fund are unchanged or have declined, because some portion of Fidelity's costs are attributable to services provided to all Fidelity funds, and all funds benefit if those costs can be allocated among more assets. The Board concluded that, given the group fee structure, fund shareholders will achieve a certain level of economies of scale as assets under FMR's management increase at the fund complex level, regardless of whether Fidelity achieves any such economies of scale.
The Board further concluded that any potential economies of scale are being shared between fund shareholders and Fidelity in an appropriate manner.
Additional Information Requested by the Board. In order to develop fully the factual basis for consideration of the Fidelity funds' Advisory Contracts, the Board requested and received additional information on several topics, including (i) fund performance trends and actions to be taken by FMR to improve certain funds' overall performance; (ii) Fidelity's portfolio manager compensation structure, including its effects on fund profitability and the extent to which portfolio manager compensation is linked to fund performance; (iii) Fidelity's fee structures; (iv) the funds' sub-advisory arrangements; and (v) accounts managed by Fidelity other than the Fidelity funds.
Based on its evaluation of all of the conclusions noted above, and after considering all material factors, the Board ultimately concluded that the advisory fee structures are fair and reasonable, and that the fund's Advisory Contracts should be renewed.
Annual Report
Annual Report
Annual Report
Annual Report
Annual Report
Annual Report
Investment Adviser
Fidelity Management & Research Company
Boston, MA
Investment Sub-Advisers
FMR Co., Inc.
Fidelity Management & Research (U.K.) Inc.
Fidelity Research & Analysis Company
Fidelity Investments Japan Limited
Fidelity International Investment Advisors
Fidelity International Investment Advisors
(U.K.) Limited
General Distributor
Fidelity Distributors Corporation
Boston, MA
Transfer and Service Agents
Fidelity Investments Institutional Operations Company, Inc.
Boston, MA
Fidelity Service Company, Inc.
Boston, MA
Custodian
JPMorgan Chase Bank
New York, NY
VTELIC-ANN-0208
1.817391.102
Fidelity® Variable Insurance Products:
Value Leaders Portfolio
Annual Report
December 31, 2007
(2_fidelity_logos) (Registered_Trademark)
Contents
Performance | <Click Here> | How the fund has done over time. |
Management's Discussion | <Click Here> | The manager's review of fund performance, strategy and outlook. |
Shareholder Expense Example | <Click Here> | An example of shareholder expenses. |
Investment Changes | <Click Here> | A summary of major shifts in the fund's investments over
the past six months. |
Investments | <Click Here> | A complete list of the fund's investments with their
market values. |
Financial Statements | <Click Here> | Statements of assets and liabilities, operations, and
changes in net assets, as well as financial highlights. |
Notes | <Click Here> | Notes to the financial statements. |
Report of Independent Registered Public Accounting Firm | <Click Here> | |
Trustees and Officers | <Click Here> | |
Distributions | <Click Here> | |
Board Approval of Investment Advisory Contracts and Management Fees | <Click Here> | |
| | |
To view a fund's proxy voting guidelines and proxy voting record for the 12-month period ended June 30, visit http://www.fidelity.com (search for "proxy voting guidelines") or visit the Securities and Exchange Commission's (SEC) web site at http://www.sec.gov. You may also call 1-877-208-0098 to request a free copy of the proxy voting guidelines.
Fidelity Variable Insurance Products are separate account options which are purchased through a variable insurance contract.
Standard & Poor's, S&P and S&P 500 are registered service marks of The McGraw-Hill Companies, Inc. and have been licensed for use by Fidelity Distributors Corporation.
Other third party marks appearing herein are the property of their respective owners.
All other marks appearing herein are registered or unregistered trademarks or service marks of FMR Corp. or an affiliated company.
This report and the financial statements contained herein are submitted for the general information of the shareholders of the fund. This report is not authorized for distribution to prospective investors in the fund unless preceded or accompanied by an effective prospectus.
A fund files its complete schedule of portfolio holdings with the SEC for the first and third quarters of each fiscal year on Form N-Q. Forms N-Q are available on the SEC's web site at http://www.sec.gov. A fund's Forms N-Q may be reviewed and copied at the SEC's Public Reference Room in Washington, DC. Information regarding the operation of the SEC's Public Reference Room may be obtained by calling 1-800-SEC-0330. For a complete list of a fund's portfolio holdings, view the most recent holdings listing, semiannual report, or annual report on Fidelity's web site at http://www.fidelity.com or http://www.advisor.fidelity.com, as applicable.
NOT FDIC INSURED · MAY LOSE VALUE · NO BANK GUARANTEE
Neither the fund nor Fidelity Distributors Corporation is a bank.
Annual Report
Performance: The Bottom Line
Average annual total return reflects the change in the value of an investment, assuming reinvestment of the class' dividend income and capital gains (the profits earned upon the sale of securities that have grown in value, if any) and assuming a constant rate of performance each year. During periods of reimbursement by Fidelity, a fund's total return will be greater than it would be had the reimbursement not occurred. Performance numbers are net of all underlying fund operating expenses, but do not include any insurance charges imposed by your insurance company's separate account. If performance information included the effect of these additional charges, the total returns would have been lower. How a fund did yesterday is no guarantee of how it will do tomorrow.
Average Annual Total Returns
Periods ended December 31, 2007 | | Past 1
year | Life of fund A |
VIP® Value Leaders - Initial Class | | 4.56% | 12.67% |
VIP Value Leaders - Service Class B | | 4.43% | 12.57% |
VIP Value Leaders - Service Class 2 C | | 4.22% | 12.38% |
VIP Value Leaders - Investor Class D | | 4.41% | 12.60% |
A From June 17, 2003.
B Performance for Service Class shares reflects an asset-based service fee (12b-1 fee).
C Performance for Service Class 2 shares reflects an asset-based service fee (12b-1 fee).
D The initial offering of Investor Class shares took place on July 21, 2005. Returns prior to July 21, 2005 are those of Initial Class. If Investor Class's transfer agent fee had been reflected, returns prior to July 21, 2005 would have been lower.
$10,000 Over Life of Fund
Let's say hypothetically that $10,000 was invested in VIP Value Leaders Portfolio - Initial Class on June 17, 2003, when the fund started. The chart shows how the value of your investment would have changed, and also shows how the Russell 1000® Value Index performed over the same period.
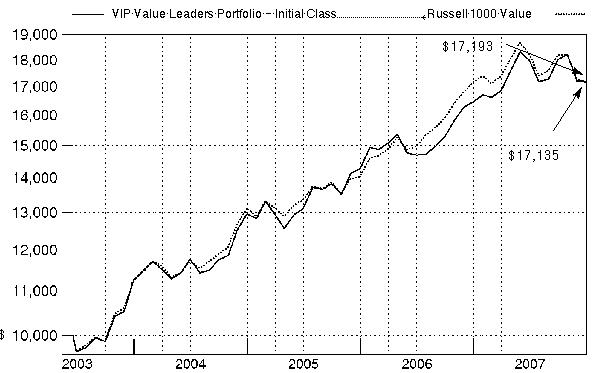
Annual Report
Management's Discussion of Fund Performance
Comments from Charles Hebard, Portfolio Manager of VIP Value Leaders Portfolio
U.S. equity markets, as measured by the bellwether Dow Jones Industrial AverageSM and the Standard & Poor's 500SM Index, registered their fifth consecutive year of positive returns in 2007, as the Dow rose 8.88% and the S&P 500® index advanced 5.49%. The tech-heavy NASDAQ Composite® Index did even better, increasing 10.55%. However, credit- and recession-related concerns carved deeply into stock prices late in 2007, pushing some major market measures into negative territory for the year overall, particularly smaller-cap and value-oriented benchmarks. Based largely on a weak U.S. dollar that boosted returns for U.S. investors, the Morgan Stanley Capital InternationalSM Europe, Australasia, and Far East (MSCI® EAFE®) Index - a gauge of developed stock markets outside the United States and Canada - beat most domestic equity measures, gaining 11.33%. Several European countries had outstanding performance, including Finland and Germany, while Australia also did very well. However, fallout from the credit crunch and concerns about export growth tempered U.K. stocks, while fears that Japanese financial companies would become embroiled in the U.S. subprime mortgage crisis contributed to a loss of more than 4% for the Japanese portion of the index. The emerging-markets stock asset class soared 39.78% according to the MSCI Emerging Markets index. The U.S. investment-grade bond market climbed 6.97% as measured by the Lehman Brothers® U.S. Aggregate Index, beating the 2.53% gain for the Merrill Lynch® U.S. High Yield Master II Constrained Index. The emerging-markets bond category shook off a sluggish first half of 2007 to finish the year with a respectable gain of 6.28% as measured by the J.P. Morgan Emerging Markets Bond Index (EMBI) Global, while the Citigroup® Non-U.S. Group of 7 Index - representing the debt performance of major global economies, excluding the United States - rose 13.05%.
For the 12-month period ending December 31, 2007, the fund solidly outperformed the Russell 1000® Value Index, which was down 0.17%. (For specific portfolio performance results, please refer to the performance section of this report.) Energy and financials were, respectively, the strongest- and weakest-performing areas of the benchmark during the period, and my stock selection and positioning in both sectors aided relative results. In the energy area, performance benefited from an emphasis on oilfield services companies and exploration and production (E&P) companies leveraged to North American natural gas. Oilfield services firms National Oilwell Varco and Smith International continued to beat Wall Street analysts' earnings expectations, as they had for several quarters. These stocks benefited from increasing confidence among investors that oil prices would remain high. E&P firm Ultra Petroleum rallied on rising natural gas prices, while coal producer CONSOL Energy benefited from higher coal prices. Smith International, Ultra Petroleum and CONSOL Energy were not index components. On the negative side, underweighting Exxon Mobil and avoiding Chevron detracted from results as these two integrated oil companies, both index components, rose sharply. Elsewhere, I underestimated the severity of the housing crisis, and the fund was hurt was by investments in homebuilders Standard Pacific and KB Home. At period end, Smith International and Standard Pacific were no longer held in the portfolio.
The views expressed above reflect those of the portfolio manager(s) only through the end of the period as stated on the cover of this report and do not necessarily represent the views of Fidelity or any other person in the Fidelity organization. Any such views are subject to change at any time based upon market or other conditions and Fidelity disclaims any responsibility to update such views. These views may not be relied on as investment advice and, because investment decisions for a Fidelity fund are based on numerous factors, may not be relied on as an indication of trading intent on behalf of any Fidelity fund.
Annual Report
Shareholder Expense Example
As a shareholder of the Fund, you incur two types of costs: (1) transaction costs, and (2) ongoing costs, including management fees, distribution and/or service (12b-1) fees and other Fund expenses. This Example is intended to help you understand your ongoing costs (in dollars) of investing in the Fund and to compare these costs with the ongoing costs of investing in other mutual funds.
The Example is based on an investment of $1,000 invested at the beginning of the period and held for the entire period (July 1, 2007 to December 31, 2007).
Actual Expenses
The first line of the accompanying table for each class of the Fund provides information about actual account values and actual expenses. You may use the information in this line, together with the amount you invested, to estimate the expenses that you paid over the period. Simply divide your account value by $1,000.00 (for example, an $8,600 account value divided by $1,000.00 = 8.6), then multiply the result by the number in the first line for a class of the Fund under the heading entitled "Expenses Paid During Period" to estimate the expenses you paid on your account during this period. The estimate of expenses does not include any fees or other expenses of any variable annuity or variable life insurance product. If they were, the estimate of expenses you paid during the period would be higher, and your ending account value would be lower. In addition, the Fund, as a shareholder in the underlying Fidelity Central Funds, will indirectly bear its pro rata share of the fees and expenses incurred by the underlying Fidelity Central Funds. These fees and expenses are not included in the Fund's annualized expense ratio used to calculate the expense estimate in the table below.
Hypothetical Example for Comparison Purposes
The second line of the accompanying table for each class of the Fund provides information about hypothetical account values and hypothetical expenses based on a Class' actual expense ratio and an assumed rate of return of 5% per year before expenses, which is not the Class' actual return. The hypothetical account values and expenses may not be used to estimate the actual ending account balance or expenses you paid for the period. You may use this information to compare the ongoing costs of investing in the Fund and other funds. To do so, compare this 5% hypothetical example with the 5% hypothetical examples that appear in the shareholder reports of the other funds. The estimate of expenses does not include any fees or other expenses of any variable annuity or variable life insurance product. If they were, the estimate of expenses you paid during the period would be higher, and your ending account value would be lower. In addition, the Fund, as a shareholder in the underlying Fidelity Central Funds, will indirectly bear its pro rata share of the fees and expenses incurred by the underlying Fidelity Central Funds. These fees and expenses are not included in the Fund's annualized expense ratio used to calculate the expense estimate in the table below.
Please note that the expenses shown in the table are meant to highlight your ongoing costs only and do not reflect any transaction costs. Therefore, the second line of the table is useful in comparing ongoing costs only, and will not help you determine the relative total costs of owning different funds.
| Beginning
Account Value
July 1, 2007 | Ending
Account Value
December 31, 2007 | Expenses Paid
During Period*
July 1, 2007
to December 31, 2007 |
Initial Class | | | |
Actual | $ 1,000.00 | $ 956.30 | $ 3.85 |
HypotheticalA | $ 1,000.00 | $ 1,021.27 | $ 3.97 |
Service Class | | | |
Actual | $ 1,000.00 | $ 955.50 | $ 4.29 |
HypotheticalA | $ 1,000.00 | $ 1,020.82 | $ 4.43 |
Service Class 2 | | | |
Actual | $ 1,000.00 | $ 954.50 | $ 5.12 |
HypotheticalA | $ 1,000.00 | $ 1,019.96 | $ 5.30 |
Investor Class | | | |
Actual | $ 1,000.00 | $ 955.40 | $ 4.39 |
HypotheticalA | $ 1,000.00 | $ 1,020.72 | $ 4.53 |
A 5% return per year before expenses
* Expenses are equal to each Class' annualized expense ratio (shown in the table below); multiplied by the average account value over the period, multiplied by 184/365 (to reflect the one-half year period).
| Annualized
Expense Ratio |
Initial Class | .78% |
Service Class | .87% |
Service Class 2 | 1.04% |
Investor Class | .89% |
Annual Report
Investment Changes
Top Ten Stocks as of December 31, 2007 |
| % of fund's
net assets | % of fund's net assets
6 months ago |
ConocoPhillips | 4.6 | 3.0 |
Bank of America Corp. | 4.3 | 4.1 |
AT&T, Inc. | 4.0 | 4.8 |
American International Group, Inc. | 3.7 | 3.5 |
General Electric Co. | 3.0 | 2.8 |
Exxon Mobil Corp. | 2.9 | 2.3 |
JPMorgan Chase & Co. | 2.9 | 2.4 |
Procter & Gamble Co. | 2.7 | 1.9 |
Citigroup, Inc. | 2.3 | 3.7 |
Verizon Communications, Inc. | 2.2 | 1.2 |
| 32.6 | |
Top Five Market Sectors as of December 31, 2007 |
| % of fund's
net assets | % of fund's net assets
6 months ago |
Financials | 28.7 | 31.4 |
Energy | 18.2 | 16.2 |
Industrials | 9.9 | 9.9 |
Telecommunication Services | 7.1 | 6.7 |
Consumer Staples | 6.9 | 7.1 |
Asset Allocation (% of fund's net assets) |
As of December 31, 2007 * | As of June 30, 2007 ** |
| Stocks 99.5% | | | Stocks 99.1% | |
| Short-Term
Investments and
Net Other Assets 0.5% | | | Short-Term
Investments and
Net Other Assets 0.9% | |
* Foreign investments | 14.3% | | ** Foreign investments | 14.2% | |

Annual Report
Investments December 31, 2007
Showing Percentage of Net Assets
Common Stocks - 99.5% |
| Shares | | Value |
CONSUMER DISCRETIONARY - 6.7% |
Automobiles - 0.3% |
Renault SA | 1,500 | | $ 212,365 |
Diversified Consumer Services - 0.2% |
H&R Block, Inc. | 10,100 | | 187,557 |
Hotels, Restaurants & Leisure - 0.4% |
McDonald's Corp. | 5,540 | | 326,361 |
Household Durables - 1.6% |
Bassett Furniture Industries, Inc. | 4,961 | | 46,336 |
Black & Decker Corp. | 3,000 | | 208,950 |
Centex Corp. | 8,900 | | 224,814 |
KB Home | 28,200 | | 609,120 |
Whirlpool Corp. | 1,700 | | 138,771 |
| | 1,227,991 |
Leisure Equipment & Products - 0.6% |
Brunswick Corp. | 6,300 | | 107,415 |
Eastman Kodak Co. | 8,720 | | 190,706 |
Mattel, Inc. | 9,200 | | 175,168 |
| | 473,289 |
Media - 1.4% |
News Corp. Class A | 19,400 | | 397,506 |
Regal Entertainment Group Class A | 10,100 | | 182,507 |
Time Warner, Inc. | 31,700 | | 523,367 |
| | 1,103,380 |
Multiline Retail - 0.4% |
Sears Holdings Corp. (a)(d) | 2,800 | | 285,740 |
Tuesday Morning Corp. | 5,300 | | 26,871 |
| | 312,611 |
Specialty Retail - 1.6% |
Advance Auto Parts, Inc. | 5,500 | | 208,945 |
Home Depot, Inc. | 5,850 | | 157,599 |
PetSmart, Inc. | 6,900 | | 162,357 |
Ross Stores, Inc. | 10,500 | | 268,485 |
Staples, Inc. | 12,600 | | 290,682 |
Williams-Sonoma, Inc. | 6,800 | | 176,120 |
| | 1,264,188 |
Textiles, Apparel & Luxury Goods - 0.2% |
Liz Claiborne, Inc. | 6,200 | | 126,170 |
TOTAL CONSUMER DISCRETIONARY | | 5,233,912 |
CONSUMER STAPLES - 6.9% |
Food & Staples Retailing - 0.6% |
Rite Aid Corp. (a) | 37,500 | | 104,625 |
SUPERVALU, Inc. | 5,900 | | 221,368 |
Winn-Dixie Stores, Inc. (a) | 11,700 | | 197,379 |
| | 523,372 |
Food Products - 1.7% |
Cermaq ASA | 7,400 | | 102,806 |
Chiquita Brands International, Inc. (a) | 13,000 | | 239,070 |
|
| Shares | | Value |
Marine Harvest ASA (a) | 176,000 | | $ 113,026 |
Nestle SA (Reg.) | 1,907 | | 873,406 |
| | 1,328,308 |
Household Products - 2.8% |
Central Garden & Pet Co. Class A (non-vtg.) (a) | 13,900 | | 74,504 |
Procter & Gamble Co. | 28,500 | | 2,092,470 |
| | 2,166,974 |
Tobacco - 1.8% |
Altria Group, Inc. | 9,500 | | 718,010 |
British American Tobacco PLC sponsored ADR | 8,900 | | 699,184 |
| | 1,417,194 |
TOTAL CONSUMER STAPLES | | 5,435,848 |
ENERGY - 18.2% |
Energy Equipment & Services - 2.1% |
Expro International Group PLC | 7,200 | | 147,774 |
Exterran Holdings, Inc. (a) | 1,947 | | 159,265 |
Nabors Industries Ltd. (a) | 14,800 | | 405,372 |
National Oilwell Varco, Inc. (a) | 7,626 | | 560,206 |
Transocean, Inc. (a) | 2,568 | | 367,609 |
| | 1,640,226 |
Oil, Gas & Consumable Fuels - 16.1% |
Chesapeake Energy Corp. | 6,700 | | 262,640 |
ConocoPhillips (d) | 40,680 | | 3,592,044 |
CONSOL Energy, Inc. | 8,200 | | 586,464 |
EnCana Corp. | 3,200 | | 217,402 |
EOG Resources, Inc. | 10,300 | | 919,275 |
EXCO Resources, Inc. (a) | 12,100 | | 187,308 |
Exxon Mobil Corp. | 24,100 | | 2,257,929 |
Hess Corp. | 2,600 | | 262,236 |
Occidental Petroleum Corp. | 16,000 | | 1,231,840 |
Quicksilver Resources, Inc. (a) | 6,000 | | 357,540 |
Suncor Energy, Inc. | 3,500 | | 380,137 |
Ultra Petroleum Corp. (a) | 15,900 | | 1,136,850 |
Uranium One, Inc. (a) | 9,800 | | 87,096 |
Valero Energy Corp. | 15,800 | | 1,106,474 |
| | 12,585,235 |
TOTAL ENERGY | | 14,225,461 |
FINANCIALS - 28.7% |
Capital Markets - 5.4% |
Ares Capital Corp. | 9,700 | | 141,911 |
Bear Stearns Companies, Inc. (d) | 5,200 | | 458,900 |
Charles Schwab Corp. | 7,968 | | 203,582 |
Franklin Resources, Inc. | 2,300 | | 263,189 |
Goldman Sachs Group, Inc. | 2,700 | | 580,635 |
Julius Baer Holding AG | 3,191 | | 263,547 |
KKR Private Equity Investors, LP | 13,938 | | 249,490 |
Common Stocks - continued |
| Shares | | Value |
FINANCIALS - continued |
Capital Markets - continued |
KKR Private Equity Investors, LP Restricted Depositary Units (e) | 1,700 | | $ 30,430 |
Legg Mason, Inc. | 2,500 | | 182,875 |
Lehman Brothers Holdings, Inc. | 18,800 | | 1,230,272 |
State Street Corp. | 7,494 | | 608,513 |
| | 4,213,344 |
Commercial Banks - 2.5% |
Associated Banc-Corp. | 5,658 | | 153,275 |
DnB Nor ASA | 14,200 | | 216,874 |
HSBC Holdings PLC sponsored ADR | 3,900 | | 326,469 |
Siam City Bank PCL NVDR | 255,000 | | 111,938 |
Sterling Financial Corp., Washington | 7,500 | | 125,925 |
Unicredito Italiano SpA | 25,000 | | 207,198 |
Wachovia Corp. | 22,201 | | 844,304 |
| | 1,985,983 |
Consumer Finance - 0.2% |
Discover Financial Services | 12,050 | | 181,714 |
Diversified Financial Services - 9.5% |
Bank of America Corp. | 80,708 | | 3,330,012 |
Citigroup, Inc. | 61,800 | | 1,819,392 |
JPMorgan Chase & Co. | 51,196 | | 2,234,705 |
| | 7,384,109 |
Insurance - 8.0% |
ACE Ltd. | 10,520 | | 649,926 |
Admiral Group PLC | 6,400 | | 139,874 |
AMBAC Financial Group, Inc. | 7,141 | | 184,024 |
American International Group, Inc. | 49,760 | | 2,901,008 |
Argo Group International Holdings, Ltd. (a) | 4,952 | | 208,628 |
Endurance Specialty Holdings Ltd. | 5,700 | | 237,861 |
Hartford Financial Services Group, Inc. | 6,000 | | 523,140 |
IPC Holdings Ltd. | 11,938 | | 344,650 |
MBIA, Inc. | 4,300 | | 80,109 |
Montpelier Re Holdings Ltd. | 17,100 | | 290,871 |
Platinum Underwriters Holdings Ltd. | 9,900 | | 352,044 |
Principal Financial Group, Inc. | 5,100 | | 351,084 |
| | 6,263,219 |
Real Estate Investment Trusts - 1.2% |
Alexandria Real Estate Equities, Inc. | 2,600 | | 264,342 |
Annaly Capital Management, Inc. | 17,800 | | 323,604 |
General Growth Properties, Inc. | 3,570 | | 147,013 |
Home Properties, Inc. | 3,600 | | 161,460 |
| | 896,419 |
Real Estate Management & Development - 0.5% |
CB Richard Ellis Group, Inc. Class A (a) | 16,900 | | 364,195 |
Thrifts & Mortgage Finance - 1.4% |
Countrywide Financial Corp. | 15,700 | | 140,358 |
Fannie Mae | 9,410 | | 376,212 |
FirstFed Financial Corp. (a)(d) | 4,800 | | 171,936 |
|
| Shares | | Value |
New York Community Bancorp, Inc. | 13,400 | | $ 235,572 |
Washington Federal, Inc. | 9,600 | | 202,656 |
| | 1,126,734 |
TOTAL FINANCIALS | | 22,415,717 |
HEALTH CARE - 6.0% |
Biotechnology - 1.2% |
Amgen, Inc. (a) | 12,400 | | 575,856 |
Biogen Idec, Inc. (a) | 2,800 | | 159,376 |
Cephalon, Inc. (a) | 2,400 | | 172,224 |
| | 907,456 |
Health Care Equipment & Supplies - 2.1% |
Becton, Dickinson & Co. | 4,500 | | 376,110 |
Boston Scientific Corp. (a) | 16,700 | | 194,221 |
C.R. Bard, Inc. | 2,600 | | 246,480 |
Covidien Ltd. | 8,082 | | 357,952 |
Medtronic, Inc. | 10,100 | | 507,727 |
| | 1,682,490 |
Life Sciences Tools & Services - 0.2% |
Thermo Fisher Scientific, Inc. (a) | 3,300 | | 190,344 |
Pharmaceuticals - 2.5% |
Johnson & Johnson | 12,200 | | 813,740 |
Merck & Co., Inc. | 15,700 | | 912,327 |
Wyeth | 5,160 | | 228,020 |
| | 1,954,087 |
TOTAL HEALTH CARE | | 4,734,377 |
INDUSTRIALS - 9.9% |
Aerospace & Defense - 2.9% |
General Dynamics Corp. | 2,700 | | 240,273 |
Honeywell International, Inc. | 14,200 | | 874,294 |
Raytheon Co. | 4,500 | | 273,150 |
United Technologies Corp. | 11,500 | | 880,210 |
| | 2,267,927 |
Air Freight & Logistics - 0.3% |
United Parcel Service, Inc. Class B | 3,700 | | 261,664 |
Airlines - 0.2% |
Delta Air Lines, Inc. (a) | 7,400 | | 110,186 |
US Airways Group, Inc. (a) | 3,200 | | 47,072 |
| | 157,258 |
Building Products - 0.1% |
Masco Corp. | 4,900 | | 105,889 |
Commercial Services & Supplies - 0.8% |
Allied Waste Industries, Inc. (a) | 23,100 | | 254,562 |
Robert Half International, Inc. | 5,000 | | 135,200 |
The Brink's Co. | 4,500 | | 268,830 |
| | 658,592 |
Construction & Engineering - 0.3% |
URS Corp. (a) | 3,600 | | 195,588 |
Common Stocks - continued |
| Shares | | Value |
INDUSTRIALS - continued |
Industrial Conglomerates - 3.8% |
General Electric Co. | 63,740 | | $ 2,362,842 |
Siemens AG sponsored ADR | 3,700 | | 582,232 |
| | 2,945,074 |
Machinery - 0.8% |
Ingersoll-Rand Co. Ltd. Class A | 5,300 | | 246,291 |
Oshkosh Truck Co. | 4,200 | | 198,492 |
Sulzer AG (Reg.) | 137 | | 201,275 |
| | 646,058 |
Road & Rail - 0.7% |
Knight Transportation, Inc. | 17,800 | | 263,618 |
Ryder System, Inc. | 5,200 | | 244,452 |
| | 508,070 |
TOTAL INDUSTRIALS | | 7,746,120 |
INFORMATION TECHNOLOGY - 6.5% |
Communications Equipment - 0.9% |
Alcatel-Lucent SA sponsored ADR | 17,200 | | 125,904 |
Comverse Technology, Inc. (a) | 7,800 | | 134,550 |
Motorola, Inc. | 29,300 | | 469,972 |
| | 730,426 |
Computers & Peripherals - 2.4% |
Hewlett-Packard Co. | 21,900 | | 1,105,512 |
International Business Machines Corp. | 5,300 | | 572,930 |
NCR Corp. (a) | 8,800 | | 220,880 |
| | 1,899,322 |
Electronic Equipment & Instruments - 1.4% |
Agilent Technologies, Inc. (a) | 6,000 | | 220,440 |
Amphenol Corp. Class A | 1,200 | | 55,644 |
Avnet, Inc. (a) | 5,800 | | 202,826 |
Flextronics International Ltd. (a) | 15,700 | | 189,342 |
Motech Industries, Inc. | 21,975 | | 201,590 |
Tyco Electronics Ltd. | 6,682 | | 248,103 |
| | 1,117,945 |
Internet Software & Services - 0.3% |
VeriSign, Inc. (a) | 5,700 | | 214,377 |
IT Services - 0.5% |
The Western Union Co. | 9,900 | | 240,372 |
Unisys Corp. (a) | 28,902 | | 136,706 |
| | 377,078 |
Semiconductors & Semiconductor Equipment - 1.0% |
Analog Devices, Inc. | 3,900 | | 123,630 |
Applied Materials, Inc. | 8,600 | | 152,736 |
Atmel Corp. (a) | 6,300 | | 27,216 |
Maxim Integrated Products, Inc. | 6,900 | | 182,712 |
Novellus Systems, Inc. (a) | 6,400 | | 176,448 |
|
| Shares | | Value |
ON Semiconductor Corp. (a) | 4,100 | | $ 36,408 |
Volterra Semiconductor Corp. (a) | 5,400 | | 59,562 |
| | 758,712 |
TOTAL INFORMATION TECHNOLOGY | | 5,097,860 |
MATERIALS - 3.7% |
Chemicals - 0.7% |
Agrium, Inc. | 3,200 | | 230,833 |
Albemarle Corp. | 5,010 | | 206,663 |
Chemtura Corp. | 10,400 | | 81,120 |
| | 518,616 |
Metals & Mining - 3.0% |
Alcoa, Inc. | 13,700 | | 500,735 |
Allegheny Technologies, Inc. | 1,300 | | 112,320 |
ArcelorMittal SA (NY Reg.) Class A | 4,200 | | 324,870 |
Carpenter Technology Corp. | 3,600 | | 270,612 |
Freeport-McMoRan Copper & Gold, Inc. Class B | 3,700 | | 379,028 |
Goldcorp, Inc. | 3,600 | | 122,470 |
Lihir Gold Ltd. (a) | 51,483 | | 162,789 |
Newcrest Mining Ltd. | 6,139 | | 177,984 |
Randgold Resources Ltd. sponsored ADR | 3,400 | | 126,242 |
Reliance Steel & Aluminum Co. | 3,100 | | 168,020 |
| | 2,345,070 |
TOTAL MATERIALS | | 2,863,686 |
TELECOMMUNICATION SERVICES - 7.1% |
Diversified Telecommunication Services - 6.9% |
AT&T, Inc. | 74,540 | | 3,097,882 |
Cincinnati Bell, Inc. (a) | 34,400 | | 163,400 |
Embarq Corp. | 3,200 | | 158,496 |
Qwest Communications International, Inc. | 35,500 | | 248,855 |
Verizon Communications, Inc. | 38,800 | | 1,695,172 |
| | 5,363,805 |
Wireless Telecommunication Services - 0.2% |
American Tower Corp. Class A (a) | 3,950 | | 168,270 |
TOTAL TELECOMMUNICATION SERVICES | | 5,532,075 |
UTILITIES - 5.8% |
Electric Utilities - 2.9% |
E.ON AG sponsored ADR | 3,600 | | 253,260 |
Edison International | 5,600 | | 298,872 |
Entergy Corp. | 6,200 | | 741,024 |
PPL Corp. | 11,300 | | 588,617 |
Reliant Energy, Inc. (a) | 15,700 | | 411,968 |
| | 2,293,741 |
Independent Power Producers & Energy Traders - 2.0% |
AES Corp. (a) | 12,500 | | 267,375 |
Common Stocks - continued |
| Shares | | Value |
UTILITIES - continued |
Independent Power Producers & Energy Traders - continued |
Constellation Energy Group, Inc. | 9,300 | | $ 953,529 |
NRG Energy, Inc. (a) | 8,200 | | 355,388 |
| | 1,576,292 |
Multi-Utilities - 0.9% |
CMS Energy Corp. | 11,500 | | 199,870 |
OGE Energy Corp. | 6,600 | | 239,514 |
Sempra Energy | 4,100 | | 253,708 |
| | 693,092 |
TOTAL UTILITIES | | 4,563,125 |
TOTAL COMMON STOCKS (Cost $72,791,618) | 77,848,181 |
Money Market Funds - 3.5% |
| | | |
Fidelity Cash Central Fund, 4.58% (b) | 433,228 | | 433,228 |
Fidelity Securities Lending Cash Central Fund, 4.65% (b)(c) | 2,302,900 | | 2,302,900 |
TOTAL MONEY MARKET FUNDS (Cost $2,736,128) | 2,736,128 |
TOTAL INVESTMENT PORTFOLIO - 103.0% (Cost $75,527,746) | 80,584,309 |
NET OTHER ASSETS - (3.0)% | (2,369,342) |
NET ASSETS - 100% | $ 78,214,967 |
Legend |
(a) Non-income producing |
(b) Affiliated fund that is available only to investment companies and other accounts managed by Fidelity Investments. The rate quoted is the annualized seven-day yield of the fund at period end. A complete unaudited listing of the fund's holdings as of its most recent quarter end is available upon request. |
(c) Investment made with cash collateral received from securities on loan. |
(d) Security or a portion of the security is on loan at period end. |
(e) Security exempt from registration under Rule 144A of the Securities Act of 1933. These securities may be resold in transactions exempt from registration, normally to qualified institutional buyers. At the end of the period, the value of these securities amounted to $30,430 or 0.0% of net assets. |
Affiliated Central Funds |
Information regarding fiscal year to date income earned by the Fund from investments in Fidelity Central Funds is as follows: |
Fund | Income earned |
Fidelity Cash Central Fund | $ 21,111 |
Fidelity Securities Lending Cash Central Fund | 8,142 |
Total | $ 29,253 |
Other Information |
Distribution of investments by country of issue, as a percentage of total net assets, is as follows: |
United States of America | 85.7% |
Bermuda | 3.0% |
Canada | 2.9% |
United Kingdom | 2.2% |
Switzerland | 1.7% |
Germany | 1.1% |
Others (individually less than 1%) | 3.4% |
| 100.0% |
See accompanying notes which are an integral part of the financial statements.
Annual Report
Financial Statements
Statement of Assets and Liabilities
| December 31, 2007 |
| | |
Assets | | |
Investment in securities, at value (including securities loaned of $2,245,080) - See accompanying schedule: Unaffiliated issuers
(cost $72,791,618) | $ 77,848,181 | |
Fidelity Central Funds (cost $2,736,128) | 2,736,128 | |
Total Investments (cost $75,527,746) | | $ 80,584,309 |
Receivable for investments sold | | 243,161 |
Receivable for fund shares sold | | 4,032 |
Dividends receivable | | 90,153 |
Distributions receivable from Fidelity Central Funds | | 2,392 |
Prepaid expenses | | 266 |
Other receivables | | 320 |
Total assets | | 80,924,633 |
| | |
Liabilities | | |
Payable to custodian bank | $ 21 | |
Payable for investments purchased | 78,227 | |
Payable for fund shares redeemed | 231,103 | |
Accrued management fee | 36,342 | |
Distribution fees payable | 1,391 | |
Other affiliated payables | 10,610 | |
Other payables and accrued expenses | 49,072 | |
Collateral on securities loaned, at value | 2,302,900 | |
Total liabilities | | 2,709,666 |
| | |
Net Assets | | $ 78,214,967 |
Net Assets consist of: | | |
Paid in capital | | $ 73,667,882 |
Undistributed net investment income | | 9,748 |
Accumulated undistributed net realized gain (loss) on investments and foreign currency transactions | | (519,574) |
Net unrealized appreciation (depreciation) on investments and assets and liabilities in foreign currencies | | 5,056,911 |
Net Assets | | $ 78,214,967 |
Statement of Assets and Liabilities - continued
| December 31, 2007 |
| | |
Initial Class:
Net Asset Value, offering price and redemption price per share ($30,299,977 ÷ 2,182,124 shares) | | $ 13.89 |
| | |
Service Class:
Net Asset Value, offering price and redemption price per share ($2,577,037 ÷ 185,988 shares) | | $ 13.86 |
| | |
Service Class 2:
Net Asset Value, offering price and redemption price per share ($5,724,015 ÷ 414,761 shares) | | $ 13.80 |
| | |
Investor Class:
Net Asset Value, offering price and redemption price per share ($39,613,938 ÷ 2,857,057 shares) | | $ 13.87 |
See accompanying notes which are an integral part of the financial statements.
Annual Report
Financial Statements - continued
Statement of Operations
| Year ended December 31, 2007 |
| | |
Investment Income | | |
Dividends | | $ 1,728,588 |
Income from Fidelity Central Funds | | 29,253 |
Total income | | 1,757,841 |
| | |
Expenses | | |
Management fee | $ 474,066 | |
Transfer agent fees | 106,522 | |
Distribution fees | 15,814 | |
Accounting and security lending fees | 33,299 | |
Custodian fees and expenses | 40,407 | |
Independent trustees' compensation | 293 | |
Audit | 55,124 | |
Legal | 608 | |
Miscellaneous | 12,653 | |
Total expenses before reductions | 738,786 | |
Expense reductions | (1,745) | 737,041 |
Net investment income (loss) | | 1,020,800 |
Realized and Unrealized Gain (Loss) Net realized gain (loss) on: | | |
Investment securities: | | |
Unaffiliated issuers (net of foreign taxes of $(2)) | 5,668,145 | |
Foreign currency transactions | 13,702 | |
Total net realized gain (loss) | | 5,681,847 |
Change in net unrealized appreciation (depreciation) on: Investment securities | (3,353,836) | |
Assets and liabilities in foreign currencies | 286 | |
Total change in net unrealized appreciation (depreciation) | | (3,353,550) |
Net gain (loss) | | 2,328,297 |
Net increase (decrease) in net assets resulting from operations | | $ 3,349,097 |
Statement of Changes in Net Assets
| Year ended
December 31,
2007 | Year ended
December 31,
2006 |
Increase (Decrease) in Net Assets | | |
Operations | | |
Net investment income (loss) | $ 1,020,800 | $ 646,523 |
Net realized gain (loss) | 5,681,847 | 2,929,131 |
Change in net unrealized appreciation (depreciation) | (3,353,550) | 5,333,793 |
Net increase (decrease) in net assets resulting from operations | 3,349,097 | 8,909,447 |
Distributions to shareholders from net investment income | (1,022,650) | (632,567) |
Distributions to shareholders from net realized gain | (7,264,777) | (1,820,096) |
Total distributions | (8,287,427) | (2,452,663) |
Share transactions - net increase (decrease) | 5,228,300 | 24,630,755 |
Total increase (decrease) in net assets | 289,970 | 31,087,539 |
| | |
Net Assets | | |
Beginning of period | 77,924,997 | 46,837,458 |
End of period (including undistributed net investment income of $9,748 and undistributed net investment income of $13,644, respectively) | $ 78,214,967 | $ 77,924,997 |
See accompanying notes which are an integral part of the financial statements.
Annual Report
Financial Highlights - Initial Class
Years ended December 31, | 2007 | 2006 | 2005 | 2004 | 2003 I |
Selected Per-Share Data | | | | | |
Net asset value, beginning of period | $ 14.82 | $ 13.30 | $ 12.28 | $ 11.20 | $ 10.00 |
Income from Investment Operations | | | | | |
Net investment income (loss) E | .20 | .15 | .13 | .10 H | .04 |
Net realized and unrealized gain (loss) | .48 | 1.86 | 1.11 | 1.59 | 1.21 |
Total from investment operations | .68 | 2.01 | 1.24 | 1.69 | 1.25 |
Distributions from net investment income | (.21) | (.13) | (.07) | (.08) | (.04) |
Distributions from net realized gain | (1.40) | (.37) | (.16) | (.53) | (.01) |
Total distributions | (1.61) | (.49) L | (.22) K | (.61) | (.05) |
Net asset value, end of period | $ 13.89 | $ 14.82 | $ 13.30 | $ 12.28 | $ 11.20 |
Total Return B, C, D | 4.56% | 15.18% | 10.18% | 15.15% | 12.51% |
Ratios to Average Net Assets F, J | | | | | |
Expenses before reductions | .80% | .84% | .98% | 2.07% | 3.63% A |
Expenses net of fee waivers, if any | .80% | .84% | .85% | 1.00% | 1.06% A |
Expenses net of all reductions | .80% | .83% | .81% | .96% | 1.04% A |
Net investment income (loss) | 1.27% | 1.09% | 1.00% | .88% | .78% A |
Supplemental Data | | | | | |
Net assets, end of period (000 omitted) | $ 30,300 | $ 42,725 | $ 37,465 | $ 1,944 | $ 1,687 |
Portfolio turnover rate G | 98% | 94% | 75% | 121% | 119% A |
A Annualized
B Total returns for periods of less than one year are not annualized.
C Total returns do not reflect charges attributable to your insurance company's separate account. Inclusion of these charges would reduce the total returns shown.
D Total returns would have been lower had certain expenses not been reduced during the periods shown.
E Calculated based on average shares outstanding during the period.
F Fees and expenses of the underlying Fidelity Central Funds are not included in the Fund's expense ratio. The Fund indirectly bears its proportionate share of the expenses of any underlying Fidelity Central Funds.
G Amount does not include the portfolio activity of any underlying Fidelity Central Funds.
H Investment income per share reflects a special dividend which amounted to $.02 per share.
I For the period June 17, 2003 (commencement of operations) to December 31, 2003.
J Expense ratios reflect operating expenses of the class. Expenses before reductions do not reflect amounts reimbursed by the investment adviser or reductions from brokerage service arrangements or other expense offset arrangements and do not represent the amount paid by the class during periods when reimbursements or reductions occur. Expense ratios before reductions for start-up periods may not be representative of longer-term operating periods. Expenses net of fee waivers reflect expenses after reimbursement by the investment adviser but prior to reductions from brokerage service arrangements or other expense offset arrangements. Expenses net of all reductions represent the net expenses paid by the class.
K Total distributions of $.22 per share is comprised of distributions from net investment income of $.066 and distributions from net realized gain of $.155 per share.
L Total distributions of $.49 per share is comprised of distributions from net investment income of $.129 and distributions from net realized gain of $.365 per share.
Financial Highlights - Service Class
Years ended December 31, | 2007 | 2006 | 2005 | 2004 | 2003 I |
Selected Per-Share Data | | | | | |
Net asset value, beginning of period | $ 14.80 | $ 13.28 | $ 12.26 | $ 11.19 | $ 10.00 |
Income from Investment Operations | | | | | |
Net investment income (loss) E | .18 | .14 | .10 | .09 H | .04 |
Net realized and unrealized gain (loss) | .48 | 1.86 | 1.13 | 1.59 | 1.20 |
Total from investment operations | .66 | 2.00 | 1.23 | 1.68 | 1.24 |
Distributions from net investment income | (.20) | (.12) | (.05) | (.08) | (.04) |
Distributions from net realized gain | (1.40) | (.37) | (.16) | (.53) | (.01) |
Total distributions | (1.60) | (.48) L | (.21) K | (.61) | (.05) |
Net asset value, end of period | $ 13.86 | $ 14.80 | $ 13.28 | $ 12.26 | $ 11.19 |
Total Return B, C, D | 4.43% | 15.11% | 10.10% | 15.08% | 12.41% |
Ratios to Average Net Assets F, J | | | | | |
Expenses before reductions | .89% | .93% | 1.42% | 2.17% | 3.73% A |
Expenses net of fee waivers, if any | .89% | .93% | .97% | 1.10% | 1.16% A |
Expenses net of all reductions | .89% | .93% | .93% | 1.06% | 1.14% A |
Net investment income (loss) | 1.18% | 1.00% | .78% | .78% | .68% A |
Supplemental Data | | | | | |
Net assets, end of period (000 omitted) | $ 2,577 | $ 2,458 | $ 2,137 | $ 1,941 | $ 1,687 |
Portfolio turnover rate G | 98% | 94% | 75% | 121% | 119% A |
A Annualized
B Total returns for periods of less than one year are not annualized.
C Total returns do not reflect charges attributable to your insurance company's separate account. Inclusion of these charges would reduce the total returns shown.
D Total returns would have been lower had certain expenses not been reduced during the periods shown.
E Calculated based on average shares outstanding during the period.
F Fees and expenses of the underlying Fidelity Central Funds are not included in the Fund's expense ratio. The Fund indirectly bears its proportionate share of the expenses of any underlying Fidelity Central Funds.
G Amount does not include the portfolio activity of any underlying Fidelity Central Funds.
H Investment income per share reflects a special dividend which amounted to $.02 per share.
I For the period June 17, 2003 (commencement of operations) to December 31, 2003.
J Expense ratios reflect operating expenses of the class. Expenses before reductions do not reflect amounts reimbursed by the investment adviser or reductions from brokerage service arrangements or other expense offset arrangements and do not represent the amount paid by the class during periods when reimbursements or reductions occur. Expense ratios before reductions for start-up periods may not be representative of longer-term operating periods. Expenses net of fee waivers reflect expenses after reimbursement by the investment adviser but prior to reductions from brokerage service arrangements or other expense offset arrangements. Expenses net of all reductions represent the net expenses paid by the class.
K Total distributions of $.21 per share is comprised of distributions from net investment income of $.054 and distributions from net realized gain of $.155 per share.
L Total distributions of $.48 per share is comprised of distributions from net investment income of $.116 and distributions from net realized gain of $.365 per share.
See accompanying notes which are an integral part of the financial statements.
Annual Report
Financial Highlights - Service Class 2
Years ended December 31, | 2007 | 2006 | 2005 | 2004 | 2003 I |
Selected Per-Share Data | | | | | |
Net asset value, beginning of period | $ 14.75 | $ 13.25 | $ 12.23 | $ 11.18 | $ 10.00 |
Income from Investment Operations | | | | | |
Net investment income (loss) E | .15 | .12 | .08 | .07 H | .03 |
Net realized and unrealized gain (loss) | .48 | 1.84 | 1.13 | 1.59 | 1.20 |
Total from investment operations | .63 | 1.96 | 1.21 | 1.66 | 1.23 |
Distributions from net investment income | (.18) | (.10) | (.04) | (.08) | (.04) |
Distributions from net realized gain | (1.40) | (.37) | (.16) | (.53) | (.01) |
Total distributions | (1.58) | (.46) L | (.19) K | (.61) | (.05) |
Net asset value, end of period | $ 13.80 | $ 14.75 | $ 13.25 | $ 12.23 | $ 11.18 |
Total Return B, C, D | 4.22% | 14.86% | 9.98% | 14.91% | 12.31% |
Ratios to Average Net Assets F, J | | | | | |
Expenses before reductions | 1.07% | 1.14% | 1.60% | 2.32% | 3.88% A |
Expenses net of fee waivers, if any | 1.07% | 1.10% | 1.12% | 1.25% | 1.32% A |
Expenses net of all reductions | 1.06% | 1.09% | 1.08% | 1.21% | 1.29% A |
Net investment income (loss) | 1.01% | .83% | .63% | .63% | .52% A |
Supplemental Data | | | | | |
Net assets, end of period (000 omitted) | $ 5,724 | $ 4,467 | $ 2,957 | $ 2,581 | $ 2,247 |
Portfolio turnover rate G | 98% | 94% | 75% | 121% | 119% A |
A Annualized
B Total returns for periods of less than one year are not annualized.
C Total returns do not reflect charges attributable to your insurance company's separate account. Inclusion of these charges would reduce the total returns shown.
D Total returns would have been lower had certain expenses not been reduced during the periods shown.
E Calculated based on average shares outstanding during the period.
F Fees and expenses of the underlying Fidelity Central Funds are not included in the Fund's expense ratio. The Fund indirectly bears its proportionate share of the expenses of any underlying Fidelity Central Funds.
G Amount does not include the portfolio activity of any underlying Fidelity Central Funds.
H Investment income per share reflects a special dividend which amounted to $.02 per share.
I For the period June 17, 2003 (commencement of operations) to December 31, 2003.
J Expense ratios reflect operating expenses of the class. Expenses before reductions do not reflect amounts reimbursed by the investment adviser or reductions from brokerage service arrangements or other expense offset arrangements and do not represent the amount paid by the class during periods when reimbursements or reductions occur. Expense ratios before reductions for start-up periods may not be representative of longer-term operating periods. Expenses net of fee waivers reflect expenses after reimbursement by the investment adviser but prior to reductions from brokerage service arrangements or other expense offset arrangements. Expenses net of all reductions represent the net expenses paid by the class.
K Total distributions of $.19 per share is comprised of distributions from net investment income of $.036 and distributions from net realized gain of $.155 per share.
L Total distributions of $.46 per share is comprised of distributions from net investment income of $.099 and distributions from net realized gain of $.365 per share.
Financial Highlights - Investor Class
Years ended December 31, | 2007 | 2006 | 2005 H |
Selected Per-Share Data | | | |
Net asset value, beginning of period | $ 14.81 | $ 13.30 | $ 12.72 |
Income from Investment Operations | | | |
Net investment income (loss) E | .18 | .14 | .05 |
Net realized and unrealized gain (loss) | .48 | 1.86 | .61 |
Total from investment operations | .66 | 2.00 | .66 |
Distributions from net investment income | (.20) | (.12) | (.05) |
Distributions from net realized gain | (1.40) | (.37) | (.03) |
Total distributions | (1.60) | (.49) K | (.08) J |
Net asset value, end of period | $ 13.87 | $ 14.81 | $ 13.30 |
Total Return B, C, D | 4.41% | 15.06% | 5.20% |
Ratios to Average Net Assets F, I | | | |
Expenses before reductions | .91% | .97% | 1.15% A |
Expenses net of fee waivers, if any | .91% | .97% | 1.00% A |
Expenses net of all reductions | .91% | .96% | .96% A |
Net investment income (loss) | 1.16% | .96% | .87% A |
Supplemental Data | | | |
Net assets, end of period (000 omitted) | $ 39,614 | $ 28,274 | $ 4,279 |
Portfolio turnover rate G | 98% | 94% | 75% |
A Annualized
B Total returns for periods of less than one year are not annualized.
C Total returns do not reflect charges attributable to your insurance company's separate account. Inclusion of these charges would reduce the total returns shown.
D Total returns would have been lower had certain expenses not been reduced during the periods shown.
E Calculated based on average shares outstanding during the period.
F Fees and expenses of the underlying Fidelity Central Funds are not included in the Fund's expense ratio. The Fund indirectly bears its proportionate share of the expenses of any underlying Fidelity Central Funds.
G Amount does not include the portfolio activity of any underlying Fidelity Central Funds.
H For the period July 21, 2005 (commencement of sale of shares) to December 31, 2005.
I Expense ratios reflect operating expenses of the class. Expenses before reductions do not reflect amounts reimbursed by the investment adviser or reductions from brokerage service arrangements or other expense offset arrangements and do not represent the amount paid by the class during periods when reimbursements or reductions occur. Expense ratios before reductions for start-up periods may not be representative of longer-term operating periods. Expenses net of fee waivers reflect expenses after reimbursement by the investment adviser but prior to reductions from brokerage service arrangements or other expense offset arrangements. Expenses net of all reductions represent the net expenses paid by the class.
J Total distributions of $.08 per share is comprised of distributions from net investment income of $.053 and distributions from net realized gain of $.030 per share.
K Total distributions of $.49 per share is comprised of distributions from net investment income of $.123 and distributions from net realized gain of $.365 per share.
See accompanying notes which are an integral part of the financial statements.
Annual Report
Notes to Financial Statements
For the period ended December 31, 2007
1. Organization.
VIP Value Leaders Portfolio (the Fund) is a fund of Variable Insurance Products Fund IV(the trust) and is authorized to issue an unlimited number of shares. The trust is registered under the Investment Company Act of 1940, as amended (the 1940 Act), as an open-end management investment company organized as a Massachusetts business trust. Shares of the Fund may only be purchased by insurance companies for the purpose of funding variable annuity or variable life insurance contracts. The Fund offers the following classes of shares: Initial Class shares, Service Class shares, Service Class 2 shares, and Investor Class shares. All classes have equal rights and voting privileges, except for matters affecting a single class. Investment income, realized and unrealized capital gains and losses, the common expenses of the Fund, and certain fund-level expense reductions, if any, are allocated on a pro rata basis to each class based on the relative net assets of each class to the total net assets of the Fund. Each class differs with respect to transfer agent and distribution and service plan fees incurred. Certain expense reductions also differ by class.
2. Investments in Fidelity Central Funds.
The Fund may invest in Fidelity Central Funds, which are open-end investment companies available only to other investment companies and accounts managed by Fidelity Management & Research Company (FMR) and its affiliates. The Fund's Schedule of Investments lists each of the Fidelity Central Funds as an investment of the Fund, but does not include the underlying holdings of each Fidelity Central Fund. As an Investing Fund, the Fund indirectly bears its proportionate share of the expenses of the underlying Fidelity Central Funds.
The Money Market Central Funds seek preservation of capital and current income and are managed by Fidelity Investments Money Management, Inc. (FIMM), an affiliate of FMR.
A complete list of holdings for each Fidelity Central Fund is available upon request or at the SEC's web site at www.sec.gov. In addition, the financial statements of the Fidelity Central Funds, which are not covered by the Fund's Report of Independent Registered Public Accounting Firm, are available on the SEC's web site or upon request.
3. Significant Accounting Policies.
The financial statements have been prepared in conformity with accounting principles generally accepted in the United States of America, which require management to make certain estimates and assumptions at the date of the financial statements. The following summarizes the significant accounting policies of the Fund:
Security Valuation. Investments are valued and net asset value (NAV) per share is calculated (NAV calculation) as of the close of business of the New York Stock Exchange (NYSE), normally 4:00 p.m. Eastern time. Wherever possible, the Fund uses independent pricing services approved by the Board of Trustees to value its investments.
Equity securities, including restricted securities, for which market quotations are readily available, are valued at the last reported sale price or official closing price as reported by an independent pricing service on the primary market or exchange on which they are traded. In the event there were no sales during the day or closing prices are not available, securities are valued at the last quoted bid price. Investments in open-end mutual funds, including the Fidelity Central Funds, are valued at their closing net asset value each business day. Short-term securities with remaining maturities of sixty days or less for which quotations are not readily available are valued at amortized cost, which approximates value.
When current market prices or quotations are not readily available or do not accurately reflect fair value, valuations may be determined in accordance with procedures adopted by the Board of Trustees. For example, when developments occur between the close of a market and the close of the NYSE that may materially affect the value of some or all of the securities, or when trading in a security is halted, those securities may be fair valued. Factors used in the determination of fair value may include monitoring news to identify significant market or security specific events such as changes in the value of U.S. securities markets, reviewing developments in foreign markets and evaluating the performance of ADRs, futures contracts and exchange-traded funds. Because the Fund's utilization of fair value pricing depends on market activity, the frequency with which fair value pricing is used cannot be predicted and may be utilized to a significant extent. The value of securities used for NAV calculation under fair value pricing may differ from published prices for the same securities.
Foreign Currency. The Fund uses foreign currency contracts to facilitate transactions in foreign-denominated securities. Losses from these transactions may arise from changes in the value of the foreign currency or if the counterparties do not perform under the contracts' terms.
Foreign-denominated assets, including investment securities, and liabilities are translated into U.S. dollars at the exchange rate at period end. Purchases and sales of investment securities, income and dividends received and expenses denominated in foreign currencies are translated into U.S. dollars at the exchange rate in effect on the transaction date.
Annual Report
Notes to Financial Statements - continued
3. Significant Accounting Policies - continued
Foreign Currency - continued
The effects of exchange rate fluctuations on investments are included with the net realized and unrealized gain (loss) on investment securities. Other foreign currency transactions resulting in realized and unrealized gain (loss) are disclosed separately.
Investment Transactions and Income. For financial reporting purposes, the Fund's investment holdings and NAV include trades executed through the end of the last business day of the period. The NAV for processing shareholder transactions includes trades executed through the end of the prior business day. Gains and losses on securities sold are determined on the basis of identified cost and may include proceeds received from litigation. Dividend income is recorded on the ex-dividend date, except for certain dividends from foreign securities where the ex-dividend date may have passed, which are recorded as soon as the Fund is informed of the ex-dividend date. Non-cash dividends included in dividend income, if any, are recorded at the fair market value of the securities received. Distributions received on securities that represent a return of capital or capital gain are recorded as a reduction of cost of investments and/or as a realized gain. The Fund estimates the components of distributions received that may be considered return of capital distributions or capital gain distributions.
Interest income and distributions from the Fidelity Central Funds are accrued as earned. Interest income includes coupon interest and amortization of premium and accretion of discount on debt securities. Investment income is recorded net of foreign taxes withheld where recovery of such taxes is uncertain.
Expenses. Most expenses of the trust can be directly attributed to a fund. Expenses which cannot be directly attributed are apportioned among each Fund in the trust. Expense estimates are accrued in the period to which they relate and adjustments are made when actual amounts are known.
Income Tax Information and Distributions to Shareholders. Each year, the Fund intends to qualify as a regulated investment company by distributing substantially all of its taxable income and realized gains under Subchapter M of the Internal Revenue Code and filing its U.S. federal tax return. As a result, no provision for income taxes is required. The Fund adopted the provisions of FASB Interpretation No. 48, Accounting for Uncertainties in Income Taxes (FIN 48), on June 29, 2007. FIN 48 sets forth a minimum threshold for financial statement recognition of the benefit of a tax position taken or expected to be taken in a tax return. The implementation of FIN 48 did not result in any unrecognized tax benefits in the accompanying financial statements. Each of the Fund's federal tax returns for the prior three fiscal years remains subject to examination by the Internal Revenue Service. Foreign taxes are provided for based on the Fund's understanding of the tax rules and rates that exist in the foreign markets in which it invests.
Distributions are recorded on the ex-dividend date. Income dividends and capital gain distributions are declared separately for each class. Income and capital gain distributions are determined in accordance with income tax regulations, which may differ from generally accepted accounting principles.
Capital accounts within the financial statements are adjusted for permanent book-tax differences. These adjustments have no impact on net assets or the results of operations. Temporary book-tax differences will reverse in a subsequent period.
Book-tax differences are primarily due to foreign currency transactions, certain foreign taxes, partnerships, passive foreign investment companies (PFIC) and losses deferred due to wash sales and excise tax regulations.
The tax-basis components of distributable earnings and the federal tax cost as of period end were as follows:
Unrealized appreciation | $ 12,184,930 | |
Unrealized depreciation | 7,600,933 | |
Net unrealized appreciation (depreciation) | 4,583,997 | |
Undistributed ordinary income | 77,534 | |
| | |
Cost for federal income tax purposes | $ 76,000,312 | |
The tax character of distributions paid was as follows:
| December 31, 2007 | December 31, 2006 |
Ordinary Income | $ 4,137,604 | $ 943,513 |
Long-term Capital Gains | 4,149,823 | 1,509,150 |
Total | $ 8,287,427 | $ 2,452,663 |
New Accounting Pronouncement. In September 2006, Statement of Financial Accounting Standards No. 157, Fair Value Measurements (SFAS 157), was issued and is effective for fiscal years beginning after November 15, 2007. SFAS 157 defines fair value, establishes a framework for measuring fair value and expands disclosures about fair value measurements. Management is currently evaluating the impact the adoption of SFAS 157 will have on the Fund's financial statement disclosures.
Annual Report
4. Operating Policies.
Repurchase Agreements. FMR has received an Exemptive Order from the Securities and Exchange Commission (the SEC) which permits the Fund and other affiliated entities of FMR to transfer uninvested cash balances into joint trading accounts which are then invested in repurchase agreements. The Fund may also invest directly with institutions in repurchase agreements. Repurchase agreements are collateralized by government or non-government securities. Upon settlement date, collateral is held in segregated accounts with custodian banks and may be obtained in the event of a default of the counterparty. The Fund monitors, on a daily basis, the value of the collateral to ensure it is at least equal to the principal amount of the repurchase agreement (including accrued interest). In the event of a default by the counterparty, realization of the collateral proceeds could be delayed, during which time the value of the collateral may decline.
Restricted Securities. The Fund may invest in securities that are subject to legal or contractual restrictions on resale. These securities generally may be resold in transactions exempt from registration or to the public if the securities are registered. Disposal of these securities may involve time-consuming negotiations and expense, and prompt sale at an acceptable price may be difficult. Information regarding restricted securities is included at the end of the Fund's Schedule of Investments.
5. Purchases and Sales of Investments.
Purchases and sales of securities, other than short-term securities, aggregated $82,321,421 and $84,204,858, respectively.
6. Fees and Other Transactions with Affiliates.
Management Fee. FMR and its affiliates provide the Fund with investment management related services for which the Fund pays a monthly management fee. The management fee is the sum of an individual fund fee rate that is based on an annual rate of .30% of the Fund's average net assets and a group fee rate that averaged .26% during the period. The group fee rate is based upon the average net assets of all the mutual funds advised by FMR. The group fee rate decreases as assets under management increase and increases as assets under management decrease. For the period, the total annual management fee rate was .56% of the Fund's average net assets.
Distribution and Service Plan. In accordance with Rule 12b-1 of the 1940 Act, the Fund has adopted separate 12b-1 Plans for each Service Class of shares. Each Service Class pays Fidelity Distributors Corporation (FDC), an affiliate of FMR, a service fee. For the period, the service fee is based on an annual rate of .10% of Service Class' average net assets and .25% of Service Class 2's average net assets.
For the period, each class paid FDC the following amounts, all of which were re-allowed to insurance companies for the distribution of shares and providing shareholder support services:
Service Class | $ 2,602 | |
Service Class 2 | 13,212 | |
| $ 15,814 | |
Transfer Agent Fees. Fidelity Investments Institutional Operations Company, Inc. (FIIOC), an affiliate of FMR, is the Fund's transfer, dividend disbursing, and shareholder servicing agent. FIIOC receives an asset-based fee with respect to each class. Each class with the exception of Investor Class pays a transfer agent fee, excluding out of pocket expenses, equal to an annual rate of .07% of average net assets. Investor Class pays a monthly asset-based transfer agent fee of .18% of average net assets. The total transfer agent fees paid by each class to FIIOC, including out of pocket expenses, were as follows:
Initial Class | $ 28,032 | |
Service Class | 1,732 | |
Service Class 2 | 4,750 | |
Investor Class | 72,008 | |
| $ 106,522 | |
Effective February 1, 2008, the Board of Trustees approved a decrease to Investor Class' asset-based fee from .18% to .15% of average net assets.
Accounting and Security Lending Fees. Fidelity Service Company, Inc. (FSC), an affiliate of FMR, maintains the Fund's accounting records. The accounting fee is based on the level of average net assets for the month. Under a separate contract, FSC administers the security lending program. The security lending fee is based on the number and duration of lending transactions.
Brokerage Commissions. The Fund placed a portion of its portfolio transactions with brokerage firms which are affiliates of the investment adviser. The commissions paid to these affiliated firms were $2,078 for the period.
Annual Report
Notes to Financial Statements - continued
7. Committed Line of Credit.
The Fund participates with other funds managed by FMR in a $4.2 billion credit facility (the "line of credit") to be utilized for temporary or emergency purposes to fund shareholder redemptions or for other short-term liquidity purposes. The Fund has agreed to pay commitment fees on its pro rata portion of the line of credit, which amounted to $172 and is reflected in Miscellaneous Expense on the Statement of Operations. During the period, there were no borrowings on this line of credit.
8. Security Lending.
The Fund lends portfolio securities from time to time in order to earn additional income. On the settlement date of the loan, the Fund receives collateral (in the form of U.S. Treasury obligations, letters of credit and/or cash) against the loaned securities and maintains collateral in an amount not less than 100% of the market value of the loaned securities during the period of the loan. The market value of the loaned securities is determined at the close of business of the Fund and any additional required collateral is delivered to the Fund on the next business day. If the borrower defaults on its obligation to return the securities loaned because of insolvency or other reasons, a fund could experience delays and costs in recovering the securities loaned or in gaining access to the collateral. Any cash collateral received is invested in the Fidelity Securities Lending Cash Central Fund. The value of loaned securities and cash collateral at period end are disclosed on the Fund's Statement of Assets and Liabilities. Security lending income represents the income earned on investing cash collateral, less fees and expenses associated with the loan, plus any premium payments that may be received on the loan of certain types of securities. Security lending income is presented in the Statement of Operations as a component of income from Fidelity Central Funds. Net income from lending portfolio securities during the period amounted to $8,142.
9. Expense Reductions.
Many of the brokers with whom FMR places trades on behalf of the Fund provided services to the Fund in addition to trade execution. These services included payments of certain expenses on behalf of the Fund totaling $1,728 for the period.
10. Other.
The Fund's organizational documents provide former and current trustees and officers with a limited indemnification against liabilities arising in connection with the performance of their duties to the Fund. In the normal course of business, the Fund may also enter into contracts that provide general indemnifications. The Fund's maximum exposure under these arrangements is unknown as this would be dependent on future claims that may be made against the Fund. The risk of material loss from such claims is considered remote.
At the end of the period, FMR or its affiliates were the owners of record of 97% of the total outstanding shares of the Fund.
The United States Securities and Exchange Commission ("SEC") is conducting an investigation of FMR (covering the years 2002 to 2004) arising from gifts, gratuities and business entertainment provided by certain brokers to certain individuals who were employed on FMR's domestic equity trading desk during that period. FMR is in discussions with the SEC staff regarding the possible resolution of the matter, but as of period-end no final resolution has been reached.
In December 2006, the Independent Trustees completed their own investigation of the matter with the assistance of independent counsel. The Independent Trustees and FMR agree that, despite the absence of proof that the Fidelity mutual funds experienced diminished execution quality as a result of the improper receipt of gifts and business entertainment, the conduct at issue was serious and is worthy of redress. Accordingly, the Independent Trustees have requested and FMR has agreed to pay $42 million to Fidelity mutual funds, plus interest to be determined at the time that payment is made. A method of allocating this payment among the funds has not yet been determined. The total payment to the Fund is not anticipated to have a material impact on the Fund's net assets. In addition, FMR reimbursed related legal expenses which are recorded in the accompanying Statement of Operations as an expense reduction.
Annual Report
11. Distributions to Shareholders.
Distributions to shareholders of each class were as follows:
Years ended December 31, | 2007 | 2006 |
From net investment income | | |
Initial Class | $ 414,412 | $ 362,794 |
Service Class | 33,342 | 18,695 |
Service Class 2 | 66,023 | 29,094 |
Investor Class | 508,873 | 221,984 |
Total | $ 1,022,650 | $ 632,567 |
From net realized gain | | |
Initial Class | $ 2,949,447 | $ 1,031,629 |
Service Class | 236,266 | 58,819 |
Service Class 2 | 513,410 | 105,568 |
Investor Class | 3,565,654 | 624,080 |
Total | $ 7,264,777 | $ 1,820,096 |
12. Share Transactions.
Transactions for each class of shares were as follows:
| Shares | Dollars |
Years ended December 31, | 2007 | 2006 | 2007 | 2006 |
Initial Class | | | | |
Shares sold | 386,276 | 995,302 | $ 5,999,493 | $ 14,048,028 |
Reinvestment of distributions | 238,214 | 94,957 | 3,363,859 | 1,394,423 |
Shares redeemed | (1,325,141) | (1,023,701) | (20,301,341) | (14,501,975) |
Net increase (decrease) | (700,651) | 66,558 | $ (10,937,989) | $ 940,476 |
Service Class | | | | |
Shares sold | 642 | - | $ 10,000 | $ - |
Reinvestment of distributions | 19,187 | 5,288 | 269,608 | 77,514 |
Net increase (decrease) | 19,829 | 5,288 | $ 279,608 | $ 77,514 |
Service Class 2 | | | | |
Shares sold | 109,446 | 80,992 | $ 1,673,062 | $ 1,131,528 |
Reinvestment of distributions | 41,439 | 9,211 | 579,433 | 134,662 |
Shares redeemed | (39,041) | (10,524) | (613,049) | (147,206) |
Net increase (decrease) | 111,844 | 79,679 | $ 1,639,446 | $ 1,118,984 |
Investor Class | | | | |
Shares sold | 1,493,436 | 1,712,304 | $ 22,999,503 | $ 24,221,597 |
Reinvestment of distributions | 290,097 | 57,496 | 4,074,527 | 846,064 |
Shares redeemed | (836,226) | (181,703) | (12,826,795) | (2,573,880) |
Net increase (decrease) | 947,307 | 1,588,097 | $ 14,247,235 | $ 22,493,781 |
Annual Report
Report of Independent Registered Public Accounting Firm
To the Trustees of Variable Insurance Products Fund IV and the Shareholders of VIP Value Leaders Portfolio:
In our opinion, the accompanying statement of assets and liabilities, including the schedule of investments, and the related statements of operations and of changes in net assets and the financial highlights present fairly, in all material respects, the financial position of VIP Value Leaders Portfolio (a fund of Variable Insurance Products Fund IV) at December 31, 2007, the results of its operations for the year then ended, the changes in its net assets for each of the two years in the period then ended and the financial highlights for each of the periods indicated, in conformity with accounting principles generally accepted in the United States of America. These financial statements and financial highlights (hereafter referred to as "financial statements") are the responsibility of the VIP Value Leaders Portfolio's management. Our responsibility is to express an opinion on these financial statements based on our audits. We conducted our audits of these financial statements in accordance with the standards of the Public Company Accounting Oversight Board (United States). Those standards require that we plan and perform the audit to obtain reasonable assurance about whether the financial statements are free of material misstatement. An audit includes examining, on a test basis, evidence supporting the amounts and disclosures in the financial statements, assessing the accounting principles used and significant estimates made by management, and evaluating the overall financial statement presentation. We believe that our audits, which included confirmation of securities at December 31, 2007 by correspondence with the custodian and brokers, provide a reasonable basis for our opinion.
/s/ PricewaterhouseCoopers LLP
PricewaterhouseCoopers LLP
Boston, Massachusetts
February 20, 2008
Annual Report
Trustees and Officers
The Trustees, Members of the Advisory Board, and executive officers of the trust and fund, as applicable, are listed below. The Board of Trustees governs the fund and is responsible for protecting the interests of shareholders. The Trustees are experienced executives who meet periodically throughout the year to oversee the fund's activities, review contractual arrangements with companies that provide services to the fund, and review the fund's performance. Except for James C. Curvey, each of the Trustees oversees 373 funds advised by FMR or an affiliate. Mr. Curvey oversees 368 funds advised by FMR or an affiliate.
The Trustees hold office without limit in time except that (a) any Trustee may resign; (b) any Trustee may be removed by written instrument, signed by at least two-thirds of the number of Trustees prior to such removal; (c) any Trustee who requests to be retired or who has become incapacitated by illness or injury may be retired by written instrument signed by a majority of the other Trustees; and (d) any Trustee may be removed at any special meeting of shareholders by a two-thirds vote of the outstanding voting securities of the trust. Each Trustee who is not an interested person (as defined in the 1940 Act) (Independent Trustee), shall retire not later than the last day of the calendar year in which his or her 72nd birthday occurs. The Independent Trustees may waive this mandatory retirement age policy with respect to individual Trustees. The executive officers and Advisory Board Members hold office without limit in time, except that any officer and Advisory Board Members may resign or may be removed by a vote of a majority of the Trustees at any regular meeting or any special meeting of the Trustees. Except as indicated, each individual has held the office shown or other offices in the same company for the past five years.
The fund's Statement of Additional Information (SAI) includes more information about the Trustees. To request a free copy, call Fidelity at 1-877-208-0098.
Interested Trustees*:
Correspondence intended for each Trustee who is an interested person may be sent to Fidelity Investments, 82 Devonshire Street, Boston, Massachusetts 02109.
Name, Age; Principal Occupation |
Edward C. Johnson 3d (77) |
| Year of Election or Appointment: 1983 Mr. Johnson is Chairman of the Board of Trustees. Mr. Johnson serves as President (2006-present), Chief Executive Officer, Chairman, and a Director of FMR LLC; Chairman and a Director of FMR; Chairman and a Director of Fidelity Research & Analysis Company (FRAC); Chairman and a Director of Fidelity Investments Money Management, Inc.; and Chairman (2001-present) and a Director of FMR Co., Inc. In addition, Mr. Johnson serves as Chairman and Director of Fidelity International Limited (FIL). Mr. Edward C. Johnson 3d and Mr. Arthur E. Johnson are not related. |
James C. Curvey (72) |
| Year of Election or Appointment: 2007 Mr. Curvey also serves as Trustee (2007-present) or Member of the Advisory Board (2007-present) of other investment companies advised by FMR. Mr. Curvey is a Director of FMR and FMR Co., Inc. (2007-present). Mr. Curvey is also Vice Chairman (2006-present) and Director of FMR LLC. Mr. Curvey joined Fidelity in 1982 and served in numerous senior management positions, including President and Chief Operating Officer of FMR LLC (1997-2000) and President of Fidelity Strategic Investments (2000-2002). In addition, he serves as a member of the Board of Directors of Geerlings & Wade, Inc. (wine distribution). |
* Trustees have been determined to be "Interested Trustees" by virtue of, among other things, their affiliation with the trust or various entities under common control with FMR. FMR Corp. merged with and into FMR LLC on October 1, 2007. Any references to FMR LLC for prior periods are deemed to be references to the prior entity.
Independent Trustees:
Correspondence intended for each Independent Trustee (that is, the Trustees other than the Interested Trustees) may be sent to Fidelity Investments, P.O. Box 55235, Boston, Massachusetts 02205-5235.
Name, Age; Principal Occupation |
Dennis J. Dirks (59) |
| Year of Election or Appointment: 2005 Prior to his retirement in May 2003, Mr. Dirks was Chief Operating Officer and a member of the Board of The Depository Trust & Clearing Corporation (DTCC) (1999-2003). He also served as President, Chief Operating Officer, and Board member of The Depository Trust Company (DTC) (1999-2003) and President and Board member of the National Securities Clearing Corporation (NSCC) (1999-2003). In addition, Mr. Dirks served as Chief Executive Officer and Board member of the Government Securities Clearing Corporation (2001-2003) and Chief Executive Officer and Board member of the Mortgage-Backed Securities Clearing Corporation (2001-2003). Mr. Dirks also serves as a Trustee and a member of the Finance Committee of Manhattan College (2005-present) and a Trustee and a member of the Finance Committee of AHRC of Nassau County (2006-present). |
Albert R. Gamper, Jr. (65) |
| Year of Election or Appointment: 2006 Prior to his retirement in December 2004, Mr. Gamper served as Chairman of the Board of CIT Group Inc. (commercial finance). During his tenure with CIT Group Inc. Mr. Gamper served in numerous senior management positions, including Chairman (1987-1989; 1999-2001; 2002-2004), Chief Executive Officer (1987-2004), and President (1989-2002). He currently serves as a member of the Board of Directors of Public Service Enterprise Group (utilities, 2001-present), Chairman of the Board of Governors, Rutgers University (2004-present), and Chairman of the Board of Saint Barnabas Health Care System. |
George H. Heilmeier (71) |
| Year of Election or Appointment: 2004 Dr. Heilmeier is Chairman Emeritus of Telcordia Technologies (communication software and systems), where prior to his retirement, he served as company Chairman and Chief Executive Officer. He currently serves on the Boards of Directors of The Mitre Corporation (systems engineering and information technology support for the government), and HRL Laboratories (private research and development, 2004-present). He is Chairman of the General Motors Science & Technology Advisory Board and a Life Fellow of the Institute of Electrical and Electronics Engineers (IEEE). Dr. Heilmeier is a member of the Defense Science Board and the National Security Agency Advisory Board. He is also a member of the National Academy of Engineering, the American Academy of Arts and Sciences, and the Board of Overseers of the School of Engineering and Applied Science of the University of Pennsylvania. Previously, Dr. Heilmeier served as a Director of TRW Inc. (automotive, space, defense, and information technology, 1992-2002), Compaq (1994-2002), Automatic Data Processing, Inc. (ADP) (technology-based business outsourcing, 1995-2002), INET Technologies Inc. (telecommunications network surveillance, 2001-2004), and Teletech Holdings (customer management services). He is the recipient of the 2005 Kyoto Prize in Advanced Technology for his invention of the liquid crystal display, and a member of the Consumer Electronics Hall of Fame. |
James H. Keyes (67) |
| Year of Election or Appointment: 2007 Prior to his retirement in 2003, Mr. Keyes was Chairman, President, and Chief Executive Officer of Johnson Controls, Inc. (automotive supplier, 1993-2003). He currently serves as a member of the boards of LSI Logic Corporation (semiconductor technologies), Navistar International Corporation (manufacture and sale of trucks, buses, and diesel engines, 2002-present), and Pitney Bowes, Inc. (integrated mail, messaging, and document management solutions). |
Marie L. Knowles (61) |
| Year of Election or Appointment: 2001 Prior to Ms. Knowles' retirement in June 2000, she served as Executive Vice President and Chief Financial Officer of Atlantic Richfield Company (ARCO) (diversified energy, 1996-2000). From 1993 to 1996, she was a Senior Vice President of ARCO and President of ARCO Transportation Company. She served as a Director of ARCO from 1996 to 1998. She currently serves as a Director of Phelps Dodge Corporation (copper mining and manufacturing) and McKesson Corporation (healthcare service, 2002-present). Ms. Knowles is a Trustee of the Brookings Institution and the Catalina Island Conservancy and also serves as a member of the Advisory Board for the School of Engineering of the University of Southern California. |
Ned C. Lautenbach (63) |
| Year of Election or Appointment: 2000 Mr. Lautenbach is Chairman of the Independent Trustees (2006-present). Mr. Lautenbach has been a partner of Clayton, Dubilier & Rice, Inc. (private equity investment firm) since September 1998. Previously, Mr. Lautenbach was with the International Business Machines Corporation (IBM) from 1968 until his retirement in 1998. Mr. Lautenbach serves as a Director of Sony Corporation (2006-present) and Eaton Corporation (diversified industrial) as well as the Philharmonic Center for the Arts in Naples, Florida. He also is a member of the Board of Trustees of Fairfield University (2005-present), as well as a member of the Council on Foreign Relations. |
Cornelia M. Small (63) |
| Year of Election or Appointment: 2005 Ms. Small is a member (2000-present) and Chairperson (2002-present) of the Investment Committee, and a member (2002-
present) of the Board of Trustees of Smith College. Previously, she served as Chief Investment Officer (1999-2000), Director of Global Equity Investments (1996-1999), and a member of the Board of Directors of Scudder, Stevens & Clark (1990-1997) and Scudder Kemper Investments (1997-1999). In addition, Ms. Small served as Co-Chair (2000-2003) of the Annual Fund for the Fletcher School of Law and Diplomacy. |
William S. Stavropoulos (68) |
| Year of Election or Appointment: 2001 Mr. Stavropoulos is Chairman Emeritus of the Board of Directors of The Dow Chemical Company. Since joining The Dow Chemical Company in 1967, Mr. Stavropoulos served in numerous senior management positions, including President (1993-2000; 2002-2003), CEO (1995-2000; 2002-2004), and Chairman of the Executive Committee (2000-2004). Currently, he is a Director of NCR Corporation (data warehousing and technology solutions), Chemical Financial Corporation, Maersk Inc. (industrial conglomerate, 2002-present), Tyco International, Inc. (multinational manufacturing and services, 2007-present), and a member of the Advisory Board for Metalmark Capital (private equity investment firm, 2005-present). He is a special advisor to Clayton, Dubilier & Rice, Inc., a private equity investment firm. He also serves as a member of the Board of Trustees of the American Enterprise Institute for Public Policy Research. In addition, Mr. Stavropoulos is a member of The Business Council, J.P. Morgan International Council and the University of Notre Dame Advisory Council for the College of Science. |
Kenneth L. Wolfe (68) |
| Year of Election or Appointment: 2005 Mr. Wolfe is Chairman and a Director of Hershey Foods Corporation (2007-present), where prior to his retirement in 2001, he was Chairman and Chief Executive Officer. Mr. Wolfe currently serves as a member of the board of Revlon Inc. (2004-present). Previously, Mr. Wolfe served as a member of the boards of Adelphia Communications Corporation (2003-2006) and Bausch & Lomb, Inc. (1993-2007). |
Advisory Board Members and Executive Officers**:
Correspondence intended for Mr. Mauriello, Mr. Thomas, Mr. Wiley, Mr. Lacy, and Mr. Arthur Johnson may be sent to Fidelity Investments, P.O. Box 55235, Boston, Massachusetts 02205-5235. Correspondence intended for each executive officer and Mr. Lynch may be sent to Fidelity Investments, 82 Devonshire Street, Boston, Massachusetts 02109.
Name, Age; Principal Occupation |
Arthur E. Johnson (60) |
| Year of Election or Appointment: 2008 Member of the Advisory Board of Variable Insurance Products Fund IV. Mr. Johnson serves as Senior Vice President of Corporate Strategic Development of Lockheed Martin Corporation (defense contractor). In addition, Mr. Johnson serves as a member of the Board of Directors of AGL Resources, Inc. (holding company, 2002-present), and IKON Office Solutions, Inc. (document management systems and services). Mr. Arthur E. Johnson and Mr. Edward C. Johnson 3d are not related. |
Alan J. Lacy (54) |
| Year of Election or Appointment: 2008 Member of the Advisory Board of Variable Insurance Products Fund IV. Mr. Lacy serves as Senior Adviser (2007-present) of Oak Hill Capital Partners, L.P. (a private equity firm). Mr. Lacy also served as Vice Chairman and Chief Executive Officer of Sears Holdings Corporation and Sears, Roebuck and Co. (retail, 2005-2006; 2000-2005). In addition, Mr. Lacy serves as a member of the Board of Directors of The Western Union Company (global money transfer, 2006-present) and Bristol-Myers Squibb (global pharmaceuticals, 2007-present). Mr. Lacy is a Trustee of the National Parks Conservation Association and The Field Museum of Natural History. |
Joseph Mauriello (63) |
| Year of Election or Appointment: 2007 Member of the Advisory Board of Variable Insurance Products Fund IV. Prior to his retirement in January 2006, Mr. Mauriello served in numerous senior management positions including Deputy Chairman and Chief Operating Officer (2004-2005), and Vice Chairman of Financial Services (2002-2004) of KPMG LLP US (professional services firm, 1965-2005). Mr. Mauriello currently serves as a member of the Board of Directors of XL Capital Ltd. (global insurance and re-insurance company, 2006-present) and of Arcadia Resources Inc. (health care services and products, 2007-present). He also served as a Director of the Hamilton Funds of the Bank of New York (2006-2007). |
David M. Thomas (58) |
| Year of Election or Appointment: 2007 Member of the Advisory Board of Variable Insurance Products Fund IV. Previously, Mr. Thomas served as Executive Chairman (2005-2006) and Chairman and Chief Executive Officer (2000-2005) of IMS Health, Inc. (pharmaceutical and healthcare information solutions). In addition, Mr. Thomas serves as a member of the Board of Directors of Fortune Brands, Inc. (consumer products holding company), and Interpublic Group of Companies, Inc. (marketing communication, 2004-present). |
Michael E. Wiley (57) |
| Year of Election or Appointment: 2007 Member of the Advisory Board of Variable Insurance Products Fund IV. Mr. Wiley also serves as a member of the Board of Trustees of the University of Tulsa (2000-2006; 2007-present). He serves as a Director of Tesoro Corporation (independent oil refiner and marketer, 2005-present), and a Director of Bill Barrett Corporation (exploration and production company, 2005-present). In addition, he also serves as a Director of Post Oak Bank (privately-held bank, 2004-present). Previously, Mr. Wiley served as a Sr. Energy Advisor of Katzenbach Partners, LLC (consulting firm, 2006-2007), as an Advisory Director of Riverstone Holdings (private investment firm), Chairman, President, and CEO of Baker Hughes, Inc. (oilfield services company, 2000-2004), and as Director of Spinnaker Exploration Company (exploration and production company, 2001-2005). |
Peter S. Lynch (63) |
| Year of Election or Appointment: 2003 Member of the Advisory Board of Variable Insurance Products Fund IV. Mr. Lynch is Vice Chairman and a Director of FMR, and Vice Chairman (2001-present) and a Director of FMR Co., Inc. Previously, Mr. Lynch served as a Trustee of the Fidelity funds (1990-2003). In addition, he serves as a Trustee of Boston College and as the Chairman of the Inner-City Scholarship Fund. |
Kimberley H. Monasterio (44) |
| Year of Election or Appointment: 2007 President and Treasurer of VIP Value Leaders. Ms. Monasterio also serves as President and Treasurer of other Fidelity funds (2007-present) and is an employee of FMR (2004-present). Previously, Ms. Monasterio served as Deputy Treasurer of the Fidelity funds (2004-2006). Before joining Fidelity Investments, Ms. Monasterio served as Treasurer (2000-2004) and Chief Financial Officer (2002-2004) of the Franklin Templeton Funds and Senior Vice President of Franklin Templeton Services, LLC (2000-2004). |
Walter C. Donovan (45) |
| Year of Election or Appointment: 2007 Vice President of VIP Value Leaders. Mr. Donovan also serves as Vice President of Fidelity's Equity Funds (2007-present). Mr. Donovan also serves as Executive Vice President of FMR (2005-present) and FMR Co., Inc. (2005-present). Previously, Mr. Donovan served as Vice President of Fidelity's High Income Funds (2005-2007), Fixed-Income Funds (2005-2006), certain Asset Allocation Funds (2005-2006), certain Balanced Funds (2005-2006), and as Vice President and Director of Fidelity's International Equity Trading group (1998-2005). |
Bruce T. Herring (42) |
| Year of Election or Appointment: 2006 Vice President of VIP Value Leaders. Mr. Herring also serves as Vice President of certain Equity Funds (2006-present). Mr. Herring is Senior Vice President of FMR (2006-present) and Vice President of FMR Co., Inc. (2001-present). Previously, Mr. Herring served as a portfolio manager for Fidelity U.S. Equity Funds (2001-2005). |
Eric D. Roiter (59) |
| Year of Election or Appointment: 2003 Secretary of VIP Value Leaders. He also serves as Secretary of other Fidelity funds; Vice President, General Counsel, and Secretary of FMR Co., Inc. (2001-present) and FMR; Assistant Secretary of Fidelity Management & Research (U.K.) Inc. (2001-present), Fidelity Research & Analysis Company (2001-present), and Fidelity Investments Money Management, Inc. (2001-present). Mr. Roiter is an Adjunct Member, Faculty of Law, at Boston College Law School (2003-present). Previously, Mr. Roiter served as Vice President and Secretary of Fidelity Distributors Corporation (FDC) (1998-2005). |
John B. McGinty, Jr. (45) |
| Year of Election or Appointment: 2008 Assistant Secretary of VIP Value Leaders. Mr. McGinty also serves as Assistant Secretary of other Fidelity funds (2008-present), and is an employee of FMR LLC (2004-present). Mr. McGinty also serves as Senior Vice President, Secretary, and Chief Legal Officer of FDC (2007-present). Before joining Fidelity Investments, Mr. McGinty practiced law at Ropes & Gray, LLP. |
R. Stephen Ganis (41) |
| Year of Election or Appointment: 2006 Anti-Money Laundering (AML) officer of VIP Value Leaders. Mr. Ganis also serves as AML officer of other Fidelity funds (2006-present) and FMR LLC (2003-present). Before joining Fidelity Investments, Mr. Ganis practiced law at Goodwin Procter, LLP (2000-2002). |
Joseph B. Hollis (59) |
| Year of Election or Appointment: 2006 Chief Financial Officer of VIP Value Leaders. Mr. Hollis also serves as Chief Financial Officer of other Fidelity funds. Mr. Hollis is President of Fidelity Pricing and Cash Management Services (FPCMS) (2005-present). Mr. Hollis also serves as President and Director of Fidelity Service Company, Inc. (2006-present). Previously, Mr. Hollis served as Senior Vice President of Cash Management Services (1999-2002) and Investment Management Operations (2002-2005). |
Kenneth A. Rathgeber (60) |
| Year of Election or Appointment: 2004 Chief Compliance Officer of VIP Value Leaders. Mr. Rathgeber also serves as Chief Compliance Officer of other Fidelity funds (2004-present) and Executive Vice President of Risk Oversight for Fidelity Investments (2002-present). He is Chief Compliance Officer of FMR (2005-present), FMR Co., Inc. (2005-present), Fidelity Management & Research (U.K.) Inc. (2005-present), Fidelity Research & Analysis Company (2005-present), Fidelity Investments Money Management, Inc. (2005-present), and Strategic Advisers, Inc. (2005-present). Previously, Mr. Rathgeber served as Executive Vice President and Chief Operating Officer for Fidelity Investments Institutional Services Company, Inc. (1998-2002). |
Bryan A. Mehrmann (46) |
| Year of Election or Appointment: 2005 Deputy Treasurer of VIP Value Leaders. Mr. Mehrmann also serves as Deputy Treasurer of other Fidelity funds (2005-present) and is an employee of FMR. Previously, Mr. Mehrmann served as Vice President of Fidelity Investments Institutional Services Group (FIIS)/Fidelity Investments Institutional Operations Corporation, Inc. (FIIOC) Client Services (1998-2004). |
Kenneth B. Robins (38) |
| Year of Election or Appointment: 2005 Deputy Treasurer of VIP Value Leaders. Mr. Robins also serves as Deputy Treasurer of other Fidelity funds (2005-present) and is an employee of FMR (2004-present). Before joining Fidelity Investments, Mr. Robins worked at KPMG LLP, where he was a partner in KPMG's department of professional practice (2002-2004) and a Senior Manager (1999-2000). In addition, Mr. Robins served as Assistant Chief Accountant, United States Securities and Exchange Commission (2000-2002). |
Robert G. Byrnes (41) |
| Year of Election or Appointment: 2005 Assistant Treasurer of VIP Value Leaders. Mr. Byrnes also serves as Assistant Treasurer of other Fidelity funds (2005-present) and is an employee of FMR (2005-present). Previously, Mr. Byrnes served as Vice President of FPCMS (2003-2005). Before joining Fidelity Investments, Mr. Byrnes worked at Deutsche Asset Management where he served as Vice President of the Investment Operations Group (2000-2003). |
Peter L. Lydecker (53) |
| Year of Election or Appointment: 2004 Assistant Treasurer of VIP Value Leaders. Mr. Lydecker also serves as Assistant Treasurer of other Fidelity funds (2004) and is an employee of FMR. |
Paul M. Murphy (60) |
| Year of Election or Appointment: 2007 Assistant Treasurer of VIP Value Leaders. Mr. Murphy also serves as Assistant Treasurer of other Fidelity funds (2007-present) and is an employee of FMR (2007-present). Previously, Mr. Murphy served as Chief Financial Officer of the Fidelity Funds (2005-2006), Vice President and Associate General Counsel of FMR (2007), and Senior Vice President of Fidelity Pricing and Cash Management Services Group (FPCMS) (1994-2007). |
Gary W. Ryan (49) |
| Year of Election or Appointment: 2005 Assistant Treasurer of VIP Value Leaders. Mr. Ryan also serves as Assistant Treasurer of other Fidelity funds (2005-present) and is an employee of FMR (2005-present). Previously, Mr. Ryan served as Vice President of Fund Reporting in FPCMS (1999-2005). |
** FMR Corp. merged with and into FMR LLC on October 1, 2007. Any references to FMR LLC for prior periods are deemed to be references to the prior entity.
Annual Report
Distributions
The Board of Trustees of VIP Value Leaders Portfolio voted to pay to shareholders of record at the opening of business on record date, the following distributions per share derived from capital gains realized from sales of portfolio securities:
Fund | Pay Date | Record Date | Capital Gains |
Initial Class | 02/15/08 | 02/15/08 | $.02 |
Service Class | 02/15/08 | 02/15/08 | $.02 |
Service Class 2 | 02/15/08 | 02/15/08 | $.02 |
Investor Class | 02/15/08 | 02/15/08 | $.02 |
The fund hereby designates as a capital gain dividend with respect to the taxable year ended December 31, 2007, $3,497,091, or, if subsequently determined to be different, the net capital gain of such year.
Initial Class designates 18% and 39%; Service Class designates 18% and 40%; Service Class 2 designates 18% and 41%; and Investor Class designates 18% and 40%; of the dividends distributed in February and December, respectively during the fiscal year as qualifying for the dividends-received deduction for corporate shareholders.
The fund will notify shareholders in January 2008 of amounts for use in preparing 2007 income tax returns.
Annual Report
Board Approval of Investment Advisory Contracts and Management Fees
VIP Value Leaders Portfolio
Each year, typically in July, the Board of Trustees, including the Independent Trustees (together, the Board), votes on the renewal of the management contract and sub-advisory agreements (together, the Advisory Contracts) for the fund. The Board, assisted by the advice of fund counsel and Independent Trustees' counsel, requests and considers a broad range of information throughout the year.
The Board meets regularly each month except August and takes into account throughout the year matters bearing on Advisory Contracts. The Board, acting directly and through its separate committees, considers at each of its meetings factors that are relevant to the annual renewal of the fund's Advisory Contracts, including the services and support provided to the fund and its shareholders. At the time of the renewal, the Board had 12 standing committees, each composed of Independent Trustees with varying backgrounds, to which the Board has assigned specific subject matter responsibilities in order to enhance effective decision-making by the Board. Each committee has adopted a written charter outlining the structure and purposes of the committee. One such committee, the Equity Contract Committee, meets periodically as needed throughout the year to consider matters specifically related to the annual renewal of Advisory Contracts. The committee requests and receives information on, and makes recommendations to the Independent Trustees concerning, the approval and annual review of the Advisory Contracts.
At its July 2007 meeting, the Board of Trustees, including the Independent Trustees, unanimously determined to renew the Advisory Contracts for the fund. In reaching its determination, the Board considered all factors it believed relevant, including (i) the nature, extent, and quality of the services to be provided to the fund and its shareholders (including the investment performance of the fund); (ii) the competitiveness of the management fee and total expenses of the fund; (iii) the total costs of the services to be provided by and the profits to be realized by the investment adviser and its affiliates from the relationship with the fund; (iv) the extent to which economies of scale would be realized as the fund grows; and (v) whether fee levels reflect these economies of scale, if any, for the benefit of fund shareholders. The Board also approved amendments to the fund's agreements with foreign sub-advisers to clarify that each sub-adviser provides services as an independent contractor.
In determining whether to renew the Advisory Contracts for the fund, the Board ultimately reached a determination, with the assistance of fund counsel and Independent Trustees' counsel, that the renewal of the Advisory Contracts and the compensation to be received by Fidelity under the management contract is consistent with Fidelity's fiduciary duty under applicable law. In addition to evaluating the specific factors noted above, the Board, in reaching its determination, is aware that shareholders in the fund have a broad range of investment choices available to them, including a wide choice among mutual funds offered by competitors to Fidelity, and that the fund's shareholders, with the opportunity to review and weigh the disclosure provided by the fund in its prospectus and other public disclosures, have chosen to invest in this fund, managed by Fidelity.
Nature, Extent, and Quality of Services Provided. The Board considered staffing within the investment adviser, FMR, and the sub-advisers (together, the Investment Advisers), including the background of the fund's portfolio manager and the fund's investment objective and discipline. The Independent Trustees also had discussions with senior management of Fidelity's investment operations and investment groups. The Board considered the structure of the portfolio manager compensation program and whether this structure provides appropriate incentives.
Resources Dedicated to Investment Management and Support Services. The Board reviewed the size, education, and experience of the Investment Advisers' investment staff, their use of technology, and the Investment Advisers' approach to recruiting, training, and retaining portfolio managers and other research, advisory, and management personnel. The Board considered Fidelity's extensive global research capabilities that enable the Investment Advisers to aggregate data from various sources in an effort to produce positive investment results. The Board noted that Fidelity's analysts have access to a variety of technological tools that enable them to perform both fundamental and quantitative analysis and to specialize in various disciplines. The Board also considered that Fidelity's portfolio managers and analysts have access to daily portfolio attribution that allows for monitoring of a fund's portfolio, as well as an electronic communication system that provides immediate real-time access to research concerning issuers and credit enhancers.
Shareholder and Administrative Services. The Board considered (i) the nature, extent, quality, and cost of advisory, administrative, distribution, and shareholder services performed by the Investment Advisers and their affiliates under the Advisory Contracts and under separate agreements covering transfer agency, pricing and bookkeeping, and securities lending services for the fund; (ii) the nature and extent of the Investment Advisers' supervision of third party service providers, principally custodians and subcustodians; and (iii) the resources devoted to, and the record of compliance with, the fund's compliance policies and procedures. The Board reviewed the allocation of fund brokerage, including allocations to brokers affiliated with the Investment Advisers, the use of brokerage commissions to pay fund expenses, and the use of "soft" commission dollars to pay for research services. The Board also considered that Fidelity voluntarily pays for market data out of its own resources. The Board also considered the agreement reached between the Independent Trustees and Fidelity in December 2006 following an independent review of matters relating to receipt of travel, entertainment, gifts and gratuities in violation of Fidelity policies.
The Board noted that the growth of fund assets across the complex allows Fidelity to reinvest in the development of services designed to enhance the value or convenience of the Fidelity funds as investment vehicles. These services include 24-hour access to account information and market information through phone representatives and over the Internet, and investor education materials and asset allocation tools.
Annual Report
Board Approval of Investment Advisory Contracts and Management Fees - continued
Investment in a Large Fund Family. The Board considered the benefits to shareholders of investing in a Fidelity fund, including the benefits of investing in a fund that is part of a large family of funds offering a variety of investment disciplines and providing for a large variety of mutual fund investor services. The Board noted that, since the last Advisory Contract renewals in July 2006, Fidelity has taken a number of actions that benefited particular funds, including (i) dedicating additional resources to investment research and to restructure the investment research teams; (ii) contractually agreeing to reduce the management fee on Fidelity Advisor Floating Rate High Income Fund; (iii) contractually agreeing to reduce the management fees on Fidelity's California, Massachusetts, New Jersey, and New York AMT Tax-Free Money Market Funds, launching new Institutional Classes and Service Classes of these funds, and contractually agreeing to impose expense limitations on these funds; (iv) eliminating the exchange fee on the Fidelity Select Portfolios and reducing the pricing and bookkeeping fee rates for these funds; (v) reducing the maximum transfer agency fee rates on high income funds and certain equity funds; (vi) proposing amended management contracts that, if approved by shareholders, will add a performance adjustment component to the management fees paid by 18 Fidelity Advisor equity funds; (vii) contractually agreeing to reduce fees for Ultra-Short Central Fund and the money market Central Funds; (viii) waiving the Fidelity Advisor funds' contingent deferred sales charge on certain redemptions made through systematic withdrawal programs; and (ix) amending the management contracts for equity and fixed-income funds whose management contracts incorporate a "group fee" structure by adding four new fee "breakpoints" to the group fee rate schedules.
Investment Performance and Compliance. The Board considered whether the fund has operated within its investment objective, as well as its record of compliance with its investment restrictions. It also reviewed the fund's absolute investment performance for each class, as well as the fund's relative investment performance for each class measured against (i) a broad-based securities market index, and (ii) a peer group of mutual funds deemed appropriate by the Board over multiple periods. Because the fund had been in existence less than five calendar years, the following charts considered by the Board show, over the one- and three-year periods ended December 31, 2006, the cumulative total returns of Initial Class and Service Class 2 of the fund, the cumulative total returns of a broad-based securities market index ("benchmark"), and a range of cumulative total returns of a peer group of mutual funds identified by Morningstar, Inc. as having an investment style similar to that of the fund based on underlying portfolio holdings. The returns of Initial Class and Service Class 2 show the performance of the highest and lowest performing classes, respectively (based on three-year performance). The box within each chart shows the 25th percentile return (bottom of box) and the 75th percentile return (top of box) of the peer group. Returns shown above the box are in the first quartile and returns shown below the box are in the fourth quartile. The percentage beaten numbers noted below each chart correspond to the percentile box and represent the percentage of funds in the peer group whose performance was equal to or lower than that of the class indicated.
VIP Value Leaders Portfolio
The Board reviewed the fund's relative investment performance against its peer group and stated that the performance of Initial Class of the fund was in the fourth quartile for the one-year period and the second quartile for the three-year period. The Board also stated that the investment performance of the fund was lower than its benchmark for all the periods shown. The Board considered that the variations in performance among the fund's classes reflect the variations in class expenses, which result in lower performance for higher expense classes.
The Board considered that FMR has taken steps to refocus and strengthen equity research, equity portfolio management, and compliance.
Based on its review, and giving particular weight to the nature and quality of the resources dedicated by the Investment Advisers to maintain and improve relative performance, the Board concluded that the nature, extent, and quality of the services provided to the fund will benefit the fund's shareholders, particularly in light of the Board's view that the fund's shareholders benefit from investing in a fund that is part of a large family of funds offering a variety of investment disciplines and services.
Annual Report
Competitiveness of Management Fee and Total Fund Expenses. The Board considered the fund's management fee and total expenses compared to "mapped groups" of competitive funds and classes. Fidelity creates "mapped groups" by combining similar Lipper investment objective categories that have comparable management fee characteristics. Combining Lipper investment objective categories aids the Board's management fee and total expense comparisons by broadening the competitive group used for comparison and by reducing the number of universes to which various Fidelity funds are compared. The Board also considered supplemental information about how the fund's management fee and total expenses ranked relative to groups based on Lipper classifications, which take into account a fund's market capitalization and style.
The Board considered two proprietary management fee comparisons for the 12-month (or shorter) periods shown in the chart below. The group of Lipper funds used by the Board for management fee comparisons is referred to below as the "Total Mapped Group." The Total Mapped Group comparison focuses on a fund's standing relative to the total universe of comparable funds available to investors, in terms of gross management fees before expense reimbursements or caps. "TMG %" represents the percentage of funds in the Total Mapped Group that had management fees that were lower than the fund's. For example, a TMG % of 8% means that 92% of the funds in the Total Mapped Group had higher management fees than the fund. The "Asset-Size Peer Group" (ASPG) comparison focuses on a fund's standing relative to non-Fidelity funds similar in size to the fund within the Total Mapped Group. The ASPG represents at least 15% of the funds in the Total Mapped Group with comparable asset size and management fee characteristics, subject to a minimum of 50 funds (or all funds in the Total Mapped Group if fewer than 50). Additional information, such as the ASPG quartile in which the fund's management fee ranked, is also included in the chart and considered by the Board.
VIP Value Leaders Portfolio
The Board noted that the fund's management fee ranked below the median of its Total Mapped Group and below the median of its ASPG for 2006.
Based on its review, the Board concluded that the fund's management fee was fair and reasonable in light of the services that the fund receives and the other factors considered.
In its review of each class's total expenses, the Board considered the fund's management fee as well as other fund or class expenses, as applicable, such as transfer agent fees, pricing and bookkeeping fees, fund-paid 12b-1 fees, and custodial, legal, and audit fees. The Board also noted the effects of any waivers and reimbursements on fees and expenses. As part of its review, the Board also considered current and historical total expenses of each class of the fund compared to competitive fund median expenses. Each class of the fund is compared to those funds and classes in the Total Mapped Group (used by the Board for management fee comparisons) that have a similar sales load structure.
The Board noted that the total expenses of each of Initial Class and Service Class ranked below its competitive median for 2006, and the total expenses of each of Investor Class and Service Class 2 ranked above its competitive median for 2006. The Board considered that the total expenses of Investor Class were above the median primarily due to its higher transfer agent fee. The Board noted that the fund offers multiple classes, each of which has a different 12b-1 fee structure, and that the multiple structures are intended to offer a range of pricing options for the intermediary market. The Board also noted that the total expenses of the classes vary primarily by the level of their 12b-1 fees, although differences in transfer agent fees may also cause expenses to vary from class to class.
Annual Report
Board Approval of Investment Advisory Contracts and Management Fees - continued
In its review of total expenses, the Board also considered Fidelity fee structures and other information on clients that FMR and its affiliates service in other competitive markets, such as other mutual funds advised or subadvised by FMR or its affiliates, pension plan clients, and other institutional clients.
Based on its review, the Board concluded that the total expenses of each class of the fund were reasonable, although in some cases above the median of the universe presented for comparison, in light of the services that the fund and its shareholders receive and the other factors considered.
Costs of the Services and Profitability. The Board considered the revenues earned and the expenses incurred by Fidelity in conducting the business of developing, marketing, distributing, managing, administering and servicing the fund and its shareholders. The Board also considered the level of Fidelity's profits in respect of all the Fidelity funds.
On an annual basis, FMR presents to the Board Fidelity's profitability for the fund. Fidelity calculates the profitability for each fund, as well as aggregate profitability for groups of Fidelity funds and all Fidelity funds, using a series of detailed revenue and cost allocation methodologies which originate with the audited books and records of Fidelity. The Audit Committee of the Board reviews any significant changes from the prior year's methodologies.
PricewaterhouseCoopers LLP (PwC), independent registered public accounting firm and auditor to Fidelity and certain Fidelity funds, has been engaged annually by the Board as part of the Board's assessment of the results of Fidelity's profitability analysis. PwC's engagement includes the review and assessment of Fidelity's methodologies used in determining the revenues and expenses attributable to Fidelity's mutual fund business, and completion of agreed-upon procedures surrounding the mathematical accuracy of fund profitability and its conformity to allocation methodologies. After considering PwC's reports issued under the engagement and information provided by Fidelity, the Board believes that while other allocation methods may also be reasonable, Fidelity's profitability methodologies are reasonable in all material respects.
The Board has also reviewed Fidelity's non-fund businesses and any fall-out benefits related to the mutual fund business as well as cases where Fidelity's affiliates may benefit from or be related to the fund's business.
The Board considered the costs of the services provided by and the profits realized by Fidelity in connection with the operation of the fund and determined that the amount of profit is a fair entrepreneurial profit for the management of the fund.
Economies of Scale. The Board considered whether there have been economies of scale in respect of the management of the Fidelity funds, whether the Fidelity funds (including the fund) have appropriately benefited from any such economies of scale, and whether there is potential for realization of any further economies of scale. The Board considered the extent to which the fund will benefit from economies of scale through increased services to the fund, through waivers or reimbursements, or through fee or expense reductions.
The Board recognized that the fund's management contract incorporates a "group fee" structure, which provides for lower group fee rates as total fund assets under FMR's management increase, and for higher group fee rates as total fund assets under FMR's management decrease. FMR determines the group fee rates based on a tiered asset "breakpoint" schedule. In connection with the renewal of the fund's management contract, the Board approved amendments to the fund's management contract that added four new fee breakpoints to the group fee rate schedule for assets under FMR's management above $1,386 billion. The Board considered that the group fee rate declines under both the present and amended schedules, but that under the amended schedule, the group fee rate declines faster as assets under FMR's management exceed $1,386 billion. The Board considered that the group fee is designed to deliver the benefits of economies of scale to fund shareholders when total fund assets increase, even if assets of any particular fund are unchanged or have declined, because some portion of Fidelity's costs are attributable to services provided to all Fidelity funds, and all funds benefit if those costs can be allocated among more assets. The Board concluded that, given the group fee structure, fund shareholders will achieve a certain level of economies of scale as assets under FMR's management increase at the fund complex level, regardless of whether Fidelity achieves any such economies of scale.
The Board further concluded that any potential economies of scale are being shared between fund shareholders and Fidelity in an appropriate manner.
Additional Information Requested by the Board. In order to develop fully the factual basis for consideration of the Fidelity funds' Advisory Contracts, the Board requested and received additional information on several topics, including (i) fund performance trends and actions to be taken by FMR to improve certain funds' overall performance; (ii) Fidelity's portfolio manager compensation structure, including its effects on fund profitability and the extent to which portfolio manager compensation is linked to fund performance; (iii) Fidelity's fee structures; (iv) the funds' sub-advisory arrangements; and (v) accounts managed by Fidelity other than the Fidelity funds.
Based on its evaluation of all of the conclusions noted above, and after considering all material factors, the Board ultimately concluded that the advisory fee structures are fair and reasonable, and that the fund's Advisory Contracts should be renewed.
Annual Report
Annual Report
Investment Adviser
Fidelity Management & Research Company
Boston, MA
Investment Sub-Advisers
FMR Co., Inc.
Fidelity Management & Research (U.K.) Inc.
Fidelity Research & Analysis Company
Fidelity Investments Japan Limited
Fidelity International Investment Advisors
Fidelity International Investment Advisors (U.K.) Limited
General Distributor
Fidelity Distributors Corporation
Boston, MA
Transfer and Service Agents
Fidelity Investments Institutional Operations Company, Inc.
Boston, MA
Fidelity Service Company, Inc.
Boston, MA
Custodian
Brown Brothers Harriman & Co.
Boston, MA
VVL-ANN-0208
1.796594.104
Item 2. Code of Ethics
As of the end of the period, December 31, 2007, Variable Insurance Products Fund IV (the trust) has adopted a code of ethics, as defined in Item 2 of Form N-CSR, that applies to its President and Treasurer and its Chief Financial Officer. A copy of the code of ethics is filed as an exhibit to this Form N-CSR.
Item 3. Audit Committee Financial Expert
The Board of Trustees of the trust has determined that Marie L. Knowles is an audit committee financial expert, as defined in Item 3 of Form N-CSR. Ms. Knowles is independent for purposes of Item 3 of Form N-CSR.
Item 4. Principal Accountant Fees and Services
(a) Audit Fees.
For the fiscal years ended December 31, 2007 and December 31, 2006, the aggregate Audit Fees billed by PricewaterhouseCoopers LLP (PwC) for professional services rendered for the audits of the financial statements, or services that are normally provided in connection with statutory and regulatory filings or engagements for those fiscal years, for Consumer Discretionary Portfolio, Consumer Staples Portfolio, Energy Portfolio, Financial Services Portfolio, Growth Stock Portfolio, Health Care Portfolio, Industrials Portfolio, International Capital Appreciation Portfolio, Materials Portfolio, Real Estate Portfolio, Technology Portfolio, Telecommunications Portfolio, Utilities Portfolio, and Value Leaders Portfolio, (the funds) and for all funds in the Fidelity Group of Funds are shown in the table below.
Fund | 2007A | 2006A,B |
Consumer Discretionary Portfolio | $36,000 | $35,000 |
Consumer Staples Portfolio | $29,000 | $0 |
Energy Portfolio | $36,000 | $35,000 |
Financial Services Portfolio | $37,000 | $31,000 |
Growth Stock Portfolio | $45,000 | $43,000 |
Health Care Portfolio | $34,000 | $34,000 |
Industrials Portfolio | $36,000 | $36,000 |
International Capital Appreciation Portfolio | $43,000 | $46,000 |
Materials Portfolio | $29,000 | $0 |
Real Estate Portfolio | $45,000 | $43,000 |
Technology Portfolio | $35,000 | $31,000 |
Telecommunications Portfolio | $29,000 | $0 |
Utilities Portfolio | $35,000 | $34,000 |
Value Leaders Portfolio | $43,000 | $41,000 |
All funds in the Fidelity Group of Funds audited by PwC | $14,700,000 | $13,900,000 |
A | Aggregate amounts may reflect rounding. |
B | No Audit Fees were billed by PwC for professional services rendered for the audit of the annual financial statements, or services that are normally provided in connection with statutory and regulatory filings or engagements to Consumer Staples Portfolio, Materials Portfolio and Telecommunications Portfolio, as the funds did not commence operations until April 24, 2007. |
(b) Audit-Related Fees.
In each of the fiscal years ended December 31, 2007 and December 31, 2006, the aggregate Audit-Related Fees billed by PwC for services rendered for assurance and related services to each fund that are reasonably related to the performance of the audit or review of the fund's financial statements, but not reported as Audit Fees, are shown in the table below.
Fund | 2007A | 2006 A,B |
Consumer Discretionary Portfolio | $0 | $0 |
Consumer Staples Portfolio | $0 | $0 |
Energy Portfolio | $0 | $0 |
Financial Services Portfolio | $0 | $0 |
Growth Stock Portfolio | $0 | $0 |
Health Care Portfolio | $0 | $0 |
Industrials Portfolio | $0 | $0 |
International Capital Appreciation Portfolio | $0 | $0 |
Materials Portfolio | $0 | $0 |
Real Estate Portfolio | $0 | $0 |
Technology Portfolio | $0 | $0 |
Telecommunications Portfolio | $0 | $0 |
Utilities Portfolio | $0 | $0 |
Value Leaders Portfolio | $0 | $0 |
A | Aggregate amounts may reflect rounding. |
B | No Audit-Related Fees were billed by PwC for services rendered for assurance and related services to Consumer Staples Portfolio, Materials Portfolio, and Telecommunications Portfolio that are reasonably related to the performance of the audit or review of the funds' financial statements, but not reported as Audit Fees, as the funds did not commence operations until April 24, 2007. |
In each of the fiscal years ended December 31, 2007 and December 31, 2006, the aggregate Audit-Related Fees that were billed by PwC that were required to be approved by the Audit Committee for services rendered on behalf of Fidelity Management & Research Company (FMR) and entities controlling, controlled by, or under common control with FMR (not including any sub-adviser whose role is primarily portfolio management and is subcontracted with or overseen by another investment adviser) that provide ongoing services to the funds ("Fund Service Providers") for assurance and related services that relate directly to the operations and financial reporting of each fund that are reasonably related to the performance of the audit or review of the fund's financial statements, but not reported as Audit Fees, are shown in the table below.
Billed By | 2007 A | 2006A |
PwC | $0 | $0 |
A | Aggregate amounts may reflect rounding. |
Fees included in the audit-related category comprise assurance and related services (e.g., due diligence services) that are traditionally performed by the independent registered public accounting firm. These audit-related services include due diligence related to mergers and acquisitions, accounting consultations and audits in connection with acquisitions, internal control reviews, attest services that are not required by statute or regulation and consultation concerning financial accounting and reporting standards.
(c) Tax Fees.
In each of the fiscal years ended December 31, 2007 and December 31, 2006, the aggregate Tax Fees billed by PwC for professional services rendered for tax compliance, tax advice, and tax planning for each fund is shown in the table below.
Fund | 2007A | 2006A,B |
Consumer Discretionary Portfolio | $2,100 | $2,000 |
Consumer Staples Portfolio | $2,100 | $0 |
Energy Portfolio | $2,100 | $2,000 |
Financial Services Portfolio | $2,100 | $2,000 |
Growth Stock Portfolio | $2,900 | $2,700 |
Health Care Portfolio | $2,100 | $2,000 |
Industrials Portfolio | $2,100 | $2,000 |
International Capital Appreciation Portfolio | $2,900 | $2,500 |
Materials Portfolio | $2,100 | $0 |
Real Estate Portfolio | $2,900 | $2,700 |
Technology Portfolio | $2,100 | $2,000 |
Telecommunications Portfolio | $2,100 | $0 |
Utilities Portfolio | $2,100 | $2,000 |
Value Leaders Portfolio | $2,900 | $2,700 |
A | Aggregate amounts may reflect rounding. |
B | No Tax Fees were billed by PwC for services rendered for tax compliance, tax advice, and tax planning for Consumer Staples Portfolio, Materials Portfolio and Telecommunications Portfolio as the funds did not commence operations until April 24, 2007. |
In each of the fiscal years ended December 31, 2007 and December 31, 2006, the aggregate Tax Fees billed by PwC that were required to be approved by the Audit Committee for professional services rendered on behalf of the Fund Service Providers for tax compliance, tax advice, and tax planning that relate directly to the operations and financial reporting of each fund is shown in the table below.
Billed By | 2007A | 2006A |
PwC | $0 | $0 |
A | Aggregate amounts may reflect rounding. |
Fees included in the Tax Fees category comprise all services performed by professional staff in the independent registered public accounting firm's tax division except those services related to the audit. Typically, this category would include fees for tax compliance, tax planning, and tax advice. Tax compliance, tax advice, and tax planning services include preparation of original and amended tax returns, claims for refund and tax payment-planning services, assistance with tax audits and appeals, tax advice related to mergers and acquisitions and requests for rulings or technical advice from taxing authorities.
(d) All Other Fees.
In each of the fiscal years ended December 31, 2007 and December 31, 2006, the aggregate Other Fees billed by PwC for all other non-audit services rendered to the funds is shown in the table below.
Fund | 2007A | 2006A,B |
Consumer Discretionary Portfolio | $1,200 | $1,200 |
Consumer Staples Portfolio | $600 | $0 |
Energy Portfolio | $1,500 | $1,500 |
Financial Services Portfolio | $1,200 | $1,200 |
Growth Stock Portfolio | $1,200 | $1,200 |
Health Care Portfolio | $1,300 | $1,300 |
Industrials Portfolio | $1,200 | $1,200 |
International Capital Appreciation Portfolio | $1,200 | $1,200 |
Materials Portfolio | $600 | $0 |
Real Estate Portfolio | $1,400 | $1,300 |
Technology Portfolio | $1,300 | $1,200 |
Telecommunications Portfolio | $600 | $0 |
Utilities Portfolio | $1,300 | $1,200 |
Value Leaders Portfolio | $1,300 | $1,200 |
A | Aggregate amounts may reflect rounding. |
B | No Other Fees were billed by PwC for all other non-audit services rendered to Consumer Staples Portfolio, Materials Portfolio, and Telecommunications Portfolio, as the funds did not commence operations until April 24, 2007. |
In each of the fiscal years ended December 31, 2007 and December 31, 2006, the aggregate Other Fees billed by PwC that were required to be approved by the Audit Committee for all other non-audit services rendered on behalf of the Fund Service Providers that relate directly to the operations and financial reporting of each fund is shown in the table below.
Billed By | 2007A | 2006A |
PwC | $215,000 | $125,000 |
A | Aggregate amounts may reflect rounding. |
Fees included in the All Other Fees category include services related to internal control reviews, strategy and other consulting, financial information systems design and implementation, consulting on other information systems, and other tax services unrelated to the fund.
(e) (1) | Audit Committee Pre-Approval Policies and Procedures: |
The trust's Audit Committee must pre-approve all audit and non-audit services provided by the independent registered public accounting firm relating to the operations or financial reporting of the funds. Prior to the commencement of any audit or non-audit services to a fund, the Audit Committee reviews the services to determine whether they are appropriate and permissible under applicable law.
The trust's Audit Committee has adopted policies and procedures to, among other purposes, provide a framework for the Committee's consideration of non-audit services by the audit firms that audit the Fidelity funds. The policies and procedures require that any non-audit service provided by a fund audit firm to a Fidelity Fund and any non-audit service provided by a fund auditor to a Fund Service Provider that relates directly to the operations and financial reporting of a Fidelity fund (Covered Service) are subject to approval by the Audit Committee before such service is provided. Non-audit services provided by a fund audit firm for a Fund Service Provider that do not relate directly to the operations and financial reporting of a Fidelity fund (Non-Covered Service) but that are expected to exceed $50,000 are also subject to pre-approval by the Audit Committee.
All Covered Services, as well as Non-Covered Services that are expected to exceed $50,000, must be approved in advance of provision of the service either: (i) by formal resolution of the Audit Committee, or (ii) by oral or written approval of the service by the Chair of the Audit Committee (or if the Chair is unavailable, such other member of the Audit Committee as may be designated by the Chair to act in the Chair's absence). The approval contemplated by (ii) above is permitted where the Treasurer determines that action on such an engagement is necessary before the next meeting of the Audit Committee. Neither pre-approval nor advance notice of Non-Covered Service engagements for which fees are not expected to exceed $50,000 is required; such engagements are to be reported to the Audit Committee monthly.
(e) (2) | Services approved pursuant to paragraph (c)(7)(i)(C) of Rule 2-01 of Regulation S-X: |
Audit-Related Fees:
There were no amounts that were approved by the Audit Committee pursuant to the de minimis exception for the fiscal years ended December 31, 2007 and December 31, 2006 on behalf of each fund.
There were no amounts that were required to be approved by the Audit Committee pursuant to the de minimis exception for the fiscal years ended December 31, 2007 and December 31, 2006 on behalf of the Fund Service Providers that relate directly to the operations and financial reporting of each fund.
Tax Fees:
There were no amounts that were approved by the Audit Committee pursuant to the de minimis exception for the fiscal years ended December 31, 2007 and December 31, 2006 on behalf of each fund.
There were no amounts that were required to be approved by the Audit Committee pursuant to the de minimis exception for the fiscal years ended December 31, 2007 and December 31, 2006 on behalf of the Fund Service Providers that relate directly to the operations and financial reporting of each fund.
All Other Fees:
There were no amounts that were approved by the Audit Committee pursuant to the de minimis exception for the fiscal years ended December 31, 2007 and December 31, 2006 on behalf of each fund.
There were no amounts that were required to be approved by the Audit Committee pursuant to the de minimis exception for the fiscal years ended December 31, 2007 and December 31, 2006 on behalf of the Fund Service Providers that relate directly to the operations and financial reporting of each fund.
(f) Not applicable.
(g) For the fiscal years ended December 31, 2007 and December 31, 2006, the aggregate fees billed by PwC of $1,520,000A and $1,355,000A for non-audit services rendered on behalf of the funds, FMR (not including any sub-adviser whose role is primarily portfolio management and is subcontracted with or overseen by another investment adviser) and Fund Service Providers relating to Covered Services and Non-Covered Services are shown in the table below.
| 2007A | 2006A |
Covered Services | $265,000 | $165,000 |
Non-Covered Services | $1,255,000 | $1,190,000 |
A | Aggregate amounts may reflect rounding. |
(h) The trust's Audit Committee has considered Non-Covered Services that were not pre-approved that were provided by PwC to Fund Service Providers to be compatible with maintaining the independence of PwC in its audit of the funds, taking into account representations from PwC, in accordance with Independence Standards Board Standard No.1, regarding its independence from the funds and their related entities.
Item 5. Audit Committee of Listed Registrants
Not applicable.
Item 6. Schedule of Investments
Not applicable.
Item 7. Disclosure of Proxy Voting Policies and Procedures for Closed-End Management Investment Companies
Not applicable.
Item 8. Portfolio Managers of Closed-End Management Investment Companies
Not applicable.
Item 9. Purchase of Equity Securities by Closed-End Management Investment Company and Affiliated Purchasers
Not applicable.
Item 10. Submission of Matters to a Vote of Security Holders
There were no material changes to the procedures by which shareholders may recommend nominees to the trust's Board of Trustees.
Item 11. Controls and Procedures
(a)(i) The President and Treasurer and the Chief Financial Officer have concluded that the trust's disclosure controls and procedures (as defined in Rule 30a-3(c) under the Investment Company Act) provide reasonable assurances that material information relating to the trust is made known to them by the appropriate persons, based on their evaluation of these controls and procedures as of a date within 90 days of the filing date of this report.
(a)(ii) There was no change in the trust's internal control over financial reporting (as defined in Rule 30a-3(d) under the Investment Company Act) that occurred during the second fiscal quarter of the period covered by this report that has materially affected, or is reasonably likely to materially affect, the trust's internal control over financial reporting.
Item 12. Exhibits
(a) | (1) | Code of Ethics pursuant to Item 2 of Form N-CSR is filed and attached hereto as EX-99.CODE ETH. |
(a) | (2) | Certification pursuant to Rule 30a-2(a) under the Investment Company Act of 1940 (17 CFR 270.30a-2(a)) is filed and attached hereto as Exhibit 99.CERT. |
(a) | (3) | Not applicable. |
(b) | | Certification pursuant to Rule 30a-2(b) under the Investment Company Act of 1940 (17 CFR 270.30a-2(b)) is furnished and attached hereto as Exhibit 99.906CERT. |
SIGNATURES
Pursuant to the requirements of the Securities Exchange Act of 1934 and the Investment Company Act of 1940, the registrant has duly caused this report to be signed on its behalf by the undersigned, thereunto duly authorized.
Variable Insurance Products Fund IV
By: | /s/Kimberley Monasterio |
| Kimberley Monasterio |
| President and Treasurer |
| |
Date: | February 29, 2008 |
Pursuant to the requirements of the Securities Exchange Act of 1934 and the Investment Company Act of 1940, this report has been signed below by the following persons on behalf of the registrant and in the capacities and on the dates indicated.
By: | /s/Kimberley Monasterio |
| Kimberley Monasterio |
| President and Treasurer |
| |
Date: | February 29, 2008 |
By: | /s/Joseph B. Hollis |
| Joseph B. Hollis |
| Chief Financial Officer |
| |
Date: | February 29, 2008 |