To view a fund's proxy voting guidelines and proxy voting record for the 12-month period ended June 30, visit http://www.fidelity.com (search for "proxy voting guidelines") or visit the Securities and Exchange Commission's (SEC) web site at http://www.sec.gov. You may also call 1-877-208-0098 to request a free copy of the proxy voting guidelines.
Fidelity Variable Insurance Products are separate account options which are purchased through a variable insurance contract.
Standard & Poor's, S&P and S&P 500 are registered service marks of The McGraw-Hill Companies, Inc. and have been licensed for use by Fidelity Distributors Corporation.
Other third party marks appearing herein are the property of their respective owners.
All other marks appearing herein are registered or unregistered trademarks or service marks of FMR LLC or an affiliated company.
This report and the financial statements contained herein are submitted for the general information of the shareholders of the fund. This report is not authorized for distribution to prospective investors in the fund unless preceded or accompanied by an effective prospectus.
A fund files its complete schedule of portfolio holdings with the SEC for the first and third quarters of each fiscal year on Form N-Q. Forms N-Q are available on the SEC's web site at http://www.sec.gov. A fund's Forms N-Q may be reviewed and copied at the SEC's Public Reference Room in Washington, DC. Information regarding the operation of the SEC's Public Reference Room may be obtained by calling 1-800-SEC-0330. For a complete list of a fund's portfolio holdings, view the most recent holdings listings, semiannual report, or annual report on Fidelity's web site at http://www.fidelity.com or http://www.advisor.fidelity.com, as applicable.
NOT FDIC INSURED · MAY LOSE VALUE · NO BANK GUARANTEE
Neither the fund nor Fidelity Distributors Corporation is a bank.
Average annual total return reflects the change in the value of an investment, assuming reinvestment of the class' dividend income and capital gains (the profits earned upon the sale of securities that have grown in value, if any) and assuming a constant rate of performance each year. During periods of reimbursement by Fidelity, a fund's total return will be greater than it would be had the reimbursement not occurred. Performance numbers are net of all underlying fund operating expenses, but do not include any insurance charges imposed by your insurance company's separate account. If performance information included the effect of these additional charges, the total returns would have been lower. How a fund did yesterday is no guarantee of how it will do tomorrow.
Average Annual Total Returns
Periods ended December 31, 2008
Past 1 year
Past 5 years
Life of fundA
VIP Consumer Discretionary - Initial Class C
-34.10%
-5.15%
-3.25%
VIP Consumer Discretionary - Investor Class B, C
-34.10%
-5.20%
-3.28%
A From July 18, 2001.
BThe initial offering of Investor Class shares took place on July 21, 2005. Returns prior to July 21, 2005 are those of Initial Class. If Investor Class's transfer agent fee had been reflected, returns prior to July 21, 2005 would have been lower.
CPrior to October 1, 2006, VIP Consumer Discretionary operated under certain different investment policies. The historical performance for the fund may not represent its current investment policies.
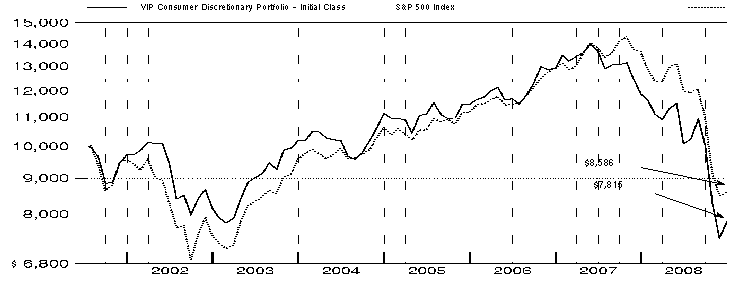
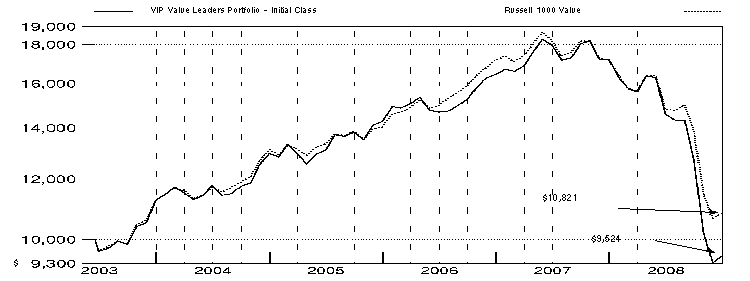
$10,000 Over Life of Fund
Let's say hypothetically that $10,000 was invested in VIP Consumer Discretionary Portfolio - Initial Class on July 18, 2001, when the fund started. The chart shows how the value of your investment would have changed, and also shows how the Standard & Poor's 500SM Index (S&P 500®) performed over the same period.
Comments from John Harris, Portfolio Manager of VIP Consumer Discretionary Portfolio
By year-end 2008, the vicious credit crisis sparked in the U.S. had spread like wildfire across the world's capital markets, stunting global growth, toppling commodity prices, changing the face of the global financial system and chasing risk-averse investors toward the sidelines. The U.S. equity markets, as measured by the Dow Jones Industrial AverageSM and Standard & Poor's 500SM Index, fell hard as a result, declining 31.93% and 37.00%, respectively, while the technology-laden NASDAQ Composite® Index slid 40.03%. Foreign market stocks saw an even sharper decline, as illustrated by the 43.28% loss of the MSCI® EAFE® Index (Europe, Australasia, Far East), a gauge of developed stock markets outside the U.S. and Canada. A generally stronger U.S. dollar also held back returns for U.S. investors in foreign equities. Emerging-markets stocks - the global performance leader only a year ago - fell harder still, dropping 53.18%, as measured by the MSCI Emerging Markets Index. The only clear winners during the past year were assets backed by the U.S. government, as investors fled from risk. Thus, the Barclays Capital U.S. Treasury Bond Index climbed 13.74% for the year, while the Barclays Capital U.S. Aggregate Bond Index - a broader measure of the U.S. investment-grade bond universe - gained a more modest 5.24%. By contrast, high-yield bonds bore the brunt of investors' increasing wariness over risk, as expressed by the Merrill Lynch® U.S. High Yield Master II Constrained Index's drop of 26.11%. The emerging-markets bond category also felt the shock of investors' risk-averse sentiment, with the JPMorgan Emerging Markets Bond Index (EMBI) Global falling 10.91%. Meanwhile, the Citigroup® Non-U.S. Group of 7 Index - representing the debt performance of major global economies, excluding the United States - eked out a 1.69% gain.
For the 12-month period ending December 31, 2008, the fund outpaced the -38.05% return of its sector benchmark, the MSCI® US Investable Market Consumer Discretionary Index, and the S&P 500®. (For specific portfolio results, please refer to the performance section of this report.) The fund outperformed the MSCI index by owning what I believed were quality firms whose earnings would hold up better in a downbeat environment. I looked for companies with strong franchises in their industries, solid balance sheets with minimal debt, and high cash flow generation. This was a stock picker's market, as evidenced by the fact that our performance was bolstered by stock selection across a wide variety of categories: cable and satellite, specialty stores, restaurants, broadcasting, automotive retail, home improvement retail, and auto parts and equipment. Relative results also benefited from an overweighting in home improvement retail and underweightings in several of the index's weaker areas, including auto parts and equipment, automobile manufacturers, publishing and broadcasting. Looking at individual stocks that helped results, home improvement retailer Lowe's was an example of a leading franchise in its category with a good balance sheet and strong cash flow, and its stock solidly outperformed the index. Enrollment increased at adult education firm Apollo Group, sending its shares up during a period when a majority of stocks declined. Avoiding three index components that fell sharply - General Motors; media firm CBS; and Garmin, a maker of GPS (global positioning system) devices - aided results as well. On the negative side, performance was held back by stock selection in homefurnishing retail and in casinos and gaming, and by an overweighting in the latter area. Our shares in Las Vegas Sands plummeted as the casino operator's business in Macao - a region of China that is one of the world's fastest-growing gaming markets - was hurt by the Chinese government's attempt to slow tourism growth in the region. International Game Technology, which sells and leases slot machines, was hurt by a general slowdown in the gaming industry. Underweighting Home Depot detracted because the home improvement retailer's stock declined less than the index. An out-of-index position in Google held back results as well.
The views expressed above reflect those of the portfolio manager(s) only through the end of the period as stated on the cover of this report and do not necessarily represent the views of Fidelity or any other person in the Fidelity organization. Any such views are subject to change at any time based upon market or other conditions and Fidelity disclaims any responsibility to update such views. These views may not be relied on as investment advice and, because investment decisions for a Fidelity fund are based on numerous factors, may not be relied on as an indication of trading intent on behalf of any Fidelity fund.
As a shareholder of the Fund, you incur two types of costs: (1) transaction costs, including redemption fees, and (2) ongoing costs, including management fees and other Fund expenses. This Example is intended to help you understand your ongoing costs (in dollars) of investing in the Fund and to compare these costs with the ongoing costs of investing in other mutual funds.
The Example is based on an investment of $1,000 invested at the beginning of the period and held for the entire period (July 1, 2008 to December 31, 2008).
Actual Expenses
The first line of the accompanying table for each class of the Fund provides information about actual account values and actual expenses. You may use the information in this line, together with the amount you invested, to estimate the expenses that you paid over the period. Simply divide your account value by $1,000.00 (for example, an $8,600 account value divided by $1,000.00 = 8.6), then multiply the result by the number in the first line for a class of the Fund under the heading entitled "Expenses Paid During Period" to estimate the expenses you paid on your account during this period. The estimate of expenses does not include any fees or other expenses of any variable annuity or variable life insurance product. If they were, the estimate of expenses you paid during the period would be higher, and your ending account value would be lower. In addition, the Fund, as a shareholder in the underlying Fidelity Central Funds, will indirectly bear its pro rata share of the fees and expenses incurred by the underlying Fidelity Central Funds. These fees and expenses are not included in the Fund's annualized expense ratio used to calculate the expense estimate in the table below.
Hypothetical Example for Comparison Purposes
The second line of the accompanying table for each class of the Fund provides information about hypothetical account values and hypothetical expenses based on a Class' actual expense ratio and an assumed rate of return of 5% per year before expenses, which is not the Class' actual return. The hypothetical account values and expenses may not be used to estimate the actual ending account balance or expenses you paid for the period. You may use this information to compare the ongoing costs of investing in the Fund and other funds. To do so, compare this 5% hypothetical example with the 5% hypothetical examples that appear in the shareholder reports of the other funds. The estimate of expenses does not include any fees or other expenses of any variable annuity or variable life insurance product. If they were, the estimate of expenses you paid during the period would be higher, and your ending account value would be lower. In addition, the Fund, as a shareholder in the underlying Fidelity Central Funds, will indirectly bear its pro rata share of the fees and expenses incurred by the underlying Fidelity Central Funds. These fees and expenses are not included in the Fund's annualized expense ratio used to calculate the expense estimate in the table below.
Please note that the expenses shown in the table are meant to highlight your ongoing costs only and do not reflect any transaction costs. Therefore, the second line of the table is useful in comparing ongoing costs only, and will not help you determine the relative total costs of owning different funds. In addition, if these transactional costs were included, your costs would have been higher.
Annualized Expense Ratio
Beginning Account Value July 1, 2008
Ending Account Value December 31, 2008
Expenses Paid During Period* July 1, 2008 to December 31, 2008
Initial Class
1.00%
Actual
$ 1,000.00
$ 775.00
$ 4.46
Hypothetical A
$ 1,000.00
$ 1,020.11
$ 5.08
Investor Class
1.08%
Actual
$ 1,000.00
$ 774.20
$ 4.82
Hypothetical A
$ 1,000.00
$ 1,019.71
$ 5.48
A 5% return per year before expenses
* Expenses are equal to each Class' annualized expense ratio, multiplied by the average account value over the period, multiplied by 184/366 (to reflect the one-half year period).
Annual Report
Investment Changes (Unaudited)
Top Ten Stocks as of December 31, 2008
% of fund's net assets
% of fund's net assets 6 months ago
McDonald's Corp.
8.5
6.1
Lowe's Companies, Inc.
6.8
4.0
Target Corp.
6.5
6.1
Comcast Corp. Class A
5.3
4.3
Time Warner, Inc.
5.1
6.2
The Walt Disney Co.
4.2
3.9
Staples, Inc.
3.4
3.2
Apollo Group, Inc. Class A (non-vtg.)
3.0
1.5
Home Depot, Inc.
2.9
3.9
The DIRECTV Group, Inc.
2.3
2.0
48.0
Top Industries (% of fund's net assets)
As of December 31, 2008
Media
26.3%
Specialty Retail
23.8%
Hotels, Restaurants & Leisure
18.2%
Multiline Retail
7.0%
Textiles, Apparel & Luxury Goods
6.8%
All Others*
17.9%
As of June 30, 2008
Media
29.8%
Specialty Retail
24.0%
Hotels, Restaurants & Leisure
15.2%
Multiline Retail
7.0%
Textiles, Apparel & Luxury Goods
6.2%
All Others*
17.8%
* Includes short-term investments and net other assets.
Prior period industry classifications reflect the categories in place as of the date indicated and have not been adjusted to reflect current industry classifications.
Annual Report
Investments December 31, 2008
Showing Percentage of Net Assets
Common Stocks - 98.9%
Shares
Value
AUTO COMPONENTS - 0.9%
Auto Parts & Equipment - 0.9%
American Axle & Manufacturing Holdings, Inc.
2,800
$ 8,092
Gentex Corp.
2,800
24,724
TRW Automotive Holdings Corp. (a)
2,500
9,000
41,816
AUTOMOBILES - 0.4%
Automobile Manufacturers - 0.4%
Ford Motor Co. (a)
7,908
18,109
DISTRIBUTORS - 0.8%
Distributors - 0.8%
Li & Fung Ltd.
20,000
34,563
DIVERSIFIED CONSUMER SERVICES - 4.4%
Education Services - 4.1%
Apollo Group, Inc. Class A (non-vtg.) (a)
1,800
137,916
Princeton Review, Inc. (a)
1,679
8,277
Strayer Education, Inc.
188
40,309
186,502
Specialized Consumer Services - 0.3%
Coinstar, Inc. (a)
700
13,657
TOTAL DIVERSIFIED CONSUMER SERVICES
200,159
FOOD & STAPLES RETAILING - 3.7%
Food Retail - 1.5%
Susser Holdings Corp. (a)
5,000
66,450
Hypermarkets & Super Centers - 2.2%
Costco Wholesale Corp.
1,900
99,750
TOTAL FOOD & STAPLES RETAILING
166,200
HOTELS, RESTAURANTS & LEISURE - 18.2%
Casinos & Gaming - 4.4%
Bally Technologies, Inc. (a)
1,500
36,045
International Game Technology
4,700
55,883
Las Vegas Sands Corp. (a)
2,600
15,418
Las Vegas Sands Corp. unit (a)
300
31,050
Penn National Gaming, Inc. (a)
1,900
40,622
WMS Industries, Inc. (a)
800
21,520
200,538
Hotels, Resorts & Cruise Lines - 0.8%
Carnival Corp. unit
1,400
34,048
Restaurants - 13.0%
Brinker International, Inc.
2,700
28,458
Burger King Holdings, Inc.
2,200
52,536
Darden Restaurants, Inc.
2,100
59,178
Jack in the Box, Inc. (a)
600
13,254
Shares
Value
McDonald's Corp.
6,200
$ 385,579
Sonic Corp. (a)
4,000
48,680
587,685
TOTAL HOTELS, RESTAURANTS & LEISURE
822,271
HOUSEHOLD DURABLES - 1.9%
Homebuilding - 1.4%
Centex Corp.
800
8,512
Lennar Corp. Class A
1,500
13,005
Pulte Homes, Inc.
3,700
40,441
61,958
Household Appliances - 0.5%
Whirlpool Corp.
600
24,810
TOTAL HOUSEHOLD DURABLES
86,768
INTERNET & CATALOG RETAIL - 2.1%
Internet Retail - 2.1%
Amazon.com, Inc. (a)
1,900
97,432
INTERNET SOFTWARE & SERVICES - 1.4%
Internet Software & Services - 1.4%
Dice Holdings, Inc. (a)
900
3,672
Google, Inc. Class A (sub. vtg.) (a)
194
59,684
63,356
LEISURE EQUIPMENT & PRODUCTS - 1.2%
Leisure Products - 1.2%
Hasbro, Inc.
1,810
52,798
MEDIA - 26.3%
Advertising - 2.6%
Interpublic Group of Companies, Inc. (a)
7,900
31,284
Lamar Advertising Co. Class A (a)
1,100
13,816
Omnicom Group, Inc.
2,600
69,992
115,092
Broadcasting - 1.3%
Grupo Televisa SA de CV (CPO) sponsored ADR
3,900
58,266
Cable & Satellite - 9.3%
Comcast Corp. Class A
14,100
238,008
Liberty Media Corp. - Entertainment Class A (a)
2,700
47,196
The DIRECTV Group, Inc. (a)
4,600
105,386
Time Warner Cable, Inc. (a)
1,000
21,450
Virgin Media, Inc.
2,000
9,980
422,020
Movies & Entertainment - 12.3%
Ascent Media Corp. (a)
300
6,552
News Corp.:
Class A
7,641
69,457
Class B
800
7,664
Regal Entertainment Group Class A
4,800
49,008
Common Stocks - continued
Shares
Value
MEDIA - CONTINUED
Movies & Entertainment - continued
The Walt Disney Co.
8,400
$ 190,596
Time Warner, Inc.
23,100
232,386
555,663
Publishing - 0.8%
McGraw-Hill Companies, Inc.
1,600
37,104
TOTAL MEDIA
1,188,145
MULTILINE RETAIL - 7.0%
Department Stores - 0.5%
Nordstrom, Inc.
1,800
23,958
General Merchandise Stores - 6.5%
Target Corp.
8,500
293,505
TOTAL MULTILINE RETAIL
317,463
SPECIALTY RETAIL - 23.8%
Apparel Retail - 3.4%
Abercrombie & Fitch Co. Class A
1,600
36,912
Citi Trends, Inc. (a)
2,300
33,856
Ross Stores, Inc.
1,700
50,541
Urban Outfitters, Inc. (a)
1,300
19,474
Zumiez, Inc. (a)
1,800
13,410
154,193
Automotive Retail - 2.7%
Advance Auto Parts, Inc.
2,600
87,490
AutoZone, Inc. (a)
243
33,891
121,381
Computer & Electronics Retail - 1.4%
Best Buy Co., Inc.
1,300
36,543
Gamestop Corp. Class A (a)
1,300
28,158
64,701
Home Improvement Retail - 11.0%
Home Depot, Inc.
5,784
133,148
Lowe's Companies, Inc.
14,200
305,584
Sherwin-Williams Co.
1,000
59,750
498,482
Homefurnishing Retail - 0.6%
Williams-Sonoma, Inc.
3,300
25,938
Shares
Value
Specialty Stores - 4.7%
PetSmart, Inc.
2,563
$ 47,287
Sally Beauty Holdings, Inc. (a)
2,700
15,363
Staples, Inc.
8,450
151,424
214,074
TOTAL SPECIALTY RETAIL
1,078,769
TEXTILES, APPAREL & LUXURY GOODS - 6.8%
Apparel, Accessories & Luxury Goods - 2.8%
Coach, Inc. (a)
1,800
37,386
G-III Apparel Group Ltd. (a)
2,005
12,812
Hanesbrands, Inc. (a)
2,200
28,050
Polo Ralph Lauren Corp. Class A
400
18,164
VF Corp.
600
32,862
129,274
Footwear - 4.0%
Iconix Brand Group, Inc. (a)
7,900
77,262
NIKE, Inc. Class B
2,000
102,000
179,262
TOTAL TEXTILES, APPAREL & LUXURY GOODS
308,536
TOTAL COMMON STOCKS
(Cost $6,506,469)
4,476,385
Money Market Funds - 1.8%
Fidelity Cash Central Fund, 1.06% (b) (Cost $80,622)
80,622
80,622
TOTAL INVESTMENT PORTFOLIO - 100.7%
(Cost $6,587,091)
4,557,007
NET OTHER ASSETS - (0.7)%
(32,459)
NET ASSETS - 100%
$ 4,524,548
Legend
(a) Non-income producing
(b) Affiliated fund that is available only to investment companies and other accounts managed by Fidelity Investments. The rate quoted is the annualized seven-day yield of the fund at period end. A complete unaudited listing of the fund's holdings as of its most recent quarter end is available upon request.
Affiliated Central Funds
Information regarding fiscal year to date income earned by the Fund from investments in Fidelity Central Funds is as follows:
Fund
Income earned
Fidelity Cash Central Fund
$ 2,420
Other Information
The following is a summary of the inputs used, as of December 31, 2008, involving the Fund's assets carried at value. The inputs or methodology used for valuing securities may not be an indication of the risk associated with investing in those securities. For more information on valuation inputs, and their aggregation into the levels used in the tables below, please refer to the Security Valuation section in the accompanying Notes to Financial Statements.
Valuation Inputs at Reporting Date:
Description
Total
Level 1
Level 2
Level 3
Investments in Securities
$ 4,557,007
$ 4,491,394
$ 34,563
$ 31,050
The following is a reconciliation of assets for which Level 3 inputs were used in determining value:
Investments in Securities
Beginning Balance
$ -
Total Realized Gain (Loss)
-
Total Unrealized Gain (Loss)
1,050
Cost of Purchases
30,000
Proceeds of Sales
-
Amortization/Accretion
-
Transfer in/out of Level 3
-
Ending Balance
$ 31,050
The information used in the above reconciliation represents fiscal year to date activity for any Investment Securities identified as using Level 3 inputs at either the beginning or the end of the current fiscal period. Transfers in or out of Level 3 represents either the beginning value (for transfers in), or the ending value (for transfers out) of any Security or Instrument where a change in the pricing level occurred from the beginning to the end of the period.
Income Tax Information
At December 31, 2008, the fund had a capital loss carryforward of approximately $966,651 all of which will expire on December 31, 2016.
The fund intends to elect to defer to its fiscal year ending December 31, 2009 approximately $382,884 of losses recognized during the period November 1, 2008 to December 31, 2008.
See accompanying notes which are an integral part of the financial statements.
Investment in securities, at value - See accompanying schedule:
Unaffiliated issuers (cost $6,506,469)
$ 4,476,385
Fidelity Central Funds (cost $80,622)
80,622
Total Investments (cost $6,587,091)
$ 4,557,007
Cash
8,771
Foreign currency held at value (cost $4)
3
Dividends receivable
4,951
Distributions receivable from Fidelity Central Funds
49
Prepaid expenses
69
Receivable from investment adviser for expense reductions
5,011
Other receivables
5
Total assets
4,575,866
Liabilities
Payable for fund shares redeemed
12,652
Accrued management fee
2,185
Other affiliated payables
492
Other payables and accrued expenses
35,989
Total liabilities
51,318
Net Assets
$ 4,524,548
Net Assets consist of:
Paid in capital
$ 8,146,552
Undistributed net investment income
671
Accumulated undistributed net realized gain (loss) on investments and foreign currency transactions
(1,592,590)
Net unrealized appreciation (depreciation) on investments and assets and liabilities in foreign currencies
(2,030,085)
Net Assets
$ 4,524,548
Statement of Assets and Liabilities - continued
December 31, 2008
Initial Class: Net Asset Value, offering price and redemption price per share ($3,212,007 ÷ 461,273 shares)
$ 6.96
Investor Class: Net Asset Value, offering price and redemption price per share ($1,312,541 ÷ 188,559 shares)
$ 6.96
See accompanying notes which are an integral part of the financial statements.
Annual Report
Statement of Operations
Year ended December 31, 2008
Investment Income
Dividends
$ 106,646
Interest
612
Income from Fidelity Central Funds
2,420
Total income
109,678
Expenses
Management fee
$ 41,455
Transfer agent fees
13,465
Accounting fees and expenses
2,884
Custodian fees and expenses
7,758
Independent trustees' compensation
36
Audit
40,783
Legal
48
Miscellaneous
44
Total expenses before reductions
106,473
Expense reductions
(30,626)
75,847
Net investment income (loss)
33,831
Realized and Unrealized Gain (Loss)
Net realized gain (loss) on:
Investment securities:
Unaffiliated issuers
(1,541,531)
Foreign currency transactions
(1)
Total net realized gain (loss)
(1,541,532)
Change in net unrealized appreciation (depreciation) on:
Investment securities
(1,650,906)
Assets and liabilities in foreign currencies
(6)
Total change in net unrealized appreciation (depreciation)
(1,650,912)
Net gain (loss)
(3,192,444)
Net increase (decrease) in net assets resulting from operations
$ (3,158,613)
Statement of Changes in Net Assets
Year ended December 31, 2008
Year ended December 31, 2007
Increase (Decrease) in Net Assets
Operations
Net investment income (loss)
$ 33,831
$ (15,182)
Net realized gain (loss)
(1,541,532)
1,258,081
Change in net unrealized appreciation (depreciation)
(1,650,912)
(1,860,301)
Net increase (decrease) in net assets resulting from operations
(3,158,613)
(617,402)
Distributions to shareholders from net investment income
(30,645)
(27,376)
Distributions to shareholders from net realized gain
(72,042)
(850,763)
Total distributions
(102,687)
(878,139)
Share transactions - net increase (decrease)
(1,561,450)
(7,299,873)
Redemption fees
5,640
15,858
Total increase (decrease) in net assets
(4,817,110)
(8,779,556)
Net Assets
Beginning of period
9,341,658
18,121,214
End of period (including undistributed net investment income of $671 and $0, respectively)
$ 4,524,548
$ 9,341,658
See accompanying notes which are an integral part of the financial statements.
Annual Report
Financial Highlights - Initial Class
Years ended December 31,
2008
2007
2006
2005
2004
Selected Per-Share Data
Net asset value, beginning of period
$ 10.72
$ 12.84
$ 11.45
$ 11.12
$ 10.17
Income from Investment Operations
Net investment income (loss)C
.04
(.01)
.11F
(.02)
(.04)
Net realized and unrealized gain (loss)
(3.68)
(1.02)
1.33
.35
.99
Total from investment operations
(3.64)
(1.03)
1.44
.33
.95
Distributions from net investment income
(.05)
(.02)
(.06)
-
-
Distributions from net realized gain
(.09)
(1.08)
-
-
-
Total distributions
(.13)I
(1.10)
(.06)
-
-
Redemption fees added to paid in capitalC
.01
.01
.01
-H
-H
Net asset value, end of period
$ 6.96
$ 10.72
$ 12.84
$ 11.45
$ 11.12
Total ReturnA,B
(34.10)%
(8.14)%
12.63%
2.97%
9.34%
Ratios to Average Net AssetsD,G
Expenses before reductions
1.40%
1.10%
1.20%
1.19%
1.35%
Expenses net of fee waivers, if any
1.00%
1.01%
1.15%
1.14%
1.35%
Expenses net of all reductions
1.00%
1.01%
1.14%
1.12%
1.31%
Net investment income (loss)
.48%
(.07)%
.90% F
(.19)%
(.42)%
Supplemental Data
Net assets, end of period (000 omitted)
$ 3,212
$ 6,989
$ 13,866
$ 9,616
$ 12,051
Portfolio turnover rateE
81%
114%
189%
74%
145%
A Total returns do not reflect charges attributable to your insurance company's separate account. Inclusion of these charges would reduce the total returns shown. BTotal returns would have been lower had certain expenses not been reduced during the periods shown. C Calculated based on average shares outstanding during the period. D Fees and expenses of the underlying Fidelity Central Funds are not included in the Fund's expense ratio. The Fund indirectly bears its proportionate share of the expenses of any underlying Fidelity Central Funds. E Amount does not include the portfolio activity of any underlying Fidelity Central Funds. F Investment income per share reflects special dividends which amounted to $.09 per share. Excluding these special dividends, the ratio of net investment income (loss) to average net assets would have been .13%. G Expense ratios reflect operating expenses of the class. Expenses before reductions do not reflect amounts reimbursed by the investment adviser or reductions from brokerage service arrangements or other expense offset arrangements and do not represent the amount paid by the class during periods when reimbursements or reductions occur. Expenses net of fee waivers reflect expenses after reimbursement by the investment adviser but prior to reductions from brokerage service arrangements or other expense offset arrangements. Expenses net of all reductions represent the net expenses paid by the class. H Amount represents less than $.01 per share. I Total distributions of $.131 per share is comprised of distributions from net investment income of $.046 and distributions from net realized gain of $.085 per share.
Financial Highlights - Investor Class
Years ended December 31,
2008
2007
2006
2005I
Selected Per-Share Data
Net asset value, beginning of period
$ 10.72
$ 12.83
$ 11.44
$ 11.49
Income from Investment Operations
Net investment income (loss)E
.04
(.03)
.10H
(.01)
Net realized and unrealized gain (loss)
(3.68)
(1.02)
1.33
(.04)
Total from investment operations
(3.64)
(1.05)
1.43
(.05)
Distributions from net investment income
(.05)
(.02)
(.05)
-
Distributions from net realized gain
(.09)
(1.05)
-
-
Total distributions
(.13)L
(1.07)
(.05)
-
Redemption fees added to paid in capitalE
.01
.01
.01
-K
Net asset value, end of period
$ 6.96
$ 10.72
$ 12.83
$ 11.44
Total ReturnB,C,D
(34.10)%
(8.29)%
12.62%
(.44)%
Ratios to Average Net AssetsF,J
Expenses before reductions
1.54%
1.24%
1.41%
1.61%A
Expenses net of fee waivers, if any
1.09%
1.15%
1.25%
1.25%A
Expenses net of all reductions
1.09%
1.15%
1.24%
1.23%A
Net investment income (loss)
.39%
(.21)%
.80%H
(.20)%A
Supplemental Data
Net assets, end of period (000 omitted)
$ 1,313
$ 2,352
$ 4,256
$ 339
Portfolio turnover rateG
81%
114%
189%
74%
A Annualized BTotal returns for periods of less than one year are not annualized. C Total returns do not reflect charges attributable to your insurance company's separate account. Inclusion of these charges would reduce the total returns shown. D Total returns would have been lower had certain expenses not been reduced during the periods shown. E Calculated based on average shares outstanding during the period. F Fees and expenses of the underlying Fidelity Central Funds are not included in the Fund's expense ratio. The Fund indirectly bears its proportionate share of the expenses of any underlying Fidelity Central Funds. G Amount does not include the portfolio activity of any underlying Fidelity Central Funds. H Investment income per share reflects special dividends which amounted to $.09 per share. Excluding these special dividends, the ratio of net investment income (loss) to average net assets would have been .03%. I For the period July 21, 2005 (commencement of sale of shares) to December 31, 2005. J Expense ratios reflect operating expenses of the class. Expenses before reductions do not reflect amounts reimbursed by the investment adviser or reductions from brokerage service arrangements or other expense offset arrangements and do not represent the amount paid by the class during periods when reimbursements or reductions occur. Expense ratios before reductions for start-up periods may not be representative of longer-term operating periods. Expenses net of fee waivers reflect expenses after reimbursement by the investment adviser but prior to reductions from brokerage service arrangements or other expense offset arrangements. Expenses net of all reductions represent the net expenses paid by the class. K Amount represents less than $.01 per share. L Total distributions of $.131 per share is comprised of distributions from net investment income of $.046 and distributions from net realized gain of $.085 per share.
See accompanying notes which are an integral part of the financial statements.
VIP Consumer Discretionary Portfolio (the Fund) is a non-diversified fund of Variable Insurance Products Fund IV (the trust) and is authorized to issue an unlimited number of shares. The trust is registered under the Investment Company Act of 1940, as amended (the 1940 Act), as an open-end management investment company organized as a Massachusetts business trust. Shares of the Fund may only be purchased by insurance companies for the purpose of funding variable annuity or variable life insurance contracts. The Fund offers the following classes of shares: Initial Class shares and Investor Class shares. All classes have equal rights and voting privileges, except for matters affecting a single class. Investment income, realized and unrealized capital gains and losses, the common expenses of the Fund, and certain fund-level expense reductions, if any, are allocated on a pro rata basis to each class based on the relative net assets of each class to the total net assets of the Fund. Each class differs with respect to transfer agent fees incurred. Certain expense reductions also differ by class.
2. Investments in Fidelity Central Funds.
The Fund may invest in Fidelity Central Funds, which are open-end investment companies available only to other investment companies and accounts managed by Fidelity Management & Research Company (FMR) and its affiliates. The Fund's Schedule of Investments lists each of the Fidelity Central Funds held as of period end, if any, as an investment of the Fund, but does not include the underlying holdings of each Fidelity Central Fund. As an Investing Fund, the Fund indirectly bears its proportionate share of the expenses of the underlying Fidelity Central Funds.
The Money Market Central Funds seek preservation of capital and current income and are managed by Fidelity Investments Money Management, Inc. (FIMM), an affiliate of FMR.
A complete unaudited list of holdings for each Fidelity Central Fund is available upon request or at the SEC's web site at www.sec.gov. In addition, the financial statements of the Fidelity Central Funds, which are not covered by the Fund's Report of Independent Registered Public Accounting Firm, are available on the SEC's web site or upon request.
3. Significant Accounting Policies.
The financial statements have been prepared in conformity with accounting principles generally accepted in the United States of America, which require management to make certain estimates and assumptions at the date of the financial statements. Actual results could differ from those estimates. The following summarizes the significant accounting policies of the Fund:
Security Valuation. Investments are valued as of 4:00 p.m. Eastern time on the last calendar day of the period. Wherever possible, the Fund uses independent pricing services approved by the Board of Trustees to value its investments.
Equity securities, including restricted securities, for which market quotations are readily available, are valued at the last reported sale price or official closing price as reported by an independent pricing service on the primary market or exchange on which they are traded. In the event there were no sales during the day or closing prices are not available, securities are valued at the last quoted bid price. Investments in open-end mutual funds, including the Fidelity Central Funds, are valued at their closing net asset value each business day. Short-term securities with remaining maturities of sixty days or less for which quotations are not readily available are valued at amortized cost, which approximates value.
When current market prices or quotations are not readily available or reliable, valuations may be determined in good faith in accordance with procedures adopted by the Board of Trustees. Factors used in determining value may include significant market or security specific events, changes in interest rates and credit quality, and developments in foreign markets which are monitored by evaluating the performance of ADRs, futures contracts and exchange-traded funds. The frequency with which these procedures are used cannot be predicted and may be utilized to a significant extent. The value of securities used for net asset value (NAV) calculation under these procedures may differ from published prices for the same securities.
The Fund is subject to the provisions of Statement of Financial Accounting Standards No. 157, "Fair Value Measurements" (SFAS 157), effective with the beginning of the Fund's fiscal year. SFAS 157 establishes a hierarchy that prioritizes the inputs to valuation techniques giving the highest priority to readily available unadjusted quoted prices in active markets for identical assets (level 1 measurements) and the lowest priority to unobservable inputs (level 3 measurements) when market prices are not readily available or reliable. The three levels of the hierarchy under SFAS 157 are described below:
Level 1
Quoted prices in active markets for identical securities.
Level 2
Prices determined using other significant observable inputs. Observable inputs are inputs that other market participants may use in pricing a security. These may include quoted prices for similar securities, interest rates, prepayment speeds, credit risk and others.
Level 3
Prices determined using significant unobservable inputs. In situations where quoted prices or observable inputs are unavailable or deemed less relevant (for example, when there is little or no market activity for an investment at the end of the period), unobservable inputs may be used. Unobservable inputs reflect the Fund's own assumptions about the factors market participants would use in pricing an investment, and would be based on the best information available.
Changes in valuation techniques may result in transfers in or out of an investment's assigned level within the hierarchy.
Annual Report
3. Significant Accounting Policies - continued
Security Valuation - continued
The aggregate value by input level, as of December 31, 2008, for the Fund's investments, as well as a reconciliation of assets for which significant unobservable inputs (Level 3) were used in determining value, is included at the end of the Fund's Schedule of Investments.
Foreign Currency.The Fund uses foreign currency contracts to facilitate transactions in foreign-denominated securities. Losses from these transactions may arise from changes in the value of the foreign currency or if the counterparties do not perform under the contracts' terms.
Foreign-denominated assets, including investment securities, and liabilities are translated into U.S. dollars at the exchange rate at period end. Purchases and sales of investment securities, income and dividends received and expenses denominated in foreign currencies are translated into U.S. dollars at the exchange rate in effect on the transaction date.
The effects of exchange rate fluctuations on investments are included with the net realized and unrealized gain (loss) on investment securities. Other foreign currency transactions resulting in realized and unrealized gain (loss) are disclosed separately.
Investment Transactions and Income. For financial reporting purposes, the Fund's investment holdings and NAV include trades executed through the end of the last business day of the period. The NAV per share for processing shareholder transactions is calculated as of the close of business of the New York Stock Exchange (NYSE), normally 4:00 p.m. Eastern time and includes trades executed through the end of the prior business day. Gains and losses on securities sold are determined on the basis of identified cost and may include proceeds received from litigation. Dividend income is recorded on the ex-dividend date, except for certain dividends from foreign securities where the ex-dividend date may have passed, which are recorded as soon as the Fund is informed of the ex-dividend date. Non-cash dividends included in dividend income, if any, are recorded at the fair market value of the securities received. Distributions received on securities that represent a return of capital or capital gain are recorded as a reduction of cost of investments and/or as a realized gain. The Fund estimates the components of distributions received that may be considered return of capital distributions or capital gain distributions. Interest income and distributions from the Fidelity Central Funds are accrued as earned. Interest income includes coupon interest and amortization of premium and accretion of discount on debt securities. Investment income is recorded net of foreign taxes withheld where recovery of such taxes is uncertain.
Expenses. Most expenses of the trust can be directly attributed to a fund. Expenses which cannot be directly attributed are apportioned among each Fund in the trust. Expense estimates are accrued in the period to which they relate and adjustments are made when actual amounts are known.
Income Tax Information and Distributions to Shareholders. Each year, the Fund intends to qualify as a regulated investment company by distributing substantially all of its taxable income and realized gains under Subchapter M of the Internal Revenue Code and filing its U.S. federal tax return. As a result, no provision for income taxes is required. The Fund is subject to the provisions of FASB Interpretation No. 48, Accounting for Uncertainties in Income Taxes (FIN 48). FIN 48 sets forth a minimum threshold for financial statement recognition of the benefit of a tax position taken or expected to be taken in a tax return. There are no unrecognized tax benefits in the accompanying financial statements. A Fund's federal tax return is subject to examination by the Internal Revenue Service (IRS) for a period of three years. Foreign taxes are provided for based on the Fund's understanding of the tax rules and rates that exist in the foreign markets in which it invests
Distributions are recorded on the ex-dividend date. Income dividends and capital gain distributions are declared separately for each class. Income and capital gain distributions are determined in accordance with income tax regulations, which may differ from generally accepted accounting principles.
Capital accounts within the financial statements are adjusted for permanent book-tax differences. These adjustments have no impact on net assets or the results of operations. Temporary book-tax differences will reverse in a subsequent period.
Book-tax differences are primarily due to foreign currency transactions, capital loss carryforwards, and losses deferred due to wash sales and excise tax regulations.
The tax-basis components of distributable earnings and the federal tax cost as of period end were as follows:
Unrealized appreciation
$ 220,290
Unrealized depreciation
(2,493,435)
Net unrealized appreciation (depreciation)
(2,273,145)
Undistributed ordinary income
671
Capital loss carryforward
(966,651)
Cost for federal income tax purposes
$ 6,830,152
The tax character of distributions paid was as follows:
December 31, 2008
December 31, 2007
Ordinary Income
$ 51,833
$ 512,049
Long-term Capital Gains
50,854
366,090
Total
$ 102,687
$ 878,139
Annual Report
Notes to Financial Statements - continued
3. Significant Accounting Policies - continued
Trading (Redemption) Fees. Shares held less than 60 days are subject to a redemption fee equal to 1% of the proceeds of the redeemed shares. All redemption fees, including any estimated redemption fees paid by FMR, are retained by the Fund and accounted for as an addition to paid in capital.
4. Operating Policies.
Repurchase Agreements. FMR has received an Exemptive Order from the Securities and Exchange Commission (the SEC) which permits the Fund and other affiliated entities of FMR to transfer uninvested cash balances into joint trading accounts which are then invested in repurchase agreements. The Fund may also invest directly with institutions in repurchase agreements. Repurchase agreements are collateralized by government or non-government securities. Upon settlement date, collateral is held in segregated accounts with custodian banks and may be obtained in the event of a default of the counterparty. The Fund monitors, on a daily basis, the value of the collateral to ensure it is at least equal to the principal amount of the repurchase agreement (including accrued interest). In the event of a default by the counterparty, realization of the collateral proceeds could be delayed, during which time the value of the collateral may decline.
5. Purchases and Sales of Investments.
Purchases and sales of securities, other than short-term securities, aggregated $5,993,351 and $7,558,220, respectively.
6. Fees and Other Transactions with Affiliates.
Management Fee. FMR and its affiliates provide the Fund with investment management related services for which the Fund pays a monthly management fee. The management fee is the sum of an individual fund fee rate that is based on an annual rate of .30% of the Fund's average net assets and a group fee rate that averaged .26% during the period. The group fee rate is based upon the average net assets of all the mutual funds advised by FMR. The group fee rate decreases as assets under management increase and increases as assets under management decrease. For the period, the total annual management fee rate was .56% of the Fund's average net assets.
Transfer Agent Fees. Fidelity Investments Institutional Operations Company, Inc. (FIIOC), an affiliate of FMR, is the Fund's transfer, dividend disbursing, and shareholder servicing agent. FIIOC receives an asset-based fee with respect to each class. Each class (with the exception of Investor Class) pays a transfer agent fee, excluding out of pocket expenses, equal to an annual rate of .07% of average net assets. Investor Class pays a monthly asset-based transfer agent fee of .15% of average net assets. Prior to February 1, 2008, Investor Class paid a monthly asset-based transfer agent fee of .18% of average net assets. The total transfer agent fees paid by each class to FIIOC, including out of pocket expenses, were as follows:
Initial Class
$ 7,802
Investor Class
5,663
$ 13,465
Accounting Fees. Fidelity Service Company, Inc. (FSC), an affiliate of FMR, maintains the Fund's accounting records. The fee is based on the level of average net assets for the month.
Brokerage Commissions. The Fund placed a portion of its portfolio transactions with brokerage firms which are affiliates of the investment adviser. The commissions paid to these affiliated firms were $884 for the period.
7. Committed Line of Credit.
The Fund participates with other funds managed by FMR in a $4.2 billion credit facility (the "line of credit") to be utilized for temporary or emergency purposes to fund shareholder redemptions or for other short-term liquidity purposes. The Fund has agreed to pay commitment fees on its pro rata portion of the line of credit, which amounted to $17 and is reflected in Miscellaneous Expense on the Statement of Operations. During the period, there were no borrowings on this line of credit.
8. Expense Reductions.
FMR voluntarily agreed to reimburse each class to the extent annual operating expenses exceeded certain levels of average net assets as noted in the table below. Some expenses, for example interest expense, including commitment fees, are excluded from this reimbursement.
Annual Report
8. Expense Reductions - continued
The following classes were in reimbursement during the period:
Expense Limitations
Reimbursement from adviser
Initial Class
1.00%
$ 21,667
Investor Class
1.15-1.08%*
8,898
$ 30,565
* Expense limitation in effect at period end.
Many of the brokers with whom FMR places trades on behalf of the Fund provided services to the Fund in addition to trade execution. These services included payments of certain expenses on behalf of the Fund totaling $61 for the period.
9. Other.
The Fund's organizational documents provide former and current trustees and officers with a limited indemnification against liabilities arising in connection with the performance of their duties to the Fund. In the normal course of business, the Fund may also enter into contracts that provide general indemnifications. The Fund's maximum exposure under these arrangements is unknown as this would be dependent on future claims that may be made against the Fund. The risk of material loss from such claims is considered remote.
At the end of the period, FMR or its affiliates were the owners of record of 100% of the total outstanding shares of the fund.
In December 2006, the Independent Trustees, with the assistance of independent counsel, completed an investigation regarding gifts, gratuities and business entertainment provided by certain brokers to certain individuals who were employed on FMR's domestic equity trading desk during the period 2002 to 2004. The Independent Trustees and FMR agreed that, despite the absence of proof that the Fidelity mutual funds experienced diminished execution quality as a result of the improper receipt of gifts and business entertainment, the conduct at issue was serious and was worthy of redress. Accordingly, the Independent Trustees requested, and FMR agreed to make, a payment of $42 million plus accrued interest, which equaled approximately $7.3 million, to certain Fidelity mutual funds.
In March 2008, the Trustees approved a method for allocating this payment among the funds and, in total, FMR paid the fund $3,761, which is recorded in the accompanying Statement of Operations.
In a related administrative order dated March 5, 2008, the U.S. Securities and Exchange Commission ("SEC") announced a settlement with FMR and FMR Co., Inc. (an affiliate of FMR) involving the SEC's regulatory rules for investment advisers and the improper receipt of gifts, gratuities and business entertainment. Without admitting or denying the SEC's findings, FMR agreed to pay an $8 million civil penalty to the United States Treasury.
10. Distributions to Shareholders.
Distributions to shareholders of each class were as follows:
Years ended December 31,
2008
2007
From net investment income
Initial Class
$ 22,246
$ 21,493
Investor Class
8,399
5,883
Total
$ 30,645
$ 27,376
From net realized gain
Initial Class
$ 53,286
$ 642,099
Investor Class
18,756
208,664
Total
$ 72,042
$ 850,763
Annual Report
Notes to Financial Statements - continued
11. Share Transactions.
Transactions for each class of shares were as follows:
Shares
Dollars
Years ended December 31,
2008
2007
2008
2007
Initial Class
Shares sold
200,837
194,438
$ 1,839,241
$ 2,608,051
Reinvestment of distributions
8,451
60,458
75,532
663,592
Shares redeemed
(400,279)
(682,661)
(3,312,456)
(9,097,868)
Net increase (decrease)
(190,991)
(427,765)
$ (1,397,683)
$ (5,826,225)
Investor Class
Shares sold
124,737
215,844
$ 1,182,888
$ 2,882,128
Reinvestment of distributions
3,058
19,548
27,155
214,547
Shares redeemed
(158,673)
(347,583)
(1,373,810)
(4,570,323)
Net increase (decrease)
(30,878)
(112,191)
$ (163,767)
$ (1,473,648)
Annual Report
Reportof Independent Registered Public Accounting Firm
To the Trustees of Variable Insurance Products Fund IV and the Shareholders of VIP Consumer Discretionary Portfolio:
In our opinion, the accompanying statement of assets and liabilities, including the schedule of investments, and the related statements of operations and of changes in net assets and the financial highlights present fairly, in all material respects, the financial position of VIP Consumer Discretionary Portfolio (a fund of Variable Insurance Products Fund IV) at December 31, 2008, the results of its operations for the year then ended, the changes in its net assets for each of the two years in the period then ended and the financial highlights for each of the periods indicated, in conformity with accounting principles generally accepted in the United States of America. These financial statements and financial highlights (hereafter referred to as "financial statements") are the responsibility of the VIP Consumer Discretionary Portfolio's management. Our responsibility is to express an opinion on these financial statements based on our audits. We conducted our audits of these financial statements in accordance with the standards of the Public Company Accounting Oversight Board (United States). Those standards require that we plan and perform the audit to obtain reasonable assurance about whether the financial statements are free of material misstatement. An audit includes examining, on a test basis, evidence supporting the amounts and disclosures in the financial statements, assessing the accounting principles used and significant estimates made by management, and evaluating the overall financial statement presentation. We believe that our audits, which included confirmation of securities at December 31, 2008 by correspondence with the custodian and brokers, provide a reasonable basis for our opinion.
The Trustees, Member of the Advisory Board, and executive officers of the trust and fund, as applicable, are listed below. The Board of Trustees governs the fund and is responsible for protecting the interests of shareholders. The Trustees are experienced executives who meet periodically throughout the year to oversee the fund's activities, review contractual arrangements with companies that provide services to the fund, and review the fund's performance. Except for Edward C. Johnson 3d and James C. Curvey, each of the Trustees oversees 222 funds advised by FMR or an affiliate. Messrs. Johnson and Curvey oversee 381 funds advised by FMR or an affiliate.
The Trustees hold office without limit in time except that (a) any Trustee may resign; (b) any Trustee may be removed by written instrument, signed by at least two-thirds of the number of Trustees prior to such removal; (c) any Trustee who requests to be retired or who has become incapacitated by illness or injury may be retired by written instrument signed by a majority of the other Trustees; and (d) any Trustee may be removed at any special meeting of shareholders by a two-thirds vote of the outstanding voting securities of the trust. Each Trustee who is not an interested person (as defined in the 1940 Act) (Independent Trustee), shall retire not later than the last day of the calendar year in which his or her 72nd birthday occurs. The Independent Trustees may waive this mandatory retirement age policy with respect to individual Trustees. The executive officers and Advisory Board Member hold office without limit in time, except that any officer and Advisory Board Member may resign or may be removed by a vote of a majority of the Trustees at any regular meeting or any special meeting of the Trustees. Except as indicated, each individual has held the office shown or other offices in the same company for the past five years.
The fund's Statement of Additional Information (SAI) includes more information about the Trustees. To request a free copy, call Fidelity at 1-877-0098.
Interested Trustees*:
Correspondence intended for each Trustee who is an interested person may be sent to Fidelity Investments, 82 Devonshire Street, Boston, Massachusetts 02109.
Name, Age; Principal Occupation
Edward C. Johnson 3d (78)
Year of Election or Appointment: 1983
Mr. Johnson is Chairman of the Board of Trustees. Mr. Johnson serves as Chief Executive Officer, Chairman, and a Director of FMR LLC; Chairman and a Director of FMR; Chairman and a Director of Fidelity Research & Analysis Company (FRAC); Chairman and a Director of Fidelity Investments Money Management, Inc.; and Chairman and a Director of FMR Co., Inc. In addition, Mr. Johnson serves as Chairman and Director of FIL Limited. Previously, Mr. Johnson served as President of FMR LLC (2006-2007).
James C. Curvey (73)
Year of Election or Appointment: 2007
Mr. Curvey also serves as Trustee (2007-present) of other investment companies advised by FMR. Mr. Curvey is a Director of FMR and FMR Co., Inc. (2007-present). Mr. Curvey is also Vice Chairman (2006-present) and Director of FMR LLC. In addition, Mr. Curvey serves as an Overseer for the Boston Symphony Orchestra and a member of the Trustees of Villanova University.
* Trustees have been determined to be "Interested Trustees" by virtue of, among other things, their affiliation with the trust or various entities under common control with FMR. FMR Corp. merged with and into FMR LLC on October 1, 2007. Any references to FMR LLC for prior periods are deemed to be references to the prior entity.
Independent Trustees:
Correspondence intended for each Independent Trustee (that is, the Trustees other than the Interested Trustees) may be sent to Fidelity Investments, P.O. Box 55235, Boston, Massachusetts 02205-5235.
Name, Age; Principal Occupation
Dennis J. Dirks (60)
Year of Election or Appointment: 2005
Prior to his retirement in May 2003, Mr. Dirks was Chief Operating Officer and a member of the Board of The Depository Trust & Clearing Corporation (DTCC) (1999-2003). He also served as President, Chief Operating Officer, and Board member of The Depository Trust Company (DTC) (1999-2003) and President and Board member of the National Securities Clearing Corporation (NSCC) (1999-2003). In addition, Mr. Dirks served as Chief Executive Officer and Board member of the Government Securities Clearing Corporation (2001-2003), Chief Executive Officer and Board member of the Mortgage-Backed Securities Clearing Corporation (2001-2003), as a Trustee and a member of the Finance Committee of Manhattan College (2005-2008), and as a Trustee and a member of the Finance Committee of AHRC of Nassau County (2006-2008). Currently, Mr. Dirks serves as a member of the Board of Directors for The Brookville Center for Children's Services, Inc. (2009-present).
Alan J. Lacy (55)
Year of Election or Appointment:2008
Mr. Lacy serves as Senior Adviser (2007-present) of Oak Hill Capital Partners, L.P. (a private equity firm). Mr. Lacy also served as Chief Executive Officer (2000-2005) and Vice Chairman (2005-2006) of Sears Holdings Corporation and Sears, Roebuck and Co. (retail). In addition, Mr. Lacy serves as a member of the Board of Directors of The Western Union Company (global money transfer, 2006-present) and Bristol-Myers Squibb (global pharmaceuticals, 2007-present). Mr. Lacy is a Trustee of the National Parks Conservation Association and The Field Museum of Natural History.
Ned C. Lautenbach (64)
Year of Election or Appointment: 2000
Mr. Lautenbach is Chairman of the Independent Trustees (2006-present). Mr. Lautenbach is an Advisory Partner of Clayton, Dubilier & Rice, Inc. (private equity investment firm). Previously, Mr. Lautenbach was with the International Business Machines Corporation (IBM) from 1968 until his retirement in 1998. Mr. Lautenbach serves as a Director of Eaton Corporation (diversified industrial) as well as the Philharmonic Center for the Arts in Naples, Florida. He also is a member of the Board of Trustees of Fairfield University (2005-present), as well as a member of the Council on Foreign Relations. Previously, Mr. Lautenbach served as a Director of Sony Corporation (2006-2007).
Joseph Mauriello (64)
Year of Election or Appointment: 2008
Prior to his retirement in January 2006, Mr. Mauriello served in numerous senior management positions including Deputy Chairman and Chief Operating Officer (2004-2005), and Vice Chairman of Financial Services (2002-2004) of KPMG LLP US (professional services firm, 1965-2005). Mr. Mauriello currently serves as a member of the Board of Directors of XL Capital Ltd. (global insurance and re-insurance company, 2006-present) and of Arcadia Resources Inc. (health care services and products, 2007- present). He also served as a Director of the Hamilton Funds of the Bank of New York (2006-2007).
Cornelia M. Small (64)
Year of Election or Appointment: 2005
Ms. Small is a member of the Investment Committee, and Chair (2008-present) and a member of the Board of Trustees of Smith College. Ms. Small also serves on the Investment Committee of the Berkshire Taconic Community Foundation (2008-present). Previously, Ms. Small served as Chairperson of the Investment Committee (2002-2008) of Smith College and as Co-Chair (2000-2003) of the Annual Fund for the Fletcher School of Law and Diplomacy. In addition, she served as Chief Investment Officer, Director of Global Equity Investments, and a member of the Board of Directors of Scudder, Stevens & Clark and Scudder Kemper Investments.
William S. Stavropoulos (69)
Year of Election or Appointment: 2001
Mr. Stavropoulos is Chairman Emeritus of the Board of Directors of The Dow Chemical Company, where he previously served in numerous senior management positions, including President (1993-2000; 2002-2003), CEO (1995-2000; 2002-2004), Chairman of the Executive Committee (2000-2006), and as a member of the Board of Directors (1990-2006). Currently, he is a Director of Teradata Corporation (data warehousing and technology solutions, 2008-present), Chemical Financial Corporation, Maersk Inc. (industrial conglomerate), Tyco International, Inc. (multinational manufacturing and services, 2007-present), and a member of the Advisory Board for Metalmark Capital (private equity investment firm, 2005-present). He is a special advisor to Clayton, Dubilier & Rice, Inc. (private equity investment). In addition, Mr. Stavropoulos is a member of the University of Notre Dame Advisory Council for the College of Science.
David M. Thomas (59)
Year of Election or Appointment: 2008
Previously, Mr. Thomas served as Executive Chairman (2005-2006) and Chairman and Chief Executive Officer (2000-2005) of IMS Health, Inc. (pharmaceutical and healthcare information solutions). In addition, Mr. Thomas serves as a member of the Board of Directors of Fortune Brands, Inc. (consumer products holding company), and Interpublic Group of Companies, Inc. (marketing communication, 2004-present).
Michael E. Wiley (58)
Year of Election or Appointment: 2008
Mr. Wiley also serves as a member of the Board of Trustees of the University of Tulsa (2000-2006; 2007-present). He serves as a Director of Tesoro Corporation (independent oil refiner and marketer, 2005-present), and a Director of Bill Barrett Corporation (exploration and production company, 2005-present). In addition, he also serves as a Director of Post Oak Bank (privately-held bank, 2004-present). Previously, Mr. Wiley served as a Sr. Energy Advisor of Katzenbach Partners, LLC (consulting firm, 2006-2007), as an Advisory Director of Riverstone Holdings (private investment firm), Chairman, President, and CEO of Baker Hughes, Inc. (oilfield services company, 2000-2004), and as Director of Spinnaker Exploration Company (exploration and production company, 2001-2005).
Annual Report
Trustees and Officers - continued
Advisory Board Member and Executive Officers**:
Correspondence intended for each executive officer and Peter S. Lynch may be sent to Fidelity Investments, 82 Devonshire Street, Boston, Massachusetts 02109.
Name, Age; Principal Occupation
Peter S. Lynch (64)
Year of Election or Appointment: 2003
Member of the Advisory Board of Fidelity's Equity and High Income Funds. Mr. Lynch is Vice Chairman and a Director of FMR, and Vice Chairman (2001-present) and a Director of FMR Co., Inc. Previously, Mr. Lynch served as a Trustee of the Fidelity funds (1990-2003). In addition, he serves as a Trustee of Boston College and as the Chairman of the Inner-City Scholarship Fund. Previously, Mr. Lynch served on the Special Olympics International Board of Directors (1997-2006).
Kenneth B. Robins (39)
Year of Election or Appointment: 2008
President and Treasurer of Fidelity's Equity and High Income Funds. Mr. Robins is an employee of Fidelity Investments (2004- present). Before joining Fidelity Investments, Mr. Robins worked at KPMG LLP, where he was a partner in KPMG's department of professional practice (2002-2004).
Brian B. Hogan (44)
Year of Election or Appointment: 2007
Vice President of Sector Funds. Mr. Hogan also serves as Senior Vice President, Equity Research of FMR. Previously, Mr. Hogan served as a portfolio manager.
Scott C. Goebel (40)
Year of Election or Appointment: 2008
Secretary and Chief Legal Officer (CLO) of the Fidelity funds. Mr. Goebel also serves as General Counsel, Secretary, and Senior Vice President of FMR (2008-present); Deputy General Counsel of FMR LLC; Chief Legal Secretary of Fidelity Management & Research (Hong Kong) Limited (2008-present) and Assistant Secretary of Fidelity Management & Research (Japan) Inc. (2008- present). Previously, Mr. Goebel served as Assistant Secretary of the Funds (2007-2008) and as Vice President and Secretary of Fidelity Distributors Corporation (FDC) (2005-2007).
John B. McGinty, Jr. (46)
Year of Election or Appointment: 2008
Assistant Secretary of Fidelity's Equity and High Income Funds. Mr. McGinty is an employee of Fidelity Investments (2004-present). Mr. McGinty also serves as Senior Vice President, Secretary, and Chief Legal Officer of FDC (2007-present). Before joining Fidelity Investments, Mr. McGinty practiced law at Ropes & Gray, LLP.
Holly C. Laurent (54)
Year of Election or Appointment: 2008
Anti-Money Laundering (AML) Officer of the Fidelity funds. Ms. Laurent is an employee of Fidelity Investments. Previously, Ms. Laurent was Senior Vice President and Head of Legal for Fidelity Business Services India Pvt. Ltd. (2006-2008), Senior Vice President, Deputy General Counsel and Group Head for FMR LLC (2005-2006).
Christine Reynolds (50)
Year of Election or Appointment: 2008
Chief Financial Officer of the Fidelity funds. Ms. Reynolds became President of Fidelity Pricing and Cash Management Services (FPCMS) in August 2008. She served as Chief Operating Officer of FPCMS from 2007 through July 2008. Previously, Ms. Reynolds served as President, Treasurer, and Anti-Money Laundering officer of the Fidelity funds (2004-2007). Before joining Fidelity Investments, Ms. Reynolds worked at PricewaterhouseCoopers LLP (PwC) (1980-2002), where she was an audit partner with PwC's investment management practice.
Kenneth A. Rathgeber (61)
Year of Election or Appointment: 2004
Chief Compliance Officer of Fidelity's Equity and High Income Funds. Mr. Rathgeber is Chief Compliance Officer of Fidelity Management & Research (Hong Kong) Limited (2008-present), Fidelity Management & Research (Japan) Inc. (2008-present), FMR (2005-present), FMR Co., Inc. (2005-present), Fidelity Management & Research (U.K.) Inc. (2005-present), Fidelity Research & Analysis Company (2005-present), Fidelity Investments Money Management, Inc. (2005-present), and Strategic Advisers, Inc. (2005-present).
Bryan A. Mehrmann (47)
Year of Election or Appointment: 2005
Deputy Treasurer of the Fidelity funds. Mr. Mehrmann is an employee of Fidelity Investments. Previously, Mr. Mehrmann served as Vice President of Fidelity Investments Institutional Services Group (FIIS)/Fidelity Investments Institutional Operations Company, Inc. (FIIOC) Client Services (1998-2004).
Adrien E. Deberghes (41)
Year of Election or Appointment: 2008
Deputy Treasurer of Fidelity's Equity and High Income Funds. Mr. Deberghes is an employee of Fidelity Investments (2008-present). Previously, Mr. Deberghes served as Senior Vice President of Mutual Fund Administration at State Street Corporation (2007-2008), Senior Director of Mutual Fund Administration at Investors Bank & Trust (2005-2007), and Director of Finance for Dunkin' Brands (2000-2005).
Robert G. Byrnes (42)
Year of Election or Appointment: 2005
Assistant Treasurer of the Fidelity funds. Mr. Byrnes is an employee of Fidelity Investments (2005-present). Previously, Mr. Byrnes served as Vice President of Fidelity Pricing and Cash Management Services (FPCMS) (2003-2005). Before joining Fidelity Investments, Mr. Byrnes worked at Deutsche Asset Management where he served as Vice President of the Investment Operations Group (2000-2003).
Paul M. Murphy (61)
Year of Election or Appointment: 2007
Assistant Treasurer of the Fidelity funds. Mr. Murphy is an employee of Fidelity Investments (2007-present). Previously, Mr. Murphy served as Chief Financial Officer of the Fidelity Funds (2005-2006), Vice President and Associate General Counsel of FMR (2007), and Senior Vice President of Fidelity Pricing and Cash Management Services (FPCMS) (1994-2007).
Gary W. Ryan (50)
Year of Election or Appointment: 2005
Assistant Treasurer of the Fidelity funds. Mr. Ryan is an employee of Fidelity Investments. Previously, Mr. Ryan served as Vice President of Fund Reporting in Fidelity Pricing and Cash Management Services (FPCMS) (1999-2005).
** FMR Corp. merged with and into FMR LLC on October 1, 2007. Any references to FMR LLC for prior periods are deemed to be references to the prior entity.
Initial Class, and Investor Class designate 3% and 100% of the dividends distributed in February and December, respectively as qualifying for the dividends-received deduction for corporate shareholders.
The fund will notify shareholders in January 2009 of amounts for use in preparing 2008 income tax returns.
A special meeting of the fund's shareholders was held on May 14, 2008. The results of votes taken among shareholders on the proposals before them are reported below. Each vote reported represents one dollar of net asset value held on the record date for the meeting.
PROPOSAL 1
To elect a Board of Trustees.A
# of Votes
% of Votes
James C. Curvey
Affirmative
82,890,712.47
95.991
Withheld
3,461,988.43
4.009
TOTAL
86,352,700.90
100.000
Dennis J. Dirks
Affirmative
82,970,372.75
96.083
Withheld
3,382,328.15
3.917
TOTAL
86,352,700.90
100.000
Edward C. Johnson 3d
Affirmative
82,689,162.78
95.757
Withheld
3,663,538.12
4.243
TOTAL
86,352,700.90
100.000
Alan J. Lacy
Affirmative
83,041,222.35
96.165
Withheld
3,311,478.55
3.835
TOTAL
86,352,700.90
100.000
Ned C. Lautenbach
Affirmative
82,983,853.72
96.099
Withheld
3,368,847.18
3.901
TOTAL
86,352,700.90
100.000
Joseph Mauriello
Affirmative
83,138,122.14
96.277
Withheld
3,214,578.76
3.723
TOTAL
86,352,700.90
100.000
Cornelia M. Small
Affirmative
83,095,438.06
96.228
Withheld
3,257,262.84
3.772
TOTAL
86,352,700.90
100.000
William S. Stavropoulos
Affirmative
82,929,113.95
96.035
Withheld
3,423,586.95
3.965
TOTAL
86,352,700.90
100.000
David M. Thomas
Affirmative
83,095,487.87
96.228
Withheld
3,257,213.03
3.772
TOTAL
86,352,700.90
100.000
Michael E. Wiley
Affirmative
83,048,523.75
96.174
Withheld
3,304,177.15
3.826
TOTAL
86,352,700.90
100.000
PROPOSAL 2
To amend the Declaration of Trust to reduce the required quorum for future shareholder meetings.A
# of Votes
% of Votes
Affirmative
74,393,635.26
86.151
Against
8,745,543.59
10.128
Abstain
3,213,522.05
3.721
TOTAL
86,352,700.90
100.000
ADenotes trust-wide proposal and voting results.
Annual Report
BoardApproval of Investment Advisory Contracts and Management Fees
VIP Consumer Discretionary Portfolio
Each year, typically in July, the Board of Trustees, including the Independent Trustees (together, the Board), votes on the renewal of the management contract and sub-advisory agreements (together, the Advisory Contracts) for the fund. The Board, assisted by the advice of fund counsel and Independent Trustees' counsel, requests and considers a broad range of information throughout the year.
The Board meets regularly and, acting directly and through its separate committees, requests and receives information concerning, and considers at each of its meetings factors that are relevant to, its annual consideration of the renewal of the fund's Advisory Contracts, including the services and support provided to the fund and its shareholders. At the time of the renewal, the Board had 12 standing committees, each composed of Independent Trustees with varying backgrounds, to which the Board has assigned specific subject matter responsibilities in order to enhance effective decision-making by the Board. Each committee has a written charter outlining the structure and purposes of the committee. The Board also meets as needed to consider matters specifically related to the Board's annual consideration of the renewal of Advisory Contracts.
At its July 2008 meeting, the Board of Trustees, including the Independent Trustees, unanimously determined to renew the fund's Advisory Contracts. In reaching its determination, the Board considered all factors it believed relevant, including (i) the nature, extent, and quality of the services to be provided to the fund and its shareholders (including the investment performance of the fund); (ii) the competitiveness of the fund's management fee and total expenses; (iii) the total costs of the services to be provided by and the profits to be realized by Fidelity from its relationship with the fund; (iv) the extent to which economies of scale would be realized as the fund grows; and (v) whether fee levels reflect these economies of scale, if any, for the benefit of fund shareholders. The Board also approved agreements with foreign sub-advisers Fidelity Management & Research (Japan) Inc. and Fidelity Management & Research (Hong Kong) Limited, as well as amendments to the fund's agreement with Fidelity Management & Research (U.K.) Inc.
In considering whether to renew the Advisory Contracts for the fund, the Board ultimately reached a determination, with the assistance of fund counsel and Independent Trustees' counsel and through the exercise of its business judgment, that the renewal of the Advisory Contracts and the compensation to be received by Fidelity under the management contract is consistent with Fidelity's fiduciary duty under applicable law. The Board's decision to renew the Advisory Contracts was not based on any single factor noted above, but rather was based on a comprehensive consideration of all the information provided to the Board at its meetings throughout the year. The Board, in reaching its determination to renew the Advisory Contracts, is aware that shareholders in the fund have a broad range of investment choices available to them, including a wide choice among mutual funds offered by competitors to Fidelity, and that the fund's shareholders, with the opportunity to review and weigh the disclosure provided by the fund in its prospectus and other public disclosures, have chosen to invest in this fund, managed by Fidelity.
Nature, Extent, and Quality of Services Provided. The Board considered staffing within the investment adviser, FMR, and the sub-advisers (together, the Investment Advisers), including the backgrounds of the fund's investment personnel and the fund's investment objective and discipline. The Independent Trustees also had discussions with senior management of Fidelity's investment operations and investment groups. The Board considered the structure of the portfolio manager compensation program and whether this structure provides appropriate incentives.
Resources Dedicated to Investment Management and Support Services. The Board reviewed the size, education, and experience of the Investment Advisers' investment staff, their use of technology, and the Investment Advisers' approach to recruiting, training, and retaining portfolio managers and other research, advisory, and management personnel. The Board noted that Fidelity's analysts have access to a variety of technological tools that enable them to perform both fundamental and quantitative analysis and to specialize in various disciplines. The Board considered Fidelity's extensive global research capabilities that enable the Investment Advisers to aggregate data from various sources in an effort to produce positive investment results. The Board also considered that Fidelity's portfolio managers and analysts have access to daily portfolio attribution that allows for monitoring of a fund's portfolio, as well as an electronic communication system that provides immediate real-time access to research concerning issuers and credit enhancers.
Shareholder and Administrative Services. The Board considered (i) the nature, extent, quality, and cost of advisory, administrative, distribution, and shareholder services performed by the Investment Advisers and their affiliates under the Advisory Contracts and under separate agreements covering transfer agency, pricing and bookkeeping, and securities lending services for the fund; (ii) the nature and extent of the Investment Advisers' supervision of third party service providers, principally custodians and subcustodians; and (iii) the resources devoted to, and the record of compliance with, the fund's compliance policies and procedures. The Board also reviewed the allocation of fund brokerage, including allocations to brokers affiliated with the Investment Advisers, the use of brokerage commissions to pay fund expenses, and the use of "soft" commission dollars to pay for research services. The Board further considered that Fidelity voluntarily pays for market data out of its own resources.
The Board noted that the growth of fund assets across the complex allows Fidelity to reinvest in the development of services designed to enhance the value or convenience of the Fidelity funds as investment vehicles. These services include 24-hour access to account information and market information through phone representatives and over the Internet, and investor education materials and asset allocation tools.
Investment in a Large Fund Family. The Board considered the benefits to shareholders of investing in a Fidelity fund, including the benefits of investing in a fund that is part of a large family of funds offering a variety of investment disciplines and providing for a large variety of mutual fund investor services. The Board noted that Fidelity has taken a number of actions over the previous year that benefited particular funds, including (i) dedicating additional resources to investment research and to restructure the investment research teams; (ii) contractually agreeing to reduce the management fees on Fidelity's Institutional Money Market Funds and launching Class IV and Institutional Class of certain of these funds; (iii) reducing the transfer agent fees for the Fidelity Select Portfolios and Investor Class of the VIP funds; and (iv) launching Class K of 29 equity funds as a lower-fee class available to certain employer-sponsored retirement plans.
Annual Report
Investment Performance. The Board considered whether the fund has operated within its investment objective, as well as its record of compliance with its investment restrictions. It also reviewed the fund's absolute investment performance for each class, as well as the fund's relative investment performance for each class measured against a third-party-sponsored index that reflects the market sector in which the fund invests over multiple periods. The Board noted that FMR does not believe that a meaningful peer group exists against which to compare the fund's performance. The following charts considered by the Board show, over the one-, three-, and five-year periods ended December 31, 2007, as available, the cumulative total returns of Initial Class and Investor Class of the fund and the cumulative total returns of a third-party-sponsored index ("benchmark").
VIP Consumer Discretionary Portfolio
The Board stated that the investment performance of Initial Class of the fund compared favorably to its benchmark for the one- and three-year periods, although the fund's five-year cumulative total return was lower than its benchmark. The Board considered that the variations in performance between the fund's classes reflect the variations in class expenses, which result in lower performance for the higher expense class.
The Board considered that FMR has taken steps to refocus and strengthen equity research, equity portfolio management, and compliance.
Based on its review, and giving particular weight to the nature and quality of the resources dedicated by the Investment Advisers to maintain and improve relative performance, the Board concluded that the nature, extent, and quality of the services provided to the fund will benefit the fund's shareholders, particularly in light of the Board's view that the fund's shareholders benefit from investing in a fund that is part of a large family of funds offering a variety of investment disciplines and services.
Competitiveness of Management Fee and Total Fund Expenses. The Board considered the fund's management fee and total expenses compared to "mapped groups" of competitive funds and classes. Fidelity creates "mapped groups" by combining similar Lipper investment objective categories that have comparable management fee characteristics. Combining Lipper investment objective categories aids the Board's management fee and total expense comparisons by broadening the competitive group used for comparison and by reducing the number of universes to which various Fidelity funds are compared. The Board also considered supplemental information about how the fund's management fee and total expenses ranked relative to groups based on Lipper classifications, which take into account a fund's market capitalization and style.
The Board considered two proprietary management fee comparisons for the 12-month periods shown in the chart below. The group of Lipper funds used by the Board for management fee comparisons is referred to below as the "Total Mapped Group." The Total Mapped Group comparison focuses on a fund's standing relative to the total universe of comparable funds available to investors, in terms of gross management fees before expense reimbursements or caps. "TMG %" represents the percentage of funds in the Total Mapped Group that had management fees that were lower than the fund's. For example, a TMG % of 4% means that 96% of the funds in the Total Mapped Group had higher management fees than the fund. The "Asset-Size Peer Group" (ASPG) comparison focuses on a fund's standing relative to non-Fidelity funds similar in size to the fund within the Total Mapped Group. The ASPG represents at least 15% of the funds in the Total Mapped Group with comparable asset size and management fee characteristics, subject to a minimum of 50 funds (or all funds in the Total Mapped Group if fewer than 50). Additional information, such as the ASPG quartile in which the fund's management fee ranked, is also included in the chart and considered by the Board.
Annual Report
Board Approval of Investment Advisory Contracts and Management Fees - continued
VIP Consumer Discretionary Portfolio
The Board noted that the fund's management fee ranked below the median of its Total Mapped Group and below the median of its ASPG for 2007.
Based on its review, the Board concluded that the fund's management fee was fair and reasonable in light of the services that the fund receives and the other factors considered.
In its review of each class's total expenses, the Board considered the fund's management fee as well as other fund or class expenses, as applicable, such as transfer agent fees, pricing and bookkeeping fees, and custodial, legal, and audit fees. The Board also noted the effects of any waivers and reimbursements on fees and expenses. As part of its review, the Board also considered current and historical total expenses of each class of the fund compared to competitive fund median expenses. Each class of the fund is compared to those funds and classes in the Total Mapped Group (used by the Board for management fee comparisons) that have a similar sales load structure.
The Board noted that the total expenses of Initial Class ranked below its competitive median for 2007, and the total expenses of Investor Class ranked above its competitive median for 2007. The Board considered that the total expenses of Investor Class were above the median primarily due to its higher transfer agent fee. The Board noted that the fund offers multiple classes and that the multiple structures are intended to offer pricing options for the intermediary market. The Board also noted that the total expenses of the classes vary primarily due to differences in transfer agent fees.
In its review of total expenses, the Board also considered Fidelity fee structures and other information on clients that FMR and its affiliates service in other competitive markets, such as other mutual funds advised or subadvised by FMR or its affiliates, pension plan clients, and other institutional clients.
Based on its review, the Board concluded that the total expenses of each class of the fund were reasonable, although in one case above the median of the universe presented for comparison, in light of the services that the fund and its shareholders receive and the other factors considered.
Costs of the Services and Profitability. The Board considered the revenues earned and the expenses incurred by Fidelity in conducting the business of developing, marketing, distributing, managing, administering and servicing the fund and its shareholders. The Board also considered the level of Fidelity's profits in respect of all the Fidelity funds.
On an annual basis, FMR presents to the Board Fidelity's profitability for the fund. Fidelity calculates the profitability for each fund, as well as aggregate profitability for groups of Fidelity funds and all Fidelity funds, using a series of detailed revenue and cost allocation methodologies which originate with the audited books and records of Fidelity. The Audit Committee of the Board reviews any significant changes from the prior year's methodologies.
PricewaterhouseCoopers LLP (PwC), independent registered public accounting firm and auditor to Fidelity and certain Fidelity funds, has been engaged annually by the Board as part of the Board's assessment of the results of Fidelity's profitability analysis. PwC's engagement includes the review and assessment of Fidelity's methodologies used in determining the revenues and expenses attributable to Fidelity's mutual fund business, and completion of agreed-upon procedures surrounding the mathematical accuracy of fund profitability and its conformity to allocation methodologies. After considering PwC's reports issued under the engagement and information provided by Fidelity, the Board believes that while other allocation methods may also be reasonable, Fidelity's profitability methodologies are reasonable in all material respects.
Annual Report
The Board has also reviewed Fidelity's non-fund businesses and any fall-out benefits related to the mutual fund business as well as cases where Fidelity's affiliates may benefit from or be related to the fund's business.
The Board considered the costs of the services provided by and the profits realized by Fidelity in connection with the operation of the fund and determined that the amount of profit is a fair entrepreneurial profit for the management of the fund.
Economies of Scale. The Board considered whether there have been economies of scale in respect of the management of the Fidelity funds, whether the Fidelity funds (including the fund) have appropriately benefited from any such economies of scale, and whether there is potential for realization of any further economies of scale. The Board considered the extent to which the fund will benefit from economies of scale through increased services to the fund, through waivers or reimbursements, or through fee or expense reductions.
The Board recognized that the fund's management contract incorporates a "group fee" structure, which provides for lower group fee rates as total fund assets under FMR's management increase, and for higher group fee rates as total fund assets under FMR's management decrease. FMR determines the group fee rates based on a tiered asset "breakpoint" schedule. The Board considered that the group fee is designed to deliver the benefits of economies of scale to fund shareholders when total fund assets increase, even if assets of any particular fund are unchanged or have declined, because some portion of Fidelity's costs are attributable to services provided to all Fidelity funds, and all funds benefit if those costs can be allocated among more assets. The Board concluded that, given the group fee structure, fund shareholders will achieve a certain level of economies of scale as assets under FMR's management increase at the fund complex level, regardless of whether Fidelity achieves any such economies of scale.
The Board further concluded that any potential economies of scale are being shared between fund shareholders and Fidelity in an appropriate manner.
Additional Information Requested by the Board. In order to develop fully the factual basis for consideration of the Fidelity funds' Advisory Contracts, the Board requested and received additional information on certain topics, including (i) fund performance trends and actions to be taken by FMR to improve certain funds' overall performance; (ii) portfolio manager changes that have occurred during the past year; (iii) Fidelity's fund profitability methodology, the profitability of certain fund service providers, and profitability trends for certain funds; (iv) Fidelity's compensation structure for portfolio managers and key personnel, including its effects on fund profitability and the extent to which portfolio manager compensation is linked to fund performance; (v) Fidelity's fee structures and rationale for recommending different fees among categories of funds; and (vi) Fidelity's rationale for recommending which funds should have a performance adjustment component as part of their management fees.
Based on its evaluation of all of the conclusions noted above, and after considering all material factors, the Board ultimately concluded that the advisory fee structures are fair and reasonable, and that the fund's Advisory Contracts should be renewed.
Annual Report
Annual Report
Investment Adviser
Fidelity Management & Research Company Boston, MA
Investment Sub-Advisers
FMR Co., Inc.
Fidelity Management & Research (U.K.) Inc.
Fidelity Research & Analysis Company
Fidelity Investments Japan Limited
FIL Investment Advisors
FIL Investment Advisors (U.K.) Ltd.
Fidelity Management & Research (Hong Kong) Limited
Fidelity Management & Research (Japan) Inc.
General Distributor
Fidelity Distributors Corporation Boston, MA
Transfer and Service Agents
Fidelity Investments Institutional Operations Company, Inc. Boston, MA
Fidelity Service Company, Inc. Boston, MA
Custodian
JPMorgan Chase Bank New York, NY
VCONIC-ANN-0209
1.817355.103
Fidelity® Variable Insurance Products:
Consumer Staples Portfolio
Annual Report
December 31, 2008 (2_fidelity_logos) (Registered_Trademark)
To view a fund's proxy voting guidelines and proxy voting record for the 12-month period ended June 30, visit http://www.fidelity.com (search for "proxy voting guidelines") or visit the Securities and Exchange Commission's (SEC) web site at http://www.sec.gov. You may also call 1-877-208-0098 to request a free copy of the proxy voting guidelines.
Fidelity Variable Insurance Products are separate account options which are purchased through a variable insurance contract.
Standard & Poor's, S&P and S&P 500 are registered service marks of The McGraw-Hill Companies, Inc. and have been licensed for use by Fidelity Distributors Corporation.
Other third party marks appearing herein are the property of their respective owners.
All other marks appearing herein are registered or unregistered trademarks or service marks of FMR LLC or an affiliated company.
This report and the financial statements contained herein are submitted for the general information of the shareholders of the fund. This report is not authorized for distribution to prospective investors in the fund unless preceded or accompanied by an effective prospectus.
A fund files its complete schedule of portfolio holdings with the SEC for the first and third quarters of each fiscal year on Form N-Q. Forms N-Q are available on the SEC's web site at http://www.sec.gov. A fund's Forms N-Q may be reviewed and copied at the SEC's Public Reference Room in Washington, DC. Information regarding the operation of the SEC's Public Reference Room may be obtained by calling 1-800-SEC-0330. For a complete list of a fund's portfolio holdings, view the most recent holdings listing, semiannual report, or annual report on Fidelity's web site at http://www.fidelity.com or http://www.advisor.fidelity.com, as applicable.
NOT FDIC INSURED · MAY LOSE VALUE · NO BANK GUARANTEE
Neither the fund nor Fidelity Distributors Corporation is a bank.
Average annual total return reflects the change in the value of an investment, assuming reinvestment of the class' dividend income and capital gains (the profits earned upon the sale of securities that have grown in value, if any) and assuming a constant rate of performance each year. During periods of reimbursement by Fidelity, a fund's total return will be greater than it would be had the reimbursement not occurred. Performance numbers are net of all underlying fund operating expenses, but do not include any insurance charges imposed by your insurance company's separate account. If performance information included the effect of these additional charges, the total returns would have been lower. How a fund did yesterday is no guarantee of how it will do tomorrow.
Average Annual Total Returns
Periods ended December 31, 2008
Past 1 year
Life of fundA
VIP Consumer Staples - Initial Class
-21.35%
-7.27%
VIP Consumer Staples - Investor Class
-21.41%
-7.36%
A From April 24, 2007.
$10,000 Over Life of Fund
Let's say hypothetically that $10,000 was invested in VIP Consumer Staples Portfolio - Initial Class on April 24, 2007, when the fund started. The chart shows how the value of your investment would have changed, and also shows how the Standard & Poor's 500SM Index (S&P 500®) performed over the same period.
Comments from Robert Lee, Portfolio Manager of VIP Consumer Staples Portfolio
By year-end 2008, the vicious credit crisis sparked in the U.S. had spread like wildfire across the world's capital markets, stunting global growth, toppling commodity prices, changing the face of the global financial system, and chasing risk-averse investors toward the sidelines. The U.S. equity markets, as measured by the Dow Jones Industrial AverageSM and Standard & Poor's 500SM Index, fell hard as a result, declining 31.93% and 37.00%, respectively, while the technology-laden NASDAQ Composite® Index slid 40.03%. Foreign market stocks saw an even sharper decline, as illustrated by the 43.28% loss of the MSCI® EAFE® Index (Europe, Australasia, Far East), a gauge of developed stock markets outside the U.S. and Canada. A generally stronger U.S. dollar also held back returns for U.S. investors in foreign equities. Emerging-markets stocks - the global performance leader only a year ago - fell harder still, dropping 53.18%, as measured by the MSCI Emerging Markets Index. The only clear winners during the past year were assets backed by the U.S. government, as investors fled from risk. Thus, the Barclays Capital U.S. Treasury Bond Index climbed 13.74% for the year, while the Barclays Capital U.S. Aggregate Bond Index - a broader measure of the U.S. investment-grade bond universe - gained a more modest 5.24%. By contrast, high-yield bonds bore the brunt of investors' increasing wariness over risk, as expressed by the Merrill Lynch® U.S. High Yield Master II Constrained Index's drop of 26.11%. The emerging-markets bond category also felt the shock of investors' risk-averse sentiment, with the JPMorgan Emerging Markets Bond Index (EMBI) Global falling 10.91%. Meanwhile, the Citigroup® Non-U.S. Group of 7 Index - representing the debt performance of major global economies, excluding the United States - eked out a 1.69% gain.
During the past year, the fund significantly lagged the -16.38% return of its sector benchmark, the MSCI® US Investable Market Consumer Staples Index, but beat the S&P 500®. (For specific portfolio results, please refer to the performance section of this report.) A large part of the fund's underperformance of the MSCI index came from stocks with emerging-markets exposure, a theme I have been pursuing in the portfolio for some time. While I was correct on the business fundamentals - consumer staples spending continued to grow faster in emerging markets than in developed economies - - I was wrong on the direction of the equity market. In a dramatically slowing global economy, investors fled to the perceived safety of consumer staples companies doing business exclusively in developed nations. The stronger dollar also hurt the performance of foreign securities when translated back into dollars. On a sector level, the fund suffered from stock selection in brewers and in packaged foods and meats, and from a major underweighting in hypermarkets and supercenters. In the latter area, a below-market weighting in Wal-Mart was the key culprit. The stock proved very resilient as investors expected it to benefit from consumers turning to the discount giant for bargain prices. In the brewing industry, avoiding Anheuser-Busch for much of the period hurt results because its share price spiked on a successful takeover bid from Belgium-based Inbev, another fund detractor. Our shares in brewer SABMiller, eastern European soft drink distributor Coca-Cola Hellenic and cigarette maker British American Tobacco (BAT) all declined sharply, casualties of the stampede away from firms with emerging-markets exposure. On the positive side, contributors included stock selection in food retail and household products. In the latter industry, Kimberly-Clark and Procter & Gamble were key contributors due to timely ownership. Elsewhere, I bought Molson Coors Brewing at an attractive valuation, and the stock rose as the firm gained market share and executed a cost-saving joint venture with SABMiller. The fund's cash position also aided results.
The views expressed above reflect those of the portfolio manager(s) only through the end of the period as stated on the cover of this report and do not necessarily represent the views of Fidelity or any other person in the Fidelity organization. Any such views are subject to change at any time based upon market or other conditions and Fidelity disclaims any responsibility to update such views. These views may not be relied on as investment advice and, because investment decisions for a Fidelity fund are based on numerous factors, may not be relied on as an indication of trading intent on behalf of any Fidelity fund.
As a shareholder of the Fund, you incur two types of costs: (1) transaction costs, including redemption fees, and (2) ongoing costs, including management fees and other Fund expenses. This Example is intended to help you understand your ongoing costs (in dollars) of investing in the Fund and to compare these costs with the ongoing costs of investing in other mutual funds.
The Example is based on an investment of $1,000 invested at the beginning of the period and held for the entire period (July 1, 2008 to December 31, 2008).
Actual Expenses
The first line of the accompanying table for each class of the Fund provides information about actual account values and actual expenses. You may use the information in this line, together with the amount you invested, to estimate the expenses that you paid over the period. Simply divide your account value by $1,000.00 (for example, an $8,600 account value divided by $1,000.00 = 8.6), then multiply the result by the number in the first line for a class of the Fund under the heading entitled "Expenses Paid During Period" to estimate the expenses you paid on your account during this period. The estimate of expenses does not include any fees or other expenses of any variable annuity or variable life insurance product. If they were, the estimate of expenses you paid during the period would be higher, and your ending account value would be lower. In addition, the Fund, as a shareholder in the underlying Fidelity Central Funds, will indirectly bear its pro rata share of the fees and expenses incurred by the underlying Fidelity Central Funds. These fees and expenses are not included in the Fund's annualized expense ratio used to calculate the expense estimate in the table below.
Hypothetical Example for Comparison Purposes
The second line of the accompanying table for each class of the Fund provides information about hypothetical account values and hypothetical expenses based on a Class' actual expense ratio and an assumed rate of return of 5% per year before expenses, which is not the Class' actual return. The hypothetical account values and expenses may not be used to estimate the actual ending account balance or expenses you paid for the period. You may use this information to compare the ongoing costs of investing in the Fund and other funds. To do so, compare this 5% hypothetical example with the 5% hypothetical examples that appear in the shareholder reports of the other funds. The estimate of expenses does not include any fees or other expenses of any variable annuity or variable life insurance product. If they were, the estimate of expenses you paid during the period would be higher, and your ending account value would be lower. In addition, the Fund, as a shareholder in the underlying Fidelity Central Funds, will indirectly bear its pro rata share of the fees and expenses incurred by the underlying Fidelity Central Funds. These fees and expenses are not included in the Fund's annualized expense ratio used to calculate the expense estimate in the table below.
Please note that the expenses shown in the table are meant to highlight your ongoing costs only and do not reflect any transaction costs. Therefore, the second line of the table is useful in comparing ongoing costs only, and will not help you determine the relative total costs of owning different funds. In addition, if these transactional costs were included, your costs would have been higher.
Annualized Expense Ratio
Beginning Account Value July 1, 2008
Ending Account Value December 31, 2008
Expenses Paid During Period* July 1, 2008 to December 31, 2008
Initial Class
1.00%
Actual
$ 1,000.00
$ 870.60
$ 4.70
HypotheticalA
$ 1,000.00
$ 1,020.11
$ 5.08
Investor Class
1.08%
Actual
$ 1,000.00
$ 870.00
$ 5.08
HypotheticalA
$ 1,000.00
$ 1,019.71
$ 5.48
A 5% return per year before expenses
* Expenses are equal to each Class' annualized expense ratio, multiplied by the average account value over the period, multiplied by 184/366 (to reflect the one-half year period).
Annual Report
Investment Changes (Unaudited)
Top Ten Stocks as of December 31, 2008
% of fund's net assets
% of fund's net assets 6 months ago
Procter & Gamble Co.
14.8
15.4
The Coca-Cola Co.
10.1
10.1
PepsiCo, Inc.
8.3
8.9
Wal-Mart Stores, Inc.
5.9
1.3
CVS Caremark Corp.
5.6
6.1
British American Tobacco PLC sponsored ADR
4.0
3.7
Nestle SA (Reg.)
3.9
0.0
Colgate-Palmolive Co.
3.5
3.5
Avon Products, Inc.
3.0
3.2
Unilever NV (NY Shares)
2.9
2.5
62.0
Top Industries (% of fund's net assets)
As of December 31, 2008
Beverages
31.8%
Household Products
18.6%
Food & Staples Retailing
18.0%
Food Products
15.4%
Tobacco
8.5%
All Others*
7.7%
As of June 30, 2008
Beverages
35.1%
Household Products
19.4%
Food Products
15.3%
Food & Staples Retailing
15.1%
Tobacco
9.5%
All Others*
5.6%
* Includes short-term investments and net other assets.
Prior period industry classifications reflect the categories in place as of the date indicated and have not been adjusted to reflect current industry classifications.
Annual Report
Investments December 31, 2008
Showing Percentage of Net Assets
Common Stocks - 96.5%
Shares
Value
BEVERAGES - 31.8%
Brewers - 5.9%
Anadolu Efes Biracilik ve Malt Sanyii AS
5,700
$ 38,111
Anheuser-Busch InBev NV
26,225
611,921
Anheuser-Busch InBev NV (strip VVPR) (a)
12,200
71
Companhia de Bebidas das Americas (AmBev) (PN) sponsored ADR
2,675
118,529
Molson Coors Brewing Co. Class B
10,310
504,365
SABMiller PLC
6,180
105,335
1,378,332
Distillers & Vintners - 4.5%
Constellation Brands, Inc. Class A (sub. vtg.) (a)
33,250
524,353
Diageo PLC sponsored ADR
5,895
334,482
Pernod Ricard SA
2,330
173,913
Remy Cointreau SA
100
4,171
1,036,919
Soft Drinks - 21.4%
Coca-Cola Amatil Ltd.
6,284
41,190
Coca-Cola Enterprises, Inc.
14,600
175,638
Coca-Cola FEMSA SAB de CV sponsored ADR
2,570
111,821
Coca-Cola Hellenic Bottling Co. SA sponsored ADR
7,160
103,534
Coca-Cola Icecek AS
10,650
43,900
Cott Corp. (a)
49,400
62,527
Embotelladora Andina SA sponsored ADR
7,350
99,225
Fomento Economico Mexicano SA de CV sponsored ADR
1,785
53,782
PepsiCo, Inc.
35,000
1,916,950
The Coca-Cola Co.
51,950
2,351,777
4,960,344
TOTAL BEVERAGES
7,375,595
FOOD & STAPLES RETAILING - 18.0%
Drug Retail - 8.3%
CVS Caremark Corp.
45,390
1,304,509
Walgreen Co.
24,950
615,517
1,920,026
Food Distributors - 0.5%
Sysco Corp.
5,050
115,847
United Natural Foods, Inc. (a)
600
10,692
126,539
Food Retail - 3.3%
Kroger Co.
11,700
308,997
Safeway, Inc.
16,850
400,525
SUPERVALU, Inc.
4,300
62,780
772,302
Shares
Value
Hypermarkets & Super Centers - 5.9%
Wal-Mart Stores, Inc.
24,400
$ 1,367,864
TOTAL FOOD & STAPLES RETAILING
4,186,731
FOOD PRODUCTS - 15.4%
Agricultural Products - 3.3%
Archer Daniels Midland Co.
12,610
363,546
Bunge Ltd.
4,855
251,343
Corn Products International, Inc.
1,575
45,439
SLC Agricola SA
7,500
47,409
Viterra, Inc. (a)
8,200
64,026
771,763
Packaged Foods & Meats - 12.1%
Cadbury PLC sponsored ADR
1,559
55,610
Groupe Danone
2,670
162,087
Kraft Foods, Inc. Class A
18,400
494,040
Lindt & Spruengli AG
2
42,926
Nestle SA (Reg.)
22,902
904,794
Perdigao SA
3,100
40,974
PureCircle Ltd.
6,400
18,367
Ralcorp Holdings, Inc. (a)
1,200
70,080
Sadia SA ADR
8,300
40,670
Smithfield Foods, Inc. (a)
2,400
33,768
Tyson Foods, Inc. Class A
27,550
241,338
Unilever NV (NY Shares)
27,825
683,104
Wimm-Bill-Dann Foods OJSC sponsored ADR (a)
940
24,731
2,812,489
TOTAL FOOD PRODUCTS
3,584,252
HOUSEHOLD PRODUCTS - 18.6%
Household Products - 18.6%
Colgate-Palmolive Co.
11,935
818,025
Energizer Holdings, Inc. (a)
1,150
62,261
Kimberly-Clark Corp.
100
5,274
Procter & Gamble Co.
55,500
3,431,005
4,316,565
PERSONAL PRODUCTS - 3.4%
Personal Products - 3.4%
Avon Products, Inc.
28,550
686,057
Bare Escentuals, Inc. (a)
4,955
25,915
Herbalife Ltd.
2,680
58,102
Physicians Formula Holdings, Inc. (a)
9,133
25,481
795,555
PHARMACEUTICALS - 0.8%
Pharmaceuticals - 0.8%
Johnson & Johnson
2,900
173,507
TOBACCO - 8.5%
Tobacco - 8.5%
Altria Group, Inc.
20,550
309,483
Common Stocks - continued
Shares
Value
TOBACCO - CONTINUED
Tobacco - continued
British American Tobacco PLC sponsored ADR
17,720
$ 938,097
Lorillard, Inc.
2,025
114,109
Philip Morris International, Inc.
12,870
559,974
Souza Cruz Industria Comerico
2,550
50,159
1,971,822
TOTAL COMMON STOCKS
(Cost $25,774,624)
22,404,027
Money Market Funds - 4.1%
Fidelity Cash Central Fund, 1.06% (b) (Cost $962,489)
962,489
962,489
TOTAL INVESTMENT PORTFOLIO - 100.6%
(Cost $26,737,113)
23,366,516
NET OTHER ASSETS - (0.6)%
(142,783)
NET ASSETS - 100%
$ 23,223,733
Legend
(a) Non-income producing
(b) Affiliated fund that is available only to investment companies and other accounts managed by Fidelity Investments. The rate quoted is the annualized seven-day yield of the fund at period end. A complete unaudited listing of the fund's holdings as of its most recent quarter end is available upon request.
Affiliated Central Funds
Information regarding fiscal year to date income earned by the Fund from investments in Fidelity Central Funds is as follows:
Fund
Income earned
Fidelity Cash Central Fund
$ 16,478
Other Information
The following is a summary of the inputs used, as of December 31, 2008, involving the Fund's assets carried at value. The inputs or methodology used for valuing securities may not be an indication of the risk associated with investing in those securities. For more information on valuation inputs, and their aggregation into the levels used in the table below, please refer to the Security Valuation section in the accompanying Notes to Financial Statements.
Valuation Inputs at Reporting Date:
Description
Total
Level 1
Level 2
Level 3
Investments in Securities
$ 23,366,516
$ 21,163,199
$ 2,203,317
$ -
Distribution of investments by country of issue, as a percentage of total net assets, is as follows: (Unaudited)
United States of America
77.3%
United Kingdom
6.1%
Switzerland
4.1%
Netherlands
2.9%
Belgium
2.6%
France
1.5%
Brazil
1.3%
Bermuda
1.2%
Others (individually less than 1%)
3.0%
100.0%
Income Tax Information
At December 31, 2008, the fund had a capital loss carryforward of approximately $176,480 all of which will expire on December 31, 2016.
See accompanying notes which are an integral part of the financial statements.
B Total returns for periods of less than one year are not annualized.
C Total returns do not reflect charges attributable to your insurance company's separate account. Inclusion of these charges would reduce the total returns shown.
D Total returns would have been lower had certain expenses not been reduced during the periods shown.
E Calculated based on average shares outstanding during the period.
F Fees and expenses of the underlying Fidelity Central Funds are not included in the Fund's expense ratio. The Fund indirectly bears its proportionate share of the expenses of any underlying Fidelity Central Funds.
G Amount does not include the portfolio activity of any underlying Fidelity Central Funds.
H For the period April 24, 2007 (commencement of operations) to December 31, 2007.
I Expense ratios reflect operating expenses of the class. Expenses before reductions do not reflect amounts reimbursed by the investment adviser or reductions from brokerage service arrangements or other expense offset arrangements and do not represent the amount paid by the class during periods when reimbursements or reductions occur. Expense ratios before reductions for start-up periods may not be representative of longer-term operating periods. Expenses net of fee waivers reflect expenses after reimbursement by the investment adviser but prior to reductions from brokerage service arrangements or other expense offset arrangements. Expenses net of all reductions represent the net expenses paid by the class.
J Amount represents less than $.01 per share.
See accompanying notes which are an integral part of the financial statements.
VIP Consumer Staples Portfolio (the Fund) is a non-diversified fund of Variable Insurance Products Fund IV (the trust) and is authorized to issue an unlimited number of shares. The trust is registered under the Investment Company Act of 1940, as amended (the 1940 Act), as an open-end management investment company organized as a Massachusetts business trust. Shares of the Fund may only be purchased by insurance companies for the purpose of funding variable annuity or variable life insurance contracts. The Fund offers the following classes of shares: Initial Class shares and Investor Class shares. All classes have equal rights and voting privileges, except for matters affecting a single class. Investment income, realized and unrealized capital gains and losses, the common expenses of the Fund, and certain fund-level expense reductions, if any, are allocated on a pro rata basis to each class based on the relative net assets of each class to the total net assets of the Fund. Each class differs with respect to transfer agent fees incurred. Certain expense reductions also differ by class.
2. Investments in Fidelity Central Funds.
The Fund may invest in Fidelity Central Funds, which are open-end investment companies available only to other investment companies and accounts managed by Fidelity Management & Research Company (FMR) and its affiliates. The Fund's Schedule of Investments lists each of the Fidelity Central Funds held as of period end, if any, as an investment of the Fund, but does not include the underlying holdings of each Fidelity Central Fund. As an Investing Fund, the Fund indirectly bears its proportionate share of the expenses of the underlying Fidelity Central Funds.
The Money Market Central Funds seek preservation of capital and current income and are managed by Fidelity Investments Money Management, Inc. (FIMM), an affiliate of FMR.
A complete unaudited list of holdings for each Fidelity Central Fund is available upon request or at the SEC's web site at www.sec.gov. In addition, the financial statements of the Fidelity Central Funds, which are not covered by the Fund's Report of Independent Registered Public Accounting Firm, are available on the SEC's web site or upon request.
3. Significant Accounting Policies.
The financial statements have been prepared in conformity with accounting principles generally accepted in the United States of America, which require management to make certain estimates and assumptions at the date of the financial statements. Actual results could differ from those estimates. The following summarizes the significant accounting policies of the Fund:
Security Valuation. Investments are valued as of 4:00 p.m. Eastern time on the last calendar day of the period. Wherever possible, the Fund uses independent pricing services approved by the Board of Trustees to value its investments.
Equity securities, including restricted securities, for which market quotations are readily available, are valued at the last reported sale price or official closing price as reported by an independent pricing service on the primary market or exchange on which they are traded. In the event there were no sales during the day or closing prices are not available, securities are valued at the last quoted bid price. Investments in open-end mutual funds, including the Fidelity Central Funds, are valued at their closing net asset value each business day. Short-term securities with remaining maturities of sixty days or less for which quotations are not readily available are valued at amortized cost, which approximates value.
When current market prices or quotations are not readily available or reliable, valuations may be determined in good faith in accordance with procedures adopted by the Board of Trustees. Factors used in determining value may include significant market or security specific events, changes in interest rates and credit quality, and developments in foreign markets which are monitored by evaluating the performance of ADRs, futures contracts and exchange-traded funds. The frequency with which these procedures are used cannot be predicted and may be utilized to a significant extent. The value of securities used for net asset value (NAV) calculation under these procedures may differ from published prices for the same securities.
The Fund is subject to the provisions of Statement of Financial Accounting Standards No. 157, "Fair Value Measurements" (SFAS 157), effective with the beginning of the Fund's fiscal year. SFAS 157 establishes a hierarchy that prioritizes the inputs to valuation techniques giving the highest priority to readily available unadjusted quoted prices in active markets for identical assets (level 1 measurements) and the lowest priority to unobservable inputs (level 3 measurements) when market prices are not readily available or reliable. The three levels of the hierarchy under SFAS 157 are described below:
Level 1
Quoted prices in active markets for identical securities.
Level 2
Prices determined using other significant observable inputs. Observable inputs are inputs that other market participants may use in pricing a security. These may include quoted prices for similar securities, interest rates, prepayment speeds, credit risk and others.
Level 3
Prices determined using significant unobservable inputs. In situations where quoted prices or observable inputs are unavailable or deemed less relevant (for example, when there is little or no market activity for an investment at the end of the period), unobservable inputs may be used. Unobservable inputs reflect the Fund's own assumptions about the factors market participants would use in pricing an investment, and would be based on the best information available.
Annual Report
3. Significant Accounting Policies - continued
Security Valuation - continued
Changes in valuation techniques may result in transfers in or out of an investment's assigned level within the hierarchy.
The aggregate value by input level, as of December 31, 2008, for the Fund's investments is included at the end of the Fund's Schedule of Investments.
Foreign Currency. The Fund uses foreign currency contracts to facilitate transactions in foreign-denominated securities. Losses from these transactions may arise from changes in the value of the foreign currency or if the counterparties do not perform under the contracts' terms.
Foreign-denominated assets, including investment securities, and liabilities are translated into U.S. dollars at the exchange rate at period end. Purchases and sales of investment securities, income and dividends received and expenses denominated in foreign currencies are translated into U.S. dollars at the exchange rate in effect on the transaction date.
The effects of exchange rate fluctuations on investments are included with the net realized and unrealized gain (loss) on investment securities. Other foreign currency transactions resulting in realized and unrealized gain (loss) are disclosed separately.
Investment Transactions and Income. For financial reporting purposes, the Fund's investment holdings and NAV include trades executed through the end of the last business day of the period. The NAV per share for processing shareholder transactions is calculated as of the close of business of the New York Stock Exchange (NYSE), normally 4:00 p.m. Eastern time and includes trades executed through the end of the prior business day. Gains and losses on securities sold are determined on the basis of identified cost. Dividend income is recorded on the ex-dividend date, except for certain dividends from foreign securities where the ex-dividend date may have passed, which are recorded as soon as the Fund is informed of the ex-dividend date. Non-cash dividends included in dividend income, if any, are recorded at the fair market value of the securities received. Interest income and distributions from the Fidelity Central Funds are accrued as earned. Interest income includes coupon interest and amortization of premium and accretion of discount on debt securities. Investment income is recorded net of foreign taxes withheld where recovery of such taxes is uncertain.
Expenses. Most expenses of the trust can be directly attributed to a fund. Expenses which cannot be directly attributed are apportioned among each Fund in the trust. Expense estimates are accrued in the period to which they relate and adjustments are made when actual amounts are known.
Income Tax Information and Distributions to Shareholders. Each year, the Fund intends to qualify as a regulated investment company by distributing substantially all of its taxable income and realized gains under Subchapter M of the Internal Revenue Code and filing its U.S. federal tax return. As a result, no provision for income taxes is required. The Fund is subject to the provisions of FASB Interpretation No. 48, Accounting for Uncertainties in Income Taxes (FIN 48). FIN 48 sets forth a minimum threshold for financial statement recognition of the benefit of a tax position taken or expected to be taken in a tax return. There are no unrecognized tax benefits in the accompanying financial statements. A Fund's federal tax return is subject to examination by the Internal Revenue Service (IRS) for a period of three years. Foreign taxes are provided for based on the Fund's understanding of the tax rules and rates that exist in the foreign markets in which it invests.
Distributions are recorded on the ex-dividend date. Income dividends and capital gain distributions are declared separately for each class. Income and capital gain distributions are determined in accordance with income tax regulations, which may differ from generally accepted accounting principles.
Capital accounts within the financial statements are adjusted for permanent book-tax differences. These adjustments have no impact on net assets or the results of operations. Temporary book-tax differences will reverse in a subsequent period.
Book-tax differences are primarily due to foreign currency transactions, and losses deferred due to wash sales and excise tax regulations.
The tax-basis components of distributable earnings and the federal tax cost as of period end were as follows:
Unrealized appreciation
$ 568,019
Unrealized depreciation
(4,141,794)
Net unrealized appreciation (depreciation)
(3,573,775)
Capital loss carryforward
(176,480)
Cost for federal income tax purposes
$ 26,940,291
The tax character of distributions paid was as follows:
December 31, 2008
December 31, 2007
Ordinary Income
$ 286,028
$ 144,855
Trading (Redemption) Fees. Shares held less than 60 days are subject to a redemption fee equal to 1% of the proceeds of the redeemed shares. All redemption fees, including any estimated redemption fees paid by FMR, are retained by the Fund and accounted for as an addition to paid in capital.
Annual Report
Notes to Financial Statements - continued
4. Operating Policies.
Repurchase Agreements. FMR has received an Exemptive Order from the Securities and Exchange Commission (the SEC) which permits the Fund and other affiliated entities of FMR to transfer uninvested cash balances into joint trading accounts which are then invested in repurchase agreements. The Fund may also invest directly with institutions in repurchase agreements. Repurchase agreements are collateralized by government or non-government securities. Upon settlement date, collateral is held in segregated accounts with custodian banks and may be obtained in the event of a default of the counterparty. The Fund monitors, on a daily basis, the value of the collateral to ensure it is at least equal to the principal amount of the repurchase agreement (including accrued interest). In the event of a default by the counterparty, realization of the collateral proceeds could be delayed, during which time the value of the collateral may decline.
5. Purchases and Sales of Investments.
Purchases and sales of securities, other than short-term securities, aggregated $29,892,747 and $17,281,687, respectively.
6. Fees and Other Transactions with Affiliates.
Management Fee. FMR and its affiliates provide the Fund with investment management related services for which the Fund pays a monthly management fee. The management fee is the sum of an individual fund fee rate that is based on an annual rate of .30% of the Fund's average net assets and a group fee rate that averaged .26% during the period. The group fee rate is based upon the average net assets of all the mutual funds advised by FMR. The group fee rate decreases as assets under management increase and increases as assets under management decrease. For the period, the total annual management fee rate was .56% of the Fund's average net assets.
Transfer Agent Fees. Fidelity Investments Institutional Operations Company, Inc. (FIIOC), an affiliate of FMR, is the Fund's transfer, dividend disbursing, and shareholder servicing agent. FIIOC receives an asset-based fee with respect to each class. Each class (with the exception of Investor Class) pays a transfer agent fee, excluding out of pocket expenses, equal to an annual rate of .07% of average net assets. Investor Class pays a monthly asset-based transfer agent fee of .15% of average net assets. Prior to February 1, 2008, Investor Class paid a monthly asset based-based transfer agent fee of .18% of average net assets. The total transfer agent fees paid by each class to FIIOC, including out of pocket expenses, were as follows:
Initial Class
$ 9,723
Investor Class
19,322
$ 29,045
Accounting Fees. Fidelity Service Company, Inc. (FSC), an affiliate of FMR, maintains the Fund's accounting records. The fee is based on the level of average net assets for the month.
Brokerage Commissions. The Fund placed a portion of its portfolio transactions with brokerage firms which are affiliates of the investment adviser. The commissions paid to these affiliated firms were $1,080 for the period.
7. Committed Line of Credit.
The Fund participates with other funds managed by FMR in a $4.2 billion credit facility (the "line of credit") to be utilized for temporary or emergency purposes to fund shareholder redemptions or for other short-term liquidity purposes. The Fund has agreed to pay commitment fees on its pro rata portion of the line of credit, which amounted to $24 and is reflected in Miscellaneous Expense on the Statement of Operations. During the period, there were no borrowings on this line of credit.
8. Expense Reductions.
FMR voluntarily agreed to reimburse each class to the extent annual operating expenses exceeded certain levels of average net assets as noted in the table below. Some expenses, for example interest expense, including commitment fees, are excluded from this reimbursement.
The following classes were in reimbursement during the period:
Expense Limitations
Reimbursement from Adviser
Initial Class
1.00%
$ 11,342
Investor Class
1.15%-1.08%*
14,103
$ 25,445
* Expense limitation in effect at period end.
Annual Report
8. Expense Reductions - continued
Effective February 1, 2008 the expense limitations changed to 1.08% for Investor Class.
Many of the brokers with whom FMR places trades on behalf of the Fund provided services to the Fund in addition to trade execution. These services included payments of certain expenses on behalf of the Fund totaling $828 for the period.
9. Other.
The Fund's organizational documents provide former and current trustees and officers with a limited indemnification against liabilities arising in connection with the performance of their duties to the Fund. In the normal course of business, the Fund may also enter into contracts that provide general indemnifications. The Fund's maximum exposure under these arrangements is unknown as this would be dependent on future claims that may be made against the Fund. The risk of material loss from such claims is considered remote.
At the end of the period FMR or its affiliates were the owners of record of 100% of the total outstanding shares of the Fund.
During the period, Lehman Brothers Holdings, Inc. and certain of its affiliates (LBHI) sought protection under the insolvency laws of their jurisdictions of organization, including the United States, the United Kingdom and Japan. At the time LBHI's insolvency proceedings were instituted, the Fund had outstanding securities trades with counterparties affiliated with LBHI. As a result of the insolvency proceedings, LBHI is unable to fulfill its commitments and, in certain cases, the Fund may have terminated its trades and related agreements with the relevant entities and, where appropriate, is in the process of initiating claims for damages. FMR believes that the financial impact to the Fund relating to the terminated trades and agreements is immaterial.
10. Distributions to Shareholders.
Distributions to shareholders of each class were as follows:
Years ended December 31,
2008
2007A
From net investment income
Initial Class
$ 121,735
$ 30,241
Investor Class
164,293
24,881
Total
$ 286,028
$ 55,122
From net realized gain
Initial Class
-
49,230
Investor Class
-
40,503
Total
$ -
$ 89,733
AFor the period April 24, 2007 (commencement of operations) to December 31, 2007.
11. Share Transactions.
Transactions for each class of shares were as follows:
Shares
Dollars
Years ended December 31,
2008
2007 A
2008
2007 A
Initial Class
Shares sold
1,195,732
737,178
$ 11,605,548
$ 7,668,501
Reinvestment of distributions
14,597
7,108
121,735
79,471
Shares redeemed
(800,693)
(25,448)
(7,779,005)
(270,975)
Net increase (decrease)
409,636
718,838
$ 3,948,278
$ 7,476,997
Investor Class
Shares sold
1,623,656
637,642
$ 15,815,233
$ 6,632,924
Reinvestment of distributions
19,723
5,854
164,293
65,384
Shares redeemed
(703,808)
(9,503)
(6,932,310)
(99,848)
Net increase (decrease)
939,571
633,993
$ 9,047,216
$ 6,598,460
AFor the period April 24, 2007 (commencement of operations) to December 31, 2007.
Annual Report
Reportof Independent Registered Public Accounting Firm
To the Trustees of Variable Insurance Products Fund IV and the Shareholders of VIP Consumer Staples Portfolio:
In our opinion, the accompanying statement of assets and liabilities, including the schedule of investments, and the related statements of operations and of changes in net assets and the financial highlights present fairly, in all material respects, the financial position of VIP Consumer Staples Portfolio (a fund of Variable Insurance Products Fund IV) at December 31, 2008, the results of its operations for the year then ended, the changes in its net assets for each of the periods indicated and the financial highlights for each of the periods indicated, in conformity with accounting principles generally accepted in the United States of America. These financial statements and financial highlights (hereafter referred to as "financial statements") are the responsibility of the VIP Consumer Staples Portfolio's management. Our responsibility is to express an opinion on these financial statements based on our audits. We conducted our audits of these financial statements in accordance with the standards of the Public Company Accounting Oversight Board (United States). Those standards require that we plan and perform the audit to obtain reasonable assurance about whether the financial statements are free of material misstatement. An audit includes examining, on a test basis, evidence supporting the amounts and disclosures in the financial statements, assessing the accounting principles used and significant estimates made by management, and evaluating the overall financial statement presentation. We believe that our audits, which included confirmation of securities at December 31, 2008 by correspondence with the custodian and brokers, provide a reasonable basis for our opinion.
The Trustees, Member of the Advisory Board, and executive officers of the trust and fund, as applicable, are listed below. The Board of Trustees governs the fund and is responsible for protecting the interests of shareholders. The Trustees are experienced executives who meet periodically throughout the year to oversee the fund's activities, review contractual arrangements with companies that provide services to the fund, and review the fund's performance. Except for Edward C. Johnson 3d and James C. Curvey, each of the Trustees oversees 222 funds advised by FMR or an affiliate. Messrs. Johnson and Curvey oversee 381 funds advised by FMR or an affiliate.
The Trustees hold office without limit in time except that (a) any Trustee may resign; (b) any Trustee may be removed by written instrument, signed by at least two-thirds of the number of Trustees prior to such removal; (c) any Trustee who requests to be retired or who has become incapacitated by illness or injury may be retired by written instrument signed by a majority of the other Trustees; and (d) any Trustee may be removed at any special meeting of shareholders by a two-thirds vote of the outstanding voting securities of the trust. Each Trustee who is not an interested person (as defined in the 1940 Act) (Independent Trustee), shall retire not later than the last day of the calendar year in which his or her 72nd birthday occurs. The Independent Trustees may waive this mandatory retirement age policy with respect to individual Trustees. The executive officers and Advisory Board Member hold office without limit in time, except that any officer and Advisory Board Member may resign or may be removed by a vote of a majority of the Trustees at any regular meeting or any special meeting of the Trustees. Except as indicated, each individual has held the office shown or other offices in the same company for the past five years.
The fund's Statement of Additional Information (SAI) includes more information about the Trustees. To request a free copy, call Fidelity at 1-877-0098.
Interested Trustees*:
Correspondence intended for each Trustee who is an interested person may be sent to Fidelity Investments, 82 Devonshire Street, Boston, Massachusetts 02109.
Name, Age; Principal Occupation
Edward C. Johnson 3d (78)
Year of Election or Appointment: 1983
Mr. Johnson is Chairman of the Board of Trustees. Mr. Johnson serves as Chief Executive Officer, Chairman, and a Director of FMR LLC; Chairman and a Director of FMR; Chairman and a Director of Fidelity Research & Analysis Company (FRAC); Chairman and a Director of Fidelity Investments Money Management, Inc.; and Chairman and a Director of FMR Co., Inc. In addition, Mr. Johnson serves as Chairman and Director of FIL Limited. Previously, Mr. Johnson served as President of FMR LLC (2006-2007).
James C. Curvey (73)
Year of Election or Appointment: 2007
Mr. Curvey also serves as Trustee (2007-present) of other investment companies advised by FMR. Mr. Curvey is a Director of FMR and FMR Co., Inc. (2007-present). Mr. Curvey is also Vice Chairman (2006-present) and Director of FMR LLC. In addition, Mr. Curvey serves as an Overseer for the Boston Symphony Orchestra and a member of the Trustees of Villanova University.
* Trustees have been determined to be "Interested Trustees" by virtue of, among other things, their affiliation with the trust or various entities under common control with FMR. FMR Corp. merged with and into FMR LLC on October 1, 2007. Any references to FMR LLC for prior periods are deemed to be references to the prior entity.
Independent Trustees:
Correspondence intended for each Independent Trustee (that is, the Trustees other than the Interested Trustees) may be sent to Fidelity Investments, P.O. Box 55235, Boston, Massachusetts 02205-5235.
Name, Age; Principal Occupation
Dennis J. Dirks (60)
Year of Election or Appointment: 2005
Prior to his retirement in May 2003, Mr. Dirks was Chief Operating Officer and a member of the Board of The Depository Trust & Clearing Corporation (DTCC) (1999-2003). He also served as President, Chief Operating Officer, and Board member of The Depository Trust Company (DTC) (1999-2003) and President and Board member of the National Securities Clearing Corporation (NSCC) (1999-2003). In addition, Mr. Dirks served as Chief Executive Officer and Board member of the Government Securities Clearing Corporation (2001-2003), Chief Executive Officer and Board member of the Mortgage-Backed Securities Clearing Corporation (2001-2003), as a Trustee and a member of the Finance Committee of Manhattan College (2005-2008), and as a Trustee and a member of the Finance Committee of AHRC of Nassau County (2006-2008). Currently, Mr. Dirks serves as a member of the Board of Directors for The Brookville Center for Children's Services, Inc. (2009-present).
Alan J. Lacy (55)
Year of Election or Appointment:2008
Mr. Lacy serves as Senior Adviser (2007-present) of Oak Hill Capital Partners, L.P. (a private equity firm). Mr. Lacy also served as Chief Executive Officer (2000-2005) and Vice Chairman (2005-2006) of Sears Holdings Corporation and Sears, Roebuck and Co. (retail). In addition, Mr. Lacy serves as a member of the Board of Directors of The Western Union Company (global money transfer, 2006-present) and Bristol-Myers Squibb (global pharmaceuticals, 2007-present). Mr. Lacy is a Trustee of the National Parks Conservation Association and The Field Museum of Natural History.
Ned C. Lautenbach (64)
Year of Election or Appointment: 2000
Mr. Lautenbach is Chairman of the Independent Trustees (2006-present). Mr. Lautenbach is an Advisory Partner of Clayton, Dubilier & Rice, Inc. (private equity investment firm). Previously, Mr. Lautenbach was with the International Business Machines Corporation (IBM) from 1968 until his retirement in 1998. Mr. Lautenbach serves as a Director of Eaton Corporation (diversified industrial) as well as the Philharmonic Center for the Arts in Naples, Florida. He also is a member of the Board of Trustees of Fairfield University (2005-present), as well as a member of the Council on Foreign Relations. Previously, Mr. Lautenbach served as a Director of Sony Corporation (2006-2007).
Joseph Mauriello (64)
Year of Election or Appointment: 2008
Prior to his retirement in January 2006, Mr. Mauriello served in numerous senior management positions including Deputy Chairman and Chief Operating Officer (2004-2005), and Vice Chairman of Financial Services (2002-2004) of KPMG LLP US (professional services firm, 1965-2005). Mr. Mauriello currently serves as a member of the Board of Directors of XL Capital Ltd. (global insurance and re-insurance company, 2006-present) and of Arcadia Resources Inc. (health care services and products, 2007-present). He also served as a Director of the Hamilton Funds of the Bank of New York (2006-2007).
Cornelia M. Small (64)
Year of Election or Appointment: 2005
Ms. Small is a member of the Investment Committee, and Chair (2008-present) and a member of the Board of Trustees of Smith College. Ms. Small also serves on the Investment Committee of the Berkshire Taconic Community Foundation (2008-present). Previously, Ms. Small served as Chairperson of the Investment Committee (2002-2008) of Smith College and as Co-Chair (2000-2003) of the Annual Fund for the Fletcher School of Law and Diplomacy. In addition, she served as Chief Investment Officer, Director of Global Equity Investments, and a member of the Board of Directors of Scudder, Stevens & Clark and Scudder Kemper Investments.
William S. Stavropoulos (69)
Year of Election or Appointment: 2001
Mr. Stavropoulos is Chairman Emeritus of the Board of Directors of The Dow Chemical Company, where he previously served in numerous senior management positions, including President (1993-2000; 2002-2003), CEO (1995-2000; 2002-2004), Chairman of the Executive Committee (2000-2006), and as a member of the Board of Directors (1990-2006). Currently, he is a Director of Teradata Corporation (data warehousing and technology solutions, 2008-present), Chemical Financial Corporation, Maersk Inc. (industrial conglomerate), Tyco International, Inc. (multinational manufacturing and services, 2007-present), and a member of the Advisory Board for Metalmark Capital (private equity investment firm, 2005-present). He is a special advisor to Clayton, Dubilier & Rice, Inc. (private equity investment). In addition, Mr. Stavropoulos is a member of the University of Notre Dame Advisory Council for the College of Science.
David M. Thomas (59)
Year of Election or Appointment: 2008
Previously, Mr. Thomas served as Executive Chairman (2005-2006) and Chairman and Chief Executive Officer (2000-2005) of IMS Health, Inc. (pharmaceutical and healthcare information solutions). In addition, Mr. Thomas serves as a member of the Board of Directors of Fortune Brands, Inc. (consumer products holding company), and Interpublic Group of Companies, Inc. (marketing communication, 2004-present).
Michael E. Wiley (58)
Year of Election or Appointment: 2008
Mr. Wiley also serves as a member of the Board of Trustees of the University of Tulsa (2000-2006; 2007-present). He serves as a Director of Tesoro Corporation (independent oil refiner and marketer, 2005-present), and a Director of Bill Barrett Corporation (exploration and production company, 2005-present). In addition, he also serves as a Director of Post Oak Bank (privately-held bank, 2004-present). Previously, Mr. Wiley served as a Sr. Energy Advisor of Katzenbach Partners, LLC (consulting firm, 2006-2007), as an Advisory Director of Riverstone Holdings (private investment firm), Chairman, President, and CEO of Baker Hughes, Inc. (oilfield services company, 2000-2004), and as Director of Spinnaker Exploration Company (exploration and production company, 2001-2005).
Annual Report
Trustees and Officers - continued
Advisory Board Member and Executive Officers**:
Correspondence intended for each executive officer and Peter S. Lynch may be sent to Fidelity Investments, 82 Devonshire Street, Boston, Massachusetts 02109.
Name, Age; Principal Occupation
Peter S. Lynch (64)
Year of Election or Appointment: 2003
Member of the Advisory Board of Fidelity's Equity and High Income Funds. Mr. Lynch is Vice Chairman and a Director of FMR, and Vice Chairman (2001-present) and a Director of FMR Co., Inc. Previously, Mr. Lynch served as a Trustee of the Fidelity funds (1990-2003). In addition, he serves as a Trustee of Boston College and as the Chairman of the Inner-City Scholarship Fund. Previously, Mr. Lynch served on the Special Olympics International Board of Directors (1997-2006).
Kenneth B. Robins (39)
Year of Election or Appointment: 2008
President and Treasurer of Fidelity's Equity and High Income Funds. Mr. Robins is an employee of Fidelity Investments (2004- present). Before joining Fidelity Investments, Mr. Robins worked at KPMG LLP, where he was a partner in KPMG's department of professional practice (2002-2004).
Brian B. Hogan (44)
Year of Election or Appointment: 2007
Vice President of Sector Funds. Mr. Hogan also serves as Senior Vice President, Equity Research of FMR. Previously, Mr. Hogan served as a portfolio manager.
Scott C. Goebel (40)
Year of Election or Appointment: 2008
Secretary and Chief Legal Officer (CLO) of the Fidelity funds. Mr. Goebel also serves as General Counsel, Secretary, and Senior Vice President of FMR (2008-present); Deputy General Counsel of FMR LLC; Chief Legal Secretary of Fidelity Management & Research (Hong Kong) Limited (2008-present) and Assistant Secretary of Fidelity Management & Research (Japan) Inc. (2008- present). Previously, Mr. Goebel served as Assistant Secretary of the Funds (2007-2008) and as Vice President and Secretary of Fidelity Distributors Corporation (FDC) (2005-2007).
John B. McGinty, Jr. (46)
Year of Election or Appointment: 2008
Assistant Secretary of Fidelity's Equity and High Income Funds. Mr. McGinty is an employee of Fidelity Investments (2004-present). Mr. McGinty also serves as Senior Vice President, Secretary, and Chief Legal Officer of FDC (2007-present). Before joining Fidelity Investments, Mr. McGinty practiced law at Ropes & Gray, LLP.
Holly C. Laurent (54)
Year of Election or Appointment: 2008
Anti-Money Laundering (AML) Officer of the Fidelity funds. Ms. Laurent is an employee of Fidelity Investments. Previously, Ms. Laurent was Senior Vice President and Head of Legal for Fidelity Business Services India Pvt. Ltd. (2006-2008), Senior Vice President, Deputy General Counsel and Group Head for FMR LLC (2005-2006).
Christine Reynolds (50)
Year of Election or Appointment: 2008
Chief Financial Officer of the Fidelity funds. Ms. Reynolds became President of Fidelity Pricing and Cash Management Services (FPCMS) in August 2008. She served as Chief Operating Officer of FPCMS from 2007 through July 2008. Previously, Ms. Reynolds served as President, Treasurer, and Anti-Money Laundering officer of the Fidelity funds (2004-2007). Before joining Fidelity Investments, Ms. Reynolds worked at PricewaterhouseCoopers LLP (PwC) (1980-2002), where she was an audit partner with PwC's investment management practice.
Kenneth A. Rathgeber (61)
Year of Election or Appointment: 2004
Chief Compliance Officer of Fidelity's Equity and High Income Funds. Mr. Rathgeber is Chief Compliance Officer of Fidelity Management & Research (Hong Kong) Limited (2008-present), Fidelity Management & Research (Japan) Inc. (2008-present), FMR (2005-present), FMR Co., Inc. (2005-present), Fidelity Management & Research (U.K.) Inc. (2005-present), Fidelity Research & Analysis Company (2005-present), Fidelity Investments Money Management, Inc. (2005-present), and Strategic Advisers, Inc. (2005-present).
Bryan A. Mehrmann (47)
Year of Election or Appointment: 2005
Deputy Treasurer of the Fidelity funds. Mr. Mehrmann is an employee of Fidelity Investments. Previously, Mr. Mehrmann served as Vice President of Fidelity Investments Institutional Services Group (FIIS)/Fidelity Investments Institutional Operations Company, Inc. (FIIOC) Client Services (1998-2004).
Adrien E. Deberghes (41)
Year of Election or Appointment: 2008
Deputy Treasurer of Fidelity's Equity and High Income Funds. Mr. Deberghes is an employee of Fidelity Investments (2008-present). Previously, Mr. Deberghes served as Senior Vice President of Mutual Fund Administration at State Street Corporation (2007-2008), Senior Director of Mutual Fund Administration at Investors Bank & Trust (2005-2007), and Director of Finance for Dunkin' Brands (2000-2005).
Robert G. Byrnes (42)
Year of Election or Appointment: 2005
Assistant Treasurer of the Fidelity funds. Mr. Byrnes is an employee of Fidelity Investments (2005-present). Previously, Mr. Byrnes served as Vice President of Fidelity Pricing and Cash Management Services (FPCMS) (2003-2005). Before joining Fidelity Investments, Mr. Byrnes worked at Deutsche Asset Management where he served as Vice President of the Investment Operations Group (2000-2003).
Paul M. Murphy (61)
Year of Election or Appointment: 2007
Assistant Treasurer of the Fidelity funds. Mr. Murphy is an employee of Fidelity Investments (2007-present). Previously, Mr. Murphy served as Chief Financial Officer of the Fidelity Funds (2005-2006), Vice President and Associate General Counsel of FMR (2007), and Senior Vice President of Fidelity Pricing and Cash Management Services (FPCMS) (1994-2007).
Gary W. Ryan (50)
Year of Election or Appointment: 2005
Assistant Treasurer of the Fidelity funds. Mr. Ryan is an employee of Fidelity Investments. Previously, Mr. Ryan served as Vice President of Fund Reporting in Fidelity Pricing and Cash Management Services (FPCMS) (1999-2005).
** FMR Corp. merged with and into FMR LLC on October 1, 2007. Any references to FMR LLC for prior periods are deemed to be references to the prior entity.
Initial Class and Investor Class designates 100% of the dividends distributed in December 2008, respectively during the fiscal year as qualifying for the dividends-received deduction for corporate shareholders.
The fund will notify shareholders in January 2009 of amounts for use in preparing 2008 income tax returns.
A special meeting of the fund's shareholders was held on May 14, 2008. The results of votes taken among shareholders on the proposals before them are reported below. Each vote reported represents one dollar of net asset value held on the record date for the meeting.
PROPOSAL 1
To elect a Board of Trustees.A
# of Votes
% of Votes
James C. Curvey
Affirmative
82,890,712.47
95.991
Withheld
3,461,988.43
4.009
TOTAL
86,352,700.90
100.000
Dennis J. Dirks
Affirmative
82,970,372.75
96.083
Withheld
3,382,328.15
3.917
TOTAL
86,352,700.90
100.000
Edward C. Johnson 3d
Affirmative
82,689,162.78
95.757
Withheld
3,663,538.12
4.243
TOTAL
86,352,700.90
100.000
Alan J. Lacy
Affirmative
83,041,222.35
96.165
Withheld
3,311,478.55
3.835
TOTAL
86,352,700.90
100.000
Ned C. Lautenbach
Affirmative
82,983,853.72
96.099
Withheld
3,368,847.18
3.901
TOTAL
86,352,700.90
100.000
Joseph Mauriello
Affirmative
83,138,122.14
96.277
Withheld
3,214,578.76
3.723
TOTAL
86,352,700.90
100.000
Cornelia M. Small
Affirmative
83,095,438.06
96.228
Withheld
3,257,262.84
3.772
TOTAL
86,352,700.90
100.000
William S. Stavropoulos
Affirmative
82,929,113.95
96.035
Withheld
3,423,586.95
3.965
TOTAL
86,352,700.90
100.000
David M. Thomas
Affirmative
83,095,487.87
96.228
Withheld
3,257,213.03
3.772
TOTAL
86,352,700.90
100.000
Michael E. Wiley
Affirmative
83,048,523.75
96.174
Withheld
3,304,177.15
3.826
TOTAL
86,352,700.90
100.000
PROPOSAL 2
To amend the Declaration of Trust to reduce the required quorum for future shareholder meetings.A
# of Votes
% of Votes
Affirmative
74,393,635.26
86.151
Against
8,745,543.59
10.128
Abstain
3,213,522.05
3.721
TOTAL
86,352,700.90
100.000
ADenotes trust-wide proposal and voting results.
Annual Report
BoardApproval of Investment Advisory Contracts and Management Fees
VIP Consumer Staples Portfolio
Each year, typically in July, the Board of Trustees, including the Independent Trustees (together, the Board), votes on the renewal of the management contract and sub-advisory agreements (together, the Advisory Contracts) for the fund. The Board, assisted by the advice of fund counsel and Independent Trustees' counsel, requests and considers a broad range of information throughout the year.
The Board meets regularly and, acting directly and through its separate committees, requests and receives information concerning, and considers at each of its meetings factors that are relevant to, its annual consideration of the renewal of the fund's Advisory Contracts, including the services and support provided to the fund and its shareholders. At the time of the renewal, the Board had 12 standing committees, each composed of Independent Trustees with varying backgrounds, to which the Board has assigned specific subject matter responsibilities in order to enhance effective decision-making by the Board. Each committee has a written charter outlining the structure and purposes of the committee. The Board also meets as needed to consider matters specifically related to the Board's annual consideration of the renewal of Advisory Contracts.
At its July 2008 meeting, the Board of Trustees, including the Independent Trustees, unanimously determined to renew the fund's Advisory Contracts. In reaching its determination, the Board considered all factors it believed relevant, including (i) the nature, extent, and quality of the services to be provided to the fund and its shareholders (including the investment performance of the fund); (ii) the competitiveness of the fund's management fee and total expenses; (iii) the total costs of the services to be provided by and the profits to be realized by Fidelity from its relationship with the fund; (iv) the extent to which economies of scale would be realized as the fund grows; and (v) whether fee levels reflect these economies of scale, if any, for the benefit of fund shareholders. The Board also approved amendments to the fund's agreements with foreign sub-advisers to clarify that each sub-adviser provides services as an independent contractor, as well as additional amendments to the fund's agreement with Fidelity Management & Research (U.K.) Inc. The Board further approved agreements with foreign sub-advisers Fidelity Management & Research (Japan) Inc. and Fidelity Management & Research (Hong Kong) Limited.
In considering whether to renew the Advisory Contracts for the fund, the Board ultimately reached a determination, with the assistance of fund counsel and Independent Trustees' counsel and through the exercise of its business judgment, that the renewal of the Advisory Contracts and the compensation to be received by Fidelity under the management contract is consistent with Fidelity's fiduciary duty under applicable law. The Board's decision to renew the Advisory Contracts was not based on any single factor noted above, but rather was based on a comprehensive consideration of all the information provided to the Board at its meetings throughout the year. The Board, in reaching its determination to renew the Advisory Contracts, is aware that shareholders in the fund have a broad range of investment choices available to them, including a wide choice among mutual funds offered by competitors to Fidelity, and that the fund's shareholders, with the opportunity to review and weigh the disclosure provided by the fund in its prospectus and other public disclosures, have chosen to invest in this fund, managed by Fidelity.
Nature, Extent, and Quality of Services Provided. The Board considered staffing within the investment adviser, FMR, and the sub-advisers (together, the Investment Advisers), including the backgrounds of the fund's investment personnel and the fund's investment objective and discipline. The Independent Trustees also had discussions with senior management of Fidelity's investment operations and investment groups. The Board considered the structure of the portfolio manager compensation program and whether this structure provides appropriate incentives.
Resources Dedicated to Investment Management and Support Services. The Board reviewed the size, education, and experience of the Investment Advisers' investment staff, their use of technology, and the Investment Advisers' approach to recruiting, training, and retaining portfolio managers and other research, advisory, and management personnel. The Board noted that Fidelity's analysts have access to a variety of technological tools that enable them to perform both fundamental and quantitative analysis and to specialize in various disciplines. The Board considered Fidelity's extensive global research capabilities that enable the Investment Advisers to aggregate data from various sources in an effort to produce positive investment results. The Board also considered that Fidelity's portfolio managers and analysts have access to daily portfolio attribution that allows for monitoring of a fund's portfolio, as well as an electronic communication system that provides immediate real-time access to research concerning issuers and credit enhancers.
Shareholder and Administrative Services. The Board considered (i) the nature, extent, quality, and cost of advisory, administrative, distribution, and shareholder services performed by the Investment Advisers and their affiliates under the Advisory Contracts and under separate agreements covering transfer agency, pricing and bookkeeping, and securities lending services for the fund; (ii) the nature and extent of the Investment Advisers' supervision of third party service providers, principally custodians and subcustodians; and (iii) the resources devoted to, and the record of compliance with, the fund's compliance policies and procedures. The Board also reviewed the allocation of fund brokerage, including allocations to brokers affiliated with the Investment Advisers, the use of brokerage commissions to pay fund expenses, and the use of "soft" commission dollars to pay for research services. The Board further considered that Fidelity voluntarily pays for market data out of its own resources.
The Board noted that the growth of fund assets across the complex allows Fidelity to reinvest in the development of services designed to enhance the value or convenience of the Fidelity funds as investment vehicles. These services include 24-hour access to account information and market information through phone representatives and over the Internet, and investor education materials and asset allocation tools.
Investment in a Large Fund Family. The Board considered the benefits to shareholders of investing in a Fidelity fund, including the benefits of investing in a fund that is part of a large family of funds offering a variety of investment disciplines and providing for a large variety of mutual fund investor services. The Board noted that Fidelity has taken a number of actions over the previous year that benefited particular funds, including (i) dedicating additional resources to investment research and to restructure the investment research teams; (ii) contractually agreeing to reduce the management fees on Fidelity's Institutional Money Market Funds and launching Class IV and Institutional Class of certain of these funds; (iii) reducing the transfer agent fees for the Fidelity Select Portfolios and Investor Class of the VIP funds; and (iv) launching Class K of 29 equity funds as a lower-fee class available to certain employer-sponsored retirement plans.
Annual Report
Investment Performance. The Board considered whether the fund has operated within its investment objective, as well as its record of compliance with its investment restrictions. The Board noted that it is not possible to evaluate performance in any comprehensive fashion because the fund had been in operation for less than one calendar year. Once the fund has been in operation for at least one calendar year, the Board will review the fund's absolute investment performance for each class, as well as the fund's relative investment performance for each class measured against a third-party-sponsored index that reflects the market sector in which the fund invests.
The Board considered that FMR has taken steps to refocus and strengthen equity research, equity portfolio management, and compliance.
Based on its review, and giving particular weight to the nature and quality of the resources dedicated by the Investment Advisers to maintain and improve relative performance, the Board concluded that the nature, extent, and quality of the services provided to the fund will benefit the fund's shareholders, particularly in light of the Board's view that the fund's shareholders benefit from investing in a fund that is part of a large family of funds offering a variety of investment disciplines and services.
Competitiveness of Management Fee and Total Fund Expenses. The Board considered the fund's management fee and total expenses compared to "mapped groups" of competitive funds and classes. Fidelity creates "mapped groups" by combining similar Lipper investment objective categories that have comparable management fee characteristics. Combining Lipper investment objective categories aids the Board's management fee and total expense comparisons by broadening the competitive group used for comparison and by reducing the number of universes to which various Fidelity funds are compared. The Board also considered supplemental information about how the fund's management fee and total expenses ranked relative to groups based on Lipper classifications, which take into account a fund's market capitalization and style.
The Board considered two proprietary management fee comparisons for the period of the fund's operations shown in the chart below. The group of Lipper funds used by the Board for management fee comparisons is referred to below as the "Total Mapped Group." The Total Mapped Group comparison focuses on a fund's standing relative to the total universe of comparable funds available to investors, in terms of gross management fees before expense reimbursements or caps. "TMG %" represents the percentage of funds in the Total Mapped Group that had management fees that were lower than the fund's. For example, a TMG % of 4% means that 96% of the funds in the Total Mapped Group had higher management fees than the fund. The "Asset-Size Peer Group" (ASPG) comparison focuses on a fund's standing relative to non-Fidelity funds similar in size to the fund within the Total Mapped Group. The ASPG represents at least 15% of the funds in the Total Mapped Group with comparable asset size and management fee characteristics, subject to a minimum of 50 funds (or all funds in the Total Mapped Group if fewer than 50). Additional information, such as the ASPG quartile in which the fund's management fee ranked, is also included in the chart and considered by the Board.
VIP Consumer Staples Portfolio
The Board noted that the fund's management fee ranked below the median of its Total Mapped Group and below the median of its ASPG for the period.
Based on its review, the Board concluded that the fund's management fee was fair and reasonable in light of the services that the fund receives and the other factors considered.
In its review of each class's total expenses, the Board considered the fund's management fee as well as other fund or class expenses, as applicable, such as transfer agent fees, pricing and bookkeeping fees, and custodial, legal, and audit fees. The Board also noted the effects of any waivers and reimbursements on fees and expenses. As part of its review, the Board also considered current and historical total expenses of each class of the fund compared to competitive fund median expenses. Each class of the fund is compared to those funds and classes in the Total Mapped Group (used by the Board for management fee comparisons) that have a similar sales load structure.
Annual Report
Board Approval of Investment Advisory Contracts and Management Fees - continued
The Board noted that the total expenses of Initial Class ranked below its competitive median for the period, and the total expenses of Investor Class ranked above its competitive median for the period. The Board considered that the total expenses of Investor Class were above the median primarily due to its higher transfer agent fee. The Board noted that the fund offers multiple classes and that the multiple structures are intended to offer pricing options for the intermediary market. The Board also noted that the total expenses of the classes vary primarily due to differences in transfer agent fees.
In its review of total expenses, the Board also considered Fidelity fee structures and other information on clients that FMR and its affiliates service in other competitive markets, such as other mutual funds advised or subadvised by FMR or its affiliates, pension plan clients, and other institutional clients.
Based on its review, the Board concluded that the total expenses of each class of the fund were reasonable, although in one case above the median of the universe presented for comparison, in light of the services that the fund and its shareholders receive and the other factors considered.
Costs of the Services and Profitability. The Board considered the revenues earned and the expenses incurred by Fidelity in conducting the business of developing, marketing, distributing, managing, administering and servicing the fund and its shareholders. The Board also considered the level of Fidelity's profits in respect of all the Fidelity funds.
On an annual basis, FMR presents to the Board Fidelity's profitability for the fund. Fidelity calculates the profitability for each fund, as well as aggregate profitability for groups of Fidelity funds and all Fidelity funds, using a series of detailed revenue and cost allocation methodologies which originate with the audited books and records of Fidelity. The Audit Committee of the Board reviews any significant changes from the prior year's methodologies.
PricewaterhouseCoopers LLP (PwC), independent registered public accounting firm and auditor to Fidelity and certain Fidelity funds, has been engaged annually by the Board as part of the Board's assessment of the results of Fidelity's profitability analysis. PwC's engagement includes the review and assessment of Fidelity's methodologies used in determining the revenues and expenses attributable to Fidelity's mutual fund business, and completion of agreed-upon procedures surrounding the mathematical accuracy of fund profitability and its conformity to allocation methodologies. After considering PwC's reports issued under the engagement and information provided by Fidelity, the Board believes that while other allocation methods may also be reasonable, Fidelity's profitability methodologies are reasonable in all material respects.
The Board has also reviewed Fidelity's non-fund businesses and any fall-out benefits related to the mutual fund business as well as cases where Fidelity's affiliates may benefit from or be related to the fund's business.
The Board considered the costs of the services provided by and the profits realized by Fidelity in connection with the operation of the fund and determined that the amount of profit is a fair entrepreneurial profit for the management of the fund.
Economies of Scale. The Board considered whether there have been economies of scale in respect of the management of the Fidelity funds, whether the Fidelity funds (including the fund) have appropriately benefited from any such economies of scale, and whether there is potential for realization of any further economies of scale. The Board considered the extent to which the fund will benefit from economies of scale through increased services to the fund, through waivers or reimbursements, or through fee or expense reductions.
The Board recognized that the fund's management contract incorporates a "group fee" structure, which provides for lower group fee rates as total fund assets under FMR's management increase, and for higher group fee rates as total fund assets under FMR's management decrease. FMR determines the group fee rates based on a tiered asset "breakpoint" schedule. The Board considered that the group fee is designed to deliver the benefits of economies of scale to fund shareholders when total fund assets increase, even if assets of any particular fund are unchanged or have declined, because some portion of Fidelity's costs are attributable to services provided to all Fidelity funds, and all funds benefit if those costs can be allocated among more assets. The Board concluded that, given the group fee structure, fund shareholders will achieve a certain level of economies of scale as assets under FMR's management increase at the fund complex level, regardless of whether Fidelity achieves any such economies of scale.
The Board further concluded that any potential economies of scale are being shared between fund shareholders and Fidelity in an appropriate manner.
Additional Information Requested by the Board. In order to develop fully the factual basis for consideration of the Fidelity funds' Advisory Contracts, the Board requested and received additional information on certain topics, including (i) fund performance trends and actions to be taken by FMR to improve certain funds' overall performance; (ii) portfolio manager changes that have occurred during the past year; (iii) Fidelity's fund profitability methodology, the profitability of certain fund service providers, and profitability trends for certain funds; (iv) Fidelity's compensation structure for portfolio managers and key personnel, including its effects on fund profitability and the extent to which portfolio manager compensation is linked to fund performance; (v) Fidelity's fee structures and rationale for recommending different fees among categories of funds; and (vi) Fidelity's rationale for recommending which funds should have a performance adjustment component as part of their management fees.
Based on its evaluation of all of the conclusions noted above, and after considering all material factors, the Board ultimately concluded that the advisory fee structures are fair and reasonable, and that the fund's Advisory Contracts should be renewed.
Annual Report
Annual Report
Investment Adviser
Fidelity Management & Research Company Boston, MA
Investment Sub-Advisers
FMR Co., Inc.
Fidelity Management & Research (U.K.) Inc.
Fidelity Research & Analysis Company
Fidelity Investments Japan Limited
FIL Investment Advisors
FIL Investment Advisors (U.K.) Ltd.
Fidelity Management & Research (Hong Kong) Limited
Fidelity Management & Research (Japan) Inc.
General Distributor
Fidelity Distributors Corporation Boston, MA
Transfer and Service Agents
Fidelity Investments Institutional Operations Company, Inc. Boston, MA
Fidelity Service Company, Inc. Boston, MA
Custodian
State Street Bank and Trust Company Quincy, MA
VCSP-ANN-0209
1.850994.101
Fidelity® Variable Insurance Products:
Emerging Markets Portfolio
Annual Report
December 31, 2008 (2_fidelity_logos) (Registered_Trademark)
To view a fund's proxy voting guidelines and proxy voting record for the 12-month period ended June 30, visit http://www.fidelity.com (search for "proxy voting guidelines") or visit the Securities and Exchange Commission's (SEC) web site at http://www.sec.gov. You may also call 1-877-208-0098 to request a free copy of the proxy voting guidelines.
Fidelity Variable Insurance Products are separate account options which are purchased through a variable insurance contract.
Standard & Poor's, S&P and S&P 500 are registered service marks of The McGraw-Hill Companies, Inc. and have been licensed for use by Fidelity Distributors Corporation.
Other third party marks appearing herein are the property of their respective owners.
All other marks appearing herein are registered or unregistered trademarks or service marks of FMR LLC or an affiliated company.
This report and the financial statements contained herein are submitted for the general information of the shareholders of the fund. This report is not authorized for distribution to prospective investors in the fund unless preceded or accompanied by an effective prospectus.
A fund files its complete schedule of portfolio holdings with the SEC for the first and third quarters of each fiscal year on Form N-Q. Forms N-Q are available on the SEC's web site at http://www.sec.gov. A fund's Forms N-Q may be reviewed and copied at the SEC's Public Reference Room in Washington, DC. Information regarding the operation of the SEC's Public Reference Room may be obtained by calling 1-800-SEC-0330. For a complete list of a fund's portfolio holdings, view the most recent holdings listing, semiannual report, or annual report on Fidelity's web site at http://www.fidelity.com or http://www.advisor.fidelity.com, as applicable.
NOT FDIC INSURED · MAY LOSE VALUE · NO BANK GUARANTEE
Neither the fund nor Fidelity Distributors Corporation is a bank.
Average annual total return reflects the change in the value of an investment, assuming reinvestment of the class' dividend income and capital gains (the profits earned upon the sale of securities that have grown in value, if any) and assuming a constant rate of performance each year. During periods of reimbursement by Fidelity, a fund's total return will be greater than it would be had the reimbursement not occurred. Performance numbers are net of all underlying fund operating expenses, but do not include any insurance charges imposed by your insurance company's separate account. If performance information included the effect of these additional charges, the total returns would have been lower. How a fund did yesterday is no guarantee of how it will do tomorrow.
Average annual total returns take VIP Emerging Markets Portfolio's cumulative total return and show you what would have happened if VIP Emerging Markets Portfolio shares had performed at a constant rate each year. These numbers will be reported once the fund is a year old.
$10,000 Over Life of Fund
Let's say hypothetically that $10,000 was invested in VIP Emerging Markets Portfolio - Initial Class on January 23, 2008, when the fund started. The chart shows how the value of your investment would have changed, and also shows how the MSCI® Emerging Markets Index performed over the same period.
Comments from Robert von Rekowsky, Portfolio Manager of VIP Emerging Markets Portfolio
By year-end 2008, the vicious credit crisis sparked in the U.S. had spread like wildfire across the world's capital markets, stunting global growth, toppling commodity prices, changing the face of the global financial system and chasing risk-averse investors toward the sidelines. The U.S. equity markets, as measured by the Dow Jones Industrial AverageSM and Standard & Poor's 500SM Index, fell hard as a result, declining 31.93% and 37.00%, respectively, while the technology-laden NASDAQ Composite® Index slid 40.03%. Foreign market stocks saw an even sharper decline, as illustrated by the 43.28% loss of the MSCI® EAFE® Index (Europe, Australasia, Far East), a gauge of developed stock markets outside the U.S. and Canada. A generally stronger U.S. dollar also held back returns for U.S. investors in foreign equities. Emerging-markets stocks - the global performance leader only a year ago - fell harder still, dropping 53.18%, as measured by the MSCI Emerging Markets Index. The only clear winners during the past year were assets backed by the U.S. government, as investors fled from risk. Thus, the Barclays Capital U.S. Treasury Bond Index climbed 13.74% for the year, while the Barclays Capital U.S. Aggregate Bond Index - a broader measure of the U.S. investment-grade bond universe - gained a more modest 5.24%. By contrast, high-yield bonds bore the brunt of investors' increasing wariness over risk, as expressed by the Merrill Lynch® U.S. High Yield Master II Constrained Index's drop of 26.11%. The emerging-markets bond category also felt the shock of investors' risk-averse sentiment, with the JPMorgan Emerging Markets Bond Index (EMBI) Global falling 10.91%. Meanwhile, the Citigroup® Non-U.S. Group of 7 Index - representing the debt performance of major global economies, excluding the United States - eked out a 1.69% gain.
From its inception on January 23, 2008, through December 31, 2008, the fund lagged the -44.78% return of the MSCI® Emerging Markets Index. (For specific portfolio results, please refer to the financial highlights section of this report.) Versus the MSCI index, unfavorable stock picking accounted for most of the fund's shortfall, with Russia, South Africa and Brazil detracting the most. An overweighting in Russia also was counterproductive. From a sector standpoint, the fund was hurt the most by stock selection in materials, energy, financials, consumer discretionary and industrials. Russian natural gas producer and distributor Gazprom sold off sharply on lower energy prices and concerns about the steep losses suffered by the broader Russian market. Underweighting index components Taiwan Semiconductor Manufacturing and Israel's Teva Pharmaceutical Industries proved to be ill-timed, as both outperformed the index. Meanwhile, China Mobile, that nation's dominant wireless carrier, suffered from changes in the telecom regulatory landscape that hurt the company relative to its peers. Most of the damage to performance came from overweighting the stock during the first half of the period. In the case of Brazilian steel producer Siderurgica Nacional, both the timing of our purchases and the fund's overweighting hurt performance. Some of the detractors I've mentioned were sold by period end. Conversely, an above-average cash position was helpful given the steep slide in stocks. Individual contributors included two of China's biggest banks, China Construction Bank and Industrial & Commercial Bank of China, which benefited from their solid balance sheets and prospects for increased infrastructure spending by the Chinese government. On the other hand, underweighting benchmark component ICICI Bank, based in India, was timely. Further, my decision to sell Russian nickel producer MMC Norilsk Nickel before the worst of the stock's decline of more than 71% aided the fund's results.
The views expressed above reflect those of the portfolio manager(s) only through the end of the period as stated on the cover of this report and do not necessarily represent the views of Fidelity or any other person in the Fidelity organization. Any such views are subject to change at any time based upon market or other conditions and Fidelity disclaims any responsibility to update such views. These views may not be relied on as investment advice and, because investment decisions for a Fidelity fund are based on numerous factors, may not be relied on as an indication of trading intent on behalf of any Fidelity fund.
As a shareholder of the Fund, you incur two types of costs: (1) transaction costs, including redemption fees, and (2) ongoing costs, including management fees, distribution and/or service (12b-1) fees and other Fund expenses. This Example is intended to help you understand your ongoing costs (in dollars) of investing in the Fund and to compare these costs with the ongoing costs of investing in other mutual funds.
The Example is based on an investment of $1,000 invested at the beginning of the period and held for the entire period (July 1, 2008 to December 31, 2008).
Actual Expenses
The first line of the accompanying table for each class of the Fund provides information about actual account values and actual expenses. You may use the information in this line, together with the amount you invested, to estimate the expenses that you paid over the period. Simply divide your account value by $1,000.00 (for example, an $8,600 account value divided by $1,000.00 = 8.6), then multiply the result by the number in the first line for a class of the Fund under the heading entitled "Expenses Paid During Period" to estimate the expenses you paid on your account during this period. The estimate of expenses does not include any fees or other expenses of any variable annuity or variable life insurance product. If they were, the estimate of expenses you paid during the period would be higher, and your ending account value would be lower. In addition, the Fund, as a shareholder in the underlying Fidelity Central Funds, will indirectly bear its pro rata share of the fees and expenses incurred by the underlying Fidelity Central Funds. These fees and expenses are not included in the Fund's annualized expense ratio used to calculate the expense estimate in the table below.
Hypothetical Example for Comparison Purposes
The second line of the accompanying table for each class of the Fund provides information about hypothetical account values and hypothetical expenses based on a Class' actual expense ratio and an assumed rate of return of 5% per year before expenses, which is not the Class' actual return. The hypothetical account values and expenses may not be used to estimate the actual ending account balance or expenses you paid for the period. You may use this information to compare the ongoing costs of investing in the Fund and other funds. To do so, compare this 5% hypothetical example with the 5% hypothetical examples that appear in the shareholder reports of the other funds. The estimate of expenses does not include any fees or other expenses of any variable annuity or variable life insurance product. If they were, the estimate of expenses you paid during the period would be higher, and your ending account value would be lower. In addition, the Fund, as a shareholder in the underlying Fidelity Central Funds, will indirectly bear its pro rata share of the fees and expenses incurred by the underlying Fidelity Central Funds. These fees and expenses are not included in the Fund's annualized expense ratio used to calculate the expense estimate in the table below.
Please note that the expenses shown in the table are meant to highlight your ongoing costs only and do not reflect any transaction costs. Therefore, the second line of the table is useful in comparing ongoing costs only, and will not help you determine the relative total costs of owning different funds. In addition, if these transactional costs were included, your costs would have been higher.
Annualized Expense Ratio
Beginning Account Value July 1, 2008
Ending Account Value December 31, 2008
Expenses Paid During Period* July 1, 2008 to December 31, 2008
Initial Class
1.10%
Actual
$ 1,000.00
$ 475.50
$ 4.08
HypotheticalA
$ 1,000.00
$ 1,019.61
$ 5.58
Service Class
1.20%
Actual
$ 1,000.00
$ 474.80
$ 4.45
HypotheticalA
$ 1,000.00
$ 1,019.10
$ 6.09
Service Class 2
1.35%
Actual
$ 1,000.00
$ 474.10
$ 5.00
HypotheticalA
$ 1,000.00
$ 1,018.35
$ 6.85
Initial Class R
1.10%
Actual
$ 1,000.00
$ 475.10
$ 4.08
HypotheticalA
$ 1,000.00
$ 1,019.61
$ 5.58
Service Class 2R
1.35%
Actual
$ 1,000.00
$ 474.10
$ 5.00
HypotheticalA
$ 1,000.00
$ 1,018.35
$ 6.85
Investor Class R
1.18%
Actual
$ 1,000.00
$ 474.60
$ 4.37
HypotheticalA
$ 1,000.00
$ 1,019.20
$ 5.99
A 5% return per year before expenses
*Expenses are equal to each Class' annualized expense ratio, multiplied by the average account value over the period, multiplied by 184/366 (to reflect the one-half year period).
Annual Report
Investment Changes (Unaudited)
Geographic Diversification (% of fund's net assets)
As of December 31, 2008
Brazil
14.0%
South Africa
10.2%
United States of America
9.6%
China
8.7%
Korea (South)
8.6%
Hong Kong
6.4%
India
5.9%
Taiwan
5.1%
Russia
4.8%
Other
26.7%
As of June 30, 2008
Russia
17.6%
Brazil
15.7%
Korea (South)
10.5%
South Africa
6.0%
United States of America
5.4%
Hong Kong
5.3%
Taiwan
5.2%
China
4.7%
Indonesia
4.3%
Other
25.3%
Asset Allocation
% of fund's net assets
% of fund's net assets 6 months ago
Stocks and Investment Companies
91.1
95.4
Short-Term Investments and Net Other Assets
8.9
4.6
Top Ten Stocks as of December 31, 2008
% of fund's net assets
% of fund's net assets 6 months ago
China Mobile (Hong Kong) Ltd. (Hong Kong, Wireless Telecommunication Services)
3.9
3.2
Petroleo Brasileiro SA - Petrobras (PN) (non-vtg.) (Brazil, Oil, Gas & Consumable Fuels)
3.9
5.8
Companhia Vale do Rio Doce (PN-A) sponsored ADR (Brazil, Metals & Mining)
Industrial & Commercial Bank of China (China, Commercial Banks)
1.9
1.0
OAO Gazprom sponsored ADR (Russia, Oil, Gas & Consumable Fuels)
1.8
5.7
MTN Group Ltd. (South Africa, Wireless Telecommunication Services)
1.6
1.0
China Construction Bank Corp. (H Shares) (China, Commercial Banks)
1.6
1.4
25.9
Market Sectors as of December 31, 2008
% of fund's net assets
% of fund's net assets 6 months ago
Financials
19.7
17.2
Energy
14.7
25.2
Telecommunication Services
12.7
8.9
Materials
11.1
20.4
Information Technology
10.7
7.0
Consumer Staples
5.4
2.8
Utilities
4.8
2.8
Consumer Discretionary
4.5
4.9
Industrials
4.3
6.2
Health Care
3.2
0.0
Annual Report
Investments December 31, 2008
Showing Percentage of Net Assets
Common Stocks - 91.1%
Shares
Value
Australia - 0.2%
Sino Gold Mining Ltd. (a)
3,690
$ 13,241
Bahrain - 0.1%
Gulf Finance House BSC:
(Reg. S) unit
800
6,800
GDR (c)
600
5,100
TOTAL BAHRAIN
11,900
Bermuda - 1.2%
Aquarius Platinum Ltd. (Australia)
4,612
12,450
Central European Media Enterprises Ltd. Class A (a)
1,000
21,720
Credicorp Ltd. (NY Shares)
1,000
49,960
Ports Design Ltd.
14,000
17,079
TOTAL BERMUDA
101,209
Brazil - 14.0%
America Latina Logistica SA unit
6,900
29,380
Anhanguera Educacional Participacoes SA unit
1,415
7,522
Banco ABC Brasil SA
1,000
2,278
Banco Bradesco SA:
(PN)
7,750
77,124
(PN) sponsored ADR
2,200
21,714
Companhia Energetica de Minas Gerais (CEMIG) (PN) sponsored ADR (non-vtg.)
3,400
46,716
Companhia Siderurgica Nacional SA (CSN) sponsored ADR
5,200
66,612
Companhia Vale do Rio Doce (PN-A) sponsored ADR
24,700
263,055
GVT Holding SA (a)
3,500
38,564
MRV Engenharia e Participacoes SA
2,200
9,686
Net Servicos de Comunicacao SA sponsored ADR
4,700
27,354
OGX Petroleo e Gas Participacoes SA
100
23,704
Petroleo Brasileiro SA - Petrobras:
(PN) (non-vtg.)
11,100
111,777
(PN) sponsored ADR (non-vtg.)
10,100
206,141
sponsored ADR
1,100
26,939
Redecard SA
4,100
47,064
Uniao de Bancos Brasileiros SA (Unibanco):
unit
2,800
18,166
GDR
900
58,158
Usinas Siderurgicas de Minas Gerais SA - Usiminas (PN-A) (non-vtg.)
1,800
20,726
Votorantim Celulose e Papel SA sponsored ADR (non-vtg.)
6,100
48,373
TOTAL BRAZIL
1,151,053
Cayman Islands - 1.1%
Chaoda Modern Agriculture (Holdings) Ltd.
56,160
36,088
China Dongxiang Group Co. Ltd.
73,000
17,838
Shares
Value
Suntech Power Holdings Co. Ltd. sponsored ADR (a)
900
$ 10,530
The United Laboratories International Holdings Ltd.
32,000
8,503
Xinao Gas Holdings Ltd.
6,000
6,365
Yingli Green Energy Holding Co. Ltd. ADR (a)
1,800
10,980
TOTAL CAYMAN ISLANDS
90,304
China - 8.7%
Baidu.com, Inc. sponsored ADR (a)
200
26,114
China Coal Energy Co. Ltd. (H Shares)
56,000
45,256
China Construction Bank Corp. (H Shares)
238,000
132,414
China Gas Holdings Ltd.
62,000
9,197
China Merchants Bank Co. Ltd. (H Shares)
39,500
73,906
China Petroleum & Chemical Corp.:
(H Shares)
34,000
20,898
Class H sponsored ADR
700
43,253
China Railway Construction Corp. Class H
16,000
23,953
China South Locomotive & Rolling Stock Corp. Ltd. (H Shares)
67,000
36,795
China Yurun Food Group Ltd.
18,000
21,291
Golden Eagle Retail Group Ltd. (H Shares)
34,000
23,927
Industrial & Commercial Bank of China
290,000
153,963
Ping An Insurance (Group) Co. of China, Ltd. (H Shares)
7,500
36,857
Tencent Holdings Ltd.
7,600
49,382
Yantai Changyu Pioneer Wine Co. (B Shares)
1,400
4,938
ZTE Corp. (H Shares)
5,800
15,323
TOTAL CHINA
717,467
Cyprus - 0.0%
XXI Century Investments Public Ltd. (a)
600
66
Czech Republic - 2.6%
Ceske Energeticke Zavody AS
3,000
122,478
Komercni Banka AS
400
61,801
Philip Morris CR AS
100
31,348
TOTAL CZECH REPUBLIC
215,627
Egypt - 1.3%
Commercial International Bank Ltd. sponsored GDR
7,499
51,368
Eastern Tobacco Co.
600
18,111
Orascom Construction Industries SAE GDR
400
20,000
Telecom Egypt SAE
7,100
20,655
TOTAL EGYPT
110,134
Georgia - 0.0%
Bank of Georgia unit (a)
200
828
Common Stocks - continued
Shares
Value
Hong Kong - 6.4%
China Mobile (Hong Kong) Ltd.
31,500
$ 319,602
China Resources Power Holdings Co. Ltd.
30,000
58,329
CNOOC Ltd.
123,000
116,992
CNPC (Hong Kong) Ltd.
110,000
34,468
REXCAPITAL Financial Holdings Ltd. (a)
75,000
1,807
TOTAL HONG KONG
531,198
India - 5.9%
Axis Bank Ltd.
2,500
25,952
Axis Bank Ltd. GDR (Reg. S)
600
6,288
Bank of India
7,781
46,155
Bharti Airtel Ltd. (a)
2,584
38,125
Educomp Solutions Ltd.
658
32,744
Housing Development Finance Corp. Ltd.
2,003
61,352
ICICI Bank Ltd.
7,974
73,989
Infosys Technologies Ltd. sponsored ADR
3,300
81,081
Larsen & Toubro Ltd.
1,783
28,533
Reliance Industries Ltd.
711
18,123
Rolta India Ltd.
9,218
22,145
Rural Electrification Corp. Ltd.
60
91
Sintex Industries Ltd.
2,273
8,895
Tata Power Co. Ltd.
2,958
45,771
TOTAL INDIA
489,244
Indonesia - 2.8%
PT Astra International Tbk
35,000
33,107
PT Bank Rakyat Indonesia Tbk
141,000
57,710
PT Bayan Resources Tbk
18,500
1,592
PT Bumi Resources Tbk
293,000
23,788
PT Perusahaan Gas Negara Tbk Series B
346,300
58,270
PT Telkomunikasi Indonesia Tbk:
Series B
82,000
50,441
sponsored ADR
300
7,521
TOTAL INDONESIA
232,429
Ireland - 0.0%
Dragon Oil PLC (a)
1,000
2,364
Israel - 4.1%
Cellcom Israel Ltd.
1,500
33,150
Check Point Software Technologies Ltd. (a)
3,100
58,869
Israel Chemicals Ltd.
6,703
46,637
Teva Pharmaceutical Industries Ltd. sponsored ADR
4,600
195,822
TOTAL ISRAEL
334,478
Shares
Value
Kazakhstan - 0.4%
JSC Halyk Bank of Kazakhstan unit
1,050
$ 2,877
KazMunaiGas Exploration & Production JSC (Reg. S) GDR
2,400
30,240
TOTAL KAZAKHSTAN
33,117
Korea (South) - 8.6%
Hyundai Mobis
655
33,315
Korea Gas Corp.
1,137
52,518
KT&G Corp.
1,000
63,081
LG Household & Health Care Ltd.
259
39,363
LIG Non-Life Insurance Co. Ltd.
1,330
12,757
MegaStudy Co. Ltd.
325
47,984
Meritz Fire & Marine Insurance Co. Ltd.
6,270
18,507
NHN Corp. (a)
500
52,713
POSCO
91
27,559
POSCO sponsored ADR
200
15,050
Samsung Electronics Co. Ltd.
627
227,974
Shinhan Financial Group Co. Ltd.
2,830
67,154
Taewoong Co. Ltd.
831
51,159
TOTAL KOREA (SOUTH)
709,134
Lebanon - 0.1%
Solidere GDR
300
4,875
Luxembourg - 0.5%
Evraz Group SA GDR
584
5,022
MHP SA GDR (a)(c)
700
2,415
Millicom International Cellular SA
800
35,928
TOTAL LUXEMBOURG
43,365
Malaysia - 1.2%
DiGi.com Bhd
8,600
54,378
Public Bank Bhd
18,100
46,491
TOTAL MALAYSIA
100,869
Mexico - 4.2%
America Movil SAB de CV Series L sponsored ADR
7,300
226,227
Fomento Economico Mexicano SAB de CV sponsored ADR
2,000
60,260
Grupo Financiero Banorte SA de CV Series O
27,200
49,307
Urbi, Desarrollos Urbanos, SA de CV (a)
6,800
9,418
TOTAL MEXICO
345,212
Nigeria - 0.1%
Guaranty Trust Bank PLC:
(Reg. S) unit
763
2,655
sponsored GDR (c)
436
1,517
TOTAL NIGERIA
4,172
Oman - 0.2%
BankMuscat SAOG sponsored GDR
2,300
18,400
Panama - 0.1%
Intergroup Financial Services Corp.
865
8,607
Common Stocks - continued
Shares
Value
Papua New Guinea - 0.3%
Oil Search Ltd.
6,402
$ 21,383
Peru - 0.6%
Compania de Minas Buenaventura SA sponsored ADR
2,490
49,601
Philippines - 0.1%
Security Bank Corp.
3,000
1,580
SM Investments Corp.
1,280
5,177
TOTAL PHILIPPINES
6,757
Poland - 0.7%
Powszechna Kasa Oszczednosci Bank SA
4,600
54,993
Trakcja Polska SA
2,050
2,789
TOTAL POLAND
57,782
Russia - 4.8%
Bank St. Petersburg OJSC
2,931
3,278
LSR Group OJSC (a)
100
437
Lukoil Oil Co. sponsored ADR
2,331
77,156
Magnit OJSC GDR (Reg. S) (a)
1,200
5,400
Mobile TeleSystems OJSC sponsored ADR
1,100
29,348
OAO Gazprom sponsored ADR
10,084
143,697
OAO Raspadskaya
7,400
7,627
OAO TMK
1,965
2,595
OJSC Rosneft unit
7,400
27,982
Polymetal JSC GDR (Reg. S) (a)
1,700
7,739
Rosinter Restaurants Holding (a)
363
2,582
Sberbank (Savings Bank of the Russian Federation)
44,600
33,370
Sberbank (Savings Bank of the Russian Federation) GDR
100
14,455
Uralkali JSC
4,300
8,060
Uralkali JSC GDR (Reg. S)
1,100
9,878
Wimm-Bill-Dann Foods OJSC sponsored ADR (a)
700
18,417
TOTAL RUSSIA
392,021
South Africa - 10.2%
African Bank Investments Ltd.
15,000
41,101
African Rainbow Minerals Ltd.
3,560
42,369
Aspen Pharmacare Holdings Ltd. (a)
11,764
42,226
Aveng Ltd.
9,300
30,521
Exxaro Resources Ltd.
5,657
43,497
FirstRand Ltd.
35,100
60,724
Harmony Gold Mining Co. Ltd. sponsored ADR (a)
6,300
69,111
Illovo Sugar Ltd.
10,082
24,489
Impala Platinum Holdings Ltd.
4,300
62,325
JD Group Ltd.
1,208
4,732
Shares
Value
Mr. Price Group Ltd.
16,500
$ 43,531
MTN Group Ltd.
11,608
134,603
Murray & Roberts Holdings Ltd.
4,200
21,599
Raubex Group Ltd.
16,123
37,250
Sasol Ltd.
1,900
56,829
Sasol Ltd. sponsored ADR
2,800
84,924
Shoprite Holdings Ltd.
7,600
42,991
TOTAL SOUTH AFRICA
842,822
Taiwan - 5.1%
Acer, Inc.
32,000
41,593
Asia Cement Corp.
35,000
30,381
First Financial Holding Co. Ltd.
96,032
50,543
Hon Hai Precision Industry Co. Ltd. (Foxconn)
41,550
81,389
HTC Corp.
5,900
58,865
Siliconware Precision Industries Co. Ltd.
37,560
32,088
Taiwan Mobile Co. Ltd.
29,000
43,091
Taiwan Semiconductor Manufacturing Co. Ltd.
58,000
78,572
TOTAL TAIWAN
416,522
Thailand - 1.5%
Minor International PCL (For. Reg.)
96,710
22,776
PTT Exploration & Production PCL (For. Reg.)
17,000
53,352
Siam Commercial Bank PCL (For. Reg.)
26,500
38,118
Total Access Communication PCL (For. Reg.)
6,500
6,201
TOTAL THAILAND
120,447
Turkey - 2.5%
Anadolu Efes Biracilik ve Malt Sanyii AS
8,000
53,489
Asya Katilim Bankasi AS
36,877
27,768
Enka Insaat ve Sanayi AS
10,979
37,416
Tupras-Turkiye Petrol Rafinerileri AS
4,000
42,064
Turkiye Garanti Bankasi AS (a)
28,000
47,257
TOTAL TURKEY
207,994
United Kingdom - 0.8%
Cairn Energy PLC (a)
300
8,918
Eurasian Natural Resources Corp. PLC
150
728
Hikma Pharmaceuticals PLC
3,300
17,049
Randgold Resources Ltd. sponsored ADR
800
35,136
TOTAL UNITED KINGDOM
61,831
United States of America - 0.7%
Central European Distribution Corp. (a)
1,100
21,670
CTC Media, Inc. (a)
3,500
16,800
Freeport-McMoRan Copper & Gold, Inc. Class B
900
21,996
TOTAL UNITED STATES OF AMERICA
60,466
TOTAL COMMON STOCKS
(Cost $12,503,424)
7,506,919
Money Market Funds - 9.6%
Shares
Value
Fidelity Cash Central Fund, 1.06% (b) (Cost $791,671)
791,671
$ 791,671
TOTAL INVESTMENT PORTFOLIO - 100.7%
(Cost $13,295,095)
8,298,590
NET OTHER ASSETS - (0.7)%
(61,482)
NET ASSETS - 100%
$ 8,237,108
Legend
(a) Non-income producing
(b) Affiliated fund that is available only to investment companies and other accounts managed by Fidelity Investments. The rate quoted is the annualized seven-day yield of the fund at period end. A complete unaudited listing of the fund's holdings as of its most recent quarter end is available upon request.
(c) Security exempt from registration under Rule 144A of the Securities Act of 1933. These securities may be resold in transactions exempt from registration, normally to qualified institutional buyers. At the end of the period, the value of these securities amounted to $9,032 or 0.1% of net assets.
Affiliated Central Funds
Information regarding fiscal year to date income earned by the Fund from investments in Fidelity Central Funds is as follows:
Fund
Income earned
Fidelity Cash Central Fund
$ 15,474
Other Information
The following is a summary of the inputs used, as of December 31, 2008, involving the Fund's assets carried at value. The inputs or methodology used for valuing securities may not be an indication of the risk associated with investing in those securities. For more information on valuation inputs, and their aggregation into the levels used in the table below, please refer to the Security Valuation section in the accompanying Notes to Financial Statements.
Valuation Inputs at Reporting Date:
Description
Total
Level 1
Level 2
Level 3
Investments in Securities
$ 8,298,590
$ 4,222,256
$ 4,076,334
$ -
Income Tax Information
At December 31, 2008, the fund had a capital loss carryforward of approximately $1,790,850 all of which will expire on December 31, 2016.
The fund intends to elect to defer to its fiscal year ending December 31, 2009 approximately $1,365,214 of losses recognized during the period November 1, 2008 to December 31, 2008.
See accompanying notes which are an integral part of the financial statements.
Investment in securities, at value - See accompanying schedule:
Unaffiliated issuers (cost $12,503,424)
$ 7,506,919
Fidelity Central Funds (cost $791,671)
791,671
Total Investments (cost $13,295,095)
$ 8,298,590
Cash
7,309
Foreign currency held at value (cost $1,928)
1,943
Receivable for investments sold
16,983
Receivable for fund shares sold
14,574
Dividends receivable
27,744
Distributions receivable from Fidelity Central Funds
764
Prepaid expenses
94
Receivable from investment adviser for expense reductions
20,992
Other receivables
1,064
Total assets
8,390,057
Liabilities
Payable for investments purchased
$ 82,273
Payable for fund shares redeemed
78
Accrued management fee
5,105
Distribution fees payable
189
Other affiliated payables
947
Other payables and accrued expenses
64,357
Total liabilities
152,949
Net Assets
$ 8,237,108
Net Assets consist of:
Paid in capital
$ 16,673,977
Accumulated undistributed net realized gain (loss) on investments and foreign currency transactions
(3,440,438)
Net unrealized appreciation (depreciation) on investments and assets and liabilities in foreign currencies
(4,996,431)
Net Assets
$ 8,237,108
Statement of Assets and Liabilities - continued
December 31, 2008
Initial Class: Net Asset Value, offering price and redemption price per share ($516,283 ÷ 105,877 shares)
$ 4.88
Service Class: Net Asset Value, offering price and redemption price per share ($395,731 ÷ 81,099 shares)
$ 4.88
Service Class 2: Net Asset Value, offering price and redemption price per share ($395,175 ÷ 80,903 shares)
$ 4.88
Initial Class R: Net Asset Value, offering price and redemption price per share ($3,157,919 ÷ 647,608 shares)
$ 4.88
Service Class 2R: Net Asset Value, offering price and redemption price per share ($395,176 ÷ 80,903 shares)
$ 4.88
Investor Class R: Net Asset Value, offering price and redemption price per share ($3,376,824 ÷ 693,043 shares)
$ 4.87
See accompanying notes which are an integral part of the financial statements.
Annual Report
Statement of Operations
For the period January 23, 2008 (commencement of operations) to December 31, 2008
Investment Income
Dividends
$ 216,073
Interest
1,277
Income from Fidelity Central Funds
15,474
232,824
Less foreign taxes withheld
(22,631)
Total income
210,193
Expenses
Management fee
$ 66,190
Transfer agent fees
11,034
Distribution fees
3,942
Accounting fees and expenses
4,236
Custodian fees and expenses
170,855
Independent trustees' compensation
37
Audit
60,139
Legal
94
Miscellaneous
550
Total expenses before reductions
317,077
Expense reductions
(227,202)
89,875
Net investment income (loss)
120,318
Realized and Unrealized Gain (Loss)
Net realized gain (loss) on:
Investment securities:
Unaffiliated issuers
(3,429,825)
Foreign currency transactions
(19,147)
Total net realized gain (loss)
(3,448,972)
Change in net unrealized appreciation (depreciation) on:
Investment securities
(4,996,505)
Assets and liabilities in foreign currencies
74
Total change in net unrealized appreciation (depreciation)
(4,996,431)
Net gain (loss)
(8,445,403)
Net increase (decrease) in net assets resulting from operations
$ (8,325,085)
Statement of Changes in Net Assets
For the period January 23, 2008 (commencement of operations) to December 31, 2008
Increase (Decrease) in Net Assets
Operations
Net investment income (loss)
$ 120,318
Net realized gain (loss)
(3,448,972)
Change in net unrealized appreciation (depreciation)
(4,996,431)
Net increase (decrease) in net assets resulting from operations
(8,325,085)
Distributions to shareholders from net investment income
(118,460)
Share transactions - net increase (decrease)
16,664,085
Redemption fees
16,568
Total increase (decrease) in net assets
8,237,108
Net Assets
Beginning of period
-
End of period
$ 8,237,108
See accompanying notes which are an integral part of the financial statements.
Annual Report
Financial Highlights - Initial Class
Year ended December 31,
2008H
Selected Per-Share Data
Net asset value, beginning of period
$ 10.00
Income from Investment Operations
Net investment income (loss)E
.13
Net realized and unrealized gain (loss)
(5.19)
Total from investment operations
(5.06)
Distributions from net investment income
(.08)
Redemption fees added to paid in capitalE
.02
Net asset value, end of period
$ 4.88
Total ReturnB, C, D
(50.45)%
Ratios to Average Net AssetsF, I
Expenses before reductions
3.92%A
Expenses net of fee waivers, if any
1.10%A
Expenses net of all reductions
1.02%A
Net investment income (loss)
1.54%A
Supplemental Data
Net assets, end of period (000 omitted)
$ 516
Portfolio turnover rateG
79%
A Annualized B Total returns for periods of less than one year are not annualized. C Total returns do not reflect charges attributable to your insurance company's separate account. Inclusion of these charges would reduce the total returns shown. D Total returns would have been lower had certain expenses not been reduced during the periods shown. E Calculated based on average shares outstanding during the period. F Fees and expenses of the underlying Fidelity Central Funds are not included in the Fund's expense ratio. The Fund indirectly bears its proportionate share of the expenses of any underlying Fidelity Central Funds. G Amount does not include the portfolio activity of any underlying Fidelity Central Funds. H For the period January 23, 2008 (commencement of operations) to December 31, 2008. I Expense ratios reflect operating expenses of the class. Expenses before reductions do not reflect amounts reimbursed by the investment adviser or reductions from brokerage service arrangements or other expense offset arrangements and do not represent the amount paid by the class during periods when reimbursements or reductions occur. Expense ratios before reductions for start-up periods may not be representative of longer-term operating periods. Expenses net of fee waivers reflect expenses after reimbursement by the investment adviser but prior to reductions from brokerage service arrangements or other expense offset arrangements. Expenses net of all reductions represent the net expenses paid by the class.
Financial Highlights - Service Class
Year ended December 31,
2008H
Selected Per-Share Data
Net asset value, beginning of period
$ 10.00
Income from Investment Operations
Net investment income (loss)E
.12
Net realized and unrealized gain (loss)
(5.19)
Total from investment operations
(5.07)
Distributions from net investment income
(.07)
Redemption fees added to paid in capitalE
.02
Net asset value, end of period
$ 4.88
Total ReturnB, C, D
(50.53)%
Ratios to Average Net AssetsF, I
Expenses before reductions
4.02%A
Expenses net of fee waivers, if any
1.20%A
Expenses net of all reductions
1.12%A
Net investment income (loss)
1.44%A
Supplemental Data
Net assets, end of period (000 omitted)
$ 396
Portfolio turnover rateG
79%
A Annualized B Total returns for periods of less than one year are not annualized. C Total returns do not reflect charges attributable to your insurance company's separate account. Inclusion of these charges would reduce the total returns shown. D Total returns would have been lower had certain expenses not been reduced during the periods shown. E Calculated based on average shares outstanding during the period. F Fees and expenses of the underlying Fidelity Central Funds are not included in the Fund's expense ratio. The Fund indirectly bears its proportionate share of the expenses of any underlying Fidelity Central Funds. G Amount does not include the portfolio activity of any underlying Fidelity Central Funds. H For the period January 23, 2008 (commencement of operations) to December 31, 2008. I Expense ratios reflect operating expenses of the class. Expenses before reductions do not reflect amounts reimbursed by the investment adviser or reductions from brokerage service arrangements or other expense offset arrangements and do not represent the amount paid by the class during periods when reimbursements or reductions occur. Expense ratios before reductions for start-up periods may not be representative of longer-term operating periods. Expenses net of fee waivers reflect expenses after reimbursement by the investment adviser but prior to reductions from brokerage service arrangements or other expense offset arrangements. Expenses net of all reductions represent the net expenses paid by the class.
See accompanying notes which are an integral part of the financial statements.
Annual Report
Financial Highlights - Service Class 2
Year ended December 31,
2008H
Selected Per-Share Data
Net asset value, beginning of period
$ 10.00
Income from Investment Operations
Net investment income (loss)E
.11
Net realized and unrealized gain (loss)
(5.19)
Total from investment operations
(5.08)
Distributions from net investment income
(.06)
Redemption fees added to paid in capitalE
.02
Net asset value, end of period
$ 4.88
Total ReturnB, C, D
(50.65)%
Ratios to Average Net AssetsF, I
Expenses before reductions
4.17%A
Expenses net of fee waivers, if any
1.35%A
Expenses net of all reductions
1.27%A
Net investment income (loss)
1.29%A
Supplemental Data
Net assets, end of period (000 omitted)
$ 395
Portfolio turnover rateG
79%
A Annualized B Total returns for periods of less than one year are not annualized. C Total returns do not reflect charges attributable to your insurance company's separate account. Inclusion of these charges would reduce the total returns shown. D Total returns would have been lower had certain expenses not been reduced during the periods shown. E Calculated based on average shares outstanding during the period. F Fees and expenses of the underlying Fidelity Central Funds are not included in the Fund's expense ratio. The Fund indirectly bears its proportionate share of the expenses of any underlying Fidelity Central Funds. G Amount does not include the portfolio activity of any underlying Fidelity Central Funds. H For the period January 23, 2008 (commencement of operations) to December 31, 2008. I Expense ratios reflect operating expenses of the class. Expenses before reductions do not reflect amounts reimbursed by the investment adviser or reductions from brokerage service arrangements or other expense offset arrangements and do not represent the amount paid by the class during periods when reimbursements or reductions occur. Expense ratios before reductions for start-up periods may not be representative of longer-term operating periods. Expenses net of fee waivers reflect expenses after reimbursement by the investment adviser but prior to reductions from brokerage service arrangements or other expense offset arrangements. Expenses net of all reductions represent the net expenses paid by the class.
Financial Highlights - Initial Class R
Year ended December 31,
2008H
Selected Per-Share Data
Net asset value, beginning of period
$ 10.00
Income from Investment Operations
Net investment income (loss)E
.11
Net realized and unrealized gain (loss)
(5.16)
Total from investment operations
(5.05)
Distributions from net investment income
(.08)
Redemption fees added to paid in capitalE
.01
Net asset value, end of period
$ 4.88
Total ReturnB, C, D
(50.45)%
Ratios to Average Net AssetsF, I
Expenses before reductions
3.71%A
Expenses net of fee waivers, if any
1.10%A
Expenses net of all reductions
1.02%A
Net investment income (loss)
1.54%A
Supplemental Data
Net assets, end of period (000 omitted)
$ 3,158
Portfolio turnover rateG
79%
A Annualized B Total returns for periods of less than one year are not annualized. C Total returns do not reflect charges attributable to your insurance company's separate account. Inclusion of these charges would reduce the total returns shown. D Total returns would have been lower had certain expenses not been reduced during the periods shown. E Calculated based on average shares outstanding during the period. F Fees and expenses of the underlying Fidelity Central Funds are not included in the Fund's expense ratio. The Fund indirectly bears its proportionate share of the expenses of any underlying Fidelity Central Funds. G Amount does not include the portfolio activity of any underlying Fidelity Central Funds. H For the period January 23, 2008 (commencement of operations) to December 31, 2008. I Expense ratios reflect operating expenses of the class. Expenses before reductions do not reflect amounts reimbursed by the investment adviser or reductions from brokerage service arrangements or other expense offset arrangements and do not represent the amount paid by the class during periods when reimbursements or reductions occur. Expense ratios before reductions for start-up periods may not be representative of longer-term operating periods. Expenses net of fee waivers reflect expenses after reimbursement by the investment adviser but prior to reductions from brokerage service arrangements or other expense offset arrangements. Expenses net of all reductions represent the net expenses paid by the class.
See accompanying notes which are an integral part of the financial statements.
Annual Report
Financial Highlights - Service Class 2R
Year ended December 31,
2008H
Selected Per-Share Data
Net asset value, beginning of period
$ 10.00
Income from Investment Operations
Net investment income (loss)E
.11
Net realized and unrealized gain (loss)
(5.19)
Total from investment operations
(5.08)
Distributions from net investment income
(.06)
Redemption fees added to paid in capitalE
.02
Net asset value, end of period
$ 4.88
Total ReturnB, C, D
(50.65)%
Ratios to Average Net AssetsF, I
Expenses before reductions
4.17%A
Expenses net of fee waivers, if any
1.35%A
Expenses net of all reductions
1.27%A
Net investment income (loss)
1.29%A
Supplemental Data
Net assets, end of period (000 omitted)
$ 395
Portfolio turnover rateG
79%
A Annualized B Total returns for periods of less than one year are not annualized. C Total returns do not reflect charges attributable to your insurance company's separate account. Inclusion of these charges would reduce the total returns shown. D Total returns would have been lower had certain expenses not been reduced during the periods shown. E Calculated based on average shares outstanding during the period. F Fees and expenses of the underlying Fidelity Central Funds are not included in the Fund's expense ratio. The Fund indirectly bears its proportionate share of the expenses of any underlying Fidelity Central Funds. G Amount does not include the portfolio activity of any underlying Fidelity Central Funds. H For the period January 23, 2008 (commencement of operations) to December 31, 2008. I Expense ratios reflect operating expenses of the class. Expenses before reductions do not reflect amounts reimbursed by the investment adviser or reductions from brokerage service arrangements or other expense offset arrangements and do not represent the amount paid by the class during periods when reimbursements or reductions occur. Expense ratios before reductions for start-up periods may not be representative of longer-term operating periods. Expenses net of fee waivers reflect expenses after reimbursement by the investment adviser but prior to reductions from brokerage service arrangements or other expense offset arrangements. Expenses net of all reductions represent the net expenses paid by the class.
Financial Highlights - Investor Class R
Year ended December 31,
2008H
Selected Per-Share Data
Net asset value, beginning of period
$ 10.00
Income from Investment Operations
Net investment income (loss)E
.10
Net realized and unrealized gain (loss)
(5.16)
Total from investment operations
(5.06)
Distributions from net investment income
(.08)
Redemption fees added to paid in capitalE
.01
Net asset value, end of period
$ 4.87
Total ReturnB, C, D
(50.55)%
Ratios to Average Net AssetsF, I
Expenses before reductions
3.81%A
Expenses net of fee waivers, if any
1.18%A
Expenses net of all reductions
1.10%A
Net investment income (loss)
1.46%A
Supplemental Data
Net assets, end of period (000 omitted)
$ 3,377
Portfolio turnover rateG
79%
A Annualized B Total returns for periods of less than one year are not annualized. C Total returns do not reflect charges attributable to your insurance company's separate account. Inclusion of these charges would reduce the total returns shown. D Total returns would have been lower had certain expenses not been reduced during the periods shown. E Calculated based on average shares outstanding during the period. F Fees and expenses of the underlying Fidelity Central Funds are not included in the Fund's expense ratio. The Fund indirectly bears its proportionate share of the expenses of any underlying Fidelity Central Funds. G Amount does not include the portfolio activity of any underlying Fidelity Central Funds. H For the period January 23, 2008 (commencement of operations) to December 31, 2008. I Expense ratios reflect operating expenses of the class. Expenses before reductions do not reflect amounts reimbursed by the investment adviser or reductions from brokerage service arrangements or other expense offset arrangements and do not represent the amount paid by the class during periods when reimbursements or reductions occur. Expense ratios before reductions for start-up periods may not be representative of longer-term operating periods. Expenses net of fee waivers reflect expenses after reimbursement by the investment adviser but prior to reductions from brokerage service arrangements or other expense offset arrangements. Expenses net of all reductions represent the net expenses paid by the class.
See accompanying notes which are an integral part of the financial statements.
VIP Emerging Markets Portfolio (the Fund) is a fund of Variable Insurance Products Fund IV (the trust) and is authorized to issue an unlimited number of shares. The trust is registered under the Investment Company Act of 1940, as amended (the 1940 Act), as an open-end management investment company organized as a Massachusetts business trust. Shares of the Fund may only be purchased by insurance companies for the purpose of funding variable annuity or variable life insurance contracts. The Fund offers the following classes of shares: Initial Class shares, Service Class shares, Service Class 2 shares, Initial Class R shares, Service Class 2R shares, and Investor Class R shares. All classes have equal rights and voting privileges, except for matters affecting a single class. Investment income, realized and unrealized capital gains and losses, the common expenses of the Fund, and certain fund-level expense reductions, if any, are allocated on a pro rata basis to each class based on the relative net assets of each class to the total net assets of the Fund. Each class differs with respect to transfer agent and distribution and service plan fees incurred. Certain expense reductions also differ by class. The Fund's investments in emerging markets can be subject to social, economic, regulatory, and political uncertainties and can be extremely volatile.
2. Investments in Fidelity Central Funds.
The Fund may invest in Fidelity Central Funds, which are open-end investment companies available only to other investment companies and accounts managed by Fidelity Management & Research Company (FMR) and its affiliates. The Fund's Schedule of Investments lists each of the Fidelity Central Funds held as of period end, if any, as an investment of the Fund, but does not include the underlying holdings of each Fidelity Central Fund. As an Investing Fund, the Fund indirectly bears its proportionate share of the expenses of the underlying Fidelity Central Funds.
The Money Market Central Funds seek preservation of capital and current income and are managed by Fidelity Investments Money Management, Inc. (FIMM), an affiliate of FMR.
A complete unaudited list of holdings for each Fidelity Central Fund is available upon request or at the SEC's web site at www.sec.gov. In addition, the financial statements of the Fidelity Central Funds, which are not covered by the Fund's Report of Independent Registered Public Accounting Firm, are available on the SEC's web site or upon request.
3. Significant Accounting Policies.
The financial statements have been prepared in conformity with accounting principles generally accepted in the United States of America, which require management to make certain estimates and assumptions at the date of the financial statements. Actual results could differ from those estimates. The following summarizes the significant accounting policies of the Fund:
Security Valuation. Investments are valued as of 4:00 p.m. Eastern time on the last calendar day of the period. Wherever possible, the Fund uses independent pricing services approved by the Board of Trustees to value its investments.
Equity securities, including restricted securities, for which market quotations are readily available, are valued at the last reported sale price or official closing price as reported by an independent pricing service on the primary market or exchange on which they are traded. In the event there were no sales during the day or closing prices are not available, securities are valued at the last quoted bid price. Investments in open-end mutual funds, including the Fidelity Central Funds, are valued at their closing net asset value each business day. Short-term securities with remaining maturities of sixty days or less for which quotations are not readily available are valued at amortized cost, which approximates value.
When current market prices or quotations are not readily available or reliable, valuations may be determined in good faith in accordance with procedures adopted by the Board of Trustees. Factors used in determining value may include significant market or security specific events, changes in interest rates and credit quality, and developments in foreign markets which are monitored by evaluating the performance of ADRs, futures contracts and exchange-traded funds. The frequency with which these procedures are used cannot be predicted and may be utilized to a significant extent. The value of securities used for net asset value (NAV) calculation under these procedures may differ from published prices for the same securities.
The Fund adopted the provisions of Statement of Financial Accounting Standards No. 157, "Fair Value Measurements" (SFAS 157), effective with the beginning of the Fund's fiscal year. SFAS 157 establishes a hierarchy that prioritizes the inputs to valuation techniques giving the highest priority to readily available unadjusted quoted prices in active markets for identical assets (level 1 measurements) and the lowest priority to unobservable inputs (level 3 measurements) when market prices are not readily available or reliable. The three levels of the hierarchy under SFAS 157 are described below:
Level 1
Quoted prices in active markets for identical securities.
Level 2
Prices determined using other significant observable inputs. Observable inputs are inputs that other market participants may use in pricing a security. These may include quoted prices for similar securities, interest rates, prepayment speeds, credit risk and others.
Level 3
Prices determined using significant unobservable inputs. In situations where quoted prices or observable inputs are unavailable or deemed less relevant (for example, when there is little or no market activity for an investment at the end of the period), unobservable inputs may be used. Unobservable inputs reflect the Fund's own assumptions about the factors market participants would use in pricing an investment, and would be based on the best information available.
Annual Report
Notes to Financial Statements - continued
3. Significant Accounting Policies - continued
Security Valuation - continued
Changes in valuation techniques may result in transfers in or out of an investment's assigned level within the hierarchy.
The aggregate value by input level, as of December 31, 2008, for the Fund's investments is included at the end of the Fund's Schedule of Investments.
Foreign Currency. The Fund uses foreign currency contracts to facilitate transactions in foreign-denominated securities. Losses from these transactions may arise from changes in the value of the foreign currency or if the counterparties do not perform under the contracts' terms.
Foreign-denominated assets, including investment securities, and liabilities are translated into U.S. dollars at the exchange rate at period end. Purchases and sales of investment securities, income and dividends received and expenses denominated in foreign currencies are translated into U.S. dollars at the exchange rate in effect on the transaction date.
The effects of exchange rate fluctuations on investments are included with the net realized and unrealized gain (loss) on investment securities. Other foreign currency transactions resulting in realized and unrealized gain (loss) are disclosed separately.
Investment Transactions and Income. For financial reporting purposes, the Fund's investment holdings and NAV include trades executed through the end of the last business day of the period. The NAV per share for processing shareholder transactions is calculated as of the close of business of the New York Stock Exchange (NYSE), normally 4:00 p.m. Eastern time and includes trades executed through the end of the prior business day. Gains and losses on securities sold are determined on the basis of identified cost. Dividend income is recorded on the ex-dividend date, except for certain dividends from foreign securities where the ex-dividend date may have passed, which are recorded as soon as the Fund is informed of the ex-dividend date. Non-cash dividends included in dividend income, if any, are recorded at the fair market value of the securities received. Distributions received on securities that represent a return of capital or capital gain are recorded as a reduction of cost of investments and/or as a realized gain. The Fund estimates the components of distributions received that may be considered return of capital distributions or capital gain distributions. Interest income and distributions from the Fidelity Central Funds are accrued as earned. Interest income includes coupon interest and amortization of premium and accretion of discount on debt securities. Investment income is recorded net of foreign taxes withheld where recovery of such taxes is uncertain.
Expenses. Most expenses of the trust can be directly attributed to a fund. Expenses which cannot be directly attributed are apportioned among each Fund in the trust. Expense estimates are accrued in the period to which they relate and adjustments are made when actual amounts are known.
Income Tax Information and Distributions to Shareholders. Each year, the Fund intends to qualify as a regulated investment company by distributing substantially all of its taxable income and realized gains under Subchapter M of the Internal Revenue Code and filing its U.S. federal tax return. As a result, no provision for income taxes is required. The Fund is subject to the provisions of FASB Interpretation No. 48, Accounting for Uncertainties in Income Taxes (FIN 48). FIN 48 sets forth a minimum threshold for financial statement recognition of the benefit of a tax position taken or expected to be taken in a tax return. There are no unrecognized tax benefits in the accompanying financial statements in connection with the tax positions expected to be taken in the initial filing of the Fund's federal tax return. A Fund's federal tax return is subject to examination by the Internal Revenue Service (IRS) for a period of three years. Foreign taxes are provided for based on the Fund's understanding of the tax rules and rates that exist in the foreign markets in which it invests.
Distributions are recorded on the ex-dividend date. Income dividends and capital gain distributions are declared separately for each class. Income and capital gain distributions are determined in accordance with income tax regulations, which may differ from generally accepted accounting principles.
Capital accounts within the financial statements are adjusted for permanent book-tax differences. These adjustments have no impact on net assets or the results of operations. Temporary book-tax differences will reverse in a subsequent period.
Book-tax differences are primarily due to foreign currency transactions, passive foreign investment companies (PFIC), capital loss carryforwards, losses deferred due to wash sales and excise tax regulations.
The tax-basis components of distributable earnings and the federal tax cost as of period end were as follows:
Unrealized appreciation
$ 154,405
Unrealized depreciation
(5,435,206)
Net unrealized appreciation (depreciation)
(5,280,801)
Capital loss carryforward
(1,790,850)
Cost for federal income tax purposes
$ 13,579,391
Annual Report
3. Significant Accounting Policies - continued
Income Tax Information and Distributions to Shareholders - continued
The tax character of distributions paid was as follows:
December 31, 2008
Ordinary Income
$ 118,460
Trading (Redemption) Fees. Initial Class R shares, Service Class 2R shares and Investor Class R shares held less than 60 days are subject to a redemption fee equal to 1% of the proceeds of the redeemed shares. All redemption fees, including any estimated redemption fees paid by FMR, are retained by the Fund and accounted for as an addition to paid in capital.
4. Operating Policies.
Repurchase Agreements. FMR has received an Exemptive Order from the Securities and Exchange Commission (the SEC) which permits the Fund and other affiliated entities of FMR to transfer uninvested cash balances into joint trading accounts which are then invested in repurchase agreements. The Fund may also invest directly with institutions in repurchase agreements. Repurchase agreements are collateralized by government or non-government securities. Upon settlement date, collateral is held in segregated accounts with custodian banks and may be obtained in the event of a default of the counterparty. The Fund monitors, on a daily basis, the value of the collateral to ensure it is at least equal to the principal amount of the repurchase agreement (including accrued interest). In the event of a default by the counterparty, realization of the collateral proceeds could be delayed, during which time the value of the collateral may decline.
Restricted Securities. The Fund may invest in securities that are subject to legal or contractual restrictions on resale. These securities generally may be resold in transactions exempt from registration or to the public if the securities are registered. Disposal of these securities may involve time-consuming negotiations and expense, and prompt sale at an acceptable price may be difficult. Information regarding restricted securities is included at the end of the Fund's Schedule of Investments.
5. Purchases and Sales of Investments.
Purchases and sales of securities, other than short-term securities, aggregated $22,129,573 and $6,178,056, respectively.
6. Fees and Other Transactions with Affiliates.
Management Fee. FMR and its affiliates provide the Fund with investment management related services for which the Fund pays a monthly management fee. The management fee is the sum of an individual fund fee rate that is based on an annual rate of .55% of the Fund's average net assets and a group fee rate that averaged .26% during the period. The group fee rate is based upon the average net assets of all the mutual funds advised by FMR. The group fee rate decreases as assets under management increase and increases as assets under management decrease. For the period, the total annualized management fee rate was .81% of the Fund's average net assets.
Distribution and Service Plan. In accordance with Rule 12b-1 of the 1940 Act, the Fund has adopted separate 12b-1 Plans for each Service Class of shares. Each Service Class pays Fidelity Distributors Corporation (FDC), an affiliate of FMR, a service fee. For the period, the service fee is based on an annual rate of .10% of Service Class' average net assets and .25% of Service Class 2's and Service Class 2R's average net assets.
For the period, each class paid FDC the following amounts, all of which were re-allowed to insurance companies for the distribution of shares and providing shareholder support services:
Service Class
$ 658
Service Class 2
1,642
Service Class 2R
1,642
$ 3,942
Transfer Agent Fees. Fidelity Investments Institutional Operations Company, Inc. (FIIOC), an affiliate of FMR, is the Fund's transfer, dividend disbursing, and shareholder servicing agent. FIIOC receives an asset-based fee with respect to each class. Each class (with the exception of Investor
Annual Report
Notes to Financial Statements - continued
6. Fees and Other Transactions with Affiliates - continued
Transfer Agent Fees - continued
Class R) pays a transfer agent fee, excluding out of pocket expenses, equal to an annual rate of .07% of average net assets. Investor Class R pays a monthly asset-based transfer agent fee of .15% of average net assets. Prior to February 1, 2008, Investor Class paid a monthly asset-based transfer agent fee of .18% of average net assets. The total transfer agent fees paid by each class to FIIOC, including out of pocket expenses, were as follows:
Initial Class
$ 707
Service Class
477
Service Class 2
476
Initial Class R
3,279
Service Class 2R
476
Investor Class R
5,619
$ 11,034
Accounting Fees. Fidelity Service Company, Inc. (FSC), an affiliate of FMR, maintains the Fund's accounting records. The fee is based on the level of average net assets for the month.
Brokerage Commissions. The Fund placed a portion of its portfolio transactions with brokerage firms which are affiliates of the investment adviser. The commissions paid to these affiliated firms were $79 for the period.
7. Committed Line of Credit.
The Fund participates with other funds managed by FMR in a $4.2 billion credit facility (the "line of credit") to be utilized for temporary or emergency purposes to fund shareholder redemptions or for other short-term liquidity purposes. The Fund has agreed to pay commitment fees on its pro rata portion of the line of credit, which amounted to $12 and is reflected in Miscellaneous Expense on the Statement of Operations. During the period, there were no borrowings on this line of credit.
8. Expense Reductions.
FMR voluntarily agreed to reimburse each class to the extent annual operating expenses exceeded certain levels of average net assets as noted in the table below. Some expenses, for example interest expense, including commitment fees, are excluded from this reimbursement.
The following classes were in reimbursement during the period:
Expense Limitations
Reimbursement from adviser
Initial Class
1.10%
$ 23,685
Service Class
1.20%
18,487
Service Class 2
1.35%
18,474
Initial Class R
1.10%
71,097
Service Class 2R
1.35%
18,475
Investor Class R
1.25% to 1.18%*
70,386
$ 220,604
* Expense limitation in effect at period end.
Effective February 1, 2008, the expense limitation changed to 1.18% for the Investor Class R.
Many of the brokers with whom FMR places trades on behalf of the Fund provided services to the Fund in addition to trade execution. These services included payments of certain expenses on behalf of the Fund totaling $6,377 for the period. In addition, through arrangements with the Fund's custodian and each class' transfer agent, credits realized as a result of uninvested cash balances were used to reduce the Fund's expenses. During the period, these credits reduced the Fund's custody expenses by $221.
Annual Report
9. Other.
The Fund's organizational documents provide former and current trustees and officers with a limited indemnification against liabilities arising in connection with the performance of their duties to the Fund. In the normal course of business, the Fund may also enter into contracts that provide general indemnifications. The Fund's maximum exposure under these arrangements is unknown as this would be dependent on future claims that may be made against the Fund. The risk of material loss from such claims is considered remote.
At the end of the period, FMR or its affiliates were the owners of record of approximately 100% of the total outstanding shares of the Fund.
10. Distributions to Shareholders.
Distributions to shareholders of each class were as follows:
Year ended December 31,
2008A
From net investment income
Initial Class
$ 7,875
Service Class
5,365
Service Class 2
4,404
Initial Class R
46,484
Service Class 2R
4,404
Investor Class R
49,928
Total
$ 118,460
A For the period January 23, 2008 (commencement of operations) to December 31, 2008.
11. Share Transactions.
Transactions for each class of shares were as follows:
Shares
Dollars
Year ended December 31,
2008A
2008A
Initial Class
Shares sold
107,445
$ 1,068,509
Reinvestment of distributions
1,615
7,875
Shares redeemed
(3,183)
(22,468)
Net increase (decrease)
105,877
$ 1,053,916
Service Class
Shares sold
80,001
$ 800,010
Reinvestment of distributions
1,098
5,365
Net increase (decrease)
81,099
$ 805,375
Service Class 2
Shares sold
80,001
$ 800,010
Reinvestment of distributions
902
4,404
Net increase (decrease)
80,903
$ 804,414
Initial Class R
Shares sold
856,743
$ 8,037,340
Reinvestment of distributions
9,532
46,484
Shares redeemed
(218,667)
(1,627,362)
Net increase (decrease)
647,608
$ 6,456,462
Service Class 2R
Shares sold
80,001
$ 800,010
Reinvestment of distributions
902
4,404
Net increase (decrease)
80,903
$ 804,414
Investor Class R
Shares sold
938,957
$ 8,629,449
Reinvestment of distributions
10,240
49,928
Shares redeemed
(256,154)
(1,939,873)
Net increase (decrease)
693,043
$ 6,739,504
A For the period January 23, 2008 (commencement of operations) to December 31, 2008.
Annual Report
Reportof Independent Registered Public Accounting Firm
To the Trustees of Variable Insurance Products Fund IV and Shareholders of VIP Emerging Markets Portfolio:
We have audited the accompanying statement of assets and liabilities of VIP Emerging Markets Portfolio (the Fund), a fund of Variable Insurance Products Fund IV, including the schedule of investments, as of December 31, 2008, and the related statement of operations , the statement of changes in net assets, and the financial highlights for the period from January 23, 2008 (commencement of operations) to December 31, 2008. These financial statements and financial highlights are the responsibility of the Fund's management. Our responsibility is to express an opinion on these financial statements and financial highlights based on our audit.
We conducted our audit in accordance with standards of the Public Company Accounting Oversight Board (United States). Those standards require that we plan and perform the audit to obtain reasonable assurance about whether the financial statements and financial highlights are free of material misstatement. The Fund is not required to have, nor were we engaged to perform, an audit of its internal control over financial reporting. Our audit included consideration of internal control over financial reporting as a basis for designing audit procedures that are appropriate in the circumstances, but not for the purpose of expressing an opinion on the effectiveness of the Fund's internal control over financial reporting. Accordingly, we express no such opinion. An audit also includes examining, on a test basis, evidence supporting the amounts and disclosures in the financial statements, assessing the accounting principles used and significant estimates made by management, as well as evaluating the overall financial statement presentation. Our procedures included confirmation of securities owned as of December 31, 2008, by correspondence with the custodians and brokers; where replies were not received from brokers, we performed other auditing procedures. We believe that our audit provides a reasonable basis for our opinion.
In our opinion, the financial statements and financial highlights referred to above present fairly, in all material respects, the financial position of VIP Emerging Markets Portfolio as of December 31, 2008, the results of its operations the changes in its net assets for each of the two years in the period then ended, and its financial highlights for the period from January 23, 2008 (commencement of operations) to December 31, 2008, in conformity with accounting principles generally accepted in the United States of America.
The Trustees, Member of the Advisory Board, and executive officers of the trust and fund, as applicable, are listed below. The Board of Trustees governs the fund and is responsible for protecting the interests of shareholders. The Trustees are experienced executives who meet periodically throughout the year to oversee the fund's activities, review contractual arrangements with companies that provide services to the fund, and review the fund's performance. Except for Edward C. Johnson 3d and James C. Curvey, each of the Trustees oversees 222 funds advised by FMR or an affiliate. Messrs. Johnson and Curvey oversee 380 funds advised by FMR or an affiliate.
The Trustees hold office without limit in time except that (a) any Trustee may resign; (b) any Trustee may be removed by written instrument, signed by at least two-thirds of the number of Trustees prior to such removal; (c) any Trustee who requests to be retired or who has become incapacitated by illness or injury may be retired by written instrument signed by a majority of the other Trustees; and (d) any Trustee may be removed at any special meeting of shareholders by a two-thirds vote of the outstanding voting securities of the trust. Each Trustee who is not an interested person (as defined in the 1940 Act) (Independent Trustee), shall retire not later than the last day of the calendar year in which his or her 72nd birthday occurs. The Independent Trustees may waive this mandatory retirement age policy with respect to individual Trustees. The executive officers and Advisory Board Member hold office without limit in time, except that any officer and Advisory Board Member may resign or may be removed by a vote of a majority of the Trustees at any regular meeting or any special meeting of the Trustees. Except as indicated, each individual has held the office shown or other offices in the same company for the past five years.
The fund's Statement of Additional Information (SAI) includes more information about the Trustees. To request a free copy, call Fidelity at 1-877-208-0098.
Interested Trustees*:
Correspondence intended for each Trustee who is an interested person may be sent to Fidelity Investments, 82 Devonshire Street, Boston, Massachusetts 02109.
Name, Age; Principal Occupation
Edward C. Johnson 3d (78)
Year of Election or Appointment: 1983
Mr. Johnson is Chairman of the Board of Trustees. Mr. Johnson serves as Chief Executive Officer, Chairman, and a Director of FMR LLC; Chairman and a Director of FMR; Chairman and a Director of Fidelity Research & Analysis Company (FRAC); Chairman and a Director of Fidelity Investments Money Management, Inc.; and Chairman and a Director of FMR Co., Inc. In addition, Mr. Johnson serves as Chairman and Director of FIL Limited. Previously, Mr. Johnson served as President of FMR LLC (2006-2007).
James C. Curvey (73)
Year of Election or Appointment: 2007
Mr. Curvey also serves as Trustee (2007-present) of other investment companies advised by FMR. Mr. Curvey is a Director of FMR and FMR Co., Inc. (2007-present). Mr. Curvey is also Vice Chairman (2006-present) and Director of FMR LLC. In addition, Mr. Curvey serves as an Overseer for the Boston Symphony Orchestra and a member of the Trustees of Villanova University.
* Trustees have been determined to be "Interested Trustees" by virtue of, among other things, their affiliation with the trust or various entities under common control with FMR. FMR Corp. merged with and into FMR LLC on October 1, 2007. Any references to FMR LLC for prior periods are deemed to be references to the prior entity.
Independent Trustees:
Correspondence intended for each Independent Trustee (that is, the Trustees other than the Interested Trustees) may be sent to Fidelity Investments, P.O. Box 55235, Boston, Massachusetts 02205-5235.
Name, Age; Principal Occupation
Dennis J. Dirks (60)
Year of Election or Appointment: 2005
Prior to his retirement in May 2003, Mr. Dirks was Chief Operating Officer and a member of the Board of The Depository Trust & Clearing Corporation (DTCC) (1999-2003). He also served as President, Chief Operating Officer, and Board member of The Depository Trust Company (DTC) (1999-2003) and President and Board member of the National Securities Clearing Corporation (NSCC) (1999-2003). In addition, Mr. Dirks served as Chief Executive Officer and Board member of the Government Securities Clearing Corporation (2001-2003), Chief Executive Officer and Board member of the Mortgage-Backed Securities Clearing Corporation (2001-2003), as a Trustee and a member of the Finance Committee of Manhattan College (2005-2008), and as a Trustee and a member of the Finance Committee of AHRC of Nassau County (2006-2008). Currently, Mr. Dirks serves as a member of the Board of Directors for The Brookville Center for Children's Services, Inc. (2009-present).
Alan J. Lacy (55)
Year of Election or Appointment: 2008
Mr. Lacy serves as Senior Adviser (2007-present) of Oak Hill Capital Partners, L.P. (a private equity firm). Mr. Lacy also served as Chief Executive Officer (2000-2005) and Vice Chairman (2005-2006) of Sears Holdings Corporation and Sears, Roebuck and Co. (retail). In addition, Mr. Lacy serves as a member of the Board of Directors of The Western Union Company (global money transfer, 2006-present) and Bristol-Myers Squibb (global pharmaceuticals, 2007-present). Mr. Lacy is a Trustee of the National Parks Conservation Association and The Field Museum of Natural History.
Ned C. Lautenbach (64)
Year of Election or Appointment: 2000
Mr. Lautenbach is Chairman of the Independent Trustees (2006-present). Mr. Lautenbach is an Advisory Partner of Clayton, Dubilier & Rice, Inc. (private equity investment firm). Previously, Mr. Lautenbach was with the International Business Machines Corporation (IBM) from 1968 until his retirement in 1998. Mr. Lautenbach serves as a Director of Eaton Corporation (diversified industrial) as well as the Philharmonic Center for the Arts in Naples, Florida. He also is a member of the Board of Trustees of Fairfield University (2005-present), as well as a member of the Council on Foreign Relations. Previously, Mr. Lautenbach served as a Director of Sony Corporation (2006-2007).
Joseph Mauriello (64)
Year of Election or Appointment: 2008
Prior to his retirement in January 2006, Mr. Mauriello served in numerous senior management positions including Deputy Chairman and Chief Operating Officer (2004-2005), and Vice Chairman of Financial Services (2002-2004) of KPMG LLP US (professional services firm, 1965-2005). Mr. Mauriello currently serves as a member of the Board of Directors of XL Capital Ltd. (global insurance and re-insurance company, 2006-present) and of Arcadia Resources Inc. (health care services and products, 2007-present). He also served as a Director of the Hamilton Funds of the Bank of New York (2006-2007).
Cornelia M. Small (64)
Year of Election or Appointment: 2005
Ms. Small is a member of the Investment Committee, and Chair (2008-present) and a member of the Board of Trustees of Smith College. Ms. Small also serves on the Investment Committee of the Berkshire Taconic Community Foundation (2008-present). Previously, Ms. Small served as Chairperson of the Investment Committee (2002-2008) of Smith College and as Co-Chair (2000-2003) of the Annual Fund for the Fletcher School of Law and Diplomacy. In addition, she served as Chief Investment Officer, Director of Global Equity Investments, and a member of the Board of Directors of Scudder, Stevens & Clark and Scudder Kemper Investments.
William S. Stavropoulos (69)
Year of Election or Appointment: 2001
Mr. Stavropoulos is Chairman Emeritus of the Board of Directors of The Dow Chemical Company, where he previously served in numerous senior management positions, including President (1993-2000; 2002-2003), CEO (1995-2000; 2002-2004), Chairman of the Executive Committee (2000-2006), and as a member of the Board of Directors (1990-2006). Currently, he is a Director of Teradata Corporation (data warehousing and technology solutions, 2008-present), Chemical Financial Corporation, Maersk Inc. (industrial conglomerate), Tyco International, Inc. (multinational manufacturing and services, 2007-present), and a member of the Advisory Board for Metalmark Capital (private equity investment firm, 2005-present). He is a special advisor to Clayton, Dubilier & Rice, Inc. (private equity investment). In addition, Mr. Stavropoulos is a member of the University of Notre Dame Advisory Council for the College of Science.
David M. Thomas (59)
Year of Election or Appointment: 2008
Previously, Mr. Thomas served as Executive Chairman (2005-2006) and Chairman and Chief Executive Officer (2000-2005) of IMS Health, Inc. (pharmaceutical and healthcare information solutions). In addition, Mr. Thomas serves as a member of the Board of Directors of Fortune Brands, Inc. (consumer products holding company), and Interpublic Group of Companies, Inc. (marketing communication, 2004-present).
Michael E. Wiley (58)
Year of Election or Appointment: 2008
Mr. Wiley also serves as a member of the Board of Trustees of the University of Tulsa (2000-2006; 2007-present). He serves as a Director of Tesoro Corporation (independent oil refiner and marketer, 2005-present), and a Director of Bill Barrett Corporation (exploration and production company, 2005-present). In addition, he also serves as a Director of Post Oak Bank (privately-held bank, 2004-present). Previously, Mr. Wiley served as a Sr. Energy Advisor of Katzenbach Partners, LLC (consulting firm, 2006-2007), as an Advisory Director of Riverstone Holdings (private investment firm), Chairman, President, and CEO of Baker Hughes, Inc. (oilfield services company, 2000-2004), and as Director of Spinnaker Exploration Company (exploration and production company, 2001-2005).
Annual Report
Advisory Board Member and Executive Officers**:
Correspondence intended for each executive officer and Mr. Lynch may be sent to Fidelity Investments, 82 Devonshire Street, Boston, Massachusetts 02109.
Name, Age; Principal Occupation
Peter S. Lynch (64)
Year of Election or Appointment: 2003
Member of the Advisory Board of Fidelity's Equity and High Income Funds. Mr. Lynch is Vice Chairman and a Director of FMR, and Vice Chairman (2001-present) and a Director of FMR Co., Inc. Previously, Mr. Lynch served as a Trustee of the Fidelity funds (1990-2003). In addition, he serves as a Trustee of Boston College and as the Chairman of the Inner-City Scholarship Fund. Previously, Mr. Lynch served on the Special Olympics International Board of Directors (1997-2006).
Kenneth B. Robins (39)
Year of Election or Appointment: 2008
President and Treasurer of Fidelity's Equity and High Income Funds. Mr. Robins is an employee of Fidelity Investments (2004-present). Before joining Fidelity Investments, Mr. Robins worked at KPMG LLP, where he was a partner in KPMG's department of professional practice (2002-2004).
Walter C. Donovan (46)
Year of Election or Appointment: 2007
Vice President of Fidelity's Equity Funds. Mr. Donovan also serves as President of FMR and FMR Co., Inc., and Executive Vice President of Fidelity Investments Money Management, Inc. (2007-present). Previously, Mr. Donovan served as Executive Vice President of FMR and FMR Co., Inc. (2005-2007) and Senior Vice President of FMR (2003-2005) and FMR Co., Inc. (2004-2005).
Eric M. Wetlaufer (46)
Year of Election or Appointment: 2006
Vice President of Fidelity's International Equity Funds. Mr. Wetlaufer also serves as Group Chief Investment Officer of FMR. Mr. Wetlaufer is Chairman, Chief Executive Officer, and President of Fidelity Management & Research (Hong Kong) Limited (2008-present); Chairman, Chief Executive Officer, President, and a Director of Fidelity Management & Research (Japan) Inc. (2008-present); Chairman and Chief Executive Officer (2007-present) and President and a Director (2006-present) of Fidelity Management & Research (U.K.) Inc. and President and a Director of Fidelity Research & Analysis Company (2006-present). Before joining Fidelity Investments in 2005, Mr. Wetlaufer was a partner in Oxhead Capital Management (2004-2005) and a Chief Investment Officer of Putnam Investments (1997-2003).
Scott C. Goebel (40)
Year of Election or Appointment: 2008
Secretary and Chief Legal Officer (CLO) of the Fidelity funds. Mr. Goebel also serves as General Counsel, Secretary, and Senior Vice President of FMR (2008-present); Deputy General Counsel of FMR LLC; Chief Legal Secretary of Fidelity Management & Research (Hong Kong) Limited (2008-present) and Assistant Secretary of Fidelity Management & Research (Japan) Inc. (2008-present). Previously, Mr. Goebel served as Assistant Secretary of the Funds (2007-2008) and as Vice President and Secretary of Fidelity Distributors Corporation (FDC) (2005-2007).
John B. McGinty, Jr. (46)
Year of Election or Appointment: 2008
Assistant Secretary of Fidelity's Equity and High Income Funds. Mr. McGinty is an employee of Fidelity Investments (2004-present). Mr. McGinty also serves as Senior Vice President, Secretary, and Chief Legal Officer of FDC (2007-present). Before joining Fidelity Investments, Mr. McGinty practiced law at Ropes & Gray, LLP.
Holly C. Laurent (54)
Year of Election or Appointment: 2008
Anti-Money Laundering (AML) Officer of the Fidelity funds. Ms. Laurent is an employee of Fidelity Investments. Previously, Ms. Laurent was Senior Vice President and Head of Legal for Fidelity Business Services India Pvt. Ltd. (2006-2008), Senior Vice President, Deputy General Counsel and Group Head for FMR LLC (2005-2006).
Christine Reynolds (50)
Year of Election or Appointment: 2008
Chief Financial Officer of the Fidelity funds. Ms. Reynolds became President of Fidelity Pricing and Cash Management Services (FPCMS) in August 2008. She served as Chief Operating Officer of FPCMS from 2007 through July 2008. Previously, Ms. Reynolds served as President, Treasurer, and Anti-Money Laundering officer of the Fidelity funds (2004-2007). Before joining Fidelity Investments, Ms. Reynolds worked at PricewaterhouseCoopers LLP (PwC) (1980-2002), where she was an audit partner with PwC's investment management practice.
Kenneth A. Rathgeber (61)
Year of Election or Appointment: 2004
Chief Compliance Officer of Fidelity's Equity and High Income Funds. Mr. Rathgeber is Chief Compliance Officer of Fidelity Management & Research (Hong Kong) Limited (2008-present), Fidelity Management & Research (Japan) Inc. (2008-present), FMR (2005-present), FMR Co., Inc. (2005-present), Fidelity Management & Research (U.K.) Inc. (2005-present), Fidelity Research & Analysis Company (2005-present), Fidelity Investments Money Management, Inc. (2005-present), and Strategic Advisers, Inc. (2005-present).
Bryan A. Mehrmann (47)
Year of Election or Appointment: 2005
Deputy Treasurer of the Fidelity funds. Mr. Mehrmann is an employee of Fidelity Investments. Previously, Mr. Mehrmann served as Vice President of Fidelity Investments Institutional Services Group (FIIS)/Fidelity Investments Institutional Operations Company, Inc. (FIIOC) Client Services (1998-2004).
Adrien E. Deberghes (41)
Year of Election or Appointment: 2008
Deputy Treasurer of Fidelity's Equity and High Income Funds. Mr. Deberghes is an employee of Fidelity Investments (2008-present). Previously, Mr. Deberghes served as Senior Vice President of Mutual Fund Administration at State Street Corporation (2007-2008), Senior Director of Mutual Fund Administration at Investors Bank & Trust (2005-2007), and Director of Finance for Dunkin' Brands (2000-2005).
Robert G. Byrnes (42)
Year of Election or Appointment: 2005
Assistant Treasurer of the Fidelity funds. Mr. Byrnes is an employee of Fidelity Investments (2005-present). Previously, Mr. Byrnes served as Vice President of Fidelity Pricing and Cash Management Services (FPCMS) (2003-2005). Before joining Fidelity Investments, Mr. Byrnes worked at Deutsche Asset Management where he served as Vice President of the Investment Operations Group (2000-2003).
Paul M. Murphy (61)
Year of Election or Appointment: 2007
Assistant Treasurer of the Fidelity funds. Mr. Murphy is an employee of Fidelity Investments (2007-present). Previously, Mr. Murphy served as Chief Financial Officer of the Fidelity Funds (2005-2006), Vice President and Associate General Counsel of FMR (2007), and Senior Vice President of Fidelity Pricing and Cash Management Services (FPCMS) (1994-2007).
Gary W. Ryan (50)
Year of Election or Appointment: 2005
Assistant Treasurer of the Fidelity funds. Mr. Ryan is an employee of Fidelity Investments. Previously, Mr. Ryan served as Vice President of Fund Reporting in Fidelity Pricing and Cash Management Services (FPCMS) (1999-2005).
** FMR Corp. merged with and into FMR LLC on October 1, 2007. Any references to FMR LLC for prior periods are deemed to be references to the prior entity.
The amounts per share which represent income derived from sources within, and taxes paid to, foreign countries or possessions of the United States are as follows:
Pay Date
Income
Taxes
Initial Class
12/19/2008
$0.084
$0.014
12/30/2008
$0.005
$0.000
Service Class
12/19/2008
$0.076
$0.014
12/30/2008
$0.005
$0.000
Service Class 2
12/19/2008
$0.064
$0.014
12/30/2008
$0.005
$0.000
The fund will notify shareholders in January 2009 of amounts for use in preparing 2008 income tax returns.
A special meeting of the fund's shareholders was held on May 14, 2008. The results of votes taken among shareholders on the proposals before them are reported below. Each vote reported represents one dollar of net asset value held on the record date for the meeting.
PROPOSAL 1
To elect a Board of Trustees.A
# of Votes
% of Votes
James C. Curvey
Affirmative
82,890,712.47
95.991
Withheld
3,461,988.43
4.009
TOTAL
86,352,700.90
100.000
Dennis J. Dirks
Affirmative
82,970,372.75
96.083
Withheld
3,382,328.15
3.917
TOTAL
86,352,700.90
100.000
Edward C. Johnson 3d
Affirmative
82,689,162.78
95.757
Withheld
3,663,538.12
4.243
TOTAL
86,352,700.90
100.000
Alan J. Lacy
Affirmative
83,041,222.35
96.165
Withheld
3,311,478.55
3.835
TOTAL
86,352,700.90
100.000
Ned C. Lautenbach
Affirmative
82,983,853.72
96.099
Withheld
3,368,847.18
3.901
TOTAL
86,352,700.90
100.000
Joseph Mauriello
Affirmative
83,138,122.14
96.277
Withheld
3,214,578.76
3.723
TOTAL
86,352,700.90
100.000
Cornelia M. Small
Affirmative
83,095,438.06
96.228
Withheld
3,257,262.84
3.772
TOTAL
86,352,700.90
100.000
William S. Stavropoulos
Affirmative
82,929,113.95
96.035
Withheld
3,423,586.95
3.965
TOTAL
86,352,700.90
100.000
David M. Thomas
Affirmative
83,095,487.87
96.228
Withheld
3,257,213.03
3.772
TOTAL
86,352,700.90
100.000
Michael E. Wiley
Affirmative
83,048,523.75
96.174
Withheld
3,304,177.15
3.826
TOTAL
86,352,700.90
100.000
PROPOSAL 2
To amend the Declaration of Trust to reduce the required quorum for future shareholder meetings.A
# of Votes
% of Votes
Affirmative
74,393,635.26
86.151
Against
8,745,543.59
10.128
Abstain
3,213,522.05
3.721
TOTAL
86,352,700.90
100.000
ADenotes trust-wide proposal and voting results.
Semiannual Report
BoardApproval of Investment Advisory Contracts and Management Fees
VIP Emerging Markets Portfolio
Each year, typically in July, the Board of Trustees, including the Independent Trustees (together, the Board), votes on the renewal of the management contract and sub-advisory agreements (together, the Advisory Contracts) for the fund. The Board, assisted by the advice of fund counsel and Independent Trustees' counsel, requests and considers a broad range of information throughout the year.
The Board meets regularly and, acting directly and through its separate committees, requests and receives information concerning, and considers at each of its meetings factors that are relevant to, its annual consideration of the renewal of the fund's Advisory Contracts, including the services and support provided to the fund and its shareholders. At the time of the renewal, the Board had 12 standing committees, each composed of Independent Trustees with varying backgrounds, to which the Board has assigned specific subject matter responsibilities in order to enhance effective decision-making by the Board. Each committee has a written charter outlining the structure and purposes of the committee. The Board also meets as needed to consider matters specifically related to the Board's annual consideration of the renewal of Advisory Contracts.
At its July 2008 meeting, the Board of Trustees, including the Independent Trustees, unanimously determined to renew the fund's Advisory Contracts. In reaching its determination, the Board considered a broad range of information. The Board also approved agreements with foreign sub-advisers Fidelity Management & Research (Japan) Inc. and Fidelity Management & Research (Hong Kong) Limited, as well as amendments to the fund's agreement with Fidelity Management & Research (U.K.) Inc.
In considering whether to renew the Advisory Contracts for the fund, the Board ultimately reached a determination, with the assistance of fund counsel and Independent Trustees' counsel and through the exercise of its business judgment, that the renewal of the Advisory Contracts and the compensation to be received by Fidelity under the management contract is consistent with Fidelity's fiduciary duty under applicable law. The Board's decision to renew the Advisory Contracts was not based on any single factor, but rather was based on a comprehensive consideration of all the information provided to the Board at its meetings throughout the year. The Board, in reaching its determination to renew the Advisory Contracts, is aware that shareholders in the fund have a broad range of investment choices available to them, including a wide choice among mutual funds offered by competitors to Fidelity, and that the fund's shareholders, with the opportunity to review and weigh the disclosure provided by the fund in its prospectus and other public disclosures, have chosen to invest in this fund, managed by Fidelity.
Nature, Extent, and Quality of Services Provided. The Board considered staffing within the investment adviser, FMR, and the sub-advisers (together, the Investment Advisers), including the backgrounds of the fund's investment personnel and the fund's investment objective and discipline. The Independent Trustees also had discussions with senior management of Fidelity's investment operations and investment groups. The Board considered the structure of the portfolio manager compensation program and whether this structure provides appropriate incentives.
Resources Dedicated to Investment Management and Support Services. The Board reviewed the size, education, and experience of the Investment Advisers' investment staff, their use of technology, and the Investment Advisers' approach to recruiting, training, and retaining portfolio managers and other research, advisory, and management personnel. The Board noted that Fidelity's analysts have access to a variety of technological tools that enable them to perform both fundamental and quantitative analysis and to specialize in various disciplines. The Board considered Fidelity's extensive global research capabilities that enable the Investment Advisers to aggregate data from various sources in an effort to produce positive investment results. The Board also considered that Fidelity's portfolio managers and analysts have access to daily portfolio attribution that allows for monitoring of a fund's portfolio, as well as an electronic communication system that provides immediate real-time access to research concerning issuers and credit enhancers.
Shareholder and Administrative Services. The Board considered (i) the nature, extent, quality, and cost of advisory, administrative, distribution, and shareholder services performed by the Investment Advisers and their affiliates under the Advisory Contracts and under separate agreements covering transfer agency, pricing and bookkeeping, and securities lending services for the fund; (ii) the nature and extent of the Investment Advisers' supervision of third party service providers, principally custodians and subcustodians; and (iii) the resources devoted to, and the record of compliance with, the fund's compliance policies and procedures. The Board also reviewed the allocation of fund brokerage, including allocations to brokers affiliated with the Investment Advisers, the use of brokerage commissions to pay fund expenses, and the use of "soft" commission dollars to pay for research services. The Board further considered that Fidelity voluntarily pays for market data out of its own resources.
The Board noted that the growth of fund assets across the complex allows Fidelity to reinvest in the development of services designed to enhance the value or convenience of the Fidelity funds as investment vehicles. These services include 24-hour access to account information and market information through phone representatives and over the Internet, and investor education materials and asset allocation tools.
Investment in a Large Fund Family. The Board considered the benefits to shareholders of investing in a Fidelity fund, including the benefits of investing in a fund that is part of a large family of funds offering a variety of investment disciplines and providing for a large variety of mutual fund investor services. The Board noted that Fidelity has taken a number of actions over the previous year that benefited particular funds, including (i) dedicating additional resources to investment research and to restructure the investment research teams; (ii) contractually agreeing to reduce the management fees on Fidelity's Institutional Money Market Funds and launching Class IV and Institutional Class of certain of these funds; (iii) reducing the transfer agent fees for the Fidelity Select Portfolios and Investor Class of the VIP funds; and (iv) launching Class K of 29 equity funds as a lower-fee class available to certain employer-sponsored retirement plans.
Annual Report
Investment Performance. The Board considered whether the fund has operated within its investment objective, as well as its record of compliance with its investment restrictions. The Board noted that it is not possible to evaluate performance in any comprehensive fashion because the fund had been in operation for less than one calendar year. Once the fund has been in operation for at least one calendar year, the Board will review the fund's absolute investment performance for each class, as well as the fund's relative investment performance for each class measured against a broad-based securities market index and a peer group of mutual funds.
Based on its review, the Board concluded that the nature, extent, and quality of the services provided to the fund will benefit the fund's shareholders, particularly in light of the Board's view that the fund's shareholders benefit from investing in a fund that is part of a large family of funds offering a variety of investment disciplines and services.
Competitiveness of Management Fee and Total Fund Expenses. The Board considered the fund's management fee and projected total operating expenses of each class of the fund in reviewing the Advisory Contracts. The Board noted that the fund's management fee rate is lower than the median fee rate of funds with similar Lipper investment objective categories and comparable management fee characteristics. The Board considered that the projected total operating expenses are comparable to those of similar classes and funds that Fidelity offers to shareholders.
Based on its review, the Board concluded that the fund's management fee and the projected total expenses of each class of the fund were fair and reasonable in light of the services that the fund and its shareholders receive and the other factors considered.
Costs of the Services and Profitability. The fund has only recently commenced operations and therefore no revenue, cost, or profitability data was available for the Board to review in respect of the fund at the time in renew the Advisory Contracts. In connection with its future renewal of the fund's Advisory Contracts, the Board will consider the revenues earned and the expenses incurred by Fidelity in conducting the business of developing, marketing, distributing, managing, administering and servicing the fund and its shareholders.
Economies of Scale. The Board considered whether there have been economies of scale in respect of the management of the Fidelity funds, whether the Fidelity funds (including the fund) have appropriately benefited from any such economies of scale, and whether there is potential for realization of any further economies of scale. The Board considered the extent to which the fund will benefit from economies of scale through increased services to the fund, through waivers or reimbursements, or through fee or expense reductions.
The Board recognized that the fund's management contract incorporates a "group fee" structure, which provides for lower group fee rates as total fund assets under FMR's management increase, and for higher group fee rates as total fund assets under FMR's management decrease. FMR determines the group fee rates based on a tiered asset "breakpoint" schedule. The Board considered that the group fee is designed to deliver the benefits of economies of scale to fund shareholders when total fund assets increase, even if assets of any particular fund are unchanged or have declined, because some portion of Fidelity's costs are attributable to services provided to all Fidelity funds, and all funds benefit if those costs can be allocated among more assets. The Board concluded that, given the group fee structure, fund shareholders will achieve a certain level of economies of scale as assets under FMR's management increase at the fund complex level, regardless of whether Fidelity achieves any such economies of scale.
The Board further concluded that any potential economies of scale are being shared between fund shareholders and Fidelity in an appropriate manner.
Additional Information Requested by the Board. In order to develop fully the factual basis for consideration of the Fidelity funds' Advisory Contracts, the Board requested and received additional information on certain topics, including (i) fund performance trends and actions to be taken by FMR to improve certain funds' overall performance; (ii) portfolio manager changes that have occurred during the past year; (iii) Fidelity's fund profitability methodology, the profitability of certain fund service providers, and profitability trends for certain funds; (iv) Fidelity's compensation structure for portfolio managers and key personnel, including its effects on fund profitability and the extent to which portfolio manager compensation is linked to fund performance; (v) Fidelity's fee structures and rationale for recommending different fees among categories of funds; and (vi) Fidelity's rationale for recommending which funds should have a performance adjustment component as part of their management fees.
Based on its evaluation of all of the conclusions noted above, and after considering all material factors, the Board ultimately concluded that the advisory fee structures are fair and reasonable, and that the fund's Advisory Contracts should be renewed.
Annual Report
Annual Report
Investment Adviser
Fidelity Management & Research Company Boston, MA
Investment Sub-Advisers
FMR Co., Inc.
Fidelity Management & Research (U.K.) Inc.
Fidelity Management & Research (Hong Kong) Limited
Fidelity Management & Research (Japan) Inc.
Fidelity Research & Analysis Company
FIL Investment Advisors
FIL Investment Advisors (U.K.) Ltd.
Fidelity Investments Japan Limited
General Distributor
Fidelity Distributors Corporation Boston, MA
Transfer and Service Agents
Fidelity Investments Institutional Operations Company, Inc. Boston, MA
Fidelity Service Company, Inc. Boston, MA
Custodian
State Street Bank and Trust Company Boston, MA
VIPEM-ANN-0209
1.858135.100
Fidelity® Variable Insurance Products:
Emerging Markets Portfolio - Class R
Annual Report
December 31, 2008 (2_fidelity_logos) (Registered_Trademark)
To view a fund's proxy voting guidelines and proxy voting record for the 12-month period ended June 30, visit http://www.fidelity.com (search for "proxy voting guidelines") or visit the Securities and Exchange Commission's (SEC) web site at http://www.sec.gov. You may also call 1-877-208-0098 to request a free copy of the proxy voting guidelines.
Fidelity Variable Insurance Products are separate account options which are purchased through a variable insurance contract.
Standard & Poor's, S&P and S&P 500 are registered service marks of The McGraw-Hill Companies, Inc. and have been licensed for use by Fidelity Distributors Corporation.
Other third party marks appearing herein are the property of their respective owners.
All other marks appearing herein are registered or unregistered trademarks or service marks of FMR LLC or an affiliated company.
This report and the financial statements contained herein are submitted for the general information of the shareholders of the fund. This report is not authorized for distribution to prospective investors in the fund unless preceded or accompanied by an effective prospectus.
A fund files its complete schedule of portfolio holdings with the SEC for the first and third quarters of each fiscal year on Form N-Q. Forms N-Q are available on the SEC's web site at http://www.sec.gov. A fund's Forms N-Q may be reviewed and copied at the SEC's Public Reference Room in Washington, DC. Information regarding the operation of the SEC's Public Reference Room may be obtained by calling 1-800-SEC-0330. For a complete list of a fund's portfolio holdings, view the most recent holdings listing, semiannual report, or annual report on Fidelity's web site at http://www.fidelity.com or http://www.advisor.fidelity.com, as applicable.
NOT FDIC INSURED · MAY LOSE VALUE · NO BANK GUARANTEE
Neither the fund nor Fidelity Distributors Corporation is a bank.
Average annual total return reflects the change in the value of an investment, assuming reinvestment of the class' dividend income and capital gains (the profits earned upon the sale of securities that have grown in value, if any) and assuming a constant rate of performance each year. During periods of reimbursement by Fidelity, a fund's total return will be greater than it would be had the reimbursement not occurred. Performance numbers are net of all underlying fund operating expenses, but do not include any insurance charges imposed by your insurance company's separate account. If performance information included the effect of these additional charges, the total returns would have been lower. How a fund did yesterday is no guarantee of how it will do tomorrow.
Average annual total returns take VIP Emerging Markets Portfolio's cumulative total return and show you what would have happened if VIP Emerging Markets Portfolio shares had performed at a constant rate each year. These numbers will be reported once the fund is a year old.
$10,000 Over Life of Fund
Let's say hypothetically that $10,000 was invested in VIP Emerging Markets Portfolio - Initial Class R on January 23, 2008, when the fund started. The chart shows how the value of your investment would have changed, and also shows how the MSCI® Emerging Markets Index performed over the same period.
Comments from Robert von Rekowsky, Portfolio Manager of VIP Emerging Markets Portfolio
By year-end 2008, the vicious credit crisis sparked in the U.S. had spread like wildfire across the world's capital markets, stunting global growth, toppling commodity prices, changing the face of the global financial system and chasing risk-averse investors toward the sidelines. The U.S. equity markets, as measured by the Dow Jones Industrial AverageSM and Standard & Poor's 500SM Index, fell hard as a result, declining 31.93% and 37.00%, respectively, while the technology-laden NASDAQ Composite® Index slid 40.03%. Foreign market stocks saw an even sharper decline, as illustrated by the 43.28% loss of the MSCI® EAFE® Index (Europe, Australasia, Far East), a gauge of developed stock markets outside the U.S. and Canada. A generally stronger U.S. dollar also held back returns for U.S. investors in foreign equities. Emerging-markets stocks - the global performance leader only a year ago - fell harder still, dropping 53.18%, as measured by the MSCI Emerging Markets Index. The only clear winners during the past year were assets backed by the U.S. government, as investors fled from risk. Thus, the Barclays Capital U.S. Treasury Bond Index climbed 13.74% for the year, while the Barclays Capital U.S. Aggregate Bond Index - a broader measure of the U.S. investment-grade bond universe - gained a more modest 5.24%. By contrast, high-yield bonds bore the brunt of investors' increasing wariness over risk, as expressed by the Merrill Lynch® U.S. High Yield Master II Constrained Index's drop of 26.11%. The emerging-markets bond category also felt the shock of investors' risk-averse sentiment, with the JPMorgan Emerging Markets Bond Index (EMBI) Global falling 10.91%. Meanwhile, the Citigroup® Non-U.S. Group of 7 Index - representing the debt performance of major global economies, excluding the United States - eked out a 1.69% gain.
From its inception on January 23, 2008, through December 31, 2008, the fund lagged the -44.78% return of the MSCI® Emerging Markets Index. (For specific portfolio results, please refer to the financial highlights section of this report.) Versus the MSCI index, unfavorable stock picking accounted for most of the fund's shortfall, with Russia, South Africa and Brazil detracting the most. An overweighting in Russia also was counterproductive. From a sector standpoint, the fund was hurt the most by stock selection in materials, energy, financials, consumer discretionary and industrials. Russian natural gas producer and distributor Gazprom sold off sharply on lower energy prices and concerns about the steep losses suffered by the broader Russian market. Underweighting index components Taiwan Semiconductor Manufacturing and Israel's Teva Pharmaceutical Industries proved to be ill-timed, as both outperformed the index. Meanwhile, China Mobile, that nation's dominant wireless carrier, suffered from changes in the telecom regulatory landscape that hurt the company relative to its peers. Most of the damage to performance came from overweighting the stock during the first half of the period. In the case of Brazilian steel producer Siderurgica Nacional, both the timing of our purchases and the fund's overweighting hurt performance. Some of the detractors I've mentioned were sold by period end. Conversely, an above-average cash position was helpful given the steep slide in stocks. Individual contributors included two of China's biggest banks, China Construction Bank and Industrial & Commercial Bank of China, which benefited from their solid balance sheets and prospects for increased infrastructure spending by the Chinese government. On the other hand, underweighting benchmark component ICICI Bank, based in India, was timely. Further, my decision to sell Russian nickel producer MMC Norilsk Nickel before the worst of the stock's decline of more than 71% aided the fund's results.
The views expressed above reflect those of the portfolio manager(s) only through the end of the period as stated on the cover of this report and do not necessarily represent the views of Fidelity or any other person in the Fidelity organization. Any such views are subject to change at any time based upon market or other conditions and Fidelity disclaims any responsibility to update such views. These views may not be relied on as investment advice and, because investment decisions for a Fidelity fund are based on numerous factors, may not be relied on as an indication of trading intent on behalf of any Fidelity fund.
As a shareholder of the Fund, you incur two types of costs: (1) transaction costs, including redemption fees, and (2) ongoing costs, including management fees, distribution and/or service (12b-1) fees and other Fund expenses. This Example is intended to help you understand your ongoing costs (in dollars) of investing in the Fund and to compare these costs with the ongoing costs of investing in other mutual funds.
The Example is based on an investment of $1,000 invested at the beginning of the period and held for the entire period (July 1, 2008 to December 31, 2008).
Actual Expenses
The first line of the accompanying table for each class of the Fund provides information about actual account values and actual expenses. You may use the information in this line, together with the amount you invested, to estimate the expenses that you paid over the period. Simply divide your account value by $1,000.00 (for example, an $8,600 account value divided by $1,000.00 = 8.6), then multiply the result by the number in the first line for a class of the Fund under the heading entitled "Expenses Paid During Period" to estimate the expenses you paid on your account during this period. The estimate of expenses does not include any fees or other expenses of any variable annuity or variable life insurance product. If they were, the estimate of expenses you paid during the period would be higher, and your ending account value would be lower. In addition, the Fund, as a shareholder in the underlying Fidelity Central Funds, will indirectly bear its pro rata share of the fees and expenses incurred by the underlying Fidelity Central Funds. These fees and expenses are not included in the Fund's annualized expense ratio used to calculate the expense estimate in the table below.
Hypothetical Example for Comparison Purposes
The second line of the accompanying table for each class of the Fund provides information about hypothetical account values and hypothetical expenses based on a Class' actual expense ratio and an assumed rate of return of 5% per year before expenses, which is not the Class' actual return. The hypothetical account values and expenses may not be used to estimate the actual ending account balance or expenses you paid for the period. You may use this information to compare the ongoing costs of investing in the Fund and other funds. To do so, compare this 5% hypothetical example with the 5% hypothetical examples that appear in the shareholder reports of the other funds. The estimate of expenses does not include any fees or other expenses of any variable annuity or variable life insurance product. If they were, the estimate of expenses you paid during the period would be higher, and your ending account value would be lower. In addition, the Fund, as a shareholder in the underlying Fidelity Central Funds, will indirectly bear its pro rata share of the fees and expenses incurred by the underlying Fidelity Central Funds. These fees and expenses are not included in the Fund's annualized expense ratio used to calculate the expense estimate in the table below.
Please note that the expenses shown in the table are meant to highlight your ongoing costs only and do not reflect any transaction costs. Therefore, the second line of the table is useful in comparing ongoing costs only, and will not help you determine the relative total costs of owning different funds. In addition, if these transactional costs were included, your costs would have been higher.
Annualized Expense Ratio
Beginning Account Value July 1, 2008
Ending Account Value December 31, 2008
Expenses Paid During Period* July 1, 2008 to December 31, 2008
Initial Class
1.10%
Actual
$ 1,000.00
$ 475.50
$ 4.08
HypotheticalA
$ 1,000.00
$ 1,019.61
$ 5.58
Service Class
1.20%
Actual
$ 1,000.00
$ 474.80
$ 4.45
HypotheticalA
$ 1,000.00
$ 1,019.10
$ 6.09
Service Class 2
1.35%
Actual
$ 1,000.00
$ 474.10
$ 5.00
HypotheticalA
$ 1,000.00
$ 1,018.35
$ 6.85
Initial Class R
1.10%
Actual
$ 1,000.00
$ 475.10
$ 4.08
HypotheticalA
$ 1,000.00
$ 1,019.61
$ 5.58
Service Class 2R
1.35%
Actual
$ 1,000.00
$ 474.10
$ 5.00
HypotheticalA
$ 1,000.00
$ 1,018.35
$ 6.85
Investor Class R
1.18%
Actual
$ 1,000.00
$ 474.60
$ 4.37
HypotheticalA
$ 1,000.00
$ 1,019.20
$ 5.99
A 5% return per year before expenses
*Expenses are equal to each Class' annualized expense ratio, multiplied by the average account value over the period, multiplied by 184/366 (to reflect the one-half year period).
Annual Report
Investment Changes (Unaudited)
Geographic Diversification (% of fund's net assets)
As of December 31, 2008
Brazil
14.0%
South Africa
10.2%
United States of America
9.6%
China
8.7%
Korea (South)
8.6%
Hong Kong
6.4%
India
5.9%
Taiwan
5.1%
Russia
4.8%
Other
26.7%
As of June 30, 2008
Russia
17.6%
Brazil
15.7%
Korea (South)
10.5%
South Africa
6.0%
United States of America
5.4%
Hong Kong
5.3%
Taiwan
5.2%
China
4.7%
Indonesia
4.3%
Other
25.3%
Asset Allocation
% of fund's net assets
% of fund's net assets 6 months ago
Stocks and Investment Companies
91.1
95.4
Short-Term Investments and Net Other Assets
8.9
4.6
Top Ten Stocks as of December 31, 2008
% of fund's net assets
% of fund's net assets 6 months ago
China Mobile (Hong Kong) Ltd. (Hong Kong, Wireless Telecommunication Services)
3.9
3.2
Petroleo Brasileiro SA - Petrobras (PN) (non-vtg.) (Brazil, Oil, Gas & Consumable Fuels)
3.9
5.8
Companhia Vale do Rio Doce (PN-A) sponsored ADR (Brazil, Metals & Mining)
Industrial & Commercial Bank of China (China, Commercial Banks)
1.9
1.0
OAO Gazprom sponsored ADR (Russia, Oil, Gas & Consumable Fuels)
1.8
5.7
MTN Group Ltd. (South Africa, Wireless Telecommunication Services)
1.6
1.0
China Construction Bank Corp. (H Shares) (China, Commercial Banks)
1.6
1.4
25.9
Market Sectors as of December 31, 2008
% of fund's net assets
% of fund's net assets 6 months ago
Financials
19.7
17.2
Energy
14.7
25.2
Telecommunication Services
12.7
8.9
Materials
11.1
20.4
Information Technology
10.7
7.0
Consumer Staples
5.4
2.8
Utilities
4.8
2.8
Consumer Discretionary
4.5
4.9
Industrials
4.3
6.2
Health Care
3.2
0.0
Annual Report
Investments December 31, 2008
Showing Percentage of Net Assets
Common Stocks - 91.1%
Shares
Value
Australia - 0.2%
Sino Gold Mining Ltd. (a)
3,690
$ 13,241
Bahrain - 0.1%
Gulf Finance House BSC:
(Reg. S) unit
800
6,800
GDR (c)
600
5,100
TOTAL BAHRAIN
11,900
Bermuda - 1.2%
Aquarius Platinum Ltd. (Australia)
4,612
12,450
Central European Media Enterprises Ltd. Class A (a)
1,000
21,720
Credicorp Ltd. (NY Shares)
1,000
49,960
Ports Design Ltd.
14,000
17,079
TOTAL BERMUDA
101,209
Brazil - 14.0%
America Latina Logistica SA unit
6,900
29,380
Anhanguera Educacional Participacoes SA unit
1,415
7,522
Banco ABC Brasil SA
1,000
2,278
Banco Bradesco SA:
(PN)
7,750
77,124
(PN) sponsored ADR
2,200
21,714
Companhia Energetica de Minas Gerais (CEMIG) (PN) sponsored ADR (non-vtg.)
3,400
46,716
Companhia Siderurgica Nacional SA (CSN) sponsored ADR
5,200
66,612
Companhia Vale do Rio Doce (PN-A) sponsored ADR
24,700
263,055
GVT Holding SA (a)
3,500
38,564
MRV Engenharia e Participacoes SA
2,200
9,686
Net Servicos de Comunicacao SA sponsored ADR
4,700
27,354
OGX Petroleo e Gas Participacoes SA
100
23,704
Petroleo Brasileiro SA - Petrobras:
(PN) (non-vtg.)
11,100
111,777
(PN) sponsored ADR (non-vtg.)
10,100
206,141
sponsored ADR
1,100
26,939
Redecard SA
4,100
47,064
Uniao de Bancos Brasileiros SA (Unibanco):
unit
2,800
18,166
GDR
900
58,158
Usinas Siderurgicas de Minas Gerais SA - Usiminas (PN-A) (non-vtg.)
1,800
20,726
Votorantim Celulose e Papel SA sponsored ADR (non-vtg.)
6,100
48,373
TOTAL BRAZIL
1,151,053
Cayman Islands - 1.1%
Chaoda Modern Agriculture (Holdings) Ltd.
56,160
36,088
China Dongxiang Group Co. Ltd.
73,000
17,838
Shares
Value
Suntech Power Holdings Co. Ltd. sponsored ADR (a)
900
$ 10,530
The United Laboratories International Holdings Ltd.
32,000
8,503
Xinao Gas Holdings Ltd.
6,000
6,365
Yingli Green Energy Holding Co. Ltd. ADR (a)
1,800
10,980
TOTAL CAYMAN ISLANDS
90,304
China - 8.7%
Baidu.com, Inc. sponsored ADR (a)
200
26,114
China Coal Energy Co. Ltd. (H Shares)
56,000
45,256
China Construction Bank Corp. (H Shares)
238,000
132,414
China Gas Holdings Ltd.
62,000
9,197
China Merchants Bank Co. Ltd. (H Shares)
39,500
73,906
China Petroleum & Chemical Corp.:
(H Shares)
34,000
20,898
Class H sponsored ADR
700
43,253
China Railway Construction Corp. Class H
16,000
23,953
China South Locomotive & Rolling Stock Corp. Ltd. (H Shares)
67,000
36,795
China Yurun Food Group Ltd.
18,000
21,291
Golden Eagle Retail Group Ltd. (H Shares)
34,000
23,927
Industrial & Commercial Bank of China
290,000
153,963
Ping An Insurance (Group) Co. of China, Ltd. (H Shares)
7,500
36,857
Tencent Holdings Ltd.
7,600
49,382
Yantai Changyu Pioneer Wine Co. (B Shares)
1,400
4,938
ZTE Corp. (H Shares)
5,800
15,323
TOTAL CHINA
717,467
Cyprus - 0.0%
XXI Century Investments Public Ltd. (a)
600
66
Czech Republic - 2.6%
Ceske Energeticke Zavody AS
3,000
122,478
Komercni Banka AS
400
61,801
Philip Morris CR AS
100
31,348
TOTAL CZECH REPUBLIC
215,627
Egypt - 1.3%
Commercial International Bank Ltd. sponsored GDR
7,499
51,368
Eastern Tobacco Co.
600
18,111
Orascom Construction Industries SAE GDR
400
20,000
Telecom Egypt SAE
7,100
20,655
TOTAL EGYPT
110,134
Georgia - 0.0%
Bank of Georgia unit (a)
200
828
Common Stocks - continued
Shares
Value
Hong Kong - 6.4%
China Mobile (Hong Kong) Ltd.
31,500
$ 319,602
China Resources Power Holdings Co. Ltd.
30,000
58,329
CNOOC Ltd.
123,000
116,992
CNPC (Hong Kong) Ltd.
110,000
34,468
REXCAPITAL Financial Holdings Ltd. (a)
75,000
1,807
TOTAL HONG KONG
531,198
India - 5.9%
Axis Bank Ltd.
2,500
25,952
Axis Bank Ltd. GDR (Reg. S)
600
6,288
Bank of India
7,781
46,155
Bharti Airtel Ltd. (a)
2,584
38,125
Educomp Solutions Ltd.
658
32,744
Housing Development Finance Corp. Ltd.
2,003
61,352
ICICI Bank Ltd.
7,974
73,989
Infosys Technologies Ltd. sponsored ADR
3,300
81,081
Larsen & Toubro Ltd.
1,783
28,533
Reliance Industries Ltd.
711
18,123
Rolta India Ltd.
9,218
22,145
Rural Electrification Corp. Ltd.
60
91
Sintex Industries Ltd.
2,273
8,895
Tata Power Co. Ltd.
2,958
45,771
TOTAL INDIA
489,244
Indonesia - 2.8%
PT Astra International Tbk
35,000
33,107
PT Bank Rakyat Indonesia Tbk
141,000
57,710
PT Bayan Resources Tbk
18,500
1,592
PT Bumi Resources Tbk
293,000
23,788
PT Perusahaan Gas Negara Tbk Series B
346,300
58,270
PT Telkomunikasi Indonesia Tbk:
Series B
82,000
50,441
sponsored ADR
300
7,521
TOTAL INDONESIA
232,429
Ireland - 0.0%
Dragon Oil PLC (a)
1,000
2,364
Israel - 4.1%
Cellcom Israel Ltd.
1,500
33,150
Check Point Software Technologies Ltd. (a)
3,100
58,869
Israel Chemicals Ltd.
6,703
46,637
Teva Pharmaceutical Industries Ltd. sponsored ADR
4,600
195,822
TOTAL ISRAEL
334,478
Shares
Value
Kazakhstan - 0.4%
JSC Halyk Bank of Kazakhstan unit
1,050
$ 2,877
KazMunaiGas Exploration & Production JSC (Reg. S) GDR
2,400
30,240
TOTAL KAZAKHSTAN
33,117
Korea (South) - 8.6%
Hyundai Mobis
655
33,315
Korea Gas Corp.
1,137
52,518
KT&G Corp.
1,000
63,081
LG Household & Health Care Ltd.
259
39,363
LIG Non-Life Insurance Co. Ltd.
1,330
12,757
MegaStudy Co. Ltd.
325
47,984
Meritz Fire & Marine Insurance Co. Ltd.
6,270
18,507
NHN Corp. (a)
500
52,713
POSCO
91
27,559
POSCO sponsored ADR
200
15,050
Samsung Electronics Co. Ltd.
627
227,974
Shinhan Financial Group Co. Ltd.
2,830
67,154
Taewoong Co. Ltd.
831
51,159
TOTAL KOREA (SOUTH)
709,134
Lebanon - 0.1%
Solidere GDR
300
4,875
Luxembourg - 0.5%
Evraz Group SA GDR
584
5,022
MHP SA GDR (a)(c)
700
2,415
Millicom International Cellular SA
800
35,928
TOTAL LUXEMBOURG
43,365
Malaysia - 1.2%
DiGi.com Bhd
8,600
54,378
Public Bank Bhd
18,100
46,491
TOTAL MALAYSIA
100,869
Mexico - 4.2%
America Movil SAB de CV Series L sponsored ADR
7,300
226,227
Fomento Economico Mexicano SAB de CV sponsored ADR
2,000
60,260
Grupo Financiero Banorte SA de CV Series O
27,200
49,307
Urbi, Desarrollos Urbanos, SA de CV (a)
6,800
9,418
TOTAL MEXICO
345,212
Nigeria - 0.1%
Guaranty Trust Bank PLC:
(Reg. S) unit
763
2,655
sponsored GDR (c)
436
1,517
TOTAL NIGERIA
4,172
Oman - 0.2%
BankMuscat SAOG sponsored GDR
2,300
18,400
Panama - 0.1%
Intergroup Financial Services Corp.
865
8,607
Common Stocks - continued
Shares
Value
Papua New Guinea - 0.3%
Oil Search Ltd.
6,402
$ 21,383
Peru - 0.6%
Compania de Minas Buenaventura SA sponsored ADR
2,490
49,601
Philippines - 0.1%
Security Bank Corp.
3,000
1,580
SM Investments Corp.
1,280
5,177
TOTAL PHILIPPINES
6,757
Poland - 0.7%
Powszechna Kasa Oszczednosci Bank SA
4,600
54,993
Trakcja Polska SA
2,050
2,789
TOTAL POLAND
57,782
Russia - 4.8%
Bank St. Petersburg OJSC
2,931
3,278
LSR Group OJSC (a)
100
437
Lukoil Oil Co. sponsored ADR
2,331
77,156
Magnit OJSC GDR (Reg. S) (a)
1,200
5,400
Mobile TeleSystems OJSC sponsored ADR
1,100
29,348
OAO Gazprom sponsored ADR
10,084
143,697
OAO Raspadskaya
7,400
7,627
OAO TMK
1,965
2,595
OJSC Rosneft unit
7,400
27,982
Polymetal JSC GDR (Reg. S) (a)
1,700
7,739
Rosinter Restaurants Holding (a)
363
2,582
Sberbank (Savings Bank of the Russian Federation)
44,600
33,370
Sberbank (Savings Bank of the Russian Federation) GDR
100
14,455
Uralkali JSC
4,300
8,060
Uralkali JSC GDR (Reg. S)
1,100
9,878
Wimm-Bill-Dann Foods OJSC sponsored ADR (a)
700
18,417
TOTAL RUSSIA
392,021
South Africa - 10.2%
African Bank Investments Ltd.
15,000
41,101
African Rainbow Minerals Ltd.
3,560
42,369
Aspen Pharmacare Holdings Ltd. (a)
11,764
42,226
Aveng Ltd.
9,300
30,521
Exxaro Resources Ltd.
5,657
43,497
FirstRand Ltd.
35,100
60,724
Harmony Gold Mining Co. Ltd. sponsored ADR (a)
6,300
69,111
Illovo Sugar Ltd.
10,082
24,489
Impala Platinum Holdings Ltd.
4,300
62,325
JD Group Ltd.
1,208
4,732
Shares
Value
Mr. Price Group Ltd.
16,500
$ 43,531
MTN Group Ltd.
11,608
134,603
Murray & Roberts Holdings Ltd.
4,200
21,599
Raubex Group Ltd.
16,123
37,250
Sasol Ltd.
1,900
56,829
Sasol Ltd. sponsored ADR
2,800
84,924
Shoprite Holdings Ltd.
7,600
42,991
TOTAL SOUTH AFRICA
842,822
Taiwan - 5.1%
Acer, Inc.
32,000
41,593
Asia Cement Corp.
35,000
30,381
First Financial Holding Co. Ltd.
96,032
50,543
Hon Hai Precision Industry Co. Ltd. (Foxconn)
41,550
81,389
HTC Corp.
5,900
58,865
Siliconware Precision Industries Co. Ltd.
37,560
32,088
Taiwan Mobile Co. Ltd.
29,000
43,091
Taiwan Semiconductor Manufacturing Co. Ltd.
58,000
78,572
TOTAL TAIWAN
416,522
Thailand - 1.5%
Minor International PCL (For. Reg.)
96,710
22,776
PTT Exploration & Production PCL (For. Reg.)
17,000
53,352
Siam Commercial Bank PCL (For. Reg.)
26,500
38,118
Total Access Communication PCL (For. Reg.)
6,500
6,201
TOTAL THAILAND
120,447
Turkey - 2.5%
Anadolu Efes Biracilik ve Malt Sanyii AS
8,000
53,489
Asya Katilim Bankasi AS
36,877
27,768
Enka Insaat ve Sanayi AS
10,979
37,416
Tupras-Turkiye Petrol Rafinerileri AS
4,000
42,064
Turkiye Garanti Bankasi AS (a)
28,000
47,257
TOTAL TURKEY
207,994
United Kingdom - 0.8%
Cairn Energy PLC (a)
300
8,918
Eurasian Natural Resources Corp. PLC
150
728
Hikma Pharmaceuticals PLC
3,300
17,049
Randgold Resources Ltd. sponsored ADR
800
35,136
TOTAL UNITED KINGDOM
61,831
United States of America - 0.7%
Central European Distribution Corp. (a)
1,100
21,670
CTC Media, Inc. (a)
3,500
16,800
Freeport-McMoRan Copper & Gold, Inc. Class B
900
21,996
TOTAL UNITED STATES OF AMERICA
60,466
TOTAL COMMON STOCKS
(Cost $12,503,424)
7,506,919
Money Market Funds - 9.6%
Shares
Value
Fidelity Cash Central Fund, 1.06% (b) (Cost $791,671)
791,671
$ 791,671
TOTAL INVESTMENT PORTFOLIO - 100.7%
(Cost $13,295,095)
8,298,590
NET OTHER ASSETS - (0.7)%
(61,482)
NET ASSETS - 100%
$ 8,237,108
Legend
(a) Non-income producing
(b) Affiliated fund that is available only to investment companies and other accounts managed by Fidelity Investments. The rate quoted is the annualized seven-day yield of the fund at period end. A complete unaudited listing of the fund's holdings as of its most recent quarter end is available upon request.
(c) Security exempt from registration under Rule 144A of the Securities Act of 1933. These securities may be resold in transactions exempt from registration, normally to qualified institutional buyers. At the end of the period, the value of these securities amounted to $9,032 or 0.1% of net assets.
Affiliated Central Funds
Information regarding fiscal year to date income earned by the Fund from investments in Fidelity Central Funds is as follows:
Fund
Income earned
Fidelity Cash Central Fund
$ 15,474
Other Information
The following is a summary of the inputs used, as of December 31, 2008, involving the Fund's assets carried at value. The inputs or methodology used for valuing securities may not be an indication of the risk associated with investing in those securities. For more information on valuation inputs, and their aggregation into the levels used in the table below, please refer to the Security Valuation section in the accompanying Notes to Financial Statements.
Valuation Inputs at Reporting Date:
Description
Total
Level 1
Level 2
Level 3
Investments in Securities
$ 8,298,590
$ 4,222,256
$ 4,076,334
$ -
Income Tax Information
At December 31, 2008, the fund had a capital loss carryforward of approximately $1,790,850 all of which will expire on December 31, 2016.
The fund intends to elect to defer to its fiscal year ending December 31, 2009 approximately $1,365,214 of losses recognized during the period November 1, 2008 to December 31, 2008.
See accompanying notes which are an integral part of the financial statements.
Investment in securities, at value - See accompanying schedule:
Unaffiliated issuers (cost $12,503,424)
$ 7,506,919
Fidelity Central Funds (cost $791,671)
791,671
Total Investments (cost $13,295,095)
$ 8,298,590
Cash
7,309
Foreign currency held at value (cost $1,928)
1,943
Receivable for investments sold
16,983
Receivable for fund shares sold
14,574
Dividends receivable
27,744
Distributions receivable from Fidelity Central Funds
764
Prepaid expenses
94
Receivable from investment adviser for expense reductions
20,992
Other receivables
1,064
Total assets
8,390,057
Liabilities
Payable for investments purchased
$ 82,273
Payable for fund shares redeemed
78
Accrued management fee
5,105
Distribution fees payable
189
Other affiliated payables
947
Other payables and accrued expenses
64,357
Total liabilities
152,949
Net Assets
$ 8,237,108
Net Assets consist of:
Paid in capital
$ 16,673,977
Accumulated undistributed net realized gain (loss) on investments and foreign currency transactions
(3,440,438)
Net unrealized appreciation (depreciation) on investments and assets and liabilities in foreign currencies
(4,996,431)
Net Assets
$ 8,237,108
Statement of Assets and Liabilities - continued
December 31, 2008
Initial Class: Net Asset Value, offering price and redemption price per share ($516,283 ÷ 105,877 shares)
$ 4.88
Service Class: Net Asset Value, offering price and redemption price per share ($395,731 ÷ 81,099 shares)
$ 4.88
Service Class 2: Net Asset Value, offering price and redemption price per share ($395,175 ÷ 80,903 shares)
$ 4.88
Initial Class R: Net Asset Value, offering price and redemption price per share ($3,157,919 ÷ 647,608 shares)
$ 4.88
Service Class 2R: Net Asset Value, offering price and redemption price per share ($395,176 ÷ 80,903 shares)
$ 4.88
Investor Class R: Net Asset Value, offering price and redemption price per share ($3,376,824 ÷ 693,043 shares)
$ 4.87
See accompanying notes which are an integral part of the financial statements.
Annual Report
Statement of Operations
For the period January 23, 2008 (commencement of operations) to December 31, 2008
Investment Income
Dividends
$ 216,073
Interest
1,277
Income from Fidelity Central Funds
15,474
232,824
Less foreign taxes withheld
(22,631)
Total income
210,193
��
Expenses
Management fee
$ 66,190
Transfer agent fees
11,034
Distribution fees
3,942
Accounting fees and expenses
4,236
Custodian fees and expenses
170,855
Independent trustees' compensation
37
Audit
60,139
Legal
94
Miscellaneous
550
Total expenses before reductions
317,077
Expense reductions
(227,202)
89,875
Net investment income (loss)
120,318
Realized and Unrealized Gain (Loss)
Net realized gain (loss) on:
Investment securities:
Unaffiliated issuers
(3,429,825)
Foreign currency transactions
(19,147)
Total net realized gain (loss)
(3,448,972)
Change in net unrealized appreciation (depreciation) on:
Investment securities
(4,996,505)
Assets and liabilities in foreign currencies
74
Total change in net unrealized appreciation (depreciation)
(4,996,431)
Net gain (loss)
(8,445,403)
Net increase (decrease) in net assets resulting from operations
$ (8,325,085)
Statement of Changes in Net Assets
For the period January 23, 2008 (commencement of operations) to December 31, 2008
Increase (Decrease) in Net Assets
Operations
Net investment income (loss)
$ 120,318
Net realized gain (loss)
(3,448,972)
Change in net unrealized appreciation (depreciation)
(4,996,431)
Net increase (decrease) in net assets resulting from operations
(8,325,085)
Distributions to shareholders from net investment income
(118,460)
Share transactions - net increase (decrease)
16,664,085
Redemption fees
16,568
Total increase (decrease) in net assets
8,237,108
Net Assets
Beginning of period
-
End of period
$ 8,237,108
See accompanying notes which are an integral part of the financial statements.
Annual Report
Financial Highlights - Initial Class
Year ended December 31,
2008H
Selected Per-Share Data
Net asset value, beginning of period
$ 10.00
Income from Investment Operations
Net investment income (loss)E
.13
Net realized and unrealized gain (loss)
(5.19)
Total from investment operations
(5.06)
Distributions from net investment income
(.08)
Redemption fees added to paid in capitalE
.02
Net asset value, end of period
$ 4.88
Total ReturnB, C, D
(50.45)%
Ratios to Average Net AssetsF, I
Expenses before reductions
3.92%A
Expenses net of fee waivers, if any
1.10%A
Expenses net of all reductions
1.02%A
Net investment income (loss)
1.54%A
Supplemental Data
Net assets, end of period (000 omitted)
$ 516
Portfolio turnover rateG
79%
A Annualized B Total returns for periods of less than one year are not annualized. C Total returns do not reflect charges attributable to your insurance company's separate account. Inclusion of these charges would reduce the total returns shown. D Total returns would have been lower had certain expenses not been reduced during the periods shown. E Calculated based on average shares outstanding during the period. F Fees and expenses of the underlying Fidelity Central Funds are not included in the Fund's expense ratio. The Fund indirectly bears its proportionate share of the expenses of any underlying Fidelity Central Funds. G Amount does not include the portfolio activity of any underlying Fidelity Central Funds. H For the period January 23, 2008 (commencement of operations) to December 31, 2008. I Expense ratios reflect operating expenses of the class. Expenses before reductions do not reflect amounts reimbursed by the investment adviser or reductions from brokerage service arrangements or other expense offset arrangements and do not represent the amount paid by the class during periods when reimbursements or reductions occur. Expense ratios before reductions for start-up periods may not be representative of longer-term operating periods. Expenses net of fee waivers reflect expenses after reimbursement by the investment adviser but prior to reductions from brokerage service arrangements or other expense offset arrangements. Expenses net of all reductions represent the net expenses paid by the class.
Financial Highlights - Service Class
Year ended December 31,
2008H
Selected Per-Share Data
Net asset value, beginning of period
$ 10.00
Income from Investment Operations
Net investment income (loss)E
.12
Net realized and unrealized gain (loss)
(5.19)
Total from investment operations
(5.07)
Distributions from net investment income
(.07)
Redemption fees added to paid in capitalE
.02
Net asset value, end of period
$ 4.88
Total ReturnB, C, D
(50.53)%
Ratios to Average Net AssetsF, I
Expenses before reductions
4.02%A
Expenses net of fee waivers, if any
1.20%A
Expenses net of all reductions
1.12%A
Net investment income (loss)
1.44%A
Supplemental Data
Net assets, end of period (000 omitted)
$ 396
Portfolio turnover rateG
79%
A Annualized B Total returns for periods of less than one year are not annualized. C Total returns do not reflect charges attributable to your insurance company's separate account. Inclusion of these charges would reduce the total returns shown. D Total returns would have been lower had certain expenses not been reduced during the periods shown. E Calculated based on average shares outstanding during the period. F Fees and expenses of the underlying Fidelity Central Funds are not included in the Fund's expense ratio. The Fund indirectly bears its proportionate share of the expenses of any underlying Fidelity Central Funds. G Amount does not include the portfolio activity of any underlying Fidelity Central Funds. H For the period January 23, 2008 (commencement of operations) to December 31, 2008. I Expense ratios reflect operating expenses of the class. Expenses before reductions do not reflect amounts reimbursed by the investment adviser or reductions from brokerage service arrangements or other expense offset arrangements and do not represent the amount paid by the class during periods when reimbursements or reductions occur. Expense ratios before reductions for start-up periods may not be representative of longer-term operating periods. Expenses net of fee waivers reflect expenses after reimbursement by the investment adviser but prior to reductions from brokerage service arrangements or other expense offset arrangements. Expenses net of all reductions represent the net expenses paid by the class.
See accompanying notes which are an integral part of the financial statements.
Annual Report
Financial Highlights - Service Class 2
Year ended December 31,
2008H
Selected Per-Share Data
Net asset value, beginning of period
$ 10.00
Income from Investment Operations
Net investment income (loss)E
.11
Net realized and unrealized gain (loss)
(5.19)
Total from investment operations
(5.08)
Distributions from net investment income
(.06)
Redemption fees added to paid in capitalE
.02
Net asset value, end of period
$ 4.88
Total ReturnB, C, D
(50.65)%
Ratios to Average Net AssetsF, I
Expenses before reductions
4.17%A
Expenses net of fee waivers, if any
1.35%A
Expenses net of all reductions
1.27%A
Net investment income (loss)
1.29%A
Supplemental Data
Net assets, end of period (000 omitted)
$ 395
Portfolio turnover rateG
79%
A Annualized B Total returns for periods of less than one year are not annualized. C Total returns do not reflect charges attributable to your insurance company's separate account. Inclusion of these charges would reduce the total returns shown. D Total returns would have been lower had certain expenses not been reduced during the periods shown. E Calculated based on average shares outstanding during the period. F Fees and expenses of the underlying Fidelity Central Funds are not included in the Fund's expense ratio. The Fund indirectly bears its proportionate share of the expenses of any underlying Fidelity Central Funds. G Amount does not include the portfolio activity of any underlying Fidelity Central Funds. H For the period January 23, 2008 (commencement of operations) to December 31, 2008. I Expense ratios reflect operating expenses of the class. Expenses before reductions do not reflect amounts reimbursed by the investment adviser or reductions from brokerage service arrangements or other expense offset arrangements and do not represent the amount paid by the class during periods when reimbursements or reductions occur. Expense ratios before reductions for start-up periods may not be representative of longer-term operating periods. Expenses net of fee waivers reflect expenses after reimbursement by the investment adviser but prior to reductions from brokerage service arrangements or other expense offset arrangements. Expenses net of all reductions represent the net expenses paid by the class.
Financial Highlights - Initial Class R
Year ended December 31,
2008H
Selected Per-Share Data
Net asset value, beginning of period
$ 10.00
Income from Investment Operations
Net investment income (loss)E
.11
Net realized and unrealized gain (loss)
(5.16)
Total from investment operations
(5.05)
Distributions from net investment income
(.08)
Redemption fees added to paid in capitalE
.01
Net asset value, end of period
$ 4.88
Total ReturnB, C, D
(50.45)%
Ratios to Average Net AssetsF, I
Expenses before reductions
3.71%A
Expenses net of fee waivers, if any
1.10%A
Expenses net of all reductions
1.02%A
Net investment income (loss)
1.54%A
Supplemental Data
Net assets, end of period (000 omitted)
$ 3,158
Portfolio turnover rateG
79%
A Annualized B Total returns for periods of less than one year are not annualized. C Total returns do not reflect charges attributable to your insurance company's separate account. Inclusion of these charges would reduce the total returns shown. D Total returns would have been lower had certain expenses not been reduced during the periods shown. E Calculated based on average shares outstanding during the period. F Fees and expenses of the underlying Fidelity Central Funds are not included in the Fund's expense ratio. The Fund indirectly bears its proportionate share of the expenses of any underlying Fidelity Central Funds. G Amount does not include the portfolio activity of any underlying Fidelity Central Funds. H For the period January 23, 2008 (commencement of operations) to December 31, 2008. I Expense ratios reflect operating expenses of the class. Expenses before reductions do not reflect amounts reimbursed by the investment adviser or reductions from brokerage service arrangements or other expense offset arrangements and do not represent the amount paid by the class during periods when reimbursements or reductions occur. Expense ratios before reductions for start-up periods may not be representative of longer-term operating periods. Expenses net of fee waivers reflect expenses after reimbursement by the investment adviser but prior to reductions from brokerage service arrangements or other expense offset arrangements. Expenses net of all reductions represent the net expenses paid by the class.
See accompanying notes which are an integral part of the financial statements.
Annual Report
Financial Highlights - Service Class 2R
Year ended December 31,
2008H
Selected Per-Share Data
Net asset value, beginning of period
$ 10.00
Income from Investment Operations
Net investment income (loss)E
.11
Net realized and unrealized gain (loss)
(5.19)
Total from investment operations
(5.08)
Distributions from net investment income
(.06)
Redemption fees added to paid in capitalE
.02
Net asset value, end of period
$ 4.88
Total ReturnB, C, D
(50.65)%
Ratios to Average Net AssetsF, I
Expenses before reductions
4.17%A
Expenses net of fee waivers, if any
1.35%A
Expenses net of all reductions
1.27%A
Net investment income (loss)
1.29%A
Supplemental Data
Net assets, end of period (000 omitted)
$ 395
Portfolio turnover rateG
79%
A Annualized B Total returns for periods of less than one year are not annualized. C Total returns do not reflect charges attributable to your insurance company's separate account. Inclusion of these charges would reduce the total returns shown. D Total returns would have been lower had certain expenses not been reduced during the periods shown. E Calculated based on average shares outstanding during the period. F Fees and expenses of the underlying Fidelity Central Funds are not included in the Fund's expense ratio. The Fund indirectly bears its proportionate share of the expenses of any underlying Fidelity Central Funds. G Amount does not include the portfolio activity of any underlying Fidelity Central Funds. H For the period January 23, 2008 (commencement of operations) to December 31, 2008. I Expense ratios reflect operating expenses of the class. Expenses before reductions do not reflect amounts reimbursed by the investment adviser or reductions from brokerage service arrangements or other expense offset arrangements and do not represent the amount paid by the class during periods when reimbursements or reductions occur. Expense ratios before reductions for start-up periods may not be representative of longer-term operating periods. Expenses net of fee waivers reflect expenses after reimbursement by the investment adviser but prior to reductions from brokerage service arrangements or other expense offset arrangements. Expenses net of all reductions represent the net expenses paid by the class.
Financial Highlights - Investor Class R
Year ended December 31,
2008H
Selected Per-Share Data
Net asset value, beginning of period
$ 10.00
Income from Investment Operations
Net investment income (loss)E
.10
Net realized and unrealized gain (loss)
(5.16)
Total from investment operations
(5.06)
Distributions from net investment income
(.08)
Redemption fees added to paid in capitalE
.01
Net asset value, end of period
$ 4.87
Total ReturnB, C, D
(50.55)%
Ratios to Average Net AssetsF, I
Expenses before reductions
3.81%A
Expenses net of fee waivers, if any
1.18%A
Expenses net of all reductions
1.10%A
Net investment income (loss)
1.46%A
Supplemental Data
Net assets, end of period (000 omitted)
$ 3,377
Portfolio turnover rateG
79%
A Annualized B Total returns for periods of less than one year are not annualized. C Total returns do not reflect charges attributable to your insurance company's separate account. Inclusion of these charges would reduce the total returns shown. D Total returns would have been lower had certain expenses not been reduced during the periods shown. E Calculated based on average shares outstanding during the period. F Fees and expenses of the underlying Fidelity Central Funds are not included in the Fund's expense ratio. The Fund indirectly bears its proportionate share of the expenses of any underlying Fidelity Central Funds. G Amount does not include the portfolio activity of any underlying Fidelity Central Funds. H For the period January 23, 2008 (commencement of operations) to December 31, 2008. I Expense ratios reflect operating expenses of the class. Expenses before reductions do not reflect amounts reimbursed by the investment adviser or reductions from brokerage service arrangements or other expense offset arrangements and do not represent the amount paid by the class during periods when reimbursements or reductions occur. Expense ratios before reductions for start-up periods may not be representative of longer-term operating periods. Expenses net of fee waivers reflect expenses after reimbursement by the investment adviser but prior to reductions from brokerage service arrangements or other expense offset arrangements. Expenses net of all reductions represent the net expenses paid by the class.
See accompanying notes which are an integral part of the financial statements.
VIP Emerging Markets Portfolio (the Fund) is a fund of Variable Insurance Products Fund IV (the trust) and is authorized to issue an unlimited number of shares. The trust is registered under the Investment Company Act of 1940, as amended (the 1940 Act), as an open-end management investment company organized as a Massachusetts business trust. Shares of the Fund may only be purchased by insurance companies for the purpose of funding variable annuity or variable life insurance contracts. The Fund offers the following classes of shares: Initial Class shares, Service Class shares, Service Class 2 shares, Initial Class R shares, Service Class 2R shares, and Investor Class R shares. All classes have equal rights and voting privileges, except for matters affecting a single class. Investment income, realized and unrealized capital gains and losses, the common expenses of the Fund, and certain fund-level expense reductions, if any, are allocated on a pro rata basis to each class based on the relative net assets of each class to the total net assets of the Fund. Each class differs with respect to transfer agent and distribution and service plan fees incurred. Certain expense reductions also differ by class. The Fund's investments in emerging markets can be subject to social, economic, regulatory, and political uncertainties and can be extremely volatile.
2. Investments in Fidelity Central Funds.
The Fund may invest in Fidelity Central Funds, which are open-end investment companies available only to other investment companies and accounts managed by Fidelity Management & Research Company (FMR) and its affiliates. The Fund's Schedule of Investments lists each of the Fidelity Central Funds held as of period end, if any, as an investment of the Fund, but does not include the underlying holdings of each Fidelity Central Fund. As an Investing Fund, the Fund indirectly bears its proportionate share of the expenses of the underlying Fidelity Central Funds.
The Money Market Central Funds seek preservation of capital and current income and are managed by Fidelity Investments Money Management, Inc. (FIMM), an affiliate of FMR.
A complete unaudited list of holdings for each Fidelity Central Fund is available upon request or at the SEC's web site at www.sec.gov. In addition, the financial statements of the Fidelity Central Funds, which are not covered by the Fund's Report of Independent Registered Public Accounting Firm, are available on the SEC's web site or upon request.
3. Significant Accounting Policies.
The financial statements have been prepared in conformity with accounting principles generally accepted in the United States of America, which require management to make certain estimates and assumptions at the date of the financial statements. Actual results could differ from those estimates. The following summarizes the significant accounting policies of the Fund:
Security Valuation. Investments are valued as of 4:00 p.m. Eastern time on the last calendar day of the period. Wherever possible, the Fund uses independent pricing services approved by the Board of Trustees to value its investments.
Equity securities, including restricted securities, for which market quotations are readily available, are valued at the last reported sale price or official closing price as reported by an independent pricing service on the primary market or exchange on which they are traded. In the event there were no sales during the day or closing prices are not available, securities are valued at the last quoted bid price. Investments in open-end mutual funds, including the Fidelity Central Funds, are valued at their closing net asset value each business day. Short-term securities with remaining maturities of sixty days or less for which quotations are not readily available are valued at amortized cost, which approximates value.
When current market prices or quotations are not readily available or reliable, valuations may be determined in good faith in accordance with procedures adopted by the Board of Trustees. Factors used in determining value may include significant market or security specific events, changes in interest rates and credit quality, and developments in foreign markets which are monitored by evaluating the performance of ADRs, futures contracts and exchange-traded funds. The frequency with which these procedures are used cannot be predicted and may be utilized to a significant extent. The value of securities used for net asset value (NAV) calculation under these procedures may differ from published prices for the same securities.
The Fund adopted the provisions of Statement of Financial Accounting Standards No. 157, "Fair Value Measurements" (SFAS 157), effective with the beginning of the Fund's fiscal year. SFAS 157 establishes a hierarchy that prioritizes the inputs to valuation techniques giving the highest priority to readily available unadjusted quoted prices in active markets for identical assets (level 1 measurements) and the lowest priority to unobservable inputs (level 3 measurements) when market prices are not readily available or reliable. The three levels of the hierarchy under SFAS 157 are described below:
Level 1
Quoted prices in active markets for identical securities.
Level 2
Prices determined using other significant observable inputs. Observable inputs are inputs that other market participants may use in pricing a security. These may include quoted prices for similar securities, interest rates, prepayment speeds, credit risk and others.
Level 3
Prices determined using significant unobservable inputs. In situations where quoted prices or observable inputs are unavailable or deemed less relevant (for example, when there is little or no market activity for an investment at the end of the period), unobservable inputs may be used. Unobservable inputs reflect the Fund's own assumptions about the factors market participants would use in pricing an investment, and would be based on the best information available.
Annual Report
Notes to Financial Statements - continued
3. Significant Accounting Policies - continued
Security Valuation - continued
Changes in valuation techniques may result in transfers in or out of an investment's assigned level within the hierarchy.
The aggregate value by input level, as of December 31, 2008, for the Fund's investments is included at the end of the Fund's Schedule of Investments.
Foreign Currency. The Fund uses foreign currency contracts to facilitate transactions in foreign-denominated securities. Losses from these transactions may arise from changes in the value of the foreign currency or if the counterparties do not perform under the contracts' terms.
Foreign-denominated assets, including investment securities, and liabilities are translated into U.S. dollars at the exchange rate at period end. Purchases and sales of investment securities, income and dividends received and expenses denominated in foreign currencies are translated into U.S. dollars at the exchange rate in effect on the transaction date.
The effects of exchange rate fluctuations on investments are included with the net realized and unrealized gain (loss) on investment securities. Other foreign currency transactions resulting in realized and unrealized gain (loss) are disclosed separately.
Investment Transactions and Income. For financial reporting purposes, the Fund's investment holdings and NAV include trades executed through the end of the last business day of the period. The NAV per share for processing shareholder transactions is calculated as of the close of business of the New York Stock Exchange (NYSE), normally 4:00 p.m. Eastern time and includes trades executed through the end of the prior business day. Gains and losses on securities sold are determined on the basis of identified cost. Dividend income is recorded on the ex-dividend date, except for certain dividends from foreign securities where the ex-dividend date may have passed, which are recorded as soon as the Fund is informed of the ex-dividend date. Non-cash dividends included in dividend income, if any, are recorded at the fair market value of the securities received. Distributions received on securities that represent a return of capital or capital gain are recorded as a reduction of cost of investments and/or as a realized gain. The Fund estimates the components of distributions received that may be considered return of capital distributions or capital gain distributions. Interest income and distributions from the Fidelity Central Funds are accrued as earned. Interest income includes coupon interest and amortization of premium and accretion of discount on debt securities. Investment income is recorded net of foreign taxes withheld where recovery of such taxes is uncertain.
Expenses. Most expenses of the trust can be directly attributed to a fund. Expenses which cannot be directly attributed are apportioned among each Fund in the trust. Expense estimates are accrued in the period to which they relate and adjustments are made when actual amounts are known.
Income Tax Information and Distributions to Shareholders. Each year, the Fund intends to qualify as a regulated investment company by distributing substantially all of its taxable income and realized gains under Subchapter M of the Internal Revenue Code and filing its U.S. federal tax return. As a result, no provision for income taxes is required. The Fund is subject to the provisions of FASB Interpretation No. 48, Accounting for Uncertainties in Income Taxes (FIN 48). FIN 48 sets forth a minimum threshold for financial statement recognition of the benefit of a tax position taken or expected to be taken in a tax return. There are no unrecognized tax benefits in the accompanying financial statements in connection with the tax positions expected to be taken in the initial filing of the Fund's federal tax return. A Fund's federal tax return is subject to examination by the Internal Revenue Service (IRS) for a period of three years. Foreign taxes are provided for based on the Fund's understanding of the tax rules and rates that exist in the foreign markets in which it invests.
Distributions are recorded on the ex-dividend date. Income dividends and capital gain distributions are declared separately for each class. Income and capital gain distributions are determined in accordance with income tax regulations, which may differ from generally accepted accounting principles.
Capital accounts within the financial statements are adjusted for permanent book-tax differences. These adjustments have no impact on net assets or the results of operations. Temporary book-tax differences will reverse in a subsequent period.
Book-tax differences are primarily due to foreign currency transactions, passive foreign investment companies (PFIC), capital loss carryforwards, losses deferred due to wash sales and excise tax regulations.
The tax-basis components of distributable earnings and the federal tax cost as of period end were as follows:
Unrealized appreciation
$ 154,405
Unrealized depreciation
(5,435,206)
Net unrealized appreciation (depreciation)
(5,280,801)
Capital loss carryforward
(1,790,850)
Cost for federal income tax purposes
$ 13,579,391
Annual Report
3. Significant Accounting Policies - continued
Income Tax Information and Distributions to Shareholders - continued
The tax character of distributions paid was as follows:
December 31, 2008
Ordinary Income
$ 118,460
Trading (Redemption) Fees. Initial Class R shares, Service Class 2R shares and Investor Class R shares held less than 60 days are subject to a redemption fee equal to 1% of the proceeds of the redeemed shares. All redemption fees, including any estimated redemption fees paid by FMR, are retained by the Fund and accounted for as an addition to paid in capital.
4. Operating Policies.
Repurchase Agreements. FMR has received an Exemptive Order from the Securities and Exchange Commission (the SEC) which permits the Fund and other affiliated entities of FMR to transfer uninvested cash balances into joint trading accounts which are then invested in repurchase agreements. The Fund may also invest directly with institutions in repurchase agreements. Repurchase agreements are collateralized by government or non-government securities. Upon settlement date, collateral is held in segregated accounts with custodian banks and may be obtained in the event of a default of the counterparty. The Fund monitors, on a daily basis, the value of the collateral to ensure it is at least equal to the principal amount of the repurchase agreement (including accrued interest). In the event of a default by the counterparty, realization of the collateral proceeds could be delayed, during which time the value of the collateral may decline.
Restricted Securities. The Fund may invest in securities that are subject to legal or contractual restrictions on resale. These securities generally may be resold in transactions exempt from registration or to the public if the securities are registered. Disposal of these securities may involve time-consuming negotiations and expense, and prompt sale at an acceptable price may be difficult. Information regarding restricted securities is included at the end of the Fund's Schedule of Investments.
5. Purchases and Sales of Investments.
Purchases and sales of securities, other than short-term securities, aggregated $22,129,573 and $6,178,056, respectively.
6. Fees and Other Transactions with Affiliates.
Management Fee. FMR and its affiliates provide the Fund with investment management related services for which the Fund pays a monthly management fee. The management fee is the sum of an individual fund fee rate that is based on an annual rate of .55% of the Fund's average net assets and a group fee rate that averaged .26% during the period. The group fee rate is based upon the average net assets of all the mutual funds advised by FMR. The group fee rate decreases as assets under management increase and increases as assets under management decrease. For the period, the total annualized management fee rate was .81% of the Fund's average net assets.
Distribution and Service Plan. In accordance with Rule 12b-1 of the 1940 Act, the Fund has adopted separate 12b-1 Plans for each Service Class of shares. Each Service Class pays Fidelity Distributors Corporation (FDC), an affiliate of FMR, a service fee. For the period, the service fee is based on an annual rate of .10% of Service Class' average net assets and .25% of Service Class 2's and Service Class 2R's average net assets.
For the period, each class paid FDC the following amounts, all of which were re-allowed to insurance companies for the distribution of shares and providing shareholder support services:
Service Class
$ 658
Service Class 2
1,642
Service Class 2R
1,642
$ 3,942
Transfer Agent Fees. Fidelity Investments Institutional Operations Company, Inc. (FIIOC), an affiliate of FMR, is the Fund's transfer, dividend disbursing, and shareholder servicing agent. FIIOC receives an asset-based fee with respect to each class. Each class (with the exception of Investor
Annual Report
Notes to Financial Statements - continued
6. Fees and Other Transactions with Affiliates - continued
Transfer Agent Fees - continued
Class R) pays a transfer agent fee, excluding out of pocket expenses, equal to an annual rate of .07% of average net assets. Investor Class R pays a monthly asset-based transfer agent fee of .15% of average net assets. Prior to February 1, 2008, Investor Class paid a monthly asset-based transfer agent fee of .18% of average net assets. The total transfer agent fees paid by each class to FIIOC, including out of pocket expenses, were as follows:
Initial Class
$ 707
Service Class
477
Service Class 2
476
Initial Class R
3,279
Service Class 2R
476
Investor Class R
5,619
$ 11,034
Accounting Fees. Fidelity Service Company, Inc. (FSC), an affiliate of FMR, maintains the Fund's accounting records. The fee is based on the level of average net assets for the month.
Brokerage Commissions. The Fund placed a portion of its portfolio transactions with brokerage firms which are affiliates of the investment adviser. The commissions paid to these affiliated firms were $79 for the period.
7. Committed Line of Credit.
The Fund participates with other funds managed by FMR in a $4.2 billion credit facility (the "line of credit") to be utilized for temporary or emergency purposes to fund shareholder redemptions or for other short-term liquidity purposes. The Fund has agreed to pay commitment fees on its pro rata portion of the line of credit, which amounted to $12 and is reflected in Miscellaneous Expense on the Statement of Operations. During the period, there were no borrowings on this line of credit.
8. Expense Reductions.
FMR voluntarily agreed to reimburse each class to the extent annual operating expenses exceeded certain levels of average net assets as noted in the table below. Some expenses, for example interest expense, including commitment fees, are excluded from this reimbursement.
The following classes were in reimbursement during the period:
Expense Limitations
Reimbursement from adviser
Initial Class
1.10%
$ 23,685
Service Class
1.20%
18,487
Service Class 2
1.35%
18,474
Initial Class R
1.10%
71,097
Service Class 2R
1.35%
18,475
Investor Class R
1.25% to 1.18%*
70,386
$ 220,604
* Expense limitation in effect at period end.
Effective February 1, 2008, the expense limitation changed to 1.18% for the Investor Class R.
Many of the brokers with whom FMR places trades on behalf of the Fund provided services to the Fund in addition to trade execution. These services included payments of certain expenses on behalf of the Fund totaling $6,377 for the period. In addition, through arrangements with the Fund's custodian and each class' transfer agent, credits realized as a result of uninvested cash balances were used to reduce the Fund's expenses. During the period, these credits reduced the Fund's custody expenses by $221.
Annual Report
9. Other.
The Fund's organizational documents provide former and current trustees and officers with a limited indemnification against liabilities arising in connection with the performance of their duties to the Fund. In the normal course of business, the Fund may also enter into contracts that provide general indemnifications. The Fund's maximum exposure under these arrangements is unknown as this would be dependent on future claims that may be made against the Fund. The risk of material loss from such claims is considered remote.
At the end of the period, FMR or its affiliates were the owners of record of approximately 100% of the total outstanding shares of the Fund.
10. Distributions to Shareholders.
Distributions to shareholders of each class were as follows:
Year ended December 31,
2008A
From net investment income
Initial Class
$ 7,875
Service Class
5,365
Service Class 2
4,404
Initial Class R
46,484
Service Class 2R
4,404
Investor Class R
49,928
Total
$ 118,460
A For the period January 23, 2008 (commencement of operations) to December 31, 2008.
11. Share Transactions.
Transactions for each class of shares were as follows:
Shares
Dollars
Year ended December 31,
2008A
2008A
Initial Class
Shares sold
107,445
$ 1,068,509
Reinvestment of distributions
1,615
7,875
Shares redeemed
(3,183)
(22,468)
Net increase (decrease)
105,877
$ 1,053,916
Service Class
Shares sold
80,001
$ 800,010
Reinvestment of distributions
1,098
5,365
Net increase (decrease)
81,099
$ 805,375
Service Class 2
Shares sold
80,001
$ 800,010
Reinvestment of distributions
902
4,404
Net increase (decrease)
80,903
$ 804,414
Initial Class R
Shares sold
856,743
$ 8,037,340
Reinvestment of distributions
9,532
46,484
Shares redeemed
(218,667)
(1,627,362)
Net increase (decrease)
647,608
$ 6,456,462
Service Class 2R
Shares sold
80,001
$ 800,010
Reinvestment of distributions
902
4,404
Net increase (decrease)
80,903
$ 804,414
Investor Class R
Shares sold
938,957
$ 8,629,449
Reinvestment of distributions
10,240
49,928
Shares redeemed
(256,154)
(1,939,873)
Net increase (decrease)
693,043
$ 6,739,504
A For the period January 23, 2008 (commencement of operations) to December 31, 2008.
Annual Report
Reportof Independent Registered Public Accounting Firm
To the Trustees of Variable Insurance Products Fund IV and Shareholders of VIP Emerging Markets Portfolio:
We have audited the accompanying statement of assets and liabilities of VIP Emerging Markets Portfolio (the Fund), a fund of Variable Insurance Products Fund IV, including the schedule of investments, as of December 31, 2008, and the related statement of operations , the statement of changes in net assets, and the financial highlights for the period from January 23, 2008 (commencement of operations) to December 31, 2008. These financial statements and financial highlights are the responsibility of the Fund's management. Our responsibility is to express an opinion on these financial statements and financial highlights based on our audit.
We conducted our audit in accordance with standards of the Public Company Accounting Oversight Board (United States). Those standards require that we plan and perform the audit to obtain reasonable assurance about whether the financial statements and financial highlights are free of material misstatement. The Fund is not required to have, nor were we engaged to perform, an audit of its internal control over financial reporting. Our audit included consideration of internal control over financial reporting as a basis for designing audit procedures that are appropriate in the circumstances, but not for the purpose of expressing an opinion on the effectiveness of the Fund's internal control over financial reporting. Accordingly, we express no such opinion. An audit also includes examining, on a test basis, evidence supporting the amounts and disclosures in the financial statements, assessing the accounting principles used and significant estimates made by management, as well as evaluating the overall financial statement presentation. Our procedures included confirmation of securities owned as of December 31, 2008, by correspondence with the custodians and brokers; where replies were not received from brokers, we performed other auditing procedures. We believe that our audit provides a reasonable basis for our opinion.
In our opinion, the financial statements and financial highlights referred to above present fairly, in all material respects, the financial position of VIP Emerging Markets Portfolio as of December 31, 2008, the results of its operations the changes in its net assets for each of the two years in the period then ended, and its financial highlights for the period from January 23, 2008 (commencement of operations) to December 31, 2008, in conformity with accounting principles generally accepted in the United States of America.
The Trustees, Member of the Advisory Board, and executive officers of the trust and fund, as applicable, are listed below. The Board of Trustees governs the fund and is responsible for protecting the interests of shareholders. The Trustees are experienced executives who meet periodically throughout the year to oversee the fund's activities, review contractual arrangements with companies that provide services to the fund, and review the fund's performance. Except for Edward C. Johnson 3d and James C. Curvey, each of the Trustees oversees 222 funds advised by FMR or an affiliate. Messrs. Johnson and Curvey oversee 380 funds advised by FMR or an affiliate.
The Trustees hold office without limit in time except that (a) any Trustee may resign; (b) any Trustee may be removed by written instrument, signed by at least two-thirds of the number of Trustees prior to such removal; (c) any Trustee who requests to be retired or who has become incapacitated by illness or injury may be retired by written instrument signed by a majority of the other Trustees; and (d) any Trustee may be removed at any special meeting of shareholders by a two-thirds vote of the outstanding voting securities of the trust. Each Trustee who is not an interested person (as defined in the 1940 Act) (Independent Trustee), shall retire not later than the last day of the calendar year in which his or her 72nd birthday occurs. The Independent Trustees may waive this mandatory retirement age policy with respect to individual Trustees. The executive officers and Advisory Board Member hold office without limit in time, except that any officer and Advisory Board Member may resign or may be removed by a vote of a majority of the Trustees at any regular meeting or any special meeting of the Trustees. Except as indicated, each individual has held the office shown or other offices in the same company for the past five years.
The fund's Statement of Additional Information (SAI) includes more information about the Trustees. To request a free copy, call Fidelity at 1-877-208-0098.
Interested Trustees*:
Correspondence intended for each Trustee who is an interested person may be sent to Fidelity Investments, 82 Devonshire Street, Boston, Massachusetts 02109.
Name, Age; Principal Occupation
Edward C. Johnson 3d (78)
Year of Election or Appointment: 1983
Mr. Johnson is Chairman of the Board of Trustees. Mr. Johnson serves as Chief Executive Officer, Chairman, and a Director of FMR LLC; Chairman and a Director of FMR; Chairman and a Director of Fidelity Research & Analysis Company (FRAC); Chairman and a Director of Fidelity Investments Money Management, Inc.; and Chairman and a Director of FMR Co., Inc. In addition, Mr. Johnson serves as Chairman and Director of FIL Limited. Previously, Mr. Johnson served as President of FMR LLC (2006-2007).
James C. Curvey (73)
Year of Election or Appointment: 2007
Mr. Curvey also serves as Trustee (2007-present) of other investment companies advised by FMR. Mr. Curvey is a Director of FMR and FMR Co., Inc. (2007-present). Mr. Curvey is also Vice Chairman (2006-present) and Director of FMR LLC. In addition, Mr. Curvey serves as an Overseer for the Boston Symphony Orchestra and a member of the Trustees of Villanova University.
* Trustees have been determined to be "Interested Trustees" by virtue of, among other things, their affiliation with the trust or various entities under common control with FMR. FMR Corp. merged with and into FMR LLC on October 1, 2007. Any references to FMR LLC for prior periods are deemed to be references to the prior entity.
Independent Trustees:
Correspondence intended for each Independent Trustee (that is, the Trustees other than the Interested Trustees) may be sent to Fidelity Investments, P.O. Box 55235, Boston, Massachusetts 02205-5235.
Name, Age; Principal Occupation
Dennis J. Dirks (60)
Year of Election or Appointment: 2005
Prior to his retirement in May 2003, Mr. Dirks was Chief Operating Officer and a member of the Board of The Depository Trust & Clearing Corporation (DTCC) (1999-2003). He also served as President, Chief Operating Officer, and Board member of The Depository Trust Company (DTC) (1999-2003) and President and Board member of the National Securities Clearing Corporation (NSCC) (1999-2003). In addition, Mr. Dirks served as Chief Executive Officer and Board member of the Government Securities Clearing Corporation (2001-2003), Chief Executive Officer and Board member of the Mortgage-Backed Securities Clearing Corporation (2001-2003), as a Trustee and a member of the Finance Committee of Manhattan College (2005-2008), and as a Trustee and a member of the Finance Committee of AHRC of Nassau County (2006-2008). Currently, Mr. Dirks serves as a member of the Board of Directors for The Brookville Center for Children's Services, Inc. (2009-present).
Alan J. Lacy (55)
Year of Election or Appointment: 2008
Mr. Lacy serves as Senior Adviser (2007-present) of Oak Hill Capital Partners, L.P. (a private equity firm). Mr. Lacy also served as Chief Executive Officer (2000-2005) and Vice Chairman (2005-2006) of Sears Holdings Corporation and Sears, Roebuck and Co. (retail). In addition, Mr. Lacy serves as a member of the Board of Directors of The Western Union Company (global money transfer, 2006-present) and Bristol-Myers Squibb (global pharmaceuticals, 2007-present). Mr. Lacy is a Trustee of the National Parks Conservation Association and The Field Museum of Natural History.
Ned C. Lautenbach (64)
Year of Election or Appointment: 2000
Mr. Lautenbach is Chairman of the Independent Trustees (2006-present). Mr. Lautenbach is an Advisory Partner of Clayton, Dubilier & Rice, Inc. (private equity investment firm). Previously, Mr. Lautenbach was with the International Business Machines Corporation (IBM) from 1968 until his retirement in 1998. Mr. Lautenbach serves as a Director of Eaton Corporation (diversified industrial) as well as the Philharmonic Center for the Arts in Naples, Florida. He also is a member of the Board of Trustees of Fairfield University (2005-present), as well as a member of the Council on Foreign Relations. Previously, Mr. Lautenbach served as a Director of Sony Corporation (2006-2007).
Joseph Mauriello (64)
Year of Election or Appointment: 2008
Prior to his retirement in January 2006, Mr. Mauriello served in numerous senior management positions including Deputy Chairman and Chief Operating Officer (2004-2005), and Vice Chairman of Financial Services (2002-2004) of KPMG LLP US (professional services firm, 1965-2005). Mr. Mauriello currently serves as a member of the Board of Directors of XL Capital Ltd. (global insurance and re-insurance company, 2006-present) and of Arcadia Resources Inc. (health care services and products, 2007-present). He also served as a Director of the Hamilton Funds of the Bank of New York (2006-2007).
Cornelia M. Small (64)
Year of Election or Appointment: 2005
Ms. Small is a member of the Investment Committee, and Chair (2008-present) and a member of the Board of Trustees of Smith College. Ms. Small also serves on the Investment Committee of the Berkshire Taconic Community Foundation (2008-present). Previously, Ms. Small served as Chairperson of the Investment Committee (2002-2008) of Smith College and as Co-Chair (2000-2003) of the Annual Fund for the Fletcher School of Law and Diplomacy. In addition, she served as Chief Investment Officer, Director of Global Equity Investments, and a member of the Board of Directors of Scudder, Stevens & Clark and Scudder Kemper Investments.
William S. Stavropoulos (69)
Year of Election or Appointment: 2001
Mr. Stavropoulos is Chairman Emeritus of the Board of Directors of The Dow Chemical Company, where he previously served in numerous senior management positions, including President (1993-2000; 2002-2003), CEO (1995-2000; 2002-2004), Chairman of the Executive Committee (2000-2006), and as a member of the Board of Directors (1990-2006). Currently, he is a Director of Teradata Corporation (data warehousing and technology solutions, 2008-present), Chemical Financial Corporation, Maersk Inc. (industrial conglomerate), Tyco International, Inc. (multinational manufacturing and services, 2007-present), and a member of the Advisory Board for Metalmark Capital (private equity investment firm, 2005-present). He is a special advisor to Clayton, Dubilier & Rice, Inc. (private equity investment). In addition, Mr. Stavropoulos is a member of the University of Notre Dame Advisory Council for the College of Science.
David M. Thomas (59)
Year of Election or Appointment: 2008
Previously, Mr. Thomas served as Executive Chairman (2005-2006) and Chairman and Chief Executive Officer (2000-2005) of IMS Health, Inc. (pharmaceutical and healthcare information solutions). In addition, Mr. Thomas serves as a member of the Board of Directors of Fortune Brands, Inc. (consumer products holding company), and Interpublic Group of Companies, Inc. (marketing communication, 2004-present).
Michael E. Wiley (58)
Year of Election or Appointment: 2008
Mr. Wiley also serves as a member of the Board of Trustees of the University of Tulsa (2000-2006; 2007-present). He serves as a Director of Tesoro Corporation (independent oil refiner and marketer, 2005-present), and a Director of Bill Barrett Corporation (exploration and production company, 2005-present). In addition, he also serves as a Director of Post Oak Bank (privately-held bank, 2004-present). Previously, Mr. Wiley served as a Sr. Energy Advisor of Katzenbach Partners, LLC (consulting firm, 2006-2007), as an Advisory Director of Riverstone Holdings (private investment firm), Chairman, President, and CEO of Baker Hughes, Inc. (oilfield services company, 2000-2004), and as Director of Spinnaker Exploration Company (exploration and production company, 2001-2005).
Annual Report
Advisory Board Member and Executive Officers**:
Correspondence intended for each executive officer and Mr. Lynch may be sent to Fidelity Investments, 82 Devonshire Street, Boston, Massachusetts 02109.
Name, Age; Principal Occupation
Peter S. Lynch (64)
Year of Election or Appointment: 2003
Member of the Advisory Board of Fidelity's Equity and High Income Funds. Mr. Lynch is Vice Chairman and a Director of FMR, and Vice Chairman (2001-present) and a Director of FMR Co., Inc. Previously, Mr. Lynch served as a Trustee of the Fidelity funds (1990-2003). In addition, he serves as a Trustee of Boston College and as the Chairman of the Inner-City Scholarship Fund. Previously, Mr. Lynch served on the Special Olympics International Board of Directors (1997-2006).
Kenneth B. Robins (39)
Year of Election or Appointment: 2008
President and Treasurer of Fidelity's Equity and High Income Funds. Mr. Robins is an employee of Fidelity Investments (2004-present). Before joining Fidelity Investments, Mr. Robins worked at KPMG LLP, where he was a partner in KPMG's department of professional practice (2002-2004).
Walter C. Donovan (46)
Year of Election or Appointment: 2007
Vice President of Fidelity's Equity Funds. Mr. Donovan also serves as President of FMR and FMR Co., Inc., and Executive Vice President of Fidelity Investments Money Management, Inc. (2007-present). Previously, Mr. Donovan served as Executive Vice President of FMR and FMR Co., Inc. (2005-2007) and Senior Vice President of FMR (2003-2005) and FMR Co., Inc. (2004-2005).
Eric M. Wetlaufer (46)
Year of Election or Appointment: 2006
Vice President of Fidelity's International Equity Funds. Mr. Wetlaufer also serves as Group Chief Investment Officer of FMR. Mr. Wetlaufer is Chairman, Chief Executive Officer, and President of Fidelity Management & Research (Hong Kong) Limited (2008-present); Chairman, Chief Executive Officer, President, and a Director of Fidelity Management & Research (Japan) Inc. (2008-present); Chairman and Chief Executive Officer (2007-present) and President and a Director (2006-present) of Fidelity Management & Research (U.K.) Inc. and President and a Director of Fidelity Research & Analysis Company (2006-present). Before joining Fidelity Investments in 2005, Mr. Wetlaufer was a partner in Oxhead Capital Management (2004-2005) and a Chief Investment Officer of Putnam Investments (1997-2003).
Scott C. Goebel (40)
Year of Election or Appointment: 2008
Secretary and Chief Legal Officer (CLO) of the Fidelity funds. Mr. Goebel also serves as General Counsel, Secretary, and Senior Vice President of FMR (2008-present); Deputy General Counsel of FMR LLC; Chief Legal Secretary of Fidelity Management & Research (Hong Kong) Limited (2008-present) and Assistant Secretary of Fidelity Management & Research (Japan) Inc. (2008-present). Previously, Mr. Goebel served as Assistant Secretary of the Funds (2007-2008) and as Vice President and Secretary of Fidelity Distributors Corporation (FDC) (2005-2007).
John B. McGinty, Jr. (46)
Year of Election or Appointment: 2008
Assistant Secretary of Fidelity's Equity and High Income Funds. Mr. McGinty is an employee of Fidelity Investments (2004-present). Mr. McGinty also serves as Senior Vice President, Secretary, and Chief Legal Officer of FDC (2007-present). Before joining Fidelity Investments, Mr. McGinty practiced law at Ropes & Gray, LLP.
Holly C. Laurent (54)
Year of Election or Appointment: 2008
Anti-Money Laundering (AML) Officer of the Fidelity funds. Ms. Laurent is an employee of Fidelity Investments. Previously, Ms. Laurent was Senior Vice President and Head of Legal for Fidelity Business Services India Pvt. Ltd. (2006-2008), Senior Vice President, Deputy General Counsel and Group Head for FMR LLC (2005-2006).
Christine Reynolds (50)
Year of Election or Appointment: 2008
Chief Financial Officer of the Fidelity funds. Ms. Reynolds became President of Fidelity Pricing and Cash Management Services (FPCMS) in August 2008. She served as Chief Operating Officer of FPCMS from 2007 through July 2008. Previously, Ms. Reynolds served as President, Treasurer, and Anti-Money Laundering officer of the Fidelity funds (2004-2007). Before joining Fidelity Investments, Ms. Reynolds worked at PricewaterhouseCoopers LLP (PwC) (1980-2002), where she was an audit partner with PwC's investment management practice.
Kenneth A. Rathgeber (61)
Year of Election or Appointment: 2004
Chief Compliance Officer of Fidelity's Equity and High Income Funds. Mr. Rathgeber is Chief Compliance Officer of Fidelity Management & Research (Hong Kong) Limited (2008-present), Fidelity Management & Research (Japan) Inc. (2008-present), FMR (2005-present), FMR Co., Inc. (2005-present), Fidelity Management & Research (U.K.) Inc. (2005-present), Fidelity Research & Analysis Company (2005-present), Fidelity Investments Money Management, Inc. (2005-present), and Strategic Advisers, Inc. (2005-present).
Bryan A. Mehrmann (47)
Year of Election or Appointment: 2005
Deputy Treasurer of the Fidelity funds. Mr. Mehrmann is an employee of Fidelity Investments. Previously, Mr. Mehrmann served as Vice President of Fidelity Investments Institutional Services Group (FIIS)/Fidelity Investments Institutional Operations Company, Inc. (FIIOC) Client Services (1998-2004).
Adrien E. Deberghes (41)
Year of Election or Appointment: 2008
Deputy Treasurer of Fidelity's Equity and High Income Funds. Mr. Deberghes is an employee of Fidelity Investments (2008-present). Previously, Mr. Deberghes served as Senior Vice President of Mutual Fund Administration at State Street Corporation (2007-2008), Senior Director of Mutual Fund Administration at Investors Bank & Trust (2005-2007), and Director of Finance for Dunkin' Brands (2000-2005).
Robert G. Byrnes (42)
Year of Election or Appointment: 2005
Assistant Treasurer of the Fidelity funds. Mr. Byrnes is an employee of Fidelity Investments (2005-present). Previously, Mr. Byrnes served as Vice President of Fidelity Pricing and Cash Management Services (FPCMS) (2003-2005). Before joining Fidelity Investments, Mr. Byrnes worked at Deutsche Asset Management where he served as Vice President of the Investment Operations Group (2000-2003).
Paul M. Murphy (61)
Year of Election or Appointment: 2007
Assistant Treasurer of the Fidelity funds. Mr. Murphy is an employee of Fidelity Investments (2007-present). Previously, Mr. Murphy served as Chief Financial Officer of the Fidelity Funds (2005-2006), Vice President and Associate General Counsel of FMR (2007), and Senior Vice President of Fidelity Pricing and Cash Management Services (FPCMS) (1994-2007).
Gary W. Ryan (50)
Year of Election or Appointment: 2005
Assistant Treasurer of the Fidelity funds. Mr. Ryan is an employee of Fidelity Investments. Previously, Mr. Ryan served as Vice President of Fund Reporting in Fidelity Pricing and Cash Management Services (FPCMS) (1999-2005).
** FMR Corp. merged with and into FMR LLC on October 1, 2007. Any references to FMR LLC for prior periods are deemed to be references to the prior entity.
The amounts per share which represent income derived from sources within, and taxes paid to, foreign countries or possessions of the United States are as follows:
Pay Date
Income
Taxes
Initial Class R
12/19/2008
$0.084
$0.014
12/30/2008
$0.005
$0.000
Investor Class R
12/19/2008
$0.084
$0.014
12/30/2008
$0.005
$0.000
Service Class 2R
12/19/2008
$0.064
$0.014
12/30/2008
$0.005
$0.000
The fund will notify shareholders in January 2009 of amounts for use in preparing 2008 income tax returns.
A special meeting of the fund's shareholders was held on May 14, 2008. The results of votes taken among shareholders on the proposals before them are reported below. Each vote reported represents one dollar of net asset value held on the record date for the meeting.
PROPOSAL 1
To elect a Board of Trustees.A
# of Votes
% of Votes
James C. Curvey
Affirmative
82,890,712.47
95.991
Withheld
3,461,988.43
4.009
TOTAL
86,352,700.90
100.000
Dennis J. Dirks
Affirmative
82,970,372.75
96.083
Withheld
3,382,328.15
3.917
TOTAL
86,352,700.90
100.000
Edward C. Johnson 3d
Affirmative
82,689,162.78
95.757
Withheld
3,663,538.12
4.243
TOTAL
86,352,700.90
100.000
Alan J. Lacy
Affirmative
83,041,222.35
96.165
Withheld
3,311,478.55
3.835
TOTAL
86,352,700.90
100.000
Ned C. Lautenbach
Affirmative
82,983,853.72
96.099
Withheld
3,368,847.18
3.901
TOTAL
86,352,700.90
100.000
Joseph Mauriello
Affirmative
83,138,122.14
96.277
Withheld
3,214,578.76
3.723
TOTAL
86,352,700.90
100.000
Cornelia M. Small
Affirmative
83,095,438.06
96.228
Withheld
3,257,262.84
3.772
TOTAL
86,352,700.90
100.000
William S. Stavropoulos
Affirmative
82,929,113.95
96.035
Withheld
3,423,586.95
3.965
TOTAL
86,352,700.90
100.000
David M. Thomas
Affirmative
83,095,487.87
96.228
Withheld
3,257,213.03
3.772
TOTAL
86,352,700.90
100.000
Michael E. Wiley
Affirmative
83,048,523.75
96.174
Withheld
3,304,177.15
3.826
TOTAL
86,352,700.90
100.000
PROPOSAL 2
To amend the Declaration of Trust to reduce the required quorum for future shareholder meetings.A
# of Votes
% of Votes
Affirmative
74,393,635.26
86.151
Against
8,745,543.59
10.128
Abstain
3,213,522.05
3.721
TOTAL
86,352,700.90
100.000
ADenotes trust-wide proposal and voting results.
Semiannual Report
BoardApproval of Investment Advisory Contracts and Management Fees
VIP Emerging Markets Portfolio
Each year, typically in July, the Board of Trustees, including the Independent Trustees (together, the Board), votes on the renewal of the management contract and sub-advisory agreements (together, the Advisory Contracts) for the fund. The Board, assisted by the advice of fund counsel and Independent Trustees' counsel, requests and considers a broad range of information throughout the year.
The Board meets regularly and, acting directly and through its separate committees, requests and receives information concerning, and considers at each of its meetings factors that are relevant to, its annual consideration of the renewal of the fund's Advisory Contracts, including the services and support provided to the fund and its shareholders. At the time of the renewal, the Board had 12 standing committees, each composed of Independent Trustees with varying backgrounds, to which the Board has assigned specific subject matter responsibilities in order to enhance effective decision-making by the Board. Each committee has a written charter outlining the structure and purposes of the committee. The Board also meets as needed to consider matters specifically related to the Board's annual consideration of the renewal of Advisory Contracts.
At its July 2008 meeting, the Board of Trustees, including the Independent Trustees, unanimously determined to renew the fund's Advisory Contracts. In reaching its determination, the Board considered a broad range of information. The Board also approved agreements with foreign sub-advisers Fidelity Management & Research (Japan) Inc. and Fidelity Management & Research (Hong Kong) Limited, as well as amendments to the fund's agreement with Fidelity Management & Research (U.K.) Inc.
In considering whether to renew the Advisory Contracts for the fund, the Board ultimately reached a determination, with the assistance of fund counsel and Independent Trustees' counsel and through the exercise of its business judgment, that the renewal of the Advisory Contracts and the compensation to be received by Fidelity under the management contract is consistent with Fidelity's fiduciary duty under applicable law. The Board's decision to renew the Advisory Contracts was not based on any single factor, but rather was based on a comprehensive consideration of all the information provided to the Board at its meetings throughout the year. The Board, in reaching its determination to renew the Advisory Contracts, is aware that shareholders in the fund have a broad range of investment choices available to them, including a wide choice among mutual funds offered by competitors to Fidelity, and that the fund's shareholders, with the opportunity to review and weigh the disclosure provided by the fund in its prospectus and other public disclosures, have chosen to invest in this fund, managed by Fidelity.
Nature, Extent, and Quality of Services Provided. The Board considered staffing within the investment adviser, FMR, and the sub-advisers (together, the Investment Advisers), including the backgrounds of the fund's investment personnel and the fund's investment objective and discipline. The Independent Trustees also had discussions with senior management of Fidelity's investment operations and investment groups. The Board considered the structure of the portfolio manager compensation program and whether this structure provides appropriate incentives.
Resources Dedicated to Investment Management and Support Services. The Board reviewed the size, education, and experience of the Investment Advisers' investment staff, their use of technology, and the Investment Advisers' approach to recruiting, training, and retaining portfolio managers and other research, advisory, and management personnel. The Board noted that Fidelity's analysts have access to a variety of technological tools that enable them to perform both fundamental and quantitative analysis and to specialize in various disciplines. The Board considered Fidelity's extensive global research capabilities that enable the Investment Advisers to aggregate data from various sources in an effort to produce positive investment results. The Board also considered that Fidelity's portfolio managers and analysts have access to daily portfolio attribution that allows for monitoring of a fund's portfolio, as well as an electronic communication system that provides immediate real-time access to research concerning issuers and credit enhancers.
Shareholder and Administrative Services. The Board considered (i) the nature, extent, quality, and cost of advisory, administrative, distribution, and shareholder services performed by the Investment Advisers and their affiliates under the Advisory Contracts and under separate agreements covering transfer agency, pricing and bookkeeping, and securities lending services for the fund; (ii) the nature and extent of the Investment Advisers' supervision of third party service providers, principally custodians and subcustodians; and (iii) the resources devoted to, and the record of compliance with, the fund's compliance policies and procedures. The Board also reviewed the allocation of fund brokerage, including allocations to brokers affiliated with the Investment Advisers, the use of brokerage commissions to pay fund expenses, and the use of "soft" commission dollars to pay for research services. The Board further considered that Fidelity voluntarily pays for market data out of its own resources.
The Board noted that the growth of fund assets across the complex allows Fidelity to reinvest in the development of services designed to enhance the value or convenience of the Fidelity funds as investment vehicles. These services include 24-hour access to account information and market information through phone representatives and over the Internet, and investor education materials and asset allocation tools.
Investment in a Large Fund Family. The Board considered the benefits to shareholders of investing in a Fidelity fund, including the benefits of investing in a fund that is part of a large family of funds offering a variety of investment disciplines and providing for a large variety of mutual fund investor services. The Board noted that Fidelity has taken a number of actions over the previous year that benefited particular funds, including (i) dedicating additional resources to investment research and to restructure the investment research teams; (ii) contractually agreeing to reduce the management fees on Fidelity's Institutional Money Market Funds and launching Class IV and Institutional Class of certain of these funds; (iii) reducing the transfer agent fees for the Fidelity Select Portfolios and Investor Class of the VIP funds; and (iv) launching Class K of 29 equity funds as a lower-fee class available to certain employer-sponsored retirement plans.
Annual Report
Investment Performance. The Board considered whether the fund has operated within its investment objective, as well as its record of compliance with its investment restrictions. The Board noted that it is not possible to evaluate performance in any comprehensive fashion because the fund had been in operation for less than one calendar year. Once the fund has been in operation for at least one calendar year, the Board will review the fund's absolute investment performance for each class, as well as the fund's relative investment performance for each class measured against a broad-based securities market index and a peer group of mutual funds.
Based on its review, the Board concluded that the nature, extent, and quality of the services provided to the fund will benefit the fund's shareholders, particularly in light of the Board's view that the fund's shareholders benefit from investing in a fund that is part of a large family of funds offering a variety of investment disciplines and services.
Competitiveness of Management Fee and Total Fund Expenses. The Board considered the fund's management fee and projected total operating expenses of each class of the fund in reviewing the Advisory Contracts. The Board noted that the fund's management fee rate is lower than the median fee rate of funds with similar Lipper investment objective categories and comparable management fee characteristics. The Board considered that the projected total operating expenses are comparable to those of similar classes and funds that Fidelity offers to shareholders.
Based on its review, the Board concluded that the fund's management fee and the projected total expenses of each class of the fund were fair and reasonable in light of the services that the fund and its shareholders receive and the other factors considered.
Costs of the Services and Profitability. The fund has only recently commenced operations and therefore no revenue, cost, or profitability data was available for the Board to review in respect of the fund at the time in renew the Advisory Contracts. In connection with its future renewal of the fund's Advisory Contracts, the Board will consider the revenues earned and the expenses incurred by Fidelity in conducting the business of developing, marketing, distributing, managing, administering and servicing the fund and its shareholders.
Economies of Scale. The Board considered whether there have been economies of scale in respect of the management of the Fidelity funds, whether the Fidelity funds (including the fund) have appropriately benefited from any such economies of scale, and whether there is potential for realization of any further economies of scale. The Board considered the extent to which the fund will benefit from economies of scale through increased services to the fund, through waivers or reimbursements, or through fee or expense reductions.
The Board recognized that the fund's management contract incorporates a "group fee" structure, which provides for lower group fee rates as total fund assets under FMR's management increase, and for higher group fee rates as total fund assets under FMR's management decrease. FMR determines the group fee rates based on a tiered asset "breakpoint" schedule. The Board considered that the group fee is designed to deliver the benefits of economies of scale to fund shareholders when total fund assets increase, even if assets of any particular fund are unchanged or have declined, because some portion of Fidelity's costs are attributable to services provided to all Fidelity funds, and all funds benefit if those costs can be allocated among more assets. The Board concluded that, given the group fee structure, fund shareholders will achieve a certain level of economies of scale as assets under FMR's management increase at the fund complex level, regardless of whether Fidelity achieves any such economies of scale.
The Board further concluded that any potential economies of scale are being shared between fund shareholders and Fidelity in an appropriate manner.
Additional Information Requested by the Board. In order to develop fully the factual basis for consideration of the Fidelity funds' Advisory Contracts, the Board requested and received additional information on certain topics, including (i) fund performance trends and actions to be taken by FMR to improve certain funds' overall performance; (ii) portfolio manager changes that have occurred during the past year; (iii) Fidelity's fund profitability methodology, the profitability of certain fund service providers, and profitability trends for certain funds; (iv) Fidelity's compensation structure for portfolio managers and key personnel, including its effects on fund profitability and the extent to which portfolio manager compensation is linked to fund performance; (v) Fidelity's fee structures and rationale for recommending different fees among categories of funds; and (vi) Fidelity's rationale for recommending which funds should have a performance adjustment component as part of their management fees.
Based on its evaluation of all of the conclusions noted above, and after considering all material factors, the Board ultimately concluded that the advisory fee structures are fair and reasonable, and that the fund's Advisory Contracts should be renewed.
Annual Report
Annual Report
Investment Adviser
Fidelity Management & Research Company Boston, MA
Investment Sub-Advisers
FMR Co., Inc.
Fidelity Management & Research (U.K.) Inc.
Fidelity Management & Research (Hong Kong) Limited
Fidelity Management & Research (Japan) Inc.
Fidelity Research & Analysis Company
FIL Investment Advisors
FIL Investment Advisors (U.K.) Ltd.
Fidelity Investments Japan Limited
General Distributor
Fidelity Distributors Corporation Boston, MA
Transfer and Service Agents
Fidelity Investments Institutional Operations Company, Inc. Boston, MA
Fidelity Service Company, Inc. Boston, MA
Custodian
State Street Bank and Trust Company Boston, MA
VIPEMR-ANN-0209
1.888698.100
Fidelity® Variable Insurance Products: Energy Portfolio
Annual Report
December 31, 2008 (2_fidelity_logos) (Registered_Trademark)
To view a fund's proxy voting guidelines and proxy voting record for the 12-month period ended June 30, visit http://www.fidelity.com (search for "proxy voting guidelines") or visit the Securities and Exchange Commission's (SEC) web site at http://www.sec.gov. You may also call 1-877-208-0098 to request a free copy of the proxy voting guidelines.
Fidelity Variable Insurance Products are separate account options which are purchased through a variable insurance contract.
Standard & Poor's, S&P and S&P 500 are registered service marks of The McGraw-Hill Companies, Inc. and have been licensed for use by Fidelity Distributors Corporation.
Other third party marks appearing herein are the property of their respective owners.
All other marks appearing herein are registered or unregistered trademarks or service marks of FMR LLC or an affiliated company.
This report and the financial statements contained herein are submitted for the general information of the shareholders of the fund. This report is not authorized for distribution to prospective investors in the fund unless preceded or accompanied by an effective prospectus.
A fund files its complete schedule of portfolio holdings with the SEC for the first and third quarters of each fiscal year on Form N-Q. Forms N-Q are available on the SEC's web site at http://www.sec.gov. A fund's Forms N-Q may be reviewed and copied at the SEC's Public Reference Room in Washington, DC. Information regarding the operation of the SEC's Public Reference Room may be obtained by calling 1-800-SEC-0330. For a complete list of the fund's portfolio holdings, view the most recent holdings listing, semiannual report, or annual report on Fidelity's web site at http://www.fidelity.com or http://www.advisor.fidelity.com, as applicable.
NOT FDIC INSURED · MAY LOSE VALUE · NO BANK GUARANTEE
Neither the fund nor Fidelity Distributors Corporation is a bank.
Average annual total return reflects the change in the value of an investment, assuming reinvestment of the class' dividend income and capital gains (the profits earned upon the sale of securities that have grown in value, if any) and assuming a constant rate of performance each year. During periods of reimbursement by Fidelity, a fund's total return will be greater than it would be had the reimbursement not occurred. Performance numbers are net of all underlying fund operating expenses, but do not include any insurance charges imposed by your insurance company's separate account. If performance information included the effect of these additional charges, the total returns would have been lower. How a fund did yesterday is no guarantee of how it will do tomorrow.
Average Annual Total Returns
Periods ended December 31, 2008
Past 1 year
Past 5 years
Life of fundA
VIP Energy - Initial Class C
-54.26%
7.20%
6.36%
VIP Energy - Investor ClassB, C
-54.32%
7.11%
6.30%
AFrom July 19, 2001.
BThe initial offering of Investor Class took place on July 21, 2005. Returns prior to July 21, 2005 are those of Initial Class. If Investor Class's transfer agent fee had been reflected, returns prior to July 21, 2005 would have been lower.
CPrior to October 1, 2006, VIP Energy operated under certain different investment policies. The historical performance for the fund may not represent its current investment policies.
$10,000 Over Life of Fund
Let's say hypothetically that $10,000 was invested in VIP Energy Portfolio - Initial Class on July 19, 2001, when the fund started. The chart shows how the value of your investment would have changed, and also shows how the Standard & Poor's 500SM Index (S&P 500®) performed over the same period.
Comments from John Dowd, Portfolio Manager of VIP Energy Portfolio
By year-end 2008, the vicious credit crisis sparked in the U.S. had spread like wildfire across the world's capital markets, stunting global growth, toppling commodity prices, changing the face of the global financial system and chasing risk-averse investors toward the sidelines. The U.S. equity markets, as measured by the Dow Jones Industrial AverageSM and Standard & Poor's 500SM Index, fell hard as a result, declining 31.93% and 37.00%, respectively, while the technology-laden NASDAQ Composite® Index slid 40.03%. Foreign market stocks saw an even sharper decline, as illustrated by the 43.28% loss of the MSCI® EAFE® Index (Europe, Australasia, Far East), a gauge of developed stock markets outside the U.S. and Canada. A generally stronger U.S. dollar also held back returns for U.S. investors in foreign equities. Emerging-markets stocks - the global performance leader only a year ago - fell harder still, dropping 53.18%, as measured by the MSCI Emerging Markets Index. The only clear winners during the past year were assets backed by the U.S. government, as investors fled from risk. Thus, the Barclays Capital U.S. Treasury Bond Index climbed 13.74% for the year, while the Barclays Capital U.S. Aggregate Bond Index - a broader measure of the U.S. investment-grade bond universe - gained a more modest 5.24%. By contrast, high-yield bonds bore the brunt of investors' increasing wariness over risk, as expressed by the Merrill Lynch® U.S. High Yield Master II Constrained Index's drop of 26.11%. The emerging-markets bond category also felt the shock of investors' risk-averse sentiment, with the JPMorgan Emerging Markets Bond Index (EMBI) Global falling 10.91%. Meanwhile, the Citigroup® Non-U.S. Group of 7 Index - representing the debt performance of major global economies, excluding the United States - eked out a 1.69% gain.
For the 12 months ending December 31, 2008, the fund substantially underperformed the S&P 500® and the -36.93% return of the MSCI® US Investable Market Energy Index. (For specific portfolio results, please see the performance section of this report.) With investors shedding risk and favoring mainly the "too-big-to-fail" stocks, the portfolio's relatively aggressive positioning in an array of inexpensive stocks from mid- and smaller-sized companies went unrewarded. Much of the fund's underperformance versus the MSCI index was due to underweighting integrated oil companies, which led energy sector performance despite the precipitous drop in oil prices. Specifically, the fund underweighted top-performing Exxon Mobil, as well as Chevron, though Exxon Mobil was the fund's largest holding at period end. A large position in U.S. oil refiner Valero Energy also disappointed; the stock declined when refining margins contracted due to higher oil prices early on and amid decelerating U.S. and European consumption. Rig construction company National Oilwell Varco and rig owner Nabors Industries also detracted, plummeting as a result of reduced global energy demand. Contributors included an underweighting in poorly-performing oil services company Schlumberger, an outsized stake in low-cost natural gas producer Southwestern Energy, and underweighted positions in exploration and production companies Noble Energy and Anadarko Petroleum.
The views expressed above reflect those of the portfolio manager(s) only through the end of the period as stated on the cover of this report and do not necessarily represent the views of Fidelity or any other person in the Fidelity organization. Any such views are subject to change at any time based upon market or other conditions and Fidelity disclaims any responsibility to update such views. These views may not be relied on as investment advice and, because investment decisions for a Fidelity fund are based on numerous factors, may not be relied on as an indication of trading intent on behalf of any Fidelity fund.
As a shareholder of the Fund, you incur two types of costs: (1) transaction costs, including redemption fees, and (2) ongoing costs, including management fees, distribution and/or service (12b-1) fees and other Fund expenses. This Example is intended to help you understand your ongoing costs (in dollars) of investing in the Fund and to compare these costs with the ongoing costs of investing in other mutual funds.
The Example is based on an investment of $1,000 invested at the beginning of the period and held for the entire period (July 1, 2008 to December 31, 2008).
Actual Expenses
The first line of the accompanying table for each class of the Fund provides information about actual account values and actual expenses. You may use the information in this line, together with the amount you invested, to estimate the expenses that you paid over the period. Simply divide your account value by $1,000.00 (for example, an $8,600 account value divided by $1,000.00 = 8.6), then multiply the result by the number in the first line for a class of the Fund under the heading entitled "Expenses Paid During Period" to estimate the expenses you paid on your account during this period. The estimate of expenses does not include any fees or other expenses of any variable annuity or variable life insurance product. If they were, the estimate of expenses you paid during the period would be higher, and your ending account value would be lower. In addition, the Fund, as a shareholder in the underlying Fidelity Central Funds, will indirectly bear its pro rata share of the fees and expenses incurred by the underlying Fidelity Central Funds. These fees and expenses are not included in the Fund's annualized expense ratio used to calculate the expense estimate in the table below.
Hypothetical Example for Comparison Purposes
The second line of the accompanying table for each class of the Fund provides information about hypothetical account values and hypothetical expenses based on a Class' actual expense ratio and an assumed rate of return of 5% per year before expenses, which is not the Class' actual return. The hypothetical account values and expenses may not be used to estimate the actual ending account balance or expenses you paid for the period. You may use this information to compare the ongoing costs of investing in the Fund and other funds. To do so, compare this 5% hypothetical example with the 5% hypothetical examples that appear in the shareholder reports of the other funds. The estimate of expenses does not include any fees or other expenses of any variable annuity or variable life insurance product. If they were, the estimate of expenses you paid during the period would be higher, and your ending account value would be lower. In addition, the Fund, as a shareholder in the underlying Fidelity Central Funds, will indirectly bear its pro rata share of the fees and expenses incurred by the underlying Fidelity Central Funds. These fees and expenses are not included in the Fund's annualized expense ratio used to calculate the expense estimate in the table below.
Please note that the expenses shown in the table are meant to highlight your ongoing costs only and do not reflect any transaction costs. Therefore, the second line of the table is useful in comparing ongoing costs only, and will not help you determine the relative total costs of owning different funds. In addition, if these transactional costs were included, your costs would have been higher.
Annualized Expense Ratio
Beginning Account Value July 1, 2008
Ending Account Value December 31, 2008
Expenses Paid During Period* July 1, 2008 to December 31, 2008
Initial Class
.70%
Actual
$ 1,000.00
$ 394.70
$ 2.45
HypotheticalA
$ 1,000.00
$ 1,021.62
$ 3.56
Service Class 2
.95%
Actual
$ 1,000.00
$ 394.00
$ 3.33
HypotheticalA
$ 1,000.00
$ 1,020.36
$ 4.82
Investor Class
.79%
Actual
$ 1,000.00
$ 394.40
$ 2.77
HypotheticalA
$ 1,000.00
$ 1,021.17
$ 4.01
A 5% return per year before expenses
* Expenses are equal to each Class' annualized expense ratio, multiplied by the average account value over the period, multiplied by 184/366 (to reflect the one-half year period).
Annual Report
Investment Changes (Unaudited)
Top Ten Stocks as of December 31, 2008
% of fund's net assets
% of fund's net assets 6 months ago
Exxon Mobil Corp.
6.0
3.7
Chevron Corp.
5.4
1.2
Occidental Petroleum Corp.
4.2
2.7
Range Resources Corp.
4.1
4.0
Cabot Oil & Gas Corp.
3.8
3.6
Southwestern Energy Co.
3.2
1.9
Hess Corp.
3.1
2.7
Anadarko Petroleum Corp.
2.9
0.0
Noble Corp.
2.8
0.5
ConocoPhillips
2.4
5.6
37.9
Top Industries (% of fund's net assets)
As of December 31, 2008
Oil, Gas & Consumable Fuels
71.8%
Energy Equipment & Services
21.5%
Electrical Equipment
2.3%
Gas Utilities
1.0%
Construction & Engineering
1.0%
All Others*
2.4%
As of June 30, 2008
Oil, Gas & Consumable Fuels
63.1%
Energy Equipment & Services
30.0%
Electrical Equipment
3.7%
Chemicals
0.5%
Construction & Engineering
0.3%
All Others*
2.4%
* Includes short-term investments and net other assets.
Prior period industry classifications reflect the categories in place as of the date indicated and have not been adjusted to reflect current industry classifications.
Annual Report
Investments December 31, 2008
Showing Percentage of Net Assets
Common Stocks - 97.7%
Shares
Value
COMMERCIAL SERVICES & SUPPLIES - 0.0%
Environmental & Facility Services - 0.0%
Fuel Tech, Inc. (a)
10,149
$ 107,478
CONSTRUCTION & ENGINEERING - 1.0%
Construction & Engineering - 1.0%
Jacobs Engineering Group, Inc. (a)
54,700
2,631,070
ELECTRICAL EQUIPMENT - 2.3%
Electrical Components & Equipment - 2.1%
Evergreen Solar, Inc. (a)
141,706
452,042
First Solar, Inc. (a)
9,900
1,365,804
JA Solar Holdings Co. Ltd. ADR (a)(d)
251,400
1,098,618
Q-Cells SE (a)
9,800
358,405
Renewable Energy Corp. AS (a)
38,100
367,345
Sunpower Corp. Class B (a)
52,500
1,598,100
Suntech Power Holdings Co. Ltd. sponsored ADR (a)(d)
23,800
278,460
5,518,774
Heavy Electrical Equipment - 0.2%
Vestas Wind Systems AS (a)
7,383
436,573
TOTAL ELECTRICAL EQUIPMENT
5,955,347
ENERGY EQUIPMENT & SERVICES - 21.5%
Oil & Gas Drilling - 11.0%
Atwood Oceanics, Inc. (a)
191,211
2,921,704
Helmerich & Payne, Inc.
152,351
3,465,985
Hercules Offshore, Inc. (a)
120,080
570,380
Nabors Industries Ltd. (a)
442,694
5,299,047
Noble Corp.
335,621
7,413,868
Patterson-UTI Energy, Inc.
228,114
2,625,592
Pioneer Drilling Co. (a)
41,202
229,495
Pride International, Inc. (a)
142,600
2,278,748
Rowan Companies, Inc.
88,500
1,407,150
Transocean Ltd. (a)
54,747
2,586,796
28,798,765
Oil & Gas Equipment & Services - 10.5%
Baker Hughes, Inc.
21,300
683,091
BJ Services Co.
149,800
1,748,166
Complete Production Services, Inc. (a)
59,960
488,674
Core Laboratories NV
7,400
442,964
Dril-Quip, Inc. (a)
14,500
297,395
Exterran Holdings, Inc. (a)
46,243
984,976
FMC Technologies, Inc. (a)
20
477
Fugro NV (Certificaten Van Aandelen) unit
1,023
29,544
Global Industries Ltd. (a)
216,634
756,053
Halliburton Co.
84,374
1,533,919
Helix Energy Solutions Group, Inc. (a)
44,300
320,732
National Oilwell Varco, Inc. (a)
240,478
5,877,282
Oil States International, Inc. (a)
39,200
732,648
Schlumberger Ltd. (NY Shares)
106,742
4,518,389
Smith International, Inc.
8,268
189,255
Shares
Value
Superior Energy Services, Inc. (a)
125,654
$ 2,001,668
Tenaris SA sponsored ADR
11,500
241,270
Tidewater, Inc.
36,400
1,465,828
TSC Offshore Group Ltd. (a)
746,000
53,941
Weatherford International Ltd. (a)
408,210
4,416,832
Willbros Group, Inc. (a)
108,633
920,122
27,703,226
TOTAL ENERGY EQUIPMENT & SERVICES
56,501,991
GAS UTILITIES - 1.0%
Gas Utilities - 1.0%
Equitable Resources, Inc.
30,100
1,009,855
Questar Corp.
44,600
1,457,974
Zhongyu Gas Holdings Ltd. (a)
3,884,000
207,727
2,675,556
METALS & MINING - 0.1%
Diversified Metals & Mining - 0.1%
Teck Cominco Ltd. Class B (sub. vtg.)
33,100
163,772
OIL, GAS & CONSUMABLE FUELS - 71.8%
Coal & Consumable Fuels - 3.8%
Arch Coal, Inc.
70,150
1,142,744
CONSOL Energy, Inc.
89,621
2,561,368
Foundation Coal Holdings, Inc.
187,714
2,631,750
Peabody Energy Corp.
150,994
3,435,114
PT Bumi Resources Tbk
1,598,000
129,740
9,900,716
Integrated Oil & Gas - 30.5%
BP PLC sponsored ADR
53,000
2,477,220
Chevron Corp.
193,900
14,342,783
ConocoPhillips
123,900
6,418,020
ENI SpA sponsored ADR
82,600
3,949,932
Exxon Mobil Corp.
196,774
15,708,471
Hess Corp.
151,500
8,126,460
Marathon Oil Corp.
229,000
6,265,440
Occidental Petroleum Corp.
184,000
11,038,160
Petro-Canada
109,700
2,409,126
Petroleo Brasileiro SA - Petrobras (PN) sponsored ADR (non-vtg.)
50,100
1,022,541
Royal Dutch Shell PLC Class A sponsored ADR
88,000
4,658,720
Total SA sponsored ADR
72,000
3,981,600
80,398,473
Oil & Gas Exploration & Production - 29.4%
Anadarko Petroleum Corp.
200,600
7,733,130
Apache Corp.
9,200
685,676
Berry Petroleum Co. Class A
1,714
12,958
Cabot Oil & Gas Corp.
390,118
10,143,068
Canadian Natural Resources Ltd.
43,400
1,738,925
Chesapeake Energy Corp.
25,800
417,186
Comstock Resources, Inc. (a)
110,220
5,207,895
Concho Resources, Inc. (a)
119,844
2,734,840
Common Stocks - continued
Shares
Value
OIL, GAS & CONSUMABLE FUELS - CONTINUED
Oil & Gas Exploration & Production - continued
Denbury Resources, Inc. (a)
226,100
$ 2,469,012
Devon Energy Corp.
12,500
821,375
Encore Acquisition Co. (a)
76,732
1,958,201
EOG Resources, Inc.
800
53,264
EXCO Resources, Inc. (a)
165,850
1,502,601
Forest Oil Corp. (a)
15,509
255,743
Goodrich Petroleum Corp. (a)
28,800
862,560
Newfield Exploration Co. (a)
10,100
199,475
Nexen, Inc.
133,700
2,357,085
Noble Energy, Inc.
73,400
3,612,748
Oil Search Ltd.
284,383
949,849
OPTI Canada, Inc. (a)
154,600
228,717
Penn Virginia Corp.
48,061
1,248,625
Petrobank Energy & Resources Ltd. (a)
15,900
265,414
Petrohawk Energy Corp. (a)
398,223
6,224,225
Petroquest Energy, Inc. (a)
121,063
818,386
Plains Exploration & Production Co. (a)
143,562
3,336,381
Quicksilver Resources, Inc. (a)
302,039
1,682,357
Range Resources Corp.
315,100
10,836,289
SandRidge Energy, Inc. (a)
2,922
17,970
Southwestern Energy Co. (a)
293,000
8,488,210
Talisman Energy, Inc.
2,900
29,031
Whiting Petroleum Corp. (a)
19,300
645,778
77,536,974
Oil & Gas Refining & Marketing - 6.4%
Frontier Oil Corp.
362,664
4,580,446
Holly Corp.
85,600
1,560,488
Sunoco, Inc.
77,037
3,348,028
Tesoro Corp.
167,332
2,203,762
Valero Energy Corp.
244,657
5,294,377
16,987,101
Shares
Value
Oil & Gas Storage & Transport - 1.7%
El Paso Corp.
163,900
$ 1,283,337
Williams Companies, Inc.
213,850
3,096,548
4,379,885
TOTAL OIL, GAS & CONSUMABLE FUELS
189,203,149
TOTAL COMMON STOCKS
(Cost $379,872,755)
257,238,363
Money Market Funds - 2.4%
Fidelity Cash Central Fund, 1.06% (b)
5,327,161
5,327,161
Fidelity Securities Lending Cash Central Fund, 0.87% (b)(c)
946,375
946,375
TOTAL MONEY MARKET FUNDS
(Cost $6,273,536)
6,273,536
TOTAL INVESTMENT PORTFOLIO - 100.1%
(Cost $386,146,291)
263,511,899
NET OTHER ASSETS - (0.1)%
(207,590)
NET ASSETS - 100%
$ 263,304,309
Legend
(a) Non-income producing
(b) Affiliated fund that is available only to investment companies and other accounts managed by Fidelity Investments. The rate quoted is the annualized seven-day yield of the fund at period end. A complete unaudited listing of the fund's holdings as of its most recent quarter end is available upon request.
(c) Investment made with cash collateral received from securities on loan.
(d) Security or a portion of the security is on loan at period end.
Affiliated Central Funds
Information regarding fiscal year to date income earned by the Fund from investments in Fidelity Central Funds is as follows:
Fund
Income earned
Fidelity Cash Central Fund
$ 145,870
Fidelity Securities Lending Cash Central Fund
101,982
Total
$ 247,852
Other Information
The following is a summary of the inputs used, as of December 31, 2008, involving the Fund's assets carried at value. The inputs or methodology used for valuing securities may not be an indication of the risk associated with investing in those securities. For more information on valuation inputs, and their aggregation into the levels used in the table below, please refer to the Security Valuation section in the accompanying Notes to Financial Statements.
Valuation Inputs at Reporting Date:
Description
Total
Level 1
Level 2
Level 3
Investments in Securities
$ 263,511,899
$ 260,978,775
$ 2,533,124
$ -
Distribution of investments by country of issue, as a percentage of total net assets, is as follows: (Unaudited)
United States of America
83.4%
Cayman Islands
4.4%
Canada
2.8%
United Kingdom
2.7%
Netherlands Antilles
1.7%
France
1.5%
Italy
1.5%
Others (individually less than 1%)
2.0%
100.0%
Income Tax Information
The fund intends to elect to defer to its fiscal year ending December 31, 2009 approximately $23,129,107 of losses recognized during the period November 1, 2008 to December 31, 2008.
See accompanying notes which are an integral part of the financial statements.
Investment in securities, at value (including securities loaned of $876,040) - See accompanying schedule:
Unaffiliated issuers (cost $379,872,755)
$ 257,238,363
Fidelity Central Funds (cost $6,273,536)
6,273,536
Total Investments (cost $386,146,291)
$ 263,511,899
Foreign currency held at value (cost $203)
203
Receivable for investments sold
133,757
Receivable for fund shares sold
771,173
Dividends receivable
200,230
Distributions receivable from Fidelity Central Funds
6,635
Prepaid expenses
3,646
Other receivables
41,391
Total assets
264,668,934
Liabilities
Payable for investments purchased
$ 101,769
Payable for fund shares redeemed
43,081
Accrued management fee
118,047
Distribution fees payable
17,651
Other affiliated payables
25,507
Other payables and accrued expenses
112,195
Collateral on securities loaned, at value
946,375
Total liabilities
1,364,625
Net Assets
$ 263,304,309
Net Assets consist of:
Paid in capital
$ 424,209,480
Accumulated undistributed net realized gain (loss) on investments and foreign currency transactions
(38,212,880)
Net unrealized appreciation (depreciation) on investments and assets and liabilities in foreign currencies
(122,692,291)
Net Assets
$ 263,304,309
Statement of Assets and Liabilities - continued
December 31, 2008
Initial Class: Net Asset Value, offering price and redemption price per share ($117,939,822 ÷ 10,295,396 shares)
$ 11.46
Service Class 2: Net Asset Value, offering price and redemption price per share ($90,108,510 ÷ 7,902,605 shares)
$ 11.40
Investor Class: Net Asset Value, offering price and redemption price per share ($55,255,977 ÷ 4,831,026 shares)
$ 11.44
See accompanying notes which are an integral part of the financial statements.
Annual Report
Statement of Operations
Year ended December 31, 2008
Investment Income
Dividends
$ 4,533,310
Interest
1,076
Income from Fidelity Central Funds
247,852
Total income
4,782,238
Expenses
Management fee
$ 3,243,094
Transfer agent fees
506,059
Distribution fees
458,846
Accounting and security lending fees
217,092
Custodian fees and expenses
54,033
Independent trustees' compensation
2,795
Registration fees
1,094
Audit
44,303
Legal
3,471
Interest
16,799
Miscellaneous
60,181
Total expenses before reductions
4,607,767
Expense reductions
(22,664)
4,585,103
Net investment income (loss)
197,135
Realized and Unrealized Gain (Loss)
Net realized gain (loss) on:
Investment securities:
Unaffiliated issuers
(26,229,667)
Foreign currency transactions
9,906
Total net realized gain (loss)
(26,219,761)
Change in net unrealized appreciation (depreciation) on:
Investment securities (net of decrease in deferred foreign taxes of $97,338)
(343,581,244)
Assets and liabilities in foreign currencies
515
Total change in net unrealized appreciation (depreciation)
(343,580,729)
Net gain (loss)
(369,800,490)
Net increase (decrease) in net assets resulting from operations
$ (369,603,355)
Statement of Changes in Net Assets
Year ended December 31, 2008
Year ended December 31, 2007
Increase (Decrease) in Net Assets
Operations
Net investment income (loss)
$ 197,135
$ 1,173,451
Net realized gain (loss)
(26,219,761)
35,806,472
Change in net unrealized appreciation (depreciation)
(343,580,729)
145,447,905
Net increase (decrease) in net assets resulting from operations
(369,603,355)
182,427,828
Distributions to shareholders from net investment income
(275,275)
(1,200,523)
Distributions to shareholders from net realized gain
(18,707,189)
(27,081,489)
Total distributions
(18,982,464)
(28,282,012)
Share transactions - net increase (decrease)
(29,506,360)
124,344,576
Redemption fees
458,118
169,727
Total increase (decrease) in net assets
(417,634,061)
278,660,119
Net Assets
Beginning of period
680,938,370
402,278,251
End of period
$ 263,304,309
$ 680,938,370
See accompanying notes which are an integral part of the financial statements.
Annual Report
Financial Highlights - Initial Class
Years ended December 31,
2008
2007
2006
2005
2004
Selected Per-Share Data
Net asset value, beginning of period
$ 26.55
$ 19.04
$ 18.92
$ 13.62
$ 11.04
Income from Investment Operations
Net investment income (loss) C
.03
.07
.09
.10
.10
Net realized and unrealized gain (loss)
(14.31)
8.62
3.09
6.20
2.53
Total from investment operations
(14.28)
8.69
3.18
6.30
2.63
Distributions from net investment income
(.03)
(.06)
(.16)
(.08)
(.07)
Distributions from net realized gain
(.80)
(1.13)
(2.91)
(.94)
-
Total distributions
(.83)
(1.19)
(3.07)
(1.02)
(.07)
Redemption fees added to paid in capital C
.02
.01
.01
.02
.02
Net asset value, end of period
$ 11.46
$ 26.55
$ 19.04
$ 18.92
$ 13.62
Total Return A, B
(54.26)%
45.97%
16.91%
46.31%
23.96%
Ratios to Average Net Assets D, F
Expenses before reductions
.70%
.70%
.71%
.72%
.78%
Expenses net of fee waivers, if any
.70%
.70%
.71%
.72%
.78%
Expenses net of all reductions
.69%
.70%
.70%
.66%
.74%
Net investment income (loss)
.13%
.31%
.43%
.56%
.80%
Supplemental Data
Net assets, end of period (000 omitted)
$ 117,940
$ 355,854
$ 280,537
$ 334,368
$ 125,781
Portfolio turnover rate E
130%
61%
151%
107%
87%
A Total returns do not reflect charges attributable to your insurance company's separate account. Inclusion of these charges would reduce the total returns shown.
B Total returns would have been lower had certain expenses not been reduced during the periods shown.
C Calculated based on average shares outstanding during the period.
D Fees and expenses of the underlying Fidelity Central Funds are not included in the Fund's expense ratio. The Fund indirectly bears its proportionate share of the expenses of any underlying Fidelity Central Funds.
E Amount does not include the portfolio activity of any underlying Fidelity Central Funds.
F Expense ratios reflect operating expenses of the class. Expenses before reductions do not reflect amounts reimbursed by the investment adviser or reductions from brokerage service arrangements or other expense offset arrangements and do not represent the amount paid by the class during periods when reimbursements or reductions occur. Expenses net of fee waivers reflect expenses after reimbursement by the investment adviser but prior to reductions from brokerage service arrangements or other expense offset arrangements. Expenses net of all reductions represent the net expenses paid by the class.
B Total returns for periods of less than one year are not annualized.
C Total returns do not reflect charges attributable to your insurance company's separate account. Inclusion of these charges would reduce the total returns shown.
D Total returns would have been lower had certain expenses not been reduced during the periods shown.
E Calculated based on average shares outstanding during the period.
F Fees and expenses of the underlying Fidelity Central Funds are not included in the Fund's expense ratio. The Fund indirectly bears its proportionate share of the expenses of any underlying Fidelity Central Funds.
G Amount does not include the portfolio activity of any underlying Fidelity Central Funds.
H For the period April 6, 2005 (commencement of sale of shares) to December 31, 2005.
I Expense ratios reflect operating expenses of the class. Expenses before reductions do not reflect amounts reimbursed by the investment adviser or reductions from brokerage service arrangements or other expense offset arrangements and do not represent the amount paid by the class during periods when reimbursements or reductions occur. Expense ratios before reductions for start-up periods may not be representative of longer-term operating periods. Expenses net of fee waivers reflect expenses after reimbursement by the investment adviser but prior to reductions from brokerage service arrangements or other expense offset arrangements. Expenses net of all reductions represent the net expenses paid by the class.
See accompanying notes which are an integral part of the financial statements.
Annual Report
Financial Highlights - Investor Class
Years ended December 31,
2008
2007
2006
2005 H
Selected Per-Share Data
Net asset value, beginning of period
$ 26.49
$ 19.00
$ 18.91
$ 16.76
Income from Investment Operations
Net investment income (loss) E
.01
.05
.06
.03
Net realized and unrealized gain (loss)
(14.28)
8.61
3.08
3.11
Total from investment operations
(14.27)
8.66
3.14
3.14
Distributions from net investment income
- J
(.05)
(.15)
(.08)
Distributions from net realized gain
(.80)
(1.13)
(2.91)
(.92)
Total distributions
(.80)
(1.18)
(3.06)
(1.00)
Redemption fees added to paid in capital E
.02
.01
.01
.01
Net asset value, end of period
$ 11.44
$ 26.49
$ 19.00
$ 18.91
Total Return B, C, D
(54.32)%
45.88%
16.69%
18.73%
Ratios to Average Net Assets F, I
Expenses before reductions
.79%
.81%
.84%
.91% A
Expenses net of fee waivers, if any
.79%
.81%
.84%
.91% A
Expenses net of all reductions
.78%
.81%
.82%
.85% A
Net investment income (loss)
.04%
.20%
.31%
.37% A
Supplemental Data
Net assets, end of period (000 omitted)
$ 55,256
$ 131,198
$ 51,436
$ 16,402
Portfolio turnover rate G
130%
61%
151%
107%
A Annualized
B Total returns for periods of less than one year are not annualized.
C Total returns do not reflect charges attributable to your insurance company's separate account. Inclusion of these charges would reduce the total returns shown.
D Total returns would have been lower had certain expenses not been reduced during the periods shown.
E Calculated based on average shares outstanding during the period.
F Fees and expenses of the underlying Fidelity Central Funds are not included in the Fund's expense ratio. The Fund indirectly bears its proportionate share of the expenses of any underlying Fidelity Central Funds.
G Amount does not include the portfolio activity of any underlying Fidelity Central Funds.
H For the period July 21, 2005 (commencement of sale of shares) to December 31, 2005.
I Expense ratios reflect operating expenses of the class. Expenses before reductions do not reflect amounts reimbursed by the investment adviser or reductions from brokerage service arrangements or other expense offset arrangements and do not represent the amount paid by the class during periods when reimbursements or reductions occur. Expense ratios before reductions for start-up periods may not be representative of longer-term operating periods. Expenses net of fee waivers reflect expenses after reimbursement by the investment adviser but prior to reductions from brokerage service arrangements or other expense offset arrangements. Expenses net of all reductions represent the net expenses paid by the class.
J Amount represents less than $.01 per share.
See accompanying notes which are an integral part of the financial statements.
VIP Energy Portfolio (the Fund) is a non-diversified fund of Variable Insurance Products Fund IV (the trust) and is authorized to issue an unlimited number of shares. The trust is registered under the Investment Company Act of 1940, as amended (the 1940 Act), as an open-end management investment company organized as a Massachusetts business trust. Shares of the Fund may only be purchased by insurance companies for the purpose of funding variable annuity or variable life insurance contracts. The Fund offers the following classes of shares: Initial Class shares, Service Class 2 shares, and Investor Class shares. All classes have equal rights and voting privileges, except for matters affecting a single class. Investment income, realized and unrealized capital gains and losses, the common expenses of the Fund, and certain fund-level expense reductions, if any, are allocated on a pro rata basis to each class based on the relative net assets of each class to the total net assets of the Fund. Each class differs with respect to transfer agent and distribution and service plan fees incurred. Certain expense reductions also differ by class.
2. Investments in Fidelity Central Funds.
The Fund may invest in Fidelity Central Funds, which are open-end investment companies available only to other investment companies and accounts managed by Fidelity Management & Research Company (FMR) and its affiliates. The Fund's Schedule of Investments lists each of the Fidelity Central Funds held as of period end, if any, as an investment of the Fund, but does not include the underlying holdings of each Fidelity Central Fund. As an Investing Fund, the Fund indirectly bears its proportionate share of the expenses of the underlying Fidelity Central Funds.
The Money Market Central Funds seek preservation of capital and current income and are managed by Fidelity Investments Money Management, Inc. (FIMM), an affiliate of FMR.
A complete unaudited list of holdings for each Fidelity Central Fund is available upon request or at the SEC's web site at www.sec.gov. In addition, the financial statements of the Fidelity Central Funds, which are not covered by the Fund's Report of Independent Registered Public Accounting Firm, are available on the SEC's web site or upon request.
3. Significant Accounting Policies.
The financial statements have been prepared in conformity with accounting principles generally accepted in the United States of America, which require management to make certain estimates and assumptions at the date of the financial statements. Actual results could differ from those estimates. The following summarizes the significant accounting policies of the Fund:
Security Valuation. Investments are valued as of 4:00 p.m. Eastern time on the last calendar day of the period. Wherever possible, the Fund uses independent pricing services approved by the Board of Trustees to value its investments.
Equity securities, including restricted securities, for which market quotations are readily available, are valued at the last reported sale price or official closing price as reported by an independent pricing service on the primary market or exchange on which they are traded. In the event there were no sales during the day or closing prices are not available, securities are valued at the last quoted bid price. Investments in open-end mutual funds, including the Fidelity Central Funds, are valued at their closing net asset value each business day. Short-term securities with remaining maturities of sixty days or less for which quotations are not readily available are valued at amortized cost, which approximates value.
When current market prices or quotations are not readily available or reliable, valuations may be determined in good faith in accordance with procedures adopted by the Board of Trustees. Factors used in determining value may include significant market or security specific events, changes in interest rates and credit quality, and developments in foreign markets which are monitored by evaluating the performance of ADRs, futures contracts and exchange-traded funds. The frequency with which these procedures are used cannot be predicted and may be utilized to a significant extent. The value of securities used for net asset value (NAV) calculation under these procedures may differ from published prices for the same securities.
The Fund is subject to the provisions of Statement of Financial Accounting Standards No. 157, "Fair Value Measurements" (SFAS 157), effective with the beginning of the Fund's fiscal year. SFAS 157 establishes a hierarchy that prioritizes the inputs to valuation techniques giving the highest priority to readily available unadjusted quoted prices in active markets for identical assets (level 1 measurements) and the lowest priority to unobservable inputs (level 3 measurements) when market prices are not readily available or reliable. The three levels of the hierarchy under SFAS 157 are described below:
Level 1
Quoted prices in active markets for identical securities.
Level 2
Prices determined using other significant observable inputs. Observable inputs are inputs that other market participants may use in pricing a security. These may include quoted prices for similar securities, interest rates, prepayment speeds, credit risk and others.
Level 3
Prices determined using significant unobservable inputs. In situations where quoted prices or observable inputs are unavailable or deemed less relevant (for example, when there is little or no market activity for an investment at the end of the period), unobservable inputs may be used. Unobservable inputs reflect the Fund's own assumptions about the factors market participants would use in pricing an investment, and would be based on the best information available.
Changes in valuation techniques may result in transfers in or out of an investment's assigned level within the hierarchy.
The aggregate value by input level, as of December 31, 2008, for the Fund's investments is included at the end of the Fund's Schedule of Investments.
Annual Report
3. Significant Accounting Policies - continued
Foreign Currency. The Fund uses foreign currency contracts to facilitate transactions in foreign-denominated securities. Losses from these transactions may arise from changes in the value of the foreign currency or if the counterparties do not perform under the contracts' terms.
Foreign-denominated assets, including investment securities, and liabilities are translated into U.S. dollars at the exchange rate at period end. Purchases and sales of investment securities, income and dividends received and expenses denominated in foreign currencies are translated into U.S. dollars at the exchange rate in effect on the transaction date.
The effects of exchange rate fluctuations on investments are included with the net realized and unrealized gain (loss) on investment securities. Other foreign currency transactions resulting in realized and unrealized gain (loss) are disclosed separately.
Investment Transactions and Income. For financial reporting purposes, the Fund's investment holdings and NAV include trades executed through the end of the last business day of the period. The NAV per share for processing shareholder transactions is calculated as of the close of business of the New York Stock Exchange (NYSE), normally 4:00 p.m. Eastern time and includes trades executed through the end of the prior business day. Gains and losses on securities sold are determined on the basis of identified cost and may include proceeds received from litigation. Dividend income is recorded on the ex-dividend date, except for certain dividends from foreign securities where the ex-dividend date may have passed, which are recorded as soon as the Fund is informed of the ex-dividend date. Non-cash dividends included in dividend income, if any, are recorded at the fair market value of the securities received. Distributions received on securities that represent a return of capital or capital gain are recorded as a reduction of cost of investments and/or as a realized gain. The Fund estimates the components of distributions received that may be considered return of capital distributions or capital gain distributions. Interest income and distributions from the Fidelity Central Funds are accrued as earned. Interest income includes coupon interest and amortization of premium and accretion of discount on debt securities. Investment income is recorded net of foreign taxes withheld where recovery of such taxes is uncertain.
Expenses. Most expenses of the trust can be directly attributed to a fund. Expenses which cannot be directly attributed are apportioned among each Fund in the trust. Expense estimates are accrued in the period to which they relate and adjustments are made when actual amounts are known.
Income Tax Information and Distributions to Shareholders. Each year, the Fund intends to qualify as a regulated investment company by distributing substantially all of its taxable income and realized gains under Subchapter M of the Internal Revenue Code and filing its U.S. federal tax return. As a result, no provision for income taxes is required. The Fund is subject to the provisions of FASB Interpretation No. 48, Accounting for Uncertainties in Income Taxes (FIN 48). FIN 48 sets forth a minimum threshold for financial statement recognition of the benefit of a tax position taken or expected to be taken in a tax return. There are no unrecognized tax benefits in the accompanying financial statements. A Fund's federal tax return is subject to examination by the Internal Revenue Service (IRS) for a period of three years. Foreign taxes are provided for based on the Fund's understanding of the tax rules and rates that exist in the foreign markets in which it invests.
Distributions are recorded on the ex-dividend date. Income dividends and capital gain distributions are declared separately for each class. Income and capital gain distributions are determined in accordance with income tax regulations, which may differ from generally accepted accounting principles.
Capital accounts within the financial statements are adjusted for permanent book-tax differences. These adjustments have no impact on net assets or the results of operations. Temporary book-tax differences will reverse in a subsequent period.
Book-tax differences are primarily due to foreign currency transactions, partnerships and losses deferred due to wash sales and excise tax regulations.
The tax-basis components of distributable earnings and the federal tax cost as of period end were as follows:
Unrealized appreciation
$ 19,608,440
Unrealized depreciation
(157,384,522)
Net unrealized appreciation (depreciation)
$ (137,776,082)
Cost for federal income tax purposes
$ 401,287,981
The tax character of distributions paid was as follows:
December 31, 2008
December 31, 2007
Ordinary Income
$ 2,562,622
$ 5,047,984
Long-term Capital Gains
16,419,842
23,234,028
Total
$ 18,982,464
$ 28,282,012
Trading (Redemption) Fees. Shares held less than 60 days are subject to a redemption fee equal to 1% of the proceeds of the redeemed shares. All redemption fees, including any estimated redemption fees paid by FMR, are retained by the Fund and accounted for as an addition to paid in capital.
Annual Report
Notes to Financial Statements - continued
4. Operating Policies.
Repurchase Agreements. FMR has received an Exemptive Order from the Securities and Exchange Commission (the SEC) which permits the Fund and other affiliated entities of FMR to transfer uninvested cash balances into joint trading accounts which are then invested in repurchase agreements. The Fund may also invest directly with institutions in repurchase agreements. Repurchase agreements are collateralized by government or non-government securities. Upon settlement date, collateral is held in segregated accounts with custodian banks and may be obtained in the event of a default of the counterparty. The Fund monitors, on a daily basis, the value of the collateral to ensure it is at least equal to the principal amount of the repurchase agreement (including accrued interest). In the event of a default by the counterparty, realization of the collateral proceeds could be delayed, during which time the value of the collateral may decline.
5. Purchases and Sales of Investments.
Purchases and sales of securities, other than short-term securities, aggregated $755,723,422 and $805,262,870, respectively.
6. Fees and Other Transactions with Affiliates.
Management Fee. FMR and its affiliates provide the Fund with investment management related services for which the Fund pays a monthly management fee. The management fee is the sum of an individual fund fee rate that is based on an annual rate of .30% of the Fund's average net assets and a group fee rate that averaged .26% during the period. The group fee rate is based upon the average net assets of all the mutual funds advised by FMR. The group fee rate decreases as assets under management increase and increases as assets under management decrease. For the period, the total annual management fee rate was .56% of the Fund's average net assets.
Distribution and Service Plan. In accordance with Rule 12b-1 of the 1940 Act, the Fund has adopted a separate 12b-1 Plan for Service Class 2 shares. Service Class 2 pays Fidelity Distributors Corporation (FDC), an affiliate of FMR, a service fee. For the period, the service fee is based on an annual rate of .25% of Service Class 2's average net assets.
For the period, Service Class 2 paid FDC $458,846, all of which was re-allowed to insurance companies for the distribution of shares and providing shareholder support services.
Transfer Agent Fees. Fidelity Investments Institutional Operations Company, Inc. (FIIOC), an affiliate of FMR, is the Fund's transfer, dividend disbursing, and shareholder servicing agent. FIIOC receives an asset-based fee with respect to each class. Each class (with the exception of Investor Class) pays a transfer agent fee, excluding out of pocket expenses, equal to an annual rate of .07% of average net assets. Investor Class pays a monthly asset-based transfer agent fee of .15% of average net assets. Prior to February 1, 2008, Investor class paid a monthly asset-based transfer agent fee of .18% of average net assets. The total transfer agent fees paid by each class to FIIOC, including out of pocket expenses, were as follows:
Initial Class
$ 192,524
Service Class 2
124,874
Investor Class
188,661
$ 506,059
Accounting and Security Lending Fees. Fidelity Service Company, Inc. (FSC), an affiliate of FMR, maintains the Fund's accounting records. The accounting fee is based on the level of average net assets for the month. Under a separate contract, FSC administers the security lending program. The security lending fee is based on the number and duration of lending transactions.
Brokerage Commissions. The Fund placed a portion of its portfolio transactions with brokerage firms which are affiliates of the investment adviser. The commissions paid to these affiliated firms were $4,601 for the period.
Interfund Lending Program. Pursuant to an Exemptive Order issued by the SEC, the Fund, along with other registered investment companies having management contracts with FMR, may participate in an interfund lending program. This program provides an alternative credit facility allowing the funds to borrow from, or lend money to, other participating affiliated funds. At period end, there were no interfund loans outstanding. The Fund's activity in this program during the period for which loans were outstanding was as follows:
Borrower or Lender
Average Daily Loan Balance
Weighted Average Interest Rate
Interest Expense
Borrower
$ 4,912,638
2.56%
$ 16,434
Annual Report
7. Committed Line of Credit.
The Fund participates with other funds managed by FMR in a $4.2 billion credit facility (the "line of credit") to be utilized for temporary or emergency purposes to fund shareholder redemptions or for other short-term liquidity purposes. The Fund has agreed to pay commitment fees on its pro rata portion of the line of credit, which amounted to $1,306 and is reflected in Miscellaneous Expense on the Statement of Operations. During the period, there were no borrowings on this line of credit.
8. Security Lending.
The Fund lends portfolio securities from time to time in order to earn additional income. On the settlement date of the loan, the Fund receives collateral (in the form of U.S. Treasury obligations, letters of credit and/or cash) against the loaned securities and maintains collateral in an amount not less than 100% of the market value of the loaned securities during the period of the loan. The market value of the loaned securities is determined at the close of business of the Fund and any additional required collateral is delivered to the Fund on the next business day. If the borrower defaults on its obligation to return the securities loaned because of insolvency or other reasons, a fund could experience delays and costs in recovering the securities loaned or in gaining access to the collateral. Any cash collateral received is invested in the Fidelity Securities Lending Cash Central Fund. The value of loaned securities and cash collateral at period end are disclosed on the Fund's Statement of Assets and Liabilities. Security lending income represents the income earned on investing cash collateral, less fees and expenses associated with the loan, plus any premium payments that may be received on the loan of certain types of securities. Security lending income is presented in the Statement of Operations as a component of income from Fidelity Central Funds. Net income from lending portfolio securities during the period amounted to $101,982.
9. Bank Borrowings.
The Fund is permitted to have bank borrowings for temporary or emergency purposes to fund shareholder redemptions. The Fund has established borrowing arrangements with certain banks. The interest rate on the borrowings is the bank's base rate, as revised from time to time. The average daily loan balance during the period for which loans were outstanding amounted to $1,260,750. The weighted average interest rate was 2.60%. The interest expense amounted to $365 under the bank borrowing program. At period end, there were no bank borrowings outstanding.
10. Expense Reductions.
Many of the brokers with whom FMR places trades on behalf of the Fund provided services to the Fund in addition to trade execution. These services included payments of certain expenses on behalf of the Fund totaling $22,664 for the period.
11. Other.
The Fund's organizational documents provide former and current trustees and officers with a limited indemnification against liabilities arising in connection with the performance of their duties to the Fund. In the normal course of business, the Fund may also enter into contracts that provide general indemnifications. The Fund's maximum exposure under these arrangements is unknown as this would be dependent on future claims that may be made against the Fund. The risk of material loss from such claims is considered remote.
At the end of the period, FMR or its affiliates were the owners of record of 66% of the total outstanding shares of the Fund and one otherwise unaffiliated shareholder was the owner of record of 34% of the total outstanding shares of the Fund.
During the period, Lehman Brothers Holdings, Inc. and certain of its affiliates (LBHI) sought protection under the insolvency laws of their jurisdictions of organization, including the United States, the United Kingdom and Japan. At the time LBHI's insolvency proceedings were instituted, the Fund had outstanding securities trades with counterparties affiliated with LBHI. As a result of the insolvency proceedings, LBHI is unable to fulfill its commitments and, in certain cases, the Fund may have terminated its trades and related agreements with the relevant entities and, where appropriate, is in the process of initiating claims for damages. FMR believes that the financial impact to the Fund relating to the terminated trades and agreements is immaterial.
In December 2006, the Independent Trustees, with the assistance of independent counsel, completed an investigation regarding gifts, gratuities and business entertainment provided by certain brokers to certain individuals who were employed on FMR's domestic equity trading desk during the period 2002 to 2004. The Independent Trustees and FMR agreed that, despite the absence of proof that the Fidelity mutual funds experienced diminished execution quality as a result of the improper receipt of gifts and business entertainment, the conduct at issue was serious and was worthy of redress. Accordingly, the Independent Trustees requested, and FMR agreed to make, a payment of $42 million plus accrued interest, which equaled approximately $7.3 million, to certain Fidelity mutual funds.
In March 2008, the Trustees approved a method for allocating this payment among the funds and, in total, FMR paid the fund $7,719 which is recorded in the accompanying Statement of Operations.
Annual Report
Notes to Financial Statements - continued
11. Other - continued
In a related administrative order dated March 5, 2008, the U.S. Securities and Exchange Commission ("SEC") announced a settlement with FMR and FMR Co., Inc. (an affiliate of FMR) involving the SEC's regulatory rules for investment advisers and the improper receipt of gifts, gratuities and business entertainment. Without admitting or denying the SEC's findings, FMR agreed to pay an $8 million civil penalty to the United States Treasury.
12. Distributions to Shareholders.
Distributions to shareholders of each class were as follows:
Years ended December 31,
2008
2007
From net investment income
Initial Class
$ 256,873
$ 816,831
Service Class 2
-
167,443
Investor Class
18,402
216,249
Total
$ 275,275
$ 1,200,523
From net realized gain
Initial Class
$ 8,939,423
$ 14,471,944
Service Class 2
6,049,173
7,591,179
Investor Class
3,718,593
5,018,366
Total
$ 18,707,189
$ 27,081,489
13. Share Transactions.
Transactions for each class of shares were as follows:
Shares
Dollars
Years ended December 31,
2008
2007
2008
2007
Initial Class
Shares sold
1,984,359
1,857,099
$ 49,227,554
$ 44,454,803
Reinvestment of distributions
627,226
597,904
9,196,296
15,288,775
Shares redeemed
(5,719,043)
(3,787,008)
(116,160,558)
(77,567,833)
Net increase (decrease)
(3,107,458)
(1,332,005)
$ (57,736,708)
$ (17,824,255)
Service Class 2
Shares sold
3,461,499
4,400,682
$ 81,684,684
$ 102,772,658
Reinvestment of distributions
428,438
300,833
6,049,173
7,758,622
Shares redeemed
(3,320,478)
(1,072,210)
(66,620,993)
(23,413,472)
Net increase (decrease)
569,459
3,629,305
$ 21,112,864
$ 87,117,808
Investor Class
Shares sold
2,051,429
2,764,988
$ 52,822,887
$ 64,717,111
Reinvestment of distributions
264,475
202,756
3,736,995
5,234,615
Shares redeemed
(2,438,344)
(720,765)
(49,442,398)
(14,900,703)
Net increase (decrease)
(122,440)
2,246,979
$ 7,117,484
$ 55,051,023
Annual Report
Reportof Independent Registered Public Accounting Firm
To the Trustees of Variable Insurance Products Fund IV and the Shareholders of VIP Energy Portfolio:
In our opinion, the accompanying statement of assets and liabilities, including the schedule of investments, and the related statements of operations and of changes in net assets and the financial highlights present fairly, in all material respects, the financial position of VIP Energy Portfolio (a fund of Variable Insurance Products Fund IV) at December 31, 2008, the results of its operations for the year then ended, the changes in its net assets for each of the two years in the period then ended and the financial highlights for each of the periods indicated, in conformity with accounting principles generally accepted in the United States of America. These financial statements and financial highlights (hereafter referred to as "financial statements") are the responsibility of the VIP Energy Portfolio's management. Our responsibility is to express an opinion on these financial statements based on our audits. We conducted our audits of these financial statements in accordance with the standards of the Public Company Accounting Oversight Board (United States). Those standards require that we plan and perform the audit to obtain reasonable assurance about whether the financial statements are free of material misstatement. An audit includes examining, on a test basis, evidence supporting the amounts and disclosures in the financial statements, assessing the accounting principles used and significant estimates made by management, and evaluating the overall financial statement presentation. We believe that our audits, which included confirmation of securities at December 31, 2008 by correspondence with the custodian and brokers, provide a reasonable basis for our opinion.
The Trustees, Member of the Advisory Board, and executive officers of the trust and fund, as applicable, are listed below. The Board of Trustees governs the fund and is responsible for protecting the interests of shareholders. The Trustees are experienced executives who meet periodically throughout the year to oversee the fund's activities, review contractual arrangements with companies that provide services to the fund, and review the fund's performance. Except for Edward C. Johnson 3d and James C. Curvey, each of the Trustees oversees 222 funds advised by FMR or an affiliate. Messrs. Johnson and Curvey oversee 380 funds advised by FMR or an affiliate.
The Trustees hold office without limit in time except that (a) any Trustee may resign; (b) any Trustee may be removed by written instrument, signed by at least two-thirds of the number of Trustees prior to such removal; (c) any Trustee who requests to be retired or who has become incapacitated by illness or injury may be retired by written instrument signed by a majority of the other Trustees; and (d) any Trustee may be removed at any special meeting of shareholders by a two-thirds vote of the outstanding voting securities of the trust. Each Trustee who is not an interested person (as defined in the 1940 Act) (Independent Trustee), shall retire not later than the last day of the calendar year in which his or her 72nd birthday occurs. The Independent Trustees may waive this mandatory retirement age policy with respect to individual Trustees. The executive officers and Advisory Board Member hold office without limit in time, except that any officer and Advisory Board Member may resign or may be removed by a vote of a majority of the Trustees at any regular meeting or any special meeting of the Trustees. Except as indicated, each individual has held the office shown or other offices in the same company for the past five years.
The fund's Statement of Additional Information (SAI) includes more information about the Trustees. To request a free copy, call Fidelity at 1-877-208-0098.
Interested Trustees*:
Correspondence intended for each Trustee who is an interested person may be sent to Fidelity Investments, 82 Devonshire Street, Boston, Massachusetts 02109.
Name, Age; Principal Occupation
Edward C. Johnson 3d (78)
Year of Election or Appointment: 1983
Mr. Johnson is Chairman of the Board of Trustees. Mr. Johnson serves as Chief Executive Officer, Chairman, and a Director of FMR LLC; Chairman and a Director of FMR; Chairman and a Director of Fidelity Research & Analysis Company (FRAC); Chairman and a Director of Fidelity Investments Money Management, Inc.; and Chairman and a Director of FMR Co., Inc. In addition, Mr. Johnson serves as Chairman and Director of FIL Limited. Previously, Mr. Johnson served as President of FMR LLC (2006-2007).
James C. Curvey (73)
Year of Election or Appointment: 2007
Mr. Curvey also serves as Trustee (2007-present) of other investment companies advised by FMR. Mr. Curvey is a Director of FMR and FMR Co., Inc. (2007-present). Mr. Curvey is also Vice Chairman (2006-present) and Director of FMR LLC. In addition, Mr. Curvey serves as an Overseer for the Boston Symphony Orchestra and a member of the Trustees of Villanova University.
* Trustees have been determined to be "Interested Trustees" by virtue of, among other things, their affiliation with the trust or various entities under common control with FMR. FMR Corp. merged with and into FMR LLC on October 1, 2007. Any references to FMR LLC for prior periods are deemed to be references to the prior entity.
Independent Trustees:
Correspondence intended for each Independent Trustee (that is, the Trustees other than the Interested Trustees) may be sent to Fidelity Investments, P.O. Box 55235, Boston, Massachusetts 02205-5235.
Name, Age; Principal Occupation
Dennis J. Dirks (60)
Year of Election or Appointment: 2005
Prior to his retirement in May 2003, Mr. Dirks was Chief Operating Officer and a member of the Board of The Depository Trust & Clearing Corporation (DTCC) (1999-2003). He also served as President, Chief Operating Officer, and Board member of The Depository Trust Company (DTC) (1999-2003) and President and Board member of the National Securities Clearing Corporation (NSCC) (1999-2003). In addition, Mr. Dirks served as Chief Executive Officer and Board member of the Government Securities Clearing Corporation (2001-2003), Chief Executive Officer and Board member of the Mortgage-Backed Securities Clearing Corporation (2001-2003), as a Trustee and a member of the Finance Committee of Manhattan College (2005-2008), and as a Trustee and a member of the Finance Committee of AHRC of Nassau County (2006-2008). Currently, Mr. Dirks serves as a member of the Board of Directors for The Brookville Center for Children's Services, Inc. (2009-present).
Alan J. Lacy (55)
Year of Election or Appointment: 2008
Mr. Lacy serves as Senior Adviser (2007-present) of Oak Hill Capital Partners, L.P. (a private equity firm). Mr. Lacy also served as Chief Executive Officer (2000-2005) and Vice Chairman (2005-2006) of Sears Holdings Corporation and Sears, Roebuck and Co. (retail). In addition, Mr. Lacy serves as a member of the Board of Directors of The Western Union Company (global money transfer, 2006-present) and Bristol-Myers Squibb (global pharmaceuticals, 2007-present). Mr. Lacy is a Trustee of the National Parks Conservation Association and The Field Museum of Natural History.
Ned C. Lautenbach (64)
Year of Election or Appointment: 2000
Mr. Lautenbach is Chairman of the Independent Trustees (2006-present). Mr. Lautenbach is an Advisory Partner of Clayton, Dubilier & Rice, Inc. (private equity investment firm). Previously, Mr. Lautenbach was with the International Business Machines Corporation (IBM) from 1968 until his retirement in 1998. Mr. Lautenbach serves as a Director of Eaton Corporation (diversified industrial) as well as the Philharmonic Center for the Arts in Naples, Florida. He also is a member of the Board of Trustees of Fairfield University (2005-present), as well as a member of the Council on Foreign Relations. Previously, Mr. Lautenbach served as a Director of Sony Corporation (2006-2007).
Joseph Mauriello (64)
Year of Election or Appointment: 2008
Prior to his retirement in January 2006, Mr. Mauriello served in numerous senior management positions including Deputy Chairman and Chief Operating Officer (2004-2005), and Vice Chairman of Financial Services (2002-2004) of KPMG LLP US (professional services firm, 1965-2005). Mr. Mauriello currently serves as a member of the Board of Directors of XL Capital Ltd. (global insurance and re-insurance company, 2006-present) and of Arcadia Resources Inc. (health care services and products, 2007- present). He also served as a Director of the Hamilton Funds of the Bank of New York (2006-2007).
Cornelia M. Small (64)
Year of Election or Appointment: 2005
Ms. Small is a member of the Investment Committee, and Chair (2008-present) and a member of the Board of Trustees of Smith College. Ms. Small also serves on the Investment Committee of the Berkshire Taconic Community Foundation (2008-present). Previously, Ms. Small served as Chairperson of the Investment Committee (2002-2008) of Smith College and as Co-Chair (2000- 2003) of the Annual Fund for the Fletcher School of Law and Diplomacy. In addition, she served as Chief Investment Officer, Director of Global Equity Investments, and a member of the Board of Directors of Scudder, Stevens & Clark and Scudder Kemper Investments.
William S. Stavropoulos (69)
Year of Election or Appointment: 2002
Mr. Stavropoulos is Chairman Emeritus of the Board of Directors of The Dow Chemical Company, where he previously served in numerous senior management positions, including President (1993-2000; 2002-2003), CEO (1995-2000; 2002-2004), Chairman of the Executive Committee (2000-2006), and as a member of the Board of Directors (1990-2006). Currently, he is a Director of Teradata Corporation (data warehousing and technology solutions, 2008-present), Chemical Financial Corporation, Maersk Inc. (industrial conglomerate), Tyco International, Inc. (multinational manufacturing and services, 2007-present), and a member of the Advisory Board for Metalmark Capital (private equity investment firm, 2005-present). He is a special advisor to Clayton, Dubilier & Rice, Inc. (private equity investment). In addition, Mr. Stavropoulos is a member of the University of Notre Dame Advisory Council for the College of Science.
David M. Thomas (59)
Year of Election or Appointment: 2008
Previously, Mr. Thomas served as Executive Chairman (2005-2006) and Chairman and Chief Executive Officer (2000-2005) of IMS Health, Inc. (pharmaceutical and healthcare information solutions). In addition, Mr. Thomas serves as a member of the Board of Directors of Fortune Brands, Inc. (consumer products holding company), and Interpublic Group of Companies, Inc. (marketing communication, 2004-present).
Michael E. Wiley (58)
Year of Election or Appointment: 2008
Mr. Wiley also serves as a member of the Board of Trustees of the University of Tulsa (2000-2006; 2007-present). He serves as a Director of Tesoro Corporation (independent oil refiner and marketer, 2005-present), and a Director of Bill Barrett Corporation (exploration and production company, 2005-present). In addition, he also serves as a Director of Post Oak Bank (privately-held bank, 2004-present). Previously, Mr. Wiley served as a Sr. Energy Advisor of Katzenbach Partners, LLC (consulting firm, 2006- 2007), as an Advisory Director of Riverstone Holdings (private investment firm), Chairman, President, and CEO of Baker Hughes, Inc. (oilfield services company, 2000-2004), and as Director of Spinnaker Exploration Company (exploration and production company, 2001-2005).
Annual Report
Advisory Board Member and Executive Officers**:
Correspondence intended for each executive officer and Mr. Lynch may be sent to Fidelity Investments, 82 Devonshire Street, Boston, Massachusetts 02109.
Name, Age; Principal Occupation
Peter S. Lynch (64)
Year of Election or Appointment: 2003
Member of the Advisory Board of Fidelity's Equity and High Income Funds. Mr. Lynch is Vice Chairman and a Director of FMR, and Vice Chairman (2001-present) and a Director of FMR Co., Inc. Previously, Mr. Lynch served as a Trustee of the Fidelity funds (1990-2003). In addition, he serves as a Trustee of Boston College and as the Chairman of the Inner-City Scholarship Fund. Previously, Mr. Lynch served on the Special Olympics International Board of Directors (1997-2006).
Kenneth B. Robins (39)
Year of Election or Appointment: 2008
President and Treasurer of Fidelity's Equity and High Income Funds. Mr. Robins is an employee of Fidelity Investments (2004- present). Before joining Fidelity Investments, Mr. Robins worked at KPMG LLP, where he was a partner in KPMG's department of professional practice (2002-2004).
Scott C. Goebel (40)
Year of Election or Appointment: 2008
Secretary and Chief Legal Officer (CLO) of the Fidelity funds. Mr. Goebel also serves as General Counsel, Secretary, and Senior Vice President of FMR (2008-present); Deputy General Counsel of FMR LLC; Chief Legal Secretary of Fidelity Management & Research (Hong Kong) Limited (2008-present) and Assistant Secretary of Fidelity Management & Research (Japan) Inc. (2008- present). Previously, Mr. Goebel served as Assistant Secretary of the Funds (2007-2008) and as Vice President and Secretary of Fidelity Distributors Corporation (FDC) (2005-2007).
Brian B. Hogan (44)
Year of Election or Appointment: 2007
Vice President of Sector Funds. Mr. Hogan also serves as Senior Vice President, Equity Research of FMR. Previously, Mr. Hogan served as a portfolio manager.
John B. McGinty, Jr. (46)
Year of Election or Appointment: 2008
Assistant Secretary of Fidelity's Equity and High Income Funds. Mr. McGinty is an employee of Fidelity Investments (2004-present). Mr. McGinty also serves as Senior Vice President, Secretary, and Chief Legal Officer of FDC (2007-present). Before joining Fidelity Investments, Mr. McGinty practiced law at Ropes & Gray, LLP.
Holly C. Laurent (54)
Year of Election or Appointment: 2008
Anti-Money Laundering (AML) Officer of the Fidelity funds. Ms. Laurent is an employee of Fidelity Investments. Previously, Ms. Laurent was Senior Vice President and Head of Legal for Fidelity Business Services India Pvt. Ltd. (2006-2008), Senior Vice President, Deputy General Counsel and Group Head for FMR LLC (2005-2006).
Christine Reynolds (50)
Year of Election or Appointment: 2008
Chief Financial Officer of the Fidelity funds. Ms. Reynolds became President of Fidelity Pricing and Cash Management Services (FPCMS) in August 2008. She served as Chief Operating Officer of FPCMS from 2007 through July 2008. Previously, Ms. Reynolds served as President, Treasurer, and Anti-Money Laundering officer of the Fidelity funds (2004-2007). Before joining Fidelity Investments, Ms. Reynolds worked at PricewaterhouseCoopers LLP (PwC) (1980-2002), where she was an audit partner with PwC's investment management practice.
Kenneth A. Rathgeber (61)
Year of Election or Appointment: 2004
Chief Compliance Officer of Fidelity's Equity and High Income Funds. Mr. Rathgeber is Chief Compliance Officer of Fidelity Management & Research (Hong Kong) Limited (2008-present), Fidelity Management & Research (Japan) Inc. (2008-present), FMR (2005-present), FMR Co., Inc. (2005-present), Fidelity Management & Research (U.K.) Inc. (2005-present), Fidelity Research & Analysis Company (2005-present), Fidelity Investments Money Management, Inc. (2005-present), and Strategic Advisers, Inc. (2005-present).
Bryan A. Mehrmann (47)
Year of Election or Appointment: 2005
Deputy Treasurer of the Fidelity funds. Mr. Mehrmann is an employee of Fidelity Investments. Previously, Mr. Mehrmann served as Vice President of Fidelity Investments Institutional Services Group (FIIS)/Fidelity Investments Institutional Operations Company, Inc. (FIIOC) Client Services (1998-2004).
Adrien E. Deberghes (41)
Year of Election or Appointment: 2008
Deputy Treasurer of Fidelity's Equity and High Income Funds. Mr. Deberghes is an employee of Fidelity Investments (2008-present). Previously, Mr. Deberghes served as Senior Vice President of Mutual Fund Administration at State Street Corporation (2007-2008), Senior Director of Mutual Fund Administration at Investors Bank & Trust (2005-2007), and Director of Finance for Dunkin' Brands (2000-2005).
Robert G. Byrnes (42)
Year of Election or Appointment: 2005
Assistant Treasurer of the Fidelity funds. Mr. Byrnes is an employee of Fidelity Investments (2005-present). Previously, Mr. Byrnes served as Vice President of Fidelity Pricing and Cash Management Services (FPCMS) (2003-2005). Before joining Fidelity Investments, Mr. Byrnes worked at Deutsche Asset Management where he served as Vice President of the Investment Operations Group (2000-2003).
Paul M. Murphy (61)
Year of Election or Appointment: 2007
Assistant Treasurer of the Fidelity funds. Mr. Murphy is an employee of Fidelity Investments (2007-present). Previously, Mr. Murphy served as Chief Financial Officer of the Fidelity Funds (2005-2006), Vice President and Associate General Counsel of FMR (2007), and Senior Vice President of Fidelity Pricing and Cash Management Services (FPCMS) (1994-2007).
Gary W. Ryan (50)
Year of Election or Appointment: 2005
Assistant Treasurer of the Fidelity funds. Mr. Ryan is an employee of Fidelity Investments. Previously, Mr. Ryan served as Vice President of Fund Reporting in Fidelity Pricing and Cash Management Services (FPCMS) (1999-2005).
** FMR Corp. merged with and into FMR LLC on October 1, 2007. Any references to FMR LLC for prior periods are deemed to be references to the prior entity.
The fund hereby designates as a capital gain dividend with respect to the taxable year ended December 31, 2008, $10,553,349, or, if subsequently determined to be different, the net capital gain of such year.
A percentage of the dividends distributed during the fiscal year for the following classes qualifies for the dividends-received deduction for corporate shareholders:
February
December
Initial Class
6%
100%
Investor Class
6%
100%
The fund will notify shareholders in January 2009 of amounts for use in preparing 2008 income tax returns.
A special meeting of the fund's shareholders was held on May 14, 2008. The results of votes taken among shareholders on the proposals before them are reported below. Each vote reported represents one dollar of net asset value held on the record date for the meeting.
PROPOSAL 1
To elect a Board of Trustees.A
# of Votes
% of Votes
James C. Curvey
Affirmative
82,890,712.47
95.991
Withheld
3,461,988.43
4.009
TOTAL
86,352,700.90
100.000
Dennis J. Dirks
Affirmative
82,970,372.75
96.083
Withheld
3,382,328.15
3.917
TOTAL
86,352,700.90
100.000
Edward C. Johnson 3d
Affirmative
82,689,162.78
95.757
Withheld
3,663,538.12
4.243
TOTAL
86,352,700.90
100.000
Alan J. Lacy
Affirmative
83,041,222.35
96.165
Withheld
3,311,478.55
3.835
TOTAL
86,352,700.90
100.000
Ned C. Lautenbach
Affirmative
82,983,853.72
96.099
Withheld
3,368,847.18
3.901
TOTAL
86,352,700.90
100.000
Joseph Mauriello
Affirmative
83,138,122.14
96.277
Withheld
3,214,578.76
3.723
TOTAL
86,352,700.90
100.000
Cornelia M. Small
Affirmative
83,095,438.06
96.228
Withheld
3,257,262.84
3.772
TOTAL
86,352,700.90
100.000
William S. Stavropoulos
Affirmative
82,929,113.95
96.035
Withheld
3,423,586.95
3.965
TOTAL
86,352,700.90
100.000
David M. Thomas
Affirmative
83,095,487.87
96.228
Withheld
3,257,213.03
3.772
TOTAL
86,352,700.90
100.000
Michael E. Wiley
Affirmative
83,048,523.75
96.174
Withheld
3,304,177.15
3.826
TOTAL
86,352,700.90
100.000
PROPOSAL 2
To amend the Declaration of Trust to reduce the required quorum for future shareholder meetings.A
# of Votes
% of Votes
Affirmative
74,393,635.26
86.151
Against
8,745,543.59
10.128
Abstain
3,213,522.05
3.721
TOTAL
86,352,700.90
100.000
ADenotes trust-wide proposal and voting results.
Annual Report
BoardApproval of Investment Advisory Contracts and Management Fees
VIP Energy Portfolio
Each year, typically in July, the Board of Trustees, including the Independent Trustees (together, the Board), votes on the renewal of the management contract and sub-advisory agreements (together, the Advisory Contracts) for the fund. The Board, assisted by the advice of fund counsel and Independent Trustees' counsel, requests and considers a broad range of information throughout the year.
The Board meets regularly and, acting directly and through its separate committees, requests and receives information concerning, and considers at each of its meetings factors that are relevant to, its annual consideration of the renewal of the fund's Advisory Contracts, including the services and support provided to the fund and its shareholders. At the time of the renewal, the Board had 12 standing committees, each composed of Independent Trustees with varying backgrounds, to which the Board has assigned specific subject matter responsibilities in order to enhance effective decision-making by the Board. Each committee has a written charter outlining the structure and purposes of the committee. The Board also meets as needed to consider matters specifically related to the Board's annual consideration of the renewal of Advisory Contracts.
At its July 2008 meeting, the Board of Trustees, including the Independent Trustees, unanimously determined to renew the fund's Advisory Contracts. In reaching its determination, the Board considered all factors it believed relevant, including (i) the nature, extent, and quality of the services to be provided to the fund and its shareholders (including the investment performance of the fund); (ii) the competitiveness of the fund's management fee and total expenses; (iii) the total costs of the services to be provided by and the profits to be realized by Fidelity from its relationship with the fund; (iv) the extent to which economies of scale would be realized as the fund grows; and (v) whether fee levels reflect these economies of scale, if any, for the benefit of fund shareholders. The Board also approved agreements with foreign sub-advisers Fidelity Management & Research (Japan) Inc. and Fidelity Management & Research (Hong Kong) Limited, as well as amendments to the fund's agreement with Fidelity Management & Research (U.K.) Inc.
In considering whether to renew the Advisory Contracts for the fund, the Board ultimately reached a determination, with the assistance of fund counsel and Independent Trustees' counsel and through the exercise of its business judgment, that the renewal of the Advisory Contracts and the compensation to be received by Fidelity under the management contract is consistent with Fidelity's fiduciary duty under applicable law. The Board's decision to renew the Advisory Contracts was not based on any single factor noted above, but rather was based on a comprehensive consideration of all the information provided to the Board at its meetings throughout the year. The Board, in reaching its determination to renew the Advisory Contracts, is aware that shareholders in the fund have a broad range of investment choices available to them, including a wide choice among mutual funds offered by competitors to Fidelity, and that the fund's shareholders, with the opportunity to review and weigh the disclosure provided by the fund in its prospectus and other public disclosures, have chosen to invest in this fund, managed by Fidelity.
Nature, Extent, and Quality of Services Provided. The Board considered staffing within the investment adviser, FMR, and the sub-advisers (together, the Investment Advisers), including the backgrounds of the fund's investment personnel and the fund's investment objective and discipline. The Independent Trustees also had discussions with senior management of Fidelity's investment operations and investment groups. The Board considered the structure of the portfolio manager compensation program and whether this structure provides appropriate incentives.
Resources Dedicated to Investment Management and Support Services. The Board reviewed the size, education, and experience of the Investment Advisers' investment staff, their use of technology, and the Investment Advisers' approach to recruiting, training, and retaining portfolio managers and other research, advisory, and management personnel. The Board noted that Fidelity's analysts have access to a variety of technological tools that enable them to perform both fundamental and quantitative analysis and to specialize in various disciplines. The Board considered Fidelity's extensive global research capabilities that enable the Investment Advisers to aggregate data from various sources in an effort to produce positive investment results. The Board also considered that Fidelity's portfolio managers and analysts have access to daily portfolio attribution that allows for monitoring of a fund's portfolio, as well as an electronic communication system that provides immediate real-time access to research concerning issuers and credit enhancers.
Shareholder and Administrative Services. The Board considered (i) the nature, extent, quality, and cost of advisory, administrative, distribution, and shareholder services performed by the Investment Advisers and their affiliates under the Advisory Contracts and under separate agreements covering transfer agency, pricing and bookkeeping, and securities lending services for the fund; (ii) the nature and extent of the Investment Advisers' supervision of third party service providers, principally custodians and subcustodians; and (iii) the resources devoted to, and the record of compliance with, the fund's compliance policies and procedures. The Board also reviewed the allocation of fund brokerage, including allocations to brokers affiliated with the Investment Advisers, the use of brokerage commissions to pay fund expenses, and the use of "soft" commission dollars to pay for research services. The Board further considered that Fidelity voluntarily pays for market data out of its own resources.
The Board noted that the growth of fund assets across the complex allows Fidelity to reinvest in the development of services designed to enhance the value or convenience of the Fidelity funds as investment vehicles. These services include 24-hour access to account information and market information through phone representatives and over the Internet, and investor education materials and asset allocation tools.
Investment in a Large Fund Family. The Board considered the benefits to shareholders of investing in a Fidelity fund, including the benefits of investing in a fund that is part of a large family of funds offering a variety of investment disciplines and providing for a large variety of mutual fund investor services. The Board noted that Fidelity has taken a number of actions over the previous year that benefited particular funds, including (i) dedicating additional resources to investment research and to restructure the investment research teams; (ii) contractually agreeing to reduce the management fees on Fidelity's Institutional Money Market Funds and launching Class IV and Institutional Class of certain of these funds; (iii) reducing the transfer agent fees for the Fidelity Select Portfolios and Investor Class of the VIP funds; and (iv) launching Class K of 29 equity funds as a lower-fee class available to certain employer-sponsored retirement plans.
Annual Report
Board Approval of Investment Advisory Contracts and Management Fees - continued
Investment Performance. The Board considered whether the fund has operated within its investment objective, as well as its record of compliance with its investment restrictions. It also reviewed the fund's absolute investment performance for each class, as well as the fund's relative investment performance for each class measured against a third-party-sponsored index that reflects the market sector in which the fund invests over multiple periods. The Board noted that FMR does not believe that a meaningful peer group exists against which to compare the fund's performance. The following charts considered by the Board show, over the one-, three-, and five-year periods ended December 31, 2007, as available, the cumulative total returns of Initial Class and Service Class 2 of the fund and the cumulative total returns of a third-party-sponsored index ("benchmark"). The returns of Initial Class and Service Class 2 show the performance of the highest and lowest performing classes, respectively.
VIP Energy Portfolio
The Board stated that the investment performance of Initial Class of the fund compared favorably to its benchmark for all the periods shown. The Board considered that the variations in performance among the fund's classes reflect the variations in class expenses, which result in lower performance for higher expense classes.
The Board considered that FMR has taken steps to refocus and strengthen equity research, equity portfolio management, and compliance.
Based on its review, and giving particular weight to the nature and quality of the resources dedicated by the Investment Advisers to maintain and improve relative performance, the Board concluded that the nature, extent, and quality of the services provided to the fund will benefit the fund's shareholders, particularly in light of the Board's view that the fund's shareholders benefit from investing in a fund that is part of a large family of funds offering a variety of investment disciplines and services.
Competitiveness of Management Fee and Total Fund Expenses. The Board considered the fund's management fee and total expenses compared to "mapped groups" of competitive funds and classes. Fidelity creates "mapped groups" by combining similar Lipper investment objective categories that have comparable management fee characteristics. Combining Lipper investment objective categories aids the Board's management fee and total expense comparisons by broadening the competitive group used for comparison and by reducing the number of universes to which various Fidelity funds are compared. The Board also considered supplemental information about how the fund's management fee and total expenses ranked relative to groups based on Lipper classifications, which take into account a fund's market capitalization and style.
The Board considered two proprietary management fee comparisons for the 12-month periods shown in the chart below. The group of Lipper funds used by the Board for management fee comparisons is referred to below as the "Total Mapped Group." The Total Mapped Group comparison focuses on a fund's standing relative to the total universe of comparable funds available to investors, in terms of gross management fees before expense reimbursements or caps. "TMG %" represents the percentage of funds in the Total Mapped Group that had management fees that were lower than the fund's. For example, a TMG % of 4% means that 96% of the funds in the Total Mapped Group had higher management fees than the fund. The "Asset-Size Peer Group" (ASPG) comparison focuses on a fund's standing relative to non-Fidelity funds similar in size to the fund within the Total Mapped Group. The ASPG represents at least 15% of the funds in the Total Mapped Group with comparable asset size and management fee characteristics, subject to a minimum of 50 funds (or all funds in the Total Mapped Group if fewer than 50). Additional information, such as the ASPG quartile in which the fund's management fee ranked, is also included in the chart and considered by the Board.
Annual Report
VIP Energy Portfolio
The Board noted that the fund's management fee ranked below the median of its Total Mapped Group and below the median of its ASPG for 2007.
Based on its review, the Board concluded that the fund's management fee was fair and reasonable in light of the services that the fund receives and the other factors considered.
In its review of each class's total expenses, the Board considered the fund's management fee as well as other fund or class expenses, as applicable, such as transfer agent fees, pricing and bookkeeping fees, fund-paid 12b-1 fees, and custodial, legal, and audit fees. The Board also noted the effects of any waivers and reimbursements on fees and expenses. As part of its review, the Board also considered current and historical total expenses of each class of the fund compared to competitive fund median expenses. Each class of the fund is compared to those funds and classes in the Total Mapped Group (used by the Board for management fee comparisons) that have a similar sales load structure.
The Board noted that the total expenses of each class ranked below its competitive median for 2007.
In its review of total expenses, the Board also considered Fidelity fee structures and other information on clients that FMR and its affiliates service in other competitive markets, such as other mutual funds advised or subadvised by FMR or its affiliates, pension plan clients, and other institutional clients.
Based on its review, the Board concluded that the total expenses of each class of the fund were reasonable in light of the services that the fund and its shareholders receive and the other factors considered.
Costs of the Services and Profitability. The Board considered the revenues earned and the expenses incurred by Fidelity in conducting the business of developing, marketing, distributing, managing, administering and servicing the fund and its shareholders. The Board also considered the level of Fidelity's profits in respect of all the Fidelity funds.
On an annual basis, FMR presents to the Board Fidelity's profitability for the fund. Fidelity calculates the profitability for each fund, as well as aggregate profitability for groups of Fidelity funds and all Fidelity funds, using a series of detailed revenue and cost allocation methodologies which originate with the audited books and records of Fidelity. The Audit Committee of the Board reviews any significant changes from the prior year's methodologies.
PricewaterhouseCoopers LLP (PwC), independent registered public accounting firm and auditor to Fidelity and certain Fidelity funds, has been engaged annually by the Board as part of the Board's assessment of the results of Fidelity's profitability analysis. PwC's engagement includes the review and assessment of Fidelity's methodologies used in determining the revenues and expenses attributable to Fidelity's mutual fund business, and completion of agreed-upon procedures surrounding the mathematical accuracy of fund profitability and its conformity to allocation methodologies. After considering PwC's reports issued under the engagement and information provided by Fidelity, the Board believes that while other allocation methods may also be reasonable, Fidelity's profitability methodologies are reasonable in all material respects.
The Board has also reviewed Fidelity's non-fund businesses and any fall-out benefits related to the mutual fund business as well as cases where Fidelity's affiliates may benefit from or be related to the fund's business.
The Board considered the costs of the services provided by and the profits realized by Fidelity in connection with the operation of the fund and determined that the amount of profit is a fair entrepreneurial profit for the management of the fund.
Economies of Scale. The Board considered whether there have been economies of scale in respect of the management of the Fidelity funds, whether the Fidelity funds (including the fund) have appropriately benefited from any such economies of scale, and whether there is potential for realization of any further economies of scale. The Board considered the extent to which the fund will benefit from economies of scale through increased services to the fund, through waivers or reimbursements, or through fee or expense reductions.
Annual Report
Board Approval of Investment Advisory Contracts and Management Fees - continued
The Board recognized that the fund's management contract incorporates a "group fee" structure, which provides for lower group fee rates as total fund assets under FMR's management increase, and for higher group fee rates as total fund assets under FMR's management decrease. FMR determines the group fee rates based on a tiered asset "breakpoint" schedule. The Board considered that the group fee is designed to deliver the benefits of economies of scale to fund shareholders when total fund assets increase, even if assets of any particular fund are unchanged or have declined, because some portion of Fidelity's costs are attributable to services provided to all Fidelity funds, and all funds benefit if those costs can be allocated among more assets. The Board concluded that, given the group fee structure, fund shareholders will achieve a certain level of economies of scale as assets under FMR's management increase at the fund complex level, regardless of whether Fidelity achieves any such economies of scale.
The Board further concluded that any potential economies of scale are being shared between fund shareholders and Fidelity in an appropriate manner.
Additional Information Requested by the Board. In order to develop fully the factual basis for consideration of the Fidelity funds' Advisory Contracts, the Board requested and received additional information on certain topics, including (i) fund performance trends and actions to be taken by FMR to improve certain funds' overall performance; (ii) portfolio manager changes that have occurred during the past year; (iii) Fidelity's fund profitability methodology, the profitability of certain fund service providers, and profitability trends for certain funds; (iv) Fidelity's compensation structure for portfolio managers and key personnel, including its effects on fund profitability and the extent to which portfolio manager compensation is linked to fund performance; (v) Fidelity's fee structures and rationale for recommending different fees among categories of funds; and (vi) Fidelity's rationale for recommending which funds should have a performance adjustment component as part of their management fees.
Based on its evaluation of all of the conclusions noted above, and after considering all material factors, the Board ultimately concluded that the advisory fee structures are fair and reasonable, and that the fund's Advisory Contracts should be renewed.
Annual Report
Investment Adviser
Fidelity Management & Research Company Boston, MA
Investment Sub-Advisers
FMR Co., Inc.
Fidelity Management & Research (U.K.) Inc.
Fidelity Research & Analysis Company
Fidelity Investments Japan Limited
FIL Investment Advisors
FIL Investment Advisors (U.K.) Ltd.
Fidelity Management & Research (Hong Kong) Limited
Fidelity Management & Research (Japan) Inc.
General Distributor
Fidelity Distributors Corporation Boston, MA
Transfer and Service Agents
Fidelity Investments Institutional Operations Company, Inc. Boston, MA
Fidelity Service Company, Inc. Boston, MA
Custodian
State Street Bank & Trust Co. Quincy, MA
VNRIC-ANN-0209
1.817379.103
Fidelity® Variable Insurance Products: Energy Portfolio: Service Class 2
Annual Report
December 31, 2008 (2_fidelity_logos) (Registered_Trademark)
To view a fund's proxy voting guidelines and proxy voting record for the 12-month period ended June 30, visit http://www.fidelity.com (search for "proxy voting guidelines") or visit the Securities and Exchange Commission's (SEC) web site at http://www.sec.gov. You may also call 1-877-208-0098 to request a free copy of the proxy voting guidelines.
Fidelity Variable Insurance Products are separate account options which are purchased through a variable insurance contract.
Standard & Poor's, S&P and S&P 500 are registered service marks of The McGraw-Hill Companies, Inc. and have been licensed for use by Fidelity Distributors Corporation.
Other third party marks appearing herein are the property of their respective owners.
All other marks appearing herein are registered or unregistered trademarks or service marks of FMR LLC or an affiliated company.
This report and the financial statements contained herein are submitted for the general information of the shareholders of the fund. This report is not authorized for distribution to prospective investors in the fund unless preceded or accompanied by an effective prospectus.
A fund files its complete schedule of portfolio holdings with the SEC for the first and third quarters of each fiscal year on Form N-Q. Forms N-Q are available on the SEC's web site at http://www.sec.gov. A fund's Forms N-Q may be reviewed and copied at the SEC's Public Reference Room in Washington, DC. Information regarding the operation of the SEC's Public Reference Room may be obtained by calling 1-800-SEC-0330. For a complete list of the fund's portfolio holdings, view the most recent holdings listing, semiannual report, or annual report on Fidelity's web site at http://www.fidelity.com or http://www.advisor.fidelity.com, as applicable.
NOT FDIC INSURED · MAY LOSE VALUE · NO BANK GUARANTEE
Neither the fund nor Fidelity Distributors Corporation is a bank.
Average annual total return reflects the change in the value of an investment, assuming reinvestment of the class' dividend income and capital gains (the profits earned upon the sale of securities that have grown in value, if any) and assuming a constant rate of performance each year. During periods of reimbursement by Fidelity, a fund's total return will be greater than it would be had the reimbursement not occurred. Performance numbers are net of all underlying fund operating expenses, but do not include any insurance charges imposed by your insurance company's separate account. If performance information included the effect of these additional charges, the total returns would have been lower. How a fund did yesterday is no guarantee of how it will do tomorrow.
Average Annual Total Returns
Periods ended December 31, 2008
Past 1 year
Past 5 years
Life of fundA
VIP Energy - Service Class 2 B, C
-54.40%
6.99%
6.22%
AFrom July 19, 2001.
BThe initial offering of Service Class 2 shares took place on April 6, 2005. Performance for Service Class 2 shares reflects an asset-based service fee (12b-1 fee). Returns prior to April 6, 2005 are those of Initial Class and do not include the effects of Service Class 2's 12b-1 fee. Had Service Class 2's 12b-1 fee been reflected, returns prior to April 6, 2005 would have been lower.
CPrior to October 1, 2006, VIP Energy operated under certain different investment policies. The historical performance for the fund may not represent its current investment policies.
$10,000 Over Life of Fund
Let's say hypothetically that $10,000 was invested in VIP Energy Portfolio - Service Class 2 on July 19, 2001, when the fund started. The chart shows how the value of your investment would have changed, and also shows how the Standard & Poor's 500SM Index (S&P 500®) performed over the same period. The initial offering of Service Class 2 took place on April 6, 2005. See above for additional information regarding the performance of Service Class 2.
Comments from John Dowd, Portfolio Manager of VIP Energy Portfolio
By year-end 2008, the vicious credit crisis sparked in the U.S. had spread like wildfire across the world's capital markets, stunting global growth, toppling commodity prices, changing the face of the global financial system and chasing risk-averse investors toward the sidelines. The U.S. equity markets, as measured by the Dow Jones Industrial AverageSM and Standard & Poor's 500SM Index, fell hard as a result, declining 31.93% and 37.00%, respectively, while the technology-laden NASDAQ Composite® Index slid 40.03%. Foreign market stocks saw an even sharper decline, as illustrated by the 43.28% loss of the MSCI® EAFE® Index (Europe, Australasia, Far East), a gauge of developed stock markets outside the U.S. and Canada. A generally stronger U.S. dollar also held back returns for U.S. investors in foreign equities. Emerging-markets stocks - the global performance leader only a year ago - fell harder still, dropping 53.18%, as measured by the MSCI Emerging Markets Index. The only clear winners during the past year were assets backed by the U.S. government, as investors fled from risk. Thus, the Barclays Capital U.S. Treasury Bond Index climbed 13.74% for the year, while the Barclays Capital U.S. Aggregate Bond Index - a broader measure of the U.S. investment-grade bond universe - gained a more modest 5.24%. By contrast, high-yield bonds bore the brunt of investors' increasing wariness over risk, as expressed by the Merrill Lynch® U.S. High Yield Master II Constrained Index's drop of 26.11%. The emerging-markets bond category also felt the shock of investors' risk-averse sentiment, with the JPMorgan Emerging Markets Bond Index (EMBI) Global falling 10.91%. Meanwhile, the Citigroup® Non-U.S. Group of 7 Index - representing the debt performance of major global economies, excluding the United States - eked out a 1.69% gain.
For the 12 months ending December 31, 2008, the fund substantially underperformed the S&P 500® and the -36.93% return of the MSCI® US Investable Market Energy Index. (For specific portfolio results, please see the performance section of this report.) With investors shedding risk and favoring mainly the "too-big-to-fail" stocks, the portfolio's relatively aggressive positioning in an array of inexpensive stocks from mid- and smaller-sized companies went unrewarded. Much of the fund's underperformance versus the MSCI index was due to underweighting integrated oil companies, which led energy sector performance despite the precipitous drop in oil prices. Specifically, the fund underweighted top-performing Exxon Mobil, as well as Chevron, though Exxon Mobil was the fund's largest holding at period end. A large position in U.S. oil refiner Valero Energy also disappointed; the stock declined when refining margins contracted due to higher oil prices early on and amid decelerating U.S. and European consumption. Rig construction company National Oilwell Varco and rig owner Nabors Industries also detracted, plummeting as a result of reduced global energy demand. Contributors included an underweighting in poorly-performing oil services company Schlumberger, an outsized stake in low-cost natural gas producer Southwestern Energy, and underweighted positions in exploration and production companies Noble Energy and Anadarko Petroleum.
The views expressed above reflect those of the portfolio manager(s) only through the end of the period as stated on the cover of this report and do not necessarily represent the views of Fidelity or any other person in the Fidelity organization. Any such views are subject to change at any time based upon market or other conditions and Fidelity disclaims any responsibility to update such views. These views may not be relied on as investment advice and, because investment decisions for a Fidelity fund are based on numerous factors, may not be relied on as an indication of trading intent on behalf of any Fidelity fund.
As a shareholder of the Fund, you incur two types of costs: (1) transaction costs, including redemption fees, and (2) ongoing costs, including management fees, distribution and/or service (12b-1) fees and other Fund expenses. This Example is intended to help you understand your ongoing costs (in dollars) of investing in the Fund and to compare these costs with the ongoing costs of investing in other mutual funds.
The Example is based on an investment of $1,000 invested at the beginning of the period and held for the entire period (July 1, 2008 to December 31, 2008).
Actual Expenses
The first line of the accompanying table for each class of the Fund provides information about actual account values and actual expenses. You may use the information in this line, together with the amount you invested, to estimate the expenses that you paid over the period. Simply divide your account value by $1,000.00 (for example, an $8,600 account value divided by $1,000.00 = 8.6), then multiply the result by the number in the first line for a class of the Fund under the heading entitled "Expenses Paid During Period" to estimate the expenses you paid on your account during this period. The estimate of expenses does not include any fees or other expenses of any variable annuity or variable life insurance product. If they were, the estimate of expenses you paid during the period would be higher, and your ending account value would be lower. In addition, the Fund, as a shareholder in the underlying Fidelity Central Funds, will indirectly bear its pro rata share of the fees and expenses incurred by the underlying Fidelity Central Funds. These fees and expenses are not included in the Fund's annualized expense ratio used to calculate the expense estimate in the table below.
Hypothetical Example for Comparison Purposes
The second line of the accompanying table for each class of the Fund provides information about hypothetical account values and hypothetical expenses based on a Class' actual expense ratio and an assumed rate of return of 5% per year before expenses, which is not the Class' actual return. The hypothetical account values and expenses may not be used to estimate the actual ending account balance or expenses you paid for the period. You may use this information to compare the ongoing costs of investing in the Fund and other funds. To do so, compare this 5% hypothetical example with the 5% hypothetical examples that appear in the shareholder reports of the other funds. The estimate of expenses does not include any fees or other expenses of any variable annuity or variable life insurance product. If they were, the estimate of expenses you paid during the period would be higher, and your ending account value would be lower. In addition, the Fund, as a shareholder in the underlying Fidelity Central Funds, will indirectly bear its pro rata share of the fees and expenses incurred by the underlying Fidelity Central Funds. These fees and expenses are not included in the Fund's annualized expense ratio used to calculate the expense estimate in the table below.
Please note that the expenses shown in the table are meant to highlight your ongoing costs only and do not reflect any transaction costs. Therefore, the second line of the table is useful in comparing ongoing costs only, and will not help you determine the relative total costs of owning different funds. In addition, if these transactional costs were included, your costs would have been higher.
Annualized Expense Ratio
Beginning Account Value July 1, 2008
Ending Account Value December 31, 2008
Expenses Paid During Period* July 1, 2008 to December 31, 2008
Initial Class
.70%
Actual
$ 1,000.00
$ 394.70
$ 2.45
HypotheticalA
$ 1,000.00
$ 1,021.62
$ 3.56
Service Class 2
.95%
Actual
$ 1,000.00
$ 394.00
$ 3.33
HypotheticalA
$ 1,000.00
$ 1,020.36
$ 4.82
Investor Class
.79%
Actual
$ 1,000.00
$ 394.40
$ 2.77
HypotheticalA
$ 1,000.00
$ 1,021.17
$ 4.01
A 5% return per year before expenses
* Expenses are equal to each Class' annualized expense ratio, multiplied by the average account value over the period, multiplied by 184/366 (to reflect the one-half year period).
Annual Report
Investment Changes (Unaudited)
Top Ten Stocks as of December 31, 2008
% of fund's net assets
% of fund's net assets 6 months ago
Exxon Mobil Corp.
6.0
3.7
Chevron Corp.
5.4
1.2
Occidental Petroleum Corp.
4.2
2.7
Range Resources Corp.
4.1
4.0
Cabot Oil & Gas Corp.
3.8
3.6
Southwestern Energy Co.
3.2
1.9
Hess Corp.
3.1
2.7
Anadarko Petroleum Corp.
2.9
0.0
Noble Corp.
2.8
0.5
ConocoPhillips
2.4
5.6
37.9
Top Industries (% of fund's net assets)
As of December 31, 2008
Oil, Gas & Consumable Fuels
71.8%
Energy Equipment & Services
21.5%
Electrical Equipment
2.3%
Gas Utilities
1.0%
Construction & Engineering
1.0%
All Others*
2.4%
As of June 30, 2008
Oil, Gas & Consumable Fuels
63.1%
Energy Equipment & Services
30.0%
Electrical Equipment
3.7%
Chemicals
0.5%
Construction & Engineering
0.3%
All Others*
2.4%
* Includes short-term investments and net other assets.
Prior period industry classifications reflect the categories in place as of the date indicated and have not been adjusted to reflect current industry classifications.
Annual Report
Investments December 31, 2008
Showing Percentage of Net Assets
Common Stocks - 97.7%
Shares
Value
COMMERCIAL SERVICES & SUPPLIES - 0.0%
Environmental & Facility Services - 0.0%
Fuel Tech, Inc. (a)
10,149
$ 107,478
CONSTRUCTION & ENGINEERING - 1.0%
Construction & Engineering - 1.0%
Jacobs Engineering Group, Inc. (a)
54,700
2,631,070
ELECTRICAL EQUIPMENT - 2.3%
Electrical Components & Equipment - 2.1%
Evergreen Solar, Inc. (a)
141,706
452,042
First Solar, Inc. (a)
9,900
1,365,804
JA Solar Holdings Co. Ltd. ADR (a)(d)
251,400
1,098,618
Q-Cells SE (a)
9,800
358,405
Renewable Energy Corp. AS (a)
38,100
367,345
Sunpower Corp. Class B (a)
52,500
1,598,100
Suntech Power Holdings Co. Ltd. sponsored ADR (a)(d)
23,800
278,460
5,518,774
Heavy Electrical Equipment - 0.2%
Vestas Wind Systems AS (a)
7,383
436,573
TOTAL ELECTRICAL EQUIPMENT
5,955,347
ENERGY EQUIPMENT & SERVICES - 21.5%
Oil & Gas Drilling - 11.0%
Atwood Oceanics, Inc. (a)
191,211
2,921,704
Helmerich & Payne, Inc.
152,351
3,465,985
Hercules Offshore, Inc. (a)
120,080
570,380
Nabors Industries Ltd. (a)
442,694
5,299,047
Noble Corp.
335,621
7,413,868
Patterson-UTI Energy, Inc.
228,114
2,625,592
Pioneer Drilling Co. (a)
41,202
229,495
Pride International, Inc. (a)
142,600
2,278,748
Rowan Companies, Inc.
88,500
1,407,150
Transocean Ltd. (a)
54,747
2,586,796
28,798,765
Oil & Gas Equipment & Services - 10.5%
Baker Hughes, Inc.
21,300
683,091
BJ Services Co.
149,800
1,748,166
Complete Production Services, Inc. (a)
59,960
488,674
Core Laboratories NV
7,400
442,964
Dril-Quip, Inc. (a)
14,500
297,395
Exterran Holdings, Inc. (a)
46,243
984,976
FMC Technologies, Inc. (a)
20
477
Fugro NV (Certificaten Van Aandelen) unit
1,023
29,544
Global Industries Ltd. (a)
216,634
756,053
Halliburton Co.
84,374
1,533,919
Helix Energy Solutions Group, Inc. (a)
44,300
320,732
National Oilwell Varco, Inc. (a)
240,478
5,877,282
Oil States International, Inc. (a)
39,200
732,648
Schlumberger Ltd. (NY Shares)
106,742
4,518,389
Smith International, Inc.
8,268
189,255
Shares
Value
Superior Energy Services, Inc. (a)
125,654
$ 2,001,668
Tenaris SA sponsored ADR
11,500
241,270
Tidewater, Inc.
36,400
1,465,828
TSC Offshore Group Ltd. (a)
746,000
53,941
Weatherford International Ltd. (a)
408,210
4,416,832
Willbros Group, Inc. (a)
108,633
920,122
27,703,226
TOTAL ENERGY EQUIPMENT & SERVICES
56,501,991
GAS UTILITIES - 1.0%
Gas Utilities - 1.0%
Equitable Resources, Inc.
30,100
1,009,855
Questar Corp.
44,600
1,457,974
Zhongyu Gas Holdings Ltd. (a)
3,884,000
207,727
2,675,556
METALS & MINING - 0.1%
Diversified Metals & Mining - 0.1%
Teck Cominco Ltd. Class B (sub. vtg.)
33,100
163,772
OIL, GAS & CONSUMABLE FUELS - 71.8%
Coal & Consumable Fuels - 3.8%
Arch Coal, Inc.
70,150
1,142,744
CONSOL Energy, Inc.
89,621
2,561,368
Foundation Coal Holdings, Inc.
187,714
2,631,750
Peabody Energy Corp.
150,994
3,435,114
PT Bumi Resources Tbk
1,598,000
129,740
9,900,716
Integrated Oil & Gas - 30.5%
BP PLC sponsored ADR
53,000
2,477,220
Chevron Corp.
193,900
14,342,783
ConocoPhillips
123,900
6,418,020
ENI SpA sponsored ADR
82,600
3,949,932
Exxon Mobil Corp.
196,774
15,708,471
Hess Corp.
151,500
8,126,460
Marathon Oil Corp.
229,000
6,265,440
Occidental Petroleum Corp.
184,000
11,038,160
Petro-Canada
109,700
2,409,126
Petroleo Brasileiro SA - Petrobras (PN) sponsored ADR (non-vtg.)
50,100
1,022,541
Royal Dutch Shell PLC Class A sponsored ADR
88,000
4,658,720
Total SA sponsored ADR
72,000
3,981,600
80,398,473
Oil & Gas Exploration & Production - 29.4%
Anadarko Petroleum Corp.
200,600
7,733,130
Apache Corp.
9,200
685,676
Berry Petroleum Co. Class A
1,714
12,958
Cabot Oil & Gas Corp.
390,118
10,143,068
Canadian Natural Resources Ltd.
43,400
1,738,925
Chesapeake Energy Corp.
25,800
417,186
Comstock Resources, Inc. (a)
110,220
5,207,895
Concho Resources, Inc. (a)
119,844
2,734,840
Common Stocks - continued
Shares
Value
OIL, GAS & CONSUMABLE FUELS - CONTINUED
Oil & Gas Exploration & Production - continued
Denbury Resources, Inc. (a)
226,100
$ 2,469,012
Devon Energy Corp.
12,500
821,375
Encore Acquisition Co. (a)
76,732
1,958,201
EOG Resources, Inc.
800
53,264
EXCO Resources, Inc. (a)
165,850
1,502,601
Forest Oil Corp. (a)
15,509
255,743
Goodrich Petroleum Corp. (a)
28,800
862,560
Newfield Exploration Co. (a)
10,100
199,475
Nexen, Inc.
133,700
2,357,085
Noble Energy, Inc.
73,400
3,612,748
Oil Search Ltd.
284,383
949,849
OPTI Canada, Inc. (a)
154,600
228,717
Penn Virginia Corp.
48,061
1,248,625
Petrobank Energy & Resources Ltd. (a)
15,900
265,414
Petrohawk Energy Corp. (a)
398,223
6,224,225
Petroquest Energy, Inc. (a)
121,063
818,386
Plains Exploration & Production Co. (a)
143,562
3,336,381
Quicksilver Resources, Inc. (a)
302,039
1,682,357
Range Resources Corp.
315,100
10,836,289
SandRidge Energy, Inc. (a)
2,922
17,970
Southwestern Energy Co. (a)
293,000
8,488,210
Talisman Energy, Inc.
2,900
29,031
Whiting Petroleum Corp. (a)
19,300
645,778
77,536,974
Oil & Gas Refining & Marketing - 6.4%
Frontier Oil Corp.
362,664
4,580,446
Holly Corp.
85,600
1,560,488
Sunoco, Inc.
77,037
3,348,028
Tesoro Corp.
167,332
2,203,762
Valero Energy Corp.
244,657
5,294,377
16,987,101
Shares
Value
Oil & Gas Storage & Transport - 1.7%
El Paso Corp.
163,900
$ 1,283,337
Williams Companies, Inc.
213,850
3,096,548
4,379,885
TOTAL OIL, GAS & CONSUMABLE FUELS
189,203,149
TOTAL COMMON STOCKS
(Cost $379,872,755)
257,238,363
Money Market Funds - 2.4%
Fidelity Cash Central Fund, 1.06% (b)
5,327,161
5,327,161
Fidelity Securities Lending Cash Central Fund, 0.87% (b)(c)
946,375
946,375
TOTAL MONEY MARKET FUNDS
(Cost $6,273,536)
6,273,536
TOTAL INVESTMENT PORTFOLIO - 100.1%
(Cost $386,146,291)
263,511,899
NET OTHER ASSETS - (0.1)%
(207,590)
NET ASSETS - 100%
$ 263,304,309
Legend
(a) Non-income producing
(b) Affiliated fund that is available only to investment companies and other accounts managed by Fidelity Investments. The rate quoted is the annualized seven-day yield of the fund at period end. A complete unaudited listing of the fund's holdings as of its most recent quarter end is available upon request.
(c) Investment made with cash collateral received from securities on loan.
(d) Security or a portion of the security is on loan at period end.
Affiliated Central Funds
Information regarding fiscal year to date income earned by the Fund from investments in Fidelity Central Funds is as follows:
Fund
Income earned
Fidelity Cash Central Fund
$ 145,870
Fidelity Securities Lending Cash Central Fund
101,982
Total
$ 247,852
Other Information
The following is a summary of the inputs used, as of December 31, 2008, involving the Fund's assets carried at value. The inputs or methodology used for valuing securities may not be an indication of the risk associated with investing in those securities. For more information on valuation inputs, and their aggregation into the levels used in the table below, please refer to the Security Valuation section in the accompanying Notes to Financial Statements.
Valuation Inputs at Reporting Date:
Description
Total
Level 1
Level 2
Level 3
Investments in Securities
$ 263,511,899
$ 260,978,775
$ 2,533,124
$ -
Distribution of investments by country of issue, as a percentage of total net assets, is as follows: (Unaudited)
United States of America
83.4%
Cayman Islands
4.4%
Canada
2.8%
United Kingdom
2.7%
Netherlands Antilles
1.7%
France
1.5%
Italy
1.5%
Others (individually less than 1%)
2.0%
100.0%
Income Tax Information
The fund intends to elect to defer to its fiscal year ending December 31, 2009 approximately $23,129,107 of losses recognized during the period November 1, 2008 to December 31, 2008.
See accompanying notes which are an integral part of the financial statements.
Investment in securities, at value (including securities loaned of $876,040) - See accompanying schedule:
Unaffiliated issuers (cost $379,872,755)
$ 257,238,363
Fidelity Central Funds (cost $6,273,536)
6,273,536
Total Investments (cost $386,146,291)
$ 263,511,899
Foreign currency held at value (cost $203)
203
Receivable for investments sold
133,757
Receivable for fund shares sold
771,173
Dividends receivable
200,230
Distributions receivable from Fidelity Central Funds
6,635
Prepaid expenses
3,646
Other receivables
41,391
Total assets
264,668,934
Liabilities
Payable for investments purchased
$ 101,769
Payable for fund shares redeemed
43,081
Accrued management fee
118,047
Distribution fees payable
17,651
Other affiliated payables
25,507
Other payables and accrued expenses
112,195
Collateral on securities loaned, at value
946,375
Total liabilities
1,364,625
Net Assets
$ 263,304,309
Net Assets consist of:
Paid in capital
$ 424,209,480
Accumulated undistributed net realized gain (loss) on investments and foreign currency transactions
(38,212,880)
Net unrealized appreciation (depreciation) on investments and assets and liabilities in foreign currencies
(122,692,291)
Net Assets
$ 263,304,309
Statement of Assets and Liabilities - continued
December 31, 2008
Initial Class: Net Asset Value, offering price and redemption price per share ($117,939,822 ÷ 10,295,396 shares)
$ 11.46
Service Class 2: Net Asset Value, offering price and redemption price per share ($90,108,510 ÷ 7,902,605 shares)
$ 11.40
Investor Class: Net Asset Value, offering price and redemption price per share ($55,255,977 ÷ 4,831,026 shares)
$ 11.44
See accompanying notes which are an integral part of the financial statements.
Annual Report
Statement of Operations
Year ended December 31, 2008
Investment Income
Dividends
$ 4,533,310
Interest
1,076
Income from Fidelity Central Funds
247,852
Total income
4,782,238
Expenses
Management fee
$ 3,243,094
Transfer agent fees
506,059
Distribution fees
458,846
Accounting and security lending fees
217,092
Custodian fees and expenses
54,033
Independent trustees' compensation
2,795
Registration fees
1,094
Audit
44,303
Legal
3,471
Interest
16,799
Miscellaneous
60,181
Total expenses before reductions
4,607,767
Expense reductions
(22,664)
4,585,103
Net investment income (loss)
197,135
Realized and Unrealized Gain (Loss)
Net realized gain (loss) on:
Investment securities:
Unaffiliated issuers
(26,229,667)
Foreign currency transactions
9,906
Total net realized gain (loss)
(26,219,761)
Change in net unrealized appreciation (depreciation) on:
Investment securities (net of decrease in deferred foreign taxes of $97,338)
(343,581,244)
Assets and liabilities in foreign currencies
515
Total change in net unrealized appreciation (depreciation)
(343,580,729)
Net gain (loss)
(369,800,490)
Net increase (decrease) in net assets resulting from operations
$ (369,603,355)
Statement of Changes in Net Assets
Year ended December 31, 2008
Year ended December 31, 2007
Increase (Decrease) in Net Assets
Operations
Net investment income (loss)
$ 197,135
$ 1,173,451
Net realized gain (loss)
(26,219,761)
35,806,472
Change in net unrealized appreciation (depreciation)
(343,580,729)
145,447,905
Net increase (decrease) in net assets resulting from operations
(369,603,355)
182,427,828
Distributions to shareholders from net investment income
(275,275)
(1,200,523)
Distributions to shareholders from net realized gain
(18,707,189)
(27,081,489)
Total distributions
(18,982,464)
(28,282,012)
Share transactions - net increase (decrease)
(29,506,360)
124,344,576
Redemption fees
458,118
169,727
Total increase (decrease) in net assets
(417,634,061)
278,660,119
Net Assets
Beginning of period
680,938,370
402,278,251
End of period
$ 263,304,309
$ 680,938,370
See accompanying notes which are an integral part of the financial statements.
Annual Report
Financial Highlights - Initial Class
Years ended December 31,
2008
2007
2006
2005
2004
Selected Per-Share Data
Net asset value, beginning of period
$ 26.55
$ 19.04
$ 18.92
$ 13.62
$ 11.04
Income from Investment Operations
Net investment income (loss) C
.03
.07
.09
.10
.10
Net realized and unrealized gain (loss)
(14.31)
8.62
3.09
6.20
2.53
Total from investment operations
(14.28)
8.69
3.18
6.30
2.63
Distributions from net investment income
(.03)
(.06)
(.16)
(.08)
(.07)
Distributions from net realized gain
(.80)
(1.13)
(2.91)
(.94)
-
Total distributions
(.83)
(1.19)
(3.07)
(1.02)
(.07)
Redemption fees added to paid in capital C
.02
.01
.01
.02
.02
Net asset value, end of period
$ 11.46
$ 26.55
$ 19.04
$ 18.92
$ 13.62
Total Return A, B
(54.26)%
45.97%
16.91%
46.31%
23.96%
Ratios to Average Net Assets D, F
Expenses before reductions
.70%
.70%
.71%
.72%
.78%
Expenses net of fee waivers, if any
.70%
.70%
.71%
.72%
.78%
Expenses net of all reductions
.69%
.70%
.70%
.66%
.74%
Net investment income (loss)
.13%
.31%
.43%
.56%
.80%
Supplemental Data
Net assets, end of period (000 omitted)
$ 117,940
$ 355,854
$ 280,537
$ 334,368
$ 125,781
Portfolio turnover rate E
130%
61%
151%
107%
87%
A Total returns do not reflect charges attributable to your insurance company's separate account. Inclusion of these charges would reduce the total returns shown.
B Total returns would have been lower had certain expenses not been reduced during the periods shown.
C Calculated based on average shares outstanding during the period.
D Fees and expenses of the underlying Fidelity Central Funds are not included in the Fund's expense ratio. The Fund indirectly bears its proportionate share of the expenses of any underlying Fidelity Central Funds.
E Amount does not include the portfolio activity of any underlying Fidelity Central Funds.
F Expense ratios reflect operating expenses of the class. Expenses before reductions do not reflect amounts reimbursed by the investment adviser or reductions from brokerage service arrangements or other expense offset arrangements and do not represent the amount paid by the class during periods when reimbursements or reductions occur. Expenses net of fee waivers reflect expenses after reimbursement by the investment adviser but prior to reductions from brokerage service arrangements or other expense offset arrangements. Expenses net of all reductions represent the net expenses paid by the class.
B Total returns for periods of less than one year are not annualized.
C Total returns do not reflect charges attributable to your insurance company's separate account. Inclusion of these charges would reduce the total returns shown.
D Total returns would have been lower had certain expenses not been reduced during the periods shown.
E Calculated based on average shares outstanding during the period.
F Fees and expenses of the underlying Fidelity Central Funds are not included in the Fund's expense ratio. The Fund indirectly bears its proportionate share of the expenses of any underlying Fidelity Central Funds.
G Amount does not include the portfolio activity of any underlying Fidelity Central Funds.
H For the period April 6, 2005 (commencement of sale of shares) to December 31, 2005.
I Expense ratios reflect operating expenses of the class. Expenses before reductions do not reflect amounts reimbursed by the investment adviser or reductions from brokerage service arrangements or other expense offset arrangements and do not represent the amount paid by the class during periods when reimbursements or reductions occur. Expense ratios before reductions for start-up periods may not be representative of longer-term operating periods. Expenses net of fee waivers reflect expenses after reimbursement by the investment adviser but prior to reductions from brokerage service arrangements or other expense offset arrangements. Expenses net of all reductions represent the net expenses paid by the class.
See accompanying notes which are an integral part of the financial statements.
Annual Report
Financial Highlights - Investor Class
Years ended December 31,
2008
2007
2006
2005 H
Selected Per-Share Data
Net asset value, beginning of period
$ 26.49
$ 19.00
$ 18.91
$ 16.76
Income from Investment Operations
Net investment income (loss) E
.01
.05
.06
.03
Net realized and unrealized gain (loss)
(14.28)
8.61
3.08
3.11
Total from investment operations
(14.27)
8.66
3.14
3.14
Distributions from net investment income
- J
(.05)
(.15)
(.08)
Distributions from net realized gain
(.80)
(1.13)
(2.91)
(.92)
Total distributions
(.80)
(1.18)
(3.06)
(1.00)
Redemption fees added to paid in capital E
.02
.01
.01
.01
Net asset value, end of period
$ 11.44
$ 26.49
$ 19.00
$ 18.91
Total Return B, C, D
(54.32)%
45.88%
16.69%
18.73%
Ratios to Average Net Assets F, I
Expenses before reductions
.79%
.81%
.84%
.91% A
Expenses net of fee waivers, if any
.79%
.81%
.84%
.91% A
Expenses net of all reductions
.78%
.81%
.82%
.85% A
Net investment income (loss)
.04%
.20%
.31%
.37% A
Supplemental Data
Net assets, end of period (000 omitted)
$ 55,256
$ 131,198
$ 51,436
$ 16,402
Portfolio turnover rate G
130%
61%
151%
107%
A Annualized
B Total returns for periods of less than one year are not annualized.
C Total returns do not reflect charges attributable to your insurance company's separate account. Inclusion of these charges would reduce the total returns shown.
D Total returns would have been lower had certain expenses not been reduced during the periods shown.
E Calculated based on average shares outstanding during the period.
F Fees and expenses of the underlying Fidelity Central Funds are not included in the Fund's expense ratio. The Fund indirectly bears its proportionate share of the expenses of any underlying Fidelity Central Funds.
G Amount does not include the portfolio activity of any underlying Fidelity Central Funds.
H For the period July 21, 2005 (commencement of sale of shares) to December 31, 2005.
I Expense ratios reflect operating expenses of the class. Expenses before reductions do not reflect amounts reimbursed by the investment adviser or reductions from brokerage service arrangements or other expense offset arrangements and do not represent the amount paid by the class during periods when reimbursements or reductions occur. Expense ratios before reductions for start-up periods may not be representative of longer-term operating periods. Expenses net of fee waivers reflect expenses after reimbursement by the investment adviser but prior to reductions from brokerage service arrangements or other expense offset arrangements. Expenses net of all reductions represent the net expenses paid by the class.
J Amount represents less than $.01 per share.
See accompanying notes which are an integral part of the financial statements.
VIP Energy Portfolio (the Fund) is a non-diversified fund of Variable Insurance Products Fund IV (the trust) and is authorized to issue an unlimited number of shares. The trust is registered under the Investment Company Act of 1940, as amended (the 1940 Act), as an open-end management investment company organized as a Massachusetts business trust. Shares of the Fund may only be purchased by insurance companies for the purpose of funding variable annuity or variable life insurance contracts. The Fund offers the following classes of shares: Initial Class shares, Service Class 2 shares, and Investor Class shares. All classes have equal rights and voting privileges, except for matters affecting a single class. Investment income, realized and unrealized capital gains and losses, the common expenses of the Fund, and certain fund-level expense reductions, if any, are allocated on a pro rata basis to each class based on the relative net assets of each class to the total net assets of the Fund. Each class differs with respect to transfer agent and distribution and service plan fees incurred. Certain expense reductions also differ by class.
2. Investments in Fidelity Central Funds.
The Fund may invest in Fidelity Central Funds, which are open-end investment companies available only to other investment companies and accounts managed by Fidelity Management & Research Company (FMR) and its affiliates. The Fund's Schedule of Investments lists each of the Fidelity Central Funds held as of period end, if any, as an investment of the Fund, but does not include the underlying holdings of each Fidelity Central Fund. As an Investing Fund, the Fund indirectly bears its proportionate share of the expenses of the underlying Fidelity Central Funds.
The Money Market Central Funds seek preservation of capital and current income and are managed by Fidelity Investments Money Management, Inc. (FIMM), an affiliate of FMR.
A complete unaudited list of holdings for each Fidelity Central Fund is available upon request or at the SEC's web site at www.sec.gov. In addition, the financial statements of the Fidelity Central Funds, which are not covered by the Fund's Report of Independent Registered Public Accounting Firm, are available on the SEC's web site or upon request.
3. Significant Accounting Policies.
The financial statements have been prepared in conformity with accounting principles generally accepted in the United States of America, which require management to make certain estimates and assumptions at the date of the financial statements. Actual results could differ from those estimates. The following summarizes the significant accounting policies of the Fund:
Security Valuation. Investments are valued as of 4:00 p.m. Eastern time on the last calendar day of the period. Wherever possible, the Fund uses independent pricing services approved by the Board of Trustees to value its investments.
Equity securities, including restricted securities, for which market quotations are readily available, are valued at the last reported sale price or official closing price as reported by an independent pricing service on the primary market or exchange on which they are traded. In the event there were no sales during the day or closing prices are not available, securities are valued at the last quoted bid price. Investments in open-end mutual funds, including the Fidelity Central Funds, are valued at their closing net asset value each business day. Short-term securities with remaining maturities of sixty days or less for which quotations are not readily available are valued at amortized cost, which approximates value.
When current market prices or quotations are not readily available or reliable, valuations may be determined in good faith in accordance with procedures adopted by the Board of Trustees. Factors used in determining value may include significant market or security specific events, changes in interest rates and credit quality, and developments in foreign markets which are monitored by evaluating the performance of ADRs, futures contracts and exchange-traded funds. The frequency with which these procedures are used cannot be predicted and may be utilized to a significant extent. The value of securities used for net asset value (NAV) calculation under these procedures may differ from published prices for the same securities.
The Fund is subject to the provisions of Statement of Financial Accounting Standards No. 157, "Fair Value Measurements" (SFAS 157), effective with the beginning of the Fund's fiscal year. SFAS 157 establishes a hierarchy that prioritizes the inputs to valuation techniques giving the highest priority to readily available unadjusted quoted prices in active markets for identical assets (level 1 measurements) and the lowest priority to unobservable inputs (level 3 measurements) when market prices are not readily available or reliable. The three levels of the hierarchy under SFAS 157 are described below:
Level 1
Quoted prices in active markets for identical securities.
Level 2
Prices determined using other significant observable inputs. Observable inputs are inputs that other market participants may use in pricing a security. These may include quoted prices for similar securities, interest rates, prepayment speeds, credit risk and others.
Level 3
Prices determined using significant unobservable inputs. In situations where quoted prices or observable inputs are unavailable or deemed less relevant (for example, when there is little or no market activity for an investment at the end of the period), unobservable inputs may be used. Unobservable inputs reflect the Fund's own assumptions about the factors market participants would use in pricing an investment, and would be based on the best information available.
Changes in valuation techniques may result in transfers in or out of an investment's assigned level within the hierarchy.
The aggregate value by input level, as of December 31, 2008, for the Fund's investments is included at the end of the Fund's Schedule of Investments.
Annual Report
3. Significant Accounting Policies - continued
Foreign Currency. The Fund uses foreign currency contracts to facilitate transactions in foreign-denominated securities. Losses from these transactions may arise from changes in the value of the foreign currency or if the counterparties do not perform under the contracts' terms.
Foreign-denominated assets, including investment securities, and liabilities are translated into U.S. dollars at the exchange rate at period end. Purchases and sales of investment securities, income and dividends received and expenses denominated in foreign currencies are translated into U.S. dollars at the exchange rate in effect on the transaction date.
The effects of exchange rate fluctuations on investments are included with the net realized and unrealized gain (loss) on investment securities. Other foreign currency transactions resulting in realized and unrealized gain (loss) are disclosed separately.
Investment Transactions and Income. For financial reporting purposes, the Fund's investment holdings and NAV include trades executed through the end of the last business day of the period. The NAV per share for processing shareholder transactions is calculated as of the close of business of the New York Stock Exchange (NYSE), normally 4:00 p.m. Eastern time and includes trades executed through the end of the prior business day. Gains and losses on securities sold are determined on the basis of identified cost and may include proceeds received from litigation. Dividend income is recorded on the ex-dividend date, except for certain dividends from foreign securities where the ex-dividend date may have passed, which are recorded as soon as the Fund is informed of the ex-dividend date. Non-cash dividends included in dividend income, if any, are recorded at the fair market value of the securities received. Distributions received on securities that represent a return of capital or capital gain are recorded as a reduction of cost of investments and/or as a realized gain. The Fund estimates the components of distributions received that may be considered return of capital distributions or capital gain distributions. Interest income and distributions from the Fidelity Central Funds are accrued as earned. Interest income includes coupon interest and amortization of premium and accretion of discount on debt securities. Investment income is recorded net of foreign taxes withheld where recovery of such taxes is uncertain.
Expenses. Most expenses of the trust can be directly attributed to a fund. Expenses which cannot be directly attributed are apportioned among each Fund in the trust. Expense estimates are accrued in the period to which they relate and adjustments are made when actual amounts are known.
Income Tax Information and Distributions to Shareholders. Each year, the Fund intends to qualify as a regulated investment company by distributing substantially all of its taxable income and realized gains under Subchapter M of the Internal Revenue Code and filing its U.S. federal tax return. As a result, no provision for income taxes is required. The Fund is subject to the provisions of FASB Interpretation No. 48, Accounting for Uncertainties in Income Taxes (FIN 48). FIN 48 sets forth a minimum threshold for financial statement recognition of the benefit of a tax position taken or expected to be taken in a tax return. There are no unrecognized tax benefits in the accompanying financial statements. A Fund's federal tax return is subject to examination by the Internal Revenue Service (IRS) for a period of three years. Foreign taxes are provided for based on the Fund's understanding of the tax rules and rates that exist in the foreign markets in which it invests.
Distributions are recorded on the ex-dividend date. Income dividends and capital gain distributions are declared separately for each class. Income and capital gain distributions are determined in accordance with income tax regulations, which may differ from generally accepted accounting principles.
Capital accounts within the financial statements are adjusted for permanent book-tax differences. These adjustments have no impact on net assets or the results of operations. Temporary book-tax differences will reverse in a subsequent period.
Book-tax differences are primarily due to foreign currency transactions, partnerships and losses deferred due to wash sales and excise tax regulations.
The tax-basis components of distributable earnings and the federal tax cost as of period end were as follows:
Unrealized appreciation
$ 19,608,440
Unrealized depreciation
(157,384,522)
Net unrealized appreciation (depreciation)
$ (137,776,082)
Cost for federal income tax purposes
$ 401,287,981
The tax character of distributions paid was as follows:
December 31, 2008
December 31, 2007
Ordinary Income
$ 2,562,622
$ 5,047,984
Long-term Capital Gains
16,419,842
23,234,028
Total
$ 18,982,464
$ 28,282,012
Trading (Redemption) Fees. Shares held less than 60 days are subject to a redemption fee equal to 1% of the proceeds of the redeemed shares. All redemption fees, including any estimated redemption fees paid by FMR, are retained by the Fund and accounted for as an addition to paid in capital.
Annual Report
Notes to Financial Statements - continued
4. Operating Policies.
Repurchase Agreements. FMR has received an Exemptive Order from the Securities and Exchange Commission (the SEC) which permits the Fund and other affiliated entities of FMR to transfer uninvested cash balances into joint trading accounts which are then invested in repurchase agreements. The Fund may also invest directly with institutions in repurchase agreements. Repurchase agreements are collateralized by government or non-government securities. Upon settlement date, collateral is held in segregated accounts with custodian banks and may be obtained in the event of a default of the counterparty. The Fund monitors, on a daily basis, the value of the collateral to ensure it is at least equal to the principal amount of the repurchase agreement (including accrued interest). In the event of a default by the counterparty, realization of the collateral proceeds could be delayed, during which time the value of the collateral may decline.
5. Purchases and Sales of Investments.
Purchases and sales of securities, other than short-term securities, aggregated $755,723,422 and $805,262,870, respectively.
6. Fees and Other Transactions with Affiliates.
Management Fee. FMR and its affiliates provide the Fund with investment management related services for which the Fund pays a monthly management fee. The management fee is the sum of an individual fund fee rate that is based on an annual rate of .30% of the Fund's average net assets and a group fee rate that averaged .26% during the period. The group fee rate is based upon the average net assets of all the mutual funds advised by FMR. The group fee rate decreases as assets under management increase and increases as assets under management decrease. For the period, the total annual management fee rate was .56% of the Fund's average net assets.
Distribution and Service Plan. In accordance with Rule 12b-1 of the 1940 Act, the Fund has adopted a separate 12b-1 Plan for Service Class 2 shares. Service Class 2 pays Fidelity Distributors Corporation (FDC), an affiliate of FMR, a service fee. For the period, the service fee is based on an annual rate of .25% of Service Class 2's average net assets.
For the period, Service Class 2 paid FDC $458,846, all of which was re-allowed to insurance companies for the distribution of shares and providing shareholder support services.
Transfer Agent Fees. Fidelity Investments Institutional Operations Company, Inc. (FIIOC), an affiliate of FMR, is the Fund's transfer, dividend disbursing, and shareholder servicing agent. FIIOC receives an asset-based fee with respect to each class. Each class (with the exception of Investor Class) pays a transfer agent fee, excluding out of pocket expenses, equal to an annual rate of .07% of average net assets. Investor Class pays a monthly asset-based transfer agent fee of .15% of average net assets. Prior to February 1, 2008, Investor class paid a monthly asset-based transfer agent fee of .18% of average net assets. The total transfer agent fees paid by each class to FIIOC, including out of pocket expenses, were as follows:
Initial Class
$ 192,524
Service Class 2
124,874
Investor Class
188,661
$ 506,059
Accounting and Security Lending Fees. Fidelity Service Company, Inc. (FSC), an affiliate of FMR, maintains the Fund's accounting records. The accounting fee is based on the level of average net assets for the month. Under a separate contract, FSC administers the security lending program. The security lending fee is based on the number and duration of lending transactions.
Brokerage Commissions. The Fund placed a portion of its portfolio transactions with brokerage firms which are affiliates of the investment adviser. The commissions paid to these affiliated firms were $4,601 for the period.
Interfund Lending Program. Pursuant to an Exemptive Order issued by the SEC, the Fund, along with other registered investment companies having management contracts with FMR, may participate in an interfund lending program. This program provides an alternative credit facility allowing the funds to borrow from, or lend money to, other participating affiliated funds. At period end, there were no interfund loans outstanding. The Fund's activity in this program during the period for which loans were outstanding was as follows:
Borrower or Lender
Average Daily Loan Balance
Weighted Average Interest Rate
Interest Expense
Borrower
$ 4,912,638
2.56%
$ 16,434
Annual Report
7. Committed Line of Credit.
The Fund participates with other funds managed by FMR in a $4.2 billion credit facility (the "line of credit") to be utilized for temporary or emergency purposes to fund shareholder redemptions or for other short-term liquidity purposes. The Fund has agreed to pay commitment fees on its pro rata portion of the line of credit, which amounted to $1,306 and is reflected in Miscellaneous Expense on the Statement of Operations. During the period, there were no borrowings on this line of credit.
8. Security Lending.
The Fund lends portfolio securities from time to time in order to earn additional income. On the settlement date of the loan, the Fund receives collateral (in the form of U.S. Treasury obligations, letters of credit and/or cash) against the loaned securities and maintains collateral in an amount not less than 100% of the market value of the loaned securities during the period of the loan. The market value of the loaned securities is determined at the close of business of the Fund and any additional required collateral is delivered to the Fund on the next business day. If the borrower defaults on its obligation to return the securities loaned because of insolvency or other reasons, a fund could experience delays and costs in recovering the securities loaned or in gaining access to the collateral. Any cash collateral received is invested in the Fidelity Securities Lending Cash Central Fund. The value of loaned securities and cash collateral at period end are disclosed on the Fund's Statement of Assets and Liabilities. Security lending income represents the income earned on investing cash collateral, less fees and expenses associated with the loan, plus any premium payments that may be received on the loan of certain types of securities. Security lending income is presented in the Statement of Operations as a component of income from Fidelity Central Funds. Net income from lending portfolio securities during the period amounted to $101,982.
9. Bank Borrowings.
The Fund is permitted to have bank borrowings for temporary or emergency purposes to fund shareholder redemptions. The Fund has established borrowing arrangements with certain banks. The interest rate on the borrowings is the bank's base rate, as revised from time to time. The average daily loan balance during the period for which loans were outstanding amounted to $1,260,750. The weighted average interest rate was 2.60%. The interest expense amounted to $365 under the bank borrowing program. At period end, there were no bank borrowings outstanding.
10. Expense Reductions.
Many of the brokers with whom FMR places trades on behalf of the Fund provided services to the Fund in addition to trade execution. These services included payments of certain expenses on behalf of the Fund totaling $22,664 for the period.
11. Other.
The Fund's organizational documents provide former and current trustees and officers with a limited indemnification against liabilities arising in connection with the performance of their duties to the Fund. In the normal course of business, the Fund may also enter into contracts that provide general indemnifications. The Fund's maximum exposure under these arrangements is unknown as this would be dependent on future claims that may be made against the Fund. The risk of material loss from such claims is considered remote.
At the end of the period, FMR or its affiliates were the owners of record of 66% of the total outstanding shares of the Fund and one otherwise unaffiliated shareholder was the owner of record of 34% of the total outstanding shares of the Fund.
During the period, Lehman Brothers Holdings, Inc. and certain of its affiliates (LBHI) sought protection under the insolvency laws of their jurisdictions of organization, including the United States, the United Kingdom and Japan. At the time LBHI's insolvency proceedings were instituted, the Fund had outstanding securities trades with counterparties affiliated with LBHI. As a result of the insolvency proceedings, LBHI is unable to fulfill its commitments and, in certain cases, the Fund may have terminated its trades and related agreements with the relevant entities and, where appropriate, is in the process of initiating claims for damages. FMR believes that the financial impact to the Fund relating to the terminated trades and agreements is immaterial.
In December 2006, the Independent Trustees, with the assistance of independent counsel, completed an investigation regarding gifts, gratuities and business entertainment provided by certain brokers to certain individuals who were employed on FMR's domestic equity trading desk during the period 2002 to 2004. The Independent Trustees and FMR agreed that, despite the absence of proof that the Fidelity mutual funds experienced diminished execution quality as a result of the improper receipt of gifts and business entertainment, the conduct at issue was serious and was worthy of redress. Accordingly, the Independent Trustees requested, and FMR agreed to make, a payment of $42 million plus accrued interest, which equaled approximately $7.3 million, to certain Fidelity mutual funds.
In March 2008, the Trustees approved a method for allocating this payment among the funds and, in total, FMR paid the fund $7,719 which is recorded in the accompanying Statement of Operations.
Annual Report
Notes to Financial Statements - continued
11. Other - continued
In a related administrative order dated March 5, 2008, the U.S. Securities and Exchange Commission ("SEC") announced a settlement with FMR and FMR Co., Inc. (an affiliate of FMR) involving the SEC's regulatory rules for investment advisers and the improper receipt of gifts, gratuities and business entertainment. Without admitting or denying the SEC's findings, FMR agreed to pay an $8 million civil penalty to the United States Treasury.
12. Distributions to Shareholders.
Distributions to shareholders of each class were as follows:
Years ended December 31,
2008
2007
From net investment income
Initial Class
$ 256,873
$ 816,831
Service Class 2
-
167,443
Investor Class
18,402
216,249
Total
$ 275,275
$ 1,200,523
From net realized gain
Initial Class
$ 8,939,423
$ 14,471,944
Service Class 2
6,049,173
7,591,179
Investor Class
3,718,593
5,018,366
Total
$ 18,707,189
$ 27,081,489
13. Share Transactions.
Transactions for each class of shares were as follows:
Shares
Dollars
Years ended December 31,
2008
2007
2008
2007
Initial Class
Shares sold
1,984,359
1,857,099
$ 49,227,554
$ 44,454,803
Reinvestment of distributions
627,226
597,904
9,196,296
15,288,775
Shares redeemed
(5,719,043)
(3,787,008)
(116,160,558)
(77,567,833)
Net increase (decrease)
(3,107,458)
(1,332,005)
$ (57,736,708)
$ (17,824,255)
Service Class 2
Shares sold
3,461,499
4,400,682
$ 81,684,684
$ 102,772,658
Reinvestment of distributions
428,438
300,833
6,049,173
7,758,622
Shares redeemed
(3,320,478)
(1,072,210)
(66,620,993)
(23,413,472)
Net increase (decrease)
569,459
3,629,305
$ 21,112,864
$ 87,117,808
Investor Class
Shares sold
2,051,429
2,764,988
$ 52,822,887
$ 64,717,111
Reinvestment of distributions
264,475
202,756
3,736,995
5,234,615
Shares redeemed
(2,438,344)
(720,765)
(49,442,398)
(14,900,703)
Net increase (decrease)
(122,440)
2,246,979
$ 7,117,484
$ 55,051,023
Annual Report
Reportof Independent Registered Public Accounting Firm
To the Trustees of Variable Insurance Products Fund IV and the Shareholders of VIP Energy Portfolio:
In our opinion, the accompanying statement of assets and liabilities, including the schedule of investments, and the related statements of operations and of changes in net assets and the financial highlights present fairly, in all material respects, the financial position of VIP Energy Portfolio (a fund of Variable Insurance Products Fund IV) at December 31, 2008, the results of its operations for the year then ended, the changes in its net assets for each of the two years in the period then ended and the financial highlights for each of the periods indicated, in conformity with accounting principles generally accepted in the United States of America. These financial statements and financial highlights (hereafter referred to as "financial statements") are the responsibility of the VIP Energy Portfolio's management. Our responsibility is to express an opinion on these financial statements based on our audits. We conducted our audits of these financial statements in accordance with the standards of the Public Company Accounting Oversight Board (United States). Those standards require that we plan and perform the audit to obtain reasonable assurance about whether the financial statements are free of material misstatement. An audit includes examining, on a test basis, evidence supporting the amounts and disclosures in the financial statements, assessing the accounting principles used and significant estimates made by management, and evaluating the overall financial statement presentation. We believe that our audits, which included confirmation of securities at December 31, 2008 by correspondence with the custodian and brokers, provide a reasonable basis for our opinion.
The Trustees, Member of the Advisory Board, and executive officers of the trust and fund, as applicable, are listed below. The Board of Trustees governs the fund and is responsible for protecting the interests of shareholders. The Trustees are experienced executives who meet periodically throughout the year to oversee the fund's activities, review contractual arrangements with companies that provide services to the fund, and review the fund's performance. Except for Edward C. Johnson 3d and James C. Curvey, each of the Trustees oversees 222 funds advised by FMR or an affiliate. Messrs. Johnson and Curvey oversee 381 funds advised by FMR or an affiliate.
The Trustees hold office without limit in time except that (a) any Trustee may resign; (b) any Trustee may be removed by written instrument, signed by at least two-thirds of the number of Trustees prior to such removal; (c) any Trustee who requests to be retired or who has become incapacitated by illness or injury may be retired by written instrument signed by a majority of the other Trustees; and (d) any Trustee may be removed at any special meeting of shareholders by a two-thirds vote of the outstanding voting securities of the trust. Each Trustee who is not an interested person (as defined in the 1940 Act) (Independent Trustee), shall retire not later than the last day of the calendar year in which his or her 72nd birthday occurs. The Independent Trustees may waive this mandatory retirement age policy with respect to individual Trustees. The executive officers and Advisory Board Member hold office without limit in time, except that any officer and Advisory Board Member may resign or may be removed by a vote of a majority of the Trustees at any regular meeting or any special meeting of the Trustees. Except as indicated, each individual has held the office shown or other offices in the same company for the past five years.
The fund's Statement of Additional Information (SAI) includes more information about the Trustees. To request a free copy, call Fidelity at 1-877-208-0098.
Interested Trustees*:
Correspondence intended for each Trustee who is an interested person may be sent to Fidelity Investments, 82 Devonshire Street, Boston, Massachusetts 02109.
Name, Age; Principal Occupation
Edward C. Johnson 3d (78)
Year of Election or Appointment: 1983
Mr. Johnson is Chairman of the Board of Trustees. Mr. Johnson serves as Chief Executive Officer, Chairman, and a Director of FMR LLC; Chairman and a Director of FMR; Chairman and a Director of Fidelity Research & Analysis Company (FRAC); Chairman and a Director of Fidelity Investments Money Management, Inc.; and Chairman and a Director of FMR Co., Inc. In addition, Mr. Johnson serves as Chairman and Director of FIL Limited. Previously, Mr. Johnson served as President of FMR LLC (2006-2007).
James C. Curvey (73)
Year of Election or Appointment: 2007
Mr. Curvey also serves as Trustee (2007-present) of other investment companies advised by FMR. Mr. Curvey is a Director of FMR and FMR Co., Inc. (2007-present). Mr. Curvey is also Vice Chairman (2006-present) and Director of FMR LLC. In addition, Mr. Curvey serves as an Overseer for the Boston Symphony Orchestra and a member of the Trustees of Villanova University.
* Trustees have been determined to be "Interested Trustees" by virtue of, among other things, their affiliation with the trust or various entities under common control with FMR. FMR Corp. merged with and into FMR LLC on October 1, 2007. Any references to FMR LLC for prior periods are deemed to be references to the prior entity.
Independent Trustees:
Correspondence intended for each Independent Trustee (that is, the Trustees other than the Interested Trustees) may be sent to Fidelity Investments, P.O. Box 55235, Boston, Massachusetts 02205-5235.
Name, Age; Principal Occupation
Dennis J. Dirks (60)
Year of Election or Appointment: 2005
Prior to his retirement in May 2003, Mr. Dirks was Chief Operating Officer and a member of the Board of The Depository Trust & Clearing Corporation (DTCC) (1999-2003). He also served as President, Chief Operating Officer, and Board member of The Depository Trust Company (DTC) (1999-2003) and President and Board member of the National Securities Clearing Corporation (NSCC) (1999-2003). In addition, Mr. Dirks served as a Trustee and a member of the Finance Committee of Manhattan College (2005-2008), a Trustee and a member of the Finance Committee of AHRC of Nassau County (2006-2008), as Chief Executive Officer and Board member of the Government Securities Clearing Corporation (2001-2003) and Chief Executive Officer and Board member of the Mortgage-Backed Securities Clearing Corporation (2001-2003). Currently, Mr. Dirks serves as a member of the Board of Directors for Brookville Children's Services, Inc. (2009-present).
Alan J. Lacy (55)
Year of Election or Appointment: 2008
Mr. Lacy serves as Senior Adviser (2007-present) of Oak Hill Capital Partners, L.P. (a private equity firm). Mr. Lacy also served as Chief Executive Officer (2000-2005) and Vice Chairman (2005-2006) of Sears Holdings Corporation and Sears, Roebuck and Co. (retail). In addition, Mr. Lacy serves as a member of the Board of Directors of The Western Union Company (global money transfer, 2006-present) and Bristol-Myers Squibb (global pharmaceuticals, 2007-present). Mr. Lacy is a Trustee of the National Parks Conservation Association and The Field Museum of Natural History.
Ned C. Lautenbach (64)
Year of Election or Appointment: 2000
Mr. Lautenbach is Chairman of the Independent Trustees (2006-present). Mr. Lautenbach is an Advisory Partner of Clayton, Dubilier & Rice, Inc. (private equity investment firm). Previously, Mr. Lautenbach was with the International Business Machines Corporation (IBM) from 1968 until his retirement in 1998. Mr. Lautenbach serves as a Director of Eaton Corporation (diversified industrial) as well as the Philharmonic Center for the Arts in Naples, Florida. He also is a member of the Board of Trustees of Fairfield University (2005-present), as well as a member of the Council on Foreign Relations. Previously, Mr. Lautenbach served as a Director of Sony Corporation (2006-2007).
Joseph Mauriello (64)
Year of Election or Appointment: 2008
Prior to his retirement in January 2006, Mr. Mauriello served in numerous senior management positions including Deputy Chairman and Chief Operating Officer (2004-2005), and Vice Chairman of Financial Services (2002-2004) of KPMG LLP US (professional services firm, 1965-2005). Mr. Mauriello currently serves as a member of the Board of Directors of XL Capital Ltd. (global insurance and re-insurance company, 2006-present) and of Arcadia Resources Inc. (health care services and products, 2007-present). He also served as a Director of the Hamilton Funds of the Bank of New York (2006-2007).
Cornelia M. Small (64)
Year of Election or Appointment: 2005
Ms. Small is a member of the Investment Committee, and Chair (2008-present) and a member of the Board of Trustees of Smith College. Ms. Small also serves on the Investment Committee of the Berkshire Taconic Community Foundation (2008-present). Previously, Ms. Small served as Chairperson of the Investment Committee (2002-2008) of Smith College and as Co-Chair (2000-2003) of the Annual Fund for the Fletcher School of Law and Diplomacy. In addition, she served as Chief Investment Officer, Director of Global Equity Investments, and a member of the Board of Directors of Scudder, Stevens & Clark and Scudder Kemper Investments.
William S. Stavropoulos (69)
Year of Election or Appointment: 2002
Mr. Stavropoulos is Chairman Emeritus of the Board of Directors of The Dow Chemical Company, where he previously served in numerous senior management positions, including President (1993-2000; 2002-2003), CEO (1995-2000; 2002-2004), Chairman of the Executive Committee (2000-2006), and as a member of the Board of Directors (1990-2006). Currently, he is a Director of Teradata Corporation (data warehousing and technology solutions, 2008-present), Chemical Financial Corporation, Maersk Inc. (industrial conglomerate), Tyco International, Inc. (multinational manufacturing and services, 2007-present), and a member of the Advisory Board for Metalmark Capital (private equity investment firm, 2005-present). He is a special advisor to Clayton, Dubilier & Rice, Inc. (private equity investment). In addition, Mr. Stavropoulos is a member of the University of Notre Dame Advisory Council for the College of Science.
David M. Thomas (59)
Year of Election or Appointment: 2008
Previously, Mr. Thomas served as Executive Chairman (2005-2006) and Chairman and Chief Executive Officer (2000-2005) of IMS Health, Inc. (pharmaceutical and healthcare information solutions). In addition, Mr. Thomas serves as a member of the Board of Directors of Fortune Brands, Inc. (consumer products holding company), and Interpublic Group of Companies, Inc. (marketing communication, 2004-present).
Michael E. Wiley (58)
Year of Election or Appointment: 2008
Mr. Wiley also serves as a member of the Board of Trustees of the University of Tulsa (2000-2006; 2007-present). He serves as a Director of Tesoro Corporation (independent oil refiner and marketer, 2005-present), and a Director of Bill Barrett Corporation (exploration and production company, 2005-present). In addition, he also serves as a Director of Post Oak Bank (privately-held bank, 2004-present). Previously, Mr. Wiley served as a Sr. Energy Advisor of Katzenbach Partners, LLC (consulting firm, 2006-2007), as an Advisory Director of Riverstone Holdings (private investment firm), Chairman, President, and CEO of Baker Hughes, Inc. (oilfield services company, 2000-2004), and as Director of Spinnaker Exploration Company (exploration and production company, 2001-2005).
Annual Report
Advisory Board Member and Executive Officers**:
Correspondence intended for each executive officer and Mr. Lynch may be sent to Fidelity Investments, 82 Devonshire Street, Boston, Massachusetts 02109.
Name, Age; Principal Occupation
Peter S. Lynch (64)
Year of Election or Appointment: 2003
Member of the Advisory Board of Fidelity's Equity and High Income Funds. Mr. Lynch is Vice Chairman and a Director of FMR, and Vice Chairman (2001-present) and a Director of FMR Co., Inc. Previously, Mr. Lynch served as a Trustee of the Fidelity funds (1990-2003). In addition, he serves as a Trustee of Boston College and as the Chairman of the Inner-City Scholarship Fund. Previously, Mr. Lynch served on the Special Olympics International Board of Directors (1997-2006).
Kenneth B. Robins (39)
Year of Election or Appointment: 2008
President and Treasurer of Fidelity's Equity and High Income Funds. Mr. Robins is an employee of Fidelity Investments (2004-present). Before joining Fidelity Investments, Mr. Robins worked at KPMG LLP, where he was a partner in KPMG's department of professional practice (2002-2004).
Scott C. Goebel (40)
Year of Election or Appointment: 2008
Secretary and Chief Legal Officer (CLO) of the Fidelity funds. Mr. Goebel also serves as General Counsel, Secretary, and Senior Vice President of FMR (2008-present); Deputy General Counsel of FMR LLC; Chief Legal Secretary of Fidelity Management & Research (Hong Kong) Limited (2008-present) and Assistant Secretary of Fidelity Management & Research (Japan) Inc. (2008-present). Previously, Mr. Goebel served as Assistant Secretary of the Funds (2007-2008) and as Vice President and Secretary of Fidelity Distributors Corporation (FDC) (2005-2007).
Brian B. Hogan (44)
Year of Election or Appointment: 2007
Vice President of Sector Funds. Mr. Hogan also serves as Senior Vice President, Equity Research of FMR. Previously, Mr. Hogan served as a portfolio manager.
John B. McGinty, Jr. (46)
Year of Election or Appointment: 2008
Assistant Secretary of Fidelity's Equity and High Income Funds. Mr. McGinty is an employee of Fidelity Investments (2004-present). Mr. McGinty also serves as Senior Vice President, Secretary, and Chief Legal Officer of FDC (2007-present). Before joining Fidelity Investments, Mr. McGinty practiced law at Ropes & Gray, LLP.
Holly C. Laurent (54)
Year of Election or Appointment: 2008
Anti-Money Laundering (AML) Officer of the Fidelity funds. Ms. Laurent is an employee of Fidelity Investments. Previously, Ms. Laurent was Senior Vice President and Head of Legal for Fidelity Business Services India Pvt. Ltd. (2006-2008), Senior Vice President, Deputy General Counsel and Group Head for FMR LLC (2005-2006).
Christine Reynolds (50)
Year of Election or Appointment: 2008
Chief Financial Officer of the Fidelity funds. Ms. Reynolds became President of Fidelity Pricing and Cash Management Services (FPCMS) in August 2008. She served as Chief Operating Officer of FPCMS from 2007 through July 2008. Previously, Ms. Reynolds served as President, Treasurer, and Anti-Money Laundering officer of the Fidelity funds (2004-2007). Before joining Fidelity Investments, Ms. Reynolds worked at PricewaterhouseCoopers LLP (PwC) (1980-2002), where she was an audit partner with PwC's investment management practice.
Kenneth A. Rathgeber (61)
Year of Election or Appointment: 2004
Chief Compliance Officer of Fidelity's Equity and High Income Funds. Mr. Rathgeber is Chief Compliance Officer of Fidelity Management & Research (Hong Kong) Limited (2008-present), Fidelity Management & Research (Japan) Inc. (2008-present), FMR (2005-present), FMR Co., Inc. (2005-present), Fidelity Management & Research (U.K.) Inc. (2005-present), Fidelity Research & Analysis Company (2005-present), Fidelity Investments Money Management, Inc. (2005-present), and Strategic Advisers, Inc. (2005-present).
Bryan A. Mehrmann (47)
Year of Election or Appointment: 2005
Deputy Treasurer of the Fidelity funds. Mr. Mehrmann is an employee of Fidelity Investments. Previously, Mr. Mehrmann served as Vice President of Fidelity Investments Institutional Services Group (FIIS)/Fidelity Investments Institutional Operations Company, Inc. (FIIOC) Client Services (1998-2004).
Adrien E. Deberghes (41)
Year of Election or Appointment: 2008
Deputy Treasurer of Fidelity's Equity and High Income Funds. Mr. Deberghes is an employee of Fidelity Investments (2008-present). Previously, Mr. Deberghes served as Senior Vice President of Mutual Fund Administration at State Street Corporation (2007-2008), Senior Director of Mutual Fund Administration at Investors Bank & Trust (2005-2007), and Director of Finance for Dunkin' Brands (2000-2005).
Robert G. Byrnes (42)
Year of Election or Appointment: 2005
Assistant Treasurer of the Fidelity funds. Mr. Byrnes is an employee of Fidelity Investments (2005-present). Previously, Mr. Byrnes served as Vice President of Fidelity Pricing and Cash Management Services (FPCMS) (2003-2005). Before joining Fidelity Investments, Mr. Byrnes worked at Deutsche Asset Management where he served as Vice President of the Investment Operations Group (2000-2003).
Paul M. Murphy (61)
Year of Election or Appointment: 2007
Assistant Treasurer of the Fidelity funds. Mr. Murphy is an employee of Fidelity Investments (2007-present). Previously, Mr. Murphy served as Chief Financial Officer of the Fidelity Funds (2005-2006), Vice President and Associate General Counsel of FMR (2007), and Senior Vice President of Fidelity Pricing and Cash Management Services (FPCMS) (1994-2007).
Gary W. Ryan (50)
Year of Election or Appointment: 2005
Assistant Treasurer of the Fidelity funds. Mr. Ryan is an employee of Fidelity Investments. Previously, Mr. Ryan served as Vice President of Fund Reporting in Fidelity Pricing and Cash Management Services (FPCMS) (1999-2005).
** FMR Corp. merged with and into FMR LLC on October 1, 2007. Any references to FMR LLC for prior periods are deemed to be references to the prior entity.
The fund hereby designates as a capital gain dividend with respect to the taxable year ended December 31, 2008, $10,553,349, or, if subsequently determined to be different, the net capital gain of such year.
A percentage of the dividends distributed during the fiscal year for the following classes qualifies for the dividends-received deduction for corporate shareholders:
February
Service Class 2
6%
The fund will notify shareholders in January 2009 of amounts for use in preparing 2008 income tax returns.
A special meeting of the fund's shareholders was held on May 14, 2008. The results of votes taken among shareholders on the proposals before them are reported below. Each vote reported represents one dollar of net asset value held on the record date for the meeting.
PROPOSAL 1
To elect a Board of Trustees.A
# of Votes
% of Votes
James C. Curvey
Affirmative
82,890,712.47
95.991
Withheld
3,461,988.43
4.009
TOTAL
86,352,700.90
100.000
Dennis J. Dirks
Affirmative
82,970,372.75
96.083
Withheld
3,382,328.15
3.917
TOTAL
86,352,700.90
100.000
Edward C. Johnson 3d
Affirmative
82,689,162.78
95.757
Withheld
3,663,538.12
4.243
TOTAL
86,352,700.90
100.000
Alan J. Lacy
Affirmative
83,041,222.35
96.165
Withheld
3,311,478.55
3.835
TOTAL
86,352,700.90
100.000
Ned C. Lautenbach
Affirmative
82,983,853.72
96.099
Withheld
3,368,847.18
3.901
TOTAL
86,352,700.90
100.000
Joseph Mauriello
Affirmative
83,138,122.14
96.277
Withheld
3,214,578.76
3.723
TOTAL
86,352,700.90
100.000
Cornelia M. Small
Affirmative
83,095,438.06
96.228
Withheld
3,257,262.84
3.772
TOTAL
86,352,700.90
100.000
William S. Stavropoulos
Affirmative
82,929,113.95
96.035
Withheld
3,423,586.95
3.965
TOTAL
86,352,700.90
100.000
David M. Thomas
Affirmative
83,095,487.87
96.228
Withheld
3,257,213.03
3.772
TOTAL
86,352,700.90
100.000
Michael E. Wiley
Affirmative
83,048,523.75
96.174
Withheld
3,304,177.15
3.826
TOTAL
86,352,700.90
100.000
PROPOSAL 2
To amend the Declaration of Trust to reduce the required quorum for future shareholder meetings.A
# of Votes
% of Votes
Affirmative
74,393,635.26
86.151
Against
8,745,543.59
10.128
Abstain
3,213,522.05
3.721
TOTAL
86,352,700.90
100.000
ADenotes trust-wide proposal and voting results.
Annual Report
BoardApproval of Investment Advisory Contracts and Management Fees
VIP Energy Portfolio
Each year, typically in July, the Board of Trustees, including the Independent Trustees (together, the Board), votes on the renewal of the management contract and sub-advisory agreements (together, the Advisory Contracts) for the fund. The Board, assisted by the advice of fund counsel and Independent Trustees' counsel, requests and considers a broad range of information throughout the year.
The Board meets regularly and, acting directly and through its separate committees, requests and receives information concerning, and considers at each of its meetings factors that are relevant to, its annual consideration of the renewal of the fund's Advisory Contracts, including the services and support provided to the fund and its shareholders. At the time of the renewal, the Board had 12 standing committees, each composed of Independent Trustees with varying backgrounds, to which the Board has assigned specific subject matter responsibilities in order to enhance effective decision-making by the Board. Each committee has a written charter outlining the structure and purposes of the committee. The Board also meets as needed to consider matters specifically related to the Board's annual consideration of the renewal of Advisory Contracts.
At its July 2008 meeting, the Board of Trustees, including the Independent Trustees, unanimously determined to renew the fund's Advisory Contracts. In reaching its determination, the Board considered all factors it believed relevant, including (i) the nature, extent, and quality of the services to be provided to the fund and its shareholders (including the investment performance of the fund); (ii) the competitiveness of the fund's management fee and total expenses; (iii) the total costs of the services to be provided by and the profits to be realized by Fidelity from its relationship with the fund; (iv) the extent to which economies of scale would be realized as the fund grows; and (v) whether fee levels reflect these economies of scale, if any, for the benefit of fund shareholders. The Board also approved agreements with foreign sub-advisers Fidelity Management & Research (Japan) Inc. and Fidelity Management & Research (Hong Kong) Limited, as well as amendments to the fund's agreement with Fidelity Management & Research (U.K.) Inc.
In considering whether to renew the Advisory Contracts for the fund, the Board ultimately reached a determination, with the assistance of fund counsel and Independent Trustees' counsel and through the exercise of its business judgment, that the renewal of the Advisory Contracts and the compensation to be received by Fidelity under the management contract is consistent with Fidelity's fiduciary duty under applicable law. The Board's decision to renew the Advisory Contracts was not based on any single factor noted above, but rather was based on a comprehensive consideration of all the information provided to the Board at its meetings throughout the year. The Board, in reaching its determination to renew the Advisory Contracts, is aware that shareholders in the fund have a broad range of investment choices available to them, including a wide choice among mutual funds offered by competitors to Fidelity, and that the fund's shareholders, with the opportunity to review and weigh the disclosure provided by the fund in its prospectus and other public disclosures, have chosen to invest in this fund, managed by Fidelity.
Nature, Extent, and Quality of Services Provided. The Board considered staffing within the investment adviser, FMR, and the sub-advisers (together, the Investment Advisers), including the backgrounds of the fund's investment personnel and the fund's investment objective and discipline. The Independent Trustees also had discussions with senior management of Fidelity's investment operations and investment groups. The Board considered the structure of the portfolio manager compensation program and whether this structure provides appropriate incentives.
Resources Dedicated to Investment Management and Support Services. The Board reviewed the size, education, and experience of the Investment Advisers' investment staff, their use of technology, and the Investment Advisers' approach to recruiting, training, and retaining portfolio managers and other research, advisory, and management personnel. The Board noted that Fidelity's analysts have access to a variety of technological tools that enable them to perform both fundamental and quantitative analysis and to specialize in various disciplines. The Board considered Fidelity's extensive global research capabilities that enable the Investment Advisers to aggregate data from various sources in an effort to produce positive investment results. The Board also considered that Fidelity's portfolio managers and analysts have access to daily portfolio attribution that allows for monitoring of a fund's portfolio, as well as an electronic communication system that provides immediate real-time access to research concerning issuers and credit enhancers.
Shareholder and Administrative Services. The Board considered (i) the nature, extent, quality, and cost of advisory, administrative, distribution, and shareholder services performed by the Investment Advisers and their affiliates under the Advisory Contracts and under separate agreements covering transfer agency, pricing and bookkeeping, and securities lending services for the fund; (ii) the nature and extent of the Investment Advisers' supervision of third party service providers, principally custodians and subcustodians; and (iii) the resources devoted to, and the record of compliance with, the fund's compliance policies and procedures. The Board also reviewed the allocation of fund brokerage, including allocations to brokers affiliated with the Investment Advisers, the use of brokerage commissions to pay fund expenses, and the use of "soft" commission dollars to pay for research services. The Board further considered that Fidelity voluntarily pays for market data out of its own resources.
The Board noted that the growth of fund assets across the complex allows Fidelity to reinvest in the development of services designed to enhance the value or convenience of the Fidelity funds as investment vehicles. These services include 24-hour access to account information and market information through phone representatives and over the Internet, and investor education materials and asset allocation tools.
Investment in a Large Fund Family. The Board considered the benefits to shareholders of investing in a Fidelity fund, including the benefits of investing in a fund that is part of a large family of funds offering a variety of investment disciplines and providing for a large variety of mutual fund investor services. The Board noted that Fidelity has taken a number of actions over the previous year that benefited particular funds, including (i) dedicating additional resources to investment research and to restructure the investment research teams; (ii) contractually agreeing to reduce the management fees on Fidelity's Institutional Money Market Funds and launching Class IV and Institutional Class of certain of these funds; (iii) reducing the transfer agent fees for the Fidelity Select Portfolios and Investor Class of the VIP funds; and (iv) launching Class K of 29 equity funds as a lower-fee class available to certain employer-sponsored retirement plans.
Annual Report
Board Approval of Investment Advisory Contracts and Management Fees - continued
Investment Performance. The Board considered whether the fund has operated within its investment objective, as well as its record of compliance with its investment restrictions. It also reviewed the fund's absolute investment performance for each class, as well as the fund's relative investment performance for each class measured against a third-party-sponsored index that reflects the market sector in which the fund invests over multiple periods. The Board noted that FMR does not believe that a meaningful peer group exists against which to compare the fund's performance. The following charts considered by the Board show, over the one-, three-, and five-year periods ended December 31, 2007, as available, the cumulative total returns of Initial Class and Service Class 2 of the fund and the cumulative total returns of a third-party-sponsored index ("benchmark"). The returns of Initial Class and Service Class 2 show the performance of the highest and lowest performing classes, respectively.
VIP Energy Portfolio
The Board stated that the investment performance of Initial Class of the fund compared favorably to its benchmark for all the periods shown. The Board considered that the variations in performance among the fund's classes reflect the variations in class expenses, which result in lower performance for higher expense classes.
The Board considered that FMR has taken steps to refocus and strengthen equity research, equity portfolio management, and compliance.
Based on its review, and giving particular weight to the nature and quality of the resources dedicated by the Investment Advisers to maintain and improve relative performance, the Board concluded that the nature, extent, and quality of the services provided to the fund will benefit the fund's shareholders, particularly in light of the Board's view that the fund's shareholders benefit from investing in a fund that is part of a large family of funds offering a variety of investment disciplines and services.
Competitiveness of Management Fee and Total Fund Expenses. The Board considered the fund's management fee and total expenses compared to "mapped groups" of competitive funds and classes. Fidelity creates "mapped groups" by combining similar Lipper investment objective categories that have comparable management fee characteristics. Combining Lipper investment objective categories aids the Board's management fee and total expense comparisons by broadening the competitive group used for comparison and by reducing the number of universes to which various Fidelity funds are compared. The Board also considered supplemental information about how the fund's management fee and total expenses ranked relative to groups based on Lipper classifications, which take into account a fund's market capitalization and style.
The Board considered two proprietary management fee comparisons for the 12-month periods shown in the chart below. The group of Lipper funds used by the Board for management fee comparisons is referred to below as the "Total Mapped Group." The Total Mapped Group comparison focuses on a fund's standing relative to the total universe of comparable funds available to investors, in terms of gross management fees before expense reimbursements or caps. "TMG %" represents the percentage of funds in the Total Mapped Group that had management fees that were lower than the fund's. For example, a TMG % of 4% means that 96% of the funds in the Total Mapped Group had higher management fees than the fund. The "Asset-Size Peer Group" (ASPG) comparison focuses on a fund's standing relative to non-Fidelity funds similar in size to the fund within the Total Mapped Group. The ASPG represents at least 15% of the funds in the Total Mapped Group with comparable asset size and management fee characteristics, subject to a minimum of 50 funds (or all funds in the Total Mapped Group if fewer than 50). Additional information, such as the ASPG quartile in which the fund's management fee ranked, is also included in the chart and considered by the Board.
Annual Report
VIP Energy Portfolio
The Board noted that the fund's management fee ranked below the median of its Total Mapped Group and below the median of its ASPG for 2007.
Based on its review, the Board concluded that the fund's management fee was fair and reasonable in light of the services that the fund receives and the other factors considered.
In its review of each class's total expenses, the Board considered the fund's management fee as well as other fund or class expenses, as applicable, such as transfer agent fees, pricing and bookkeeping fees, fund-paid 12b-1 fees, and custodial, legal, and audit fees. The Board also noted the effects of any waivers and reimbursements on fees and expenses. As part of its review, the Board also considered current and historical total expenses of each class of the fund compared to competitive fund median expenses. Each class of the fund is compared to those funds and classes in the Total Mapped Group (used by the Board for management fee comparisons) that have a similar sales load structure.
The Board noted that the total expenses of each class ranked below its competitive median for 2007.
In its review of total expenses, the Board also considered Fidelity fee structures and other information on clients that FMR and its affiliates service in other competitive markets, such as other mutual funds advised or subadvised by FMR or its affiliates, pension plan clients, and other institutional clients.
Based on its review, the Board concluded that the total expenses of each class of the fund were reasonable in light of the services that the fund and its shareholders receive and the other factors considered.
Costs of the Services and Profitability. The Board considered the revenues earned and the expenses incurred by Fidelity in conducting the business of developing, marketing, distributing, managing, administering and servicing the fund and its shareholders. The Board also considered the level of Fidelity's profits in respect of all the Fidelity funds.
On an annual basis, FMR presents to the Board Fidelity's profitability for the fund. Fidelity calculates the profitability for each fund, as well as aggregate profitability for groups of Fidelity funds and all Fidelity funds, using a series of detailed revenue and cost allocation methodologies which originate with the audited books and records of Fidelity. The Audit Committee of the Board reviews any significant changes from the prior year's methodologies.
PricewaterhouseCoopers LLP (PwC), independent registered public accounting firm and auditor to Fidelity and certain Fidelity funds, has been engaged annually by the Board as part of the Board's assessment of the results of Fidelity's profitability analysis. PwC's engagement includes the review and assessment of Fidelity's methodologies used in determining the revenues and expenses attributable to Fidelity's mutual fund business, and completion of agreed-upon procedures surrounding the mathematical accuracy of fund profitability and its conformity to allocation methodologies. After considering PwC's reports issued under the engagement and information provided by Fidelity, the Board believes that while other allocation methods may also be reasonable, Fidelity's profitability methodologies are reasonable in all material respects.
The Board has also reviewed Fidelity's non-fund businesses and any fall-out benefits related to the mutual fund business as well as cases where Fidelity's affiliates may benefit from or be related to the fund's business.
The Board considered the costs of the services provided by and the profits realized by Fidelity in connection with the operation of the fund and determined that the amount of profit is a fair entrepreneurial profit for the management of the fund.
Economies of Scale. The Board considered whether there have been economies of scale in respect of the management of the Fidelity funds, whether the Fidelity funds (including the fund) have appropriately benefited from any such economies of scale, and whether there is potential for realization of any further economies of scale. The Board considered the extent to which the fund will benefit from economies of scale through increased services to the fund, through waivers or reimbursements, or through fee or expense reductions.
Annual Report
Board Approval of Investment Advisory Contracts and Management Fees - continued
The Board recognized that the fund's management contract incorporates a "group fee" structure, which provides for lower group fee rates as total fund assets under FMR's management increase, and for higher group fee rates as total fund assets under FMR's management decrease. FMR determines the group fee rates based on a tiered asset "breakpoint" schedule. The Board considered that the group fee is designed to deliver the benefits of economies of scale to fund shareholders when total fund assets increase, even if assets of any particular fund are unchanged or have declined, because some portion of Fidelity's costs are attributable to services provided to all Fidelity funds, and all funds benefit if those costs can be allocated among more assets. The Board concluded that, given the group fee structure, fund shareholders will achieve a certain level of economies of scale as assets under FMR's management increase at the fund complex level, regardless of whether Fidelity achieves any such economies of scale.
The Board further concluded that any potential economies of scale are being shared between fund shareholders and Fidelity in an appropriate manner.
Additional Information Requested by the Board. In order to develop fully the factual basis for consideration of the Fidelity funds' Advisory Contracts, the Board requested and received additional information on certain topics, including (i) fund performance trends and actions to be taken by FMR to improve certain funds' overall performance; (ii) portfolio manager changes that have occurred during the past year; (iii) Fidelity's fund profitability methodology, the profitability of certain fund service providers, and profitability trends for certain funds; (iv) Fidelity's compensation structure for portfolio managers and key personnel, including its effects on fund profitability and the extent to which portfolio manager compensation is linked to fund performance; (v) Fidelity's fee structures and rationale for recommending different fees among categories of funds; and (vi) Fidelity's rationale for recommending which funds should have a performance adjustment component as part of their management fees.
Based on its evaluation of all of the conclusions noted above, and after considering all material factors, the Board ultimately concluded that the advisory fee structures are fair and reasonable, and that the fund's Advisory Contracts should be renewed.
Annual Report
Investment Adviser
Fidelity Management & Research Company Boston, MA
Investment Sub-Advisers
FMR Co., Inc.
Fidelity Management & Research (U.K.) Inc.
Fidelity Research & Analysis Company
Fidelity Investments Japan Limited
FIL Investment Advisors
FIL Investment Advisors (U.K.) Ltd.
Fidelity Management & Research (Hong Kong) Limited
Fidelity Management & Research (Japan) Inc.
General Distributor
Fidelity Distributors Corporation Boston, MA
Transfer and Service Agents
Fidelity Investments Institutional Operations Company, Inc. Boston, MA
To view a fund's proxy voting guidelines and proxy voting record for the 12-month period ended June 30, visit http://www.fidelity.com (search for "proxy voting guidelines") or visit the Securities and Exchange Commission's (SEC) web site at http://www.sec.gov. You may also call 1-877-208-0098 to request a free copy of the proxy voting guidelines.
Fidelity Variable Insurance Products are separate account options which are purchased through a variable insurance contract.
Standard & Poor's, S&P and S&P 500 are registered service marks of The McGraw-Hill Companies, Inc. and have been licensed for use by Fidelity Distributors Corporation.
Other third party marks appearing herein are the property of their respective owners.
All other marks appearing herein are registered or unregistered trademarks or service marks of FMR LLC or an affiliated company.
This report and the financial statements contained herein are submitted for the general information of the shareholders of the fund. This report is not authorized for distribution to prospective investors in the fund unless preceded or accompanied by an effective prospectus.
A fund files its complete schedule of portfolio holdings with the SEC for the first and third quarters of each fiscal year on Form N-Q. Forms N-Q are available on the SEC's web site at http://www.sec.gov. A fund's Forms N-Q may be reviewed and copied at the SEC's Public Reference Room in Washington, DC. Information regarding the operation of the SEC's Public Reference Room may be obtained by calling 1-800-SEC-0330. For a complete list of the fund's portfolio holdings, view the most recent holdings listing, semiannual report, or annual report on Fidelity's web site at http://www.fidelity.com or http://www.advisor.fidelity.com, as applicable.
NOT FDIC INSURED · MAY LOSE VALUE · NO BANK GUARANTEE
Neither the fund nor Fidelity Distributors Corporation is a bank.
Average annual total return reflects the change in the value of an investment, assuming reinvestment of the class' dividend income and capital gains (the profits earned upon the sale of securities that have grown in value, if any) and assuming a constant rate of performance each year. During periods of reimbursement by Fidelity, a fund's total return will be greater than it would be had the reimbursement not occurred. Performance numbers are net of all underlying fund operating expenses, but do not include any insurance charges imposed by your insurance company's separate account. If performance information included the effect of these additional charges, the total returns would have been lower. How a fund did yesterday is no guarantee of how it will do tomorrow.
Average Annual Total Returns
Periods ended December 31, 2008
Past 1 year
Past 5 years
Life of fundA
VIP Financial Services - Initial Class
-50.08%
-9.57%
-5.11%
VIP Financial Services - Investor Class B
-50.18%
-9.66%
-5.18%
AFrom July 18, 2001.
BThe initial offering of Investor Class shares took place on July 21, 2005. Returns prior to July 21, 2005 are those of Initial Class. If Investor Class's transfer agent fee had been reflected, returns prior to July 21, 2005 would have been lower.
$10,000 Over Life of Fund
Let's say hypothetically that $10,000 was invested in VIP Financial Services Portfolio - Initial Class on July 18, 2001, when the fund started. The chart shows how the value of your investment would have changed, and also shows how the Standard & Poor's 500SM Index (S&P 500®) performed over the same period.
Commentsfrom Benjamin Hesse, who became Co-Portfolio Manager of VIP Financial Services Portfolio on October 1, 2008, and will become sole manager on February 1, 2009
By year-end 2008, the vicious credit crisis sparked in the U.S. had spread like wildfire across the world's capital markets, stunting global growth, toppling commodity prices, changing the face of the global financial system, and chasing risk-averse investors toward the sidelines. The U.S. equity markets, as measured by the Dow Jones Industrial AverageSM and Standard & Poor's 500SM Index, fell hard as a result, declining 31.93% and 37.00%, respectively, while the technology-laden NASDAQ Composite® Index slid 40.03%. Foreign market stocks saw an even sharper decline, as illustrated by the 43.28% loss of the MSCI® EAFE® Index (Europe, Australasia, Far East), a gauge of developed stock markets outside the U.S. and Canada. A generally stronger U.S. dollar also held back returns for U.S. investors in foreign equities. Emerging-markets stocks - the global performance leader only a year ago - fell harder still, dropping 53.18%, as measured by the MSCI Emerging Markets Index. The only clear winners during the past year were assets backed by the U.S. government, as investors fled from risk. Thus, the Barclays Capital U.S. Treasury Bond Index climbed 13.74% for the year, while the Barclays Capital U.S. Aggregate Bond Index - a broader measure of the U.S. investment-grade bond universe - gained a more modest 5.24%. By contrast, high-yield bonds bore the brunt of investors' increasing wariness over risk, as expressed by the Merrill Lynch® U.S. High Yield Master II Constrained Index's drop of 26.11%. The emerging-markets bond category also felt the shock of investors' risk-averse sentiment, with the JPMorgan Emerging Markets Bond Index (EMBI) Global falling 10.91%. Meanwhile, the Citigroup® Non-U.S. Group of 7 Index - representing the debt performance of major global economies, excluding the United States - eked out a 1.69% gain.
During the past year, the fund fell just shy of the MSCI® US Investable Market Financials Index, which returned -49.11%, and lagged the S&P 500®. (For specific portfolio results, please refer to the performance section of this report.) Weakness in the housing market, credit losses and a lack of liquidity in the financial markets caused several major financial institutions to collapse or agree to either an acquisition or government bailout. Stock selection detracted from performance relative to the MSCI index, with especially weak results from thrifts and mortgage finance, retail real estate investment trusts (REITs) and multi-line insurance. Detractors included mortgage giant Fannie Mae, which was taken into government conservatorship, and retail REIT General Growth Properties, which suffered from the downturn in commercial real estate and retailing. Both stocks were no longer held at period end. AMBAC Financial Group, a bond insurer, also fell sharply because it did not have adequate capital to cover its losses. Conversely, security selection among diversified banks and property/casualty insurers aided relative performance, as did an overweighting in the reinsurance industry, which held up better than the broader sector. Winners included Fidelity National Financial, a title insurer that rallied as mortgage rates fell and refinancing activity picked up. Timely ownership of Wachovia, a diversified bank that became a takeover target, also helped results, as did a small cash position.
The views expressed above reflect those of the portfolio manager(s) only through the end of the period as stated on the cover of this report and do not necessarily represent the views of Fidelity or any other person in the Fidelity organization. Any such views are subject to change at any time based upon market or other conditions and Fidelity disclaims any responsibility to update such views. These views may not be relied on as investment advice and, because investment decisions for a Fidelity fund are based on numerous factors, may not be relied on as an indication of trading intent on behalf of any Fidelity fund.
As a shareholder of the Fund, you incur two types of costs: (1) transaction costs, including redemption fees, and (2) ongoing costs, including management fees and other Fund expenses. This Example is intended to help you understand your ongoing costs (in dollars) of investing in the Fund and to compare these costs with the ongoing costs of investing in other mutual funds.
The Example is based on an investment of $1,000 invested at the beginning of the period and held for the entire period (July 1, 2008 to December 31, 2008).
Actual Expenses
The first line of the accompanying table for each class of the Fund provides information about actual account values and actual expenses. You may use the information in this line, together with the amount you invested, to estimate the expenses that you paid over the period. Simply divide your account value by $1,000.00 (for example, an $8,600 account value divided by $1,000.00 = 8.6), then multiply the result by the number in the first line for a class of the Fund under the heading entitled "Expenses Paid During Period" to estimate the expenses you paid on your account during this period. The estimate of expenses does not include any fees or other expenses of any variable annuity or variable life insurance product. If they were, the estimate of expenses you paid during the period would be higher, and your ending account value would be lower. In addition, the Fund, as a shareholder in the underlying Fidelity Central Funds, will indirectly bear its pro rata share of the fees and expenses incurred by the underlying Fidelity Central Funds. These fees and expenses are not included in the Fund's annualized expense ratio used to calculate the expense estimate in the table below.
Hypothetical Example for Comparison Purposes
The second line of the accompanying table for each class of the Fund provides information about hypothetical account values and hypothetical expenses based on a Class' actual expense ratio and an assumed rate of return of 5% per year before expenses, which is not the Class' actual return. The hypothetical account values and expenses may not be used to estimate the actual ending account balance or expenses you paid for the period. You may use this information to compare the ongoing costs of investing in the Fund and other funds. To do so, compare this 5% hypothetical example with the 5% hypothetical examples that appear in the shareholder reports of the other funds. The estimate of expenses does not include any fees or other expenses of any variable annuity or variable life insurance product. If they were, the estimate of expenses you paid during the period would be higher, and your ending account value would be lower. In addition, the Fund, as a shareholder in the underlying Fidelity Central Funds, will indirectly bear its pro rata share of the fees and expenses incurred by the underlying Fidelity Central Funds. These fees and expenses are not included in the Fund's annualized expense ratio used to calculate the expense estimate in the table below.
Please note that the expenses shown in the table are meant to highlight your ongoing costs only and do not reflect any transaction costs. Therefore, the second line of the table is useful in comparing ongoing costs only, and will not help you determine the relative total costs of owning different funds. In addition, if these transactional costs were included, your costs would have been higher.
Annualized Expense Ratio
Beginning Account Value July 1, 2008
Ending Account Value December 31, 2008
Expenses Paid During Period* July 1, 2008 to December 31, 2008
Initial Class
.88%
Actual
$ 1,000.00
$ 693.10
$ 3.75
HypotheticalA
$ 1,000.00
$ 1,020.71
$ 4.47
Investor Class
.97%
Actual
$ 1,000.00
$ 692.50
$ 4.13
HypotheticalA
$ 1,000.00
$ 1,020.26
$ 4.93
A 5% return per year before expenses
* Expenses are equal to each Class' annualized expense ratio, multiplied by the average account value over the period, multiplied by 184/366 (to reflect the one-half year period).
Annual Report
Investment Changes (Unaudited)
Top Ten Stocks as of December 31, 2008
% of fund's net assets
% of fund's net assets 6 months ago
Fidelity National Financial, Inc. Class A
5.3
0.0
Wells Fargo & Co.
4.4
4.6
Goldman Sachs Group, Inc.
3.9
2.3
Citigroup, Inc.
3.6
3.0
Morgan Stanley
3.4
1.3
Everest Re Group Ltd.
3.2
2.4
Bank of America Corp.
3.0
3.9
CyberSource Corp.
3.0
0.0
EPIQ Systems, Inc.
2.8
0.0
JPMorgan Chase & Co.
2.7
4.6
35.3
Top Industries (% of fund's net assets)
As of December 31, 2008
Insurance
25.3%
Capital Markets
23.2%
Commercial Banks
12.3%
Diversified Financial Services
10.9%
IT Services
4.8%
All Others*
23.5%
As of June 30, 2008
Insurance
28.4%
Capital Markets
18.3%
Diversified Financial Services
15.2%
Commercial Banks
14.3%
Real Estate Investment Trusts
7.2%
All Others*
16.6%
* Includes short-term investments and net other assets.
Prior period industry classifications reflect the categories in place as of the date indicated and have not been adjusted to reflect current industry classifications.
Annual Report
Investments December 31, 2008
Showing Percentage of Net Assets
Common Stocks - 90.9%
Shares
Value
AUTOMOBILES - 0.9%
Automobile Manufacturers - 0.9%
Ford Motor Co. (a)(d)
121,100
$ 277,319
CAPITAL MARKETS - 23.2%
Asset Management & Custody Banks - 9.5%
Bank of New York Mellon Corp.
16,100
456,113
Bank Sarasin & Co. Ltd. Series B (Reg.)
2,519
75,072
EFG International
11,607
206,941
Fortress Investment Group LLC
4,400
4,400
Franklin Resources, Inc.
5,000
318,900
GLG Partners, Inc.
5,600
12,712
Janus Capital Group, Inc.
12,200
97,966
Julius Baer Holding Ltd.
12,261
474,112
KKR Private Equity Investors, LP (a)
3,400
11,900
KKR Private Equity Investors, LP Restricted Depositary Units (a)(e)
2,200
7,700
Legg Mason, Inc. (d)
26,564
582,017
State Street Corp.
10,367
407,734
T. Rowe Price Group, Inc.
3,300
116,952
The Blackstone Group LP
4,100
26,773
2,799,292
Diversified Capital Markets - 2.4%
UBS AG (NY Shares)
48,800
697,840
Investment Banking & Brokerage - 11.3%
Charles Schwab Corp.
13,400
216,678
Evercore Partners, Inc. Class A
14,400
179,856
GFI Group, Inc.
154,119
545,581
Goldman Sachs Group, Inc.
13,600
1,147,704
Lazard Ltd. Class A
2,000
59,480
Merrill Lynch & Co., Inc.
16,200
188,568
Morgan Stanley (d)
62,500
1,002,500
3,340,367
TOTAL CAPITAL MARKETS
6,837,499
COMMERCIAL BANKS - 12.0%
Diversified Banks - 6.4%
Banco Latin Americano de Exporaciones SA (BLADEX) Series E
2,600
37,336
ICICI Bank Ltd. sponsored ADR
1,100
21,175
U.S. Bancorp, Delaware (d)
13,800
345,138
Wachovia Corp.
32,097
177,817
Wells Fargo & Co.
43,800
1,291,224
1,872,690
Regional Banks - 5.6%
Associated Banc-Corp.
13,700
286,741
Boston Private Financial Holdings, Inc.
11,000
75,240
Cathay General Bancorp
5,430
128,963
Center Financial Corp., California
1,400
8,638
Huntington Bancshares, Inc.
13,400
102,644
KeyCorp
16,300
138,876
M&T Bank Corp. (d)
3,200
183,712
Shares
Value
National City Corp.
104,900
$ 189,869
PNC Financial Services Group, Inc.
7,100
347,900
UCBH Holdings, Inc.
2,300
15,824
Wintrust Financial Corp.
6,809
140,061
Zions Bancorp
1,900
46,569
1,665,037
TOTAL COMMERCIAL BANKS
3,537,727
CONSUMER FINANCE - 3.5%
Consumer Finance - 3.5%
American Express Co.
8,940
165,837
Capital One Financial Corp.
7,300
232,797
Discover Financial Services
10,355
98,683
Dollar Financial Corp. (a)
7,110
73,233
Promise Co. Ltd.
7,350
186,278
SLM Corp. (a)
29,200
259,880
1,016,708
DIVERSIFIED FINANCIAL SERVICES - 10.9%
Other Diversifed Financial Services - 9.3%
Bank of America Corp.
62,343
877,789
Citigroup, Inc.
158,075
1,060,683
JPMorgan Chase & Co.
25,038
789,448
2,727,920
Specialized Finance - 1.6%
CIT Group, Inc. (d)
28,800
130,752
CME Group, Inc.
987
205,405
Deutsche Boerse AG
1,500
110,150
JSE Ltd.
6,000
23,419
KKR Financial Holdings LLC
10,100
15,958
485,684
TOTAL DIVERSIFIED FINANCIAL SERVICES
3,213,604
INSURANCE - 25.3%
Insurance Brokers - 0.2%
National Financial Partners Corp.
5,700
17,328
Willis Group Holdings Ltd.
1,900
47,272
64,600
Life & Health Insurance - 4.1%
AFLAC, Inc.
6,700
307,128
MetLife, Inc.
18,110
631,315
Prudential Financial, Inc.
9,000
272,340
1,210,783
Multi-Line Insurance - 0.4%
American International Group, Inc.
4,200
6,594
Assurant, Inc.
2,200
66,000
Hartford Financial Services Group, Inc.
3,460
56,813
129,407
Property & Casualty Insurance - 13.5%
ACE Ltd.
13,558
717,489
AMBAC Financial Group, Inc.
36,700
47,710
Common Stocks - continued
Shares
Value
INSURANCE - CONTINUED
Property & Casualty Insurance - continued
Argo Group International Holdings, Ltd. (a)
5,344
$ 181,268
Axis Capital Holdings Ltd.
2,500
72,800
Berkshire Hathaway, Inc. Class A (a)
3
289,800
Fidelity National Financial, Inc. Class A
88,300
1,567,328
LandAmerica Financial Group, Inc.
1,200
108
MBIA, Inc.
3,800
15,466
The First American Corp.
23,800
687,582
The Travelers Companies, Inc.
6,900
311,880
United America Indemnity Ltd. Class A (a)
3,800
48,678
XL Capital Ltd. Class A
9,100
33,670
3,973,779
Reinsurance - 7.1%
Everest Re Group Ltd.
12,487
950,760
IPC Holdings Ltd.
6,000
179,400
Max Capital Group Ltd.
9,299
164,592
Montpelier Re Holdings Ltd.
1,600
26,864
Platinum Underwriters Holdings Ltd.
8,900
321,112
RenaissanceRe Holdings Ltd.
5,000
257,800
Validus Holdings Ltd.
6,700
175,272
2,075,800
TOTAL INSURANCE
7,454,369
INTERNET SOFTWARE & SERVICES - 0.9%
Internet Software & Services - 0.9%
China Finance Online Co. Ltd. ADR (a)(d)
39,577
278,622
IT SERVICES - 4.8%
Data Processing & Outsourced Services - 4.8%
CyberSource Corp. (a)
73,098
876,445
MasterCard, Inc. Class A
1,400
200,102
Visa, Inc.
6,600
346,170
1,422,717
PROFESSIONAL SERVICES - 1.6%
Research & Consulting Services - 1.6%
First Advantage Corp. Class A (a)
32,529
460,285
REAL ESTATE INVESTMENT TRUSTS - 3.0%
Mortgage REITs - 1.1%
Annaly Capital Management, Inc.
19,400
307,878
Chimera Investment Corp.
3,900
13,455
321,333
Shares
Value
Residential REITs - 1.2%
Equity Lifestyle Properties, Inc.
5,800
$ 222,488
UDR, Inc.
9,600
132,384
354,872
Retail REITs - 0.7%
CBL & Associates Properties, Inc.
2,300
14,950
Developers Diversified Realty Corp.
6,000
29,280
Simon Property Group, Inc.
2,900
154,077
198,307
TOTAL REAL ESTATE INVESTMENT TRUSTS
874,512
REAL ESTATE MANAGEMENT & DEVELOPMENT - 0.7%
Diversified Real Estate Activities - 0.7%
Meruelo Maddux Properties, Inc. (a)
7,400
9,176
Mitsubishi Estate Co. Ltd.
11,000
181,558
190,734
SOFTWARE - 2.8%
Application Software - 2.8%
EPIQ Systems, Inc. (a)
48,631
812,624
SPECIALTY RETAIL - 0.1%
Home Improvement Retail - 0.1%
Home Depot, Inc.
1,560
35,911
THRIFTS & MORTGAGE FINANCE - 1.2%
Thrifts & Mortgage Finance - 1.2%
FirstFed Financial Corp. (a)(d)
3,000
5,250
Hudson City Bancorp, Inc.
17,279
275,773
IndyMac Bancorp, Inc.
4,600
667
Radian Group, Inc.
18,100
66,608
Washington Mutual, Inc.
16,757
360
348,658
TOTAL COMMON STOCKS
(Cost $36,539,719)
26,761,289
Convertible Preferred Stocks - 0.3%
COMMERCIAL BANKS - 0.3%
Regional Banks - 0.3%
Huntington Bancshares, Inc. 8.50%
100
77,900
DIVERSIFIED FINANCIAL SERVICES - 0.0%
Specialized Finance - 0.0%
CIT Group, Inc. Series C, 8.75%
300
8,019
INSURANCE - 0.0%
Multi-Line Insurance - 0.0%
American International Group, Inc. Series A, 8.50%
600
5,009
Convertible Preferred Stocks - continued
Shares
Value
THRIFTS & MORTGAGE FINANCE - 0.0%
Thrifts & Mortgage Finance - 0.0%
Fannie Mae 8.75%
7,300
$ 8,541
TOTAL CONVERTIBLE PREFERRED STOCKS
(Cost $255,810)
99,469
Money Market Funds - 17.0%
Fidelity Cash Central Fund, 1.06% (b)
2,591,232
2,591,232
Fidelity Securities Lending Cash Central Fund, 0.87% (b)(c)
2,413,650
2,413,650
TOTAL MONEY MARKET FUNDS
(Cost $5,004,882)
5,004,882
TOTAL INVESTMENT PORTFOLIO - 108.2%
(Cost $41,800,411)
31,865,640
NET OTHER ASSETS - (8.2)%
(2,418,521)
NET ASSETS - 100%
29,447,119
Legend
(a) Non-income producing
(b) Affiliated fund that is available only to investment companies and other accounts managed by Fidelity Investments. The rate quoted is the annualized seven-day yield of the fund at period end. A complete unaudited listing of the fund's holdings as of its most recent quarter end is available upon request.
(c) Investment made with cash collateral received from securities on loan.
(d) Security or a portion of the security is on loan at period end.
(e) Security exempt from registration under Rule 144A of the Securities Act of 1933. These securities may be resold in transactions exempt from registration, normally to qualified institutional buyers. At the end of the period, the value of these securities amounted to $7,700 or 0.0% of net assets.
Affiliated Central Funds
Information regarding fiscal year to date income earned by the Fund from investments in Fidelity Central Funds is as follows:
Fund
Income earned
Fidelity Cash Central Fund
$ 62,094
Fidelity Securities Lending Cash Central Fund
39,455
Total
$ 101,549
Other Information
The following is a summary of the inputs used, as of December 31, 2008, involving the Fund's assets carried at value. The inputs or methodology used for valuing securities may not be an indication of the risk associated with investing in those securities. For more information on valuation inputs, and their aggregation into the levels used in the table below, please refer to the Security Valuation section in the accompanying Notes to Financial Statements.
Valuation Inputs at Reporting Date:
Description
Total
Level 1
Level 2
Level 3
Investments in Securities
$ 31,865,640
$ 30,586,541
$ 1,279,099
$ -
Distribution of investments by country of issue, as a percentage of total net assets, is as follows: (Unaudited)
United States of America
81.3%
Bermuda
8.3%
Switzerland
7.4%
Japan
1.2%
Others (individually less than 1%)
1.8%
100.0%
Income Tax Information
At December 31, 2008, the fund had a capital loss carryforward of approximately $5,802,731 all of which will expire on December 31, 2016.
The fund intends to elect to defer to its fiscal year ending December 31, 2009 approximately $6,383,470 of losses recognized during the period November 1, 2008 to December 31, 2008.
See accompanying notes which are an integral part of the financial statements.
Investment in securities, at value (including securities loaned of $2,424,210) - See accompanying schedule:
Unaffiliated issuers (cost $36,795,529)
$ 26,860,758
Fidelity Central Funds (cost $5,004,882)
5,004,882
Total Investments (cost $41,800,411)
$ 31,865,640
Cash
21,405
Receivable for investments sold
34,597
Receivable for fund shares sold
5,888
Dividends receivable
56,233
Distributions receivable from Fidelity Central Funds
7,412
Prepaid expenses
425
Other receivables
752
Total assets
31,992,352
Liabilities
Payable for investments purchased
$ 72,645
Payable for fund shares redeemed
4,279
Accrued management fee
13,067
Other affiliated payables
3,207
Other payables and accrued expenses
38,385
Collateral on securities loaned, at value
2,413,650
Total liabilities
2,545,233
Net Assets
$ 29,447,119
Net Assets consist of:
Paid in capital
$ 52,970,180
Undistributed net investment income
78,528
Accumulated undistributed net realized gain (loss) on investments and foreign currency transactions
(13,666,735)
Net unrealized appreciation (depreciation) on investments and assets and liabilities in foreign currencies
(9,934,854)
Net Assets
$ 29,447,119
Statement of Assets and Liabilities - continued
December 31, 2008
Initial Class: Net Asset Value, offering price and redemption price per share ($17,435,584 ÷ 3,342,813 shares)
$ 5.22
Investor Class: Net Asset Value, offering price and redemption price per share ($12,011,535 ÷ 2,309,086 shares)
$ 5.20
See accompanying notes which are an integral part of the financial statements.
Annual Report
Statement of Operations
Year ended December 31, 2008
Investment Income
Dividends
$ 1,096,262
Interest
1,914
Income from Fidelity Central Funds
101,549
Total income
1,199,725
Expenses
Management fee
$ 192,822
Transfer agent fees
42,869
Accounting and security lending fees
14,059
Custodian fees and expenses
11,414
Independent trustees' compensation
165
Audit
37,480
Legal
588
Miscellaneous
3,023
Total expenses before reductions
302,420
Expense reductions
(783)
301,637
Net investment income (loss)
898,088
Realized and Unrealized Gain (Loss)
Net realized gain (loss) on:
Investment securities:
Unaffiliated issuers
(13,299,193)
Investment not meeting investment restrictions
(2,546)
Foreign currency transactions
396
Payment from investment advisor for loss on investment not meeting investment restrictions
2,744
Total net realized gain (loss)
(13,298,599)
Change in net unrealized appreciation (depreciation) on:
Investment securities
(12,685,050)
Assets and liabilities in foreign currencies
(88)
Total change in net unrealized appreciation (depreciation)
(12,685,138)
Net gain (loss)
(25,983,737)
Net increase (decrease) in net assets resulting from operations
$ (25,085,649)
Statement of Changes in Net Assets
Year ended December 31, 2008
Year ended December 31, 2007
Increase (Decrease) in Net Assets
Operations
Net investment income (loss)
$ 898,088
$ 633,412
Net realized gain (loss)
(13,298,599)
2,287,719
Change in net unrealized appreciation (depreciation)
(12,685,138)
(7,585,697)
Net increase (decrease) in net assets resulting from operations
(25,085,649)
(4,664,566)
Distributions to shareholders from net investment income
(802,048)
(1,168,511)
Distributions to shareholders from net realized gain
(2,471,464)
(3,386,321)
Total distributions
(3,273,512)
(4,554,832)
Share transactions - net increase (decrease)
23,585,553
(14,452,083)
Redemption fees
59,484
22,111
Total increase (decrease) in net assets
(4,714,124)
(23,649,370)
Net Assets
Beginning of period
34,161,243
57,810,613
End of period (including undistributed net investment income of $78,528 and distributions in excess of net investment income of $29,976, respectively)
$ 29,447,119
$ 34,161,243
See accompanying notes which are an integral part of the financial statements.
Annual Report
Financial Highlights - Initial Class
Years ended December 31,
2008
2007
2006
2005
2004
Selected Per-Share Data
Net asset value, beginning of period
$ 11.57
$ 14.60
$ 12.98
$ 12.19
$ 10.91
Income from Investment Operations
Net investment income (loss) C
.21
.20
.18
.16
.12
Net realized and unrealized gain (loss)
(5.68)
(2.02)
1.86
.77
1.15
Total from investment operations
(5.47)
(1.82)
2.04
.93
1.27
Distributions from net investment income
(.15)
(.36)
(.16)
(.14)
-
Distributions from net realized gain
(.74)
(.86)
(.27)
-
-
Total distributions
(.89)
(1.22)
(.43)
(.14)
-
Redemption fees added to paid in capital C
.01
.01
.01
- G
.01
Net asset value, end of period
$ 5.22
$ 11.57
$ 14.60
$ 12.98
$ 12.19
Total Return A, B
(50.08)%
(13.43)%
16.29%
7.71%
11.73%
Ratios to Average Net AssetsD, F
Expenses before reductions
.84%
.87%
.86%
.86%
.85%
Expenses net of fee waivers, if any
.84%
.87%
.86%
.86%
.85%
Expenses net of all reductions
.84%
.87%
.85%
.85%
.83%
Net investment income (loss)
2.64%
1.48%
1.36%
1.31%
1.10%
Supplemental Data
Net assets, end of period (000 omitted)
$ 17,436
$ 23,631
$ 44,781
$ 32,776
$ 41,595
Portfolio turnover rate E
100%
48%
68%
59%
98%
A Total returns do not reflect charges attributable to your insurance company's separate account. Inclusion of these charges would reduce the total returns shown.
B Total returns would have been lower had certain expenses not been reduced during the periods shown.
C Calculated based on average shares outstanding during the period.
D Fees and expenses of the underlying Fidelity Central Funds are not included in the Fund's expense ratio. The Fund indirectly bears its proportionate share of the expenses of any underlying Fidelity Central Funds.
E Amount does not include the portfolio activity of any underlying Fidelity Central Funds.
F Expense ratios reflect operating expenses of the class. Expenses before reductions do not reflect amounts reimbursed by the investment adviser or reductions from brokerage service arrangements or other expense offset arrangements and do not represent the amount paid by the class during periods when reimbursements or reductions occur. Expenses net of fee waivers reflect expenses after reimbursement by the investment adviser but prior to reductions from brokerage service arrangements or other expense offset arrangements. Expenses net of all reductions represent the net expenses paid by the class.
B Total returns for periods of less than one year are not annualized.
C Total returns do not reflect charges attributable to your insurance company's separate account. Inclusion of these charges would reduce the total returns shown.
D Total returns would have been lower had certain expenses not been reduced during the periods shown.
E Calculated based on average shares outstanding during the period.
F Fees and expenses of the underlying Fidelity Central Funds are not included in the Fund's expense ratio. The Fund indirectly bears its proportionate share of the expenses of any underlying Fidelity Central Funds.
G Amount does not include the portfolio activity of any underlying Fidelity Central Funds.
H For the period July 21, 2005 (commencement of sale of shares) to December 31, 2005.
I Expense ratios reflect operating expenses of the class. Expenses before reductions do not reflect amounts reimbursed by the investment adviser or reductions from brokerage service arrangements or other expense offset arrangements and do not represent the amount paid by the class during periods when reimbursements or reductions occur. Expense ratios before reductions for start-up periods may not be representative of longer-term operating periods. Expenses net of fee waivers reflect expenses after reimbursement by the investment adviser but prior to reductions from brokerage service arrangements or other expense offset arrangements. Expenses net of all reductions represent the net expenses paid by the class.
VIP Financial Services Portfolio (the Fund) is a fund of Variable Insurance Products Fund IV (the trust) and is authorized to issue an unlimited number of shares. The trust is registered under the Investment Company Act of 1940, as amended (the 1940 Act), as an open-end management investment company organized as a Massachusetts business trust. Shares of the Fund may only be purchased by insurance companies for the purpose of funding variable annuity or variable life insurance contracts. The Fund offers the following classes of shares: Initial Class shares and Investor Class shares. All classes have equal rights and voting privileges, except for matters affecting a single class. Investment income, realized and unrealized capital gains and losses, the common expenses of the Fund, and certain fund-level expense reductions, if any, are allocated on a pro rata basis to each class based on the relative net assets of each class to the total net assets of the Fund. Each class differs with respect to transfer agent fees incurred. Certain expense reductions also differ by class. The Fund's investments in emerging markets can be subject to social, economic, regulatory and political uncertainties and can be extremely volatile.
2. Investments in Fidelity Central Funds.
The Fund may invest in Fidelity Central Funds, which are open-end investment companies available only to other investment companies and accounts managed by Fidelity Management & Research Company (FMR) and its affiliates. The Fund's Schedule of Investments lists each of the Fidelity Central Funds held as of period end, if any, as an investment of the Fund, but does not include the underlying holdings of each Fidelity Central Fund. As an Investing Fund, the Fund indirectly bears its proportionate share of the expenses of the underlying Fidelity Central Funds.
The Money Market Central Funds seek preservation of capital and current income and are managed by Fidelity Investments Money Management, Inc. (FIMM), an affiliate of FMR.
A complete unaudited list of holdings for each Fidelity Central Fund is available upon request or at the SEC's web site at www.sec.gov. In addition, the financial statements of the Fidelity Central Funds, which are not covered by the Fund's Report of Independent Registered Public Accounting Firm, are available on the SEC's web site or upon request.
3. Significant Accounting Policies.
The financial statements have been prepared in conformity with accounting principles generally accepted in the United States of America, which require management to make certain estimates and assumptions at the date of the financial statements. Actual results could differ from those estimates. The following summarizes the significant accounting policies of the Fund:
Security Valuation. Investments are valued as of 4:00 p.m. Eastern time on the last calendar day of the period. Wherever possible, the Fund uses independent pricing services approved by the Board of Trustees to value its investments.
Equity securities, including restricted securities, for which market quotations are readily available, are valued at the last reported sale price or official closing price as reported by an independent pricing service on the primary market or exchange on which they are traded. In the event there were no sales during the day or closing prices are not available, securities are valued at the last quoted bid price. Investments in open-end mutual funds, including the Fidelity Central Funds, are valued at their closing net asset value each business day. Short-term securities with remaining maturities of sixty days or less for which quotations are not readily available are valued at amortized cost, which approximates value.
When current market prices or quotations are not readily available or reliable, valuations may be determined in good faith in accordance with procedures adopted by the Board of Trustees. Factors used in determining value may include significant market or security specific events, changes in interest rates and credit quality, and developments in foreign markets which are monitored by evaluating the performance of ADRs, futures contracts and exchange-traded funds. The frequency with which these procedures are used cannot be predicted and may be utilized to a significant extent. The value of securities used for net asset value (NAV) calculation under these procedures may differ from published prices for the same securities.
The Fund is subject to the provisions of Statement of Financial Accounting Standards No. 157, "Fair Value Measurements" (SFAS 157), effective with the beginning of the Fund's fiscal year. SFAS 157 establishes a hierarchy that prioritizes the inputs to valuation techniques giving the highest priority to
Annual Report
3. Significant Accounting Policies - continued
Security Valuation - continued
readily available unadjusted quoted prices in active markets for identical assets (level 1 measurements) and the lowest priority to unobservable inputs (level 3 measurements) when market prices are not readily available or reliable. The three levels of the hierarchy under SFAS 157 are described below:
Level 1
Quoted prices in active markets for identical securities.
Level 2
Prices determined using other significant observable inputs. Observable inputs are inputs that other market participants may use in pricing a security. These may include quoted prices for similar securities, interest rates, prepayment speeds, credit risk and others.
Level 3
Prices determined using significant unobservable inputs. In situations where quoted prices or observable inputs are unavailable or deemed less relevant (for example, when there is little or no market activity for an investment at the end of the period), unobservable inputs may be used. Unobservable inputs reflect the Fund's own assumptions about the factors market participants would use in pricing an investment, and would be based on the best information available.
Changes in valuation techniques may result in transfers in or out of an investment's assigned level within the hierarchy.
The aggregate value by input level, as of December 31, 2008, for the Fund's investments is included at the end of the Fund's Schedule of Investments.
Foreign Currency. The Fund uses foreign currency contracts to facilitate transactions in foreign-denominated securities. Losses from these transactions may arise from changes in the value of the foreign currency or if the counterparties do not perform under the contracts' terms.
Foreign-denominated assets, including investment securities, and liabilities are translated into U.S. dollars at the exchange rate at period end. Purchases and sales of investment securities, income and dividends received and expenses denominated in foreign currencies are translated into U.S. dollars at the exchange rate in effect on the transaction date.
The effects of exchange rate fluctuations on investments are included with the net realized and unrealized gain (loss) on investment securities. Other foreign currency transactions resulting in realized and unrealized gain (loss) are disclosed separately.
Investment Transactions and Income. For financial reporting purposes, the Fund's investment holdings and NAV include trades executed through the end of the last business day of the period. The NAV per share for processing shareholder transactions is calculated as of the close of business of the New York Stock Exchange (NYSE), normally 4:00 p.m. Eastern time and includes trades executed through the end of the prior business day. Gains and losses on securities sold are determined on the basis of identified cost and may include proceeds received from litigation. Dividend income is recorded on the ex-dividend date, except for certain dividends from foreign securities where the ex-dividend date may have passed, which are recorded as soon as the Fund is informed of the ex-dividend date. Non-cash dividends included in dividend income, if any, are recorded at the fair market value of the securities received. Distributions received on securities that represent a return of capital or capital gain are recorded as a reduction of cost of investments and/or as a realized gain. The Fund estimates the components of distributions received that may be considered return of capital distributions or capital gain distributions. Interest income and distributions from the Fidelity Central Funds are accrued as earned. Interest income includes coupon interest and amortization of premium and accretion of discount on debt securities. Investment income is recorded net of foreign taxes withheld where recovery of such taxes is uncertain.
Expenses. Most expenses of the trust can be directly attributed to a fund. Expenses which cannot be directly attributed are apportioned among each Fund in the trust. Expense estimates are accrued in the period to which they relate and adjustments are made when actual amounts are known.
Income Tax Information and Distributions to Shareholders. Each year, the Fund intends to qualify as a regulated investment company by distributing substantially all of its taxable income and realized gains under Subchapter M of the Internal Revenue Code and filing its U.S. federal tax return. As a result, no provision for income taxes is required. The Fund is subject to the provisions of FASB Interpretation No. 48, Accounting for Uncertainties in Income Taxes (FIN 48). FIN 48 sets forth a minimum threshold for financial statement recognition of the benefit of a tax position taken or expected to be taken in a tax return. There are no unrecognized tax benefits in the accompanying financial statements. A Fund's federal tax return is subject to examination by the Internal Revenue Service (IRS) for a period of three years. Foreign taxes are provided for based on the Fund's understanding of the tax rules and rates that exist in the foreign markets in which it invests.
Distributions are recorded on the ex-dividend date. Income dividends and capital gain distributions are declared separately for each class. Income and capital gain distributions are determined in accordance with income tax regulations, which may differ from generally accepted accounting principles.
Capital accounts within the financial statements are adjusted for permanent book-tax differences. These adjustments have no impact on net assets or the results of operations. Temporary book-tax differences will reverse in a subsequent period.
Annual Report
Notes to Financial Statements - continued
3. Significant Accounting Policies - continued
Income Tax Information and Distributions to Shareholders - continued
Book-tax differences are primarily due to foreign currency transactions, passive foreign investment companies (PFIC), partnerships, capital loss carryforwards and losses deferred due to wash sales and excise tax regulations.
The tax-basis components of distributable earnings and the federal tax cost as of period end were as follows:
Unrealized appreciation
$ 2,595,592
Unrealized depreciation
(14,010,980)
Net unrealized appreciation (depreciation)
(11,415,388)
Undistributed ordinary income
78,528
Capital loss carryforward
(5,802,731)
Cost for federal income tax purposes
$ 43,281,028
The tax character of distributions paid was as follows:
December 31, 2008
December 31, 2007
Ordinary Income
$ 1,436,613
$ 1,630,820
Long-term Capital Gains
1,836,899
2,924,012
Total
$ 3,273,512
$ 4,554,832
Trading (Redemption) Fees. Shares held less than 60 days are subject to a redemption fee equal to 1% of the proceeds of the redeemed shares. All redemption fees, including any estimated redemption fees paid by FMR, are retained by the Fund and accounted for as an addition to paid in capital.
4. Operating Policies.
Repurchase Agreements. FMR has received an Exemptive Order from the Securities and Exchange Commission (the SEC) which permits the Fund and other affiliated entities of FMR to transfer uninvested cash balances into joint trading accounts which are then invested in repurchase agreements. The Fund may also invest directly with institutions in repurchase agreements. Repurchase agreements are collateralized by government or non-government securities. Upon settlement date, collateral is held in segregated accounts with custodian banks and may be obtained in the event of a default of the counterparty. The Fund monitors, on a daily basis, the value of the collateral to ensure it is at least equal to the principal amount of the repurchase agreement (including accrued interest). In the event of a default by the counterparty, realization of the collateral proceeds could be delayed, during which time the value of the collateral may decline.
Restricted Securities. The Fund may invest in securities that are subject to legal or contractual restrictions on resale. These securities generally may be resold in transactions exempt from registration or to the public if the securities are registered. Disposal of these securities may involve time-consuming negotiations and expense, and prompt sale at an acceptable price may be difficult. Information regarding restricted securities is included at the end of the Fund's Schedule of Investments.
5. Purchases and Sales of Investments.
Purchases and sales of securities, other than short-term securities, aggregated $53,468,120 and $32,873,074, respectively.
The Fund realized a gain and loss of $198 and $2,744 respectively, on sales of investments which did not meet the investment restrictions of the Fund. The loss of $2,744 was fully reimbursed by the Fund's investment advisor.
6. Fees and Other Transactions with Affiliates.
Management Fee. FMR and its affiliates provide the Fund with investment management related services for which the Fund pays a monthly management fee. The management fee is the sum of an individual fund fee rate that is based on an annual rate of .30% of the Fund's average net assets and a group fee rate that averaged .26% during the period. The group fee rate is based upon the average net assets of all the mutual funds advised by FMR. The group fee rate decreases as assets under management increase and increases as assets under management decrease. For the period, the total annual management fee rate was .56% of the Fund's average net assets.
Transfer Agent Fees. Fidelity Investments Institutional Operations Company, Inc. (FIIOC), an affiliate of FMR, is the Fund's transfer, dividend disbursing, and shareholder servicing agent. FIIOC receives an asset-based fee with respect to each class. Each class (with the exception of Investor Class) pays a transfer agent fee, excluding out of pocket expenses, equal to an annual rate of .07% of average net assets. Investor Class pays a monthly
Annual Report
6. Fees and Other Transactions with Affiliates - continued
Transfer Agent Fees - continued
asset-based transfer agent fee of .15% of average net assets. Prior to February 1, 2008, Investor Class paid a monthly asset-based transfer agent fee of .18% of average net assets. The total transfer agent fees paid by each class to FIIOC, including out of pocket expenses, were as follows:
Initial Class
$ 19,224
Investor Class
23,645
$ 42,869
Accounting and Security Lending Fees. Fidelity Service Company, Inc. (FSC), an affiliate of FMR, maintains the Fund's accounting records. The accounting fee is based on the level of average net assets for the month. Under a separate contract, FSC administers the security lending program. The security lending fee is based on the number and duration of lending transactions.
Brokerage Commissions. The Fund placed a portion of its portfolio transactions with brokerage firms which are affiliates of the investment adviser. The commissions paid to these affiliated firms were $7,819 for the period.
7. Committed Line of Credit.
The Fund participates with other funds managed by FMR in a $4.2 billion credit facility (the "line of credit") to be utilized for temporary or emergency purposes to fund shareholder redemptions or for other short-term liquidity purposes. The Fund has agreed to pay commitment fees on its pro rata portion of the line of credit, which amounted to $69 and is reflected in Miscellaneous Expense on the Statement of Operations. During the period, there were no borrowings on this line of credit.
8. Security Lending.
The Fund lends portfolio securities from time to time in order to earn additional income. On the settlement date of the loan, the Fund receives collateral (in the form of U.S. Treasury obligations, letters of credit and/or cash) against the loaned securities and maintains collateral in an amount not less than 100% of the market value of the loaned securities during the period of the loan. The market value of the loaned securities is determined at the close of business of the Fund and any additional required collateral is delivered to the Fund on the next business day. If the borrower defaults on its obligation to return the securities loaned because of insolvency or other reasons, a fund could experience delays and costs in recovering the securities loaned or in gaining access to the collateral. Any cash collateral received is invested in the Fidelity Securities Lending Cash Central Fund. The value of loaned securities and cash collateral at period end are disclosed on the Fund's Statement of Assets and Liabilities. Security lending income represents the income earned on investing cash collateral, less fees and expenses associated with the loan, plus any premium payments that may be received on the loan of certain types of securities. Security lending income is presented in the Statement of Operations as a component of income from Fidelity Central Funds. Net income from lending portfolio securities during the period amounted to $39,455.
9. Expense Reductions.
Many of the brokers with whom FMR places trades on behalf of the Fund provided services to the Fund in addition to trade execution. These services included payments of certain expenses on behalf of the Fund totaling $682 for the period. In addition, through arrangements with the Fund's custodian, credits realized as a result of uninvested cash balances were used to reduce the Fund's expenses. During the period, these credits reduced the Fund's custody expenses by $101.
10. Other.
The Fund's organizational documents provide former and current trustees and officers with a limited indemnification against liabilities arising in connection with the performance of their duties to the Fund. In the normal course of business, the Fund may also enter into contracts that provide general indemnifications. The Fund's maximum exposure under these arrangements is unknown as this would be dependent on future claims that may be made against the Fund. The risk of material loss from such claims is considered remote.
At the end of the period, FMR or its affiliates were the owners of record of 100% of the total outstanding shares of the Fund.
In December 2006, the Independent Trustees, with the assistance of independent counsel, completed an investigation regarding gifts, gratuities and business entertainment provided by certain brokers to certain individuals who were employed on FMR's domestic equity trading desk during the period 2002 to 2004. The Independent Trustees and FMR agreed that, despite the absence of proof that the Fidelity mutual funds experienced diminished execution quality as a result of the improper receipt of gifts and business entertainment, the conduct at issue was serious and was worthy of redress.
Annual Report
Notes to Financial Statements - continued
10. Other - continued
Accordingly, the Independent Trustees requested, and FMR agreed to make, a payment of $42 million plus accrued interest, which equaled approximately $7.3 million, to certain Fidelity mutual funds.
In March 2008, the Trustees approved a method for allocating this payment among the funds and, in total, FMR paid the fund $8,457, which is recorded in the accompanying Statement of Operations.
In a related administrative order dated March 5, 2008, the U.S. Securities and Exchange Commission ("SEC") announced a settlement with FMR and FMR Co., Inc. (an affiliate of FMR) involving the SEC's regulatory rules for investment advisers and the improper receipt of gifts, gratuities and business entertainment. Without admitting or denying the SEC's findings, FMR agreed to pay an $8 million civil penalty to the United States Treasury.
11. Distributions to Shareholders.
Distributions to shareholders of each class were as follows:
Years ended December 31,
2008
2007
From net investment income
Initial Class
$ 479,656
$ 852,438
Investor Class
322,392
316,073
Total
$ 802,048
$ 1,168,511
From net realized gain
Initial Class
$ 1,682,600
$ 2,557,827
Investor Class
788,864
828,494
Total
$ 2,471,464
$ 3,386,321
12. Share Transactions.
Transactions for each class of shares were as follows:
Shares
Dollars
Years ended December 31,
2008
2007
2008
2007
Initial Class
Shares sold
2,382,491
684,091
$ 19,887,411
$ 8,719,511
Reinvestment of distributions
265,220
252,303
2,162,256
3,410,265
Shares redeemed
(1,347,360)
(1,960,660)
(10,403,989)
(26,730,674)
Net increase (decrease)
1,300,351
(1,024,266)
$ 11,645,678
$ (14,600,898)
Investor Class
Shares sold
1,944,613
558,928
$ 15,854,880
$ 7,421,183
Reinvestment of distributions
143,835
85,449
1,111,256
1,144,567
Shares redeemed
(691,630)
(626,618)
(5,026,261)
(8,416,935)
Net increase (decrease)
1,396,818
17,759
$ 11,939,875
$ 148,815
Annual Report
Reportof Independent Registered Public Accounting Firm
To the Trustees of Variable Insurance Products Fund IV and the Shareholders of VIP Financial Services Portfolio:
In our opinion, the accompanying statement of assets and liabilities, including the schedule of investments, and the related statements of operations and of changes in net assets and the financial highlights present fairly, in all material respects, the financial position of VIP Financial Services Portfolio (a fund of Variable Insurance Products Fund IV) at December 31, 2008, the results of its operations for the year then ended, the changes in its net assets for each of the two years in the period then ended and the financial highlights for each of the periods indicated, in conformity with accounting principles generally accepted in the United States of America. These financial statements and financial highlights (hereafter referred to as "financial statements") are the responsibility of the VIP Financial Services Portfolio's management. Our responsibility is to express an opinion on these financial statements based on our audits. We conducted our audits of these financial statements in accordance with the standards of the Public Company Accounting Oversight Board (United States). Those standards require that we plan and perform the audit to obtain reasonable assurance about whether the financial statements are free of material misstatement. An audit includes examining, on a test basis, evidence supporting the amounts and disclosures in the financial statements, assessing the accounting principles used and significant estimates made by management, and evaluating the overall financial statement presentation. We believe that our audits, which included confirmation of securities at December 31, 2008 by correspondence with the custodian and brokers, provide a reasonable basis for our opinion.
The Trustees, Member of the Advisory Board, and executive officers of the trust and fund, as applicable, are listed below. The Board of Trustees governs the fund and is responsible for protecting the interests of shareholders. The Trustees are experienced executives who meet periodically throughout the year to oversee the fund's activities, review contractual arrangements with companies that provide services to the fund, and review the fund's performance. Except for Edward C. Johnson 3d and James C. Curvey, each of the Trustees oversees 222 funds advised by FMR or an affiliate. Messrs. Johnson and Curvey oversee 381 funds advised by FMR or an affiliate.
The Trustees hold office without limit in time except that (a) any Trustee may resign; (b) any Trustee may be removed by written instrument, signed by at least two-thirds of the number of Trustees prior to such removal; (c) any Trustee who requests to be retired or who has become incapacitated by illness or injury may be retired by written instrument signed by a majority of the other Trustees; and (d) any Trustee may be removed at any special meeting of shareholders by a two-thirds vote of the outstanding voting securities of the trust. Each Trustee who is not an interested person (as defined in the 1940 Act) (Independent Trustee), shall retire not later than the last day of the calendar year in which his or her 72nd birthday occurs. The Independent Trustees may waive this mandatory retirement age policy with respect to individual Trustees. The executive officers and Advisory Board Member hold office without limit in time, except that any officer and Advisory Board Member may resign or may be removed by a vote of a majority of the Trustees at any regular meeting or any special meeting of the Trustees. Except as indicated, each individual has held the office shown or other offices in the same company for the past five years.
The fund's Statement of Additional Information (SAI) includes more information about the Trustees. To request a free copy, call Fidelity at 1-877-0098.
Interested Trustees*:
Correspondence intended for each Trustee who is an interested person may be sent to Fidelity Investments, 82 Devonshire Street, Boston, Massachusetts 02109.
Name, Age; Principal Occupation
Edward C. Johnson 3d (78)
Year of Election or Appointment: 1983
Mr. Johnson is Chairman of the Board of Trustees. Mr. Johnson serves as Chief Executive Officer, Chairman, and a Director of FMR LLC; Chairman and a Director of FMR; Chairman and a Director of Fidelity Research & Analysis Company (FRAC); Chairman and a Director of Fidelity Investments Money Management, Inc.; and Chairman and a Director of FMR Co., Inc. In addition, Mr. Johnson serves as Chairman and Director of FIL Limited. Previously, Mr. Johnson served as President of FMR LLC (2006-2007).
James C. Curvey (73)
Year of Election or Appointment: 2007
Mr. Curvey also serves as Trustee (2007-present) of other investment companies advised by FMR. Mr. Curvey is a Director of FMR and FMR Co., Inc. (2007-present). Mr. Curvey is also Vice Chairman (2006-present) and Director of FMR LLC. In addition, Mr. Curvey serves as an Overseer for the Boston Symphony Orchestra and a member of the Trustees of Villanova University.
* Trustees have been determined to be "Interested Trustees" by virtue of, among other things, their affiliation with the trust or various entities under common control with FMR. FMR Corp. merged with and into FMR LLC on October 1, 2007. Any references to FMR LLC for prior periods are deemed to be references to the prior entity.
Independent Trustees:
Correspondence intended for each Independent Trustee (that is, the Trustees other than the Interested Trustees) may be sent to Fidelity Investments, P.O. Box 55235, Boston, Massachusetts 02205-5235.
Name, Age; Principal Occupation
Dennis J. Dirks (60)
Year of Election or Appointment: 2005
Prior to his retirement in May 2003, Mr. Dirks was Chief Operating Officer and a member of the Board of The Depository Trust & Clearing Corporation (DTCC) (1999-2003). He also served as President, Chief Operating Officer, and Board member of The Depository Trust Company (DTC) (1999-2003) and President and Board member of the National Securities Clearing Corporation (NSCC) (1999-2003). In addition, Mr. Dirks served as Chief Executive Officer and Board member of the Government Securities Clearing Corporation (2001-2003), Chief Executive Officer and Board member of the Mortgage-Backed Securities Clearing Corporation (2001-2003), as a Trustee and a member of the Finance Committee of Manhattan College (2005-2008), and as a Trustee and a member of the Finance Committee of AHRC of Nassau County (2006-2008). Currently, Mr. Dirks serves as a member of the Board of Directors for The Brookville Center for Children's Services, Inc. (2009-present).
Alan J. Lacy (55)
Year of Election or Appointment:2008
Mr. Lacy serves as Senior Adviser (2007-present) of Oak Hill Capital Partners, L.P. (a private equity firm). Mr. Lacy also served as Chief Executive Officer (2000-2005) and Vice Chairman (2005-2006) of Sears Holdings Corporation and Sears, Roebuck and Co. (retail). In addition, Mr. Lacy serves as a member of the Board of Directors of The Western Union Company (global money transfer, 2006-present) and Bristol-Myers Squibb (global pharmaceuticals, 2007-present). Mr. Lacy is a Trustee of the National Parks Conservation Association and The Field Museum of Natural History.
Ned C. Lautenbach (64)
Year of Election or Appointment: 2000
Mr. Lautenbach is Chairman of the Independent Trustees (2006-present). Mr. Lautenbach is an Advisory Partner of Clayton, Dubilier & Rice, Inc. (private equity investment firm). Previously, Mr. Lautenbach was with the International Business Machines Corporation (IBM) from 1968 until his retirement in 1998. Mr. Lautenbach serves as a Director of Eaton Corporation (diversified industrial) as well as the Philharmonic Center for the Arts in Naples, Florida. He also is a member of the Board of Trustees of Fairfield University (2005-present), as well as a member of the Council on Foreign Relations. Previously, Mr. Lautenbach served as a Director of Sony Corporation (2006-2007).
Joseph Mauriello (64)
Year of Election or Appointment: 2008
Prior to his retirement in January 2006, Mr. Mauriello served in numerous senior management positions including Deputy Chairman and Chief Operating Officer (2004-2005), and Vice Chairman of Financial Services (2002-2004) of KPMG LLP US (professional services firm, 1965-2005). Mr. Mauriello currently serves as a member of the Board of Directors of XL Capital Ltd. (global insurance and re-insurance company, 2006-present) and of Arcadia Resources Inc. (health care services and products, 2007-present). He also served as a Director of the Hamilton Funds of the Bank of New York (2006-2007).
Cornelia M. Small (64)
Year of Election or Appointment: 2005
Ms. Small is a member of the Investment Committee, and Chair (2008-present) and a member of the Board of Trustees of Smith College. Ms. Small also serves on the Investment Committee of the Berkshire Taconic Community Foundation (2008-present). Previously, Ms. Small served as Chairperson of the Investment Committee (2002-2008) of Smith College and as Co-Chair (2000-2003) of the Annual Fund for the Fletcher School of Law and Diplomacy. In addition, she served as Chief Investment Officer, Director of Global Equity Investments, and a member of the Board of Directors of Scudder, Stevens & Clark and Scudder Kemper Investments.
William S. Stavropoulos (69)
Year of Election or Appointment: 2001
Mr. Stavropoulos is Chairman Emeritus of the Board of Directors of The Dow Chemical Company, where he previously served in numerous senior management positions, including President (1993-2000; 2002-2003), CEO (1995-2000; 2002-2004), Chairman of the Executive Committee (2000-2006), and as a member of the Board of Directors (1990-2006). Currently, he is a Director of Teradata Corporation (data warehousing and technology solutions, 2008-present), Chemical Financial Corporation, Maersk Inc. (industrial conglomerate), Tyco International, Inc. (multinational manufacturing and services, 2007-present), and a member of the Advisory Board for Metalmark Capital (private equity investment firm, 2005-present). He is a special advisor to Clayton, Dubilier & Rice, Inc. (private equity investment). In addition, Mr. Stavropoulos is a member of the University of Notre Dame Advisory Council for the College of Science.
David M. Thomas (59)
Year of Election or Appointment: 2008
Previously, Mr. Thomas served as Executive Chairman (2005-2006) and Chairman and Chief Executive Officer (2000-2005) of IMS Health, Inc. (pharmaceutical and healthcare information solutions). In addition, Mr. Thomas serves as a member of the Board of Directors of Fortune Brands, Inc. (consumer products holding company), and Interpublic Group of Companies, Inc. (marketing communication, 2004-present).
Michael E. Wiley (58)
Year of Election or Appointment: 2008
Mr. Wiley also serves as a member of the Board of Trustees of the University of Tulsa (2000-2006; 2007-present). He serves as a Director of Tesoro Corporation (independent oil refiner and marketer, 2005-present), and a Director of Bill Barrett Corporation (exploration and production company, 2005-present). In addition, he also serves as a Director of Post Oak Bank (privately-held bank, 2004-present). Previously, Mr. Wiley served as a Sr. Energy Advisor of Katzenbach Partners, LLC (consulting firm, 2006-2007), as an Advisory Director of Riverstone Holdings (private investment firm), Chairman, President, and CEO of Baker Hughes, Inc. (oilfield services company, 2000-2004), and as Director of Spinnaker Exploration Company (exploration and production company, 2001-2005).
Annual Report
Advisory Board Member and Executive Officers**:
Correspondence intended for each executive officer and Peter S. Lynch may be sent to Fidelity Investments, 82 Devonshire Street, Boston, Massachusetts 02109.
Name, Age; Principal Occupation
Peter S. Lynch (64)
Year of Election or Appointment: 2003
Member of the Advisory Board of Fidelity's Equity and High Income Funds. Mr. Lynch is Vice Chairman and a Director of FMR, and Vice Chairman (2001-present) and a Director of FMR Co., Inc. Previously, Mr. Lynch served as a Trustee of the Fidelity funds (1990-2003). In addition, he serves as a Trustee of Boston College and as the Chairman of the Inner-City Scholarship Fund. Previously, Mr. Lynch served on the Special Olympics International Board of Directors (1997-2006).
Kenneth B. Robins (39)
Year of Election or Appointment: 2008
President and Treasurer of Fidelity's Equity and High Income Funds. Mr. Robins is an employee of Fidelity Investments (2004-present). Before joining Fidelity Investments, Mr. Robins worked at KPMG LLP, where he was a partner in KPMG's department of professional practice (2002-2004).
Brian B. Hogan (44)
Year of Election or Appointment: 2007
Vice President of Sector Funds. Mr. Hogan also serves as Senior Vice President, Equity Research of FMR. Previously, Mr. Hogan served as a portfolio manager.
Scott C. Goebel (40)
Year of Election or Appointment: 2008
Secretary and Chief Legal Officer (CLO) of the Fidelity funds. Mr. Goebel also serves as General Counsel, Secretary, and Senior Vice President of FMR (2008-present); Deputy General Counsel of FMR LLC; Chief Legal Secretary of Fidelity Management & Research (Hong Kong) Limited (2008-present) and Assistant Secretary of Fidelity Management & Research (Japan) Inc. (2008-present). Previously, Mr. Goebel served as Assistant Secretary of the Funds (2007-2008) and as Vice President and Secretary of Fidelity Distributors Corporation (FDC) (2005-2007).
John B. McGinty, Jr. (46)
Year of Election or Appointment: 2008
Assistant Secretary of Fidelity's Equity and High Income Funds. Mr. McGinty is an employee of Fidelity Investments (2004-present). Mr. McGinty also serves as Senior Vice President, Secretary, and Chief Legal Officer of FDC (2007-present). Before joining Fidelity Investments, Mr. McGinty practiced law at Ropes & Gray, LLP.
Holly C. Laurent (54)
Year of Election or Appointment: 2008
Anti-Money Laundering (AML) Officer of the Fidelity funds. Ms. Laurent is an employee of Fidelity Investments. Previously, Ms. Laurent was Senior Vice President and Head of Legal for Fidelity Business Services India Pvt. Ltd. (2006-2008), Senior Vice President, Deputy General Counsel and Group Head for FMR LLC (2005-2006).
Christine Reynolds (50)
Year of Election or Appointment: 2008
Chief Financial Officer of the Fidelity funds. Ms. Reynolds became President of Fidelity Pricing and Cash Management Services (FPCMS) in August 2008. She served as Chief Operating Officer of FPCMS from 2007 through July 2008. Previously, Ms. Reynolds served as President, Treasurer, and Anti-Money Laundering officer of the Fidelity funds (2004-2007). Before joining Fidelity Investments, Ms. Reynolds worked at PricewaterhouseCoopers LLP (PwC) (1980-2002), where she was an audit partner with PwC's investment management practice.
Kenneth A. Rathgeber (61)
Year of Election or Appointment: 2004
Chief Compliance Officer of Fidelity's Equity and High Income Funds. Mr. Rathgeber is Chief Compliance Officer of Fidelity Management & Research (Hong Kong) Limited (2008-present), Fidelity Management & Research (Japan) Inc. (2008-present), FMR (2005-present), FMR Co., Inc. (2005-present), Fidelity Management & Research (U.K.) Inc. (2005-present), Fidelity Research & Analysis Company (2005-present), Fidelity Investments Money Management, Inc. (2005-present), and Strategic Advisers, Inc. (2005-present).
Bryan A. Mehrmann (47)
Year of Election or Appointment: 2005
Deputy Treasurer of the Fidelity funds. Mr. Mehrmann is an employee of Fidelity Investments. Previously, Mr. Mehrmann served as Vice President of Fidelity Investments Institutional Services Group (FIIS)/Fidelity Investments Institutional Operations Company, Inc. (FIIOC) Client Services (1998-2004).
Adrien E. Deberghes (41)
Year of Election or Appointment: 2008
Deputy Treasurer of Fidelity's Equity and High Income Funds. Mr. Deberghes is an employee of Fidelity Investments (2008-present). Previously, Mr. Deberghes served as Senior Vice President of Mutual Fund Administration at State Street Corporation (2007-2008), Senior Director of Mutual Fund Administration at Investors Bank & Trust (2005-2007), and Director of Finance for Dunkin' Brands (2000-2005).
Robert G. Byrnes (42)
Year of Election or Appointment: 2005
Assistant Treasurer of the Fidelity funds. Mr. Byrnes is an employee of Fidelity Investments (2005-present). Previously, Mr. Byrnes served as Vice President of Fidelity Pricing and Cash Management Services (FPCMS) (2003-2005). Before joining Fidelity Investments, Mr. Byrnes worked at Deutsche Asset Management where he served as Vice President of the Investment Operations Group (2000-2003).
Paul M. Murphy (61)
Year of Election or Appointment: 2007
Assistant Treasurer of the Fidelity funds. Mr. Murphy is an employee of Fidelity Investments (2007-present). Previously, Mr. Murphy served as Chief Financial Officer of the Fidelity Funds (2005-2006), Vice President and Associate General Counsel of FMR (2007), and Senior Vice President of Fidelity Pricing and Cash Management Services (FPCMS) (1994-2007).
Gary W. Ryan (50)
Year of Election or Appointment: 2005
Assistant Treasurer of the Fidelity funds. Mr. Ryan is an employee of Fidelity Investments. Previously, Mr. Ryan served as Vice President of Fund Reporting in Fidelity Pricing and Cash Management Services (FPCMS) (1999-2005).
** FMR Corp. merged with and into FMR LLC on October 1, 2007. Any references to FMR LLC for prior periods are deemed to be references to the prior entity.
Initial Class designates 19% and 79%, Investor Class designates 19% and 82% of the dividends distributed in February 2008 and December 2008, respectively, as qualifying for the dividends-received deduction for corporate shareholders.
The fund will notify shareholders in January 2009 of amounts for use in preparing 2008 income tax returns.
A special meeting of the fund's shareholders was held on May 14, 2008. The results of votes taken among shareholders on the proposals before them are reported below. Each vote reported represents one dollar of net asset value held on the record date for the meeting.
PROPOSAL 1
To elect a Board of TrusteesA
# of Votes
% of Votes
James C. Curvey
Affirmative
82,890,712.47
95.991
Withheld
3,461,988.43
4.009
TOTAL
86,352,700.90
100.000
Dennis J. Dirks
Affirmative
82,970,372.75
96.083
Withheld
3,382,328.15
3.917
TOTAL
86,352,700.90
100.000
Edward C. Johnson 3d
Affirmative
82,689,162.78
95.757
Withheld
3,663,538.12
4.243
TOTAL
86,352,700.90
100.000
Alan J. Lacy
Affirmative
83,041,222.35
96.165
Withheld
3,311,478.55
3.835
TOTAL
86,352,700.90
100.000
Ned C. Lautenbach
Affirmative
82,983,853.72
96.099
Withheld
3,368,847.18
3.901
TOTAL
86,352,700.90
100.000
Joseph Mauriello
Affirmative
83,138,122.14
96.277
Withheld
3,214,578.76
3.723
TOTAL
86,352,700.90
100.000
Cornelia M. Small
Affirmative
83,095,438.06
96.228
Withheld
3,257,262.84
3.772
TOTAL
86,352,700.90
100.000
William S. Stavropoulos
Affirmative
82,929,113.95
96.035
Withheld
3,423,586.95
3.965
TOTAL
86,352,700.90
100.000
David M. Thomas
Affirmative
83,095,487.87
96.228
Withheld
3,257,213.03
3.772
TOTAL
86,352,700.90
100.000
Michael E. Wiley
Affirmative
83,048,523.75
96.174
Withheld
3,304,177.15
3.826
TOTAL
86,352,700.90
100.000
PROPOSAL 2
To amend the Declaration of Trust to reduce the required quorum for future shareholder meetingsA
# of Votes
% of Votes
Affirmative
74,393,635.26
86.151
Against
8,745,543.59
10.128
Abstain
3,213,522.05
3.721
TOTAL
86,352,700.90
100.000
ADenotes trust-wide proposal and voting results.
Semiannual Report
BoardApproval of Investment Advisory Contracts and Management Fees
VIP Financial Services Portfolio
Each year, typically in July, the Board of Trustees, including the Independent Trustees (together, the Board), votes on the renewal of the management contract and sub-advisory agreements (together, the Advisory Contracts) for the fund. The Board, assisted by the advice of fund counsel and Independent Trustees' counsel, requests and considers a broad range of information throughout the year.
The Board meets regularly and, acting directly and through its separate committees, requests and receives information concerning, and considers at each of its meetings factors that are relevant to, its annual consideration of the renewal of the fund's Advisory Contracts, including the services and support provided to the fund and its shareholders. At the time of the renewal, the Board had 12 standing committees, each composed of Independent Trustees with varying backgrounds, to which the Board has assigned specific subject matter responsibilities in order to enhance effective decision-making by the Board. Each committee has a written charter outlining the structure and purposes of the committee. The Board also meets as needed to consider matters specifically related to the Board's annual consideration of the renewal of Advisory Contracts.
At its July 2008 meeting, the Board of Trustees, including the Independent Trustees, unanimously determined to renew the fund's Advisory Contracts. In reaching its determination, the Board considered all factors it believed relevant, including (i) the nature, extent, and quality of the services to be provided to the fund and its shareholders (including the investment performance of the fund); (ii) the competitiveness of the fund's management fee and total expenses; (iii) the total costs of the services to be provided by and the profits to be realized by Fidelity from its relationship with the fund; (iv) the extent to which economies of scale would be realized as the fund grows; and (v) whether fee levels reflect these economies of scale, if any, for the benefit of fund shareholders. The Board also approved agreements with foreign sub-advisers Fidelity Management & Research (Japan) Inc. and Fidelity Management & Research (Hong Kong) Limited, as well as amendments to the fund's agreement with Fidelity Management & Research (U.K.) Inc.
In considering whether to renew the Advisory Contracts for the fund, the Board ultimately reached a determination, with the assistance of fund counsel and Independent Trustees' counsel and through the exercise of its business judgment, that the renewal of the Advisory Contracts and the compensation to be received by Fidelity under the management contract is consistent with Fidelity's fiduciary duty under applicable law. The Board's decision to renew the Advisory Contracts was not based on any single factor noted above, but rather was based on a comprehensive consideration of all the information provided to the Board at its meetings throughout the year. The Board, in reaching its determination to renew the Advisory Contracts, is aware that shareholders in the fund have a broad range of investment choices available to them, including a wide choice among mutual funds offered by competitors to Fidelity, and that the fund's shareholders, with the opportunity to review and weigh the disclosure provided by the fund in its prospectus and other public disclosures, have chosen to invest in this fund, managed by Fidelity.
Nature, Extent, and Quality of Services Provided. The Board considered staffing within the investment adviser, FMR, and the sub-advisers (together, the Investment Advisers), including the backgrounds of the fund's investment personnel and the fund's investment objective and discipline. The Independent Trustees also had discussions with senior management of Fidelity's investment operations and investment groups. The Board considered the structure of the portfolio manager compensation program and whether this structure provides appropriate incentives.
Resources Dedicated to Investment Management and Support Services. The Board reviewed the size, education, and experience of the Investment Advisers' investment staff, their use of technology, and the Investment Advisers' approach to recruiting, training, and retaining portfolio managers and other research, advisory, and management personnel. The Board noted that Fidelity's analysts have access to a variety of technological tools that enable them to perform both fundamental and quantitative analysis and to specialize in various disciplines. The Board considered Fidelity's extensive global research capabilities that enable the Investment Advisers to aggregate data from various sources in an effort to produce positive investment results. The Board also considered that Fidelity's portfolio managers and analysts have access to daily portfolio attribution that allows for monitoring of a fund's portfolio, as well as an electronic communication system that provides immediate real-time access to research concerning issuers and credit enhancers.
Shareholder and Administrative Services. The Board considered (i) the nature, extent, quality, and cost of advisory, administrative, distribution, and shareholder services performed by the Investment Advisers and their affiliates under the Advisory Contracts and under separate agreements covering transfer agency, pricing and bookkeeping, and securities lending services for the fund; (ii) the nature and extent of the Investment Advisers' supervision of third party service providers, principally custodians and subcustodians; and (iii) the resources devoted to, and the record of compliance with, the fund's compliance policies and procedures. The Board also reviewed the allocation of fund brokerage, including allocations to brokers affiliated with the Investment Advisers, the use of brokerage commissions to pay fund expenses, and the use of "soft" commission dollars to pay for research services. The Board further considered that Fidelity voluntarily pays for market data out of its own resources.
The Board noted that the growth of fund assets across the complex allows Fidelity to reinvest in the development of services designed to enhance the value or convenience of the Fidelity funds as investment vehicles. These services include 24-hour access to account information and market information through phone representatives and over the Internet, and investor education materials and asset allocation tools.
Investment in a Large Fund Family. The Board considered the benefits to shareholders of investing in a Fidelity fund, including the benefits of investing in a fund that is part of a large family of funds offering a variety of investment disciplines and providing for a large variety of mutual fund investor services. The Board noted that, Fidelity has taken a number of actions over the previous year that benefited particular funds, including (i) dedicating additional resources to investment research and to restructure the investment research teams; (ii) contractually agreeing to reduce the management fees on Fidelity's Institutional Money Market Funds and launching Class IV and Institutional Class of certain of these funds; (iii) reducing the transfer agent fees for the Fidelity Select Portfolios and Investor Class of the VIP funds; and (iv) launching Class K of 29 equity funds as a lower-fee class available to certain employer-sponsored retirement plans.
Annual Report
Investment Performance. The Board considered whether the fund has operated within its investment objective, as well as its record of compliance with its investment restrictions. It also reviewed the fund's absolute investment performance for each class, as well as the fund's relative investment performance for each class measured against a third-party-sponsored index that reflects the market sector in which the fund invests over multiple periods. The Board noted that FMR does not believe that a meaningful peer group exists against which to compare the fund's performance. The following charts considered by the Board show, over the one-, three-, and five-year periods ended December 31, 2007, as available, the cumulative total returns of Initial Class and Investor Class of the fund and the cumulative total returns of a third-party-sponsored index ("benchmark").
VIP Financial Services Portfolio
The Board stated that the investment performance of Initial Class of the fund compared favorably to its benchmark for the one- and three-year periods, although the fund's five-year cumulative total return was lower than its benchmark. The Board considered that the variations in performance between the fund's classes reflect the variations in class expenses, which result in lower performance for the higher expense class.
The Board considered that FMR has taken steps to refocus and strengthen equity research, equity portfolio management, and compliance.
Based on its review, and giving particular weight to the nature and quality of the resources dedicated by the Investment Advisers to maintain and improve relative performance, the Board concluded that the nature, extent, and quality of the services provided to the fund will benefit the fund's shareholders, particularly in light of the Board's view that the fund's shareholders benefit from investing in a fund that is part of a large family of funds offering a variety of investment disciplines and services.
Competitiveness of Management Fee and Total Fund Expenses. The Board considered the fund's management fee and total expenses compared to "mapped groups" of competitive funds and classes. Fidelity creates "mapped groups" by combining similar Lipper investment objective categories that have comparable management fee characteristics. Combining Lipper investment objective categories aids the Board's management fee and total expense comparisons by broadening the competitive group used for comparison and by reducing the number of universes to which various Fidelity funds are compared. The Board also considered supplemental information about how the fund's management fee and total expenses ranked relative to groups based on Lipper classifications, which take into account a fund's market capitalization and style.
The Board considered two proprietary management fee comparisons for the 12-month periods shown in the chart below. The group of Lipper funds used by the Board for management fee comparisons is referred to below as the "Total Mapped Group." The Total Mapped Group comparison focuses on a fund's standing relative to the total universe of comparable funds available to investors, in terms of gross management fees before expense reimbursements or caps. "TMG %" represents the percentage of funds in the Total Mapped Group that had management fees that were lower than the fund's. For example, a TMG % of 4% means that 96% of the funds in the Total Mapped Group had higher management fees than the fund. The "Asset-Size Peer Group" (ASPG) comparison focuses on a fund's standing relative to non-Fidelity funds similar in size to the fund within the Total Mapped Group. The ASPG represents at least 15% of the funds in the Total Mapped Group with comparable asset size and management fee characteristics, subject to a minimum of 50 funds (or all funds in the Total Mapped Group if fewer than 50). Additional information, such as the ASPG quartile in which the fund's management fee ranked, is also included in the chart and considered by the Board.
Annual Report
Board Approval of Investment Advisory Contracts and Management Fees - continued
VIP Financial Services Portfolio
The Board noted that the fund's management fee ranked below the median of its Total Mapped Group and below the median of its ASPG for 2007.
Based on its review, the Board concluded that the fund's management fee was fair and reasonable in light of the services that the fund receives and the other factors considered.
In its review of each class's total expenses, the Board considered the fund's management fee as well as other fund or class expenses, as applicable, such as transfer agent fees, pricing and bookkeeping fees, and custodial, legal, and audit fees. The Board also noted the effects of any waivers and reimbursements on fees and expenses. As part of its review, the Board also considered current and historical total expenses of each class of the fund compared to competitive fund median expenses. Each class of the fund is compared to those funds and classes in the Total Mapped Group (used by the Board for management fee comparisons) that have a similar sales load structure.
The Board noted that the total expenses of each class ranked below its competitive median for 2007.
In its review of total expenses, the Board also considered Fidelity fee structures and other information on clients that FMR and its affiliates service in other competitive markets, such as other mutual funds advised or subadvised by FMR or its affiliates, pension plan clients, and other institutional clients.
Based on its review, the Board concluded that the total expenses of each class of the fund were reasonable in light of the services that the fund and its shareholders receive and the other factors considered.
Costs of the Services and Profitability. The Board considered the revenues earned and the expenses incurred by Fidelity in conducting the business of developing, marketing, distributing, managing, administering and servicing the fund and its shareholders. The Board also considered the level of Fidelity's profits in respect of all the Fidelity funds.
On an annual basis, FMR presents to the Board Fidelity's profitability for the fund. Fidelity calculates the profitability for each fund, as well as aggregate profitability for groups of Fidelity funds and all Fidelity funds, using a series of detailed revenue and cost allocation methodologies which originate with the audited books and records of Fidelity. The Audit Committee of the Board reviews any significant changes from the prior year's methodologies.
PricewaterhouseCoopers LLP (PwC), independent registered public accounting firm and auditor to Fidelity and certain Fidelity funds, has been engaged annually by the Board as part of the Board's assessment of the results of Fidelity's profitability analysis. PwC's engagement includes the review and assessment of Fidelity's methodologies used in determining the revenues and expenses attributable to Fidelity's mutual fund business, and completion of agreed-upon procedures surrounding the mathematical accuracy of fund profitability and its conformity to allocation methodologies. After considering PwC's reports issued under the engagement and information provided by Fidelity, the Board believes that while other allocation methods may also be reasonable, Fidelity's profitability methodologies are reasonable in all material respects.
The Board has also reviewed Fidelity's non-fund businesses and any fall-out benefits related to the mutual fund business as well as cases where Fidelity's affiliates may benefit from or be related to the fund's business.
The Board considered the costs of the services provided by and the profits realized by Fidelity in connection with the operation of the fund and determined that the amount of profit is a fair entrepreneurial profit for the management of the fund.
Annual Report
Economies of Scale. The Board considered whether there have been economies of scale in respect of the management of the Fidelity funds, whether the Fidelity funds (including the fund) have appropriately benefited from any such economies of scale, and whether there is potential for realization of any further economies of scale. The Board considered the extent to which the fund will benefit from economies of scale through increased services to the fund, through waivers or reimbursements, or through fee or expense reductions.
The Board recognized that the fund's management contract incorporates a "group fee" structure, which provides for lower group fee rates as total fund assets under FMR's management increase, and for higher group fee rates as total fund assets under FMR's management decrease. FMR determines the group fee rates based on a tiered asset "breakpoint" schedule. The Board considered that the group fee is designed to deliver the benefits of economies of scale to fund shareholders when total fund assets increase, even if assets of any particular fund are unchanged or have declined, because some portion of Fidelity's costs are attributable to services provided to all Fidelity funds, and all funds benefit if those costs can be allocated among more assets. The Board concluded that, given the group fee structure, fund shareholders will achieve a certain level of economies of scale as assets under FMR's management increase at the fund complex level, regardless of whether Fidelity achieves any such economies of scale.
The Board further concluded that any potential economies of scale are being shared between fund shareholders and Fidelity in an appropriate manner.
Additional Information Requested by the Board. In order to develop fully the factual basis for consideration of the Fidelity funds' Advisory Contracts, the Board requested and received additional information on certain topics, including (i) fund performance trends and actions to be taken by FMR to improve certain funds' overall performance; (ii) portfolio manager changes that have occurred during the past year; (iii) Fidelity's fund profitability methodology, the profitability of certain fund service providers, and profitability trends for certain funds; (iv) Fidelity's compensation structure for portfolio managers and key personnel, including its effects on fund profitability and the extent to which portfolio manager compensation is linked to fund performance; (v) Fidelity's fee structures and rationale for recommending different fees among categories of funds; and (vi) Fidelity's rationale for recommending which funds should have a performance adjustment component as part of their management fees.
Based on its evaluation of all of the conclusions noted above, and after considering all material factors, the Board ultimately concluded that the advisory fee structures are fair and reasonable, and that the fund's Advisory Contracts should be renewed.
Annual Report
Annual Report
Investment Adviser
Fidelity Management & Research Company Boston, MA
Investment Sub-Advisers
FMR Co., Inc.
Fidelity Management & Research (U.K.) Inc.
Fidelity Research & Analysis Company
Fidelity Investments Japan Limited
FIL Investment Advisors
FIL Investment Advisors (U.K.) Ltd.
Fidelity Management and Research (Hong Kong) Limited
Fidelity Management and Research (Japan) Inc.
General Distributor
Fidelity Distributors Corporation Boston, MA
Transfer and Service Agents
Fidelity Investments Institutional Operations Company, Inc. Boston, MA
To view a fund's proxy voting guidelines and proxy voting record for the 12-month period ended June 30, visit http://www.fidelity.com (search for "proxy voting results") or visit the Securities and Exchange Commission's (SEC) web site at http://www.sec.gov. You may also call 1-877-208-0098 to request a free copy of the proxy voting guidelines.
Fidelity Variable Insurance Products are separate account options which are purchased through a variable insurance contract.
Standard & Poor's, S&P and S&P 500 are registered service marks of The McGraw-Hill Companies, Inc. and have been licensed for use by Fidelity Distributors Corporation.
Other third party marks appearing herein are the property of their respective owners.
All other marks appearing herein are registered or unregistered trademarks or service marks of FMR LLC or an affiliated company.
This report and the financial statements contained herein are submitted for the general information of the shareholders of the fund. This report is not authorized for distribution to prospective investors in the fund unless preceded or accompanied by an effective prospectus.
A fund files its complete schedule of portfolio holdings with the SEC for the first and third quarters of each fiscal year on Form N-Q. Forms N-Q are available on the SEC's web site at http://www.sec.gov. A fund's Forms N-Q may be reviewed and copied at the SEC's Public Reference Room in Washington, DC. Information regarding the operation of the SEC's Public Reference Room may be obtained by calling 1-800-SEC-0330. For a complete list of a fund's portfolio holdings, view the most recent holdings listing, semiannual report, or annual report on Fidelity's web site at http://www.fidelity.com or http://www.advisor.fidelity.com, as applicable.
NOT FDIC INSURED · MAY LOSE VALUE · NO BANK GUARANTEE
Neither the fund nor Fidelity Distributors Corporation is a bank.
Average annual total return reflects the change in the value of an investment, assuming reinvestment of the class' dividend income and capital gains (the profits earned upon the sale of securities that have grown in value, if any) and assuming a constant rate of performance each year. During periods of reimbursement by Fidelity, a fund's total return will be greater than it would be had the reimbursement not occurred. Performance numbers are net of all underlying fund operating expenses, but do not include any insurance charges imposed by your insurance company's separate account. If performance information included the effect of these additional charges, the total returns would have been lower. How a fund did yesterday is no guarantee of how it will do tomorrow.
Average Annual Total Returns
Periods ended December 31, 2008
Past 1 year
Past 5 years
Life of fund A
VIP Growth Stock - Initial Class
-44.67%
-5.46%
-0.95%
VIP Growth Stock - Service Class B
-44.71%
-5.53%
-1.04%
VIP Growth Stock - Service Class 2 C
-44.77%
-5.67%
-1.19%
VIP Growth Stock - Investor Class D
-44.69%
-5.53%
-1.01%
AFrom December 11, 2002
B Performance for Service Class shares reflects an asset-based service fee (12b-1 fee).
C Performance for Service Class 2 shares reflects an asset-based service fee (12b-1 fee).
D The initial offering of Investor Class shares took place on July 21, 2005. Returns prior to July 21, 2005 are those of Initial Class. If Investor Class's transfer agent fee had been reflected, returns prior to July 21, 2005 would have been lower.
$10,000 Over Life of Fund
Let's say hypothetically that $10,000 was invested in VIP Growth Stock Portfolio - Initial Class on December 11, 2002, when the fund started. The chart shows how the value of your investment would have changed, and also shows how the Russell 1000® Growth Index performed over the same period.
Comments from Jeffrey Feingold, Portfolio Manager of VIP Growth Stock Portfolio
By year-end 2008, the vicious credit crisis sparked in the U.S. had spread like wildfire across the world's capital markets, stunting global growth, toppling commodity prices, changing the face of the global financial system, and chasing risk-averse investors toward the sidelines. The U.S. equity markets, as measured by the Dow Jones Industrial AverageSM and Standard & Poor's 500SM Index, fell hard as a result, declining 31.93% and 37.00%, respectively, while the technology-laden NASDAQ Composite® Index slid 40.03%. Foreign market stocks saw an even sharper decline, as illustrated by the 43.28% loss of the MSCI® EAFE® Index (Europe, Australasia, Far East), a gauge of developed stock markets outside the U.S. and Canada. A generally stronger U.S. dollar also held back returns for U.S. investors in foreign equities. Emerging-markets stocks - the global performance leader only a year ago - fell harder still, dropping 53.18%, as measured by the MSCI Emerging Markets Index. The only clear winners during the past year were assets backed by the U.S. government, as investors fled from risk. Thus, the Barclays Capital U.S. Treasury Bond Index climbed 13.74% for the year, while the Barclays Capital U.S. Aggregate Bond Index - a broader measure of the U.S. investment-grade bond universe - gained a more modest 5.24%. By contrast, high-yield bonds bore the brunt of investors' increasing wariness over risk, as expressed by the Merrill Lynch® U.S. High Yield Master II Constrained Index's drop of 26.11%. The emerging-markets bond category also felt the shock of investors' risk-averse sentiment, with the JPMorgan Emerging Markets Bond Index (EMBI) Global falling 10.91%. Meanwhile, the Citigroup® Non-U.S. Group of 7 Index-representing the debt performance of major global economies, excluding the United States-eked out a 1.69% gain.
During the painful 12 months ending December 31, 2008, the fund lagged the -38.44% return of the Russell 1000® Growth Index. (For specific portfolio results, please refer to the performance section of this report.) Stock selection was the biggest detractor from the fund's relative return, with the heaviest losses coming from information technology and industrials. Sector weightings overall further hampered results, led by an underweighting, along with disappointing stock selection, in the consumer staples sector. Individual detractors included: Inverness Medical Innovations, a health care diagnostics company, which fell sharply amid concerns the company had overpaid for recent acquisitions; Apple, a well-known technology name, which declined as slower consumer spending pressured sales of its core product lines; and Google, the search engine company, which slid amid fears that online search and advertising sales would weaken. Our underweighting in Wal-Mart also hurt, as strong demand from bargain-hungry consumers drove the stock higher. The fund stemmed some losses through more favorable stock selection in the materials sector, a modest cash position and certain non-index investments that held up well. Top contributors included Molson Coors Brewing, which distributes the Miller, Molson and Coors beer brands, and Nestle, a Swiss multinational packaged goods company. Both of these out-of-index positions declined much less than other, more economically sensitive stocks.
The views expressed above reflect those of the portfolio manager(s) only through the end of the period as stated on the cover of this report and do not necessarily represent the views of Fidelity or any other person in the Fidelity organization. Any such views are subject to change at any time based upon market or other conditions and Fidelity disclaims any responsibility to update such views. These views may not be relied on as investment advice and, because investment decisions for a Fidelity fund are based on numerous factors, may not be relied on as an indication of trading intent on behalf of any Fidelity fund.
As a shareholder of the Fund, you incur two types of costs: (1) transaction costs, and (2) ongoing costs, including management fees, distribution and/or service (12b-1) fees and other Fund expenses. This Example is intended to help you understand your ongoing costs (in dollars) of investing in the Fund and to compare these costs with the ongoing costs of investing in other mutual funds.
The Example is based on an investment of $1,000 invested at the beginning of the period and held for the entire period (July 1, 2008 to December 31, 2008).
Actual Expenses
The first line of the accompanying table for each class of the Fund provides information about actual account values and actual expenses. You may use the information in this line, together with the amount you invested, to estimate the expenses that you paid over the period. Simply divide your account value by $1,000.00 (for example, an $8,600 account value divided by $1,000.00 = 8.6), then multiply the result by the number in the first line for a class of the Fund under the heading entitled "Expenses Paid During Period" to estimate the expenses you paid on your account during this period. The estimate of expenses does not include any fees or other expenses of any variable annuity or variable life insurance product. If they were, the estimate of expenses you paid during the period would be higher, and your ending account value would be lower. In addition, the Fund, as a shareholder in the underlying Fidelity Central Funds, will indirectly bear its pro rata share of the fees and expenses incurred by the underlying Fidelity Central Funds. These fees and expenses are not included in the Fund's annualized expense ratio used to calculate the expense estimate in the table below.
Hypothetical Example for Comparison Purposes
The second line of the accompanying table for each class of the Fund provides information about hypothetical account values and hypothetical expenses based on a Class' actual expense ratio and an assumed rate of return of 5% per year before expenses, which is not the Class' actual return. The hypothetical account values and expenses may not be used to estimate the actual ending account balance or expenses you paid for the period. You may use this information to compare the ongoing costs of investing in the Fund and other funds. To do so, compare this 5% hypothetical example with the 5% hypothetical examples that appear in the shareholder reports of the other funds. The estimate of expenses does not include any fees or other expenses of any variable annuity or variable life insurance product. If they were, the estimate of expenses you paid during the period would be higher, and your ending account value would be lower. In addition, the Fund, as a shareholder in the underlying Fidelity Central Funds, will indirectly bear its pro rata share of the fees and expenses incurred by the underlying Fidelity Central Funds. These fees and expenses are not included in the Fund's annualized expense ratio used to calculate the expense estimate in the table below.
Please note that the expenses shown in the table are meant to highlight your ongoing costs only and do not reflect any transaction costs. Therefore, the second line of the table is useful in comparing ongoing costs only, and will not help you determine the relative total costs of owning different funds.
Annualized Expense Ratio
Beginning Account Value July 1, 2008
Ending Account Value December 31, 2008
Expenses Paid During Period* July 1, 2008 to December 31, 2008
Initial Class
.85%
Actual
$ 1,000.00
$ 630.90
$ 3.48
HypotheticalA
$ 1,000.00
$ 1,020.86
$ 4.32
Service Class
.95%
Actual
$ 1,000.00
$ 630.90
$ 3.89
HypotheticalA
$ 1,000.00
$ 1,020.36
$ 4.82
Service Class 2
1.10%
Actual
$ 1,000.00
$ 630.40
$ 4.51
HypotheticalA
$ 1,000.00
$ 1,019.61
$ 5.58
Investor Class
.93%
Actual
$ 1,000.00
$ 631.00
$ 3.81
HypotheticalA
$ 1,000.00
$ 1,020.46
$ 4.72
A 5% return per year before expenses
* Expenses are equal to each Class' annualized expense ratio, multiplied by the average account value over the period, multiplied by 184/366 (to reflect the one-half year period).
Annual Report
Investment Changes (Unaudited)
Top Ten Stocks as of December 31, 2008
% of fund's net assets
% of fund's net assets 6 months ago
Procter & Gamble Co.
3.1
0.9
Hewlett-Packard Co.
3.0
1.6
Google, Inc. Class A (sub. vtg.)
2.9
3.7
QUALCOMM, Inc.
2.7
2.1
Cisco Systems, Inc.
2.1
4.2
Exxon Mobil Corp.
2.1
1.4
Juniper Networks, Inc.
2.0
1.3
McDonald's Corp.
1.9
1.7
The Coca-Cola Co.
1.8
0.0
Sybase, Inc.
1.8
1.1
23.4
Top Five Market Sectors as of December 31, 2008
% of fund's net assets
% of fund's net assets 6 months ago
Information Technology
30.1
32.7
Health Care
16.0
13.6
Consumer Staples
13.8
8.0
Industrials
11.9
11.1
Consumer Discretionary
11.3
7.8
Asset Allocation (% of fund's net assets)
As of December 31, 2008*
As of June 30, 2008**
Stocks 100.2%
Stocks 99.8%
Short-Term Investments and Net Other Assets † (0.2)%
Short-Term Investments and Net Other Assets 0.2%
* Foreign investments
9.4%
** Foreign investments
16.4%
† Short-term Investments and Net Other Assets are not included in the pie charts.
Annual Report
Investments December 31, 2008
Showing Percentage of Net Assets
Common Stocks - 100.2%
Shares
Value
CONSUMER DISCRETIONARY - 11.3%
Diversified Consumer Services - 0.2%
Strayer Education, Inc.
100
$ 21,441
Hotels, Restaurants & Leisure - 3.2%
Burger King Holdings, Inc.
900
21,492
Darden Restaurants, Inc.
1,400
39,452
Las Vegas Sands Corp. unit (a)
150
15,525
Life Time Fitness, Inc. (a)(d)
500
6,475
Marriott International, Inc. Class A
1,300
25,285
McDonald's Corp.
3,100
192,789
Starwood Hotels & Resorts Worldwide, Inc.
1,100
19,690
320,708
Household Durables - 0.3%
Tempur-Pedic International, Inc. (d)
4,100
29,069
Internet & Catalog Retail - 0.7%
Amazon.com, Inc. (a)
800
41,024
Blue Nile, Inc. (a)
1,200
29,388
70,412
Media - 0.4%
Interpublic Group of Companies, Inc. (a)
5,000
19,800
The Walt Disney Co.
1,000
22,690
42,490
Multiline Retail - 0.7%
Nordstrom, Inc.
600
7,986
Target Corp.
1,600
55,248
63,234
Specialty Retail - 3.2%
Abercrombie & Fitch Co. Class A
1,500
34,605
Best Buy Co., Inc.
1,900
53,409
Dick's Sporting Goods, Inc. (a)
1,300
18,343
Lowe's Companies, Inc.
500
10,760
Penske Auto Group, Inc.
3,800
29,184
Ross Stores, Inc.
900
26,757
Staples, Inc.
4,300
77,056
The Men's Wearhouse, Inc.
1,800
24,372
TJX Companies, Inc.
2,200
45,254
319,740
Textiles, Apparel & Luxury Goods - 2.6%
American Apparel, Inc. (a)(d)
6,500
12,935
Coach, Inc. (a)
1,200
24,924
Deckers Outdoor Corp. (a)
300
23,961
G-III Apparel Group Ltd. (a)
4,300
27,477
Liz Claiborne, Inc.
3,100
8,060
NIKE, Inc. Class B
800
40,800
Phillips-Van Heusen Corp.
300
6,039
Polo Ralph Lauren Corp. Class A
1,300
59,033
VF Corp.
1,000
54,770
257,999
TOTAL CONSUMER DISCRETIONARY
1,125,093
Shares
Value
CONSUMER STAPLES - 13.8%
Beverages - 3.7%
Molson Coors Brewing Co. Class B
2,800
$ 136,976
PepsiCo, Inc.
1,000
54,770
The Coca-Cola Co.
3,950
178,817
370,563
Food & Staples Retailing - 3.6%
Costco Wholesale Corp.
900
47,250
CVS Caremark Corp.
3,900
112,086
Kroger Co.
600
15,846
Sysco Corp.
1,000
22,940
Wal-Mart Stores, Inc.
2,900
162,574
360,696
Food Products - 2.1%
Nestle SA sponsored ADR
4,000
158,800
Smart Balance, Inc. (a)
8,100
55,080
213,880
Household Products - 3.1%
Procter & Gamble Co.
5,000
309,097
Personal Products - 1.3%
Avon Products, Inc.
2,500
60,075
Chattem, Inc. (a)
900
64,377
124,452
TOTAL CONSUMER STAPLES
1,378,688
ENERGY - 8.8%
Energy Equipment & Services - 2.3%
Halliburton Co.
2,800
50,904
National Oilwell Varco, Inc. (a)
1,846
45,116
Noble Corp.
900
19,881
Schlumberger Ltd. (NY Shares)
2,690
113,868
229,769
Oil, Gas & Consumable Fuels - 6.5%
Arch Coal, Inc.
700
11,403
Canadian Natural Resources Ltd.
400
16,027
Chesapeake Energy Corp.
1,400
22,638
ConocoPhillips
300
15,540
CONSOL Energy, Inc.
1,310
37,440
EOG Resources, Inc.
800
53,264
Exxon Mobil Corp.
2,590
206,760
Hess Corp.
1,100
59,004
Nova Biosource Fuels, Inc. (a)
36,900
3,690
Occidental Petroleum Corp.
1,400
83,986
Peabody Energy Corp.
1,800
40,950
Petroleo Brasileiro SA - Petrobras (PN) sponsored ADR (non-vtg.)
900
18,369
Quicksilver Resources, Inc. (a)
1,600
8,912
Southwestern Energy Co. (a)
1,100
31,867
Common Stocks - continued
Shares
Value
ENERGY - continued
Oil, Gas & Consumable Fuels - continued
Ultra Petroleum Corp. (a)
900
$ 31,059
Williams Companies, Inc.
1,000
14,480
655,389
TOTAL ENERGY
885,158
FINANCIALS - 4.2%
Capital Markets - 2.0%
Charles Schwab Corp.
3,100
50,127
Goldman Sachs Group, Inc.
300
25,317
Janus Capital Group, Inc.
1,900
15,257
Morgan Stanley
1,600
25,664
Northern Trust Corp.
620
32,327
State Street Corp.
930
36,577
T. Rowe Price Group, Inc.
400
14,176
199,445
Commercial Banks - 0.4%
Wells Fargo & Co.
1,400
41,272
Consumer Finance - 0.3%
American Express Co.
1,400
25,970
SLM Corp. (a)
700
6,230
32,200
Diversified Financial Services - 0.6%
Bank of America Corp.
2,200
30,976
Citigroup, Inc.
700
4,697
JPMorgan Chase & Co.
900
28,377
64,050
Insurance - 0.5%
Berkshire Hathaway, Inc. Class B (a)
10
32,140
MetLife, Inc.
100
3,486
W.R. Berkley Corp.
300
9,300
44,926
Thrifts & Mortgage Finance - 0.4%
Hudson City Bancorp, Inc.
2,500
39,900
TOTAL FINANCIALS
421,793
HEALTH CARE - 16.0%
Biotechnology - 6.8%
Alexion Pharmaceuticals, Inc. (a)
1,000
36,190
Alnylam Pharmaceuticals, Inc. (a)
1,100
27,203
Amgen, Inc. (a)
500
28,875
BioMarin Pharmaceutical, Inc. (a)
1,200
21,360
Celgene Corp. (a)
1,900
105,032
Cougar Biotechnology, Inc. (a)
1,400
36,400
CSL Ltd.
1,854
44,596
Genentech, Inc. (a)
2,100
174,111
Genzyme Corp. (a)
400
26,548
Shares
Value
Gilead Sciences, Inc. (a)
3,100
$ 158,534
RXi Pharmaceuticals Corp.
3,054
17,561
676,410
Health Care Equipment & Supplies - 3.7%
Alcon, Inc.
700
62,433
Baxter International, Inc.
2,100
112,539
Covidien Ltd.
2,400
86,976
Inverness Medical Innovations, Inc. (a)
5,525
104,478
366,426
Health Care Providers & Services - 1.9%
athenahealth, Inc. (a)
1,300
48,906
Community Health Systems, Inc. (a)
300
4,374
Express Scripts, Inc. (a)
1,400
76,972
Medco Health Solutions, Inc. (a)
1,200
50,292
UnitedHealth Group, Inc.
500
13,300
193,844
Life Sciences Tools & Services - 1.2%
Illumina, Inc. (a)
2,700
70,335
QIAGEN NV (a)
3,000
52,680
123,015
Pharmaceuticals - 2.4%
Abbott Laboratories
2,400
128,088
Allergan, Inc.
1,500
60,480
Wyeth
1,300
48,763
237,331
TOTAL HEALTH CARE
1,597,026
INDUSTRIALS - 11.9%
Aerospace & Defense - 4.1%
Honeywell International, Inc.
4,600
151,018
Precision Castparts Corp.
300
17,844
Raytheon Co.
1,400
71,456
The Boeing Co.
900
38,403
United Technologies Corp.
2,500
134,000
412,721
Air Freight & Logistics - 1.1%
C.H. Robinson Worldwide, Inc.
400
22,012
United Parcel Service, Inc. Class B
1,500
82,740
104,752
Airlines - 0.6%
Delta Air Lines, Inc. (a)
4,250
48,705
UAL Corp.
1,300
14,326
63,031
Building Products - 0.1%
Masco Corp.
900
10,017
Electrical Equipment - 2.2%
ABB Ltd. sponsored ADR
1,800
27,018
Alstom SA
500
29,939
American Superconductor Corp. (a)(d)
1,500
24,465
AMETEK, Inc.
1,400
42,294
Common Stocks - continued
Shares
Value
INDUSTRIALS - continued
Electrical Equipment - continued
Emerson Electric Co.
2,000
$ 73,220
First Solar, Inc. (a)
100
13,796
Satcon Technology Corp. (a)(d)
7,200
11,160
221,892
Industrial Conglomerates - 0.2%
Textron, Inc.
1,300
18,031
Machinery - 2.3%
Cummins, Inc.
1,500
40,095
Danaher Corp.
1,000
56,610
Deere & Co.
1,700
65,144
Eaton Corp.
500
24,855
Manitowoc Co., Inc.
1,800
15,588
Navistar International Corp. (a)
900
19,242
Sulzer AG (Reg.)
125
7,197
228,731
Professional Services - 0.5%
Manpower, Inc.
1,450
49,286
Road & Rail - 0.8%
CSX Corp.
400
12,988
Union Pacific Corp.
1,500
71,700
84,688
TOTAL INDUSTRIALS
1,193,149
INFORMATION TECHNOLOGY - 30.1%
Communications Equipment - 7.7%
Cisco Systems, Inc. (a)
13,200
215,160
Corning, Inc.
4,500
42,885
Infinera Corp. (a)
3,000
26,880
Juniper Networks, Inc. (a)
11,300
197,863
QUALCOMM, Inc.
7,400
265,142
Research In Motion Ltd. (a)
400
16,232
764,162
Computers & Peripherals - 5.6%
Apple, Inc. (a)
2,000
170,700
Hewlett-Packard Co.
8,300
301,207
International Business Machines Corp.
1,000
84,160
556,067
Electronic Equipment & Components - 0.4%
Ingram Micro, Inc. Class A (a)
2,800
37,492
Internet Software & Services - 3.9%
Equinix, Inc. (a)
400
21,276
Google, Inc. Class A (sub. vtg.) (a)
940
289,191
Omniture, Inc. (a)
4,735
50,380
Sohu.com, Inc. (a)
600
28,404
389,251
Shares
Value
IT Services - 3.7%
Accenture Ltd. Class A
2,900
$ 95,091
Cognizant Technology Solutions Corp. Class A (a)
8,360
150,982
CyberSource Corp. (a)
2,100
25,179
Visa, Inc.
1,900
99,655
370,907
Semiconductors & Semiconductor Equipment - 3.3%
Applied Materials, Inc.
13,800
139,794
ASML Holding NV (NY Shares)
4,600
83,122
KLA-Tencor Corp.
1,300
28,327
Lam Research Corp. (a)
1,200
25,536
Skyworks Solutions, Inc. (a)
7,900
43,766
Texas Instruments, Inc.
800
12,416
332,961
Software - 5.5%
Adobe Systems, Inc. (a)
1,400
29,806
Microsoft Corp.
8,900
173,016
Oracle Corp. (a)
8,800
156,024
Quest Software, Inc. (a)
1,300
16,367
Sybase, Inc. (a)
7,200
178,344
553,557
TOTAL INFORMATION TECHNOLOGY
3,004,397
MATERIALS - 3.3%
Chemicals - 1.7%
Calgon Carbon Corp. (a)
2,400
36,864
Monsanto Co.
1,880
132,258
169,122
Metals & Mining - 1.6%
Agnico-Eagle Mines Ltd.
500
25,795
Eldorado Gold Corp. (a)
4,800
38,070
Newmont Mining Corp.
2,100
85,470
Yamana Gold, Inc.
1,200
9,320
158,655
TOTAL MATERIALS
327,777
TELECOMMUNICATION SERVICES - 0.5%
Diversified Telecommunication Services - 0.1%
Qwest Communications International, Inc.
3,100
11,284
Wireless Telecommunication Services - 0.4%
American Tower Corp. Class A (a)
1,400
41,048
TOTAL TELECOMMUNICATION SERVICES
52,332
UTILITIES - 0.3%
Electric Utilities - 0.3%
Entergy Corp.
200
16,626
Exelon Corp.
200
11,122
27,748
Common Stocks - continued
Shares
Value
UTILITIES - continued
Independent Power Producers & Energy Traders - 0.0%
Nevada Geothermal Power, Inc. (a)
100
$ 29
TOTAL UTILITIES
27,777
TOTAL COMMON STOCKS
(Cost $13,771,019)
10,013,190
Money Market Funds - 0.7%
Fidelity Securities Lending Cash Central Fund, 0.87% (b)(c) (Cost $66,650)
66,650
66,650
TOTAL INVESTMENT PORTFOLIO - 100.9%
(Cost $13,837,669)
10,079,840
NET OTHER ASSETS - (0.9)%
(91,880)
NET ASSETS - 100%
$ 9,987,960
Legend
(a) Non-income producing
(b) Affiliated fund that is available only to investment companies and other accounts managed by Fidelity Investments. The rate quoted is the annualized seven-day yield of the fund at period end. A complete unaudited listing of the fund's holdings as of its most recent quarter end is available upon request.
(c) Investment made with cash collateral received from securities on loan.
(d) Security or a portion of the security is on loan at period end.
Affiliated Central Funds
Information regarding fiscal year to date income earned by the Fund from investments in Fidelity Central Funds is as follows:
Fund
Income earned
Fidelity Cash Central Fund
$ 10,936
Fidelity Securities Lending Cash Central Fund
19,045
Total
$ 29,981
Other Information
The following is a summary of the inputs used, as of December 31, 2008, involving the Fund's assets carried at value. The inputs or methodology used for valuing securities may not be an indication of the risk associated with investing in those securities. For more information on valuation inputs, and their aggregation into the levels used in the tables below, please refer to the Security Valuation section in the accompanying Notes to Financial Statements.
Valuation Inputs at Reporting Date:
Description
Total
Level 1
Level 2
Level 3
Investments in Securities
$ 10,079,840
$ 9,982,583
$ 81,732
$ 15,525
The following is a reconciliation of assets for which Level 3 inputs were used in determining value:
Investments in Securities
Beginning Balance
$ 0
Total Realized Gain (Loss)
0
Total Unrealized Gain (Loss)
525
Cost of Purchases
15,000
Proceeds of Sales
0
Amortization/Accretion
0
Transfer in/out of Level 3
0
Ending Balance
$ 15,525
The information used in the above reconciliation represents fiscal year to date activity for any Investment Securities identified as using Level 3 inputs at either the beginning or the end of the current fiscal period. Transfers in or out of Level 3 represents either the beginning value (for transfers in), or the ending value (for transfers out) of any Security or Instrument where a change in the pricing level occurred from the beginning to the end of the period.
Income Tax Information
At December 31, 2008, the fund had a capital loss carryforward of approximately $2,310,717 all of which will expire on December 31, 2016.
The fund intends to elect to defer to its fiscal year ending December 31, 2009 approximately $1,420,589 of losses recognized during the period November 1, 2008 to December 31, 2008.
See accompanying notes which are an integral part of the financial statements.
Investment in securities, at value (including securities loaned of $65,095) - See accompanying schedule:
Unaffiliated issuers (cost $13,771,019)
$ 10,013,190
Fidelity Central Funds (cost $66,650)
66,650
Total Investments (cost $13,837,669)
$ 10,079,840
Cash
10,262
Receivable for investments sold
229
Receivable for fund shares sold
62
Dividends receivable
10,460
Distributions receivable from Fidelity Central Funds
401
Prepaid expenses
156
Receivable from investment adviser for expense reductions
8,422
Other receivables
33
Total assets
10,109,865
Liabilities
Payable for fund shares redeemed
$ 1,419
Accrued management fee
4,726
Distribution fees payable
535
Other affiliated payables
1,125
Other payables and accrued expenses
47,450
Collateral on securities loaned, at value
66,650
Total liabilities
121,905
Net Assets
$ 9,987,960
Net Assets consist of:
Paid in capital
$ 17,638,612
Undistributed net investment income
3,524
Accumulated undistributed net realized gain (loss) on investments and foreign currency transactions
(3,896,335)
Net unrealized appreciation (depreciation) on investments and assets and liabilities in foreign currencies
(3,757,841)
Net Assets
$ 9,987,960
Statement of Assets and Liabilities - continued
December 31, 2008
Initial Class: Net Asset Value, offering price and redemption price per share ($3,368,398 ÷ 431,061 shares)
$ 7.81
Service Class: Net Asset Value, offering price and redemption price per share ($1,020,828 ÷ 131,240 shares)
$ 7.78
Service Class 2: Net Asset Value, offering price and redemption price per share ($2,182,708 ÷ 283,184 shares)
$ 7.71
Investor Class: Net Asset Value, offering price and redemption price per share ($3,416,026 ÷ 439,127 shares)
$ 7.78
See accompanying notes which are an integral part of the financial statements.
Annual Report
Financial Statements - continued
Statement of Operations
Year ended December 31, 2008
Investment Income
Dividends
$ 196,356
Interest
311
Income from Fidelity Central Funds (including $19,045 from security lending)
29,981
Total income
226,648
Expenses
Management fee
$ 121,825
Transfer agent fees
29,747
Distribution fees
12,014
Accounting and security lending fees
8,653
Custodian fees and expenses
37,928
Independent trustees' compensation
107
Audit
58,736
Legal
518
Miscellaneous
878
Total expenses before reductions
270,406
Expense reductions
(67,204)
203,202
Net investment income (loss)
23,446
Realized and Unrealized Gain (Loss)
Net realized gain (loss) on:
Investment securities:
Unaffiliated issuers (net of foreign taxes of $253)
(3,779,747)
Foreign currency transactions
(2,450)
Total net realized gain (loss)
(3,782,197)
Change in net unrealized appreciation (depreciation) on:
Investment securities (net of decrease in deferred foreign taxes of $6,736)
(7,520,702)
Assets and liabilities in foreign currencies
325
Total change in net unrealized appreciation (depreciation)
(7,520,377)
Net gain (loss)
(11,302,574)
Net increase (decrease) in net assets resulting from operations
$ (11,279,128)
Statement of Changes in Net Assets
Year ended December 31, 2008
Year ended December 31, 2007
Increase (Decrease) in Net Assets
Operations
Net investment income (loss)
$ 23,446
$ (19,420)
Net realized gain (loss)
(3,782,197)
1,503,150
Change in net unrealized appreciation (depreciation)
(7,520,377)
2,205,488
Net increase (decrease) in net assets resulting from operations
(11,279,128)
3,689,218
Distributions to shareholders from net investment income
(17,221)
-
Distributions to shareholders from net realized gain
-
(1,360,022)
Total distributions
(17,221)
(1,360,022)
Share transactions - net increase (decrease)
(9,270,016)
11,664,213
Total increase (decrease) in net assets
(20,566,365)
13,993,409
Net Assets
Beginning of period
30,554,325
16,560,916
End of period (including undistributed net investment income of $3,524 and $0, respectively)
$ 9,987,960
$ 30,554,325
See accompanying notes which are an integral part of the financial statements.
Annual Report
Financial Highlights - Initial Class
Years ended December 31,
2008
2007
2006
2005
2004
Selected Per-Share Data
Net asset value, beginning of period
$ 14.15
$ 12.07
$ 11.94
$ 11.14
$ 11.79
Income from Investment Operations
Net investment income (loss)C
.02
-I
-I
.01
.04G
Net realized and unrealized gain (loss)
(6.34)
2.74
.13
.83
.23
Total from investment operations
(6.32)
2.74
.13
.84
.27
Distributions from net investment income
(.02)
-
-I
(.01)
(.02)
Distributions from net realized gain
-
(.66)
-
(.04)
(.90)
Total distributions
(.02)
(.66)
-I
(.04)J
(.92)
Net asset value, end of period
$ 7.81
$ 14.15
$ 12.07
$ 11.94
$ 11.14
Total ReturnA,B
(44.67)%
22.67%
1.12%
7.57%
2.31%
Ratios to Average Net AssetsD,H
Expenses before reductions
1.16%
1.10%
.98%
1.01%
1.94%
Expenses net of fee waivers, if any
.85%
.85%
.86%
.85%
1.00%
Expenses net of all reductions
.85%
.84%
.86%
.81%
.95%
Net investment income (loss)
.19%
-%F
.03%
.12%
.35%
Supplemental Data
Net assets, end of period (000 omitted)
$ 3,368
$ 13,752
$ 7,414
$ 22,750
$ 1,938
Portfolio turnover rateE
137%
167%
93%
91%
151%
A Total returns do not reflect charges attributable to your insurance company's separate account. Inclusion of these charges would reduce the total returns shown.
B Total returns would have been lower had certain expenses not been reduced during the periods shown.
C Calculated based on average shares outstanding during the period.
D Fees and expenses of the underlying Fidelity Central Funds are not included in the Fund's expense ratio. The Fund indirectly bears its proportionate share of the expenses of any underlying Fidelity Central Funds.
E Amount does not include the portfolio activity of any underlying Fidelity Central Funds.
G Investment income per share reflects a special dividend which amounted to $.05 per share.
H Expense ratios reflect operating expenses of the class. Expenses before reductions do not reflect amounts reimbursed by the investment adviser or reductions from brokerage service arrangements or other expense offset arrangements and do not represent the amount paid by the class during periods when reimbursements or reductions occur. Expenses net of fee waivers reflect expenses after reimbursement by the investment adviser but prior to reductions from brokerage service arrangements or other expense offset arrangements. Expenses net of all reductions represent the net expenses paid by the class.
J Total distributions of $.040 per share is comprised of distributions from net investment income of $.005 and distributions from net realized gain of $.035 per share.
Financial Highlights - Service Class
Years ended December 31,
2008
2007
2006
2005
2004
Selected Per-Share Data
Net asset value, beginning of period
$ 14.08
$ 12.02
$ 11.90
$ 11.12
$ 11.77
Income from Investment Operations
Net investment income (loss)C
.01
(.01)
(.01)
-I
.03G
Net realized and unrealized gain (loss)
(6.30)
2.73
.13
.82
.24
Total from investment operations
(6.29)
2.72
.12
.82
.27
Distributions from net investment income
(.01)
-
-
(.01)
(.02)
Distributions from net realized gain
-
(.66)
-
(.04)
(.90)
Total distributions
(.01)
(.66)
-
(.04)J
(.92)
Net asset value, end of period
$ 7.78
$ 14.08
$ 12.02
$ 11.90
$ 11.12
Total ReturnA,B
(44.71)%
22.60%
1.01%
7.41%
2.32%
Ratios to Average Net AssetsD,H
Expenses before reductions
1.22%
1.17%
1.16%
1.36%
1.97%
Expenses net of fee waivers, if any
.95%
.95%
.96%
.97%
1.10%
Expenses net of all reductions
.95%
.95%
.95%
.92%
1.05%
Net investment income (loss)
.09%
(.10)%
(.07)%
-%F
.25%
Supplemental Data
Net assets, end of period (000 omitted)
$ 1,021
$ 2,545
$ 2,077
$ 2,056
$ 1,914
Portfolio turnover rateE
137%
167%
93%
91%
151%
A Total returns do not reflect charges attributable to your insurance company's separate account. Inclusion of these charges would reduce the total returns shown.
B Total returns would have been lower had certain expenses not been reduced during the periods shown.
C Calculated based on average shares outstanding during the period.
D Fees and expenses of the underlying Fidelity Central Funds are not included in the Fund's expense ratio. The Fund indirectly bears its proportionate share of the expenses of any underlying Fidelity Central Funds.
E Amount does not include the portfolio activity of any underlying Fidelity Central Funds.
F Amount represents less than .01%.
G Investment income per share reflects a special dividend which amounted to $.05 per share.
H Expense ratios reflect operating expenses of the class. Expenses before reductions do not reflect amounts reimbursed by the investment adviser or reductions from brokerage service arrangements or other expense offset arrangements and do not represent the amount paid by the class during periods when reimbursements or reductions occur. Expenses net of fee waivers reflect expenses after reimbursement by the investment adviser but prior to reductions from brokerage service arrangements or other expense offset arrangements. Expenses net of all reductions represent the net expenses paid by the class.
I Amount represents less than $.01 per share.
J Total distributions of $.040 per share is comprised of distributions from net investment income of $.005 and distributions from net realized gain of $.035 per share.
See accompanying notes which are an integral part of the financial statements.
Annual Report
Financial Highlights - Service Class 2
Years ended December 31,
2008
2007
2006
2005
2004
Selected Per-Share Data
Net asset value, beginning of period
$ 13.96
$ 11.95
$ 11.84
$ 11.08
$ 11.75
Income from Investment Operations
Net investment income (loss)C
(.01)
(.03)
(.03)
(.02)
.01F
Net realized and unrealized gain (loss)
(6.24)
2.70
.14
.82
.24
Total from investment operations
(6.25)
2.67
.11
.80
.25
Distributions from net investment income
-
-
-
(.01)
(.02)
Distributions from net realized gain
-
(.66)
-
(.04)
(.90)
Total distributions
-
(.66)
-
(.04)H
(.92)
Net asset value, end of period
$ 7.71
$ 13.96
$ 11.95
$ 11.84
$ 11.08
Total ReturnA,B
(44.77)%
22.31%
.93%
7.25%
2.14%
Ratios to Average Net AssetsD,G
Expenses before reductions
1.42%
1.38%
1.35%
1.51%
2.12%
Expenses net of fee waivers, if any
1.10%
1.10%
1.11%
1.12%
1.25%
Expenses net of all reductions
1.10%
1.09%
1.10%
1.07%
1.20%
Net investment income (loss)
(.06)%
(.25)%
(.22)%
(.15)%
.10%
Supplemental Data
Net assets, end of period (000 omitted)
$ 2,183
$ 5,116
$ 3,220
$ 2,729
$ 2,544
Portfolio turnover rateE
137%
167%
93%
91%
151%
A Total returns do not reflect charges attributable to your insurance company's separate account. Inclusion of these charges would reduce the total returns shown.
B Total returns would have been lower had certain expenses not been reduced during the periods shown.
C Calculated based on average shares outstanding during the period.
D Fees and expenses of the underlying Fidelity Central Funds are not included in the Fund's expense ratio. The Fund indirectly bears its proportionate share of the expenses of any underlying Fidelity Central Funds.
E Amount does not include the portfolio activity of any underlying Fidelity Central Funds.
F Investment income per share reflects a special dividend which amounted to $.05 per share.
G Expense ratios reflect operating expenses of the class. Expenses before reductions do not reflect amounts reimbursed by the investment adviser or reductions from brokerage service arrangements or other expense offset arrangements and do not represent the amount paid by the class during periods when reimbursements or reductions occur. Expenses net of fee waivers reflect expenses after reimbursement by the investment adviser but prior to reductions from brokerage service arrangements or other expense offset arrangements. Expenses net of all reductions represent the net expenses paid by the class.
H Total distributions of $.040 per share is comprised of distributions from net investment income of $.005 and distributions from net realized gain of $.035 per share.
Financial Highlights - Investor Class
Years ended December 31,
2008
2007
2006
2005H
Selected Per-Share Data
Net asset value, beginning of period
$ 14.10
$ 12.05
$ 11.94
$ 11.64
Income from Investment Operations
Net investment income (loss)E
.01
(.02)
(.01)
-J
Net realized and unrealized gain (loss)
(6.31)
2.73
.12
.30
Total from investment operations
(6.30)
2.71
.11
.30
Distributions from net investment income
(.02)
-
-J
-
Distributions from net realized gain
-
(.66)
-
-
Total distributions
(.02)
(.66)
-J
-
Net asset value, end of period
$ 7.78
$ 14.10
$ 12.05
$ 11.94
Total ReturnB,C,D
(44.69)%
22.45%
.95%
2.58%
Ratios to Average Net AssetsF,I
Expenses before reductions
1.25%
1.22%
1.21%
1.16%A
Expenses net of fee waivers, if any
.93%
1.00%
1.01%
1.00%A
Expenses net of all reductions
.93%
.99%
1.01%
.96%A
Net investment income (loss)
.11%
(.15)%
(.12)%
(.03)%A
Supplemental Data
Net assets, end of period (000 omitted)
$ 3,416
$ 9,142
$ 3,849
$ 2,209
Portfolio turnover rateG
137%
167%
93%
91%
A Annualized
B Total returns for periods of less than one year are not annualized.
C Total returns do not reflect charges attributable to your insurance company's separate account. Inclusion of these charges would reduce the total returns shown.
D Total returns would have been lower had certain expenses not been reduced during the periods shown.
E Calculated based on average shares outstanding during the period.
F Fees and expenses of the underlying Fidelity Central Funds are not included in the Fund's expense ratio. The Fund indirectly bears its proportionate share of the expenses of any underlying Fidelity Central Funds.
G Amount does not include the portfolio activity of any underlying Fidelity Central Funds.
H For the period July 21, 2005 (commencement of sale of shares) to December 31, 2005.
I Expense ratios reflect operating expenses of the class. Expenses before reductions do not reflect amounts reimbursed by the investment adviser or reductions from brokerage service arrangements or other expense offset arrangements and do not represent the amount paid by the class during periods when reimbursements or reductions occur. Expense ratios before reductions for start-up periods may not be representative of longer-term operating periods. Expenses net of fee waivers reflect expenses after reimbursement by the investment adviser but prior to reductions from brokerage service arrangements or other expense offset arrangements. Expenses net of all reductions represent the net expenses paid by the class.
J Amount represents less than $.01 per share.
See accompanying notes which are an integral part of the financial statements.
VIP Growth Stock Portfolio (the Fund) is a fund of Variable Insurance Products Fund IV (the trust) and is authorized to issue an unlimited number of shares. The trust is registered under the Investment Company Act of 1940, as amended (the 1940 Act), as an open-end management investment company organized as a Massachusetts business trust. Shares of the Fund may only be purchased by insurance companies for the purpose of funding variable annuity or variable life insurance contracts. The Fund offers the following classes of shares: Initial Class shares, Service Class shares, Service Class 2 shares, and Investor Class shares. All classes have equal rights and voting privileges, except for matters affecting a single class. Investment income, realized and unrealized capital gains and losses, the common expenses of the Fund, and certain fund-level expense reductions, if any, are allocated on a pro rata basis to each class based on the relative net assets of each class to the total net assets of the Fund. Each class differs with respect to transfer agent and distribution and service plan fees incurred. Certain expense reductions also differ by class.
2. Investments in Fidelity Central Funds.
The Fund may invest in Fidelity Central Funds, which are open-end investment companies available only to other investment companies and accounts managed by Fidelity Management & Research Company (FMR) and its affiliates. The Fund's Schedule of Investments lists each of the Fidelity Central Funds held as of period end, if any, as an investment of the Fund, but does not include the underlying holdings of each Fidelity Central Fund. As an Investing Fund, the Fund indirectly bears its proportionate share of the expenses of the underlying Fidelity Central Funds.
The Money Market Central Funds seek preservation of capital and current income and are managed by Fidelity Investments Money Management, Inc. (FIMM), an affiliate of FMR.
A complete unaudited list of holdings for each Fidelity Central Fund is available upon request or at the SEC's web site at www.sec.gov. In addition, the financial statements of the Fidelity Central Funds, which are not covered by the Fund's Report of Independent Registered Public Accounting Firm, are available on the SEC's web site or upon request.
3. Significant Accounting Policies.
The financial statements have been prepared in conformity with accounting principles generally accepted in the United States of America, which require management to make certain estimates and assumptions at the date of the financial statements. Actual results could differ from those estimates. The following summarizes the significant accounting policies of the Fund:
Security Valuation. Investments are valued as of 4:00 p.m. Eastern time on the last calendar day of the period. Wherever possible, the Fund uses independent pricing services approved by the Board of Trustees to value its investments.
Equity securities, including restricted securities, for which market quotations are readily available, are valued at the last reported sale price or official closing price as reported by an independent pricing service on the primary market or exchange on which they are traded. In the event there were no sales during the day or closing prices are not available, securities are valued at the last quoted bid price. Investments in open-end mutual funds, including the Fidelity Central Funds, are valued at their closing net asset value each business day. Short-term securities with remaining maturities of sixty days or less for which quotations are not readily available are valued at amortized cost, which approximates value.
When current market prices or quotations are not readily available or reliable, valuations may be determined in good faith in accordance with procedures adopted by the Board of Trustees. Factors used in determining value may include significant market or security specific events, changes in interest rates and credit quality, and developments in foreign markets which are monitored by evaluating the performance of ADRs, futures contracts and exchange-traded funds. The frequency with which these procedures are used cannot be predicted and may be utilized to a significant extent. The value of securities used for net asset value (NAV) calculation under these procedures may differ from published prices for the same securities.
The Fund is subject to the provisions of Statement of Financial Accounting Standards No. 157, "Fair Value Measurements" (SFAS 157), effective with the beginning of the Fund's fiscal year. SFAS 157 establishes a hierarchy that prioritizes the inputs to valuation techniques giving the highest priority to readily available unadjusted quoted prices in active markets for identical assets (level 1 measurements) and the lowest priority to unobservable inputs (level 3 measurements) when market prices are not readily available or reliable. The three levels of the hierarchy under SFAS 157 are described below:
Level 1
Quoted prices in active markets for identical securities.
Level 2
Prices determined using other significant observable inputs. Observable inputs are inputs that other market participants may use in pricing a security. These may include quoted prices for similar securities, interest rates, prepayment speeds, credit risk and others.
Level 3
Prices determined using significant unobservable inputs. In situations where quoted prices or observable inputs are unavailable or deemed less relevant (for example, when there is little or no market activity for an investment at the end of the period), unobservable inputs may be used. Unobservable inputs reflect the Fund's own assumptions about the factors market participants would use in pricing an investment, and would be based on the best information available.
Changes in valuation techniques may result in transfers in or out of an investment's assigned level within the hierarchy.
The aggregate value by input level, as of December 31, 2008, for the Fund's investments, as well as a reconciliation of assets for which significant unobservable inputs (Level 3) were used in determining value, is included at the end of the Fund's Schedule of Investments.
Annual Report
3. Significant Accounting Policies - continued
Foreign Currency. The Fund uses foreign currency contracts to facilitate transactions in foreign-denominated securities. Losses from these transactions may arise from changes in the value of the foreign currency or if the counterparties do not perform under the contracts' terms.
Foreign-denominated assets, including investment securities, and liabilities are translated into U.S. dollars at the exchange rate at period end. Purchases and sales of investment securities, income and dividends received and expenses denominated in foreign currencies are translated into U.S. dollars at the exchange rate in effect on the transaction date.
The effects of exchange rate fluctuations on investments are included with the net realized and unrealized gain (loss) on investment securities. Other foreign currency transactions resulting in realized and unrealized gain (loss) are disclosed separately.
Investment Transactions and Income. For financial reporting purposes, the Fund's investment holdings and NAV include trades executed through the end of the last business day of the period. The NAV per share for processing shareholder transactions is calculated as of the close of business of the New York Stock Exchange (NYSE), normally 4:00 p.m. Eastern time and includes trades executed through the end of the prior business day. Gains and losses on securities sold are determined on the basis of identified cost and may include proceeds received from litigation. Dividend income is recorded on the ex-dividend date, except for certain dividends from foreign securities where the ex-dividend date may have passed, which are recorded as soon as the Fund is informed of the ex-dividend date. Non-cash dividends included in dividend income, if any, are recorded at the fair market value of the securities received. Distributions received on securities that represent a return of capital or capital gain are recorded as a reduction of cost of investments and/or as a realized gain. The Fund estimates the components of distributions received that may be considered return of capital distributions or capital gain distributions. Interest income and distributions from the Fidelity Central Funds are accrued as earned. Interest income includes coupon interest and amortization of premium and accretion of discount on debt securities. Investment income is recorded net of foreign taxes withheld where recovery of such taxes is uncertain.
Expenses. Most expenses of the trust can be directly attributed to a fund. Expenses which cannot be directly attributed are apportioned among each Fund in the trust. Expense estimates are accrued in the period to which they relate and adjustments are made when actual amounts are known.
Income Tax Information and Distributions to Shareholders. Each year, the Fund intends to qualify as a regulated investment company by distributing substantially all of its taxable income and realized gains under Subchapter M of the Internal Revenue Code and filing its U.S. federal tax return. As a result, no provision for income taxes is required. The Fund is subject to the provisions of FASB Interpretation No. 48, Accounting for Uncertainties in Income Taxes (FIN 48). FIN 48 sets forth a minimum threshold for financial statement recognition of the benefit of a tax position taken or expected to be taken in a tax return. There are no unrecognized tax benefits in the accompanying financial statements. A Fund's federal tax return is subject to examination by the Internal Revenue Service (IRS) for a period of three years. Foreign taxes are provided for based on the Fund's understanding of the tax rules and rates that exist in the foreign markets in which it invests.
Distributions are recorded on the ex-dividend date. Income dividends and capital gain distributions are declared separately for each class. Income and capital gain distributions are determined in accordance with income tax regulations, which may differ from generally accepted accounting principles.
Capital accounts within the financial statements are adjusted for permanent book-tax differences. These adjustments have no impact on net assets or the results of operations. Temporary book-tax differences will reverse in a subsequent period.
Book-tax differences are primarily due to foreign currency transactions, certain foreign taxes, capital loss carryforwards and losses deferred due to wash sales and excise tax regulations.
The tax-basis components of distributable earnings and the federal tax cost as of period end were as follows:
Unrealized appreciation
$ 330,495
Unrealized depreciation
(4,253,367)
Net unrealized appreciation (depreciation)
(3,922,872)
Undistributed ordinary income
3,524
Capital loss carryforward
(2,310,717)
Cost for federal income tax purposes
$ 14,002,712
The tax character of distributions paid was as follows:
December 31, 2008
December 31, 2007
Ordinary Income
$ 17,221
$ -
Long-term Capital Gains
-
1,360,022
Total
$ 17,221
$ 1,360,022
Annual Report
Notes to Financial Statements - continued
4. Operating Policies.
Repurchase Agreements. FMR has received an Exemptive Order from the Securities and Exchange Commission (the SEC) which permits the Fund and other affiliated entities of FMR to transfer uninvested cash balances into joint trading accounts which are then invested in repurchase agreements. The Fund may also invest directly with institutions in repurchase agreements. Repurchase agreements are collateralized by government or non-government securities. Upon settlement date, collateral is held in segregated accounts with custodian banks and may be obtained in the event of a default of the counterparty. The Fund monitors, on a daily basis, the value of the collateral to ensure it is at least equal to the principal amount of the repurchase agreement (including accrued interest). In the event of a default by the counterparty, realization of the collateral proceeds could be delayed, during which time the value of the collateral may decline.
5. Purchases and Sales of Investments.
Purchases and sales of securities, other than short-term securities, aggregated $29,446,568 and $37,496,932, respectively.
6. Fees and Other Transactions with Affiliates.
Management Fee. FMR and its affiliates provide the Fund with investment management related services for which the Fund pays a monthly management fee. The management fee is the sum of an individual fund fee rate that is based on an annual rate of .30% of the Fund's average net assets and a group fee rate that averaged .26% during the period. The group fee rate is based upon the average net assets of all the mutual funds advised by FMR. The group fee rate decreases as assets under management increase and increases as assets under management decrease. For the period, the total annual management fee rate was .56% of the Fund's average net assets.
Distribution and Service Plan. In accordance with Rule 12b-1 of the 1940 Act, the Fund has adopted separate 12b-1 Plans for each Service Class of shares. Each Service Class pays Fidelity Distributors Corporation (FDC), an affiliate of FMR, a service fee. For the period, the service fee is based on an annual rate of .10% of Service Class' average net assets and .25% of Service Class 2's average net assets.
For the period, each class paid FDC the following amounts, all of which were re-allowed to insurance companies for the distribution of shares and providing shareholder support services:
Service Class
$ 1,887
Service Class 2
10,127
$ 12,014
Transfer Agent Fees. Fidelity Investments Institutional Operations Company, Inc. (FIIOC), an affiliate of FMR, is the Fund's transfer, dividend disbursing, and shareholder servicing agent. FIIOC receives an asset-based fee with respect to each class. Each class (with the exception of Investor Class) pays a transfer agent fee, excluding out of pocket expenses, equal to an annual rate of .07% of average net assets. Investor Class pays a monthly asset-based transfer agent fee of .15% of average net assets. Prior to February 1, 2008, Investor Class paid a monthly asset-based transfer agent fee of .18% of average net assets. The total transfer agent fees paid by each class to FIIOC, including out of pocket expenses, were as follows:
Initial Class
$ 8,809
Service Class
1,324
Service Class 2
4,956
Investor Class
14,658
$ 29,747
Accounting and Security Lending Fees. Fidelity Service Company, Inc. (FSC), an affiliate of FMR, maintains the Fund's accounting records. The accounting fee is based on the level of average net assets for the month. Under a separate contract, FSC administers the security lending program. The security lending fee is based on the number and duration of lending transactions.
Brokerage Commissions. The Fund placed a portion of its portfolio transactions with brokerage firms which are affiliates of the investment adviser. The commissions paid to these affiliated firms were $1,302 for the period.
7. Committed Line of Credit.
The Fund participates with other funds managed by FMR in a $4.2 billion credit facility (the "line of credit") to be utilized for temporary or emergency purposes to fund shareholder redemptions or for other short-term liquidity purposes. The Fund has agreed to pay commitment fees on its pro rata portion of the line of credit, which amounted to $50 and is reflected in Miscellaneous Expense on the Statement of Operations. During the period, there were no borrowings on this line of credit.
Annual Report
8. Security Lending.
The Fund lends portfolio securities from time to time in order to earn additional income. On the settlement date of the loan, the Fund receives collateral (in the form of U.S. Treasury obligations, letters of credit and/or cash) against the loaned securities and maintains collateral in an amount not less than 100% of the market value of the loaned securities during the period of the loan. The market value of the loaned securities is determined at the close of business of the Fund and any additional required collateral is delivered to the Fund on the next business day. If the borrower defaults on its obligation to return the securities loaned because of insolvency or other reasons, a fund could experience delays and costs in recovering the securities loaned or in gaining access to the collateral. Any cash collateral received is invested in the Fidelity Securities Lending Cash Central Fund. The value of loaned securities and cash collateral at period end are disclosed on the Fund's Statement of Assets and Liabilities. Security lending income represents the income earned on investing cash collateral, less fees and expenses associated with the loan, plus any premium payments that may be received on the loan of certain types of securities. Security lending income is presented in the Statement of Operations as a component of income from Fidelity Central Funds.
9. Expense Reductions.
FMR voluntarily agreed to reimburse each class to the extent annual operating expenses exceeded certain levels of average net assets as noted in the table below. Some expenses, for example interest expense, including commitment fees, are excluded from this reimbursement.
The following classes were in reimbursement during the period:
Expense Limitations
Reimbursement from adviser
Initial Class
.85%
$ 25,216
Service Class
.95%
5,015
Service Class 2
1.10%
12,889
Investor Class
1.00% - .93%*
23,293
$ 66,413
* Expense limitation in effect at period end.
Effective February 1, 2008, the expense limitation changed to .93% for Investor Class.
Many of the brokers with whom FMR places trades on behalf of the Fund provided services to the Fund in addition to trade execution. These services included payments of certain expenses on behalf of the Fund totaling $791 for the period.
10. Other.
The Fund's organizational documents provide former and current trustees and officers with a limited indemnification against liabilities arising in connection with the performance of their duties to the Fund. In the normal course of business, the Fund may also enter into contracts that provide general indemnifications. The Fund's maximum exposure under these arrangements is unknown as this would be dependent on future claims that may be made against the Fund. The risk of material loss from such claims is considered remote.
At the end of the period, FMR or its affiliates were the owners of record of 87% of the total outstanding shares of the Fund.
In December 2006, the Independent Trustees, with the assistance of independent counsel, completed an investigation regarding gifts, gratuities and business entertainment provided by certain brokers to certain individuals who were employed on FMR's domestic equity trading desk during the period 2002 to 2004. The Independent Trustees and FMR agreed that, despite the absence of proof that the Fidelity mutual funds experienced diminished execution quality as a result of the improper receipt of gifts and business entertainment, the conduct at issue was serious and was worthy of redress. Accordingly, the Independent Trustees requested, and FMR agreed to make, a payment of $42 million plus accrued interest, which equaled approximately $7.3 million,to certain Fidelity mutual funds.
In March 2008, the Trustees approved a method for allocating this payment among the funds and, in total, FMR paid the fund $1,405, which is recorded in the accompanying Statement of Operations.
In a related administrative order dated March 5, 2008, the U.S. Securities and Exchange Commission ("SEC") announced a settlement with FMR and FMR Co., Inc. (an affiliate of FMR) involving the SEC's regulatory rules for investment advisers and the improper receipt of gifts, gratuities and business entertainment. Without admitting or denying the SEC's findings, FMR agreed to pay an $8 million civil penalty to the United States Treasury.
Annual Report
Notes to Financial Statements - continued
11. Distributions to Shareholders.
Distributions to shareholders of each class were as follows:
Years ended December 31,
2008
2007
From net investment income
Initial Class
$ 8,154
$ -
Service Class
656
-
Investor Class
8,411
-
Total
$ 17,221
$ -
From net realized gain
Initial Class
$ -
$ 611,437
Service Class
-
114,028
Service Class 2
-
230,890
Investor Class
-
403,667
Total
$ -
$ 1,360,022
12. Share Transactions.
Transactions for each class of shares were as follows:
Shares
Dollars
Years ended December 31,
2008
2007
2008
2007
Initial Class
Shares sold
180,482
548,074
$ 2,074,455
$ 7,846,894
Reinvestment of distributions
1,060
42,938
8,154
611,437
Shares redeemed
(722,244)
(233,361)
(8,341,769)
(2,969,140)
Net increase (decrease)
(540,702)
357,651
$ (6,259,160)
$ 5,489,191
Service Class
Reinvestment of distributions
86
8,053
656
114,028
Shares redeemed
(49,669)
-
(519,049)
-
Net increase (decrease)
(49,583)
8,053
$ (518,393)
$ 114,028
Service Class 2
Shares sold
79,695
111,476
$ 920,792
$ 1,498,608
Reinvestment of distributions
-
16,445
-
230,890
Shares redeemed
(162,963)
(30,981)
(1,660,933)
(410,132)
Net increase (decrease)
(83,268)
96,940
$ (740,141)
$ 1,319,366
Investor Class
Shares sold
281,169
557,173
$ 3,422,986
$ 7,720,308
Reinvestment of distributions
1,099
28,447
8,411
403,667
Shares redeemed
(491,415)
(256,772)
(5,183,719)
(3,382,347)
Net increase (decrease)
(209,147)
328,848
$ (1,752,322)
$ 4,741,628
Annual Report
Reportof Independent Registered Public Accounting Firm
To the Trustees of Variable Insurance Products Fund IV and the Shareholders of VIP Growth Stock Portfolio:
In our opinion, the accompanying statement of assets and liabilities, including the schedule of investments, and the related statements of operations and of changes in net assets and the financial highlights present fairly, in all material respects, the financial position of VIP Growth Stock Portfolio (a fund of Variable Insurance Products Fund IV) at December 31, 2008, the results of its operations for the year then ended, the changes in its net assets for each of the two years in the period then ended and the financial highlights for each of the periods indicated, in conformity with accounting principles generally accepted in the United States of America. These financial statements and financial highlights (hereafter referred to as "financial statements") are the responsibility of the VIP Growth Stock Portfolio's management. Our responsibility is to express an opinion on these financial statements based on our audits. We conducted our audits of these financial statements in accordance with the standards of the Public Company Accounting Oversight Board (United States). Those standards require that we plan and perform the audit to obtain reasonable assurance about whether the financial statements are free of material misstatement. An audit includes examining, on a test basis, evidence supporting the amounts and disclosures in the financial statements, assessing the accounting principles used and significant estimates made by management, and evaluating the overall financial statement presentation. We believe that our audits, which included confirmation of securities at December 31, 2008 by correspondence with the custodian and brokers, provide a reasonable basis for our opinion.
The Trustees, Member of the Advisory Board, and executive officers of the trust and fund, as applicable, are listed below. The Board of Trustees governs the fund and is responsible for protecting the interests of shareholders. The Trustees are experienced executives who meet periodically throughout the year to oversee the fund's activities, review contractual arrangements with companies that provide services to the fund, and review the fund's performance. Except for Edward C. Johnson 3d and James C. Curvey, each of the Trustees oversees 222 funds advised by FMR or an affiliate. Messrs. Johnson and Curvey oversee 380 funds advised by FMR or an affiliate.
The Trustees hold office without limit in time except that (a) any Trustee may resign; (b) any Trustee may be removed by written instrument, signed by at least two-thirds of the number of Trustees prior to such removal; (c) any Trustee who requests to be retired or who has become incapacitated by illness or injury may be retired by written instrument signed by a majority of the other Trustees; and (d) any Trustee may be removed at any special meeting of shareholders by a two-thirds vote of the outstanding voting securities of the trust. Each Trustee who is not an interested person (as defined in the 1940 Act) (Independent Trustee), shall retire not later than the last day of the calendar year in which his or her 72nd birthday occurs. The Independent Trustees may waive this mandatory retirement age policy with respect to individual Trustees. The executive officers and Advisory Board Member hold office without limit in time, except that any officer and Advisory Board Member may resign or may be removed by a vote of a majority of the Trustees at any regular meeting or any special meeting of the Trustees. Except as indicated, each individual has held the office shown or other offices in the same company for the past five years.
The fund's Statement of Additional Information (SAI) includes more information about the Trustees. To request a free copy, call Fidelity at 1-877-208-0098.
Interested Trustees*:
Correspondence intended for each Trustee who is an interested person may be sent to Fidelity Investments, 82 Devonshire Street, Boston, Massachusetts 02109.
Name, Age; Principal Occupation
Edward C. Johnson 3d (78)
Year of Election or Appointment: 1983
Mr. Johnson is Chairman of the Board of Trustees. Mr. Johnson serves as Chief Executive Officer, Chairman, and a Director of FMR LLC; Chairman and a Director of FMR; Chairman and a Director of Fidelity Research & Analysis Company (FRAC); Chairman and a Director of Fidelity Investments Money Management, Inc.; and Chairman and a Director of FMR Co., Inc. In addition, Mr. Johnson serves as Chairman and Director of FIL Limited. Previously, Mr. Johnson served as President of FMR LLC (2006-2007).
James C. Curvey (73)
Year of Election or Appointment: 2007
Mr. Curvey also serves as Trustee (2007-present) of other investment companies advised by FMR. Mr. Curvey is a Director of FMR and FMR Co., Inc. (2007-present). Mr. Curvey is also Vice Chairman (2006-present) and Director of FMR LLC. In addition, Mr. Curvey serves as an Overseer for the Boston Symphony Orchestra and a member of the Trustees of Villanova University.
* Trustees have been determined to be "Interested Trustees" by virtue of, among other things, their affiliation with the trust or various entities under common control with FMR. FMR Corp. merged with and into FMR LLC on October 1, 2007. Any references to FMR LLC for prior periods are deemed to be references to the prior entity.
Independent Trustees:
Correspondence intended for each Independent Trustee (that is, the Trustees other than the Interested Trustees) may be sent to Fidelity Investments, P.O. Box 55235, Boston, Massachusetts 02205-5235.
Name, Age; Principal Occupation
Dennis J. Dirks (60)
Year of Election or Appointment: 2005
Prior to his retirement in May 2003, Mr. Dirks was Chief Operating Officer and a member of the Board of The Depository Trust & Clearing Corporation (DTCC) (1999-2003). He also served as President, Chief Operating Officer, and Board member of The Depository Trust Company (DTC) (1999-2003) and President and Board member of the National Securities Clearing Corporation (NSCC) (1999-2003). In addition, Mr. Dirks served as Chief Executive Officer and Board member of the Government Securities Clearing Corporation (2001-2003), Chief Executive Officer and Board member of the Mortgage-Backed Securities Clearing Corporation (2001-2003), as a Trustee and a member of the Finance Committee of Manhattan College (2005-2008), and as a Trustee and a member of the Finance Committee of AHRC of Nassau County (2006-2008). Currently, Mr. Dirks serves as a member of the Board of Directors for The Brookville Center for Children's Services, Inc. (2009-present).
Alan J. Lacy (55)
Year of Election or Appointment: 2008
Mr. Lacy serves as Senior Adviser (2007-present) of Oak Hill Capital Partners, L.P. (a private equity firm). Mr. Lacy also served as Chief Executive Officer (2000-2005) and Vice Chairman (2005-2006) of Sears Holdings Corporation and Sears, Roebuck and Co. (retail). In addition, Mr. Lacy serves as a member of the Board of Directors of The Western Union Company (global money transfer, 2006-present) and Bristol-Myers Squibb (global pharmaceuticals, 2007-present). Mr. Lacy is a Trustee of the National Parks Conservation Association and The Field Museum of Natural History.
Ned C. Lautenbach (64)
Year of Election or Appointment: 2000
Mr. Lautenbach is Chairman of the Independent Trustees (2006-present). Mr. Lautenbach is an Advisory Partner of Clayton, Dubilier & Rice, Inc. (private equity investment firm). Previously, Mr. Lautenbach was with the International Business Machines Corporation (IBM) from 1968 until his retirement in 1998. Mr. Lautenbach serves as a Director of Eaton Corporation (diversified industrial) as well as the Philharmonic Center for the Arts in Naples, Florida. He also is a member of the Board of Trustees of Fairfield University (2005-present), as well as a member of the Council on Foreign Relations. Previously, Mr. Lautenbach served as a Director of Sony Corporation (2006-2007).
Joseph Mauriello (64)
Year of Election or Appointment: 2008
Prior to his retirement in January 2006, Mr. Mauriello served in numerous senior management positions including Deputy Chairman and Chief Operating Officer (2004-2005), and Vice Chairman of Financial Services (2002-2004) of KPMG LLP US (professional services firm, 1965-2005). Mr. Mauriello currently serves as a member of the Board of Directors of XL Capital Ltd. (global insurance and re-insurance company, 2006-present) and of Arcadia Resources Inc. (health care services and products, 2007-present). He also served as a Director of the Hamilton Funds of the Bank of New York (2006-2007).
Cornelia M. Small (64)
Year of Election or Appointment: 2005
Ms. Small is a member of the Investment Committee, and Chair (2008-present) and a member of the Board of Trustees of Smith College. Ms. Small also serves on the Investment Committee of the Berkshire Taconic Community Foundation (2008-present). Previously, Ms. Small served as Chairperson of the Investment Committee (2002-2008) of Smith College and as Co-Chair (2000-2003) of the Annual Fund for the Fletcher School of Law and Diplomacy. In addition, she served as Chief Investment Officer, Director of Global Equity Investments, and a member of the Board of Directors of Scudder, Stevens & Clark and Scudder Kemper Investments.
William S. Stavropoulos (69)
Year of Election or Appointment: 2001
Mr. Stavropoulos is Chairman Emeritus of the Board of Directors of The Dow Chemical Company, where he previously served in numerous senior management positions, including President (1993-2000; 2002-2003), CEO (1995-2000; 2002-2004), Chairman of the Executive Committee (2000-2006), and as a member of the Board of Directors (1990-2006). Currently, he is a Director of Teradata Corporation (data warehousing and technology solutions, 2008-present), Chemical Financial Corporation, Maersk Inc. (industrial conglomerate), Tyco International, Inc. (multinational manufacturing and services, 2007-present), and a member of the Advisory Board for Metalmark Capital (private equity investment firm, 2005-present). He is a special advisor to Clayton, Dubilier & Rice, Inc. (private equity investment). In addition, Mr. Stavropoulos is a member of the University of Notre Dame Advisory Council for the College of Science.
David M. Thomas (59)
Year of Election or Appointment: 2008
Previously, Mr. Thomas served as Executive Chairman (2005-2006) and Chairman and Chief Executive Officer (2000-2005) of IMS Health, Inc. (pharmaceutical and healthcare information solutions). In addition, Mr. Thomas serves as a member of the Board of Directors of Fortune Brands, Inc. (consumer products holding company), and Interpublic Group of Companies, Inc. (marketing communication, 2004-present).
Michael E. Wiley (58)
Year of Election or Appointment: 2008
Mr. Wiley also serves as a member of the Board of Trustees of the University of Tulsa (2000-2006; 2007-present). He serves as a Director of Tesoro Corporation (independent oil refiner and marketer, 2005-present), and a Director of Bill Barrett Corporation (exploration and production company, 2005-present). In addition, he also serves as a Director of Post Oak Bank (privately-held bank, 2004-present). Previously, Mr. Wiley served as a Sr. Energy Advisor of Katzenbach Partners, LLC (consulting firm, 2006-2007), as an Advisory Director of Riverstone Holdings (private investment firm), Chairman, President, and CEO of Baker Hughes, Inc. (oilfield services company, 2000-2004), and as Director of Spinnaker Exploration Company (exploration and production company, 2001-2005).
Annual Report
Trustees and Officers - continued
Advisory Board Member and Executive Officers**:
Correspondence intended for each executive officer and Mr. Lynch may be sent to Fidelity Investments, 82 Devonshire Street, Boston, Massachusetts 02109.
Name, Age; Principal Occupation
Peter S. Lynch (64)
Year of Election or Appointment: 2003
Member of the Advisory Board of Fidelity's Equity and High Income Funds. Mr. Lynch is Vice Chairman and a Director of FMR, and Vice Chairman (2001-present) and a Director of FMR Co., Inc. Previously, Mr. Lynch served as a Trustee of the Fidelity funds (1990-2003). In addition, he serves as a Trustee of Boston College and as the Chairman of the Inner-City Scholarship Fund. Previously, Mr. Lynch served on the Special Olympics International Board of Directors (1997-2006).
Kenneth B. Robins (39)
Year of Election or Appointment: 2008
President and Treasurer of Fidelity's Equity and High Income Funds. Mr. Robins is an employee of Fidelity Investments (2004-present). Before joining Fidelity Investments, Mr. Robins worked at KPMG LLP, where he was a partner in KPMG's department of professional practice (2002-2004).
Walter C. Donovan (46)
Year of Election or Appointment: 2007
Vice President of Fidelity's Equity Funds. Mr. Donovan also serves as President of FMR and FMR Co., Inc., and Executive Vice President of Fidelity Investments Money Management, Inc. (2007-present). Previously, Mr. Donovan served as Executive Vice President of FMR and FMR Co., Inc. (2005-2007) and Senior Vice President of FMR (2003-2005) and FMR Co., Inc. (2004-2005).
Bruce T. Herring (43)
Year of Election or Appointment: 2006
Vice President of certain Equity Funds. Mr. Herring also serves as Group Chief Investments Officer of FMR. Previously, Mr. Herring served as a portfolio manager for Fidelity U.S. Equity Funds.
Scott C. Goebel (40)
Year of Election or Appointment: 2008
Secretary and Chief Legal Officer (CLO) of the Fidelity funds. Mr. Goebel also serves as General Counsel, Secretary, and Senior Vice President of FMR (2008-present); Deputy General Counsel of FMR LLC; Chief Legal Secretary of Fidelity Management & Research (Hong Kong) Limited (2008-present) and Assistant Secretary of Fidelity Management & Research (Japan) Inc. (2008-present). Previously, Mr. Goebel served as Assistant Secretary of the Funds (2007-2008) and as Vice President and Secretary of Fidelity Distributors Corporation (FDC) (2005-2007).
John B. McGinty, Jr. (46)
Year of Election or Appointment: 2008
Assistant Secretary of Fidelity's Equity and High Income Funds. Mr. McGinty is an employee of Fidelity Investments (2004-present). Mr. McGinty also serves as Senior Vice President, Secretary, and Chief Legal Officer of FDC (2007-present). Before joining Fidelity Investments, Mr. McGinty practiced law at Ropes & Gray, LLP.
Holly C. Laurent (54)
Year of Election or Appointment: 2008
Anti-Money Laundering (AML) Officer of the Fidelity funds. Ms. Laurent is an employee of Fidelity Investments. Previously, Ms. Laurent was Senior Vice President and Head of Legal for Fidelity Business Services India Pvt. Ltd. (2006-2008), Senior Vice President, Deputy General Counsel and Group Head for FMR LLC (2005-2006).
Christine Reynolds (50)
Year of Election or Appointment: 2008
Chief Financial Officer of the Fidelity funds. Ms. Reynolds became President of Fidelity Pricing and Cash Management Services (FPCMS) in August 2008. She served as Chief Operating Officer of FPCMS from 2007 through July 2008. Previously, Ms. Reynolds served as President, Treasurer, and Anti-Money Laundering officer of the Fidelity funds (2004-2007). Before joining Fidelity Investments, Ms. Reynolds worked at PricewaterhouseCoopers LLP (PwC) (1980-2002), where she was an audit partner with PwC's investment management practice.
Kenneth A. Rathgeber (61)
Year of Election or Appointment: 2004
Chief Compliance Officer of Fidelity's Equity and High Income Funds. Mr. Rathgeber is Chief Compliance Officer of Fidelity Management & Research (Hong Kong) Limited (2008-present), Fidelity Management & Research (Japan) Inc. (2008-present), FMR (2005-present), FMR Co., Inc. (2005-present), Fidelity Management & Research (U.K.) Inc. (2005-present), Fidelity Research & Analysis Company (2005-present), Fidelity Investments Money Management, Inc. (2005-present), and Strategic Advisers, Inc. (2005-present).
Bryan A. Mehrmann (47)
Year of Election or Appointment: 2005
Deputy Treasurer of the Fidelity funds. Mr. Mehrmann is an employee of Fidelity Investments. Previously, Mr. Mehrmann served as Vice President of Fidelity Investments Institutional Services Group (FIIS)/Fidelity Investments Institutional Operations Company, Inc. (FIIOC) Client Services (1998-2004).
Adrien E. Deberghes (41)
Year of Election or Appointment: 2008
Deputy Treasurer of Fidelity's Equity and High Income Funds. Mr. Deberghes is an employee of Fidelity Investments (2008-present). Previously, Mr. Deberghes served as Senior Vice President of Mutual Fund Administration at State Street Corporation (2007-2008), Senior Director of Mutual Fund Administration at Investors Bank & Trust (2005-2007), and Director of Finance for Dunkin' Brands (2000-2005).
Robert G. Byrnes (42)
Year of Election or Appointment: 2005
Assistant Treasurer of the Fidelity funds. Mr. Byrnes is an employee of Fidelity Investments (2005-present). Previously, Mr. Byrnes served as Vice President of Fidelity Pricing and Cash Management Services (FPCMS) (2003-2005). Before joining Fidelity Investments, Mr. Byrnes worked at Deutsche Asset Management where he served as Vice President of the Investment Operations Group (2000-2003).
Paul M. Murphy (61)
Year of Election or Appointment: 2007
Assistant Treasurer of the Fidelity funds. Mr. Murphy is an employee of Fidelity Investments (2007-present). Previously, Mr. Murphy served as Chief Financial Officer of the Fidelity Funds (2005-2006), Vice President and Associate General Counsel of FMR (2007), and Senior Vice President of Fidelity Pricing and Cash Management Services (FPCMS) (1994-2007).
Gary W. Ryan (50)
Year of Election or Appointment: 2005
Assistant Treasurer of the Fidelity funds. Mr. Ryan is an employee of Fidelity Investments. Previously, Mr. Ryan served as Vice President of Fund Reporting in Fidelity Pricing and Cash Management Services (FPCMS) (1999-2005).
** FMR Corp. merged with and into FMR LLC on October 1, 2007. Any references to FMR LLC for prior periods are deemed to be references to the prior entity.
A special meeting of the fund's shareholders was held on May 14, 2008. The results of votes taken among shareholders on the proposals before them are reported below. Each vote reported represents one dollar of net asset value held on the record date for the meeting.
PROPOSAL 1
To elect a Board of Trustees.A
# of Votes
% of Votes
James C. Curvey
Affirmative
82,890,712.47
95.991
Withheld
3,461,988.43
4.009
TOTAL
86,352,700.90
100.000
Dennis J. Dirks
Affirmative
82,970,372.75
96.083
Withheld
3,382,328.15
3.917
TOTAL
86,352,700.90
100.000
Edward C. Johnson 3d
Affirmative
82,689,162.78
95.757
Withheld
3,663,538.12
4.243
TOTAL
86,352,700.90
100.000
Alan J. Lacy
Affirmative
83,041,222.35
96.165
Withheld
3,311,478.55
3.835
TOTAL
86,352,700.90
100.000
Ned C. Lautenbach
Affirmative
82,983,853.72
96.099
Withheld
3,368,847.18
3.901
TOTAL
86,352,700.90
100.000
Joseph Mauriello
Affirmative
83,138,122.14
96.277
Withheld
3,214,578.76
3.723
TOTAL
86,352,700.90
100.000
Cornelia M. Small
Affirmative
83,095,438.06
96.228
Withheld
3,257,262.84
3.772
TOTAL
86,352,700.90
100.000
William S. Stavropoulos
Affirmative
82,929,113.95
96.035
Withheld
3,423,586.95
3.965
TOTAL
86,352,700.90
100.000
David M. Thomas
Affirmative
83,095,487.87
96.228
Withheld
3,257,213.03
3.772
TOTAL
86,352,700.90
100.000
Michael E. Wiley
Affirmative
83,048,523.75
96.174
Withheld
3,304,177.15
3.826
TOTAL
86,352,700.90
100.000
PROPOSAL 2
To amend the Declaration of Trust to reduce the required quorum for future shareholder meetings.A
# of Votes
% of Votes
Affirmative
74,393,635.26
86.151
Against
8,745,543.59
10.128
Abstain
3,213,522.05
3.721
TOTAL
86,352,700.90
100.000
ADenotes trust-wide proposal and voting results.
Annual Report
BoardApproval of Investment Advisory Contracts and Management Fees
VIP Growth Stock Portfolio
Each year, typically in July, the Board of Trustees, including the Independent Trustees (together, the Board), votes on the renewal of the management contract and sub-advisory agreements (together, the Advisory Contracts) for the fund. The Board, assisted by the advice of fund counsel and Independent Trustees' counsel, requests and considers a broad range of information throughout the year.
The Board meets regularly and, acting directly and through its separate committees, requests and receives information concerning, and considers at each of its meetings factors that are relevant to, its annual consideration of the renewal of the fund's Advisory Contracts, including the services and support provided to the fund and its shareholders. At the time of the renewal, the Board had 12 standing committees, each composed of Independent Trustees with varying backgrounds, to which the Board has assigned specific subject matter responsibilities in order to enhance effective decision-making by the Board. Each committee has a written charter outlining the structure and purposes of the committee. The Board also meets as needed to consider matters specifically related to the Board's annual consideration of the renewal of Advisory Contracts.
At its July 2008 meeting, the Board of Trustees, including the Independent Trustees, unanimously determined to renew the fund's Advisory Contracts. In reaching its determination, the Board considered all factors it believed relevant, including (i) the nature, extent, and quality of the services to be provided to the fund and its shareholders (including the investment performance of the fund); (ii) the competitiveness of the fund's management fee and total expenses; (iii) the total costs of the services to be provided by and the profits to be realized by Fidelity from its relationship with the fund; (iv) the extent to which economies of scale would be realized as the fund grows; and (v) whether fee levels reflect these economies of scale, if any, for the benefit of fund shareholders. The Board also approved agreements with foreign sub-advisers Fidelity Management & Research (Japan) Inc. and Fidelity Management & Research (Hong Kong) Limited, as well as amendments to the fund's agreement with Fidelity Management & Research (U.K.) Inc.
In considering whether to renew the Advisory Contracts for the fund, the Board ultimately reached a determination, with the assistance of fund counsel and Independent Trustees' counsel and through the exercise of its business judgment, that the renewal of the Advisory Contracts and the compensation to be received by Fidelity under the management contract is consistent with Fidelity's fiduciary duty under applicable law. The Board's decision to renew the Advisory Contracts was not based on any single factor noted above, but rather was based on a comprehensive consideration of all the information provided to the Board at its meetings throughout the year. The Board, in reaching its determination to renew the Advisory Contracts, is aware that shareholders in the fund have a broad range of investment choices available to them, including a wide choice among mutual funds offered by competitors to Fidelity, and that the fund's shareholders, with the opportunity to review and weigh the disclosure provided by the fund in its prospectus and other public disclosures, have chosen to invest in this fund, managed by Fidelity.
Nature, Extent, and Quality of Services Provided. The Board considered staffing within the investment adviser, FMR, and the sub-advisers (together, the Investment Advisers), including the backgrounds of the fund's investment personnel and the fund's investment objective and discipline. The Independent Trustees also had discussions with senior management of Fidelity's investment operations and investment groups. The Board considered the structure of the portfolio manager compensation program and whether this structure provides appropriate incentives.
Resources Dedicated to Investment Management and Support Services. The Board reviewed the size, education, and experience of the Investment Advisers' investment staff, their use of technology, and the Investment Advisers' approach to recruiting, training, and retaining portfolio managers and other research, advisory, and management personnel. The Board noted that Fidelity's analysts have access to a variety of technological tools that enable them to perform both fundamental and quantitative analysis and to specialize in various disciplines. The Board considered Fidelity's extensive global research capabilities that enable the Investment Advisers to aggregate data from various sources in an effort to produce positive investment results. The Board also considered that Fidelity's portfolio managers and analysts have access to daily portfolio attribution that allows for monitoring of a fund's portfolio, as well as an electronic communication system that provides immediate real-time access to research concerning issuers and credit enhancers.
Shareholder and Administrative Services. The Board considered (i) the nature, extent, quality, and cost of advisory, administrative, distribution, and shareholder services performed by the Investment Advisers and their affiliates under the Advisory Contracts and under separate agreements covering transfer agency, pricing and bookkeeping, and securities lending services for the fund; (ii) the nature and extent of the Investment Advisers' supervision of third party service providers, principally custodians and subcustodians; and (iii) the resources devoted to, and the record of compliance with, the fund's compliance policies and procedures. The Board also reviewed the allocation of fund brokerage, including allocations to brokers affiliated with the Investment Advisers, the use of brokerage commissions to pay fund expenses, and the use of "soft" commission dollars to pay for research services. The Board further considered that Fidelity voluntarily pays for market data out of its own resources.
The Board noted that the growth of fund assets across the complex allows Fidelity to reinvest in the development of services designed to enhance the value or convenience of the Fidelity funds as investment vehicles. These services include 24-hour access to account information and market information through phone representatives and over the Internet, and investor education materials and asset allocation tools.
Investment in a Large Fund Family. The Board considered the benefits to shareholders of investing in a Fidelity fund, including the benefits of investing in a fund that is part of a large family of funds offering a variety of investment disciplines and providing for a large variety of mutual fund investor services. The Board noted that Fidelity has taken a number of actions over the previous year that benefited particular funds, including (i) dedicating additional resources to investment research and to restructure the investment research teams; (ii) contractually agreeing to reduce the management fees on Fidelity's Institutional Money Market Funds and launching Class IV and Institutional Class of certain of these funds; (iii) reducing the transfer agent fees for the Fidelity Select Portfolios and Investor Class of the VIP funds; and (iv) launching Class K of 29 equity funds as a lower-fee class available to certain employer-sponsored retirement plans.
Annual Report
Board Approval of Investment Advisory Contracts and Management Fees - continued
Investment Performance. The Board considered whether the fund has operated within its investment objective, as well as its record of compliance with its investment restrictions. It also reviewed the fund's absolute investment performance for each class, as well as the fund's relative investment performance for each class measured against (i) a broad-based securities market index, and (ii) a peer group of mutual funds deemed appropriate by the Board over multiple periods. The following charts considered by the Board show, over the one-, three-, and five-year periods ended December 31, 2007, the cumulative total returns of Initial Class and Service Class 2 of the fund, the cumulative total returns of a broad-based securities market index ("benchmark"), and a range of cumulative total returns of a peer group of mutual funds identified by Morningstar, Inc. as having an investment style similar to that of the fund based on underlying portfolio holdings. The returns of Initial Class and Service Class 2 show the performance of the highest and lowest performing classes, respectively (based on three-year performance). The box within each chart shows the 25th percentile return (bottom of box) and the 75th percentile return (top of box) of the peer group. Returns shown above the box are in the first quartile and returns shown below the box are in the fourth quartile. The percentage beaten numbers noted below each chart correspond to the percentile box and represent the percentage of funds in the peer group whose performance was equal to or lower than that of the class indicated.
VIP Growth Stock Portfolio
The Board reviewed the fund's relative investment performance against its peer group and stated that the performance of Initial Class of the fund was in the first quartile for the one-year period, the second quartile for the three-year period, and the third quartile for the five-year period. The Board also stated that the investment performance of Initial Class of the fund compared favorably to its benchmark for the one- and three-year periods, although the fund's five-year cumulative total return was lower than its benchmark. The Board considered that the variations in performance among the fund's classes reflect the variations in class expenses, which result in lower performance for higher expense classes.
The Board considered that FMR has taken steps to refocus and strengthen equity research, equity portfolio management, and compliance.
Based on its review, and giving particular weight to the nature and quality of the resources dedicated by the Investment Advisers to maintain and improve relative performance, the Board concluded that the nature, extent, and quality of the services provided to the fund will benefit the fund's shareholders, particularly in light of the Board's view that the fund's shareholders benefit from investing in a fund that is part of a large family of funds offering a variety of investment disciplines and services.
Competitiveness of Management Fee and Total Fund Expenses. The Board considered the fund's management fee and total expenses compared to "mapped groups" of competitive funds and classes. Fidelity creates "mapped groups" by combining similar Lipper investment objective categories that have comparable management fee characteristics. Combining Lipper investment objective categories aids the Board's management fee and total expense comparisons by broadening the competitive group used for comparison and by reducing the number of universes to which various Fidelity funds are compared. The Board also considered supplemental information about how the fund's management fee and total expenses ranked relative to groups based on Lipper classifications, which take into account a fund's market capitalization and style.
The Board considered two proprietary management fee comparisons for the 12-month periods shown in the chart below. The group of Lipper funds used by the Board for management fee comparisons is referred to below as the "Total Mapped Group." The Total Mapped Group comparison focuses on a fund's standing relative to the total universe of comparable funds available to investors, in terms of gross management fees before expense reimbursements or caps. "TMG %" represents the percentage of funds in the Total Mapped Group that had management fees that were lower than the fund's. For example, a TMG % of 8% means that 92% of the funds in the Total Mapped Group had higher management fees than the fund. The "Asset-Size Peer Group" (ASPG) comparison focuses on a fund's standing relative to non-Fidelity funds similar in size to the fund within the Total Mapped Group. The ASPG represents at least 15% of the funds in the Total Mapped Group with comparable asset size and management fee characteristics, subject to a minimum of 50 funds (or all funds in the Total Mapped Group if fewer than 50). Additional information, such as the ASPG quartile in which the fund's management fee ranked, is also included in the chart and considered by the Board.
Annual Report
VIP Growth Stock Portfolio
The Board noted that the fund's management fee ranked below the median of its Total Mapped Group and below the median of its ASPG for 2007.
Based on its review, the Board concluded that the fund's management fee was fair and reasonable in light of the services that the fund receives and the other factors considered.
In its review of each class's total expenses, the Board considered the fund's management fee as well as other fund or class expenses, as applicable, such as transfer agent fees, pricing and bookkeeping fees, fund-paid 12b-1 fees, and custodial, legal, and audit fees. The Board also noted the effects of any waivers and reimbursements on fees and expenses. As part of its review, the Board also considered current and historical total expenses of each class of the fund compared to competitive fund median expenses. Each class of the fund is compared to those funds and classes in the Total Mapped Group (used by the Board for management fee comparisons) that have a similar sales load structure.
The Board noted that the total expenses of Initial Class ranked below its competitive median for 2007, and the total expenses of each of Investor Class, Service Class, and Service Class 2 ranked above its competitive median for 2007. The Board considered that the total expenses of Investor Class were above the median primarily due to its higher transfer agent fee. The Board noted that the fund offers multiple classes, each of which has a different 12b-1 fee structure, and that the multiple structures are intended to offer a range of pricing options for the intermediary market. The Board also noted that the total expenses of the classes vary primarily by the level of their 12b-1 fees, although differences in transfer agent fees may also cause expenses to vary from class to class.
In its review of total expenses, the Board also considered Fidelity fee structures and other information on clients that FMR and its affiliates service in other competitive markets, such as other mutual funds advised or subadvised by FMR or its affiliates, pension plan clients, and other institutional clients.
Based on its review, the Board concluded that the total expenses of each class of the fund were reasonable, although in some cases above the median of the universe presented for comparison, in light of the services that the fund and its shareholders receive and the other factors considered.
Costs of the Services and Profitability. The Board considered the revenues earned and the expenses incurred by Fidelity in conducting the business of developing, marketing, distributing, managing, administering and servicing the fund and its shareholders. The Board also considered the level of Fidelity's profits in respect of all the Fidelity funds.
Annual Report
Board Approval of Investment Advisory Contracts and Management Fees - continued
On an annual basis, FMR presents to the Board Fidelity's profitability for the fund. Fidelity calculates the profitability for each fund, as well as aggregate profitability for groups of Fidelity funds and all Fidelity funds, using a series of detailed revenue and cost allocation methodologies which originate with the audited books and records of Fidelity. The Audit Committee of the Board reviews any significant changes from the prior year's methodologies.
PricewaterhouseCoopers LLP (PwC), independent registered public accounting firm and auditor to Fidelity and certain Fidelity funds, has been engaged annually by the Board as part of the Board's assessment of the results of Fidelity's profitability analysis. PwC's engagement includes the review and assessment of Fidelity's methodologies used in determining the revenues and expenses attributable to Fidelity's mutual fund business, and completion of agreed-upon procedures surrounding the mathematical accuracy of fund profitability and its conformity to allocation methodologies. After considering PwC's reports issued under the engagement and information provided by Fidelity, the Board believes that while other allocation methods may also be reasonable, Fidelity's profitability methodologies are reasonable in all material respects.
The Board has also reviewed Fidelity's non-fund businesses and any fall-out benefits related to the mutual fund business as well as cases where Fidelity's affiliates may benefit from or be related to the fund's business.
The Board considered the costs of the services provided by and the profits realized by Fidelity in connection with the operation of the fund and determined that the amount of profit is a fair entrepreneurial profit for the management of the fund.
Economies of Scale. The Board considered whether there have been economies of scale in respect of the management of the Fidelity funds, whether the Fidelity funds (including the fund) have appropriately benefited from any such economies of scale, and whether there is potential for realization of any further economies of scale. The Board considered the extent to which the fund will benefit from economies of scale through increased services to the fund, through waivers or reimbursements, or through fee or expense reductions.
The Board recognized that the fund's management contract incorporates a "group fee" structure, which provides for lower group fee rates as total fund assets under FMR's management increase, and for higher group fee rates as total fund assets under FMR's management decrease. FMR determines the group fee rates based on a tiered asset "breakpoint" schedule. The Board considered that the group fee is designed to deliver the benefits of economies of scale to fund shareholders when total fund assets increase, even if assets of any particular fund are unchanged or have declined, because some portion of Fidelity's costs are attributable to services provided to all Fidelity funds, and all funds benefit if those costs can be allocated among more assets. The Board concluded that, given the group fee structure, fund shareholders will achieve a certain level of economies of scale as assets under FMR's management increase at the fund complex level, regardless of whether Fidelity achieves any such economies of scale.
The Board further concluded that any potential economies of scale are being shared between fund shareholders and Fidelity in an appropriate manner.
Additional Information Requested by the Board. In order to develop fully the factual basis for consideration of the Fidelity funds' Advisory Contracts, the Board requested and received additional information on certain topics, including (i) fund performance trends and actions to be taken by FMR to improve certain funds' overall performance; (ii) portfolio manager changes that have occurred during the past year; (iii) Fidelity's fund profitability methodology, the profitability of certain fund service providers, and profitability trends for certain funds; (iv) Fidelity's compensation structure for portfolio managers and key personnel, including its effects on fund profitability and the extent to which portfolio manager compensation is linked to fund performance; (v) Fidelity's fee structures and rationale for recommending different fees among categories of funds; and (vi) Fidelity's rationale for recommending which funds should have a performance adjustment component as part of their management fees.
Based on its evaluation of all of the conclusions noted above, and after considering all material factors, the Board ultimately concluded that the advisory fee structures are fair and reasonable, and that the fund's Advisory Contracts should be renewed.
Annual Report
Investment Adviser
Fidelity Management & Research Company Boston, MA
Investment Sub-Advisers
FMR Co., Inc.
Fidelity Management & Research (U.K.) Inc.
Fidelity Research & Analysis Company
Fidelity Investments Japan Limited
FIL Investment Advisors
FIL Investment Advisors (U.K.) Ltd.
Fidelity Management & Research (Hong Kong) Limited
Fidelity Management & Research (Japan) Inc.
General Distributor
Fidelity Distributors Corporation Boston, MA
Transfer and Service Agents
Fidelity Investments Institutional Operations Company, Inc. Boston, MA
Fidelity Service Company, Inc. Boston, MA
Custodian
Mellon Bank, N.A. Pittsburgh, PA
VIPGR-ANN-0209
1.781993.106
Fidelity® Variable Insurance Products: Health Care Portfolio
To view a fund's proxy voting guidelines and proxy voting record for the 12-month period ended June 30, visit http://www.fidelity.com (search for "proxy voting guidelines") or visit the Securities and Exchange Commission's (SEC) web site at http://www.sec.gov. You may also call 1-877-208-0098 to request a free copy of the proxy voting guidelines.
Fidelity Variable Insurance Products are separate account options which are purchased through a variable insurance contract.
Standard & Poor's, S&P and S&P 500 are registered service marks of The McGraw-Hill Companies, Inc. and have been licensed for use by Fidelity Distributors Corporation.
Other third party marks appearing herein are the property of their respective owners.
All other marks appearing herein are registered or unregistered trademarks or service marks of FMR LLC or an affiliated company.
This report and the financial statements contained herein are submitted for the general information of the shareholders of the fund. This report is not authorized for distribution to prospective investors in the fund unless preceded or accompanied by an effective prospectus.
The fund files its complete schedule of portfolio holdings with the SEC for the first and third quarters of each fiscal year on Form N-Q. Forms N-Q are available on the SEC's web site at http://www.sec.gov. The fund's Forms N-Q may be reviewed and copied at the SEC's Public Reference Room in Washington, DC. Information regarding the operation of the SEC's Public Reference Room may be obtained by calling 1-800-SEC-0330. For a complete list of the fund's portfolio holdings, view the most recent holdings listing, semiannual report, or annual report on Fidelity's web site at http://www.fidelity.com or http://www.advisor.fidelity.com, as applicable.
NOT FDIC INSURED · MAY LOSE VALUE · NO BANK GUARANTEE
Neither the fund nor Fidelity Distributors Corporation is a bank.
Average annual total return reflects the change in the value of an investment, assuming reinvestment of the class' dividend income and capital gains (the profits earned upon the sale of securities that have grown in value, if any) and assuming a constant rate of performance each year. During periods of reimbursement by Fidelity, a fund's total return will be greater than it would be had the reimbursement not occurred. Performance numbers are net of all underlying fund operating expenses, but do not include any insurance charges imposed by your insurance company's separate account. If performance information included the effect of these additional charges, the total returns would have been lower. How a fund did yesterday is no guarantee of how it will do tomorrow.
Average Annual Total Returns
Periods ended December 31, 2008
Past 1 year
Past 5 years
Life of fund A
VIP Health Care - Initial Class
-32.31%
0.24%
-0.06%
VIP Health Care - Investor Class B
-32.31%
0.16%
-0.12%
AFrom July 18, 2001.
BThe initial offering of Investor Class took place on July 21, 2005. Returns prior to July 21, 2005 are those of Initial Class. If Investor Class's transfer agent fee had been reflected, returns prior to July 21, 2005 would have been lower.
$10,000 Over Life of Fund
Let's say hypothetically that $10,000 was invested in VIP Health Care Portfolio - Initial Class on July 18, 2001, when the fund started. The chart shows how the value of your investment would have changed, and also shows how the Standard & Poor's 500SM Index (S&P 500®) performed over the same period.
Comments from Matthew Sabel and Edward Yoon, Co-Portfolio Managers of VIP Health Care Portfolio. Edward Yoon became Co-Manager on October 1, 2008.
By year-end 2008, the vicious credit crisis sparked in the U.S. had spread like wildfire across the world's capital markets, stunting global growth, toppling commodity prices, changing the face of the global financial system and chasing risk-averse investors toward the sidelines. The U.S. equity markets, as measured by the Dow Jones Industrial AverageSM and Standard & Poor's 500SM Index, fell hard as a result, declining 31.93% and 37.00%, respectively, while the technology-laden NASDAQ Composite® Index slid 40.03%. Foreign market stocks saw an even sharper decline, as illustrated by the 43.28% loss of the MSCI® EAFE® Index (Europe, Australasia, Far East), a gauge of developed stock markets outside the U.S. and Canada. A generally stronger U.S. dollar also held back returns for U.S. investors in foreign equities. Emerging-markets stocks - the global performance leader only a year ago - fell harder still, dropping 53.18%, as measured by the MSCI Emerging Markets Index. The only clear winners during the past year were assets backed by the U.S. government, as investors fled from risk. Thus, the Barclays Capital U.S. Treasury Bond Index climbed 13.74% for the year, while the Barclays Capital U.S. Aggregate Bond Index - a broader measure of the U.S. investment-grade bond universe - gained a more modest 5.24%. By contrast, high-yield bonds bore the brunt of investors' increasing wariness over risk, as expressed by the Merrill Lynch® U.S. High Yield Master II Constrained Index's drop of 26.11%. The emerging-markets bond category also felt the shock of investors' risk-averse sentiment, with the JPMorgan Emerging Markets Bond Index (EMBI) Global falling 10.91%. Meanwhile, the Citigroup® Non-U.S. Group of 7 Index - representing the debt performance of major global economies, excluding the United States - eked out a 1.69% gain.
For the year ending December 31, 2008, the fund significantly underperformed the -23.36% return of the MSCI®US Investable Market Health Care Index but outperformed the S&P 500®. (For specific portfolio results, please refer to the performance section of this report.) Unfavorable security selection and an underweighting in pharmaceuticals hurt, along with unsuccessful stock selection in health care supplies and health care distributors. Out-of-benchmark positions in fertilizers and agricultural chemicals detracted further. Contributions came from better stock selection and an underweighting in managed health care, as well as the portfolio's modest cash position, which helped in a down market. Detractors included a significant underweighting of pharmaceutical giant and benchmark heavyweight Johnson & Johnson; Brazilian drug distributor Profarma, which was not in the MSCI index; medical diagnostics company Inverness Medical Innovations; an out-of-benchmark stake in fertilizer company Mosaic (since sold); underweighting biotechnology firm Amgen; health care services company NightHawk Radiology; and an investment in managed health care provider Universal American Financial. Underweighting three managed health care stocks helped: WellPoint, Cigna and Aetna, the last two of which were not held at period end. Further contributions came from an out-of-benchmark position in Israel-based Teva Pharmaceutical and timely ownership of biotech firm Omrix Biopharmaceuticals, which accepted an acquisition bid by Johnson & Johnson during the period.
The views expressed above reflect those of the portfolio manager(s) only through the end of the period as stated on the cover of this report and do not necessarily represent the views of Fidelity or any other person in the Fidelity organization. Any such views are subject to change at any time based upon market or other conditions and Fidelity disclaims any responsibility to update such views. These views may not be relied on as investment advice and, because investment decisions for a Fidelity fund are based on numerous factors, may not be relied on as an indication of trading intent on behalf of any Fidelity fund.
As a shareholder of the Fund, you incur two types of costs: (1) transaction costs, including redemption fees, and (2) ongoing costs, including management fees and other Fund expenses. This Example is intended to help you understand your ongoing costs (in dollars) of investing in the Fund and to compare these costs with the ongoing costs of investing in other mutual funds.
The Example is based on an investment of $1,000 invested at the beginning of the period and held for the entire period (July 1, 2008 to December 31, 2008).
Actual Expenses
The first line of the accompanying table for each class of the Fund provides information about actual account values and actual expenses. You may use the information in this line, together with the amount you invested, to estimate the expenses that you paid over the period. Simply divide your account value by $1,000.00 (for example, an $8,600 account value divided by $1,000.00 = 8.6), then multiply the result by the number in the first line for a class of the Fund under the heading entitled "Expenses Paid During Period" to estimate the expenses you paid on your account during this period. The estimate of expenses does not include any fees or other expenses of any variable annuity or variable life insurance product. If they were, the estimate of expenses you paid during the period would be higher, and your ending account value would be lower. In addition, the Fund, as a shareholder in the underlying Fidelity Central Funds, will indirectly bear its pro rata share of the fees and expenses incurred by the underlying Fidelity Central Funds. These fees and expenses are not included in the Fund's annualized expense ratio used to calculate the expense estimate in the table below.
Hypothetical Example for Comparison Purposes
The second line of the accompanying table for each class of the Fund provides information about hypothetical account values and hypothetical expenses based on a Class' actual expense ratio and an assumed rate of return of 5% per year before expenses, which is not the Class' actual return. The hypothetical account values and expenses may not be used to estimate the actual ending account balance or expenses you paid for the period. You may use this information to compare the ongoing costs of investing in the Fund and other funds. To do so, compare this 5% hypothetical example with the 5% hypothetical examples that appear in the shareholder reports of the other funds. The estimate of expenses does not include any fees or other expenses of any variable annuity or variable life insurance product. If they were, the estimate of expenses you paid during the period would be higher, and your ending account value would be lower. In addition, the Fund, as a shareholder in the underlying Fidelity Central Funds, will indirectly bear its pro rata share of the fees and expenses incurred by the underlying Fidelity Central Funds. These fees and expenses are not included in the Fund's annualized expense ratio used to calculate the expense estimate in the table below.
Please note that the expenses shown in the table are meant to highlight your ongoing costs only and do not reflect any transaction costs. Therefore, the second line of the table is useful in comparing ongoing costs only, and will not help you determine the relative total costs of owning different funds. In addition, if these transactional costs were included, your costs would have been higher.
Annualized Expense Ratio
Beginning Account Value July 1, 2008
Ending Account Value December 31, 2008
Expenses Paid During Period* July 1, 2008 to December 31, 2008
Initial Class
.88%
Actual
$ 1,000.00
$ 785.60
$ 3.95
HypotheticalA
$ 1,000.00
$ 1,020.71
$ 4.47
Investor Class
.97%
Actual
$ 1,000.00
$ 785.90
$ 4.35
HypotheticalA
$ 1,000.00
$ 1,020.26
$ 4.93
A5% return per year before expenses
* Expenses are equal to each Class' annualized expense ratio, multiplied by the average account value over the period, multiplied by 184/366 (to reflect the one-half year period).
Annual Report
Investment Changes (Unaudited)
Top Ten Stocks as of December 31, 2008
% of fund's net assets
% of fund's net assets 6 months ago
Merck & Co., Inc.
6.6
6.4
Pfizer, Inc.
6.3
2.4
Genentech, Inc.
5.9
2.3
Wyeth
5.5
5.0
Medco Health Solutions, Inc.
5.0
0.9
Baxter International, Inc.
4.1
3.8
Covidien Ltd.
3.9
3.3
Amgen, Inc.
3.7
0.9
Schering-Plough Corp.
3.7
0.1
Abbott Laboratories
3.3
5.4
48.0
Top Industries (% of fund's net assets)
As of December 31, 2008
Pharmaceuticals
35.8%
Biotechnology
20.9%
Health Care Equipment & Supplies
17.7%
Health Care Providers & Services
17.7%
Life Sciences Tools & Services
3.2%
All Others*
4.7%
As of June 30, 2008
Pharmaceuticals
26.5%
Health Care Equipment & Supplies
24.6%
Health Care Providers & Services
15.1%
Biotechnology
12.7%
Life Sciences Tools & Services
11.3%
All Others*
9.8%
* Includes short-term investments and net other assets.
Prior period industry classifications reflect the categories in place as of the date indicated and have not been adjusted to reflect current industry classifications.
Annual Report
Investments December 31, 2008
Showing Percentage of Net Assets
Common Stocks - 96.2%
Shares
Value
BIOTECHNOLOGY - 20.9%
Biotechnology - 20.9%
Alexion Pharmaceuticals, Inc. (a)
4,900
$ 177,331
Alkermes, Inc. (a)
9,100
96,915
Alnylam Pharmaceuticals, Inc. (a)
8,200
202,786
Amgen, Inc. (a)
38,625
2,230,594
Biogen Idec, Inc. (a)
23,464
1,117,590
BioMarin Pharmaceutical, Inc. (a)(d)
19,877
353,811
Cephalon, Inc. (a)
2,590
199,534
Cougar Biotechnology, Inc. (a)
1,106
28,756
CSL Ltd.
6,030
145,044
Emergent BioSolutions, Inc. (a)
300
7,833
Genentech, Inc. (a)
42,338
3,510,244
Genomic Health, Inc. (a)
700
13,636
Genzyme Corp. (a)
22,600
1,499,962
Gilead Sciences, Inc. (a)
33,203
1,698,001
GTx, Inc. (a)
9,800
165,032
Molecular Insight Pharmaceuticals, Inc. (a)(d)
1,266
5,444
Myriad Genetics, Inc. (a)
2,400
159,024
ONYX Pharmaceuticals, Inc. (a)
10,105
345,187
OSI Pharmaceuticals, Inc. (a)
3,400
132,770
PDL BioPharma, Inc.
9,900
61,182
Theravance, Inc. (a)
4,814
59,645
United Therapeutics Corp. (a)
4,500
281,475
12,491,796
CHEMICALS - 0.2%
Fertilizers & Agricultural Chemicals - 0.2%
Monsanto Co.
1,750
123,113
Specialty Chemicals - 0.0%
Jubilant Organosys Ltd.
7,178
17,709
TOTAL CHEMICALS
140,822
COMMERCIAL SERVICES & SUPPLIES - 0.0%
Diversified Support Services - 0.0%
PRG-Schultz International, Inc. (a)
300
1,224
DIVERSIFIED CONSUMER SERVICES - 0.4%
Specialized Consumer Services - 0.4%
Carriage Services, Inc. Class A (a)
50,589
101,684
Service Corp. International
2,100
10,437
Stewart Enterprises, Inc. Class A
33,386
100,492
212,613
FOOD & STAPLES RETAILING - 0.8%
Drug Retail - 0.8%
China Nepstar Chain Drugstore Ltd. ADR
1,100
5,555
CVS Caremark Corp.
16,242
466,795
472,350
Shares
Value
HEALTH CARE EQUIPMENT & SUPPLIES - 17.7%
Health Care Equipment - 14.6%
American Medical Systems Holdings, Inc. (a)
17,200
$ 154,628
Aspect Medical Systems, Inc. (a)
3,000
10,110
Baxter International, Inc.
45,109
2,417,391
Boston Scientific Corp. (a)
116,498
901,695
Conceptus, Inc. (a)
5,300
80,666
CONMED Corp. (a)
7,600
181,944
Covidien Ltd.
63,488
2,300,805
Electro-Optical Sciences, Inc. (a)
12,558
42,069
Electro-Optical Sciences, Inc.:
warrants 11/2/11 (a)(f)
7,563
13,382
warrants 8/2/12 (a)(f)
1,900
3,663
ev3, Inc. (a)
13,462
82,118
Golden Meditech Co. Ltd. (a)
278,000
37,822
Hospira, Inc. (a)
17,180
460,768
Integra LifeSciences Holdings Corp. (a)
12,376
440,214
Kinetic Concepts, Inc. (a)
4,203
80,614
Masimo Corp. (a)
3,400
101,422
Medtronic, Inc.
17,123
538,005
Meridian Bioscience, Inc.
1,000
25,470
Micrus Endovascular Corp. (a)
12,042
139,808
Mindray Medical International Ltd. sponsored ADR (d)
3,729
67,122
Natus Medical, Inc. (a)
100
1,295
NeuroMetrix, Inc. (a)
10,344
8,792
NuVasive, Inc. (a)
400
13,860
Quidel Corp. (a)
1,200
15,684
St. Jude Medical, Inc. (a)
13,900
458,144
Syneron Medical Ltd. (a)
7,297
60,857
Wright Medical Group, Inc. (a)
3,790
77,430
8,715,778
Health Care Supplies - 3.1%
Alcon, Inc.
5,258
468,961
Align Technology, Inc. (a)
5,100
44,625
Immucor, Inc. (a)
1,400
37,212
InfuSystems Holdings, Inc. (a)
52,900
124,315
InfuSystems Holdings, Inc. warrants 4/11/11 (a)
4,900
221
Inverness Medical Innovations, Inc. (a)(d)
53,648
1,014,484
RTI Biologics, Inc. (a)
44,000
121,440
Shandong Weigao Group Medical Polymer Co. Ltd. (H Shares)
38,000
57,838
1,869,096
TOTAL HEALTH CARE EQUIPMENT & SUPPLIES
10,584,874
HEALTH CARE PROVIDERS & SERVICES - 17.3%
Health Care Distributors & Services - 1.4%
Henry Schein, Inc. (a)
4,800
176,112
Common Stocks - continued
Shares
Value
HEALTH CARE PROVIDERS & SERVICES - CONTINUED
Health Care Distributors & Services - continued
McKesson Corp.
12,464
$ 482,731
Profarma Distribuidora de Produtos Farmaceuticos SA
68,800
160,067
818,910
Health Care Facilities - 1.2%
Community Health Systems, Inc. (a)
10,034
146,296
Hanger Orthopedic Group, Inc. (a)
13,765
199,730
Sun Healthcare Group, Inc. (a)
15,400
136,290
Tenet Healthcare Corp. (a)
20,200
23,230
Universal Health Services, Inc. Class B
6,741
253,259
758,805
Health Care Services - 9.6%
athenahealth, Inc. (a)
4,696
176,664
Diagnosticos da America SA
4,500
44,406
Emergency Medical Services Corp. Class A (a)
100
3,661
Express Scripts, Inc. (a)
25,260
1,388,795
Fresenius Medical Care AG sponsored ADR
4,000
188,720
Genoptix, Inc. (a)
2,600
88,608
Health Grades, Inc. (a)
41,466
85,420
Healthways, Inc. (a)
2,100
24,108
Laboratory Corp. of America Holdings (a)
6,000
386,460
LHC Group, Inc. (a)
5,200
187,200
Medco Health Solutions, Inc. (a)
71,300
2,988,183
NightHawk Radiology Holdings, Inc. (a)
29,821
144,930
Rural/Metro Corp. (a)
15,400
27,566
Virtual Radiologic Corp. (a)
1,600
13,568
5,748,289
Managed Health Care - 5.1%
Coventry Health Care, Inc. (a)
1,700
25,296
Health Net, Inc. (a)
2,200
23,958
Humana, Inc. (a)
17,257
643,341
UnitedHealth Group, Inc.
56,765
1,509,949
Universal American Financial Corp. (a)
5,964
52,602
WellPoint, Inc. (a)
19,108
805,020
3,060,166
TOTAL HEALTH CARE PROVIDERS & SERVICES
10,386,170
HEALTH CARE TECHNOLOGY - 0.0%
Health Care Technology - 0.0%
HLTH Corp. (a)
607
6,349
HOTELS, RESTAURANTS & LEISURE - 0.0%
Restaurants - 0.0%
Centerplate, Inc. unit
300
513
Shares
Value
LIFE SCIENCES TOOLS & SERVICES - 3.2%
Life Sciences Tools & Services - 3.2%
Albany Molecular Research, Inc. (a)
370
$ 3,604
Bruker BioSciences Corp. (a)
12,586
50,847
Charles River Laboratories International, Inc. (a)
3,415
89,473
Illumina, Inc. (a)(d)
28,268
736,381
Lonza Group AG
2,672
247,156
PAREXEL International Corp. (a)
2,414
23,440
QIAGEN NV (a)
22,200
389,832
Thermo Fisher Scientific, Inc. (a)
9,405
320,428
Waters Corp. (a)
1,500
54,975
1,916,136
PERSONAL PRODUCTS - 0.0%
Personal Products - 0.0%
Nutraceutical International Corp. (a)
1,150
8,844
PHARMACEUTICALS - 35.7%
Pharmaceuticals - 35.7%
Abbott Laboratories
37,102
1,980,134
Allergan, Inc.
29,426
1,186,456
Auxilium Pharmaceuticals, Inc. (a)
5,200
147,888
Bristol-Myers Squibb Co.
65,480
1,522,410
China Shineway Pharmaceutical Group Ltd.
79,000
44,593
Elan Corp. PLC sponsored ADR (a)
1,300
7,800
Eli Lilly & Co.
1,600
64,432
Johnson & Johnson
28,748
1,719,993
Merck & Co., Inc.
129,800
3,945,916
Pfizer, Inc.
212,800
3,768,688
Piramal Healthcare Ltd.
9,800
48,223
Schering-Plough Corp.
130,100
2,215,603
Shire PLC sponsored ADR
9,377
419,902
Teva Pharmaceutical Industries Ltd. sponsored ADR
17,421
741,612
Valeant Pharmaceuticals International (a)(d)
4,000
91,600
Wyeth
87,233
3,272,110
XenoPort, Inc. (a)
8,300
208,164
21,385,524
TOTAL COMMON STOCKS
(Cost $66,406,644)
57,607,215
Convertible Preferred Stocks - 0.1%
PHARMACEUTICALS - 0.1%
Pharmaceuticals - 0.1%
Mylan, Inc. 6.50% (Cost $60,032)
100
65,903
Corporate Bonds - 0.4%
Principal Amount
Value
Convertible Bonds - 0.2%
HEALTH CARE PROVIDERS & SERVICES - 0.2%
Health Care Services - 0.2%
Lincare Holdings, Inc. 2.75% 11/1/37
$ 170,000
$ 141,984
Nonconvertible Bonds - 0.2%
HEALTH CARE PROVIDERS & SERVICES - 0.2%
Health Care Services - 0.2%
DASA Finance Corp. 8.75% 5/29/18 (e)
110,000
85,800
TOTAL CORPORATE BONDS
(Cost $244,933)
227,784
Money Market Funds - 5.4%
Shares
Fidelity Cash Central Fund, 1.06% (b)
1,406,273
1,406,273
Fidelity Securities Lending Cash Central Fund, 0.87% (b)(c)
1,826,625
1,826,625
TOTAL MONEY MARKET FUNDS
(Cost $3,232,898)
3,232,898
Cash Equivalents - 0.1%
Maturity Amount
Investments in repurchase agreements in a joint trading account at 0.01%, dated 12/31/08 due 1/2/09 (Collateralized by U.S. Treasury Obligations) # (Cost $42,000)
$ 42,000
42,000
TOTAL INVESTMENT PORTFOLIO - 102.2%
(Cost $69,986,507)
61,175,800
NET OTHER ASSETS - (2.2)%
(1,314,305)
NET ASSETS - 100%
$ 59,861,495
Legend
(a) Non-income producing
(b) Affiliated fund that is available only to investment companies and other accounts managed by Fidelity Investments. The rate quoted is the annualized seven-day yield of the fund at period end. A complete unaudited listing of the fund's holdings as of its most recent quarter end is available upon request.
(c) Investment made with cash collateral received from securities on loan.
(d) Security or a portion of the security is on loan at period end.
(e) Security exempt from registration under Rule 144A of the Securities Act of 1933. These securities may be resold in transactions exempt from registration, normally to qualified institutional buyers. At the end of the period, the value of these securities amounted to $ 85,800 or 0.2% of net assets.
(f) Restricted securities - Investment in securities not registered under the Securities Act of 1933 (excluding 144A issues). At the end of the period, the value of restricted securities (excluding 144A issues) amounted to $17,045 or 0.0% of net assets.
Additional information on each holding is as follows:
Security
Acquisition Date
Acquisition Cost
Electro-Optical Sciences, Inc. warrants 11/2/11
11/1/06
$ 1
Electro-Optical Sciences, Inc. warrants 8/2/12
8/1/07
$ 2
# Additional Information on each counterparty to the repurchase agreement is as follows:
Repurchase Agreement / Counterparty
Value
$42,000 due 1/02/09 at 0.01%
BNP Paribas Securities Corp.
$ 148
Banc of America Securities LLC
4,437
Goldman, Sachs & Co.
28,199
UBS Securities LLC
9,216
$ 42,000
Affiliated Central Funds
Information regarding fiscal year to date income earned by the Fund from investments in Fidelity Central Funds is as follows:
Fund
Income earned
Fidelity Cash Central Fund
$ 64,665
Fidelity Securities Lending Cash Central Fund
29,629
Total
$ 94,294
Other Information
The following is a summary of the inputs used, as of December 31, 2008, involving the Fund's assets carried at value. The inputs or methodology used for valuing securities may not be an indication of the risk associated with investing in those securities. For more information on valuation inputs, and their aggregation into the levels used in the table below, please refer to the Security Valuation section in the accompanying Notes to Financial Statements.
Valuation Inputs at Reporting Date:
Description
Total
Level 1
Level 2
Level 3
Investments in Securities
$ 61,175,800
$ 60,020,210
$ 1,155,590
$ -
Income Tax Information
At December 31, 2008, the fund had a capital loss carryforward of approximately $3,482,538 all of which will expire on December 31, 2016.
The fund intends to elect to defer to its fiscal year ending December 31, 2009 approximately $3,627,749 of losses recognized during the period November 1, 2008 to December 31, 2008.
See accompanying notes which are an integral part of the financial statements.
Investment in securities, at value (including securities loaned of $1,800,208 and repurchase agreements of $42,000) - See accompanying schedule:
Unaffiliated issuers (cost $66,753,609)
$ 57,942,902
Fidelity Central Funds (cost $3,232,898)
3,232,898
Total Investments (cost $69,986,507)
$ 61,175,800
Cash
983
Foreign currency held at value (cost $77)
73
Receivable for investments sold
695,216
Receivable for fund shares sold
16,578
Dividends receivable
72,562
Interest receivable
1,626
Distributions receivable from Fidelity Central Funds
1,822
Prepaid expenses
757
Other receivables
5,886
Total assets
61,971,303
Liabilities
Payable for investments purchased
$ 191,694
Payable for fund shares redeemed
9,410
Accrued management fee
26,970
Other affiliated payables
6,452
Other payables and accrued expenses
48,657
Collateral on securities loaned, at value
1,826,625
Total liabilities
2,109,808
Net Assets
$ 59,861,495
Net Assets consist of:
Paid in capital
$ 77,329,881
Distributions in excess of net investment income
(1,064)
Accumulated undistributed net realized gain (loss) on investments and foreign currency transactions
(8,656,278)
Net unrealized appreciation (depreciation) on investments and assets and liabilities in foreign currencies
(8,811,044)
Net Assets
$ 59,861,495
Statement of Assets and Liabilities - continued
December 31, 2008
Initial Class: Net Asset Value, offering price and redemption price per share ($37,960,539 ÷ 4,654,898 shares)
$ 8.15
Investor Class: Net Asset Value, offering price and redemption price per share ($21,900,956 ÷ 2,694,747 shares)
$ 8.13
See accompanying notes which are an integral part of the financial statements.
Annual Report
Statement of Operations
Year ended December 31, 2008
Investment Income
Dividends
$ 738,372
Interest
14,333
Income from Fidelity Central Funds
94,294
Total income
846,999
Expenses
Management fee
$ 395,622
Transfer agent fees
78,219
Accounting and security lending fees
28,161
Custodian fees and expenses
49,071
Independent trustees' compensation
341
Audit
59,406
Legal
409
Miscellaneous
7,789
Total expenses before reductions
619,018
Expense reductions
(3,454)
615,564
Net investment income (loss)
231,435
Realized and Unrealized Gain (Loss)
Net realized gain (loss) on:
Investment securities:
Unaffiliated issuers (net of foreign taxes of $1,481)
(8,411,156)
Foreign currency transactions
(17,295)
Total net realized gain (loss)
(8,428,451)
Change in net unrealized appreciation (depreciation) on:
Investment securities (net of decrease in deferred foreign taxes of $7,098)
(21,595,695)
Assets and liabilities in foreign currencies
(551)
Total change in net unrealized appreciation (depreciation)
(21,596,246)
Net gain (loss)
(30,024,697)
Net increase (decrease) in net assets resulting from operations
$ (29,793,262)
Statement of Changes in Net Assets
Year ended December 31, 2008
Year ended December 31, 2007
Increase (Decrease) in Net Assets
Operations
Net investment income (loss)
$ 231,435
$ 165,425
Net realized gain (loss)
(8,428,451)
9,181,105
Change in net unrealized appreciation (depreciation)
(21,596,246)
(1,590,467)
Net increase (decrease) in net assets resulting from operations
(29,793,262)
7,756,063
Distributions to shareholders from net investment income
(250,509)
(399,085)
Distributions to shareholders from net realized gain
(9,280,105)
(5,172,213)
Total distributions
(9,530,614)
(5,571,298)
Share transactions - net increase (decrease)
16,530,814
(5,226,497)
Redemption fees
31,180
18,137
Total increase (decrease) in net assets
(22,761,882)
(3,023,595)
Net Assets
Beginning of period
82,623,377
85,646,972
End of period (including distributions in excess of net investment income of $1,064 and undistributed net investment income of $41,704, respectively)
$ 59,861,495
$ 82,623,377
See accompanying notes which are an integral part of the financial statements.
Annual Report
Financial Highlights - Initial Class
Years ended December 31,
2008
2007
2006
2005
2004
Selected Per-Share Data
Net asset value, beginning of period
$ 13.57
$ 13.17
$ 12.39
$ 10.61
$ 9.77
Income from Investment Operations
Net investment income (loss) C
.04
.03
.04
.01
.03
Net realized and unrealized gain (loss)
(4.05)
1.25
.75
1.80
.84
Total from investment operations
(4.01)
1.28
.79
1.81
.87
Distributions from net investment income
(.04)
(.07)
(.01)
(.03)
(.04)
Distributions from net realized gain
(1.37)
(.81)
-
-
-
Total distributions
(1.41)
(.88)
(.01)
(.03)
(.04)
Redemption fees added to paid in capital C
-G
-G
-G
-G
.01
Net asset value, end of period
$ 8.15
$ 13.57
$ 13.17
$ 12.39
$ 10.61
Total ReturnA,B
(32.31)%
10.21%
6.34%
17.05%
8.97%
Ratios to Average Net AssetsD,F
Expenses before reductions
.84%
.81%
.77%
.75%
.77%
Expenses net of fee waivers, if any
.84%
.81%
.77%
.75%
.77%
Expenses net of all reductions
.84%
.80%
.76%
.70%
.76%
Net investment income (loss)
.36%
.23%
.33%
.06%
.26%
Supplemental Data
Net assets, end of period (000 omitted)
$ 37,961
$ 55,676
$ 69,418
$ 118,928
$ 65,718
Portfolio turnover rate E
189%
128%
106%
122%
56%
A Total returns do not reflect charges attributable to your insurance company's separate account. Inclusion of these charges would reduce the total returns shown.
B Total returns would have been lower had certain expenses not been reduced during the periods shown.
C Calculated based on average shares outstanding during the period.
D Fees and expenses of the underlying Fidelity Central Funds are not included in the Fund's expense ratio. The Fund indirectly bears its proportionate share of the expenses of any underlying Fidelity Central Funds.
E Amount does not include the portfolio activity of any underlying Fidelity Central Funds.
F Expense ratios reflect operating expenses of the class. Expenses before reductions do not reflect amounts reimbursed by the investment adviser or reductions from brokerage service arrangements or other expense offset arrangements and do not represent the amount paid by the class during periods when reimbursements or reductions occur. Expenses net of fee waivers reflect expenses after reimbursement by the investment adviser but prior to reductions from brokerage service arrangements or other expense offset arrangements. Expenses net of all reductions represent the net expenses paid by the class.
B Total returns for periods of less than one year are not annualized.
C Total returns do not reflect charges attributable to your insurance company's separate account. Inclusion of these charges would reduce the total returns shown.
D Total returns would have been lower had certain expenses not been reduced during the periods shown.
E Calculated based on average shares outstanding during the period.
F Fees and expenses of the underlying Fidelity Central Funds are not included in the Fund's expense ratio. The Fund indirectly bears its proportionate share of the expenses of any underlying Fidelity Central Funds.
G Amount does not include the portfolio activity of any underlying Fidelity Central Funds.
H For the period July 21, 2005 (commencement of sale of shares) to December 31, 2005.
I Expense ratios reflect operating expenses of the class. Expenses before reductions do not reflect amounts reimbursed by the investment adviser or reductions from brokerage service arrangements or other expense offset arrangements and do not represent the amount paid by the class during periods when reimbursements or reductions occur. Expense ratios before reductions for start-up periods may not be representative of longer-term operating periods. Expenses net of fee waivers reflect expenses after reimbursement by the investment adviser but prior to reductions from brokerage service arrangements or other expense offset arrangements. Expenses net of all reductions represent the net expenses paid by the class.
JAmount represents less than $.01 per share.
See accompanying notes which are an integral part of the financial statements.
VIP Health Care Portfolio (the Fund) is a non-diversified fund of Variable Insurance Products Fund IV (the trust) and is authorized to issue an unlimited number of shares. The trust is registered under the Investment Company Act of 1940, as amended (the 1940 Act), as an open-end management investment company organized as a Massachusetts business trust. Shares of the Fund may only be purchased by insurance companies for the purpose of funding variable annuity or variable life insurance contracts. The Fund offers the following classes of shares: Initial Class shares and Investor Class shares. All classes have equal rights and voting privileges, except for matters affecting a single class. Investment income, realized and unrealized capital gains and losses, the common expenses of the Fund, and certain fund-level expense reductions, if any, are allocated on a pro rata basis to each class based on the relative net assets of each class to the total net assets of the Fund. Each class differs with respect to transfer agent fees incurred. Certain expense reductions also differ by class.
2. Investments in Fidelity Central Funds.
The Fund may invest in Fidelity Central Funds, which are open-end investment companies available only to other investment companies and accounts managed by Fidelity Management & Research Company (FMR) and its affiliates. The Fund's Schedule of Investments lists each of the Fidelity Central Funds held as of period end, if any, as an investment of the Fund, but does not include the underlying holdings of each Fidelity Central Fund. As an Investing Fund, the Fund indirectly bears its proportionate share of the expenses of the underlying Fidelity Central Funds.
The Money Market Central Funds seek preservation of capital and current income and are managed by Fidelity Investments Money Management, Inc. (FIMM), an affiliate of FMR.
A complete unaudited list of holdings for each Fidelity Central Fund is available upon request or at the SEC's web site at www.sec.gov. In addition, the financial statements of the Fidelity Central Funds, which are not covered by the Fund's Report of Independent Registered Public Accounting Firm, are available on the SEC's web site or upon request.
3. Significant Accounting Policies.
The financial statements have been prepared in conformity with accounting principles generally accepted in the United States of America, which require management to make certain estimates and assumptions at the date of the financial statements. Actual results could differ from those estimates. The following summarizes the significant accounting policies of the Fund:
Security Valuation. Investments are valued as of 4:00 p.m. Eastern time on the last calendar day of the period. Wherever possible, the Fund uses independent pricing services approved by the Board of Trustees to value its investments.
Equity securities, including restricted securities, for which market quotations are readily available, are valued at the last reported sale price or official closing price as reported by an independent pricing service on the primary market or exchange on which they are traded. In the event there were no sales during the day or closing prices are not available, securities are valued at the last quoted bid price. Debt securities, including restricted securities, are valued by independent pricing services or by dealers who make markets in such securities. Pricing services consider yield or price of bonds of comparable quality, coupon, maturity and type as well as dealer supplied prices. Investments in open-end mutual funds, including the Fidelity Central Funds, are valued at their closing net asset value each business day. Short-term securities with remaining maturities of sixty days or less for which quotations are not readily available are valued at amortized cost, which approximates value.
When current market prices or quotations are not readily available or reliable, valuations may be determined in good faith in accordance with procedures adopted by the Board of Trustees. Factors used in determining value may include significant market or security specific events, changes in interest rates and credit quality, and developments in foreign markets which are monitored by evaluating the performance of ADRs, futures contracts and exchange-traded funds. The frequency with which these procedures are used cannot be predicted and may be utilized to a significant extent. The value of securities used for net asset value (NAV) calculation under these procedures may differ from published prices for the same securities.
The Fund is subject to the provisions of Statement of Financial Accounting Standards No. 157, "Fair Value Measurements" (SFAS 157), effective with the beginning of the Fund's fiscal year. SFAS 157 establishes a hierarchy that prioritizes the inputs to valuation techniques giving the highest priority to readily available unadjusted quoted prices in active markets for identical assets (level 1 measurements) and the lowest priority to unobservable inputs (level 3 measurements) when market prices are not readily available or reliable. The three levels of the hierarchy under SFAS 157 are described below:
Level 1
Quoted prices in active markets for identical securities.
Level 2
Prices determined using other significant observable inputs. Observable inputs are inputs that other market participants may use in pricing a security. These may include quoted prices for similar securities, interest rates, prepayment speeds, credit risk and others.
Level 3
Prices determined using significant unobservable inputs. In situations where quoted prices or observable inputs are unavailable or deemed less relevant (for example, when there is little or no market activity for an investment at the end of the period), unobservable inputs may be used. Unobservable inputs reflect the Fund's own assumptions about the factors market participants would use in pricing an investment, and would be based on the best information available.
Annual Report
3. Significant Accounting Policies - continued
Security Valuation - continued
Changes in valuation techniques may result in transfers in or out of an investment's assigned level within the hierarchy.
The aggregate value by input level, as of December 31, 2008, for the Fund's investments is included at the end of the Fund's Schedule of Investments.
Foreign Currency. The Fund uses foreign currency contracts to facilitate transactions in foreign-denominated securities. Losses from these transactions may arise from changes in the value of the foreign currency or if the counterparties do not perform under the contracts' terms.
Foreign-denominated assets, including investment securities, and liabilities are translated into U.S. dollars at the exchange rate at period end. Purchases and sales of investment securities, income and dividends received and expenses denominated in foreign currencies are translated into U.S. dollars at the exchange rate in effect on the transaction date.
The effects of exchange rate fluctuations on investments are included with the net realized and unrealized gain (loss) on investment securities. Other foreign currency transactions resulting in realized and unrealized gain (loss) are disclosed separately.
Investment Transactions and Income. For financial reporting purposes, the Fund's investment holdings and NAV include trades executed through the end of the last business day of the period. The NAV per share for processing shareholder transactions is calculated as of the close of business of the New York Stock Exchange (NYSE), normally 4:00 p.m. Eastern time and includes trades executed through the end of the prior business day. Gains and losses on securities sold are determined on the basis of identified cost and may include proceeds received from litigation. Dividend income is recorded on the ex-dividend date, except for certain dividends from foreign securities where the ex-dividend date may have passed, which are recorded as soon as the Fund is informed of the ex-dividend date. Non-cash dividends included in dividend income, if any, are recorded at the fair market value of the securities received. Distributions received on securities that represent a return of capital or capital gain are recorded as a reduction of cost of investments and/or as a realized gain. The Fund estimates the components of distributions received that may be considered return of capital distributions or capital gain distributions. Interest income and distributions from the Fidelity Central Funds are accrued as earned. Interest income includes coupon interest and amortization of premium and accretion of discount on debt securities. Investment income is recorded net of foreign taxes withheld where recovery of such taxes is uncertain.
Expenses. Most expenses of the trust can be directly attributed to a fund. Expenses which cannot be directly attributed are apportioned among each Fund in the trust. Expense estimates are accrued in the period to which they relate and adjustments are made when actual amounts are known.
Income Tax Information and Distributions to Shareholders. Each year, the Fund intends to qualify as a regulated investment company by distributing substantially all of its taxable income and realized gains under Subchapter M of the Internal Revenue Code and filing its U.S. federal tax return. As a result, no provision for income taxes is required. The Fund is subject to the provisions of FASB Interpretation No. 48, Accounting for Uncertainties in Income Taxes (FIN 48). FIN 48 sets forth a minimum threshold for financial statement recognition of the benefit of a tax position taken or expected to be taken in a tax return. There are no unrecognized tax benefits in the accompanying financial statements. A Fund's federal tax return is subject to examination by the Internal Revenue Service (IRS) for a period of three years. Foreign taxes are provided for based on the Fund's understanding of the tax rules and rates that exist in the foreign markets in which it invests.
Distributions are recorded on the ex-dividend date. Income dividends and capital gain distributions are declared separately for each class. Income and capital gain distributions are determined in accordance with income tax regulations, which may differ from generally accepted accounting principles.
Capital accounts within the financial statements are adjusted for permanent book-tax differences. These adjustments have no impact on net assets or the results of operations. Temporary book-tax differences will reverse in a subsequent period.
Book-tax differences are primarily due to foreign currency transactions, certain foreign taxes, market discount, partnerships, capital loss carryforwards and losses deferred due to wash sales and excise tax regulations.
The tax-basis components of distributable earnings and the federal tax cost as of period end were as follows:
Unrealized appreciation
$ 2,730,839
Unrealized depreciation
(13,088,940)
Net unrealized appreciation (depreciation)
(10,358,101)
Capital loss carryforward
(3,482,538)
Cost for federal income tax purposes
$ 71,533,901
Annual Report
Notes to Financial Statements - continued
3. Significant Accounting Policies - continued
Income Tax Information and Distributions to Shareholders - continued
The tax character of distributions paid was as follows:
December 31, 2008
December 31, 2007
Ordinary Income
$ 2,756,815
$ 1,176,191
Long-term Capital Gains
6,773,799
4,395,107
Total
$ 9,530,614
$ 5,571,298
Trading (Redemption) Fees. Shares held less than 60 days are subject to a redemption fee equal to 1% of the proceeds of the redeemed shares. All redemption fees, including any estimated redemption fees paid by FMR, are retained by the Fund and accounted for as an addition to paid in capital.
4. Operating Policies.
Repurchase Agreements. FMR has received an Exemptive Order from the Securities and Exchange Commission (the SEC) which permits the Fund and other affiliated entities of FMR to transfer uninvested cash balances into joint trading accounts which are then invested in repurchase agreements. The Fund may also invest directly with institutions in repurchase agreements. Repurchase agreements are collateralized by government or non-government securities. Upon settlement date, collateral is held in segregated accounts with custodian banks and may be obtained in the event of a default of the counterparty. The Fund monitors, on a daily basis, the value of the collateral to ensure it is at least equal to the principal amount of the repurchase agreement (including accrued interest). In the event of a default by the counterparty, realization of the collateral proceeds could be delayed, during which time the value of the collateral may decline.
Restricted Securities. The Fund may invest in securities that are subject to legal or contractual restrictions on resale. These securities generally may be resold in transactions exempt from registration or to the public if the securities are registered. Disposal of these securities may involve time-consuming negotiations and expense, and prompt sale at an acceptable price may be difficult. Information regarding restricted securities is included at the end of the Fund's Schedule of Investments.
5. Purchases and Sales of Investments.
Purchases and sales of securities, other than short-term securities, aggregated $139,685,974 and $130,176,136, respectively.
6. Fees and Other Transactions with Affiliates.
Management Fee. FMR and its affiliates provide the Fund with investment management related services for which the Fund pays a monthly management fee. The management fee is the sum of an individual fund fee rate that is based on an annual rate of .30% of the Fund's average net assets and a group fee rate that averaged .26% during the period. The group fee rate is based upon the average net assets of all the mutual funds advised by FMR. The group fee rate decreases as assets under management increase and increases as assets under management decrease. For the period, the total annual management fee rate was .56% of the Fund's average net assets.
Transfer Agent Fees. Fidelity Investments Institutional Operations Company, Inc. (FIIOC), an affiliate of FMR, is the Fund's transfer, dividend disbursing, and shareholder servicing agent. FIIOC receives an asset-based fee with respect to each class. Each class (with the exception of Investor Class) pays a transfer agent fee, excluding out of pocket expenses, equal to an annual rate of .07% of average net assets. Investor Class pays a monthly asset-based transfer agent fee of .15% of average net assets. Prior to February 1, 2008, Investor Class paid a monthly asset-based transfer agent fee of .18% of average net assets. The total transfer agent fees paid by each class to FIIOC, including out of pocket expenses, were as follows:
Initial Class
$ 35,379
Investor Class
42,840
$ 78,219
Accounting and Security Lending Fees. Fidelity Service Company, Inc. (FSC), an affiliate of FMR, maintains the Fund's accounting records. The accounting fee is based on the level of average net assets for the month. Under a separate contract, FSC administers the security lending program. The security lending fee is based on the number and duration of lending transactions.
Brokerage Commissions. The Fund placed a portion of its portfolio transactions with brokerage firms which are affiliates of the investment adviser. The commissions paid to these affiliated firms were $3,171 for the period.
Annual Report
7. Committed Line of Credit.
The Fund participates with other funds managed by FMR in a $4.2 billion credit facility (the "line of credit") to be utilized for temporary or emergency purposes to fund shareholder redemptions or for other short-term liquidity purposes. The Fund has agreed to pay commitment fees on its pro rata portion of the line of credit, which amounted to $149 and is reflected in Miscellaneous Expense on the Statement of Operations. During the period, there were no borrowings on this line of credit.
8. Security Lending.
The Fund lends portfolio securities from time to time in order to earn additional income. On the settlement date of the loan, the Fund receives collateral (in the form of U.S. Treasury obligations, letters of credit and/or cash) against the loaned securities and maintains collateral in an amount not less than 100% of the market value of the loaned securities during the period of the loan. The market value of the loaned securities is determined at the close of business of the Fund and any additional required collateral is delivered to the Fund on the next business day. If the borrower defaults on its obligation to return the securities loaned because of insolvency or other reasons, a fund could experience delays and costs in recovering the securities loaned or in gaining access to the collateral. Any cash collateral received is invested in the Fidelity Securities Lending Cash Central Fund. The value of loaned securities and cash collateral at period end are disclosed on the Fund's Statement of Assets and Liabilities. Security lending income represents the income earned on investing cash collateral, less fees and expenses associated with the loan, plus any premium payments that may be received on the loan of certain types of securities. Security lending income is presented in the Statement of Operations as a component of income from Fidelity Central Funds. Net income from lending portfolio securities during the period amounted to $29,629.
9. Expense Reductions.
Many of the brokers with whom FMR places trades on behalf of the Fund provided services to the Fund in addition to trade execution. These services included payments of certain expenses on behalf of the Fund totaling $3,454 for the period.
10. Other.
The Fund's organizational documents provide former and current trustees and officers with a limited indemnification against liabilities arising in connection with the performance of their duties to the Fund. In the normal course of business, the Fund may also enter into contracts that provide general indemnifications. The Fund's maximum exposure under these arrangements is unknown as this would be dependent on future claims that may be made against the Fund. The risk of material loss from such claims is considered remote.
At the end of the period, FMR or its affiliates were the owners of record of 100% of the total outstanding shares of the Fund.
During the period, Lehman Brothers Holdings, Inc. and certain of its affiliates (LBHI) sought protection under the insolvency laws of their jurisdictions of organization, including the United States, the United Kingdom and Japan. At the time LBHI's insolvency proceedings were instituted, the Fund had outstanding securities trades with counterparties affiliated with LBHI. As a result of the insolvency proceedings, LBHI is unable to fulfill its commitments and, in certain cases, the Fund may have terminated its trades and related agreements with the relevant entities and, where appropriate, is in the process of initiating claims for damages. FMR believes that the financial impact to the Fund relating to the terminated trades and agreements is immaterial.
In December 2006, the Independent Trustees, with the assistance of independent counsel, completed an investigation regarding gifts, gratuities and business entertainment provided by certain brokers to certain individuals who were employed on FMR's domestic equity trading desk during the period 2002 to 2004. The Independent Trustees and FMR agreed that, despite the absence of proof that the Fidelity mutual funds experienced diminished execution quality as a result of the improper receipt of gifts and business entertainment, the conduct at issue was serious and was worthy of redress. Accordingly, the Independent Trustees requested, and FMR agreed to make, a payment of $42 million plus accrued interest, which equaled approximately $7.3 million, to certain Fidelity mutual funds.
In March 2008, the Trustees approved a method for allocating this payment among the funds and, in total, FMR paid the fund $13,222, which is recorded in the accompanying Statement of Operations.
In a related administrative order dated March 5, 2008, the U.S. Securities and Exchange Commission ("SEC") announced a settlement with FMR and FMR Co., Inc. (an affiliate of FMR) involving the SEC's regulatory rules for investment advisers and the improper receipt of gifts, gratuities and business entertainment. Without admitting or denying the SEC's findings, FMR agreed to pay an $8 million civil penalty to the United States Treasury.
Annual Report
Notes to Financial Statements - continued
11. Distributions to Shareholders.
Distributions to shareholders of each class were as follows:
Years ended December 31,
2008
2007
From net investment income
Initial Class
$ 172,478
$ 326,177
Investor Class
78,031
72,908
Total
$ 250,509
$ 399,085
From net realized gain
Initial Class
$ 5,962,891
$ 4,069,153
Investor Class
3,317,214
1,103,060
Total
$ 9,280,105
$ 5,172,213
12. Share Transactions.
Transactions for each class of shares were as follows:
Shares
Dollars
Years ended December 31,
2008
2007
2008
2007
Initial Class
Shares sold
1,463,398
366,144
$ 16,106,016
$ 4,856,177
Reinvestment of distributions
552,267
346,986
6,135,369
4,395,330
Shares redeemed
(1,462,500)
(1,880,362)
(14,698,975)
(24,498,174)
Net increase (decrease)
553,165
(1,167,232)
$ 7,542,410
$ (15,246,667)
Investor Class
Shares sold
1,451,367
1,102,519
$ 16,188,341
$ 14,551,900
Reinvestment of distributions
306,096
93,172
3,395,245
1,175,968
Shares redeemed
(1,053,962)
(439,794)
(10,595,182)
(5,707,698)
Net increase (decrease)
703,501
755,897
$ 8,988,404
$ 10,020,170
Annual Report
Reportof Independent Registered Public Accounting Firm
To the Trustees of Variable Insurance Products Fund IV and the Shareholders of VIP Health Care Portfolio:
In our opinion, the accompanying statement of assets and liabilities, including the schedule of investments, and the related statements of operations and of changes in net assets and the financial highlights present fairly, in all material respects, the financial position of VIP Health Care Portfolio (a fund of Variable Insurance Products Fund IV) at December 31, 2008, the results of its operations for the year then ended, the changes in its net assets for each of the two years in the period then ended and the financial highlights for each of the periods indicated, in conformity with accounting principles generally accepted in the United States of America. These financial statements and financial highlights (hereafter referred to as "financial statements") are the responsibility of the VIP Health Care Portfolio's management. Our responsibility is to express an opinion on these financial statements based on our audits. We conducted our audits of these financial statements in accordance with the standards of the Public Company Accounting Oversight Board (United States). Those standards require that we plan and perform the audit to obtain reasonable assurance about whether the financial statements are free of material misstatement. An audit includes examining, on a test basis, evidence supporting the amounts and disclosures in the financial statements, assessing the accounting principles used and significant estimates made by management, and evaluating the overall financial statement presentation. We believe that our audits, which included confirmation of securities at December 31, 2008 by correspondence with the custodian and brokers, provide a reasonable basis for our opinion.
The Trustees, Member of the Advisory Board, and executive officers of the trust and fund, as applicable, are listed below. The Board of Trustees governs the fund and is responsible for protecting the interests of shareholders. The Trustees are experienced executives who meet periodically throughout the year to oversee the fund's activities, review contractual arrangements with companies that provide services to the fund, and review the fund's performance. Except for Edward C. Johnson 3d and James C. Curvey, each of the Trustees oversees 222 funds advised by FMR or an affiliate. Messrs. Johnson and Curvey oversee 381 funds advised by FMR or an affiliate.
The Trustees hold office without limit in time except that (a) any Trustee may resign; (b) any Trustee may be removed by written instrument, signed by at least two-thirds of the number of Trustees prior to such removal; (c) any Trustee who requests to be retired or who has become incapacitated by illness or injury may be retired by written instrument signed by a majority of the other Trustees; and (d) any Trustee may be removed at any special meeting of shareholders by a two-thirds vote of the outstanding voting securities of the trust. Each Trustee who is not an interested person (as defined in the 1940 Act) (Independent Trustee), shall retire not later than the last day of the calendar year in which his or her 72nd birthday occurs. The Independent Trustees may waive this mandatory retirement age policy with respect to individual Trustees. The executive officers and Advisory Board Member hold office without limit in time, except that any officer and Advisory Board Member may resign or may be removed by a vote of a majority of the Trustees at any regular meeting or any special meeting of the Trustees. Except as indicated, each individual has held the office shown or other offices in the same company for the past five years.
The fund's Statement of Additional Information (SAI) includes more information about the Trustees. To request a free copy, call Fidelity at 1-877-0098.
Interested Trustees*:
Correspondence intended for each Trustee who is an interested person may be sent to Fidelity Investments, 82 Devonshire Street, Boston, Massachusetts 02109.
Name, Age; Principal Occupation
Edward C. Johnson 3d (78)
Year of Election or Appointment: 1983
Mr. Johnson is Chairman of the Board of Trustees. Mr. Johnson serves as Chief Executive Officer, Chairman, and a Director of FMR LLC; Chairman and a Director of FMR; Chairman and a Director of Fidelity Research & Analysis Company (FRAC); Chairman and a Director of Fidelity Investments Money Management, Inc.; and Chairman and a Director of FMR Co., Inc. In addition, Mr. Johnson serves as Chairman and Director of FIL Limited. Previously, Mr. Johnson served as President of FMR LLC (2006-2007).
James C. Curvey (73)
Year of Election or Appointment: 2007
Mr. Curvey also serves as Trustee (2007-present) of other investment companies advised by FMR. Mr. Curvey is a Director of FMR and FMR Co., Inc. (2007-present). Mr. Curvey is also Vice Chairman (2006-present) and Director of FMR LLC. In addition, Mr. Curvey serves as an Overseer for the Boston Symphony Orchestra and a member of the Trustees of Villanova University.
* Trustees have been determined to be "Interested Trustees" by virtue of, among other things, their affiliation with the trust or various entities under common control with FMR. FMR Corp. merged with and into FMR LLC on October 1, 2007. Any references to FMR LLC for prior periods are deemed to be references to the prior entity.
Independent Trustees:
Correspondence intended for each Independent Trustee (that is, the Trustees other than the Interested Trustees) may be sent to Fidelity Investments, P.O. Box 55235, Boston, Massachusetts 02205-5235.
Name, Age; Principal Occupation
Dennis J. Dirks (60)
Year of Election or Appointment: 2005
Prior to his retirement in May 2003, Mr. Dirks was Chief Operating Officer and a member of the Board of The Depository Trust & Clearing Corporation (DTCC) (1999-2003). He also served as President, Chief Operating Officer, and Board member of The Depository Trust Company (DTC) (1999-2003) and President and Board member of the National Securities Clearing Corporation (NSCC) (1999-2003). In addition, Mr. Dirks served as Chief Executive Officer and Board member of the Government Securities Clearing Corporation (2001-2003), Chief Executive Officer and Board member of the Mortgage-Backed Securities Clearing Corporation (2001-2003), as a Trustee and a member of the Finance Committee of Manhattan College (2005-2008), and as a Trustee and a member of the Finance Committee of AHRC of Nassau County (2006-2008). Currently, Mr. Dirks serves as a member of the Board of Directors for The Brookville Center for Children's Services, Inc. (2009-present).
Alan J. Lacy (55)
Year of Election or Appointment:2008
Mr. Lacy serves as Senior Adviser (2007-present) of Oak Hill Capital Partners, L.P. (a private equity firm). Mr. Lacy also served as Chief Executive Officer (2000-2005) and Vice Chairman (2005-2006) of Sears Holdings Corporation and Sears, Roebuck and Co. (retail). In addition, Mr. Lacy serves as a member of the Board of Directors of The Western Union Company (global money transfer, 2006-present) and Bristol-Myers Squibb (global pharmaceuticals, 2007-present). Mr. Lacy is a Trustee of the National Parks Conservation Association and The Field Museum of Natural History.
Ned C. Lautenbach (64)
Year of Election or Appointment: 2000
Mr. Lautenbach is Chairman of the Independent Trustees (2006-present). Mr. Lautenbach is an Advisory Partner of Clayton, Dubilier & Rice, Inc. (private equity investment firm). Previously, Mr. Lautenbach was with the International Business Machines Corporation (IBM) from 1968 until his retirement in 1998. Mr. Lautenbach serves as a Director of Eaton Corporation (diversified industrial) as well as the Philharmonic Center for the Arts in Naples, Florida. He also is a member of the Board of Trustees of Fairfield University (2005-present), as well as a member of the Council on Foreign Relations. Previously, Mr. Lautenbach served as a Director of Sony Corporation (2006-2007).
Joseph Mauriello (64)
Year of Election or Appointment: 2008
Prior to his retirement in January 2006, Mr. Mauriello served in numerous senior management positions including Deputy Chairman and Chief Operating Officer (2004-2005), and Vice Chairman of Financial Services (2002-2004) of KPMG LLP US (professional services firm, 1965-2005). Mr. Mauriello currently serves as a member of the Board of Directors of XL Capital Ltd. (global insurance and re-insurance company, 2006-present) and of Arcadia Resources Inc. (health care services and products, 2007- present). He also served as a Director of the Hamilton Funds of the Bank of New York (2006-2007).
Cornelia M. Small (64)
Year of Election or Appointment: 2005
Ms. Small is a member of the Investment Committee, and Chair (2008-present) and a member of the Board of Trustees of Smith College. Ms. Small also serves on the Investment Committee of the Berkshire Taconic Community Foundation (2008-present). Previously, Ms. Small served as Chairperson of the Investment Committee (2002-2008) of Smith College and as Co-Chair (2000-2003) of the Annual Fund for the Fletcher School of Law and Diplomacy. In addition, she served as Chief Investment Officer, Director of Global Equity Investments, and a member of the Board of Directors of Scudder, Stevens & Clark and Scudder Kemper Investments.
William S. Stavropoulos (69)
Year of Election or Appointment: 2001
Mr. Stavropoulos is Chairman Emeritus of the Board of Directors of The Dow Chemical Company, where he previously served in numerous senior management positions, including President (1993-2000; 2002-2003), CEO (1995-2000; 2002-2004), Chairman of the Executive Committee (2000-2006), and as a member of the Board of Directors (1990-2006). Currently, he is a Director of Teradata Corporation (data warehousing and technology solutions, 2008-present), Chemical Financial Corporation, Maersk Inc. (industrial conglomerate), Tyco International, Inc. (multinational manufacturing and services, 2007-present), and a member of the Advisory Board for Metalmark Capital (private equity investment firm, 2005-present). He is a special advisor to Clayton, Dubilier & Rice, Inc. (private equity investment). In addition, Mr. Stavropoulos is a member of the University of Notre Dame Advisory Council for the College of Science.
David M. Thomas (59)
Year of Election or Appointment: 2008
Previously, Mr. Thomas served as Executive Chairman (2005-2006) and Chairman and Chief Executive Officer (2000-2005) of IMS Health, Inc. (pharmaceutical and healthcare information solutions). In addition, Mr. Thomas serves as a member of the Board of Directors of Fortune Brands, Inc. (consumer products holding company), and Interpublic Group of Companies, Inc. (marketing communication, 2004-present).
Michael E. Wiley (58)
Year of Election or Appointment: 2008
Mr. Wiley also serves as a member of the Board of Trustees of the University of Tulsa (2000-2006; 2007-present). He serves as a Director of Tesoro Corporation (independent oil refiner and marketer, 2005-present), and a Director of Bill Barrett Corporation (exploration and production company, 2005-present). In addition, he also serves as a Director of Post Oak Bank (privately-held bank, 2004-present). Previously, Mr. Wiley served as a Sr. Energy Advisor of Katzenbach Partners, LLC (consulting firm, 2006-2007), as an Advisory Director of Riverstone Holdings (private investment firm), Chairman, President, and CEO of Baker Hughes, Inc. (oilfield services company, 2000-2004), and as Director of Spinnaker Exploration Company (exploration and production company, 2001-2005).
Annual Report
Advisory Board Member and Executive Officers**:
Correspondence intended for each executive officer and Peter S. Lynch may be sent to Fidelity Investments, 82 Devonshire Street, Boston, Massachusetts 02109.
Name, Age; Principal Occupation
Peter S. Lynch (64)
Year of Election or Appointment: 2003
Member of the Advisory Board of Fidelity's Equity and High Income Funds. Mr. Lynch is Vice Chairman and a Director of FMR, and Vice Chairman (2001-present) and a Director of FMR Co., Inc. Previously, Mr. Lynch served as a Trustee of the Fidelity funds (1990-2003). In addition, he serves as a Trustee of Boston College and as the Chairman of the Inner-City Scholarship Fund. Previously, Mr. Lynch served on the Special Olympics International Board of Directors (1997-2006).
Kenneth B. Robins (39)
Year of Election or Appointment: 2008
President and Treasurer of Fidelity's Equity and High Income Funds. Mr. Robins is an employee of Fidelity Investments (2004- present). Before joining Fidelity Investments, Mr. Robins worked at KPMG LLP, where he was a partner in KPMG's department of professional practice (2002-2004).
Brian B. Hogan (44)
Year of Election or Appointment: 2007
Vice President of Sector Funds. Mr. Hogan also serves as Senior Vice President, Equity Research of FMR. Previously, Mr. Hogan served as a portfolio manager.
Scott C. Goebel (40)
Year of Election or Appointment: 2008
Secretary and Chief Legal Officer (CLO) of the Fidelity funds. Mr. Goebel also serves as General Counsel, Secretary, and Senior Vice President of FMR (2008-present); Deputy General Counsel of FMR LLC; Chief Legal Secretary of Fidelity Management & Research (Hong Kong) Limited (2008-present) and Assistant Secretary of Fidelity Management & Research (Japan) Inc. (2008- present). Previously, Mr. Goebel served as Assistant Secretary of the Funds (2007-2008) and as Vice President and Secretary of Fidelity Distributors Corporation (FDC) (2005-2007).
John B. McGinty, Jr. (46)
Year of Election or Appointment: 2008
Assistant Secretary of Fidelity's Equity and High Income Funds. Mr. McGinty is an employee of Fidelity Investments (2004-present). Mr. McGinty also serves as Senior Vice President, Secretary, and Chief Legal Officer of FDC (2007-present). Before joining Fidelity Investments, Mr. McGinty practiced law at Ropes & Gray, LLP.
Holly C. Laurent (54)
Year of Election or Appointment: 2008
Anti-Money Laundering (AML) Officer of the Fidelity funds. Ms. Laurent is an employee of Fidelity Investments. Previously, Ms. Laurent was Senior Vice President and Head of Legal for Fidelity Business Services India Pvt. Ltd. (2006-2008), Senior Vice President, Deputy General Counsel and Group Head for FMR LLC (2005-2006).
Christine Reynolds (50)
Year of Election or Appointment: 2008
Chief Financial Officer of the Fidelity funds. Ms. Reynolds became President of Fidelity Pricing and Cash Management Services (FPCMS) in August 2008. She served as Chief Operating Officer of FPCMS from 2007 through July 2008. Previously, Ms. Reynolds served as President, Treasurer, and Anti-Money Laundering officer of the Fidelity funds (2004-2007). Before joining Fidelity Investments, Ms. Reynolds worked at PricewaterhouseCoopers LLP (PwC) (1980-2002), where she was an audit partner with PwC's investment management practice.
Kenneth A. Rathgeber (61)
Year of Election or Appointment: 2004
Chief Compliance Officer of Fidelity's Equity and High Income Funds. Mr. Rathgeber is Chief Compliance Officer of Fidelity Management & Research (Hong Kong) Limited (2008-present), Fidelity Management & Research (Japan) Inc. (2008-present), FMR (2005-present), FMR Co., Inc. (2005-present), Fidelity Management & Research (U.K.) Inc. (2005-present), Fidelity Research & Analysis Company (2005-present), Fidelity Investments Money Management, Inc. (2005-present), and Strategic Advisers, Inc. (2005-present).
Bryan A. Mehrmann (47)
Year of Election or Appointment: 2005
Deputy Treasurer of the Fidelity funds. Mr. Mehrmann is an employee of Fidelity Investments. Previously, Mr. Mehrmann served as Vice President of Fidelity Investments Institutional Services Group (FIIS)/Fidelity Investments Institutional Operations Company, Inc. (FIIOC) Client Services (1998-2004).
Adrien E. Deberghes (41)
Year of Election or Appointment: 2008
Deputy Treasurer of Fidelity's Equity and High Income Funds. Mr. Deberghes is an employee of Fidelity Investments (2008-present). Previously, Mr. Deberghes served as Senior Vice President of Mutual Fund Administration at State Street Corporation (2007-2008), Senior Director of Mutual Fund Administration at Investors Bank & Trust (2005-2007), and Director of Finance for Dunkin' Brands (2000-2005).
Robert G. Byrnes (42)
Year of Election or Appointment: 2005
Assistant Treasurer of the Fidelity funds. Mr. Byrnes is an employee of Fidelity Investments (2005-present). Previously, Mr. Byrnes served as Vice President of Fidelity Pricing and Cash Management Services (FPCMS) (2003-2005). Before joining Fidelity Investments, Mr. Byrnes worked at Deutsche Asset Management where he served as Vice President of the Investment Operations Group (2000-2003).
Paul M. Murphy (61)
Year of Election or Appointment: 2007
Assistant Treasurer of the Fidelity funds. Mr. Murphy is an employee of Fidelity Investments (2007-present). Previously, Mr. Murphy served as Chief Financial Officer of the Fidelity Funds (2005-2006), Vice President and Associate General Counsel of FMR (2007), and Senior Vice President of Fidelity Pricing and Cash Management Services (FPCMS) (1994-2007).
Gary W. Ryan (50)
Year of Election or Appointment: 2005
Assistant Treasurer of the Fidelity funds. Mr. Ryan is an employee of Fidelity Investments. Previously, Mr. Ryan served as Vice President of Fund Reporting in Fidelity Pricing and Cash Management Services (FPCMS) (1999-2005).
** FMR Corp. merged with and into FMR LLC on October 1, 2007. Any references to FMR LLC for prior periods are deemed to be references to the prior entity.
Initial Class designates 19% and 100% and Investor Class designates 19% and 100% of the dividends distributed in February 2008 and December 2008 respectively, as qualifying for the dividends-received deduction for corporate shareholders.
The fund will notify shareholders in January 2009 of amounts for use in preparing 2008 income tax returns.
A special meeting of the fund's shareholders was held on May 14, 2008. The results of votes taken among shareholders on the proposals before them are reported below. Each vote reported represents one dollar of net asset value held on the record date for the meeting.
PROPOSAL 1
To elect a Board of Trustees.A
# of Votes
% of Votes
James C. Curvey
Affirmative
82,890,712.47
95.991
Withheld
3,461,988.43
4.009
TOTAL
86,352,700.90
100.000
Dennis J. Dirks
Affirmative
82,970,372.75
96.083
Withheld
3,382,328.15
3.917
TOTAL
86,352,700.90
100.000
Edward C. Johnson 3d
Affirmative
82,689,162.78
95.757
Withheld
3,663,538.12
4.243
TOTAL
86,352,700.90
100.000
Alan J. Lacy
Affirmative
83,041,222.35
96.165
Withheld
3,311,478.55
3.835
TOTAL
86,352,700.90
100.000
Ned C. Lautenbach
Affirmative
82,983,853.72
96.099
Withheld
3,368,847.18
3.901
TOTAL
86,352,700.90
100.000
Joseph Mauriello
Affirmative
83,138,122.14
96.277
Withheld
3,214,578.76
3.723
TOTAL
86,352,700.90
100.000
Cornelia M. Small
Affirmative
83,095,438.06
96.228
Withheld
3,257,262.84
3.772
TOTAL
86,352,700.90
100.000
William S. Stavropoulos
Affirmative
82,929,113.95
96.035
Withheld
3,423,586.95
3.965
TOTAL
86,352,700.90
100.000
David M. Thomas
Affirmative
83,095,487.87
96.228
Withheld
3,257,213.03
3.772
TOTAL
86,352,700.90
100.000
Michael E. Wiley
Affirmative
83,048,523.75
96.174
Withheld
3,304,177.15
3.826
TOTAL
86,352,700.90
100.000
PROPOSAL 2
To amend the Declaration of Trust to reduce the required quorum for future shareholder meetings.A
# of Votes
% of Votes
Affirmative
74,393,635.26
86.151
Against
8,745,543.59
10.128
Abstain
3,213,522.05
3.721
TOTAL
86,352,700.90
100.000
ADenotes trust-wide proposal and voting results.
Semiannual Report
BoardApproval of Investment Advisory Contracts and Management Fees
VIP Health Care Portfolio
Each year, typically in July, the Board of Trustees, including the Independent Trustees (together, the Board), votes on the renewal of the management contract and sub-advisory agreements (together, the Advisory Contracts) for the fund. The Board, assisted by the advice of fund counsel and Independent Trustees' counsel, requests and considers a broad range of information throughout the year.
The Board meets regularly and, acting directly and through its separate committees, requests and receives information concerning, and considers at each of its meetings factors that are relevant to, its annual consideration of the renewal of the fund's Advisory Contracts, including the services and support provided to the fund and its shareholders. At the time of the renewal, the Board had 12 standing committees, each composed of Independent Trustees with varying backgrounds, to which the Board has assigned specific subject matter responsibilities in order to enhance effective decision-making by the Board. Each committee has a written charter outlining the structure and purposes of the committee. The Board also meets as needed to consider matters specifically related to the Board's annual consideration of the renewal of Advisory Contracts.
At its July 2008 meeting, the Board of Trustees, including the Independent Trustees, unanimously determined to renew the fund's Advisory Contracts. In reaching its determination, the Board considered all factors it believed relevant, including (i) the nature, extent, and quality of the services to be provided to the fund and its shareholders (including the investment performance of the fund); (ii) the competitiveness of the fund's management fee and total expenses; (iii) the total costs of the services to be provided by and the profits to be realized by Fidelity from its relationship with the fund; (iv) the extent to which economies of scale would be realized as the fund grows; and (v) whether fee levels reflect these economies of scale, if any, for the benefit of fund shareholders. The Board also approved agreements with foreign sub-advisers Fidelity Management & Research (Japan) Inc. and Fidelity Management & Research (Hong Kong) Limited, as well as amendments to the fund's agreement with Fidelity Management & Research (U.K.) Inc.
In considering whether to renew the Advisory Contracts for the fund, the Board ultimately reached a determination, with the assistance of fund counsel and Independent Trustees' counsel and through the exercise of its business judgment, that the renewal of the Advisory Contracts and the compensation to be received by Fidelity under the management contract is consistent with Fidelity's fiduciary duty under applicable law. The Board's decision to renew the Advisory Contracts was not based on any single factor noted above, but rather was based on a comprehensive consideration of all the information provided to the Board at its meetings throughout the year. The Board, in reaching its determination to renew the Advisory Contracts, is aware that shareholders in the fund have a broad range of investment choices available to them, including a wide choice among mutual funds offered by competitors to Fidelity, and that the fund's shareholders, with the opportunity to review and weigh the disclosure provided by the fund in its prospectus and other public disclosures, have chosen to invest in this fund, managed by Fidelity.
Nature, Extent, and Quality of Services Provided. The Board considered staffing within the investment adviser, FMR, and the sub-advisers (together, the Investment Advisers), including the backgrounds of the fund's investment personnel and the fund's investment objective and discipline. The Independent Trustees also had discussions with senior management of Fidelity's investment operations and investment groups. The Board considered the structure of the portfolio manager compensation program and whether this structure provides appropriate incentives.
Resources Dedicated to Investment Management and Support Services. The Board reviewed the size, education, and experience of the Investment Advisers' investment staff, their use of technology, and the Investment Advisers' approach to recruiting, training, and retaining portfolio managers and other research, advisory, and management personnel. The Board noted that Fidelity's analysts have access to a variety of technological tools that enable them to perform both fundamental and quantitative analysis and to specialize in various disciplines. The Board considered Fidelity's extensive global research capabilities that enable the Investment Advisers to aggregate data from various sources in an effort to produce positive investment results. The Board also considered that Fidelity's portfolio managers and analysts have access to daily portfolio attribution that allows for monitoring of a fund's portfolio, as well as an electronic communication system that provides immediate real-time access to research concerning issuers and credit enhancers.
Shareholder and Administrative Services. The Board considered (i) the nature, extent, quality, and cost of advisory, administrative, distribution, and shareholder services performed by the Investment Advisers and their affiliates under the Advisory Contracts and under separate agreements covering transfer agency, pricing and bookkeeping, and securities lending services for the fund; (ii) the nature and extent of the Investment Advisers' supervision of third party service providers, principally custodians and subcustodians; and (iii) the resources devoted to, and the record of compliance with, the fund's compliance policies and procedures. The Board also reviewed the allocation of fund brokerage, including allocations to brokers affiliated with the Investment Advisers, the use of brokerage commissions to pay fund expenses, and the use of "soft" commission dollars to pay for research services. The Board further considered that Fidelity voluntarily pays for market data out of its own resources.
The Board noted that the growth of fund assets across the complex allows Fidelity to reinvest in the development of services designed to enhance the value or convenience of the Fidelity funds as investment vehicles. These services include 24-hour access to account information and market information through phone representatives and over the Internet, and investor education materials and asset allocation tools.
Investment in a Large Fund Family. The Board considered the benefits to shareholders of investing in a Fidelity fund, including the benefits of investing in a fund that is part of a large family of funds offering a variety of investment disciplines and providing for a large variety of mutual fund investor services. The Board noted that Fidelity has taken a number of actions over the previous year that benefited particular funds, including (i) dedicating additional resources to investment research and to restructure the investment research teams; (ii) contractually agreeing to reduce the management fees on Fidelity's Institutional Money Market Funds and launching Class IV and Institutional Class of certain of these funds; (iii) reducing the transfer agent fees for the Fidelity Select Portfolios and Investor Class of the VIP funds; and (iv) launching Class K of 29 equity funds as a lower-fee class available to certain employer-sponsored retirement plans.
Annual Report
Investment Performance. The Board considered whether the fund has operated within its investment objective, as well as its record of compliance with its investment restrictions. It also reviewed the fund's absolute investment performance for each class, as well as the fund's relative investment performance for each class measured against a third-party-sponsored index that reflects the market sector in which the fund invests over multiple periods. The Board noted that FMR does not believe that a meaningful peer group exists against which to compare the fund's performance. The following charts considered by the Board show, over the one-, three-, and five-year periods ended December 31, 2007, as available, the cumulative total returns of Initial Class and Investor Class of the fund and the cumulative total returns of a third-party-sponsored index ("benchmark").
VIP Health Care Portfolio
The Board stated that the investment performance of Initial Class of the fund compared favorably to its benchmark for all the periods shown. The Board considered that the variations in performance between the fund's classes reflect the variations in class expenses, which result in lower performance for the higher expense class.
The Board considered that FMR has taken steps to refocus and strengthen equity research, equity portfolio management, and compliance.
Based on its review, and giving particular weight to the nature and quality of the resources dedicated by the Investment Advisers to maintain and improve relative performance, the Board concluded that the nature, extent, and quality of the services provided to the fund will benefit the fund's shareholders, particularly in light of the Board's view that the fund's shareholders benefit from investing in a fund that is part of a large family of funds offering a variety of investment disciplines and services.
Competitiveness of Management Fee and Total Fund Expenses. The Board considered the fund's management fee and total expenses compared to "mapped groups" of competitive funds and classes. Fidelity creates "mapped groups" by combining similar Lipper investment objective categories that have comparable management fee characteristics. Combining Lipper investment objective categories aids the Board's management fee and total expense comparisons by broadening the competitive group used for comparison and by reducing the number of universes to which various Fidelity funds are compared. The Board also considered supplemental information about how the fund's management fee and total expenses ranked relative to groups based on Lipper classifications, which take into account a fund's market capitalization and style.
The Board considered two proprietary management fee comparisons for the 12-month periods shown in the chart below. The group of Lipper funds used by the Board for management fee comparisons is referred to below as the "Total Mapped Group." The Total Mapped Group comparison focuses on a fund's standing relative to the total universe of comparable funds available to investors, in terms of gross management fees before expense reimbursements or caps. "TMG %" represents the percentage of funds in the Total Mapped Group that had management fees that were lower than the fund's. For example, a TMG % of 4% means that 96% of the funds in the Total Mapped Group had higher management fees than the fund. The "Asset-Size Peer Group" (ASPG) comparison focuses on a fund's standing relative to non-Fidelity funds similar in size to the fund within the Total Mapped Group. The ASPG represents at least 15% of the funds in the Total Mapped Group with comparable asset size and management fee characteristics, subject to a minimum of 50 funds (or all funds in the Total Mapped Group if fewer than 50). Additional information, such as the ASPG quartile in which the fund's management fee ranked, is also included in the chart and considered by the Board.
Annual Report
Board Approval of Investment Advisory Contracts and Management Fees - continued
VIP Health Care Portfolio
The Board noted that the fund's management fee ranked below the median of its Total Mapped Group and below the median of its ASPG for 2007.
Based on its review, the Board concluded that the fund's management fee was fair and reasonable in light of the services that the fund receives and the other factors considered.
In its review of each class's total expenses, the Board considered the fund's management fee as well as other fund or class expenses, as applicable, such as transfer agent fees, pricing and bookkeeping fees, and custodial, legal, and audit fees. The Board also noted the effects of any waivers and reimbursements on fees and expenses. As part of its review, the Board also considered current and historical total expenses of each class of the fund compared to competitive fund median expenses. Each class of the fund is compared to those funds and classes in the Total Mapped Group (used by the Board for management fee comparisons) that have a similar sales load structure.
The Board noted that the total expenses of each class ranked below its competitive median for 2007.
In its review of total expenses, the Board also considered Fidelity fee structures and other information on clients that FMR and its affiliates service in other competitive markets, such as other mutual funds advised or subadvised by FMR or its affiliates, pension plan clients, and other institutional clients.
Based on its review, the Board concluded that the total expenses of each class of the fund were reasonable in light of the services that the fund and its shareholders receive and the other factors considered.
Costs of the Services and Profitability. The Board considered the revenues earned and the expenses incurred by Fidelity in conducting the business of developing, marketing, distributing, managing, administering and servicing the fund and its shareholders. The Board also considered the level of Fidelity's profits in respect of all the Fidelity funds.
On an annual basis, FMR presents to the Board Fidelity's profitability for the fund. Fidelity calculates the profitability for each fund, as well as aggregate profitability for groups of Fidelity funds and all Fidelity funds, using a series of detailed revenue and cost allocation methodologies which originate with the audited books and records of Fidelity. The Audit Committee of the Board reviews any significant changes from the prior year's methodologies.
PricewaterhouseCoopers LLP (PwC), independent registered public accounting firm and auditor to Fidelity and certain Fidelity funds, has been engaged annually by the Board as part of the Board's assessment of the results of Fidelity's profitability analysis. PwC's engagement includes the review and assessment of Fidelity's methodologies used in determining the revenues and expenses attributable to Fidelity's mutual fund business, and completion of agreed-upon procedures surrounding the mathematical accuracy of fund profitability and its conformity to allocation methodologies. After considering PwC's reports issued under the engagement and information provided by Fidelity, the Board believes that while other allocation methods may also be reasonable, Fidelity's profitability methodologies are reasonable in all material respects.
The Board has also reviewed Fidelity's non-fund businesses and any fall-out benefits related to the mutual fund business as well as cases where Fidelity's affiliates may benefit from or be related to the fund's business.
Annual Report
The Board considered the costs of the services provided by and the profits realized by Fidelity in connection with the operation of the fund and determined that the amount of profit is a fair entrepreneurial profit for the management of the fund.
Economies of Scale. The Board considered whether there have been economies of scale in respect of the management of the Fidelity funds, whether the Fidelity funds (including the fund) have appropriately benefited from any such economies of scale, and whether there is potential for realization of any further economies of scale. The Board considered the extent to which the fund will benefit from economies of scale through increased services to the fund, through waivers or reimbursements, or through fee or expense reductions.
The Board recognized that the fund's management contract incorporates a "group fee" structure, which provides for lower group fee rates as total fund assets under FMR's management increase, and for higher group fee rates as total fund assets under FMR's management decrease. FMR determines the group fee rates based on a tiered asset "breakpoint" schedule. The Board considered that the group fee is designed to deliver the benefits of economies of scale to fund shareholders when total fund assets increase, even if assets of any particular fund are unchanged or have declined, because some portion of Fidelity's costs are attributable to services provided to all Fidelity funds, and all funds benefit if those costs can be allocated among more assets. The Board concluded that, given the group fee structure, fund shareholders will achieve a certain level of economies of scale as assets under FMR's management increase at the fund complex level, regardless of whether Fidelity achieves any such economies of scale.
The Board further concluded that any potential economies of scale are being shared between fund shareholders and Fidelity in an appropriate manner.
Additional Information Requested by the Board. In order to develop fully the factual basis for consideration of the Fidelity funds' Advisory Contracts, the Board requested and received additional information on certain topics, including (i) fund performance trends and actions to be taken by FMR to improve certain funds' overall performance; (ii) portfolio manager changes that have occurred during the past year; (iii) Fidelity's fund profitability methodology, the profitability of certain fund service providers, and profitability trends for certain funds; (iv) Fidelity's compensation structure for portfolio managers and key personnel, including its effects on fund profitability and the extent to which portfolio manager compensation is linked to fund performance; (v) Fidelity's fee structures and rationale for recommending different fees among categories of funds; and (vi) Fidelity's rationale for recommending which funds should have a performance adjustment component as part of their management fees.
Based on its evaluation of all of the conclusions noted above, and after considering all material factors, the Board ultimately concluded that the advisory fee structures are fair and reasonable, and that the fund's Advisory Contracts should be renewed.
Annual Report
Annual Report
Investment Adviser
Fidelity Management & Research Company Boston, MA
Investment Sub-Advisers
FMR Co., Inc.
Fidelity Management & Research (U.K.) Inc.
Fidelity Research & Analysis Company
Fidelity Investments Japan Limited
FIL Investment Advisors
FIL Investment Advisors (U.K.) Ltd.
Fidelity Management & Research (Hong Kong) Limited
Fidelity Management & Research (Japan) Inc.
General Distributor
Fidelity Distributors Corporation Boston, MA
Transfer and Service Agents
Fidelity Investments Institutional Operations Company, Inc. Boston, MA
To view a fund's proxy voting guidelines and proxy voting record for the 12-month period ended June 30, visit http://www.fidelity.com (search for "proxy voting guidelines") or visit the Securities and Exchange Commission's (SEC) web site at http://www.sec.gov. You may also call 1-877-208-0098 to request a free copy of the proxy voting guidelines.
Fidelity Variable Insurance Products are separate account options which are purchased through a variable insurance contract.
Standard & Poor's, S&P and S&P 500 are registered service marks of The McGraw-Hill Companies, Inc. and have been licensed for use by Fidelity Distributors Corporation.
Other third party marks appearing herein are the property of their respective owners.
All other marks appearing herein are registered or unregistered trademarks or service marks of FMR LLC or an affiliated company.
This report and the financial statements contained herein are submitted for the general information of the shareholders of the fund. This report is not authorized for distribution to prospective investors in the fund unless preceded or accompanied by an effective prospectus.
A fund files its complete schedule of portfolio holdings with the SEC for the first and third quarters of each fiscal year on Form N-Q. Forms N-Q are available on the SEC's web site at http://www.sec.gov. A fund's Forms N-Q may be reviewed and copied at the SEC's Public Reference Room in Washington, DC. Information regarding the operation of the SEC's Public Reference Room may be obtained by calling 1-800-SEC-0330. For a complete list of the fund's portfolio holdings, view the most recent holdings listing, semiannual report, or annual report on Fidelity's web site at http://www.fidelity.com or http://www.advisor.fidelity.com, as applicable.
NOT FDIC INSURED · MAY LOSE VALUE · NO BANK GUARANTEE
Neither the fund nor Fidelity Distributors Corporation is a bank.
Average annual total return reflects the change in the value of an investment, assuming reinvestment of the class' dividend income and capital gains (the profits earned upon the sale of securities that have grown in value, if any) and assuming a constant rate of performance each year. During periods of reimbursement by Fidelity, a fund's total return will be greater than it would be had the reimbursement not occurred. Performance numbers are net of all underlying fund operating expenses, but do not include any insurance charges imposed by your insurance company's separate account. If performance information included the effect of these additional charges, the total returns would have been lower. How a fund did yesterday is no guarantee of how it will do tomorrow.
Average Annual Total Returns
Periods ended December 31, 2008
Past 1 year
Past 5 years
Life of fund A
VIP Industrials - Initial Class C
-39.84%
2.88%
3.47%
VIP Industrials - Investor Class B,C
-39.84%
2.81%
3.43%
AFrom July 18, 2001.
BThe initial offering of Investor Class shares took place on July 21, 2005. Returns prior to July 21, 2005, are those of Initial Class. If Investor Class's transfer agent fee had been reflected, returns prior to July 21, 2005 would have been lower.
CPrior to October 1, 2006, VIP Industrials operated under certain different investment policies. The historical performance for the fund may not represent its current investment policies.
$10,000 Over Life of Fund
Let's say hypothetically that $10,000 was invested in VIP Industrials Portfolio - Initial Class on July 18, 2001, when the fund started. The chart shows how the value of your investment would have changed, and also shows how the Standard & Poor's 500SM Index (S&P 500®) performed over the same period.
Comments from Tobias Welo, Portfolio Manager of VIP Industrials Portfolio
By year-end 2008, the vicious credit crisis sparked in the U.S. had spread like wildfire across the world's capital markets, stunting global growth, toppling commodity prices, changing the face of the global financial system and chasing risk-averse investors toward the sidelines. The U.S. equity markets, as measured by the Dow Jones Industrial AverageSM and Standard & Poor's 500SM Index, fell hard as a result, declining 31.93% and 37.00%, respectively, while the technology-laden NASDAQ Composite® Index slid 40.03%. Foreign market stocks saw an even sharper decline, as illustrated by the 43.28% loss of the MSCI® EAFE® Index (Europe, Australasia, Far East), a gauge of developed stock markets outside the U.S. and Canada. A generally stronger U.S. dollar also held back returns for U.S. investors in foreign equities. Emerging-markets stocks - the global performance leader only a year ago - fell harder still, dropping 53.18%, as measured by the MSCI Emerging Markets Index. The only clear winners during the past year were assets backed by the U.S. government, as investors fled from risk. Thus, the Barclays Capital U.S. Treasury Bond Index climbed 13.74% for the year, while the Barclays Capital U.S. Aggregate Bond Index - a broader measure of the U.S. investment-grade bond universe - gained a more modest 5.24%. By contrast, high-yield bonds bore the brunt of investors' increasing wariness over risk, as expressed by the Merrill Lynch® U.S. High Yield Master II Constrained Index's drop of 26.11%. The emerging-markets bond category also felt the shock of investors' risk-averse sentiment, with the JPMorgan Emerging Markets Bond Index (EMBI) Global falling 10.91%. Meanwhile, the Citigroup® Non-U.S. Group of 7 Index - representing the debt performance of major global economies, excluding the United States - eked out a 1.69% gain.
During the past year, the fund finished about in line with the -39.90% return of the MSCI® US Investable Market Industrials Index and behind the S&P 500®. (For specific portfolio results, please refer to the performance section of this report.) Versus the MSCI index, favorable industry positioning and a small cash position boosted performance, while weak overall security selection had a roughly offsetting negative impact. Specifically, underweighting industrial conglomerates and overweighting trucking aided our results, as did stock picking in aerospace and defense. At the individual stock level, underweighting major index component General Electric (GE) added value. As the financial crisis worsened, I became increasingly concerned about the exposure of GE's finance division to the rising rate of defaults by its commercial borrowers. United Parcel Service benefited from its rock-solid balance sheet and its position as an industry leader. Old Dominion Freight Lines and Ryder System, both part of the outperforming trucking group, further added value. In the case of Ryder System, though, I sold the position to lock in profits. Defense contractor Raytheon helped as well. Conversely, fund performance was hampered by my stock picks in heavy electrical equipment, although the damage there was considerably lessened by having a presence in that outperforming, out-of-index group. Stock selection in construction and farm machinery/heavy trucks and in industrial machinery further weighed on performance, as did underweighting railroads for much of the period. Three of the biggest detractors play various roles in the process of making heavy trucks. Cummins and Caterpillar make the engines, and Navistar International makes the vehicles. Despite the poor short-term performance of this group, I continued to think it has a good chance of outperforming in the early stages of an economic recovery. That said, I sold Caterpillar because of its relatively heavy exposure to the energy sector. Railroads CSX and Burlington Northern Santa Fe hurt performance. We didn't own either benchmark component during the first half of the year, when their performance was strongest, and had only a modest position in CSX in the back half of the period.
The views expressed above reflect those of the portfolio manager(s) only through the end of the period as stated on the cover of this report and do not necessarily represent the views of Fidelity or any other person in the Fidelity organization. Any such views are subject to change at any time based upon market or other conditions and Fidelity disclaims any responsibility to update such views. These views may not be relied on as investment advice and, because investment decisions for a Fidelity fund are based on numerous factors, may not be relied on as an indication of trading intent on behalf of any Fidelity fund.
As a shareholder of the Fund, you incur two types of costs: (1) transaction costs, including redemption fees, and (2) ongoing costs, including management fees and other Fund expenses. This Example is intended to help you understand your ongoing costs (in dollars) of investing in the Fund and to compare these costs with the ongoing costs of investing in other mutual funds.
The Example is based on an investment of $1,000 invested at the beginning of the period and held for the entire period (July 1, 2008 to December 31, 2008).
Actual Expenses
The first line of the accompanying table for each class of the Fund provides information about actual account values and actual expenses. You may use the information in this line, together with the amount you invested, to estimate the expenses that you paid over the period. Simply divide your account value by $1,000.00 (for example, an $8,600 account value divided by $1,000.00 = 8.6), then multiply the result by the number in the first line for a class of the Fund under the heading entitled "Expenses Paid During Period" to estimate the expenses you paid on your account during this period. The estimate of expenses does not include any fees or other expenses of any variable annuity or variable life insurance product. If they were, the estimate of expenses you paid during the period would be higher, and your ending account value would be lower. In addition, the Fund, as a shareholder in the underlying Fidelity Central Funds, will indirectly bear its pro rata share of the fees and expenses incurred by the underlying Fidelity Central Funds. These fees and expenses are not included in the Fund's annualized expense ratio used to calculate the expense estimate in the table below.
Hypothetical Example for Comparison Purposes
The second line of the accompanying table for each class of the Fund provides information about hypothetical account values and hypothetical expenses based on a Class' actual expense ratio and an assumed rate of return of 5% per year before expenses, which is not the Class' actual return. The hypothetical account values and expenses may not be used to estimate the actual ending account balance or expenses you paid for the period. You may use this information to compare the ongoing costs of investing in the Fund and other funds. To do so, compare this 5% hypothetical example with the 5% hypothetical examples that appear in the shareholder reports of the other funds. The estimate of expenses does not include any fees or other expenses of any variable annuity or variable life insurance product. If they were, the estimate of expenses you paid during the period would be higher, and your ending account value would be lower. In addition, the Fund, as a shareholder in the underlying Fidelity Central Funds, will indirectly bear its pro rata share of the fees and expenses incurred by the underlying Fidelity Central Funds. These fees and expenses are not included in the Fund's annualized expense ratio used to calculate the expense estimate in the table below.
Please note that the expenses shown in the table are meant to highlight your ongoing costs only and do not reflect any transaction costs. Therefore, the second line of the table is useful in comparing ongoing costs only, and will not help you determine the relative total costs of owning different funds. In addition, if these transactional costs were included, your costs would have been higher.
Annualized Expense Ratio
Beginning Account Value July 1, 2008
Ending Account Value December 31, 2008
Expenses Paid During Period* July 1, 2008 to December 31, 2008
Initial Class
.82%
Actual
$ 1,000.00
$ 666.50
$ 3.43
HypotheticalA
$ 1,000.00
$ 1,021.01
$ 4.17
Investor Class
.91%
Actual
$ 1,000.00
$ 666.80
$ 3.81
HypotheticalA
$ 1,000.00
$ 1,020.56
$ 4.62
A5% return per year before expenses
* Expenses are equal to each Class' annualized expense ratio, multiplied by the average account value over the period, multiplied by 184/366 (to reflect the one-half year period).
Annual Report
Investment Changes (Unaudited)
Top Ten Stocks as of December 31, 2008
% of fund's net assets
% of fund's net assets 6 months ago
United Technologies Corp.
7.1
5.2
Honeywell International, Inc.
6.0
4.4
Lockheed Martin Corp.
4.1
3.5
United Parcel Service, Inc. Class B
3.9
4.3
The Boeing Co.
3.8
0.0
Siemens AG sponsored ADR
3.7
2.4
Danaher Corp.
3.6
3.3
Union Pacific Corp.
3.6
3.2
Emerson Electric Co.
3.5
1.8
Cummins, Inc.
3.2
3.0
42.5
Top Industries (% of fund's net assets)
As of December 31, 2008
Aerospace & Defense
26.3%
Machinery
16.2%
Road & Rail
10.4%
Electrical Equipment
10.3%
Industrial Conglomerates
9.9%
All Others*
26.9%
As of June 30, 2008
Machinery
22.9%
Aerospace & Defense
15.0%
Electrical Equipment
11.8%
Industrial Conglomerates
10.7%
Road & Rail
10.5%
All Others*
29.1%
* Includes short-term investments and net other assets.
Prior period industry classifications reflect the categories in place as of the date indicated and have not been adjusted to reflect current industry classifications.
Annual Report
Investments December 31, 2008
Showing Percentage of Net Assets
Common Stocks - 97.0%
Shares
Value
AEROSPACE & DEFENSE - 26.3%
Aerospace & Defense - 26.3%
Honeywell International, Inc.
75,400
$ 2,475,382
Lockheed Martin Corp.
19,900
1,673,192
Precision Castparts Corp.
14,200
844,616
Raytheon Co.
25,425
1,297,692
The Boeing Co.
36,800
1,570,256
United Technologies Corp.
54,799
2,937,223
10,798,361
AIR FREIGHT & LOGISTICS - 7.9%
Air Freight & Logistics - 7.9%
C.H. Robinson Worldwide, Inc.
8,900
489,767
FedEx Corp.
13,100
840,365
United Parcel Service, Inc. Class B
29,000
1,599,640
UTI Worldwide, Inc.
21,900
314,046
3,243,818
AUTO COMPONENTS - 3.7%
Auto Parts & Equipment - 2.6%
Johnson Controls, Inc.
59,300
1,076,888
Tires & Rubber - 1.1%
The Goodyear Tire & Rubber Co. (a)
71,200
425,064
TOTAL AUTO COMPONENTS
1,501,952
AUTOMOBILES - 0.2%
Automobile Manufacturers - 0.2%
Renault SA
3,500
91,770
BUILDING PRODUCTS - 2.5%
Building Products - 2.5%
Masco Corp.
71,720
798,244
Owens Corning (a)
7,900
136,670
USG Corp. (a)(d)
13,700
110,148
1,045,062
CHEMICALS - 1.0%
Specialty Chemicals - 1.0%
Albemarle Corp.
4,635
103,361
Nalco Holding Co.
13,400
154,636
W.R. Grace & Co. (a)
26,368
157,417
415,414
COMMERCIAL SERVICES & SUPPLIES - 2.6%
Environmental & Facility Services - 2.3%
Republic Services, Inc.
39,049
968,025
Office Services & Supplies - 0.3%
United Stationers, Inc. (a)
3,468
116,143
TOTAL COMMERCIAL SERVICES & SUPPLIES
1,084,168
Shares
Value
CONSTRUCTION MATERIALS - 0.3%
Construction Materials - 0.3%
Martin Marietta Materials, Inc.
1,100
$ 106,788
DIVERSIFIED CONSUMER SERVICES - 0.6%
Specialized Consumer Services - 0.6%
Brinks Home Security Holdings, Inc. (a)
10,825
237,284
ELECTRICAL EQUIPMENT - 10.3%
Electrical Components & Equipment - 9.1%
Acuity Brands, Inc.
6,700
233,897
AMETEK, Inc.
21,950
663,110
Cooper Industries Ltd. Class A
29,000
847,670
Emerson Electric Co.
39,800
1,457,078
Rockwell Automation, Inc.
9,700
312,728
Saft Groupe SA
7,377
200,851
3,715,334
Heavy Electrical Equipment - 1.2%
Alstom SA
3,900
233,523
Vestas Wind Systems AS (a)
4,558
269,525
503,048
TOTAL ELECTRICAL EQUIPMENT
4,218,382
ELECTRONIC EQUIPMENT & COMPONENTS - 0.5%
Electronic Equipment & Instruments - 0.5%
Itron, Inc. (a)
3,400
216,716
HOUSEHOLD DURABLES - 0.2%
Homebuilding - 0.2%
Centex Corp.
8,000
85,120
INDUSTRIAL CONGLOMERATES - 9.9%
Industrial Conglomerates - 9.9%
General Electric Co.
73,319
1,187,768
Siemens AG sponsored ADR
19,900
1,507,425
Textron, Inc.
34,500
478,515
Tyco International Ltd.
41,581
898,150
4,071,858
MACHINERY - 16.2%
Construction & Farm Machinery & Heavy Trucks - 9.6%
Cummins, Inc.
49,800
1,331,154
Deere & Co. (d)
32,200
1,233,904
Manitowoc Co., Inc.
28,500
246,810
Navistar International Corp. (a)
28,100
600,778
PACCAR, Inc.
5,700
163,020
Terex Corp. (a)
15,400
266,728
Toro Co.
3,400
112,200
3,954,594
Industrial Machinery - 6.6%
Danaher Corp.
26,400
1,494,504
Eaton Corp.
11,418
567,589
Common Stocks - continued
Shares
Value
MACHINERY - CONTINUED
Industrial Machinery - continued
Parker Hannifin Corp. (d)
12,400
$ 527,496
Sulzer AG (Reg.)
1,898
109,277
2,698,866
TOTAL MACHINERY
6,653,460
MARINE - 0.4%
Marine - 0.4%
Safe Bulkers, Inc.
14,200
94,856
Ultrapetrol (Bahamas) Ltd. (a)
26,600
84,854
179,710
PROFESSIONAL SERVICES - 1.6%
Human Resource & Employment Services - 0.7%
Manpower, Inc.
8,000
271,920
Research & Consulting Services - 0.9%
Equifax, Inc.
13,800
365,976
TOTAL PROFESSIONAL SERVICES
637,896
ROAD & RAIL - 10.4%
Railroads - 7.8%
CSX Corp.
26,200
850,714
Norfolk Southern Corp.
18,390
865,250
Union Pacific Corp.
31,000
1,481,800
3,197,764
Trucking - 2.6%
Con-way, Inc.
17,900
476,140
J.B. Hunt Transport Services, Inc.
6,900
181,263
Landstar System, Inc.
4,600
176,778
Old Dominion Freight Lines, Inc. (a)
9,029
256,965
1,091,146
TOTAL ROAD & RAIL
4,288,910
TRADING COMPANIES & DISTRIBUTORS - 1.7%
Trading Companies & Distributors - 1.7%
Rush Enterprises, Inc. Class A (a)
50,536
433,094
W.W. Grainger, Inc.
3,500
275,940
709,034
Shares
Value
TRANSPORTATION INFRASTRUCTURE - 0.7%
Marine Ports & Services - 0.7%
Aegean Marine Petroleum Network, Inc.
17,100
$ 290,016
TOTAL COMMON STOCKS
(Cost $52,380,595)
39,875,719
Nonconvertible Preferred Stocks - 0.2%
AUTOMOBILES - 0.2%
Automobile Manufacturers - 0.2%
Fiat SpA (Cost $135,850)
23,735
84,517
Nonconvertible Bonds - 0.0%
Principal Amount
AIRLINES - 0.0%
Airlines - 0.0%
Delta Air Lines, Inc. 8.3% 12/15/29 (a) (Cost $15,608)
$ 540,000
10,800
Money Market Funds - 7.5%
Shares
Fidelity Cash Central Fund, 1.06% (b)
1,334,441
1,334,441
Fidelity Securities Lending Cash Central Fund, 0.87% (b)(c)
1,730,650
1,730,650
TOTAL MONEY MARKET FUNDS
(Cost $3,065,091)
3,065,091
TOTAL INVESTMENT PORTFOLIO - 104.7%
(Cost $55,597,144)
43,036,127
NET OTHER ASSETS - (4.7)%
(1,931,014)
NET ASSETS - 100%
$ 41,105,113
Legend
(a) Non-income producing
(b) Affiliated fund that is available only to investment companies and other accounts managed by Fidelity Investments. The rate quoted is the annualized seven-day yield of the fund at period end. A complete unaudited listing of the fund's holdings as of its most recent quarter end is available upon request.
(c) Investment made with cash collateral received from securities on loan.
(d) Security or a portion of the security is on loan at period end.
Affiliated Central Funds
Information regarding fiscal year to date income earned by the Fund from investments in Fidelity Central Funds is as follows:
Fund
Income earned
Fidelity Cash Central Fund
$ 48,264
Fidelity Securities Lending Cash Central Fund
69,351
Total
$ 117,615
Other Information
The following is a summary of the inputs used, as of December 31, 2008, involving the Fund's assets carried at value. The inputs or methodology used for valuing securities may not be an indication of the risk associated with investing in those securities. For more information on valuation inputs, and their aggregation into the levels used in the table below, please refer to the Security Valuation section in the accompanying Notes to Financial Statements.
Valuation Inputs at Reporting Date:
Description
Total
Level 1
Level 2
Level 3
Investments in Securities
$ 43,036,127
$ 42,035,864
$ 1,000,263
$ -
Distribution of investments by country of issue, as a percentage of total net assets, is as follows: (Unaudited)
United States of America
87.7%
Bermuda
4.3%
Germany
3.7%
France
1.3%
Others (individually less than 1%)
3.0%
100.0%
Income Tax Information
At December 31, 2008, the fund had a capital loss carryforward of approximately $5,257,797 all of which will expire on December 31, 2016.
The fund intends to elect to defer to its fiscal year ending December 31, 2009 approximately $5,105,987 of losses recognized during the period November 1, 2008 to December 31, 2008.
See accompanying notes which are an integral part of the financial statements.
Investment in securities, at value (including securities loaned of $1,726,884) - See accompanying schedule:
Unaffiliated issuers (cost $52,532,053)
$ 39,971,036
Fidelity Central Funds (cost $3,065,091)
3,065,091
Total Investments (cost $55,597,144)
$ 43,036,127
Receivable for investments sold
163,096
Receivable for fund shares sold
93,842
Dividends receivable
94,130
Distributions receivable from Fidelity Central Funds
2,443
Prepaid expenses
550
Other receivables
428
Total assets
43,390,616
Liabilities
Payable for investments purchased
$ 483,633
Payable for fund shares redeemed
10,200
Accrued management fee
18,369
Other affiliated payables
4,546
Other payables and accrued expenses
38,105
Collateral on securities loaned, at value
1,730,650
Total liabilities
2,285,503
Net Assets
$ 41,105,113
Net Assets consist of:
Paid in capital
$ 65,535,997
Accumulated undistributed net realized gain (loss) on investments and foreign currency transactions
(11,869,481)
Net unrealized appreciation (depreciation) on investments and assets and liabilities in foreign currencies
(12,561,403)
Net Assets
$ 41,105,113
Statement of Assets and Liabilities - continued
December 31, 2008
Initial Class: Net Asset Value, offering price and redemption price per share ($23,746,518 ÷ 2,835,508 shares)
$ 8.37
Investor Class: Net Asset Value, offering price and redemption price per share ($17,358,595 ÷ 2,079,739 shares)
$ 8.35
See accompanying notes which are an integral part of the financial statements.
Annual Report
Statement of Operations
Year ended December 31, 2008
Investment Income
Dividends
$ 1,032,596
Interest
791
Income from Fidelity Central Funds (including $69,351 from security lending)
117,615
Total income
1,151,002
Expenses
Management fee
$ 358,064
Transfer agent fees
73,111
Accounting and security lending fees
25,415
Custodian fees and expenses
16,479
Independent trustees' compensation
310
Audit
44,859
Legal
373
Miscellaneous
6,088
Total expenses before reductions
524,699
Expense reductions
(1,851)
522,848
Net investment income (loss)
628,154
Realized and Unrealized Gain (Loss)
Net realized gain (loss) on:
Investment securities:
Unaffiliated issuers
(11,763,988)
Foreign currency transactions
5,044
Total net realized gain (loss)
(11,758,944)
Change in net unrealized appreciation (depreciation) on:
Investment securities
(20,070,834)
Assets and liabilities in foreign currencies
(202)
Total change in net unrealized appreciation (depreciation)
(20,071,036)
Net gain (loss)
(31,829,980)
Net increase (decrease) in net assets resulting from operations
$ (31,201,826)
Statement of Changes in Net Assets
Year ended December 31, 2008
Year ended December 31, 2007
Increase (Decrease) in Net Assets
Operations
Net investment income (loss)
$ 628,154
$ 403,759
Net realized gain (loss)
(11,758,944)
9,944,805
Change in net unrealized appreciation (depreciation)
(20,071,036)
(99,969)
Net increase (decrease) in net assets resulting from operations
(31,201,826)
10,248,595
Distributions to shareholders from net investment income
(647,391)
(396,466)
Distributions to shareholders from net realized gain
(1,349,574)
(8,842,045)
Total distributions
(1,996,965)
(9,238,511)
Share transactions - net increase (decrease)
(2,375,514)
11,529,518
Redemption fees
30,102
20,061
Total increase (decrease) in net assets
(35,544,203)
12,559,663
Net Assets
Beginning of period
76,649,316
64,089,653
End of period
$ 41,105,113
$ 76,649,316
See accompanying notes which are an integral part of the financial statements.
Annual Report
Financial Highlights - Initial Class
Years ended December 31,
2008
2007
2006
2005
2004
Selected Per-Share Data
Net asset value, beginning of period
$ 14.43
$ 13.90
$ 14.20
$ 13.81
$ 11.16
Income from Investment Operations
Net investment income (loss) C
.12
.10
.14
.08
.08 H
Net realized and unrealized gain (loss)
(5.79)
2.43
2.02
1.70
2.59
Total from investment operations
(5.67)
2.53
2.16
1.78
2.67
Distributions from net investment income
(.14)
(.09)
(.15)
(.10)
(.04)
Distributions from net realized gain
(.26)
(1.91)
(2.33)
(1.30)
-
Total distributions
(.40)
(2.00)
(2.47) I
(1.40)
(.04)
Redemption fees added to paid in capital C
.01
- G
.01
.01
.02
Net asset value, end of period
$ 8.37
$ 14.43
$ 13.90
$ 14.20
$ 13.81
Total Return A, B
(39.84)%
18.21%
15.71%
12.88%
24.10%
Ratios to Average Net Assets D, F
Expenses before reductions
.78%
.78%
.79%
.81%
.95%
Expenses net of fee waivers, if any
.78%
.78%
.79%
.81%
.95%
Expenses net of all reductions
.78%
.78%
.78%
.76%
.90%
Net investment income (loss)
1.02%
.64%
.95%
.53%
.63% H
Supplemental Data
Net assets, end of period (000 omitted)
$ 23,747
$ 50,586
$ 51,332
$ 50,332
$ 62,299
Portfolio turnover rate E
138%
122%
137%
160%
121%
A Total returns do not reflect charges attributable to your insurance company's separate account. Inclusion of these charges would reduce the total returns shown. B Total returns would have been lower had certain expenses not been reduced during the periods shown. C Calculated based on average shares outstanding during the period. D Fees and expenses of the underlying Fidelity Central Funds are not included in the Fund's expense ratio. The Fund indirectly bears its proportionate share of the expenses of any underlying Fidelity Central Funds. E Amount does not include the portfolio activity of any underlying Fidelity Central Funds. F Expense ratios reflect operating expenses of the class. Expenses before reductions do not reflect amounts reimbursed by the investment adviser or reductions from brokerage service arrangements or other expense offset arrangements and do not represent the amount paid by the class during periods when reimbursements or reductions occur. Expenses net of fee waivers reflect expenses after reimbursement by the investment adviser but prior to reductions from brokerage service arrangements or other expense offset arrangements. Expenses net of all reductions represent the net expenses paid by the class. G Amount represents less than $.01 per share. H As a result in the change in the estimate of the return of capital components of dividend income realized in the year ended December 31, 2003, net investment income per share and the ratio of net investment income to average net assets for the year ended December 31, 2004 have been reduced by $0.00 per share and .04%, respectively. The change in estimate has no impact on total net assets or total return of the class. I Total distributions of $2.47 per share is comprised of distributions from net investment income of $.147 and distributions from net realized gain of $2.325 per share.
Financial Highlights - Investor Class
Years ended December 31,
2008
2007
2006
2005 H
Selected Per-Share Data
Net asset value, beginning of period
$ 14.38
$ 13.86
$ 14.19
$ 14.55
Income from Investment Operations
Net investment income (loss) E
.11
.08
.12
.02
Net realized and unrealized gain (loss)
(5.76)
2.43
2.00
.96
Total from investment operations
(5.65)
2.51
2.12
.98
Distributions from net investment income
(.13)
(.08)
(.14)
(.09)
Distributions from net realized gain
(.26)
(1.91)
(2.33)
(1.25)
Total distributions
(.39)
(1.99)
(2.46) K
(1.34)
Redemption fees added to paid in capital E
.01
- J
.01
- J
Net asset value, end of period
$ 8.35
$ 14.38
$ 13.86
$ 14.19
Total Return B, C, D
(39.84)%
18.12%
15.43%
6.65%
Ratios to Average Net Assets F, I
Expenses before reductions
.88%
.90%
.92%
1.08% A
Expenses net of fee waivers, if any
.88%
.90%
.92%
1.08% A
Expenses net of all reductions
.87%
.90%
.92%
1.03% A
Net investment income (loss)
.92%
.52%
.81%
.31% A
Supplemental Data
Net assets, end of period (000 omitted)
$ 17,359
$ 26,063
$ 12,758
$ 1,936
Portfolio turnover rate G
138%
122%
137%
160%
A Annualized B Total returns for periods of less than one year are not annualized. C Total returns do not reflect charges attributable to your insurance company's separate account. Inclusion of these charges would reduce the total returns shown. D Total returns would have been lower had certain expenses not been reduced during the periods shown. E Calculated based on average shares outstanding during the period. F Fees and expenses of the underlying Fidelity Central Funds are not included in the Fund's expense ratio. The Fund indirectly bears its proportionate share of the expenses of any underlying Fidelity Central Funds. G Amount does not include the portfolio activity of any underlying Fidelity Central Funds. H For the period July 21, 2005 (commencement of sale of shares) to December 31, 2005. I Expense ratios reflect operating expenses of the class. Expenses before reductions do not reflect amounts reimbursed by the investment adviser or reductions from brokerage service arrangements or other expense offset arrangements and do not represent the amount paid by the class during periods when reimbursements or reductions occur. Expense ratios before reductions for start-up periods may not be representative of longer-term operating periods. Expenses net of fee waivers reflect expenses after reimbursement by the investment adviser but prior to reductions from brokerage service arrangements or other expense offset arrangements. Expenses net of all reductions represent the net expenses paid by the class. J Amount represents less than $.01 per share. K Total distributions of $2.46 per share is comprised of distributions from net investment income of $.138 and distributions from net realized gain of $2.325 per share.
See accompanying notes which are an integral part of the financial statements.
VIP Industrials Portfolio (the Fund) is a non-diversified fund of Variable Insurance Products Fund IV (the trust) and is authorized to issue an unlimited number of shares. The trust is registered under the Investment Company Act of 1940, as amended (the 1940 Act), as an open-end management investment company organized as a Massachusetts business trust. Shares of the Fund may only be purchased by insurance companies for the purpose of funding variable annuity or variable life insurance contracts. The Fund offers the following classes of shares: Initial Class shares, and Investor Class shares. All classes have equal rights and voting privileges, except for matters affecting a single class. Investment income, realized and unrealized capital gains and losses, the common expenses of the Fund, and certain fund-level expense reductions, if any, are allocated on a pro rata basis to each class based on the relative net assets of each class to the total net assets of the Fund. Each class differs with respect to transfer agent fees incurred. Certain expense reductions also differ by class.
2. Investments in Fidelity Central Funds.
The Fund may invest in Fidelity Central Funds, which are open-end investment companies available only to other investment companies and accounts managed by Fidelity Management & Research Company (FMR) and its affiliates. The Fund's Schedule of Investments lists each of the Fidelity Central Funds held as of period end, if any, as an investment of the Fund, but does not include the underlying holdings of each Fidelity Central Fund. As an Investing Fund, the Fund indirectly bears its proportionate share of the expenses of the underlying Fidelity Central Funds.
The Money Market Central Funds seek preservation of capital and current income and are managed by Fidelity Investments Money Management, Inc. (FIMM), an affiliate of FMR.
A complete unaudited list of holdings for each Fidelity Central Fund is available upon request or at the SEC's web site at www.sec.gov. In addition, the financial statements of the Fidelity Central Funds, which are not covered by the Fund's Report of Independent Registered Public Accounting Firm, are available on the SEC's web site or upon request.
3. Significant Accounting Policies.
The financial statements have been prepared in conformity with accounting principles generally accepted in the United States of America, which require management to make certain estimates and assumptions at the date of the financial statements. Actual results could differ from those estimates. The following summarizes the significant accounting policies of the Fund:
Security Valuation. Investments are valued as of 4:00 p.m. Eastern time on the last calendar day of the period. Wherever possible, the Fund uses independent pricing services approved by the Board of Trustees to value its investments.
Equity securities, including restricted securities, for which market quotations are readily available, are valued at the last reported sale price or official closing price as reported by an independent pricing service on the primary market or exchange on which they are traded. In the event there were no sales during the day or closing prices are not available, securities are valued at the last quoted bid price. Debt securities, including restricted securities, are valued by independent pricing services or by dealers who make markets in such securities. Pricing services consider yield or price of bonds of comparable quality, coupon, maturity and type as well as dealer supplied prices. Investments in open-end mutual funds, including the Fidelity Central Funds, are valued at their closing net asset value each business day. Short-term securities with remaining maturities of sixty days or less for which quotations are not readily available are valued at amortized cost, which approximates value.
When current market prices or quotations are not readily available or reliable, valuations may be determined in good faith in accordance with procedures adopted by the Board of Trustees. Factors used in determining value may include significant market or security specific events, changes in interest rates and credit quality, and developments in foreign markets which are monitored by evaluating the performance of ADRs, futures contracts and exchange-traded funds. The frequency with which these procedures are used cannot be predicted and may be utilized to a significant extent. The value of securities used for net asset value (NAV) calculation under these procedures may differ from published prices for the same securities.
The Fund is subject to the provisions of Statement of Financial Accounting Standards No. 157, "Fair Value Measurements" (SFAS 157), effective with the beginning of the Fund's fiscal year. SFAS 157 establishes a hierarchy that prioritizes the inputs to valuation techniques giving the highest priority to readily available unadjusted quoted prices in active markets for identical assets (level 1 measurements) and the lowest priority to unobservable inputs (level 3 measurements) when market prices are not readily available or reliable. The three levels of the hierarchy under SFAS 157 are described below:
Level 1
Quoted prices in active markets for identical securities.
Level 2
Prices determined using other significant observable inputs. Observable inputs are inputs that other market participants may use in pricing a security. These may include quoted prices for similar securities, interest rates, prepayment speeds, credit risk and others.
Level 3
Prices determined using significant unobservable inputs. In situations where quoted prices or observable inputs are unavailable or deemed less relevant (for example, when there is little or no market activity for an investment at the end of the period), unobservable inputs may be used. Unobservable inputs reflect the Fund's own assumptions about the factors market participants would use in pricing an investment, and would be based on the best information available.
Annual Report
Notes to Financial Statements - continued
3. Significant Accounting Policies - continued
Security Valuation - continued
Changes in valuation techniques may result in transfers in or out of an investment's assigned level within the hierarchy.
The aggregate value by input level, as of December 31, 2008, for the Fund's investments is included at the end of the Fund's Schedule of Investments.
Foreign Currency. The Fund uses foreign currency contracts to facilitate transactions in foreign-denominated securities. Losses from these transactions may arise from changes in the value of the foreign currency or if the counterparties do not perform under the contracts' terms.
Foreign-denominated assets, including investment securities, and liabilities are translated into U.S. dollars at the exchange rate at period end. Purchases and sales of investment securities, income and dividends received and expenses denominated in foreign currencies are translated into U.S. dollars at the exchange rate in effect on the transaction date.
The effects of exchange rate fluctuations on investments are included with the net realized and unrealized gain (loss) on investment securities. Other foreign currency transactions resulting in realized and unrealized gain (loss) are disclosed separately.
Investment Transactions and Income. For financial reporting purposes, the Fund's investment holdings and NAV include trades executed through the end of the last business day of the period. The NAV per share for processing shareholder transactions is calculated as of the close of business of the New York Stock Exchange (NYSE) normally 4:00 p.m. Eastern time and includes trades executed through the end of the prior business day. Gains and losses on securities sold are determined on the basis of identified cost and may include proceeds received from litigation. Dividend income is recorded on the ex-dividend date, except for certain dividends from foreign securities where the ex-dividend date may have passed, which are recorded as soon as the Fund is informed of the ex-dividend date. Non-cash dividends included in dividend income, if any, are recorded at the fair market value of the securities received. Distributions received on securities that represent a return of capital or capital gain are recorded as a reduction of cost of investments and/or as a realized gain. The Fund estimates the components of distributions received that may be considered return of capital distributions or capital gain distributions. Interest income and distributions from the Fidelity Central Funds are accrued as earned. Interest income includes coupon interest and amortization of premium and accretion of discount on debt securities. Investment income is recorded net of foreign taxes withheld where recovery of such taxes is uncertain.
Expenses. Most expenses of the trust can be directly attributed to a fund. Expenses which cannot be directly attributed are apportioned among each Fund in the trust. Expense estimates are accrued in the period to which they relate and adjustments are made when actual amounts are known.
Income Tax Information and Distributions to Shareholders. Each year, the Fund intends to qualify as a regulated investment company by distributing substantially all of its taxable income and realized gains under Subchapter M of the Internal Revenue Code and filing its U.S. federal tax return. As a result, no provision for income taxes is required. The Fund is subject to the provisions of FASB Interpretation No. 48, Accounting for Uncertainties in Income Taxes (FIN 48). FIN 48 sets forth a minimum threshold for financial statement recognition of the benefit of a tax position taken or expected to be taken in a tax return. There are no unrecognized tax benefits in the accompanying financial statements. A Fund's federal tax return is subject to examination by the Internal Revenue Service (IRS) for a period of three years. Foreign taxes are provided for based on the Fund's understanding of the tax rules and rates that exist in the foreign markets in which it invests.
Distributions are recorded on the ex-dividend date. Income dividends and capital gain distributions are declared separately for each class. Income and capital gain distributions are determined in accordance with income tax regulations, which may differ from generally accepted accounting principles.
Capital accounts within the financial statements are adjusted for permanent book-tax differences. These adjustments have no impact on net assets or the results of operations. Temporary book-tax differences will reverse in a subsequent period.
Book-tax differences are primarily due to foreign currency transactions, losses deferred due to wash sales and excise tax regulations.
The tax-basis components of distributable earnings and the federal tax cost as of period end were as follows:
Unrealized appreciation
$ 953,472
Unrealized depreciation
(15,020,574)
Net unrealized appreciation (depreciation)
(14,067,102)
Capital loss carryforward
(5,257,797)
Cost for federal income tax purposes
$ 57,103,229
Annual Report
3. Significant Accounting Policies - continued
Income Tax Information and Distributions to Shareholders - continued
The tax character of distributions paid was as follows:
December 31, 2008
December 31, 2007
Ordinary Income
$ 1,374,085
$ 5,349,354
Long-term Capital Gains
622,880
3,889,157
Total
$ 1,996,965
$ 9,238,511
Trading (Redemption) Fees. Shares held less than 60 days are subject to a redemption fee equal to 1% of the proceeds of the redeemed shares. All redemption fees, including any estimated redemption fees paid by FMR, are retained by the Fund and accounted for as an addition to paid in capital
4. Operating Policies.
Repurchase Agreements. FMR has received an Exemptive Order from the Securities and Exchange Commission (the SEC) which permits the Fund and other affiliated entities of FMR to transfer uninvested cash balances into joint trading accounts which are then invested in repurchase agreements. The Fund may also invest directly with institutions in repurchase agreements. Repurchase agreements are collateralized by government or non-government securities. Upon settlement date, collateral is held in segregated accounts with custodian banks and may be obtained in the event of a default of the counterparty. The Fund monitors, on a daily basis, the value of the collateral to ensure it is at least equal to the principal amount of the repurchase agreement (including accrued interest). In the event of a default by the counterparty, realization of the collateral proceeds could be delayed, during which time the value of the collateral may decline.
5. Purchases and Sales of Investments.
Purchases and sales of securities, other than short-term securities, aggregated $86,576,554 and $89,820,769, respectively.
6. Fees and Other Transactions with Affiliates.
Management Fee. FMR and its affiliates provide the Fund with investment management related services for which the Fund pays a monthly management fee. The management fee is the sum of an individual fund fee rate that is based on an annual rate of .30% of the Fund's average net assets and a group fee rate that averaged .26% during the period. The group fee rate is based upon the average net assets of all the mutual funds advised by FMR. The group fee rate decreases as assets under management increase and increases as assets under management decrease. For the period, the total annual management fee rate was .56% of the Fund's average net assets.
Transfer Agent Fees. Fidelity Investments Institutional Operations Company, Inc. (FIIOC), an affiliate of FMR, is the Fund's transfer, dividend disbursing, and shareholder servicing agent. FIIOC receives an asset-based fee with respect to each class. Each class (with the exception of Investor Class) pays a transfer agent fee, excluding out of pocket expenses, equal to an annual rate of .07% of average net assets. Investor Class pays a monthly asset-based transfer agent fee of .15% of average net assets. Prior to February 1, 2008, Investor Class paid a monthly asset-based transfer agent fee of .18% of average net assets. The total transfer agent fees paid by each class to FIIOC, including out of pocket expenses, were as follows:
Initial Class
$ 30,218
Investor Class
42,893
$ 73,111
Accounting and Security Lending Fees. Fidelity Service Company, Inc. (FSC), an affiliate of FMR, maintains the Fund's accounting records. The accounting fee is based on the level of average net assets for the month. Under a separate contract, FSC administers the security lending program. The security lending fee is based on the number and duration of lending transactions.
Brokerage Commissions. The Fund placed a portion of its portfolio transactions with brokerage firms which are affiliates of the investment adviser. The commissions paid to these affiliated firms were $2,294 for the period.
7. Committed Line of Credit.
The Fund participates with other funds managed by FMR in a $4.2 billion credit facility (the "line of credit") to be utilized for temporary or emergency purposes to fund shareholder redemptions or for other short-term liquidity purposes. The Fund has agreed to pay commitment fees on its pro rata portion of the line of credit, which amounted to $141 and is reflected in Miscellaneous Expense on the Statement of Operations. During the period, there were no borrowings on this line of credit.
Annual Report
Notes to Financial Statements - continued
8. Security Lending.
The Fund lends portfolio securities from time to time in order to earn additional income. On the settlement date of the loan, the Fund receives collateral (in the form of U.S. Treasury obligations, letters of credit and/or cash) against the loaned securities and maintains collateral in an amount not less than 100% of the market value of the loaned securities during the period of the loan. The market value of the loaned securities is determined at the close of business of the Fund and any additional required collateral is delivered to the Fund on the next business day. If the borrower defaults on its obligation to return the securities loaned because of insolvency or other reasons, a fund could experience delays and costs in recovering the securities loaned or in gaining access to the collateral. Any cash collateral received is invested in the Fidelity Securities Lending Cash Central Fund. The value of loaned securities and cash collateral at period end are disclosed on the Fund's Statement of Assets and Liabilities. Security lending income represents the income earned on investing cash collateral, less fees and expenses associated with the loan, plus any premium payments that may be received on the loan of certain types of securities. Security lending income is presented in the Statement of Operations as a component of income from Fidelity Central Funds.
9. Expense Reductions.
Many of the brokers with whom FMR places trades on behalf of the Fund provided services to the Fund in addition to trade execution. These services included payments of certain expenses on behalf of the Fund totaling $1,851 for the period.
10. Other.
The Fund's organizational documents provide former and current trustees and officers with a limited indemnification against liabilities arising in connection with the performance of their duties to the Fund. In the normal course of business, the Fund may also enter into contracts that provide general indemnifications. The Fund's maximum exposure under these arrangements is unknown as this would be dependent on future claims that may be made against the Fund. The risk of material loss from such claims is considered remote.
At the end of the period, FMR or its affiliates were the owners of record of 100% of the total outstanding shares of the Fund.
In December 2006, the Independent Trustees, with the assistance of independent counsel, completed an investigation regarding gifts, gratuities and business entertainment provided by certain brokers to certain individuals who were employed on FMR's domestic equity trading desk during the period 2002 to 2004. The Independent Trustees and FMR agreed that, despite the absence of proof that the Fidelity mutual funds experienced diminished execution quality as a result of the improper receipt of gifts and business entertainment, the conduct at issue was serious and was worthy of redress. Accordingly, the Independent Trustees requested, and FMR agreed to make, a payment of $42 million plus accrued interest, which equaled approximately $7.3 million, to certain Fidelity mutual funds.
In March 2008, the Trustees approved a method for allocating this payment among the funds and, in total, FMR paid the fund $5,236 which is recorded in the accompanying Statement of Operations.
In a related administrative order dated March 5, 2008, the U.S. Securities and Exchange Commission ("SEC") announced a settlement with FMR and FMR Co., Inc. (an affiliate of FMR) involving the SEC's regulatory rules for investment advisers and the improper receipt of gifts, gratuities and business entertainment. Without admitting or denying the SEC's findings, FMR agreed to pay an $8 million civil penalty to the United States Treasury.
11. Distributions to Shareholders.
Distributions to shareholders of each class were as follows:
Years ended December 31,
2008
2007
From net investment income
Initial Class
$ 385,462
$ 272,670
Investor Class
261,929
123,796
Total
$ 647,391
$ 396,466
From net realized gain
Initial Class
$ 885,620
$ 5,872,517
Investor Class
463,954
2,969,528
Total
$ 1,349,574
$ 8,842,045
Annual Report
12. Share Transactions.
Transactions for each class of shares were as follows:
Shares
Dollars
Years ended December 31,
2008
2007
2008
2007
Initial Class
Shares sold
842,161
515,158
$ 10,739,604
$ 8,136,966
Reinvestment of distributions
115,154
425,160
1,271,082
6,145,187
Shares redeemed
(1,628,549)
(1,127,712)
(19,451,472)
(16,771,318)
Net increase (decrease)
(671,234)
(187,394)
$ (7,440,786)
$ (2,489,165)
Investor Class
Shares sold
1,277,670
981,693
$ 16,291,692
$ 15,432,146
Reinvestment of distributions
67,934
214,711
725,883
3,093,324
Shares redeemed
(1,078,868)
(303,783)
(11,952,303)
(4,506,787)
Net increase (decrease)
266,736
892,621
$ 5,065,272
$ 14,018,683
Annual Report
Reportof Independent Registered Public Accounting Firm
To the Trustees of Variable Insurance Products Fund IV and the Shareholders of VIP Industrials Portfolio:
In our opinion, the accompanying statement of assets and liabilities, including the schedule of investments, and the related statements of operations and of changes in net assets and the financial highlights present fairly, in all material respects, the financial position of VIP Industrials Portfolio (a fund of Variable Insurance Products Fund IV) at December 31, 2008, the results of its operations for the year then ended, the changes in its net assets for each of the two years in the period then ended and the financial highlights for each of the periods indicated, in conformity with accounting principles generally accepted in the United States of America. These financial statements and financial highlights (hereafter referred to as "financial statements") are the responsibility of the VIP Industrials Portfolio's management. Our responsibility is to express an opinion on these financial statements based on our audits. We conducted our audits of these financial statements in accordance with the standards of the Public Company Accounting Oversight Board (United States). Those standards require that we plan and perform the audit to obtain reasonable assurance about whether the financial statements are free of material misstatement. An audit includes examining, on a test basis, evidence supporting the amounts and disclosures in the financial statements, assessing the accounting principles used and significant estimates made by management, and evaluating the overall financial statement presentation. We believe that our audits, which included confirmation of securities at December 31, 2008 by correspondence with the custodian and brokers, provide a reasonable basis for our opinion.
The Trustees, Member of the Advisory Board, and executive officers of the trust and fund, as applicable, are listed below. The Board of Trustees governs the fund and is responsible for protecting the interests of shareholders. The Trustees are experienced executives who meet periodically throughout the year to oversee the fund's activities, review contractual arrangements with companies that provide services to the fund, and review the fund's performance. Except for Edward C. Johnson 3d and James C. Curvey, each of the Trustees oversees 222 funds advised by FMR or an affiliate. Messrs. Johnson and Curvey oversee 381 funds advised by FMR or an affiliate.
The Trustees hold office without limit in time except that (a) any Trustee may resign; (b) any Trustee may be removed by written instrument, signed by at least two-thirds of the number of Trustees prior to such removal; (c) any Trustee who requests to be retired or who has become incapacitated by illness or injury may be retired by written instrument signed by a majority of the other Trustees; and (d) any Trustee may be removed at any special meeting of shareholders by a two-thirds vote of the outstanding voting securities of the trust. Each Trustee who is not an interested person (as defined in the 1940 Act) (Independent Trustee), shall retire not later than the last day of the calendar year in which his or her 72nd birthday occurs. The Independent Trustees may waive this mandatory retirement age policy with respect to individual Trustees. The executive officers and Advisory Board Member hold office without limit in time, except that any officer and Advisory Board Member may resign or may be removed by a vote of a majority of the Trustees at any regular meeting or any special meeting of the Trustees. Except as indicated, each individual has held the office shown or other offices in the same company for the past five years.
The fund's Statement of Additional Information (SAI) includes more information about the Trustees. To request a free copy, call Fidelity at 1-877-0098.
Interested Trustees*:
Correspondence intended for each Trustee who is an interested person may be sent to Fidelity Investments, 82 Devonshire Street, Boston, Massachusetts 02109.
Name, Age; Principal Occupation
Edward C. Johnson 3d (78)
Year of Election or Appointment: 1983
Mr. Johnson is Chairman of the Board of Trustees. Mr. Johnson serves as Chief Executive Officer, Chairman, and a Director of FMR LLC; Chairman and a Director of FMR; Chairman and a Director of Fidelity Research & Analysis Company (FRAC); Chairman and a Director of Fidelity Investments Money Management, Inc.; and Chairman and a Director of FMR Co., Inc. In addition, Mr. Johnson serves as Chairman and Director of FIL Limited. Previously, Mr. Johnson served as President of FMR LLC (2006-2007).
James C. Curvey (73)
Year of Election or Appointment: 2007
Mr. Curvey also serves as Trustee (2007-present) of other investment companies advised by FMR. Mr. Curvey is a Director of FMR and FMR Co., Inc. (2007-present). Mr. Curvey is also Vice Chairman (2006-present) and Director of FMR LLC. In addition, Mr. Curvey serves as an Overseer for the Boston Symphony Orchestra and a member of the Trustees of Villanova University.
* Trustees have been determined to be "Interested Trustees" by virtue of, among other things, their affiliation with the trust or various entities under common control with FMR. FMR Corp. merged with and into FMR LLC on October 1, 2007. Any references to FMR LLC for prior periods are deemed to be references to the prior entity.
Independent Trustees:
Correspondence intended for each Independent Trustee (that is, the Trustees other than the Interested Trustees) may be sent to Fidelity Investments, P.O. Box 55235, Boston, Massachusetts 02205-5235.
Name, Age; Principal Occupation
Dennis J. Dirks (60)
Year of Election or Appointment: 2005
Prior to his retirement in May 2003, Mr. Dirks was Chief Operating Officer and a member of the Board of The Depository Trust & Clearing Corporation (DTCC) (1999-2003). He also served as President, Chief Operating Officer, and Board member of The Depository Trust Company (DTC) (1999-2003) and President and Board member of the National Securities Clearing Corporation (NSCC) (1999-2003). In addition, Mr. Dirks served as Chief Executive Officer and Board member of the Government Securities Clearing Corporation (2001-2003), Chief Executive Officer and Board member of the Mortgage-Backed Securities Clearing Corporation (2001-2003), as a Trustee and a member of the Finance Committee of Manhattan College (2005-2008), and as a Trustee and a member of the Finance Committee of AHRC of Nassau County (2006-2008). Currently, Mr. Dirks serves as a member of the Board of Directors for The Brookville Center for Children's Services, Inc. (2009-present).
Alan J. Lacy (55)
Year of Election or Appointment:2008
Mr. Lacy serves as Senior Adviser (2007-present) of Oak Hill Capital Partners, L.P. (a private equity firm). Mr. Lacy also served as Chief Executive Officer (2000-2005) and Vice Chairman (2005-2006) of Sears Holdings Corporation and Sears, Roebuck and Co. (retail). In addition, Mr. Lacy serves as a member of the Board of Directors of The Western Union Company (global money transfer, 2006-present) and Bristol-Myers Squibb (global pharmaceuticals, 2007-present). Mr. Lacy is a Trustee of the National Parks Conservation Association and The Field Museum of Natural History.
Ned C. Lautenbach (64)
Year of Election or Appointment: 2000
Mr. Lautenbach is Chairman of the Independent Trustees (2006-present). Mr. Lautenbach is an Advisory Partner of Clayton, Dubilier & Rice, Inc. (private equity investment firm). Previously, Mr. Lautenbach was with the International Business Machines Corporation (IBM) from 1968 until his retirement in 1998. Mr. Lautenbach serves as a Director of Eaton Corporation (diversified industrial) as well as the Philharmonic Center for the Arts in Naples, Florida. He also is a member of the Board of Trustees of Fairfield University (2005-present), as well as a member of the Council on Foreign Relations. Previously, Mr. Lautenbach served as a Director of Sony Corporation (2006-2007).
Joseph Mauriello (64)
Year of Election or Appointment: 2008
Prior to his retirement in January 2006, Mr. Mauriello served in numerous senior management positions including Deputy Chairman and Chief Operating Officer (2004-2005), and Vice Chairman of Financial Services (2002-2004) of KPMG LLP US (professional services firm, 1965-2005). Mr. Mauriello currently serves as a member of the Board of Directors of XL Capital Ltd. (global insurance and re-insurance company, 2006-present) and of Arcadia Resources Inc. (health care services and products, 2007- present). He also served as a Director of the Hamilton Funds of the Bank of New York (2006-2007).
Cornelia M. Small (64)
Year of Election or Appointment: 2005
Ms. Small is a member of the Investment Committee, and Chair (2008-present) and a member of the Board of Trustees of Smith College. Ms. Small also serves on the Investment Committee of the Berkshire Taconic Community Foundation (2008-present). Previously, Ms. Small served as Chairperson of the Investment Committee (2002-2008) of Smith College and as Co-Chair (2000-2003) of the Annual Fund for the Fletcher School of Law and Diplomacy. In addition, she served as Chief Investment Officer, Director of Global Equity Investments, and a member of the Board of Directors of Scudder, Stevens & Clark and Scudder Kemper Investments.
William S. Stavropoulos (69)
Year of Election or Appointment: 2001
Mr. Stavropoulos is Chairman Emeritus of the Board of Directors of The Dow Chemical Company, where he previously served in numerous senior management positions, including President (1993-2000; 2002-2003), CEO (1995-2000; 2002-2004), Chairman of the Executive Committee (2000-2006), and as a member of the Board of Directors (1990-2006). Currently, he is a Director of Teradata Corporation (data warehousing and technology solutions, 2008-present), Chemical Financial Corporation, Maersk Inc. (industrial conglomerate), Tyco International, Inc. (multinational manufacturing and services, 2007-present), and a member of the Advisory Board for Metalmark Capital (private equity investment firm, 2005-present). He is a special advisor to Clayton, Dubilier & Rice, Inc. (private equity investment). In addition, Mr. Stavropoulos is a member of the University of Notre Dame Advisory Council for the College of Science.
David M. Thomas (59)
Year of Election or Appointment: 2008
Previously, Mr. Thomas served as Executive Chairman (2005-2006) and Chairman and Chief Executive Officer (2000-2005) of IMS Health, Inc. (pharmaceutical and healthcare information solutions). In addition, Mr. Thomas serves as a member of the Board of Directors of Fortune Brands, Inc. (consumer products holding company), and Interpublic Group of Companies, Inc. (marketing communication, 2004-present).
Michael E. Wiley (58)
Year of Election or Appointment: 2008
Mr. Wiley also serves as a member of the Board of Trustees of the University of Tulsa (2000-2006; 2007-present). He serves as a Director of Tesoro Corporation (independent oil refiner and marketer, 2005-present), and a Director of Bill Barrett Corporation (exploration and production company, 2005-present). In addition, he also serves as a Director of Post Oak Bank (privately-held bank, 2004-present). Previously, Mr. Wiley served as a Sr. Energy Advisor of Katzenbach Partners, LLC (consulting firm, 2006-2007), as an Advisory Director of Riverstone Holdings (private investment firm), Chairman, President, and CEO of Baker Hughes, Inc. (oilfield services company, 2000-2004), and as Director of Spinnaker Exploration Company (exploration and production company, 2001-2005).
Annual Report
Trustees and Officers - continued
Advisory Board Member and Executive Officers**:
Correspondence intended for each executive officer and Peter S. Lynch may be sent to Fidelity Investments, 82 Devonshire Street, Boston, Massachusetts 02109.
Name, Age; Principal Occupation
Peter S. Lynch (64)
Year of Election or Appointment: 2003
Member of the Advisory Board of Fidelity's Equity and High Income Funds. Mr. Lynch is Vice Chairman and a Director of FMR, and Vice Chairman (2001-present) and a Director of FMR Co., Inc. Previously, Mr. Lynch served as a Trustee of the Fidelity funds (1990-2003). In addition, he serves as a Trustee of Boston College and as the Chairman of the Inner-City Scholarship Fund. Previously, Mr. Lynch served on the Special Olympics International Board of Directors (1997-2006).
Kenneth B. Robins (39)
Year of Election or Appointment: 2008
President and Treasurer of Fidelity's Equity and High Income Funds. Mr. Robins is an employee of Fidelity Investments (2004- present). Before joining Fidelity Investments, Mr. Robins worked at KPMG LLP, where he was a partner in KPMG's department of professional practice (2002-2004).
Brian B. Hogan (44)
Year of Election or Appointment: 2007
Vice President of Sector Funds. Mr. Hogan also serves as Senior Vice President, Equity Research of FMR. Previously, Mr. Hogan served as a portfolio manager.
Scott C. Goebel (40)
Year of Election or Appointment: 2008
Secretary and Chief Legal Officer (CLO) of the Fidelity funds. Mr. Goebel also serves as General Counsel, Secretary, and Senior Vice President of FMR (2008-present); Deputy General Counsel of FMR LLC; Chief Legal Secretary of Fidelity Management & Research (Hong Kong) Limited (2008-present) and Assistant Secretary of Fidelity Management & Research (Japan) Inc. (2008- present). Previously, Mr. Goebel served as Assistant Secretary of the Funds (2007-2008) and as Vice President and Secretary of Fidelity Distributors Corporation (FDC) (2005-2007).
John B. McGinty, Jr. (46)
Year of Election or Appointment: 2008
Assistant Secretary of Fidelity's Equity and High Income Funds. Mr. McGinty is an employee of Fidelity Investments (2004-present). Mr. McGinty also serves as Senior Vice President, Secretary, and Chief Legal Officer of FDC (2007-present). Before joining Fidelity Investments, Mr. McGinty practiced law at Ropes & Gray, LLP.
Holly C. Laurent (54)
Year of Election or Appointment: 2008
Anti-Money Laundering (AML) Officer of the Fidelity funds. Ms. Laurent is an employee of Fidelity Investments. Previously, Ms. Laurent was Senior Vice President and Head of Legal for Fidelity Business Services India Pvt. Ltd. (2006-2008), Senior Vice President, Deputy General Counsel and Group Head for FMR LLC (2005-2006).
Christine Reynolds (50)
Year of Election or Appointment: 2008
Chief Financial Officer of the Fidelity funds. Ms. Reynolds became President of Fidelity Pricing and Cash Management Services (FPCMS) in August 2008. She served as Chief Operating Officer of FPCMS from 2007 through July 2008. Previously, Ms. Reynolds served as President, Treasurer, and Anti-Money Laundering officer of the Fidelity funds (2004-2007). Before joining Fidelity Investments, Ms. Reynolds worked at PricewaterhouseCoopers LLP (PwC) (1980-2002), where she was an audit partner with PwC's investment management practice.
Kenneth A. Rathgeber (61)
Year of Election or Appointment: 2004
Chief Compliance Officer of Fidelity's Equity and High Income Funds. Mr. Rathgeber is Chief Compliance Officer of Fidelity Management & Research (Hong Kong) Limited (2008-present), Fidelity Management & Research (Japan) Inc. (2008-present), FMR (2005-present), FMR Co., Inc. (2005-present), Fidelity Management & Research (U.K.) Inc. (2005-present), Fidelity Research & Analysis Company (2005-present), Fidelity Investments Money Management, Inc. (2005-present), and Strategic Advisers, Inc. (2005-present).
Bryan A. Mehrmann (47)
Year of Election or Appointment: 2005
Deputy Treasurer of the Fidelity funds. Mr. Mehrmann is an employee of Fidelity Investments. Previously, Mr. Mehrmann served as Vice President of Fidelity Investments Institutional Services Group (FIIS)/Fidelity Investments Institutional Operations Company, Inc. (FIIOC) Client Services (1998-2004).
Adrien E. Deberghes (41)
Year of Election or Appointment: 2008
Deputy Treasurer of Fidelity's Equity and High Income Funds. Mr. Deberghes is an employee of Fidelity Investments (2008-present). Previously, Mr. Deberghes served as Senior Vice President of Mutual Fund Administration at State Street Corporation (2007-2008), Senior Director of Mutual Fund Administration at Investors Bank & Trust (2005-2007), and Director of Finance for Dunkin' Brands (2000-2005).
Robert G. Byrnes (42)
Year of Election or Appointment: 2005
Assistant Treasurer of the Fidelity funds. Mr. Byrnes is an employee of Fidelity Investments (2005-present). Previously, Mr. Byrnes served as Vice President of Fidelity Pricing and Cash Management Services (FPCMS) (2003-2005). Before joining Fidelity Investments, Mr. Byrnes worked at Deutsche Asset Management where he served as Vice President of the Investment Operations Group (2000-2003).
Paul M. Murphy (61)
Year of Election or Appointment: 2007
Assistant Treasurer of the Fidelity funds. Mr. Murphy is an employee of Fidelity Investments (2007-present). Previously, Mr. Murphy served as Chief Financial Officer of the Fidelity Funds (2005-2006), Vice President and Associate General Counsel of FMR (2007), and Senior Vice President of Fidelity Pricing and Cash Management Services (FPCMS) (1994-2007).
Gary W. Ryan (50)
Year of Election or Appointment: 2005
Assistant Treasurer of the Fidelity funds. Mr. Ryan is an employee of Fidelity Investments. Previously, Mr. Ryan served as Vice President of Fund Reporting in Fidelity Pricing and Cash Management Services (FPCMS) (1999-2005).
** FMR Corp. merged with and into FMR LLC on October 1, 2007. Any references to FMR LLC for prior periods are deemed to be references to the prior entity.
Initial Class and Investor Class designates 3% and 100% of the dividends distributed in February 2008 and December 2008, respectively during the fiscal year as qualifying for the dividends-received deduction for corporate shareholders.
The fund will notify shareholders in January 2009 of amounts for use in preparing 2008 income tax returns.
A special meeting of the fund's shareholders was held on May 14, 2008. The results of votes taken among shareholders on the proposals before them are reported below. Each vote reported represents one dollar of net asset value held on the record date for the meeting.
PROPOSAL 1
To elect a Board of Trustees.A
# of Votes
% of Votes
James C. Curvey
Affirmative
82,890,712.47
95.991
Withheld
3,461,988.43
4.009
TOTAL
86,352,700.90
100.000
Dennis J. Dirks
Affirmative
82,970,372.75
96.083
Withheld
3,382,328.15
3.917
TOTAL
86,352,700.90
100.000
Edward C. Johnson 3d
Affirmative
82,689,162.78
95.757
Withheld
3,663,538.12
4.243
TOTAL
86,352,700.90
100.000
Alan J. Lacy
Affirmative
83,041,222.35
96.165
Withheld
3,311,478.55
3.835
TOTAL
86,352,700.90
100.000
Ned C. Lautenbach
Affirmative
82,983,853.72
96.099
Withheld
3,368,847.18
3.901
TOTAL
86,352,700.90
100.000
Joseph Mauriello
Affirmative
83,138,122.14
96.277
Withheld
3,214,578.76
3.723
TOTAL
86,352,700.90
100.000
Cornelia M. Small
Affirmative
83,095,438.06
96.228
Withheld
3,257,262.84
3.772
TOTAL
86,352,700.90
100.000
William S. Stavropoulos
Affirmative
82,929,113.95
96.035
Withheld
3,423,586.95
3.965
TOTAL
86,352,700.90
100.000
David M. Thomas
Affirmative
83,095,487.87
96.228
Withheld
3,257,213.03
3.772
TOTAL
86,352,700.90
100.000
Michael E. Wiley
Affirmative
83,048,523.75
96.174
Withheld
3,304,177.15
3.826
TOTAL
86,352,700.90
100.000
PROPOSAL 2
To amend the Declaration of Trust to reduce the required quorum for future shareholder meetings.A
# of Votes
% of Votes
Affirmative
74,393,635.26
86.151
Against
8,745,543.59
10.128
Abstain
3,213,522.05
3.721
TOTAL
86,352,700.90
100.000
ADenotes trust-wide proposal and voting results.
Annual Report
BoardApproval of Investment Advisory Contracts and Management Fees
VIP Industrials Portfolio
Each year, typically in July, the Board of Trustees, including the Independent Trustees (together, the Board), votes on the renewal of the management contract and sub-advisory agreements (together, the Advisory Contracts) for the fund. The Board, assisted by the advice of fund counsel and Independent Trustees' counsel, requests and considers a broad range of information throughout the year.
The Board meets regularly and, acting directly and through its separate committees, requests and receives information concerning, and considers at each of its meetings factors that are relevant to, its annual consideration of the renewal of the fund's Advisory Contracts, including the services and support provided to the fund and its shareholders. At the time of the renewal, the Board had 12 standing committees, each composed of Independent Trustees with varying backgrounds, to which the Board has assigned specific subject matter responsibilities in order to enhance effective decision-making by the Board. Each committee has a written charter outlining the structure and purposes of the committee. The Board also meets as needed to consider matters specifically related to the Board's annual consideration of the renewal of Advisory Contracts.
At its July 2008 meeting, the Board of Trustees, including the Independent Trustees, unanimously determined to renew the fund's Advisory Contracts. In reaching its determination, the Board considered all factors it believed relevant, including (i) the nature, extent, and quality of the services to be provided to the fund and its shareholders (including the investment performance of the fund); (ii) the competitiveness of the fund's management fee and total expenses; (iii) the total costs of the services to be provided by and the profits to be realized by Fidelity from its relationship with the fund; (iv) the extent to which economies of scale would be realized as the fund grows; and (v) whether fee levels reflect these economies of scale, if any, for the benefit of fund shareholders. The Board also approved agreements with foreign sub-advisers Fidelity Management & Research (Japan) Inc. and Fidelity Management & Research (Hong Kong) Limited, as well as amendments to the fund's agreement with Fidelity Management & Research (U.K.) Inc.
In considering whether to renew the Advisory Contracts for the fund, the Board ultimately reached a determination, with the assistance of fund counsel and Independent Trustees' counsel and through the exercise of its business judgment, that the renewal of the Advisory Contracts and the compensation to be received by Fidelity under the management contract is consistent with Fidelity's fiduciary duty under applicable law. The Board's decision to renew the Advisory Contracts was not based on any single factor noted above, but rather was based on a comprehensive consideration of all the information provided to the Board at its meetings throughout the year. The Board, in reaching its determination to renew the Advisory Contracts, is aware that shareholders in the fund have a broad range of investment choices available to them, including a wide choice among mutual funds offered by competitors to Fidelity, and that the fund's shareholders, with the opportunity to review and weigh the disclosure provided by the fund in its prospectus and other public disclosures, have chosen to invest in this fund, managed by Fidelity.
Nature, Extent, and Quality of Services Provided. The Board considered staffing within the investment adviser, FMR, and the sub-advisers (together, the Investment Advisers), including the backgrounds of the fund's investment personnel and the fund's investment objective and discipline. The Independent Trustees also had discussions with senior management of Fidelity's investment operations and investment groups. The Board considered the structure of the portfolio manager compensation program and whether this structure provides appropriate incentives.
Resources Dedicated to Investment Management and Support Services. The Board reviewed the size, education, and experience of the Investment Advisers' investment staff, their use of technology, and the Investment Advisers' approach to recruiting, training, and retaining portfolio managers and other research, advisory, and management personnel. The Board noted that Fidelity's analysts have access to a variety of technological tools that enable them to perform both fundamental and quantitative analysis and to specialize in various disciplines. The Board considered Fidelity's extensive global research capabilities that enable the Investment Advisers to aggregate data from various sources in an effort to produce positive investment results. The Board also considered that Fidelity's portfolio managers and analysts have access to daily portfolio attribution that allows for monitoring of a fund's portfolio, as well as an electronic communication system that provides immediate real-time access to research concerning issuers and credit enhancers.
Shareholder and Administrative Services. The Board considered (i) the nature, extent, quality, and cost of advisory, administrative, distribution, and shareholder services performed by the Investment Advisers and their affiliates under the Advisory Contracts and under separate agreements covering transfer agency, pricing and bookkeeping, and securities lending services for the fund; (ii) the nature and extent of the Investment Advisers' supervision of third party service providers, principally custodians and subcustodians; and (iii) the resources devoted to, and the record of compliance with, the fund's compliance policies and procedures. The Board also reviewed the allocation of fund brokerage, including allocations to brokers affiliated with the Investment Advisers, the use of brokerage commissions to pay fund expenses, and the use of "soft" commission dollars to pay for research services. The Board further considered that Fidelity voluntarily pays for market data out of its own resources.
The Board noted that the growth of fund assets across the complex allows Fidelity to reinvest in the development of services designed to enhance the value or convenience of the Fidelity funds as investment vehicles. These services include 24-hour access to account information and market information through phone representatives and over the Internet, and investor education materials and asset allocation tools.
Investment in a Large Fund Family. The Board considered the benefits to shareholders of investing in a Fidelity fund, including the benefits of investing in a fund that is part of a large family of funds offering a variety of investment disciplines and providing for a large variety of mutual fund investor services. The Board noted that Fidelity has taken a number of actions over the previous year that benefited particular funds, including (i) dedicating additional resources to investment research and to restructure the investment research teams; (ii) contractually agreeing to reduce the management fees on Fidelity's Institutional Money Market Funds and launching Class IV and Institutional Class of certain of these funds; (iii) reducing the transfer agent fees for the Fidelity Select Portfolios and Investor Class of the VIP funds; and (iv) launching Class K of 29 equity funds as a lower-fee class available to certain employer-sponsored retirement plans.
Annual Report
Investment Performance. The Board considered whether the fund has operated within its investment objective, as well as its record of compliance with its investment restrictions. It also reviewed the fund's absolute investment performance for each class, as well as the fund's relative investment performance for each class measured against a third-party-sponsored index that reflects the market sector in which the fund invests over multiple periods. The Board noted that FMR does not believe that a meaningful peer group exists against which to compare the fund's performance. The following charts considered by the Board show, over the one-, three-, and five-year periods ended December 31, 2007, as available, the cumulative total returns of Initial Class and Investor Class of the fund and the cumulative total returns of a third-party-sponsored index ("benchmark").
VIP Industrials Portfolio
The Board stated that the investment performance of Initial Class of the fund compared favorably to its benchmark for all the periods shown. The Board considered that the variations in performance between the fund's classes reflect the variations in class expenses, which result in lower performance for the higher expense class.
The Board considered that FMR has taken steps to refocus and strengthen equity research, equity portfolio management, and compliance.
Based on its review, and giving particular weight to the nature and quality of the resources dedicated by the Investment Advisers to maintain and improve relative performance, the Board concluded that the nature, extent, and quality of the services provided to the fund will benefit the fund's shareholders, particularly in light of the Board's view that the fund's shareholders benefit from investing in a fund that is part of a large family of funds offering a variety of investment disciplines and services.
Competitiveness of Management Fee and Total Fund Expenses. The Board considered the fund's management fee and total expenses compared to "mapped groups" of competitive funds and classes. Fidelity creates "mapped groups" by combining similar Lipper investment objective categories that have comparable management fee characteristics. Combining Lipper investment objective categories aids the Board's management fee and total expense comparisons by broadening the competitive group used for comparison and by reducing the number of universes to which various Fidelity funds are compared. The Board also considered supplemental information about how the fund's management fee and total expenses ranked relative to groups based on Lipper classifications, which take into account a fund's market capitalization and style.
The Board considered two proprietary management fee comparisons for the 12-month periods shown in the chart below. The group of Lipper funds used by the Board for management fee comparisons is referred to below as the "Total Mapped Group." The Total Mapped Group comparison focuses on a fund's standing relative to the total universe of comparable funds available to investors, in terms of gross management fees before expense reimbursements or caps. "TMG %" represents the percentage of funds in the Total Mapped Group that had management fees that were lower than the fund's. For example, a TMG % of 4% means that 96% of the funds in the Total Mapped Group had higher management fees than the fund. The "Asset-Size Peer Group" (ASPG) comparison focuses on a fund's standing relative to non-Fidelity funds similar in size to the fund within the Total Mapped Group. The ASPG represents at least 15% of the funds in the Total Mapped Group with comparable asset size and management fee characteristics, subject to a minimum of 50 funds (or all funds in the Total Mapped Group if fewer than 50). Additional information, such as the ASPG quartile in which the fund's management fee ranked, is also included in the chart and considered by the Board.
Annual Report
Board Approval of Investment Advisory Contracts and Management Fees - continued
VIP Industrials Portfolio
The Board noted that the fund's management fee ranked below the median of its Total Mapped Group and below the median of its ASPG for 2007.
Based on its review, the Board concluded that the fund's management fee was fair and reasonable in light of the services that the fund receives and the other factors considered.
In its review of each class's total expenses, the Board considered the fund's management fee as well as other fund or class expenses, as applicable, such as transfer agent fees, pricing and bookkeeping fees, and custodial, legal, and audit fees. The Board also noted the effects of any waivers and reimbursements on fees and expenses. As part of its review, the Board also considered current and historical total expenses of each class of the fund compared to competitive fund median expenses. Each class of the fund is compared to those funds and classes in the Total Mapped Group (used by the Board for management fee comparisons) that have a similar sales load structure.
The Board noted that the total expenses of each class ranked below its competitive median for 2007.
In its review of total expenses, the Board also considered Fidelity fee structures and other information on clients that FMR and its affiliates service in other competitive markets, such as other mutual funds advised or subadvised by FMR or its affiliates, pension plan clients, and other institutional clients.
Based on its review, the Board concluded that the total expenses of each class of the fund were reasonable in light of the services that the fund and its shareholders receive and the other factors considered.
Costs of the Services and Profitability. The Board considered the revenues earned and the expenses incurred by Fidelity in conducting the business of developing, marketing, distributing, managing, administering and servicing the fund and its shareholders. The Board also considered the level of Fidelity's profits in respect of all the Fidelity funds.
On an annual basis, FMR presents to the Board Fidelity's profitability for the fund. Fidelity calculates the profitability for each fund, as well as aggregate profitability for groups of Fidelity funds and all Fidelity funds, using a series of detailed revenue and cost allocation methodologies which originate with the audited books and records of Fidelity. The Audit Committee of the Board reviews any significant changes from the prior year's methodologies.
PricewaterhouseCoopers LLP (PwC), independent registered public accounting firm and auditor to Fidelity and certain Fidelity funds, has been engaged annually by the Board as part of the Board's assessment of the results of Fidelity's profitability analysis. PwC's engagement includes the review and assessment of Fidelity's methodologies used in determining the revenues and expenses attributable to Fidelity's mutual fund business, and completion of agreed-upon procedures surrounding the mathematical accuracy of fund profitability and its conformity to allocation methodologies. After considering PwC's reports issued under the engagement and information provided by Fidelity, the Board believes that while other allocation methods may also be reasonable, Fidelity's profitability methodologies are reasonable in all material respects.
The Board has also reviewed Fidelity's non-fund businesses and any fall-out benefits related to the mutual fund business as well as cases where Fidelity's affiliates may benefit from or be related to the fund's business.
Annual Report
The Board considered the costs of the services provided by and the profits realized by Fidelity in connection with the operation of the fund and determined that the amount of profit is a fair entrepreneurial profit for the management of the fund.
Economies of Scale. The Board considered whether there have been economies of scale in respect of the management of the Fidelity funds, whether the Fidelity funds (including the fund) have appropriately benefited from any such economies of scale, and whether there is potential for realization of any further economies of scale. The Board considered the extent to which the fund will benefit from economies of scale through increased services to the fund, through waivers or reimbursements, or through fee or expense reductions.
The Board recognized that the fund's management contract incorporates a "group fee" structure, which provides for lower group fee rates as total fund assets under FMR's management increase, and for higher group fee rates as total fund assets under FMR's management decrease. FMR determines the group fee rates based on a tiered asset "breakpoint" schedule. The Board considered that the group fee is designed to deliver the benefits of economies of scale to fund shareholders when total fund assets increase, even if assets of any particular fund are unchanged or have declined, because some portion of Fidelity's costs are attributable to services provided to all Fidelity funds, and all funds benefit if those costs can be allocated among more assets. The Board concluded that, given the group fee structure, fund shareholders will achieve a certain level of economies of scale as assets under FMR's management increase at the fund complex level, regardless of whether Fidelity achieves any such economies of scale.
The Board further concluded that any potential economies of scale are being shared between fund shareholders and Fidelity in an appropriate manner.
Additional Information Requested by the Board. In order to develop fully the factual basis for consideration of the Fidelity funds' Advisory Contracts, the Board requested and received additional information on certain topics, including (i) fund performance trends and actions to be taken by FMR to improve certain funds' overall performance; (ii) portfolio manager changes that have occurred during the past year; (iii) Fidelity's fund profitability methodology, the profitability of certain fund service providers, and profitability trends for certain funds; (iv) Fidelity's compensation structure for portfolio managers and key personnel, including its effects on fund profitability and the extent to which portfolio manager compensation is linked to fund performance; (v) Fidelity's fee structures and rationale for recommending different fees among categories of funds; and (vi) Fidelity's rationale for recommending which funds should have a performance adjustment component as part of their management fees.
Based on its evaluation of all of the conclusions noted above, and after considering all material factors, the Board ultimately concluded that the advisory fee structures are fair and reasonable, and that the fund's Advisory Contracts should be renewed.
Annual Report
Investment Adviser
Fidelity Management & Research Company Boston, MA
Investment Sub-Advisers
FMR Co., Inc.
Fidelity Management & Research (U.K.) Inc.
Fidelity Research & Analysis Company
Fidelity Investments Japan Limited
FIL Investment Advisors
FIL Investment Advisors (U.K.) Ltd.
Fidelity Management & Research (Hong Kong) Limited
Fidelity Management & Research (Japan) Inc.
General Distributor
Fidelity Distributors Corporation Boston, MA
Transfer and Service Agents
Fidelity Investments Institutional Operations Company, Inc. Boston, MA
Fidelity Service Company, Inc. Boston, MA
Custodian
JPMorgan Chase Bank New York, NY
VCYLIC-ANN-0209
1.817361.103
Fidelity® Variable Insurance Products:
International Capital Appreciation Portfolio
Annual Report
December 31, 2008 (2_fidelity_logos) (Registered_Trademark)
To view a fund's proxy voting guidelines and proxy voting record for the 12-month period ended June 30, visit http://www.fidelity.com (search for "proxy voting guidelines") or visit the Securities and Exchange Commission's (SEC) web site at http://www.sec.gov. You may also call 1-877-208-0098 to request a free copy of the proxy voting guidelines.
Fidelity Variable Insurance Products are separate account options which are purchased through a variable insurance contract.
Standard & Poor's, S&P and S&P 500 are registered service marks of The McGraw-Hill Companies, Inc. and have been licensed for use by Fidelity Distributors Corporation.
Other third party marks appearing herein are the property of their respective owners.
All other marks appearing herein are registered or unregistered trademarks or service marks of FMR LLC or an affiliated company.
This report and the financial statements contained herein are submitted for the general information of the shareholders of the fund. This report is not authorized for distribution to prospective investors in the fund unless preceded or accompanied by an effective prospectus.
A fund files its complete schedule of portfolio holdings with the SEC for the first and third quarters of each fiscal year on Form N-Q. Forms N-Q are available on the SEC's web site at http://www.sec.gov. A fund's Forms N-Q may be reviewed and copied at the SEC's Public Reference Room in Washington, DC. Information regarding the operation of the SEC's Public Reference Room may be obtained by calling 1-800-SEC-0330. For a complete list of a fund's portfolio holdings, view the most recent holdings listing, semiannual report, or annual report on Fidelity's web site at http://www.fidelity.com or http://www.advisor.fidelity.com, as applicable.
NOT FDIC INSURED · MAY LOSE VALUE · NO BANK GUARANTEE
Neither the fund nor Fidelity Distributors Corporation is a bank.
Average annual total return reflects the change in the value of an investment, assuming reinvestment of the class' dividend income and capital gains (the profits earned upon the sale of securities that have grown in value, if any) and assuming a constant rate of performance each year. During periods of reimbursement by Fidelity, a fund's total return will be greater than it would be had the reimbursement not occurred. Performance numbers are net of all underlying fund operating expenses, but do not include any insurance charges imposed by your insurance company's separate account. If performance information included the effect of these additional charges, the total returns would have been lower. How a fund did yesterday is no guarantee of how it will do tomorrow.
Average Annual Total Returns
Periods ended December 31, 2008
Past 1 Year
Life of fundA
VIP International Capital Appreciation - Initial Class
-50.69%
-9.03%
VIP International Capital Appreciation - Service Class
-50.64%
-9.09%
VIP International Capital Appreciation - Service Class 2
-50.73%
-9.22%
VIP International Capital Appreciation - Initial Class R
-50.60%
-8.99%
VIP International Capital Appreciation - Service Class R
-50.64%
-9.09%
VIP International Capital Appreciation - Service Class 2R
-50.73%
-9.22%
VIP International Capital Appreciation - Investor Class R B
-50.65%
-9.08%
A From December 22, 2004.
B The initial offering of Investor Class R shares took place on July 21, 2005. Returns prior to July 21, 2005 are those of Initial Class R. If Investor Class R's transfer agent fee had been reflected, returns prior to July 21, 2005 would have been lower.
$10,000 Over Life of Fund
Let's say hypothetically that $10,000 was invested in VIP International Capital Appreciation Portfolio - Initial Class on December 22, 2004, when the fund started. The chart shows how the value of your investment would have changed, and also shows how the MSCI® ACWI (All Country World Index) ex USA Index performed over the same period.
Comments from Sammy Simnegar, Portfolio Manager of VIP International Capital Appreciation Portfolio
By year-end 2008, the vicious credit crisis sparked in the U.S. had spread like wildfire across the world's capital markets, stunting global growth, toppling commodity prices, changing the face of the global financial system, and chasing risk-averse investors toward the sidelines. The U.S. equity markets, as measured by the Dow Jones Industrial AverageSM and Standard & Poor's 500SM Index, fell hard as a result, declining 31.93% and 37.00%, respectively, while the technology-laden NASDAQ Composite® Index slid 40.03%. Foreign market stocks saw an even sharper decline, as illustrated by the 43.28% loss of the MSCI® EAFE® Index (Europe, Australasia, Far East), a gauge of developed stock markets outside the U.S. and Canada. A generally stronger U.S. dollar also held back returns for U.S. investors in foreign equities. Emerging-markets stocks - the global performance leader only a year ago - fell harder still, dropping 53.18%, as measured by the MSCI Emerging Markets Index. The only clear winners during the past year were assets backed by the U.S. government, as investors fled from risk. Thus, the Barclays Capital U.S. Treasury Bond Index climbed 13.74% for the year, while the Barclays Capital U.S. Aggregate Bond Index - a broader measure of the U.S. investment-grade bond universe - gained a more modest 5.24%. By contrast, high-yield bonds bore the brunt of investors' increasing wariness over risk, as expressed by the Merrill Lynch® U.S. High Yield Master II Constrained Index's drop of 26.11%. The emerging-markets bond category also felt the shock of investors' risk-averse sentiment, with the JPMorgan Emerging Markets Bond Index (EMBI) Global falling 10.91%. Meanwhile, the Citigroup® Non-U.S. Group of 7 Index - representing the debt performance of major global economies, excluding the United States - eked out a 1.69% gain.
The fund underperformed the MSCI All Country World ex USA Index, which fell 45.45% for the year (For specific portfolio results, please refer to the performance section of this report). Many of the fund's stock picks within the volatile financials, energy and materials sectors were big detractors, as were some of its holdings in consumer discretionary and information technology. Three of our five biggest relative detractors were materials stocks, which as a group were hurt by falling commodity prices. Among them were out-of-index positions in two Canadian mining stocks - Mercator Minerals and Consolidated Thompson Iron Mines, both of which were sold by period end - as well as a stake in Vedanta Resources, a London-based mining company with operations in India. Also detracting was a position - since sold - in Gazprom, the big Russian natural gas producer, whose earnings fell as energy prices collapsed. On the plus side, some of the fund's holdings in the more defensively oriented consumer staples and health care sectors did well versus the index, as did some of our Japanese holdings, which also benefited from favorable currency movements. A moderate position in cash helped as well. Among the fund's top contributors were passenger rail operator East Japan Railway, Swiss consumer staples manufacturer Nestle and Rio Tinto, a London-based mining company, which helped the fund mainly because we were underweighted in this hard-hit stock.
The views expressed above reflect those of the portfolio manager(s) only through the end of the period as stated on the cover of this report and do not necessarily represent the views of Fidelity or any other person in the Fidelity organization. Any such views are subject to change at any time based upon market or other conditions and Fidelity disclaims any responsibility to update such views. These views may not be relied on as investment advice and, because investment decisions for a Fidelity fund are based on numerous factors, may not be relied on as an indication of trading intent on behalf of any Fidelity fund.
As a shareholder of the Fund, you incur two types of costs: (1) transaction costs, including redemption fees, and (2) ongoing costs, including management fees, distribution and/or service (12b-1) fees and other Fund expenses. This Example is intended to help you understand your ongoing costs (in dollars) of investing in the Fund and to compare these costs with the ongoing costs of investing in other mutual funds.
The Example is based on an investment of $1,000 invested at the beginning of the period and held for the entire period (July 1, 2008 to December 31, 2008).
Actual Expenses
The first line of the accompanying table for each class of the Fund provides information about actual account values and actual expenses. You may use the information in this line, together with the amount you invested, to estimate the expenses that you paid over the period. Simply divide your account value by $1,000.00 (for example, an $8,600 account value divided by $1,000.00 = 8.6), then multiply the result by the number in the first line for a class of the Fund under the heading entitled "Expenses Paid During Period" to estimate the expenses you paid on your account during this period. The estimate of expenses does not include any fees or other expenses of any variable annuity or variable life insurance product. If they were, the estimate of expenses you paid during the period would be higher, and your ending account value would be lower. In addition, the Fund, as a shareholder in the underlying Fidelity Central Funds, will indirectly bear its pro rata share of the fees and expenses incurred by the underlying Fidelity Central Funds. These fees and expenses are not included in the Fund's annualized expense ratio used to calculate the expense estimate in the table below.
Hypothetical Example for Comparison Purposes
The second line of the accompanying table for each class of the Fund provides information about hypothetical account values and hypothetical expenses based on a Class' actual expense ratio and an assumed rate of return of 5% per year before expenses, which is not the Class' actual return. The hypothetical account values and expenses may not be used to estimate the actual ending account balance or expenses you paid for the period. You may use this information to compare the ongoing costs of investing in the Fund and other funds. To do so, compare this 5% hypothetical example with the 5% hypothetical examples that appear in the shareholder reports of the other funds. The estimate of expenses does not include any fees or other expenses of any variable annuity or variable life insurance product. If they were, the estimate of expenses you paid during the period would be higher, and your ending account value would be lower. In addition, the Fund, as a shareholder in the underlying Fidelity Central Funds, will indirectly bear its pro rata share of the fees and expenses incurred by the underlying Fidelity Central Funds. These fees and expenses are not included in the Fund's annualized expense ratio used to calculate the expense estimate in the table below.
Please note that the expenses shown in the table are meant to highlight your ongoing costs only and do not reflect any transaction costs. Therefore, the second line of the table is useful in comparing ongoing costs only, and will not help you determine the relative total costs of owning different funds. In addition, if these transactional costs were included, your costs would have been higher.
Annualized Expense Ratio
Beginning Account Value July 1, 2008
Ending Account Value December 31, 2008
Expenses Paid During Period* July 1, 2008 to December 31, 2008
Initial Class
1.10%
Actual
$ 1,000.00
$ 548.40
$ 4.28
HypotheticalA
$ 1,000.00
$ 1,019.61
$ 5.58
Service Class
1.20%
Actual
$ 1,000.00
$ 548.90
$ 4.67
HypotheticalA
$ 1,000.00
$ 1,019.10
$ 6.09
Service Class 2
1.35%
Actual
$ 1,000.00
$ 548.50
$ 5.25
HypotheticalA
$ 1,000.00
$ 1,018.35
$ 6.85
Initial Class R
1.10%
Actual
$ 1,000.00
$ 549.40
$ 4.28
HypotheticalA
$ 1,000.00
$ 1,019.61
$ 5.58
Service Class R
1.20%
Actual
$ 1,000.00
$ 548.90
$ 4.67
HypotheticalA
$ 1,000.00
$ 1,019.10
$ 6.09
Service Class 2R
1.35%
Actual
$ 1,000.00
$ 548.50
$ 5.25
HypotheticalA
$ 1,000.00
$ 1,018.35
$ 6.85
Investor Class R
1.18%
Actual
$ 1,000.00
$ 549.00
$ 4.59
HypotheticalA
$ 1,000.00
$ 1,019.20
$ 5.99
A 5% return per year before expenses
* Expenses are equal to each Class' annualized expense ratio, multiplied by the average account value over the period, multiplied by 184/366 (to reflect the one-half year period).
Annual Report
Investment Changes (Unaudited)
Geographic Diversification (% of fund's net assets)
As of December 31, 2008
Japan
17.0%
United Kingdom
14.7%
United States of America
11.1%
Canada
8.0%
France
7.8%
Germany
6.7%
Switzerland
5.5%
Spain
2.7%
Italy
2.6%
Other
23.9%
Percentages are adjusted for the effect of futures contracts, if applicable.
As of June 30, 2008
United Kingdom
13.8%
Japan
12.2%
Canada
11.7%
Germany
10.2%
France
5.8%
Italy
4.6%
United States of America
4.5%
Switzerland
3.8%
India
3.0%
Other
30.4%
Percentages are adjusted for the effect of futures contracts, if applicable.
Telefonica SA (Spain, Diversified Telecommunication Services)
1.9
1.8
Siemens AG sponsored ADR (Germany, Industrial Conglomerates)
1.8
0.0
Mitsubishi UFJ Financial Group, Inc. sponsored ADR (Japan, Commercial Banks)
1.8
0.0
UBS AG (NY Shares) (Switzerland, Capital Markets)
1.7
0.0
GDF Suez (France, Multi-Utilities)
1.7
0.0
Allianz AG (Reg.) (Germany, Insurance)
1.6
2.0
19.2
Market Sectors as of December 31, 2008
% of fund's net assets
% of fund's net assets 6 months ago
Financials
28.6
18.3
Industrials
14.1
13.9
Materials
10.7
12.4
Consumer Staples
9.2
8.9
Energy
8.1
12.6
Health Care
6.7
3.1
Consumer Discretionary
5.8
9.5
Telecommunication Services
5.7
5.8
Utilities
4.9
6.5
Information Technology
4.4
6.3
Annual Report
Investments December 31, 2008
Showing Percentage of Net Assets
Common Stocks - 96.3%
Shares
Value
Australia - 1.0%
CSL Ltd.
9,873
$ 237,482
Belgium - 1.2%
Anheuser-Busch InBev NV
12,700
296,336
Brazil - 2.5%
Companhia Vale do Rio Doce (PN-A) sponsored ADR
29,100
309,915
Petroleo Brasileiro SA - Petrobras (PN) sponsored ADR (non-vtg.)
13,600
277,576
TOTAL BRAZIL
587,491
Canada - 8.0%
Absolute Software Corp. (a)
47,400
128,950
Agnico-Eagle Mines Ltd.
5,900
304,383
Canadian Natural Resources Ltd.
6,600
264,445
EnCana Corp.
5,900
276,209
Goldcorp, Inc.
9,300
293,439
Research In Motion Ltd. (a)
5,300
215,074
Suncor Energy, Inc.
13,400
261,238
Teck Cominco Ltd. Class B (sub. vtg.)
33,600
166,246
TOTAL CANADA
1,909,984
Cayman Islands - 2.0%
Suntech Power Holdings Co. Ltd. sponsored ADR (a)(d)
39,900
466,830
Czech Republic - 0.6%
Ceske Energeticke Zavody AS
3,200
130,644
Denmark - 2.1%
Novo Nordisk AS Series B
3,500
181,419
Vestas Wind Systems AS (a)
5,400
319,314
TOTAL DENMARK
500,733
France - 7.8%
Alstom SA
4,700
281,425
AXA SA
14,300
322,497
BNP Paribas SA
7,700
333,945
GDF Suez
7,900
402,232
Saft Groupe SA
6,600
179,696
Societe Generale Series A
6,500
331,330
TOTAL FRANCE
1,851,125
Germany - 6.7%
Adidas-Salomon AG
4,900
192,236
Allianz AG (Reg.)
3,500
379,049
E.ON AG
8,100
332,999
Q-Cells SE (a)(d)
7,200
263,318
Siemens AG sponsored ADR
5,700
431,775
TOTAL GERMANY
1,599,377
Greece - 1.2%
Public Power Corp. of Greece
17,500
282,583
Shares
Value
Hong Kong - 2.2%
China Mobile (Hong Kong) Ltd. sponsored ADR
5,100
$ 259,335
CNOOC Ltd.
271,000
257,764
TOTAL HONG KONG
517,099
India - 1.5%
Bharti Airtel Ltd. (a)
7,971
117,608
ICICI Bank Ltd. sponsored ADR (d)
12,700
244,475
Rural Electrification Corp. Ltd.
3,032
4,584
TOTAL INDIA
366,667
Ireland - 1.7%
CRH PLC sponsored ADR
10,300
268,109
Dragon Oil PLC (a)
52,401
123,894
TOTAL IRELAND
392,003
Israel - 0.9%
Teva Pharmaceutical Industries Ltd. sponsored ADR
4,900
208,593
Italy - 2.0%
Intesa Sanpaolo SpA
70,300
256,591
UniCredit SpA
82,800
211,521
TOTAL ITALY
468,112
Japan - 17.0%
Canon Marketing Japan, Inc.
13,200
212,384
Canon, Inc. sponsored ADR
6,200
194,680
East Japan Railway Co.
32
264,163
Hisamitsu Pharmaceutical Co., Inc.
4,800
196,051
Honda Motor Co. Ltd. sponsored ADR
9,700
206,998
Japan Retail Fund Investment Corp.
73
315,052
Japan Tobacco, Inc.
60
198,576
Keyence Corp.
600
123,205
Mitsubishi Corp.
18,100
256,158
Mitsubishi UFJ Financial Group, Inc. sponsored ADR
68,621
426,136
Mitsui & Co. Ltd.
26,000
267,069
NGK Insulators Ltd.
10,000
113,224
Nomura Holdings, Inc. sponsored ADR (d)
29,100
242,985
ORIX Corp.
4,040
230,497
SHIMANO, Inc.
3,300
129,803
Sumitomo Mitsui Financial Group, Inc.
66
297,327
Terumo Corp.
5,000
234,034
Tsumura & Co.
4,100
152,058
TOTAL JAPAN
4,060,400
Luxembourg - 1.1%
Evraz Group SA GDR
15,400
132,440
Millicom International Cellular SA
2,800
125,748
TOTAL LUXEMBOURG
258,188
Netherlands - 1.3%
Unilever NV (NY Shares)
13,000
319,150
Common Stocks - continued
Shares
Value
Norway - 1.0%
Renewable Energy Corp. AS (a)(d)
25,200
$ 242,968
South Africa - 1.2%
MTN Group Ltd.
25,500
295,691
Spain - 2.7%
Grifols SA
10,820
190,485
Telefonica SA
20,300
460,381
TOTAL SPAIN
650,866
Switzerland - 5.5%
Credit Suisse Group sponsored ADR (d)
10,300
291,078
Nestle SA (Reg.)
15,660
618,680
UBS AG (NY Shares)
28,600
408,980
TOTAL SWITZERLAND
1,318,738
Taiwan - 0.7%
HTC Corp.
16,000
159,634
Turkey - 0.4%
Tupras-Turkiye Petrol Rafinerileri AS
9,000
94,645
United Kingdom - 14.7%
BG Group PLC
20,700
290,815
BHP Billiton PLC
25,300
498,063
British Airways PLC
45,600
122,335
British American Tobacco PLC (United Kingdom)
11,400
301,847
HSBC Holdings PLC sponsored ADR (d)
9,700
472,099
Imperial Tobacco Group PLC
9,400
254,846
Informa PLC
34,800
124,974
Man Group PLC
70,250
245,293
Prudential PLC
44,760
275,776
Reckitt Benckiser Group PLC
5,700
216,785
Rio Tinto PLC (Reg.)
9,500
214,317
Standard Chartered PLC (United Kingdom)
21,100
274,043
Vedanta Resources PLC (d)
24,200
220,564
TOTAL UNITED KINGDOM
3,511,757
United States of America - 9.3%
Citigroup, Inc.
26,200
175,802
D.R. Horton, Inc.
21,000
148,470
First Solar, Inc. (a)
1,000
137,960
Goldman Sachs Group, Inc.
3,200
270,048
JPMorgan Chase & Co.
6,500
204,945
MasterCard, Inc. Class A
800
114,344
Medco Health Solutions, Inc. (a)
4,370
183,147
Meritage Homes Corp. (a)
20,196
245,785
Morgan Stanley
17,000
272,680
SL Green Realty Corp.
13,300
344,470
Visa, Inc.
2,200
115,390
TOTAL UNITED STATES OF AMERICA
2,213,041
TOTAL COMMON STOCKS
(Cost $28,206,061)
22,940,137
Nonconvertible Preferred Stocks - 0.6%
Shares
Value
Italy - 0.6%
Fiat SpA (Risp) (Cost $145,291)
30,800
$ 137,952
Nonconvertible Bonds - 1.3%
Principal Amount
Luxembourg - 1.3%
Evraz Group SA 8.875% 4/24/13 (e)
$ 250,000
126,250
TNK-BP Finance SA 7.5% 3/13/13 (Reg. S)
100,000
63,000
Vimpel Communications 8.375% 4/30/13 (Issued by VIP Finance Ireland Ltd. for Vimpel Communications) (e)
200,000
124,000
TOTAL NONCONVERTIBLE BONDS
(Cost $260,142)
313,250
Money Market Funds - 8.3%
Shares
Fidelity Cash Central Fund, 1.06% (b)
603,076
603,076
Fidelity Securities Lending Cash Central Fund, 0.87% (b)(c)
1,378,832
1,378,832
TOTAL MONEY MARKET FUNDS
(Cost $1,981,908)
1,981,908
TOTAL INVESTMENT PORTFOLIO - 106.5%
(Cost $30,593,402)
25,373,247
NET OTHER ASSETS - (6.5)%
(1,544,705)
NET ASSETS - 100%
$ 23,828,542
Legend
(a) Non-income producing
(b) Affiliated fund that is available only to investment companies and other accounts managed by Fidelity Investments. The rate quoted is the annualized seven-day yield of the fund at period end. A complete unaudited listing of the fund's holdings as of its most recent quarter end is available upon request.
(c) Investment made with cash collateral received from securities on loan.
(d) Security or a portion of the security is on loan at period end.
(e) Security exempt from registration under Rule 144A of the Securities Act of 1933. These securities may be resold in transactions exempt from registration, normally to qualified institutional buyers. At the end of the period, the value of these securities amounted to $ 250,250 or 1.1% of net assets.
Affiliated Central Funds
Information regarding fiscal year to date income earned by the Fund from investments in Fidelity Central Funds is as follows:
Fund
Income earned
Fidelity Cash Central Fund
$ 26,125
Fidelity Securities Lending Cash Central Fund
46,336
Total
$ 72,461
Other Information
The following is a summary of the inputs used, as of December 31, 2008, involving the Fund's assets carried at value. The inputs or methodology used for valuing securities may not be an indication of the risk associated with investing in those securities. For more information on valuation inputs, and their aggregation into the levels used in the tables below, please refer to the Security Valuation section in the accompanying Notes to Financial Statements.
Valuation Inputs at Reporting Date:
Description
Total
Level 1
Level 2
Level 3
Investments in Securities
$ 25,373,247
$ 11,776,758
$ 13,034,999
$ 561,490
The following is a reconciliation of assets for which Level 3 inputs were used in determining value:
Investments in Securities
Beginning Balance
$ -
Total Realized Gain (Loss)
(63,782)
Total Unrealized Gain (Loss)
(192,143)
Cost of Purchases
1,366,819
Proceeds of Sales
(986,803)
Amortization/Accretion
-
Transfer in/out of Level 3
437,399
Ending Balance
$ 561,490
The information used in the above reconciliation represents fiscal year to date activity for any Investment Securities identified as using Level 3 inputs at either the beginning or the end of the current fiscal period. Transfers in or out of Level 3 represents either the beginning value (for transfers in), or the ending value (for transfers out) of any Security or Instrument where a change in the pricing level occurred from the beginning to the end of the period.
Income Tax Information
At December 31, 2008, the fund had a capital loss carryforward of approximately $20,462,362 all of which will expire on December 31, 2016.
The fund intends to elect to defer to its fiscal year ending December 31, 2009 approximately $6,910,998 of losses recognized during the period November 1, 2008 to December 31, 2008.
See accompanying notes which are an integral part of the financial statements.
Investment in securities, at value (including securities loaned of $1,327,299) - See accompanying schedule:
Unaffiliated issuers (cost $28,611,494)
$ 23,391,339
Fidelity Central Funds (cost $1,981,908)
1,981,908
Total Investments (cost $30,593,402)
$ 25,373,247
Receivable for fund shares sold
31,796
Dividends receivable
81,829
Interest receivable
9,205
Distributions receivable from Fidelity Central Funds
7,481
Prepaid expenses
318
Receivable from investment adviser for expense reductions
15,130
Other receivables
53,386
Total assets
25,572,392
Liabilities
Payable for investments purchased
$ 285,238
Payable for fund shares redeemed
2,016
Accrued management fee
13,339
Distribution fees payable
117
Other affiliated payables
3,124
Other payables and accrued expenses
61,184
Collateral on securities loaned, at value
1,378,832
Total liabilities
1,743,850
Net Assets
$ 23,828,542
Net Assets consist of:
Paid in capital
$ 57,883,683
Undistributed net investment income
5,642
Accumulated undistributed net realized gain (loss) on investments and foreign currency transactions
(28,849,419)
Net unrealized appreciation (depreciation) on investments and assets and liabilities in foreign currencies
(5,211,364)
Net Assets
$ 23,828,542
Statement of Assets and Liabilities - continued
December 31, 2008
Initial Class: Net Asset Value, offering price and redemption price per share ($387,663 ÷ 69,045 shares)
$ 5.61
Service Class: Net Asset Value, offering price and redemption price per share ($134,813 ÷ 24,050 shares)
$ 5.61
Service Class 2: Net Asset Value, offering price and redemption price per share ($301,837 ÷ 53,938 shares)
$ 5.60
Initial Class R: Net Asset Value, offering price and redemption price per share ($8,482,621 ÷ 1,510,582 shares)
$ 5.62
Service Class R: Net Asset Value, offering price and redemption price per share ($134,812 ÷ 24,050 shares)
$ 5.61
Service Class 2R: Net Asset Value, offering price and redemption price per share ($178,644 ÷ 31,927 shares)
$ 5.60
Investor Class R: Net Asset Value, offering price and redemption price per share ($14,208,152 ÷ 2,539,010 shares)
$ 5.60
See accompanying notes which are an integral part of the financial statements.
Annual Report
Statement of Operations
Year ended December 31, 2008
Investment Income
Dividends
$ 1,239,541
Interest
13,608
Income from Fidelity Central Funds
72,461
1,325,610
Less foreign taxes withheld
(126,223)
Total income
1,199,387
Expenses
Management fee
$ 332,126
Transfer agent fees
64,485
Distribution fees
2,854
Accounting and security lending fees
24,720
Custodian fees and expenses
206,567
Independent trustees' compensation
234
Audit
59,389
Legal
358
Miscellaneous
5,131
Total expenses before reductions
695,864
Expense reductions
(251,100)
444,764
Net investment income (loss)
754,623
Realized and Unrealized Gain (Loss)
Net realized gain (loss) on:
Investment securities:
Unaffiliated issuers
(24,807,587)
Foreign currency transactions
(105,532)
Total net realized gain (loss)
(24,913,119)
Change in net unrealized appreciation (depreciation) on:
Investment securities (net of decrease in deferred foreign taxes of $19,180)
(5,468,641)
Assets and liabilities in foreign currencies
7,688
Total change in net unrealized appreciation (depreciation)
(5,460,953)
Net gain (loss)
(30,374,072)
Net increase (decrease) in net assets resulting from operations
$ (29,619,449)
Statement of Changes in Net Assets
Year ended December 31, 2008
Year ended December 31, 2007
Increase (Decrease) in Net Assets
Operations
Net investment income (loss)
$ 754,623
$ 507,872
Net realized gain (loss)
(24,913,119)
5,112,624
Change in net unrealized appreciation (depreciation)
(5,460,953)
(4,352,834)
Net increase (decrease) in net assets resulting from operations
(29,619,449)
1,267,662
Distributions to shareholders from net investment income
-
(488,571)
Distributions to shareholders from net realized gain
(328,342)
(9,900,180)
Total distributions
(328,342)
(10,388,751)
Share transactions - net increase (decrease)
(20,630,488)
38,585,498
Redemption fees
5,532
18,995
Total increase (decrease) in net assets
(50,572,747)
29,483,404
Net Assets
Beginning of period
74,401,289
44,917,885
End of period (including undistributed net investment income of $5,642 and distributions in excess of net investment income of $2,078, respectively)
$ 23,828,542
$ 74,401,289
See accompanying notes which are an integral part of the financial statements.
Annual Report
Financial Highlights - Initial Class
Years ended December 31,
2008
2007
2006
2005
2004 I
Selected Per-Share Data
Net asset value, beginning of period
$ 11.44
$ 12.68
$ 11.46
$ 10.24
$ 10.00
Income from Investment Operations
Net investment income (loss) E
.15
.11 H
.11
.06
- K
Net realized and unrealized gain (loss)
(5.92)
.53
1.54
1.21
.24
Total from investment operations
(5.77)
.64
1.65
1.27
.24
Distributions from net investment income
-
(.09)
(.10)
(.02)
-
Distributions from net realized gain
(.06)
(1.79)
(.34)
(.02)
-
Total distributions
(.06)
(1.88)
(.43) M
(.05) L
-
Redemption fees added to paid in capital E
- K
- K
- K
- K
-
Net asset value, end of period
$ 5.61
$ 11.44
$ 12.68
$ 11.46
$ 10.24
Total Return B,C,D
(50.69)%
5.17%
14.49%
12.37%
2.40%
Ratios to Average Net Assets F, J
Expenses before reductions
1.54%
1.20%
1.80%
3.55%
43.27% A
Expenses net of fee waivers, if any
1.10%
1.10%
1.10%
1.10%
1.10% A
Expenses net of all reductions
.91%
1.07%
1.00%
91%
92% A
Net investment income (loss)
1.65%
.82% H
.95%
.53%
.80% A
Supplemental Data
Net assets, end of period (000 omitted)
$ 388
$ 1,409
$ 1,357
$ 9,367
$ 307
Portfolio turnover rate G
350%
224%
185%
176%
52% A
A Annualized BTotal returns for periods of less than one year are not annualized. CTotal returns do not reflect charges attributable to your insurance company's separate account. Inclusion of these charges would reduce the total returns shown. DTotal returns would have been lower had certain expenses not been reduced during the periods shown. ECalculated based on average shares outstanding during the period. FFees and expenses of the underlying Fidelity Central Funds are not included in the Fund's expense ratio. The Fund indirectly bears its proportionate share of the expenses of any underlying Fidelity Central Funds. GAmount does not include the portfolio activity of any underlying Fidelity Central Funds. HInvestment income per share reflects a special dividend which amounted to $.02 per share. Excluding the special dividend, the ratio of net investment income (loss) to average net assets would have been .68%. IFor the period December 22, 2004 (commencement of operations) to December 31, 2004. JExpense ratios reflect operating expenses of the class. Expenses before reductions do not reflect amounts reimbursed by the investment adviser or reductions from brokerage service arrangements or other expense offset arrangements and do not represent the amount paid by the class during periods when reimbursements or reductions occur. Expense ratios before reductions for start-up periods may not be representative of longer-term operating periods. Expenses net of fee waivers reflect expenses after reimbursement by the investment adviser but prior to reductions from brokerage service arrangements or other expense offset arrangements. Expenses net of all reductions represent the net expenses paid by the class. KAmount represents less than $.01 per share. LTotal distributions of $.05 per share is comprised of distributions from net investment income of $.022 and distributions from net realized gain of $.023 per share. MTotal distributions of $.43 per share is comprised of distributions from net investment income of $.095 and distributions from net realized gain of $.335 per share.
Financial Highlights - Service Class
Years ended December 31,
2008
2007
2006
2005
2004 I
Selected Per-Share Data
Net asset value, beginning of period
$ 11.43
$ 12.67
$ 11.46
$ 10.24
$ 10.00
Income from Investment Operations
Net investment income (loss) E
.14
.10 H
.10
.10
- K
Net realized and unrealized gain (loss)
(5.90)
.53
1.53
1.16
.24
Total from investment operations
(5.76)
.63
1.63
1.26
.24
Distributions from net investment income
-
(.08)
(.08)
(.01)
-
Distributions from net realized gain
(.06)
(1.79)
(.34)
(.02)
-
Total distributions
(.06)
(1.87)
(.42) M
(.04) L
-
Redemption fees added to paid in capital E
- K
- K
- K
- K
-
Net asset value, end of period
$ 5.61
$ 11.43
$ 12.67
$ 11.46
$ 10.24
Total Return B,C,D
(50.64)%
5.06%
14.30%
12.27%
2.40%
Ratios to Average Net Assets F, J
Expenses before reductions
1.51%
1.20%
1.62%
4.35%
43.36% A
Expenses net of fee waivers, if any
1.20%
1.20%
1.20%
1.20%
1.20% A
Expenses net of all reductions
1.01%
1.16%
1.10%
1.01%
1.01% A
Net investment income (loss)
1.55%
.72% H
.85%
.98%
.71% A
Supplemental Data
Net assets, end of period (000 omitted)
$ 135
$ 414
$ 394
$ 345
$ 307
Portfolio turnover rate G
350%
224%
185%
176%
52% A
A Annualized B Total returns for periods of less than one year are not annualized. C Total returns do not reflect charges attributable to your insurance company's separate account. Inclusion of these charges would reduce the total returns shown. D Total returns would have been lower had certain expenses not been reduced during the periods shown. E Calculated based on average shares outstanding during the period. F Fees and expenses of the underlying Fidelity Central Funds are not included in the Fund's expense ratio. The Fund indirectly bears its proportionate share of the expenses of any underlying Fidelity Central Funds. G Amount does not include the portfolio activity of any underlying Fidelity Central Funds. H Investment income per share reflects a special dividend which amounted to $.02 per share. Excluding the special dividend, the ratio of net investment income (loss) to average net assets would have been .58%. I For the period December 22, 2004 (commencement of operations) to December 31, 2004. J Expense ratios reflect operating expenses of the class. Expenses before reductions do not reflect amounts reimbursed by the investment adviser or reductions from brokerage service arrangements or other expense offset arrangements and do not represent the amount paid by the class during periods when reimbursements or reductions occur. Expense ratios before reductions for start-up periods may not be representative of longer-term operating periods. Expenses net of fee waivers reflect expenses after reimbursement by the investment adviser but prior to reductions from brokerage service arrangements or other expense offset arrangements. Expenses net of all reductions represent the net expenses paid by the class. K Amount represents less than $.01 per share. L Total distributions of $.04 per share is comprised of distributions from net investment income of $.012 and distributions from net realized gain of $.023 per share. M Total distributions of $.42 per share is comprised of distributions from net investment income of $.084 and distributions from net realized gain of $.335 per share.
See accompanying notes which are an integral part of the financial statements.
Annual Report
Financial Highlights - Service Class 2
Years ended December 31,
2008
2007
2006
2005
2004 I
Selected Per-Share Data
Net asset value, beginning of period
$ 11.43
$ 12.67
$ 11.46
$ 10.24
$ 10.00
Income from Investment Operations
Net investment income (loss) E
.12
.08 H
.08
.09
- K
Net realized and unrealized gain (loss)
(5.89)
.53
1.53
1.15
.24
Total from investment operations
(5.77)
.61
1.61
1.24
.24
Distributions from net investment income
-
(.06)
(.07)
-
-
Distributions from net realized gain
(.06)
(1.79)
(.34)
(.02)
-
Total distributions
(.06)
(1.85)
(.40) M
(.02) L
-
Redemption fees added to paid in capital E
- K
- K
- K
- K
-
Net asset value, end of period
$ 5.60
$ 11.43
$ 12.67
$ 11.46
$ 10.24
Total Return B, C, D
(50.73)%
4.89%
14.14%
12.12%
2.40%
Ratios to Average Net Assets F, J
Expenses before reductions
1.79%
1.41%
1.77%
4.50%
43.51% A
Expenses net of fee waivers, if any
1.35%
1.35%
1.35%
1.35%
1.35% A
Expenses net of all reductions
1.16%
1.32%
1.25%
1.16%
1.17% A
Net investment income (loss)
1.40%
.57% H
.70%
.83%
.55% A
Supplemental Data
Net assets, end of period (000 omitted)
$ 302
$ 550
$ 524
$ 459
$ 410
Portfolio turnover rate G
350%
224%
185%
176%
52% A
A Annualized B Total returns for periods of less than one year are not annualized. C Total returns do not reflect charges attributable to your insurance company's separate account. Inclusion of these charges would reduce the total returns shown. D Total returns would have been lower had certain expenses not been reduced during the periods shown. E Calculated based on average shares outstanding during the period. F Fees and expenses of the underlying Fidelity Central Funds are not included in the Fund's expense ratio. The Fund indirectly bears its proportionate share of the expenses of any underlying Fidelity Central Funds. G Amount does not include the portfolio activity of any underlying Fidelity Central Funds. H Investment income per share reflects a special dividend which amounted to $.02 per share. Excluding the special dividend, the ratio of net investment income (loss) to average net assets would have been .43%. I For the period December 22, 2004 (commencement of operations) to December 31, 2004. J Expense ratios reflect operating expenses of the class. Expenses before reductions do not reflect amounts reimbursed by the investment adviser or reductions from brokerage service arrangements or other expense offset arrangements and do not represent the amount paid by the class during periods when reimbursements or reductions occur. Expense ratios before reductions for start-up periods may not be representative of longer-term operating periods. Expenses net of fee waivers reflect expenses after reimbursement by the investment adviser but prior to reductions from brokerage service arrangements or other expense offset arrangements. Expenses net of all reductions represent the net expenses paid by the class. K Amount represents less than $.01 per share. L Total distributions of $.02 per share is comprised of distributions from net investment income of $.000 and distributions from net realized gain of $.020 per share. MTotal distributions of $.40 per share is comprised of distributions from net investment income of $.066 and distributions from net realized gain of $.335 per share.
Financial Highlights - Initial Class R
Years ended December 31,
2008
2007
2006
2005
2004 I
Selected Per-Share Data
Net asset value, beginning of period
$ 11.44
$ 12.68
$ 11.46
$ 10.24
$ 10.00
Income from Investment Operations
Net investment income (loss) E
.15
.11 H
.11
.11
- K
Net realized and unrealized gain (loss)
(5.91)
.53
1.54
1.16
.24
Total from investment operations
(5.76)
.64
1.65
1.27
.24
Distributions from net investment income
-
(.09)
(.10)
(.02)
-
Distributions from net realized gain
(.06)
(1.79)
(.34)
(.02)
-
Total distributions
(.06)
(1.88)
(.43) M
(.05) L
-
Redemption fees added to paid in capital E
- K
- K
- K
- K
-
Net asset value, end of period
$ 5.62
$ 11.44
$ 12.68
$ 11.46
$ 10.24
Total Return B,C,D
(50.60)%
5.17%
14.50%
12.37%
2.40%
Ratios to Average Net Assets F, J
Expenses before reductions
1.44%
1.11%
1.46%
4.25%
43.27% A
Expenses net of fee waivers, if any
1.10%
1.10%
1.10%
1.10%
1.10% A
Expenses net of all reductions
.91%
1.06%
1.00%
.91%
.92% A
Net investment income (loss)
1.65%
.82% H
.95%
1.08%
.80% A
Supplemental Data
Net assets, end of period (000 omitted)
$ 8,483
$ 32,345
$ 17,219
$ 345
$ 307
Portfolio turnover rate G
350%
224%
185%
176%
52% A
A Annualized B Total returns for periods of less than one year are not annualized. C Total returns do not reflect charges attributable to your insurance company's separate account. Inclusion of these charges would reduce the total returns shown. D Total returns would have been lower had certain expenses not been reduced during the periods shown. E Calculated based on average shares outstanding during the period. F Fees and expenses of the underlying Fidelity Central Funds are not included in the Fund's expense ratio. The Fund indirectly bears its proportionate share of the expenses of any underlying Fidelity Central Funds. G Amount does not include the portfolio activity of any underlying Fidelity Central Funds. H Investment income per share reflects a special dividend which amounted to $.02 per share. Excluding the special dividend, the ratio of net investment income (loss) to average net assets would have been .68%. I For the period December 22, 2004 (commencement of operations) to December 31, 2004. J Expense ratios reflect operating expenses of the class. Expenses before reductions do not reflect amounts reimbursed by the investment adviser or reductions from brokerage service arrangements or other expense offset arrangements and do not represent the amount paid by the class during periods when reimbursements or reductions occur. Expense ratios before reductions for start-up periods may not be representative of longer-term operating periods. Expenses net of fee waivers reflect expenses after reimbursement by the investment adviser but prior to reductions from brokerage service arrangements or other expense offset arrangements. Expenses net of all reductions represent the net expenses paid by the class. K Amount represents less than $.01 per share. L Total distributions of $.05 per share is comprised of distributions from net investment income of $.022 and distributions from net realized gain of $.023 per share. M Total distributions of $.43 per share is comprised of distributions from net investment income of $.096 and distributions from net realized gain of $.335 per share.
See accompanying notes which are an integral part of the financial statements.
Annual Report
Financial Highlights - Service Class R
Years ended December 31,
2008
2007
2006
2005
2004 I
Selected Per-Share Data
Net asset value, beginning of period
$ 11.43
$ 12.67
$ 11.46
$ 10.24
$ 10.00
Income from Investment Operations
Net investment income (loss) E
.14
.10 H
.10
.10
- K
Net realized and unrealized gain (loss)
(5.90)
.53
1.53
1.16
.24
Total from investment operations
(5.76)
.63
1.63
1.26
.24
Distributions from net investment income
-
(.08)
(.08)
(.01)
-
Distributions from net realized gain
(.06)
(1.79)
(.34)
(.02)
-
Total distributions
(.06)
(1.87)
(.42) M
(.04) L
-
Redemption fees added to paid in capital E
- K
- K
- K
- K
-
Net asset value, end of period
$ 5.61
$ 11.43
$ 12.67
$ 11.46
$ 10.24
Total Return B,C,D
(50.64)%
5.06%
14.30%
12.27%
2.40%
Ratios to Average Net Assets F, J
Expenses before reductions
1.51%
1.20%
1.62%
4.35%
43.36% A
Expenses net of fee waivers, if any
1.20%
1.20%
1.20%
1.20%
1.20% A
Expenses net of all reductions
1.01%
1.16%
1.10%
1.01%
1.01% A
Net investment income (loss)
1.55%
.72% H
.85%
.98%
.71% A
Supplemental Data
Net assets, end of period (000 omitted)
$ 135
$ 414
$ 394
$ 345
$ 307
Portfolio turnover rate G
350%
224%
185%
176%
52% A
A Annualized B Total returns for periods of less than one year are not annualized. C Total returns do not reflect charges attributable to your insurance company's separate account. Inclusion of these charges would reduce the total returns shown. D Total returns would have been lower had certain expenses not been reduced during the periods shown. E Calculated based on average shares outstanding during the period. F Fees and expenses of the underlying Fidelity Central Funds are not included in the Fund's expense ratio. The Fund indirectly bears its proportionate share of the expenses of any underlying Fidelity Central Funds. G Amount does not include the portfolio activity of any underlying Fidelity Central Funds. H Investment income per share reflects a special dividend which amounted to $.02 per share. Excluding the special dividend, the ratio of net investment income (loss) to average net assets would have been .58%. I For the period December 22, 2004 (commencement of operations) to December 31, 2004. J Expense ratios reflect operating expenses of the class. Expenses before reductions do not reflect amounts reimbursed by the investment adviser or reductions from brokerage service arrangements or other expense offset arrangements and do not represent the amount paid by the class during periods when reimbursements or reductions occur. Expense ratios before reductions for start-up periods may not be representative of longer-term operating periods. Expenses net of fee waivers reflect expenses after reimbursement by the investment adviser but prior to reductions from brokerage service arrangements or other expense offset arrangements. Expenses net of all reductions represent the net expenses paid by the class. K Amount represents less than $.01 per share. L Total distributions of $.04 per share is comprised of distributions from net investment income of $.012 and distributions from net realized gain of $.023 per share. M Total distributions of $.42 per share is comprised of distributions from net investment income of $.084 and distributions from net realized gain of $.335 per share.
Financial Highlights - Service Class 2R
Years ended December 31,
2008
2007
2006
2005
2004 I
Selected Per-Share Data
Net asset value, beginning of period
$ 11.43
$ 12.67
$ 11.46
$ 10.24
$ 10.00
Income from Investment Operations
Net investment income (loss) E
.13
.08 H
.08
.09
- K
Net realized and unrealized gain (loss)
(5.90)
.53
1.53
1.15
.24
Total from investment operations
(5.77)
.61
1.61
1.24
.24
Distributions from net investment income
-
(.06)
(.07)
-
-
Distributions from net realized gain
(.06)
(1.79)
(.34)
(.02)
-
Total distributions
(.06)
(1.85)
(.40) M
(.02) L
-
Redemption fees added to paid in capital E
- K
- K
- K
- K
-
Net asset value, end of period
$ 5.60
$ 11.43
$ 12.67
$ 11.46
$ 10.24
Total Return B,C,D
(50.73)%
4.90%
14.14%
12.12%
2.40%
Ratios to Average Net Assets F, J
Expenses before reductions
1.66%
1.35%
1.77%
4.50%
43.51% A
Expenses net of fee waivers, if any
1.35%
1.35%
1.35%
1.35%
1.35% A
Expenses net of all reductions
1.16%
1.31%
1.25%
1.16%
1.17% A
Net investment income (loss)
1.40%
.57% H
.70%
.83%
.55% A
Supplemental Data
Net assets, end of period (000 omitted)
$ 179
$ 550
$ 524
$ 459
$ 410
Portfolio turnover rate G
350%
224%
185%
176%
52% A
A Annualized BTotal returns for periods of less than one year are not annualized. C Total returns do not reflect charges attributable to your insurance company's separate account. Inclusion of these charges would reduce the total returns shown. D Total returns would have been lower had certain expenses not been reduced during the periods shown. E Calculated based on average shares outstanding during the period. F Fees and expenses of the underlying Fidelity Central Funds are not included in the Fund's expense ratio. The Fund indirectly bears its proportionate share of the expenses of any underlying Fidelity Central Funds. G Amount does not include the portfolio activity of any underlying Fidelity Central Funds. H Investment income per share reflects a special dividend which amounted to $.02 per share. Excluding the special dividend, the ratio of net investment income (loss) to average net assets would have been .43%. I For the period December 22, 2004 (commencement of operations) to December 31, 2004. J Expense ratios reflect operating expenses of the class. Expenses before reductions do not reflect amounts reimbursed by the investment adviser or reductions from brokerage service arrangements or other expense offset arrangements and do not represent the amount paid by the class during periods when reimbursements or reductions occur. Expense ratios before reductions for start-up periods may not be representative of longer-term operating periods. Expenses net of fee waivers reflect expenses after reimbursement by the investment adviser but prior to reductions from brokerage service arrangements or other expense offset arrangements. Expenses net of all reductions represent the net expenses paid by the class. K Amount represents less than $.01 per share. L Total distributions of $.02 per share is comprised of distributions from net investment income of $.000 and distributions from net realized gain of $.020 per share. M Total distributions of $.40 per share is comprised of distributions from net investment income of $.066 and distributions from net realized gain of $.335 per share.
See accompanying notes which are an integral part of the financial statements.
Annual Report
Financial Highlights - Investor Class R
Years ended December 31,
2008
2007
2006
2005 I
Selected Per-Share Data
Net asset value, beginning of period
$ 11.41
$ 12.65
$ 11.46
$ 10.32
Income from Investment Operations
Net investment income (loss) E
.14
.09 H
.09
.01
Net realized and unrealized gain (loss)
(5.89)
.54
1.53
1.16
Total from investment operations
(5.75)
.63
1.62
1.17
Distributions from net investment income
-
(.08)
(.10)
(.02)
Distributions from net realized gain
(.06)
(1.79)
(.34)
(.01)
Total distributions
(.06)
(1.87)
(.43) M
(.03) L
Redemption fees added to paid in capital E, K
-
-
-
-
Net asset value, end of period
$ 5.60
$ 11.41
$ 12.65
$ 11.46
Total Return B,C,D
(50.65)%
5.07%
14.23%
11.39%
Ratios to Average Net Assets F, J
Expenses before reductions
1.51%
1.22%
1.61%
2.19% A
Expenses net of fee waivers, if any
1.17%
1.22%
1.25%
1.25% A
Expenses net of all reductions
.97%
1.18%
1.15%
1.06% A
Net investment income (loss)
1.59%
.71% H
.80%
.31% A
Supplemental Data
Net assets, end of period (000 omitted)
$ 14,208
$ 38,719
$ 24,505
$ 9,810
Portfolio turnover rate G
350%
224%
185%
176%
A Annualized B Total returns for periods of less than one year are not annualized. C Total returns do not reflect charges attributable to your insurance company's separate account. Inclusion of these charges would reduce the total returns shown. D Total returns would have been lower had certain expenses not been reduced during the periods shown. E Calculated based on average shares outstanding during the period. F Fees and expenses of the underlying Fidelity Central Funds are not included in the Fund's expense ratio. The Fund indirectly bears its proportionate share of the expenses of any underlying Fidelity Central Funds. G Amount does not include the portfolio activity of any underlying Fidelity Central Funds. H Investment income per share reflects a special dividend which amounted to $.02 per share. Excluding the special dividend, the ratio of net investment income (loss) to average net assets would have been .57%. I For the period July 21, 2005 (commencement of sale of shares) to December 31, 2005. J Expense ratios reflect operating expenses of the class. Expenses before reductions do not reflect amounts reimbursed by the investment adviser or reductions from brokerage service arrangements or other expense offset arrangements and do not represent the amount paid by the class during periods when reimbursements or reductions occur. Expense ratios before reductions for start-up periods may not be representative of longer-term operating periods. Expenses net of fee waivers reflect expenses after reimbursement by the investment adviser but prior to reductions from brokerage service arrangements or other expense offset arrangements. Expenses net of all reductions represent the net expenses paid by the class. K Amount represents less than $.01 per share. L Total distributions of $.03 per share is comprised of distributions from net investment income of $.022 and distributions from net realized gain of $.013 per share. M Total distributions of $.43 per share is comprised of distributions from net investment income of $.095 and distributions from net realized gain of $.335 per share.
See accompanying notes which are an integral part of the financial statements.
VIP International Capital Appreciation Portfolio (the Fund) is a fund of Variable Insurance Products Fund IV (the trust) and is authorized to issue an unlimited number of shares. The trust is registered under the Investment Company Act of 1940, as amended (the 1940 Act), as an open-end management investment company organized as a Massachusetts business trust. Shares of the Fund may only be purchased by insurance companies for the purpose of funding variable annuity or variable life insurance contracts. The Fund offers the following classes of shares: Initial Class shares, Service Class shares, Service Class 2 shares, Initial Class R shares, Service Class R shares, Service Class 2R shares, and Investor Class R shares. All classes have equal rights and voting privileges, except for matters affecting a single class. Investment income, realized and unrealized capital gains and losses, the common expenses of the Fund, and certain fund-level expense reductions, if any, are allocated on a pro rata basis to each class based on the relative net assets of each class to the total net assets of the Fund. Each class differs with respect to transfer agent and distribution and service plan fees incurred. Certain expense reductions also differ by class. The Fund's investments in emerging markets can be subject to social, economic, regulatory, and political uncertainties and can be extremely volatile.
2. Investments in Fidelity Central Funds.
The Fund may invest in Fidelity Central Funds, which are open-end investment companies available only to other investment companies and accounts managed by Fidelity Management & Research Company (FMR) and its affiliates. The Fund's Schedule of Investments lists each of the Fidelity Central Funds held as of period end, if any, as an investment of the Fund, but does not include the underlying holdings of each Fidelity Central Fund. As an Investing Fund, the Fund indirectly bears its proportionate share of the expenses of the underlying Fidelity Central Funds.
The Money Market Central Funds seek preservation of capital and current income and are managed by Fidelity Investments Money Management, Inc. (FIMM), an affiliate of FMR.
A complete unaudited list of holdings for each Fidelity Central Fund is available upon request or at the SEC's web site at www.sec.gov. In addition, the financial statements of the Fidelity Central Funds, which are not covered by the Fund's Report of Independent Registered Public Accounting Firm, are available on the SEC's web site or upon request.
3. Significant Accounting Policies.
The financial statements have been prepared in conformity with accounting principles generally accepted in the United States of America, which require management to make certain estimates and assumptions at the date of the financial statements. Actual results could differ from those estimates. The following summarizes the significant accounting policies of the Fund:
Security Valuation. Investments are valued as of 4:00 p.m. Eastern time on the last calendar day of the period. Wherever possible, the Fund uses independent pricing services approved by the Board of Trustees to value its investments.
Equity securities, including restricted securities, for which market quotations are readily available, are valued at the last reported sale price or official closing price as reported by an independent pricing service on the primary market or exchange on which they are traded. In the event there were no sales during the day or closing prices are not available, securities are valued at the last quoted bid price. Investments in open-end mutual funds, including the Fidelity Central Funds, are valued at their closing net asset value each business day. Short-term securities with remaining maturities of sixty days or less for which quotations are not readily available are valued at amortized cost, which approximates value.
When current market prices or quotations are not readily available or reliable, valuations may be determined in good faith in accordance with procedures adopted by the Board of Trustees. Factors used in determining value may include significant market or security specific events, changes in interest rates and credit quality, and developments in foreign markets which are monitored by evaluating the performance of ADRs, futures contracts and exchange-traded funds. The frequency with which these procedures are used cannot be predicted and may be utilized to a significant extent. The value of securities used for net asset value (NAV) calculation under these procedures may differ from published prices for the same securities.
The Fund is subject to the provisions of Statement of Financial Accounting Standards No. 157, "Fair Value Measurements" (SFAS 157), effective with the beginning of the Fund's fiscal year. SFAS 157 establishes a hierarchy that prioritizes the inputs to valuation techniques giving the highest priority to readily available unadjusted quoted prices in active markets for identical assets (level 1 measurements) and the lowest priority to unobservable inputs (level 3 measurements) when market prices are not readily available or reliable. The three levels of the hierarchy under SFAS 157 are described below:
Level 1
Quoted prices in active markets for identical securities.
Level 2
Prices determined using other significant observable inputs. Observable inputs are inputs that other market participants may use in pricing a security. These may include quoted prices for similar securities, interest rates, prepayment speeds, credit risk and others.
Level 3
Prices determined using significant unobservable inputs. In situations where quoted prices or observable inputs are unavailable or deemed less relevant (for example, when there is little or no market activity for an investment at the end of the period), unobservable inputs may be used. Unobservable inputs reflect the Fund's own assumptions about the factors market participants would use in pricing an investment, and would be based on the best information available.
Annual Report
Notes to Financial Statements - continued
3. Significant Accounting Policies - continued
Security Valuation - continued
Changes in valuation techniques may result in transfers in or out of an investment's assigned level within the hierarchy.
The aggregate value by input level, as of December 31, 2008, for the Fund's investments, as well as a reconciliation of assets for which significant unobservable inputs (Level 3) were used in determining value, is included at the end of the Fund's Schedule of Investments.
Foreign Currency. The Fund uses foreign currency contracts to facilitate transactions in foreign-denominated securities. Losses from these transactions may arise from changes in the value of the foreign currency or if the counterparties do not perform under the contracts' terms.
Foreign-denominated assets, including investment securities, and liabilities are translated into U.S. dollars at the exchange rate at period end. Purchases and sales of investment securities, income and dividends received and expenses denominated in foreign currencies are translated into U.S. dollars at the exchange rate in effect on the transaction date.
The effects of exchange rate fluctuations on investments are included with the net realized and unrealized gain (loss) on investment securities. Other foreign currency transactions resulting in realized and unrealized gain (loss) are disclosed separately.
Investment Transactions and Income. For financial reporting purposes, the Fund's investment holdings and NAV include trades executed through the end of the last business day of the period. The NAV per share for processing shareholder transactions is calculated as of the close of business of the New York Stock Exchange (NYSE), normally 4:00 p.m. Eastern time and includes trades executed through the end of the prior business day. Gains and losses on securities sold are determined on the basis of identified cost. Dividend income is recorded on the ex-dividend date, except for certain dividends from foreign securities where the ex-dividend date may have passed, which are recorded as soon as the Fund is informed of the ex-dividend date. Non-cash dividends included in dividend income, if any, are recorded at the fair market value of the securities received. Interest income and distributions from the Fidelity Central Funds are accrued as earned. Interest income includes coupon interest and amortization of premium and accretion of discount on debt securities. Investment income is recorded net of foreign taxes withheld where recovery of such taxes is uncertain.
Expenses. Most expenses of the trust can be directly attributed to a fund. Expenses which cannot be directly attributed are apportioned among each Fund in the trust. Expense estimates are accrued in the period to which they relate and adjustments are made when actual amounts are known.
Income Tax Information and Distributions to Shareholders. Each year, the Fund intends to qualify as a regulated investment company by distributing substantially all of its taxable income and realized gains under Subchapter M of the Internal Revenue Code and filing its U.S. federal tax return. As a result, no provision for income taxes is required. The Fund is subject to the provisions of FASB Interpretation No. 48, Accounting for Uncertainties in Income Taxes (FIN 48). FIN 48 sets forth a minimum threshold for financial statement recognition of the benefit of a tax position taken or expected to be taken in a tax return. There are no unrecognized tax benefits in the accompanying financial statements. A Fund's federal tax return is subject to examination by the Internal Revenue Service (IRS) for a period of three years. Foreign taxes are provided for based on the Fund's understanding of the tax rules and rates that exist in the foreign markets in which it invests.
Distributions are recorded on the ex-dividend date. Income dividends and capital gain distributions are declared separately for each class. Income and capital gain distributions are determined in accordance with income tax regulations, which may differ from generally accepted accounting principles.
Capital accounts within the financial statements are adjusted for permanent book-tax differences. These adjustments have no impact on net assets or the results of operations. Temporary book-tax differences will reverse in a subsequent period.
Book-tax differences are primarily due to foreign currency transactions, certain foreign taxes, passive foreign investment companies (PFIC), capital loss carryforwards and losses deferred due to wash sales and excise tax regulations.
The tax-basis components of distributable earnings and the federal tax cost as of period end were as follows:
Unrealized appreciation
$ 1,621,534
Unrealized depreciation
(8,303,330)
Net unrealized appreciation (depreciation)
(6,681,796)
Capital loss carryforward
(20,462,362)
Cost for federal income tax purposes
$ 32,055,043
The tax character of distributions paid was as follows:
December 31, 2008
December 31, 2007
Ordinary Income
$ 298,493
$ 9,196,187
Long-term Capital Gains
29,849
1,192,564
Total
$ 328,342
$ 10,388,751
Annual Report
3. Significant Accounting Policies - continued
Trading (Redemption) Fees. Initial Class R shares, Service Class R shares, Service Class 2 R shares and Investor Class R shares held less than 60 days are subject to a redemption fee equal to 1% of the proceeds of the redeemed shares. All redemption fees, including any estimated redemption fees paid by FMR, are retained by the Fund and accounted for as an addition to paid in capital.
4. Operating Policies.
Repurchase Agreements. FMR has received an Exemptive Order from the Securities and Exchange Commission (the SEC) which permits the Fund and other affiliated entities of FMR to transfer uninvested cash balances into joint trading accounts which are then invested in repurchase agreements. The Fund may also invest directly with institutions in repurchase agreements. Repurchase agreements are collateralized by government or non-government securities. Upon settlement date, collateral is held in segregated accounts with custodian banks and may be obtained in the event of a default of the counterparty. The Fund monitors, on a daily basis, the value of the collateral to ensure it is at least equal to the principal amount of the repurchase agreement (including accrued interest). In the event of a default by the counterparty, realization of the collateral proceeds could be delayed, during which time the value of the collateral may decline.
5. Purchases and Sales of Investments.
Purchases and sales of securities, other than short-term securities, aggregated $162,229,980 and $178,782,488, respectively.
6. Fees and Other Transactions with Affiliates.
Management Fee. FMR and its affiliates provide the Fund with investment management related services for which the Fund pays a monthly management fee. The management fee is the sum of an individual fund fee rate that is based on an annual rate of .45% of the Fund's average net assets and a group fee rate that averaged .26% during the period. The group fee rate is based upon the average net assets of all the mutual funds advised by FMR. The group fee rate decreases as assets under management increase and increases as assets under management decrease. For the period, the total annual management fee rate was .71% of the Fund's average net assets.
Distribution and Service Plan. In accordance with Rule 12b-1 of the 1940 Act, the Fund has adopted separate 12b-1 Plans for each Service Class of shares. Each Service Class pays Fidelity Distributors Corporation (FDC), an affiliate of FMR, a service fee. For the period, the service fee is based on an annual rate of .10% of Service Class' and Service Class R's average net assets and .25% of Service Class 2's and Service Class 2R's average net assets.
For the period, each class paid FDC the following amounts, all of which were re-allowed to insurance companies for the distribution of shares and providing shareholder support services:
Service Class
$ 301
Service Class 2
1,259
Service Class R
301
Service Class 2 R
993
$ 2,854
Transfer Agent Fees. Fidelity Investments Institutional Operations Company, Inc. (FIIOC), an affiliate of FMR, is the Fund's transfer, dividend disbursing, and shareholder servicing agent. FIIOC receives an asset-based fee with respect to each class. Each class (with the exception of Investor Class) pays a transfer agent fee, excluding out of pocket expenses, equal to an annual rate of .07% of average net assets. Investor Class pays a monthly asset-based transfer agent fee of .15% of average net assets. Prior to February 1, 2008, Investor Class paid a monthly asset-based transfer agent fee of .18% of average net assets. The total transfer agent fees paid by each class to FIIOC, including out of pocket expenses, were as follows:
Initial Class
$ 1,994
Service Class
232
Service Class 2
1,276
Initial Class R
15,782
Service Class R
232
Service Class 2R
297
Investor Class R
44,672
$ 64,485
Accounting and Security Lending Fees. Fidelity Service Company, Inc. (FSC), an affiliate of FMR, maintains the Fund's accounting records. The accounting fee is based on the level of average net assets for the month. Under a separate contract, FSC administers the security lending program. The security lending fee is based on the number and duration of lending transactions.
Annual Report
Notes to Financial Statements - continued
6. Fees and Other Transactions with Affiliates - continued
Brokerage Commissions. The Fund placed a portion of its portfolio transactions with brokerage firms which are affiliates of the investment adviser. The commissions paid to these affiliated firms were $427 for the period.
7. Committed Line of Credit.
The Fund participates with other funds managed by FMR in a $4.2 billion credit facility (the "line of credit") to be utilized for temporary or emergency purposes to fund shareholder redemptions or for other short-term liquidity purposes. The Fund has agreed to pay commitment fees on its pro rata portion of the line of credit, which amounted to $118 and is reflected in Miscellaneous Expense on the Statement of Operations. During the period, there were no borrowings on this line of credit.
8. Security Lending.
The Fund lends portfolio securities from time to time in order to earn additional income. On the settlement date of the loan, the Fund receives collateral (in the form of U.S. Treasury obligations, letters of credit and/or cash) against the loaned securities and maintains collateral in an amount not less than 100% of the market value of the loaned securities during the period of the loan. The market value of the loaned securities is determined at the close of business of the Fund and any additional required collateral is delivered to the Fund on the next business day. If the borrower defaults on its obligation to return the securities loaned because of insolvency or other reasons, a fund could experience delays and costs in recovering the securities loaned or in gaining access to the collateral. Any cash collateral received is invested in the Fidelity Securities Lending Cash Central Fund. The value of loaned securities and cash collateral at period end are disclosed on the Fund's Statement of Assets and Liabilities. Security lending income represents the income earned on investing cash collateral, less fees and expenses associated with the loan, plus any premium payments that may be received on the loan of certain types of securities. Security lending income is presented in the Statement of Operations as a component of income from Fidelity Central Funds. Net income from lending portfolio securities during the period amounted to $46,336.
9. Expense Reductions.
FMR voluntarily agreed to reimburse each class to the extent annual operating expenses exceeded certain levels of average net assets as noted in the table below. Some expenses, for example interest expense, including commitment fees, are excluded from this reimbursement.
The following classes were in reimbursement during the period:
Expense Limitations
Reimbursement from adviser
Initial Class
1.10%
$ 3,962
Service Class
1.20%
931
Service Class 2
1.35%
2,215
Initial Class R
1.10%
60,251
Service Class R
1.20%
930
Service Class 2R
1.35%
1,221
Investor Class R
1.25% - 1.18%*
91,211
$ 160,721
* Expense limitation in effect at period end.
Effective February 1, 2008, the expense limitation changed to 1.18% for Investor Class R.
Many of the brokers with whom FMR places trades on behalf of the Fund provided services to the Fund in addition to trade execution. These services included payments of certain expenses on behalf of the Fund totaling $90,379 for the period.
10. Other.
The Fund's organizational documents provide former and current trustees and officers with a limited indemnification against liabilities arising in connection with the performance of their duties to the Fund. In the normal course of business, the Fund may also enter into contracts that provide general indemnifications. The Fund's maximum exposure under these arrangements is unknown as this would be dependent on future claims that may be made against the Fund. The risk of material loss from such claims is considered remote.
At the end of the period, FMR or its affiliates were the owners of record of 98% of the total outstanding shares of the Fund.
Annual Report
11. Distributions to Shareholders.
Distributions to shareholders of each class were as follows:
Years ended December 31,
2008
2007
From net investment income
Initial Class
$ -
$ 9,981
Service Class
-
2,513
Service Class 2
-
2,465
Initial Class R
-
232,391
Service Class R
-
2,513
Service Class 2R
-
2,506
Investor Class R
-
236,202
Total
$ -
$ 488,571
From net realized gain
Initial Class
$ 6,626
$ 188,994
Service Class
1,993
56,040
Service Class 2
2,646
75,317
Initial Class R
134,858
4,287,821
Service Class R
1,993
56,040
Service Class 2R
2,646
74,517
Investor Class R
177,580
5,161,451
Total
$ 328,342
$ 9,900,180
12. Share Transactions.
Transactions for each class of shares were as follows:
Shares
Dollars
Years ended December 31,
2008
2007
2008
2007
Initial Class
Shares sold
30,908
57,013
$ 260,134
$ 797,148
Reinvestment of distributions
672
17,391
6,626
198,975
Shares redeemed
(85,732)
(58,226)
(731,294)
(765,491)
Net increase (decrease)
(54,152)
16,178
$ (464,534)
$ 230,632
Service Class
Reinvestment of distributions
202
5,121
$ 1,993
$ 58,553
Shares redeemed
(12,389)
-
(90,726)
-
Net increase (decrease)
(12,187)
5,121
$ (88,733)
$ 58,553
Service Class 2
Shares sold
29,552
6,394
$ 262,678
$ 84,142
Reinvestment of distributions
269
6,793
2,646
77,782
Shares redeemed
(23,991)
(6,455)
(171,548)
(88,305)
Net increase (decrease)
5,830
6,732
$ 93,776
$ 73,619
Initial Class R
Shares sold
148,524
1,656,294
$ 1,413,988
$ 22,491,075
Reinvestment of distributions
13,677
396,233
134,858
4,520,212
Shares redeemed
(1,478,974)
(583,136)
(13,970,732)
(7,820,250)
Net increase (decrease)
(1,316,773)
1,469,391
$ (12,421,886)
$ 19,191,037
Service Class R
Reinvestment of distributions
202
5,121
$ 1,993
$ 58,553
Shares redeemed
(12,389)
-
(90,726)
-
Net increase (decrease)
(12,187)
5,121
$ (88,733)
$ 58,553
Service Class 2R
Reinvestment of distributions
269
6,735
$ 2,646
$ 77,024
Shares redeemed
(16,453)
-
(120,308)
-
Net increase (decrease)
(16,184)
6,735
$ (117,662)
$ 77,024
Investor Class R
Shares sold
176,104
1,585,891
$ 1,598,648
$ 21,572,358
Reinvestment of distributions
18,065
473,946
177,580
5,397,653
Shares redeemed
(1,048,997)
(602,827)
(9,318,944)
(8,073,931)
Net increase (decrease)
(854,828)
1,457,010
$ (7,542,716)
$ 18,896,080
Annual Report
Reportof Independent Registered Public Accounting Firm
To the Trustees of Variable Insurance Products Fund IV and the Shareholders of VIP International Capital Appreciation Portfolio:
In our opinion, the accompanying statement of assets and liabilities, including the schedule of investments, and the related statements of operations and of changes in net assets and the financial highlights present fairly, in all material respects, the financial position of VIP International Capital Appreciation Portfolio (a fund of Variable Insurance Products Fund IV) at December 31, 2008, the results of its operations for the year then ended, the changes in its net assets for each of the two years in the period then ended and the financial highlights for each of the periods indicated, in conformity with accounting principles generally accepted in the United States of America. These financial statements and financial highlights (hereafter referred to as "financial statements") are the responsibility of the VIP International Capital Appreciation Portfolio's management. Our responsibility is to express an opinion on these financial statements based on our audits. We conducted our audits of these financial statements in accordance with the standards of the Public Company Accounting Oversight Board (United States). Those standards require that we plan and perform the audit to obtain reasonable assurance about whether the financial statements are free of material misstatement. An audit includes examining, on a test basis, evidence supporting the amounts and disclosures in the financial statements, assessing the accounting principles used and significant estimates made by management, and evaluating the overall financial statement presentation. We believe that our audits, which included confirmation of securities at December 31, 2008 by correspondence with the custodian and brokers, provide a reasonable basis for our opinion.
The Trustees, Member of the Advisory Board, and executive officers of the trust and fund, as applicable, are listed below. The Board of Trustees governs the fund and is responsible for protecting the interests of shareholders. The Trustees are experienced executives who meet periodically throughout the year to oversee the fund's activities, review contractual arrangements with companies that provide services to the fund, and review the fund's performance. Except for Edward C. Johnson 3d and James C. Curvey, each of the Trustees oversees 222 funds advised by FMR or an affiliate. Messrs. Johnson and Curvey oversee 380 funds advised by FMR or an affiliate.
The Trustees hold office without limit in time except that (a) any Trustee may resign; (b) any Trustee may be removed by written instrument, signed by at least two-thirds of the number of Trustees prior to such removal; (c) any Trustee who requests to be retired or who has become incapacitated by illness or injury may be retired by written instrument signed by a majority of the other Trustees; and (d) any Trustee may be removed at any special meeting of shareholders by a two-thirds vote of the outstanding voting securities of the trust. Each Trustee who is not an interested person (as defined in the 1940 Act) (Independent Trustee), shall retire not later than the last day of the calendar year in which his or her 72nd birthday occurs. The Independent Trustees may waive this mandatory retirement age policy with respect to individual Trustees. The executive officers and Advisory Board Member hold office without limit in time, except that any officer and Advisory Board Member may resign or may be removed by a vote of a majority of the Trustees at any regular meeting or any special meeting of the Trustees. Except as indicated, each individual has held the office shown or other offices in the same company for the past five years.
The fund's Statement of Additional Information (SAI) includes more information about the Trustees.To request a free copy, call Fidelity at 1-877-208-0098.
Interested Trustees*:
Correspondence intended for each Trustee who is an interested person may be sent to Fidelity Investments, 82 Devonshire Street, Boston, Massachusetts 02109.
Name, Age; Principal Occupation
Edward C. Johnson 3d (78)
Year of Election or Appointment: 1983
Mr. Johnson is Chairman of the Board of Trustees. Mr. Johnson serves as Chief Executive Officer, Chairman, and a Director of FMR LLC; Chairman and a Director of FMR; Chairman and a Director of Fidelity Research & Analysis Company (FRAC); Chairman and a Director of Fidelity Investments Money Management, Inc.; and Chairman and a Director of FMR Co., Inc. In addition, Mr. Johnson serves as Chairman and Director of FIL Limited. Previously, Mr. Johnson served as President of FMR LLC (2006-2007).
James C. Curvey (73)
Year of Election or Appointment: 2007
Mr. Curvey also serves as Trustee (2007-present) of other investment companies advised by FMR. Mr. Curvey is a Director of FMR and FMR Co., Inc. (2007-present). Mr. Curvey is also Vice Chairman (2006-present) and Director of FMR LLC. In addition, Mr. Curvey serves as an Overseer for the Boston Symphony Orchestra and a member of the Trustees of Villanova University.
* Trustees have been determined to be "Interested Trustees" by virtue of, among other things, their affiliation with the trust or various entities under common control with FMR. FMR Corp. merged with and into FMR LLC on October 1, 2007. Any references to FMR LLC for prior periods are deemed to be references to the prior entity.
Independent Trustees:
Correspondence intended for each Independent Trustee (that is, the Trustees other than the Interested Trustees) may be sent to Fidelity Investments, P.O. Box 55235, Boston, Massachusetts 02205-5235.
Name, Age; Principal Occupation
Dennis J. Dirks (60)
Year of Election or Appointment: 2005
Prior to his retirement in May 2003, Mr. Dirks was Chief Operating Officer and a member of the Board of The Depository Trust & Clearing Corporation (DTCC) (1999-2003). He also served as President, Chief Operating Officer, and Board member of The Depository Trust Company (DTC) (1999-2003) and President and Board member of the National Securities Clearing Corporation (NSCC) (1999-2003). In addition, Mr. Dirks served as Chief Executive Officer and Board member of the Government Securities Clearing Corporation (2001-2003), Chief Executive Officer and Board member of the Mortgage-Backed Securities Clearing Corporation (2001-2003), as a Trustee and a member of the Finance Committee of Manhattan College (2005-2008), and as a Trustee and a member of the Finance Committee of AHRC of Nassau County (2006-2008). Currently, Mr. Dirks serves as a member of the Board of Directors for The Brookville Center for Children's Services, Inc. (2009-present).
Alan J. Lacy (55)
Year of Election or Appointment: 2008
Mr. Lacy serves as Senior Adviser (2007-present) of Oak Hill Capital Partners, L.P. (a private equity firm). Mr. Lacy also served as Chief Executive Officer (2000-2005) and Vice Chairman (2005-2006) of Sears Holdings Corporation and Sears, Roebuck and Co. (retail). In addition, Mr. Lacy serves as a member of the Board of Directors of The Western Union Company (global money transfer, 2006-present) and Bristol-Myers Squibb (global pharmaceuticals, 2007-present). Mr. Lacy is a Trustee of the National Parks Conservation Association and The Field Museum of Natural History.
Ned C. Lautenbach (64)
Year of Election or Appointment: 2000
Mr. Lautenbach is Chairman of the Independent Trustees (2006-present). Mr. Lautenbach is an Advisory Partner of Clayton, Dubilier & Rice, Inc. (private equity investment firm). Previously, Mr. Lautenbach was with the International Business Machines Corporation (IBM) from 1968 until his retirement in 1998. Mr. Lautenbach serves as a Director of Eaton Corporation (diversified industrial) as well as the Philharmonic Center for the Arts in Naples, Florida. He also is a member of the Board of Trustees of Fairfield University (2005-present), as well as a member of the Council on Foreign Relations. Previously, Mr. Lautenbach served as a Director of Sony Corporation (2006-2007).
Joseph Mauriello (64)
Year of Election or Appointment: 2008
Prior to his retirement in January 2006, Mr. Mauriello served in numerous senior management positions including Deputy Chairman and Chief Operating Officer (2004-2005), and Vice Chairman of Financial Services (2002-2004) of KPMG LLP US (professional services firm, 1965-2005). Mr. Mauriello currently serves as a member of the Board of Directors of XL Capital Ltd. (global insurance and re-insurance company, 2006-present) and of Arcadia Resources Inc. (health care services and products, 2007-present). He also served as a Director of the Hamilton Funds of the Bank of New York (2006-2007).
Cornelia M. Small (64)
Year of Election or Appointment: 2005
Ms. Small is a member of the Investment Committee, and Chair (2008-present) and a member of the Board of Trustees of Smith College. Ms. Small also serves on the Investment Committee of the Berkshire Taconic Community Foundation (2008-present). Previously, Ms. Small served as Chairperson of the Investment Committee (2002-2008) of Smith College and as Co-Chair (2000-2003) of the Annual Fund for the Fletcher School of Law and Diplomacy. In addition, she served as Chief Investment Officer, Director of Global Equity Investments, and a member of the Board of Directors of Scudder, Stevens & Clark and Scudder Kemper Investments.
William S. Stavropoulos (69)
Year of Election or Appointment: 2001
Mr. Stavropoulos is Chairman Emeritus of the Board of Directors of The Dow Chemical Company, where he previously served in numerous senior management positions, including President (1993-2000; 2002-2003), CEO (1995-2000; 2002-2004), Chairman of the Executive Committee (2000-2006), and as a member of the Board of Directors (1990-2006). Currently, he is a Director of Teradata Corporation (data warehousing and technology solutions, 2008-present), Chemical Financial Corporation, Maersk Inc. (industrial conglomerate), Tyco International, Inc. (multinational manufacturing and services, 2007-present), and a member of the Advisory Board for Metalmark Capital (private equity investment firm, 2005-present). He is a special advisor to Clayton, Dubilier & Rice, Inc. (private equity investment). In addition, Mr. Stavropoulos is a member of the University of Notre Dame Advisory Council for the College of Science.
David M. Thomas (59)
Year of Election or Appointment: 2008
Previously, Mr. Thomas served as Executive Chairman (2005-2006) and Chairman and Chief Executive Officer (2000-2005) of IMS Health, Inc. (pharmaceutical and healthcare information solutions). In addition, Mr. Thomas serves as a member of the Board of Directors of Fortune Brands, Inc. (consumer products holding company), and Interpublic Group of Companies, Inc. (marketing communication, 2004-present).
Michael E. Wiley (58)
Year of Election or Appointment: 2008
Mr. Wiley also serves as a member of the Board of Trustees of the University of Tulsa (2000-2006; 2007-present). He serves as a Director of Tesoro Corporation (independent oil refiner and marketer, 2005-present), and a Director of Bill Barrett Corporation (exploration and production company, 2005-present). In addition, he also serves as a Director of Post Oak Bank (privately-held bank, 2004-present). Previously, Mr. Wiley served as a Sr. Energy Advisor of Katzenbach Partners, LLC (consulting firm, 2006-2007), as an Advisory Director of Riverstone Holdings (private investment firm), Chairman, President, and CEO of Baker Hughes, Inc. (oilfield services company, 2000-2004), and as Director of Spinnaker Exploration Company (exploration and production company, 2001-2005).
Annual Report
Trustees and Officers - continued
Advisory Board Member and Executive Officers**:
Correspondence intended for each executive officer and Mr. Lynch may be sent to Fidelity Investments, 82 Devonshire Street, Boston, Massachusetts 02109.
Name, Age; Principal Occupation
Peter S. Lynch (64)
Year of Election or Appointment: 2003
Member of the Advisory Board of Fidelity's Equity and High Income Funds. Mr. Lynch is Vice Chairman and a Director of FMR, and Vice Chairman (2001-present) and a Director of FMR Co., Inc. Previously, Mr. Lynch served as a Trustee of the Fidelity funds (1990-2003). In addition, he serves as a Trustee of Boston College and as the Chairman of the Inner-City Scholarship Fund. Previously, Mr. Lynch served on the Special Olympics International Board of Directors (1997-2006).
Kenneth B. Robins (39)
Year of Election or Appointment: 2008
President and Treasurer of Fidelity's Equity and High Income Funds. Mr. Robins is an employee of Fidelity Investments (2004-present). Before joining Fidelity Investments, Mr. Robins worked at KPMG LLP, where he was a partner in KPMG's department of professional practice (2002-2004).
Walter C. Donovan (46)
Year of Election or Appointment: 2007
Vice President of Fidelity's Equity Funds. Mr. Donovan also serves as President of FMR and FMR Co., Inc., and Executive Vice President of Fidelity Investments Money Management, Inc. (2007-present). Previously, Mr. Donovan served as Executive Vice President of FMR and FMR Co., Inc. (2005-2007) and Senior Vice President of FMR (2003-2005) and FMR Co., Inc. (2004-2005).
Eric M. Wetlaufer (46)
Year of Election or Appointment: 2006
Vice President of Fidelity's International Equity Funds. Mr. Wetlaufer also serves as Group Chief Investment Officer of FMR. Mr. Wetlaufer is Chairman, Chief Executive Officer, and President of Fidelity Management & Research (Hong Kong) Limited (2008-present); Chairman, Chief Executive Officer, President, and a Director of Fidelity Management & Research (Japan) Inc. (2008-present); Chairman and Chief Executive Officer (2007-present) and President and a Director (2006-present) of Fidelity Management & Research (U.K.) Inc. and President and a Director of Fidelity Research & Analysis Company (2006-present). Before joining Fidelity Investments in 2005, Mr. Wetlaufer was a partner in Oxhead Capital Management (2004-2005) and a Chief Investment Officer of Putnam Investments (1997-2003).
Scott C. Goebel (40)
Year of Election or Appointment: 2008
Secretary and Chief Legal Officer (CLO) of the Fidelity funds. Mr. Goebel also serves as General Counsel, Secretary, and Senior Vice President of FMR (2008-present); Deputy General Counsel of FMR LLC; Chief Legal Secretary of Fidelity Management & Research (Hong Kong) Limited (2008-present) and Assistant Secretary of Fidelity Management & Research (Japan) Inc. (2008-present). Previously, Mr. Goebel served as Assistant Secretary of the Funds (2007-2008) and as Vice President and Secretary of Fidelity Distributors Corporation (FDC) (2005-2007).
John B. McGinty, Jr. (46)
Year of Election or Appointment: 2008
Assistant Secretary of Fidelity's Equity and High Income Funds. Mr. McGinty is an employee of Fidelity Investments (2004-present). Mr. McGinty also serves as Senior Vice President, Secretary, and Chief Legal Officer of FDC (2007-present). Before joining Fidelity Investments, Mr. McGinty practiced law at Ropes & Gray, LLP.
Holly C. Laurent (54)
Year of Election or Appointment: 2008
Anti-Money Laundering (AML) Officer of the Fidelity funds. Ms. Laurent is an employee of Fidelity Investments. Previously, Ms. Laurent was Senior Vice President and Head of Legal for Fidelity Business Services India Pvt. Ltd. (2006-2008), Senior Vice President, Deputy General Counsel and Group Head for FMR LLC (2005-2006).
Christine Reynolds (50)
Year of Election or Appointment: 2008
Chief Financial Officer of the Fidelity funds. Ms. Reynolds became President of Fidelity Pricing and Cash Management Services (FPCMS) in August 2008. She served as Chief Operating Officer of FPCMS from 2007 through July 2008. Previously, Ms. Reynolds served as President, Treasurer, and Anti-Money Laundering officer of the Fidelity funds (2004-2007). Before joining Fidelity Investments, Ms. Reynolds worked at PricewaterhouseCoopers LLP (PwC) (1980-2002), where she was an audit partner with PwC's investment management practice.
Kenneth A. Rathgeber (61)
Year of Election or Appointment: 2004
Chief Compliance Officer of Fidelity's Equity and High Income Funds. Mr. Rathgeber is Chief Compliance Officer of Fidelity Management & Research (Hong Kong) Limited (2008-present), Fidelity Management & Research (Japan) Inc. (2008-present), FMR (2005-present), FMR Co., Inc. (2005-present), Fidelity Management & Research (U.K.) Inc. (2005-present), Fidelity Research & Analysis Company (2005-present), Fidelity Investments Money Management, Inc. (2005-present), and Strategic Advisers, Inc. (2005-present).
Bryan A. Mehrmann (47)
Year of Election or Appointment: 2005
Deputy Treasurer of the Fidelity funds. Mr. Mehrmann is an employee of Fidelity Investments. Previously, Mr. Mehrmann served as Vice President of Fidelity Investments Institutional Services Group (FIIS)/Fidelity Investments Institutional Operations Company, Inc. (FIIOC) Client Services (1998-2004).
Adrien E. Deberghes (41)
Year of Election or Appointment: 2008
Deputy Treasurer of Fidelity's Equity and High Income Funds. Mr. Deberghes is an employee of Fidelity Investments (2008-present). Previously, Mr. Deberghes served as Senior Vice President of Mutual Fund Administration at State Street Corporation (2007-2008), Senior Director of Mutual Fund Administration at Investors Bank & Trust (2005-2007), and Director of Finance for Dunkin' Brands (2000-2005).
Robert G. Byrnes (42)
Year of Election or Appointment: 2005
Assistant Treasurer of the Fidelity funds. Mr. Byrnes is an employee of Fidelity Investments (2005-present). Previously, Mr. Byrnes served as Vice President of Fidelity Pricing and Cash Management Services (FPCMS) (2003-2005). Before joining Fidelity Investments, Mr. Byrnes worked at Deutsche Asset Management where he served as Vice President of the Investment Operations Group (2000-2003).
Paul M. Murphy (61)
Year of Election or Appointment: 2007
Assistant Treasurer of the Fidelity funds. Mr. Murphy is an employee of Fidelity Investments (2007-present). Previously, Mr. Murphy served as Chief Financial Officer of the Fidelity Funds (2005-2006), Vice President and Associate General Counsel of FMR (2007), and Senior Vice President of Fidelity Pricing and Cash Management Services (FPCMS) (1994-2007).
Gary W. Ryan (50)
Year of Election or Appointment: 2005
Assistant Treasurer of the Fidelity funds. Mr. Ryan is an employee of Fidelity Investments. Previously, Mr. Ryan served as Vice President of Fund Reporting in Fidelity Pricing and Cash Management Services (FPCMS) (1999-2005).
** FMR Corp. merged with and into FMR LLC on October 1, 2007. Any references to FMR LLC for prior periods are deemed to be references to the prior entity.
A special meeting of the fund's shareholders was held on May 14, 2008. The results of votes taken among shareholders on the proposals before them are reported below. Each vote reported represents one dollar of net asset value held on the record date for the meeting.
PROPOSAL 1
To elect a Board of Trustees.A
# of Votes
% of Votes
James C. Curvey
Affirmative
82,890,712.47
95.991
Withheld
3,461,988.43
4.009
TOTAL
86,352,700.90
100.000
Dennis J. Dirks
Affirmative
82,970,372.75
96.083
Withheld
3,382,328.15
3.917
TOTAL
86,352,700.90
100.000
Edward C. Johnson 3d
Affirmative
82,689,162.78
95.757
Withheld
3,663,538.12
4.243
TOTAL
86,352,700.90
100.000
Alan J. Lacy
Affirmative
83,041,222.35
96.165
Withheld
3,311,478.55
3.835
TOTAL
86,352,700.90
100.000
Ned C. Lautenbach
Affirmative
82,983,853.72
96.099
Withheld
3,368,847.18
3.901
TOTAL
86,352,700.90
100.000
Joseph Mauriello
Affirmative
83,138,122.14
96.277
Withheld
3,214,578.76
3.723
TOTAL
86,352,700.90
100.000
Cornelia M. Small
Affirmative
83,095,438.06
96.228
Withheld
3,257,262.84
3.772
TOTAL
86,352,700.90
100.000
William S. Stavropoulos
Affirmative
82,929,113.95
96.035
Withheld
3,423,586.95
3.965
TOTAL
86,352,700.90
100.000
David M. Thomas
Affirmative
83,095,487.87
96.228
Withheld
3,257,213.03
3.772
TOTAL
86,352,700.90
100.000
Michael E. Wiley
Affirmative
83,048,523.75
96.174
Withheld
3,304,177.15
3.826
TOTAL
86,352,700.90
100.000
PROPOSAL 2
To amend the Declaration of Trust to reduce the required quorum for future shareholder meetings.A
# of Votes
% of Votes
Affirmative
74,393,635.26
86.151
Against
8,745,543.59
10.128
Abstain
3,213,522.05
3.721
TOTAL
86,352,700.90
100.000
ADenotes trust-wide proposal and voting results.
Annual Report
BoardApproval of Investment Advisory Contracts and Management Fees
VIP International Capital Appreciation Portfolio
Each year, typically in July, the Board of Trustees, including the Independent Trustees (together, the Board), votes on the renewal of the management contract and sub-advisory agreements (together, the Advisory Contracts) for the fund. The Board, assisted by the advice of fund counsel and Independent Trustees' counsel, requests and considers a broad range of information throughout the year.
The Board meets regularly and, acting directly and through its separate committees, requests and receives information concerning, and considers at each of its meetings factors that are relevant to, its annual consideration of the renewal of the fund's Advisory Contracts, including the services and support provided to the fund and its shareholders. At the time of the renewal, the Board had 12 standing committees, each composed of Independent Trustees with varying backgrounds, to which the Board has assigned specific subject matter responsibilities in order to enhance effective decision-making by the Board. Each committee has a written charter outlining the structure and purposes of the committee. The Board also meets as needed to consider matters specifically related to the Board's annual consideration of the renewal of Advisory Contracts.
At its July 2008 meeting, the Board of Trustees, including the Independent Trustees, unanimously determined to renew the fund's Advisory Contracts. In reaching its determination, the Board considered all factors it believed relevant, including (i) the nature, extent, and quality of the services to be provided to the fund and its shareholders (including the investment performance of the fund); (ii) the competitiveness of the fund's management fee and total expenses; (iii) the total costs of the services to be provided by and the profits to be realized by Fidelity from its relationship with the fund; (iv) the extent to which economies of scale would be realized as the fund grows; and (v) whether fee levels reflect these economies of scale, if any, for the benefit of fund shareholders. The Board also approved agreements with foreign sub-advisers Fidelity Management & Research (Japan) Inc. and Fidelity Management & Research (Hong Kong) Limited, as well as amendments to the fund's agreement with Fidelity Management & Research (U.K.) Inc.
In considering whether to renew the Advisory Contracts for the fund, the Board ultimately reached a determination, with the assistance of fund counsel and Independent Trustees' counsel and through the exercise of its business judgment, that the renewal of the Advisory Contracts and the compensation to be received by Fidelity under the management contract is consistent with Fidelity's fiduciary duty under applicable law. The Board's decision to renew the Advisory Contracts was not based on any single factor noted above, but rather was based on a comprehensive consideration of all the information provided to the Board at its meetings throughout the year. The Board, in reaching its determination to renew the Advisory Contracts, is aware that shareholders in the fund have a broad range of investment choices available to them, including a wide choice among mutual funds offered by competitors to Fidelity, and that the fund's shareholders, with the opportunity to review and weigh the disclosure provided by the fund in its prospectus and other public disclosures, have chosen to invest in this fund, managed by Fidelity.
Nature, Extent, and Quality of Services Provided. The Board considered staffing within the investment adviser, FMR, and the sub-advisers (together, the Investment Advisers), including the backgrounds of the fund's investment personnel and the fund's investment objective and discipline. The Independent Trustees also had discussions with senior management of Fidelity's investment operations and investment groups. The Board considered the structure of the portfolio manager compensation program and whether this structure provides appropriate incentives.
Resources Dedicated to Investment Management and Support Services. The Board reviewed the size, education, and experience of the Investment Advisers' investment staff, their use of technology, and the Investment Advisers' approach to recruiting, training, and retaining portfolio managers and other research, advisory, and management personnel. The Board noted that Fidelity's analysts have access to a variety of technological tools that enable them to perform both fundamental and quantitative analysis and to specialize in various disciplines. The Board considered Fidelity's extensive global research capabilities that enable the Investment Advisers to aggregate data from various sources in an effort to produce positive investment results. The Board also considered that Fidelity's portfolio managers and analysts have access to daily portfolio attribution that allows for monitoring of a fund's portfolio, as well as an electronic communication system that provides immediate real-time access to research concerning issuers and credit enhancers.
Shareholder and Administrative Services. The Board considered (i) the nature, extent, quality, and cost of advisory, administrative, distribution, and shareholder services performed by the Investment Advisers and their affiliates under the Advisory Contracts and under separate agreements covering transfer agency, pricing and bookkeeping, and securities lending services for the fund; (ii) the nature and extent of the Investment Advisers' supervision of third party service providers, principally custodians and subcustodians; and (iii) the resources devoted to, and the record of compliance with, the fund's compliance policies and procedures. The Board also reviewed the allocation of fund brokerage, including allocations to brokers affiliated with the Investment Advisers, the use of brokerage commissions to pay fund expenses, and the use of "soft" commission dollars to pay for research services. The Board further considered that Fidelity voluntarily pays for market data out of its own resources.
The Board noted that the growth of fund assets across the complex allows Fidelity to reinvest in the development of services designed to enhance the value or convenience of the Fidelity funds as investment vehicles. These services include 24-hour access to account information and market information through phone representatives and over the Internet, and investor education materials and asset allocation tools.
Investment in a Large Fund Family. The Board considered the benefits to shareholders of investing in a Fidelity fund, including the benefits of investing in a fund that is part of a large family of funds offering a variety of investment disciplines and providing for a large variety of mutual fund investor services. The Board noted that Fidelity has taken a number of actions over the previous year that benefited particular funds, including (i) dedicating additional resources to investment research and to restructure the investment research teams; (ii) contractually agreeing to reduce the management fees on Fidelity's Institutional Money Market Funds and launching Class IV and Institutional Class of certain of these funds; (iii) reducing the transfer agent fees for the Fidelity Select Portfolios and Investor Class of the VIP funds; and (iv) launching Class K of 29 equity funds as a lower-fee class available to certain employer-sponsored retirement plans.
Annual Report
Investment Performance. The Board considered whether the fund has operated within its investment objective, as well as its record of compliance with its investment restrictions. It also reviewed the fund's absolute investment performance for each class, as well as the fund's relative investment performance for each class measured against (i) a broad-based securities market index, and (ii) a custom peer group of mutual funds deemed appropriate by the Board. Because the fund had been in existence less than five calendar years, the following charts considered by the Board show, for the one- and three-year periods ended December 31, 2007, the cumulative total returns of Initial Class R and Service Class 2 of the fund, the cumulative total returns of a broad-based securities market index ("benchmark"), and a range of cumulative total returns of a custom peer group of mutual funds defined by FMR based on categories assigned by Morningstar, Inc. The returns of Initial Class R and Service Class 2 show the performance of the highest and lowest performing classes, respectively (based on three-year performance). The box within each chart shows the 25th percentile return (bottom of box) and the 75th percentile return (top of box) of the peer group. Returns shown above the box are in the first quartile and returns shown below the box are in the fourth quartile. The percentage beaten numbers noted below each chart correspond to the percentile box and represent the percentage of funds in the peer group whose performance was equal to or lower than that of the class indicated. The fund's custom peer group, defined by FMR, is a peer group that FMR believes provides a more meaningful performance comparison than the peer group assigned by Morningstar, Inc., which assigns mutual funds to categories based on their investment styles as measured by their underlying portfolio holdings.
VIP International Capital Appreciation Portfolio
The Board reviewed the fund's relative investment performance against its peer group and stated that the performance of Initial Class R of the fund was in the fourth quartile for all the periods shown. The Board also stated that the investment performance of the fund was lower than its benchmark for all the periods shown. The Board considered that the variations in performance among the fund's classes reflect the variations in class expenses, which result in lower performance for higher expense classes. The Board discussed with FMR actions that may be taken by FMR to improve the fund's disappointing performance relative to its peer group and benchmark. The Board will continue to closely monitor the performance of the fund in the coming year and discuss with FMR other appropriate actions to address the performance of the fund.
The Board considered that FMR has taken steps to refocus and strengthen equity research, equity portfolio management, and compliance.
Based on its review, and giving particular weight to the nature and quality of the resources dedicated by the Investment Advisers to maintain and improve relative performance, the Board concluded that the nature, extent, and quality of the services provided to the fund will benefit the fund's shareholders, particularly in light of the Board's view that the fund's shareholders benefit from investing in a fund that is part of a large family of funds offering a variety of investment disciplines and services.
Competitiveness of Management Fee and Total Fund Expenses. The Board considered the fund's management fee and total expenses compared to "mapped groups" of competitive funds and classes. Fidelity creates "mapped groups" by combining similar Lipper investment objective categories that have comparable management fee characteristics. Combining Lipper investment objective categories aids the Board's management fee and total expense comparisons by broadening the competitive group used for comparison and by reducing the number of universes to which various Fidelity funds are compared. The Board also considered supplemental information about how the fund's management fee and total expenses ranked relative to groups based on Lipper classifications, which take into account a fund's market capitalization and style.
Annual Report
Board Approval of Investment Advisory Contracts and Management Fees - continued
The Board considered two proprietary management fee comparisons for the 12-month (or shorter) periods shown in the chart below. The group of Lipper funds used by the Board for management fee comparisons is referred to below as the "Total Mapped Group." The Total Mapped Group comparison focuses on a fund's standing relative to the total universe of comparable funds available to investors, in terms of gross management fees before expense reimbursements or caps. "TMG %" represents the percentage of funds in the Total Mapped Group that had management fees that were lower than the fund's. For example, a TMG % of 14% means that 86% of the funds in the Total Mapped Group had higher management fees than the fund. The "Asset-Size Peer Group" (ASPG) comparison focuses on a fund's standing relative to non-Fidelity funds similar in size to the fund within the Total Mapped Group. The ASPG represents at least 15% of the funds in the Total Mapped Group with comparable asset size and management fee characteristics, subject to a minimum of 50 funds (or all funds in the Total Mapped Group if fewer than 50). Additional information, such as the ASPG quartile in which the fund's management fee ranked, is also included in the chart and considered by the Board.
VIP International Capital Appreciation Portfolio
The Board noted that the fund's management fee ranked below the median of its Total Mapped Group and below the median of its ASPG for 2007.
Based on its review, the Board concluded that the fund's management fee was fair and reasonable in light of the services that the fund receives and the other factors considered.
In its review of each class's total expenses, the Board considered the fund's management fee as well as other fund or class expenses, as applicable, such as transfer agent fees, pricing and bookkeeping fees, fund-paid 12b-1 fees, and custodial, legal, and audit fees. The Board also noted the effects of any waivers and reimbursements on fees and expenses. As part of its review, the Board also considered current and historical total expenses of each class of the fund compared to competitive fund median expenses. Each class of the fund is compared to those funds and classes in the Total Mapped Group (used by the Board for management fee comparisons) that have a similar sales load structure.
The Board noted that the total expenses of each of Initial Class and Initial Class R ranked below its competitive median for 2007, and the total expenses of each of Investor Class R, Service Class, Service Class 2, Service Class R, and Service Class 2 R ranked above its competitive median for 2007. The Board considered that the total expenses of Investor Class R were above the median primarily due to its higher transfer agent fee. The Board noted that the fund offers multiple classes, each of which has a different 12b-1 fee structure, and that the multiple structures are intended to offer a range of pricing options for the intermediary market. The Board also noted that the total expenses of the classes vary primarily by the level of their 12b-1 fees, although differences in transfer agent fees may also cause expenses to vary from class to class.
In its review of total expenses, the Board also considered Fidelity fee structures and other information on clients that FMR and its affiliates service in other competitive markets, such as other mutual funds advised or subadvised by FMR or its affiliates, pension plan clients, and other institutional clients.
Based on its review, the Board concluded that the total expenses of each class of the fund were reasonable, although in some cases above the median of the universe presented for comparison, in light of the services that the fund and its shareholders receive and the other factors considered.
Annual Report
Costs of the Services and Profitability. The Board considered the revenues earned and the expenses incurred by Fidelity in conducting the business of developing, marketing, distributing, managing, administering and servicing the fund and its shareholders. The Board also considered the level of Fidelity's profits in respect of all the Fidelity funds.
On an annual basis, FMR presents to the Board Fidelity's profitability for the fund. Fidelity calculates the profitability for each fund, as well as aggregate profitability for groups of Fidelity funds and all Fidelity funds, using a series of detailed revenue and cost allocation methodologies which originate with the audited books and records of Fidelity. The Audit Committee of the Board reviews any significant changes from the prior year's methodologies.
PricewaterhouseCoopers LLP (PwC), independent registered public accounting firm and auditor to Fidelity and certain Fidelity funds, has been engaged annually by the Board as part of the Board's assessment of the results of Fidelity's profitability analysis. PwC's engagement includes the review and assessment of Fidelity's methodologies used in determining the revenues and expenses attributable to Fidelity's mutual fund business, and completion of agreed-upon procedures surrounding the mathematical accuracy of fund profitability and its conformity to allocation methodologies. After considering PwC's reports issued under the engagement and information provided by Fidelity, the Board believes that while other allocation methods may also be reasonable, Fidelity's profitability methodologies are reasonable in all material respects.
The Board has also reviewed Fidelity's non-fund businesses and any fall-out benefits related to the mutual fund business as well as cases where Fidelity's affiliates may benefit from or be related to the fund's business.
The Board considered the costs of the services provided by and the profits realized by Fidelity in connection with the operation of the fund and determined that the amount of profit is a fair entrepreneurial profit for the management of the fund.
Economies of Scale. The Board considered whether there have been economies of scale in respect of the management of the Fidelity funds, whether the Fidelity funds (including the fund) have appropriately benefited from any such economies of scale, and whether there is potential for realization of any further economies of scale. The Board considered the extent to which the fund will benefit from economies of scale through increased services to the fund, through waivers or reimbursements, or through fee or expense reductions.
The Board recognized that the fund's management contract incorporates a "group fee" structure, which provides for lower group fee rates as total fund assets under FMR's management increase, and for higher group fee rates as total fund assets under FMR's management decrease. FMR determines the group fee rates based on a tiered asset "breakpoint" schedule. The Board considered that the group fee is designed to deliver the benefits of economies of scale to fund shareholders when total fund assets increase, even if assets of any particular fund are unchanged or have declined, because some portion of Fidelity's costs are attributable to services provided to all Fidelity funds, and all funds benefit if those costs can be allocated among more assets. The Board concluded that, given the group fee structure, fund shareholders will achieve a certain level of economies of scale as assets under FMR's management increase at the fund complex level, regardless of whether Fidelity achieves any such economies of scale.
The Board further concluded that any potential economies of scale are being shared between fund shareholders and Fidelity in an appropriate manner.
Additional Information Requested by the Board. In order to develop fully the factual basis for consideration of the Fidelity funds' Advisory Contracts, the Board requested and received additional information on certain topics, including (i) fund performance trends and actions to be taken by FMR to improve certain funds' overall performance; (ii) portfolio manager changes that have occurred during the past year; (iii) Fidelity's fund profitability methodology, the profitability of certain fund service providers, and profitability trends for certain funds; (iv) Fidelity's compensation structure for portfolio managers and key personnel, including its effects on fund profitability and the extent to which portfolio manager compensation is linked to fund performance; (v) Fidelity's fee structures and rationale for recommending different fees among categories of funds; and (vi) Fidelity's rationale for recommending which funds should have a performance adjustment component as part of their management fees.
Based on its evaluation of all of the conclusions noted above, and after considering all material factors, the Board ultimately concluded that the advisory fee structures are fair and reasonable, and that the fund's Advisory Contracts should be renewed.
Annual Report
Investment Adviser
Fidelity Management & Research Company Boston, MA
Investment Sub-Advisers
FMR Co., Inc.
Fidelity Management & Research (U.K.) Inc.
Fidelity Research & Analysis Company
FIL Investment Advisors
FIL Investment Advisors (U.K.) Ltd.
Fidelity Investments Japan Limited
Fidelity Management & Research (Hong Kong) Limited
Fidelity Management & Research (Japan) Inc.
General Distributor
Fidelity Distributors Corporation Boston, MA
Transfer and Service Agents
Fidelity Investments Institutional Operations Company, Inc. Boston, MA
Fidelity Service Company, Inc. Boston, MA
Custodian
Brown Brothers Harriman & Co. Boston, MA
VIPCAP-ANN-0209
1.811843.104
Fidelity® Variable Insurance Products:
International Capital Appreciation Portfolio - Class R
Annual Report
December 31, 2008 (2_fidelity_logos) (Registered_Trademark)
To view a fund's proxy voting guidelines and proxy voting record for the 12-month period ended June 30, visit http://www.fidelity.com (search for "proxy voting guidelines") or visit the Securities and Exchange Commission's (SEC) web site at http://www.sec.gov. You may also call 1-877-208-0098 to request a free copy of the proxy voting guidelines.
Fidelity Variable Insurance Products are separate account options which are purchased through a variable insurance contract.
Standard & Poor's, S&P and S&P 500 are registered service marks of The McGraw-Hill Companies, Inc. and have been licensed for use by Fidelity Distributors Corporation.
Other third party marks appearing herein are the property of their respective owners.
All other marks appearing herein are registered or unregistered trademarks or service marks of FMR LLC or an affiliated company.
This report and the financial statements contained herein are submitted for the general information of the shareholders of the fund. This report is not authorized for distribution to prospective investors in the fund unless preceded or accompanied by an effective prospectus.
A fund files its complete schedule of portfolio holdings with the SEC for the first and third quarters of each fiscal year on Form N-Q. Forms N-Q are available on the SEC's web site at http://www.sec.gov. A fund's Forms N-Q may be reviewed and copied at the SEC's Public Reference Room in Washington, DC. Information regarding the operation of the SEC's Public Reference Room may be obtained by calling 1-800-SEC-0330. For a complete list of a fund's portfolio holdings, view the most recent holdings listing, semiannual report, or annual report on Fidelity's web site at http://www.fidelity.com or http://www.advisor.fidelity.com, as applicable.
NOT FDIC INSURED · MAY LOSE VALUE · NO BANK GUARANTEE
Neither the fund nor Fidelity Distributors Corporation is a bank.
Average annual total return reflects the change in the value of an investment, assuming reinvestment of a class' dividend income and capital gains (the profits earned upon the sale of securities that have grown in value, if any) and assuming a constant rate of performance each year. During periods of reimbursement by Fidelity, a fund's total return will be greater than it would be had the reimbursement not occurred. Performance numbers are net of all underlying fund operating expenses, but do not include any insurance charges imposed by your insurance company's separate account. If performance information included the effect of these additional charges, the total returns would be lower. How a fund did yesterday is no guarantee of how it will do tomorrow.
Average Annual Total Returns
Periods ended December 31, 2008
Past 1 year
Life of fundA
VIP International Capital Appreciation - Initial Class
-50.69%
-9.03%
VIP International Capital Appreciation - Service Class
-50.64%
-9.09%
VIP International Capital Appreciation - Service Class 2
-50.73%
-9.22%
VIP International Capital Appreciation - Initial Class R
-50.60%
-8.99%
VIP International Capital Appreciation - Service Class R
-50.64%
-9.09%
VIP International Capital Appreciation - Service Class 2R
-50.73%
-9.22%
VIP International Capital Appreciation - Investor Class R B
-50.65%
-9.08%
A From December 22, 2004.
B The initial offering of Investor Class R shares took place on July 21, 2005. Returns prior to July 21, 2005 are those of Initial Class R. If Investor Class R's transfer agent fee had been reflected, returns prior to July 21, 2005 would have been lower.
$10,000 Over Life of Fund
Let's say hypothetically that $10,000 was invested in VIP International Capital Appreciation Portfolio - Initial Class R on December 22, 2004, when the fund started. The chart shows how the value of your investment would have changed, and also shows how the MSCI® ACWI (All Country World Index) ex USA Index performed over the same period.
Comments from Sammy Simnegar, Portfolio Manager of VIP International Capital Appreciation Portfolio
By year-end 2008, the vicious credit crisis sparked in the U.S. had spread like wildfire across the world's capital markets, stunting global growth, toppling commodity prices, changing the face of the global financial system, and chasing risk-averse investors toward the sidelines. The U.S. equity markets, as measured by the Dow Jones Industrial AverageSM and Standard & Poor's 500SM Index, fell hard as a result, declining 31.93% and 37.00%, respectively, while the technology-laden NASDAQ Composite® Index slid 40.03%. Foreign market stocks saw an even sharper decline, as illustrated by the 43.28% loss of the MSCI® EAFE® Index (Europe, Australasia, Far East), a gauge of developed stock markets outside the U.S. and Canada. A generally stronger U.S. dollar also held back returns for U.S. investors in foreign equities. Emerging-markets stocks - the global performance leader only a year ago - fell harder still, dropping 53.18%, as measured by the MSCI Emerging Markets Index. The only clear winners during the past year were assets backed by the U.S. government, as investors fled from risk. Thus, the Barclays Capital U.S. Treasury Bond Index climbed 13.74% for the year, while the Barclays Capital U.S. Aggregate Bond Index - a broader measure of the U.S. investment-grade bond universe - gained a more modest 5.24%. By contrast, high-yield bonds bore the brunt of investors' increasing wariness over risk, as expressed by the Merrill Lynch® U.S. High Yield Master II Constrained Index's drop of 26.11%. The emerging-markets bond category also felt the shock of investors' risk-averse sentiment, with the JPMorgan Emerging Markets Bond Index (EMBI) Global falling 10.91%. Meanwhile, the Citigroup® Non-U.S. Group of 7 Index - representing the debt performance of major global economies, excluding the United States - eked out a 1.69% gain.
The fund underperformed the MSCI All Country World ex USA Index, which fell 45.45% for the year (For specific portfolio results, please refer to the performance section of this report). Many of the fund's stock picks within the volatile financials, energy and materials sectors were big detractors, as were some of its holdings in consumer discretionary and information technology. Three of our five biggest relative detractors were materials stocks, which as a group were hurt by falling commodity prices. Among them were out-of-index positions in two Canadian mining stocks - Mercator Minerals and Consolidated Thompson Iron Mines, both of which were sold by period end - as well as a stake in Vedanta Resources, a London-based mining company with operations in India. Also detracting was a position - since sold - in Gazprom, the big Russian natural gas producer, whose earnings fell as energy prices collapsed. On the plus side, some of the fund's holdings in the more defensively oriented consumer staples and health care sectors did well versus the index, as did some of our Japanese holdings, which also benefited from favorable currency movements. A moderate position in cash helped as well. Among the fund's top contributors were passenger rail operator East Japan Railway, Swiss consumer staples manufacturer Nestle and Rio Tinto, a London-based mining company, which helped the fund mainly because we were underweighted in this hard-hit stock.
The views expressed above reflect those of the portfolio manager(s) only through the end of the period as stated on the cover of this report and do not necessarily represent the views of Fidelity or any other person in the Fidelity organization. Any such views are subject to change at any time based upon market or other conditions and Fidelity disclaims any responsibility to update such views. These views may not be relied on as investment advice and, because investment decisions for a Fidelity fund are based on numerous factors, may not be relied on as an indication of trading intent on behalf of any Fidelity fund.
As a shareholder of the Fund, you incur two types of costs: (1) transaction costs, including redemption fees, and (2) ongoing costs, including management fees, distribution and/or service (12b-1) fees and other Fund expenses. This Example is intended to help you understand your ongoing costs (in dollars) of investing in the Fund and to compare these costs with the ongoing costs of investing in other mutual funds.
The Example is based on an investment of $1,000 invested at the beginning of the period and held for the entire period (July 1, 2008 to December 31, 2008).
Actual Expenses
The first line of the accompanying table for each class of the Fund provides information about actual account values and actual expenses. You may use the information in this line, together with the amount you invested, to estimate the expenses that you paid over the period. Simply divide your account value by $1,000.00 (for example, an $8,600 account value divided by $1,000.00 = 8.6), then multiply the result by the number in the first line for a class of the Fund under the heading entitled "Expenses Paid During Period" to estimate the expenses you paid on your account during this period. The estimate of expenses does not include any fees or other expenses of any variable annuity or variable life insurance product. If they were, the estimate of expenses you paid during the period would be higher, and your ending account value would be lower. In addition, the Fund, as a shareholder in the underlying Fidelity Central Funds, will indirectly bear its pro rata share of the fees and expenses incurred by the underlying Fidelity Central Funds. These fees and expenses are not included in the Fund's annualized expense ratio used to calculate the expense estimate in the table below.
Hypothetical Example for Comparison Purposes
The second line of the accompanying table for each class of the Fund provides information about hypothetical account values and hypothetical expenses based on a Class' actual expense ratio and an assumed rate of return of 5% per year before expenses, which is not the Class' actual return. The hypothetical account values and expenses may not be used to estimate the actual ending account balance or expenses you paid for the period. You may use this information to compare the ongoing costs of investing in the Fund and other funds. To do so, compare this 5% hypothetical example with the 5% hypothetical examples that appear in the shareholder reports of the other funds. The estimate of expenses does not include any fees or other expenses of any variable annuity or variable life insurance product. If they were, the estimate of expenses you paid during the period would be higher, and your ending account value would be lower. In addition, the Fund, as a shareholder in the underlying Fidelity Central Funds, will indirectly bear its pro rata share of the fees and expenses incurred by the underlying Fidelity Central Funds. These fees and expenses are not included in the Fund's annualized expense ratio used to calculate the expense estimate in the table below.
Please note that the expenses shown in the table are meant to highlight your ongoing costs only and do not reflect any transaction costs. Therefore, the second line of the table is useful in comparing ongoing costs only, and will not help you determine the relative total costs of owning different funds. In addition, if these transactional costs were included, your costs would have been higher.
Annualized Expense Ratio
Beginning Account Value July 1, 2008
Ending Account Value December 31, 2008
Expenses Paid During Period* July 1, 2008 to December 31, 2008
Initial Class
1.10%
Actual
$ 1,000.00
$ 548.40
$ 4.28
HypotheticalA
$ 1,000.00
$ 1,019.61
$ 5.58
Service Class
1.20%
Actual
$ 1,000.00
$ 548.90
$ 4.67
HypotheticalA
$ 1,000.00
$ 1,019.10
$ 6.09
Service Class 2
1.35%
Actual
$ 1,000.00
$ 548.50
$ 5.25
HypotheticalA
$ 1,000.00
$ 1,018.35
$ 6.85
Initial Class R
1.10%
Actual
$ 1,000.00
$ 549.40
$ 4.28
HypotheticalA
$ 1,000.00
$ 1,019.61
$ 5.58
Service Class R
1.20%
Actual
$ 1,000.00
$ 548.90
$ 4.67
HypotheticalA
$ 1,000.00
$ 1,019.10
$ 6.09
Service Class 2R
1.35%
Actual
$ 1,000.00
$ 548.50
$ 5.25
HypotheticalA
$ 1,000.00
$ 1,018.35
$ 6.85
Investor Class R
1.18%
Actual
$ 1,000.00
$ 549.00
$ 4.59
HypotheticalA
$ 1,000.00
$ 1,019.20
$ 5.99
A 5% return per year before expenses
* Expenses are equal to each Class' annualized expense ratio, multiplied by the average account value over the period, multiplied by 184/366 (to reflect the one-half year period).
Annual Report
Investment Changes (Unaudited)
Geographic Diversification (% of fund's net assets)
As of December 31, 2008
Japan
17.0%
United Kingdom
14.7%
United States of America
11.1%
Canada
8.0%
France
7.8%
Germany
6.7%
Switzerland
5.5%
Spain
2.7%
Italy
2.6%
Other
23.9%
Percentages are adjusted for the effect of futures contracts, if applicable.
As of June 30, 2008
United Kingdom
13.8%
Japan
12.2%
Canada
11.7%
Germany
10.2%
France
5.8%
Italy
4.6%
United States of America
4.5%
Switzerland
3.8%
India
3.0%
Other
30.4%
Percentages are adjusted for the effect of futures contracts, if applicable.
Telefonica SA (Spain, Diversified Telecommunication Services)
1.9
1.8
Siemens AG sponsored ADR (Germany, Industrial Conglomerates)
1.8
0.0
Mitsubishi UFJ Financial Group, Inc. sponsored ADR (Japan, Commercial Banks)
1.8
0.0
UBS AG (NY Shares) (Switzerland, Capital Markets)
1.7
0.0
GDF Suez (France, Multi-Utilities)
1.7
0.0
Allianz AG (Reg.) (Germany, Insurance)
1.6
2.0
19.2
Market Sectors as of December 31, 2008
% of fund's net assets
% of fund's net assets 6 months ago
Financials
28.6
18.3
Industrials
14.1
13.9
Materials
10.7
12.4
Consumer Staples
9.2
8.9
Energy
8.1
12.6
Health Care
6.7
3.1
Consumer Discretionary
5.8
9.5
Telecommunication Services
5.7
5.8
Utilities
4.9
6.5
Information Technology
4.4
6.3
Annual Report
Investments December 31, 2008
Showing Percentage of Net Assets
Common Stocks - 96.3%
Shares
Value
Australia - 1.0%
CSL Ltd.
9,873
$ 237,482
Belgium - 1.2%
Anheuser-Busch InBev NV
12,700
296,336
Brazil - 2.5%
Companhia Vale do Rio Doce (PN-A) sponsored ADR
29,100
309,915
Petroleo Brasileiro SA - Petrobras (PN) sponsored ADR (non-vtg.)
13,600
277,576
TOTAL BRAZIL
587,491
Canada - 8.0%
Absolute Software Corp. (a)
47,400
128,950
Agnico-Eagle Mines Ltd.
5,900
304,383
Canadian Natural Resources Ltd.
6,600
264,445
EnCana Corp.
5,900
276,209
Goldcorp, Inc.
9,300
293,439
Research In Motion Ltd. (a)
5,300
215,074
Suncor Energy, Inc.
13,400
261,238
Teck Cominco Ltd. Class B (sub. vtg.)
33,600
166,246
TOTAL CANADA
1,909,984
Cayman Islands - 2.0%
Suntech Power Holdings Co. Ltd. sponsored ADR (a)(d)
39,900
466,830
Czech Republic - 0.6%
Ceske Energeticke Zavody AS
3,200
130,644
Denmark - 2.1%
Novo Nordisk AS Series B
3,500
181,419
Vestas Wind Systems AS (a)
5,400
319,314
TOTAL DENMARK
500,733
France - 7.8%
Alstom SA
4,700
281,425
AXA SA
14,300
322,497
BNP Paribas SA
7,700
333,945
GDF Suez
7,900
402,232
Saft Groupe SA
6,600
179,696
Societe Generale Series A
6,500
331,330
TOTAL FRANCE
1,851,125
Germany - 6.7%
Adidas-Salomon AG
4,900
192,236
Allianz AG (Reg.)
3,500
379,049
E.ON AG
8,100
332,999
Q-Cells SE (a)(d)
7,200
263,318
Siemens AG sponsored ADR
5,700
431,775
TOTAL GERMANY
1,599,377
Greece - 1.2%
Public Power Corp. of Greece
17,500
282,583
Shares
Value
Hong Kong - 2.2%
China Mobile (Hong Kong) Ltd. sponsored ADR
5,100
$ 259,335
CNOOC Ltd.
271,000
257,764
TOTAL HONG KONG
517,099
India - 1.5%
Bharti Airtel Ltd. (a)
7,971
117,608
ICICI Bank Ltd. sponsored ADR (d)
12,700
244,475
Rural Electrification Corp. Ltd.
3,032
4,584
TOTAL INDIA
366,667
Ireland - 1.7%
CRH PLC sponsored ADR
10,300
268,109
Dragon Oil PLC (a)
52,401
123,894
TOTAL IRELAND
392,003
Israel - 0.9%
Teva Pharmaceutical Industries Ltd. sponsored ADR
4,900
208,593
Italy - 2.0%
Intesa Sanpaolo SpA
70,300
256,591
UniCredit SpA
82,800
211,521
TOTAL ITALY
468,112
Japan - 17.0%
Canon Marketing Japan, Inc.
13,200
212,384
Canon, Inc. sponsored ADR
6,200
194,680
East Japan Railway Co.
32
264,163
Hisamitsu Pharmaceutical Co., Inc.
4,800
196,051
Honda Motor Co. Ltd. sponsored ADR
9,700
206,998
Japan Retail Fund Investment Corp.
73
315,052
Japan Tobacco, Inc.
60
198,576
Keyence Corp.
600
123,205
Mitsubishi Corp.
18,100
256,158
Mitsubishi UFJ Financial Group, Inc. sponsored ADR
68,621
426,136
Mitsui & Co. Ltd.
26,000
267,069
NGK Insulators Ltd.
10,000
113,224
Nomura Holdings, Inc. sponsored ADR (d)
29,100
242,985
ORIX Corp.
4,040
230,497
SHIMANO, Inc.
3,300
129,803
Sumitomo Mitsui Financial Group, Inc.
66
297,327
Terumo Corp.
5,000
234,034
Tsumura & Co.
4,100
152,058
TOTAL JAPAN
4,060,400
Luxembourg - 1.1%
Evraz Group SA GDR
15,400
132,440
Millicom International Cellular SA
2,800
125,748
TOTAL LUXEMBOURG
258,188
Netherlands - 1.3%
Unilever NV (NY Shares)
13,000
319,150
Common Stocks - continued
Shares
Value
Norway - 1.0%
Renewable Energy Corp. AS (a)(d)
25,200
$ 242,968
South Africa - 1.2%
MTN Group Ltd.
25,500
295,691
Spain - 2.7%
Grifols SA
10,820
190,485
Telefonica SA
20,300
460,381
TOTAL SPAIN
650,866
Switzerland - 5.5%
Credit Suisse Group sponsored ADR (d)
10,300
291,078
Nestle SA (Reg.)
15,660
618,680
UBS AG (NY Shares)
28,600
408,980
TOTAL SWITZERLAND
1,318,738
Taiwan - 0.7%
HTC Corp.
16,000
159,634
Turkey - 0.4%
Tupras-Turkiye Petrol Rafinerileri AS
9,000
94,645
United Kingdom - 14.7%
BG Group PLC
20,700
290,815
BHP Billiton PLC
25,300
498,063
British Airways PLC
45,600
122,335
British American Tobacco PLC (United Kingdom)
11,400
301,847
HSBC Holdings PLC sponsored ADR (d)
9,700
472,099
Imperial Tobacco Group PLC
9,400
254,846
Informa PLC
34,800
124,974
Man Group PLC
70,250
245,293
Prudential PLC
44,760
275,776
Reckitt Benckiser Group PLC
5,700
216,785
Rio Tinto PLC (Reg.)
9,500
214,317
Standard Chartered PLC (United Kingdom)
21,100
274,043
Vedanta Resources PLC (d)
24,200
220,564
TOTAL UNITED KINGDOM
3,511,757
United States of America - 9.3%
Citigroup, Inc.
26,200
175,802
D.R. Horton, Inc.
21,000
148,470
First Solar, Inc. (a)
1,000
137,960
Goldman Sachs Group, Inc.
3,200
270,048
JPMorgan Chase & Co.
6,500
204,945
MasterCard, Inc. Class A
800
114,344
Medco Health Solutions, Inc. (a)
4,370
183,147
Meritage Homes Corp. (a)
20,196
245,785
Morgan Stanley
17,000
272,680
SL Green Realty Corp.
13,300
344,470
Visa, Inc.
2,200
115,390
TOTAL UNITED STATES OF AMERICA
2,213,041
TOTAL COMMON STOCKS
(Cost $28,206,061)
22,940,137
Nonconvertible Preferred Stocks - 0.6%
Shares
Value
Italy - 0.6%
Fiat SpA (Risp) (Cost $145,291)
30,800
$ 137,952
Nonconvertible Bonds - 1.3%
Principal Amount
Luxembourg - 1.3%
Evraz Group SA 8.875% 4/24/13 (e)
$ 250,000
126,250
TNK-BP Finance SA 7.5% 3/13/13 (Reg. S)
100,000
63,000
Vimpel Communications 8.375% 4/30/13 (Issued by VIP Finance Ireland Ltd. for Vimpel Communications) (e)
200,000
124,000
TOTAL NONCONVERTIBLE BONDS
(Cost $260,142)
313,250
Money Market Funds - 8.3%
Shares
Fidelity Cash Central Fund, 1.06% (b)
603,076
603,076
Fidelity Securities Lending Cash Central Fund, 0.87% (b)(c)
1,378,832
1,378,832
TOTAL MONEY MARKET FUNDS
(Cost $1,981,908)
1,981,908
TOTAL INVESTMENT PORTFOLIO - 106.5%
(Cost $30,593,402)
25,373,247
NET OTHER ASSETS - (6.5)%
(1,544,705)
NET ASSETS - 100%
$ 23,828,542
Legend
(a) Non-income producing
(b) Affiliated fund that is available only to investment companies and other accounts managed by Fidelity Investments. The rate quoted is the annualized seven-day yield of the fund at period end. A complete unaudited listing of the fund's holdings as of its most recent quarter end is available upon request.
(c) Investment made with cash collateral received from securities on loan.
(d) Security or a portion of the security is on loan at period end.
(e) Security exempt from registration under Rule 144A of the Securities Act of 1933. These securities may be resold in transactions exempt from registration, normally to qualified institutional buyers. At the end of the period, the value of these securities amounted to $ 250,250 or 1.1% of net assets.
Affiliated Central Funds
Information regarding fiscal year to date income earned by the Fund from investments in Fidelity Central Funds is as follows:
Fund
Income earned
Fidelity Cash Central Fund
$ 26,125
Fidelity Securities Lending Cash Central Fund
46,336
Total
$ 72,461
Other Information
The following is a summary of the inputs used, as of December 31, 2008, involving the Fund's assets carried at value. The inputs or methodology used for valuing securities may not be an indication of the risk associated with investing in those securities. For more information on valuation inputs, and their aggregation into the levels used in the tables below, please refer to the Security Valuation section in the accompanying Notes to Financial Statements.
Valuation Inputs at Reporting Date:
Description
Total
Level 1
Level 2
Level 3
Investments in Securities
$ 25,373,247
$ 11,776,758
$ 13,034,999
$ 561,490
The following is a reconciliation of assets for which Level 3 inputs were used in determining value:
Investments in Securities
Beginning Balance
$ -
Total Realized Gain (Loss)
(63,782)
Total Unrealized Gain (Loss)
(192,143)
Cost of Purchases
1,366,819
Proceeds of Sales
(986,803)
Amortization/Accretion
-
Transfer in/out of Level 3
437,399
Ending Balance
$ 561,490
The information used in the above reconciliation represents fiscal year to date activity for any Investment Securities identified as using Level 3 inputs at either the beginning or the end of the current fiscal period. Transfers in or out of Level 3 represents either the beginning value (for transfers in), or the ending value (for transfers out) of any Security or Instrument where a change in the pricing level occurred from the beginning to the end of the period.
Income Tax Information
At December 31, 2008, the fund had a capital loss carryforward of approximately $20,462,362 all of which will expire on December 31, 2016.
The fund intends to elect to defer to its fiscal year ending December 31, 2009 approximately $6,910,998 of losses recognized during the period November 1, 2008 to December 31, 2008.
See accompanying notes which are an integral part of the financial statements.
Investment in securities, at value (including securities loaned of $1,327,299) - See accompanying schedule:
Unaffiliated issuers (cost $28,611,494)
$ 23,391,339
Fidelity Central Funds (cost $1,981,908)
1,981,908
Total Investments (cost $30,593,402)
$ 25,373,247
Receivable for fund shares sold
31,796
Dividends receivable
81,829
Interest receivable
9,205
Distributions receivable from Fidelity Central Funds
7,481
Prepaid expenses
318
Receivable from investment adviser for expense reductions
15,130
Other receivables
53,386
Total assets
25,572,392
Liabilities
Payable for investments purchased
$ 285,238
Payable for fund shares redeemed
2,016
Accrued management fee
13,339
Distribution fees payable
117
Other affiliated payables
3,124
Other payables and accrued expenses
61,184
Collateral on securities loaned, at value
1,378,832
Total liabilities
1,743,850
Net Assets
$ 23,828,542
Net Assets consist of:
Paid in capital
$ 57,883,683
Undistributed net investment income
5,642
Accumulated undistributed net realized gain (loss) on investments and foreign currency transactions
(28,849,419)
Net unrealized appreciation (depreciation) on investments and assets and liabilities in foreign currencies
(5,211,364)
Net Assets
$ 23,828,542
Statement of Assets and Liabilities - continued
December 31, 2008
Initial Class: Net Asset Value, offering price and redemption price per share ($387,663 ÷ 69,045 shares)
$ 5.61
Service Class: Net Asset Value, offering price and redemption price per share ($134,813 ÷ 24,050 shares)
$ 5.61
Service Class 2: Net Asset Value, offering price and redemption price per share ($301,837 ÷ 53,938 shares)
$ 5.60
Initial Class R: Net Asset Value, offering price and redemption price per share ($8,482,621 ÷ 1,510,582 shares)
$ 5.62
Service Class R: Net Asset Value, offering price and redemption price per share ($134,812 ÷ 24,050 shares)
$ 5.61
Service Class 2R: Net Asset Value, offering price and redemption price per share ($178,644 ÷ 31,927 shares)
$ 5.60
Investor Class R: Net Asset Value, offering price and redemption price per share ($14,208,152 ÷ 2,539,010 shares)
$ 5.60
See accompanying notes which are an integral part of the financial statements.
Annual Report
Statement of Operations
Year ended December 31, 2008
Investment Income
Dividends
$ 1,239,541
Interest
13,608
Income from Fidelity Central Funds
72,461
1,325,610
Less foreign taxes withheld
(126,223)
Total income
1,199,387
Expenses
Management fee
$ 332,126
Transfer agent fees
64,485
Distribution fees
2,854
Accounting and security lending fees
24,720
Custodian fees and expenses
206,567
Independent trustees' compensation
234
Audit
59,389
Legal
358
Miscellaneous
5,131
Total expenses before reductions
695,864
Expense reductions
(251,100)
444,764
Net investment income (loss)
754,623
Realized and Unrealized Gain (Loss)
Net realized gain (loss) on:
Investment securities:
Unaffiliated issuers
(24,807,587)
Foreign currency transactions
(105,532)
Total net realized gain (loss)
(24,913,119)
Change in net unrealized appreciation (depreciation) on:
Investment securities (net of decrease in deferred foreign taxes of $19,180)
(5,468,641)
Assets and liabilities in foreign currencies
7,688
Total change in net unrealized appreciation (depreciation)
(5,460,953)
Net gain (loss)
(30,374,072)
Net increase (decrease) in net assets resulting from operations
$ (29,619,449)
Statement of Changes in Net Assets
Year ended December 31, 2008
Year ended December 31, 2007
Increase (Decrease) in Net Assets
Operations
Net investment income (loss)
$ 754,623
$ 507,872
Net realized gain (loss)
(24,913,119)
5,112,624
Change in net unrealized appreciation (depreciation)
(5,460,953)
(4,352,834)
Net increase (decrease) in net assets resulting from operations
(29,619,449)
1,267,662
Distributions to shareholders from net investment income
-
(488,571)
Distributions to shareholders from net realized gain
(328,342)
(9,900,180)
Total distributions
(328,342)
(10,388,751)
Share transactions - net increase (decrease)
(20,630,488)
38,585,498
Redemption fees
5,532
18,995
Total increase (decrease) in net assets
(50,572,747)
29,483,404
Net Assets
Beginning of period
74,401,289
44,917,885
End of period (including undistributed net investment income of $5,642 and distributions in excess of net investment income of $2,078, respectively)
$ 23,828,542
$ 74,401,289
See accompanying notes which are an integral part of the financial statements.
Annual Report
Financial Highlights - Initial Class
Years ended December 31,
2008
2007
2006
2005
2004 I
Selected Per-Share Data
Net asset value, beginning of period
$ 11.44
$ 12.68
$ 11.46
$ 10.24
$ 10.00
Income from Investment Operations
Net investment income (loss) E
.15
.11 H
.11
.06
- K
Net realized and unrealized gain (loss)
(5.92)
.53
1.54
1.21
.24
Total from investment operations
(5.77)
.64
1.65
1.27
.24
Distributions from net investment income
-
(.09)
(.10)
(.02)
-
Distributions from net realized gain
(.06)
(1.79)
(.34)
(.02)
-
Total distributions
(.06)
(1.88)
(.43) M
(.05) L
-
Redemption fees added to paid in capital E
- K
- K
- K
- K
-
Net asset value, end of period
$ 5.61
$ 11.44
$ 12.68
$ 11.46
$ 10.24
Total Return B,C,D
(50.69)%
5.17%
14.49%
12.37%
2.40%
Ratios to Average Net Assets F, J
Expenses before reductions
1.54%
1.20%
1.80%
3.55%
43.27% A
Expenses net of fee waivers, if any
1.10%
1.10%
1.10%
1.10%
1.10% A
Expenses net of all reductions
.91%
1.07%
1.00%
91%
92% A
Net investment income (loss)
1.65%
.82% H
.95%
.53%
.80% A
Supplemental Data
Net assets, end of period (000 omitted)
$ 388
$ 1,409
$ 1,357
$ 9,367
$ 307
Portfolio turnover rate G
350%
224%
185%
176%
52% A
A Annualized BTotal returns for periods of less than one year are not annualized. CTotal returns do not reflect charges attributable to your insurance company's separate account. Inclusion of these charges would reduce the total returns shown. DTotal returns would have been lower had certain expenses not been reduced during the periods shown. ECalculated based on average shares outstanding during the period. FFees and expenses of the underlying Fidelity Central Funds are not included in the Fund's expense ratio. The Fund indirectly bears its proportionate share of the expenses of any underlying Fidelity Central Funds. GAmount does not include the portfolio activity of any underlying Fidelity Central Funds. HInvestment income per share reflects a special dividend which amounted to $.02 per share. Excluding the special dividend, the ratio of net investment income (loss) to average net assets would have been .68%. IFor the period December 22, 2004 (commencement of operations) to December 31, 2004. JExpense ratios reflect operating expenses of the class. Expenses before reductions do not reflect amounts reimbursed by the investment adviser or reductions from brokerage service arrangements or other expense offset arrangements and do not represent the amount paid by the class during periods when reimbursements or reductions occur. Expense ratios before reductions for start-up periods may not be representative of longer-term operating periods. Expenses net of fee waivers reflect expenses after reimbursement by the investment adviser but prior to reductions from brokerage service arrangements or other expense offset arrangements. Expenses net of all reductions represent the net expenses paid by the class. KAmount represents less than $.01 per share. LTotal distributions of $.05 per share is comprised of distributions from net investment income of $.022 and distributions from net realized gain of $.023 per share. MTotal distributions of $.43 per share is comprised of distributions from net investment income of $.095 and distributions from net realized gain of $.335 per share.
Financial Highlights - Service Class
Years ended December 31,
2008
2007
2006
2005
2004 I
Selected Per-Share Data
Net asset value, beginning of period
$ 11.43
$ 12.67
$ 11.46
$ 10.24
$ 10.00
Income from Investment Operations
Net investment income (loss) E
.14
.10 H
.10
.10
- K
Net realized and unrealized gain (loss)
(5.90)
.53
1.53
1.16
.24
Total from investment operations
(5.76)
.63
1.63
1.26
.24
Distributions from net investment income
-
(.08)
(.08)
(.01)
-
Distributions from net realized gain
(.06)
(1.79)
(.34)
(.02)
-
Total distributions
(.06)
(1.87)
(.42) M
(.04) L
-
Redemption fees added to paid in capital E
- K
- K
- K
- K
-
Net asset value, end of period
$ 5.61
$ 11.43
$ 12.67
$ 11.46
$ 10.24
Total Return B,C,D
(50.64)%
5.06%
14.30%
12.27%
2.40%
Ratios to Average Net Assets F, J
Expenses before reductions
1.51%
1.20%
1.62%
4.35%
43.36% A
Expenses net of fee waivers, if any
1.20%
1.20%
1.20%
1.20%
1.20% A
Expenses net of all reductions
1.01%
1.16%
1.10%
1.01%
1.01% A
Net investment income (loss)
1.55%
.72% H
.85%
.98%
.71% A
Supplemental Data
Net assets, end of period (000 omitted)
$ 135
$ 414
$ 394
$ 345
$ 307
Portfolio turnover rate G
350%
224%
185%
176%
52% A
A Annualized B Total returns for periods of less than one year are not annualized. C Total returns do not reflect charges attributable to your insurance company's separate account. Inclusion of these charges would reduce the total returns shown. D Total returns would have been lower had certain expenses not been reduced during the periods shown. E Calculated based on average shares outstanding during the period. F Fees and expenses of the underlying Fidelity Central Funds are not included in the Fund's expense ratio. The Fund indirectly bears its proportionate share of the expenses of any underlying Fidelity Central Funds. G Amount does not include the portfolio activity of any underlying Fidelity Central Funds. H Investment income per share reflects a special dividend which amounted to $.02 per share. Excluding the special dividend, the ratio of net investment income (loss) to average net assets would have been .58%. I For the period December 22, 2004 (commencement of operations) to December 31, 2004. J Expense ratios reflect operating expenses of the class. Expenses before reductions do not reflect amounts reimbursed by the investment adviser or reductions from brokerage service arrangements or other expense offset arrangements and do not represent the amount paid by the class during periods when reimbursements or reductions occur. Expense ratios before reductions for start-up periods may not be representative of longer-term operating periods. Expenses net of fee waivers reflect expenses after reimbursement by the investment adviser but prior to reductions from brokerage service arrangements or other expense offset arrangements. Expenses net of all reductions represent the net expenses paid by the class. K Amount represents less than $.01 per share. L Total distributions of $.04 per share is comprised of distributions from net investment income of $.012 and distributions from net realized gain of $.023 per share. M Total distributions of $.42 per share is comprised of distributions from net investment income of $.084 and distributions from net realized gain of $.335 per share.
See accompanying notes which are an integral part of the financial statements.
Annual Report
Financial Highlights - Service Class 2
Years ended December 31,
2008
2007
2006
2005
2004 I
Selected Per-Share Data
Net asset value, beginning of period
$ 11.43
$ 12.67
$ 11.46
$ 10.24
$ 10.00
Income from Investment Operations
Net investment income (loss) E
.12
.08 H
.08
.09
- K
Net realized and unrealized gain (loss)
(5.89)
.53
1.53
1.15
.24
Total from investment operations
(5.77)
.61
1.61
1.24
.24
Distributions from net investment income
-
(.06)
(.07)
-
-
Distributions from net realized gain
(.06)
(1.79)
(.34)
(.02)
-
Total distributions
(.06)
(1.85)
(.40) M
(.02) L
-
Redemption fees added to paid in capital E
- K
- K
- K
- K
-
Net asset value, end of period
$ 5.60
$ 11.43
$ 12.67
$ 11.46
$ 10.24
Total Return B, C, D
(50.73)%
4.89%
14.14%
12.12%
2.40%
Ratios to Average Net Assets F, J
Expenses before reductions
1.79%
1.41%
1.77%
4.50%
43.51% A
Expenses net of fee waivers, if any
1.35%
1.35%
1.35%
1.35%
1.35% A
Expenses net of all reductions
1.16%
1.32%
1.25%
1.16%
1.17% A
Net investment income (loss)
1.40%
.57% H
.70%
.83%
.55% A
Supplemental Data
Net assets, end of period (000 omitted)
$ 302
$ 550
$ 524
$ 459
$ 410
Portfolio turnover rate G
350%
224%
185%
176%
52% A
A Annualized B Total returns for periods of less than one year are not annualized. C Total returns do not reflect charges attributable to your insurance company's separate account. Inclusion of these charges would reduce the total returns shown. D Total returns would have been lower had certain expenses not been reduced during the periods shown. E Calculated based on average shares outstanding during the period. F Fees and expenses of the underlying Fidelity Central Funds are not included in the Fund's expense ratio. The Fund indirectly bears its proportionate share of the expenses of any underlying Fidelity Central Funds. G Amount does not include the portfolio activity of any underlying Fidelity Central Funds. H Investment income per share reflects a special dividend which amounted to $.02 per share. Excluding the special dividend, the ratio of net investment income (loss) to average net assets would have been .43%. I For the period December 22, 2004 (commencement of operations) to December 31, 2004. J Expense ratios reflect operating expenses of the class. Expenses before reductions do not reflect amounts reimbursed by the investment adviser or reductions from brokerage service arrangements or other expense offset arrangements and do not represent the amount paid by the class during periods when reimbursements or reductions occur. Expense ratios before reductions for start-up periods may not be representative of longer-term operating periods. Expenses net of fee waivers reflect expenses after reimbursement by the investment adviser but prior to reductions from brokerage service arrangements or other expense offset arrangements. Expenses net of all reductions represent the net expenses paid by the class. K Amount represents less than $.01 per share. L Total distributions of $.02 per share is comprised of distributions from net investment income of $.000 and distributions from net realized gain of $.020 per share. MTotal distributions of $.40 per share is comprised of distributions from net investment income of $.066 and distributions from net realized gain of $.335 per share.
Financial Highlights - Initial Class R
Years ended December 31,
2008
2007
2006
2005
2004 I
Selected Per-Share Data
Net asset value, beginning of period
$ 11.44
$ 12.68
$ 11.46
$ 10.24
$ 10.00
Income from Investment Operations
Net investment income (loss) E
.15
.11 H
.11
.11
- K
Net realized and unrealized gain (loss)
(5.91)
.53
1.54
1.16
.24
Total from investment operations
(5.76)
.64
1.65
1.27
.24
Distributions from net investment income
-
(.09)
(.10)
(.02)
-
Distributions from net realized gain
(.06)
(1.79)
(.34)
(.02)
-
Total distributions
(.06)
(1.88)
(.43) M
(.05) L
-
Redemption fees added to paid in capital E
- K
- K
- K
- K
-
Net asset value, end of period
$ 5.62
$ 11.44
$ 12.68
$ 11.46
$ 10.24
Total Return B,C,D
(50.60)%
5.17%
14.50%
12.37%
2.40%
Ratios to Average Net Assets F, J
Expenses before reductions
1.44%
1.11%
1.46%
4.25%
43.27% A
Expenses net of fee waivers, if any
1.10%
1.10%
1.10%
1.10%
1.10% A
Expenses net of all reductions
.91%
1.06%
1.00%
.91%
.92% A
Net investment income (loss)
1.65%
.82% H
.95%
1.08%
.80% A
Supplemental Data
Net assets, end of period (000 omitted)
$ 8,483
$ 32,345
$ 17,219
$ 345
$ 307
Portfolio turnover rate G
350%
224%
185%
176%
52% A
A Annualized B Total returns for periods of less than one year are not annualized. C Total returns do not reflect charges attributable to your insurance company's separate account. Inclusion of these charges would reduce the total returns shown. D Total returns would have been lower had certain expenses not been reduced during the periods shown. E Calculated based on average shares outstanding during the period. F Fees and expenses of the underlying Fidelity Central Funds are not included in the Fund's expense ratio. The Fund indirectly bears its proportionate share of the expenses of any underlying Fidelity Central Funds. G Amount does not include the portfolio activity of any underlying Fidelity Central Funds. H Investment income per share reflects a special dividend which amounted to $.02 per share. Excluding the special dividend, the ratio of net investment income (loss) to average net assets would have been .68%. I For the period December 22, 2004 (commencement of operations) to December 31, 2004. J Expense ratios reflect operating expenses of the class. Expenses before reductions do not reflect amounts reimbursed by the investment adviser or reductions from brokerage service arrangements or other expense offset arrangements and do not represent the amount paid by the class during periods when reimbursements or reductions occur. Expense ratios before reductions for start-up periods may not be representative of longer-term operating periods. Expenses net of fee waivers reflect expenses after reimbursement by the investment adviser but prior to reductions from brokerage service arrangements or other expense offset arrangements. Expenses net of all reductions represent the net expenses paid by the class. K Amount represents less than $.01 per share. L Total distributions of $.05 per share is comprised of distributions from net investment income of $.022 and distributions from net realized gain of $.023 per share. M Total distributions of $.43 per share is comprised of distributions from net investment income of $.096 and distributions from net realized gain of $.335 per share.
See accompanying notes which are an integral part of the financial statements.
Annual Report
Financial Highlights - Service Class R
Years ended December 31,
2008
2007
2006
2005
2004 I
Selected Per-Share Data
Net asset value, beginning of period
$ 11.43
$ 12.67
$ 11.46
$ 10.24
$ 10.00
Income from Investment Operations
Net investment income (loss) E
.14
.10 H
.10
.10
- K
Net realized and unrealized gain (loss)
(5.90)
.53
1.53
1.16
.24
Total from investment operations
(5.76)
.63
1.63
1.26
.24
Distributions from net investment income
-
(.08)
(.08)
(.01)
-
Distributions from net realized gain
(.06)
(1.79)
(.34)
(.02)
-
Total distributions
(.06)
(1.87)
(.42) M
(.04) L
-
Redemption fees added to paid in capital E
- K
- K
- K
- K
-
Net asset value, end of period
$ 5.61
$ 11.43
$ 12.67
$ 11.46
$ 10.24
Total Return B,C,D
(50.64)%
5.06%
14.30%
12.27%
2.40%
Ratios to Average Net Assets F, J
Expenses before reductions
1.51%
1.20%
1.62%
4.35%
43.36% A
Expenses net of fee waivers, if any
1.20%
1.20%
1.20%
1.20%
1.20% A
Expenses net of all reductions
1.01%
1.16%
1.10%
1.01%
1.01% A
Net investment income (loss)
1.55%
.72% H
.85%
.98%
.71% A
Supplemental Data
Net assets, end of period (000 omitted)
$ 135
$ 414
$ 394
$ 345
$ 307
Portfolio turnover rate G
350%
224%
185%
176%
52% A
A Annualized B Total returns for periods of less than one year are not annualized. C Total returns do not reflect charges attributable to your insurance company's separate account. Inclusion of these charges would reduce the total returns shown. D Total returns would have been lower had certain expenses not been reduced during the periods shown. E Calculated based on average shares outstanding during the period. F Fees and expenses of the underlying Fidelity Central Funds are not included in the Fund's expense ratio. The Fund indirectly bears its proportionate share of the expenses of any underlying Fidelity Central Funds. G Amount does not include the portfolio activity of any underlying Fidelity Central Funds. H Investment income per share reflects a special dividend which amounted to $.02 per share. Excluding the special dividend, the ratio of net investment income (loss) to average net assets would have been .58%. I For the period December 22, 2004 (commencement of operations) to December 31, 2004. J Expense ratios reflect operating expenses of the class. Expenses before reductions do not reflect amounts reimbursed by the investment adviser or reductions from brokerage service arrangements or other expense offset arrangements and do not represent the amount paid by the class during periods when reimbursements or reductions occur. Expense ratios before reductions for start-up periods may not be representative of longer-term operating periods. Expenses net of fee waivers reflect expenses after reimbursement by the investment adviser but prior to reductions from brokerage service arrangements or other expense offset arrangements. Expenses net of all reductions represent the net expenses paid by the class. K Amount represents less than $.01 per share. L Total distributions of $.04 per share is comprised of distributions from net investment income of $.012 and distributions from net realized gain of $.023 per share. M Total distributions of $.42 per share is comprised of distributions from net investment income of $.084 and distributions from net realized gain of $.335 per share.
Financial Highlights - Service Class 2R
Years ended December 31,
2008
2007
2006
2005
2004 I
Selected Per-Share Data
Net asset value, beginning of period
$ 11.43
$ 12.67
$ 11.46
$ 10.24
$ 10.00
Income from Investment Operations
Net investment income (loss) E
.13
.08 H
.08
.09
- K
Net realized and unrealized gain (loss)
(5.90)
.53
1.53
1.15
.24
Total from investment operations
(5.77)
.61
1.61
1.24
.24
Distributions from net investment income
-
(.06)
(.07)
-
-
Distributions from net realized gain
(.06)
(1.79)
(.34)
(.02)
-
Total distributions
(.06)
(1.85)
(.40) M
(.02) L
-
Redemption fees added to paid in capital E
- K
- K
- K
- K
-
Net asset value, end of period
$ 5.60
$ 11.43
$ 12.67
$ 11.46
$ 10.24
Total Return B,C,D
(50.73)%
4.90%
14.14%
12.12%
2.40%
Ratios to Average Net Assets F, J
Expenses before reductions
1.66%
1.35%
1.77%
4.50%
43.51% A
Expenses net of fee waivers, if any
1.35%
1.35%
1.35%
1.35%
1.35% A
Expenses net of all reductions
1.16%
1.31%
1.25%
1.16%
1.17% A
Net investment income (loss)
1.40%
.57% H
.70%
.83%
.55% A
Supplemental Data
Net assets, end of period (000 omitted)
$ 179
$ 550
$ 524
$ 459
$ 410
Portfolio turnover rate G
350%
224%
185%
176%
52% A
A Annualized BTotal returns for periods of less than one year are not annualized. C Total returns do not reflect charges attributable to your insurance company's separate account. Inclusion of these charges would reduce the total returns shown. D Total returns would have been lower had certain expenses not been reduced during the periods shown. E Calculated based on average shares outstanding during the period. F Fees and expenses of the underlying Fidelity Central Funds are not included in the Fund's expense ratio. The Fund indirectly bears its proportionate share of the expenses of any underlying Fidelity Central Funds. G Amount does not include the portfolio activity of any underlying Fidelity Central Funds. H Investment income per share reflects a special dividend which amounted to $.02 per share. Excluding the special dividend, the ratio of net investment income (loss) to average net assets would have been .43%. I For the period December 22, 2004 (commencement of operations) to December 31, 2004. J Expense ratios reflect operating expenses of the class. Expenses before reductions do not reflect amounts reimbursed by the investment adviser or reductions from brokerage service arrangements or other expense offset arrangements and do not represent the amount paid by the class during periods when reimbursements or reductions occur. Expense ratios before reductions for start-up periods may not be representative of longer-term operating periods. Expenses net of fee waivers reflect expenses after reimbursement by the investment adviser but prior to reductions from brokerage service arrangements or other expense offset arrangements. Expenses net of all reductions represent the net expenses paid by the class. K Amount represents less than $.01 per share. L Total distributions of $.02 per share is comprised of distributions from net investment income of $.000 and distributions from net realized gain of $.020 per share. M Total distributions of $.40 per share is comprised of distributions from net investment income of $.066 and distributions from net realized gain of $.335 per share.
See accompanying notes which are an integral part of the financial statements.
Annual Report
Financial Highlights - Investor Class R
Years ended December 31,
2008
2007
2006
2005 I
Selected Per-Share Data
Net asset value, beginning of period
$ 11.41
$ 12.65
$ 11.46
$ 10.32
Income from Investment Operations
Net investment income (loss) E
.14
.09 H
.09
.01
Net realized and unrealized gain (loss)
(5.89)
.54
1.53
1.16
Total from investment operations
(5.75)
.63
1.62
1.17
Distributions from net investment income
-
(.08)
(.10)
(.02)
Distributions from net realized gain
(.06)
(1.79)
(.34)
(.01)
Total distributions
(.06)
(1.87)
(.43) M
(.03) L
Redemption fees added to paid in capital E, K
-
-
-
-
Net asset value, end of period
$ 5.60
$ 11.41
$ 12.65
$ 11.46
Total Return B,C,D
(50.65)%
5.07%
14.23%
11.39%
Ratios to Average Net Assets F, J
Expenses before reductions
1.51%
1.22%
1.61%
2.19% A
Expenses net of fee waivers, if any
1.17%
1.22%
1.25%
1.25% A
Expenses net of all reductions
.97%
1.18%
1.15%
1.06% A
Net investment income (loss)
1.59%
.71% H
.80%
.31% A
Supplemental Data
Net assets, end of period (000 omitted)
$ 14,208
$ 38,719
$ 24,505
$ 9,810
Portfolio turnover rate G
350%
224%
185%
176%
A Annualized B Total returns for periods of less than one year are not annualized. C Total returns do not reflect charges attributable to your insurance company's separate account. Inclusion of these charges would reduce the total returns shown. D Total returns would have been lower had certain expenses not been reduced during the periods shown. E Calculated based on average shares outstanding during the period. F Fees and expenses of the underlying Fidelity Central Funds are not included in the Fund's expense ratio. The Fund indirectly bears its proportionate share of the expenses of any underlying Fidelity Central Funds. G Amount does not include the portfolio activity of any underlying Fidelity Central Funds. H Investment income per share reflects a special dividend which amounted to $.02 per share. Excluding the special dividend, the ratio of net investment income (loss) to average net assets would have been .57%. I For the period July 21, 2005 (commencement of sale of shares) to December 31, 2005. J Expense ratios reflect operating expenses of the class. Expenses before reductions do not reflect amounts reimbursed by the investment adviser or reductions from brokerage service arrangements or other expense offset arrangements and do not represent the amount paid by the class during periods when reimbursements or reductions occur. Expense ratios before reductions for start-up periods may not be representative of longer-term operating periods. Expenses net of fee waivers reflect expenses after reimbursement by the investment adviser but prior to reductions from brokerage service arrangements or other expense offset arrangements. Expenses net of all reductions represent the net expenses paid by the class. K Amount represents less than $.01 per share. L Total distributions of $.03 per share is comprised of distributions from net investment income of $.022 and distributions from net realized gain of $.013 per share. M Total distributions of $.43 per share is comprised of distributions from net investment income of $.095 and distributions from net realized gain of $.335 per share.
See accompanying notes which are an integral part of the financial statements.
VIP International Capital Appreciation Portfolio (the Fund) is a fund of Variable Insurance Products Fund IV (the trust) and is authorized to issue an unlimited number of shares. The trust is registered under the Investment Company Act of 1940, as amended (the 1940 Act), as an open-end management investment company organized as a Massachusetts business trust. Shares of the Fund may only be purchased by insurance companies for the purpose of funding variable annuity or variable life insurance contracts. The Fund offers the following classes of shares: Initial Class shares, Service Class shares, Service Class 2 shares, Initial Class R shares, Service Class R shares, Service Class 2R shares, and Investor Class R shares. All classes have equal rights and voting privileges, except for matters affecting a single class. Investment income, realized and unrealized capital gains and losses, the common expenses of the Fund, and certain fund-level expense reductions, if any, are allocated on a pro rata basis to each class based on the relative net assets of each class to the total net assets of the Fund. Each class differs with respect to transfer agent and distribution and service plan fees incurred. Certain expense reductions also differ by class. The Fund's investments in emerging markets can be subject to social, economic, regulatory, and political uncertainties and can be extremely volatile.
2. Investments in Fidelity Central Funds.
The Fund may invest in Fidelity Central Funds, which are open-end investment companies available only to other investment companies and accounts managed by Fidelity Management & Research Company (FMR) and its affiliates. The Fund's Schedule of Investments lists each of the Fidelity Central Funds held as of period end, if any, as an investment of the Fund, but does not include the underlying holdings of each Fidelity Central Fund. As an Investing Fund, the Fund indirectly bears its proportionate share of the expenses of the underlying Fidelity Central Funds.
The Money Market Central Funds seek preservation of capital and current income and are managed by Fidelity Investments Money Management, Inc. (FIMM), an affiliate of FMR.
A complete unaudited list of holdings for each Fidelity Central Fund is available upon request or at the SEC's web site at www.sec.gov. In addition, the financial statements of the Fidelity Central Funds, which are not covered by the Fund's Report of Independent Registered Public Accounting Firm, are available on the SEC's web site or upon request.
3. Significant Accounting Policies.
The financial statements have been prepared in conformity with accounting principles generally accepted in the United States of America, which require management to make certain estimates and assumptions at the date of the financial statements. Actual results could differ from those estimates. The following summarizes the significant accounting policies of the Fund:
Security Valuation. Investments are valued as of 4:00 p.m. Eastern time on the last calendar day of the period. Wherever possible, the Fund uses independent pricing services approved by the Board of Trustees to value its investments.
Equity securities, including restricted securities, for which market quotations are readily available, are valued at the last reported sale price or official closing price as reported by an independent pricing service on the primary market or exchange on which they are traded. In the event there were no sales during the day or closing prices are not available, securities are valued at the last quoted bid price. Investments in open-end mutual funds, including the Fidelity Central Funds, are valued at their closing net asset value each business day. Short-term securities with remaining maturities of sixty days or less for which quotations are not readily available are valued at amortized cost, which approximates value.
When current market prices or quotations are not readily available or reliable, valuations may be determined in good faith in accordance with procedures adopted by the Board of Trustees. Factors used in determining value may include significant market or security specific events, changes in interest rates and credit quality, and developments in foreign markets which are monitored by evaluating the performance of ADRs, futures contracts and exchange-traded funds. The frequency with which these procedures are used cannot be predicted and may be utilized to a significant extent. The value of securities used for net asset value (NAV) calculation under these procedures may differ from published prices for the same securities.
The Fund is subject to the provisions of Statement of Financial Accounting Standards No. 157, "Fair Value Measurements" (SFAS 157), effective with the beginning of the Fund's fiscal year. SFAS 157 establishes a hierarchy that prioritizes the inputs to valuation techniques giving the highest priority to readily available unadjusted quoted prices in active markets for identical assets (level 1 measurements) and the lowest priority to unobservable inputs (level 3 measurements) when market prices are not readily available or reliable. The three levels of the hierarchy under SFAS 157 are described below:
Level 1
Quoted prices in active markets for identical securities.
Level 2
Prices determined using other significant observable inputs. Observable inputs are inputs that other market participants may use in pricing a security. These may include quoted prices for similar securities, interest rates, prepayment speeds, credit risk and others.
Level 3
Prices determined using significant unobservable inputs. In situations where quoted prices or observable inputs are unavailable or deemed less relevant (for example, when there is little or no market activity for an investment at the end of the period), unobservable inputs may be used. Unobservable inputs reflect the Fund's own assumptions about the factors market participants would use in pricing an investment, and would be based on the best information available.
Annual Report
Notes to Financial Statements - continued
3. Significant Accounting Policies - continued
Security Valuation - continued
Changes in valuation techniques may result in transfers in or out of an investment's assigned level within the hierarchy.
The aggregate value by input level, as of December 31, 2008, for the Fund's investments, as well as a reconciliation of assets for which significant unobservable inputs (Level 3) were used in determining value, is included at the end of the Fund's Schedule of Investments.
Foreign Currency. The Fund uses foreign currency contracts to facilitate transactions in foreign-denominated securities. Losses from these transactions may arise from changes in the value of the foreign currency or if the counterparties do not perform under the contracts' terms.
Foreign-denominated assets, including investment securities, and liabilities are translated into U.S. dollars at the exchange rate at period end. Purchases and sales of investment securities, income and dividends received and expenses denominated in foreign currencies are translated into U.S. dollars at the exchange rate in effect on the transaction date.
The effects of exchange rate fluctuations on investments are included with the net realized and unrealized gain (loss) on investment securities. Other foreign currency transactions resulting in realized and unrealized gain (loss) are disclosed separately.
Investment Transactions and Income. For financial reporting purposes, the Fund's investment holdings and NAV include trades executed through the end of the last business day of the period. The NAV per share for processing shareholder transactions is calculated as of the close of business of the New York Stock Exchange (NYSE), normally 4:00 p.m. Eastern time and includes trades executed through the end of the prior business day. Gains and losses on securities sold are determined on the basis of identified cost. Dividend income is recorded on the ex-dividend date, except for certain dividends from foreign securities where the ex-dividend date may have passed, which are recorded as soon as the Fund is informed of the ex-dividend date. Non-cash dividends included in dividend income, if any, are recorded at the fair market value of the securities received. Interest income and distributions from the Fidelity Central Funds are accrued as earned. Interest income includes coupon interest and amortization of premium and accretion of discount on debt securities. Investment income is recorded net of foreign taxes withheld where recovery of such taxes is uncertain.
Expenses. Most expenses of the trust can be directly attributed to a fund. Expenses which cannot be directly attributed are apportioned among each Fund in the trust. Expense estimates are accrued in the period to which they relate and adjustments are made when actual amounts are known.
Income Tax Information and Distributions to Shareholders. Each year, the Fund intends to qualify as a regulated investment company by distributing substantially all of its taxable income and realized gains under Subchapter M of the Internal Revenue Code and filing its U.S. federal tax return. As a result, no provision for income taxes is required. The Fund is subject to the provisions of FASB Interpretation No. 48, Accounting for Uncertainties in Income Taxes (FIN 48). FIN 48 sets forth a minimum threshold for financial statement recognition of the benefit of a tax position taken or expected to be taken in a tax return. There are no unrecognized tax benefits in the accompanying financial statements. A Fund's federal tax return is subject to examination by the Internal Revenue Service (IRS) for a period of three years. Foreign taxes are provided for based on the Fund's understanding of the tax rules and rates that exist in the foreign markets in which it invests.
Distributions are recorded on the ex-dividend date. Income dividends and capital gain distributions are declared separately for each class. Income and capital gain distributions are determined in accordance with income tax regulations, which may differ from generally accepted accounting principles.
Capital accounts within the financial statements are adjusted for permanent book-tax differences. These adjustments have no impact on net assets or the results of operations. Temporary book-tax differences will reverse in a subsequent period.
Book-tax differences are primarily due to foreign currency transactions, certain foreign taxes, passive foreign investment companies (PFIC), capital loss carryforwards and losses deferred due to wash sales and excise tax regulations.
The tax-basis components of distributable earnings and the federal tax cost as of period end were as follows:
Unrealized appreciation
$ 1,621,534
Unrealized depreciation
(8,303,330)
Net unrealized appreciation (depreciation)
(6,681,796)
Capital loss carryforward
(20,462,362)
Cost for federal income tax purposes
$ 32,055,043
The tax character of distributions paid was as follows:
December 31, 2008
December 31, 2007
Ordinary Income
$ 298,493
$ 9,196,187
Long-term Capital Gains
29,849
1,192,564
Total
$ 328,342
$ 10,388,751
Annual Report
3. Significant Accounting Policies - continued
Trading (Redemption) Fees. Initial Class R shares, Service Class R shares, Service Class 2 R shares and Investor Class R shares held less than 60 days are subject to a redemption fee equal to 1% of the proceeds of the redeemed shares. All redemption fees, including any estimated redemption fees paid by FMR, are retained by the Fund and accounted for as an addition to paid in capital.
4. Operating Policies.
Repurchase Agreements. FMR has received an Exemptive Order from the Securities and Exchange Commission (the SEC) which permits the Fund and other affiliated entities of FMR to transfer uninvested cash balances into joint trading accounts which are then invested in repurchase agreements. The Fund may also invest directly with institutions in repurchase agreements. Repurchase agreements are collateralized by government or non-government securities. Upon settlement date, collateral is held in segregated accounts with custodian banks and may be obtained in the event of a default of the counterparty. The Fund monitors, on a daily basis, the value of the collateral to ensure it is at least equal to the principal amount of the repurchase agreement (including accrued interest). In the event of a default by the counterparty, realization of the collateral proceeds could be delayed, during which time the value of the collateral may decline.
5. Purchases and Sales of Investments.
Purchases and sales of securities, other than short-term securities, aggregated $162,229,980 and $178,782,488, respectively.
6. Fees and Other Transactions with Affiliates.
Management Fee. FMR and its affiliates provide the Fund with investment management related services for which the Fund pays a monthly management fee. The management fee is the sum of an individual fund fee rate that is based on an annual rate of .45% of the Fund's average net assets and a group fee rate that averaged .26% during the period. The group fee rate is based upon the average net assets of all the mutual funds advised by FMR. The group fee rate decreases as assets under management increase and increases as assets under management decrease. For the period, the total annual management fee rate was .71% of the Fund's average net assets.
Distribution and Service Plan. In accordance with Rule 12b-1 of the 1940 Act, the Fund has adopted separate 12b-1 Plans for each Service Class of shares. Each Service Class pays Fidelity Distributors Corporation (FDC), an affiliate of FMR, a service fee. For the period, the service fee is based on an annual rate of .10% of Service Class' and Service Class R's average net assets and .25% of Service Class 2's and Service Class 2R's average net assets.
For the period, each class paid FDC the following amounts, all of which were re-allowed to insurance companies for the distribution of shares and providing shareholder support services:
Service Class
$ 301
Service Class 2
1,259
Service Class R
301
Service Class 2 R
993
$ 2,854
Transfer Agent Fees. Fidelity Investments Institutional Operations Company, Inc. (FIIOC), an affiliate of FMR, is the Fund's transfer, dividend disbursing, and shareholder servicing agent. FIIOC receives an asset-based fee with respect to each class. Each class (with the exception of Investor Class) pays a transfer agent fee, excluding out of pocket expenses, equal to an annual rate of .07% of average net assets. Investor Class pays a monthly asset-based transfer agent fee of .15% of average net assets. Prior to February 1, 2008, Investor Class paid a monthly asset-based transfer agent fee of .18% of average net assets. The total transfer agent fees paid by each class to FIIOC, including out of pocket expenses, were as follows:
Initial Class
$ 1,994
Service Class
232
Service Class 2
1,276
Initial Class R
15,782
Service Class R
232
Service Class 2R
297
Investor Class R
44,672
$ 64,485
Accounting and Security Lending Fees. Fidelity Service Company, Inc. (FSC), an affiliate of FMR, maintains the Fund's accounting records. The accounting fee is based on the level of average net assets for the month. Under a separate contract, FSC administers the security lending program. The security lending fee is based on the number and duration of lending transactions.
Annual Report
Notes to Financial Statements - continued
6. Fees and Other Transactions with Affiliates - continued
Brokerage Commissions. The Fund placed a portion of its portfolio transactions with brokerage firms which are affiliates of the investment adviser. The commissions paid to these affiliated firms were $427 for the period.
7. Committed Line of Credit.
The Fund participates with other funds managed by FMR in a $4.2 billion credit facility (the "line of credit") to be utilized for temporary or emergency purposes to fund shareholder redemptions or for other short-term liquidity purposes. The Fund has agreed to pay commitment fees on its pro rata portion of the line of credit, which amounted to $118 and is reflected in Miscellaneous Expense on the Statement of Operations. During the period, there were no borrowings on this line of credit.
8. Security Lending.
The Fund lends portfolio securities from time to time in order to earn additional income. On the settlement date of the loan, the Fund receives collateral (in the form of U.S. Treasury obligations, letters of credit and/or cash) against the loaned securities and maintains collateral in an amount not less than 100% of the market value of the loaned securities during the period of the loan. The market value of the loaned securities is determined at the close of business of the Fund and any additional required collateral is delivered to the Fund on the next business day. If the borrower defaults on its obligation to return the securities loaned because of insolvency or other reasons, a fund could experience delays and costs in recovering the securities loaned or in gaining access to the collateral. Any cash collateral received is invested in the Fidelity Securities Lending Cash Central Fund. The value of loaned securities and cash collateral at period end are disclosed on the Fund's Statement of Assets and Liabilities. Security lending income represents the income earned on investing cash collateral, less fees and expenses associated with the loan, plus any premium payments that may be received on the loan of certain types of securities. Security lending income is presented in the Statement of Operations as a component of income from Fidelity Central Funds. Net income from lending portfolio securities during the period amounted to $46,336.
9. Expense Reductions.
FMR voluntarily agreed to reimburse each class to the extent annual operating expenses exceeded certain levels of average net assets as noted in the table below. Some expenses, for example interest expense, including commitment fees, are excluded from this reimbursement.
The following classes were in reimbursement during the period:
Expense Limitations
Reimbursement from adviser
Initial Class
1.10%
$ 3,962
Service Class
1.20%
931
Service Class 2
1.35%
2,215
Initial Class R
1.10%
60,251
Service Class R
1.20%
930
Service Class 2R
1.35%
1,221
Investor Class R
1.25% - 1.18%*
91,211
$ 160,721
* Expense limitation in effect at period end.
Effective February 1, 2008, the expense limitation changed to 1.18% for Investor Class R.
Many of the brokers with whom FMR places trades on behalf of the Fund provided services to the Fund in addition to trade execution. These services included payments of certain expenses on behalf of the Fund totaling $90,379 for the period.
10. Other.
The Fund's organizational documents provide former and current trustees and officers with a limited indemnification against liabilities arising in connection with the performance of their duties to the Fund. In the normal course of business, the Fund may also enter into contracts that provide general indemnifications. The Fund's maximum exposure under these arrangements is unknown as this would be dependent on future claims that may be made against the Fund. The risk of material loss from such claims is considered remote.
At the end of the period, FMR or its affiliates were the owners of record of 98% of the total outstanding shares of the Fund.
Annual Report
11. Distributions to Shareholders.
Distributions to shareholders of each class were as follows:
Years ended December 31,
2008
2007
From net investment income
Initial Class
$ -
$ 9,981
Service Class
-
2,513
Service Class 2
-
2,465
Initial Class R
-
232,391
Service Class R
-
2,513
Service Class 2R
-
2,506
Investor Class R
-
236,202
Total
$ -
$ 488,571
From net realized gain
Initial Class
$ 6,626
$ 188,994
Service Class
1,993
56,040
Service Class 2
2,646
75,317
Initial Class R
134,858
4,287,821
Service Class R
1,993
56,040
Service Class 2R
2,646
74,517
Investor Class R
177,580
5,161,451
Total
$ 328,342
$ 9,900,180
12. Share Transactions.
Transactions for each class of shares were as follows:
Shares
Dollars
Years ended December 31,
2008
2007
2008
2007
Initial Class
Shares sold
30,908
57,013
$ 260,134
$ 797,148
Reinvestment of distributions
672
17,391
6,626
198,975
Shares redeemed
(85,732)
(58,226)
(731,294)
(765,491)
Net increase (decrease)
(54,152)
16,178
$ (464,534)
$ 230,632
Service Class
Reinvestment of distributions
202
5,121
$ 1,993
$ 58,553
Shares redeemed
(12,389)
-
(90,726)
-
Net increase (decrease)
(12,187)
5,121
$ (88,733)
$ 58,553
Service Class 2
Shares sold
29,552
6,394
$ 262,678
$ 84,142
Reinvestment of distributions
269
6,793
2,646
77,782
Shares redeemed
(23,991)
(6,455)
(171,548)
(88,305)
Net increase (decrease)
5,830
6,732
$ 93,776
$ 73,619
Initial Class R
Shares sold
148,524
1,656,294
$ 1,413,988
$ 22,491,075
Reinvestment of distributions
13,677
396,233
134,858
4,520,212
Shares redeemed
(1,478,974)
(583,136)
(13,970,732)
(7,820,250)
Net increase (decrease)
(1,316,773)
1,469,391
$ (12,421,886)
$ 19,191,037
Service Class R
Reinvestment of distributions
202
5,121
$ 1,993
$ 58,553
Shares redeemed
(12,389)
-
(90,726)
-
Net increase (decrease)
(12,187)
5,121
$ (88,733)
$ 58,553
Service Class 2R
Reinvestment of distributions
269
6,735
$ 2,646
$ 77,024
Shares redeemed
(16,453)
-
(120,308)
-
Net increase (decrease)
(16,184)
6,735
$ (117,662)
$ 77,024
Investor Class R
Shares sold
176,104
1,585,891
$ 1,598,648
$ 21,572,358
Reinvestment of distributions
18,065
473,946
177,580
5,397,653
Shares redeemed
(1,048,997)
(602,827)
(9,318,944)
(8,073,931)
Net increase (decrease)
(854,828)
1,457,010
$ (7,542,716)
$ 18,896,080
Annual Report
Reportof Independent Registered Public Accounting Firm
To the Trustees of Variable Insurance Products Fund IV and the Shareholders of VIP International Capital Appreciation Portfolio:
In our opinion, the accompanying statement of assets and liabilities, including the schedule of investments, and the related statements of operations and of changes in net assets and the financial highlights present fairly, in all material respects, the financial position of VIP International Capital Appreciation Portfolio (a fund of Variable Insurance Products Fund IV) at December 31, 2008, the results of its operations for the year then ended, the changes in its net assets for each of the two years in the period then ended and the financial highlights for each of the periods indicated, in conformity with accounting principles generally accepted in the United States of America. These financial statements and financial highlights (hereafter referred to as "financial statements") are the responsibility of the VIP International Capital Appreciation Portfolio's management. Our responsibility is to express an opinion on these financial statements based on our audits. We conducted our audits of these financial statements in accordance with the standards of the Public Company Accounting Oversight Board (United States). Those standards require that we plan and perform the audit to obtain reasonable assurance about whether the financial statements are free of material misstatement. An audit includes examining, on a test basis, evidence supporting the amounts and disclosures in the financial statements, assessing the accounting principles used and significant estimates made by management, and evaluating the overall financial statement presentation. We believe that our audits, which included confirmation of securities at December 31, 2008 by correspondence with the custodian and brokers, provide a reasonable basis for our opinion.
The Trustees, Member of the Advisory Board, and executive officers of the trust and fund, as applicable, are listed below. The Board of Trustees governs the fund and is responsible for protecting the interests of shareholders. The Trustees are experienced executives who meet periodically throughout the year to oversee the fund's activities, review contractual arrangements with companies that provide services to the fund, and review the fund's performance. Except for Edward C. Johnson 3d and James C. Curvey, each of the Trustees oversees 222 funds advised by FMR or an affiliate. Messrs. Johnson and Curvey oversee 380 funds advised by FMR or an affiliate.
The Trustees hold office without limit in time except that (a) any Trustee may resign; (b) any Trustee may be removed by written instrument, signed by at least two-thirds of the number of Trustees prior to such removal; (c) any Trustee who requests to be retired or who has become incapacitated by illness or injury may be retired by written instrument signed by a majority of the other Trustees; and (d) any Trustee may be removed at any special meeting of shareholders by a two-thirds vote of the outstanding voting securities of the trust. Each Trustee who is not an interested person (as defined in the 1940 Act) (Independent Trustee), shall retire not later than the last day of the calendar year in which his or her 72nd birthday occurs. The Independent Trustees may waive this mandatory retirement age policy with respect to individual Trustees. The executive officers and Advisory Board Member hold office without limit in time, except that any officer and Advisory Board Member may resign or may be removed by a vote of a majority of the Trustees at any regular meeting or any special meeting of the Trustees. Except as indicated, each individual has held the office shown or other offices in the same company for the past five years.
The fund's Statement of Additional Information (SAI) includes more information about the Trustees.To request a free copy, call Fidelity at 1-877-208-0098.
Interested Trustees*:
Correspondence intended for each Trustee who is an interested person may be sent to Fidelity Investments, 82 Devonshire Street, Boston, Massachusetts 02109.
Name, Age; Principal Occupation
Edward C. Johnson 3d (78)
Year of Election or Appointment: 1983
Mr. Johnson is Chairman of the Board of Trustees. Mr. Johnson serves as Chief Executive Officer, Chairman, and a Director of FMR LLC; Chairman and a Director of FMR; Chairman and a Director of Fidelity Research & Analysis Company (FRAC); Chairman and a Director of Fidelity Investments Money Management, Inc.; and Chairman and a Director of FMR Co., Inc. In addition, Mr. Johnson serves as Chairman and Director of FIL Limited. Previously, Mr. Johnson served as President of FMR LLC (2006-2007).
James C. Curvey (73)
Year of Election or Appointment: 2007
Mr. Curvey also serves as Trustee (2007-present) of other investment companies advised by FMR. Mr. Curvey is a Director of FMR and FMR Co., Inc. (2007-present). Mr. Curvey is also Vice Chairman (2006-present) and Director of FMR LLC. In addition, Mr. Curvey serves as an Overseer for the Boston Symphony Orchestra and a member of the Trustees of Villanova University.
* Trustees have been determined to be "Interested Trustees" by virtue of, among other things, their affiliation with the trust or various entities under common control with FMR. FMR Corp. merged with and into FMR LLC on October 1, 2007. Any references to FMR LLC for prior periods are deemed to be references to the prior entity.
Independent Trustees:
Correspondence intended for each Independent Trustee (that is, the Trustees other than the Interested Trustees) may be sent to Fidelity Investments, P.O. Box 55235, Boston, Massachusetts 02205-5235.
Name, Age; Principal Occupation
Dennis J. Dirks (60)
Year of Election or Appointment: 2005
Prior to his retirement in May 2003, Mr. Dirks was Chief Operating Officer and a member of the Board of The Depository Trust & Clearing Corporation (DTCC) (1999-2003). He also served as President, Chief Operating Officer, and Board member of The Depository Trust Company (DTC) (1999-2003) and President and Board member of the National Securities Clearing Corporation (NSCC) (1999-2003). In addition, Mr. Dirks served as Chief Executive Officer and Board member of the Government Securities Clearing Corporation (2001-2003), Chief Executive Officer and Board member of the Mortgage-Backed Securities Clearing Corporation (2001-2003), as a Trustee and a member of the Finance Committee of Manhattan College (2005-2008), and as a Trustee and a member of the Finance Committee of AHRC of Nassau County (2006-2008). Currently, Mr. Dirks serves as a member of the Board of Directors for The Brookville Center for Children's Services, Inc. (2009-present).
Alan J. Lacy (55)
Year of Election or Appointment: 2008
Mr. Lacy serves as Senior Adviser (2007-present) of Oak Hill Capital Partners, L.P. (a private equity firm). Mr. Lacy also served as Chief Executive Officer (2000-2005) and Vice Chairman (2005-2006) of Sears Holdings Corporation and Sears, Roebuck and Co. (retail). In addition, Mr. Lacy serves as a member of the Board of Directors of The Western Union Company (global money transfer, 2006-present) and Bristol-Myers Squibb (global pharmaceuticals, 2007-present). Mr. Lacy is a Trustee of the National Parks Conservation Association and The Field Museum of Natural History.
Ned C. Lautenbach (64)
Year of Election or Appointment: 2000
Mr. Lautenbach is Chairman of the Independent Trustees (2006-present). Mr. Lautenbach is an Advisory Partner of Clayton, Dubilier & Rice, Inc. (private equity investment firm). Previously, Mr. Lautenbach was with the International Business Machines Corporation (IBM) from 1968 until his retirement in 1998. Mr. Lautenbach serves as a Director of Eaton Corporation (diversified industrial) as well as the Philharmonic Center for the Arts in Naples, Florida. He also is a member of the Board of Trustees of Fairfield University (2005-present), as well as a member of the Council on Foreign Relations. Previously, Mr. Lautenbach served as a Director of Sony Corporation (2006-2007).
Joseph Mauriello (64)
Year of Election or Appointment: 2008
Prior to his retirement in January 2006, Mr. Mauriello served in numerous senior management positions including Deputy Chairman and Chief Operating Officer (2004-2005), and Vice Chairman of Financial Services (2002-2004) of KPMG LLP US (professional services firm, 1965-2005). Mr. Mauriello currently serves as a member of the Board of Directors of XL Capital Ltd. (global insurance and re-insurance company, 2006-present) and of Arcadia Resources Inc. (health care services and products, 2007-present). He also served as a Director of the Hamilton Funds of the Bank of New York (2006-2007).
Cornelia M. Small (64)
Year of Election or Appointment: 2005
Ms. Small is a member of the Investment Committee, and Chair (2008-present) and a member of the Board of Trustees of Smith College. Ms. Small also serves on the Investment Committee of the Berkshire Taconic Community Foundation (2008-present). Previously, Ms. Small served as Chairperson of the Investment Committee (2002-2008) of Smith College and as Co-Chair (2000-2003) of the Annual Fund for the Fletcher School of Law and Diplomacy. In addition, she served as Chief Investment Officer, Director of Global Equity Investments, and a member of the Board of Directors of Scudder, Stevens & Clark and Scudder Kemper Investments.
William S. Stavropoulos (69)
Year of Election or Appointment: 2001
Mr. Stavropoulos is Chairman Emeritus of the Board of Directors of The Dow Chemical Company, where he previously served in numerous senior management positions, including President (1993-2000; 2002-2003), CEO (1995-2000; 2002-2004), Chairman of the Executive Committee (2000-2006), and as a member of the Board of Directors (1990-2006). Currently, he is a Director of Teradata Corporation (data warehousing and technology solutions, 2008-present), Chemical Financial Corporation, Maersk Inc. (industrial conglomerate), Tyco International, Inc. (multinational manufacturing and services, 2007-present), and a member of the Advisory Board for Metalmark Capital (private equity investment firm, 2005-present). He is a special advisor to Clayton, Dubilier & Rice, Inc. (private equity investment). In addition, Mr. Stavropoulos is a member of the University of Notre Dame Advisory Council for the College of Science.
David M. Thomas (59)
Year of Election or Appointment: 2008
Previously, Mr. Thomas served as Executive Chairman (2005-2006) and Chairman and Chief Executive Officer (2000-2005) of IMS Health, Inc. (pharmaceutical and healthcare information solutions). In addition, Mr. Thomas serves as a member of the Board of Directors of Fortune Brands, Inc. (consumer products holding company), and Interpublic Group of Companies, Inc. (marketing communication, 2004-present).
Michael E. Wiley (58)
Year of Election or Appointment: 2008
Mr. Wiley also serves as a member of the Board of Trustees of the University of Tulsa (2000-2006; 2007-present). He serves as a Director of Tesoro Corporation (independent oil refiner and marketer, 2005-present), and a Director of Bill Barrett Corporation (exploration and production company, 2005-present). In addition, he also serves as a Director of Post Oak Bank (privately-held bank, 2004-present). Previously, Mr. Wiley served as a Sr. Energy Advisor of Katzenbach Partners, LLC (consulting firm, 2006-2007), as an Advisory Director of Riverstone Holdings (private investment firm), Chairman, President, and CEO of Baker Hughes, Inc. (oilfield services company, 2000-2004), and as Director of Spinnaker Exploration Company (exploration and production company, 2001-2005).
Annual Report
Trustees and Officers - continued
Advisory Board Member and Executive Officers**:
Correspondence intended for each executive officer and Mr. Lynch may be sent to Fidelity Investments, 82 Devonshire Street, Boston, Massachusetts 02109.
Name, Age; Principal Occupation
Peter S. Lynch (64)
Year of Election or Appointment: 2003
Member of the Advisory Board of Fidelity's Equity and High Income Funds. Mr. Lynch is Vice Chairman and a Director of FMR, and Vice Chairman (2001-present) and a Director of FMR Co., Inc. Previously, Mr. Lynch served as a Trustee of the Fidelity funds (1990-2003). In addition, he serves as a Trustee of Boston College and as the Chairman of the Inner-City Scholarship Fund. Previously, Mr. Lynch served on the Special Olympics International Board of Directors (1997-2006).
Kenneth B. Robins (39)
Year of Election or Appointment: 2008
President and Treasurer of Fidelity's Equity and High Income Funds. Mr. Robins is an employee of Fidelity Investments (2004-present). Before joining Fidelity Investments, Mr. Robins worked at KPMG LLP, where he was a partner in KPMG's department of professional practice (2002-2004).
Walter C. Donovan (46)
Year of Election or Appointment: 2007
Vice President of Fidelity's Equity Funds. Mr. Donovan also serves as President of FMR and FMR Co., Inc., and Executive Vice President of Fidelity Investments Money Management, Inc. (2007-present). Previously, Mr. Donovan served as Executive Vice President of FMR and FMR Co., Inc. (2005-2007) and Senior Vice President of FMR (2003-2005) and FMR Co., Inc. (2004-2005).
Eric M. Wetlaufer (46)
Year of Election or Appointment: 2006
Vice President of Fidelity's International Equity Funds. Mr. Wetlaufer also serves as Group Chief Investment Officer of FMR. Mr. Wetlaufer is Chairman, Chief Executive Officer, and President of Fidelity Management & Research (Hong Kong) Limited (2008-present); Chairman, Chief Executive Officer, President, and a Director of Fidelity Management & Research (Japan) Inc. (2008-present); Chairman and Chief Executive Officer (2007-present) and President and a Director (2006-present) of Fidelity Management & Research (U.K.) Inc. and President and a Director of Fidelity Research & Analysis Company (2006-present). Before joining Fidelity Investments in 2005, Mr. Wetlaufer was a partner in Oxhead Capital Management (2004-2005) and a Chief Investment Officer of Putnam Investments (1997-2003).
Scott C. Goebel (40)
Year of Election or Appointment: 2008
Secretary and Chief Legal Officer (CLO) of the Fidelity funds. Mr. Goebel also serves as General Counsel, Secretary, and Senior Vice President of FMR (2008-present); Deputy General Counsel of FMR LLC; Chief Legal Secretary of Fidelity Management & Research (Hong Kong) Limited (2008-present) and Assistant Secretary of Fidelity Management & Research (Japan) Inc. (2008-present). Previously, Mr. Goebel served as Assistant Secretary of the Funds (2007-2008) and as Vice President and Secretary of Fidelity Distributors Corporation (FDC) (2005-2007).
John B. McGinty, Jr. (46)
Year of Election or Appointment: 2008
Assistant Secretary of Fidelity's Equity and High Income Funds. Mr. McGinty is an employee of Fidelity Investments (2004-present). Mr. McGinty also serves as Senior Vice President, Secretary, and Chief Legal Officer of FDC (2007-present). Before joining Fidelity Investments, Mr. McGinty practiced law at Ropes & Gray, LLP.
Holly C. Laurent (54)
Year of Election or Appointment: 2008
Anti-Money Laundering (AML) Officer of the Fidelity funds. Ms. Laurent is an employee of Fidelity Investments. Previously, Ms. Laurent was Senior Vice President and Head of Legal for Fidelity Business Services India Pvt. Ltd. (2006-2008), Senior Vice President, Deputy General Counsel and Group Head for FMR LLC (2005-2006).
Christine Reynolds (50)
Year of Election or Appointment: 2008
Chief Financial Officer of the Fidelity funds. Ms. Reynolds became President of Fidelity Pricing and Cash Management Services (FPCMS) in August 2008. She served as Chief Operating Officer of FPCMS from 2007 through July 2008. Previously, Ms. Reynolds served as President, Treasurer, and Anti-Money Laundering officer of the Fidelity funds (2004-2007). Before joining Fidelity Investments, Ms. Reynolds worked at PricewaterhouseCoopers LLP (PwC) (1980-2002), where she was an audit partner with PwC's investment management practice.
Kenneth A. Rathgeber (61)
Year of Election or Appointment: 2004
Chief Compliance Officer of Fidelity's Equity and High Income Funds. Mr. Rathgeber is Chief Compliance Officer of Fidelity Management & Research (Hong Kong) Limited (2008-present), Fidelity Management & Research (Japan) Inc. (2008-present), FMR (2005-present), FMR Co., Inc. (2005-present), Fidelity Management & Research (U.K.) Inc. (2005-present), Fidelity Research & Analysis Company (2005-present), Fidelity Investments Money Management, Inc. (2005-present), and Strategic Advisers, Inc. (2005-present).
Bryan A. Mehrmann (47)
Year of Election or Appointment: 2005
Deputy Treasurer of the Fidelity funds. Mr. Mehrmann is an employee of Fidelity Investments. Previously, Mr. Mehrmann served as Vice President of Fidelity Investments Institutional Services Group (FIIS)/Fidelity Investments Institutional Operations Company, Inc. (FIIOC) Client Services (1998-2004).
Adrien E. Deberghes (41)
Year of Election or Appointment: 2008
Deputy Treasurer of Fidelity's Equity and High Income Funds. Mr. Deberghes is an employee of Fidelity Investments (2008-present). Previously, Mr. Deberghes served as Senior Vice President of Mutual Fund Administration at State Street Corporation (2007-2008), Senior Director of Mutual Fund Administration at Investors Bank & Trust (2005-2007), and Director of Finance for Dunkin' Brands (2000-2005).
Robert G. Byrnes (42)
Year of Election or Appointment: 2005
Assistant Treasurer of the Fidelity funds. Mr. Byrnes is an employee of Fidelity Investments (2005-present). Previously, Mr. Byrnes served as Vice President of Fidelity Pricing and Cash Management Services (FPCMS) (2003-2005). Before joining Fidelity Investments, Mr. Byrnes worked at Deutsche Asset Management where he served as Vice President of the Investment Operations Group (2000-2003).
Paul M. Murphy (61)
Year of Election or Appointment: 2007
Assistant Treasurer of the Fidelity funds. Mr. Murphy is an employee of Fidelity Investments (2007-present). Previously, Mr. Murphy served as Chief Financial Officer of the Fidelity Funds (2005-2006), Vice President and Associate General Counsel of FMR (2007), and Senior Vice President of Fidelity Pricing and Cash Management Services (FPCMS) (1994-2007).
Gary W. Ryan (50)
Year of Election or Appointment: 2005
Assistant Treasurer of the Fidelity funds. Mr. Ryan is an employee of Fidelity Investments. Previously, Mr. Ryan served as Vice President of Fund Reporting in Fidelity Pricing and Cash Management Services (FPCMS) (1999-2005).
** FMR Corp. merged with and into FMR LLC on October 1, 2007. Any references to FMR LLC for prior periods are deemed to be references to the prior entity.
A special meeting of the fund's shareholders was held on May 14, 2008. The results of votes taken among shareholders on the proposals before them are reported below. Each vote reported represents one dollar of net asset value held on the record date for the meeting.
PROPOSAL 1
To elect a Board of Trustees.A
# of Votes
% of Votes
James C. Curvey
Affirmative
82,890,712.47
95.991
Withheld
3,461,988.43
4.009
TOTAL
86,352,700.90
100.000
Dennis J. Dirks
Affirmative
82,970,372.75
96.083
Withheld
3,382,328.15
3.917
TOTAL
86,352,700.90
100.000
Edward C. Johnson 3d
Affirmative
82,689,162.78
95.757
Withheld
3,663,538.12
4.243
TOTAL
86,352,700.90
100.000
Alan J. Lacy
Affirmative
83,041,222.35
96.165
Withheld
3,311,478.55
3.835
TOTAL
86,352,700.90
100.000
Ned C. Lautenbach
Affirmative
82,983,853.72
96.099
Withheld
3,368,847.18
3.901
TOTAL
86,352,700.90
100.000
Joseph Mauriello
Affirmative
83,138,122.14
96.277
Withheld
3,214,578.76
3.723
TOTAL
86,352,700.90
100.000
Cornelia M. Small
Affirmative
83,095,438.06
96.228
Withheld
3,257,262.84
3.772
TOTAL
86,352,700.90
100.000
William S. Stavropoulos
Affirmative
82,929,113.95
96.035
Withheld
3,423,586.95
3.965
TOTAL
86,352,700.90
100.000
David M. Thomas
Affirmative
83,095,487.87
96.228
Withheld
3,257,213.03
3.772
TOTAL
86,352,700.90
100.000
Michael E. Wiley
Affirmative
83,048,523.75
96.174
Withheld
3,304,177.15
3.826
TOTAL
86,352,700.90
100.000
PROPOSAL 2
To amend the Declaration of Trust to reduce the required quorum for future shareholder meetings.A
# of Votes
% of Votes
Affirmative
74,393,635.26
86.151
Against
8,745,543.59
10.128
Abstain
3,213,522.05
3.721
TOTAL
86,352,700.90
100.000
ADenotes trust-wide proposal and voting results.
Annual Report
BoardApproval of Investment Advisory Contracts and Management Fees
VIP International Capital Appreciation Portfolio
Each year, typically in July, the Board of Trustees, including the Independent Trustees (together, the Board), votes on the renewal of the management contract and sub-advisory agreements (together, the Advisory Contracts) for the fund. The Board, assisted by the advice of fund counsel and Independent Trustees' counsel, requests and considers a broad range of information throughout the year.
The Board meets regularly and, acting directly and through its separate committees, requests and receives information concerning, and considers at each of its meetings factors that are relevant to, its annual consideration of the renewal of the fund's Advisory Contracts, including the services and support provided to the fund and its shareholders. At the time of the renewal, the Board had 12 standing committees, each composed of Independent Trustees with varying backgrounds, to which the Board has assigned specific subject matter responsibilities in order to enhance effective decision-making by the Board. Each committee has a written charter outlining the structure and purposes of the committee. The Board also meets as needed to consider matters specifically related to the Board's annual consideration of the renewal of Advisory Contracts.
At its July 2008 meeting, the Board of Trustees, including the Independent Trustees, unanimously determined to renew the fund's Advisory Contracts. In reaching its determination, the Board considered all factors it believed relevant, including (i) the nature, extent, and quality of the services to be provided to the fund and its shareholders (including the investment performance of the fund); (ii) the competitiveness of the fund's management fee and total expenses; (iii) the total costs of the services to be provided by and the profits to be realized by Fidelity from its relationship with the fund; (iv) the extent to which economies of scale would be realized as the fund grows; and (v) whether fee levels reflect these economies of scale, if any, for the benefit of fund shareholders. The Board also approved agreements with foreign sub-advisers Fidelity Management & Research (Japan) Inc. and Fidelity Management & Research (Hong Kong) Limited, as well as amendments to the fund's agreement with Fidelity Management & Research (U.K.) Inc.
In considering whether to renew the Advisory Contracts for the fund, the Board ultimately reached a determination, with the assistance of fund counsel and Independent Trustees' counsel and through the exercise of its business judgment, that the renewal of the Advisory Contracts and the compensation to be received by Fidelity under the management contract is consistent with Fidelity's fiduciary duty under applicable law. The Board's decision to renew the Advisory Contracts was not based on any single factor noted above, but rather was based on a comprehensive consideration of all the information provided to the Board at its meetings throughout the year. The Board, in reaching its determination to renew the Advisory Contracts, is aware that shareholders in the fund have a broad range of investment choices available to them, including a wide choice among mutual funds offered by competitors to Fidelity, and that the fund's shareholders, with the opportunity to review and weigh the disclosure provided by the fund in its prospectus and other public disclosures, have chosen to invest in this fund, managed by Fidelity.
Nature, Extent, and Quality of Services Provided. The Board considered staffing within the investment adviser, FMR, and the sub-advisers (together, the Investment Advisers), including the backgrounds of the fund's investment personnel and the fund's investment objective and discipline. The Independent Trustees also had discussions with senior management of Fidelity's investment operations and investment groups. The Board considered the structure of the portfolio manager compensation program and whether this structure provides appropriate incentives.
Resources Dedicated to Investment Management and Support Services. The Board reviewed the size, education, and experience of the Investment Advisers' investment staff, their use of technology, and the Investment Advisers' approach to recruiting, training, and retaining portfolio managers and other research, advisory, and management personnel. The Board noted that Fidelity's analysts have access to a variety of technological tools that enable them to perform both fundamental and quantitative analysis and to specialize in various disciplines. The Board considered Fidelity's extensive global research capabilities that enable the Investment Advisers to aggregate data from various sources in an effort to produce positive investment results. The Board also considered that Fidelity's portfolio managers and analysts have access to daily portfolio attribution that allows for monitoring of a fund's portfolio, as well as an electronic communication system that provides immediate real-time access to research concerning issuers and credit enhancers.
Shareholder and Administrative Services. The Board considered (i) the nature, extent, quality, and cost of advisory, administrative, distribution, and shareholder services performed by the Investment Advisers and their affiliates under the Advisory Contracts and under separate agreements covering transfer agency, pricing and bookkeeping, and securities lending services for the fund; (ii) the nature and extent of the Investment Advisers' supervision of third party service providers, principally custodians and subcustodians; and (iii) the resources devoted to, and the record of compliance with, the fund's compliance policies and procedures. The Board also reviewed the allocation of fund brokerage, including allocations to brokers affiliated with the Investment Advisers, the use of brokerage commissions to pay fund expenses, and the use of "soft" commission dollars to pay for research services. The Board further considered that Fidelity voluntarily pays for market data out of its own resources.
The Board noted that the growth of fund assets across the complex allows Fidelity to reinvest in the development of services designed to enhance the value or convenience of the Fidelity funds as investment vehicles. These services include 24-hour access to account information and market information through phone representatives and over the Internet, and investor education materials and asset allocation tools.
Investment in a Large Fund Family. The Board considered the benefits to shareholders of investing in a Fidelity fund, including the benefits of investing in a fund that is part of a large family of funds offering a variety of investment disciplines and providing for a large variety of mutual fund investor services. The Board noted that Fidelity has taken a number of actions over the previous year that benefited particular funds, including (i) dedicating additional resources to investment research and to restructure the investment research teams; (ii) contractually agreeing to reduce the management fees on Fidelity's Institutional Money Market Funds and launching Class IV and Institutional Class of certain of these funds; (iii) reducing the transfer agent fees for the Fidelity Select Portfolios and Investor Class of the VIP funds; and (iv) launching Class K of 29 equity funds as a lower-fee class available to certain employer-sponsored retirement plans.
Annual Report
Investment Performance. The Board considered whether the fund has operated within its investment objective, as well as its record of compliance with its investment restrictions. It also reviewed the fund's absolute investment performance for each class, as well as the fund's relative investment performance for each class measured against (i) a broad-based securities market index, and (ii) a custom peer group of mutual funds deemed appropriate by the Board. Because the fund had been in existence less than five calendar years, the following charts considered by the Board show, for the one- and three-year periods ended December 31, 2007, the cumulative total returns of Initial Class R and Service Class 2 of the fund, the cumulative total returns of a broad-based securities market index ("benchmark"), and a range of cumulative total returns of a custom peer group of mutual funds defined by FMR based on categories assigned by Morningstar, Inc. The returns of Initial Class R and Service Class 2 show the performance of the highest and lowest performing classes, respectively (based on three-year performance). The box within each chart shows the 25th percentile return (bottom of box) and the 75th percentile return (top of box) of the peer group. Returns shown above the box are in the first quartile and returns shown below the box are in the fourth quartile. The percentage beaten numbers noted below each chart correspond to the percentile box and represent the percentage of funds in the peer group whose performance was equal to or lower than that of the class indicated. The fund's custom peer group, defined by FMR, is a peer group that FMR believes provides a more meaningful performance comparison than the peer group assigned by Morningstar, Inc., which assigns mutual funds to categories based on their investment styles as measured by their underlying portfolio holdings.
VIP International Capital Appreciation Portfolio
The Board reviewed the fund's relative investment performance against its peer group and stated that the performance of Initial Class R of the fund was in the fourth quartile for all the periods shown. The Board also stated that the investment performance of the fund was lower than its benchmark for all the periods shown. The Board considered that the variations in performance among the fund's classes reflect the variations in class expenses, which result in lower performance for higher expense classes. The Board discussed with FMR actions that may be taken by FMR to improve the fund's disappointing performance relative to its peer group and benchmark. The Board will continue to closely monitor the performance of the fund in the coming year and discuss with FMR other appropriate actions to address the performance of the fund.
The Board considered that FMR has taken steps to refocus and strengthen equity research, equity portfolio management, and compliance.
Based on its review, and giving particular weight to the nature and quality of the resources dedicated by the Investment Advisers to maintain and improve relative performance, the Board concluded that the nature, extent, and quality of the services provided to the fund will benefit the fund's shareholders, particularly in light of the Board's view that the fund's shareholders benefit from investing in a fund that is part of a large family of funds offering a variety of investment disciplines and services.
Competitiveness of Management Fee and Total Fund Expenses. The Board considered the fund's management fee and total expenses compared to "mapped groups" of competitive funds and classes. Fidelity creates "mapped groups" by combining similar Lipper investment objective categories that have comparable management fee characteristics. Combining Lipper investment objective categories aids the Board's management fee and total expense comparisons by broadening the competitive group used for comparison and by reducing the number of universes to which various Fidelity funds are compared. The Board also considered supplemental information about how the fund's management fee and total expenses ranked relative to groups based on Lipper classifications, which take into account a fund's market capitalization and style.
Annual Report
Board Approval of Investment Advisory Contracts and Management Fees - continued
The Board considered two proprietary management fee comparisons for the 12-month (or shorter) periods shown in the chart below. The group of Lipper funds used by the Board for management fee comparisons is referred to below as the "Total Mapped Group." The Total Mapped Group comparison focuses on a fund's standing relative to the total universe of comparable funds available to investors, in terms of gross management fees before expense reimbursements or caps. "TMG %" represents the percentage of funds in the Total Mapped Group that had management fees that were lower than the fund's. For example, a TMG % of 14% means that 86% of the funds in the Total Mapped Group had higher management fees than the fund. The "Asset-Size Peer Group" (ASPG) comparison focuses on a fund's standing relative to non-Fidelity funds similar in size to the fund within the Total Mapped Group. The ASPG represents at least 15% of the funds in the Total Mapped Group with comparable asset size and management fee characteristics, subject to a minimum of 50 funds (or all funds in the Total Mapped Group if fewer than 50). Additional information, such as the ASPG quartile in which the fund's management fee ranked, is also included in the chart and considered by the Board.
VIP International Capital Appreciation Portfolio
The Board noted that the fund's management fee ranked below the median of its Total Mapped Group and below the median of its ASPG for 2007.
Based on its review, the Board concluded that the fund's management fee was fair and reasonable in light of the services that the fund receives and the other factors considered.
In its review of each class's total expenses, the Board considered the fund's management fee as well as other fund or class expenses, as applicable, such as transfer agent fees, pricing and bookkeeping fees, fund-paid 12b-1 fees, and custodial, legal, and audit fees. The Board also noted the effects of any waivers and reimbursements on fees and expenses. As part of its review, the Board also considered current and historical total expenses of each class of the fund compared to competitive fund median expenses. Each class of the fund is compared to those funds and classes in the Total Mapped Group (used by the Board for management fee comparisons) that have a similar sales load structure.
The Board noted that the total expenses of each of Initial Class and Initial Class R ranked below its competitive median for 2007, and the total expenses of each of Investor Class R, Service Class, Service Class 2, Service Class R, and Service Class 2 R ranked above its competitive median for 2007. The Board considered that the total expenses of Investor Class R were above the median primarily due to its higher transfer agent fee. The Board noted that the fund offers multiple classes, each of which has a different 12b-1 fee structure, and that the multiple structures are intended to offer a range of pricing options for the intermediary market. The Board also noted that the total expenses of the classes vary primarily by the level of their 12b-1 fees, although differences in transfer agent fees may also cause expenses to vary from class to class.
In its review of total expenses, the Board also considered Fidelity fee structures and other information on clients that FMR and its affiliates service in other competitive markets, such as other mutual funds advised or subadvised by FMR or its affiliates, pension plan clients, and other institutional clients.
Based on its review, the Board concluded that the total expenses of each class of the fund were reasonable, although in some cases above the median of the universe presented for comparison, in light of the services that the fund and its shareholders receive and the other factors considered.
Annual Report
Costs of the Services and Profitability. The Board considered the revenues earned and the expenses incurred by Fidelity in conducting the business of developing, marketing, distributing, managing, administering and servicing the fund and its shareholders. The Board also considered the level of Fidelity's profits in respect of all the Fidelity funds.
On an annual basis, FMR presents to the Board Fidelity's profitability for the fund. Fidelity calculates the profitability for each fund, as well as aggregate profitability for groups of Fidelity funds and all Fidelity funds, using a series of detailed revenue and cost allocation methodologies which originate with the audited books and records of Fidelity. The Audit Committee of the Board reviews any significant changes from the prior year's methodologies.
PricewaterhouseCoopers LLP (PwC), independent registered public accounting firm and auditor to Fidelity and certain Fidelity funds, has been engaged annually by the Board as part of the Board's assessment of the results of Fidelity's profitability analysis. PwC's engagement includes the review and assessment of Fidelity's methodologies used in determining the revenues and expenses attributable to Fidelity's mutual fund business, and completion of agreed-upon procedures surrounding the mathematical accuracy of fund profitability and its conformity to allocation methodologies. After considering PwC's reports issued under the engagement and information provided by Fidelity, the Board believes that while other allocation methods may also be reasonable, Fidelity's profitability methodologies are reasonable in all material respects.
The Board has also reviewed Fidelity's non-fund businesses and any fall-out benefits related to the mutual fund business as well as cases where Fidelity's affiliates may benefit from or be related to the fund's business.
The Board considered the costs of the services provided by and the profits realized by Fidelity in connection with the operation of the fund and determined that the amount of profit is a fair entrepreneurial profit for the management of the fund.
Economies of Scale. The Board considered whether there have been economies of scale in respect of the management of the Fidelity funds, whether the Fidelity funds (including the fund) have appropriately benefited from any such economies of scale, and whether there is potential for realization of any further economies of scale. The Board considered the extent to which the fund will benefit from economies of scale through increased services to the fund, through waivers or reimbursements, or through fee or expense reductions.
The Board recognized that the fund's management contract incorporates a "group fee" structure, which provides for lower group fee rates as total fund assets under FMR's management increase, and for higher group fee rates as total fund assets under FMR's management decrease. FMR determines the group fee rates based on a tiered asset "breakpoint" schedule. The Board considered that the group fee is designed to deliver the benefits of economies of scale to fund shareholders when total fund assets increase, even if assets of any particular fund are unchanged or have declined, because some portion of Fidelity's costs are attributable to services provided to all Fidelity funds, and all funds benefit if those costs can be allocated among more assets. The Board concluded that, given the group fee structure, fund shareholders will achieve a certain level of economies of scale as assets under FMR's management increase at the fund complex level, regardless of whether Fidelity achieves any such economies of scale.
The Board further concluded that any potential economies of scale are being shared between fund shareholders and Fidelity in an appropriate manner.
Additional Information Requested by the Board. In order to develop fully the factual basis for consideration of the Fidelity funds' Advisory Contracts, the Board requested and received additional information on certain topics, including (i) fund performance trends and actions to be taken by FMR to improve certain funds' overall performance; (ii) portfolio manager changes that have occurred during the past year; (iii) Fidelity's fund profitability methodology, the profitability of certain fund service providers, and profitability trends for certain funds; (iv) Fidelity's compensation structure for portfolio managers and key personnel, including its effects on fund profitability and the extent to which portfolio manager compensation is linked to fund performance; (v) Fidelity's fee structures and rationale for recommending different fees among categories of funds; and (vi) Fidelity's rationale for recommending which funds should have a performance adjustment component as part of their management fees.
Based on its evaluation of all of the conclusions noted above, and after considering all material factors, the Board ultimately concluded that the advisory fee structures are fair and reasonable, and that the fund's Advisory Contracts should be renewed.
Annual Report
Investment Adviser
Fidelity Management & Research Company Boston, MA
Investment Sub-Advisers
FMR Co., Inc.
Fidelity Management & Research (U.K.) Inc.
Fidelity Research & Analysis Company
FIL Investment Advisors
FIL Investment Advisors (U.K.) Ltd.
Fidelity Investments Japan Limited
Fidelity Management & Research (Hong Kong) Limited
Fidelity Management & Research (Japan) Inc.
General Distributor
Fidelity Distributors Corporation Boston, MA
Transfer and Service Agents
Fidelity Investments Institutional Operations Company, Inc. Boston, MA
To view a fund's proxy voting guidelines and proxy voting record for the 12-month period ended June 30, visit http://www.fidelity.com (search for "proxy voting guidelines") or visit the Securities and Exchange Commission's (SEC) web site at http://www.sec.gov. You may also call 1-877-208-0098 to request a free copy of the proxy voting guidelines.
Fidelity Variable Insurance Products are separate account options which are purchased through a variable insurance contract.
Standard & Poor's, S&P and S&P 500 are registered service marks of The McGraw-Hill Companies, Inc. and have been licensed for use by Fidelity Distributors Corporation.
Other third party marks appearing herein are the property of their respective owners.
All other marks appearing herein are registered or unregistered trademarks or service marks of FMR LLC or an affiliated company.
This report and the financial statements contained herein are submitted for the general information of the shareholders of the fund. This report is not authorized for distribution to prospective investors in the fund unless preceded or accompanied by an effective prospectus.
A fund files its complete schedule of portfolio holdings with the SEC for the first and third quarters of each fiscal year on Form N-Q. Forms N-Q are available on the SEC's web site at http://www.sec.gov. A fund's Forms N-Q may be reviewed and copied at the SEC's Public Reference Room in Washington, DC. Information regarding the operation of the SEC's Public Reference Room may be obtained by calling 1-800-SEC-0330. For a complete list of a fund's portfolio holdings, view the most recent holdings listing, semiannual report, or annual report on Fidelity's web site at http://www.fidelity.com or http://www.advisor.fidelity.com, as applicable.
NOT FDIC INSURED · MAY LOSE VALUE · NO BANK GUARANTEE
Neither the fund nor Fidelity Distributors Corporation is a bank.
Average annual total return reflects the change in the value of an investment, assuming reinvestment of the class' dividend income and capital gains (the profits earned upon the sale of securities that have grown in value, if any) and assuming a constant rate of performance each year. During periods of reimbursement by Fidelity, a fund's total return will be greater than it would be had the reimbursement not occurred. Performance numbers are net of all underlying fund operating expenses, but do not include any insurance charges imposed by your insurance company's separate account. If performance information included the effect of these additional charges, the total returns would have been lower. How a fund did yesterday is no guarantee of how it will do tomorrow.
Average Annual Total Returns
Periods ended December 31, 2008
Past 1 year
Life of fund A
VIP Materials - Initial Class
-46.88%
-26.02%
VIP Materials - Investor Class
-46.98%
-26.13%
A From April 24, 2007.
$10,000 Over Life of Fund
Let's say hypothetically that $10,000 was invested in VIP Materials Portfolio - Initial Class on April 24, 2007, when the fund started. The chart shows how the value of your investment would have changed, and also shows how the Standard & Poor's 500SM Index (S&P 500®) performed over the same period.
Comments from Tobias Welo, Portfolio Manager of VIP Materials Portfolio
By year-end 2008, the vicious credit crisis sparked in the U.S. had spread like wildfire across the world's capital markets, stunting global growth, toppling commodity prices, changing the face of the global financial system, and chasing risk-averse investors toward the sidelines. The U.S. equity markets, as measured by the Dow Jones Industrial AverageSM and Standard & Poor's 500SM Index, fell hard as a result, declining 31.93% and 37.00%, respectively, while the technology-laden NASDAQ Composite® Index slid 40.03%. Foreign market stocks saw an even sharper decline, as illustrated by the 43.28% loss of the MSCI® EAFE® Index (Europe, Australasia, Far East), a gauge of developed stock markets outside the U.S. and Canada. A generally stronger U.S. dollar also held back returns for U.S. investors in foreign equities. Emerging-markets stocks - the global performance leader only a year ago - fell harder still, dropping 53.18%, as measured by the MSCI Emerging Markets Index. The only clear winners during the past year were assets backed by the U.S. government, as investors fled from risk. Thus, the Barclays Capital U.S. Treasury Bond Index climbed 13.74% for the year, while the Barclays Capital U.S. Aggregate Bond Index - a broader measure of the U.S. investment-grade bond universe - gained a more modest 5.24%. By contrast, high-yield bonds bore the brunt of investors' increasing wariness over risk, as expressed by the Merrill Lynch® U.S. High Yield Master II Constrained Index's drop of 26.11%. The emerging-markets bond category also felt the shock of investors' risk-averse sentiment, with the JPMorgan Emerging Markets Bond Index (EMBI) Global falling 10.91%. Meanwhile, the Citigroup® Non-U.S. Group of 7 Index - representing the debt performance of major global economies, excluding the United States - eked out a 1.69% gain.
For the one-year period ending December 31, 2008, the fund's return mirrored the -46.66% return of the MSCI® US Investable Market Materials Index and underperformed the return of the S&P 500®. (For specific portfolio results, please see the performance section of this report.) Strong industry selection played a key role in the fund's performance versus the MSCI index, including overweightings in gold and metal/glass containers and an underweighting in paper products. Stock selection within metal/glass containers and home improvement retail also benefited results, as did the fund's allocation to cash in a down market. Among detractors, certain stock picks within specialty chemicals, commodity chemicals and steel hurt, as did an underweighting in construction materials. In addition, while we saw mixed results from our foreign holdings, the strengthening U.S. dollar worked against fund performance. Among individual holdings, underweightings in Alcoa and Dow Chemical were positives. Aluminum company Alcoa was hampered by a steep drop-off in demand, while major index component and diversified chemicals company Dow Chemical struggled with unease surrounding its long-term competitiveness. Among detractors, underweightings in steel company Nucor and specialty chemicals firm Rohm & Haas detracted. Nucor was buoyed by its relatively strong financial position, while Rohm & Haas rose steeply in July on news of its agreement to be purchased by Dow Chemical. Some stocks I've mentioned were sold by period end.
The views expressed above reflect those of the portfolio manager(s) only through the end of the period as stated on the cover of this report and do not necessarily represent the views of Fidelity or any other person in the Fidelity organization. Any such views are subject to change at any time based upon market or other conditions and Fidelity disclaims any responsibility to update such views. These views may not be relied on as investment advice and, because investment decisions for a Fidelity fund are based on numerous factors, may not be relied on as an indication of trading intent on behalf of any Fidelity fund.
As a shareholder of the Fund, you incur two types of costs: (1) transaction costs, including redemption fees, and (2) ongoing costs, including management fees and other Fund expenses. This Example is intended to help you understand your ongoing costs (in dollars) of investing in the Fund and to compare these costs with the ongoing costs of investing in other mutual funds.
The Example is based on an investment of $1,000 invested at the beginning of the period and held for the entire period (July 1, 2008 to December 31, 2008).
Actual Expenses
The first line of the accompanying table for each class of the Fund provides information about actual account values and actual expenses. You may use the information in this line, together with the amount you invested, to estimate the expenses that you paid over the period. Simply divide your account value by $1,000.00 (for example, an $8,600 account value divided by $1,000.00 = 8.6), then multiply the result by the number in the first line for a class of the Fund under the heading entitled "Expenses Paid During Period" to estimate the expenses you paid on your account during this period. The estimate of expenses does not include any fees or other expenses of any variable annuity or variable life insurance product. If they were, the estimate of expenses you paid during the period would be higher, and your ending account value would be lower. In addition, the Fund, as a shareholder in the underlying Fidelity Central Funds, will indirectly bear its pro rata share of the fees and expenses incurred by the underlying Fidelity Central Funds. These fees and expenses are not included in the Fund's annualized expense ratio used to calculate the expense estimate in the table below.
Hypothetical Example for Comparison Purposes
The second line of the accompanying table for each class of the Fund provides information about hypothetical account values and hypothetical expenses based on a Class' actual expense ratio and an assumed rate of return of 5% per year before expenses, which is not the Class' actual return. The hypothetical account values and expenses may not be used to estimate the actual ending account balance or expenses you paid for the period. You may use this information to compare the ongoing costs of investing in the Fund and other funds. To do so, compare this 5% hypothetical example with the 5% hypothetical examples that appear in the shareholder reports of the other funds. The estimate of expenses does not include any fees or other expenses of any variable annuity or variable life insurance product. If they were, the estimate of expenses you paid during the period would be higher, and your ending account value would be lower. In addition, the Fund, as a shareholder in the underlying Fidelity Central Funds, will indirectly bear its pro rata share of the fees and expenses incurred by the underlying Fidelity Central Funds. These fees and expenses are not included in the Fund's annualized expense ratio used to calculate the expense estimate in the table below.
Please note that the expenses shown in the table are meant to highlight your ongoing costs only and do not reflect any transaction costs. Therefore, the second line of the table is useful in comparing ongoing costs only, and will not help you determine the relative total costs of owning different funds. In addition, if these transactional costs were included, your costs would have been higher.
Annualized Expense Ratio
Beginning Account Value July 1, 2008
Ending Account Value December 31, 2008
Expenses Paid During Period* July 1, 2008 to December 31, 2008
Initial Class
.94%
Actual
$ 1,000.00
$ 502.00
$ 3.55
HypotheticalA
$ 1,000.00
$ 1,020.41
$ 4.77
Investor Class
1.03%
Actual
$ 1,000.00
$ 501.50
$ 3.89
HypotheticalA
$ 1,000.00
$ 1,019.96
$ 5.23
A 5% return per year before expenses
* Expenses are equal to each Class' annualized expense ratio, multiplied by the average account value over the period, multiplied by 184/366 (to reflect the one-half year period).
Annual Report
Investment Changes (Unaudited)
Top Ten Stocks as of December 31, 2008
% of fund's net assets
% of fund's net assets 6 months ago
Monsanto Co.
12.5
10.9
E.I. du Pont de Nemours & Co.
7.5
6.8
Praxair, Inc.
6.3
2.0
Newmont Mining Corp.
5.5
3.8
FMC Corp.
3.9
2.7
Owens-Illinois, Inc.
3.8
1.8
Airgas, Inc.
3.7
1.4
Freeport-McMoRan Copper & Gold, Inc. Class B
3.4
8.3
Weyerhaeuser Co.
3.2
1.6
Lubrizol Corp.
3.1
0.0
52.9
Top Industries (% of fund's net assets)
As of December 31, 2008
Chemicals
55.3%
Metals & Mining
16.6%
Containers & Packaging
13.7%
Paper & Forest Products
3.2%
Construction Materials
2.3%
All Others*
8.9%
As of June 30, 2008
Chemicals
43.4%
Metals & Mining
38.9%
Containers & Packaging
7.5%
Paper & Forest Products
1.7%
Oil, Gas & Consumable Fuels
1.2%
All Others*
7.3%
* Includes short-term investments and net other assets.
Prior period industry classifications reflect the categories in place as of the date indicated and have not been adjusted to reflect current industry classifications.
Annual Report
Investments December 31, 2008
Showing Percentage of Net Assets
Common Stocks - 95.9%
Shares
Value
BUILDING PRODUCTS - 2.1%
Building Products - 2.1%
Masco Corp.
28,700
$ 319,431
USG Corp. (a)
7,600
61,104
380,535
CHEMICALS - 54.9%
Commodity Chemicals - 2.8%
Celanese Corp. Class A
39,700
493,471
Diversified Chemicals - 12.8%
E.I. du Pont de Nemours & Co.
52,751
1,334,600
FMC Corp.
15,800
706,734
Solutia, Inc. (a)
54,200
243,900
2,285,234
Fertilizers & Agricultural Chemicals - 12.5%
Monsanto Co.
31,724
2,231,785
Industrial Gases - 11.5%
Air Products & Chemicals, Inc.
5,300
266,431
Airgas, Inc.
16,600
647,234
Praxair, Inc.
19,000
1,127,840
2,041,505
Specialty Chemicals - 15.3%
Albemarle Corp.
21,635
482,461
Ecolab, Inc.
14,900
523,735
Lubrizol Corp.
15,425
561,316
Nalco Holding Co.
24,300
280,422
Rockwood Holdings, Inc. (a)
8,400
90,720
Rohm & Haas Co.
5,300
327,487
Valspar Corp.
9,400
170,046
W.R. Grace & Co. (a)
49,400
294,918
2,731,105
TOTAL CHEMICALS
9,783,100
CONSTRUCTION MATERIALS - 2.3%
Construction Materials - 2.3%
Martin Marietta Materials, Inc.
4,200
407,736
CONTAINERS & PACKAGING - 13.7%
Metal & Glass Containers - 10.2%
Ball Corp.
9,500
395,105
Crown Holdings, Inc. (a)
19,229
369,197
Myers Industries, Inc.
4,992
39,936
Owens-Illinois, Inc. (a)
24,400
666,852
Pactiv Corp. (a)
13,700
340,856
1,811,946
Paper Packaging - 3.5%
Packaging Corp. of America
16,500
222,090
Shares
Value
Rock-Tenn Co. Class A
8,436
$ 288,342
Temple-Inland, Inc.
24,474
117,475
627,907
TOTAL CONTAINERS & PACKAGING
2,439,853
HOUSEHOLD DURABLES - 0.2%
Homebuilding - 0.2%
Centex Corp.
3,200
34,048
MACHINERY - 0.6%
Construction & Farm Machinery & Heavy Trucks - 0.6%
Deere & Co.
2,600
99,632
MARINE - 1.1%
Marine - 1.1%
Safe Bulkers, Inc.
14,400
96,192
Ultrapetrol (Bahamas) Ltd. (a)
29,300
93,467
189,659
METALS & MINING - 16.0%
Diversified Metals & Mining - 4.3%
BHP Billiton PLC
8,100
159,459
Freeport-McMoRan Copper & Gold, Inc. Class B
24,800
606,112
765,571
Gold - 8.1%
Agnico-Eagle Mines Ltd.
2,900
149,612
Goldcorp, Inc.
2,800
88,347
Newmont Mining Corp.
24,200
984,940
Randgold Resources Ltd. sponsored ADR
1,300
57,096
Yamana Gold, Inc.
20,400
158,445
1,438,440
Precious Metals & Minerals - 0.3%
Impala Platinum Holdings Ltd.
3,513
50,918
Steel - 3.3%
Cliffs Natural Resources, Inc.
8,400
215,124
Commercial Metals Co.
5,700
67,659
Steel Dynamics, Inc.
28,100
314,158
596,941
TOTAL METALS & MINING
2,851,870
OIL, GAS & CONSUMABLE FUELS - 1.0%
Coal & Consumable Fuels - 1.0%
CONSOL Energy, Inc.
2,700
77,166
Foundation Coal Holdings, Inc.
2,600
36,452
Massey Energy Co.
4,800
66,192
179,810
PAPER & FOREST PRODUCTS - 3.2%
Forest Products - 3.2%
Weyerhaeuser Co.
18,500
566,285
Common Stocks - continued
Shares
Value
TRANSPORTATION INFRASTRUCTURE - 0.8%
Marine Ports & Services - 0.8%
Aegean Marine Petroleum Network, Inc.
8,900
$ 150,944
TOTAL COMMON STOCKS
(Cost $27,459,374)
17,083,472
Nonconvertible Bonds - 0.6%
Principal Amount
METALS & MINING - 0.6%
Steel - 0.6%
Steel Dynamics, Inc. 6.75% 4/1/15 (Cost $93,122)
$ 150,000
100,500
Floating Rate Loans - 0.4%
MATERIALS - 0.4%
Chemicals - 0.4%
Celanese Holding LLC term loan 5.5525% 4/2/14 (c)
(Cost $77,244)
101,021
68,189
Money Market Funds - 5.2%
Shares
Value
Fidelity Cash Central Fund, 1.06% (b) (Cost $921,451)
921,451
$ 921,451
TOTAL INVESTMENT PORTFOLIO - 102.1%
(Cost $28,551,191)
18,173,612
NET OTHER ASSETS - (2.1)%
(366,539)
NET ASSETS - 100%
$ 17,807,073
Legend
(a) Non-income producing
(b) Affiliated fund that is available only to investment companies and other accounts managed by Fidelity Investments. The rate quoted is the annualized seven-day yield of the fund at period end. A complete unaudited listing of the fund's holdings as of its most recent quarter end is available upon request.
(c) The coupon rate shown on floating or adjustable rate securities represents the rate at period end.
Affiliated Central Funds
Information regarding fiscal year to date income earned by the Fund from investments in Fidelity Central Funds is as follows:
Fund
Income earned
Fidelity Cash Central Fund
$ 36,046
Other Information
The following is a summary of the inputs used, as of December 31, 2008, involving the Fund's assets carried at value. The inputs or methodology used for valuing securities may not be an indication of the risk associated with investing in those securities. For more information on valuation inputs, and their aggregation into the levels used in the table below, please refer to the Security Valuation section in the accompanying Notes to Financial Statements.
Valuation Inputs at Reporting Date:
Description
Total
Level 1
Level 2
Level 3
Investments in Securities
$ 18,173,612
$ 17,794,546
$ 379,066
$ -
Income Tax Information
At December 31, 2008, the fund had a capital loss carryforward of approximately $8,497,719 all of which will expire on December 31, 2016.
The fund intends to elect to defer to its fiscal year ending December 31, 2009 approximately $1,808,501 of losses recognized during the period November 1, 2008 to December 31, 2008.
See accompanying notes which are an integral part of the financial statements.
Investment in securities, at value - See accompanying schedule:
Unaffiliated issuers (cost $27,629,740)
$ 17,252,161
Fidelity Central Funds (cost $921,451)
921,451
Total Investments (cost $28,551,191)
$ 18,173,612
Cash
2,516
Receivable for investments sold
38,863
Receivable for fund shares sold
50,836
Dividends receivable
19,552
Interest receivable
2,767
Distributions receivable from Fidelity Central Funds
1,091
Prepaid expenses
253
Other receivables
311
Total assets
18,289,801
Liabilities
Payable for investments purchased
$ 433,206
Payable for fund shares redeemed
21
Accrued management fee
7,861
Other affiliated payables
1,971
Other payables and accrued expenses
39,669
Total liabilities
482,728
Net Assets
$ 17,807,073
Net Assets consist of:
Paid in capital
$ 39,166,277
Undistributed net investment income
280
Accumulated undistributed net realized gain (loss) on investments and foreign currency transactions
(10,981,897)
Net unrealized appreciation (depreciation) on investments and assets and liabilities in foreign currencies
(10,377,587)
Net Assets
$ 17,807,073
Statement of Assets and Liabilities - continued
December 31, 2008
Initial Class: Net Asset Value, offering price and redemption price per share ($9,963,174 ÷ 1,718,346 shares)
$ 5.80
Investor Class: Net Asset Value, offering price and redemption price per share ($7,843,899 ÷ 1,352,192 shares)
$ 5.80
See accompanying notes which are an integral part of the financial statements.
Annual Report
Financial Statements - continued
Statement of Operations
Year ended December 31, 2008
Investment Income
Dividends
$ 476,787
Interest
981
Income from Fidelity Central Funds
36,046
Total income
513,814
Expenses
Management fee
$ 177,538
Transfer agent fees
40,898
Accounting fees and expenses
12,360
Custodian fees and expenses
23,446
Independent trustees' compensation
149
Audit
34,040
Legal
161
Interest
2,940
Miscellaneous
1,915
Total expenses before reductions
293,447
Expense reductions
(1,674)
291,773
Net investment income (loss)
222,041
Realized and Unrealized Gain (Loss)
Net realized gain (loss) on:
Investment securities:
Unaffiliated issuers
(10,925,908)
Foreign currency transactions
(5,916)
Total net realized gain (loss)
(10,931,824)
Change in net unrealized appreciation (depreciation) on:
Investment securities
(11,526,110)
Assets and liabilities in foreign currencies
(6)
Total change in net unrealized appreciation (depreciation)
(11,526,116)
Net gain (loss)
(22,457,940)
Net increase (decrease) in net assets resulting from operations
$ (22,235,899)
Statement of Changes in Net Assets
Year ended December 31, 2008
For the period April 24, 2007 (Commencement of operations) to December 31, 2007
Increase (Decrease) in Net Assets
Operations
Net investment income (loss)
$ 222,041
$ 138,828
Net realized gain (loss)
(10,931,824)
295,085
Change in net unrealized appreciation (depreciation)
(11,526,116)
1,148,529
Net increase (decrease) in net assets resulting from operations
(22,235,899)
1,582,442
Distributions to shareholders from net investment income
(219,419)
(150,736)
Distributions to shareholders from net realized gain
(132,142)
(237,160)
Total distributions
(351,561)
(387,896)
Share transactions - net increase (decrease)
15,709,835
23,315,139
Redemption fees
161,568
13,445
Total increase (decrease) in net assets
(6,716,057)
24,523,130
Net Assets
Beginning of period
24,523,130
-
End of period (including undistributed net investment income of $280 and $0, respectively)
$ 17,807,073
$ 24,523,130
See accompanying notes which are an integral part of the financial statements.
Annual Report
Financial Highlights - Initial Class
Years ended December 31,
2008
2007 I
Selected Per-Share Data
Net asset value, beginning of period
$ 11.13
$ 10.00
Income from Investment Operations
Net investment income (loss)
.07
.10 H
Net realized and unrealized gain (loss) E
(5.31)
1.20
Total from investment operations
(5.24)
1.30
Distributions from net investment income
(.08)
(.07)
Distributions from net realized gain
(.06)
(.11)
Total distributions
(.14)
(.18)
Redemption fees added to paid in capital E
.05
.01
Net asset value, end of period
$ 5.80
$ 11.13
Total Return B, C, D
(46.88)%
13.12%
Ratios to Average Net Assets F, J
Expenses before reductions
.88%
1.08% A
Expenses net of fee waivers, if any
.88%
1.00% A
Expenses net of all reductions
.88%
1.00% A
Net investment income (loss)
.74%
1.31% A, H
Supplemental Data
Net assets, end of period (000 omitted)
$ 9,963
$ 13,730
Portfolio turnover rate G
171%
35% A
A Annualized B Total returns for periods of less than one year are not annualized. C Total returns do not reflect charges attributable to your insurance company's separate account. Inclusion of these charges would reduce the total returns shown. D Total returns would have been lower had certain expenses not been reduced during the periods shown. E Calculated based on average shares outstanding during the period. F Fees and expenses of the underlying Fidelity Central Funds are not included in the Fund's expense ratio. The Fund indirectly bears its proportionate share of the expenses of any underlying Fidelity Central Funds. G Amount does not include the portfolio activity of any underlying Fidelity Central Funds. H Investment income per share reflects a special dividend which amounted to $.02 per share. Excluding the special dividend, the ratio of net investment income (loss) to average net assets would have been 1.03%. I For the period April 24, 2007 (commencement of operations) to December 31, 2007. J Expense ratios reflect operating expenses of the class. Expenses before reductions do not reflect amounts reimbursed by the investment adviser or reductions from brokerage service arrangements or other expense offset arrangements and do not represent the amount paid by the class during periods when reimbursements or reductions occur. Expense ratios before reductions for start-up periods may not be representative of longer-term operating periods. Expenses net of fee waivers reflect expenses after reimbursement by the investment adviser but prior to reductions from brokerage service arrangements or other expense offset arrangements. Expenses net of all reductions represent the net expenses paid by the class.
Financial Highlights - Investor Class
Years ended December 31,
2008
2007 I
Selected Per-Share Data
Net asset value, beginning of period
$ 11.13
$ 10.00
Income from Investment Operations
Net investment income (loss)
.06
.09 H
Net realized and unrealized gain (loss) E
(5.31)
1.21
Total from investment operations
(5.25)
1.30
Distributions from net investment income
(.07)
(.07)
Distributions from net realized gain
(.06)
(.11)
Total distributions
(.13)
(.18)
Redemption fees added to paid in capital E
.05
.01
Net asset value, end of period
$ 5.80
$ 11.13
Total Return B, C, D
(46.98)%
13.05%
Ratios to Average Net Assets F, J
Expenses before reductions
.97%
1.20% A
Expenses net of fee waivers, if any
.97%
1.15% A
Expenses net of all reductions
.96%
1.15% A
Net investment income (loss)
.65%
1.16% A, H
Supplemental Data
Net assets, end of period (000 omitted)
$ 7,844
$ 10,793
Portfolio turnover rate G
171%
35% A
A Annualized B Total returns for periods of less than one year are not annualized. C Total returns do not reflect charges attributable to your insurance company's separate account. Inclusion of these charges would reduce the total returns shown. D Total returns would have been lower had certain expenses not been reduced during the periods shown. E Calculated based on average shares outstanding during the period. F Fees and expenses of the underlying Fidelity Central Funds are not included in the Fund's expense ratio. The Fund indirectly bears its proportionate share of the expenses of any underlying Fidelity Central Funds. G Amount does not include the portfolio activity of any underlying Fidelity Central Funds. H Investment income per share reflects a special dividend which amounted to $.02 per share. Excluding the special dividend, the ratio of net investment income (loss) to average net assets would have been .88%. I For the period April 24, 2007 (commencement of operations) to December 31, 2007. J Expense ratios reflect operating expenses of the class. Expenses before reductions do not reflect amounts reimbursed by the investment adviser or reductions from brokerage service arrangements or other expense offset arrangements and do not represent the amount paid by the class during periods when reimbursements or reductions occur. Expense ratios before reductions for start-up periods may not be representative of longer-term operating periods. Expenses net of fee waivers reflect expenses after reimbursement by the investment adviser but prior to reductions from brokerage service arrangements or other expense offset arrangements. Expenses net of all reductions represent the net expenses paid by the class.
See accompanying notes which are an integral part of the financial statements.
VIP Materials Portfolio (the Fund) is a non-diversified fund of Variable Insurance Products Fund IV (the trust) and is authorized to issue an unlimited number of shares. The trust is registered under the Investment Company Act of 1940, as amended (the 1940 Act), as an open-end management investment company organized as a Massachusetts business trust. Shares of the Fund may only be purchased by insurance companies for the purpose of funding variable annuity or variable life insurance contracts. The Fund offers the following classes of shares: Initial Class shares and Investor Class shares. All classes have equal rights and voting privileges, except for matters affecting a single class. Investment income, realized and unrealized capital gains and losses, the common expenses of the Fund, and certain fund-level expense reductions, if any, are allocated on a pro rata basis to each class based on the relative net assets of each class to the total net assets of the Fund. Each class differs with respect to transfer agent fees incurred. Certain expense reductions also differ by class.
2. Investments in Fidelity Central Funds.
The Fund may invest in Fidelity Central Funds, which are open-end investment companies available only to other investment companies and accounts managed by Fidelity Management & Research Company (FMR) and its affiliates. The Fund's Schedule of Investments lists each of the Fidelity Central Funds held as of period end, if any, as an investment of the Fund, but does not include the underlying holdings of each Fidelity Central Fund. As an Investing Fund, the Fund indirectly bears its proportionate share of the expenses of the underlying Fidelity Central Funds.
The Money Market Central Funds seek preservation of capital and current income and are managed by Fidelity Investments Money Management, Inc. (FIMM), an affiliate of FMR.
A complete unaudited list of holdings for each Fidelity Central Fund is available upon request or at the SEC's web site at www.sec.gov. In addition, the financial statements of the Fidelity Central Funds, which are not covered by the Fund's Report of Independent Registered Public Accounting Firm, are available on the SEC's web site or upon request.
3. Significant Accounting Policies.
The financial statements have been prepared in conformity with accounting principles generally accepted in the United States of America, which require management to make certain estimates and assumptions at the date of the financial statements. Actual results could differ from those estimates. The following summarizes the significant accounting policies of the Fund:
Security Valuation. Investments are valued as of 4:00 p.m. Eastern time on the last calendar day of the period. Wherever possible, the Fund uses independent pricing services approved by the Board of Trustees to value its investments.
Equity securities, including restricted securities, for which market quotations are readily available, are valued at the last reported sale price or official closing price as reported by an independent pricing service on the primary market or exchange on which they are traded. In the event there were no sales during the day or closing prices are not available, securities are valued at the last quoted bid price.
Debt securities, including restricted securities, are valued by independent pricing services or by dealers who make markets in such securities. Pricing services consider yield or price of bonds of comparable quality, coupon, maturity and type as well as dealer supplied prices Investments in open-end mutual funds, including the Fidelity Central Funds, are valued at their closing net asset value each business day. Short-term securities with remaining maturities of sixty days or less for which quotations are not readily available are valued at amortized cost, which approximates value.
When current market prices or quotations are not readily available or reliable, valuations may be determined in good faith in accordance with procedures adopted by the Board of Trustees. Factors used in determining value may include significant market or security specific events, changes in interest rates and credit quality, and developments in foreign markets which are monitored by evaluating the performance of ADRs, futures contracts and exchange-traded funds. The frequency with which these procedures are used cannot be predicted and may be utilized to a significant extent. The value of securities used for net asset value (NAV) calculation under these procedures may differ from published prices for the same securities.
The Fund is subject to the provisions of Statement of Financial Accounting Standards No. 157, "Fair Value Measurements" (SFAS 157), effective with the beginning of the Fund's fiscal year. SFAS 157 establishes a hierarchy that prioritizes the inputs to valuation techniques giving the highest priority to readily available unadjusted quoted prices in active markets for identical assets (level 1 measurements) and the lowest priority to unobservable inputs (level 3 measurements) when market prices are not readily available or reliable. The three levels of the hierarchy under SFAS 157 are described below:
Level 1
Quoted prices in active markets for identical securities.
Level 2
Prices determined using other significant observable inputs. Observable inputs are inputs that other market participants may use in pricing a security. These may include quoted prices for similar securities, interest rates, prepayment speeds, credit risk and others.
Level 3
Prices determined using significant unobservable inputs. In situations where quoted prices or observable inputs are unavailable or deemed less relevant (for example, when there is little or no market activity for an investment at the end of the period), unobservable inputs may be used. Unobservable inputs reflect the Fund's own assumptions about the factors market participants would use in pricing an investment, and would be based on the best information available.
Annual Report
3. Significant Accounting Policies - continued
Security Valuation - continued
Changes in valuation techniques may result in transfers in or out of an investment's assigned level within the hierarchy.
The aggregate value by input level, as of December 31, 2008, for the Fund's investments is included at the end of the Fund's Schedule of Investments.
Foreign Currency. The Fund uses foreign currency contracts to facilitate transactions in foreign-denominated securities. Losses from these transactions may arise from changes in the value of the foreign currency or if the counterparties do not perform under the contracts' terms.
Foreign-denominated assets, including investment securities, and liabilities are translated into U.S. dollars at the exchange rate at period end. Purchases and sales of investment securities, income and dividends received and expenses denominated in foreign currencies are translated into U.S. dollars at the exchange rate in effect on the transaction date.
The effects of exchange rate fluctuations on investments are included with the net realized and unrealized gain (loss) on investment securities. Other foreign currency transactions resulting in realized and unrealized gain (loss) are disclosed separately.
Investment Transactions and Income. For financial reporting purposes, the Fund's investment holdings and NAV include trades executed through the end of the last business day of the period. The NAV per share for processing shareholder transactions is calculated as of the close of business of the New York Stock Exchange (NYSE), normally 4:00 p.m. Eastern time and includes trades executed through the end of the prior business day. Gains and losses on securities sold are determined on the basis of identified cost. Dividend income is recorded on the ex-dividend date, except for certain dividends from foreign securities where the ex-dividend date may have passed, which are recorded as soon as the Fund is informed of the ex-dividend date. Non-cash dividends included in dividend income, if any, are recorded at the fair market value of the securities received. Distributions received on securities that represent a return of capital or capital gain are recorded as a reduction of cost of investments and/or as a realized gain. The Fund estimates the components of distributions received that may be considered return of capital distributions or capital gain distributions. Interest income and distributions from the Fidelity Central Funds are accrued as earned. Interest income includes coupon interest and amortization of premium and accretion of discount on debt securities. Investment income is recorded net of foreign taxes withheld where recovery of such taxes is uncertain.
Expenses. Most expenses of the trust can be directly attributed to a fund. Expenses which cannot be directly attributed are apportioned among each Fund in the trust. Expense estimates are accrued in the period to which they relate and adjustments are made when actual amounts are known.
Income Tax Information and Distributions to Shareholders. Each year, the Fund intends to qualify as a regulated investment company by distributing substantially all of its taxable income and realized gains under Subchapter M of the Internal Revenue Code and filing its U.S. federal tax return. As a result, no provision for income taxes is required. The Fund is subject to the provisions of FASB Interpretation No. 48, Accounting for Uncertainties in Income Taxes (FIN 48). FIN 48 sets forth a minimum threshold for financial statement recognition of the benefit of a tax position taken or expected to be taken in a tax return. There are no unrecognized tax benefits in the accompanying financial statements. A Fund's federal tax return is subject to examination by the Internal Revenue Service (IRS) for a period of three years. Foreign taxes are provided for based on the Fund's understanding of the tax rules and rates that exist in the foreign markets in which it invests.
Distributions are recorded on the ex-dividend date. Income dividends and capital gain distributions are declared separately for each class. Income and capital gain distributions are determined in accordance with income tax regulations, which may differ from generally accepted accounting principles.
Capital accounts within the financial statements are adjusted for permanent book-tax differences. These adjustments have no impact on net assets or the results of operations. Temporary book-tax differences will reverse in a subsequent period.
Book-tax differences are primarily due to foreign currency transactions, passive foreign investment companies (PFIC), capital loss carryforwards and losses deferred due to wash sales and excise tax regulations.
The tax-basis components of distributable earnings and the federal tax cost as of period end were as follows:
Unrealized appreciation
$ 538,835
Unrealized depreciation
(11,591,819)
Net unrealized appreciation (depreciation)
(11,052,984)
Capital loss carryforward
(8,497,719)
Cost for federal income tax purposes
$ 29,226,596
Annual Report
Notes to Financial Statements - continued
3. Significant Accounting Policies - continued
Income Tax Information and Distributions to Shareholders - continued
The tax character of distributions paid was as follows:
December 31, 2008
December 31, 2007
Ordinary Income
$ 351,561
$ 387,896
Trading (Redemption) Fees. Shares held less than 60 days are subject to a redemption fee equal to 1% of the proceeds of the redeemed shares. All redemption fees, including any estimated redemption fees paid by FMR, are retained by the Fund and accounted for as an addition to paid in capital.
4. Operating Policies.
Repurchase Agreements. FMR has received an Exemptive Order from the Securities and Exchange Commission (the SEC) which permits the Fund and other affiliated entities of FMR to transfer uninvested cash balances into joint trading accounts which are then invested in repurchase agreements. The Fund may also invest directly with institutions in repurchase agreements. Repurchase agreements are collateralized by government or non-government securities. Upon settlement date, collateral is held in segregated accounts with custodian banks and may be obtained in the event of a default of the counterparty. The Fund monitors, on a daily basis, the value of the collateral to ensure it is at least equal to the principal amount of the repurchase agreement (including accrued interest). In the event of a default by the counterparty, realization of the collateral proceeds could be delayed, during which time the value of the collateral may decline.
Loans and Other Direct Debt Instruments. The Fund may invest in loans and loan participations, trade claims or other receivables. These investments may include standby financing commitments, including revolving credit facilities that obligate the Fund to supply additional cash to the borrower on demand. Loan participations involve a risk of insolvency of the lending bank or other financial intermediary. The Fund may be contractually obligated to receive approval from the agent bank and/or borrower prior to the sale of these investments.
5. Purchases and Sales of Investments.
Purchases and sales of securities, other than short-term securities, aggregated $68,984,696 and $52,357,635, respectively.
6. Fees and Other Transactions with Affiliates.
Management Fee. FMR and its affiliates provide the Fund with investment management related services for which the Fund pays a monthly management fee. The management fee is the sum of an individual fund fee rate that is based on an annual rate of .30% of the Fund's average net assets and a group fee rate that averaged .26% during the period. The group fee rate is based upon the average net assets of all the mutual funds advised by FMR. The group fee rate decreases as assets under management increase and increases as assets under management decrease. For the period, the total annual management fee rate was .56% of the Fund's average net assets.
Transfer Agent Fees. Fidelity Investments Institutional Operations Company, Inc. (FIIOC), an affiliate of FMR, is the Fund's transfer, dividend disbursing, and shareholder servicing agent. FIIOC receives an asset-based fee with respect to each class. Each class (with the exception of Investor Class) pays a transfer agent fee, excluding out of pocket expenses, equal to an annual rate of .07% of average net assets. Investor Class pays a monthly asset-based transfer agent fee of .15% of average net assets. Prior to February 1, 2008, Investor Class paid a monthly asset-based transfer agent fee of .18% of average net assets. The total transfer agent fees paid by each class to FIIOC, including out of pocket expenses, were as follows:
Initial Class
15,059
Investor Class
25,839
$ 40,898
Accounting Fees. Fidelity Service Company, Inc. (FSC), an affiliate of FMR, maintains the Fund's accounting records. The fee is based on the level of average net assets for the month.
Brokerage Commissions. The Fund placed a portion of its portfolio transactions with brokerage firms which are affiliates of the investment adviser. The commissions paid to these affiliated firms were $3,127 for the period.
7. Committed Line of Credit.
The Fund participates with other funds managed by FMR in a $4.2 billion credit facility (the "line of credit") to be utilized for temporary or emergency purposes to fund shareholder redemptions or for other short-term liquidity purposes. The Fund has agreed to pay commitment fees on its pro rata portion of the line of credit, which amounted to $47 and is reflected in Miscellaneous Expense on the Statement of Operations. During the period, there were no borrowings on this line of credit.
Annual Report
8. Bank Borrowings.
The Fund is permitted to have bank borrowings for temporary or emergency purposes to fund shareholder redemptions. The Fund has established borrowing arrangements with certain banks. The interest rate on the borrowings is the bank's base rate, as revised from time to time. The average daily loan balance during the period for which loans were outstanding amounted to $9,154,800. The weighted average interest rate was 2.31%. The interest expense amounted to $2,940 under the bank borrowing program. At period end, there were no bank borrowings outstanding.
9. Expense Reductions.
Many of the brokers with whom FMR places trades on behalf of the Fund provided services to the Fund in addition to trade execution. These services included payments of certain expenses on behalf of the Fund totaling $1,674 for the period.
10. Other.
The Fund's organizational documents provide former and current trustees and officers with a limited indemnification against liabilities arising in connection with the performance of their duties to the Fund. In the normal course of business, the Fund may also enter into contracts that provide general indemnifications. The Fund's maximum exposure under these arrangements is unknown as this would be dependent on future claims that may be made against the Fund. The risk of material loss from such claims is considered remote.
At the end of the period, FMR or its affiliates were the owners of record of 100% of the total outstanding shares of the fund.
11. Distributions to Shareholders.
Distributions to shareholders of each class were as follows:
Years ended December 31,
2008
2007 A
From net investment income
Initial Class
$ 130,583
$ 88,019
Investor Class
88,836
62,717
Total
$ 219,419
$ 150,736
From net realized gain
Initial Class
69,513
132,632
Investor Class
62,629
104,528
Total
$ 132,142
$ 237,160
A For the period April 24, 2007 (commencement of operations) to December 31, 2007.
12. Share Transactions.
Transactions for each class of shares were as follows:
Shares
Dollars
Years ended December 31,
2008
2007 A
2008
2007 A
Initial Class
Shares sold
2,413,136
1,343,772
$ 26,368,625
$ 14,140,777
Reinvestment of distributions
29,762
19,701
200,096
220,651
Shares redeemed
(1,958,182)
(129,843)
(18,118,552)
(1,378,897)
Net increase (decrease)
484,716
1,233,630
$ 8,450,169
$ 12,982,531
Investor Class
Shares sold
2,230,231
1,131,664
$ 25,342,249
$ 11,981,220
Reinvestment of distributions
21,729
14,932
151,465
167,245
Shares redeemed
(1,869,798)
(176,566)
(18,234,048)
(1,815,857)
Net increase (decrease)
382,162
970,030
$ 7,259,666
$ 10,332,608
A For the period April 24, 2007 (commencement of operations) to December 31, 2007.
Annual Report
Reportof Independent Registered Public Accounting Firm
To the Trustees of Variable Insurance Products Fund IV and the Shareholders of VIP Materials Portfolio:
In our opinion, the accompanying statement of assets and liabilities, including the schedule of investments, and the related statements of operations and of changes in net assets and the financial highlights present fairly, in all material respects, the financial position of VIP Materials Portfolio (a fund of Variable Insurance Products Fund IV) at December 31, 2008, the results of its operations for the year then ended, the changes in its net assets for each of the periods indicated and the financial highlights for each of the periods indicated, in conformity with accounting principles generally accepted in the United States of America. These financial statements and financial highlights (hereafter referred to as "financial statements") are the responsibility of the VIP Materials Portfolio's management. Our responsibility is to express an opinion on these financial statements based on our audits. We conducted our audits of these financial statements in accordance with the standards of the Public Company Accounting Oversight Board (United States). Those standards require that we plan and perform the audit to obtain reasonable assurance about whether the financial statements are free of material misstatement. An audit includes examining, on a test basis, evidence supporting the amounts and disclosures in the financial statements, assessing the accounting principles used and significant estimates made by management, and evaluating the overall financial statement presentation. We believe that our audits, which included confirmation of securities at December 31, 2008 by correspondence with the custodian and brokers, provide a reasonable basis for our opinion.
The Trustees, Member of the Advisory Board, and executive officers of the trust and fund, as applicable, are listed below. The Board of Trustees governs the fund and is responsible for protecting the interests of shareholders. The Trustees are experienced executives who meet periodically throughout the year to oversee the fund's activities, review contractual arrangements with companies that provide services to the fund, and review the fund's performance. Except for Edward C. Johnson 3d and James C. Curvey, each of the Trustees oversees 222 funds advised by FMR or an affiliate. Messrs. Johnson and Curvey oversee 381 funds advised by FMR or an affiliate.
The Trustees hold office without limit in time except that (a) any Trustee may resign; (b) any Trustee may be removed by written instrument, signed by at least two-thirds of the number of Trustees prior to such removal; (c) any Trustee who requests to be retired or who has become incapacitated by illness or injury may be retired by written instrument signed by a majority of the other Trustees; and (d) any Trustee may be removed at any special meeting of shareholders by a two-thirds vote of the outstanding voting securities of the trust. Each Trustee who is not an interested person (as defined in the 1940 Act) (Independent Trustee), shall retire not later than the last day of the calendar year in which his or her 72nd birthday occurs. The Independent Trustees may waive this mandatory retirement age policy with respect to individual Trustees. The executive officers and Advisory Board Member hold office without limit in time, except that any officer and Advisory Board Member may resign or may be removed by a vote of a majority of the Trustees at any regular meeting or any special meeting of the Trustees. Except as indicated, each individual has held the office shown or other offices in the same company for the past five years.
The fund's Statement of Additional Information (SAI) includes more information about the Trustees. To request a free copy, call Fidelity at 1-877-0098.
Interested Trustees*:
Correspondence intended for each Trustee who is an interested person may be sent to Fidelity Investments, 82 Devonshire Street, Boston, Massachusetts 02109.
Name, Age; Principal Occupation
Edward C. Johnson 3d (78)
Year of Election or Appointment: 1983
Mr. Johnson is Chairman of the Board of Trustees. Mr. Johnson serves as Chief Executive Officer, Chairman, and a Director of FMR LLC; Chairman and a Director of FMR; Chairman and a Director of Fidelity Research & Analysis Company (FRAC); Chairman and a Director of Fidelity Investments Money Management, Inc.; and Chairman and a Director of FMR Co., Inc. In addition, Mr. Johnson serves as Chairman and Director of FIL Limited. Previously, Mr. Johnson served as President of FMR LLC (2006-2007).
James C. Curvey (73)
Year of Election or Appointment: 2007
Mr. Curvey also serves as Trustee (2007-present) of other investment companies advised by FMR. Mr. Curvey is a Director of FMR and FMR Co., Inc. (2007-present). Mr. Curvey is also Vice Chairman (2006-present) and Director of FMR LLC. In addition, Mr. Curvey serves as an Overseer for the Boston Symphony Orchestra and a member of the Trustees of Villanova University.
* Trustees have been determined to be "Interested Trustees" by virtue of, among other things, their affiliation with the trust or various entities under common control with FMR. FMR Corp. merged with and into FMR LLC on October 1, 2007. Any references to FMR LLC for prior periods are deemed to be references to the prior entity.
Independent Trustees:
Correspondence intended for each Independent Trustee (that is, the Trustees other than the Interested Trustees) may be sent to Fidelity Investments, P.O. Box 55235, Boston, Massachusetts 02205-5235.
Name, Age; Principal Occupation
Dennis J. Dirks (60)
Year of Election or Appointment: 2005
Prior to his retirement in May 2003, Mr. Dirks was Chief Operating Officer and a member of the Board of The Depository Trust & Clearing Corporation (DTCC) (1999-2003). He also served as President, Chief Operating Officer, and Board member of The Depository Trust Company (DTC) (1999-2003) and President and Board member of the National Securities Clearing Corporation (NSCC) (1999-2003). In addition, Mr. Dirks served as Chief Executive Officer and Board member of the Government Securities Clearing Corporation (2001-2003), Chief Executive Officer and Board member of the Mortgage-Backed Securities Clearing Corporation (2001-2003), as a Trustee and a member of the Finance Committee of Manhattan College (2005-2008), and as a Trustee and a member of the Finance Committee of AHRC of Nassau County (2006-2008). Currently, Mr. Dirks serves as a member of the Board of Directors for The Brookville Center for Children's Services, Inc. (2009-present).
Alan J. Lacy (55)
Year of Election or Appointment:2008
Mr. Lacy serves as Senior Adviser (2007-present) of Oak Hill Capital Partners, L.P. (a private equity firm). Mr. Lacy also served as Chief Executive Officer (2000-2005) and Vice Chairman (2005-2006) of Sears Holdings Corporation and Sears, Roebuck and Co. (retail). In addition, Mr. Lacy serves as a member of the Board of Directors of The Western Union Company (global money transfer, 2006-present) and Bristol-Myers Squibb (global pharmaceuticals, 2007-present). Mr. Lacy is a Trustee of the National Parks Conservation Association and The Field Museum of Natural History.
Ned C. Lautenbach (64)
Year of Election or Appointment: 2000
Mr. Lautenbach is Chairman of the Independent Trustees (2006-present). Mr. Lautenbach is an Advisory Partner of Clayton, Dubilier & Rice, Inc. (private equity investment firm). Previously, Mr. Lautenbach was with the International Business Machines Corporation (IBM) from 1968 until his retirement in 1998. Mr. Lautenbach serves as a Director of Eaton Corporation (diversified industrial) as well as the Philharmonic Center for the Arts in Naples, Florida. He also is a member of the Board of Trustees of Fairfield University (2005-present), as well as a member of the Council on Foreign Relations. Previously, Mr. Lautenbach served as a Director of Sony Corporation (2006-2007).
Joseph Mauriello (64)
Year of Election or Appointment: 2008
Prior to his retirement in January 2006, Mr. Mauriello served in numerous senior management positions including Deputy Chairman and Chief Operating Officer (2004-2005), and Vice Chairman of Financial Services (2002-2004) of KPMG LLP US (professional services firm, 1965-2005). Mr. Mauriello currently serves as a member of the Board of Directors of XL Capital Ltd. (global insurance and re-insurance company, 2006-present) and of Arcadia Resources Inc. (health care services and products, 2007-present). He also served as a Director of the Hamilton Funds of the Bank of New York (2006-2007).
Cornelia M. Small (64)
Year of Election or Appointment: 2005
Ms. Small is a member of the Investment Committee, and Chair (2008-present) and a member of the Board of Trustees of Smith College. Ms. Small also serves on the Investment Committee of the Berkshire Taconic Community Foundation (2008-present). Previously, Ms. Small served as Chairperson of the Investment Committee (2002-2008) of Smith College and as Co-Chair (2000-2003) of the Annual Fund for the Fletcher School of Law and Diplomacy. In addition, she served as Chief Investment Officer, Director of Global Equity Investments, and a member of the Board of Directors of Scudder, Stevens & Clark and Scudder Kemper Investments.
William S. Stavropoulos (69)
Year of Election or Appointment: 2001
Mr. Stavropoulos is Chairman Emeritus of the Board of Directors of The Dow Chemical Company, where he previously served in numerous senior management positions, including President (1993-2000; 2002-2003), CEO (1995-2000; 2002-2004), Chairman of the Executive Committee (2000-2006), and as a member of the Board of Directors (1990-2006). Currently, he is a Director of Teradata Corporation (data warehousing and technology solutions, 2008-present), Chemical Financial Corporation, Maersk Inc. (industrial conglomerate), Tyco International, Inc. (multinational manufacturing and services, 2007-present), and a member of the Advisory Board for Metalmark Capital (private equity investment firm, 2005-present). He is a special advisor to Clayton, Dubilier & Rice, Inc. (private equity investment). In addition, Mr. Stavropoulos is a member of the University of Notre Dame Advisory Council for the College of Science.
David M. Thomas (59)
Year of Election or Appointment: 2008
Previously, Mr. Thomas served as Executive Chairman (2005-2006) and Chairman and Chief Executive Officer (2000-2005) of IMS Health, Inc. (pharmaceutical and healthcare information solutions). In addition, Mr. Thomas serves as a member of the Board of Directors of Fortune Brands, Inc. (consumer products holding company), and Interpublic Group of Companies, Inc. (marketing communication, 2004-present).
Michael E. Wiley (58)
Year of Election or Appointment: 2008
Mr. Wiley also serves as a member of the Board of Trustees of the University of Tulsa (2000-2006; 2007-present). He serves as a Director of Tesoro Corporation (independent oil refiner and marketer, 2005-present), and a Director of Bill Barrett Corporation (exploration and production company, 2005-present). In addition, he also serves as a Director of Post Oak Bank (privately-held bank, 2004-present). Previously, Mr. Wiley served as a Sr. Energy Advisor of Katzenbach Partners, LLC (consulting firm, 2006-2007), as an Advisory Director of Riverstone Holdings (private investment firm), Chairman, President, and CEO of Baker Hughes, Inc. (oilfield services company, 2000-2004), and as Director of Spinnaker Exploration Company (exploration and production company, 2001-2005).
Annual Report
Trustees and Officers - continued
Advisory Board Member and Executive Officers**:
Correspondence intended for each executive officer and Peter S. Lynch may be sent to Fidelity Investments, 82 Devonshire Street, Boston, Massachusetts 02109.
Name, Age; Principal Occupation
Peter S. Lynch (64)
Year of Election or Appointment: 2003
Member of the Advisory Board of Fidelity's Equity and High Income Funds. Mr. Lynch is Vice Chairman and a Director of FMR, and Vice Chairman (2001-present) and a Director of FMR Co., Inc. Previously, Mr. Lynch served as a Trustee of the Fidelity funds (1990-2003). In addition, he serves as a Trustee of Boston College and as the Chairman of the Inner-City Scholarship Fund. Previously, Mr. Lynch served on the Special Olympics International Board of Directors (1997-2006).
Kenneth B. Robins (39)
Year of Election or Appointment: 2008
President and Treasurer of Fidelity's Equity and High Income Funds. Mr. Robins is an employee of Fidelity Investments (2004-present). Before joining Fidelity Investments, Mr. Robins worked at KPMG LLP, where he was a partner in KPMG's department of professional practice (2002-2004).
Brian B. Hogan (44)
Year of Election or Appointment: 2007
Vice President of Sector Funds. Mr. Hogan also serves as Senior Vice President, Equity Research of FMR. Previously, Mr. Hogan served as a portfolio manager.
Scott C. Goebel (40)
Year of Election or Appointment: 2008
Secretary and Chief Legal Officer (CLO) of the Fidelity funds. Mr. Goebel also serves as General Counsel, Secretary, and Senior Vice President of FMR (2008-present); Deputy General Counsel of FMR LLC; Chief Legal Secretary of Fidelity Management & Research (Hong Kong) Limited (2008-present) and Assistant Secretary of Fidelity Management & Research (Japan) Inc. (2008-present). Previously, Mr. Goebel served as Assistant Secretary of the Funds (2007-2008) and as Vice President and Secretary of Fidelity Distributors Corporation (FDC) (2005-2007).
John B. McGinty, Jr. (46)
Year of Election or Appointment: 2008
Assistant Secretary of Fidelity's Equity and High Income Funds. Mr. McGinty is an employee of Fidelity Investments (2004-present). Mr. McGinty also serves as Senior Vice President, Secretary, and Chief Legal Officer of FDC (2007-present). Before joining Fidelity Investments, Mr. McGinty practiced law at Ropes & Gray, LLP.
Holly C. Laurent (54)
Year of Election or Appointment: 2008
Anti-Money Laundering (AML) Officer of the Fidelity funds. Ms. Laurent is an employee of Fidelity Investments. Previously, Ms. Laurent was Senior Vice President and Head of Legal for Fidelity Business Services India Pvt. Ltd. (2006-2008), Senior Vice President, Deputy General Counsel and Group Head for FMR LLC (2005-2006).
Christine Reynolds (50)
Year of Election or Appointment: 2008
Chief Financial Officer of the Fidelity funds. Ms. Reynolds became President of Fidelity Pricing and Cash Management Services (FPCMS) in August 2008. She served as Chief Operating Officer of FPCMS from 2007 through July 2008. Previously, Ms. Reynolds served as President, Treasurer, and Anti-Money Laundering officer of the Fidelity funds (2004-2007). Before joining Fidelity Investments, Ms. Reynolds worked at PricewaterhouseCoopers LLP (PwC) (1980-2002), where she was an audit partner with PwC's investment management practice.
Kenneth A. Rathgeber (61)
Year of Election or Appointment: 2004
Chief Compliance Officer of Fidelity's Equity and High Income Funds. Mr. Rathgeber is Chief Compliance Officer of Fidelity Management & Research (Hong Kong) Limited (2008-present), Fidelity Management & Research (Japan) Inc. (2008-present), FMR (2005-present), FMR Co., Inc. (2005-present), Fidelity Management & Research (U.K.) Inc. (2005-present), Fidelity Research & Analysis Company (2005-present), Fidelity Investments Money Management, Inc. (2005-present), and Strategic Advisers, Inc. (2005-present).
Bryan A. Mehrmann (47)
Year of Election or Appointment: 2005
Deputy Treasurer of the Fidelity funds. Mr. Mehrmann is an employee of Fidelity Investments. Previously, Mr. Mehrmann served as Vice President of Fidelity Investments Institutional Services Group (FIIS)/Fidelity Investments Institutional Operations Company, Inc. (FIIOC) Client Services (1998-2004).
Adrien E. Deberghes (41)
Year of Election or Appointment: 2008
Deputy Treasurer of Fidelity's Equity and High Income Funds. Mr. Deberghes is an employee of Fidelity Investments (2008-present). Previously, Mr. Deberghes served as Senior Vice President of Mutual Fund Administration at State Street Corporation (2007-2008), Senior Director of Mutual Fund Administration at Investors Bank & Trust (2005-2007), and Director of Finance for Dunkin' Brands (2000-2005).
Robert G. Byrnes (42)
Year of Election or Appointment: 2005
Assistant Treasurer of the Fidelity funds. Mr. Byrnes is an employee of Fidelity Investments (2005-present). Previously, Mr. Byrnes served as Vice President of Fidelity Pricing and Cash Management Services (FPCMS) (2003-2005). Before joining Fidelity Investments, Mr. Byrnes worked at Deutsche Asset Management where he served as Vice President of the Investment Operations Group (2000-2003).
Paul M. Murphy (61)
Year of Election or Appointment: 2007
Assistant Treasurer of the Fidelity funds. Mr. Murphy is an employee of Fidelity Investments (2007-present). Previously, Mr. Murphy served as Chief Financial Officer of the Fidelity Funds (2005-2006), Vice President and Associate General Counsel of FMR (2007), and Senior Vice President of Fidelity Pricing and Cash Management Services (FPCMS) (1994-2007).
Gary W. Ryan (50)
Year of Election or Appointment: 2005
Assistant Treasurer of the Fidelity funds. Mr. Ryan is an employee of Fidelity Investments. Previously, Mr. Ryan served as Vice President of Fund Reporting in Fidelity Pricing and Cash Management Services (FPCMS) (1999-2005).
** FMR Corp. merged with and into FMR LLC on October 1, 2007. Any references to FMR LLC for prior periods are deemed to be references to the prior entity.
Initial Class and Investor Class designates 10% and 100% of the dividends distributed in February and December, respectively during the fiscal year as qualifying for the dividends-received deduction for corporate shareholders.
The fund will notify shareholders in January 2009 of amounts for use in preparing 2008 income tax returns.
A special meeting of the fund's shareholders was held on May 14, 2008. The results of votes taken among shareholders on the proposals before them are reported below. Each vote reported represents one dollar of net asset value held on the record date for the meeting.
PROPOSAL 1
To elect a Board of Trustees.A
# of Votes
% of Votes
James C. Curvey
Affirmative
82,890,712.47
95.991
Withheld
3,461,988.43
4.009
TOTAL
86,352,700.90
100.000
Dennis J. Dirks
Affirmative
82,970,372.75
96.083
Withheld
3,382,328.15
3.917
TOTAL
86,352,700.90
100.000
Edward C. Johnson 3d
Affirmative
82,689,162.78
95.757
Withheld
3,663,538.12
4.243
TOTAL
86,352,700.90
100.000
Alan J. Lacy
Affirmative
83,041,222.35
96.165
Withheld
3,311,478.55
3.835
TOTAL
86,352,700.90
100.000
Ned C. Lautenbach
Affirmative
82,983,853.72
96.099
Withheld
3,368,847.18
3.901
TOTAL
86,352,700.90
100.000
Joseph Mauriello
Affirmative
83,138,122.14
96.277
Withheld
3,214,578.76
3.723
TOTAL
86,352,700.90
100.000
Cornelia M. Small
Affirmative
83,095,438.06
96.228
Withheld
3,257,262.84
3.772
TOTAL
86,352,700.90
100.000
William S. Stavropoulos
Affirmative
82,929,113.95
96.035
Withheld
3,423,586.95
3.965
TOTAL
86,352,700.90
100.000
David M. Thomas
Affirmative
83,095,487.87
96.228
Withheld
3,257,213.03
3.772
TOTAL
86,352,700.90
100.000
Michael E. Wiley
Affirmative
83,048,523.75
96.174
Withheld
3,304,177.15
3.826
TOTAL
86,352,700.90
100.000
PROPOSAL 2
To amend the Declaration of Trust to reduce the required quorum for future shareholder meetings.A
# of Votes
% of Votes
Affirmative
74,393,635.26
86.151
Against
8,745,543.59
10.128
Abstain
3,213,522.05
3.721
TOTAL
86,352,700.90
100.000
ADenotes trust-wide proposal and voting results.
Annual Report
BoardApproval of Investment Advisory Contracts and Management Fees
VIP Materials Portfolio
Each year, typically in July, the Board of Trustees, including the Independent Trustees (together, the Board), votes on the renewal of the management contract and sub-advisory agreements (together, the Advisory Contracts) for the fund. The Board, assisted by the advice of fund counsel and Independent Trustees' counsel, requests and considers a broad range of information throughout the year.
The Board meets regularly and, acting directly and through its separate committees, requests and receives information concerning, and considers at each of its meetings factors that are relevant to, its annual consideration of the renewal of the fund's Advisory Contracts, including the services and support provided to the fund and its shareholders. At the time of the renewal, the Board had 12 standing committees, each composed of Independent Trustees with varying backgrounds, to which the Board has assigned specific subject matter responsibilities in order to enhance effective decision-making by the Board. Each committee has a written charter outlining the structure and purposes of the committee. The Board also meets as needed to consider matters specifically related to the Board's annual consideration of the renewal of Advisory Contracts.
At its July 2008 meeting, the Board of Trustees, including the Independent Trustees, unanimously determined to renew the fund's Advisory Contracts. In reaching its determination, the Board considered all factors it believed relevant, including (i) the nature, extent, and quality of the services to be provided to the fund and its shareholders (including the investment performance of the fund); (ii) the competitiveness of the fund's management fee and total expenses; (iii) the total costs of the services to be provided by and the profits to be realized by Fidelity from its relationship with the fund; (iv) the extent to which economies of scale would be realized as the fund grows; and (v) whether fee levels reflect these economies of scale, if any, for the benefit of fund shareholders. The Board also approved amendments to the fund's agreements with foreign sub-advisers to clarify that each sub-adviser provides services as an independent contractor, as well as additional amendments to the fund's agreement with Fidelity Management & Research (U.K.) Inc. The Board further approved agreements with foreign sub-advisers Fidelity Management & Research (Japan) Inc. and Fidelity Management & Research (Hong Kong) Limited.
In considering whether to renew the Advisory Contracts for the fund, the Board ultimately reached a determination, with the assistance of fund counsel and Independent Trustees' counsel and through the exercise of its business judgment, that the renewal of the Advisory Contracts and the compensation to be received by Fidelity under the management contract is consistent with Fidelity's fiduciary duty under applicable law. The Board's decision to renew the Advisory Contracts was not based on any single factor noted above, but rather was based on a comprehensive consideration of all the information provided to the Board at its meetings throughout the year. The Board, in reaching its determination to renew the Advisory Contracts, is aware that shareholders in the fund have a broad range of investment choices available to them, including a wide choice among mutual funds offered by competitors to Fidelity, and that the fund's shareholders, with the opportunity to review and weigh the disclosure provided by the fund in its prospectus and other public disclosures, have chosen to invest in this fund, managed by Fidelity.
Nature, Extent, and Quality of Services Provided. The Board considered staffing within the investment adviser, FMR, and the sub-advisers (together, the Investment Advisers), including the backgrounds of the fund's investment personnel and the fund's investment objective and discipline. The Independent Trustees also had discussions with senior management of Fidelity's investment operations and investment groups. The Board considered the structure of the portfolio manager compensation program and whether this structure provides appropriate incentives.
Resources Dedicated to Investment Management and Support Services. The Board reviewed the size, education, and experience of the Investment Advisers' investment staff, their use of technology, and the Investment Advisers' approach to recruiting, training, and retaining portfolio managers and other research, advisory, and management personnel. The Board noted that Fidelity's analysts have access to a variety of technological tools that enable them to perform both fundamental and quantitative analysis and to specialize in various disciplines. The Board considered Fidelity's extensive global research capabilities that enable the Investment Advisers to aggregate data from various sources in an effort to produce positive investment results. The Board also considered that Fidelity's portfolio managers and analysts have access to daily portfolio attribution that allows for monitoring of a fund's portfolio, as well as an electronic communication system that provides immediate real-time access to research concerning issuers and credit enhancers.
Shareholder and Administrative Services. The Board considered (i) the nature, extent, quality, and cost of advisory, administrative, distribution, and shareholder services performed by the Investment Advisers and their affiliates under the Advisory Contracts and under separate agreements covering transfer agency, pricing and bookkeeping, and securities lending services for the fund; (ii) the nature and extent of the Investment Advisers' supervision of third party service providers, principally custodians and subcustodians; and (iii) the resources devoted to, and the record of compliance with, the fund's compliance policies and procedures. The Board also reviewed the allocation of fund brokerage, including allocations to brokers affiliated with the Investment Advisers, the use of brokerage commissions to pay fund expenses, and the use of "soft" commission dollars to pay for research services. The Board further considered that Fidelity voluntarily pays for market data out of its own resources.
The Board noted that the growth of fund assets across the complex allows Fidelity to reinvest in the development of services designed to enhance the value or convenience of the Fidelity funds as investment vehicles. These services include 24-hour access to account information and market information through phone representatives and over the Internet, and investor education materials and asset allocation tools.
Investment in a Large Fund Family. The Board considered the benefits to shareholders of investing in a Fidelity fund, including the benefits of investing in a fund that is part of a large family of funds offering a variety of investment disciplines and providing for a large variety of mutual fund investor services. The Board noted that Fidelity has taken a number of actions over the previous year that benefited particular funds, including (i) dedicating additional resources to investment research and to restructure the investment research teams; (ii) contractually agreeing to reduce the management fees on Fidelity's Institutional Money Market Funds and launching Class IV and Institutional Class of certain of these funds; (iii) reducing the transfer agent fees for the Fidelity Select Portfolios and Investor Class of the VIP funds; and (iv) launching Class K of 29 equity funds as a lower-fee class available to certain employer-sponsored retirement plans.
Annual Report
Investment Performance. The Board considered whether the fund has operated within its investment objective, as well as its record of compliance with its investment restrictions. The Board noted that it is not possible to evaluate performance in any comprehensive fashion because the fund had been in operation for less than one calendar year. Once the fund has been in operation for at least one calendar year, the Board will review the fund's absolute investment performance for each class, as well as the fund's relative investment performance for each class measured against a third-party-sponsored index that reflects the market sector in which the fund invests and a peer group of mutual funds.
The Board considered that FMR has taken steps to refocus and strengthen equity research, equity portfolio management, and compliance.
Based on its review, and giving particular weight to the nature and quality of the resources dedicated by the Investment Advisers to maintain and improve relative performance, the Board concluded that the nature, extent, and quality of the services provided to the fund will benefit the fund's shareholders, particularly in light of the Board's view that the fund's shareholders benefit from investing in a fund that is part of a large family of funds offering a variety of investment disciplines and services.
Competitiveness of Management Fee and Total Fund Expenses. The Board considered the fund's management fee and total expenses compared to "mapped groups" of competitive funds and classes. Fidelity creates "mapped groups" by combining similar Lipper investment objective categories that have comparable management fee characteristics. Combining Lipper investment objective categories aids the Board's management fee and total expense comparisons by broadening the competitive group used for comparison and by reducing the number of universes to which various Fidelity funds are compared. The Board also considered supplemental information about how the fund's management fee and total expenses ranked relative to groups based on Lipper classifications, which take into account a fund's market capitalization and style.
The Board considered two proprietary management fee comparisons for the period of the fund's operations shown in the chart below. The group of Lipper funds used by the Board for management fee comparisons is referred to below as the "Total Mapped Group." The Total Mapped Group comparison focuses on a fund's standing relative to the total universe of comparable funds available to investors, in terms of gross management fees before expense reimbursements or caps. "TMG %" represents the percentage of funds in the Total Mapped Group that had management fees that were lower than the fund's. For example, a TMG % of 4% means that 96% of the funds in the Total Mapped Group had higher management fees than the fund. The "Asset-Size Peer Group" (ASPG) comparison focuses on a fund's standing relative to non-Fidelity funds similar in size to the fund within the Total Mapped Group. The ASPG represents at least 15% of the funds in the Total Mapped Group with comparable asset size and management fee characteristics, subject to a minimum of 50 funds (or all funds in the Total Mapped Group if fewer than 50). Additional information, such as the ASPG quartile in which the fund's management fee ranked, is also included in the chart and considered by the Board.
VIP Materials Portfolio
The Board noted that the fund's management fee ranked below the median of its Total Mapped Group and below the median of its ASPG for the period.
Based on its review, the Board concluded that the fund's management fee was fair and reasonable in light of the services that the fund receives and the other factors considered.
In its review of each class's total expenses, the Board considered the fund's management fee as well as other fund or class expenses, as applicable, such as transfer agent fees, pricing and bookkeeping fees, and custodial, legal, and audit fees. The Board also noted the effects of any waivers and reimbursements on fees and expenses. As part of its review, the Board also considered current and historical total expenses of each class of the fund compared to competitive fund median expenses. Each class of the fund is compared to those funds and classes in the Total Mapped Group (used by the Board for management fee comparisons) that have a similar sales load structure.
Annual Report
Board Approval of Investment Advisory Contracts and Management Fees - continued
The Board noted that the total expenses of Initial Class ranked below its competitive median for the period, and the total expenses of Investor Class ranked above its competitive median for the period. The Board considered that the total expenses of Investor Class were above the median primarily due to its higher transfer agent fee. The Board noted that the fund offers multiple classes and that the multiple structures are intended to offer pricing options for the intermediary market. The Board also noted that the total expenses of the classes vary primarily due to differences in transfer agent fees.
In its review of total expenses, the Board also considered Fidelity fee structures and other information on clients that FMR and its affiliates service in other competitive markets, such as other mutual funds advised or subadvised by FMR or its affiliates, pension plan clients, and other institutional clients.
Based on its review, the Board concluded that the total expenses of each class of the fund were reasonable, although in one case above the median of the universe presented for comparison, in light of the services that the fund and its shareholders receive and the other factors considered.
Costs of the Services and Profitability. The Board considered the revenues earned and the expenses incurred by Fidelity in conducting the business of developing, marketing, distributing, managing, administering and servicing the fund and its shareholders. The Board also considered the level of Fidelity's profits in respect of all the Fidelity funds.
On an annual basis, FMR presents to the Board Fidelity's profitability for the fund. Fidelity calculates the profitability for each fund, as well as aggregate profitability for groups of Fidelity funds and all Fidelity funds, using a series of detailed revenue and cost allocation methodologies which originate with the audited books and records of Fidelity. The Audit Committee of the Board reviews any significant changes from the prior year's methodologies.
PricewaterhouseCoopers LLP (PwC), independent registered public accounting firm and auditor to Fidelity and certain Fidelity funds, has been engaged annually by the Board as part of the Board's assessment of the results of Fidelity's profitability analysis. PwC's engagement includes the review and assessment of Fidelity's methodologies used in determining the revenues and expenses attributable to Fidelity's mutual fund business, and completion of agreed-upon procedures surrounding the mathematical accuracy of fund profitability and its conformity to allocation methodologies. After considering PwC's reports issued under the engagement and information provided by Fidelity, the Board believes that while other allocation methods may also be reasonable, Fidelity's profitability methodologies are reasonable in all material respects.
The Board has also reviewed Fidelity's non-fund businesses and any fall-out benefits related to the mutual fund business as well as cases where Fidelity's affiliates may benefit from or be related to the fund's business.
The Board considered the costs of the services provided by and the profits realized by Fidelity in connection with the operation of the fund and determined that the amount of profit is a fair entrepreneurial profit for the management of the fund.
Economies of Scale. The Board considered whether there have been economies of scale in respect of the management of the Fidelity funds, whether the Fidelity funds (including the fund) have appropriately benefited from any such economies of scale, and whether there is potential for realization of any further economies of scale. The Board considered the extent to which the fund will benefit from economies of scale through increased services to the fund, through waivers or reimbursements, or through fee or expense reductions.
The Board recognized that the fund's management contract incorporates a "group fee" structure, which provides for lower group fee rates as total fund assets under FMR's management increase, and for higher group fee rates as total fund assets under FMR's management decrease. FMR determines the group fee rates based on a tiered asset "breakpoint" schedule. The Board considered that the group fee is designed to deliver the benefits of economies of scale to fund shareholders when total fund assets increase, even if assets of any particular fund are unchanged or have declined, because some portion of Fidelity's costs are attributable to services provided to all Fidelity funds, and all funds benefit if those costs can be allocated among more assets. The Board concluded that, given the group fee structure, fund shareholders will achieve a certain level of economies of scale as assets under FMR's management increase at the fund complex level, regardless of whether Fidelity achieves any such economies of scale.
The Board further concluded that any potential economies of scale are being shared between fund shareholders and Fidelity in an appropriate manner.
Additional Information Requested by the Board. In order to develop fully the factual basis for consideration of the Fidelity funds' Advisory Contracts, the Board requested and received additional information on certain topics, including (i) fund performance trends and actions to be taken by FMR to improve certain funds' overall performance; (ii) portfolio manager changes that have occurred during the past year; (iii) Fidelity's fund profitability methodology, the profitability of certain fund service providers, and profitability trends for certain funds; (iv) Fidelity's compensation structure for portfolio managers and key personnel, including its effects on fund profitability and the extent to which portfolio manager compensation is linked to fund performance; (v) Fidelity's fee structures and rationale for recommending different fees among categories of funds; and (vi) Fidelity's rationale for recommending which funds should have a performance adjustment component as part of their management fees.
Based on its evaluation of all of the conclusions noted above, and after considering all material factors, the Board ultimately concluded that the advisory fee structures are fair and reasonable, and that the fund's Advisory Contracts should be renewed.
Annual Report
Investment Adviser
Fidelity Management & Research Company Boston, MA
Investment Sub-Advisers
FMR Co., Inc.
Fidelity Management & Research (U.K.) Inc.
Fidelity Research & Analysis Company
Fidelity Investments Japan Limited
FIL Investment Advisors
FIL Investment Advisors (U.K.) Ltd.
Fidelity Management & Research (Hong Kong) Limited
Fidelity Management & Research (Japan) Inc.
General Distributor
Fidelity Distributors Corporation Boston, MA
Transfer and Service Agents
Fidelity Investments Institutional Operations Company, Inc. Boston, MA
Fidelity Service Company, Inc. Boston, MA
Custodian
State Street Bank and Trust Company Quincy, MA
VMATP-ANN-0209
1.850999.101
Fidelity® Variable Insurance Products: Real Estate Portfolio
Annual Report
December 31, 2008 (2_fidelity_logos) (Registered_Trademark)
To view a fund's proxy voting guidelines and proxy voting record for the 12-month period ended June 30, visit http://www.fidelity.com (search for "proxy voting results") or visit the Securities and Exchange Commission's (SEC) web site at http://www.sec.gov. You may also call 1-877-208-0098 to request a free copy of the proxy voting guidelines.
Fidelity Variable Insurance Products are separate account options which are purchased through a variable insurance contract.
Standard & Poor's, S&P and S&P 500 are registered service marks of The McGraw-Hill Companies, Inc. and have been licensed for use by Fidelity Distributors Corporation.
Other third party marks appearing herein are the property of their respective owners.
All other marks appearing herein are registered or unregistered trademarks or service marks of FMR LLC or an affiliated company.
This report and the financial statements contained herein are submitted for the general information of the shareholders of the fund. This report is not authorized for distribution to prospective investors in the fund unless preceded or accompanied by an effective prospectus.
A fund files its complete schedule of portfolio holdings with the SEC for the first and third quarters of each fiscal year on Form N-Q. Forms N-Q are available on the SEC's web site at http://www.sec.gov. A fund's Forms N-Q may be reviewed and copied at the SEC's Public Reference Room in Washington, DC. Information regarding the operation of the SEC's Public Reference Room may be obtained by calling 1-800-SEC-0330. For a complete list of a fund's portfolio holdings, view the most recent holdings listing, semiannual report, or annual report on Fidelity's web site at http://www.fidelity.com or http://www.advisor.fidelity.com, as applicable.
NOT FDIC INSURED · MAY LOSE VALUE · NO BANK GUARANTEE
Neither the fund nor Fidelity Distributors Corporation is a bank.
Average annual total return reflects the change in the value of an investment, assuming reinvestment of the class' dividend income and capital gains (the profits earned upon the sale of securities that have grown in value, if any) and assuming a constant rate of performance each year. During periods of reimbursement by Fidelity, a fund's total return will be greater than it would be had the reimbursement not occurred. Performance numbers are net of all underlying fund operating expenses, but do not include any insurance charges imposed by your insurance company's separate account. If performance information included the effect of these additional charges, the total returns would have been lower. How a fund did yesterday is no guarantee of how it will do tomorrow.
Average Annual Total Returns
Periods ended December 31, 2008
Past 1 year
Past 5 years
Life of fund A
VIP Real Estate - Initial Class
-39.87%
0.88%
5.95%
VIP Real Estate - Service Class B
-39.95%
0.78%
5.85%
VIP Real Estate - Service Class 2 C
-40.06%
0.62%
5.68%
VIP Real Estate - Investor Class D
-39.91%
0.79%
5.89%
AFrom November 6, 2002.
BPerformance for Service Class shares reflects an asset-based service fee (12b-1 fee).
CPerformance for Service Class 2 shares reflects an asset-based service fee (12b-1 fee).
DThe initial offering of Investor Class shares took place on July 21, 2005. Returns prior to July 21, 2005 are those of Initial Class. If Investor Class's transfer agent fee had been reflected, returns prior to July 21, 2005 would have been lower.
$10,000 Over Life of Fund
Let's say hypothetically that $10,000 was invested in VIP Real Estate Portfolio - Initial Class on November 6, 2002, when the fund started. The chart shows how the value of your investment would have changed, and also shows how the Standard & Poor's 500SM Index (S&P 500®) performed over the same period.
Comments from Samuel Wald, Portfolio Manager of VIP Real Estate Portfolio
By year-end 2008, the vicious credit crisis sparked in the U.S. had spread like wildfire across the world's capital markets, stunting global growth, toppling commodity prices, changing the face of the global financial system, and chasing risk-averse investors toward the sidelines. The U.S. equity markets, as measured by the Dow Jones Industrial AverageSM and Standard & Poor's 500SM Index, fell hard as a result, declining 31.93% and 37.00%, respectively, while the technology-laden NASDAQ Composite® Index slid 40.03%. Foreign market stocks saw an even sharper decline, as illustrated by the 43.28% loss of the MSCI® EAFE® Index (Europe, Australasia, Far East), a gauge of developed stock markets outside the U.S. and Canada. A generally stronger U.S. dollar also held back returns for U.S. investors in foreign equities. Emerging-markets stocks - the global performance leader only a year ago - fell harder still, dropping 53.18%, as measured by the MSCI Emerging Markets Index. The only clear winners during the past year were assets backed by the U.S. government, as investors fled from risk. Thus, the Barclays Capital U.S. Treasury Bond Index climbed 13.74% for the year, while the Barclays Capital U.S. Aggregate Bond Index - a broader measure of the U.S. investment-grade bond universe - gained a more modest 5.24%. By contrast, high-yield bonds bore the brunt of investors' increasing wariness over risk, as expressed by the Merrill Lynch® U.S. High Yield Master II Constrained Index's drop of 26.11%. The emerging-markets bond category also felt the shock of investors' risk-averse sentiment, with the JPMorgan Emerging Markets Bond Index (EMBI) Global falling 10.91%. Meanwhile, the Citigroup® Non-U.S. Group of 7 Index - representing the debt performance of major global economies, excluding the United States - eked out a 1.69% gain.
For the year ending December 31, 2008, the fund was in line with its benchmark, the Dow Jones Wilshire Real Estate Securities IndexSM, which fell 39.83%. The fund also lagged the S&P 500®. (For specific portfolio results, please refer to the performance section of this report.) As a general rule, highly leveraged real estate investment trusts (REITs) underperformed while high-quality, relatively defensive stocks outperformed. The biggest individual detractor was mall operator General Growth Properties, which lost nearly all of its value in the credit crisis and which was no longer in the portfolio at period end. As credit became unavailable, the prospects for GGP's ability to refinance its substantial debt load dimmed significantly. Worries about debt also weighed on retail REIT Developers Diversified Realty, as did investor concerns about consumer spending. Further detracting was industrial REIT ProLogis. On the positive side, Highwoods Properties did well in relative terms. This office and industrial REIT, whose core markets are located in the southeastern and midwestern United States, benefited from ongoing sales of some lower-quality assets and success in strengthening its balance sheet. Apartment REIT Home Properties also outperformed. The apartment sector as a whole did better than the overall REIT market, while Home Properties further benefited from the relatively defensive nature of the company's core Northeast focus. Also contributing was self-storage company Public Storage, helped by its strong business fundamentals and healthy balance sheet. Of final note, the fund's modest average cash balance proved helpful in a down market.
The views expressed above reflect those of the portfolio manager(s) only through the end of the period as stated on the cover of this report and do not necessarily represent the views of Fidelity or any other person in the Fidelity organization. Any such views are subject to change at any time based upon market or other conditions and Fidelity disclaims any responsibility to update such views. These views may not be relied on as investment advice and, because investment decisions for a Fidelity fund are based on numerous factors, may not be relied on as an indication of trading intent on behalf of any Fidelity fund.
As a shareholder of the Fund, you incur two types of costs: (1) transaction costs, and (2) ongoing costs, including management fees, distribution and/or service (12b-1) fees and other Fund expenses. This Example is intended to help you understand your ongoing costs (in dollars) of investing in the Fund and to compare these costs with the ongoing costs of investing in other mutual funds.
The Example is based on an investment of $1,000 invested at the beginning of the period and held for the entire period (July 1, 2008 to December 31, 2008).
Actual Expenses
The first line of the accompanying table for each class of the Fund provides information about actual account values and actual expenses. You may use the information in this line, together with the amount you invested, to estimate the expenses that you paid over the period. Simply divide your account value by $1,000.00 (for example, an $8,600 account value divided by $1,000.00 = 8.6), then multiply the result by the number in the first line for a class of the Fund under the heading entitled "Expenses Paid During Period" to estimate the expenses you paid on your account during this period. The estimate of expenses does not include any fees or other expenses of any variable annuity or variable life insurance product. If they were, the estimate of expenses you paid during the period would be higher, and your ending account value would be lower. In addition, the Fund, as a shareholder in the underlying Fidelity Central Funds, will indirectly bear its pro rata share of the fees and expenses incurred by the underlying Fidelity Central Funds. These fees and expenses are not included in the Fund's annualized expense ratio used to calculate the expense estimate in the table below.
Hypothetical Example for Comparison Purposes
The second line of the accompanying table for each class of the Fund provides information about hypothetical account values and hypothetical expenses based on a Class' actual expense ratio and an assumed rate of return of 5% per year before expenses, which is not the Class' actual return. The hypothetical account values and expenses may not be used to estimate the actual ending account balance or expenses you paid for the period. You may use this information to compare the ongoing costs of investing in the Fund and other funds. To do so, compare this 5% hypothetical example with the 5% hypothetical examples that appear in the shareholder reports of the other funds. The estimate of expenses does not include any fees or other expenses of any variable annuity or variable life insurance product. If they were, the estimate of expenses you paid during the period would be higher, and your ending account value would be lower. In addition, the Fund, as a shareholder in the underlying Fidelity Central Funds, will indirectly bear its pro rata share of the fees and expenses incurred by the underlying Fidelity Central Funds. These fees and expenses are not included in the Fund's annualized expense ratio used to calculate the expense estimate in the table below.
Please note that the expenses shown in the table are meant to highlight your ongoing costs only and do not reflect any transaction costs. Therefore, the second line of the table is useful in comparing ongoing costs only, and will not help you determine the relative total costs of owning different funds.
Annualized Expense Ratio
Beginning Account Value July 1, 2008
Ending Account Value December 31, 2008
Expenses Paid During Period* July 1, 2008 to December 31, 2008
Initial Class
.78%
Actual
$ 1,000.00
$ 620.10
$ 3.18
HypotheticalA
$ 1,000.00
$ 1,021.22
$ 3.96
Service Class
.88%
Actual
$ 1,000.00
$ 619.30
$ 3.58
HypotheticalA
$ 1,000.00
$ 1,020.71
$ 4.47
Service Class 2
1.07%
Actual
$ 1,000.00
$ 618.70
$ 4.35
HypotheticalA
$ 1,000.00
$ 1,019.76
$ 5.43
Investor Class
.87%
Actual
$ 1,000.00
$ 619.70
$ 3.54
HypotheticalA
$ 1,000.00
$ 1,020.76
$ 4.42
A 5% return per year before expenses
* Expenses are equal to each Class' annualized expense ratio, multiplied by the average account value over the period, multiplied by 184/366 (to reflect the one-half year period).
Annual Report
Investment Changes (Unaudited)
Top Ten Stocks as of December 31, 2008
% of fund's net assets
% of fund's net assets 6 months ago
Public Storage
7.3
7.2
Simon Property Group, Inc.
7.2
7.3
Vornado Realty Trust
6.4
4.6
Ventas, Inc.
6.2
1.8
Highwoods Properties, Inc. (SBI)
4.7
3.7
Digital Realty Trust, Inc.
4.0
1.0
ProLogis Trust
3.9
7.1
Corporate Office Properties Trust (SBI)
3.6
2.3
Equity Residential (SBI)
3.6
2.4
Healthcare Realty Trust, Inc.
3.3
2.3
50.2
Top Five REIT Sectors as of December 31, 2008
% of fund's net assets
% of fund's net assets 6 months ago
REITs - Office Buildings
18.1
17.8
REITs - Apartments
17.4
18.7
REITs - Shopping Centers
14.1
11.9
REITs - Health Care Facilities
12.0
6.4
REITs - Industrial Buildings
11.2
16.4
Asset Allocation (% of fund's net assets)
As of December 31, 2008*
As of June 30, 2008**
Stocks 96.7%
Stocks 98.1%
Short-Term Investments and Net Other Assets 3.3%
Short-Term Investments and Net Other Assets 1.9%
* Foreign investments
1.5%
** Foreign investments
2.7%
Annual Report
Investments December 31, 2008
Showing Percentage of Net Assets
Common Stocks - 96.7%
Shares
Value
HEALTH CARE PROVIDERS & SERVICES - 1.3%
Health Care Facilities - 1.3%
Capital Senior Living Corp. (a)
4,100
$ 12,218
Emeritus Corp. (a)
73,611
738,318
TOTAL HEALTH CARE FACILITIES
750,536
HOTELS, RESTAURANTS & LEISURE - 1.8%
Hotels, Resorts & Cruise Lines - 1.8%
Gaylord Entertainment Co. (a)
23,100
250,404
Marriott International, Inc. Class A
18,600
361,770
Starwood Hotels & Resorts Worldwide, Inc.
24,900
445,710
TOTAL HOTELS, RESORTS & CRUISE LINES
1,057,884
HOUSEHOLD DURABLES - 0.5%
Homebuilding - 0.5%
Centex Corp.
6,200
65,968
D.R. Horton, Inc.
5,000
35,350
Meritage Homes Corp. (a)
4,100
49,897
Pulte Homes, Inc.
15,900
173,787
TOTAL HOMEBUILDING
325,002
REAL ESTATE INVESTMENT TRUSTS - 91.0%
REITs - Apartments - 17.4%
American Campus Communities, Inc.
49,900
1,021,952
Apartment Investment & Management Co. Class A
106,473
1,229,763
AvalonBay Communities, Inc.
18,200
1,102,556
Camden Property Trust (SBI)
55,910
1,752,219
Equity Residential (SBI)
71,900
2,144,058
Essex Property Trust, Inc.
14,300
1,097,525
Home Properties, Inc.
48,000
1,948,800
UDR, Inc.
10,800
148,932
TOTAL REITS - APARTMENTS
10,445,805
REITs - Factory Outlets - 1.7%
Tanger Factory Outlet Centers, Inc.
27,000
1,015,740
REITs - Health Care Facilities - 12.0%
HCP, Inc.
43,600
1,210,772
Healthcare Realty Trust, Inc.
84,900
1,993,452
Omega Healthcare Investors, Inc.
15,400
245,938
Ventas, Inc.
110,500
3,709,485
TOTAL REITS - HEALTH CARE FACILITIES
7,159,647
Shares
Value
REITs - Hotels - 4.6%
DiamondRock Hospitality Co.
45,100
$ 228,657
Host Hotels & Resorts, Inc.
98,347
744,487
LaSalle Hotel Properties (SBI)
106,500
1,176,825
Sunstone Hotel Investors, Inc.
94,300
583,717
TOTAL REITS - HOTELS
2,733,686
REITs - Industrial Buildings - 11.2%
ProLogis Trust
168,116
2,335,131
Public Storage
54,840
4,359,782
TOTAL REITS - INDUSTRIAL BUILDINGS
6,694,913
REITs - Malls - 7.9%
CBL & Associates Properties, Inc.
64,350
418,275
Simon Property Group, Inc.
81,740
4,342,846
TOTAL REITS - MALLS
4,761,121
REITs - Management/Investment - 4.0%
Digital Realty Trust, Inc.
72,500
2,381,625
REITs - Office Buildings - 18.1%
Alexandria Real Estate Equities, Inc.
25,700
1,550,738
Boston Properties, Inc.
29,000
1,595,000
Corporate Office Properties Trust (SBI)
70,500
2,164,350
Highwoods Properties, Inc. (SBI)
103,900
2,842,704
Kilroy Realty Corp.
27,800
930,188
SL Green Realty Corp.
68,000
1,761,200
TOTAL REITS - OFFICE BUILDINGS
10,844,180
REITs - Shopping Centers - 14.1%
Developers Diversified Realty Corp.
112,550
549,244
Inland Real Estate Corp.
101,700
1,320,066
Kimco Realty Corp.
53,515
978,254
Regency Centers Corp.
36,900
1,723,230
Vornado Realty Trust
63,900
3,856,365
TOTAL REITS - SHOPPING CENTERS
8,427,159
TOTAL REAL ESTATE INVESTMENT TRUSTS
54,463,876
REAL ESTATE MANAGEMENT & DEVELOPMENT - 2.1%
Real Estate Operating Companies - 1.5%
Brookfield Properties Corp.
118,650
917,165
Real Estate Services - 0.6%
CB Richard Ellis Group, Inc. Class A (a)
84,800
366,336
TOTAL REAL ESTATE MANAGEMENT & DEVELOPMENT
1,283,501
TOTAL COMMON STOCKS
(Cost $85,626,057)
57,880,799
Money Market Funds - 2.7%
Shares
Value
Fidelity Cash Central Fund, 1.06% (b) (Cost $1,628,428)
1,628,428
$ 1,628,428
TOTAL INVESTMENT PORTFOLIO - 99.4%
(Cost $87,254,485)
59,509,227
NET OTHER ASSETS - 0.6%
368,112
NET ASSETS - 100%
$ 59,877,339
Legend
(a) Non-income producing
(b) Affiliated fund that is available only to investment companies and other accounts managed by Fidelity Investments. The rate quoted is the annualized seven-day yield of the fund at period end. A complete unaudited listing of the fund's holdings as of its most recent quarter end is available upon request.
Affiliated Central Funds
Information regarding fiscal year to date income earned by the Fund from investments in Fidelity Central Funds is as follows:
Fund
Income earned
Fidelity Cash Central Fund
$ 46,178
Other Information
The following is a summary of the inputs used, as of December 31, 2008, involving the Fund's assets carried at value. The inputs or methodology used for valuing securities may not be an indication of the risk associated with investing in those securities. For more information on valuation inputs, and their aggregation into the levels used in the table below, please refer to the Security Valuation section in the accompanying Notes to Financial Statements.
Valuation Inputs at Reporting Date:
Description
Total
Level 1
Level 2
Level 3
Investments in Securities
$ 59,509,227
$ 59,509,227
$ -
$ -
Income Tax Information
The Fund intends to elect to defer its fiscal year ending December 31, 2009 approximately $9,062,124 of losses recognized during the period January 1, 2008 to December 31, 2008.
See accompanying notes which are an integral part of the financial statements.
Investment in securities, at value - See accompanying schedule:
Unaffiliated issuers (cost $85,626,057)
$ 57,880,799
Fidelity Central Funds (cost $1,628,428)
1,628,428
Total Investments (cost $87,254,485)
$ 59,509,227
Cash
10,125
Receivable for investments sold
371,181
Receivable for fund shares sold
32,834
Dividends receivable
631,358
Distributions receivable from Fidelity Central Funds
1,581
Prepaid expenses
864
Other receivables
312
Total assets
60,557,482
Liabilities
Payable for investments purchased
$ 517,752
Payable for fund shares redeemed
80,503
Accrued management fee
24,986
Distribution fees payable
613
Other affiliated payables
6,018
Other payables and accrued expenses
50,271
Total liabilities
680,143
Net Assets
$ 59,877,339
Net Assets consist of:
Paid in capital
$ 98,236,371
Undistributed net investment income
151,507
Accumulated undistributed net realized gain (loss) on investments and foreign currency transactions
(10,765,300)
Net unrealized appreciation (depreciation) on investments and assets and liabilities in foreign currencies
(27,745,239)
Net Assets
$ 59,877,339
Statement of Assets and Liabilities - continued
December 31, 2008
Initial Class: Net Asset Value, offering price and redemption price per share ($32,917,633 ÷ 4,049,079 shares)
$ 8.13
Service Class: Net Asset Value, offering price and redemption price per share ($1,384,555 ÷ 170,679 shares)
$ 8.11
Service Class 2: Net Asset Value, offering price and redemption price per share ($2,864,021 ÷ 354,818 shares)
$ 8.07
Investor Class: Net Asset Value, offering price and redemption price per share ($22,711,130 ÷ 2,801,286 shares)
$ 8.11
See accompanying notes which are an integral part of the financial statements.
Annual Report
Statement of Operations
Year ended December 31, 2008
Investment Income
Dividends
$ 3,075,590
Interest
1,278
Income from Fidelity Central Funds
46,178
Total income
3,123,046
Expenses
Management fee
$ 533,401
Transfer agent fees
102,498
Distribution fees
11,678
Accounting fees and expenses
37,132
Custodian fees and expenses
22,210
Independent trustees' compensation
465
Audit
51,099
Legal
576
Miscellaneous
10,538
Total expenses before reductions
769,597
Expense reductions
(799)
768,798
Net investment income (loss)
2,354,248
Realized and Unrealized Gain (Loss)
Net realized gain (loss) on:
Investment securities:
Unaffiliated issuers
(9,260,149)
Foreign currency transactions
(2,996)
Total net realized gain (loss)
(9,263,145)
Change in net unrealized appreciation (depreciation) on:
Investment securities
(36,927,369)
Assets and liabilities in foreign currencies
19
Total change in net unrealized appreciation (depreciation)
(36,927,350)
Net gain (loss)
(46,190,495)
Net increase (decrease) in net assets resulting from operations
$ (43,836,247)
Statement of Changes in Net Assets
Year ended December 31, 2008
Year ended December 31, 2007
Increase (Decrease) in Net Assets
Operations
Net investment income (loss)
$ 2,354,248
$ 2,396,168
Net realized gain (loss)
(9,263,145)
22,097,488
Change in net unrealized appreciation (depreciation)
(36,927,350)
(55,566,054)
Net increase (decrease) in net assets resulting from operations
(43,836,247)
(31,072,398)
Distributions to shareholders from net investment income
(2,499,867)
(2,083,139)
Distributions to shareholders from net realized gain
(1,117,046)
(26,825,176)
Total distributions
(3,616,913)
(28,908,315)
Share transactions - net increase (decrease)
196,182
(97,480,470)
Total increase (decrease) in net assets
(47,256,978)
(157,461,183)
Net Assets
Beginning of period
107,134,317
264,595,500
End of period (including undistributed net investment income of $151,507 and undistributed net investment income of $241,854, respectively)
$ 59,877,339
$ 107,134,317
See accompanying notes which are an integral part of the financial statements.
Annual Report
Financial Highlights - Initial Class
Years ended December 31,
2008
2007
2006
2005
2004
Selected Per-Share Data
Net asset value, beginning of period
$ 14.38
$ 22.74
$ 18.48
$ 17.46
$ 13.30
Income from Investment Operations
Net investment income (loss) C
.33
.27
.38
.38
.45
Net realized and unrealized gain (loss)
(6.06)
(4.15)
6.23
2.25
4.08
Total from investment operations
(5.73)
(3.88)
6.61
2.63
4.53
Distributions from net investment income
(.36)
(.36)
(.33)
(.41)
(.31)
Distributions from net realized gain
(.16)
(4.12)
(2.02)
(1.20)
(.06)
Total distributions
(.52)
(4.48)
(2.35)
(1.61) G
(.37)
Net asset value, end of period
$ 8.13
$ 14.38
$ 22.74
$ 18.48
$ 17.46
Total Return A, B
(39.87)%
(17.72)%
36.71%
15.12%
34.14%
Ratios to Average Net Assets D, F
Expenses before reductions
.76%
.74%
.72%
.74%
.77%
Expenses net of fee waivers, if any
.76%
.74%
.72%
.74%
.77%
Expenses net of all reductions
.76%
.74%
.71%
.71%
.74%
Net investment income (loss)
2.51%
1.21%
1.76%
2.13%
3.02%
Supplemental Data
Net assets, end of period (000 omitted)
$ 32,918
$ 68,401
$ 205,802
$ 145,065
$ 147,779
Portfolio turnover rate E
87%
102%
70%
75%
66%
A Total returns do not reflect charges attributable to your insurance company's separate account. Inclusion of these charges would reduce the total returns shown. B Total returns would have been lower had certain expenses not been reduced during the periods shown. C Calculated based on average shares outstanding during the period. D Fees and expenses of the underlying Fidelity Central Funds are not included in the Fund's expense ratio. The Fund indirectly bears its proportionate share of the expenses of any underlying Fidelity Central Funds. E Amount does not include the portfolio activity of any underlying Fidelity Central Funds. F Expense ratios reflect operating expenses of the class. Expenses before reductions do not reflect amounts reimbursed by the investment adviser or reductions from brokerage service arrangements or other expense offset arrangements and do not represent the amount paid by the class during periods when reimbursements or reductions occur. Expenses net of fee waivers reflect expenses after reimbursement by the investment adviser but prior to reductions from brokerage service arrangements or other expense offset arrangements. Expenses net of all reductions represent the net expenses paid by the class. G Total distributions of $1.61 per share is comprised of distributions from net investment income of $.413 and distributions from net realized gain of $1.195 per share.
Financial Highlights - Service Class
Years ended December 31,
2008
2007
2006
2005
2004
Selected Per-Share Data
Net asset value, beginning of period
$ 14.33
$ 22.69
$ 18.44
$ 17.43
$ 13.28
Income from Investment Operations
Net investment income (loss) C
.32
.24
.35
.37
.43
Net realized and unrealized gain (loss)
(6.04)
(4.13)
6.22
2.23
4.08
Total from investment operations
(5.72)
(3.89)
6.57
2.60
4.51
Distributions from net investment income
(.34)
(.35)
(.30)
(.40)
(.30)
Distributions from net realized gain
(.16)
(4.12)
(2.02)
(1.20)
(.06)
Total distributions
(.50)
(4.47)
(2.32)
(1.59) G
(.36)
Net asset value, end of period
$ 8.11
$ 14.33
$ 22.69
$ 18.44
$ 17.43
Total Return A, B
(39.95)%
(17.80)%
36.61%
15.00%
34.04%
Ratios to Average Net Assets D, F
Expenses before reductions
.86%
.83%
.82%
.84%
.86%
Expenses net of fee waivers, if any
.86%
.83%
.82%
.84%
.86%
Expenses net of all reductions
.85%
.83%
.81%
.81%
.84%
Net investment income (loss)
2.41%
1.12%
1.66%
2.03%
2.92%
Supplemental Data
Net assets, end of period (000 omitted)
$ 1,385
$ 3,543
$ 4,311
$ 3,156
$ 2,744
Portfolio turnover rate E
87%
102%
70%
75%
66%
A Total returns do not reflect charges attributable to your insurance company's separate account. Inclusion of these charges would reduce the total returns shown. B Total returns would have been lower had certain expenses not been reduced during the periods shown. C Calculated based on average shares outstanding during the period. D Fees and expenses of the underlying Fidelity Central Funds are not included in the Fund's expense ratio. The Fund indirectly bears its proportionate share of the expenses of any underlying Fidelity Central Funds. E Amount does not include the portfolio activity of any underlying Fidelity Central Funds. F Expense ratios reflect operating expenses of the class. Expenses before reductions do not reflect amounts reimbursed by the investment adviser or reductions from brokerage service arrangements or other expense offset arrangements and do not represent the amount paid by the class during periods when reimbursements or reductions occur. Expenses net of fee waivers reflect expenses after reimbursement by the investment adviser but prior to reductions from brokerage service arrangements or other expense offset arrangements. Expenses net of all reductions represent the net expenses paid by the class. G Total distributions of $1.59 per share is comprised of distributions from net investment income of $.397 and distributions from net realized gain of $1.195 per share.
See accompanying notes which are an integral part of the financial statements.
Annual Report
Financial Highlights - Service Class 2
Years ended December 31,
2008
2007
2006
2005
2004
Selected Per-Share Data
Net asset value, beginning of period
$ 14.28
$ 22.62
$ 18.40
$ 17.39
$ 13.26
Income from Investment Operations
Net investment income (loss) C
.28
.21
.32
.34
.41
Net realized and unrealized gain (loss)
(5.99)
(4.11)
6.19
2.24
4.06
Total from investment operations
(5.71)
(3.90)
6.51
2.58
4.47
Distributions from net investment income
(.34)
(.32)
(.27)
(.37)
(.28)
Distributions from net realized gain
(.16)
(4.12)
(2.02)
(1.20)
(.06)
Total distributions
(.50)
(4.44)
(2.29)
(1.57) G
(.34)
Net asset value, end of period
$ 8.07
$ 14.28
$ 22.62
$ 18.40
$ 17.39
Total Return A, B
(40.06)%
(17.91)%
36.35%
14.88%
33.79%
Ratios to Average Net Assets D, F
Expenses before reductions
1.03%
.98%
.97%
.99%
1.01%
Expenses net of fee waivers, if any
1.03%
.98%
.97%
.99%
1.01%
Expenses net of all reductions
1.03%
.98%
.96%
.96%
.99%
Net investment income (loss)
2.24%
.97%
1.51%
1.88%
2.77%
Supplemental Data
Net assets, end of period (000 omitted)
$ 2,864
$ 3,558
$ 4,284
$ 3,141
$ 2,735
Portfolio turnover rate E
87%
102%
70%
75%
66%
A Total returns do not reflect charges attributable to your insurance company's separate account. Inclusion of these charges would reduce the total returns shown. B Total returns would have been lower had certain expenses not been reduced during the periods shown. C Calculated based on average shares outstanding during the period. D Fees and expenses of the underlying Fidelity Central Funds are not included in the Fund's expense ratio. The Fund indirectly bears its proportionate share of the expenses of any underlying Fidelity Central Funds. E Amount does not include the portfolio activity of any underlying Fidelity Central Funds. F Expense ratios reflect operating expenses of the class. Expenses before reductions do not reflect amounts reimbursed by the investment adviser or reductions from brokerage service arrangements or other expense offset arrangements and do not represent the amount paid by the class during periods when reimbursements or reductions occur. Expenses net of fee waivers reflect expenses after reimbursement by the investment adviser but prior to reductions from brokerage service arrangements or other expense offset arrangements. Expenses net of all reductions represent the net expenses paid by the class. G Total distributions of $1.57 per share is comprised of distributions from net investment income of $.37 and distributions from net realized gain of $1.195 per share.
Financial Highlights - Investor Class
Years ended December 31,
2008
2007
2006
2005 H
Selected Per-Share Data
Net asset value, beginning of period
$ 14.34
$ 22.69
$ 18.46
$ 19.25
Income from Investment Operations
Net investment income (loss) E
.31
.24
.35
.17
Net realized and unrealized gain (loss)
(6.03)
(4.13)
6.22
.52
Total from investment operations
(5.72)
(3.89)
6.57
.69
Distributions from net investment income
(.35)
(.34)
(.32)
(.42)
Distributions from net realized gain
(.16)
(4.12)
(2.02)
(1.06)
Total distributions
(.51)
(4.46)
(2.34)
(1.48) J
Net asset value, end of period
$ 8.11
$ 14.34
$ 22.69
$ 18.46
Total Return B, C, D
(39.91)%
(17.83)%
36.53%
3.52%
Ratios to Average Net Assets F, I
Expenses before reductions
.85%
.85%
.85%
.99% A
Expenses net of fee waivers, if any
.85%
.85%
.85%
.99% A
Expenses net of all reductions
.85%
.85%
.85%
.96% A
Net investment income (loss)
2.42%
1.10%
1.62%
1.98% A
Supplemental Data
Net assets, end of period (000 omitted)
$ 22,711
$ 31,632
$ 50,198
$ 7,134
Portfolio turnover rate G
87%
102%
70%
75%
A Annualized B Total returns for periods of less than one year are not annualized. C Total returns do not reflect charges attributable to your insurance company's separate account. Inclusion of these charges would reduce the total returns shown. D Total returns would have been lower had certain expenses not been reduced during the periods shown. E Calculated based on average shares outstanding during the period. F Fees and expenses of the underlying Fidelity Central Funds are not included in the Fund's expense ratio. The Fund indirectly bears its proportionate share of the expenses of any underlying Fidelity Central Funds. G Amount does not include the portfolio activity of any underlying Fidelity Central Funds. H For the period July 21, 2005 (commencement of sale of shares) to December 31, 2005. I Expense ratios reflect operating expenses of the class. Expenses before reductions do not reflect amounts reimbursed by the investment adviser or reductions from brokerage service arrangements or other expense offset arrangements and do not represent the amount paid by the class during periods when reimbursements or reductions occur. Expense ratios before reductions for start-up periods may not be representative of longer-term operating periods. Expenses net of fee waivers reflect expenses after reimbursement by the investment adviser but prior to reductions from brokerage service arrangements or other expense offset arrangements. Expenses net of all reductions represent the net expenses paid by the class. J Total distributions of $1.48 per share is comprised of distributions from net investment income of $.419 and distributions from net realized gain of $1.06 per share.
See accompanying notes which are an integral part of the financial statements.
VIP Real Estate Portfolio (the Fund) is a non-diversified fund of Variable Insurance Products Fund IV (the trust) and is authorized to issue an unlimited number of shares. The trust is registered under the Investment Company Act of 1940, as amended (the 1940 Act), as an open-end management investment company organized as a Massachusetts business trust. Shares of the Fund may only be purchased by insurance companies for the purpose of funding variable annuity or variable life insurance contracts. The Fund offers the following classes of shares: Initial Class shares, Service Class shares, Service Class 2 shares, and Investor Class shares. All classes have equal rights and voting privileges, except for matters affecting a single class. Investment income, realized and unrealized capital gains and losses, the common expenses of the Fund, and certain fund-level expense reductions, if any, are allocated on a pro rata basis to each class based on the relative net assets of each class to the total net assets of the Fund. Each class differs with respect to transfer agent and distribution and service plan fees incurred. Certain expense reductions also differ by class.
2. Investments in Fidelity Central Funds.
The Fund may invest in Fidelity Central Funds, which are open-end investment companies available only to other investment companies and accounts managed by Fidelity Management & Research Company (FMR) and its affiliates. The Fund's Schedule of Investments lists each of the Fidelity Central Funds held as of period end, if any, as an investment of the Fund, but does not include the underlying holdings of each Fidelity Central Fund. As an Investing Fund, the Fund indirectly bears its proportionate share of the expenses of the underlying Fidelity Central Funds.
The Money Market Central Funds seek preservation of capital and current income and are managed by Fidelity Investments Money Management, Inc. (FIMM), an affiliate of FMR.
A complete unaudited list of holdings for each Fidelity Central Fund is available upon request or at the SEC's web site at www.sec.gov. In addition, the financial statements of the Fidelity Central Funds, which are not covered by the Fund's Report of Independent Registered Public Accounting Firm, are available on the SEC's web site or upon request.
3. Significant Accounting Policies.
The financial statements have been prepared in conformity with accounting principles generally accepted in the United States of America, which require management to make certain estimates and assumptions at the date of the financial statements. Actual results could differ from those estimates. The following summarizes the significant accounting policies of the Fund:
Security Valuation. Investments are valued as of 4:00 p.m. Eastern time on the last calendar day of the period. Wherever possible, the Fund uses independent pricing services approved by the Board of Trustees to value its investments.
Equity securities, including restricted securities, for which market quotations are readily available, are valued at the last reported sale price or official closing price as reported by an independent pricing service on the primary market or exchange on which they are traded. In the event there were no sales during the day or closing prices are not available, securities are valued at the last quoted bid price. Investments in open-end mutual funds, including the Fidelity Central Funds, are valued at their closing net asset value each business day. Short-term securities with remaining maturities of sixty days or less for which quotations are not readily available are valued at amortized cost, which approximates value.
When current market prices or quotations are not readily available or reliable, valuations may be determined in good faith in accordance with procedures adopted by the Board of Trustees. Factors used in determining value may include significant market or security specific events, changes in interest rates and credit quality, and developments in foreign markets which are monitored by evaluating the performance of ADRs, futures contracts and exchange-traded funds. The frequency with which these procedures are used cannot be predicted and may be utilized to a significant extent. The value of securities used for net asset value (NAV) calculation under these procedures may differ from published prices for the same securities.
The Fund is subject to the provisions of Statement of Financial Accounting Standards No. 157, "Fair Value Measurements" (SFAS 157), effective with the beginning of the Fund's fiscal year. SFAS 157 establishes a hierarchy that prioritizes the inputs to valuation techniques giving the highest priority to readily available unadjusted quoted prices in active markets for identical assets (level 1 measurements) and the lowest priority to unobservable inputs (level 3 measurements) when market prices are not readily available or reliable. The three levels of the hierarchy under SFAS 157 are described below:
Level 1
Quoted prices in active markets for identical securities.
Level 2
Prices determined using other significant observable inputs. Observable inputs are inputs that other market participants may use in pricing a security. These may include quoted prices for similar securities, interest rates, prepayment speeds, credit risk and others.
Level 3
Prices determined using significant unobservable inputs. In situations where quoted prices or observable inputs are unavailable or deemed less relevant (for example, when there is little or no market activity for an investment at the end of the period), unobservable inputs may be used. Unobservable inputs reflect the Fund's own assumptions about the factors market participants would use in pricing an investment, and would be based on the best information available.
Annual Report
3. Significant Accounting Policies - continued
Security Valuation - continued
Changes in valuation techniques may result in transfers in or out of an investment's assigned level within the hierarchy.
The aggregate value by input level, as of December 31, 2008, for the Fund's investments is included at the end of the Fund's Schedule of Investments.
Foreign Currency. The Fund uses foreign currency contracts to facilitate transactions in foreign-denominated securities. Losses from these transactions may arise from changes in the value of the foreign currency or if the counterparties do not perform under the contracts' terms.
Foreign-denominated assets, including investment securities, and liabilities are translated into U.S. dollars at the exchange rate at period end. Purchases and sales of investment securities, income and dividends received and expenses denominated in foreign currencies are translated into U.S. dollars at the exchange rate in effect on the transaction date.
The effects of exchange rate fluctuations on investments are included with the net realized and unrealized gain (loss) on investment securities. Other foreign currency transactions resulting in realized and unrealized gain (loss) are disclosed separately.
Investment Transactions and Income. For financial reporting purposes, the Fund's investment holdings and NAV include trades executed through the end of the last business day of the period. The NAV per share for processing shareholder transactions is calculated as of the close of business of the New York Stock Exchange (NYSE), normally 4:00 p.m. Eastern time and includes trades executed through the end of the prior business day. Gains and losses on securities sold are determined on the basis of identified cost. Dividend income is recorded on the ex-dividend date, except for certain dividends from foreign securities where the ex-dividend date may have passed, which are recorded as soon as the Fund is informed of the ex-dividend date. Non-cash dividends included in dividend income, if any, are recorded at the fair market value of the securities received. Distributions received on securities that represent a return of capital or capital gain are recorded as a reduction of cost of investments and/or as a realized gain. The Fund estimates the components of distributions received that may be considered return of capital distributions or capital gain distributions. Interest income and distributions from the Fidelity Central Funds are accrued as earned. Interest income includes coupon interest and amortization of premium and accretion of discount on debt securities. Investment income is recorded net of foreign taxes withheld where recovery of such taxes is uncertain.
Expenses. Most expenses of the trust can be directly attributed to a fund. Expenses which cannot be directly attributed are apportioned among each Fund in the trust. Expense estimates are accrued in the period to which they relate and adjustments are made when actual amounts are known.
Income Tax Information and Distributions to Shareholders. Each year, the Fund intends to qualify as a regulated investment company by distributing substantially all of its taxable income and realized gains under Subchapter M of the Internal Revenue Code and filing its U.S. federal tax return. As a result, no provision for income taxes is required. The Fund is subject to the provisions of FASB Interpretation No. 48, Accounting for Uncertainties in Income Taxes (FIN 48). FIN 48 sets forth a minimum threshold for financial statement recognition of the benefit of a tax position taken or expected to be taken in a tax return. There are no unrecognized tax benefits in the accompanying financial statements. A Fund's federal tax return is subject to examination by the Internal Revenue Service (IRS) for a period of three years. Foreign taxes are provided for based on the Fund's understanding of the tax rules and rates that exist in the foreign markets in which it invests.
Distributions are recorded on the ex-dividend date. Income dividends and capital gain distributions are declared separately for each class. Income and capital gain distributions are determined in accordance with income tax regulations, which may differ from generally accepted accounting principles.
Capital accounts within the financial statements are adjusted for permanent book-tax differences. These adjustments have no impact on net assets or the results of operations. Temporary book-tax differences will reverse in a subsequent period.
Book-tax differences are primarily due to foreign currency transactions, passive foreign investment companies (PFIC) and losses deferred due to wash sales and excise tax regulations.
The tax-basis components of distributable earnings and the federal tax cost as of period end were as follows:
Unrealized appreciation
$ 3,659,961
Unrealized depreciation
(33,108,373)
Net unrealized appreciation (depreciation)
(29,448,412)
Undistributed ordinary income
151,507
Cost for federal income tax purposes
$ 88,957,639
Annual Report
Notes to Financial Statements - continued
3. Significant Accounting Policies - continued
Income Tax Information and Distributions to Shareholders - continued
The tax character of distributions paid was as follows:
December 31, 2008
December 31, 2007
Ordinary Income
$ 2,499,867
$ 3,497,299
Long-term Capital Gains
1,117,046
25,411,016
Total
$ 3,616,913
$ 28,908,315
4. Operating Policies.
Repurchase Agreements. FMR has received an Exemptive Order from the Securities and Exchange Commission (the SEC) which permits the Fund and other affiliated entities of FMR to transfer uninvested cash balances into joint trading accounts which are then invested in repurchase agreements. The Fund may also invest directly with institutions in repurchase agreements. Repurchase agreements are collateralized by government or non-government securities. Upon settlement date, collateral is held in segregated accounts with custodian banks and may be obtained in the event of a default of the counterparty. The Fund monitors, on a daily basis, the value of the collateral to ensure it is at least equal to the principal amount of the repurchase agreement (including accrued interest). In the event of a default by the counterparty, realization of the collateral proceeds could be delayed, during which time the value of the collateral may decline.
5. Purchases and Sales of Investments.
Purchases and sales of securities, other than short-term securities, aggregated $83,526,828 and $82,436,985, respectively.
6. Fees and Other Transactions with Affiliates.
Management Fee. FMR and its affiliates provide the Fund with investment management related services for which the Fund pays a monthly management fee. The management fee is the sum of an individual fund fee rate that is based on an annual rate of .30% of the Fund's average net assets and a group fee rate that averaged .26% during the period. The group fee rate is based upon the average net assets of all the mutual funds advised by FMR. The group fee rate decreases as assets under management increase and increases as assets under management decrease. For the period, the total annual management fee rate was .56% of the Fund's average net assets.
Distribution and Service Plan. In accordance with Rule 12b-1 of the 1940 Act, the Fund has adopted separate 12b-1 Plans for each Service Class of shares. Each Service Class pays Fidelity Distributors Corporation (FDC), an affiliate of FMR, a service fee. For the period, the service fee is based on an annual rate of .10% of Service Class' average net assets and .25% of Service Class 2's average net assets.
For the period, each class paid FDC the following amounts, all of which were re-allowed to insurance companies for the distribution of shares and providing shareholder support services:
Service Class
$ 2,982
Service Class 2
8,696
$ 11,678
Transfer Agent Fees. Fidelity Investments Institutional Operations Company, Inc. (FIIOC), an affiliate of FMR, is the Fund's transfer, dividend disbursing, and shareholder servicing agent. FIIOC receives an asset-based fee with respect to each class. Each class (with the exception of Investor Class) pays a transfer agent fee, excluding out of pocket expenses, equal to an annual rate of .07% of average net assets. Investor Class pays a monthly asset-based transfer agent fee of .15% of average net assets. Prior to February 1, 2008, Investor Class paid a monthly asset-based transfer agent fee of .18% of average net assets. The total transfer agent fees paid by each class to FIIOC, including out of pocket expenses, were as follows:
Initial Class
$ 42,540
Service Class
2,063
Service Class 2
3,245
Investor Class
54,650
$ 102,498
Accounting Fees. Fidelity Service Company, Inc. (FSC), an affiliate of FMR, maintains the Fund's accounting records. The fee is based on the level of average net assets for the month.
Brokerage Commissions. The Fund placed a portion of its portfolio transactions with brokerage firms which are affiliates of the investment adviser. The commissions paid to these affiliated firms were $3,559 for the period.
Annual Report
7. Committed Line of Credit.
The Fund participates with other funds managed by FMR in a $4.2 billion credit facility (the "line of credit") to be utilized for temporary or emergency purposes to fund shareholder redemptions or for other short-term liquidity purposes. The Fund has agreed to pay commitment fees on its pro rata portion of the line of credit, which amounted to $217 and is reflected in Miscellaneous Expense on the Statement of Operations. During the period, there were no borrowings on this line of credit.
8. Expense Reductions.
Many of the brokers with whom FMR places trades on behalf of the Fund provided services to the Fund in addition to trade execution. These services included payments of certain expenses on behalf of the Fund totaling $799 for the period.
9. Other.
The Fund's organizational documents provide former and current trustees and officers with a limited indemnification against liabilities arising in connection with the performance of their duties to the Fund. In the normal course of business, the Fund may also enter into contracts that provide general indemnifications. The Fund's maximum exposure under these arrangements is unknown as this would be dependent on future claims that may be made against the Fund. The risk of material loss from such claims is considered remote.
At the end of the period, FMR or its affiliates were the owners of record of 96% of the total outstanding shares of the Fund.
In December 2006, the Independent Trustees, with the assistance of independent counsel, completed an investigation regarding gifts, gratuities and business entertainment provided by certain brokers to certain individuals who were employed on FMR's domestic equity trading desk during the period 2002 to 2004. The Independent Trustees and FMR agreed that, despite the absence of proof that the Fidelity mutual funds experienced diminished execution quality as a result of the improper receipt of gifts and business entertainment, the conduct at issue was serious and was worthy of redress. Accordingly, the Independent Trustees requested, and FMR agreed to make, a payment of $42 million plus accrued interest, which equaled approximately $7.3 million,to certain Fidelity mutual funds.
In March 2008, the Trustees approved a method for allocating this payment among the funds and, in total, FMR paid the fund $8,376 which is recorded in the accompanying Statement of Operations.
In a related administrative order dated March 5, 2008, the U.S. Securities and Exchange Commission ("SEC") announced a settlement with FMR and FMR Co., Inc. (an affiliate of FMR) involving the SEC's regulatory rules for investment advisers and the improper receipt of gifts, gratuities and business entertainment. Without admitting or denying the SEC's findings, FMR agreed to pay an $8 million civil penalty to the United States Treasury.
During the period, Lehman Brothers Holdings, Inc. and certain of its affiliates (LBHI) sought protection under the insolvency laws of their jurisdictions of organization, including the United States, the United Kingdom and Japan. At the time LBHI's insolvency proceedings were instituted, the Fund had outstanding securities trades with counterparties affiliated with LBHI. As a result of the insolvency proceedings, LBHI is unable to fulfill its commitments and, in certain cases, the Fund may have terminated its trades and related agreements with the relevant entities and, where appropriate, is in the process of initiating claims for damages. FMR believes that the financial impact to the Fund relating to the terminated trades and agreements is immaterial.
10. Distributions to Shareholders.
Distributions to shareholders of each class were as follows:
Years ended December 31,
2008
2007
From net investment income
Initial Class
$ 1,416,267
$ 1,365,795
Service Class
58,561
68,258
Service Class 2
104,945
62,646
Investor Class
920,094
586,440
Total
$ 2,499,867
$ 2,083,139
From net realized gain
Initial Class
$ 631,633
$ 17,699,464
Service Class
28,427
793,369
Service Class 2
48,687
800,493
Investor Class
408,299
7,531,850
Total
$ 1,117,046
$ 26,825,176
Annual Report
Notes to Financial Statements - continued
11. Share Transactions.
Transactions for each class of shares were as follows:
Shares
Dollars
Years ended December 31,
2008
2007
2008
2007
Initial Class
Shares sold
1,072,807
1,009,853
$ 15,243,890
$ 24,565,352
Reinvestment of distributions
245,583
1,205,003
2,047,900
19,065,259
Shares redeemed
(2,026,672)
(6,507,635)
(26,391,337)
(141,392,015)
Net increase (decrease)
(708,282)
(4,292,779)
$ (9,099,547)
$ (97,761,404)
Service Class
Shares sold
-
-
$ -
$ -
Reinvestment of distributions
10,234
57,280
86,988
861,626
Shares redeemed
(86,835)
-
(942,259)
-
Net increase (decrease)
(76,601)
57,280
$ (855,271)
$ 861,626
Service Class 2
Shares sold
230,882
2,439
$ 2,490,148
$ 60,976
Reinvestment of distributions
18,848
57,564
153,632
863,138
Shares redeemed
(144,174)
(138)
(1,475,124)
(3,144)
Net increase (decrease)
105,556
59,865
$ 1,168,656
$ 920,970
Investor Class
Shares sold
1,443,530
1,124,988
$ 20,545,410
$ 26,378,804
Reinvestment of distributions
162,246
528,915
1,328,392
8,118,290
Shares redeemed
(1,010,483)
(1,660,061)
(12,891,458)
(35,998,756)
Net increase (decrease)
595,293
(6,158)
$ 8,982,344
$ (1,501,662)
Annual Report
Reportof Independent Registered Public Accounting Firm
To the Trustees of Variable Insurance Products Fund IV and the Shareholders of VIP Real Estate Portfolio:
In our opinion, the accompanying statement of assets and liabilities, including the schedule of investments, and the related statements of operations and of changes in net assets and the financial highlights present fairly, in all material respects, the financial position of VIP Real Estate Portfolio (a fund of Variable Insurance Products Fund IV) at December 31, 2008, the results of its operations for the year then ended, the changes in its net assets for each of the two years in the period then ended and the financial highlights for each of the periods indicated, in conformity with accounting principles generally accepted in the United States of America. These financial statements and financial highlights (hereafter referred to as "financial statements") are the responsibility of the VIP Real Estate Portfolio's management. Our responsibility is to express an opinion on these financial statements based on our audits. We conducted our audits of these financial statements in accordance with the standards of the Public Company Accounting Oversight Board (United States). Those standards require that we plan and perform the audit to obtain reasonable assurance about whether the financial statements are free of material misstatement. An audit includes examining, on a test basis, evidence supporting the amounts and disclosures in the financial statements, assessing the accounting principles used and significant estimates made by management, and evaluating the overall financial statement presentation. We believe that our audits, which included confirmation of securities at December 31, 2008 by correspondence with the custodian and brokers, provide a reasonable basis for our opinion.
The Trustees, Member of the Advisory Board, and executive officers of the trust and fund, as applicable, are listed below. The Board of Trustees governs the fund and is responsible for protecting the interests of shareholders. The Trustees are experienced executives who meet periodically throughout the year to oversee the fund's activities, review contractual arrangements with companies that provide services to the fund, and review the fund's performance. Except for Edward C. Johnson 3d and James C. Curvey, each of the Trustees oversees 222 funds advised by FMR or an affiliate. Messrs. Johnson and Curvey oversee 380 funds advised by FMR or an affiliate.
The Trustees hold office without limit in time except that (a) any Trustee may resign; (b) any Trustee may be removed by written instrument, signed by at least two-thirds of the number of Trustees prior to such removal; (c) any Trustee who requests to be retired or who has become incapacitated by illness or injury may be retired by written instrument signed by a majority of the other Trustees; and (d) any Trustee may be removed at any special meeting of shareholders by a two-thirds vote of the outstanding voting securities of the trust. Each Trustee who is not an interested person (as defined in the 1940 Act) (Independent Trustee), shall retire not later than the last day of the calendar year in which his or her 72nd birthday occurs. The Independent Trustees may waive this mandatory retirement age policy with respect to individual Trustees. The executive officers and Advisory Board Member hold office without limit in time, except that any officer and Advisory Board Member may resign or may be removed by a vote of a majority of the Trustees at any regular meeting or any special meeting of the Trustees. Except as indicated, each individual has held the office shown or other offices in the same company for the past five years.
The fund's Statement of Additional Information (SAI) includes more information about the Trustees. To request a free copy, call Fidelity at 1-877-208-0098.
Interested Trustees*:
Correspondence intended for each Trustee who is an interested person may be sent to Fidelity Investments, 82 Devonshire Street, Boston, Massachusetts 02109.
Name, Age; Principal Occupation
Edward C. Johnson 3d (78)
Year of Election or Appointment: 1983
Mr. Johnson is Chairman of the Board of Trustees. Mr. Johnson serves as Chief Executive Officer, Chairman, and a Director of FMR LLC; Chairman and a Director of FMR; Chairman and a Director of Fidelity Research & Analysis Company (FRAC); Chairman and a Director of Fidelity Investments Money Management, Inc.; and Chairman and a Director of FMR Co., Inc. In addition, Mr. Johnson serves as Chairman and Director of FIL Limited. Previously, Mr. Johnson served as President of FMR LLC (2006-2007).
James C. Curvey (73)
Year of Election or Appointment: 2007
Mr. Curvey also serves as Trustee (2007-present) of other investment companies advised by FMR. Mr. Curvey is a Director of FMR and FMR Co., Inc. (2007-present). Mr. Curvey is also Vice Chairman (2006-present) and Director of FMR LLC. In addition, Mr. Curvey serves as an Overseer for the Boston Symphony Orchestra and a member of the Trustees of Villanova University.
* Trustees have been determined to be "Interested Trustees" by virtue of, among other things, their affiliation with the trust or various entities under common control with FMR. FMR Corp. merged with and into FMR LLC on October 1, 2007. Any references to FMR LLC for prior periods are deemed to be references to the prior entity.
Independent Trustees:
Correspondence intended for each Independent Trustee (that is, the Trustees other than the Interested Trustees) may be sent to Fidelity Investments, P.O. Box 55235, Boston, Massachusetts 02205-5235.
Name, Age; Principal Occupation
Dennis J. Dirks (60)
Year of Election or Appointment: 2005
Prior to his retirement in May 2003, Mr. Dirks was Chief Operating Officer and a member of the Board of The Depository Trust & Clearing Corporation (DTCC) (1999-2003). He also served as President, Chief Operating Officer, and Board member of The Depository Trust Company (DTC) (1999-2003) and President and Board member of the National Securities Clearing Corporation (NSCC) (1999-2003). In addition, Mr. Dirks served as Chief Executive Officer and Board member of the Government Securities Clearing Corporation (2001-2003), Chief Executive Officer and Board member of the Mortgage-Backed Securities Clearing Corporation (2001-2003), as a Trustee and a member of the Finance Committee of Manhattan College (2005-2008), and as a Trustee and a member of the Finance Committee of AHRC of Nassau County (2006-2008). Currently, Mr. Dirks serves as a member of the Board of Directors for The Brookville Center for Children's Services, Inc. (2009-present).
Alan J. Lacy (55)
Year of Election or Appointment: 2008
Mr. Lacy serves as Senior Adviser (2007-present) of Oak Hill Capital Partners, L.P. (a private equity firm). Mr. Lacy also served as Chief Executive Officer (2000-2005) and Vice Chairman (2005-2006) of Sears Holdings Corporation and Sears, Roebuck and Co. (retail). In addition, Mr. Lacy serves as a member of the Board of Directors of The Western Union Company (global money transfer, 2006-present) and Bristol-Myers Squibb (global pharmaceuticals, 2007-present). Mr. Lacy is a Trustee of the National Parks Conservation Association and The Field Museum of Natural History.
Ned C. Lautenbach (64)
Year of Election or Appointment: 2000
Mr. Lautenbach is Chairman of the Independent Trustees (2006-present). Mr. Lautenbach is an Advisory Partner of Clayton, Dubilier & Rice, Inc. (private equity investment firm). Previously, Mr. Lautenbach was with the International Business Machines Corporation (IBM) from 1968 until his retirement in 1998. Mr. Lautenbach serves as a Director of Eaton Corporation (diversified industrial) as well as the Philharmonic Center for the Arts in Naples, Florida. He also is a member of the Board of Trustees of Fairfield University (2005-present), as well as a member of the Council on Foreign Relations. Previously, Mr. Lautenbach served as a Director of Sony Corporation (2006-2007).
Joseph Mauriello (64)
Year of Election or Appointment: 2008
Prior to his retirement in January 2006, Mr. Mauriello served in numerous senior management positions including Deputy Chairman and Chief Operating Officer (2004-2005), and Vice Chairman of Financial Services (2002-2004) of KPMG LLP US (professional services firm, 1965-2005). Mr. Mauriello currently serves as a member of the Board of Directors of XL Capital Ltd. (global insurance and re-insurance company, 2006-present) and of Arcadia Resources Inc. (health care services and products, 2007-present). He also served as a Director of the Hamilton Funds of the Bank of New York (2006-2007).
Cornelia M. Small (64)
Year of Election or Appointment: 2005
Ms. Small is a member of the Investment Committee, and Chair (2008-present) and a member of the Board of Trustees of Smith College. Ms. Small also serves on the Investment Committee of the Berkshire Taconic Community Foundation (2008-present). Previously, Ms. Small served as Chairperson of the Investment Committee (2002-2008) of Smith College and as Co-Chair (2000-2003) of the Annual Fund for the Fletcher School of Law and Diplomacy. In addition, she served as Chief Investment Officer, Director of Global Equity Investments, and a member of the Board of Directors of Scudder, Stevens & Clark and Scudder Kemper Investments.
William S. Stavropoulos (69)
Year of Election or Appointment: 2001
Mr. Stavropoulos is Chairman Emeritus of the Board of Directors of The Dow Chemical Company, where he previously served in numerous senior management positions, including President (1993-2000; 2002-2003), CEO (1995-2000; 2002-2004), Chairman of the Executive Committee (2000-2006), and as a member of the Board of Directors (1990-2006). Currently, he is a Director of Teradata Corporation (data warehousing and technology solutions, 2008-present), Chemical Financial Corporation, Maersk Inc. (industrial conglomerate), Tyco International, Inc. (multinational manufacturing and services, 2007-present), and a member of the Advisory Board for Metalmark Capital (private equity investment firm, 2005-present). He is a special advisor to Clayton, Dubilier & Rice, Inc. (private equity investment). In addition, Mr. Stavropoulos is a member of the University of Notre Dame Advisory Council for the College of Science.
David M. Thomas (59)
Year of Election or Appointment: 2008
Previously, Mr. Thomas served as Executive Chairman (2005-2006) and Chairman and Chief Executive Officer (2000-2005) of IMS Health, Inc. (pharmaceutical and healthcare information solutions). In addition, Mr. Thomas serves as a member of the Board of Directors of Fortune Brands, Inc. (consumer products holding company), and Interpublic Group of Companies, Inc. (marketing communication, 2004-present).
Michael E. Wiley (58)
Year of Election or Appointment: 2008
Mr. Wiley also serves as a member of the Board of Trustees of the University of Tulsa (2000-2006; 2007-present). He serves as a Director of Tesoro Corporation (independent oil refiner and marketer, 2005-present), and a Director of Bill Barrett Corporation (exploration and production company, 2005-present). In addition, he also serves as a Director of Post Oak Bank (privately-held bank, 2004-present). Previously, Mr. Wiley served as a Sr. Energy Advisor of Katzenbach Partners, LLC (consulting firm, 2006-2007), as an Advisory Director of Riverstone Holdings (private investment firm), Chairman, President, and CEO of Baker Hughes, Inc. (oilfield services company, 2000-2004), and as Director of Spinnaker Exploration Company (exploration and production company, 2001-2005).
Annual Report
Trustees and Officers - continued
Advisory Board Member and Executive Officers**:
Correspondence intended for each executive officer and Mr. Lynch may be sent to Fidelity Investments, 82 Devonshire Street, Boston, Massachusetts 02109.
Name, Age; Principal Occupation
Peter S. Lynch (64)
Year of Election or Appointment: 2003
Member of the Advisory Board of Fidelity's Equity and High Income Funds. Mr. Lynch is Vice Chairman and a Director of FMR, and Vice Chairman (2001-present) and a Director of FMR Co., Inc. Previously, Mr. Lynch served as a Trustee of the Fidelity funds (1990-2003). In addition, he serves as a Trustee of Boston College and as the Chairman of the Inner-City Scholarship Fund. Previously, Mr. Lynch served on the Special Olympics International Board of Directors (1997-2006).
Kenneth B. Robins (39)
Year of Election or Appointment: 2008
President and Treasurer of Fidelity's Equity and High Income Funds. Mr. Robins is an employee of Fidelity Investments (2004-present). Before joining Fidelity Investments, Mr. Robins worked at KPMG LLP, where he was a partner in KPMG's department of professional practice (2002-2004).
Brian B. Hogan (44)
Year of Election or Appointment: 2007
Vice President of Sector Funds. Mr. Hogan also serves as Senior Vice President, Equity Research of FMR. Previously, Mr. Hogan served as a portfolio manager.
Scott C. Goebel (40)
Year of Election or Appointment: 2008
Secretary and Chief Legal Officer (CLO) of the Fidelity funds. Mr. Goebel also serves as General Counsel, Secretary, and Senior Vice President of FMR (2008-present); Deputy General Counsel of FMR LLC; Chief Legal Secretary of Fidelity Management & Research (Hong Kong) Limited (2008-present) and Assistant Secretary of Fidelity Management & Research (Japan) Inc. (2008-present). Previously, Mr. Goebel served as Assistant Secretary of the Funds (2007-2008) and as Vice President and Secretary of Fidelity Distributors Corporation (FDC) (2005-2007).
John B. McGinty, Jr. (46)
Year of Election or Appointment: 2008
Assistant Secretary of Fidelity's Equity and High Income Funds. Mr. McGinty is an employee of Fidelity Investments (2004-present). Mr. McGinty also serves as Senior Vice President, Secretary, and Chief Legal Officer of Fidelity Distributors Corporation (FDC) (2007-present). Before joining Fidelity Investments, Mr. McGinty practiced law at Ropes & Gray, LLP.
Holly C. Laurent (54)
Year of Election or Appointment: 2008
Anti-Money Laundering (AML) Officer of the Fidelity funds. Ms. Laurent is an employee of Fidelity Investments. Previously, Ms. Laurent was Senior Vice President and Head of Legal for Fidelity Business Services India Pvt. Ltd. (2006-2008), Senior Vice President, Deputy General Counsel and Group Head for FMR LLC (2005-2006).
Christine Reynolds (50)
Year of Election or Appointment: 2008
Chief Financial Officer of the Fidelity funds. Ms. Reynolds became President of Fidelity Pricing and Cash Management Services (FPCMS) in August 2008. She served as Chief Operating Officer of FPCMS from 2007 through July 2008. Previously, Ms. Reynolds served as President, Treasurer, and Anti-Money Laundering officer of the Fidelity funds (2004-2007). Before joining Fidelity Investments, Ms. Reynolds worked at PricewaterhouseCoopers LLP (PwC) (1980-2002), where she was an audit partner with PwC's investment management practice.
Kenneth A. Rathgeber (61)
Year of Election or Appointment: 2004
Chief Compliance Officer of Fidelity's Equity and High Income Funds. Mr. Rathgeber is Chief Compliance Officer of Fidelity Management & Research (Hong Kong) Limited (2008-present), Fidelity Management & Research (Japan) Inc. (2008-present), FMR (2005-present), FMR Co., Inc. (2005-present), Fidelity Management & Research (U.K.) Inc. (2005-present), Fidelity Research & Analysis Company (2005-present), Fidelity Investments Money Management, Inc. (2005-present), and Strategic Advisers, Inc. (2005-present).
Bryan A. Mehrmann (47)
Year of Election or Appointment: 2005
Deputy Treasurer of the Fidelity funds. Mr. Mehrmann is an employee of Fidelity Investments. Previously, Mr. Mehrmann served as Vice President of Fidelity Investments Institutional Services Group (FIIS)/Fidelity Investments Institutional Operations Company, Inc. (FIIOC) Client Services (1998-2004).
Adrien E. Deberghes (41)
Year of Election or Appointment: 2008
Deputy Treasurer of Fidelity's Equity and High Income Funds. Mr. Deberghes is an employee of Fidelity Investments (2008-present). Previously, Mr. Deberghes served as Senior Vice President of Mutual Fund Administration at State Street Corporation (2007-2008), Senior Director of Mutual Fund Administration at Investors Bank & Trust (2005-2007), and Director of Finance for Dunkin' Brands (2000-2005).
Robert G. Byrnes (42)
Year of Election or Appointment: 2005
Assistant Treasurer of the Fidelity funds. Mr. Byrnes is an employee of Fidelity Investments (2005-present). Previously, Mr. Byrnes served as Vice President of Fidelity Pricing and Cash Management Services (FPCMS) (2003-2005). Before joining Fidelity Investments, Mr. Byrnes worked at Deutsche Asset Management where he served as Vice President of the Investment Operations Group (2000-2003).
Paul M. Murphy (61)
Year of Election or Appointment: 2007
Assistant Treasurer of the Fidelity funds. Mr. Murphy is an employee of Fidelity Investments (2007-present). Previously, Mr. Murphy served as Chief Financial Officer of the Fidelity Funds (2005-2006), Vice President and Associate General Counsel of FMR (2007), and Senior Vice President of Fidelity Pricing and Cash Management Services (FPCMS) (1994-2007).
Gary W. Ryan (50)
Year of Election or Appointment: 2005
Assistant Treasurer of the Fidelity funds. Mr. Ryan is an employee of Fidelity Investments. Previously, Mr. Ryan served as Vice President of Fund Reporting in Fidelity Pricing and Cash Management Services (FPCMS) (1999-2005).
** FMR Corp. merged with and into FMR LLC on October 1, 2007. Any references to FMR LLC for prior periods are deemed to be references to the prior entity.
The fund hereby designates as a capital gain dividend with respect to the taxable year ended December 31, 2008, $861,058, or, if subsequently determined to be different, the net capital gain of such year.
The fund will notify shareholders in January 2009 of amounts for use in preparing 2008 income tax returns.
A special meeting of the fund's shareholders was held on May 14, 2008. The results of votes taken among shareholders on the proposals before them are reported below. Each vote reported represents one dollar of net asset value held on the record date for the meeting.
PROPOSAL 1
To elect a Board of Trustees.A
# of Votes
% of Votes
James C. Curvey
Affirmative
82,890,712.47
95.991
Withheld
3,461,988.43
4.009
TOTAL
86,352,700.90
100.000
Dennis J. Dirks
Affirmative
82,970,372.75
96.083
Withheld
3,382,328.15
3.917
TOTAL
86,352,700.90
100.000
Edward C. Johnson 3d
Affirmative
82,689,162.78
95.757
Withheld
3,663,538.12
4.243
TOTAL
86,352,700.90
100.000
Alan J. Lacy
Affirmative
83,041,222.35
96.165
Withheld
3,311,478.55
3.835
TOTAL
86,352,700.90
100.000
Ned C. Lautenbach
Affirmative
82,983,853.72
96.099
Withheld
3,368,847.18
3.901
TOTAL
86,352,700.90
100.000
Joseph Mauriello
Affirmative
83,138,122.14
96.277
Withheld
3,214,578.76
3.723
TOTAL
86,352,700.90
100.000
Cornelia M. Small
Affirmative
83,095,438.06
96.228
Withheld
3,257,262.84
3.772
TOTAL
86,352,700.90
100.000
William S. Stavropoulos
Affirmative
82,929,113.95
96.035
Withheld
3,423,586.95
3.965
TOTAL
86,352,700.90
100.000
David M. Thomas
Affirmative
83,095,487.87
96.228
Withheld
3,257,213.03
3.772
TOTAL
86,352,700.90
100.000
Michael E. Wiley
Affirmative
83,048,523.75
96.174
Withheld
3,304,177.15
3.826
TOTAL
86,352,700.90
100.000
PROPOSAL 2
To amend the Declaration of Trust to reduce the required quorum for future shareholder meetings.A
# of Votes
% of Votes
Affirmative
74,393,635.26
86.151
Against
8,745,543.59
10.128
Abstain
3,213,522.05
3.721
TOTAL
86,352,700.90
100.000
ADenotes trust-wide proposal and voting results.
Annual Report
BoardApproval of Investment Advisory Contracts and Management Fees
VIP Real Estate Portfolio
Each year, typically in July, the Board of Trustees, including the Independent Trustees (together, the Board), votes on the renewal of the management contract and sub-advisory agreements (together, the Advisory Contracts) for the fund. The Board, assisted by the advice of fund counsel and Independent Trustees' counsel, requests and considers a broad range of information throughout the year.
The Board meets regularly and, acting directly and through its separate committees, requests and receives information concerning, and considers at each of its meetings factors that are relevant to, its annual consideration of the renewal of the fund's Advisory Contracts, including the services and support provided to the fund and its shareholders. At the time of the renewal, the Board had 12 standing committees, each composed of Independent Trustees with varying backgrounds, to which the Board has assigned specific subject matter responsibilities in order to enhance effective decision-making by the Board. Each committee has a written charter outlining the structure and purposes of the committee. The Board also meets as needed to consider matters specifically related to the Board's annual consideration of the renewal of Advisory Contracts.
At its July 2008 meeting, the Board of Trustees, including the Independent Trustees, unanimously determined to renew the fund's Advisory Contracts. In reaching its determination, the Board considered all factors it believed relevant, including (i) the nature, extent, and quality of the services to be provided to the fund and its shareholders (including the investment performance of the fund); (ii) the competitiveness of the fund's management fee and total expenses; (iii) the total costs of the services to be provided by and the profits to be realized by Fidelity from its relationship with the fund; (iv) the extent to which economies of scale would be realized as the fund grows; and (v) whether fee levels reflect these economies of scale, if any, for the benefit of fund shareholders. The Board also approved agreements with foreign sub-advisers Fidelity Management & Research (Japan) Inc. and Fidelity Management & Research (Hong Kong) Limited, as well as amendments to the fund's agreement with Fidelity Management & Research (U.K.) Inc.
In considering whether to renew the Advisory Contracts for the fund, the Board ultimately reached a determination, with the assistance of fund counsel and Independent Trustees' counsel and through the exercise of its business judgment, that the renewal of the Advisory Contracts and the compensation to be received by Fidelity under the management contract is consistent with Fidelity's fiduciary duty under applicable law. The Board's decision to renew the Advisory Contracts was not based on any single factor noted above, but rather was based on a comprehensive consideration of all the information provided to the Board at its meetings throughout the year. The Board, in reaching its determination to renew the Advisory Contracts, is aware that shareholders in the fund have a broad range of investment choices available to them, including a wide choice among mutual funds offered by competitors to Fidelity, and that the fund's shareholders, with the opportunity to review and weigh the disclosure provided by the fund in its prospectus and other public disclosures, have chosen to invest in this fund, managed by Fidelity.
Nature, Extent, and Quality of Services Provided. The Board considered staffing within the investment adviser, FMR, and the sub-advisers (together, the Investment Advisers), including the backgrounds of the fund's investment personnel and the fund's investment objective and discipline. The Independent Trustees also had discussions with senior management of Fidelity's investment operations and investment groups. The Board considered the structure of the portfolio manager compensation program and whether this structure provides appropriate incentives.
Resources Dedicated to Investment Management and Support Services. The Board reviewed the size, education, and experience of the Investment Advisers' investment staff, their use of technology, and the Investment Advisers' approach to recruiting, training, and retaining portfolio managers and other research, advisory, and management personnel. The Board noted that Fidelity's analysts have access to a variety of technological tools that enable them to perform both fundamental and quantitative analysis and to specialize in various disciplines. The Board considered Fidelity's extensive global research capabilities that enable the Investment Advisers to aggregate data from various sources in an effort to produce positive investment results. The Board also considered that Fidelity's portfolio managers and analysts have access to daily portfolio attribution that allows for monitoring of a fund's portfolio, as well as an electronic communication system that provides immediate real-time access to research concerning issuers and credit enhancers.
Shareholder and Administrative Services. The Board considered (i) the nature, extent, quality, and cost of advisory, administrative, distribution, and shareholder services performed by the Investment Advisers and their affiliates under the Advisory Contracts and under separate agreements covering transfer agency, pricing and bookkeeping, and securities lending services for the fund; (ii) the nature and extent of the Investment Advisers' supervision of third party service providers, principally custodians and subcustodians; and (iii) the resources devoted to, and the record of compliance with, the fund's compliance policies and procedures. The Board also reviewed the allocation of fund brokerage, including allocations to brokers affiliated with the Investment Advisers, the use of brokerage commissions to pay fund expenses, and the use of "soft" commission dollars to pay for research services. The Board further considered that Fidelity voluntarily pays for market data out of its own resources.
The Board noted that the growth of fund assets across the complex allows Fidelity to reinvest in the development of services designed to enhance the value or convenience of the Fidelity funds as investment vehicles. These services include 24-hour access to account information and market information through phone representatives and over the Internet, and investor education materials and asset allocation tools.
Investment in a Large Fund Family. The Board considered the benefits to shareholders of investing in a Fidelity fund, including the benefits of investing in a fund that is part of a large family of funds offering a variety of investment disciplines and providing for a large variety of mutual fund investor services. The Board noted that Fidelity has taken a number of actions over the previous year that benefited particular funds, including (i) dedicating additional resources to investment research and to restructure the investment research teams; (ii) contractually agreeing to reduce the management fees on Fidelity's Institutional Money Market Funds and launching Class IV and Institutional Class of certain of these funds; (iii) reducing the transfer agent fees for the Fidelity Select Portfolios and Investor Class of the VIP funds; and (iv) launching Class K of 29 equity funds as a lower-fee class available to certain employer-sponsored retirement plans.
Annual Report
Investment Performance. The Board considered whether the fund has operated within its investment objective, as well as its record of compliance with its investment restrictions. It also reviewed the fund's absolute investment performance for each class, as well as the fund's relative investment performance for each class measured against a broad-based securities market index over multiple periods. The Board noted that FMR does not believe that a meaningful peer group exists against which to compare the fund's performance. The following charts considered by the Board show, over the one-, three-, and five-year periods ended December 31, 2007, the cumulative total returns of Initial Class and Service Class 2 of the fund and the cumulative total returns of a broad-based securities market index ("benchmark"). The returns of Initial Class and Service Class 2 show the performance of the highest and lowest performing classes, respectively (based on three-year performance).
VIP Real Estate Portfolio
The Board stated that the investment performance of Initial Class of the fund compared favorably to its benchmark for the one- and three-year periods, although the fund's five-year cumulative total return was lower than its benchmark. The Board considered that the variations in performance among the fund's classes reflect the variations in class expenses, which result in lower performance for higher expense classes.
The Board considered that FMR has taken steps to refocus and strengthen equity research, equity portfolio management, and compliance.
Based on its review, and giving particular weight to the nature and quality of the resources dedicated by the Investment Advisers to maintain and improve relative performance, the Board concluded that the nature, extent, and quality of the services provided to the fund will benefit the fund's shareholders, particularly in light of the Board's view that the fund's shareholders benefit from investing in a fund that is part of a large family of funds offering a variety of investment disciplines and services.
Competitiveness of Management Fee and Total Fund Expenses. The Board considered the fund's management fee and total expenses compared to "mapped groups" of competitive funds and classes. Fidelity creates "mapped groups" by combining similar Lipper investment objective categories that have comparable management fee characteristics. Combining Lipper investment objective categories aids the Board's management fee and total expense comparisons by broadening the competitive group used for comparison and by reducing the number of universes to which various Fidelity funds are compared. The Board also considered supplemental information about how the fund's management fee and total expenses ranked relative to groups based on Lipper classifications, which take into account a fund's market capitalization and style.
The Board considered two proprietary management fee comparisons for the 12-month periods shown in the chart below. The group of Lipper funds used by the Board for management fee comparisons is referred to below as the "Total Mapped Group." The Total Mapped Group comparison focuses on a fund's standing relative to the total universe of comparable funds available to investors, in terms of gross management fees before expense reimbursements or caps. "TMG %" represents the percentage of funds in the Total Mapped Group that had management fees that were lower than the fund's. For example, a TMG % of 4% means that 96% of the funds in the Total Mapped Group had higher management fees than the fund. The "Asset-Size Peer Group" (ASPG) comparison focuses on a fund's standing relative to non-Fidelity funds similar in size to the fund within the Total Mapped Group. The ASPG represents at least 15% of the funds in the Total Mapped Group with comparable asset size and management fee characteristics, subject to a minimum of 50 funds (or all funds in the Total Mapped Group if fewer than 50). Additional information, such as the ASPG quartile in which the fund's management fee ranked, is also included in the chart and considered by the Board.
Annual Report
Board Approval of Investment Advisory Contracts and Management Fees - continued
VIP Real Estate Portfolio
The Board noted that the fund's management fee ranked below the median of its Total Mapped Group and below the median of its ASPG for 2007.
Based on its review, the Board concluded that the fund's management fee was fair and reasonable in light of the services that the fund receives and the other factors considered.
In its review of each class's total expenses, the Board considered the fund's management fee as well as other fund or class expenses, as applicable, such as transfer agent fees, pricing and bookkeeping fees, fund-paid 12b-1 fees, and custodial, legal, and audit fees. The Board also noted the effects of any waivers and reimbursements on fees and expenses. As part of its review, the Board also considered current and historical total expenses of each class of the fund compared to competitive fund median expenses. Each class of the fund is compared to those funds and classes in the Total Mapped Group (used by the Board for management fee comparisons) that have a similar sales load structure.
The Board noted that the total expenses of each class ranked below its competitive median for 2007.
In its review of total expenses, the Board also considered Fidelity fee structures and other information on clients that FMR and its affiliates service in other competitive markets, such as other mutual funds advised or subadvised by FMR or its affiliates, pension plan clients, and other institutional clients.
Based on its review, the Board concluded that the total expenses of each class of the fund were reasonable in light of the services that the fund and its shareholders receive and the other factors considered.
Costs of the Services and Profitability. The Board considered the revenues earned and the expenses incurred by Fidelity in conducting the business of developing, marketing, distributing, managing, administering and servicing the fund and its shareholders. The Board also considered the level of Fidelity's profits in respect of all the Fidelity funds.
On an annual basis, FMR presents to the Board Fidelity's profitability for the fund. Fidelity calculates the profitability for each fund, as well as aggregate profitability for groups of Fidelity funds and all Fidelity funds, using a series of detailed revenue and cost allocation methodologies which originate with the audited books and records of Fidelity. The Audit Committee of the Board reviews any significant changes from the prior year's methodologies.
PricewaterhouseCoopers LLP (PwC), independent registered public accounting firm and auditor to Fidelity and certain Fidelity funds, has been engaged annually by the Board as part of the Board's assessment of the results of Fidelity's profitability analysis. PwC's engagement includes the review and assessment of Fidelity's methodologies used in determining the revenues and expenses attributable to Fidelity's mutual fund business, and completion of agreed-upon procedures surrounding the mathematical accuracy of fund profitability and its conformity to allocation methodologies. After considering PwC's reports issued under the engagement and information provided by Fidelity, the Board believes that while other allocation methods may also be reasonable, Fidelity's profitability methodologies are reasonable in all material respects.
The Board has also reviewed Fidelity's non-fund businesses and any fall-out benefits related to the mutual fund business as well as cases where Fidelity's affiliates may benefit from or be related to the fund's business.
The Board considered the costs of the services provided by and the profits realized by Fidelity in connection with the operation of the fund and determined that the amount of profit is a fair entrepreneurial profit for the management of the fund.
Annual Report
Economies of Scale. The Board considered whether there have been economies of scale in respect of the management of the Fidelity funds, whether the Fidelity funds (including the fund) have appropriately benefited from any such economies of scale, and whether there is potential for realization of any further economies of scale. The Board considered the extent to which the fund will benefit from economies of scale through increased services to the fund, through waivers or reimbursements, or through fee or expense reductions.
The Board recognized that the fund's management contract incorporates a "group fee" structure, which provides for lower group fee rates as total fund assets under FMR's management increase, and for higher group fee rates as total fund assets under FMR's management decrease. FMR determines the group fee rates based on a tiered asset "breakpoint" schedule. The Board considered that the group fee is designed to deliver the benefits of economies of scale to fund shareholders when total fund assets increase, even if assets of any particular fund are unchanged or have declined, because some portion of Fidelity's costs are attributable to services provided to all Fidelity funds, and all funds benefit if those costs can be allocated among more assets. The Board concluded that, given the group fee structure, fund shareholders will achieve a certain level of economies of scale as assets under FMR's management increase at the fund complex level, regardless of whether Fidelity achieves any such economies of scale.
The Board further concluded that any potential economies of scale are being shared between fund shareholders and Fidelity in an appropriate manner.
Additional Information Requested by the Board. In order to develop fully the factual basis for consideration of the Fidelity funds' Advisory Contracts, the Board requested and received additional information on certain topics, including (i) fund performance trends and actions to be taken by FMR to improve certain funds' overall performance; (ii) portfolio manager changes that have occurred during the past year; (iii) Fidelity's fund profitability methodology, the profitability of certain fund service providers, and profitability trends for certain funds; (iv) Fidelity's compensation structure for portfolio managers and key personnel, including its effects on fund profitability and the extent to which portfolio manager compensation is linked to fund performance; (v) Fidelity's fee structures and rationale for recommending different fees among categories of funds; and (vi) Fidelity's rationale for recommending which funds should have a performance adjustment component as part of their management fees.
Based on its evaluation of all of the conclusions noted above, and after considering all material factors, the Board ultimately concluded that the advisory fee structures are fair and reasonable, and that the fund's Advisory Contracts should be renewed.
Annual Report
Investment Adviser
Fidelity Management & Research Company Boston, MA
Investment Sub-Advisers
FMR Co., Inc.
Fidelity Management & Research (U.K.) Inc.
Fidelity Research & Analysis Company
Fidelity Investments Japan Limited
FIL Investment Advisors
FIL Investment Advisors (U.K.) Ltd.
Fidelity Management & Research (Japan) Inc.
Fidelity Management & Research (Hong Kong) Limited
General Distributor
Fidelity Distributors Corporation Boston, MA
Transfer and Service Agents
Fidelity Investments Institutional Operations Company, Inc. Boston, MA
To view a fund's proxy voting guidelines and proxy voting record for the 12-month period ended June 30, visit http://www.fidelity.com (search for "proxy voting guidelines") or visit the Securities and Exchange Commission's (SEC) web site at http://www.sec.gov. You may also call 1-877-208-0098 to request a free copy of the proxy voting guidelines.
Fidelity Variable Insurance Products are separate account options which are purchased through a variable insurance contract.
Standard & Poor's, S&P and S&P 500 are registered service marks of The McGraw-Hill Companies, Inc. and have been licensed for use by Fidelity Distributors Corporation.
Other third party marks appearing herein are the property of their respective owners.
All other marks appearing herein are registered or unregistered trademarks or service marks of FMR LLC or an affiliated company.
This report and the financial statements contained herein are submitted for the general information of the shareholders of the fund. This report is not authorized for distribution to prospective investors in the fund unless preceded or accompanied by an effective prospectus.
The fund files its complete schedule of portfolio holdings with the SEC for the first and third quarters of each fiscal year on Form N-Q. Forms N-Q are available on the SEC's web site at http://www.sec.gov. The fund's Forms N-Q may be reviewed and copied at the SEC's Public Reference Room in Washington, DC. Information regarding the operation of the SEC's Public Reference Room may be obtained by calling 1-800-SEC-0330. For a complete list of the fund's portfolio holdings, view the most recent holdings listing, semiannual report, or annual report on Fidelity's web site at http://www.fidelity.com or http://www.advisor.fidelity.com, as applicable.
NOT FDIC INSURED · MAY LOSE VALUE · NO BANK GUARANTEE
Neither the fund nor Fidelity Distributors Corporation is a bank.
Average annual total return reflects the change in the value of an investment, assuming reinvestment of the class' dividend income and capital gains (the profits earned upon the sale of securities that have grown in value, if any) and assuming a constant rate of performance each year. During periods of reimbursement by Fidelity, a fund's total return will be greater than it would be had the reimbursement not occurred. Performance numbers are net of all underlying fund operating expenses, but do not include any insurance charges imposed by your insurance company's separate account. If performance information included the effect of these additional charges, the total returns would have been lower. How a fund did yesterday is no guarantee of how it will do tomorrow.
Average Annual Total Returns
Periods ended December 31, 2008
Past 1 year
Past 5 years
Life of fund A
VIP Technology - Initial Class
-50.77%
-7.31%
-5.84%
VIP Technology - Investor Class B
-50.74%
-7.38%
-5.89%
AFrom July 19, 2001.
BThe initial offering of Investor Class shares took place on July 21, 2005. Returns prior to July 21, 2005 are those of Initial Class. If Investor Class's transfer agent fee had been reflected, returns prior to July 21, 2005 would have been lower.
$10,000 Over Life of Fund
Let's say hypothetically that $10,000 was invested in VIP Technology Portfolio - Initial Class on July 19, 2001, when the fund started. The chart shows how the value of your investment would have changed, and also shows how the Standard & Poor's 500SM Index (S&P 500®) performed over the same period.
Comments from Charlie Chai, Portfolio Manager of VIP Technology Portfolio
By year-end 2008, the vicious credit crisis sparked in the U.S. had spread like wildfire across the world's capital markets, stunting global growth, toppling commodity prices, changing the face of the global financial system and chasing risk-averse investors toward the sidelines. The U.S. equity markets, as measured by the Dow Jones Industrial AverageSM and Standard & Poor's 500SM Index, fell hard as a result, declining 31.93% and 37.00%, respectively, while the technology-laden NASDAQ Composite® Index slid 40.03%. Foreign market stocks saw an even sharper decline, as illustrated by the 43.28% loss of the MSCI® EAFE® Index (Europe, Australasia, Far East), a gauge of developed stock markets outside the U.S. and Canada. A generally stronger U.S. dollar also held back returns for U.S. investors in foreign equities. Emerging-markets stocks - the global performance leader only a year ago - fell harder still, dropping 53.18%, as measured by the MSCI Emerging Markets Index. The only clear winners during the past year were assets backed by the U.S. government, as investors fled from risk. Thus, the Barclays Capital U.S. Treasury Bond Index climbed 13.74% for the year, while the Barclays Capital U.S. Aggregate Bond Index - a broader measure of the U.S. investment-grade bond universe - gained a more modest 5.24%. By contrast, high-yield bonds bore the brunt of investors' increasing wariness over risk, as expressed by the Merrill Lynch® U.S. High Yield Master II Constrained Index's drop of 26.11%. The emerging-markets bond category also felt the shock of investors' risk-averse sentiment, with the JPMorgan Emerging Markets Bond Index (EMBI) Global falling 10.91%. Meanwhile, the Citigroup® Non-U.S. Group of 7 Index - representing the debt performance of major global economies, excluding the United States - eked out a 1.69% gain.
During the past year, the fund finished well behind the S&P 500® and the -42.76% return of the MSCI® US Investable Market Information Technology Index. (For specific portfolio results, please refer to the performance section of this report.) Versus the sector index, unfavorable stock picking in communications equipment, computer hardware and two groups not represented in the index - electrical components/equipment and advertising - had the most negative impact on performance. Underweighting computer hardware, which modestly outperformed the MSCI index, detracted as well. In semiconductor equipment, a large overweighting offset most of the benefits of favorable stock selection, and the same was true of home entertainment software. In systems software, an underweighting cancelled out positive stock picking. Apple, maker of a variety of popular consumer electronics products, was the biggest detractor, suffering in part from stiffer competition in the smartphone space. I trimmed the position. A tougher competitive landscape also sidetracked Canada's Research In Motion, maker of the popular BlackBerry smartphone, and I sold the stock. Not owning or underweighting major benchmark components IBM (International Business Machines) and computer maker Hewlett-Packard further undermined performance. Other detractors included China-based VisionChina Media, which uses technology to deliver advertising messages on buses and subways, and SanDisk, a manufacturer of the NAND memory used in cellular phones and other consumer electronics applications. VisionChina Media and Research In Motion were out-of-index holdings. On the positive side, a small cash position aided our results. Synaptics, a maker of touchscreens, provided a lift - - particularly during the first half of the period - benefiting from the growing adoption of its technology in the laptop computer and cellular phone markets. Other contributors were Chinese Internet company Tencent Holdings and HTC Corp., based in Taiwan. HTC Corp. and Tencent Holdings were out-of-index positions.
The views expressed above reflect those of the portfolio manager(s) only through the end of the period as stated on the cover of this report and do not necessarily represent the views of Fidelity or any other person in the Fidelity organization. Any such views are subject to change at any time based upon market or other conditions and Fidelity disclaims any responsibility to update such views. These views may not be relied on as investment advice and, because investment decisions for a Fidelity fund are based on numerous factors, may not be relied on as an indication of trading intent on behalf of any Fidelity fund.
As a shareholder of the Fund, you incur two types of costs: (1) transaction costs, including redemption fees, and (2) ongoing costs, including management fees and other Fund expenses. This Example is intended to help you understand your ongoing costs (in dollars) of investing in the Fund and to compare these costs with the ongoing costs of investing in other mutual funds.
The Example is based on an investment of $1,000 invested at the beginning of the period and held for the entire period (July 1, 2008 to December 31, 2008).
Actual Expenses
The first line of the accompanying table for each class of the Fund provides information about actual account values and actual expenses. You may use the information in this line, together with the amount you invested, to estimate the expenses that you paid over the period. Simply divide your account value by $1,000.00 (for example, an $8,600 account value divided by $1,000.00 = 8.6), then multiply the result by the number in the first line for a class of the Fund under the heading entitled "Expenses Paid During Period" to estimate the expenses you paid on your account during this period. The estimate of expenses does not include any fees or other expenses of any variable annuity or variable life insurance product. If they were, the estimate of expenses you paid during the period would be higher, and your ending account value would be lower. In addition, the Fund, as a shareholder in the underlying Fidelity Central Funds, will indirectly bear its pro rata share of the fees and expenses incurred by the underlying Fidelity Central Funds. These fees and expenses are not included in the Fund's annualized expense ratio used to calculate the expense estimate in the table below.
Hypothetical Example for Comparison Purposes
The second line of the accompanying table for each class of the Fund provides information about hypothetical account values and hypothetical expenses based on a Class' actual expense ratio and an assumed rate of return of 5% per year before expenses, which is not the Class' actual return. The hypothetical account values and expenses may not be used to estimate the actual ending account balance or expenses you paid for the period. You may use this information to compare the ongoing costs of investing in the Fund and other funds. To do so, compare this 5% hypothetical example with the 5% hypothetical examples that appear in the shareholder reports of the other funds. The estimate of expenses does not include any fees or other expenses of any variable annuity or variable life insurance product. If they were, the estimate of expenses you paid during the period would be higher, and your ending account value would be lower. In addition, the Fund, as a shareholder in the underlying Fidelity Central Funds, will indirectly bear its pro rata share of the fees and expenses incurred by the underlying Fidelity Central Funds. These fees and expenses are not included in the Fund's annualized expense ratio used to calculate the expense estimate in the table below.
Please note that the expenses shown in the table are meant to highlight your ongoing costs only and do not reflect any transaction costs. Therefore, the second line of the table is useful in comparing ongoing costs only, and will not help you determine the relative total costs of owning different funds. In addition, if these transactional costs were included, your costs would have been higher.
Annualized Expense Ratio
Beginning Account Value July 1, 2008
Ending Account Value December 31, 2008
Expenses Paid During Period* July 1, 2008 to December 31, 2008
Initial Class
.81%
Actual
$ 1,000.00
$ 586.40
$ 3.23
HypotheticalA
$ 1,000.00
$ 1,021.06
$ 4.12
Investor Class
.91%
Actual
$ 1,000.00
$ 586.60
$ 3.63
HypotheticalA
$ 1,000.00
$ 1,020.56
$ 4.62
A 5% return per year before expenses
* Expenses are equal to each Class' annualized expense ratio, multiplied by the average account value over the period, multiplied by 184/366 (to reflect the one-half year period).
Annual Report
Investment Changes (Unaudited)
Top Ten Stocks as of December 31, 2008
% of fund's net assets
% of fund's net assets 6 months ago
Cisco Systems, Inc.
8.8
5.8
QUALCOMM, Inc.
7.0
3.2
Microsoft Corp.
6.6
0.1
Hewlett-Packard Co.
5.4
0.5
Applied Materials, Inc.
3.1
2.8
Visa, Inc.
3.1
2.1
ASML Holding NV (NY Shares)
2.8
1.0
Starent Networks Corp.
2.7
1.5
Nintendo Co. Ltd.
2.3
7.4
Symantec Corp.
2.3
0.0
44.1
Top Industries (% of fund's net assets)
As of December 31, 2008
Semiconductors & Semiconductor Equipment
24.3%
Communications Equipment
22.7%
Software
22.2%
Computers & Peripherals
8.8%
Electronic Equipment & Components
5.3%
All Others*
16.7%
As of June 30, 2008
Semiconductors & Semiconductor Equipment
21.6%
Communications Equipment
17.4%
Software
16.8%
Computers & Peripherals
14.9%
Electrical Equipment
4.7%
All Others*
24.6%
* Includes short-term investments and net other assets.
Prior period industry classifications reflect the categories in place as of the date indicated and have not been adjusted to reflect current industry classifications.
Annual Report
Investments December 31, 2008
Showing Percentage of Net Assets
Common Stocks - 97.1%
Shares
Value
COMMUNICATIONS EQUIPMENT - 22.5%
Communications Equipment - 22.5%
ADC Telecommunications, Inc. (a)
22,901
$ 125,268
ADVA AG Optical Networking (a)
58,503
93,870
Alcatel-Lucent SA sponsored ADR (a)
1,700
3,655
Aruba Networks, Inc. (a)
900
2,295
AudioCodes Ltd. (a)
37,150
63,527
Balda AG (a)
15,400
11,353
Ciena Corp. (a)
12,100
81,070
Cisco Systems, Inc. (a)
205,700
3,352,909
Cogo Group, Inc. (a)
28,599
138,991
CommScope, Inc. (a)
7,600
118,104
Comverse Technology, Inc. (a)
31,170
195,124
Delta Networks, Inc.
181,000
28,389
F5 Networks, Inc. (a)
1,126
25,740
Infinera Corp. (a)
14,400
129,024
Powerwave Technologies, Inc. (a)
126,900
63,450
QUALCOMM, Inc.
74,400
2,665,752
Sandvine Corp. (a)
185,700
123,627
Sandvine Corp. (U.K.) (a)
100,288
64,189
Sonus Networks, Inc. (a)(d)
20,200
31,916
Starent Networks Corp. (a)
87,488
1,043,732
Telefonaktiebolaget LM Ericsson (B Shares) sponsored ADR
2,600
20,306
Tellabs, Inc. (a)
38,300
157,796
ZTE Corp. (H Shares)
20,400
53,894
8,593,981
COMPUTERS & PERIPHERALS - 8.8%
Computer Hardware - 7.8%
3PAR, Inc. (a)
800
6,104
Apple, Inc. (a)
4,445
379,381
Hewlett-Packard Co.
57,400
2,083,046
HTC Corp.
25,650
255,913
NCR Corp. (a)
5,900
83,426
Palm, Inc. (a)(d)
11,700
35,919
Stratasys, Inc. (a)
13,110
140,933
2,984,722
Computer Storage & Peripherals - 1.0%
Chicony Electronics Co. Ltd.
39,610
38,250
Data Domain, Inc. (a)
300
5,640
EMC Corp. (a)
1,900
19,893
SanDisk Corp. (a)
10,352
99,379
Seagate Technology
35,900
159,037
Synaptics, Inc. (a)
1,200
19,872
Western Digital Corp. (a)
4,800
54,960
397,031
TOTAL COMPUTERS & PERIPHERALS
3,381,753
Shares
Value
DIVERSIFIED CONSUMER SERVICES - 0.0%
Education Services - 0.0%
New Oriental Education & Technology Group, Inc. sponsored ADR (a)
100
$ 5,491
ELECTRICAL EQUIPMENT - 1.2%
Electrical Components & Equipment - 1.2%
centrotherm photovoltaics AG (a)
200
5,782
Energy Conversion Devices, Inc. (a)
2,100
52,941
First Solar, Inc. (a)
986
136,029
General Cable Corp. (a)
3,300
58,377
JA Solar Holdings Co. Ltd. ADR (a)
3,300
14,421
Neo-Neon Holdings Ltd.
452,000
88,746
Q-Cells SE (a)
200
7,314
Roth & Rau AG
200
4,308
Sunpower Corp. Class B (a)
1,642
49,982
Suntech Power Holdings Co. Ltd. sponsored ADR (a)
3,600
42,120
Yingli Green Energy Holding Co. Ltd. ADR (a)
2,100
12,810
472,830
ELECTRONIC EQUIPMENT & COMPONENTS - 5.3%
Electronic Components - 0.8%
Amphenol Corp. Class A
7,100
170,258
Everlight Electronics Co. Ltd.
70,219
92,554
Vishay Intertechnology, Inc. (a)
5,100
17,442
280,254
Electronic Equipment & Instruments - 0.7%
Agilent Technologies, Inc. (a)
3,400
53,142
China Security & Surveillance Technology, Inc. (a)(d)
19,585
86,762
Chroma ATE, Inc.
153,684
97,298
Comverge, Inc. (a)
1,211
5,934
Coretronic Corp.
35,700
18,626
261,762
Electronic Manufacturing Services - 0.7%
Ju Teng International Holdings Ltd. (a)
172,000
36,188
Molex, Inc.
1,400
20,286
Trimble Navigation Ltd. (a)
8,200
177,202
Tyco Electronics Ltd.
2,500
40,525
274,201
Technology Distributors - 3.1%
Anixter International, Inc. (a)
1,500
45,180
Arrow Electronics, Inc. (a)
12,900
243,036
Avnet, Inc. (a)
23,600
429,756
Ingram Micro, Inc. Class A (a)
35,700
478,023
1,195,995
TOTAL ELECTRONIC EQUIPMENT & COMPONENTS
2,012,212
Common Stocks - continued
Shares
Value
HEALTH CARE EQUIPMENT & SUPPLIES - 1.6%
Health Care Equipment - 1.2%
China Medical Technologies, Inc. sponsored ADR (d)
8,900
$ 180,314
Golden Meditech Co. Ltd. (a)
262,000
35,645
I-Flow Corp. (a)
9,390
45,072
Mingyuan Medicare Development Co. Ltd.
3,700,000
218,908
479,939
Health Care Supplies - 0.4%
Shandong Weigao Group Medical Polymer Co. Ltd. (H Shares)
92,000
140,030
TOTAL HEALTH CARE EQUIPMENT & SUPPLIES
619,969
HEALTH CARE PROVIDERS & SERVICES - 0.0%
Health Care Services - 0.0%
athenahealth, Inc. (a)
100
3,762
HOTELS, RESTAURANTS & LEISURE - 0.0%
Hotels, Resorts & Cruise Lines - 0.0%
Ctrip.com International Ltd. sponsored ADR
100
2,380
INTERNET SOFTWARE & SERVICES - 4.2%
Internet Software & Services - 4.2%
DealerTrack Holdings, Inc. (a)
1,500
17,835
Equinix, Inc. (a)(d)
3,600
191,484
Google, Inc. Class A (sub. vtg.) (a)
1,300
399,945
Tencent Holdings Ltd.
131,600
855,085
VeriSign, Inc. (a)
8,100
154,548
1,618,897
IT SERVICES - 4.2%
Data Processing & Outsourced Services - 3.7%
CyberSource Corp. (a)
3,805
45,622
MasterCard, Inc. Class A
1,400
200,102
Visa, Inc.
22,100
1,159,145
1,404,869
IT Consulting & Other Services - 0.5%
China Information Security Technology, Inc. (a)
1,083
3,899
SAIC, Inc. (a)
3,200
62,336
Satyam Computer Services Ltd. sponsored ADR
1,400
12,656
Yucheng Technologies Ltd. (a)
16,300
118,827
197,718
TOTAL IT SERVICES
1,602,587
MACHINERY - 0.4%
Industrial Machinery - 0.4%
Meyer Burger Technology AG (a)
30
3,503
Shin Zu Shing Co. Ltd.
52,368
131,020
134,523
Shares
Value
MEDIA - 1.3%
Advertising - 1.3%
VisionChina Media, Inc. ADR (d)
86,600
$ 472,836
METALS & MINING - 0.0%
Diversified Metals & Mining - 0.0%
Timminco Ltd. (a)
700
2,031
SEMICONDUCTORS & SEMICONDUCTOR EQUIPMENT - 23.6%
Semiconductor Equipment - 12.8%
Aixtron AG
200
1,376
Applied Materials, Inc.
116,000
1,175,080
ASML Holding NV (NY Shares)
58,800
1,062,516
Cymer, Inc. (a)(d)
30,700
672,637
FormFactor, Inc. (a)
8,400
122,640
Global Unichip Corp.
16,689
59,067
Inotera Memories, Inc. (a)
312,000
76,727
Lam Research Corp. (a)
29,100
619,248
LTX-Credence Corp. (a)
55,615
15,016
MEMC Electronic Materials, Inc. (a)
2,400
34,272
Tessera Technologies, Inc. (a)
25,700
305,316
Varian Semiconductor Equipment Associates, Inc. (a)(d)
32,400
587,088
Verigy Ltd. (a)
17,200
165,464
4,896,447
Semiconductors - 10.8%
Advanced Semiconductor Engineering, Inc. sponsored ADR
Fidelity Securities Lending Cash Central Fund, 0.87% (b)(c)
1,365,238
1,365,238
TOTAL MONEY MARKET FUNDS
(Cost $3,716,127)
3,716,127
TOTAL INVESTMENT PORTFOLIO - 107.7%
(Cost $58,727,949)
41,250,312
NET OTHER ASSETS - (7.7)%
(2,947,421)
NET ASSETS - 100%
$ 38,302,891
Legend
(a) Non-income producing
(b) Affiliated fund that is available only to investment companies and other accounts managed by Fidelity Investments. The rate quoted is the annualized seven-day yield of the fund at period end. A complete unaudited listing of the fund's holdings as of its most recent quarter end is available upon request.
(c) Investment made with cash collateral received from securities on loan.
(d) Security or a portion of the security is on loan at period end.
Affiliated Central Funds
Information regarding fiscal year to date income earned by the Fund from investments in Fidelity Central Funds is as follows:
Fund
Income earned
Fidelity Cash Central Fund
$ 40,499
Fidelity Securities Lending Cash Central Fund
126,867
Total
$ 167,366
Other Information
The following is a summary of the inputs used, as of December 31, 2008, involving the Fund's assets carried at value. The inputs or methodology used for valuing securities may not be an indication of the risk associated with investing in those securities. For more information on valuation inputs, and their aggregation into the levels used in the table below, please refer to the Security Valuation section in the accompanying Notes to Financial Statements.
Valuation Inputs at Reporting Date:
Description
Total
Level 1
Level 2
Level 3
Investments in Securities
$ 41,250,312
$ 37,667,707
$ 3,582,605
$ -
Distribution of investments by country of issue, as a percentage of total net assets, is as follows: (Unaudited)
United States of America
78.7%
Taiwan
4.7%
Cayman Islands
4.3%
Netherlands
2.8%
China
2.7%
Japan
2.3%
United Kingdom
1.1%
Others (individually less than 1%)
3.4%
100.0%
Income Tax Information
At December 31, 2008, the fund had a capital loss carryforward of approximately $15,064,221 all of which will expire on December 31, 2016.
The fund intends to elect to defer to its fiscal year ending December 31, 2009 approximately $9,010,340 of losses recognized during the period November 1, 2008 to December 31, 2008.
See accompanying notes which are an integral part of the financial statements.
Investment in securities, at value (including securities loaned of $1,369,090) - See accompanying schedule:
Unaffiliated issuers (cost $55,011,822)
$ 37,534,185
Fidelity Central Funds (cost $3,716,127)
3,716,127
Total Investments (cost $58,727,949)
$ 41,250,312
Foreign currency held at value (cost $32)
32
Receivable for investments sold
235,903
Dividends receivable
22,019
Interest receivable
18,093
Distributions receivable from Fidelity Central Funds
3,204
Prepaid expenses
558
Other receivables
1,458
Total assets
41,531,579
Liabilities
Payable for investments purchased
$ 675,748
Payable for fund shares redeemed
1,124,828
Accrued management fee
18,106
Other affiliated payables
4,304
Other payables and accrued expenses
40,464
Collateral on securities loaned, at value
1,365,238
Total liabilities
3,228,688
Net Assets
$ 38,302,891
Net Assets consist of:
Paid in capital
$ 80,895,822
Undistributed net investment income
26,283
Accumulated undistributed net realized gain (loss) on investments and foreign currency transactions
(25,141,890)
Net unrealized appreciation (depreciation) on investments and assets and liabilities in foreign currencies
(17,477,324)
Net Assets
$ 38,302,891
Statement of Assets and Liabilities - continued
December 31, 2008
Initial Class: Net Asset Value, offering price and redemption price per share ($25,399,989 ÷ 5,627,694 shares)
$ 4.51
Investor Class: Net Asset Value, offering price and redemption price per share ($12,902,902 ÷ 2,869,648 shares)
$ 4.50
See accompanying notes which are an integral part of the financial statements.
Annual Report
Statement of Operations
Year ended December 31, 2008
Investment Income
Dividends
$ 450,734
Interest
62,553
Income from Fidelity Central Funds (including $126,867 from security lending)
167,366
Total income
680,653
Expenses
Management fee
$ 385,225
Transfer agent fees
75,988
Accounting and security lending fees
27,829
Custodian fees and expenses
45,358
Independent trustees' compensation
343
Audit
35,311
Legal
480
Miscellaneous
7,158
Total expenses before reductions
577,692
Expense reductions
(8,207)
569,485
Net investment income (loss)
111,168
Realized and Unrealized Gain (Loss)
Net realized gain (loss) on:
Investment securities:
Unaffiliated issuers
(24,795,530)
Foreign currency transactions
(7,289)
Total net realized gain (loss)
(24,802,819)
Change in net unrealized appreciation (depreciation) on:
Investment securities
(23,722,220)
Assets and liabilities in foreign currencies
1,291
Total change in net unrealized appreciation (depreciation)
(23,720,929)
Net gain (loss)
(48,523,748)
Net increase (decrease) in net assets resulting from operations
$ (48,412,580)
Statement of Changes in Net Assets
Year ended December 31, 2008
Year ended December 31, 2007
Increase (Decrease) in Net Assets
Operations
Net investment income (loss)
$ 111,168
$ (392,900)
Net realized gain (loss)
(24,802,819)
13,153,331
Change in net unrealized appreciation (depreciation)
(23,720,929)
(3,984,827)
Net increase (decrease) in net assets resulting from operations
(48,412,580)
8,775,604
Distributions to shareholders from net investment income
(77,871)
-
Distributions to shareholders from net realized gain
(12,421,709)
(6,094,577)
Total distributions
(12,499,580)
(6,094,577)
Share transactions - net increase (decrease)
(5,986,585)
21,800,349
Redemption fees
47,060
44,921
Total increase (decrease) in net assets
(66,851,685)
24,526,297
Net Assets
Beginning of period
105,154,576
80,628,279
End of period (including undistributed net investment income of $26,283 and undistributed net investment income of $0, respectively)
$ 38,302,891
$ 105,154,576
See accompanying notes which are an integral part of the financial statements.
Annual Report
Financial Highlights - Initial Class
Years ended December 31,
2008
2007
2006
2005
2004
Selected Per-Share Data
Net asset value, beginning of period
$ 11.02
$ 10.37
$ 10.35
$ 9.37
$ 9.33
Income from Investment Operations
Net investment income (loss) C
.01
(.05)
(.04)
(.02)
.02 F
Net realized and unrealized gain (loss)
(5.01)
1.52
.88
1.04
.01
Total from investment operations
(5.00)
1.47
.84
1.02
.03
Distributions from net investment income
(.01)
-
-
(.04)
-
Distributions from net realized gain
(1.49)
(.83)
(.83)
-
-
Total distributions
(1.51) I
(.83)
(.83)
(.04)
-
Redemption fees added to paid in capital C
- H
.01
.01
- H
.01
Net asset value, end of period
$ 4.51
$ 11.02
$ 10.37
$ 10.35
$ 9.37
Total Return A, B
(50.77)%
15.36%
8.19%
10.88%
.43%
Ratios to Average Net Assets D, G
Expenses before reductions
.81%
.81%
.80%
.79%
.75%
Expenses net of fee waivers, if any
.81%
.81%
.80%
.79%
.75%
Expenses net of all reductions
.79%
.79%
.77%
.62%
.68%
Net investment income (loss)
.19%
(.44)%
(.43)%
(.24)%
.24%
Supplemental Data
Net assets, end of period (000 omitted)
$ 25,400
$ 70,788
$ 64,689
$ 78,892
$ 116,831
Portfolio turnover rate E
237%
213%
269%
249%
118%
A Total returns do not reflect charges attributable to your insurance company's separate account. Inclusion of these charges would reduce the total returns shown. B Total returns would have been lower had certain expenses not been reduced during the periods shown. C Calculated based on average shares outstanding during the period. D Fees and expenses of the underlying Fidelity Central Funds are not included in the Fund's expense ratio. The Fund indirectly bears its proportionate share of the expenses of any underlying Fidelity Central Funds. E Amount does not include the portfolio activity of any underlying Fidelity Central Funds. F Investment income per share reflects a special dividend which amounted to $.06 per share. G Expense ratios reflect operating expenses of the class. Expenses before reductions do not reflect amounts reimbursed by the investment adviser or reductions from brokerage service arrangements or other expense offset arrangements and do not represent the amount paid by the class during periods when reimbursements or reductions occur. Expenses net of fee waivers reflect expenses after reimbursement by the investment adviser but prior to reductions from brokerage service arrangements or other expense offset arrangements. Expenses net of all reductions represent the net expenses paid by the class. H Amount represents less than $.01 per share. I Total distributions of $1.51 per share is comprised of distributions from net investment income of $0.011 and distributions from net realized gain of $1.494 per share.
Financial Highlights - Investor Class
Years ended December 31,
2008
2007
2006
2005 H
Selected Per-Share Data
Net asset value, beginning of period
$ 10.97
$ 10.34
$ 10.33
$ 9.71
Income from Investment Operations
Net investment income (loss) E
.01
(.06)
(.06)
(.02)
Net realized and unrealized gain (loss)
(4.99)
1.50
.89
.64
Total from investment operations
(4.98)
1.44
.83
.62
Distributions from net investment income
(.01)
-
-
-
Distributions from net realized gain
(1.49)
(.82)
(.83)
-
Total distributions
(1.49) K
(.82)
(.83)
-
Redemption fees added to paid in capital E
- J
.01
.01
- J
Net asset value, end of period
$ 4.50
$ 10.97
$ 10.34
$ 10.33
Total Return B, C, D
(50.74)%
15.15%
8.10%
6.39%
Ratios to Average Net Assets F, I
Expenses before reductions
.90%
.93%
.93%
.97% A
Expenses net of fee waivers, if any
.90%
.93%
.93%
.97% A
Expenses net of all reductions
.89%
.91%
.90%
.80% A
Net investment income (loss)
.10%
(.56)%
(.56)%
(.45)% A
Supplemental Data
Net assets, end of period (000 omitted)
$ 12,903
$ 34,367
$ 15,939
$ 5,809
Portfolio turnover rate G
237%
213%
269%
249%
A Annualized B Total returns for periods of less than one year are not annualized. C Total returns do not reflect charges attributable to your insurance company's separate account. Inclusion of these charges would reduce the total returns shown. D Total returns would have been lower had certain expenses not been reduced during the periods shown. E Calculated based on average shares outstanding during the period. F Fees and expenses of the underlying Fidelity Central Funds are not included in the Fund's expense ratio. The Fund indirectly bears its proportionate share of the expenses of any underlying Fidelity Central Funds. G Amount does not include the portfolio activity of any underlying Fidelity Central Funds. H For the period July 21, 2005 (commencement of sale of shares) to December 31, 2005. I Expense ratios reflect operating expenses of the class. Expenses before reductions do not reflect amounts reimbursed by the investment adviser or reductions from brokerage service arrangements or other expense offset arrangements and do not represent the amount paid by the class during periods when reimbursements or reductions occur. Expense ratios before reductions for start-up periods may not be representative of longer-term operating periods. Expenses net of fee waivers reflect expenses after reimbursement by the investment adviser but prior to reductions from brokerage service arrangements or other expense offset arrangements. Expenses net of all reductions represent the net expenses paid by the class. J Amount represents less than $.01 per share. K Total distributions of $1.49 per share is comprised of distributions from net investment income of $0.005 and distributions from net realized gain of $1.485 per share.
See accompanying notes which are an integral part of the financial statements.
VIP Technology Portfolio (the Fund) is a non-diversified fund of Variable Insurance Products Fund IV (the trust) and is authorized to issue an unlimited number of shares. The trust is registered under the Investment Company Act of 1940, as amended (the 1940 Act), as an open-end management investment company organized as a Massachusetts business trust. Shares of the Fund may only be purchased by insurance companies for the purpose of funding variable annuity or variable life insurance contracts. The Fund offers the following classes of shares: Initial Class shares and Investor Class shares. All classes have equal rights and voting privileges, except for matters affecting a single class. Investment income, realized and unrealized capital gains and losses, the common expenses of the Fund, and certain fund-level expense reductions, if any, are allocated on a pro rata basis to each class based on the relative net assets of each class to the total net assets of the Fund. Each class differs with respect to transfer agent fees incurred. Certain expense reductions also differ by class. The Fund's investments in emerging markets can be subject to social, economic, regulatory, and political uncertainties and can be extremely volatile.
2. Investments in Fidelity Central Funds.
The Fund may invest in Fidelity Central Funds, which are open-end investment companies available only to other investment companies and accounts managed by Fidelity Management & Research Company (FMR) and its affiliates. The Fund's Schedule of Investments lists each of the Fidelity Central Funds held as of period end, if any, as an investment of the Fund, but does not include the underlying holdings of each Fidelity Central Fund. As an Investing Fund, the Fund indirectly bears its proportionate share of the expenses of the underlying Fidelity Central Funds.
The Money Market Central Funds seek preservation of capital and current income and are managed by Fidelity Investments Money Management, Inc. (FIMM), an affiliate of FMR.
A complete unaudited list of holdings for each Fidelity Central Fund is available upon request or at the SEC's web site at www.sec.gov. In addition, the financial statements of the Fidelity Central Funds, which are not covered by the Fund's Report of Independent Registered Public Accounting Firm, are available on the SEC's web site or upon request.
3. Significant Accounting Policies.
The financial statements have been prepared in conformity with accounting principles generally accepted in the United States of America, which require management to make certain estimates and assumptions at the date of the financial statements. Actual results could differ from those estimates. The following summarizes the significant accounting policies of the Fund:
Security Valuation. Investments are valued as of 4:00 p.m. Eastern time on the last calendar day of the period. Wherever possible, the Fund uses independent pricing services approved by the Board of Trustees to value its investments.
Equity securities, including restricted securities, for which market quotations are readily available, are valued at the last reported sale price or official closing price as reported by an independent pricing service on the primary market or exchange on which they are traded. In the event there were no sales during the day or closing prices are not available, securities are valued at the last quoted bid price. Debt securities, including restricted securities, are valued by independent pricing services or by dealers who make markets in such securities. Pricing services consider yield or price of bonds of comparable quality, coupon, maturity and type as well as dealer supplied prices. Investments in open-end mutual funds, including the Fidelity Central Funds, are valued at their closing net asset value each business day. Short-term securities with remaining maturities of sixty days or less for which quotations are not readily available are valued at amortized cost, which approximates value.
When current market prices or quotations are not readily available or reliable, valuations may be determined in good faith in accordance with procedures adopted by the Board of Trustees. Factors used in determining value may include significant market or security specific events, changes in interest rates and credit quality, and developments in foreign markets which are monitored by evaluating the performance of ADRs, futures contracts and exchange-traded funds. The frequency with which these procedures are used cannot be predicted and may be utilized to a significant extent. The value of securities used for net asset value (NAV) calculation under these procedures may differ from published prices for the same securities.
The Fund is subject to the provisions of Statement of Financial Accounting Standards No. 157, "Fair Value Measurements" (SFAS 157), effective with the beginning of the Fund's fiscal year. SFAS 157 establishes a hierarchy that prioritizes the inputs to valuation techniques giving the highest priority to readily available unadjusted quoted prices in active markets for identical assets (level 1 measurements) and the lowest priority to unobservable inputs (level 3 measurements) when market prices are not readily available or reliable. The three levels of the hierarchy under SFAS 157 are described below:
Level 1
Quoted prices in active markets for identical securities.
Level 2
Prices determined using other significant observable inputs. Observable inputs are inputs that other market participants may use in pricing a security. These may include quoted prices for similar securities, interest rates, prepayment speeds, credit risk and others.
Level 3
Prices determined using significant unobservable inputs. In situations where quoted prices or observable inputs are unavailable or deemed less relevant (for example, when there is little or no market activity for an investment at the end of the period), unobservable inputs may be used. Unobservable inputs reflect the Fund's own assumptions about the factors market participants would use in pricing an investment, and would be based on the best information available.
Annual Report
Notes to Financial Statements - continued
3. Significant Accounting Policies - continued
Security Valuation - continued
Changes in valuation techniques may result in transfers in or out of an investment's assigned level within the hierarchy.
The aggregate value by input level, as of December 31, 2008, for the Fund's investments is included at the end of the Fund's Schedule of Investments.
Foreign Currency. The Fund uses foreign currency contracts to facilitate transactions in foreign-denominated securities. Losses from these transactions may arise from changes in the value of the foreign currency or if the counterparties do not perform under the contracts' terms.
Foreign-denominated assets, including investment securities, and liabilities are translated into U.S. dollars at the exchange rate at period end. Purchases and sales of investment securities, income and dividends received and expenses denominated in foreign currencies are translated into U.S. dollars at the exchange rate in effect on the transaction date.
The effects of exchange rate fluctuations on investments are included with the net realized and unrealized gain (loss) on investment securities. Other foreign currency transactions resulting in realized and unrealized gain (loss) are disclosed separately.
Investment Transactions and Income. For financial reporting purposes, the Fund's investment holdings and NAV include trades executed through the end of the last business day of the period. The NAV per share for processing shareholder transactions is calculated as of the close of business of the New York Stock Exchange (NYSE), normally 4:00 p.m. Eastern time and includes trades executed through the end of the prior business day. Gains and losses on securities sold are determined on the basis of identified cost and may include proceeds received from litigation. Dividend income is recorded on the ex-dividend date, except for certain dividends from foreign securities where the ex-dividend date may have passed, which are recorded as soon as the Fund is informed of the ex-dividend date. Non-cash dividends included in dividend income, if any, are recorded at the fair market value of the securities received. Distributions received on securities that represent a return of capital or capital gain are recorded as a reduction of cost of investments and/or as a realized gain. The Fund estimates the components of distributions received that may be considered return of capital distributions or capital gain distributions. Interest income and distributions from the Fidelity Central Funds are accrued as earned. Interest income includes coupon interest and amortization of premium and accretion of discount on debt securities. Investment income is recorded net of foreign taxes withheld where recovery of such taxes is uncertain.
Expenses. Most expenses of the trust can be directly attributed to a fund. Expenses which cannot be directly attributed are apportioned among each Fund in the trust. Expense estimates are accrued in the period to which they relate and adjustments are made when actual amounts are known.
Income Tax Information and Distributions to Shareholders. Each year, the Fund intends to qualify as a regulated investment company by distributing substantially all of its taxable income and realized gains under Subchapter M of the Internal Revenue Code and filing its U.S. federal tax return. As a result, no provision for income taxes is required. The Fund is subject to the provisions of FASB Interpretation No. 48, Accounting for Uncertainties in Income Taxes (FIN 48). FIN 48 sets forth a minimum threshold for financial statement recognition of the benefit of a tax position taken or expected to be taken in a tax return. There are no unrecognized tax benefits in the accompanying financial statements. A Fund's federal tax return is subject to examination by the Internal Revenue Service (IRS) for a period of three years. Foreign taxes are provided for based on the Fund's understanding of the tax rules and rates that exist in the foreign markets in which it invests.
Distributions are recorded on the ex-dividend date. Income dividends and capital gain distributions are declared separately for each class. Income and capital gain distributions are determined in accordance with income tax regulations, which may differ from generally accepted accounting principles.
Capital accounts within the financial statements are adjusted for permanent book-tax differences. These adjustments have no impact on net assets or the results of operations. Temporary book-tax differences will reverse in a subsequent period.
Book-tax differences are primarily due to foreign currency transactions, market discount, losses deferred due to wash sales and excise tax regulations.
The tax-basis components of distributable earnings and the federal tax cost as of period end were as follows:
Unrealized appreciation
$ 814,017
Unrealized depreciation
(19,332,389)
Net unrealized appreciation (depreciation)
$ (18,518,372)
Capital loss carryforward
(15,064,221)
Cost for federal income tax purposes
$ 59,768,684
Annual Report
3. Significant Accounting Policies - continued
Income Tax Information and Distributions to Shareholders - continued
The tax character of distributions paid was as follows:
December 31, 2008
December 31, 2007
Ordinary Income
$ 6,751,533
$ 3,662,874
Long-term Capital Gains
5,748,047
2,431,703
Total
$ 12,499,580
$ 6,094,577
Trading (Redemption) Fees. Shares held less than 60 days are subject to a redemption fee equal to 1% of the proceeds of the redeemed shares. All redemption fees, including any estimated redemption fees paid by FMR, are retained by the Fund and accounted for as an addition to paid in capital.
4. Operating Policies.
Repurchase Agreements. FMR has received an Exemptive Order from the Securities and Exchange Commission (the SEC) which permits the Fund and other affiliated entities of FMR to transfer uninvested cash balances into joint trading accounts which are then invested in repurchase agreements. The Fund may also invest directly with institutions in repurchase agreements. Repurchase agreements are collateralized by government or non-government securities. Upon settlement date, collateral is held in segregated accounts with custodian banks and may be obtained in the event of a default of the counterparty. The Fund monitors, on a daily basis, the value of the collateral to ensure it is at least equal to the principal amount of the repurchase agreement (including accrued interest). In the event of a default by the counterparty, realization of the collateral proceeds could be delayed, during which time the value of the collateral may decline.
Restricted Securities. The Fund may invest in securities that are subject to legal or contractual restrictions on resale. These securities generally may be resold in transactions exempt from registration or to the public if the securities are registered. Disposal of these securities may involve time-consuming negotiations and expense, and prompt sale at an acceptable price may be difficult.
5. Purchases and Sales of Investments.
Purchases and sales of securities, other than short-term securities, aggregated $161,819,743 and $180,538,060, respectively.
6. Fees and Other Transactions with Affiliates.
Management Fee. FMR and its affiliates provide the Fund with investment management related services for which the Fund pays a monthly management fee. The management fee is the sum of an individual fund fee rate that is based on an annual rate of .30% of the Fund's average net assets and a group fee rate that averaged .26% during the period. The group fee rate is based upon the average net assets of all the mutual funds advised by FMR. The group fee rate decreases as assets under management increase and increases as assets under management decrease. For the period, the total annual management fee rate was .56% of the Fund's average net assets.
Transfer Agent Fees. Fidelity Investments Institutional Operations Company, Inc. (FIIOC), an affiliate of FMR, is the Fund's transfer, dividend disbursing, and shareholder servicing agent. FIIOC receives an asset-based fee with respect to each class. Each class (with the exception of Investor Class) pays a transfer agent fee, excluding out of pocket expenses, equal to an annual rate of .07% of average net assets. Investor Class pays a monthly asset-based transfer agent fee of .15% of average net assets. Prior to February 1, 2008, Investor Class paid a monthly asset-based transfer agent fee of .18% of average net assets. The total transfer agent fees paid by each class to FIIOC, including out of pocket expenses, were as follows:
Initial Class
$ 34,520
Investor Class
41,468
$ 75,988
Accounting and Security Lending Fees. Fidelity Service Company, Inc. (FSC), an affiliate of FMR, maintains the Fund's accounting records. The accounting fee is based on the level of average net assets for the month. Under a separate contract, FSC administers the security lending program. The security lending fee is based on the number and duration of lending transactions.
Brokerage Commissions. The Fund placed a portion of its portfolio transactions with brokerage firms which are affiliates of the investment adviser. The commissions paid to these affiliated firms were $4,206 for the period.
Annual Report
Notes to Financial Statements - continued
7. Committed Line of Credit.
The Fund participates with other funds managed by FMR in a $4.2 billion credit facility (the "line of credit") to be utilized for temporary or emergency purposes to fund shareholder redemptions or for other short-term liquidity purposes. The Fund has agreed to pay commitment fees on its pro rata portion of the line of credit, which amounted to $165 and is reflected in Miscellaneous Expense on the Statement of Operations. During the period, there were no borrowings on this line of credit.
8. Security Lending.
The Fund lends portfolio securities from time to time in order to earn additional income. On the settlement date of the loan, the Fund receives collateral (in the form of U.S. Treasury obligations, letters of credit and/or cash) against the loaned securities and maintains collateral in an amount not less than 100% of the market value of the loaned securities during the period of the loan. The market value of the loaned securities is determined at the close of business of the Fund and any additional required collateral is delivered to the Fund on the next business day. If the borrower defaults on its obligation to return the securities loaned because of insolvency or other reasons, a fund could experience delays and costs in recovering the securities loaned or in gaining access to the collateral. Any cash collateral received is invested in the Fidelity Securities Lending Cash Central Fund. The value of loaned securities and cash collateral at period end are disclosed on the Fund's Statement of Assets and Liabilities. Security lending income represents the income earned on investing cash collateral, less fees and expenses associated with the loan, plus any premium payments that may be received on the loan of certain types of securities. Security lending income is presented in the Statement of Operations as a component of income from Fidelity Central Funds.
9. Expense Reductions.
Many of the brokers with whom FMR places trades on behalf of the Fund provided services to the Fund in addition to trade execution. These services included payments of certain expenses on behalf of the Fund totaling $8,207 for the period.
10. Other.
The Fund's organizational documents provide former and current trustees and officers with a limited indemnification against liabilities arising in connection with the performance of their duties to the Fund. In the normal course of business, the Fund may also enter into contracts that provide general indemnifications. The Fund's maximum exposure under these arrangements is unknown as this would be dependent on future claims that may be made against the Fund. The risk of material loss from such claims is considered remote.
At the end of the period, FMR or its affiliates were the owners of record of 100% of the total outstanding shares of the Fund.
In December 2006, the Independent Trustees, with the assistance of independent counsel, completed an investigation regarding gifts, gratuities and business entertainment provided by certain brokers to certain individuals who were employed on FMR's domestic equity trading desk during the period 2002 to 2004. The Independent Trustees and FMR agreed that, despite the absence of proof that the Fidelity mutual funds experienced diminished execution quality as a result of the improper receipt of gifts and business entertainment, the conduct at issue was serious and was worthy of redress. Accordingly, the Independent Trustees requested, and FMR agreed to make, a payment of $42 million plus accrued interest, which equaled approximately $7.3 million, to certain Fidelity mutual funds.
In March 2008, the Trustees approved a method for allocating this payment among the funds and, in total, FMR paid the fund $28,508, which is recorded in the accompanying Statement of Operations.
In a related administrative order dated March 5, 2008, the U.S. Securities and Exchange Commission ("SEC") announced a settlement with FMR and FMR Co., Inc. (an affiliate of FMR) involving the SEC's regulatory rules for investment advisers and the improper receipt of gifts, gratuities and business entertainment. Without admitting or denying the SEC's findings, FMR agreed to pay an $8 million civil penalty to the United States Treasury.
11. Distributions to Shareholders.
Distributions to shareholders of each class were as follows:
Years ended December 31,
2008
2007
From net investment income
Initial Class
$ 62,217
$ -
Investor Class
15,654
-
Total
$ 77,871
$ -
From net realized gain
Initial Class
$ 8,440,333
$ 4,693,279
Investor Class
3,981,376
1,401,298
Total
$ 12,421,709
$ 6,094,577
Annual Report
12. Share Transactions.
Transactions for each class of shares were as follows:
Shares
Dollars
Years ended December 31,
2008
2007
2008
2007
Initial Class
Shares sold
1,178,491
2,595,070
$ 8,240,629
$ 28,838,207
Reinvestment of distributions
1,143,754
484,843
8,502,550
4,693,279
Shares redeemed
(3,119,510)
(2,892,839)
(22,814,157)
(29,640,764)
Net increase (decrease)
(797,265)
187,074
$ (6,070,978)
$ 3,890,722
Investor Class
Shares sold
1,576,768
2,580,889
$ 12,608,557
$ 28,186,641
Reinvestment of distributions
538,625
145,212
3,997,030
1,401,298
Shares redeemed
(2,379,042)
(1,134,869)
(16,521,194)
(11,678,312)
Net increase (decrease)
(263,649)
1,591,232
$ 84,393
$ 17,909,627
Annual Report
Reportof Independent Registered Public Accounting Firm
To the Trustees of Variable Insurance Products Fund IV and the Shareholders of VIP Technology Portfolio:
In our opinion, the accompanying statement of assets and liabilities, including the schedule of investments, and the related statements of operations and of changes in net assets and the financial highlights present fairly, in all material respects, the financial position of VIP Technology Portfolio (a fund of Variable Insurance Products Fund IV) at December 31, 2008, the results of its operations for the year then ended, the changes in its net assets for each of the two years in the period then ended and the financial highlights for each of the periods indicated, in conformity with accounting principles generally accepted in the United States of America. These financial statements and financial highlights (hereafter referred to as "financial statements") are the responsibility of the VIP Technology Portfolio's management. Our responsibility is to express an opinion on these financial statements based on our audits. We conducted our audits of these financial statements in accordance with the standards of the Public Company Accounting Oversight Board (United States). Those standards require that we plan and perform the audit to obtain reasonable assurance about whether the financial statements are free of material misstatement. An audit includes examining, on a test basis, evidence supporting the amounts and disclosures in the financial statements, assessing the accounting principles used and significant estimates made by management, and evaluating the overall financial statement presentation. We believe that our audits, which included confirmation of securities at December 31, 2008 by correspondence with the custodian and brokers, provide a reasonable basis for our opinion.
The Trustees, Member of the Advisory Board, and executive officers of the trust and fund, as applicable, are listed below. The Board of Trustees governs the fund and is responsible for protecting the interests of shareholders. The Trustees are experienced executives who meet periodically throughout the year to oversee the fund's activities, review contractual arrangements with companies that provide services to the fund, and review the fund's performance. Except for Edward C. Johnson 3d and James C. Curvey, each of the Trustees oversees 222 funds advised by FMR or an affiliate. Messrs. Johnson and Curvey oversee 381 funds advised by FMR or an affiliate.
The Trustees hold office without limit in time except that (a) any Trustee may resign; (b) any Trustee may be removed by written instrument, signed by at least two-thirds of the number of Trustees prior to such removal; (c) any Trustee who requests to be retired or who has become incapacitated by illness or injury may be retired by written instrument signed by a majority of the other Trustees; and (d) any Trustee may be removed at any special meeting of shareholders by a two-thirds vote of the outstanding voting securities of the trust. Each Trustee who is not an interested person (as defined in the 1940 Act) (Independent Trustee), shall retire not later than the last day of the calendar year in which his or her 72nd birthday occurs. The Independent Trustees may waive this mandatory retirement age policy with respect to individual Trustees. The executive officers and Advisory Board Member hold office without limit in time, except that any officer and Advisory Board Member may resign or may be removed by a vote of a majority of the Trustees at any regular meeting or any special meeting of the Trustees. Except as indicated, each individual has held the office shown or other offices in the same company for the past five years.
The fund's Statement of Additional Information (SAI) includes more information about the Trustees. To request a free copy, call Fidelity at 1-877-0098.
Interested Trustees*:
Correspondence intended for each Trustee who is an interested person may be sent to Fidelity Investments, 82 Devonshire Street, Boston, Massachusetts 02109.
Name, Age; Principal Occupation
Edward C. Johnson 3d (78)
Year of Election or Appointment: 1983
Mr. Johnson is Chairman of the Board of Trustees. Mr. Johnson serves as Chief Executive Officer, Chairman, and a Director of FMR LLC; Chairman and a Director of FMR; Chairman and a Director of Fidelity Research & Analysis Company (FRAC); Chairman and a Director of Fidelity Investments Money Management, Inc.; and Chairman and a Director of FMR Co., Inc. In addition, Mr. Johnson serves as Chairman and Director of FIL Limited. Previously, Mr. Johnson served as President of FMR LLC (2006-2007).
James C. Curvey (73)
Year of Election or Appointment: 2007
Mr. Curvey also serves as Trustee (2007-present) of other investment companies advised by FMR. Mr. Curvey is a Director of FMR and FMR Co., Inc. (2007-present). Mr. Curvey is also Vice Chairman (2006-present) and Director of FMR LLC. In addition, Mr. Curvey serves as an Overseer for the Boston Symphony Orchestra and a member of the Trustees of Villanova University.
* Trustees have been determined to be "Interested Trustees" by virtue of, among other things, their affiliation with the trust or various entities under common control with FMR. FMR Corp. merged with and into FMR LLC on October 1, 2007. Any references to FMR LLC for prior periods are deemed to be references to the prior entity.
Independent Trustees:
Correspondence intended for each Independent Trustee (that is, the Trustees other than the Interested Trustees) may be sent to Fidelity Investments, P.O. Box 55235, Boston, Massachusetts 02205-5235.
Name, Age; Principal Occupation
Dennis J. Dirks (60)
Year of Election or Appointment: 2005
Prior to his retirement in May 2003, Mr. Dirks was Chief Operating Officer and a member of the Board of The Depository Trust & Clearing Corporation (DTCC) (1999-2003). He also served as President, Chief Operating Officer, and Board member of The Depository Trust Company (DTC) (1999-2003) and President and Board member of the National Securities Clearing Corporation (NSCC) (1999-2003). In addition, Mr. Dirks served as Chief Executive Officer and Board member of the Government Securities Clearing Corporation (2001-2003), Chief Executive Officer and Board member of the Mortgage-Backed Securities Clearing Corporation (2001-2003), as a Trustee and a member of the Finance Committee of Manhattan College (2005-2008), and as a Trustee and a member of the Finance Committee of AHRC of Nassau County (2006-2008). Currently, Mr. Dirks serves as a member of the Board of Directors for The Brookville Center for Children's Services, Inc. (2009-present).
Alan J. Lacy (55)
Year of Election or Appointment:2008
Mr. Lacy serves as Senior Adviser (2007-present) of Oak Hill Capital Partners, L.P. (a private equity firm). Mr. Lacy also served as Chief Executive Officer (2000-2005) and Vice Chairman (2005-2006) of Sears Holdings Corporation and Sears, Roebuck and Co. (retail). In addition, Mr. Lacy serves as a member of the Board of Directors of The Western Union Company (global money transfer, 2006-present) and Bristol-Myers Squibb (global pharmaceuticals, 2007-present). Mr. Lacy is a Trustee of the National Parks Conservation Association and The Field Museum of Natural History.
Ned C. Lautenbach (64)
Year of Election or Appointment: 2000
Mr. Lautenbach is Chairman of the Independent Trustees (2006-present). Mr. Lautenbach is an Advisory Partner of Clayton, Dubilier & Rice, Inc. (private equity investment firm). Previously, Mr. Lautenbach was with the International Business Machines Corporation (IBM) from 1968 until his retirement in 1998. Mr. Lautenbach serves as a Director of Eaton Corporation (diversified industrial) as well as the Philharmonic Center for the Arts in Naples, Florida. He also is a member of the Board of Trustees of Fairfield University (2005-present), as well as a member of the Council on Foreign Relations. Previously, Mr. Lautenbach served as a Director of Sony Corporation (2006-2007).
Joseph Mauriello (64)
Year of Election or Appointment: 2008
Prior to his retirement in January 2006, Mr. Mauriello served in numerous senior management positions including Deputy Chairman and Chief Operating Officer (2004-2005), and Vice Chairman of Financial Services (2002-2004) of KPMG LLP US (professional services firm, 1965-2005). Mr. Mauriello currently serves as a member of the Board of Directors of XL Capital Ltd. (global insurance and re-insurance company, 2006-present) and of Arcadia Resources Inc. (health care services and products, 2007-present). He also served as a Director of the Hamilton Funds of the Bank of New York (2006-2007).
Cornelia M. Small (64)
Year of Election or Appointment: 2005
Ms. Small is a member of the Investment Committee, and Chair (2008-present) and a member of the Board of Trustees of Smith College. Ms. Small also serves on the Investment Committee of the Berkshire Taconic Community Foundation (2008-present). Previously, Ms. Small served as Chairperson of the Investment Committee (2002-2008) of Smith College and as Co-Chair (2000-2003) of the Annual Fund for the Fletcher School of Law and Diplomacy. In addition, she served as Chief Investment Officer, Director of Global Equity Investments, and a member of the Board of Directors of Scudder, Stevens & Clark and Scudder Kemper Investments.
William S. Stavropoulos (69)
Year of Election or Appointment: 2001
Mr. Stavropoulos is Chairman Emeritus of the Board of Directors of The Dow Chemical Company, where he previously served in numerous senior management positions, including President (1993-2000; 2002-2003), CEO (1995-2000; 2002-2004), Chairman of the Executive Committee (2000-2006), and as a member of the Board of Directors (1990-2006). Currently, he is a Director of Teradata Corporation (data warehousing and technology solutions, 2008-present), Chemical Financial Corporation, Maersk Inc. (industrial conglomerate), Tyco International, Inc. (multinational manufacturing and services, 2007-present), and a member of the Advisory Board for Metalmark Capital (private equity investment firm, 2005-present). He is a special advisor to Clayton, Dubilier & Rice, Inc. (private equity investment). In addition, Mr. Stavropoulos is a member of the University of Notre Dame Advisory Council for the College of Science.
David M. Thomas (59)
Year of Election or Appointment: 2008
Previously, Mr. Thomas served as Executive Chairman (2005-2006) and Chairman and Chief Executive Officer (2000-2005) of IMS Health, Inc. (pharmaceutical and healthcare information solutions). In addition, Mr. Thomas serves as a member of the Board of Directors of Fortune Brands, Inc. (consumer products holding company), and Interpublic Group of Companies, Inc. (marketing communication, 2004-present).
Michael E. Wiley (58)
Year of Election or Appointment: 2008
Mr. Wiley also serves as a member of the Board of Trustees of the University of Tulsa (2000-2006; 2007-present). He serves as a Director of Tesoro Corporation (independent oil refiner and marketer, 2005-present), and a Director of Bill Barrett Corporation (exploration and production company, 2005-present). In addition, he also serves as a Director of Post Oak Bank (privately-held bank, 2004-present). Previously, Mr. Wiley served as a Sr. Energy Advisor of Katzenbach Partners, LLC (consulting firm, 2006-2007), as an Advisory Director of Riverstone Holdings (private investment firm), Chairman, President, and CEO of Baker Hughes, Inc. (oilfield services company, 2000-2004), and as Director of Spinnaker Exploration Company (exploration and production company, 2001-2005).
Annual Report
Trustees and Officers - continued
Advisory Board Member and Executive Officers**:
Correspondence intended for each executive officer and Peter S. Lynch may be sent to Fidelity Investments, 82 Devonshire Street, Boston, Massachusetts 02109.
Name, Age; Principal Occupation
Peter S. Lynch (64)
Year of Election or Appointment: 2003
Member of the Advisory Board of Fidelity's Equity and High Income Funds. Mr. Lynch is Vice Chairman and a Director of FMR, and Vice Chairman (2001-present) and a Director of FMR Co., Inc. Previously, Mr. Lynch served as a Trustee of the Fidelity funds (1990-2003). In addition, he serves as a Trustee of Boston College and as the Chairman of the Inner-City Scholarship Fund. Previously, Mr. Lynch served on the Special Olympics International Board of Directors (1997-2006).
Kenneth B. Robins (39)
Year of Election or Appointment: 2008
President and Treasurer of Fidelity's Equity and High Income Funds. Mr. Robins is an employee of Fidelity Investments (2004-present). Before joining Fidelity Investments, Mr. Robins worked at KPMG LLP, where he was a partner in KPMG's department of professional practice (2002-2004).
Brian B. Hogan (44)
Year of Election or Appointment: 2007
Vice President of Sector Funds. Mr. Hogan also serves as Senior Vice President, Equity Research of FMR. Previously, Mr. Hogan served as a portfolio manager.
Scott C. Goebel (40)
Year of Election or Appointment: 2008
Secretary and Chief Legal Officer (CLO) of the Fidelity funds. Mr. Goebel also serves as General Counsel, Secretary, and Senior Vice President of FMR (2008-present); Deputy General Counsel of FMR LLC; Chief Legal Secretary of Fidelity Management & Research (Hong Kong) Limited (2008-present) and Assistant Secretary of Fidelity Management & Research (Japan) Inc. (2008-present). Previously, Mr. Goebel served as Assistant Secretary of the Funds (2007-2008) and as Vice President and Secretary of Fidelity Distributors Corporation (FDC) (2005-2007).
John B. McGinty, Jr. (46)
Year of Election or Appointment: 2008
Assistant Secretary of Fidelity's Equity and High Income Funds. Mr. McGinty is an employee of Fidelity Investments (2004-present). Mr. McGinty also serves as Senior Vice President, Secretary, and Chief Legal Officer of FDC (2007-present). Before joining Fidelity Investments, Mr. McGinty practiced law at Ropes & Gray, LLP.
Holly C. Laurent (54)
Year of Election or Appointment: 2008
Anti-Money Laundering (AML) Officer of the Fidelity funds. Ms. Laurent is an employee of Fidelity Investments. Previously, Ms. Laurent was Senior Vice President and Head of Legal for Fidelity Business Services India Pvt. Ltd. (2006-2008), Senior Vice President, Deputy General Counsel and Group Head for FMR LLC (2005-2006).
Christine Reynolds (50)
Year of Election or Appointment: 2008
Chief Financial Officer of the Fidelity funds. Ms. Reynolds became President of Fidelity Pricing and Cash Management Services (FPCMS) in August 2008. She served as Chief Operating Officer of FPCMS from 2007 through July 2008. Previously, Ms. Reynolds served as President, Treasurer, and Anti-Money Laundering officer of the Fidelity funds (2004-2007). Before joining Fidelity Investments, Ms. Reynolds worked at PricewaterhouseCoopers LLP (PwC) (1980-2002), where she was an audit partner with PwC's investment management practice.
Kenneth A. Rathgeber (61)
Year of Election or Appointment: 2004
Chief Compliance Officer of Fidelity's Equity and High Income Funds. Mr. Rathgeber is Chief Compliance Officer of Fidelity Management & Research (Hong Kong) Limited (2008-present), Fidelity Management & Research (Japan) Inc. (2008-present), FMR (2005-present), FMR Co., Inc. (2005-present), Fidelity Management & Research (U.K.) Inc. (2005-present), Fidelity Research & Analysis Company (2005-present), Fidelity Investments Money Management, Inc. (2005-present), and Strategic Advisers, Inc. (2005-present).
Bryan A. Mehrmann (47)
Year of Election or Appointment: 2005
Deputy Treasurer of the Fidelity funds. Mr. Mehrmann is an employee of Fidelity Investments. Previously, Mr. Mehrmann served as Vice President of Fidelity Investments Institutional Services Group (FIIS)/Fidelity Investments Institutional Operations Company, Inc. (FIIOC) Client Services (1998-2004).
Adrien E. Deberghes (41)
Year of Election or Appointment: 2008
Deputy Treasurer of Fidelity's Equity and High Income Funds. Mr. Deberghes is an employee of Fidelity Investments (2008-present). Previously, Mr. Deberghes served as Senior Vice President of Mutual Fund Administration at State Street Corporation (2007-2008), Senior Director of Mutual Fund Administration at Investors Bank & Trust (2005-2007), and Director of Finance for Dunkin' Brands (2000-2005).
Robert G. Byrnes (42)
Year of Election or Appointment: 2005
Assistant Treasurer of the Fidelity funds. Mr. Byrnes is an employee of Fidelity Investments (2005-present). Previously, Mr. Byrnes served as Vice President of Fidelity Pricing and Cash Management Services (FPCMS) (2003-2005). Before joining Fidelity Investments, Mr. Byrnes worked at Deutsche Asset Management where he served as Vice President of the Investment Operations Group (2000-2003).
Paul M. Murphy (61)
Year of Election or Appointment: 2007
Assistant Treasurer of the Fidelity funds. Mr. Murphy is an employee of Fidelity Investments (2007-present). Previously, Mr. Murphy served as Chief Financial Officer of the Fidelity Funds (2005-2006), Vice President and Associate General Counsel of FMR (2007), and Senior Vice President of Fidelity Pricing and Cash Management Services (FPCMS) (1994-2007).
Gary W. Ryan (50)
Year of Election or Appointment: 2005
Assistant Treasurer of the Fidelity funds. Mr. Ryan is an employee of Fidelity Investments. Previously, Mr. Ryan served as Vice President of Fund Reporting in Fidelity Pricing and Cash Management Services (FPCMS) (1999-2005).
** FMR Corp. merged with and into FMR LLC on October 1, 2007. Any references to FMR LLC for prior periods are deemed to be references to the prior entity.
Initial class designates 1% and 52% and Investor Class designates 1% and 100% of the dividends distributed in February 2008 and December 2008, respectively, as qualifying for the dividends-received deduction for corporate shareholders.
The fund will notify shareholders in January 2009 of amounts for use in preparing 2008 income tax returns.
A special meeting of the fund's shareholders was held on May 14, 2008. The results of votes taken among shareholders on the proposals before them are reported below. Each vote reported represents one dollar of net asset value held on the record date for the meeting.
PROPOSAL 1
To elect a Board of Trustees.A
# of Votes
% of Votes
James C. Curvey
Affirmative
82,890,712.47
95.991
Withheld
3,461,988.43
4.009
TOTAL
86,352,700.90
100.000
Dennis J. Dirks
Affirmative
82,970,372.75
96.083
Withheld
3,382,328.15
3.917
TOTAL
86,352,700.90
100.000
Edward C. Johnson 3d
Affirmative
82,689,162.78
95.757
Withheld
3,663,538.12
4.243
TOTAL
86,352,700.90
100.000
Alan J. Lacy
Affirmative
83,041,222.35
96.165
Withheld
3,311,478.55
3.835
TOTAL
86,352,700.90
100.000
Ned C. Lautenbach
Affirmative
82,983,853.72
96.099
Withheld
3,368,847.18
3.901
TOTAL
86,352,700.90
100.000
Joseph Mauriello
Affirmative
83,138,122.14
96.277
Withheld
3,214,578.76
3.723
TOTAL
86,352,700.90
100.000
Cornelia M. Small
Affirmative
83,095,438.06
96.228
Withheld
3,257,262.84
3.772
TOTAL
86,352,700.90
100.000
William S. Stavropoulos
Affirmative
82,929,113.95
96.035
Withheld
3,423,586.95
3.965
TOTAL
86,352,700.90
100.000
David M. Thomas
Affirmative
83,095,487.87
96.228
Withheld
3,257,213.03
3.772
TOTAL
86,352,700.90
100.000
Michael E. Wiley
Affirmative
83,048,523.75
96.174
Withheld
3,304,177.15
3.826
TOTAL
86,352,700.90
100.000
PROPOSAL 2
To amend the Declaration of Trust to reduce the required quorum for future shareholder meetings.A
# of Votes
% of Votes
Affirmative
74,393,635.26
86.151
Against
8,745,543.59
10.128
Abstain
3,213,522.05
3.721
TOTAL
86,352,700.90
100.000
ADenotes trust-wide proposal and voting results.
Annual Report
BoardApproval of Investment Advisory Contracts and Management Fees
VIP Technology Portfolio
Each year, typically in July, the Board of Trustees, including the Independent Trustees (together, the Board), votes on the renewal of the management contract and sub-advisory agreements (together, the Advisory Contracts) for the fund. The Board, assisted by the advice of fund counsel and Independent Trustees' counsel, requests and considers a broad range of information throughout the year.
The Board meets regularly and, acting directly and through its separate committees, requests and receives information concerning, and considers at each of its meetings factors that are relevant to, its annual consideration of the renewal of the fund's Advisory Contracts, including the services and support provided to the fund and its shareholders. At the time of the renewal, the Board had 12 standing committees, each composed of Independent Trustees with varying backgrounds, to which the Board has assigned specific subject matter responsibilities in order to enhance effective decision-making by the Board. Each committee has a written charter outlining the structure and purposes of the committee. The Board also meets as needed to consider matters specifically related to the Board's annual consideration of the renewal of Advisory Contracts.
At its July 2008 meeting, the Board of Trustees, including the Independent Trustees, unanimously determined to renew the fund's Advisory Contracts. In reaching its determination, the Board considered all factors it believed relevant, including (i) the nature, extent, and quality of the services to be provided to the fund and its shareholders (including the investment performance of the fund); (ii) the competitiveness of the fund's management fee and total expenses; (iii) the total costs of the services to be provided by and the profits to be realized by Fidelity from its relationship with the fund; (iv) the extent to which economies of scale would be realized as the fund grows; and (v) whether fee levels reflect these economies of scale, if any, for the benefit of fund shareholders. The Board also approved agreements with foreign sub-advisers Fidelity Management & Research (Japan) Inc. and Fidelity Management & Research (Hong Kong) Limited, as well as amendments to the fund's agreement with Fidelity Management & Research (U.K.) Inc.
In considering whether to renew the Advisory Contracts for the fund, the Board ultimately reached a determination, with the assistance of fund counsel and Independent Trustees' counsel and through the exercise of its business judgment, that the renewal of the Advisory Contracts and the compensation to be received by Fidelity under the management contract is consistent with Fidelity's fiduciary duty under applicable law. The Board's decision to renew the Advisory Contracts was not based on any single factor noted above, but rather was based on a comprehensive consideration of all the information provided to the Board at its meetings throughout the year. The Board, in reaching its determination to renew the Advisory Contracts, is aware that shareholders in the fund have a broad range of investment choices available to them, including a wide choice among mutual funds offered by competitors to Fidelity, and that the fund's shareholders, with the opportunity to review and weigh the disclosure provided by the fund in its prospectus and other public disclosures, have chosen to invest in this fund, managed by Fidelity.
Nature, Extent, and Quality of Services Provided. The Board considered staffing within the investment adviser, FMR, and the sub-advisers (together, the Investment Advisers), including the backgrounds of the fund's investment personnel and the fund's investment objective and discipline. The Independent Trustees also had discussions with senior management of Fidelity's investment operations and investment groups. The Board considered the structure of the portfolio manager compensation program and whether this structure provides appropriate incentives.
Resources Dedicated to Investment Management and Support Services. The Board reviewed the size, education, and experience of the Investment Advisers' investment staff, their use of technology, and the Investment Advisers' approach to recruiting, training, and retaining portfolio managers and other research, advisory, and management personnel. The Board noted that Fidelity's analysts have access to a variety of technological tools that enable them to perform both fundamental and quantitative analysis and to specialize in various disciplines. The Board considered Fidelity's extensive global research capabilities that enable the Investment Advisers to aggregate data from various sources in an effort to produce positive investment results. The Board also considered that Fidelity's portfolio managers and analysts have access to daily portfolio attribution that allows for monitoring of a fund's portfolio, as well as an electronic communication system that provides immediate real-time access to research concerning issuers and credit enhancers.
Shareholder and Administrative Services. The Board considered (i) the nature, extent, quality, and cost of advisory, administrative, distribution, and shareholder services performed by the Investment Advisers and their affiliates under the Advisory Contracts and under separate agreements covering transfer agency, pricing and bookkeeping, and securities lending services for the fund; (ii) the nature and extent of the Investment Advisers' supervision of third party service providers, principally custodians and subcustodians; and (iii) the resources devoted to, and the record of compliance with, the fund's compliance policies and procedures. The Board also reviewed the allocation of fund brokerage, including allocations to brokers affiliated with the Investment Advisers, the use of brokerage commissions to pay fund expenses, and the use of "soft" commission dollars to pay for research services. The Board further considered that Fidelity voluntarily pays for market data out of its own resources.
The Board noted that the growth of fund assets across the complex allows Fidelity to reinvest in the development of services designed to enhance the value or convenience of the Fidelity funds as investment vehicles. These services include 24-hour access to account information and market information through phone representatives and over the Internet, and investor education materials and asset allocation tools.
Investment in a Large Fund Family. The Board considered the benefits to shareholders of investing in a Fidelity fund, including the benefits of investing in a fund that is part of a large family of funds offering a variety of investment disciplines and providing for a large variety of mutual fund investor services. The Board noted that Fidelity has taken a number of actions over the previous year that benefited particular funds, including (i) dedicating additional resources to investment research and to restructure the investment research teams; (ii) contractually agreeing to reduce the management fees on Fidelity's Institutional Money Market Funds and launching Class IV and Institutional Class of certain of these funds; (iii) reducing the transfer agent fees for the Fidelity Select Portfolios and Investor Class of the VIP funds; and (iv) launching Class K of 29 equity funds as a lower-fee class available to certain employer-sponsored retirement plans.
Annual Report
Investment Performance. The Board considered whether the fund has operated within its investment objective, as well as its record of compliance with its investment restrictions. It also reviewed the fund's absolute investment performance for each class, as well as the fund's relative investment performance for each class measured against a third-party-sponsored index that reflects the market sector in which the fund invests over multiple periods. The Board noted that FMR does not believe that a meaningful peer group exists against which to compare the fund's performance. The following charts considered by the Board show, over the one-, three-, and five-year periods ended December 31, 2007, as available, the cumulative total returns of Initial Class and Investor Class of the fund and the cumulative total returns of a third-party-sponsored index ("benchmark").
VIP Technology Portfolio
The Board stated that the investment performance of Initial Class of the fund compared favorably to its benchmark for all the periods shown. The Board considered that the variations in performance between the fund's classes reflect the variations in class expenses, which result in lower performance for the higher expense class.
The Board considered that FMR has taken steps to refocus and strengthen equity research, equity portfolio management, and compliance.
Based on its review, and giving particular weight to the nature and quality of the resources dedicated by the Investment Advisers to maintain and improve relative performance, the Board concluded that the nature, extent, and quality of the services provided to the fund will benefit the fund's shareholders, particularly in light of the Board's view that the fund's shareholders benefit from investing in a fund that is part of a large family of funds offering a variety of investment disciplines and services.
Competitiveness of Management Fee and Total Fund Expenses. The Board considered the fund's management fee and total expenses compared to "mapped groups" of competitive funds and classes. Fidelity creates "mapped groups" by combining similar Lipper investment objective categories that have comparable management fee characteristics. Combining Lipper investment objective categories aids the Board's management fee and total expense comparisons by broadening the competitive group used for comparison and by reducing the number of universes to which various Fidelity funds are compared. The Board also considered supplemental information about how the fund's management fee and total expenses ranked relative to groups based on Lipper classifications, which take into account a fund's market capitalization and style.
The Board considered two proprietary management fee comparisons for the 12-month periods shown in the chart below. The group of Lipper funds used by the Board for management fee comparisons is referred to below as the "Total Mapped Group." The Total Mapped Group comparison focuses on a fund's standing relative to the total universe of comparable funds available to investors, in terms of gross management fees before expense reimbursements or caps. "TMG %" represents the percentage of funds in the Total Mapped Group that had management fees that were lower than the fund's. For example, a TMG % of 4% means that 96% of the funds in the Total Mapped Group had higher management fees than the fund. The "Asset-Size Peer Group" (ASPG) comparison focuses on a fund's standing relative to non-Fidelity funds similar in size to the fund within the Total Mapped Group. The ASPG represents at least 15% of the funds in the Total Mapped Group with comparable asset size and management fee characteristics, subject to a minimum of 50 funds (or all funds in the Total Mapped Group if fewer than 50). Additional information, such as the ASPG quartile in which the fund's management fee ranked, is also included in the chart and considered by the Board.
Annual Report
Board Approval of Investment Advisory Contracts and Management Fees - continued
VIP Technology Portfolio
The Board noted that the fund's management fee ranked below the median of its Total Mapped Group and below the median of its ASPG for 2007.
Based on its review, the Board concluded that the fund's management fee was fair and reasonable in light of the services that the fund receives and the other factors considered.
In its review of each class's total expenses, the Board considered the fund's management fee as well as other fund or class expenses, as applicable, such as transfer agent fees, pricing and bookkeeping fees, and custodial, legal, and audit fees. The Board also noted the effects of any waivers and reimbursements on fees and expenses. As part of its review, the Board also considered current and historical total expenses of each class of the fund compared to competitive fund median expenses. Each class of the fund is compared to those funds and classes in the Total Mapped Group (used by the Board for management fee comparisons) that have a similar sales load structure.
The Board noted that the total expenses of each class ranked below its competitive median for 2007.
In its review of total expenses, the Board also considered Fidelity fee structures and other information on clients that FMR and its affiliates service in other competitive markets, such as other mutual funds advised or subadvised by FMR or its affiliates, pension plan clients, and other institutional clients.
Based on its review, the Board concluded that the total expenses of each class of the fund were reasonable in light of the services that the fund and its shareholders receive and the other factors considered.
Costs of the Services and Profitability. The Board considered the revenues earned and the expenses incurred by Fidelity in conducting the business of developing, marketing, distributing, managing, administering and servicing the fund and its shareholders. The Board also considered the level of Fidelity's profits in respect of all the Fidelity funds.
On an annual basis, FMR presents to the Board Fidelity's profitability for the fund. Fidelity calculates the profitability for each fund, as well as aggregate profitability for groups of Fidelity funds and all Fidelity funds, using a series of detailed revenue and cost allocation methodologies which originate with the audited books and records of Fidelity. The Audit Committee of the Board reviews any significant changes from the prior year's methodologies.
PricewaterhouseCoopers LLP (PwC), independent registered public accounting firm and auditor to Fidelity and certain Fidelity funds, has been engaged annually by the Board as part of the Board's assessment of the results of Fidelity's profitability analysis. PwC's engagement includes the review and assessment of Fidelity's methodologies used in determining the revenues and expenses attributable to Fidelity's mutual fund business, and completion of agreed-upon procedures surrounding the mathematical accuracy of fund profitability and its conformity to allocation methodologies. After considering PwC's reports issued under the engagement and information provided by Fidelity, the Board believes that while other allocation methods may also be reasonable, Fidelity's profitability methodologies are reasonable in all material respects.
The Board has also reviewed Fidelity's non-fund businesses and any fall-out benefits related to the mutual fund business as well as cases where Fidelity's affiliates may benefit from or be related to the fund's business.
The Board considered the costs of the services provided by and the profits realized by Fidelity in connection with the operation of the fund and determined that the amount of profit is a fair entrepreneurial profit for the management of the fund.
Annual Report
Economies of Scale. The Board considered whether there have been economies of scale in respect of the management of the Fidelity funds, whether the Fidelity funds (including the fund) have appropriately benefited from any such economies of scale, and whether there is potential for realization of any further economies of scale. The Board considered the extent to which the fund will benefit from economies of scale through increased services to the fund, through waivers or reimbursements, or through fee or expense reductions.
The Board recognized that the fund's management contract incorporates a "group fee" structure, which provides for lower group fee rates as total fund assets under FMR's management increase, and for higher group fee rates as total fund assets under FMR's management decrease. FMR determines the group fee rates based on a tiered asset "breakpoint" schedule. The Board considered that the group fee is designed to deliver the benefits of economies of scale to fund shareholders when total fund assets increase, even if assets of any particular fund are unchanged or have declined, because some portion of Fidelity's costs are attributable to services provided to all Fidelity funds, and all funds benefit if those costs can be allocated among more assets. The Board concluded that, given the group fee structure, fund shareholders will achieve a certain level of economies of scale as assets under FMR's management increase at the fund complex level, regardless of whether Fidelity achieves any such economies of scale.
The Board further concluded that any potential economies of scale are being shared between fund shareholders and Fidelity in an appropriate manner.
Additional Information Requested by the Board. In order to develop fully the factual basis for consideration of the Fidelity funds' Advisory Contracts, the Board requested and received additional information on certain topics, including (i) fund performance trends and actions to be taken by FMR to improve certain funds' overall performance; (ii) portfolio manager changes that have occurred during the past year; (iii) Fidelity's fund profitability methodology, the profitability of certain fund service providers, and profitability trends for certain funds; (iv) Fidelity's compensation structure for portfolio managers and key personnel, including its effects on fund profitability and the extent to which portfolio manager compensation is linked to fund performance; (v) Fidelity's fee structures and rationale for recommending different fees among categories of funds; and (vi) Fidelity's rationale for recommending which funds should have a performance adjustment component as part of their management fees.
Based on its evaluation of all of the conclusions noted above, and after considering all material factors, the Board ultimately concluded that the advisory fee structures are fair and reasonable, and that the fund's Advisory Contracts should be renewed.
Annual Report
Investment Adviser
Fidelity Management & Research Company Boston, MA
Investment Sub-Advisers
FMR Co., Inc.
Fidelity Management & Research (U.K.) Inc.
Fidelity Research & Analysis Company
Fidelity Investments Japan Limited
FIL Investment Advisors
FIL Investment Advisors (U.K.) Ltd.
Fidelity Management & Research (Hong Kong) Limited
Fidelity Management & Research (Japan) Inc.
General Distributor
Fidelity Distributors Corporation Boston, MA
Transfer and Service Agents
Fidelity Investments Institutional Operations Company, Inc. Boston, MA
Fidelity Service Company, Inc. Boston, MA
Custodian
JPMorgan Chase Bank New York, NY
VTECIC-ANN-0209
1.817385.103
Fidelity® Variable Insurance Products:
Telecommunications Portfolio
Annual Report
December 31, 2008 (2_fidelity_logos) (Registered_Trademark)
To view a fund's proxy voting guidelines and proxy voting record for the 12-month period ended June 30, visit http://www.fidelity.com (search for "proxy voting guidelines") or visit the Securities and Exchange Commission's (SEC) web site at http://www.sec.gov. You may also call 1-877-208-0098 to request a free copy of the proxy voting guidelines.
Fidelity Variable Insurance Products are separate account options which are purchased through a variable insurance contract.
Standard & Poor's, S&P and S&P 500 are registered service marks of The McGraw-Hill Companies, Inc. and have been licensed for use by Fidelity Distributors Corporation.
Other third party marks appearing herein are the property of their respective owners.
All other marks appearing herein are registered or unregistered trademarks or service marks of FMR LLC or an affiliated company.
This report and the financial statements contained herein are submitted for the general information of the shareholders of the fund. This report is not authorized for distribution to prospective investors in the fund unless preceded or accompanied by an effective prospectus.
A fund files its complete schedule of portfolio holdings with the SEC for the first and third quarters of each fiscal year on Form N-Q. Forms N-Q are available on the SEC's web site at http://www.sec.gov. A fund's Forms N-Q may be reviewed and copied at the SEC's Public Reference Room in Washington, DC. Information regarding the operation of the SEC's Public Reference Room may be obtained by calling 1-800-SEC-0330. For a complete list of a fund's portfolio holdings, view the most recent holdings listing, semiannual report, or annual report on Fidelity's web site at http://www.fidelity.com or http://www.advisor.fidelity.com, as applicable.
NOT FDIC INSURED · MAY LOSE VALUE · NO BANK GUARANTEE
Neither the fund nor Fidelity Distributors Corporation is a bank.
Average annual total return reflects the change in the value of an investment, assuming reinvestment of the class' dividend income and capital gains (the profits earned upon the sale of securities that have grown in value, if any) and assuming a constant rate of performance each year. During periods of reimbursement by Fidelity, a fund's total return will be greater than it would be had the reimbursement not occurred. Performance numbers are net of all underlying fund operating expenses, but do not include any insurance charges imposed by your insurance company's separate account. If performance information included the effect of these additional charges, the total returns would have been lower. How a fund did yesterday is no guarantee of how it will do tomorrow.
Average Annual Total Returns
Periods ended December 31, 2008
Past 1 year
Life of FundA
VIP Telecommunications - Initial Class
-47.41%
-32.11%
VIP Telecommunications - Investor Class
-47.46%
-32.19%
AFrom April 24, 2007.
$10,000 Over Life of Fund
Let's say hypothetically that $10,000 was invested in VIP Telecommunications Portfolio - Initial Class on April 24, 2007, when the fund started. The chart shows how the value of your investment would have changed, and also shows how the Standard & Poor's 500SM Index (S&P 500®) performed over the same period.
Comments from Gavin Baker, Portfolio Manager of VIP Telecommunications Portfolio
By year-end 2008, the vicious credit crisis sparked in the U.S. had spread like wildfire across the world's capital markets, stunting global growth, toppling commodity prices, changing the face of the global financial system and chasing risk-averse investors toward the sidelines. The U.S. equity markets, as measured by the Dow Jones Industrial AverageSM and Standard & Poor's 500SM Index, fell hard as a result, declining 31.93% and 37.00%, respectively, while the technology-laden NASDAQ Composite® Index slid 40.03%. Foreign market stocks saw an even sharper decline, as illustrated by the 43.28% loss of the MSCI® EAFE® Index (Europe, Australasia, Far East), a gauge of developed stock markets outside the U.S. and Canada. A generally stronger U.S. dollar also held back returns for U.S. investors in foreign equities. Emerging-markets stocks - the global performance leader only a year ago - fell harder still, dropping 53.18%, as measured by the MSCI Emerging Markets Index. The only clear winners during the past year were assets backed by the U.S. government, as investors fled from risk. Thus, the Barclays Capital U.S. Treasury Bond Index climbed 13.74% for the year, while the Barclays Capital U.S. Aggregate Bond Index - a broader measure of the U.S. investment-grade bond universe - gained a more modest 5.24%. By contrast, high-yield bonds bore the brunt of investors' increasing wariness over risk, as expressed by the Merrill Lynch® U.S. High Yield Master II Constrained Index's drop of 26.11%. The emerging-markets bond category also felt the shock of investors' risk-averse sentiment, with the JPMorgan Emerging Markets Bond Index (EMBI) Global falling 10.91%. Meanwhile, the Citigroup® Non-U.S. Group of 7 Index - representing the debt performance of major global economies, excluding the United States - eked out a 1.69% gain.
For the 12-month period ending December 31, 2008, the fund significantly underperformed the -33.16% return of the MSCI® US Investable Market Telecommunications Services Index, as well as the return of the S&P 500®. (For specific portfolio results, please refer to the performance section of this report.) Relative to the MSCI index, the fund was hurt by being significantly overweighted in the poor-performing alternative carriers group. Underweighting integrated telecommunication services stocks, specifically index heavyweights AT&T and Verizon - due to the fund's investment limitations - - also detracted because these two stocks outperformed the MSCI index. In terms of other individual detractors, alternative carriers Global Crossing, which is based in Bermuda, and Level 3 Communications also hurt the fund. French company Gameloft, which sells video games for cell phones, and an out-of-index position in software firm Synchronoss Technologies further detracted. On the other hand, the fund benefited from strong stock selection in the wireless telecommunication services group. Specifically, it was helped by underweighting Sprint Nextel, which performed poorly. Another stock that contributed was broadcasting and cable TV company DIRECTV Group, in which the fund held an out-of-benchmark position. Spanish integrated telecommunication services company Telefonica SA, another out-of-benchmark holding, also did well.
The views expressed above reflect those of the portfolio manager(s) only through the end of the period as stated on the cover of this report and do not necessarily represent the views of Fidelity or any other person in the Fidelity organization. Any such views are subject to change at any time based upon market or other conditions and Fidelity disclaims any responsibility to update such views. These views may not be relied on as investment advice and, because investment decisions for a Fidelity fund are based on numerous factors, may not be relied on as an indication of trading intent on behalf of any Fidelity fund.
As a shareholder of the Fund, you incur two types of costs: (1) transaction costs, including redemption fees, and (2) ongoing costs, including management fees and other Fund expenses. This Example is intended to help you understand your ongoing costs (in dollars) of investing in the Fund and to compare these costs with the ongoing costs of investing in other mutual funds.
The Example is based on an investment of $1,000 invested at the beginning of the period and held for the entire period (July 1, 2008 to December 31, 2008).
Actual Expenses
The first line of the accompanying table for each class of the Fund provides information about actual account values and actual expenses. You may use the information in this line, together with the amount you invested, to estimate the expenses that you paid over the period. Simply divide your account value by $1,000.00 (for example, an $8,600 account value divided by $1,000.00 = 8.6), then multiply the result by the number in the first line for a class of the Fund under the heading entitled "Expenses Paid During Period" to estimate the expenses you paid on your account during this period. The estimate of expenses does not include any fees or other expenses of any variable annuity or variable life insurance product. If they were, the estimate of expenses you paid during the period would be higher, and your ending account value would be lower. In addition, the Fund, as a shareholder in the underlying Fidelity Central Funds, will indirectly bear its pro rata share of the fees and expenses incurred by the underlying Fidelity Central Funds. These fees and expenses are not included in the Fund's annualized expense ratio used to calculate the expense estimate in the table below.
Hypothetical Example for Comparison Purposes
The second line of the accompanying table for each class of the Fund provides information about hypothetical account values and hypothetical expenses based on a Class' actual expense ratio and an assumed rate of return of 5% per year before expenses, which is not the Class' actual return. The hypothetical account values and expenses may not be used to estimate the actual ending account balance or expenses you paid for the period. You may use this information to compare the ongoing costs of investing in the Fund and other funds. To do so, compare this 5% hypothetical example with the 5% hypothetical examples that appear in the shareholder reports of the other funds. The estimate of expenses does not include any fees or other expenses of any variable annuity or variable life insurance product. If they were, the estimate of expenses you paid during the period would be higher, and your ending account value would be lower. In addition, the Fund, as a shareholder in the underlying Fidelity Central Funds, will indirectly bear its pro rata share of the fees and expenses incurred by the underlying Fidelity Central Funds. These fees and expenses are not included in the Fund's annualized expense ratio used to calculate the expense estimate in the table below.
Please note that the expenses shown in the table are meant to highlight your ongoing costs only and do not reflect any transaction costs. Therefore, the second line of the table is useful in comparing ongoing costs only, and will not help you determine the relative total costs of owning different funds. In addition, if these transactional costs were included, your costs would have been higher.
Annualized Expense Ratio
Beginning Account Value July 1, 2008
Ending Account Value December 31, 2008
Expenses Paid During Period* July 1, 2008 to December 31, 2008
Initial Class
1.00%
Actual
$ 1,000.00
$ 671.50
$ 4.20
HypotheticalA
$ 1,000.00
$ 1,020.11
$ 5.08
Investor Class
1.08%
Actual
$ 1,000.00
$ 671.10
$ 4.54
HypotheticalA
$ 1,000.00
$ 1,019.71
$ 5.48
A 5% return per year before expenses
* Expenses are equal to each Class' annualized expense ratio, multiplied by the average account value over the period, multiplied by 184/366 (to reflect the one-half year period).
Annual Report
Investment Changes (Unaudited)
Top Ten Stocks as of December 31, 2008
% of fund's net assets
% of fund's net assets 6 months ago
Verizon Communications, Inc.
11.6
4.8
Qwest Communications International, Inc.
9.4
8.1
AT&T, Inc.
8.8
15.2
Global Crossing Ltd.
7.3
7.1
Starent Networks Corp.
4.8
3.7
Vodafone Group PLC sponsored ADR
4.7
4.7
Cbeyond, Inc.
4.2
1.1
tw telecom, inc.
3.7
4.9
The DIRECTV Group, Inc.
3.6
2.2
Gameloft
3.5
3.5
61.6
Top Industries (% of fund's net assets)
As of December 31, 2008
Diversified Telecommunication Services
51.9%
Wireless Telecommunication Services
21.1%
Media
10.4%
Communications Equipment
5.2%
Software
3.8%
All Others*
7.6%
As of June 30, 2008
Diversified Telecommunication Services
56.1%
Wireless Telecommunication Services
22.5%
Media
10.5%
Software
4.4%
Communications Equipment
4.3%
All Others*
2.2%
* Includes short-term investments and net other assets.
Prior period industry classifications reflect the categories in place as of the date indicated and have not been adjusted to reflect current industry classifications.
Annual Report
Investments December 31, 2008
Showing Percentage of Net Assets
Common Stocks - 92.5%
Shares
Value
COMMUNICATIONS EQUIPMENT - 5.2%
Communications Equipment - 5.2%
Aruba Networks, Inc. (a)
5
$ 13
Infinera Corp. (a)
1,400
12,544
Nortel Networks Corp. (a)
100
26
Sandvine Corp. (a)
100
67
Sonus Networks, Inc. (a)
900
1,422
Starent Networks Corp. (a)
12,793
152,620
166,692
DIVERSIFIED TELECOMMUNICATION SERVICES - 51.9%
Alternative Carriers - 11.7%
Cable & Wireless PLC
309
709
Cogent Communications Group, Inc. (a)
1,006
6,569
Global Crossing Ltd. (a)
29,044
230,609
Iliad Group SA
10
872
Level 3 Communications, Inc. (a)
19,292
13,504
PAETEC Holding Corp. (a)
1,400
2,016
tw telecom, inc. (a)
13,738
116,361
370,640
Integrated Telecommunication Services - 40.2%
AT&T, Inc.
9,783
278,816
BT Group PLC
109
222
Cbeyond, Inc. (a)
8,343
133,321
China Unicom Ltd. sponsored ADR
5,300
64,660
Cincinnati Bell, Inc. (a)
3,500
6,755
FairPoint Communications, Inc.
522
1,712
France Telecom SA
700
19,604
NTELOS Holdings Corp.
36
888
PT Telkomunikasi Indonesia Tbk Series B
5,500
3,383
Qwest Communications International, Inc.
82,300
299,572
Telecom Italia SpA sponsored ADR
200
3,250
Telefonica SA sponsored ADR
1,400
94,346
Telenor ASA
100
679
Telenor ASA sponsored ADR
70
1,435
Telkom SA Ltd.
100
1,221
Verizon Communications, Inc.
10,900
369,513
1,279,377
TOTAL DIVERSIFIED TELECOMMUNICATION SERVICES
1,650,017
INTERNET SOFTWARE & SERVICES - 0.1%
Internet Software & Services - 0.1%
SAVVIS, Inc. (a)
401
2,763
MEDIA - 10.4%
Cable & Satellite - 10.4%
Comcast Corp. Class A
5,300
89,464
DISH Network Corp. Class A (a)
2,600
28,834
Dish TV India Ltd. (a)
112
46
Dish TV India Ltd. rights 1/5/09 (a)
135
0
Shares
Value
The DIRECTV Group, Inc. (a)
5,040
$ 115,466
Virgin Media, Inc.
19,400
96,806
330,616
SOFTWARE - 3.8%
Application Software - 0.3%
OnMobile Global Ltd.
2,081
9,636
Synchronoss Technologies, Inc. (a)
37
394
10,030
Home Entertainment Software - 3.5%
Gameloft (a)
52,114
111,043
Glu Mobile, Inc. (a)
1,989
995
112,038
TOTAL SOFTWARE
122,068
WIRELESS TELECOMMUNICATION SERVICES - 21.1%
Wireless Telecommunication Services - 21.1%
American Tower Corp. Class A (a)
2,800
82,096
Bharti Airtel Ltd. (a)
36
531
Centennial Communications Corp. Class A (a)
1,400
11,284
Clearwire Corp. Class A (a)
290
1,430
Crown Castle International Corp. (a)
2,617
46,007
Idea Cellular Ltd. (a)
63
68
Leap Wireless International, Inc. (a)
2,000
53,780
MetroPCS Communications, Inc. (a)
957
14,211
Millicom International Cellular SA
817
36,691
MTN Group Ltd.
600
6,957
NII Holdings, Inc. (a)
1,900
34,542
SBA Communications Corp. Class A (a)
2,818
45,990
Sprint Nextel Corp.
58,487
107,031
Syniverse Holdings, Inc. (a)
432
5,158
Telephone & Data Systems, Inc.
230
7,303
TIM Participacoes SA sponsored ADR (non-vtg.)
1,000
12,490
Turkcell Iletisim Hizmet AS sponsored ADR
1,900
27,702
Vivo Participacoes SA sponsored ADR
2,300
28,842
Vodafone Group PLC sponsored ADR
7,300
149,212
671,325
TOTAL COMMON STOCKS
(Cost $4,956,817)
2,943,481
Money Market Funds - 8.5%
Shares
Value
Fidelity Cash Central Fund, 1.06% (b) (Cost $270,264)
270,264
$ 270,264
TOTAL INVESTMENT PORTFOLIO - 101.0%
(Cost $5,227,081)
3,213,745
NET OTHER ASSETS - (1.0)%
(32,481)
NET ASSETS - 100%
3,181,264
Legend
(a) Non-income producing
(b) Affiliated fund that is available only to investment companies and other accounts managed by Fidelity Investments. The rate quoted is the annualized seven-day yield of the fund at period end. A complete unaudited listing of the fund's holdings as of its most recent quarter end is available upon request.
Affiliated Central Funds
Information regarding fiscal year to date income earned by the Fund from investments in Fidelity Central Funds is as follows:
Fund
Income earned
Fidelity Cash Central Fund
$ 2,179
Other Information
The following is a summary of the inputs used, as of December 31, 2008, involving the Fund's assets carried at value. The inputs or methodology used for valuing securities may not be an indication of the risk associated with investing in those securities. For more information on valuation inputs, and their aggregation into the levels used in the table below, please refer to the Security Valuation section in the accompanying Notes to Financial Statements.
Valuation Inputs at Reporting Date:
Description
Total
Level 1
Level 2
Level 3
Investments in Securities
$ 3,213,745
$ 3,058,774
$ 154,971
$ -
Distribution of investments by country of issue, as a percentage of total net assets, is as follows: (Unaudited)
United States of America
74.7%
Bermuda
7.3%
United Kingdom
4.7%
France
4.1%
Spain
3.0%
Hong Kong
2.0%
Brazil
1.3%
Luxembourg
1.2%
Others (individually less than 1%)
1.7%
100.0%
Income Tax Information
At December 31, 2008, the fund had a capital loss carryforward of approximately $1,999,657 all of which will expire on December 31, 2016.
The fund intends to elect to defer to its fiscal year ending December 31, 2009 approximately $160,257 of losses recognized during the period November 1, 2008 to December 31, 2008.
See accompanying notes which are an integral part of the financial statements.
Investment in securities, at value - See accompanying schedule:
Unaffiliated issuers (cost $4,956,817)
$ 2,943,481
Fidelity Central Funds (cost $270,264)
270,264
Total Investments (cost $5,227,081)
$ 3,213,745
Receivable for investments sold
8,750
Receivable for fund shares sold
27,456
Dividends receivable
3,256
Distributions receivable from Fidelity Central Funds
95
Prepaid expenses
38
Receivable from investment adviser for expense reductions
13,135
Other receivables
938
Total assets
3,267,413
Liabilities
Payable for investments purchased
$ 46,353
Payable for fund shares redeemed
3
Accrued management fee
1,402
Other affiliated payables
365
Other payables and accrued expenses
38,026
Total liabilities
86,149
Net Assets
$ 3,181,264
Net Assets consist of:
Paid in capital
$ 7,654,962
Accumulated undistributed net realized gain (loss) on investments and foreign currency transactions
(2,460,157)
Net unrealized appreciation (depreciation) on investments and assets and liabilities in foreign currencies
(2,013,541)
Net Assets
$ 3,181,264
Statement of Assets and Liabilities - continued
December 31, 2008
Initial Class: Net Asset Value, offering price and redemption price per share ($1,549,123 ÷ 321,814 shares)
$ 4.81
Investor Class: Net Asset Value, offering price and redemption price per share ($1,632,141 ÷ 339,781 shares)
$ 4.80
See accompanying notes which are an integral part of the financial statements.
Annual Report
Statement of Operations
Year ended December 31, 2008
Investment Income
Dividends
$ 118,153
Interest
102
Income from Fidelity Central Funds
2,179
Total income
120,434
Expenses
Management fee
$ 29,159
Transfer agent fees
12,044
Accounting fees and expenses
2,031
Custodian fees and expenses
26,986
Independent trustees' compensation
26
Audit
39,079
Legal
32
Miscellaneous
669
Total expenses before reductions
110,026
Expense reductions
(55,903)
54,123
Net investment income (loss)
66,311
Realized and Unrealized Gain (Loss)
Net realized gain (loss) on:
Investment securities:
Unaffiliated issuers
(2,213,595)
Foreign currency transactions
491
Total net realized gain (loss)
(2,213,104)
Change in net unrealized appreciation (depreciation) on:
Investment securities (net of decrease in deferred foreign taxes of $593)
(1,314,806)
Assets and liabilities in foreign currencies
(203)
Total change in net unrealized appreciation (depreciation)
(1,315,009)
Net gain (loss)
(3,528,113)
Net increase (decrease) in net assets resulting from operations
$ (3,461,802)
Statement of Changes in Net Assets
Year ended December 31, 2008
For the period April 24, 2007 (commencement of operations) to December 31, 2007
Increase (Decrease) in Net Assets
Operations
Net investment income (loss)
$ 66,311
$ 38,828
Net realized gain (loss)
(2,213,104)
161,086
Change in net unrealized appreciation (depreciation)
(1,315,009)
(698,532)
Net increase (decrease) in net assets resulting from operations
(3,461,802)
(498,618)
Distributions to shareholders from net investment income
(68,515)
(41,369)
Distributions to shareholders from net realized gain
-
(405,249)
Total distributions
(68,515)
(446,618)
Share transactions - net increase (decrease)
(1,545,159)
9,194,365
Redemption fees
2,509
5,102
Total increase (decrease) in net assets
(5,072,967)
8,254,231
Net Assets
Beginning of period
8,254,231
-
End of period
$ 3,181,264
$ 8,254,231
See accompanying notes which are an integral part of the financial statements.
Annual Report
Financial Highlights - Initial Class
Years ended December 31,
2008
2007H
Selected Per-Share Data
Net asset value, beginning of period
$ 9.36
$ 10.00
Income from Investment Operations
Net investment income (loss)E
.09
.05
Net realized and unrealized gain (loss)
(4.53)
(.17)
Total from investment operations
(4.44)
(.12)
Distributions from net investment income
(.11)
(.05)
Distributions from net realized gain
-
(.48)
Total distributions
(.11)
(.53)
Redemption fees added to paid in capitalE
-J
.01
Net asset value, end of period
$ 4.81
$ 9.36
Total Return B, C, D
(47.41)%
(1.18)%
Ratios to Average Net Assets F, I
Expenses before reductions
2.07%
1.37%A
Expenses net of fee waivers, if any
1.00%
1.00%A
Expenses net of all reductions
.99%
1.00%A
Net investment income (loss)
1.32%
.63%A
Supplemental Data
Net assets, end of period (000 omitted)
$ 1,549
$ 3,956
Portfolio turnover rateG
203%
160%A
A Annualized B Total returns for periods of less than one year are not annualized. C Total returns do not reflect charges attributable to your insurance company's separate account. Inclusion of these charges would reduce the total returns shown. D Total returns would have been lower had certain expenses not been reduced during the periods shown. E Calculated based on average shares outstanding during the period. F Fees and expenses of the underlying Fidelity Central Funds are not included in the Fund's expense ratio. The Fund indirectly bears its proportionate share of the expenses of any underlying Fidelity Central Funds. G Amount does not include the portfolio activity of any underlying Fidelity Central Funds. H For the period April 24, 2007 (commencement of operations) to December 31, 2007. I Expense ratios reflect operating expenses of the class. Expenses before reductions do not reflect amounts reimbursed by the investment adviser or reductions from brokerage service arrangements or other expense offset arrangements and do not represent the amount paid by the class during periods when reimbursements or reductions occur. Expense ratios before reductions for start-up periods may not be representative of longer-term operating periods. Expenses net of fee waivers reflect expenses after reimbursement by the investment adviser but prior to reductions from brokerage service arrangements or other expense offset arrangements. Expenses net of all reductions represent the net expenses paid by the class. J Amount represents less than $.01 per share.
Financial Highlights - Investor Class
Years ended December 31,
2008
2007H
Selected Per-Share Data
Net asset value, beginning of period
$ 9.35
$ 10.00
Income from Investment Operations
Net investment income (loss)E
.09
.04
Net realized and unrealized gain (loss)
(4.53)
(.17)
Total from investment operations
(4.44)
(.13)
Distributions from net investment income
(.11)
(.05)
Distributions from net realized gain
-
(.48)
Total distributions
(.11)
(.53)
Redemption fees added to paid in capitalE
-J
.01
Net asset value, end of period
$ 4.80
$ 9.35
Total Return B, C, D
(47.46)%
(1.28)%
Ratios to Average Net Assets F, I
Expenses before reductions
2.15%
1.50%A
Expenses net of fee waivers, if any
1.09%
1.15%A
Expenses net of all reductions
1.08%
1.15%A
Net investment income (loss)
1.23%
.48%A
Supplemental Data
Net assets, end of period (000 omitted)
$ 1,632
$ 4,298
Portfolio turnover rateG
203%
160%A
A Annualized B Total returns for periods of less than one year are not annualized. C Total returns do not reflect charges attributable to your insurance company's separate account. Inclusion of these charges would reduce the total returns shown. D Total returns would have been lower had certain expenses not been reduced during the periods shown. E Calculated based on average shares outstanding during the period. F Fees and expenses of the underlying Fidelity Central Funds are not included in the Fund's expense ratio. The Fund indirectly bears its proportionate share of the expenses of any underlying Fidelity Central Funds. G Amount does not include the portfolio activity of any underlying Fidelity Central Funds. H For the period April 24, 2007 (commencement of operations) to December 31, 2007. I Expense ratios reflect operating expenses of the class. Expenses before reductions do not reflect amounts reimbursed by the investment adviser or reductions from brokerage service arrangements or other expense offset arrangements and do not represent the amount paid by the class during periods when reimbursements or reductions occur. Expense ratios before reductions for start-up periods may not be representative of longer-term operating periods. Expenses net of fee waivers reflect expenses after reimbursement by the investment adviser but prior to reductions from brokerage service arrangements or other expense offset arrangements. Expenses net of all reductions represent the net expenses paid by the class. J Amount represents less than $.01 per share.
See accompanying notes which are an integral part of the financial statements.
VIP Telecommunications Portfolio (the Fund) is a fund of Variable Insurance Products Fund IV (the trust) and is authorized to issue an unlimited number of shares. The trust is registered under the Investment Company Act of 1940, as amended (the 1940 Act), as an open-end management investment company organized as a Massachusetts business trust. Shares of the Fund may only be purchased by insurance companies for the purpose of funding variable annuity or variable life insurance contracts. The Fund offers the following classes of shares: Initial Class shares and Investor Class shares. All classes have equal rights and voting privileges, except for matters affecting a single class. Investment income, realized and unrealized capital gains and losses, the common expenses of the Fund, and certain fund-level expense reductions, if any, are allocated on a pro rata basis to each class based on the relative net assets of each class to the total net assets of the Fund. Each class differs with respect to transfer agent fees incurred. Certain expense reductions also differ by class.
2. Investments in Fidelity Central Funds.
The Fund may invest in Fidelity Central Funds, which are open-end investment companies available only to other investment companies and accounts managed by Fidelity Management & Research Company (FMR) and its affiliates. The Fund's Schedule of Investments lists each of the Fidelity Central Funds held as of period end, if any, as an investment of the Fund, but does not include the underlying holdings of each Fidelity Central Fund. As an Investing Fund, the Fund indirectly bears its proportionate share of the expenses of the underlying Fidelity Central Funds.
The Money Market Central Funds seek preservation of capital and current income and are managed by Fidelity Investments Money Management, Inc. (FIMM), an affiliate of FMR.
A complete unaudited list of holdings for each Fidelity Central Fund is available upon request or at the SEC's web site at www.sec.gov. In addition, the financial statements of the Fidelity Central Funds, which are not covered by the Fund's Report of Independent Registered Public Accounting Firm, are available on the SEC's web site or upon request.
3. Significant Accounting Policies.
The financial statements have been prepared in conformity with accounting principles generally accepted in the United States of America, which require management to make certain estimates and assumptions at the date of the financial statements. Actual results could differ from those estimates. The following summarizes the significant accounting policies of the Fund:
Security Valuation. Investments are valued as of 4:00 p.m. Eastern time on the last calendar day of the period. Wherever possible, the Fund uses independent pricing services approved by the Board of Trustees to value its investments.
Equity securities, including restricted securities, for which market quotations are readily available, are valued at the last reported sale price or official closing price as reported by an independent pricing service on the primary market or exchange on which they are traded. In the event there were no sales during the day or closing prices are not available, securities are valued at the last quoted bid price. Investments in open-end mutual funds, including the Fidelity Central Funds, are valued at their closing net asset value each business day. Short-term securities with remaining maturities of sixty days or less for which quotations are not readily available are valued at amortized cost, which approximates value.
When current market prices or quotations are not readily available or reliable, valuations may be determined in good faith in accordance with procedures adopted by the Board of Trustees. Factors used in determining value may include significant market or security specific events, changes in interest rates and credit quality, and developments in foreign markets which are monitored by evaluating the performance of ADRs, futures contracts and exchange-traded funds. The frequency with which these procedures are used cannot be predicted and may be utilized to a significant extent. The value of securities used for net asset value (NAV) calculation under these procedures may differ from published prices for the same securities.
The Fund is subject to the provisions of Statement of Financial Accounting Standards No. 157, "Fair Value Measurements" (SFAS 157), effective with the beginning of the Fund's fiscal year. SFAS 157 establishes a hierarchy that prioritizes the inputs to valuation techniques giving the highest priority to readily available unadjusted quoted prices in active markets for identical assets (level 1 measurements) and the lowest priority to unobservable inputs (level 3 measurements) when market prices are not readily available or reliable. The three levels of the hierarchy under SFAS 157 are described below:
Level 1
Quoted prices in active markets for identical securities.
Level 2
Prices determined using other significant observable inputs. Observable inputs are inputs that other market participants may use in pricing a security. These may include quoted prices for similar securities, interest rates, prepayment speeds, credit risk and others.
Level 3
Prices determined using significant unobservable inputs. In situations where quoted prices or observable inputs are unavailable or deemed less relevant (for example, when there is little or no market activity for an investment at the end of the period), unobservable inputs may be used. Unobservable inputs reflect the Fund's own assumptions about the factors market participants would use in pricing an investment, and would be based on the best information available.
Annual Report
Notes to Financial Statements - continued
3. Significant Accounting Policies - continued
Security Valuation - continued
Changes in valuation techniques may result in transfers in or out of an investment's assigned level within the hierarchy.
The aggregate value by input level, as of December 31, 2008, for the Fund's investments is included at the end of the Fund's Schedule of Investments.
Foreign Currency. The Fund uses foreign currency contracts to facilitate transactions in foreign-denominated securities. Losses from these transactions may arise from changes in the value of the foreign currency or if the counterparties do not perform under the contracts' terms.
Foreign-denominated assets, including investment securities, and liabilities are translated into U.S. dollars at the exchange rate at period end. Purchases and sales of investment securities, income and dividends received and expenses denominated in foreign currencies are translated into U.S. dollars at the exchange rate in effect on the transaction date.
The effects of exchange rate fluctuations on investments are included with the net realized and unrealized gain (loss) on investment securities. Other foreign currency transactions resulting in realized and unrealized gain (loss) are disclosed separately.
Investment Transactions and Income. For financial reporting purposes, the Fund's investment holdings and NAV include trades executed through the end of the last business day of the period. The NAV per share for processing shareholder transactions is calculated as of the close of business of the New York Stock Exchange (NYSE), normally 4:00 p.m. Eastern time and includes trades executed through the end of the prior business day. Gains and losses on securities sold are determined on the basis of identified cost. Dividend income is recorded on the ex-dividend date, except for certain dividends from foreign securities where the ex-dividend date may have passed, which are recorded as soon as the Fund is informed of the ex-dividend date. Non-cash dividends included in dividend income, if any, are recorded at the fair market value of the securities received. Interest income and distributions from the Fidelity Central Funds are accrued as earned. Interest income includes coupon interest and amortization of premium and accretion of discount on debt securities. Investment income is recorded net of foreign taxes withheld where recovery of such taxes is uncertain.
Expenses. Most expenses of the trust can be directly attributed to a fund. Expenses which cannot be directly attributed are apportioned among each Fund in the trust. Expense estimates are accrued in the period to which they relate and adjustments are made when actual amounts are known.
Income Tax Information and Distributions to Shareholders. Each year, the Fund intends to qualify as a regulated investment company by distributing substantially all of its taxable income and realized gains under Subchapter M of the Internal Revenue Code and filing its U.S. federal tax return. As a result, no provision for income taxes is required. The Fund is subject to the provisions of FASB Interpretation No. 48, Accounting for Uncertainties in Income Taxes (FIN 48). FIN 48 sets forth a minimum threshold for financial statement recognition of the benefit of a tax position taken or expected to be taken in a tax return. There are no unrecognized tax benefits in the accompanying financial statements. A Fund's federal tax return is subject to examination by the Internal Revenue Service (IRS) for a period of three years. Foreign taxes are provided for based on the Fund's understanding of the tax rules and rates that exist in the foreign markets in which it invests.
Distributions are recorded on the ex-dividend date. Income dividends and capital gain distributions are declared separately for each class. Income and capital gain distributions are determined in accordance with income tax regulations, which may differ from generally accepted accounting principles.
Capital accounts within the financial statements are adjusted for permanent book-tax differences. These adjustments have no impact on net assets or the results of operations. Temporary book-tax differences will reverse in a subsequent period.
Book-tax differences are primarily due to foreign currency transactions, certain foreign taxes, capital loss carryforwards and losses deferred due to wash sales and excise tax regulations.
The tax-basis components of distributable earnings and the federal tax cost as of period end were as follows:
Unrealized appreciation
$ 78,239
Unrealized depreciation
(2,392,024)
Net unrealized appreciation (depreciation)
(2,313,785)
Capital loss carryforward
(1,999,657)
Cost for federal income tax purposes
$ 5,527,530
The tax character of distributions paid was as follows:
December 31, 2008
December 31, 2007
Ordinary Income
$ 68,515
$ 446,618
Trading (Redemption) Fees. Shares held less than 60 days are subject to a redemption fee equal to 1% of the proceeds of the redeemed shares. All redemption fees, including any estimated redemption fees paid by FMR, are retained by the Fund and accounted for as an addition to paid in capital.
Annual Report
4. Operating Policies.
Repurchase Agreements. FMR has received an Exemptive Order from the Securities and Exchange Commission (the SEC) which permits the Fund and other affiliated entities of FMR to transfer uninvested cash balances into joint trading accounts which are then invested in repurchase agreements. The Fund may also invest directly with institutions in repurchase agreements. Repurchase agreements are collateralized by government or non-government securities. Upon settlement date, collateral is held in segregated accounts with custodian banks and may be obtained in the event of a default of the counterparty. The Fund monitors, on a daily basis, the value of the collateral to ensure it is at least equal to the principal amount of the repurchase agreement (including accrued interest). In the event of a default by the counterparty, realization of the collateral proceeds could be delayed, during which time the value of the collateral may decline.
5. Purchases and Sales of Investments.
Purchases and sales of securities, other than short-term securities, aggregated $10,608,590 and $12,412,890, respectively.
6. Fees and Other Transactions with Affiliates.
Management Fee. FMR and its affiliates provide the Fund with investment management related services for which the Fund pays a monthly management fee. The management fee is the sum of an individual fund fee rate that is based on an annual rate of .30% of the Fund's average net assets and a group fee rate that averaged .26% during the period. The group fee rate is based upon the average net assets of all the mutual funds advised by FMR. The group fee rate decreases as assets under management increase and increases as assets under management decrease. For the period, the total annual management fee rate was .56% of the Fund's average net assets.
Transfer Agent Fees. Fidelity Investments Institutional Operations Company, Inc. (FIIOC), an affiliate of FMR, is the Fund's transfer, dividend disbursing, and shareholder servicing agent. FIIOC receives an asset-based fee with respect to each class. Each class (with the exception of Investor Class) pays a transfer agent fee, excluding out of pocket expenses, equal to an annual rate of .07% of average net assets. Investor Class pays a monthly asset-based transfer agent fee of .15% of average net assets. Prior to February 1, 2008, Investor Class paid a monthly asset-based transfer agent fee of .18% of average net assets. The total transfer agent fees paid by each class to FIIOC, including out of pocket expenses, were as follows:
Initial Class
$ 4,704
Investor Class
7,340
$ 12,044
Accounting Fees. Fidelity Service Company, Inc. (FSC), an affiliate of FMR, maintains the Fund's accounting records. The fee is based on the level of average net assets for the month.
Brokerage Commissions. The Fund placed a portion of its portfolio transactions with brokerage firms which are affiliates of the investment adviser. The commissions paid to these affiliated firms were $806 for the period.
7. Committed Line of Credit.
The Fund participates with other funds managed by FMR in a $4.2 billion credit facility (the "line of credit") to be utilized for temporary or emergency purposes to fund shareholder redemptions or for other short-term liquidity purposes. The Fund has agreed to pay commitment fees on its pro rata portion of the line of credit, which amounted to $7 and is reflected in Miscellaneous Expense on the Statement of Operations. During the period, there were no borrowings on this line of credit.
8. Expense Reductions.
FMR voluntarily agreed to reimburse each class to the extent annual operating expenses exceeded certain levels of average net assets as noted in the table below. Some expenses, for example interest expense, including commitment fees, are excluded from this reimbursement.
The following classes were in reimbursement during the period:
Expense Limitations
Reimbursement from adviser
Initial Class
1.00%
$ 26,277
Investor Class
1.15%-1.08%*
29,093
$ 55,370
* Expense limitation in effect at period end.
Annual Report
Notes to Financial Statements - continued
8. Expense Reductions - continued
Effective February 1, 2008 the expense limitation changed to 1.08% for the Investor Class.
Many of the brokers with whom FMR places trades on behalf of the Fund provided services to the Fund in addition to trade execution. These services included payments of certain expenses on behalf of the Fund totaling $533 for the period.
9. Other.
The Fund's organizational documents provide former and current trustees and officers with a limited indemnification against liabilities arising in connection with the performance of their duties to the Fund. In the normal course of business, the Fund may also enter into contracts that provide general indemnifications. The Fund's maximum exposure under these arrangements is unknown as this would be dependent on future claims that may be made against the Fund. The risk of material loss from such claims is considered remote.
At the end of the period, FMR or its affiliates were the owners of record of 100% of the total outstanding shares of the Fund.
10. Distributions to Shareholders.
Distributions to shareholders of each class were as follows:
Years ended December 31,
2008
2007A
From net investment income
Initial Class
$ 34,167
$ 19,585
Investor Class
34,348
21,784
Total
$ 68,515
$ 41,369
From net realized gain
Initial Class
$ -
$ 191,851
Investor Class
-
213,398
Total
$ -
$ 405,249
A For the period April 24, 2007 (commencement of operations) to December 31, 2007.
11. Share Transactions.
Transactions for each class of shares were as follows:
Shares
Dollars
Years ended December 31,
2008
2007A
2008
2007A
Initial Class
Shares sold
166,405
673,203
$ 1,029,476
$ 7,061,076
Reinvestment of distributions
7,239
22,280
34,167
211,436
Shares redeemed
(274,366)
(272,947)
(1,833,477)
(2,817,196)
Net increase (decrease)
(100,722)
422,536
$ (769,834)
$ 4,455,316
Investor Class
Shares sold
149,553
695,098
$ 986,673
$ 7,280,048
Reinvestment of distributions
7,293
24,808
34,348
235,182
Shares redeemed
(276,604)
(260,367)
(1,796,346)
(2,776,181)
Net increase (decrease)
(119,758)
459,539
$ (775,325)
$ 4,739,049
A For the period April 24, 2007 (commencement of operations) to December 31, 2007.
Annual Report
Reportof Independent Registered Public Accounting Firm
To the Trustees of Variable Insurance Products Fund IV and the Shareholders of VIP Telecommunications Portfolio:
In our opinion, the accompanying statement of assets and liabilities, including the schedule of investments, and the related statements of operations and of changes in net assets and the financial highlights present fairly, in all material respects, the financial position of VIP Telecommunications Portfolio (a fund of Variable Insurance Products Fund IV) at December 31, 2008, the results of its operations for the year then ended, the changes in its net assets for each of the periods indicated and the financial highlights for each of the periods indicated, in conformity with accounting principles generally accepted in the United States of America. These financial statements and financial highlights (hereafter referred to as "financial statements") are the responsibility of the VIP Telecommunications Portfolio's management. Our responsibility is to express an opinion on these financial statements based on our audits. We conducted our audits of these financial statements in accordance with the standards of the Public Company Accounting Oversight Board (United States). Those standards require that we plan and perform the audit to obtain reasonable assurance about whether the financial statements are free of material misstatement. An audit includes examining, on a test basis, evidence supporting the amounts and disclosures in the financial statements, assessing the accounting principles used and significant estimates made by management, and evaluating the overall financial statement presentation. We believe that our audits, which included confirmation of securities at December 31, 2008 by correspondence with the custodian and brokers, provide a reasonable basis for our opinion.
The Trustees, Member of the Advisory Board, and executive officers of the trust and fund, as applicable, are listed below. The Board of Trustees governs the fund and is responsible for protecting the interests of shareholders. The Trustees are experienced executives who meet periodically throughout the year to oversee the fund's activities, review contractual arrangements with companies that provide services to the fund, and review the fund's performance. Except for Edward C. Johnson 3d and James C. Curvey, each of the Trustees oversees 222 funds advised by FMR or an affiliate. Messrs. Johnson and Curvey oversee 380 funds advised by FMR or an affiliate.
The Trustees hold office without limit in time except that (a) any Trustee may resign; (b) any Trustee may be removed by written instrument, signed by at least two-thirds of the number of Trustees prior to such removal; (c) any Trustee who requests to be retired or who has become incapacitated by illness or injury may be retired by written instrument signed by a majority of the other Trustees; and (d) any Trustee may be removed at any special meeting of shareholders by a two-thirds vote of the outstanding voting securities of the trust. Each Trustee who is not an interested person (as defined in the 1940 Act) (Independent Trustee), shall retire not later than the last day of the calendar year in which his or her 72nd birthday occurs. The Independent Trustees may waive this mandatory retirement age policy with respect to individual Trustees. The executive officers and Advisory Board Member hold office without limit in time, except that any officer and Advisory Board Member may resign or may be removed by a vote of a majority of the Trustees at any regular meeting or any special meeting of the Trustees. Except as indicated, each individual has held the office shown or other offices in the same company for the past five years.
The fund's Statement of Additional Information (SAI) includes more information about the Trustees. To request a free copy, call Fidelity at 1-877-208-0098.
Interested Trustees*:
Correspondence intended for each Trustee who is an interested person may be sent to Fidelity Investments, 82 Devonshire Street, Boston, Massachusetts 02109.
Name, Age; Principal Occupation
Edward C. Johnson 3d (78)
Year of Election or Appointment: 1983
Mr. Johnson is Chairman of the Board of Trustees. Mr. Johnson serves as Chief Executive Officer, Chairman, and a Director of FMR LLC; Chairman and a Director of FMR; Chairman and a Director of Fidelity Research & Analysis Company (FRAC); Chairman and a Director of Fidelity Investments Money Management, Inc.; and Chairman and a Director of FMR Co., Inc. In addition, Mr. Johnson serves as Chairman and Director of FIL Limited. Previously, Mr. Johnson served as President of FMR LLC (2006-2007).
James C. Curvey (73)
Year of Election or Appointment: 2007
Mr. Curvey also serves as Trustee (2007-present) of other investment companies advised by FMR. Mr. Curvey is a Director of FMR and FMR Co., Inc. (2007-present). Mr. Curvey is also Vice Chairman (2006-present) and Director of FMR LLC. In addition, Mr. Curvey serves as an Overseer for the Boston Symphony Orchestra and a member of the Trustees of Villanova University.
* Trustees have been determined to be "Interested Trustees" by virtue of, among other things, their affiliation with the trust or various entities under common control with FMR. FMR Corp. merged with and into FMR LLC on October 1, 2007. Any references to FMR LLC for prior periods are deemed to be references to the prior entity.
Independent Trustees:
Correspondence intended for each Independent Trustee (that is, the Trustees other than the Interested Trustees) may be sent to Fidelity Investments, P.O. Box 55235, Boston, Massachusetts 02205-5235.
Name, Age; Principal Occupation
Dennis J. Dirks (60)
Year of Election or Appointment: 2005
Prior to his retirement in May 2003, Mr. Dirks was Chief Operating Officer and a member of the Board of The Depository Trust & Clearing Corporation (DTCC) (1999-2003). He also served as President, Chief Operating Officer, and Board member of The Depository Trust Company (DTC) (1999-2003) and President and Board member of the National Securities Clearing Corporation (NSCC) (1999-2003). In addition, Mr. Dirks served as Chief Executive Officer and Board member of the Government Securities Clearing Corporation (2001-2003), Chief Executive Officer and Board member of the Mortgage-Backed Securities Clearing Corporation (2001-2003), as a Trustee and a member of the Finance Committee of Manhattan College (2005-2008), and as a Trustee and a member of the Finance Committee of AHRC of Nassau County (2006-2008). Currently, Mr. Dirks serves as a member of the Board of Directors for The Brookville Center for Children's Services, Inc. (2009-present).
Alan J. Lacy (55)
Year of Election or Appointment: 2008
Mr. Lacy serves as Senior Adviser (2007-present) of Oak Hill Capital Partners, L.P. (a private equity firm). Mr. Lacy also served as Chief Executive Officer (2000-2005) and Vice Chairman (2005-2006) of Sears Holdings Corporation and Sears, Roebuck and Co. (retail). In addition, Mr. Lacy serves as a member of the Board of Directors of The Western Union Company (global money transfer, 2006-present) and Bristol-Myers Squibb (global pharmaceuticals, 2007-present). Mr. Lacy is a Trustee of the National Parks Conservation Association and The Field Museum of Natural History.
Ned C. Lautenbach (64)
Year of Election or Appointment: 2000
Mr. Lautenbach is Chairman of the Independent Trustees (2006-present). Mr. Lautenbach is an Advisory Partner of Clayton, Dubilier & Rice, Inc. (private equity investment firm). Previously, Mr. Lautenbach was with the International Business Machines Corporation (IBM) from 1968 until his retirement in 1998. Mr. Lautenbach serves as a Director of Eaton Corporation (diversified industrial) as well as the Philharmonic Center for the Arts in Naples, Florida. He also is a member of the Board of Trustees of Fairfield University (2005-present), as well as a member of the Council on Foreign Relations. Previously, Mr. Lautenbach served as a Director of Sony Corporation (2006-2007).
Joseph Mauriello (64)
Year of Election or Appointment: 2008
Prior to his retirement in January 2006, Mr. Mauriello served in numerous senior management positions including Deputy Chairman and Chief Operating Officer (2004-2005), and Vice Chairman of Financial Services (2002-2004) of KPMG LLP US (professional services firm, 1965-2005). Mr. Mauriello currently serves as a member of the Board of Directors of XL Capital Ltd. (global insurance and re-insurance company, 2006-present) and of Arcadia Resources Inc. (health care services and products, 2007-present). He also served as a Director of the Hamilton Funds of the Bank of New York (2006-2007).
Cornelia M. Small (64)
Year of Election or Appointment: 2005
Ms. Small is a member of the Investment Committee, and Chair (2008-present) and a member of the Board of Trustees of Smith College. Ms. Small also serves on the Investment Committee of the Berkshire Taconic Community Foundation (2008-present). Previously, Ms. Small served as Chairperson of the Investment Committee (2002-2008) of Smith College and as Co-Chair (2000- 2003) of the Annual Fund for the Fletcher School of Law and Diplomacy. In addition, she served as Chief Investment Officer, Director of Global Equity Investments, and a member of the Board of Directors of Scudder, Stevens & Clark and Scudder Kemper Investments.
William S. Stavropoulos (69)
Year of Election or Appointment: 2001
Mr. Stavropoulos is Chairman Emeritus of the Board of Directors of The Dow Chemical Company, where he previously served in numerous senior management positions, including President (1993-2000; 2002-2003), CEO (1995-2000; 2002-2004), Chairman of the Executive Committee (2000-2006), and as a member of the Board of Directors (1990-2006). Currently, he is a Director of Teradata Corporation (data warehousing and technology solutions, 2008-present), Chemical Financial Corporation, Maersk Inc. (industrial conglomerate), Tyco International, Inc. (multinational manufacturing and services, 2007-present), and a member of the Advisory Board for Metalmark Capital (private equity investment firm, 2005-present). He is a special advisor to Clayton, Dubilier & Rice, Inc. (private equity investment). In addition, Mr. Stavropoulos is a member of the University of Notre Dame Advisory Council for the College of Science.
David M. Thomas (59)
Year of Election or Appointment: 2008
Previously, Mr. Thomas served as Executive Chairman (2005-2006) and Chairman and Chief Executive Officer (2000-2005) of IMS Health, Inc. (pharmaceutical and healthcare information solutions). In addition, Mr. Thomas serves as a member of the Board of Directors of Fortune Brands, Inc. (consumer products holding company), and Interpublic Group of Companies, Inc. (marketing communication, 2004-present).
Michael E. Wiley (58)
Year of Election or Appointment: 2008
Mr. Wiley also serves as a member of the Board of Trustees of the University of Tulsa (2000-2006; 2007-present). He serves as a Director of Tesoro Corporation (independent oil refiner and marketer, 2005-present), and a Director of Bill Barrett Corporation (exploration and production company, 2005-present). In addition, he also serves as a Director of Post Oak Bank (privately-held bank, 2004-present). Previously, Mr. Wiley served as a Sr. Energy Advisor of Katzenbach Partners, LLC (consulting firm, 2006- 2007), as an Advisory Director of Riverstone Holdings (private investment firm), Chairman, President, and CEO of Baker Hughes, Inc. (oilfield services company, 2000-2004), and as Director of Spinnaker Exploration Company (exploration and production company, 2001-2005).
Annual Report
Trustees and Officers - continued
Advisory Board Member and Executive Officers**:
Correspondence intended for each executive officer and Mr. Lynch may be sent to Fidelity Investments, 82 Devonshire Street, Boston, Massachusetts 02109.
Name, Age; Principal Occupation
Peter S. Lynch (64)
Year of Election or Appointment: 2003
Member of the Advisory Board of Fidelity's Equity and High Income Funds. Mr. Lynch is Vice Chairman and a Director of FMR, and Vice Chairman (2001-present) and a Director of FMR Co., Inc. Previously, Mr. Lynch served as a Trustee of the Fidelity funds (1990-2003). In addition, he serves as a Trustee of Boston College and as the Chairman of the Inner-City Scholarship Fund. Previously, Mr. Lynch served on the Special Olympics International Board of Directors (1997-2006).
Kenneth B. Robins (39)
Year of Election or Appointment: 2008
President and Treasurer of Fidelity's Equity and High Income Funds. Mr. Robins is an employee of Fidelity Investments (2004- present). Before joining Fidelity Investments, Mr. Robins worked at KPMG LLP, where he was a partner in KPMG's department of professional practice (2002-2004).
Brian B. Hogan (44)
Year of Election or Appointment: 2007
Vice President of Sector Funds. Mr. Hogan also serves as Senior Vice President, Equity Research of FMR. Previously, Mr. Hogan served as a portfolio manager.
Scott C. Goebel (40)
Year of Election or Appointment: 2008
Secretary and Chief Legal Officer (CLO) of the Fidelity funds. Mr. Goebel also serves as General Counsel, Secretary, and Senior Vice President of FMR (2008-present); Deputy General Counsel of FMR LLC; Chief Legal Secretary of Fidelity Management & Research (Hong Kong) Limited (2008-present) and Assistant Secretary of Fidelity Management & Research (Japan) Inc. (2008- present). Previously, Mr. Goebel served as Assistant Secretary of the Funds (2007-2008) and as Vice President and Secretary of Fidelity Distributors Corporation (FDC) (2005-2007).
John B. McGinty, Jr. (46)
Year of Election or Appointment: 2008
Assistant Secretary of Fidelity's Equity and High Income Funds. Mr. McGinty is an employee of Fidelity Investments (2004-present). Mr. McGinty also serves as Senior Vice President, Secretary, and Chief Legal Officer of Fidelity Distributors Corporation (FDC) (2007-present). Before joining Fidelity Investments, Mr. McGinty practiced law at Ropes & Gray, LLP.
Holly C. Laurent (54)
Year of Election or Appointment: 2008
Anti-Money Laundering (AML) Officer of the Fidelity funds. Ms. Laurent is an employee of Fidelity Investments. Previously, Ms. Laurent was Senior Vice President and Head of Legal for Fidelity Business Services India Pvt. Ltd. (2006-2008), Senior Vice President, Deputy General Counsel and Group Head for FMR LLC (2005-2006).
Christine Reynolds (50)
Year of Election or Appointment: 2008
Chief Financial Officer of the Fidelity funds. Ms. Reynolds became President of Fidelity Pricing and Cash Management Services (FPCMS) in August 2008. She served as Chief Operating Officer of FPCMS from 2007 through July 2008. Previously, Ms. Reynolds served as President, Treasurer, and Anti-Money Laundering officer of the Fidelity funds (2004-2007). Before joining Fidelity Investments, Ms. Reynolds worked at PricewaterhouseCoopers LLP (PwC) (1980-2002), where she was an audit partner with PwC's investment management practice.
Kenneth A. Rathgeber (61)
Year of Election or Appointment: 2004
Chief Compliance Officer of Fidelity's Equity and High Income Funds. Mr. Rathgeber is Chief Compliance Officer of Fidelity Management & Research (Hong Kong) Limited (2008-present), Fidelity Management & Research (Japan) Inc. (2008-present), FMR (2005-present), FMR Co., Inc. (2005-present), Fidelity Management & Research (U.K.) Inc. (2005-present), Fidelity Research & Analysis Company (2005-present), Fidelity Investments Money Management, Inc. (2005-present), and Strategic Advisers, Inc. (2005-present).
Bryan A. Mehrmann (47)
Year of Election or Appointment: 2005
Deputy Treasurer of the Fidelity funds. Mr. Mehrmann is an employee of Fidelity Investments. Previously, Mr. Mehrmann served as Vice President of Fidelity Investments Institutional Services Group (FIIS)/Fidelity Investments Institutional Operations Company, Inc. (FIIOC) Client Services (1998-2004).
Adrien E. Deberghes (41)
Year of Election or Appointment: 2008
Deputy Treasurer of Fidelity's Equity and High Income Funds. Mr. Deberghes is an employee of Fidelity Investments (2008-present). Previously, Mr. Deberghes served as Senior Vice President of Mutual Fund Administration at State Street Corporation (2007-2008), Senior Director of Mutual Fund Administration at Investors Bank & Trust (2005-2007), and Director of Finance for Dunkin' Brands (2000-2005).
Robert G. Byrnes (42)
Year of Election or Appointment: 2005
Assistant Treasurer of the Fidelity funds. Mr. Byrnes is an employee of Fidelity Investments (2005-present). Previously, Mr. Byrnes served as Vice President of Fidelity Pricing and Cash Management Services (FPCMS) (2003-2005). Before joining Fidelity Investments, Mr. Byrnes worked at Deutsche Asset Management where he served as Vice President of the Investment Operations Group (2000-2003).
Paul M. Murphy (61)
Year of Election or Appointment: 2007
Assistant Treasurer of the Fidelity funds. Mr. Murphy is an employee of Fidelity Investments (2007-present). Previously, Mr. Murphy served as Chief Financial Officer of the Fidelity Funds (2005-2006), Vice President and Associate General Counsel of FMR (2007), and Senior Vice President of Fidelity Pricing and Cash Management Services (FPCMS) (1994-2007).
Gary W. Ryan (50)
Year of Election or Appointment: 2005
Assistant Treasurer of the Fidelity funds. Mr. Ryan is an employee of Fidelity Investments. Previously, Mr. Ryan served as Vice President of Fund Reporting in Fidelity Pricing and Cash Management Services (FPCMS) (1999-2005).
** FMR Corp. merged with and into FMR LLC on October 1, 2007. Any references to FMR LLC for prior periods are deemed to be references to the prior entity.
Initial Class and Investors Class each designate 100% of each dividends distributed in December 2008, during the fiscal year as qualifying for the dividends-received deduction for corporate shareholders.
The fund will notify shareholders in January 2009 of amounts for use in preparing 2008 income tax returns.
A special meeting of the fund's shareholders was held on May 14, 2008. The results of votes taken among shareholders on the proposals before them are reported below. Each vote reported represents one dollar of net asset value held on the record date for the meeting.
PROPOSAL 1
To elect a Board of Trustees.A
# of Votes
% of Votes
James C. Curvey
Affirmative
82,890,712.47
95.991
Withheld
3,461,988.43
4.009
TOTAL
86,352,700.90
100.000
Dennis J. Dirks
Affirmative
82,970,372.75
96.083
Withheld
3,382,328.15
3.917
TOTAL
86,352,700.90
100.000
Edward C. Johnson 3d
Affirmative
82,689,162.78
95.757
Withheld
3,663,538.12
4.243
TOTAL
86,352,700.90
100.000
Alan J. Lacy
Affirmative
83,041,222.35
96.165
Withheld
3,311,478.55
3.835
TOTAL
86,352,700.90
100.000
Ned C. Lautenbach
Affirmative
82,983,853.72
96.099
Withheld
3,368,847.18
3.901
TOTAL
86,352,700.90
100.000
Joseph Mauriello
Affirmative
83,138,122.14
96.277
Withheld
3,214,578.76
3.723
TOTAL
86,352,700.90
100.000
Cornelia M. Small
Affirmative
83,095,438.06
96.228
Withheld
3,257,262.84
3.772
TOTAL
86,352,700.90
100.000
William S. Stavropoulos
Affirmative
82,929,113.95
96.035
Withheld
3,423,586.95
3.965
TOTAL
86,352,700.90
100.000
David M. Thomas
Affirmative
83,095,487.87
96.228
Withheld
3,257,213.03
3.772
TOTAL
86,352,700.90
100.000
Michael E. Wiley
Affirmative
83,048,523.75
96.174
Withheld
3,304,177.15
3.826
TOTAL
86,352,700.90
100.000
PROPOSAL 2
To amend the Declaration of Trust to reduce the required quorum for future shareholder meetings.A
# of Votes
% of Votes
Affirmative
74,393,635.26
86.151
Against
8,745,543.59
10.128
Abstain
3,213,522.05
3.721
TOTAL
86,352,700.90
100.000
ADenotes trust-wide proposal and voting results.
Annual Report
BoardApproval of Investment Advisory Contracts and Management Fees
VIP Telecommunications Portfolio
Each year, typically in July, the Board of Trustees, including the Independent Trustees (together, the Board), votes on the renewal of the management contract and sub-advisory agreements (together, the Advisory Contracts) for the fund. The Board, assisted by the advice of fund counsel and Independent Trustees' counsel, requests and considers a broad range of information throughout the year.
The Board meets regularly and, acting directly and through its separate committees, requests and receives information concerning, and considers at each of its meetings factors that are relevant to, its annual consideration of the renewal of the fund's Advisory Contracts, including the services and support provided to the fund and its shareholders. At the time of the renewal, the Board had 12 standing committees, each composed of Independent Trustees with varying backgrounds, to which the Board has assigned specific subject matter responsibilities in order to enhance effective decision-making by the Board. Each committee has a written charter outlining the structure and purposes of the committee. The Board also meets as needed to consider matters specifically related to the Board's annual consideration of the renewal of Advisory Contracts.
At its July 2008 meeting, the Board of Trustees, including the Independent Trustees, unanimously determined to renew the fund's Advisory Contracts. In reaching its determination, the Board considered all factors it believed relevant, including (i) the nature, extent, and quality of the services to be provided to the fund and its shareholders (including the investment performance of the fund); (ii) the competitiveness of the fund's management fee and total expenses; (iii) the total costs of the services to be provided by and the profits to be realized by Fidelity from its relationship with the fund; (iv) the extent to which economies of scale would be realized as the fund grows; and (v) whether fee levels reflect these economies of scale, if any, for the benefit of fund shareholders. The Board also approved amendments to the fund's agreements with foreign sub-advisers to clarify that each sub-adviser provides services as an independent contractor, as well as additional amendments to the fund's agreement with Fidelity Management & Research (U.K.) Inc. The Board further approved agreements with foreign sub-advisers Fidelity Management & Research (Japan) Inc. and Fidelity Management & Research (Hong Kong) Limited.
In considering whether to renew the Advisory Contracts for the fund, the Board ultimately reached a determination, with the assistance of fund counsel and Independent Trustees' counsel and through the exercise of its business judgment, that the renewal of the Advisory Contracts and the compensation to be received by Fidelity under the management contract is consistent with Fidelity's fiduciary duty under applicable law. The Board's decision to renew the Advisory Contracts was not based on any single factor noted above, but rather was based on a comprehensive consideration of all the information provided to the Board at its meetings throughout the year. The Board, in reaching its determination to renew the Advisory Contracts, is aware that shareholders in the fund have a broad range of investment choices available to them, including a wide choice among mutual funds offered by competitors to Fidelity, and that the fund's shareholders, with the opportunity to review and weigh the disclosure provided by the fund in its prospectus and other public disclosures, have chosen to invest in this fund, managed by Fidelity.
Nature, Extent, and Quality of Services Provided. The Board considered staffing within the investment adviser, FMR, and the sub-advisers (together, the Investment Advisers), including the backgrounds of the fund's investment personnel and the fund's investment objective and discipline. The Independent Trustees also had discussions with senior management of Fidelity's investment operations and investment groups. The Board considered the structure of the portfolio manager compensation program and whether this structure provides appropriate incentives.
Resources Dedicated to Investment Management and Support Services. The Board reviewed the size, education, and experience of the Investment Advisers' investment staff, their use of technology, and the Investment Advisers' approach to recruiting, training, and retaining portfolio managers and other research, advisory, and management personnel. The Board noted that Fidelity's analysts have access to a variety of technological tools that enable them to perform both fundamental and quantitative analysis and to specialize in various disciplines. The Board considered Fidelity's extensive global research capabilities that enable the Investment Advisers to aggregate data from various sources in an effort to produce positive investment results. The Board also considered that Fidelity's portfolio managers and analysts have access to daily portfolio attribution that allows for monitoring of a fund's portfolio, as well as an electronic communication system that provides immediate real-time access to research concerning issuers and credit enhancers.
Shareholder and Administrative Services. The Board considered (i) the nature, extent, quality, and cost of advisory, administrative, distribution, and shareholder services performed by the Investment Advisers and their affiliates under the Advisory Contracts and under separate agreements covering transfer agency, pricing and bookkeeping, and securities lending services for the fund; (ii) the nature and extent of the Investment Advisers' supervision of third party service providers, principally custodians and subcustodians; and (iii) the resources devoted to, and the record of compliance with, the fund's compliance policies and procedures. The Board also reviewed the allocation of fund brokerage, including allocations to brokers affiliated with the Investment Advisers, the use of brokerage commissions to pay fund expenses, and the use of "soft" commission dollars to pay for research services. The Board further considered that Fidelity voluntarily pays for market data out of its own resources.
The Board noted that the growth of fund assets across the complex allows Fidelity to reinvest in the development of services designed to enhance the value or convenience of the Fidelity funds as investment vehicles. These services include 24-hour access to account information and market information through phone representatives and over the Internet, and investor education materials and asset allocation tools.
Annual Report
Investment in a Large Fund Family. The Board considered the benefits to shareholders of investing in a Fidelity fund, including the benefits of investing in a fund that is part of a large family of funds offering a variety of investment disciplines and providing for a large variety of mutual fund investor services. The Board noted that Fidelity has taken a number of actions over the previous year that benefited particular funds, including (i) dedicating additional resources to investment research and to restructure the investment research teams; (ii) contractually agreeing to reduce the management fees on Fidelity's Institutional Money Market Funds and launching Class IV and Institutional Class of certain of these funds; (iii) reducing the transfer agent fees for the Fidelity Select Portfolios and Investor Class of the VIP funds; and (iv) launching Class K of 29 equity funds as a lower-fee class available to certain employer-sponsored retirement plans.
Investment Performance. The Board considered whether the fund has operated within its investment objective, as well as its record of compliance with its investment restrictions. The Board noted that it is not possible to evaluate performance in any comprehensive fashion because the fund had been in operation for less than one calendar year. Once the fund has been in operation for at least one calendar year, the Board will review the fund's absolute investment performance for each class, as well as the fund's relative investment performance for each class measured against a third-party-sponsored index that reflects the market sector in which the fund invests.
The Board considered that FMR has taken steps to refocus and strengthen equity research, equity portfolio management, and compliance.
Based on its review, and giving particular weight to the nature and quality of the resources dedicated by the Investment Advisers to maintain and improve relative performance, the Board concluded that the nature, extent, and quality of the services provided to the fund will benefit the fund's shareholders, particularly in light of the Board's view that the fund's shareholders benefit from investing in a fund that is part of a large family of funds offering a variety of investment disciplines and services.
Competitiveness of Management Fee and Total Fund Expenses. The Board considered the fund's management fee and total expenses compared to "mapped groups" of competitive funds and classes. Fidelity creates "mapped groups" by combining similar Lipper investment objective categories that have comparable management fee characteristics. Combining Lipper investment objective categories aids the Board's management fee and total expense comparisons by broadening the competitive group used for comparison and by reducing the number of universes to which various Fidelity funds are compared. The Board also considered supplemental information about how the fund's management fee and total expenses ranked relative to groups based on Lipper classifications, which take into account a fund's market capitalization and style.
The Board considered two proprietary management fee comparisons for the period of the fund's operations shown in the chart below. The group of Lipper funds used by the Board for management fee comparisons is referred to below as the "Total Mapped Group." The Total Mapped Group comparison focuses on a fund's standing relative to the total universe of comparable funds available to investors, in terms of gross management fees before expense reimbursements or caps. "TMG %" represents the percentage of funds in the Total Mapped Group that had management fees that were lower than the fund's. For example, a TMG % of 4% means that 96% of the funds in the Total Mapped Group had higher management fees than the fund. The "Asset-Size Peer Group" (ASPG) comparison focuses on a fund's standing relative to non-Fidelity funds similar in size to the fund within the Total Mapped Group. The ASPG represents at least 15% of the funds in the Total Mapped Group with comparable asset size and management fee characteristics, subject to a minimum of 50 funds (or all funds in the Total Mapped Group if fewer than 50). Additional information, such as the ASPG quartile in which the fund's management fee ranked, is also included in the chart and considered by the Board.
VIP Telecommunications Portfolio
Annual Report
Board Approval of Investment Advisory Contracts and Management Fees - continued
The Board noted that the fund's management fee ranked below the median of its Total Mapped Group and below the median of its ASPG for the period.
Based on its review, the Board concluded that the fund's management fee was fair and reasonable in light of the services that the fund receives and the other factors considered.
In its review of each class's total expenses, the Board considered the fund's management fee as well as other fund or class expenses, as applicable, such as transfer agent fees, pricing and bookkeeping fees, and custodial, legal, and audit fees. The Board also noted the effects of any waivers and reimbursements on fees and expenses. As part of its review, the Board also considered current and historical total expenses of each class of the fund compared to competitive fund median expenses. Each class of the fund is compared to those funds and classes in the Total Mapped Group (used by the Board for management fee comparisons) that have a similar sales load structure.
The Board noted that the total expenses of Initial Class ranked below its competitive median for the period, and the total expenses of Investor Class ranked above its competitive median for the period. The Board considered that the total expenses of Investor Class were above the median primarily due to its higher transfer agent fee. The Board noted that the fund offers multiple classes and that the multiple structures are intended to offer pricing options for the intermediary market. The Board also noted that the total expenses of the classes vary primarily due to differences in transfer agent fees.
In its review of total expenses, the Board also considered Fidelity fee structures and other information on clients that FMR and its affiliates service in other competitive markets, such as other mutual funds advised or subadvised by FMR or its affiliates, pension plan clients, and other institutional clients.
Based on its review, the Board concluded that the total expenses of each class of the fund were reasonable, although in one case above the median of the universe presented for comparison, in light of the services that the fund and its shareholders receive and the other factors considered.
Costs of the Services and Profitability. The Board considered the revenues earned and the expenses incurred by Fidelity in conducting the business of developing, marketing, distributing, managing, administering and servicing the fund and its shareholders. The Board also considered the level of Fidelity's profits in respect of all the Fidelity funds.
On an annual basis, FMR presents to the Board Fidelity's profitability for the fund. Fidelity calculates the profitability for each fund, as well as aggregate profitability for groups of Fidelity funds and all Fidelity funds, using a series of detailed revenue and cost allocation methodologies which originate with the audited books and records of Fidelity. The Audit Committee of the Board reviews any significant changes from the prior year's methodologies.
PricewaterhouseCoopers LLP (PwC), independent registered public accounting firm and auditor to Fidelity and certain Fidelity funds, has been engaged annually by the Board as part of the Board's assessment of the results of Fidelity's profitability analysis. PwC's engagement includes the review and assessment of Fidelity's methodologies used in determining the revenues and expenses attributable to Fidelity's mutual fund business, and completion of agreed-upon procedures surrounding the mathematical accuracy of fund profitability and its conformity to allocation methodologies. After considering PwC's reports issued under the engagement and information provided by Fidelity, the Board believes that while other allocation methods may also be reasonable, Fidelity's profitability methodologies are reasonable in all material respects.
The Board has also reviewed Fidelity's non-fund businesses and any fall-out benefits related to the mutual fund business as well as cases where Fidelity's affiliates may benefit from or be related to the fund's business.
The Board considered the costs of the services provided by and the profits realized by Fidelity in connection with the operation of the fund and determined that the amount of profit is a fair entrepreneurial profit for the management of the fund.
Economies of Scale. The Board considered whether there have been economies of scale in respect of the management of the Fidelity funds, whether the Fidelity funds (including the fund) have appropriately benefited from any such economies of scale, and whether there is potential for realization of any further economies of scale. The Board considered the extent to which the fund will benefit from economies of scale through increased services to the fund, through waivers or reimbursements, or through fee or expense reductions.
The Board recognized that the fund's management contract incorporates a "group fee" structure, which provides for lower group fee rates as total fund assets under FMR's management increase, and for higher group fee rates as total fund assets under FMR's management decrease. FMR determines the group fee rates based on a tiered asset "breakpoint" schedule. The Board considered that the group fee is designed to deliver the benefits of economies of scale to fund shareholders when total fund assets increase, even if assets of any particular fund are unchanged or have declined, because some portion of Fidelity's costs are attributable to services provided to all Fidelity funds, and all funds benefit if those costs can be allocated among more assets. The Board concluded that, given the group fee structure, fund shareholders will achieve a certain level of economies of scale as assets under FMR's management increase at the fund complex level, regardless of whether Fidelity achieves any such economies of scale.
The Board further concluded that any potential economies of scale are being shared between fund shareholders and Fidelity in an appropriate manner.
Additional Information Requested by the Board. In order to develop fully the factual basis for consideration of the Fidelity funds' Advisory Contracts, the Board requested and received additional information on certain topics, including (i) fund performance trends and actions to be taken by FMR to improve certain funds' overall performance; (ii) portfolio manager changes that have occurred during the past year; (iii) Fidelity's fund profitability methodology, the profitability of certain fund service providers, and profitability trends for certain funds; (iv) Fidelity's compensation structure for portfolio managers and key personnel, including its effects on fund profitability and the extent to which portfolio manager compensation is linked to fund performance; (v) Fidelity's fee structures and rationale for recommending different fees among categories of funds; and (vi) Fidelity's rationale for recommending which funds should have a performance adjustment component as part of their management fees.
Annual Report
Based on its evaluation of all of the conclusions noted above, and after considering all material factors, the Board ultimately concluded that the advisory fee structures are fair and reasonable, and that the fund's Advisory Contracts should be renewed.
Annual Report
Investment Adviser
Fidelity Management & Research Company Boston, MA
Investment Sub-Advisers
FMR Co., Inc.
Fidelity Management & Research (U.K.) Inc.
Fidelity Research & Analysis Company
Fidelity Investments Japan Limited
FIL Investment Advisors
FIL Investment Advisors (U.K.) Ltd.
Fidelity Management & Research (Hong Kong) Limited
Fidelity Management & Research (Japan) Inc.
General Distributor
Fidelity Distributors Corporation Boston, MA
Transfer and Service Agents
Fidelity Investments Institutional Operations Company, Inc. Boston, MA
Fidelity Service Company, Inc. Boston, MA
Custodian
State Street Bank and Trust Company Quincy, MA
VTELP-ANN-0209
1.851004.101
Fidelity® Variable Insurance Products:
Utilities Portfolio
Annual Report
December 31, 2008 (2_fidelity_logos) (Registered_Trademark)
To view a fund's proxy voting guidelines and proxy voting record for the 12-month period ended June 30, visit http://www.fidelity.com (search for "proxy voting guidelines") or visit the Securities and Exchange Commission's (SEC) web site at http://www.sec.gov. You may also call 1-877-208-0098 to request a free copy of the proxy voting guidelines.
Fidelity Variable Insurance Products are separate account options which are purchased through a variable insurance contract.
Standard & Poor's, S&P and S&P 500 are registered service marks of The McGraw-Hill Companies, Inc. and have been licensed for use by Fidelity Distributors Corporation.
Other third party marks appearing herein are the property of their respective owners.
All other marks appearing herein are registered or unregistered trademarks or service marks of FMR LLC or an affiliated company.
This report and the financial statements contained herein are submitted for the general information of the shareholders of the fund. This report is not authorized for distribution to prospective investors in the fund unless preceded or accompanied by an effective prospectus.
A fund files its complete schedule of portfolio holdings with the SEC for the first and third quarters of each fiscal year on Form N-Q. Forms N-Q are available on the SEC's web site at http://www.sec.gov. A fund's Forms N-Q may be reviewed and copied at the SEC's Public Reference Room in Washington, DC. Information regarding the operation of the SEC's Public Reference Room may be obtained by calling 1-800-SEC-0330. For a complete list of the fund's portfolio holdings, view the most recent holdings listing, semiannual report, or annual report on Fidelity's web site at http://www.fidelity.com or http://www.advisor.fidelity.com, as applicable.
NOT FDIC INSURED · MAY LOSE VALUE · NO BANK GUARANTEE
Neither the fund nor Fidelity Distributors Corporation is a bank.
Average annual total return reflects the change in the value of an investment, assuming reinvestment of the class' dividend income and capital gains (the profits earned upon the sale of securities that have grown in value, if any) and assuming a constant rate of performance each year. During periods of reimbursement by Fidelity, a fund's total return will be greater than it would be had the reimbursement not occurred. Performance numbers are net of all underlying fund operating expenses, but do not include any insurance charges imposed by your insurance company's separate account. If performance information included the effect of these additional charges, the total returns would have been lower. How a fund did yesterday is no guarantee of how it will do tomorrow.
Average Annual Total Returns
Periods ended December 31, 2008
Past 1 year
Past 5 years
Life of fund A
VIP Utilities - Initial Class C
-35.61%
6.93%
0.84%
VIP Utilities - Investor ClassB,C
-35.65%
6.84%
0.78%
AFrom July 19, 2001.
BThe initial offering of Investor Class shares took place on July 21, 2005. Returns prior to July 21, 2005 are those of Initial Class. If Investor Class's transfer agent fee had been reflected, returns prior to July 21, 2005 would have been lower.
CPrior to October 1, 2006, VIP Utilities operated under certain different investment policies. The historical performance for the fund may not represent its current investment policies.
$10,000 Over Life of Fund
Let's say hypothetically that $10,000 was invested in VIP Utilities Portfolio - Initial Class on July 19, 2001, when the fund started. The chart shows how the value of your investment would have changed, and also shows how the Standard & Poor's 500SM Index (S&P 500®) performed over the same period.
Comments from Douglas Simmons, Portfolio Manager of VIP Utilities Portfolio
By year-end 2008, the vicious credit crisis sparked in the U.S. had spread like wildfire across the world's capital markets, stunting global growth, toppling commodity prices, changing the face of the global financial system, and chasing risk-averse investors toward the sidelines. The U.S. equity markets, as measured by the Dow Jones Industrial AverageSM and Standard & Poor's 500SM Index, fell hard as a result, declining 31.93% and 37.00%, respectively, while the technology-laden NASDAQ Composite® Index slid 40.03%. Foreign market stocks saw an even sharper decline, as illustrated by the 43.28% loss of the MSCI® EAFE® Index (Europe, Australasia, Far East), a gauge of developed stock markets outside the U.S. and Canada. A generally stronger U.S. dollar also held back returns for U.S. investors in foreign equities. Emerging-markets stocks - the global performance leader only a year ago - fell harder still, dropping 53.18%, as measured by the MSCI Emerging Markets Index. The only clear winners during the past year were assets backed by the U.S. government, as investors fled from risk. Thus, the Barclays Capital U.S. Treasury Bond Index climbed 13.74% for the year, while the Barclays Capital U.S. Aggregate Bond Index - a broader measure of the U.S. investment-grade bond universe - gained a more modest 5.24%. By contrast, high-yield bonds bore the brunt of investors' increasing wariness over risk, as expressed by the Merrill Lynch® U.S. High Yield Master II Constrained Index's drop of 26.11%. The emerging-markets bond category also felt the shock of investors' risk-averse sentiment, with the JPMorgan Emerging Markets Bond Index (EMBI) Global falling 10.91%. Meanwhile, the Citigroup® Non-U.S. Group of 7 Index - representing the debt performance of major global economies, excluding the United States - eked out a 1.69% gain.
For the year ending December 31, 2008, the fund significantly underperformed the -27.99% return of the MSCI®US Investable Market Utilities Index but modestly outperformed the S&P 500®. (For specific portfolio results, please refer to the performance section of this report.) Unfavorable security selection among electric utilities, multi-utilities, and gas utilities detracted versus the MSCI index, as did modestly overweighting the independent power/energy traders area and underweighting multi-utilities. More-successful stock selection in the oil/gas storage/transport group modestly boosted relative performance, as did an out-of-benchmark position in electronic equipment/instruments. Detractors included not owning Atlanta-based electric utility and index heavyweight Southern Company; an investment in Constellation Energy, an independent power producer located in Maryland; Pennsylvania-based electric utilities Allegheny Energy and PPL; New Jersey-based independent power producer NRG Energy; underweighting multi-utility Dominion Resources, located in Virginia; and Teco Energy, a multi-utility in Florida. Contributions came from an out-of-benchmark position in oil and gas storage and transport company Spectra Energy, located in Houston; underweighting another Houston-based firm, independent power producer Dynegy; overweighting Kansas-based electric utility Westar Energy; and timely ownership of multi-utility CenterPoint Energy, also headquartered in Houston. Some securities mentioned in this report were not held at period end.
The views expressed above reflect those of the portfolio manager(s) only through the end of the period as stated on the cover of this report and do not necessarily represent the views of Fidelity or any other person in the Fidelity organization. Any such views are subject to change at any time based upon market or other conditions and Fidelity disclaims any responsibility to update such views. These views may not be relied on as investment advice and, because investment decisions for a Fidelity fund are based on numerous factors, may not be relied on as an indication of trading intent on behalf of any Fidelity fund.
As a shareholder of the Fund, you incur two types of costs: (1) transaction costs, including redemption fees, and (2) ongoing costs, including management fees and other Fund expenses. This Example is intended to help you understand your ongoing costs (in dollars) of investing in the Fund and to compare these costs with the ongoing costs of investing in other mutual funds.
The Example is based on an investment of $1,000 invested at the beginning of the period and held for the entire period (July 1, 2008 to December 31, 2008).
Actual Expenses
The first line of the accompanying table for each class of the Fund provides information about actual account values and actual expenses. You may use the information in this line, together with the amount you invested, to estimate the expenses that you paid over the period. Simply divide your account value by $1,000.00 (for example, an $8,600 account value divided by $1,000.00 = 8.6), then multiply the result by the number in the first line for a class of the Fund under the heading entitled "Expenses Paid During Period" to estimate the expenses you paid on your account during this period. The estimate of expenses does not include any fees or other expenses of any variable annuity or variable life insurance product. If they were, the estimate of expenses you paid during the period would be higher, and your ending account value would be lower. In addition, the Fund, as a shareholder in the underlying Fidelity Central Funds, will indirectly bear its pro rata share of the fees and expenses incurred by the underlying Fidelity Central Funds. These fees and expenses are not included in the Fund's annualized expense ratio used to calculate the expense estimate in the table below.
Hypothetical Example for Comparison Purposes
The second line of the accompanying table for each class of the Fund provides information about hypothetical account values and hypothetical expenses based on a Class' actual expense ratio and an assumed rate of return of 5% per year before expenses, which is not the Class' actual return. The hypothetical account values and expenses may not be used to estimate the actual ending account balance or expenses you paid for the period. You may use this information to compare the ongoing costs of investing in the Fund and other funds. To do so, compare this 5% hypothetical example with the 5% hypothetical examples that appear in the shareholder reports of the other funds. The estimate of expenses does not include any fees or other expenses of any variable annuity or variable life insurance product. If they were, the estimate of expenses you paid during the period would be higher, and your ending account value would be lower. In addition, the Fund, as a shareholder in the underlying Fidelity Central Funds, will indirectly bear its pro rata share of the fees and expenses incurred by the underlying Fidelity Central Funds. These fees and expenses are not included in the Fund's annualized expense ratio used to calculate the expense estimate in the table below.
Please note that the expenses shown in the table are meant to highlight your ongoing costs only and do not reflect any transaction costs. Therefore, the second line of the table is useful in comparing ongoing costs only, and will not help you determine the relative total costs of owning different funds. In addition, if these transactional costs were included, your costs would have been higher.
Annualized Expense Ratio
Beginning Account Value July 1, 2008
Ending Account Value December 31, 2008
Expenses Paid During Period* July 1, 2008 to December 31, 2008
Initial Class
.76%
Actual
$ 1,000.00
$ 661.60
$ 3.17
Hypothetical A
$ 1,000.00
$ 1,021.32
$ 3.86
Investor Class
.86%
Actual
$ 1,000.00
$ 661.70
$ 3.59
Hypothetical A
$ 1,000.00
$ 1,020.81
$ 4.37
A 5% return per year before expenses
* Expenses are equal to each Class' annualized expense ratio, multiplied by the average account value over the period, multiplied by 184/366 (to reflect the one-half year period).
Annual Report
Investment Changes (Unaudited)
Top Ten Stocks as of December 31, 2008
% of fund's net assets
% of fund's net assets 6 months ago
Exelon Corp.
11.2
12.9
Entergy Corp.
7.0
6.7
American Electric Power Co., Inc.
6.0
4.0
Public Service Enterprise Group, Inc.
5.8
5.9
FirstEnergy Corp.
5.7
4.9
FPL Group, Inc.
5.4
7.6
Dominion Resources, Inc.
4.8
2.2
Edison International
4.4
4.2
Duke Energy Corp.
4.3
0.0
Sempra Energy
4.3
4.8
58.9
Top Industries (% of fund's net assets)
As of December 31, 2008
Electric Utilities
63.3%
Multi-utilities
24.2%
Independent Power Producers & Energy Traders
5.0%
Gas Utilities
2.4%
Diversified Financial Services
0.4%
All Others*
4.7%
As of June 30, 2008
Electric Utilities
58.4%
Multi-utilities
16.6%
Independent Power Producers & Energy Traders
16.4%
Gas Utilities
5.3%
Oil, Gas & Consumable Fuels
0.7%
All Others*
2.6%
* Includes short-term investments and net other assets.
Prior period industry classifications reflect the categories in place as of the date indicated and have not been adjusted to reflect current industry classifications.
Annual Report
Investments December 31, 2008
Showing Percentage of Net Assets
Common Stocks - 95.3%
Shares
Value
DIVERSIFIED FINANCIAL SERVICES - 0.4%
Other Diversifed Financial Services - 0.4%
Hicks Acquisition Co. I, Inc. unit (a)
20,200
$ 180,184
ELECTRIC UTILITIES - 63.3%
Electric Utilities - 63.3%
Allegheny Energy, Inc.
43,800
1,483,068
American Electric Power Co., Inc.
90,800
3,021,824
DPL, Inc.
61,800
1,411,512
Duke Energy Corp.
145,300
2,180,953
Edison International
68,600
2,203,432
Entergy Corp.
42,600
3,541,338
Exelon Corp.
101,000
5,616,609
FirstEnergy Corp.
58,601
2,846,837
FPL Group, Inc.
54,000
2,717,820
Northeast Utilities
61,500
1,479,690
NV Energy, Inc.
115,600
1,143,284
Pepco Holdings, Inc.
28,200
500,832
Portland General Electric Co.
15,989
311,306
PPL Corp.
44,335
1,360,641
Progress Energy, Inc.
50,800
2,024,380
31,843,526
GAS UTILITIES - 2.4%
Gas Utilities - 2.4%
AGL Resources, Inc.
7,400
231,990
Atmos Energy Corp.
10,900
258,330
Questar Corp.
22,000
719,180
1,209,500
INDEPENDENT POWER PRODUCERS & ENERGY TRADERS - 5.0%
Independent Power Producers & Energy Traders - 5.0%
AES Corp. (a)
80,150
660,436
Constellation Energy Group, Inc.
21,400
536,926
Dynegy, Inc. Class A (a)
61,600
123,200
Shares
Value
Mirant Corp. (a)
24,700
$ 466,089
NRG Energy, Inc. (a)
31,900
744,227
2,530,878
MULTI-UTILITIES - 24.2%
Multi-Utilities - 24.2%
Ameren Corp.
23,510
781,943
CMS Energy Corp.
33,900
342,729
Dominion Resources, Inc.
67,200
2,408,448
NiSource, Inc.
34,600
379,562
OGE Energy Corp.
15,300
394,434
PG&E Corp.
37,945
1,468,851
Public Service Enterprise Group, Inc.
100,200
2,922,834
Puget Energy, Inc.
16,180
441,229
Sempra Energy
50,600
2,157,078
Wisconsin Energy Corp.
20,200
847,996
12,145,104
TOTAL COMMON STOCKS
(Cost $54,589,473)
47,909,192
Money Market Funds - 4.6%
Fidelity Cash Central Fund, 1.06% (b) (Cost $2,334,394)
2,334,394
2,334,394
TOTAL INVESTMENT PORTFOLIO - 99.9%
(Cost $56,923,867)
50,243,586
NET OTHER ASSETS - 0.1%
34,455
NET ASSETS - 100%
$ 50,278,041
Legend
(a) Non-income producing
(b) Affiliated fund that is available only to investment companies and other accounts managed by Fidelity Investments. The rate quoted is the annualized seven-day yield of the fund at period end. A complete unaudited listing of the fund's holdings as of its most recent quarter end is available upon request.
Affiliated Central Funds
Information regarding fiscal year to date income earned by the Fund from investments in Fidelity Central Funds is as follows:
Fund
Income earned
Fidelity Cash Central Fund
$ 42,749
Fidelity Securities Lending Cash Central Fund
15,959
Total
$ 58,708
Other Information
The following is a summary of the inputs used, as of December 31, 2008, involving the Fund's assets carried at value. The inputs or methodology used for valuing securities may not be an indication of the risk associated with investing in those securities. For more information on valuation inputs, and their aggregation into the levels used in the table below, please refer to the Security Valuation section in the accompanying Notes to Financial Statements.
Valuation Inputs at Reporting Date:
Description
Total
Level 1
Level 2
Level 3
Investments in Securities
$ 50,243,586
$ 50,243,586
$ -
$ -
Income Tax Information
At December 31, 2008, the fund had a capital loss carryforward of approximately $3,279,978 all of which will expire on December 31, 2016.
The fund intends to elect to defer to its fiscal year ending December 31, 2009 approximately $1,820,843 of losses recognized during the period November 1, 2008 to December 31, 2008.
See accompanying notes which are an integral part of the financial statements.
Investment in securities, at value - See accompanying schedule:
Unaffiliated issuers (cost $54,589,473)
$ 47,909,192
Fidelity Central Funds (cost $2,334,394)
2,334,394
Total Investments (cost $56,923,867)
$ 50,243,586
Receivable for investments sold
29,994
Receivable for fund shares sold
38,587
Dividends receivable
73,141
Distributions receivable from Fidelity Central Funds
1,128
Prepaid expenses
606
Other receivables
16,261
Total assets
50,403,303
Liabilities
Payable for investments purchased
$ 45,166
Payable for fund shares redeemed
15,943
Accrued management fee
22,997
Other affiliated payables
5,497
Other payables and accrued expenses
35,659
Total liabilities
125,262
Net Assets
$ 50,278,041
Net Assets consist of:
Paid in capital
$ 65,078,727
Accumulated undistributed net realized gain (loss) on investments and foreign currency transactions
(8,120,405)
Net unrealized appreciation (depreciation) on investments
(6,680,281)
Net Assets
$ 50,278,041
Statement of Assets and Liabilities - continued
December 31, 2008
Initial Class: Net Asset Value, offering price and redemption price per share ($31,759,652 ÷ 3,899,406 shares)
$ 8.14
Investor Class: Net Asset Value, offering price and redemption price per share ($18,518,389 ÷ 2,280,623 shares)
$ 8.12
See accompanying notes which are an integral part of the financial statements.
Annual Report
Statement of Operations
Year ended December 31, 2008
Investment Income
Dividends
$ 2,115,559
Interest
1,822
Income from Fidelity Central Funds
58,708
Total income
2,176,089
Expenses
Management fee
$ 476,382
Transfer agent fees
91,918
Accounting and security lending fees
33,949
Custodian fees and expenses
10,032
Independent trustees' compensation
419
Audit
39,811
Legal
546
Miscellaneous
8,908
Total expenses before reductions
661,965
Expense reductions
(1,125)
660,840
Net investment income (loss)
1,515,249
Realized and Unrealized Gain (Loss)
Net realized gain (loss) on:
Investment securities:
Unaffiliated issuers
(7,926,278)
Foreign currency transactions
4,004
Total net realized gain (loss)
(7,922,274)
Change in net unrealized appreciation (depreciation) on investment securities
(28,563,857)
Net gain (loss)
(36,486,131)
Net increase (decrease) in net assets resulting from operations
$ (34,970,882)
Statement of Changes in Net Assets
Year ended December 31, 2008
Year ended December 31, 2007
Increase (Decrease) in Net Assets
Operations
Net investment income (loss)
$ 1,515,249
$ 2,144,694
Net realized gain (loss)
(7,922,274)
2,935,331
Change in net unrealized appreciation (depreciation)
(28,563,857)
12,809,570
Net increase (decrease) in net assets resulting from operations
(34,970,882)
17,889,595
Distributions to shareholders from net investment income
(1,542,657)
(2,306,423)
Distributions to shareholders from net realized gain
(278,438)
(2,632,223)
Total distributions
(1,821,095)
(4,938,646)
Share transactions - net increase (decrease)
(39,256,959)
17,247,792
Redemption fees
25,756
60,056
Total increase (decrease) in net assets
(76,023,180)
30,258,797
Net Assets
Beginning of period
126,301,221
96,042,424
End of period
$ 50,278,041
$ 126,301,221
See accompanying notes which are an integral part of the financial statements.
Annual Report
Financial Highlights - Initial Class
Years ended December 31,
2008
2007
2006
2005
2004
Selected Per-Share Data
Net asset value, beginning of period
$ 13.09
$ 11.29
$ 9.53
$ 9.14
$ 7.42
Income from Investment Operations
Net investment income (loss) C
.20
.21
.24
.17
.17 F
Net realized and unrealized gain (loss)
(4.86)
2.12
2.76
.71
1.65
Total from investment operations
(4.66)
2.33
3.00
.88
1.82
Distributions from net investment income
(.26)
(.25)
(.14)
(.19)
(.11)
Distributions from net realized gain
(.03)
(.29)
(1.10)
(.30)
-
Total distributions
(.29)
(.54)
(1.24) J
(.49) I
(.11)
Redemption fees added to paid in capital C
- H
.01
- H
- H
.01
Net asset value, end of period
$ 8.14
$ 13.09
$ 11.29
$ 9.53
$ 9.14
Total Return A, B
(35.61)%
20.67%
31.79%
9.54%
24.61%
Ratios to Average Net Assets D, G
Expenses before reductions
.75%
.73%
.81%
.83%
1.04%
Expenses net of fee waivers, if any
.75%
.73%
.81%
.83%
1.04%
Expenses net of all reductions
.74%
.73%
.80%
.80%
1.00%
Net investment income (loss)
1.81%
1.65%
2.20%
1.81%
2.03%
Supplemental Data
Net assets, end of period (000 omitted)
$ 31,760
$ 84,105
$ 77,153
$ 36,444
$ 38,182
Portfolio turnover rate E
112%
90%
139%
100%
84%
A Total returns do not reflect charges attributable to your insurance company's separate account. Inclusion of these charges would reduce the total returns shown. B Total returns would have been lower had certain expenses not been reduced during the periods shown. C Calculated based on average shares outstanding during the period. D Fees and expenses of the underlying Fidelity Central Funds are not included in the Fund's expense ratio. The Fund indirectly bears its proportionate share of the expenses of any underlying Fidelity Central Funds. E Amount does not include the portfolio activity of any underlying Fidelity Central Funds. F Investment income per share reflects a special dividend which amounted to $.05 per share. G Expense ratios reflect operating expenses of the class. Expenses before reductions do not reflect amounts reimbursed by the investment adviser or reductions from brokerage service arrangements or other expense offset arrangements and do not represent the amount paid by the class during periods when reimbursements or reductions occur. Expenses net of fee waivers reflect expenses after reimbursement by the investment adviser but prior to reductions from brokerage service arrangements or other expense offset arrangements. Expenses net of all reductions represent the net expenses paid by the class. H Amount represents less than $.01 per share. I Total distributions of $.49 per share is comprised of distributions from net investment income of $.193 and distributions from net realized gain of $.295 per share. J Total distributions of $1.24 per share is comprised of distributions from net investment income of $.139 and distributions from net realized gain of $1.105 per share.
Financial Highlights - Investor Class
Years ended December 31,
2008
2007
2006
2005 H
Selected Per-Share Data
Net asset value, beginning of period
$ 13.05
$ 11.26
$ 9.52
$ 9.72
Income from Investment Operations
Net investment income (loss) E
.19
.19
.23
.05
Net realized and unrealized gain (loss)
(4.84)
2.12
2.75
.24
Total from investment operations
(4.65)
2.31
2.98
.29
Distributions from net investment income
(.25)
(.24)
(.13)
(.20)
Distributions from net realized gain
(.03)
(.29)
(1.10)
(.30)
Total distributions
(.28)
(.53)
(1.24) L
(.49) K
Redemption fees added to paid in capital E
- J
.01
- J
- J
Net asset value, end of period
$ 8.12
$ 13.05
$ 11.26
$ 9.52
Total Return B, C, D
(35.65)%
20.53%
31.56%
2.94%
Ratios to Average Net Assets F, I
Expenses before reductions
.84%
.84%
.96%
1.16% A
Expenses net of fee waivers, if any
.84%
.84%
.96%
1.16% A
Expenses net of all reductions
.84%
.84%
.96%
1.12% A
Net investment income (loss)
1.72%
1.53%
2.04%
1.09% A
Supplemental Data
Net assets, end of period (000 omitted)
$ 18,518
$ 42,196
$ 18,889
$ 1,150
Portfolio turnover rate G
112%
90%
139%
100%
A Annualized BTotal returns for periods of less than one year are not annualized. C Total returns do not reflect charges attributable to your insurance company's separate account. Inclusion of these charges would reduce the total returns shown. D Total returns would have been lower had certain expenses not been reduced during the periods shown. E Calculated based on average shares outstanding during the period. F Fees and expenses of the underlying Fidelity Central Funds are not included in the Fund's expense ratio. The Fund indirectly bears its proportionate share of the expenses of any underlying Fidelity Central Funds. G Amount does not include the portfolio activity of any underlying Fidelity Central Funds. H For the period July 21, 2005 (commencement of sale of shares) to December 31, 2005. I Expense ratios reflect operating expenses of the class. Expenses before reductions do not reflect amounts reimbursed by the investment adviser or reductions from brokerage service arrangements or other expense offset arrangements and do not represent the amount paid by the class during periods when reimbursements or reductions occur. Expense ratios before reductions for start-up periods may not be representative of longer-term operating periods. Expenses net of fee waivers reflect expenses after reimbursement by the investment adviser but prior to reductions from brokerage service arrangements or other expense offset arrangements. Expenses net of all reductions represent the net expenses paid by the class. J Amount represents less than $.01 per share. K Total distributions of $.49 per share is comprised of distributions from net investment income of $.196 and distributions from net realized gain of $.295 per share. L Total distributions of $1.24 per share is comprised of distributions from net investment income of $.134 and distributions from net realized gain of $1.105 per share.
See accompanying notes which are an integral part of the financial statements.
VIP Utilities Portfolio (the Fund) is a non-diversified fund of Variable Insurance Products Fund IV (the trust) and is authorized to issue an unlimited number of shares. The trust is registered under the Investment Company Act of 1940, as amended (the 1940 Act), as an open-end management investment company organized as a Massachusetts business trust. Shares of the Fund may only be purchased by insurance companies for the purpose of funding variable annuity or variable life insurance contracts. The Fund offers the following classes of shares: Initial Class shares and Investor Class shares. All classes have equal rights and voting privileges, except for matters affecting a single class. Investment income, realized and unrealized capital gains and losses, the common expenses of the Fund, and certain fund-level expense reductions, if any, are allocated on a pro rata basis to each class based on the relative net assets of each class to the total net assets of the Fund. Each class differs with respect to transfer agent fees incurred. Certain expense reductions also differ by class.
2. Investments in Fidelity Central Funds.
The Fund may invest in Fidelity Central Funds, which are open-end investment companies available only to other investment companies and accounts managed by Fidelity Management & Research Company (FMR) and its affiliates. The Fund's Schedule of Investments lists each of the Fidelity Central Funds held as of period end, if any, as an investment of the Fund, but does not include the underlying holdings of each Fidelity Central Fund. As an Investing Fund, the Fund indirectly bears its proportionate share of the expenses of the underlying Fidelity Central Funds.
The Money Market Central Funds seek preservation of capital and current income and are managed by Fidelity Investments Money Management, Inc. (FIMM), an affiliate of FMR.
A complete unaudited list of holdings for each Fidelity Central Fund is available upon request or at the SEC's web site at www.sec.gov. In addition, the financial statements of the Fidelity Central Funds, which are not covered by the Fund's Report of Independent Registered Public Accounting Firm, are available on the SEC's web site or upon request.
3. Significant Accounting Policies.
The financial statements have been prepared in conformity with accounting principles generally accepted in the United States of America, which require management to make certain estimates and assumptions at the date of the financial statements. Actual results could differ from those estimates. The following summarizes the significant accounting policies of the Fund:
Security Valuation. Investments are valued as of 4:00 p.m. Eastern time on the last calendar day of the period. Wherever possible, the Fund uses independent pricing services approved by the Board of Trustees to value its investments.
Equity securities, including restricted securities, for which market quotations are readily available, are valued at the last reported sale price or official closing price as reported by an independent pricing service on the primary market or exchange on which they are traded. In the event there were no sales during the day or closing prices are not available, securities are valued at the last quoted bid price. Investments in open-end mutual funds, including the Fidelity Central Funds, are valued at their closing net asset value each business day. Short-term securities with remaining maturities of sixty days or less for which quotations are not readily available are valued at amortized cost, which approximates value.
When current market prices or quotations are not readily available or reliable, valuations may be determined in good faith in accordance with procedures adopted by the Board of Trustees. Factors used in determining value may include significant market or security specific events, changes in interest rates and credit quality, and developments in foreign markets which are monitored by evaluating the performance of ADRs, futures contracts and exchange-traded funds. The frequency with which these procedures are used cannot be predicted and may be utilized to a significant extent. The value of securities used for net asset value (NAV) calculation under these procedures may differ from published prices for the same securities.
The Fund is subject to the provisions of Statement of Financial Accounting Standards No. 157, "Fair Value Measurements" (SFAS 157), effective with the beginning of the Fund's fiscal year. SFAS 157 establishes a hierarchy that prioritizes the inputs to valuation techniques giving the highest priority to readily available unadjusted quoted prices in active markets for identical assets (level 1 measurements) and the lowest priority to unobservable inputs (level 3 measurements) when market prices are not readily available or reliable. The three levels of the hierarchy under SFAS 157 are described below:
Level 1
Quoted prices in active markets for identical securities.
Level 2
Prices determined using other significant observable inputs. Observable inputs are inputs that other market participants may use in pricing a security. These may include quoted prices for similar securities, interest rates, prepayment speeds, credit risk and others.
Level 3
Prices determined using significant unobservable inputs. In situations where quoted prices or observable inputs are unavailable or deemed less relevant (for example, when there is little or no market activity for an investment at the end of the period), unobservable inputs may be used. Unobservable inputs reflect the Fund's own assumptions about the factors market participants would use in pricing an investment, and would be based on the best information available.
Changes in valuation techniques may result in transfers in or out of an investment's assigned level within the hierarchy.
The aggregate value by input level, as of December 31, 2008, for the Fund's investments, is included at the end of the Fund's Schedule of Investments.
Annual Report
Notes to Financial Statements - continued
3. Significant Accounting Policies - continued
Foreign Currency. The Fund uses foreign currency contracts to facilitate transactions in foreign-denominated securities. Losses from these transactions may arise from changes in the value of the foreign currency or if the counterparties do not perform under the contracts' terms.
Foreign-denominated assets, including investment securities, and liabilities are translated into U.S. dollars at the exchange rate at period end. Purchases and sales of investment securities, income and dividends received and expenses denominated in foreign currencies are translated into U.S. dollars at the exchange rate in effect on the transaction date.
The effects of exchange rate fluctuations on investments are included with the net realized and unrealized gain (loss) on investment securities. Other foreign currency transactions resulting in realized and unrealized gain (loss) are disclosed separately.
Investment Transactions and Income. For financial reporting purposes, the Fund's investment holdings and NAV include trades executed through the end of the last business day of the period. The NAV per share for processing shareholder transactions is calculated as of the close of business of the New York Stock Exchange (NYSE), normally 4:00 p.m. Eastern time and includes trades executed through the end of the prior business day. Gains and losses on securities sold are determined on the basis of identified cost and may include proceeds received from litigation. Dividend income is recorded on the ex-dividend date, except for certain dividends from foreign securities where the ex-dividend date may have passed, which are recorded as soon as the Fund is informed of the ex-dividend date. Non-cash dividends included in dividend income, if any, are recorded at the fair market value of the securities received. Distributions received on securities that represent a return of capital or capital gain are recorded as a reduction of cost of investments and/or as a realized gain. The Fund estimates the components of distributions received that may be considered return of capital distributions or capital gain distributions. Interest income and distributions from the Fidelity Central Funds are accrued as earned. Interest income includes coupon interest and amortization of premium and accretion of discount on debt securities. Investment income is recorded net of foreign taxes withheld where recovery of such taxes is uncertain.
Expenses. Most expenses of the trust can be directly attributed to a fund. Expenses which cannot be directly attributed are apportioned among each Fund in the trust. Expense estimates are accrued in the period to which they relate and adjustments are made when actual amounts are known.
Income Tax Information and Distributions to Shareholders. Each year, the Fund intends to qualify as a regulated investment company by distributing substantially all of its taxable income and realized gains under Subchapter M of the Internal Revenue Code and filing its U.S. federal tax return. As a result, no provision for income taxes is required. The Fund is subject to the provisions of FASB Interpretation No. 48, Accounting for Uncertainties in Income Taxes (FIN 48). FIN 48 sets forth a minimum threshold for financial statement recognition of the benefit of a tax position taken or expected to be taken in a tax return. There are no unrecognized tax benefits in the accompanying financial statements. A Fund's federal tax return is subject to examination by the Internal Revenue Service (IRS) for a period of three years. Foreign taxes are provided for based on the Fund's understanding of the tax rules and rates that exist in the foreign markets in which it invests.
Distributions are recorded on the ex-dividend date. Income dividends and capital gain distributions are declared separately for each class. Income and capital gain distributions are determined in accordance with income tax regulations, which may differ from generally accepted accounting principles.
Capital accounts within the financial statements are adjusted for permanent book-tax differences. These adjustments have no impact on net assets or the results of operations. Temporary book-tax differences will reverse in a subsequent period.
Book-tax differences are primarily due to foreign currency transactions and losses deferred due to wash sales and excise tax regulations.
The tax-basis components of distributable earnings and the federal tax cost as of period end were as follows:
Unrealized appreciation
$ 1,144,787
Unrealized depreciation
(10,844,653)
Net unrealized appreciation (depreciation)
(9,699,866)
Capital loss carryforward
(3,279,978)
Cost for federal income tax purposes
$ 59,943,452
The tax character of distributions paid was as follows:
December 31, 2008
December 31, 2007
Ordinary Income
$ 1,635,469
$ 3,081,321
Long-term Capital Gains
185,626
1,857,325
Total
$ 1,821,095
$ 4,938,646
Trading (Redemption) Fees. Shares held less than 60 days are subject to a redemption fee equal to 1% of the proceeds of the redeemed shares. All redemption fees, including any estimated redemption fees paid by FMR, are retained by the Fund and accounted for as an addition to paid in capital.
Annual Report
4. Operating Policies.
Repurchase Agreements. FMR has received an Exemptive Order from the Securities and Exchange Commission (the SEC) which permits the Fund and other affiliated entities of FMR to transfer uninvested cash balances into joint trading accounts which are then invested in repurchase agreements. The Fund may also invest directly with institutions in repurchase agreements. Repurchase agreements are collateralized by government or non-government securities. Upon settlement date, collateral is held in segregated accounts with custodian banks and may be obtained in the event of a default of the counterparty. The Fund monitors, on a daily basis, the value of the collateral to ensure it is at least equal to the principal amount of the repurchase agreement (including accrued interest). In the event of a default by the counterparty, realization of the collateral proceeds could be delayed, during which time the value of the collateral may decline.
5. Purchases and Sales of Investments.
Purchases and sales of securities, other than short-term securities, aggregated $94,055,284 and $131,782,243, respectively.
6. Fees and Other Transactions with Affiliates.
Management Fee. FMR and its affiliates provide the Fund with investment management related services for which the Fund pays a monthly management fee. The management fee is the sum of an individual fund fee rate that is based on an annual rate of .30% of the Fund's average net assets and a group fee rate that averaged .26% during the period. The group fee rate is based upon the average net assets of all the mutual funds advised by FMR. The group fee rate decreases as assets under management increase and increases as assets under management decrease. For the period, the total annual management fee rate was .56% of the Fund's average net assets.
Transfer Agent Fees. Fidelity Investments Institutional Operations Company, Inc. (FIIOC), an affiliate of FMR, is the Fund's transfer, dividend disbursing, and shareholder servicing agent. FIIOC receives an asset-based fee with respect to each class. Each class (with the exception of Investor Class) pays a transfer agent fee, excluding out of pocket expenses, equal to an annual rate of .07% of average net assets. Investor Class pays a monthly asset-based transfer agent fee of .15% of average net assets. Prior to February 1, 2008, Investor Class paid a monthly asset-based transfer agent fee of .18% of average net assets. The total transfer agent fees paid by each class to FIIOC, including out of pocket expenses, were as follows:
Initial Class
$ 41,903
Investor Class
50,015
$ 91,918
Accounting and Security Lending Fees. Fidelity Service Company, Inc. (FSC), an affiliate of FMR, maintains the Fund's accounting records. The accounting fee is based on the level of average net assets for the month. Under a separate contract, FSC administers the security lending program. The security lending fee is based on the number and duration of lending transactions.
Brokerage Commissions. The Fund placed a portion of its portfolio transactions with brokerage firms which are affiliates of the investment adviser. The commissions paid to these affiliated firms were $2,694 for the period.
7. Committed Line of Credit.
The Fund participates with other funds managed by FMR in a $4.2 billion credit facility (the "line of credit") to be utilized for temporary or emergency purposes to fund shareholder redemptions or for other short-term liquidity purposes. The Fund has agreed to pay commitment fees on its pro rata portion of the line of credit, which amounted to $202 and is reflected in Miscellaneous Expense on the Statement of Operations. During the period, there were no borrowings on this line of credit.
8. Security Lending.
The Fund lends portfolio securities from time to time in order to earn additional income. On the settlement date of the loan, the Fund receives collateral (in the form of U.S. Treasury obligations, letters of credit and/or cash) against the loaned securities and maintains collateral in an amount not less than 100% of the market value of the loaned securities during the period of the loan. The market value of the loaned securities is determined at the close of business of the Fund and any additional required collateral is delivered to the Fund on the next business day. If the borrower defaults on its obligation to return the securities loaned because of insolvency or other reasons, a fund could experience delays and costs in recovering the securities loaned or in gaining access to the collateral. Any cash collateral received is invested in the Fidelity Securities Lending Cash Central Fund. At period end, there were no security loans outstanding. Security lending income represents the income earned on investing cash collateral, less fees and expenses associated with the loan, plus any premium payments that may be received on the loan of certain types of securities. Security lending income is presented in the Statement of Operations as a component of income from Fidelity Central Funds. Net income from lending portfolio securities during the period amounted to $15,959.
Annual Report
Notes to Financial Statements - continued
9. Expense Reductions.
Many of the brokers with whom FMR places trades on behalf of the Fund provided services to the Fund in addition to trade execution. These services included payments of certain expenses on behalf of the Fund totaling $1,125 for the period.
10. Other.
The Fund's organizational documents provide former and current trustees and officers with a limited indemnification against liabilities arising in connection with the performance of their duties to the Fund. In the normal course of business, the Fund may also enter into contracts that provide general indemnifications. The Fund's maximum exposure under these arrangements is unknown as this would be dependent on future claims that may be made against the Fund. The risk of material loss from such claims is considered remote.
At the end of the period, FMR or its affiliates were the owners of record of 100% of the total outstanding shares of the Fund.
In December 2006, the Independent Trustees, with the assistance of independent counsel, completed an investigation regarding gifts, gratuities and business entertainment provided by certain brokers to certain individuals who were employed on FMR's domestic equity trading desk during the period 2002 to 2004. The Independent Trustees and FMR agreed that, despite the absence of proof that the Fidelity mutual funds experienced diminished execution quality as a result of the improper receipt of gifts and business entertainment, the conduct at issue was serious and was worthy of redress. Accordingly, the Independent Trustees requested, and FMR agreed to make, a payment of $42 million plus accrued interest, which equaled approximately $7.3 million,to certain Fidelity mutual funds.
In March 2008, the Trustees approved a method for allocating this payment among the funds and, in total, FMR paid the fund $3,366, which is recorded in the accompanying Statement of Operations.
In a related administrative order dated March 5, 2008, the U.S. Securities and Exchange Commission ("SEC") announced a settlement with FMR and FMR Co., Inc. (an affiliate of FMR) involving the SEC's regulatory rules for investment advisers and the improper receipt of gifts, gratuities and business entertainment. Without admitting or denying the SEC's findings, FMR agreed to pay an $8 million civil penalty to the United States Treasury.
11. Distributions to Shareholders.
Distributions to shareholders of each class were as follows:
Years ended December 31,
2008
2007
From net investment income
Initial Class
$ 992,400
$ 1,565,772
Investor Class
550,257
740,651
Total
$ 1,542,657
$ 2,306,423
From net realized gain
Initial Class
$ 185,094
$ 1,776,075
Investor Class
93,344
856,148
Total
$ 278,438
$ 2,632,223
12. Share Transactions.
Transactions for each class of shares were as follows:
Shares
Dollars
Years ended December 31,
2008
2007
2008
2007
Initial Class
Shares sold
534,178
4,552,813
$ 5,586,449
$ 58,700,689
Reinvestment of distributions
140,658
253,185
1,177,495
3,341,847
Shares redeemed
(3,198,980)
(5,217,379)
(35,570,008)
(65,354,798)
Net increase (decrease)
(2,524,144)
(411,381)
$ (28,806,064)
$ (3,312,262)
Investor Class
Shares sold
603,317
3,608,070
$ 6,888,002
$ 46,292,465
Reinvestment of distributions
77,430
121,138
643,601
1,596,799
Shares redeemed
(1,633,572)
(2,173,696)
(17,982,498)
(27,329,210)
Net increase (decrease)
(952,825)
1,555,512
$ (10,450,895)
$ 20,560,054
Annual Report
Reportof Independent Registered Public Accounting Firm
To the Trustees of Variable Insurance Products Fund IV and the Shareholders of VIP Utilities Portfolio:
In our opinion, the accompanying statement of assets and liabilities, including the schedule of investments, and the related statements of operations and of changes in net assets and the financial highlights present fairly, in all material respects, the financial position of VIP Utilities Portfolio (a fund of Variable Insurance Products Fund IV) at December 31, 2008, the results of its operations for the year then ended, the changes in its net assets for each of the two years in the period then ended and the financial highlights for each of the periods indicated, in conformity with accounting principles generally accepted in the United States of America. These financial statements and financial highlights (hereafter referred to as "financial statements") are the responsibility of the VIP Utilities Portfolio's management. Our responsibility is to express an opinion on these financial statements based on our audits. We conducted our audits of these financial statements in accordance with the standards of the Public Company Accounting Oversight Board (United States). Those standards require that we plan and perform the audit to obtain reasonable assurance about whether the financial statements are free of material misstatement. An audit includes examining, on a test basis, evidence supporting the amounts and disclosures in the financial statements, assessing the accounting principles used and significant estimates made by management, and evaluating the overall financial statement presentation. We believe that our audits, which included confirmation of securities at December 31, 2008 by correspondence with the custodian and brokers, provide a reasonable basis for our opinion.
The Trustees, Member of the Advisory Board, and executive officers of the trust and fund, as applicable, are listed below. The Board of Trustees governs the fund and is responsible for protecting the interests of shareholders. The Trustees are experienced executives who meet periodically throughout the year to oversee the fund's activities, review contractual arrangements with companies that provide services to the fund, and review the fund's performance. Except for Edward C. Johnson 3d and James C. Curvey, each of the Trustees oversees 222 funds advised by FMR or an affiliate. Messrs. Johnson and Curvey oversee 380 funds advised by FMR or an affiliate.
The Trustees hold office without limit in time except that (a) any Trustee may resign; (b) any Trustee may be removed by written instrument, signed by at least two-thirds of the number of Trustees prior to such removal; (c) any Trustee who requests to be retired or who has become incapacitated by illness or injury may be retired by written instrument signed by a majority of the other Trustees; and (d) any Trustee may be removed at any special meeting of shareholders by a two-thirds vote of the outstanding voting securities of the trust. Each Trustee who is not an interested person (as defined in the 1940 Act) (Independent Trustee), shall retire not later than the last day of the calendar year in which his or her 72nd birthday occurs. The Independent Trustees may waive this mandatory retirement age policy with respect to individual Trustees. The executive officers and Advisory Board Member hold office without limit in time, except that any officer and Advisory Board Member may resign or may be removed by a vote of a majority of the Trustees at any regular meeting or any special meeting of the Trustees. Except as indicated, each individual has held the office shown or other offices in the same company for the past five years.
The fund's Statement of Additional Information (SAI) includes more information about the Trustees. To request a free copy, call Fidelity at 1-877-208-0098.
Interested Trustees*:
Correspondence intended for each Trustee who is an interested person may be sent to Fidelity Investments, 82 Devonshire Street, Boston, Massachusetts 02109.
Name, Age; Principal Occupation
Edward C. Johnson 3d (78)
Year of Election or Appointment: 1983
Mr. Johnson is Chairman of the Board of Trustees. Mr. Johnson serves as Chief Executive Officer, Chairman, and a Director of FMR LLC; Chairman and a Director of FMR; Chairman and a Director of Fidelity Research & Analysis Company (FRAC); Chairman and a Director of Fidelity Investments Money Management, Inc.; and Chairman and a Director of FMR Co., Inc. In addition, Mr. Johnson serves as Chairman and Director of FIL Limited. Previously, Mr. Johnson served as President of FMR LLC (2006-2007).
James C. Curvey (73)
Year of Election or Appointment: 2007
Mr. Curvey also serves as Trustee (2007-present) of other investment companies advised by FMR. Mr. Curvey is a Director of FMR and FMR Co., Inc. (2007-present). Mr. Curvey is also Vice Chairman (2006-present) and Director of FMR LLC. In addition, Mr. Curvey serves as an Overseer for the Boston Symphony Orchestra and a member of the Trustees of Villanova University.
* Trustees have been determined to be "Interested Trustees" by virtue of, among other things, their affiliation with the trust or various entities under common control with FMR. FMR Corp. merged with and into FMR LLC on October 1, 2007. Any references to FMR LLC for prior periods are deemed to be references to the prior entity.
Independent Trustees:
Correspondence intended for each Independent Trustee (that is, the Trustees other than the Interested Trustees) may be sent to Fidelity Investments, P.O. Box 55235, Boston, Massachusetts 02205-5235.
Name, Age; Principal Occupation
Dennis J. Dirks (60)
Year of Election or Appointment: 2005
Prior to his retirement in May 2003, Mr. Dirks was Chief Operating Officer and a member of the Board of The Depository Trust & Clearing Corporation (DTCC) (1999-2003). He also served as President, Chief Operating Officer, and Board member of The Depository Trust Company (DTC) (1999-2003) and President and Board member of the National Securities Clearing Corporation (NSCC) (1999-2003). In addition, Mr. Dirks served as Chief Executive Officer and Board member of the Government Securities Clearing Corporation (2001-2003), Chief Executive Officer and Board member of the Mortgage-Backed Securities Clearing Corporation (2001-2003), as a Trustee and a member of the Finance Committee of Manhattan College (2005-2008), and as a Trustee and a member of the Finance Committee of AHRC of Nassau County (2006-2008). Currently, Mr. Dirks serves as a member of the Board of Directors for The Brookville Center for Children's Services, Inc. (2009-present).
Alan J. Lacy (55)
Year of Election or Appointment: 2008
Mr. Lacy serves as Senior Adviser (2007-present) of Oak Hill Capital Partners, L.P. (a private equity firm). Mr. Lacy also served as Chief Executive Officer (2000-2005) and Vice Chairman (2005-2006) of Sears Holdings Corporation and Sears, Roebuck and Co. (retail). In addition, Mr. Lacy serves as a member of the Board of Directors of The Western Union Company (global money transfer, 2006-present) and Bristol-Myers Squibb (global pharmaceuticals, 2007-present). Mr. Lacy is a Trustee of the National Parks Conservation Association and The Field Museum of Natural History.
Ned C. Lautenbach (64)
Year of Election or Appointment: 2000
Mr. Lautenbach is Chairman of the Independent Trustees (2006-present). Mr. Lautenbach is an Advisory Partner of Clayton, Dubilier & Rice, Inc. (private equity investment firm). Previously, Mr. Lautenbach was with the International Business Machines Corporation (IBM) from 1968 until his retirement in 1998. Mr. Lautenbach serves as a Director of Eaton Corporation (diversified industrial) as well as the Philharmonic Center for the Arts in Naples, Florida. He also is a member of the Board of Trustees of Fairfield University (2005-present), as well as a member of the Council on Foreign Relations. Previously, Mr. Lautenbach served as a Director of Sony Corporation (2006-2007).
Joseph Mauriello (64)
Year of Election or Appointment: 2008
Prior to his retirement in January 2006, Mr. Mauriello served in numerous senior management positions including Deputy Chairman and Chief Operating Officer (2004-2005), and Vice Chairman of Financial Services (2002-2004) of KPMG LLP US (professional services firm, 1965-2005). Mr. Mauriello currently serves as a member of the Board of Directors of XL Capital Ltd. (global insurance and re-insurance company, 2006-present) and of Arcadia Resources Inc. (health care services and products, 2007- present). He also served as a Director of the Hamilton Funds of the Bank of New York (2006-2007).
Cornelia M. Small (64)
Year of Election or Appointment: 2005
Ms. Small is a member of the Investment Committee, and Chair (2008-present) and a member of the Board of Trustees of Smith College. Ms. Small also serves on the Investment Committee of the Berkshire Taconic Community Foundation (2008-present). Previously, Ms. Small served as Chairperson of the Investment Committee (2002-2008) of Smith College and as Co-Chair (2000-2003) of the Annual Fund for the Fletcher School of Law and Diplomacy. In addition, she served as Chief Investment Officer, Director of Global Equity Investments, and a member of the Board of Directors of Scudder, Stevens & Clark and Scudder Kemper Investments.
William S. Stavropoulos (69)
Year of Election or Appointment: 2001
Mr. Stavropoulos is Chairman Emeritus of the Board of Directors of The Dow Chemical Company, where he previously served in numerous senior management positions, including President (1993-2000; 2002-2003), CEO (1995-2000; 2002-2004), Chairman of the Executive Committee (2000-2006), and as a member of the Board of Directors (1990-2006). Currently, he is a Director of Teradata Corporation (data warehousing and technology solutions, 2008-present), Chemical Financial Corporation, Maersk Inc. (industrial conglomerate), Tyco International, Inc. (multinational manufacturing and services, 2007-present), and a member of the Advisory Board for Metalmark Capital (private equity investment firm, 2005-present). He is a special advisor to Clayton, Dubilier & Rice, Inc. (private equity investment). In addition, Mr. Stavropoulos is a member of the University of Notre Dame Advisory Council for the College of Science.
David M. Thomas (59)
Year of Election or Appointment: 2008
Previously, Mr. Thomas served as Executive Chairman (2005-2006) and Chairman and Chief Executive Officer (2000-2005) of IMS Health, Inc. (pharmaceutical and healthcare information solutions). In addition, Mr. Thomas serves as a member of the Board of Directors of Fortune Brands, Inc. (consumer products holding company), and Interpublic Group of Companies, Inc. (marketing communication, 2004-present).
Michael E. Wiley (58)
Year of Election or Appointment: 2008
Mr. Wiley also serves as a member of the Board of Trustees of the University of Tulsa (2000-2006; 2007-present). He serves as a Director of Tesoro Corporation (independent oil refiner and marketer, 2005-present), and a Director of Bill Barrett Corporation (exploration and production company, 2005-present). In addition, he also serves as a Director of Post Oak Bank (privately-held bank, 2004-present). Previously, Mr. Wiley served as a Sr. Energy Advisor of Katzenbach Partners, LLC (consulting firm, 2006-2007), as an Advisory Director of Riverstone Holdings (private investment firm), Chairman, President, and CEO of Baker Hughes, Inc. (oilfield services company, 2000-2004), and as Director of Spinnaker Exploration Company (exploration and production company, 2001-2005).
Annual Report
Trustees and Officers - continued
Advisory Board Member and Executive Officers**:
Correspondence intended for each executive officer and Mr. Lynch may be sent to Fidelity Investments, 82 Devonshire Street, Boston, Massachusetts 02109.
Name, Age; Principal Occupation
Peter S. Lynch (64)
Year of Election or Appointment: 2003
Member of the Advisory Board of Fidelity's Equity and High Income Funds. Mr. Lynch is Vice Chairman and a Director of FMR, and Vice Chairman (2001-present) and a Director of FMR Co., Inc. Previously, Mr. Lynch served as a Trustee of the Fidelity funds (1990-2003). In addition, he serves as a Trustee of Boston College and as the Chairman of the Inner-City Scholarship Fund. Previously, Mr. Lynch served on the Special Olympics International Board of Directors (1997-2006).
Kenneth B. Robins (39)
Year of Election or Appointment: 2008
President and Treasurer of Fidelity's Equity and High Income Funds. Mr. Robins is an employee of Fidelity Investments (2004- present). Before joining Fidelity Investments, Mr. Robins worked at KPMG LLP, where he was a partner in KPMG's department of professional practice (2002-2004).
Brian B. Hogan (44)
Year of Election or Appointment: 2007
Vice President of Sector Funds. Mr. Hogan also serves as Senior Vice President, Equity Research of FMR. Previously, Mr. Hogan served as a portfolio manager.
Scott C. Goebel (40)
Year of Election or Appointment: 2008
Secretary and Chief Legal Officer (CLO) of the Fidelity funds. Mr. Goebel also serves as General Counsel, Secretary, and Senior Vice President of FMR (2008-present); Deputy General Counsel of FMR LLC; Chief Legal Secretary of Fidelity Management & Research (Hong Kong) Limited (2008-present) and Assistant Secretary of Fidelity Management & Research (Japan) Inc. (2008- present). Previously, Mr. Goebel served as Assistant Secretary of the Funds (2007-2008) and as Vice President and Secretary of Fidelity Distributors Corporation (FDC) (2005-2007).
John B. McGinty, Jr. (46)
Year of Election or Appointment: 2008
Assistant Secretary of Fidelity's Equity and High Income Funds. Mr. McGinty is an employee of Fidelity Investments (2004-present). Mr. McGinty also serves as Senior Vice President, Secretary, and Chief Legal Officer of Fidelity Distributors Corporation (FDC) (2007-present). Before joining Fidelity Investments, Mr. McGinty practiced law at Ropes & Gray, LLP.
Holly C. Laurent (54)
Year of Election or Appointment: 2008
Anti-Money Laundering (AML) Officer of the Fidelity funds. Ms. Laurent is an employee of Fidelity Investments. Previously, Ms. Laurent was Senior Vice President and Head of Legal for Fidelity Business Services India Pvt. Ltd. (2006-2008), Senior Vice President, Deputy General Counsel and Group Head for FMR LLC (2005-2006).
Christine Reynolds (50)
Year of Election or Appointment: 2008
Chief Financial Officer of the Fidelity funds. Ms. Reynolds became President of Fidelity Pricing and Cash Management Services (FPCMS) in August 2008. She served as Chief Operating Officer of FPCMS from 2007 through July 2008. Previously, Ms. Reynolds served as President, Treasurer, and Anti-Money Laundering officer of the Fidelity funds (2004-2007). Before joining Fidelity Investments, Ms. Reynolds worked at PricewaterhouseCoopers LLP (PwC) (1980-2002), where she was an audit partner with PwC's investment management practice.
Kenneth A. Rathgeber (61)
Year of Election or Appointment: 2004
Chief Compliance Officer of Fidelity's Equity and High Income Funds. Mr. Rathgeber is Chief Compliance Officer of Fidelity Management & Research (Hong Kong) Limited (2008-present), Fidelity Management & Research (Japan) Inc. (2008-present), FMR (2005-present), FMR Co., Inc. (2005-present), Fidelity Management & Research (U.K.) Inc. (2005-present), Fidelity Research & Analysis Company (2005-present), Fidelity Investments Money Management, Inc. (2005-present), and Strategic Advisers, Inc. (2005-present).
Bryan A. Mehrmann (47)
Year of Election or Appointment: 2005
Deputy Treasurer of the Fidelity funds. Mr. Mehrmann is an employee of Fidelity Investments. Previously, Mr. Mehrmann served as Vice President of Fidelity Investments Institutional Services Group (FIIS)/Fidelity Investments Institutional Operations Company, Inc. (FIIOC) Client Services (1998-2004).
Adrien E. Deberghes (41)
Year of Election or Appointment: 2008
Deputy Treasurer of Fidelity's Equity and High Income Funds. Mr. Deberghes is an employee of Fidelity Investments (2008-present). Previously, Mr. Deberghes served as Senior Vice President of Mutual Fund Administration at State Street Corporation (2007-2008), Senior Director of Mutual Fund Administration at Investors Bank & Trust (2005-2007), and Director of Finance for Dunkin' Brands (2000-2005).
Robert G. Byrnes (42)
Year of Election or Appointment: 2005
Assistant Treasurer of the Fidelity funds. Mr. Byrnes is an employee of Fidelity Investments (2005-present). Previously, Mr. Byrnes served as Vice President of Fidelity Pricing and Cash Management Services (FPCMS) (2003-2005). Before joining Fidelity Investments, Mr. Byrnes worked at Deutsche Asset Management where he served as Vice President of the Investment Operations Group (2000-2003).
Paul M. Murphy (61)
Year of Election or Appointment: 2007
Assistant Treasurer of the Fidelity funds. Mr. Murphy is an employee of Fidelity Investments (2007-present). Previously, Mr. Murphy served as Chief Financial Officer of the Fidelity Funds (2005-2006), Vice President and Associate General Counsel of FMR (2007), and Senior Vice President of Fidelity Pricing and Cash Management Services (FPCMS) (1994-2007).
Gary W. Ryan (50)
Year of Election or Appointment: 2005
Assistant Treasurer of the Fidelity funds. Mr. Ryan is an employee of Fidelity Investments. Previously, Mr. Ryan served as Vice President of Fund Reporting in Fidelity Pricing and Cash Management Services (FPCMS) (1999-2005).
** FMR Corp. merged with and into FMR LLC on October 1, 2007. Any references to FMR LLC for prior periods are deemed to be references to the prior entity.
Initial Class and Investor Class designate 58% and 100% of the dividends distributed in February 2008 and December 2008, respectively, as qualifying for the dividends-received deduction for corporate shareholders.
The fund will notify shareholders in January 2009 of amounts for use in preparing 2008 income tax returns.
A special meeting of the fund's shareholders was held on May 14, 2008. The results of votes taken among shareholders on the proposals before them are reported below. Each vote reported represents one dollar of net asset value held on the record date for the meeting.
PROPOSAL 1
To elect a Board of Trustees.A
# of Votes
% of Votes
James C. Curvey
Affirmative
82,890,712.47
95.991
Withheld
3,461,988.43
4.009
TOTAL
86,352,700.90
100.000
Dennis J. Dirks
Affirmative
82,970,372.75
96.083
Withheld
3,382,328.15
3.917
TOTAL
86,352,700.90
100.000
Edward C. Johnson 3d
Affirmative
82,689,162.78
95.757
Withheld
3,663,538.12
4.243
TOTAL
86,352,700.90
100.000
Alan J. Lacy
Affirmative
83,041,222.35
96.165
Withheld
3,311,478.55
3.835
TOTAL
86,352,700.90
100.000
Ned C. Lautenbach
Affirmative
82,983,853.72
96.099
Withheld
3,368,847.18
3.901
TOTAL
86,352,700.90
100.000
Joseph Mauriello
Affirmative
83,138,122.14
96.277
Withheld
3,214,578.76
3.723
TOTAL
86,352,700.90
100.000
Cornelia M. Small
Affirmative
83,095,438.06
96.228
Withheld
3,257,262.84
3.772
TOTAL
86,352,700.90
100.000
William S. Stavropoulos
Affirmative
82,929,113.95
96.035
Withheld
3,423,586.95
3.965
TOTAL
86,352,700.90
100.000
David M. Thomas
Affirmative
83,095,487.87
96.228
Withheld
3,257,213.03
3.772
TOTAL
86,352,700.90
100.000
Michael E. Wiley
Affirmative
83,048,523.75
96.174
Withheld
3,304,177.15
3.826
TOTAL
86,352,700.90
100.000
PROPOSAL 2
To amend the Declaration of Trust to reduce the required quorum for future shareholder meetings.A
# of Votes
% of Votes
Affirmative
74,393,635.26
86.151
Against
8,745,543.59
10.128
Abstain
3,213,522.05
3.721
TOTAL
86,352,700.90
100.000
ADenotes trust-wide proposal and voting results.
Annual Report
BoardApproval of Investment Advisory Contracts and Management Fees
VIP Utilities Portfolio
Each year, typically in July, the Board of Trustees, including the Independent Trustees (together, the Board), votes on the renewal of the management contract and sub-advisory agreements (together, the Advisory Contracts) for the fund. The Board, assisted by the advice of fund counsel and Independent Trustees' counsel, requests and considers a broad range of information throughout the year.
The Board meets regularly and, acting directly and through its separate committees, requests and receives information concerning, and considers at each of its meetings factors that are relevant to, its annual consideration of the renewal of the fund's Advisory Contracts, including the services and support provided to the fund and its shareholders. At the time of the renewal, the Board had 12 standing committees, each composed of Independent Trustees with varying backgrounds, to which the Board has assigned specific subject matter responsibilities in order to enhance effective decision-making by the Board. Each committee has a written charter outlining the structure and purposes of the committee. The Board also meets as needed to consider matters specifically related to the Board's annual consideration of the renewal of Advisory Contracts.
At its July 2008 meeting, the Board of Trustees, including the Independent Trustees, unanimously determined to renew the fund's Advisory Contracts. In reaching its determination, the Board considered all factors it believed relevant, including (i) the nature, extent, and quality of the services to be provided to the fund and its shareholders (including the investment performance of the fund); (ii) the competitiveness of the fund's management fee and total expenses; (iii) the total costs of the services to be provided by and the profits to be realized by Fidelity from its relationship with the fund; (iv) the extent to which economies of scale would be realized as the fund grows; and (v) whether fee levels reflect these economies of scale, if any, for the benefit of fund shareholders. The Board also approved agreements with foreign sub-advisers Fidelity Management & Research (Japan) Inc. and Fidelity Management & Research (Hong Kong) Limited, as well as amendments to the fund's agreement with Fidelity Management & Research (U.K.) Inc.
In considering whether to renew the Advisory Contracts for the fund, the Board ultimately reached a determination, with the assistance of fund counsel and Independent Trustees' counsel and through the exercise of its business judgment, that the renewal of the Advisory Contracts and the compensation to be received by Fidelity under the management contract is consistent with Fidelity's fiduciary duty under applicable law. The Board's decision to renew the Advisory Contracts was not based on any single factor noted above, but rather was based on a comprehensive consideration of all the information provided to the Board at its meetings throughout the year. The Board, in reaching its determination to renew the Advisory Contracts, is aware that shareholders in the fund have a broad range of investment choices available to them, including a wide choice among mutual funds offered by competitors to Fidelity, and that the fund's shareholders, with the opportunity to review and weigh the disclosure provided by the fund in its prospectus and other public disclosures, have chosen to invest in this fund, managed by Fidelity.
Nature, Extent, and Quality of Services Provided. The Board considered staffing within the investment adviser, FMR, and the sub-advisers (together, the Investment Advisers), including the backgrounds of the fund's investment personnel and the fund's investment objective and discipline. The Independent Trustees also had discussions with senior management of Fidelity's investment operations and investment groups. The Board considered the structure of the portfolio manager compensation program and whether this structure provides appropriate incentives.
Resources Dedicated to Investment Management and Support Services. The Board reviewed the size, education, and experience of the Investment Advisers' investment staff, their use of technology, and the Investment Advisers' approach to recruiting, training, and retaining portfolio managers and other research, advisory, and management personnel. The Board noted that Fidelity's analysts have access to a variety of technological tools that enable them to perform both fundamental and quantitative analysis and to specialize in various disciplines. The Board considered Fidelity's extensive global research capabilities that enable the Investment Advisers to aggregate data from various sources in an effort to produce positive investment results. The Board also considered that Fidelity's portfolio managers and analysts have access to daily portfolio attribution that allows for monitoring of a fund's portfolio, as well as an electronic communication system that provides immediate real-time access to research concerning issuers and credit enhancers.
Shareholder and Administrative Services. The Board considered (i) the nature, extent, quality, and cost of advisory, administrative, distribution, and shareholder services performed by the Investment Advisers and their affiliates under the Advisory Contracts and under separate agreements covering transfer agency, pricing and bookkeeping, and securities lending services for the fund; (ii) the nature and extent of the Investment Advisers' supervision of third party service providers, principally custodians and subcustodians; and (iii) the resources devoted to, and the record of compliance with, the fund's compliance policies and procedures. The Board also reviewed the allocation of fund brokerage, including allocations to brokers affiliated with the Investment Advisers, the use of brokerage commissions to pay fund expenses, and the use of "soft" commission dollars to pay for research services. The Board further considered that Fidelity voluntarily pays for market data out of its own resources.
The Board noted that the growth of fund assets across the complex allows Fidelity to reinvest in the development of services designed to enhance the value or convenience of the Fidelity funds as investment vehicles. These services include 24-hour access to account information and market information through phone representatives and over the Internet, and investor education materials and asset allocation tools.
Investment in a Large Fund Family. The Board considered the benefits to shareholders of investing in a Fidelity fund, including the benefits of investing in a fund that is part of a large family of funds offering a variety of investment disciplines and providing for a large variety of mutual fund investor services. The Board noted that Fidelity has taken a number of actions over the previous year that benefited particular funds, including (i) dedicating additional resources to investment research and to restructure the investment research teams; (ii) contractually agreeing to reduce the management fees on Fidelity's Institutional Money Market Funds and launching Class IV and Institutional Class of certain of these funds; (iii) reducing the transfer agent fees for the Fidelity Select Portfolios and Investor Class of the VIP funds; and (iv) launching Class K of 29 equity funds as a lower-fee class available to certain employer-sponsored retirement plans.
Annual Report
Investment Performance. The Board considered whether the fund has operated within its investment objective, as well as its record of compliance with its investment restrictions. It also reviewed the fund's absolute investment performance for each class, as well as the fund's relative investment performance for each class measured against a third-party-sponsored index that reflects the market sector in which the fund invests over multiple periods. The Board noted that FMR does not believe that a meaningful peer group exists against which to compare the fund's performance. The following charts considered by the Board show, over the one-, three-, and five-year periods ended December 31, 2007, as available, the cumulative total returns of Initial Class and Investor Class of the fund and the cumulative total returns of a third-party-sponsored index ("benchmark").
VIP Utilities Portfolio
The Board stated that the investment performance of Initial Class of the fund compared favorably to its benchmark for all the periods shown. The Board considered that the variations in performance between the fund's classes reflect the variations in class expenses, which result in lower performance for the higher expense class.
The Board considered that FMR has taken steps to refocus and strengthen equity research, equity portfolio management, and compliance.
Based on its review, and giving particular weight to the nature and quality of the resources dedicated by the Investment Advisers to maintain and improve relative performance, the Board concluded that the nature, extent, and quality of the services provided to the fund will benefit the fund's shareholders, particularly in light of the Board's view that the fund's shareholders benefit from investing in a fund that is part of a large family of funds offering a variety of investment disciplines and services.
Competitiveness of Management Fee and Total Fund Expenses. The Board considered the fund's management fee and total expenses compared to "mapped groups" of competitive funds and classes. Fidelity creates "mapped groups" by combining similar Lipper investment objective categories that have comparable management fee characteristics. Combining Lipper investment objective categories aids the Board's management fee and total expense comparisons by broadening the competitive group used for comparison and by reducing the number of universes to which various Fidelity funds are compared. The Board also considered supplemental information about how the fund's management fee and total expenses ranked relative to groups based on Lipper classifications, which take into account a fund's market capitalization and style.
The Board considered two proprietary management fee comparisons for the 12-month periods shown in the chart below. The group of Lipper funds used by the Board for management fee comparisons is referred to below as the "Total Mapped Group." The Total Mapped Group comparison focuses on a fund's standing relative to the total universe of comparable funds available to investors, in terms of gross management fees before expense reimbursements or caps. "TMG %" represents the percentage of funds in the Total Mapped Group that had management fees that were lower than the fund's. For example, a TMG % of 4% means that 96% of the funds in the Total Mapped Group had higher management fees than the fund. The "Asset-Size Peer Group" (ASPG) comparison focuses on a fund's standing relative to non-Fidelity funds similar in size to the fund within the Total Mapped Group. The ASPG represents at least 15% of the funds in the Total Mapped Group with comparable asset size and management fee characteristics, subject to a minimum of 50 funds (or all funds in the Total Mapped Group if fewer than 50). Additional information, such as the ASPG quartile in which the fund's management fee ranked, is also included in the chart and considered by the Board.
Annual Report
Board Approval of Investment Advisory Contracts and Management Fees - continued
VIP Utilities Portfolio
The Board noted that the fund's management fee ranked below the median of its Total Mapped Group and below the median of its ASPG for 2007.
Based on its review, the Board concluded that the fund's management fee was fair and reasonable in light of the services that the fund receives and the other factors considered.
In its review of each class's total expenses, the Board considered the fund's management fee as well as other fund or class expenses, as applicable, such as transfer agent fees, pricing and bookkeeping fees, and custodial, legal, and audit fees. The Board also noted the effects of any waivers and reimbursements on fees and expenses. As part of its review, the Board also considered current and historical total expenses of each class of the fund compared to competitive fund median expenses. Each class of the fund is compared to those funds and classes in the Total Mapped Group (used by the Board for management fee comparisons) that have a similar sales load structure.
The Board noted that the total expenses of each class ranked below its competitive median for 2007.
In its review of total expenses, the Board also considered Fidelity fee structures and other information on clients that FMR and its affiliates service in other competitive markets, such as other mutual funds advised or subadvised by FMR or its affiliates, pension plan clients, and other institutional clients.
Based on its review, the Board concluded that the total expenses of each class of the fund were reasonable in light of the services that the fund and its shareholders receive and the other factors considered.
Costs of the Services and Profitability. The Board considered the revenues earned and the expenses incurred by Fidelity in conducting the business of developing, marketing, distributing, managing, administering and servicing the fund and its shareholders. The Board also considered the level of Fidelity's profits in respect of all the Fidelity funds.
On an annual basis, FMR presents to the Board Fidelity's profitability for the fund. Fidelity calculates the profitability for each fund, as well as aggregate profitability for groups of Fidelity funds and all Fidelity funds, using a series of detailed revenue and cost allocation methodologies which originate with the audited books and records of Fidelity. The Audit Committee of the Board reviews any significant changes from the prior year's methodologies.
PricewaterhouseCoopers LLP (PwC), independent registered public accounting firm and auditor to Fidelity and certain Fidelity funds, has been engaged annually by the Board as part of the Board's assessment of the results of Fidelity's profitability analysis. PwC's engagement includes the review and assessment of Fidelity's methodologies used in determining the revenues and expenses attributable to Fidelity's mutual fund business, and completion of agreed-upon procedures surrounding the mathematical accuracy of fund profitability and its conformity to allocation methodologies. After considering PwC's reports issued under the engagement and information provided by Fidelity, the Board believes that while other allocation methods may also be reasonable, Fidelity's profitability methodologies are reasonable in all material respects.
The Board has also reviewed Fidelity's non-fund businesses and any fall-out benefits related to the mutual fund business as well as cases where Fidelity's affiliates may benefit from or be related to the fund's business.
Annual Report
The Board considered the costs of the services provided by and the profits realized by Fidelity in connection with the operation of the fund and determined that the amount of profit is a fair entrepreneurial profit for the management of the fund.
Economies of Scale. The Board considered whether there have been economies of scale in respect of the management of the Fidelity funds, whether the Fidelity funds (including the fund) have appropriately benefited from any such economies of scale, and whether there is potential for realization of any further economies of scale. The Board considered the extent to which the fund will benefit from economies of scale through increased services to the fund, through waivers or reimbursements, or through fee or expense reductions.
The Board recognized that the fund's management contract incorporates a "group fee" structure, which provides for lower group fee rates as total fund assets under FMR's management increase, and for higher group fee rates as total fund assets under FMR's management decrease. FMR determines the group fee rates based on a tiered asset "breakpoint" schedule. The Board considered that the group fee is designed to deliver the benefits of economies of scale to fund shareholders when total fund assets increase, even if assets of any particular fund are unchanged or have declined, because some portion of Fidelity's costs are attributable to services provided to all Fidelity funds, and all funds benefit if those costs can be allocated among more assets. The Board concluded that, given the group fee structure, fund shareholders will achieve a certain level of economies of scale as assets under FMR's management increase at the fund complex level, regardless of whether Fidelity achieves any such economies of scale.
The Board further concluded that any potential economies of scale are being shared between fund shareholders and Fidelity in an appropriate manner.
Additional Information Requested by the Board. In order to develop fully the factual basis for consideration of the Fidelity funds' Advisory Contracts, the Board requested and received additional information on certain topics, including (i) fund performance trends and actions to be taken by FMR to improve certain funds' overall performance; (ii) portfolio manager changes that have occurred during the past year; (iii) Fidelity's fund profitability methodology, the profitability of certain fund service providers, and profitability trends for certain funds; (iv) Fidelity's compensation structure for portfolio managers and key personnel, including its effects on fund profitability and the extent to which portfolio manager compensation is linked to fund performance; (v) Fidelity's fee structures and rationale for recommending different fees among categories of funds; and (vi) Fidelity's rationale for recommending which funds should have a performance adjustment component as part of their management fees.
Based on its evaluation of all of the conclusions noted above, and after considering all material factors, the Board ultimately concluded that the advisory fee structures are fair and reasonable, and that the fund's Advisory Contracts should be renewed.
Annual Report
Investment Adviser
Fidelity Management & Research Company Boston, MA
Investment Sub-Advisers
FMR Co., Inc.
Fidelity Management & Research (U.K.) Inc.
Fidelity Research & Analysis Company
Fidelity Investments Japan Limited
FIL Investment Advisors
FIL Investment Advisors (U.K.) Ltd.
Fidelity Management & Research (Hong Kong) Limited
Fidelity Management & Research (Japan) Inc.
General Distributor
Fidelity Distributors Corporation Boston, MA
Transfer and Service Agents
Fidelity Investments Institutional Operations Company, Inc. Boston, MA
Fidelity Service Company, Inc. Boston, MA
Custodian
JPMorgan Chase Bank New York, NY
VTELIC-ANN-0209
1.817391.103
Fidelity® Variable Insurance Products: Value Leaders Portfolio
Annual Report
December 31, 2008 (2_fidelity_logos) (Registered_Trademark)
To view a fund's proxy voting guidelines and proxy voting record for the 12-month period ended June 30, visit http://www.fidelity.com (search for "proxy voting guidelines") or visit the Securities and Exchange Commission's (SEC) web site at http://www.sec.gov. You may also call 1-877-208-0098 to request a free copy of the proxy voting guidelines.
Fidelity Variable Insurance Products are separate account options which are purchased through a variable insurance contract.
Standard & Poor's, S&P and S&P 500 are registered service marks of The McGraw-Hill Companies, Inc. and have been licensed for use by Fidelity Distributors Corporation.
Other third party marks appearing herein are the property of their respective owners.
All other marks appearing herein are registered or unregistered trademarks or service marks of FMR Corp. or an affiliated company.
This report and the financial statements contained herein are submitted for the general information of the shareholders of the fund. This report is not authorized for distribution to prospective investors in the fund unless preceded or accompanied by an effective prospectus.
A fund files its complete schedule of portfolio holdings with the SEC for the first and third quarters of each fiscal year on Form N-Q. Forms N-Q are available on the SEC's web site at http://www.sec.gov. A fund's Forms N-Q may be reviewed and copied at the SEC's Public Reference Room in Washington, DC. Information regarding the operation of the SEC's Public Reference Room may be obtained by calling 1-800-SEC-0330. For a complete list of a fund's portfolio holdings, view the most recent holdings listing, semiannual report, or annual report on Fidelity's web site at http://www.fidelity.com or http://www.advisor.fidelity.com, as applicable.
NOT FDIC INSURED · MAY LOSE VALUE · NO BANK GUARANTEE
Neither the fund nor Fidelity Distributors Corporation is a bank.
Average annual total return reflects the change in the value of an investment, assuming reinvestment of the class' dividend income and capital gains (the profits earned upon the sale of securities that have grown in value, if any) and assuming a constant rate of performance each year. During periods of reimbursement by Fidelity, a fund's total return will be greater than it would be had the reimbursement not occurred. Performance numbers are net of all underlying fund operating expenses, but do not include any insurance charges imposed by your insurance company's separate account. If performance information included the effect of these additional charges, the total returns would have been lower. How a fund did yesterday is no guarantee of how it will do tomorrow.
Average Annual Total Returns
Periods ended December 31, 2008
Past 1 year
Past 5 years
Life of fund A
VIP® Value Leaders - Initial Class
-44.61%
-3.28%
-0.88%
VIP Value Leaders - Service Class B
-44.69%
-3.37%
-0.98%
VIP Value Leaders - Service Class 2 C
-44.77%
-3.53%
-1.14%
VIP Value Leaders - Investor Class D
-44.67%
-3.35%
-0.94%
AFrom June 17, 2003.
BPerformance of Service Class shares reflects an asset-based service fee (12b-1 fee).
CPerformance of Service Class 2 shares reflects an asset-based service fee (12b-1 fee).
DThe initial offering of Investor Class shares took place on July 21, 2005. Returns prior to July 21, 2005 are those of Initial Class. If Investor Class's transfer agent fee had been reflected, returns prior to July 21, 2005 would have been lower.
$10,000 Over Life of Fund
Let's say hypothetically that $10,000 was invested in VIP Value Leaders Portfolio - Initial Class on June 17, 2003, when the fund started. The chart shows how the value of your investment would have changed, and also shows how the Russell 1000® Value Index performed over the same period.
Comments from Charles Hebard, Portfolio Manager of VIP Value Leaders Portfolio
By year-end 2008, the vicious credit crisis sparked in the U.S. had spread like wildfire across the world's capital markets, stunting global growth, toppling commodity prices, changing the face of the global financial system and chasing risk-averse investors toward the sidelines. The U.S. equity markets, as measured by the Dow Jones Industrial AverageSM and Standard & Poor's 500SM Index, fell hard as a result, declining 31.93% and 37.00%, respectively, while the technology-laden NASDAQ Composite® Index slid 40.03%. Foreign market stocks saw an even sharper decline, as illustrated by the 43.28% loss of the MSCI® EAFE® Index (Europe, Australasia, Far East), a gauge of developed stock markets outside the U.S. and Canada. A generally stronger U.S. dollar also held back returns for U.S. investors in foreign equities. Emerging-markets stocks - the global performance leader only a year ago - fell harder still, dropping 53.18%, as measured by the MSCI Emerging Markets Index. The only clear winners during the past year were assets backed by the U.S. government, as investors fled from risk. Thus, the Barclays Capital U.S. Treasury Bond Index climbed 13.74% for the year, while the Barclays Capital U.S. Aggregate Bond Index - a broader measure of the U.S. investment-grade bond universe - gained a more modest 5.24%. By contrast, high-yield bonds bore the brunt of investors' increasing wariness over risk, as expressed by the Merrill Lynch® U.S. High Yield Master II Constrained Index's drop of 26.11%. The emerging-markets bond category also felt the shock of investors' risk-averse sentiment, with the JPMorgan Emerging Markets Bond Index (EMBI) Global falling 10.91%. Meanwhile, the Citigroup® Non-U.S. Group of 7 Index - representing the debt performance of major global economies, excluding the United States - eked out a 1.69% gain.
For the 12-month period ending December 31, 2008, the fund significantly underperformed its benchmark, the Russell 1000® Value Index, which returned -36.85%. (For specific portfolio results, please refer to the performance section of this report.) I misjudged how deep and severe the economic slowdown would become, and that misjudgment led to some poor stock picking on my part - particularly in financials, energy and utilities, which were the fund's worst-performing sectors during the period relative to the index. Top individual detractors included financial companies that didn't survive the credit crisis, such as investment company Lehman Brothers and banking firm Wachovia, or were transformed by it, such as insurer American International Group (AIG). Underweighting Exxon Mobil and Chevron, two large oil companies whose stocks declined less than the overall index, also detracted. By period end, the fund no longer owned AIG or Lehman. On the positive side, underweighting Citigroup and General Electric and avoiding Sprint Nextel - three index components that performed poorly - aided relative results. Citigroup's share price was weighed down by significant credit losses. Problems in its industrial and financial services businesses hurt industrial conglomerate General Electric. Sprint's stock was crushed by investor concerns about its ability to compete and the level of debt on its balance sheet. A modest cash position during part of the period also aided fund performance in a declining market.
The views expressed above reflect those of the portfolio manager(s) only through the end of the period as stated on the cover of this report and do not necessarily represent the views of Fidelity or any other person in the Fidelity organization. Any such views are subject to change at any time based upon market or other conditions and Fidelity disclaims any responsibility to update such views. These views may not be relied on as investment advice and, because investment decisions for a Fidelity fund are based on numerous factors, may not be relied on as an indication of trading intent on behalf of any Fidelity fund.
As a shareholder of the Fund, you incur two types of costs: (1) transaction costs, and (2) ongoing costs, including management fees, distribution and/or service (12b-1) fees and other Fund expenses. This Example is intended to help you understand your ongoing costs (in dollars) of investing in the Fund and to compare these costs with the ongoing costs of investing in other mutual funds.
The Example is based on an investment of $1,000 invested at the beginning of the period and held for the entire period (July 1, 2008 to December 31, 2008).
Actual Expenses
The first line of the accompanying table for each class of the Fund provides information about actual account values and actual expenses. You may use the information in this line, together with the amount you invested, to estimate the expenses that you paid over the period. Simply divide your account value by $1,000.00 (for example, an $8,600 account value divided by $1,000.00 = 8.6), then multiply the result by the number in the first line for a class of the Fund under the heading entitled "Expenses Paid During Period" to estimate the expenses you paid on your account during this period. The estimate of expenses does not include any fees or other expenses of any variable annuity or variable life insurance product. If they were, the estimate of expenses you paid during the period would be higher, and your ending account value would be lower. In addition, the Fund, as a shareholder in the underlying Fidelity Central Funds, will indirectly bear its pro rata share of the fees and expenses incurred by the underlying Fidelity Central Funds. These fees and expenses are not included in the Fund's annualized expense ratio used to calculate the expense estimate in the table below.
Hypothetical Example for Comparison Purposes
The second line of the accompanying table for each class of the Fund provides information about hypothetical account values and hypothetical expenses based on a Class' actual expense ratio and an assumed rate of return of 5% per year before expenses, which is not the Class' actual return. The hypothetical account values and expenses may not be used to estimate the actual ending account balance or expenses you paid for the period. You may use this information to compare the ongoing costs of investing in the Fund and other funds. To do so, compare this 5% hypothetical example with the 5% hypothetical examples that appear in the shareholder reports of the other funds. The estimate of expenses does not include any fees or other expenses of any variable annuity or variable life insurance product. If they were, the estimate of expenses you paid during the period would be higher, and your ending account value would be lower. In addition, the Fund, as a shareholder in the underlying Fidelity Central Funds, will indirectly bear its pro rata share of the fees and expenses incurred by the underlying Fidelity Central Funds. These fees and expenses are not included in the Fund's annualized expense ratio used to calculate the expense estimate in the table below.
Please note that the expenses shown in the table are meant to highlight your ongoing costs only and do not reflect any transaction costs. Therefore, the second line of the table is useful in comparing ongoing costs only, and will not help you determine the relative total costs of owning different funds.
Annualized Expense Ratio
Beginning Account Value July 1, 2008
Ending Account Value December 31, 2008
Expenses Paid During Period* July 1, 2008 to December 31, 2008
Initial Class
.83%
Actual
$ 1,000.00
$ 652.10
$ 3.45
HypotheticalA
$ 1,000.00
$ 1,020.96
$ 4.22
Service Class
.91%
Actual
$ 1,000.00
$ 651.40
$ 3.78
HypotheticalA
$ 1,000.00
$ 1,020.56
$ 4.62
Service Class 2
1.06%
Actual
$ 1,000.00
$ 650.40
$ 4.40
HypotheticalA
$ 1,000.00
$ 1,019.81
$ 5.38
Investor Class
.91%
Actual
$ 1,000.00
$ 651.60
$ 3.78
HypotheticalA
$ 1,000.00
$ 1,020.56
$ 4.62
A 5% return per year before expenses
* Expenses are equal to each Class' annualized expense ratio, multiplied by the average account value over the period, multiplied by 184/366 (to reflect the one-half year period).
Annual Report
Investment Changes (Unaudited)
Top Ten Stocks as of December 31, 2008
% of fund's net assets
% of fund's net assets 6 months ago
JPMorgan Chase & Co.
4.5
2.6
AT&T, Inc.
3.7
3.7
Chevron Corp.
3.4
0.0
Wells Fargo & Co.
3.4
0.0
Exxon Mobil Corp.
3.1
3.1
Bank of America Corp.
3.1
3.0
Verizon Communications, Inc.
2.6
2.2
ConocoPhillips
2.4
6.1
Procter & Gamble Co.
1.9
1.3
Merck & Co., Inc.
1.8
1.3
29.9
Top Five Market Sectors as of December 31, 2008
% of fund's net assets
% of fund's net assets 6 months ago
Financials
24.7
24.4
Energy
16.5
21.1
Health Care
11.2
7.1
Consumer Discretionary
9.4
7.1
Industrials
8.7
8.9
Asset Allocation (% of fund's net assets)
As of December 31, 2008*
As of June 30, 2008**
Stocks 99.5%
Stocks 98.7%
Short-Term Investments and Net Other Assets 0.5%
Short-Term Investments and Net Other Assets 1.3%
* Foreign investments
13.0%
** Foreign investments
13.0%
Annual Report
Investments December 31, 2008
Showing Percentage of Net Assets
Common Stocks - 99.2%
Shares
Value
CONSUMER DISCRETIONARY - 9.4%
Auto Components - 0.5%
Johnson Controls, Inc.
11,700
$ 212,472
Automobiles - 0.2%
Renault SA
2,700
70,794
Diversified Consumer Services - 0.7%
Brinks Home Security Holdings, Inc. (a)
350
7,672
H&R Block, Inc.
13,600
308,992
316,664
Household Durables - 2.5%
Black & Decker Corp.
5,000
209,050
Centex Corp.
30,600
325,584
KB Home
30,500
415,410
Pulte Homes, Inc.
10,900
119,137
Whirlpool Corp.
2,200
90,970
1,160,151
Media - 2.1%
Comcast Corp. Class A (special) (non-vtg.)
21,500
347,225
News Corp. Class A
24,500
222,705
Time Warner, Inc.
38,300
385,298
955,228
Specialty Retail - 3.4%
Advance Auto Parts, Inc.
5,000
168,250
Home Depot, Inc.
8,750
201,425
Lowe's Companies, Inc.
14,800
318,496
PetSmart, Inc.
6,300
116,235
Ross Stores, Inc.
8,600
255,678
Staples, Inc.
21,500
385,280
Williams-Sonoma, Inc.
11,600
91,176
1,536,540
Textiles, Apparel & Luxury Goods - 0.0%
Liz Claiborne, Inc.
8,500
22,100
TOTAL CONSUMER DISCRETIONARY
4,273,949
CONSUMER STAPLES - 8.4%
Beverages - 1.2%
Anheuser-Busch InBev NV
13,920
324,802
Molson Coors Brewing Co. Class B
3,300
161,436
The Coca-Cola Co.
1,600
72,432
558,670
Food & Staples Retailing - 1.9%
CVS Caremark Corp.
11,100
319,014
Kroger Co.
8,900
235,049
Sysco Corp.
4,800
110,112
Winn-Dixie Stores, Inc. (a)
12,400
199,640
863,815
Food Products - 1.8%
Cermaq ASA
9,500
36,787
Shares
Value
Marine Harvest ASA (a)
230,000
$ 35,471
Nestle SA (Reg.)
16,654
657,953
Tyson Foods, Inc. Class A
8,100
70,956
801,167
Household Products - 2.3%
Energizer Holdings, Inc. (a)
3,500
189,490
Procter & Gamble Co.
13,700
846,934
1,036,424
Tobacco - 1.2%
Altria Group, Inc.
11,900
179,214
British American Tobacco PLC sponsored ADR
7,300
386,462
565,676
TOTAL CONSUMER STAPLES
3,825,752
ENERGY - 16.5%
Energy Equipment & Services - 2.3%
ENSCO International, Inc.
3,350
95,107
Nabors Industries Ltd. (a)
27,400
327,978
National Oilwell Varco, Inc. (a)
9,326
227,927
Noble Corp.
4,300
94,987
Patterson-UTI Energy, Inc.
10,000
115,100
Transocean Ltd. (a)
2,000
94,500
Weatherford International Ltd. (a)
7,700
83,314
1,038,913
Oil, Gas & Consumable Fuels - 14.2%
Chesapeake Energy Corp.
22,700
367,059
Chevron Corp.
20,800
1,538,576
ConocoPhillips
20,680
1,071,224
EOG Resources, Inc.
3,200
213,056
Exxon Mobil Corp.
17,900
1,428,957
Hess Corp.
3,700
198,468
Occidental Petroleum Corp.
12,800
767,872
Petrohawk Energy Corp. (a)
10,700
167,241
Plains Exploration & Production Co. (a)
8,600
199,864
Quicksilver Resources, Inc. (a)
12,100
67,397
Range Resources Corp.
2,900
99,731
Ultra Petroleum Corp. (a)
9,300
320,943
Uranium One, Inc. (a)
12,000
17,654
6,458,042
TOTAL ENERGY
7,496,955
FINANCIALS - 24.6%
Capital Markets - 5.9%
Bank of New York Mellon Corp.
26,100
739,413
Charles Schwab Corp.
8,368
135,311
Franklin Resources, Inc.
4,800
306,144
Goldman Sachs Group, Inc.
3,400
286,926
Julius Baer Holding Ltd.
2,742
106,029
KKR Private Equity Investors, LP (a)
18,738
65,583
Common Stocks - continued
Shares
Value
FINANCIALS - continued
Capital Markets - continued
KKR Private Equity Investors, LP Restricted Depositary Units (a)(e)
1,700
$ 5,950
Merrill Lynch & Co., Inc.
11,100
129,204
Morgan Stanley
15,000
240,600
State Street Corp.
11,800
464,094
T. Rowe Price Group, Inc.
6,100
216,184
2,695,438
Commercial Banks - 4.7%
Huntington Bancshares, Inc.
15,900
121,794
National City Corp.
125,000
226,250
Wachovia Corp.
48,400
268,136
Wells Fargo & Co.
51,940
1,531,191
2,147,371
Consumer Finance - 0.8%
Capital One Financial Corp.
8,300
264,687
Discover Financial Services
10,000
95,300
359,987
Diversified Financial Services - 8.2%
Bank of America Corp.
100,392
1,413,519
CIT Group, Inc. (d)
24,200
109,868
Citigroup, Inc.
19,500
130,845
JPMorgan Chase & Co.
64,996
2,049,323
3,703,555
Insurance - 3.9%
ACE Ltd.
11,420
604,346
Allied World Assurance Co. Holdings Ltd.
2,400
97,440
Argo Group International Holdings, Ltd. (a)
4,652
157,796
Everest Re Group Ltd.
5,900
449,226
Hartford Financial Services Group, Inc.
3,100
50,902
Loews Corp.
5,000
141,250
PartnerRe Ltd.
3,600
256,572
1,757,532
Real Estate Investment Trusts - 0.8%
Alexandria Real Estate Equities, Inc.
3,400
205,156
CapitalSource, Inc.
17,900
82,698
General Growth Properties, Inc.
16,470
21,246
Simon Property Group, Inc.
1,300
69,069
378,169
Real Estate Management & Development - 0.3%
CB Richard Ellis Group, Inc. Class A (a)
25,800
111,456
TOTAL FINANCIALS
11,153,508
HEALTH CARE - 11.2%
Biotechnology - 2.3%
Amgen, Inc. (a)
12,900
744,975
Shares
Value
Biogen Idec, Inc. (a)
3,700
$ 176,231
Cephalon, Inc. (a)
1,400
107,856
1,029,062
Health Care Equipment & Supplies - 2.5%
Baxter International, Inc.
4,500
241,155
Boston Scientific Corp. (a)
25,700
198,918
Covidien Ltd.
13,782
499,460
Medtronic, Inc.
6,100
191,662
1,131,195
Health Care Providers & Services - 1.0%
Brookdale Senior Living, Inc.
10,500
58,590
UnitedHealth Group, Inc.
14,300
380,380
438,970
Life Sciences Tools & Services - 0.2%
Thermo Fisher Scientific, Inc. (a)
3,500
119,245
Pharmaceuticals - 5.2%
Allergan, Inc.
2,400
96,768
Bristol-Myers Squibb Co.
6,361
147,893
Johnson & Johnson
4,600
275,218
Merck & Co., Inc.
26,900
817,760
Pfizer, Inc.
23,100
409,101
Sepracor, Inc. (a)
8,400
92,232
Wyeth
13,860
519,889
2,358,861
TOTAL HEALTH CARE
5,077,333
INDUSTRIALS - 8.7%
Aerospace & Defense - 2.5%
Honeywell International, Inc.
18,800
617,204
Raytheon Co.
4,800
244,992
The Boeing Co.
3,000
128,010
United Technologies Corp.
2,500
134,000
1,124,206
Air Freight & Logistics - 0.5%
United Parcel Service, Inc. Class B
4,000
220,640
Airlines - 0.2%
Delta Air Lines, Inc. (a)
7,600
87,096
Building Products - 0.9%
Masco Corp.
27,900
310,527
Owens Corning (a)
6,900
119,370
429,897
Commercial Services & Supplies - 0.5%
Republic Services, Inc.
9,045
224,226
Electrical Equipment - 0.2%
Acuity Brands, Inc.
2,000
69,820
Industrial Conglomerates - 2.5%
General Electric Co.
44,140
715,068
McDermott International, Inc. (a)
7,400
73,112
Siemens AG sponsored ADR
4,900
371,175
1,159,355
Common Stocks - continued
Shares
Value
INDUSTRIALS - continued
Machinery - 1.1%
Cummins, Inc.
5,300
$ 141,669
Illinois Tool Works, Inc.
3,600
126,180
Ingersoll-Rand Co. Ltd. Class A
7,700
133,595
Sulzer AG (Reg.)
1,888
108,702
510,146
Road & Rail - 0.3%
Con-way, Inc.
4,800
127,680
TOTAL INDUSTRIALS
3,953,066
INFORMATION TECHNOLOGY - 6.4%
Communications Equipment - 0.9%
Cisco Systems, Inc. (a)
20,500
334,150
Motorola, Inc.
20,000
88,600
422,750
Computers & Peripherals - 1.9%
Hewlett-Packard Co.
12,500
453,625
International Business Machines Corp.
3,000
252,480
NCR Corp. (a)
11,600
164,024
870,129
Electronic Equipment & Components - 1.4%
Amphenol Corp. Class A
1,400
33,572
Arrow Electronics, Inc. (a)
7,700
145,068
Avnet, Inc. (a)
13,700
249,477
Flextronics International Ltd. (a)
21,300
54,528
Tyco Electronics Ltd.
8,982
145,598
628,243
Internet Software & Services - 0.3%
VeriSign, Inc. (a)
7,000
133,560
IT Services - 0.4%
Lender Processing Services, Inc.
3,400
100,130
The Western Union Co.
5,100
73,134
173,264
Semiconductors & Semiconductor Equipment - 1.5%
Applied Materials, Inc.
15,500
157,015
ASML Holding NV (NY Shares)
4,700
84,929
Atmel Corp. (a)
23,600
73,868
Lam Research Corp. (a)
6,800
144,704
Maxim Integrated Products, Inc.
6,600
75,372
MEMC Electronic Materials, Inc. (a)
3,200
45,696
Novellus Systems, Inc. (a)
8,000
98,720
ON Semiconductor Corp. (a)
4,100
13,940
694,244
TOTAL INFORMATION TECHNOLOGY
2,922,190
MATERIALS - 2.6%
Chemicals - 0.3%
Albemarle Corp.
6,710
149,633
Shares
Value
Containers & Packaging - 0.4%
Owens-Illinois, Inc. (a)
4,900
$ 133,917
Temple-Inland, Inc.
6,100
29,280
163,197
Metals & Mining - 1.9%
Agnico-Eagle Mines Ltd.
2,300
118,658
ArcelorMittal SA (NY Shares) Class A
4,700
115,573
Commercial Metals Co.
5,900
70,033
Freeport-McMoRan Copper & Gold, Inc. Class B
4,600
112,424
Lihir Gold Ltd. (a)
35,537
78,142
Newcrest Mining Ltd.
8,227
199,744
Randgold Resources Ltd. sponsored ADR
4,000
175,680
870,254
TOTAL MATERIALS
1,183,084
TELECOMMUNICATION SERVICES - 6.9%
Diversified Telecommunication Services - 6.9%
AT&T, Inc.
60,140
1,713,990
Cincinnati Bell, Inc. (a)
45,500
87,815
Qwest Communications International, Inc.
48,300
175,812
Verizon Communications, Inc.
34,700
1,176,330
3,153,947
UTILITIES - 4.5%
Electric Utilities - 2.5%
Entergy Corp.
5,100
423,963
Exelon Corp.
6,600
367,026
FirstEnergy Corp.
6,500
315,770
1,106,759
Independent Power Producers & Energy Traders - 0.8%
AES Corp. (a)
12,700
104,648
NRG Energy, Inc. (a)
8,600
200,638
Reliant Energy, Inc. (a)
9,500
54,910
360,196
Multi-Utilities - 1.2%
CMS Energy Corp.
15,900
160,749
Sempra Energy
5,300
225,939
Wisconsin Energy Corp.
4,100
172,118
558,806
TOTAL UTILITIES
2,025,761
TOTAL COMMON STOCKS
(Cost $63,536,985)
45,065,545
Convertible Preferred Stocks - 0.1%
FINANCIALS - 0.1%
Commercial Banks - 0.1%
Fifth Third Bancorp 8.50%
300
25,608
Convertible Preferred Stocks - continued
Shares
Value
FINANCIALS - continued
Diversified Financial Services - 0.0%
CIT Group, Inc. Series C, 8.75%
700
$ 18,711
TOTAL CONVERTIBLE PREFERRED STOCKS
(Cost $64,265)
44,319
Investment Companies - 0.2%
Ares Capital Corp. (Cost $211,919)
13,996
88,595
Money Market Funds - 0.6%
Fidelity Cash Central Fund, 1.06% (b)
194,575
194,575
Fidelity Securities Lending Cash Central Fund, 0.87% (b)(c)
83,700
83,700
TOTAL MONEY MARKET FUNDS
(Cost $278,275)
278,275
Cash Equivalents - 0.1%
Maturity Amount
Investments in repurchase agreements in a joint trading account at 0.01%, dated 12/31/08 due 1/2/09 (Collateralized by U.S. Treasury Obligations) # (Cost $42,000)
$ 42,000
42,000
TOTAL INVESTMENT PORTFOLIO - 100.2%
(Cost $64,133,444)
45,518,734
NET OTHER ASSETS - (0.2)%
(108,314)
NET ASSETS - 100%
$ 45,410,420
Legend
(a) Non-income producing
(b) Affiliated fund that is available only to investment companies and other accounts managed by Fidelity Investments. The rate quoted is the annualized seven-day yield of the fund at period end. A complete unaudited listing of the fund's holdings as of its most recent quarter end is available upon request.
(c) Investment made with cash collateral received from securities on loan.
(d) Security or a portion of the security is on loan at period end.
(e) Security exempt from registration under Rule 144A of the Securities Act of 1933. These securities may be resold in transactions exempt from registration, normally to qualified institutional buyers. At the end of the period, the value of these securities amounted to $5,950 or 0.0% of net assets.
# Additional Information on each counterparty to the repurchase agreement is as follows:
Repurchase Agreement / Counterparty
Value
$42,000 due 1/02/09 at 0.01%
BNP Paribas Securities Corp.
$ 148
Banc of America Securities LLC
4,437
Goldman, Sachs & Co.
28,199
UBS Securities LLC
9,216
$ 42,000
Affiliated Central Funds
Information regarding fiscal year to date income earned by the Fund from investments in Fidelity Central Funds is as follows:
Fund
Income earned
Fidelity Cash Central Fund
$ 20,039
Fidelity Securities Lending Cash Central Fund
16,315
Total
$ 36,354
Other Information
The following is a summary of the inputs used, as of December 31, 2008, involving the Fund's assets carried at value. The inputs or methodology used for valuing securities may not be an indication of the risk associated with investing in those securities. For more information on valuation inputs, and their aggregation into the levels used in the table below, please refer to the Security Valuation section in the accompanying Notes to Financial Statements.
Valuation Inputs at Reporting Date:
Description
Total
Level 1
Level 2
Level 3
Investments in Securities
$ 45,518,734
$ 43,813,991
$ 1,704,743
$ -
Distribution of investments by country of issue, as a percentage of total net assets, is as follows: (Unaudited)
United States of America
87.0%
Bermuda
3.9%
Switzerland
3.1%
United Kingdom
1.4%
Canada
1.0%
Others (individually less than 1%)
3.6%
100.0%
Income Tax Information
At December 31, 2008, the fund had a capital loss carryforward of approximately $11,836,329 all of which will expire on December 31, 2016.
The fund intends to elect to defer its fiscal year ending December 31, 2009 approximately $2,990,532 of losses recognized during the period November 1, 2008 to December 31, 2008.
See accompanying notes which are an integral part of the financial statements.
Investment in securities, at value (including securities loaned of $84,444 and repurchase agreements of $42,000) - See accompanying schedule:
Unaffiliated issuers (cost $63,855,169)
$ 45,240,459
Fidelity Central Funds (cost $278,275)
278,275
Total Investments (cost $64,133,444)
$ 45,518,734
Cash
5
Receivable for investments sold
235,775
Receivable for fund shares sold
9,148
Dividends receivable
83,603
Distributions receivable from Fidelity Central Funds
450
Prepaid expenses
606
Other receivables
138
Total assets
45,848,459
Liabilities
Payable for investments purchased
$ 247,987
Payable for fund shares redeemed
33,279
Accrued management fee
20,715
Distribution fees payable
492
Other affiliated payables
5,421
Other payables and accrued expenses
46,445
Collateral on securities loaned, at value
83,700
Total liabilities
438,039
Net Assets
$ 45,410,420
Net Assets consist of:
Paid in capital
$ 80,133,947
Undistributed net investment income
43,927
Accumulated undistributed net realized gain (loss) on investments and foreign currency transactions
(16,153,069)
Net unrealized appreciation (depreciation) on investments and assets and liabilities in foreign currencies
(18,614,385)
Net Assets
$ 45,410,420
Statement of Assets and Liabilities - continued
December 31, 2008
Initial Class: Net Asset Value, offering price and redemption price per share ($18,847,415 ÷ 2,517,923 shares)
$ 7.49
Service Class: Net Asset Value, offering price and redemption price per share ($955,767 ÷ 127,767 shares)
$ 7.48
Service Class 2: Net Asset Value, offering price and redemption price per share ($2,001,254 ÷ 268,182 shares)
$ 7.46
Investor Class: Net Asset Value, offering price and redemption price per share ($23,605,984 ÷ 3,157,238 shares)
$ 7.48
See accompanying notes which are an integral part of the financial statements.
Annual Report
Financial Statements - continued
Statement of Operations
Year ended December 31, 2008
Investment Income
Dividends
$ 1,686,585
Interest
183
Income from Fidelity Central Funds
36,354
Total income
1,723,122
Expenses
Management fee
$ 370,251
Transfer agent fees
80,924
Distribution fees
12,170
Accounting and security lending fees
26,009
Custodian fees and expenses
33,669
Independent trustees' compensation
322
Audit
47,084
Legal
777
Miscellaneous
6,133
Total expenses before reductions
577,339
Expense reductions
(312)
577,027
Net investment income (loss)
1,146,095
Realized and Unrealized Gain (Loss)
Net realized gain (loss) on:
Investment securities:
Unaffiliated issuers
(15,569,240)
Investment not meeting investment restrictions
(47)
Foreign currency transactions
(1,902)
Payment from investment advisor for loss on investment not meeting investment restrictions
272
Total net realized gain (loss)
(15,570,917)
Change in net unrealized appreciation (depreciation) on:
Investment securities
(23,671,273)
Assets and liabilities in foreign currencies
(23)
Total change in net unrealized appreciation (depreciation)
(23,671,296)
Net gain (loss)
(39,242,213)
Net increase (decrease) in net assets resulting from operations
$ (38,096,118)
Statement of Changes in Net Assets
Year ended December 31, 2008
Year ended December 31, 2007
Increase (Decrease) in Net Assets
Operations
Net investment income (loss)
$ 1,146,095
$ 1,020,800
Net realized gain (loss)
(15,570,917)
5,681,847
Change in net unrealized appreciation (depreciation)
(23,671,296)
(3,353,550)
Net increase (decrease) in net assets resulting from operations
(38,096,118)
3,349,097
Distributions to shareholders from net investment income
(1,069,463)
(1,022,650)
Distributions to shareholders from net realized gain
(105,299)
(7,264,777)
Total distributions
(1,174,762)
(8,287,427)
Share transactions - net increase (decrease)
6,466,333
5,228,300
Total increase (decrease) in net assets
(32,804,547)
289,970
Net Assets
Beginning of period
78,214,967
77,924,997
End of period (including undistributed net investment income of $43,927 and undistributed net investment income of $9,748, respectively)
$ 45,410,420
$ 78,214,967
See accompanying notes which are an integral part of the financial statements.
Annual Report
Financial Highlights - Initial Class
Years ended December 31,
2008
2007
2006
2005
2004
Selected Per-Share Data
Net asset value, beginning of period
$ 13.89
$ 14.82
$ 13.30
$ 12.28
$ 11.20
Income from Investment Operations
Net investment income (loss)C
.20
.20
.15
.13
.10 F
Net realized and unrealized gain (loss)
(6.39)
.48
1.86
1.11
1.59
Total from investment operations
(6.19)
.68
2.01
1.24
1.69
Distributions from net investment income
(.19)
(.21)
(.13)
(.07)
(.08)
Distributions from net realized gain
(.02)
(1.40)
(.37)
(.16)
(.53)
Total distributions
(.21)
(1.61)
(.49)I
(.22) H
(.61)
Net asset value, end of period
$ 7.49
$ 13.89
$ 14.82
$ 13.30
$ 12.28
Total ReturnA, B
(44.61)%
4.56%
15.18%
10.18%
15.15%
Ratios to Average Net AssetsD, G
Expenses before reductions
.81%
.80%
.84%
.98%
2.07%
Expenses net of fee waivers, if any
.81%
.80%
.84%
.85%
1.00%
Expenses net of all reductions
.81%
.80%
.83%
.81%
.96%
Net investment income (loss)
1.79%
1.27%
1.09%
1.00%
.88%
Supplemental Data
Net assets, end of period (000 omitted)
$ 18,847
$ 30,300
$ 42,725
$ 37,465
$ 1,944
Portfolio turnover rate E
95%
98%
94%
75%
121%
A Total returns do not reflect charges attributable to your insurance company's separate account. Inclusion of these charges would reduce the total returns shown.
B Total returns would have been lower had certain expenses not been reduced during the periods shown.
C Calculated based on average shares outstanding during the period.
D Fees and expenses of the underlying Fidelity Central Funds are not included in the Fund's expense ratio. The Fund indirectly bears its proportionate share of the expenses of any underlying Fidelity Central Funds.
E Amount does not include the portfolio activity of any underlying Fidelity Central Funds.
F Investment income per share reflects a special dividend which amounted to $.02 per share.
G Expense ratios reflect operating expenses of the class. Expenses before reductions do not reflect amounts reimbursed by the investment adviser or reductions from brokerage service arrangements or other expense offset arrangements and do not represent the amount paid by the class during periods when reimbursements or reductions occur. Expenses net of fee waivers reflect expenses after reimbursement by the investment adviser but prior to reductions from brokerage service arrangements or other expense offset arrangements. Expenses net of all reductions represent the net expenses paid by the class.
H Total distributions of $.22 per share is comprised of distributions from net investment income of $.066 and distributions from net realized gain of $.155 per share.
I Total distributions of $.49 per share is comprised of distributions from net investment income of $.129 and distributions from net realized gain of $.365 per share.
Financial Highlights - Service Class
Years ended December 31,
2008
2007
2006
2005
2004
Selected Per-Share Data
Net asset value, beginning of period
$ 13.86
$ 14.80
$ 13.28
$ 12.26
$ 11.19
Income from Investment Operations
Net investment income (loss)C
.19
.18
.14
.10
.09 F
Net realized and unrealized gain (loss)
(6.38)
.48
1.86
1.13
1.59
Total from investment operations
(6.19)
.66
2.00
1.23
1.68
Distributions from net investment income
(.17)
(.20)
(.12)
(.05)
(.08)
Distributions from net realized gain
(.02)
(1.40)
(.37)
(.16)
(.53)
Total distributions
(.19)
(1.60)
(.48) I
(.21) H
(.61)
Net asset value, end of period
$ 7.48
$ 13.86
$ 14.80
$ 13.28
$ 12.26
Total ReturnA, B
(44.69)%
4.43%
15.11%
10.10%
15.08%
Ratios to Average Net AssetsD, G
Expenses before reductions
.90%
.89%
.93%
1.42%
2.17%
Expenses net of fee waivers, if any
.90%
.89%
.93%
.97%
1.10%
Expenses net of all reductions
.90%
.89%
.93%
.93%
1.06%
Net investment income (loss)
1.70%
1.18%
1.00%
.78%
.78%
Supplemental Data
Net assets, end of period (000 omitted)
$ 956
$ 2,577
$ 2,458
$ 2,137
$ 1,941
Portfolio turnover rateE
95%
98%
94%
75%
121%
A Total returns do not reflect charges attributable to your insurance company's separate account. Inclusion of these charges would reduce the total returns shown.
B Total returns would have been lower had certain expenses not been reduced during the periods shown.
C Calculated based on average shares outstanding during the period.
D Fees and expenses of the underlying Fidelity Central Funds are not included in the Fund's expense ratio. The Fund indirectly bears its proportionate share of the expenses of any underlying Fidelity Central Funds.
E Amount does not include the portfolio activity of any underlying Fidelity Central Funds.
F Investment income per share reflects a special dividend which amounted to $.02 per share.
G Expense ratios reflect operating expenses of the class. Expenses before reductions do not reflect amounts reimbursed by the investment adviser or reductions from brokerage service arrangements or other expense offset arrangements and do not represent the amount paid by the class during periods when reimbursements or reductions occur. Expenses net of fee waivers reflect expenses after reimbursement by the investment adviser but prior to reductions from brokerage service arrangements or other expense offset arrangements. Expenses net of all reductions represent the net expenses paid by the class.
H Total distributions of $.21 per share is comprised of distributions from net investment income of $.054 and distributions from net realized gain of $.155 per share.
I Total distributions of $.48 per share is comprised of distributions from net investment income of $.116 and distributions from net realized gain of $.365 per share.
See accompanying notes which are an integral part of the financial statements.
Annual Report
Financial Highlights - Service Class 2
Years ended December 31,
2008
2007
2006
2005
2004
Selected Per-Share Data
Net asset value, beginning of period
$ 13.80
$ 14.75
$ 13.25
$ 12.23
$ 11.18
Income from Investment Operations
Net investment income (loss)C
.18
.15
.12
.08
.07 F
Net realized and unrealized gain (loss)
(6.35)
.48
1.84
1.13
1.59
Total from investment operations
(6.17)
.63
1.96
1.21
1.66
Distributions from net investment income
(.15)
(.18)
(.10)
(.04)
(.08)
Distributions from net realized gain
(.02)
(1.40)
(.37)
(.16)
(.53)
Total distributions
(.17)
(1.58)
(.46)I
(.19)H
(.61)
Net asset value, end of period
$ 7.46
$ 13.80
$ 14.75
$ 13.25
$ 12.23
Total ReturnA, B
(44.77)%
4.22%
14.86%
9.98%
14.91%
Ratios to Average Net AssetsD, G
Expenses before reductions
1.05%
1.07%
1.14%
1.60%
2.32%
Expenses net of fee waivers, if any
1.05%
1.07%
1.10%
1.12%
1.25%
Expenses net of all reductions
1.05%
1.06%
1.09%
1.08%
1.21%
Net investment income (loss)
1.55%
1.01%
.83%
.63%
.63%
Supplemental Data
Net assets, end of period (000 omitted)
$ 2,001
$ 5,724
$ 4,467
$ 2,957
$ 2,581
Portfolio turnover rate E
95%
98%
94%
75%
121%
A Total returns do not reflect charges attributable to your insurance company's separate account. Inclusion of these charges would reduce the total returns shown.
B Total returns would have been lower had certain expenses not been reduced during the periods shown.
C Calculated based on average shares outstanding during the period.
D Fees and expenses of the underlying Fidelity Central Funds are not included in the Fund's expense ratio. The Fund indirectly bears its proportionate share of the expenses of any underlying Fidelity Central Funds.
E Amount does not include the portfolio activity of any underlying Fidelity Central Funds.
F Investment income per share reflects a special dividend which amounted to $.02 per share.
G Expense ratios reflect operating expenses of the class. Expenses before reductions do not reflect amounts reimbursed by the investment adviser or reductions from brokerage service arrangements or other expense offset arrangements and do not represent the amount paid by the class during periods when reimbursements or reductions occur. Expenses net of fee waivers reflect expenses after reimbursement by the investment adviser but prior to reductions from brokerage service arrangements or other expense offset arrangements. Expenses net of all reductions represent the net expenses paid by the class.
H Total distributions of $.19 per share is comprised of distributions from net investment income of $.036 and distributions from net realized gain of $.155 per share.
I Total distributions of $.46 per share is comprised of distributions from net investment income of $.099 and distributions from net realized gain of $.365 per share.
Financial Highlights - Investor Class
Years ended December 31,
2008
2007
2006
2005H
Selected Per-Share Data
Net asset value, beginning of period
$ 13.87
$ 14.81
$ 13.30
$ 12.72
Income from Investment Operations
Net investment income (loss)E
.19
.18
.14
.05
Net realized and unrealized gain (loss)
(6.38)
.48
1.86
.61
Total from investment operations
(6.19)
.66
2.00
.66
Distributions from net investment income
(.18)
(.20)
(.12)
(.05)
Distributions from net realized gain
(.02)
(1.40)
(.37)
(.03)
Total distributions
(.20)
(1.60)
(.49)K
(.08)J
Net asset value, end of period
$ 7.48
$ 13.87
$ 14.81
$ 13.30
Total ReturnB, C, D
(44.67)%
4.41%
15.06%
5.20%
Ratios to Average Net AssetsF, I
Expenses before reductions
.90%
.91%
.97%
1.15%A
Expenses net of fee waivers, if any
.90%
.91%
.97%
1.00%A
Expenses net of all reductions
.90%
.91%
.96%
.96%A
Net investment income (loss)
1.71%
1.16%
.96%
.87%A
Supplemental Data
Net assets, end of period (000 omitted)
$ 23,606
$ 39,614
$ 28,274
$ 4,279
Portfolio turnover rateG
95%
98%
94%
75%
A Annualized.
B Total returns for periods of less than one year are not annualized.
C Total returns do not reflect charges attributable to your insurance company's separate account. Inclusion of these charges would reduce the total returns shown.
D Total returns would have been lower had certain expenses not been reduced during the periods shown.
E Calculated based on average shares outstanding during the period.
F Fees and expenses of the underlying Fidelity Central Funds are not included in the Fund's expense ratio. The Fund indirectly bears its proportionate share of the expenses of any underlying Fidelity Central Funds.
G Amount does not include the portfolio activity of any underlying Fidelity Central Funds.
H For the period July 21, 2005 (commencement of sale of shares) to December 31, 2005.
I Expense ratios reflect operating expenses of the class. Expenses before reductions do not reflect amounts reimbursed by the investment adviser or reductions from brokerage service arrangements or other expense offset arrangements and do not represent the amount paid by the class during periods when reimbursements or reductions occur. Expense ratios before reductions for start-up periods may not be representative of longer-term operating periods. Expenses net of fee waivers reflect expenses after reimbursement by the investment adviser but prior to reductions from brokerage service arrangements or other expense offset arrangements. Expenses net of all reductions represent the net expenses paid by the class.
J Total distributions of $.08 per share is comprised of distributions from net investment income of $.053 and distributions from net realized gain of $.030 per share.
K Total distributions of $.49 per share is comprised of distributions from net investment income of $.123 and distributions from net realized gain of $.365 per share.
See accompanying notes which are an integral part of the financial statements.
VIP Value Leaders Portfolio (the Fund) is a fund of Variable Insurance Products Fund IV (the trust) and is authorized to issue an unlimited number of shares. The trust is registered under the Investment Company Act of 1940, as amended (the 1940 Act), as an open-end management investment company organized as a Massachusetts business trust. Shares of the Fund may only be purchased by insurance companies for the purpose of funding variable annuity or variable life insurance contracts. The Fund offers the following classes of shares: Initial Class shares, Service Class shares, Service Class 2 shares, and Investor Class shares. All classes have equal rights and voting privileges, except for matters affecting a single class. Investment income, realized and unrealized capital gains and losses, the common expenses of the Fund, and certain fund-level expense reductions, if any, are allocated on a pro rata basis to each class based on the relative net assets of each class to the total net assets of the Fund. Each class differs with respect to transfer agent and distribution and service plan fees incurred. Certain expense reductions also differ by class.
2. Investments in Fidelity Central Funds.
The Fund may invest in Fidelity Central Funds, which are open-end investment companies available only to other investment companies and accounts managed by Fidelity Management & Research Company (FMR) and its affiliates. The Fund's Schedule of Investments lists each of the Fidelity Central Funds held as of period end, if any, as an investment of the Fund, but does not include the underlying holdings of each Fidelity Central Fund. As an Investing Fund, the Fund indirectly bears its proportionate share of the expenses of the underlying Fidelity Central Funds.
The Money Market Central Funds seek preservation of capital and current income and are managed by Fidelity Investments Money Management, Inc. (FIMM), an affiliate of FMR.
A complete unaudited list of holdings for each Fidelity Central Fund is available upon request or at the SEC's web site at www.sec.gov. In addition, the financial statements of the Fidelity Central Funds, which are not covered by the Fund's Report of Independent Registered Public Accounting Firm, are available on the SEC's web site or upon request.
3. Significant Accounting Policies.
The financial statements have been prepared in conformity with accounting principles generally accepted in the United States of America, which require management to make certain estimates and assumptions at the date of the financial statements. Actual results could differ from those estimates. The following summarizes the significant accounting policies of the Fund:
Security Valuation. Investments are valued as of 4:00 p.m. Eastern time on the last calendar day of the period. Wherever possible, the Fund uses independent pricing services approved by the Board of Trustees to value its investments.
Equity securities, including restricted securities, for which market quotations are readily available, are valued at the last reported sale price or official closing price as reported by an independent pricing service on the primary market or exchange on which they are traded. In the event there were no sales during the day or closing prices are not available, securities are valued at the last quoted bid price. Investments in open-end mutual funds , including the Fidelity Central Funds, are valued at their closing net asset value each business day. Short-term securities with remaining maturities of sixty days or less for which quotations are not readily available are valued at amortized cost, which approximates value.
When current market prices or quotations are not readily available or reliable, valuations may be determined in good faith in accordance with procedures adopted by the Board of Trustees. Factors used in determining value may include significant market or security specific events, changes in interest rates and credit quality, and developments in foreign markets which are monitored by evaluating the performance of ADRs, futures contracts and exchange-traded funds. The frequency with which these procedures are used cannot be predicted and may be utilized to a significant extent. The value of securities used for net asset value (NAV) calculation under these procedures may differ from published prices for the same securities.
The Fund is subject to the provisions of Statement of Financial Accounting Standards No. 157, "Fair Value Measurements" (SFAS 157), effective with the beginning of the Fund's fiscal year. SFAS 157 establishes a hierarchy that prioritizes the inputs to valuation techniques giving the highest priority to readily available unadjusted quoted prices in active markets for identical assets (level 1 measurements) and the lowest priority to unobservable inputs (level 3 measurements) when market prices are not readily available or reliable. The three levels of the hierarchy under SFAS 157 are described below:
Level 1
Quoted prices in active markets for identical securities.
Level 2
Prices determined using other significant observable inputs. Observable inputs are inputs that other market participants may use in pricing a security. These may include quoted prices for similar securities, interest rates, prepayment speeds, credit risk and others.
Level 3
Prices determined using significant unobservable inputs. In situations where quoted prices or observable inputs are unavailable or deemed less relevant (for example, when there is little or no market activity for an investment at the end of the period), unobservable inputs may be used. Unobservable inputs reflect the Fund's own assumptions about the factors market participants would use in pricing an investment, and would be based on the best information available.
Changes in valuation techniques may result in transfers in or out of an investment's assigned level within the hierarchy.
The aggregate value by input level, as of December 31, 2008, for the Fund's investments is included at the end of the Fund's Schedule of Investments.
Annual Report
3. Significant Accounting Policies - continued
Foreign Currency. The Fund uses foreign currency contracts to facilitate transactions in foreign-denominated securities. Losses from these transactions may arise from changes in the value of the foreign currency or if the counterparties do not perform under the contracts' terms.
Foreign-denominated assets, including investment securities, and liabilities are translated into U.S. dollars at the exchange rate at period end. Purchases and sales of investment securities, income and dividends received and expenses denominated in foreign currencies are translated into U.S. dollars at the exchange rate in effect on the transaction date.
The effects of exchange rate fluctuations on investments are included with the net realized and unrealized gain (loss) on investment securities. Other foreign currency transactions resulting in realized and unrealized gain (loss) are disclosed separately.
Investment Transactions and Income. For financial reporting purposes, the Fund's investment holdings and NAV include trades executed through the end of the last business day of the period. The NAV per share for processing shareholder transactions is calculated as of the close of business of the New York Stock Exchange (NYSE), normally 4:00 p.m. Eastern time and includes trades executed through the end of the prior business day. Gains and losses on securities sold are determined on the basis of identified cost and may include proceeds received from litigation. Dividend income is recorded on the ex-dividend date, except for certain dividends from foreign securities where the ex-dividend date may have passed, which are recorded as soon as the Fund is informed at the ex-dividend date. Non-cash dividends included in dividend income, if any, are recorded at the fair market value of the securities received. Distributions received on securities that represent a return of capital or capital gain are recorded as a reduction of cost of investments and/or as a realized gain. The Fund estimates the components of distributions received that may be considered return of capital distributions or capital gain distributions. Interest income and distributions from the Fidelity Central Funds are accrued as earned. Interest income includes coupon interest and amortization of premium and accretion of discount on debt securities. Investment income is recorded net of foreign taxes withheld where recovery of such taxes is uncertain.
Expenses. Most expenses of the trust can be directly attributed to a fund. Expenses which cannot be directly attributed are apportioned among each Fund in the trust. Expense estimates are accrued in the period to which they relate and adjustments are made when actual amounts are known.
Income Tax Information and Distributions to Shareholders. Each year, the Fund intends to qualify as a regulated investment company by distributing substantially all of its taxable income and realized gains under Subchapter M of the Internal Revenue Code and filing its U.S. federal tax return. As a result, no provision for income taxes is required. The Fund is subject to the provisions of FASB Interpretation No. 48, Accounting for Uncertainties in Income Taxes (FIN 48). FIN 48 sets forth a minimum threshold for financial statement recognition of the benefit of a tax position taken or expected to be taken in a tax return. There are no unrecognized tax benefits in the accompanying financial statements. A Fund's federal tax return is subject to examination by the Internal Revenue Service (IRS) for a period of three years. Foreign taxes are provided for based on the Fund's understanding of the tax rules and rates that exist in the foreign markets in which it invests.
Distributions are recorded on the ex-dividend date. Income dividends and capital gain distributions are declared separately for each class. Income and capital gain distributions are determined in accordance with income tax regulations, which may differ from generally accepted accounting principles.
Capital accounts within the financial statements are adjusted for permanent book-tax differences. These adjustments have no impact on net assets or the results of operations. Temporary book-tax differences will reverse in a subsequent period.
Book-tax differences are primarily due to foreign currency transactions, partnerships, capital loss carryforwards, losses deferred due to wash sales and excise tax regulations.
The tax-basis components of distributable earnings and the federal tax cost as of period end were as follows:
Unrealized appreciation
$ 1,881,059
Unrealized depreciation
(21,821,646)
Net unrealized appreciation (depreciation)
(19,940,587)
Undistributed ordinary income
43,927
Capital loss carryforward
(11,836,329)
Cost for federal income tax purposes
$ 65,459,321
The tax character of distributions paid was as follows:
December 31, 2008
December 31, 2007
Ordinary Income
$ 1,174,762
$ 4,137,604
Long-term Capital Gains
-
4,149,823
Total
$ 1,174,762
$ 8,287,427
Annual Report
Notes to Financial Statements - continued
4. Operating Policies.
Repurchase Agreements. FMR has received an Exemptive Order from the Securities and Exchange Commission (the SEC) which permits the Fund and other affiliated entities of FMR to transfer uninvested cash balances into joint trading accounts which are then invested in repurchase agreements. The Fund may also invest directly with institutions in repurchase agreements. Repurchase agreements are collateralized by government or non-government securities. Upon settlement date, collateral is held in segregated accounts with custodian banks and may be obtained in the event of a default of the counterparty. The Fund monitors, on a daily basis, the value of the collateral to ensure it is at least equal to the principal amount of the repurchase agreement (including accrued interest). In the event of a default by the counterparty, realization of the collateral proceeds could be delayed, during which time the value of the collateral may decline.
Restricted Securities. The Fund may invest in securities that are subject to legal or contractual restrictions on resale. These securities generally may be resold in transactions exempt from registration or to the public if the securities are registered. Disposal of these securities may involve time-consuming negotiations and expense, and prompt sale at an acceptable price may be difficult. Information regarding restricted securities is included at the end of the Fund's Schedule of Investments.
5. Purchases and Sales of Investments.
Purchases and sales of securities, other than short-term securities, aggregated $69,594,542 and $62,963,741, respectively.
The Fund realized a gain and loss of $225 and $272 respectively, on sales of investments which did not meet the investment restrictions of the Fund. The loss of $272 was fully reimbursed by the Fund's investment advisor.
6. Fees and Other Transactions with Affiliates.
Management Fee. FMR and its affiliates provide the Fund with investment management related services for which the Fund pays a monthly management fee. The management fee is the sum of an individual fund fee rate that is based on an annual rate of .30% of the Fund's average net assets and a group fee rate that averaged .26% during the period. The group fee rate is based upon the average net assets of all the mutual funds advised by FMR. The group fee rate decreases as assets under management increase and increases as assets under management decrease. For the period, the total annual management fee rate was .56% of the Fund's average net assets.
Distribution and Service Plan. In accordance with Rule 12b-1 of the 1940 Act, the Fund has adopted separate 12b-1 Plans for each Service Class of shares. Each Service Class pays Fidelity Distributors Corporation (FDC), an affiliate of FMR, a service fee. For the period, the service fee is based on an annual rate of .10% of Service Class' average net assets and .25% of Service Class 2's average net assets.
For the period, each class paid FDC the following amounts, all of which were re-allowed to insurance companies for the distribution of shares and providing shareholder support services:
Service Class
$ 1,926
Service Class 2
10,244
$ 12,170
Transfer Agent Fees. Fidelity Investments Institutional Operations Company, Inc. (FIIOC), an affiliate of FMR, is the Fund's transfer, dividend disbursing, and shareholder servicing agent. FIIOC receives an asset-based fee with respect to each class. Each class (with the exception of Investor Class) pays a transfer agent fee, excluding out of pocket expenses, equal to an annual rate of .07% of average net assets. Investor Class pays a monthly asset-based transfer agent fee of .15% of average net assets. Prior to February 1, 2008, Investor Class paid a monthly asset-based transfer agent fee of .18% of average net assets. The total transfer agent fees paid by each class to FIIOC, including out of pocket expenses, were as follows:
Initial Class
$ 22,094
Service Class
1,346
Service Class 2
2,832
Investor Class
54,652
$ 80,924
Accounting and Security Lending Fees. Fidelity Service Company, Inc. (FSC), an affiliate of FMR, maintains the Fund's accounting records. The accounting fee is based on the level of average net assets for the month. Under a separate contract, FSC administers the security lending program. The security lending fee is based on the number and duration of lending transactions.
Brokerage Commissions. The Fund placed a portion of its portfolio transactions with brokerage firms which are affiliates of the investment adviser. The commissions paid to these affiliated firms were $5,087 for the period.
Annual Report
7. Committed Line of Credit.
The Fund participates with other funds managed by FMR in a $4.2 billion credit facility (the "line of credit") to be utilized for temporary or emergency purposes to fund shareholder redemptions or for other short-term liquidity purposes. The Fund has agreed to pay commitment fees on its pro rata portion of the line of credit, which amounted to $146 and is reflected in Miscellaneous Expense on the Statement of Operations. During the period, there were no borrowings on this line of credit.
8. Security Lending.
The Fund lends portfolio securities from time to time in order to earn additional income. On the settlement date of the loan, the Fund receives collateral (in the form of U.S. Treasury obligations, letters of credit and/or cash) against the loaned securities and maintains collateral in an amount not less than 100% of the market value of the loaned securities during the period of the loan. The market value of the loaned securities is determined at the close of business of the Fund and any additional required collateral is delivered to the Fund on the next business day. If the borrower defaults on its obligation to return the securities loaned because of insolvency or other reasons, a fund could experience delays and costs in recovering the securities loaned or in gaining access to the collateral. Any cash collateral received is invested in the Fidelity Securities Lending Cash Central Fund. The value of loaned securities and cash collateral at period end are disclosed on the Fund's Statement of Assets and Liabilities. Security lending income represents the income earned on investing cash collateral, less fees and expenses associated with the loan, plus any premium payments that may be received on the loan of certain types of securities. Security lending income is presented in the Statement of Operations as a component of income from Fidelity Central Funds. Net income from lending portfolio securities during the period amounted to $16,315.
9. Expense Reductions.
Many of the brokers with whom FMR places trades on behalf of the Fund provided services to the Fund in addition to trade execution. These services included payments of certain expenses on behalf of the Fund totaling $312 for the period.
10. Other.
The Fund's organizational documents provide former and current trustees and officers with a limited indemnification against liabilities arising in connection with the performance of their duties to the Fund. In the normal course of business, the Fund may also enter into contracts that provide general indemnifications. The Fund's maximum exposure under these arrangements is unknown as this would be dependent on future claims that may be made against the Fund. The risk of material loss from such claims is considered remote.
At the end of the period, FMR or its affiliates were owners of record of 98% of the total outstanding shares of the Fund.
During the period, Lehman Brothers Holdings, Inc. and certain of its affiliates (LBHI) sought protection under the insolvency laws of their jurisdictions of organization, including the United States, the United Kingdom and Japan. At the time LBHI's insolvency proceedings were instituted, the Fund had outstanding securities trades with counterparties affiliated with LBHI. As a result of the insolvency proceedings, LBHI is unable to fulfill its commitments and, in certain cases, the Fund may have terminated its trades and related agreements with the relevant entities and, where appropriate, is in the process of initiating claims for damages. FMR believes that the financial impact to the Fund relating to the terminated trades and agreements is immaterial.
In December 2006, the Independent Trustees, with the assistance of independent counsel, completed an investigation regarding gifts, gratuities and business entertainment provided by certain brokers to certain individuals who were employed on FMR's domestic equity trading desk during the period 2002 to 2004. The Independent Trustees and FMR agreed that, despite the absence of proof that the Fidelity mutual funds experienced diminished execution quality as a result of the improper receipt of gifts and business entertainment, the conduct at issue was serious and was worthy of redress. Accordingly, the Independent Trustees requested, and FMR agreed to make, a payment of $42 million plus accrued interest, which equaled approximately $7.3 million,to certain Fidelity mutual funds.
In March 2008, the Trustees approved a method for allocating this payment among the funds and, in total, FMR paid the fund $975, which is recorded in the accompanying Statement of Operations.
In a related administrative order dated March 5, 2008, the U.S. Securities and Exchange Commission ("SEC") announced a settlement with FMR and FMR Co., Inc. (an affiliate of FMR) involving the SEC's regulatory rules for investment advisers and the improper receipt of gifts, gratuities and business entertainment. Without admitting or denying the SEC's findings, FMR agreed to pay an $8 million civil penalty to the United States Treasury.
Annual Report
Notes to Financial Statements - continued
11. Distributions to Shareholders.
Distributions to shareholders of each class were as follows:
Years ended December 31,
2008
2007
From net investment income
Initial Class
$ 460,521
$ 414,412
Service Class
21,104
33,342
Service Class 2
38,328
66,023
Investor Class
549,510
508,873
Total
$ 1,069,463
$ 1,022,650
From net realized gain
Initial Class
$ 38,367
$ 2,949,447
Service Class
3,720
236,266
Service Class 2
8,161
513,410
Investor Class
55,051
3,565,654
Total
$ 105,299
$ 7,264,777
12. Share Transactions.
Transactions for each class of shares were as follows:
Shares
Dollars
Years ended December 31,
2008
2007
2008
2007
Initial Class
Shares sold
1,249,574
386,276
$ 15,002,246
$ 5,999,493
Reinvestment of distributions
66,157
238,214
498,888
3,363,859
Shares redeemed
(979,932)
(1,325,141)
(10,972,093)
(20,301,341)
Net increase (decrease)
335,799
(700,651)
$ 4,529,041
$ (10,937,989)
Service Class
Shares sold
-
642
$ -
$ 10,000
Reinvestment of distributions
3,185
19,187
24,823
269,608
Shares redeemed
(61,406)
-
(584,123)
-
Net increase (decrease)
(58,221)
19,829
$ (559,300)
$ 279,608
Service Class 2
Shares sold
45,542
109,446
$ 514,841
$ 1,673,062
Reinvestment of distributions
5,912
41,439
46,489
579,433
Shares redeemed
(198,033)
(39,041)
(2,015,823)
(613,049)
Net increase (decrease)
(146,579)
111,844
$ (1,454,493)
$ 1,639,446
Investor Class
Shares sold
1,143,976
1,493,436
$ 13,354,389
$ 22,999,503
Reinvestment of distributions
79,773
290,097
604,561
4,074,527
Shares redeemed
(923,568)
(836,226)
(10,007,865)
(12,826,795)
Net increase (decrease)
300,181
947,307
$ 3,951,085
$ 14,247,235
Annual Report
Reportof Independent Registered Public Accounting Firm
To the Trustees of Variable Insurance Products Fund IV and the Shareholders of VIP Value Leaders Portfolio:
In our opinion, the accompanying statement of assets and liabilities, including the schedule of investments, and the related statements of operations and of changes in net assets and the financial highlights present fairly, in all material respects, the financial position of VIP Value Leaders Portfolio (a fund of Variable Insurance Products Fund IV) at December 31, 2008, the results of its operations for the year then ended, the changes in its net assets for each of the two years in the period then ended and the financial highlights for each of the periods indicated, in conformity with accounting principles generally accepted in the United States of America. These financial statements and financial highlights (hereafter referred to as "financial statements") are the responsibility of the VIP Value Leaders Portfolio's management. Our responsibility is to express an opinion on these financial statements based on our audits. We conducted our audits of these financial statements in accordance with the standards of the Public Company Accounting Oversight Board (United States). Those standards require that we plan and perform the audit to obtain reasonable assurance about whether the financial statements are free of material misstatement. An audit includes examining, on a test basis, evidence supporting the amounts and disclosures in the financial statements, assessing the accounting principles used and significant estimates made by management, and evaluating the overall financial statement presentation. We believe that our audits, which included confirmation of securities at December 31, 2008 by correspondence with the custodian and brokers, provide a reasonable basis for our opinion.
The Trustees, Member of the Advisory Board, and executive officers of the trust and fund, as applicable, are listed below. The Board of Trustees governs the fund and is responsible for protecting the interests of shareholders. The Trustees are experienced executives who meet periodically throughout the year to oversee the fund's activities, review contractual arrangements with companies that provide services to the fund, and review the fund's performance. Except for Edward C. Johnson 3d and James C. Curvey, each of the Trustees oversees 222 funds advised by FMR or an affiliate. Messrs. Johnson and Curvey oversee 380 funds advised by FMR or an affiliate.
The Trustees hold office without limit in time except that (a) any Trustee may resign; (b) any Trustee may be removed by written instrument, signed by at least two-thirds of the number of Trustees prior to such removal; (c) any Trustee who requests to be retired or who has become incapacitated by illness or injury may be retired by written instrument signed by a majority of the other Trustees; and (d) any Trustee may be removed at any special meeting of shareholders by a two-thirds vote of the outstanding voting securities of the trust. Each Trustee who is not an interested person (as defined in the 1940 Act) (Independent Trustee), shall retire not later than the last day of the calendar year in which his or her 72nd birthday occurs. The Independent Trustees may waive this mandatory retirement age policy with respect to individual Trustees. The executive officers and Advisory Board Member hold office without limit in time, except that any officer and Advisory Board Member may resign or may be removed by a vote of a majority of the Trustees at any regular meeting or any special meeting of the Trustees. Except as indicated, each individual has held the office shown or other offices in the same company for the past five years.
The fund's Statement of Additional Information (SAI) includes more information about the Trustees. To request a free copy, call Fidelity at 1-877-208-0098.
Interested Trustees*:
Correspondence intended for each Trustee who is an interested person may be sent to Fidelity Investments, 82 Devonshire Street, Boston, Massachusetts 02109.
Name, Age; Principal Occupation
Edward C. Johnson 3d (78)
Year of Election or Appointment: 1983
Mr. Johnson is Chairman of the Board of Trustees. Mr. Johnson serves as Chief Executive Officer, Chairman, and a Director of FMR LLC; Chairman and a Director of FMR; Chairman and a Director of Fidelity Research & Analysis Company (FRAC); Chairman and a Director of Fidelity Investments Money Management, Inc.; and Chairman and a Director of FMR Co., Inc. In addition, Mr. Johnson serves as Chairman and Director of FIL Limited. Previously, Mr. Johnson served as President of FMR LLC (2006-2007).
James C. Curvey (73)
Year of Election or Appointment: 2007
Mr. Curvey also serves as Trustee (2007-present) of other investment companies advised by FMR. Mr. Curvey is a Director of FMR and FMR Co., Inc. (2007-present). Mr. Curvey is also Vice Chairman (2006-present) and Director of FMR LLC. In addition, Mr. Curvey serves as an Overseer for the Boston Symphony Orchestra and a member of the Trustees of Villanova University.
* Trustees have been determined to be "Interested Trustees" by virtue of, among other things, their affiliation with the trust or various entities under common control with FMR. FMR Corp. merged with and into FMR LLC on October 1, 2007. Any references to FMR LLC for prior periods are deemed to be references to the prior entity.
Independent Trustees:
Correspondence intended for each Independent Trustee (that is, the Trustees other than the Interested Trustees) may be sent to Fidelity Investments, P.O. Box 55235, Boston, Massachusetts 02205-5235.
Name, Age; Principal Occupation
Dennis J. Dirks (60)
Year of Election or Appointment: 2005
Prior to his retirement in May 2003, Mr. Dirks was Chief Operating Officer and a member of the Board of The Depository Trust & Clearing Corporation (DTCC) (1999-2003). He also served as President, Chief Operating Officer, and Board member of The Depository Trust Company (DTC) (1999-2003) and President and Board member of the National Securities Clearing Corporation (NSCC) (1999-2003). In addition, Mr. Dirks served as Chief Executive Officer and Board member of the Government Securities Clearing Corporation (2001-2003), Chief Executive Officer and Board member of the Mortgage-Backed Securities Clearing Corporation (2001-2003), as a Trustee and a member of the Finance Committee of Manhattan College (2005-2008), and as a Trustee and a member of the Finance Committee of AHRC of Nassau County (2006-2008). Currently, Mr. Dirks serves as a member of the Board of Directors for The Brookville Center for Children's Services, Inc. (2009-present).
Alan J. Lacy (55)
Year of Election or Appointment: 2008
Mr. Lacy serves as Senior Adviser (2007-present) of Oak Hill Capital Partners, L.P. (a private equity firm). Mr. Lacy also served as Chief Executive Officer (2000-2005) and Vice Chairman (2005-2006) of Sears Holdings Corporation and Sears, Roebuck and Co. (retail). In addition, Mr. Lacy serves as a member of the Board of Directors of The Western Union Company (global money transfer, 2006-present) and Bristol-Myers Squibb (global pharmaceuticals, 2007-present). Mr. Lacy is a Trustee of the National Parks Conservation Association and The Field Museum of Natural History.
Ned C. Lautenbach (64)
Year of Election or Appointment: 2000
Mr. Lautenbach is Chairman of the Independent Trustees (2006-present). Mr. Lautenbach is an Advisory Partner of Clayton, Dubilier & Rice, Inc. (private equity investment firm). Previously, Mr. Lautenbach was with the International Business Machines Corporation (IBM) from 1968 until his retirement in 1998. Mr. Lautenbach serves as a Director of Eaton Corporation (diversified industrial) as well as the Philharmonic Center for the Arts in Naples, Florida. He also is a member of the Board of Trustees of Fairfield University (2005-present), as well as a member of the Council on Foreign Relations. Previously, Mr. Lautenbach served as a Director of Sony Corporation (2006-2007).
Joseph Mauriello (64)
Year of Election or Appointment: 2008
Prior to his retirement in January 2006, Mr. Mauriello served in numerous senior management positions including Deputy Chairman and Chief Operating Officer (2004-2005), and Vice Chairman of Financial Services (2002-2004) of KPMG LLP US (professional services firm, 1965-2005). Mr. Mauriello currently serves as a member of the Board of Directors of XL Capital Ltd. (global insurance and re-insurance company, 2006-present) and of Arcadia Resources Inc. (health care services and products, 2007-present). He also served as a Director of the Hamilton Funds of the Bank of New York (2006-2007).
Cornelia M. Small (64)
Year of Election or Appointment: 2005
Ms. Small is a member of the Investment Committee, and Chair (2008-present) and a member of the Board of Trustees of Smith College. Ms. Small also serves on the Investment Committee of the Berkshire Taconic Community Foundation (2008-present). Previously, Ms. Small served as Chairperson of the Investment Committee (2002-2008) of Smith College and as Co-Chair (2000-2003) of the Annual Fund for the Fletcher School of Law and Diplomacy. In addition, she served as Chief Investment Officer, Director of Global Equity Investments, and a member of the Board of Directors of Scudder, Stevens & Clark and Scudder Kemper Investments.
William S. Stavropoulos (69)
Year of Election or Appointment: 2001
Mr. Stavropoulos is Chairman Emeritus of the Board of Directors of The Dow Chemical Company, where he previously served in numerous senior management positions, including President (1993-2000; 2002-2003), CEO (1995-2000; 2002-2004), Chairman of the Executive Committee (2000-2006), and as a member of the Board of Directors (1990-2006). Currently, he is a Director of Teradata Corporation (data warehousing and technology solutions, 2008-present), Chemical Financial Corporation, Maersk Inc. (industrial conglomerate), Tyco International, Inc. (multinational manufacturing and services, 2007-present), and a member of the Advisory Board for Metalmark Capital (private equity investment firm, 2005-present). He is a special advisor to Clayton, Dubilier & Rice, Inc. (private equity investment). In addition, Mr. Stavropoulos is a member of the University of Notre Dame Advisory Council for the College of Science.
David M. Thomas (59)
Year of Election or Appointment: 2008
Previously, Mr. Thomas served as Executive Chairman (2005-2006) and Chairman and Chief Executive Officer (2000-2005) of IMS Health, Inc. (pharmaceutical and healthcare information solutions). In addition, Mr. Thomas serves as a member of the Board of Directors of Fortune Brands, Inc. (consumer products holding company), and Interpublic Group of Companies, Inc. (marketing communication, 2004-present).
Michael E. Wiley (58)
Year of Election or Appointment: 2008
Mr. Wiley also serves as a member of the Board of Trustees of the University of Tulsa (2000-2006; 2007-present). He serves as a Director of Tesoro Corporation (independent oil refiner and marketer, 2005-present), and a Director of Bill Barrett Corporation (exploration and production company, 2005-present). In addition, he also serves as a Director of Post Oak Bank (privately-held bank, 2004-present). Previously, Mr. Wiley served as a Sr. Energy Advisor of Katzenbach Partners, LLC (consulting firm, 2006- 2007), as an Advisory Director of Riverstone Holdings (private investment firm), Chairman, President, and CEO of Baker Hughes, Inc. (oilfield services company, 2000-2004), and as Director of Spinnaker Exploration Company (exploration and production company, 2001-2005).
Annual Report
Advisory Board Member and Executive Officers**:
Correspondence intended for each executive officer and Mr. Lynch may be sent to Fidelity Investments, 82 Devonshire Street, Boston, Massachusetts 02109.
Name, Age; Principal Occupation
Peter S. Lynch (64)
Year of Election or Appointment: 2003
Member of the Advisory Board of Fidelity's Equity and High Income Funds. Mr. Lynch is Vice Chairman and a Director of FMR, and Vice Chairman (2001-present) and a Director of FMR Co., Inc. Previously, Mr. Lynch served as a Trustee of the Fidelity funds (1990-2003). In addition, he serves as a Trustee of Boston College and as the Chairman of the Inner-City Scholarship Fund. Previously, Mr. Lynch served on the Special Olympics International Board of Directors (1997-2006).
Kenneth B. Robins (39)
Year of Election or Appointment: 2008
President and Treasurer of Fidelity's Equity and High Income Funds. Mr. Robins is an employee of Fidelity Investments (2004- present). Before joining Fidelity Investments, Mr. Robins worked at KPMG LLP, where he was a partner in KPMG's department of professional practice (2002-2004).
Walter C. Donovan (46)
Year of Election or Appointment: 2007
Vice President of Fidelity's Equity Funds. Mr. Donovan also serves as President of FMR and FMR Co., Inc., and Executive Vice President of Fidelity Investments Money Management, Inc. (2007-present). Previously, Mr. Donovan served as Executive Vice President of FMR and FMR Co., Inc. (2005-2007) and Senior Vice President of FMR (2003-2005) and FMR Co., Inc. (2004-2005).
Bruce T. Herring (43)
Year of Election or Appointment: 2006
Vice President of certain Equity Funds. Mr. Herring also serves as Group Chief Investments Officer of FMR. Previously, Mr. Herring served as a portfolio manager for Fidelity U.S. Equity Funds.
Scott C. Goebel (40)
Year of Election or Appointment: 2008
Secretary and Chief Legal Officer (CLO) of the Fidelity funds. Mr. Goebel also serves as General Counsel, Secretary, and Senior Vice President of FMR (2008-present); Deputy General Counsel of FMR LLC; Chief Legal Secretary of Fidelity Management & Research (Hong Kong) Limited (2008-present) and Assistant Secretary of Fidelity Management & Research (Japan) Inc. (2008- present). Previously, Mr. Goebel served as Assistant Secretary of the Funds (2007-2008) and as Vice President and Secretary of Fidelity Distributors Corporation (FDC) (2005-2007).
John B. McGinty, Jr. (46)
Year of Election or Appointment: 2008
Assistant Secretary of Fidelity's Equity and High Income Funds. Mr. McGinty is an employee of Fidelity Investments (2004-present). Mr. McGinty also serves as Senior Vice President, Secretary, and Chief Legal Officer of Fidelity Distributors Corporation (FDC) (2007-present). Before joining Fidelity Investments, Mr. McGinty practiced law at Ropes & Gray, LLP.
Holly C. Laurent (54)
Year of Election or Appointment: 2008
Anti-Money Laundering (AML) Officer of the Fidelity funds. Ms. Laurent is an employee of Fidelity Investments. Previously, Ms. Laurent was Senior Vice President and Head of Legal for Fidelity Business Services India Pvt. Ltd. (2006-2008), Senior Vice President, Deputy General Counsel and Group Head for FMR LLC (2005-2006).
Christine Reynolds (50)
Year of Election or Appointment: 2008
Chief Financial Officer of the Fidelity funds. Ms. Reynolds became President of Fidelity Pricing and Cash Management Services (FPCMS) in August 2008. She served as Chief Operating Officer of FPCMS from 2007 through July 2008. Previously, Ms. Reynolds served as President, Treasurer, and Anti-Money Laundering officer of the Fidelity funds (2004-2007). Before joining Fidelity Investments, Ms. Reynolds worked at PricewaterhouseCoopers LLP (PwC) (1980-2002), where she was an audit partner with PwC's investment management practice.
Kenneth A. Rathgeber (61)
Year of Election or Appointment: 2004
Chief Compliance Officer of Fidelity's Equity and High Income Funds. Mr. Rathgeber is Chief Compliance Officer of Fidelity Management & Research (Hong Kong) Limited (2008-present), Fidelity Management & Research (Japan) Inc. (2008-present), FMR (2005-present), FMR Co., Inc. (2005-present), Fidelity Management & Research (U.K.) Inc. (2005-present), Fidelity Research & Analysis Company (2005-present), Fidelity Investments Money Management, Inc. (2005-present), and Strategic Advisers, Inc. (2005-present).
Bryan A. Mehrmann (47)
Year of Election or Appointment: 2005
Deputy Treasurer of the Fidelity funds. Mr. Mehrmann is an employee of Fidelity Investments. Previously, Mr. Mehrmann served as Vice President of Fidelity Investments Institutional Services Group (FIIS)/Fidelity Investments Institutional Operations Company, Inc. (FIIOC) Client Services (1998-2004).
Adrien E. Deberghes (41)
Year of Election or Appointment: 2008
Deputy Treasurer of Fidelity's Equity and High Income Funds. Mr. Deberghes is an employee of Fidelity Investments (2008-present). Previously, Mr. Deberghes served as Senior Vice President of Mutual Fund Administration at State Street Corporation (2007-2008), Senior Director of Mutual Fund Administration at Investors Bank & Trust (2005-2007), and Director of Finance for Dunkin' Brands (2000-2005).
Robert G. Byrnes (42)
Year of Election or Appointment: 2005
Assistant Treasurer of the Fidelity funds. Mr. Byrnes is an employee of Fidelity Investments (2005-present). Previously, Mr. Byrnes served as Vice President of Fidelity Pricing and Cash Management Services (FPCMS) (2003-2005). Before joining Fidelity Investments, Mr. Byrnes worked at Deutsche Asset Management where he served as Vice President of the Investment Operations Group (2000-2003).
Paul M. Murphy (61)
Year of Election or Appointment: 2007
Assistant Treasurer of the Fidelity funds. Mr. Murphy is an employee of Fidelity Investments (2007-present). Previously, Mr. Murphy served as Chief Financial Officer of the Fidelity Funds (2005-2006), Vice President and Associate General Counsel of FMR (2007), and Senior Vice President of Fidelity Pricing and Cash Management Services (FPCMS) (1994-2007).
Gary W. Ryan (50)
Year of Election or Appointment: 2005
Assistant Treasurer of the Fidelity funds. Mr. Ryan is an employee of Fidelity Investments. Previously, Mr. Ryan served as Vice President of Fund Reporting in Fidelity Pricing and Cash Management Services (FPCMS) (1999-2005).
** FMR Corp. merged with and into FMR LLC on October 1, 2007. Any references to FMR LLC for prior periods are deemed to be references to the prior entity.
Initial Class, Service Class, Service Class 2, and Investor Class designates 28% and 100% of the dividends distributed in February and December, respectively during the fiscal year as qualifying for the dividends-received deduction for corporate shareholders.
The fund will notify shareholders in January 2009 of amounts for use in preparing 2008 income tax returns.
A special meeting of the fund's shareholders was held on May 14, 2008. The results of votes taken among shareholders on the proposals before them are reported below. Each vote reported represents one dollar of net asset value held on the record date for the meeting.
PROPOSAL 1
To elect a Board of Trustees.A
# of Votes
% of Votes
James C. Curvey
Affirmative
82,890,712.47
95.991
Withheld
3,461,988.43
4.009
TOTAL
86,352,700.90
100.000
Dennis J. Dirks
Affirmative
82,970,372.75
96.083
Withheld
3,382,328.15
3.917
TOTAL
86,352,700.90
100.000
Edward C. Johnson 3d
Affirmative
82,689,162.78
95.757
Withheld
3,663,538.12
4.243
TOTAL
86,352,700.90
100.000
Alan J. Lacy
Affirmative
83,041,222.35
96.165
Withheld
3,311,478.55
3.835
TOTAL
86,352,700.90
100.000
Ned C. Lautenbach
Affirmative
82,983,853.72
96.099
Withheld
3,368,847.18
3.901
TOTAL
86,352,700.90
100.000
Joseph Mauriello
Affirmative
83,138,122.14
96.277
Withheld
3,214,578.76
3.723
TOTAL
86,352,700.90
100.000
Cornelia M. Small
Affirmative
83,095,438.06
96.228
Withheld
3,257,262.84
3.772
TOTAL
86,352,700.90
100.000
William S. Stavropoulos
Affirmative
82,929,113.95
96.035
Withheld
3,423,586.95
3.965
TOTAL
86,352,700.90
100.000
David M. Thomas
Affirmative
83,095,487.87
96.228
Withheld
3,257,213.03
3.772
TOTAL
86,352,700.90
100.000
Michael E. Wiley
Affirmative
83,048,523.75
96.174
Withheld
3,304,177.15
3.826
TOTAL
86,352,700.90
100.000
PROPOSAL 2
To amend the Declaration of Trust to reduce the required quorum for future shareholder meetings.A
# of Votes
% of Votes
Affirmative
74,393,635.26
86.151
Against
8,745,543.59
10.128
Abstain
3,213,522.05
3.721
TOTAL
86,352,700.90
100.000
ADenotes trust-wide proposal and voting results.
Annual Report
BoardApproval of Investment Advisory Contracts and Management Fees
VIP Value Leaders Portfolio
Each year, typically in July, the Board of Trustees, including the Independent Trustees (together, the Board), votes on the renewal of the management contract and sub-advisory agreements (together, the Advisory Contracts) for the fund. The Board, assisted by the advice of fund counsel and Independent Trustees' counsel, requests and considers a broad range of information throughout the year.
The Board meets regularly and, acting directly and through its separate committees, requests and receives information concerning, and considers at each of its meetings factors that are relevant to, its annual consideration of the renewal of the fund's Advisory Contracts, including the services and support provided to the fund and its shareholders. At the time of the renewal, the Board had 12 standing committees, each composed of Independent Trustees with varying backgrounds, to which the Board has assigned specific subject matter responsibilities in order to enhance effective decision-making by the Board. Each committee has a written charter outlining the structure and purposes of the committee. The Board also meets as needed to consider matters specifically related to the Board's annual consideration of the renewal of Advisory Contracts.
At its July 2008 meeting, the Board of Trustees, including the Independent Trustees, unanimously determined to renew the fund's Advisory Contracts. In reaching its determination, the Board considered all factors it believed relevant, including (i) the nature, extent, and quality of the services to be provided to the fund and its shareholders (including the investment performance of the fund); (ii) the competitiveness of the fund's management fee and total expenses; (iii) the total costs of the services to be provided by and the profits to be realized by Fidelity from its relationship with the fund; (iv) the extent to which economies of scale would be realized as the fund grows; and (v) whether fee levels reflect these economies of scale, if any, for the benefit of fund shareholders. The Board also approved agreements with foreign sub-advisers Fidelity Management & Research (Japan) Inc. and Fidelity Management & Research (Hong Kong) Limited, as well as amendments to the fund's agreement with Fidelity Management & Research (U.K.) Inc.
In considering whether to renew the Advisory Contracts for the fund, the Board ultimately reached a determination, with the assistance of fund counsel and Independent Trustees' counsel and through the exercise of its business judgment, that the renewal of the Advisory Contracts and the compensation to be received by Fidelity under the management contract is consistent with Fidelity's fiduciary duty under applicable law. The Board's decision to renew the Advisory Contracts was not based on any single factor noted above, but rather was based on a comprehensive consideration of all the information provided to the Board at its meetings throughout the year. The Board, in reaching its determination to renew the Advisory Contracts, is aware that shareholders in the fund have a broad range of investment choices available to them, including a wide choice among mutual funds offered by competitors to Fidelity, and that the fund's shareholders, with the opportunity to review and weigh the disclosure provided by the fund in its prospectus and other public disclosures, have chosen to invest in this fund, managed by Fidelity.
Nature, Extent, and Quality of Services Provided. The Board considered staffing within the investment adviser, FMR, and the sub-advisers (together, the Investment Advisers), including the backgrounds of the fund's investment personnel and the fund's investment objective and discipline. The Independent Trustees also had discussions with senior management of Fidelity's investment operations and investment groups. The Board considered the structure of the portfolio manager compensation program and whether this structure provides appropriate incentives.
Resources Dedicated to Investment Management and Support Services. The Board reviewed the size, education, and experience of the Investment Advisers' investment staff, their use of technology, and the Investment Advisers' approach to recruiting, training, and retaining portfolio managers and other research, advisory, and management personnel. The Board noted that Fidelity's analysts have access to a variety of technological tools that enable them to perform both fundamental and quantitative analysis and to specialize in various disciplines. The Board considered Fidelity's extensive global research capabilities that enable the Investment Advisers to aggregate data from various sources in an effort to produce positive investment results. The Board also considered that Fidelity's portfolio managers and analysts have access to daily portfolio attribution that allows for monitoring of a fund's portfolio, as well as an electronic communication system that provides immediate real-time access to research concerning issuers and credit enhancers.
Shareholder and Administrative Services. The Board considered (i) the nature, extent, quality, and cost of advisory, administrative, distribution, and shareholder services performed by the Investment Advisers and their affiliates under the Advisory Contracts and under separate agreements covering transfer agency, pricing and bookkeeping, and securities lending services for the fund; (ii) the nature and extent of the Investment Advisers' supervision of third party service providers, principally custodians and subcustodians; and (iii) the resources devoted to, and the record of compliance with, the fund's compliance policies and procedures. The Board also reviewed the allocation of fund brokerage, including allocations to brokers affiliated with the Investment Advisers, the use of brokerage commissions to pay fund expenses, and the use of "soft" commission dollars to pay for research services. The Board further considered that Fidelity voluntarily pays for market data out of its own resources.
The Board noted that the growth of fund assets across the complex allows Fidelity to reinvest in the development of services designed to enhance the value or convenience of the Fidelity funds as investment vehicles. These services include 24-hour access to account information and market information through phone representatives and over the Internet, and investor education materials and asset allocation tools.
Investment in a Large Fund Family. The Board considered the benefits to shareholders of investing in a Fidelity fund, including the benefits of investing in a fund that is part of a large family of funds offering a variety of investment disciplines and providing for a large variety of mutual fund investor services. The Board noted that Fidelity has taken a number of actions over the previous year that benefited particular funds, including (i) dedicating additional resources to investment research and to restructure the investment research teams; (ii) contractually agreeing to reduce the management fees on Fidelity's Institutional Money Market Funds and launching Class IV and Institutional Class of certain of these funds; (iii) reducing the transfer agent fees for the Fidelity Select Portfolios and Investor Class of the VIP funds; and (iv) launching Class K of 29 equity funds as a lower-fee class available to certain employer-sponsored retirement plans.
Annual Report
Board Approval of Investment Advisory Contracts and Management Fees - continued
Investment Performance. The Board considered whether the fund has operated within its investment objective, as well as its record of compliance with its investment restrictions. It also reviewed the fund's absolute investment performance for each class, as well as the fund's relative investment performance for each class measured against (i) a broad-based securities market index, and (ii) a peer group of mutual funds deemed appropriate by the Board over multiple periods. Because the fund had been in existence less than five calendar years, the following charts considered by the Board show, over the one- and three-year periods ended December 31, 2007, the cumulative total returns of Initial Class and Service Class 2 of the fund, the cumulative total returns of a broad-based securities market index ("benchmark"), and a range of cumulative total returns of a peer group of mutual funds identified by Morningstar, Inc. as having an investment style similar to that of the fund based on underlying portfolio holdings. The returns of Initial Class and Service Class 2 show the performance of the highest and lowest performing classes, respectively (based on three-year performance). The box within each chart shows the 25th percentile return (bottom of box) and the 75th percentile return (top of box) of the peer group. Returns shown above the box are in the first quartile and returns shown below the box are in the fourth quartile. The percentage beaten numbers noted below each chart correspond to the percentile box and represent the percentage of funds in the peer group whose performance was equal to or lower than that of the class indicated.
VIP Value Leaders Portfolio
The Board reviewed the fund's relative investment performance against its peer group and stated that the performance of Initial Class of the fund was in the second quartile for the one-year period and the first quartile for the three-year period. The Board also stated that the investment performance of Initial Class of the fund compared favorably to its benchmark for all the periods shown. The Board considered that the variations in performance among the fund's classes reflect the variations in class expenses, which result in lower performance for higher expense classes.
The Board considered that FMR has taken steps to refocus and strengthen equity research, equity portfolio management, and compliance.
Based on its review, and giving particular weight to the nature and quality of the resources dedicated by the Investment Advisers to maintain and improve relative performance, the Board concluded that the nature, extent, and quality of the services provided to the fund will benefit the fund's shareholders, particularly in light of the Board's view that the fund's shareholders benefit from investing in a fund that is part of a large family of funds offering a variety of investment disciplines and services.
Competitiveness of Management Fee and Total Fund Expenses. The Board considered the fund's management fee and total expenses compared to "mapped groups" of competitive funds and classes. Fidelity creates "mapped groups" by combining similar Lipper investment objective categories that have comparable management fee characteristics. Combining Lipper investment objective categories aids the Board's management fee and total expense comparisons by broadening the competitive group used for comparison and by reducing the number of universes to which various Fidelity funds are compared. The Board also considered supplemental information about how the fund's management fee and total expenses ranked relative to groups based on Lipper classifications, which take into account a fund's market capitalization and style.
Annual Report
The Board considered two proprietary management fee comparisons for the 12-month (or shorter) periods shown in the chart below. The group of Lipper funds used by the Board for management fee comparisons is referred to below as the "Total Mapped Group." The Total Mapped Group comparison focuses on a fund's standing relative to the total universe of comparable funds available to investors, in terms of gross management fees before expense reimbursements or caps. "TMG %" represents the percentage of funds in the Total Mapped Group that had management fees that were lower than the fund's. For example, a TMG % of 8% means that 92% of the funds in the Total Mapped Group had higher management fees than the fund. The "Asset-Size Peer Group" (ASPG) comparison focuses on a fund's standing relative to non-Fidelity funds similar in size to the fund within the Total Mapped Group. The ASPG represents at least 15% of the funds in the Total Mapped Group with comparable asset size and management fee characteristics, subject to a minimum of 50 funds (or all funds in the Total Mapped Group if fewer than 50). Additional information, such as the ASPG quartile in which the fund's management fee ranked, is also included in the chart and considered by the Board.
VIP Value Leaders Portfolio
The Board noted that the fund's management fee ranked below the median of its Total Mapped Group and below the median of its ASPG for 2007.
Based on its review, the Board concluded that the fund's management fee was fair and reasonable in light of the services that the fund receives and the other factors considered.
In its review of each class's total expenses, the Board considered the fund's management fee as well as other fund or class expenses, as applicable, such as transfer agent fees, pricing and bookkeeping fees, fund-paid 12b-1 fees, and custodial, legal, and audit fees. The Board also noted the effects of any waivers and reimbursements on fees and expenses. As part of its review, the Board also considered current and historical total expenses of each class of the fund compared to competitive fund median expenses. Each class of the fund is compared to those funds and classes in the Total Mapped Group (used by the Board for management fee comparisons) that have a similar sales load structure.
The Board noted that the total expenses of each of Initial Class, Investor Class, and Service Class ranked below its competitive median for 2007, and the total expenses of Service Class 2 ranked above its competitive median for 2007. The Board noted that the fund offers multiple classes, each of which has a different 12b-1 fee structure, and that the multiple structures are intended to offer a range of pricing options for the intermediary market. The Board also noted that the total expenses of the classes vary primarily by the level of their 12b-1 fees, although differences in transfer agent fees may also cause expenses to vary from class to class.
In its review of total expenses, the Board also considered Fidelity fee structures and other information on clients that FMR and its affiliates service in other competitive markets, such as other mutual funds advised or subadvised by FMR or its affiliates, pension plan clients, and other institutional clients.
Based on its review, the Board concluded that the total expenses of each class of the fund were reasonable, although in one case above the median of the universe presented for comparison, in light of the services that the fund and its shareholders receive and the other factors considered.
Costs of the Services and Profitability. The Board considered the revenues earned and the expenses incurred by Fidelity in conducting the business of developing, marketing, distributing, managing, administering and servicing the fund and its shareholders. The Board also considered the level of Fidelity's profits in respect of all the Fidelity funds.
Annual Report
Board Approval of Investment Advisory Contracts and Management Fees - continued
On an annual basis, FMR presents to the Board Fidelity's profitability for the fund. Fidelity calculates the profitability for each fund, as well as aggregate profitability for groups of Fidelity funds and all Fidelity funds, using a series of detailed revenue and cost allocation methodologies which originate with the audited books and records of Fidelity. The Audit Committee of the Board reviews any significant changes from the prior year's methodologies.
PricewaterhouseCoopers LLP (PwC), independent registered public accounting firm and auditor to Fidelity and certain Fidelity funds, has been engaged annually by the Board as part of the Board's assessment of the results of Fidelity's profitability analysis. PwC's engagement includes the review and assessment of Fidelity's methodologies used in determining the revenues and expenses attributable to Fidelity's mutual fund business, and completion of agreed-upon procedures surrounding the mathematical accuracy of fund profitability and its conformity to allocation methodologies. After considering PwC's reports issued under the engagement and information provided by Fidelity, the Board believes that while other allocation methods may also be reasonable, Fidelity's profitability methodologies are reasonable in all material respects.
The Board has also reviewed Fidelity's non-fund businesses and any fall-out benefits related to the mutual fund business as well as cases where Fidelity's affiliates may benefit from or be related to the fund's business.
The Board considered the costs of the services provided by and the profits realized by Fidelity in connection with the operation of the fund and determined that the amount of profit is a fair entrepreneurial profit for the management of the fund.
Economies of Scale. The Board considered whether there have been economies of scale in respect of the management of the Fidelity funds, whether the Fidelity funds (including the fund) have appropriately benefited from any such economies of scale, and whether there is potential for realization of any further economies of scale. The Board considered the extent to which the fund will benefit from economies of scale through increased services to the fund, through waivers or reimbursements, or through fee or expense reductions.
The Board recognized that the fund's management contract incorporates a "group fee" structure, which provides for lower group fee rates as total fund assets under FMR's management increase, and for higher group fee rates as total fund assets under FMR's management decrease. FMR determines the group fee rates based on a tiered asset "breakpoint" schedule. The Board considered that the group fee is designed to deliver the benefits of economies of scale to fund shareholders when total fund assets increase, even if assets of any particular fund are unchanged or have declined, because some portion of Fidelity's costs are attributable to services provided to all Fidelity funds, and all funds benefit if those costs can be allocated among more assets. The Board concluded that, given the group fee structure, fund shareholders will achieve a certain level of economies of scale as assets under FMR's management increase at the fund complex level, regardless of whether Fidelity achieves any such economies of scale.
The Board further concluded that any potential economies of scale are being shared between fund shareholders and Fidelity in an appropriate manner.
Additional Information Requested by the Board. In order to develop fully the factual basis for consideration of the Fidelity funds' Advisory Contracts, the Board requested and received additional information on certain topics, including (i) fund performance trends and actions to be taken by FMR to improve certain funds' overall performance; (ii) portfolio manager changes that have occurred during the past year; (iii) Fidelity's fund profitability methodology, the profitability of certain fund service providers, and profitability trends for certain funds; (iv) Fidelity's compensation structure for portfolio managers and key personnel, including its effects on fund profitability and the extent to which portfolio manager compensation is linked to fund performance; (v) Fidelity's fee structures and rationale for recommending different fees among categories of funds; and (vi) Fidelity's rationale for recommending which funds should have a performance adjustment component as part of their management fees.
Based on its evaluation of all of the conclusions noted above, and after considering all material factors, the Board ultimately concluded that the advisory fee structures are fair and reasonable, and that the fund's Advisory Contracts should be renewed.
Annual Report
Investment Adviser
Fidelity Management & Research Company Boston, MA
Investment Sub-Advisers
FMR Co., Inc.
Fidelity Management & Research (U.K.) Inc.
Fidelity Research & Analysis Company
Fidelity Investments Japan Limited
FIL Investment Advisors
FIL Investment Advisors (U.K.) Ltd.
Fidelity Management & Research (Hong Kong) Limited
Fidelity Management & Research (Japan) Inc.
General Distributor
Fidelity Distributors Corporation Boston, MA
Transfer and Service Agents
Fidelity Investments Institutional Operations Company, Inc. Boston, MA
Fidelity Service Company, Inc. Boston, MA
Custodian
Brown Brothers Harriman & Co. Boston, MA
VVL-ANN-0209
1.796594.105
Item 2. Code of Ethics
As of the end of the period, December 31, 2008, Variable Insurance Products Fund IV (the trust) has adopted a code of ethics, as defined in Item 2 of Form N-CSR, that applies to its President and Treasurer and its Chief Financial Officer. A copy of the code of ethics is filed as an exhibit to this Form N-CSR.
Item 3. Audit Committee Financial Expert
The Board of Trustees of the trust has determined that Joseph Mauriello is an audit committee financial expert, as defined in Item 3 of Form N-CSR. Mr. Mauriello is independent for purposes of Item 3 of Form N-CSR.
Item 4. Principal Accountant Fees and Services
Fees and Services
The following table presents fees billed by Deloitte & Touche LLP, the member firms of Deloitte Touche Tohmatsu, and their respective affiliates (collectively, "Deloitte Entities") in each of the last two fiscal years for services rendered to Emerging Markets Portfolio (the "Fund"):
Services Billed by Deloitte Entities
December 31, 2008 FeesA,B
Audit Fees
Audit-Related Fees
Tax Fees
All Other Fees
Emerging Markets Portfolio
$40,000
$-
$5,700
$-
December 31, 2007 FeesA,B
Audit Fees
Audit-Related Fees
Tax Fees
All Other Fees
Emerging Markets Portfolio
$-
$-
$-
$-
A Amounts may reflect rounding.
B Emerging Markets Portfolio commenced operations on January 23, 2008.
The following table presents fees billed by PricewaterhouseCoopers LLP ("PwC") in each of the last two fiscal years for services rendered to Consumer Discretionary Portfolio, Consumer Staples Portfolio, Energy Portfolio, Financial Services Portfolio, Growth Stock Portfolio, Health Care Portfolio, Industrials Portfolio, International Capital Appreciation Portfolio, Materials Portfolio, Real Estate Portfolio, Technology Portfolio, Telecommunications Portfolio, Utilities Portfolio, and Value Leaders Portfolio (the "Funds"):
Services Billed by PwC
December 31, 2008 FeesA
Audit Fees
Audit-Related Fees
Tax Fees
All Other Fees
Consumer Discretionary Portfolio
$35,000
$-
$4,500
$1,500
Consumer Staples Portfolio
$29,000
$-
$3,100
$1,500
Energy Portfolio
$35,000
$-
$4,500
$2,000
Financial Services Portfolio
$35,000
$-
$5,900
$1,500
Growth Stock Portfolio
$41,000
$-
$4,700
$1,500
Health Care Portfolio
$37,000
$-
$4,500
$1,500
Industrials Portfolio
$33,000
$-
$4,500
$1,500
International Capital Appreciation Portfolio
$43,000
$-
$5,100
$1,500
Materials Portfolio
$29,000
$-
$3,100
$1,500
Real Estate Portfolio
$42,000
$-
$5,500
$1,500
Technology Portfolio
$34,000
$-
$4,500
$1,500
Telecommunications Portfolio
$29,000
$-
$3,100
$1,500
Utilities Portfolio
$34,000
$-
$4,500
$1,500
Value Leaders Portfolio
$39,000
$-
$6,100
$1,500
December 31, 2007 FeesA,B
Audit Fees
Audit-Related Fees
Tax Fees
All Other Fees
Consumer Discretionary Portfolio
$36,000
$-
$2,100
$1,200
Consumer Staples Portfolio
$29,000
$-
$2,100
$600
Energy Portfolio
$36,000
$-
$2,100
$1,500
Financial Services Portfolio
$37,000
$-
$2,100
$1,200
Growth Stock Portfolio
$45,000
$-
$2,900
$1,200
Health Care Portfolio
$34,000
$-
$2,100
$1,300
Industrials Portfolio
$36,000
$-
$2,100
$1,200
International Capital Appreciation Portfolio
$43,000
$-
$2,900
$1,200
Materials Portfolio
$29,000
$-
$2,100
$600
Real Estate Portfolio
$45,000
$-
$2,900
$1,400
Technology Portfolio
$35,000
$-
$2,100
$1,300
Telecommunications Portfolio
$29,000
$-
$2,100
$600
Utilities Portfolio
$35,000
$-
$2,100
$1,300
Value Leaders Portfolio
$43,000
$-
$2,900
$1,300
A Amounts may reflect rounding.
B Consumer Staples Portfolio, Materials Portfolio and Telecommunications Portfolio commenced operations on April 24, 2007.
The following table presents fees billed by PwC and Deloitte Entities that were required to be approved by the Audit Committee for services that relate directly to the operations and financial reporting of the Funds and that are rendered on behalf of Fidelity Management & Research Company ("FMR") and entities controlling, controlled by, or under common control with FMR (not including any sub-adviser whose role is primarily portfolio management and is subcontracted with or overseen by another investment adviser) that provide ongoing services to the Funds ("Fund Service Providers"):
Services Billed by Deloitte Entities
December 31, 2008A,B
December 31, 2007A,B
Audit-Related Fees
$815,000
$-
Tax Fees
$2,000
$-
All Other Fees
$-
$-
A Amounts may reflect rounding.
B May include amounts billed prior to Emerging Market Portfolio's commencement of operations.
Services Billed by PwC
December 31, 2008A
December 31, 2007A
Audit-Related Fees
$2,340,000
$-
Tax Fees
$2,000
$-
All Other Fees
$190,000
$215,000
A Amounts may reflect rounding.
"Audit-Related Fees" represent fees billed for assurance and related services that are reasonably related to the performance of the fund audit or the review of the fund's financial statements and that are not reported under Audit Fees.
"Tax Fees" represent fees billed for tax compliance, tax advice or tax planning that relate directly to the operations and financial reporting of the fund.
"All Other Fees" represent fees billed for assurance services provided to the fund or Fund Service Provider that relate directly to the operations and financial reporting of the fund, excluding those services that are reported under Audit Fees, Audit-Related Fees or Tax Fees.
Assurance services must be performed by an independent public accountant.
* * *
The aggregate non-audit fees billed by PwC and Deloitte Entities for services rendered to the Funds, FMR (not including any sub-adviser whose role is primarily portfolio management and is subcontracted with or overseen by another investment adviser), and any Fund Service Provider for each of the last two fiscal years of the Funds are as follows:
Billed By
December 31, 2008 A
December 31, 2007 A
PwC
$3,040,000
$1,520,000
Deloitte Entities
$1,325,000B
$730,000B
A Amounts may reflect rounding.
B May include amounts billed prior to Emerging Market Portfolio's commencement of operations.
The trust's Audit Committee has considered non-audit services that were not pre-approved that were provided by PwC and Deloitte Entities to Fund Service Providers to be compatible with maintaining the independence of PwC and Deloitte Entities in their audits of the Funds, taking into account representations from PwC and Deloitte Entities, in accordance with Independence Standards Board Standard No. 1, regarding their independence from the Funds and their related entities and FMR's review of the appropriateness and permissibility under applicable law of such non-audit services prior to their provision to the Fund Service Providers.
Audit Committee Pre-Approval Policies and Procedures
The Fidelity fund's Audit Committee must pre-approve all audit and non-audit services provided by a fund's independent registered public accounting firm relating to the operations or financial reporting of the fund. Prior to the commencement of any audit or non-audit services to a fund, the Audit Committee reviews the services to determine whether they are appropriate and permissible under applicable law.
The Audit Committee has adopted policies and procedures to, among other purposes, provide a framework for the Committee's consideration of non-audit services by the audit firms that audit the Fidelity funds. The policies and procedures require that any non-audit service provided by a fund audit firm to a Fidelity fund and any non-audit service provided by a fund auditor to a Fund Service Provider that relates directly to the operations and financial reporting of a Fidelity fund ("Covered Service") are subject to approval by the Audit Committee before such service is provided.
All Covered Services must be approved in advance of provision of the service either: (i) by formal resolution of the Audit Committee, or (ii) by oral or written approval of the service by the Chair of the Audit Committee (or if the Chair is unavailable, such other member of the Audit Committee as may be designated by the Chair to act in the Chair's absence). The approval contemplated by (ii) above is permitted where the Treasurer determines that action on such an engagement is necessary before the next meeting of the Audit Committee.
Non-audit services provided by a fund audit firm to a Fund Service Provider that do not relate directly to the operations and financial reporting of a Fidelity fund are reported to the Audit Committee on a periodic basis.
Non-Audit Services Approved Pursuant to Rule 2-01(c)(7)(i)(C) and (ii) of Regulation S-X ("De Minimis Exception")
There were no non-audit services approved or required to be approved by the Audit Committee pursuant to the De Minimis Exception during the Funds' last two fiscal years relating to services provided to (i) the Funds or (ii) any Fund Service Provider that relate directly to the operations and financial reporting of the Funds.
Item 5. Audit Committee of Listed Registrants
Not applicable.
Item 6. Investments
(a) Not applicable.
(b) Not applicable
Item 7. Disclosure of Proxy Voting Policies and Procedures for Closed-End Management Investment Companies
Not applicable.
Item 8. Portfolio Managers of Closed-End Management Investment Companies
Not applicable.
Item 9. Purchase of Equity Securities by Closed-End Management Investment Company and Affiliated Purchasers
Not applicable.
Item 10. Submission of Matters to a Vote of Security Holders
There were no material changes to the procedures by which shareholders may recommend nominees to the trust's Board of Trustees.
Item 11. Controls and Procedures
(a)(i) The President and Treasurer and the Chief Financial Officer have concluded that the trust's disclosure controls and procedures (as defined in Rule 30a-3(c) under the Investment Company Act) provide reasonable assurances that material information relating to the trust is made known to them by the appropriate persons, based on their evaluation of these controls and procedures as of a date within 90 days of the filing date of this report.
(a)(ii) There was no change in the trust's internal control over financial reporting (as defined in Rule 30a-3(d) under the Investment Company Act) that occurred during the second fiscal quarter of the period covered by this report that has materially affected, or is reasonably likely to materially affect, the trust's internal control over financial reporting.
Item 12. Exhibits
(a)
(1)
Code of Ethics pursuant to Item 2 of Form N-CSR is filed and attached hereto as EX-99.CODE ETH.
(a)
(2)
Certification pursuant to Rule 30a-2(a) under the Investment Company Act of 1940 (17 CFR 270.30a-2(a)) is filed and attached hereto as Exhibit 99.CERT.
(a)
(3)
Not applicable.
(b)
Certification pursuant to Rule 30a-2(b) under the Investment Company Act of 1940 (17 CFR 270.30a-2(b)) is furnished and attached hereto as Exhibit 99.906CERT.
SIGNATURES
Pursuant to the requirements of the Securities Exchange Act of 1934 and the Investment Company Act of 1940, the registrant has duly caused this report to be signed on its behalf by the undersigned, thereunto duly authorized.
Variable Insurance Products Fund IV
By:
/s/Kenneth B. Robins
Kenneth B. Robins
President and Treasurer
Date:
March 11, 2009
Pursuant to the requirements of the Securities Exchange Act of 1934 and the Investment Company Act of 1940, this report has been signed below by the following persons on behalf of the registrant and in the capacities and on the dates indicated.
By:
/s/Kenneth B. Robins
Kenneth B. Robins
President and Treasurer
Date:
March 11, 2009
By:
/s/Christine Reynolds
Christine Reynolds
Chief Financial Officer
Date:
March 11, 2009
We use cookies on this site to provide a more responsive and personalized service. Continuing to browse, clicking I Agree, or closing this banner indicates agreement. See our Cookie Policy for more information.