UNITED STATES
SECURITIES AND EXCHANGE COMMISSION
Washington, D.C. 20549
FORM N-CSR
CERTIFIED SHAREHOLDER REPORT OF REGISTERED
MANAGEMENT INVESTMENT COMPANIES
Investment Company Act file number 811-3759
Variable Insurance Products Fund IV
(Exact name of registrant as specified in charter)
82 Devonshire St., Boston, Massachusetts 02109
(Address of principal executive offices) (Zip code)
Scott C. Goebel, Secretary
82 Devonshire St.
Boston, Massachusetts 02109
(Name and address of agent for service)
Registrant's telephone number, including area code: 617-563-7000
Date of fiscal year end: | December 31 |
| |
Date of reporting period: | December 31, 2010 |
Item 1. Reports to Stockholders
Fidelity® Variable Insurance Products:
Consumer Discretionary Portfolio
Annual Report
December 31, 2010
(2_fidelity_logos) (Registered_Trademark)
Contents
Performance | <Click Here> | How the fund has done over time. |
Management's Discussion of Fund Performance | <Click Here> | The Portfolio Manager's review of fund performance and strategy. |
Shareholder Expense Example | <Click Here> | An example of shareholder expenses. |
Investment Changes | <Click Here> | A summary of major shifts in the fund's investments over the past six months. |
Investments | <Click Here> | A complete list of the fund's investments with their market values. |
Financial Statements | <Click Here> | Statements of assets and liabilities, operations, and changes in net assets, as well as financial highlights. |
Notes | <Click Here> | Notes to the financial statements. |
Report of Independent Registered Public Accounting Firm | <Click Here> | |
Trustees and Officers | <Click Here> | |
Distributions | <Click Here> | |
Board Approval of Investment Advisory Contracts and Management Fees | <Click Here> | |
To view a fund's proxy voting guidelines and proxy voting record for the 12-month period ended June 30, visit http://www.fidelity.com/proxyvotingresults or visit the Securities and Exchange Commission's (SEC) web site at http://www.sec.gov. You may also call 1-877-208-0098 to request a free copy of the proxy voting guidelines.
Fidelity Variable Insurance Products are separate account options which are purchased through a variable insurance contract.
Standard & Poor's, S&P and S&P 500 are registered service marks of The McGraw-Hill Companies, Inc. and have been licensed for use by Fidelity Distributors Corporation.
Other third party marks appearing herein are the property of their respective owners.
All other marks appearing herein are registered or unregistered trademarks or service marks of FMR LLC or an affiliated company.
The general research services agreement with Fidelity Research & Analysis Company has been terminated and is no longer in effect for the fund.
This report and the financial statements contained herein are submitted for the general information of the shareholders of the fund. This report is not authorized for distribution to prospective investors in the fund unless preceded or accompanied by an effective prospectus.
A fund files its complete schedule of portfolio holdings with the SEC for the first and third quarters of each fiscal year on Form N-Q. Forms N-Q are available on the SEC's web site at http://www.sec.gov. A fund's Forms N-Q may be reviewed and copied at the SEC's Public Reference Room in Washington, DC. Information regarding the operation of the SEC's Public Reference Room may be obtained by calling 1-800-SEC-0330. For a complete list of a fund's portfolio holdings, view the most recent holdings listings, semiannual report, or annual report on Fidelity's web site at http://www.fidelity.com, http://www.advisor.fidelity.com, or http://www.401k.com, as applicable.
NOT FDIC INSURED • MAY LOSE VALUE • NO BANK GUARANTEE
Neither the fund nor Fidelity Distributors Corporation is a bank.
Annual Report
Average annual total return reflects the change in the value of an investment, assuming reinvestment of the class' distributions from dividend income and capital gains (the profits earned upon the sale of securities that have grown in value, if any) and assuming a constant rate of performance each year. During periods of reimbursement by Fidelity, a fund's total return will be greater than it would be had the reimbursement not occurred. Performance numbers are net of all underlying fund operating expenses, but do not include any insurance charges imposed by your insurance company's separate account. If performance information included the effect of these additional charges, the total returns would have been lower. How a fund did yesterday is no guarantee of how it will do tomorrow.
Average Annual Total Returns
Periods ended December 31, 2010 | Past 1
year | Past 5
years | Life of
fundA |
VIP Consumer Discretionary Portfolio - Initial Class C | 31.29% | 4.37% | 3.77% |
VIP Consumer Discretionary Portfolio - Investor Class B, C | 31.16% | 4.29% | 3.72% |
A From July 18, 2001.
B The initial offering of Investor Class shares took place on July 21, 2005. Returns prior to July 21, 2005 are those of Initial Class. Had Investor Class's transfer agent fee been reflected, returns prior to July 21, 2005 would have been lower.
C Prior to October 1, 2006, VIP Consumer Discretionary Portfolio operated under certain different investment policies. The historical performance for the fund may not represent its current investment policies.
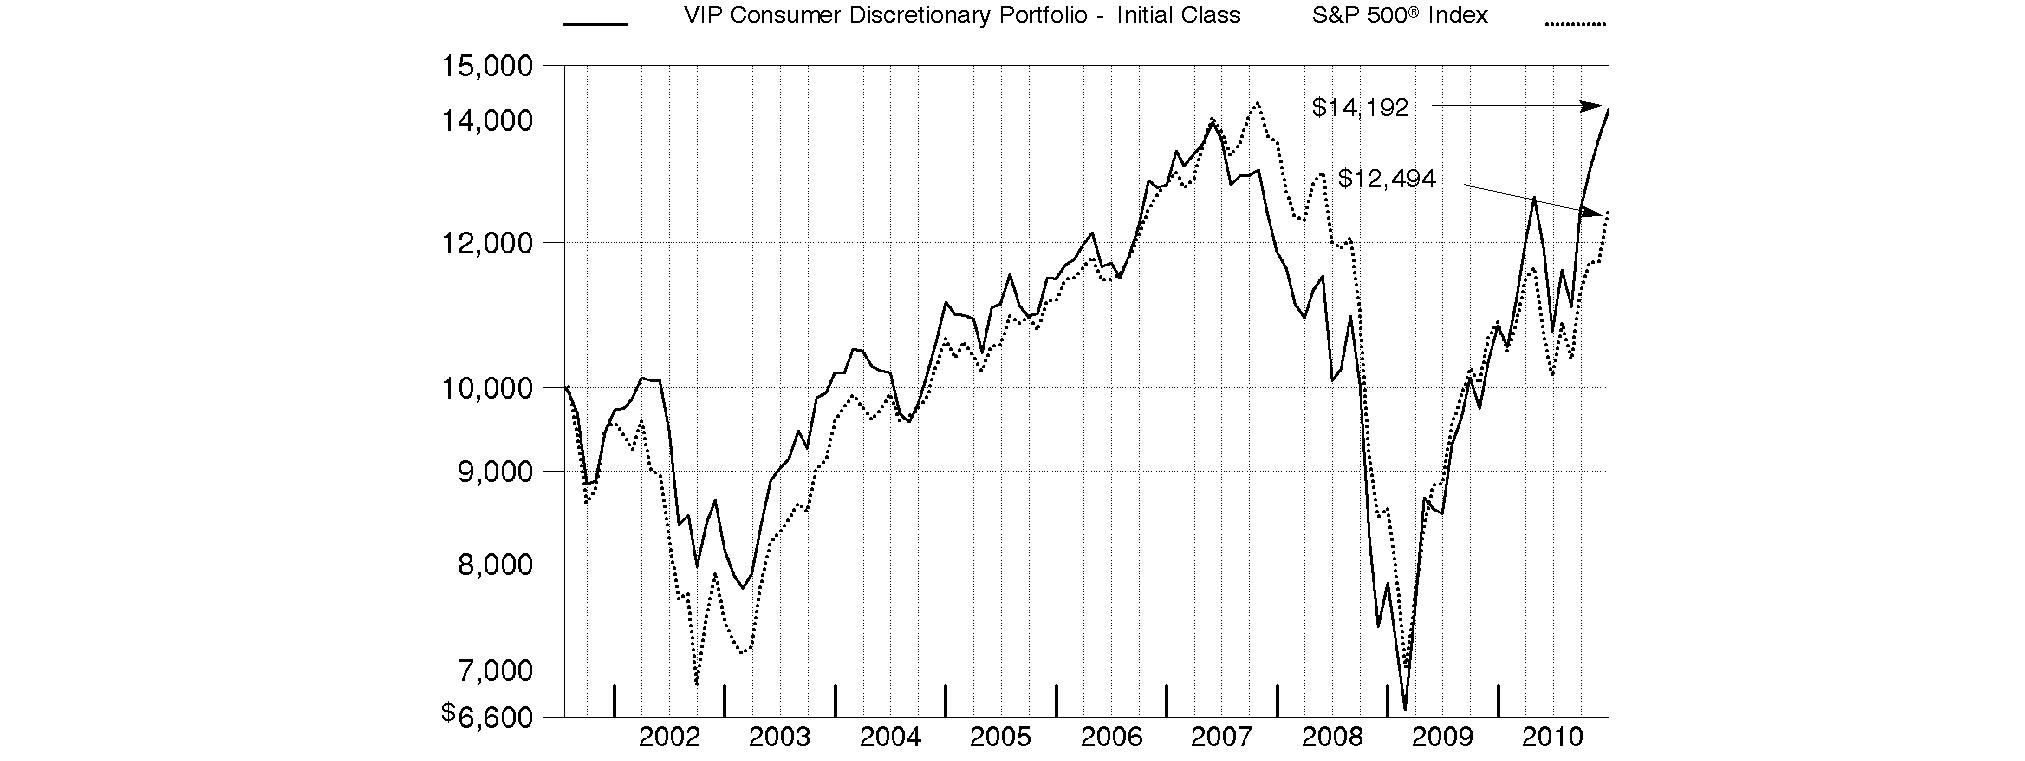
$10,000 Over Life of Fund
Let's say hypothetically that $10,000 was invested in VIP Consumer Discretionary Portfolio - Initial Class on July 18, 2001, when the fund started. The chart shows how the value of your investment would have changed, and also shows how the S&P 500® Index performed over the same period.
Annual Report
Market Recap: While market improvements around the world hit a speed bump in the first half of the 12-month period ending December 31, 2010, world economies re-accelerated in August, supported by a broadening recovery and low inflation in the U.S. Domestic stock markets recorded solid gains for the year, lifted by a strong second-half rally fueled by economic optimism, encouraging earnings reports and a wave of corporate mergers. The large-cap S&P 500® Index rose 15.06%, the blue-chip-laden Dow Jones Industrial AverageSM added 14.06% and the technology-heavy Nasdaq Composite® Index climbed 18.02%. Meanwhile, international stocks, as represented by the MSCI® ACWI® (All Country World Index) ex USA Index, gained 11.29%, boosted in part by a depreciating U.S. dollar. In the fixed-income arena, U.S. taxable investment-grade bonds generated positive results during 2010, as the Barclays Capital® U.S. Aggregate Bond Index gained 6.54%. With ultra-low interest rates bolstering nearly all fixed-income securities for most of the year, sectors in the index with higher yields and more credit risk generally fared best, while most high-quality bonds generated more-moderate returns. Meanwhile, high-yield bonds, as represented by The BofA Merrill LynchSM US High Yield Constrained Index, returned 15.07%, a result of improved economic data and strengthening investor demand. Overseas, foreign bond markets showed mixed results, with a sizable disparity between the 3.97% return of the Citigroup® Non-U.S. Group of 7 Index - which measures the performance of sovereign debt of the major global economies outside the U.S. - and the 12.04% advance of the JPMorgan Emerging Markets Bond Index Global (EMBI Global), which benefited from the rising overall credit quality of emerging-markets debt issuers.
Comments from John Harris, Portfolio Manager of VIP Consumer Discretionary Portfolio: For the 12 months ending December 31, 2010, the fund's share classes handily outperformed the broadly based S&P 500® and also topped the 30.87% gain of the MSCI® U.S. IM Consumer Discretionary 25/50 Index, which was adopted in January 2010 as a better representation of the fund's investment universe. (For specific portfolio results, please refer to the performance section of this report.) Solid positioning in casinos and gaming led the fund's outperformance, including a significant overweighting in casino operator Las Vegas Sands. The firm's shares benefited from an improving economy and increased consumer spending in the U.S., coupled with the successful opening of the firm's Singapore property. An overweighting in hotels, resorts and cruise lines was another key contributor, with a stake in Starwood Hotels & Resorts Worldwide aiding returns. Favorable picks in specialized consumer services helped, such as not owning tax preparer H&R Block, an index component that was hurt by weak results in its core tax-preparation business and concern related to the company's former mortgage-origination business. Security selection within some automotive-related groups was a bright spot, led by an out-of-index position in BMW and an overweighting in parts supplier Tenneco. Media stocks contributed, with shares of U.K. cable TV provider Virgin Media moving up. Underweighting global media conglomerate News Corp. paid off when the firm's stock underperformed during the period. On the flip side, unfavorable positioning in the home improvement retail industry was a big disappointment, where a sizable overweighting in Lowe's, the fund's largest holding, continued to struggle in the face of weak housing reports and sluggish sales of big-ticket items such as appliances. Weak picks in Internet retail and Internet software/services also detracted, including not owning movie-subscription service and index constituent Netflix and an out-of-index stake in Internet search leader Google. Elsewhere, the apparel retail industry had some poor performers. Urban-oriented off-price retailer Citi Trends detracted when the chain missed its second-quarter numbers, while unfavorable positioning in discount retailer TJX Companies also hurt. Some of the stocks I've discussed were sold prior to period end.
The views expressed above reflect those of the portfolio manager(s) only through the end of the period as stated on the cover of this report and do not necessarily represent the views of Fidelity or any other person in the Fidelity organization. Any such views are subject to change at any time based upon market or other conditions and Fidelity disclaims any responsibility to update such views. These views may not be relied on as investment advice and, because investment decisions for a Fidelity fund are based on numerous factors, may not be relied on as an indication of trading intent on behalf of any Fidelity fund.
Annual Report
As a shareholder of the Fund, you incur two types of costs: (1) transaction costs, including redemption fees, and (2) ongoing costs, including management fees and other Fund expenses. This Example is intended to help you understand your ongoing costs (in dollars) of investing in the Fund and to compare these costs with the ongoing costs of investing in other mutual funds.
The Example is based on an investment of $1,000 invested at the beginning of the period and held for the entire period (July 1, 2010 to December 31, 2010).
Actual Expenses
The first line of the accompanying table for each class of the Fund provides information about actual account values and actual expenses. You may use the information in this line, together with the amount you invested, to estimate the expenses that you paid over the period. Simply divide your account value by $1,000.00 (for example, an $8,600 account value divided by $1,000.00 = 8.6), then multiply the result by the number in the first line for a class of the Fund under the heading entitled "Expenses Paid During Period" to estimate the expenses you paid on your account during this period. The estimate of expenses does not include any fees or other expenses of any variable annuity or variable life insurance product. If they were, the estimate of expenses you paid during the period would be higher, and your ending account value would be lower. In addition, the Fund, as a shareholder in the underlying Fidelity Central Funds, will indirectly bear its pro-rata share of the fees and expenses incurred by the underlying Fidelity Central Funds. These fees and expenses are not included in the Fund's annualized expense ratio used to calculate the expense estimate in the table below.
Hypothetical Example for Comparison Purposes
The second line of the accompanying table for each class of the Fund provides information about hypothetical account values and hypothetical expenses based on a Class' actual expense ratio and an assumed rate of return of 5% per year before expenses, which is not the Class' actual return. The hypothetical account values and expenses may not be used to estimate the actual ending account balance or expenses you paid for the period. You may use this information to compare the ongoing costs of investing in the Fund and other funds. To do so, compare this 5% hypothetical example with the 5% hypothetical examples that appear in the shareholder reports of the other funds. The estimate of expenses does not include any fees or other expenses of any variable annuity or variable life insurance product. If they were, the estimate of expenses you paid during the period would be higher, and your ending account value would be lower. In addition, the Fund, as a shareholder in the underlying Fidelity Central Funds, will indirectly bear its pro-rata share of the fees and expenses incurred by the underlying Fidelity Central Funds. These fees and expenses are not included in the Fund's annualized expense ratio used to calculate the expense estimate in the table below.
Please note that the expenses shown in the table are meant to highlight your ongoing costs only and do not reflect any transaction costs. Therefore, the second line of the table is useful in comparing ongoing costs only, and will not help you determine the relative total costs of owning different funds. In addition, if these transactional costs were included, your costs would have been higher.
| Annualized
Expense Ratio | Beginning
Account Value
July 1, 2010 | Ending
Account Value
December 31, 2010 | Expenses Paid
During Period*
July 1, 2010
to December 31, 2010 |
Initial Class | 1.00% | | | |
Actual | | $ 1,000.00 | $ 1,322.60 | $ 5.85 |
Hypothetical A | | $ 1,000.00 | $ 1,020.16 | $ 5.09 |
Investor Class | 1.08% | | | |
Actual | | $ 1,000.00 | $ 1,322.70 | $ 6.32 |
Hypothetical A | | $ 1,000.00 | $ 1,019.76 | $ 5.50 |
A 5% return per year before expenses
* Expenses are equal to each Class' annualized expense ratio, multiplied by the average account value over the period, multiplied by 184/365 (to reflect the one-half year period).
Annual Report
Investment Changes (Unaudited)
Top Ten Stocks as of December 31, 2010 |
| % of fund's
net assets | % of fund's net assets
6 months ago |
Lowe's Companies, Inc. | 5.7 | 6.4 |
The Walt Disney Co. | 5.4 | 5.9 |
McDonald's Corp. | 5.2 | 6.4 |
Amazon.com, Inc. | 4.6 | 3.8 |
Target Corp. | 4.2 | 4.2 |
News Corp. Class A | 2.9 | 0.0 |
Bed Bath & Beyond, Inc. | 2.9 | 2.1 |
DIRECTV | 2.7 | 3.2 |
Virgin Media, Inc. | 2.3 | 1.6 |
Starbucks Corp. | 2.3 | 2.0 |
| 38.2 | |
Top Industries (% of fund's net assets) |
As of December 31, 2010 |
 | Media | 24.0% | |
 | Hotels, Restaurants & Leisure | 21.9% | |
 | Specialty Retail | 20.4% | |
 | Textiles, Apparel & Luxury Goods | 7.0% | |
 | Internet & Catalog Retail | 5.6% | |
 | All Others* | 21.1% | |

|
As of June 30, 2010 |
| Media | 26.8% | |
| Hotels, Restaurants & Leisure | 21.4% | |
| Specialty Retail | 21.2% | |
| Multiline Retail | 6.7% | |
| Household Durables | 4.8% | |
| All Others* | 19.1% | |

* Includes short-term investments and net other assets. |
Annual Report
Investments December 31, 2010
Showing Percentage of Net Assets
Common Stocks - 98.9% |
| Shares | | Value |
AUTO COMPONENTS - 3.7% |
Auto Parts & Equipment - 3.7% |
Autoliv, Inc. | 7,495 | | $ 591,655 |
Tenneco, Inc. (a) | 12,233 | | 503,510 |
TRW Automotive Holdings Corp. (a) | 9,300 | | 490,110 |
| | 1,585,275 |
AUTOMOBILES - 2.2% |
Automobile Manufacturers - 2.2% |
Bayerische Motoren Werke AG (BMW) | 2,226 | | 175,147 |
General Motors Co. | 20,602 | | 759,390 |
Volkswagen AG | 18 | | 2,549 |
| | 937,086 |
DISTRIBUTORS - 0.3% |
Distributors - 0.3% |
Li & Fung Ltd. | 18,000 | | 104,445 |
DIVERSIFIED CONSUMER SERVICES - 2.9% |
Education Services - 1.6% |
DeVry, Inc. | 6,800 | | 326,264 |
Grand Canyon Education, Inc. (a) | 18,074 | | 354,070 |
| | 680,334 |
Specialized Consumer Services - 1.3% |
Sotheby's Class A (ltd. vtg.) | 8,697 | | 391,365 |
Steiner Leisure Ltd. (a) | 3,021 | | 141,081 |
| | 532,446 |
TOTAL DIVERSIFIED CONSUMER SERVICES | | 1,212,780 |
ELECTRONIC EQUIPMENT & COMPONENTS - 0.2% |
Technology Distributors - 0.2% |
Funtalk China Holdings Ltd. (a) | 15,600 | | 88,452 |
FOOD & STAPLES RETAILING - 1.4% |
Hypermarkets & Super Centers - 1.4% |
BJ's Wholesale Club, Inc. (a) | 2,800 | | 134,120 |
Costco Wholesale Corp. | 6,369 | | 459,905 |
| | 594,025 |
HOTELS, RESTAURANTS & LEISURE - 21.9% |
Casinos & Gaming - 4.7% |
Betfair Group PLC | 7,400 | | 111,295 |
Las Vegas Sands Corp. unit | 773 | | 601,487 |
MGM Mirage, Inc. (a) | 35,483 | | 526,923 |
Pinnacle Entertainment, Inc. (a) | 16,956 | | 237,723 |
WMS Industries, Inc. (a) | 11,040 | | 499,450 |
| | 1,976,878 |
Hotels, Resorts & Cruise Lines - 5.3% |
Accor SA | 4,874 | | 217,001 |
China Lodging Group Ltd. ADR | 6,215 | | 135,425 |
Home Inns & Hotels Management, Inc. sponsored ADR (a) | 7,100 | | 290,816 |
Marriott International, Inc. Class A | 7,716 | | 320,523 |
|
| Shares | | Value |
Starwood Hotels & Resorts Worldwide, Inc. | 11,729 | | $ 712,889 |
Wyndham Worldwide Corp. | 18,745 | | 561,600 |
| | 2,238,254 |
Restaurants - 11.9% |
BJ's Restaurants, Inc. (a) | 8,116 | | 287,550 |
Bravo Brio Restaurant Group, Inc. | 3,400 | | 65,178 |
Darden Restaurants, Inc. | 12,827 | | 595,686 |
McDonald's Corp. | 28,615 | | 2,196,487 |
P.F. Chang's China Bistro, Inc. | 7,013 | | 339,850 |
Ruth's Hospitality Group, Inc. (a) | 29,581 | | 136,960 |
Starbucks Corp. | 30,390 | | 976,431 |
Texas Roadhouse, Inc. Class A (a) | 27,495 | | 472,089 |
| | 5,070,231 |
TOTAL HOTELS, RESTAURANTS & LEISURE | | 9,285,363 |
HOUSEHOLD DURABLES - 2.1% |
Home Furnishings - 0.8% |
Tempur-Pedic International, Inc. (a) | 8,200 | | 328,492 |
Homebuilding - 0.9% |
Lennar Corp. Class A | 14,100 | | 264,375 |
Toll Brothers, Inc. (a) | 7,194 | | 136,686 |
| | 401,061 |
Household Appliances - 0.4% |
Stanley Black & Decker, Inc. | 2,421 | | 161,892 |
TOTAL HOUSEHOLD DURABLES | | 891,445 |
INTERNET & CATALOG RETAIL - 5.6% |
Internet Retail - 5.6% |
Amazon.com, Inc. (a) | 10,800 | | 1,944,000 |
Expedia, Inc. | 9,389 | | 235,570 |
Ocado Group PLC (a) | 11,500 | | 31,990 |
Priceline.com, Inc. (a) | 440 | | 175,802 |
| | 2,387,362 |
INTERNET SOFTWARE & SERVICES - 1.0% |
Internet Software & Services - 1.0% |
eBay, Inc. (a) | 15,645 | | 435,400 |
LEISURE EQUIPMENT & PRODUCTS - 0.7% |
Leisure Products - 0.7% |
Polaris Industries, Inc. | 3,700 | | 288,674 |
MEDIA - 24.0% |
Advertising - 3.0% |
Interpublic Group of Companies, Inc. (a) | 33,400 | | 354,708 |
Lamar Advertising Co. Class A (a) | 10,282 | | 409,635 |
National CineMedia, Inc. | 24,568 | | 489,149 |
| | 1,253,492 |
Broadcasting - 0.8% |
Scripps Networks Interactive, Inc. Class A | 6,800 | | 351,900 |
Common Stocks - continued |
| Shares | | Value |
MEDIA - CONTINUED |
Cable & Satellite - 11.2% |
Comcast Corp.: | | | |
Class A | 30,800 | | $ 676,676 |
Class A (special) (non-vtg.) | 25,644 | | 533,652 |
DIRECTV (a) | 28,612 | | 1,142,477 |
Kabel Deutschland Holding AG | 9,217 | | 429,769 |
Sirius XM Radio, Inc. (a) | 172,200 | | 282,408 |
Time Warner Cable, Inc. | 10,852 | | 716,558 |
Virgin Media, Inc. | 35,900 | | 977,916 |
| | 4,759,456 |
Movies & Entertainment - 8.3% |
News Corp. Class A | 84,611 | | 1,231,936 |
The Walt Disney Co. | 61,146 | | 2,293,586 |
| | 3,525,522 |
Publishing - 0.7% |
United Business Media Ltd. | 26,700 | | 287,426 |
TOTAL MEDIA | | 10,177,796 |
MULTILINE RETAIL - 5.5% |
Department Stores - 1.3% |
Nordstrom, Inc. | 9,790 | | 414,900 |
Retail Ventures, Inc. (a) | 8,200 | | 133,660 |
| | 548,560 |
General Merchandise Stores - 4.2% |
Droga Raia SA | 1,000 | | 15,329 |
Target Corp. | 29,493 | | 1,773,414 |
| | 1,788,743 |
TOTAL MULTILINE RETAIL | | 2,337,303 |
SPECIALTY RETAIL - 20.4% |
Apparel Retail - 5.7% |
Chico's FAS, Inc. | 14,800 | | 178,044 |
Citi Trends, Inc. (a) | 10,425 | | 255,934 |
DSW, Inc. Class A (a) | 3,701 | | 144,709 |
Fast Retailing Co. Ltd. | 700 | | 111,445 |
Inditex SA | 2,832 | | 212,151 |
TJX Companies, Inc. | 21,078 | | 935,652 |
Urban Outfitters, Inc. (a) | 16,093 | | 576,290 |
| | 2,414,225 |
Automotive Retail - 1.0% |
Advance Auto Parts, Inc. | 5,670 | | 375,071 |
Lentuo International, Inc. ADR | 8,400 | | 58,800 |
| | 433,871 |
Computer & Electronics Retail - 1.3% |
Best Buy Co., Inc. | 6,600 | | 226,314 |
hhgregg, Inc. (a) | 15,855 | | 332,162 |
| | 558,476 |
|
| Shares | | Value |
Home Improvement Retail - 7.0% |
Home Depot, Inc. | 8,354 | | $ 292,891 |
Lowe's Companies, Inc. | 96,545 | | 2,421,351 |
Lumber Liquidators Holdings, Inc. (a) | 9,500 | | 236,645 |
| | 2,950,887 |
Homefurnishing Retail - 2.9% |
Bed Bath & Beyond, Inc. (a) | 24,848 | | 1,221,279 |
Specialty Stores - 2.5% |
Hengdeli Holdings Ltd. | 360,000 | | 214,448 |
OfficeMax, Inc. (a) | 18,010 | | 318,777 |
Tractor Supply Co. | 8,766 | | 425,063 |
Ulta Salon, Cosmetics & Fragrance, Inc. (a) | 3,700 | | 125,800 |
| | 1,084,088 |
TOTAL SPECIALTY RETAIL | | 8,662,826 |
TEXTILES, APPAREL & LUXURY GOODS - 7.0% |
Apparel, Accessories & Luxury Goods - 5.5% |
China Xiniya Fashion Ltd. ADR | 11,100 | | 101,676 |
Christian Dior SA | 800 | | 114,340 |
Coach, Inc. | 12,088 | | 668,587 |
Phillips-Van Heusen Corp. | 6,300 | | 396,963 |
Polo Ralph Lauren Corp. Class A | 4,660 | | 516,887 |
Titan Industries Ltd. | 3,115 | | 250,451 |
Vera Bradley, Inc. | 7,900 | | 260,700 |
| | 2,309,604 |
Footwear - 1.5% |
Iconix Brand Group, Inc. (a) | 9,800 | | 189,238 |
NIKE, Inc. Class B | 5,200 | | 444,184 |
| | 633,422 |
TOTAL TEXTILES, APPAREL & LUXURY GOODS | | 2,943,026 |
TOTAL COMMON STOCKS (Cost $37,868,870) | 41,931,258 |
Nonconvertible Preferred Stocks - 0.5% |
| | | |
AUTOMOBILES - 0.5% |
Automobile Manufacturers - 0.5% |
Volkswagen AG
(Cost $217,857) | 1,300 | | 211,005 |
Money Market Funds - 3.0% |
| Shares | | Value |
Fidelity Cash Central Fund, 0.19% (b)
(Cost $1,284,658) | 1,284,658 | | $ 1,284,658 |
TOTAL INVESTMENT PORTFOLIO - 102.4% (Cost $39,371,385) | | 43,426,921 |
NET OTHER ASSETS (LIABILITIES) - (2.4)% | | (1,032,810) |
NET ASSETS - 100% | $ 42,394,111 |
Legend |
(a) Non-income producing |
(b) Affiliated fund that is available only to investment companies and other accounts managed by Fidelity Investments. The rate quoted is the annualized seven-day yield of the fund at period end. A complete unaudited listing of the fund's holdings as of its most recent quarter end is available upon request. In addition, each Fidelity Central Fund's financial statements, which are not covered by the Fund's Report of Independent Registered Public Accounting Firm, are available on the SEC's website or upon request. |
Affiliated Central Funds |
Information regarding fiscal year to date income earned by the Fund from investments in Fidelity Central Funds is as follows: |
Fund | Income earned |
Fidelity Cash Central Fund | $ 1,127 |
Other Information |
The following is a summary of the inputs used, as of December 31, 2010, involving the Fund's assets and liabilities carried at fair value. The inputs or methodology used for valuing securities may not be an indication of the risk associated with investing in those securities. For more information on valuation inputs, and their aggregation into the levels used in the table below, please refer to the Security Valuation section at the end of this in the accompanying Notes to Financial Statements. |
Valuation Inputs at Reporting Date: |
Description | Total | Level 1 | Level 2 | Level 3 |
Investments in Securities: | | | | |
Common Stocks | $ 41,931,258 | $ 41,329,771 | $ 601,487 | $ - |
Nonconvertible Preferred Stocks | 211,005 | 211,005 | - | - |
Money Market Funds | 1,284,658 | 1,284,658 | - | - |
Total Investments in Securities: | $ 43,426,921 | $ 42,825,434 | $ 601,487 | $ - |
Income Tax Information |
At December 31, 2010, the Fund had a capital loss carryforward of approximately $1,260,189 of which $171,972 and $1,088,217 will expire in fiscal 2016 and 2017, respectively. Capital loss carryforwards are only available to offset future capital gains of the Fund to the extent provided by regulations and may be limited. |
See accompanying notes which are an integral part of the financial statements.
Annual Report
Statement of Assets and Liabilities
| December 31, 2010 |
| | |
Assets | | |
Investment in securities, at value - See accompanying schedule: Unaffiliated issuers (cost $38,086,727) | $ 42,142,263 | |
Fidelity Central Funds (cost $1,284,658) | 1,284,658 | |
Total Investments (cost $39,371,385) | | $ 43,426,921 |
Receivable for investments sold | | 362,089 |
Receivable for fund shares sold | | 191,306 |
Dividends receivable | | 23,790 |
Distributions receivable from Fidelity Central Funds | | 308 |
Prepaid expenses | | 54 |
Other receivables | | 1,017 |
Total assets | | 44,005,485 |
| | |
Liabilities | | |
Payable for investments purchased | $ 1,470,424 | |
Payable for fund shares redeemed | 75,466 | |
Accrued management fee | 19,956 | |
Other affiliated payables | 4,826 | |
Other payables and accrued expenses | 40,702 | |
Total liabilities | | 1,611,374 |
| | |
Net Assets | | $ 42,394,111 |
Net Assets consist of: | | |
Paid in capital | | $ 39,772,179 |
Accumulated undistributed net realized gain (loss) on investments and foreign currency transactions | | (1,431,269) |
Net unrealized appreciation (depreciation) on investments and assets and liabilities in foreign currencies | | 4,053,201 |
Net Assets | | $ 42,394,111 |
Statement of Assets and Liabilities - continued
| December 31, 2010 |
| | |
Initial Class:
Net Asset Value, offering price and redemption price per share ($18,112,697 ÷ 1,442,296 shares) | | $ 12.56 |
| | |
Investor Class:
Net Asset Value, offering price and redemption price per share ($24,281,414 ÷ 1,936,415 shares) | | $ 12.54 |
See accompanying notes which are an integral part of the financial statements.
Annual Report
Statement of Operations
| Year ended December 31, 2010 |
| | |
Investment Income | | |
Dividends | | $ 227,801 |
Interest | | 3 |
Income from Fidelity Central Funds | | 1,127 |
Total income | | 228,931 |
| | |
Expenses | | |
Management fee | $ 104,595 | |
Transfer agent fees | 28,885 | |
Accounting fees and expenses | 7,279 | |
Custodian fees and expenses | 32,457 | |
Independent trustees' compensation | 92 | |
Audit | 37,346 | |
Legal | 64 | |
Miscellaneous | 155 | |
Total expenses before reductions | 210,873 | |
Expense reductions | (16,376) | 194,497 |
Net investment income (loss) | | 34,434 |
Realized and Unrealized Gain (Loss) Net realized gain (loss) on: | | |
Investment securities: | | |
Unaffiliated issuers | 809,233 | |
Foreign currency transactions | 181 | |
Total net realized gain (loss) | | 809,414 |
Change in net unrealized appreciation (depreciation) on: Investment securities (net of increase in deferred foreign taxes of $2,466) | 3,250,811 | |
Assets and liabilities in foreign currencies | 133 | |
Total change in net unrealized appreciation (depreciation) | | 3,250,944 |
Net gain (loss) | | 4,060,358 |
Net increase (decrease) in net assets resulting from operations | | $ 4,094,792 |
Statement of Changes in Net Assets
| Year ended
December 31, 2010 | Year ended
December 31, 2009 |
Increase (Decrease) in Net Assets | | |
Operations | | |
Net investment income (loss) | $ 34,434 | $ 36,995 |
Net realized gain (loss) | 809,414 | (649,462) |
Change in net unrealized appreciation (depreciation) | 3,250,944 | 2,832,342 |
Net increase (decrease) in net assets resulting
from operations | 4,094,792 | 2,219,875 |
Distributions to shareholders from net investment income | (46,369) | (39,751) |
Share transactions - net increase (decrease) | 29,996,122 | 1,609,010 |
Redemption fees | 27,571 | 8,313 |
Total increase (decrease) in net assets | 34,072,116 | 3,797,447 |
| | |
Net Assets | | |
Beginning of period | 8,321,995 | 4,524,548 |
End of period | $ 42,394,111 | $ 8,321,995 |
See accompanying notes which are an integral part of the financial statements.
Annual Report
Financial Highlights - Initial Class
Years ended December 31, | 2010 | 2009 | 2008 | 2007 | 2006 |
Selected Per-Share Data | | | | | |
Net asset value, beginning of period | $ 9.58 | $ 6.96 | $ 10.72 | $ 12.84 | $ 11.45 |
Income from Investment Operations | | | | | |
Net investment income (loss) C | .02 | .04 | .04 | (.01) | .11 F |
Net realized and unrealized gain (loss) | 2.96 | 2.62 | (3.68) | (1.02) | 1.33 |
Total from investment operations | 2.98 | 2.66 | (3.64) | (1.03) | 1.44 |
Distributions from net investment income | (.02) | (.05) | (.05) | (.02) | (.06) |
Distributions from net realized gain | - | - | (.09) | (1.08) | - |
Total distributions | (.02) | (.05) | (.13) H | (1.10) | (.06) |
Redemption fees added to paid in capital C | .02 | .01 | .01 | .01 | .01 |
Net asset value, end of period | $ 12.56 | $ 9.58 | $ 6.96 | $ 10.72 | $ 12.84 |
Total Return A, B | 31.29% | 38.32% | (34.10)% | (8.14)% | 12.63% |
Ratios to Average Net Assets D, G | | | | | |
Expenses before reductions | 1.08% | 1.43% | 1.40% | 1.10% | 1.20% |
Expenses net of fee waivers, if any | 1.00% | 1.00% | 1.00% | 1.01% | 1.15% |
Expenses net of all reductions | .98% | .99% | 1.00% | 1.01% | 1.14% |
Net investment income (loss) | .23% | .57% | .48% | (.07)% | .90% F |
Supplemental Data | | | | | |
Net assets, end of period (000 omitted) | $ 18,113 | $ 4,098 | $ 3,212 | $ 6,989 | $ 13,866 |
Portfolio turnover rate E | 191% | 166% | 81% | 114% | 189% |
A Total returns do not reflect charges attributable to your insurance company's separate account. Inclusion of these charges would reduce the total returns shown.
B Total returns would have been lower had certain expenses not been reduced during the periods shown.
C Calculated based on average shares outstanding during the period.
D Fees and expenses of the underlying Fidelity Central Funds are not included in the Fund's expense ratio. The Fund indirectly bears its proportionate share of the expenses of any underlying Fidelity Central Funds.
E Amount does not include the portfolio activity of any underlying Fidelity Central Funds.
F Investment income per share reflects special dividends which amounted to $.09 per share. Excluding these special dividends, the ratio of net investment income (loss) to average net assets would have been .13%.
G Expense ratios reflect operating expenses of the class. Expenses before reductions do not reflect amounts reimbursed by the investment adviser or reductions from brokerage service arrangements or reductions from other expense offset arrangements and do not represent the amount paid by the class during periods when reimbursements or reductions occur. Expenses net of fee waivers reflect expenses after reimbursement by the investment adviser but prior to reductions from brokerage service arrangements or other expense offset arrangements. Expenses net of all reductions represent the net expenses paid by the class.
H Total distributions of $.13 per share is comprised of distributions from net investment income of $.046 and distributions from net realized gain of $.085 per share.
Financial Highlights - Investor Class
Years ended December 31, | 2010 | 2009 | 2008 | 2007 | 2006 |
Selected Per-Share Data | | | | | |
Net asset value, beginning of period | $ 9.57 | $ 6.96 | $ 10.72 | $ 12.83 | $ 11.44 |
Income from Investment Operations | | | | | |
Net investment income (loss) C | .02 | .04 | .04 | (.03) | .10 F |
Net realized and unrealized gain (loss) | 2.94 | 2.61 | (3.68) | (1.02) | 1.33 |
Total from investment operations | 2.96 | 2.65 | (3.64) | (1.05) | 1.43 |
Distributions from net investment income | (.01) | (.05) | (.05) | (.02) | (.05) |
Distributions from net realized gain | - | - | (.09) | (1.05) | - |
Total distributions | (.01) | (.05) | (.13) H | (1.07) | (.05) |
Redemption fees added to paid in capital C | .02 | .01 | .01 | .01 | .01 |
Net asset value, end of period | $ 12.54 | $ 9.57 | $ 6.96 | $ 10.72 | $ 12.83 |
Total Return A, B | 31.16% | 38.17% | (34.10)% | (8.29)% | 12.62% |
Ratios to Average Net Assets D, G | | | | | |
Expenses before reductions | 1.14% | 1.51% | 1.54% | 1.24% | 1.41% |
Expenses net of fee waivers, if any | 1.08% | 1.08% | 1.09% | 1.15% | 1.25% |
Expenses net of all reductions | 1.06% | 1.08% | 1.09% | 1.15% | 1.24% |
Net investment income (loss) | .15% | .48% | .39% | (.21)% | .80% F |
Supplemental Data | | | | | |
Net assets, end of period (000 omitted) | $ 24,281 | $ 4,224 | $ 1,313 | $ 2,352 | $ 4,256 |
Portfolio turnover rate E | 191% | 166% | 81% | 114% | 189% |
A Total returns do not reflect charges attributable to your insurance company's separate account. Inclusion of these charges would reduce the total returns shown.
B Total returns would have been lower had certain expenses not been reduced during the periods shown.
C Calculated based on average shares outstanding during the period.
D Fees and expenses of the underlying Fidelity Central Funds are not included in the Fund's expense ratio. The Fund indirectly bears its proportionate share of the expenses of any underlying Fidelity Central Funds.
E Amount does not include the portfolio activity of any underlying Fidelity Central Funds.
F Investment income per share reflects special dividends which amounted to $.09 per share. Excluding these special dividends, the ratio of net investment income (loss) to average net assets would have been .03%.
G Expense ratios reflect operating expenses of the class. Expenses before reductions do not reflect amounts reimbursed by the investment adviser or reductions from brokerage service arrangements or reductions from other expense offset arrangements and do not represent the amount paid by the class during periods when reimbursements or reductions occur. Expenses net of fee waivers reflect expenses after reimbursement by the investment adviser but prior to reductions from brokerage service arrangements or other expense offset arrangements. Expenses net of all reductions represent the net expenses paid by the class.
H Total distributions of $.13 per share is comprised of distributions from net investment income of $.046 and distributions from net realized gain of $.085 per share.
See accompanying notes which are an integral part of the financial statements.
Annual Report
Notes to Financial Statements
For the period ended December 31, 2010
1. Organization.
VIP Consumer Discretionary Portfolio (the Fund) is a non-diversified fund of Variable Insurance Products Fund IV (the Trust) and is authorized to issue an unlimited number of shares. The Trust is registered under the Investment Company Act of 1940, as amended (the 1940 Act), as an open-end management investment company organized as a Massachusetts business trust. Shares of the Fund may only be purchased by insurance companies for the purpose of funding variable annuity or variable life insurance contracts. The Fund offers the following classes of shares: Initial Class shares and Investor Class shares. All classes have equal rights and voting privileges, except for matters affecting a single class. Investment income, realized and unrealized capital gains and losses, the common expenses of the Fund, and certain fund-level expense reductions, if any, are allocated on a pro-rata basis to each class based on the relative net assets of each class to the total net assets of the Fund. Each class differs with respect to transfer agent fees incurred. Certain expense reductions may also differ by class.
2. Investments in Fidelity Central Funds.
The Fund may invest in Fidelity Central Funds, which are open-end investment companies available only to other investment companies and accounts managed by Fidelity Management & Research Company (FMR) and its affiliates. The Fund's Schedule of Investments lists each of the Fidelity Central Funds held as of period end, if any, as an investment of the Fund, but does not include the underlying holdings of each Fidelity Central Fund. As an Investing Fund, the Fund indirectly bears its proportionate share of the expenses of the underlying Fidelity Central Funds.
The Money Market Central Funds seek preservation of capital and current income and are managed by Fidelity Investments Money Management, Inc. (FIMM), an affiliate of FMR.
A complete unaudited list of holdings for each Fidelity Central Fund is available upon request or at the Securities and Exchange Commission (the SEC) web site at www.sec.gov. In addition, the financial statements of the Fidelity Central Funds, which are not covered by the Fund's Report of Independent Registered Public Accounting Firm, are available on the SEC web site or upon request.
3. Significant Accounting Policies.
The financial statements have been prepared in conformity with accounting principles generally accepted in the United States of America (GAAP), which require management to make certain estimates and assumptions at the date of the financial statements. Actual results could differ from those estimates. Subsequent events, if any, through the date that the financial statements were issued have been evaluated in the preparation of the financial statements. The following summarizes the significant accounting policies of the Fund:
Security Valuation. Investments are valued as of 4:00 p.m. Eastern time on the last calendar day of the period. The Fund uses independent pricing services approved by the Board of Trustees to value its investments. When current market prices or quotations are not readily available or reliable, valuations may be determined in good faith in accordance with procedures adopted by the Board of Trustees. Factors used in determining value may include market or security specific events. The frequency with which these procedures are used cannot be predicted and they may be utilized to a significant extent. The value used for net asset value (NAV) calculation under these procedures may differ from published prices for the same securities.
The Fund categorizes the inputs to valuation techniques used to value its investments into a disclosure hierarchy consisting of three levels as shown below.
Level 1 - quoted prices in active markets for identical investments
Level 2 - other significant observable inputs (including quoted prices for similar investments, interest rates, prepayment speeds, etc.)
Level 3 - unobservable inputs (including the Fund's own assumptions based on the best information available)
Changes in valuation techniques may result in transfers in or out of an assigned level within the disclosure hierarchy. The aggregate value of investments by input level, as of December 31, 2010, is included at the end of the Fund's Schedule of Investments. Valuation techniques used to value the Fund's investments by major category are as follows.
Equity securities, including restricted securities, for which market quotations are readily available, are valued at the last reported sale price or official closing price as reported by an independent pricing service on the primary market or exchange on which they are traded and are categorized as Level 1 in the hierarchy. In the event there were no sales during the day or closing prices are not available, securities are valued at the last quoted bid price or may be valued using the last available price and are generally categorized as Level 2 in the hierarchy. For foreign equity securities, when significant market or security specific events arise, comparisons to the valuation of American Depositary Receipts (ADRs), futures contracts, Exchange-traded funds (ETFs) and certain indexes as well as quoted prices for similar securities are used and are categorized as Level 2 in the hierarchy in these circumstances. Utilizing these techniques may result in transfers between Level 1 and Level 2. For restricted equity securities and private placements where observable inputs are limited, assumptions about market activity and risk are used and are categorized as Level 3 in the hierarchy.
Investments in open-end mutual funds, including the Fidelity Central Funds, are valued at their closing net asset value each business day and are categorized as Level 1 in the hierarchy.
Annual Report
Notes to Financial Statements - continued
3. Significant Accounting Policies - continued
Foreign Currency. The Fund uses foreign currency contracts to facilitate transactions in foreign-denominated securities. Gains and losses from these transactions may arise from changes in the value of the foreign currency or if the counterparties do not perform under the contracts' terms.
Foreign-denominated assets, including investment securities, and liabilities are translated into U.S. dollars at the exchange rate at period end. Purchases and sales of investment securities, income and dividends received and expenses denominated in foreign currencies are translated into U.S. dollars at the exchange rate in effect on the transaction date.
The effects of exchange rate fluctuations on investments are included with the net realized and unrealized gain (loss) on investment securities. Other foreign currency transactions resulting in realized and unrealized gain (loss) are disclosed separately.
Investment Transactions and Income. For financial reporting purposes, the Fund's investment holdings and NAV include trades executed through the end of the last business day of the period. The NAV per share for processing shareholder transactions is calculated as of the close of business of the New York Stock Exchange (NYSE), normally 4:00 p.m. Eastern time and includes trades executed through the end of the prior business day. Gains and losses on securities sold are determined on the basis of identified cost and may include proceeds received from litigation. Dividend income is recorded on the ex-dividend date, except for certain dividends from foreign securities where the ex-dividend date may have passed, which are recorded as soon as the Fund is informed of the ex-dividend date. Non-cash dividends included in dividend income, if any, are recorded at the fair market value of the securities received. Distributions received on securities that represent a return of capital or capital gain are recorded as a reduction of cost of investments and/or as a realized gain. The Fund estimates the components of distributions received that may be considered return of capital distributions or capital gain distributions. Interest income and distributions from the Fidelity Central Funds are accrued as earned. Interest income includes coupon interest and amortization of premium and accretion of discount on debt securities. Investment income is recorded net of foreign taxes withheld where recovery of such taxes is uncertain.
Expenses. Expenses directly attributable to a fund are charged to that fund. Expenses attributable to more than one fund are allocated among the respective funds on the basis of relative net assets or other appropriate methods. Expense estimates are accrued in the period to which they relate and adjustments are made when actual amounts are known.
Income Tax Information and Distributions to Shareholders. Each year the Fund intends to qualify as a regulated investment company, including distributing substantially all of its taxable income and realized gains under Subchapter M of the Internal Revenue Code and filing its U.S. federal tax return. As a result, no provision for income taxes is required. As of December 31, 2010, the Fund did not have any unrecognized tax benefits in the accompanying financial statements. A fund's federal tax return is subject to examination by the Internal Revenue Service (IRS) for a period of three years. Foreign taxes are provided for based on the Fund's understanding of the tax rules and rates that exist in the foreign markets in which it invests. The Fund is subject to a tax imposed on realized short term capital gains on securities of certain issuers domiciled in India. An estimated deferred tax liability for net unrealized gains on these securities is included in Other payables and accrued expenses on the Statement of Assets & Liabilities.
Distributions are declared and recorded on the ex-dividend date. Income dividends and capital gain distributions are declared separately for each class. Income and capital gain distributions are determined in accordance with income tax regulations, which may differ from GAAP.
Capital accounts within the financial statements are adjusted for permanent book-tax differences. These adjustments have no impact on net assets or the results of operations. Temporary book-tax differences will reverse in a subsequent period.
Book-tax differences are primarily due to foreign currency transactions, capital loss carryforwards and losses deferred due to wash sales and excise tax regulations.
The federal tax cost of investment securities and unrealized appreciation (depreciation) as of period end were as follows:
Gross unrealized appreciation | $ 4,443,348 |
Gross unrealized depreciation | (558,893) |
Net unrealized appreciation (depreciation) | $ 3,884,455 |
| |
Tax Cost | $ 39,542,466 |
The tax-based components of distributable earnings as of period end were as follows:
Capital loss carryforward | $ (1,260,189) |
Net unrealized appreciation (depreciation) | $ 3,884,585 |
The tax character of distributions paid was as follows:
| December 31, 2010 | December 31, 2009 |
Ordinary Income | $ 46,369 | $ 39,751 |
Annual Report
3. Significant Accounting Policies - continued
Trading (Redemption) Fees. Initial Class shares and Investor Class shares held by investors less than 60 days are subject to a redemption fee equal to 1% of the net asset value of shares redeemed. All redemption fees, which reduce the proceeds of the shareholder redemption, are retained by the Fund and accounted for as an addition to paid in capital.
4. Purchases and Sales of Investments.
Purchases and sales of securities short-term securities, aggregated $65,791,630 and $35,950,977, respectively.
5. Fees and Other Transactions with Affiliates.
Management Fee. FMR and its affiliates provide the Fund with investment management related services for which the Fund pays a monthly management fee. The management fee is the sum of an individual fund fee rate that is based on an annual rate of .30% of the Fund's average net assets and a group fee rate that averaged .26% during the period. The group fee rate is based upon the average net assets of all the mutual funds advised by FMR. The group fee rate decreases as assets under management increase and increases as assets under management decrease. For the period, the total annual management fee rate was .55% of the Fund's average net assets.
Transfer Agent Fees. Fidelity Investments Institutional Operations Company, Inc. (FIIOC), an affiliate of FMR, is the Fund's transfer, dividend disbursing, and shareholder servicing agent. FIIOC receives an asset-based fee with respect to each class. Each class (with the exception of Investor Class) pays a transfer agent fee, excluding out of pocket expenses, equal to an annual rate of .07% of average net assets. Investor Class pays a monthly asset-based transfer agent fee of .15% of average net assets. In addition, FIIOC receives an asset-based fee of .01% of average net assets for typesetting, printing and mailing of shareholder reports, except proxy statements. FIIOC has agreed to voluntarily waive this fee until December 31, 2010. (See Note 7: Expense Reductions.) For the period, transfer agent fees for each class, including printing and out of pocket expenses, were as follows:
Initial Class | $ 8,998 |
Investor Class | 19,887 |
| $ 28,885 |
Accounting Fees. Fidelity Service Company, Inc. (FSC), an affiliate of FMR, maintains the Fund's accounting records. The fee is based on the level of average net assets for the month.
Brokerage Commissions. The Fund placed a portion of its portfolio transactions with brokerage firms which are affiliates of the investment adviser. The commissions paid to these affiliated firms were $3,310 for the period.
6. Committed Line of Credit.
The Fund participates with other funds managed by FMR or an affiliate in a $3.75 billion credit facility (the "line of credit") to be utilized for temporary or emergency purposes to fund shareholder redemptions or for other short-term liquidity purposes. The Fund has agreed to pay commitment fees on its pro-rata portion of the line of credit, which amounted to $53 and is reflected in Miscellaneous expenses on the Statement of Operations. During the period, there were no borrowings on this line of credit.
7. Expense Reductions.
In addition to FIIOC waiving a portion of its transfer agent fees, FMR voluntarily agreed to reimburse each class to the extent annual operating expenses exceeded certain levels of average net assets as noted in the table below. Some expenses, for example interest expense, including commitment fees, are excluded from this reimbursement.
The following classes were in reimbursement during the period:
| Expense
Limitations | Reimbursement/
Waiver |
Initial Class | 1.00% | $ 7,081 |
Investor Class | 1.08 | 6,905 |
| | $ 13,986 |
Many of the brokers with whom FMR places trades on behalf of the Fund provided services to the Fund in addition to trade execution. These services included payments of certain expenses on behalf of the Fund totaling $2,390 for the period
Annual Report
Notes to Financial Statements - continued
8. Distributions to Shareholders.
Distributions to shareholders of each class were as follows:
Years ended December 31, | 2010 | 2009 |
From net investment income | | |
Initial Class | $ 24,605 | $ 19,436 |
Investor Class | 21,764 | 20,315 |
Total | $ 46,369 | $ 39,751 |
9. Share Transactions.
Transactions for each class of shares were as follows:
| Shares | Dollars |
Years ended December 31, | 2010 | 2009 | 2010 | 2009 |
Initial Class | | | | |
Shares sold | 1,403,892 | 387,558 | $ 16,356,186 | $ 2,878,099 |
Reinvestment of distributions | 1,962 | 2,071 | 24,605 | 19,436 |
Shares redeemed | (391,168) | (423,292) | (4,016,992) | (3,190,755) |
Net increase (decrease) | 1,014,686 | (33,663) | $ 12,363,799 | $ (293,220) |
Investor Class | | | | |
Shares sold | 1,964,116 | 573,242 | $ 22,469,975 | $ 4,445,239 |
Reinvestment of distributions | 1,738 | 2,151 | 21,764 | 20,315 |
Shares redeemed | (470,793) | (322,598) | (4,859,416) | (2,563,324) |
Net increase (decrease) | 1,495,061 | 252,795 | $ 17,632,323 | $ 1,902,230 |
10. Other.
The Fund's organizational documents provide former and current trustees and officers with a limited indemnification against liabilities arising in connection with the performance of their duties to the Fund. In the normal course of business, the Fund may also enter into contracts that provide general indemnifications. The Fund's maximum exposure under these arrangements is unknown as this would be dependent on future claims that may be made against the Fund. The risk of material loss from such claims is considered remote.
At the end of the period, FMR or its affiliates were the owners of record of 100% of the total outstanding shares of the Fund.
Annual Report
Report of Independent Registered Public Accounting Firm
To the Trustees of Variable Insurance Products Fund IV and the Shareholders of VIP Consumer Discretionary Portfolio:
In our opinion, the accompanying statement of assets and liabilities, including the schedule of investments, and the related statements of operations and of changes in net assets and the financial highlights present fairly, in all material respects, the financial position of VIP Consumer Discretionary Portfolio (a fund of Variable Insurance Products Fund IV) at December 31, 2010, the results of its operations for the year then ended, the changes in its net assets for each of the two years in the period then ended and the financial highlights for each of the five years in the period then ended, in conformity with accounting principles generally accepted in the United States of America. These financial statements and financial highlights (hereafter referred to as "financial statements") are the responsibility of the VIP Consumer Discretionary Portfolio's management. Our responsibility is to express an opinion on these financial statements based on our audits. We conducted our audits of these financial statements in accordance with the standards of the Public Company Accounting Oversight Board (United States). Those standards require that we plan and perform the audit to obtain reasonable assurance about whether the financial statements are free of material misstatement. An audit includes examining, on a test basis, evidence supporting the amounts and disclosures in the financial statements, assessing the accounting principles used and significant estimates made by management, and evaluating the overall financial statement presentation. We believe that our audits, which included confirmation of securities at December 31, 2010 by correspondence with the custodian and brokers, provide a reasonable basis for our opinion.
/s/ PricewaterhouseCoopers LLP
PricewaterhouseCoopers LLP
Boston, Massachusetts
February 17, 2011
Annual Report
The Trustees, Members of the Advisory Board, and executive officers of the trust and funds, as applicable, are listed below. The Board of Trustees governs each fund and is responsible for protecting the interests of shareholders. The Trustees are experienced executives who meet periodically throughout the year to oversee each fund's activities, review contractual arrangements with companies that provide services to each fund, oversee management of the risks associated with such activities and contractual arrangements, and review each fund's performance. Except for James C. Curvey, each of the Trustees oversees 219 funds advised by FMR or an affiliate. Mr. Curvey oversees 408 funds advised by FMR or an affiliate.
The Trustees hold office without limit in time except that (a) any Trustee may resign; (b) any Trustee may be removed by written instrument, signed by at least two-thirds of the number of Trustees prior to such removal; (c) any Trustee who requests to be retired or who has become incapacitated by illness or injury may be retired by written instrument signed by a majority of the other Trustees; and (d) any Trustee may be removed at any special meeting of shareholders by a two-thirds vote of the outstanding voting securities of the trust. Each Trustee who is not an interested person (as defined in the 1940 Act) (Independent Trustee), shall retire not later than the last day of the calendar year in which his or her 72nd birthday occurs. The Independent Trustees may waive this mandatory retirement age policy with respect to individual Trustees. The executive officers and Advisory Board Members hold office without limit in time, except that any officer and Advisory Board Member may resign or may be removed by a vote of a majority of the Trustees at any regular meeting or any special meeting of the Trustees. Except as indicated, each individual has held the office shown or other offices in the same company for the past five years.
Experience, Skills, Attributes, and Qualifications of the Fund's Trustees. The Governance and Nominating Committee has adopted a statement of policy that describes the experience, qualifications, attributes, and skills that are necessary and desirable for potential Independent Trustee candidates (Statement of Policy). The Board believes that each Trustee satisfied at the time he or she was initially elected or appointed a Trustee, and continues to satisfy, the standards contemplated by the Statement of Policy. The Governance and Nominating Committee also engages professional search firms to help identify potential Independent Trustee candidates who have the experience, qualifications, attributes, and skills consistent with the Statement of Policy. From time to time, additional criteria based on the composition and skills of the current Independent Trustees, as well as experience or skills that may be appropriate in light of future changes to board composition, business conditions, and regulatory or other developments, have also been considered by the professional search firms and the Governance and Nominating Committee. In addition, the Board takes into account the Trustees' commitment and participation in Board and committee meetings, as well as their leadership of standing and ad hoc committees throughout their tenure.
In determining that a particular Trustee was and continues to be qualified to serve as a Trustee, the Board has considered a variety of criteria, none of which, in isolation, was controlling. The Board believes that, collectively, the Trustees have balanced and diverse experience, qualifications, attributes, and skills, which allow the Board to operate effectively in governing each fund and protecting the interests of shareholders. Information about the specific experience, skills, attributes, and qualifications of each Trustee, which in each case led to the Board's conclusion that the Trustee should serve (or continue to serve) as a trustee of the funds, is provided below.
Board Structure and Oversight Function. James C. Curvey is an interested person (as defined in the 1940 Act) and currently serves as Acting Chairman. The Trustees have determined that an interested Chairman is appropriate and benefits shareholders because an interested Chairman has a personal and professional stake in the quality and continuity of services provided to the funds. Independent Trustees exercise their informed business judgment to appoint an individual of their choosing to serve as Chairman, regardless of whether the Trustee happens to be independent or a member of management. The Independent Trustees have determined that they can act independently and effectively without having an Independent Trustee serve as Chairman and that a key structural component for assuring that they are in a position to do so is for the Independent Trustees to constitute a substantial majority for the Board. The Independent Trustees also regularly meet in executive session. Ned C. Lautenbach serves as Chairman of the Independent Trustees and as such (i) acts as a liaison between the Independent Trustees and management with respect to matters important to the Independent Trustees and (ii) with management prepares agendas for Board meetings.
Fidelity funds are overseen by different Boards of Trustees. The funds' Board oversees Fidelity's equity and high income funds and another Board oversees Fidelity's investment-grade bond, money market, and asset allocation funds. The asset allocation funds may invest in Fidelity funds overseen by the funds' Board. The use of separate Boards, each with its own committee structure, allows the Trustees of each group of Fidelity funds to focus on the unique issues of the funds they oversee, including common research, investment, and operational issues. On occasion, the separate Boards establish joint committees to address issues of overlapping consequences for the Fidelity funds overseen by each Board.
The Trustees operate using a system of committees to facilitate the timely and efficient consideration of all matters of importance to the Trustees, each fund, and fund shareholders and to facilitate compliance with legal and regulatory requirements and oversight of the funds' activities and associated risks. The Board, acting through its committees, has charged FMR and its affiliates with (i) identifying events or circumstances the occurrence of which could have demonstrably adverse effects on the funds' business and/or reputation; (ii) implementing processes and controls to lessen the possibility that such events or circumstances occur or to mitigate the effects of such events or circumstances if they do occur; and (iii) creating and maintaining a system designed to evaluate continuously business and market conditions in order to facilitate the identification and implementation processes described in (i) and (ii) above. Because the day-to-day operations and activities of the funds are carried out by or through FMR, its affiliates and other service providers, the funds' exposure to risks is mitigated but not eliminated by the processes overseen by the Trustees. While each of the Board's committees has responsibility for overseeing different aspects of the funds' activities, oversight is exercised primarily through the Operations, Audit, and Compliance Committees. Appropriate personnel, including but not limited to the funds' Chief Compliance Officer (CCO), FMR's internal auditor, the independent accountants, the funds' Treasurer and portfolio management personnel, make periodic reports to the Board's committees, as appropriate. The responsibilities of each committee, including their oversight responsibilities, are described further under "Standing Committees of the Fund's Trustees."
Annual Report
Trustees and Officers - continued
The fund's Statement of Additional Information (SAI) includes more information about the Trustees. To request a free copy, call Fidelity at 1-877-208-0098.
Interested Trustees*:
Correspondence intended for each Trustee who is an interested person may be sent to Fidelity Investments, 82 Devonshire Street, Boston, Massachusetts 02109.
Name, Age; Principal Occupations and Other Relevant Experience+ |
James C. Curvey (75) |
| Year of Election or Appointment: 2007 Mr. Curvey is Trustee and Acting Chairman of the Board of Trustees of certain Trusts. Mr. Curvey also serves as Trustee (2007-present) of other investment companies advised by FMR. Mr. Curvey is a Director of Fidelity Investments Money Management, Inc. (2009-present), Director of Fidelity Research & Analysis Co. (2009-present) and Director of FMR and FMR Co., Inc. (2007-present). Mr. Curvey is also Vice Chairman (2007-present) and Director of FMR LLC. In addition, Mr. Curvey serves as an Overseer for the Boston Symphony Orchestra and a member of the Trustees of Villanova University. Previously, Mr. Curvey was the Vice Chairman (2006-2007) and Director (2000-2007) of FMR Corp. |
Ronald P. O'Hanley (54) |
| Year of Election or Appointment: 2011 Mr. O'Hanley is President of Fidelity Asset Management and Corporate Services and a member of Fidelity's Executive Committee (2010-present). Previously, Mr. O'Hanley served as President and Chief Executive Officer of BNY Mellon Asset Management (2007-2010). Mr. O'Hanley also served as Vice Chairman of Bank New York Mellon Corp. and a member of that firm's Executive Committee. Prior to the 2007 merger of The Bank of New York and Mellon Financial Corporation, he was Vice Chairman of Mellon Financial Corporation and President and Chief Executive Officer of Mellon Asset Management. He joined Mellon in February 1997. Mr. O'Hanley currently serves as Chairman of the Boston Public Library Foundation Board of Directors and sits on the Board of Directors of Beth Israel Deaconess Medical Center, the Board of Trustees of the Marine Biological Laboratory and the Advisory Board of the Maxwell School of Citizenship and Public Administration at Syracuse University. Mr. O'Hanley also chairs the Council on Asset Management for the Financial Services Roundtable and is a member of the Board of Directors of Institutional Investor's U.S. Institute. |
* Trustees have been determined to be "Interested Trustees" by virtue of, among other things, their affiliation with the trust or various entities under common control with FMR.
+ The information above includes each Trustee's principal occupation during the last five years and other information relating to the experience, attributes, and skills relevant to each Trustee's qualifications to serve as a Trustee, which led to the conclusion that each Trustee should serve as a Trustee for each fund.
Independent Trustees:
Correspondence intended for each Independent Trustee (that is, the Trustees other than the Interested Trustees) may be sent to Fidelity Investments, P.O. Box 55235, Boston, Massachusetts 02205-5235.
Name, Age; Principal Occupations and Other Relevant Experience+ |
Dennis J. Dirks (62) |
| Year of Election or Appointment: 2005 Prior to his retirement in May 2003, Mr. Dirks was Chief Operating Officer and a member of the Board of The Depository Trust & Clearing Corporation (DTCC). He also served as President, Chief Operating Officer, and Board member of The Depository Trust Company (DTC) and President and Board member of the National Securities Clearing Corporation (NSCC). In addition, Mr. Dirks served as Chief Executive Officer and Board member of the Government Securities Clearing Corporation, Chief Executive Officer and Board member of the Mortgage-Backed Securities Clearing Corporation, as a Trustee and a member of the Finance Committee of Manhattan College (2005-2008), and as a Trustee and a member of the Finance Committee of AHRC of Nassau County (2006-2008). Mr. Dirks is a member of the Independent Directors Council (IDC) Governing Council (2010-Present) and Board of Directors for The Brookville Center for Children's Services, Inc. (2009-present). |
Alan J. Lacy (57) |
| Year of Election or Appointment: 2008 Mr. Lacy serves as Senior Adviser (2007-present) of Oak Hill Capital Partners, L.P. (private equity). Mr. Lacy also served as Chief Executive Officer (2000-2005) and Vice Chairman (2005-2006) of Sears Holdings Corporation and Sears, Roebuck and Co. (retail). In addition, Mr. Lacy serves as a member of the Board of Directors of The Western Union Company (global money transfer, 2006-present) and Bristol-Myers Squibb Company (global pharmaceuticals, 2007-present). Mr. Lacy is Chairman (2008-present) and a member (2006-present) of the Board of Trustees of The National Parks Conservation Association. |
Ned C. Lautenbach (66) |
| Year of Election or Appointment: 2000 Mr. Lautenbach is Chairman of the Independent Trustees of the Equity and High Income Funds (2006-present). Mr. Lautenbach currently serves as the Lead Director of the Eaton Corporation Board of Directors (diversified industrial, 1997-present). Mr. Lautenbach is also a member of the Board of Directors of the Philharmonic Center for the Arts in Naples, Florida (1999-present); a member of the Board of Trustees of Fairfield University (2005-present); and a member of the Council on Foreign Relations (1994-present). Previously, Mr. Lautenbach was a Partner/Advisory Partner at Clayton, Dubilier & Rice, Inc. (private equity investment, 1998-2010), as well as a Director of Sony Corporation (2006-2007). |
Joseph Mauriello (66) |
| Year of Election or Appointment: 2008 Prior to his retirement in January 2006, Mr. Mauriello served in numerous senior management positions including Deputy Chairman and Chief Operating Officer (2004-2005), and Vice Chairman of Financial Services (2002-2004) of KPMG LLP US (professional services, 1965-2005). Mr. Mauriello currently serves as a member of the Board of Directors of XL Group plc. (global insurance and re-insurance, 2006-present) and of Arcadia Resources Inc. (health care services and products, 2007-present). Previously, Mr. Mauriello served as a Director of the Hamilton Funds of the Bank of New York (2006-2007). |
Cornelia M. Small (66) |
| Year of Election or Appointment: 2005 Ms. Small is a member of the Board of Directors of the Teagle Foundation (2009-present). Ms. Small is also a member of the Investment Committee, and Chair (2008-present) and a member of the Board of Trustees of Smith College. In addition, Ms. Small serves on the Investment Committee of the Berkshire Taconic Community Foundation (2008-present). Previously, Ms. Small served as Chairperson of the Investment Committee (2002-2008) of Smith College. In addition, Ms. Small served as Chief Investment Officer, Director of Global Equity Investments, and a member of the Board of Directors of Scudder, Stevens & Clark and Scudder Kemper Investments. |
William S. Stavropoulos (71) |
| Year of Election or Appointment: 2001 Mr. Stavropoulos is Vice Chairman of the Independent Trustees of the Equity and High Income Funds (2006-present). Mr. Stavropoulos serves as President and Founder of the Michigan Baseball Foundation, the Great Lakes Loons (2007-present). Mr. Stavropoulos is Chairman Emeritus of the Board of Directors of The Dow Chemical Company, where he previously served in numerous senior management positions, including President, CEO (1995-2000; 2002-2004), Chairman of the Executive Committee (2000-2006), and as a member of the Board of Directors (1990-2006). Currently, Mr. Stavropoulos is Chairman of Univar (global distributor of commodity and specialty chemicals, 2010-present), a Director of Teradata Corporation (data warehousing and technology solutions, 2008-present), Chemical Financial Corporation, Maersk Inc. (industrial conglomerate), Tyco International, Inc. (multinational manufacturing and services, 2007-present), and a member of the Advisory Board for Metalmark Capital (private equity investment, 2005-present). Mr. Stavropoulos is a special advisor to Clayton, Dubilier & Rice, LLC (private equity investment). In addition, Mr. Stavropoulos is a member of the University of Notre Dame Advisory Council for the College of Science. |
David M. Thomas (61) |
| Year of Election or Appointment: 2008 Previously, Mr. Thomas served as Executive Chairman (2005-2006) and Chairman and Chief Executive Officer (2000-2005) of IMS Health, Inc. (pharmaceutical and healthcare information solutions). In addition, Mr. Thomas serves as a member of the Board of Directors of Fortune Brands, Inc. (consumer products), and Interpublic Group of Companies, Inc. (marketing communication, 2004-present). |
Michael E. Wiley (60) |
| Year of Election or Appointment: 2008 Mr. Wiley also serves as a Director of Asia Pacific Exploration Consolidated (international oil and gas exploration and production, 2008-present). Mr. Wiley serves as a Director of Tesoro Corporation (independent oil refiner and marketer, 2005-present), and a Director of Bill Barrett Corporation (exploration and production, 2005-present). In addition, Mr. Wiley also serves as a Director of Post Oak Bank (privately-held bank, 2004-present). Previously, Mr. Wiley served as a member of the Board of Trustees of the University of Tulsa (2000-2006; 2007-2010), as a Senior Energy Advisor of Katzenbach Partners, LLC (consulting, 2006-2007), as an Advisory Director of Riverstone Holdings (private investment), Chairman, President, and CEO of Baker Hughes, Inc. (oilfield services, 2000-2004), and as Director of Spinnaker Exploration Company (exploration and production, 2001-2005). |
+ The information above includes each Trustee's principal occupation during the last five years and other information relating to the experience, attributes, and skills relevant to each Trustee's qualifications to serve as a Trustee, which led to the conclusion that each Trustee should serve as a Trustee for each fund.
Annual Report
Trustees and Officers - continued
Advisory Board Members and Executive Officers:
Correspondence intended for each executive officer, Edward C. Johnson 3d, and and Peter S. Lynch may be sent to Fidelity Investments, 82 Devonshire Street, Boston, Massachusetts 02109.
Name, Age; Principal Occupation |
Edward C. Johnson 3d (80) |
| Year of Election or Appointment: 2011 Member of the Advisory Board of Fidelity's Equity and High Income Funds. Formerly Trustee and Chairman of the Board of Trustees of certain Trusts, Mr. Johnson serves as Chief Executive Officer, Chairman, and a Director of FMR LLC; Chairman and a Director of FMR; and Chairman and a Director of FMR Co., Inc. In addition, Mr. Johnson serves as Chairman and Director of FIL Limited. Previously, Mr. Johnson served as President of FMR LLC (2006-2007). |
Peter S. Lynch (66) |
| Year of Election or Appointment: 2003 Member of the Advisory Board of Fidelity's Equity and High Income Funds. Mr. Lynch is Vice Chairman and a Director of FMR and FMR Co., Inc. In addition, Mr. Lynch serves as a Trustee of Boston College and as the Chairman of the Inner-City Scholarship Fund. Previously, Mr. Lynch served on the Special Olympics International Board of Directors (1997-2006). |
Kenneth B. Robins (41) |
| Year of Election or Appointment: 2008 President and Treasurer of Fidelity's Equity and High Income Funds. Mr. Robins also serves as President and Treasurer (2010-present) and Assistant Treasurer (2009-present) of other Fidelity funds and is an employee of Fidelity Investments (2004-present). Previously, Mr. Robins served as Deputy Treasurer of the Fidelity funds (2005-2008) and Treasurer and Chief Financial Officer of The North Carolina Capital Management Trust: Cash and Term Portfolios (2006-2008). |
Brian B. Hogan (46) |
| Year of Election or Appointment: 2009 Vice President of certain Equity Funds and Vice President of Sector Funds. Mr. Hogan also serves as President of FMR's Equity Division (2009-present). Previously, Mr. Hogan served as Senior Vice President, Equity Research of FMR (2006-2009) and as a portfolio manager. |
Christopher S. Bartel (39) |
| Year of Election or Appointment: 2009 Vice President of Fidelity's Sector and Real Estate Equity Funds. Mr. Bartel also serves as Senior Vice President of Equity Research (2009-present). Previously, Mr. Bartel served as Managing Director of Research (2006-2009) and an analyst and portfolio manager (2000-2006). |
Scott C. Goebel (42) |
| Year of Election or Appointment: 2008 Secretary and Chief Legal Officer (CLO) of the Fidelity funds. Mr. Goebel also serves as Secretary and CLO of The North Carolina Capital Management Trust: Cash and Term Portfolio (2008-present); General Counsel, Secretary, and Senior Vice President of FMR (2008-present) and FMR Co., Inc. (2008-present); Deputy General Counsel of FMR LLC; Chief Legal Officer of Fidelity Management & Research (Hong Kong) Limited (2008-present) and Assistant Secretary of Fidelity Management & Research (Japan) Inc. (2008-present), Fidelity Investments Money Management, Inc. (2008-present), Fidelity Management & Research (U.K.) Inc. (2008-present), and Fidelity Research and Analysis Company (2008-present). Previously, Mr. Goebel served as Assistant Secretary of the Funds (2007-2008) and as Vice President and Secretary of Fidelity Distributors Corporation (FDC) (2005-2007). |
William C. Coffey (41) |
| Year of Election or Appointment: 2009 Assistant Secretary of Fidelity's Equity and High Income Funds. Mr. Coffey also serves as Senior Vice President and Deputy General Counsel of FMR LLC (2010-present), and is an employee of Fidelity Investments. Previously, Mr. Coffey served as Vice President and Associate General Counsel of FMR LLC (2005-2009). |
Holly C. Laurent (56) |
| Year of Election or Appointment: 2008 Anti-Money Laundering (AML) Officer of the Fidelity funds. Ms. Laurent also serves as AML Officer of The North Carolina Capital Management Trust: Cash and Term Portfolio (2008-present) and is an employee of Fidelity Investments. Previously, Ms. Laurent was Senior Vice President and Head of Legal for Fidelity Business Services India Pvt. Ltd. (2006-2008), and Senior Vice President, Deputy General Counsel and Group Head for FMR LLC (2005-2006). |
Christine Reynolds (52) |
| Year of Election or Appointment: 2008 Chief Financial Officer of the Fidelity funds. Ms. Reynolds became President of Fidelity Pricing and Cash Management Services (FPCMS) in August 2008. Ms. Reynolds served as Chief Operating Officer of FPCMS (2007-2008). Previously, Ms. Reynolds served as President, Treasurer, and Anti-Money Laundering officer of the Fidelity funds (2004-2007). |
Kenneth A. Rathgeber (63) |
| Year of Election or Appointment: 2004 Chief Compliance Officer of Fidelity's Equity and High Income Funds. Mr. Rathgeber is Chief Compliance Officer of Fidelity Management & Research (Hong Kong) Limited (2008-present), Fidelity Management & Research (Japan) Inc. (2008-present), FMR (2005-present), FMR Co., Inc. (2005-present), Fidelity Management & Research (U.K.) Inc. (2005-present), Fidelity Research & Analysis Company (2005-present), Fidelity Investments Money Management, Inc. (2005-present), Pyramis Global Advisors, LLC (2005-present), and Strategic Advisers, Inc. (2005-present). |
Jeffrey S. Christian (49) |
| Year of Election or Appointment: 2009 Deputy Treasurer of the Fidelity funds. Mr. Christian is an employee of Fidelity Investments. Previously, Mr. Christian served as Chief Financial Officer (2008-2009) of certain Fidelity funds and Senior Vice President of Fidelity Pricing and Cash Management Services (FPCMS) (2004-2009). |
Bryan A. Mehrmann (49) |
| Year of Election or Appointment: 2005 Deputy Treasurer of the Fidelity funds. Mr. Mehrmann is an employee of Fidelity Investments. |
Adrien E. Deberghes (43) |
| Year of Election or Appointment: 2008 Deputy Treasurer of Fidelity's Equity and High Income Funds. Mr. Deberghes also serves as Assistant Treasurer of other Fidelity funds (2010-present) and is an employee of Fidelity Investments (2008-present). Previously, Mr. Deberghes served as Senior Vice President of Mutual Fund Administration at State Street Corporation (2007-2008), Senior Director of Mutual Fund Administration at Investors Bank & Trust (2005-2007), and Director of Finance for Dunkin' Brands (2000-2005). |
Stephanie J. Dorsey (41) |
| Year of Election or Appointment: 2010 Assistant Treasurer of Fidelity's Equity and High Income Funds. Ms. Dorsey also serves as Deputy Treasurer of other Fidelity funds (2008-present) and is an employee of Fidelity Investments (2008-present). Previously, Ms. Dorsey served as Treasurer (2004-2008) of the JPMorgan Mutual Funds and Vice President (2004-2008) of JPMorgan Chase Bank. |
John R. Hebble (52) |
| Year of Election or Appointment: 2009 Assistant Treasurer of Fidelity's Equity and High Income Funds. Mr. Hebble also serves as Treasurer and Chief Financial Officer of The North Carolina Capital Management Trust: Cash and Term Portfolio (2008-present), President and Treasurer of other Fidelity funds (2008-present) and is an employee of Fidelity Investments. |
Gary W. Ryan (52) |
| Year of Election or Appointment: 2005 Assistant Treasurer of the Fidelity funds. Mr. Ryan is an employee of Fidelity Investments. Previously, Mr. Ryan served as Vice President of Fund Reporting in Fidelity Pricing and Cash Management Services (FPCMS) (1999-2005). |
Jonathan Davis (42) |
| Year of Election or Appointment: 2010 Assistant Treasurer of the Fidelity funds. Mr. Davis is an employee of Fidelity Investments. Previously, Mr. Davis served as Vice President and Associate General Counsel of FMR LLC (2003-2010). |
Annual Report
Initial Class and Investor Class designate 100% of the dividends distributed during the fiscal year as qualifying for the dividends-received deduction for corporate shareholders.
Annual Report
Board Approval of Investment Advisory Contracts and Management Fees
VIP Consumer Discretionary Portfolio
Each year, the Board of Trustees, including the Independent Trustees (together, the Board), votes on the renewal of the management contract and sub-advisory agreements (together, the Advisory Contracts) for the fund. The Board, assisted by the advice of fund counsel and Independent Trustees' counsel, requests and considers a broad range of information relevant to the renewal of the Advisory Contracts throughout the year.
The Board meets regularly and considers at each of its meetings factors that are relevant to its annual consideration of the renewal of the fund's Advisory Contracts, including the services and support provided to the fund and its shareholders. The Board has established various standing committees, each composed of Independent Trustees with varying backgrounds, to which the Board has assigned specific subject matter responsibilities in order to enhance effective decision-making by the Board. The Board, acting directly and through its Committees, requests and receives information concerning the annual consideration of the renewal of the fund's Advisory Contracts. The Board also meets as needed to consider matters specifically related to the Board's annual consideration of the renewal of Advisory Contracts. Members of the Board may also meet with trustees of other Fidelity funds through ad hoc joint committees to discuss certain matters relevant to the Fidelity funds.
At its July 2010 meeting, the Board of Trustees, including the Independent Trustees, unanimously determined to renew the fund's Advisory Contracts. In reaching its determination, the Board considered all factors it believed relevant, including (i) the nature, extent, and quality of the services to be provided to the fund and its shareholders (including the investment performance of the fund); (ii) the competitiveness of the fund's management fee and total expenses; (iii) the total costs of the services to be provided by and the profits to be realized by Fidelity from its relationship with the fund; (iv) the extent to which economies of scale would be realized as the fund grows; and (v) whether fee levels reflect these economies of scale, if any, for the benefit of fund shareholders.
In considering whether to renew the Advisory Contracts for the fund, the Board reached a determination, with the assistance of fund counsel and Independent Trustees' counsel and through the exercise of its business judgment, that the renewal of the Advisory Contracts is in the best interests of fund shareholders and that the compensation to be received by Fidelity under the management contract is fair and reasonable. The Board's decision to renew the Advisory Contracts was not based on any single factor noted above, but rather was based on a comprehensive consideration of all the information provided to the Board at its meetings throughout the year. The Board, in reaching its determination to renew the Advisory Contracts, is aware that shareholders in the fund have a broad range of investment choices available to them, including a wide choice among mutual funds offered by Fidelity's competitors, and that the fund's shareholders, with the opportunity to review and weigh the disclosure provided by the fund in its prospectus and other public disclosures, have chosen to invest in this fund, managed by Fidelity.
Nature, Extent, and Quality of Services Provided. The Board considered the staffing within the investment adviser, FMR, and the sub-advisers (together, the Investment Advisers), including the backgrounds of the fund's investment personnel and the fund's investment objective and discipline. The Independent Trustees also had discussions with senior management of Fidelity's investment operations and investment groups. The Board considered the structure of the portfolio manager compensation program and whether this structure provides appropriate incentives to act in the best interest of the fund.
Resources Dedicated to Investment Management and Support Services. The Board and the equity research subcommittee of the Board's Fund Oversight Committee reviewed the size, education, and experience of the Investment Advisers' investment staff, their use of technology, and the Investment Advisers' approach to recruiting, training, and retaining portfolio managers and other research, advisory, and management personnel. The Board noted that Fidelity's analysts have access to a variety of technological tools and market and securities data that enable them to perform both fundamental and quantitative analysis and to specialize in various disciplines. The Board considered Fidelity's extensive global research capabilities that enable the Investment Advisers to aggregate data from various sources in an effort to produce positive investment results. The Board also considered that Fidelity's portfolio managers and analysts have access to daily portfolio attribution that allows for monitoring of a fund's portfolio, as well as an electronic communication system that provides immediate real-time access to research concerning issuers and credit enhancers. The Board noted FMR's continued focus on strengthening the organization and discipline of equity portfolio management and research.
Shareholder and Administrative Services. The Board considered (i) the nature, extent, quality, and cost of advisory, administrative, and shareholder services performed by the Investment Advisers and their affiliates under the Advisory Contracts and under separate agreements covering transfer agency, pricing and bookkeeping, and securities lending services for the fund; (ii) the nature and extent of the investment adviser's supervision of third party service providers, principally custodians and subcustodians; and (iii) the resources devoted to, and the record of compliance with, the fund's compliance policies and procedures. The Board also reviewed the allocation of fund brokerage, including allocations to brokers affiliated with the Investment Advisers, the use of brokerage commissions to pay fund expenses, and the use of "soft" commission dollars to pay for research services.
The Board noted that the growth of fund assets over time across the complex allows Fidelity to reinvest in the development of services designed to enhance the value or convenience of the Fidelity funds as investment vehicles. These services include 24-hour access to account information and market information through phone representatives and over the Internet, and investor education materials and asset allocation tools.
Investment in a Large Fund Family. The Board considered the benefits to shareholders of investing in a Fidelity fund, including the benefits of investing in a fund that is part of a large family of funds offering a variety of investment disciplines and providing a large variety of mutual fund investor services. The Board noted that Fidelity had taken, or had made recommendations that resulted in the Fidelity funds taking, a number of actions over the previous year that benefited particular funds, including (i) dedicating additional resources to investment research and restructuring and broadening the focus of the investment research teams; (ii) bolstering the senior management team that oversees asset management; (iii) launching Class F of certain funds as a lower-fee class available to Freedom K and Freedom Index Funds; (iv) lowering the initial investment minimums and ongoing balance requirements for Real Estate High Income Fund; (v) eliminating subsequent purchase minimums for all funds and adding a waiver of the investment minimum requirement for new accounts opened with the proceeds of a systematic withdrawal plan; (vi) eliminating the withdrawal minimum and maximum limits for systematic withdrawals from Advisor funds; (vii) expanding sales load waivers on Class A shares for Destiny Planholders and expanding Institutional Class eligibility for Class O Destiny Planholders; and (viii) changing certain Class A and Class T sales charge structures to further align them with industry practices.
Annual Report
Investment Performance. The Board considered whether the fund has operated in accordance with its investment objective, as well as its record of compliance with its investment restrictions. It also reviewed the fund's absolute investment performance for each class, as well as the fund's relative investment performance for each class measured over multiple periods against a third-party-sponsored index that reflects the market sector in which the fund invests. The Board noted that FMR does not believe that a meaningful peer group exists against which to compare the fund's performance. The following charts considered by the Board show, over the one-, three-, and five-year periods ended December 31, 2009, as available, the cumulative total returns of Initial Class and Investor Class of the fund and the cumulative total returns of a third-party-sponsored index ("benchmark").
VIP Consumer Discretionary Portfolio
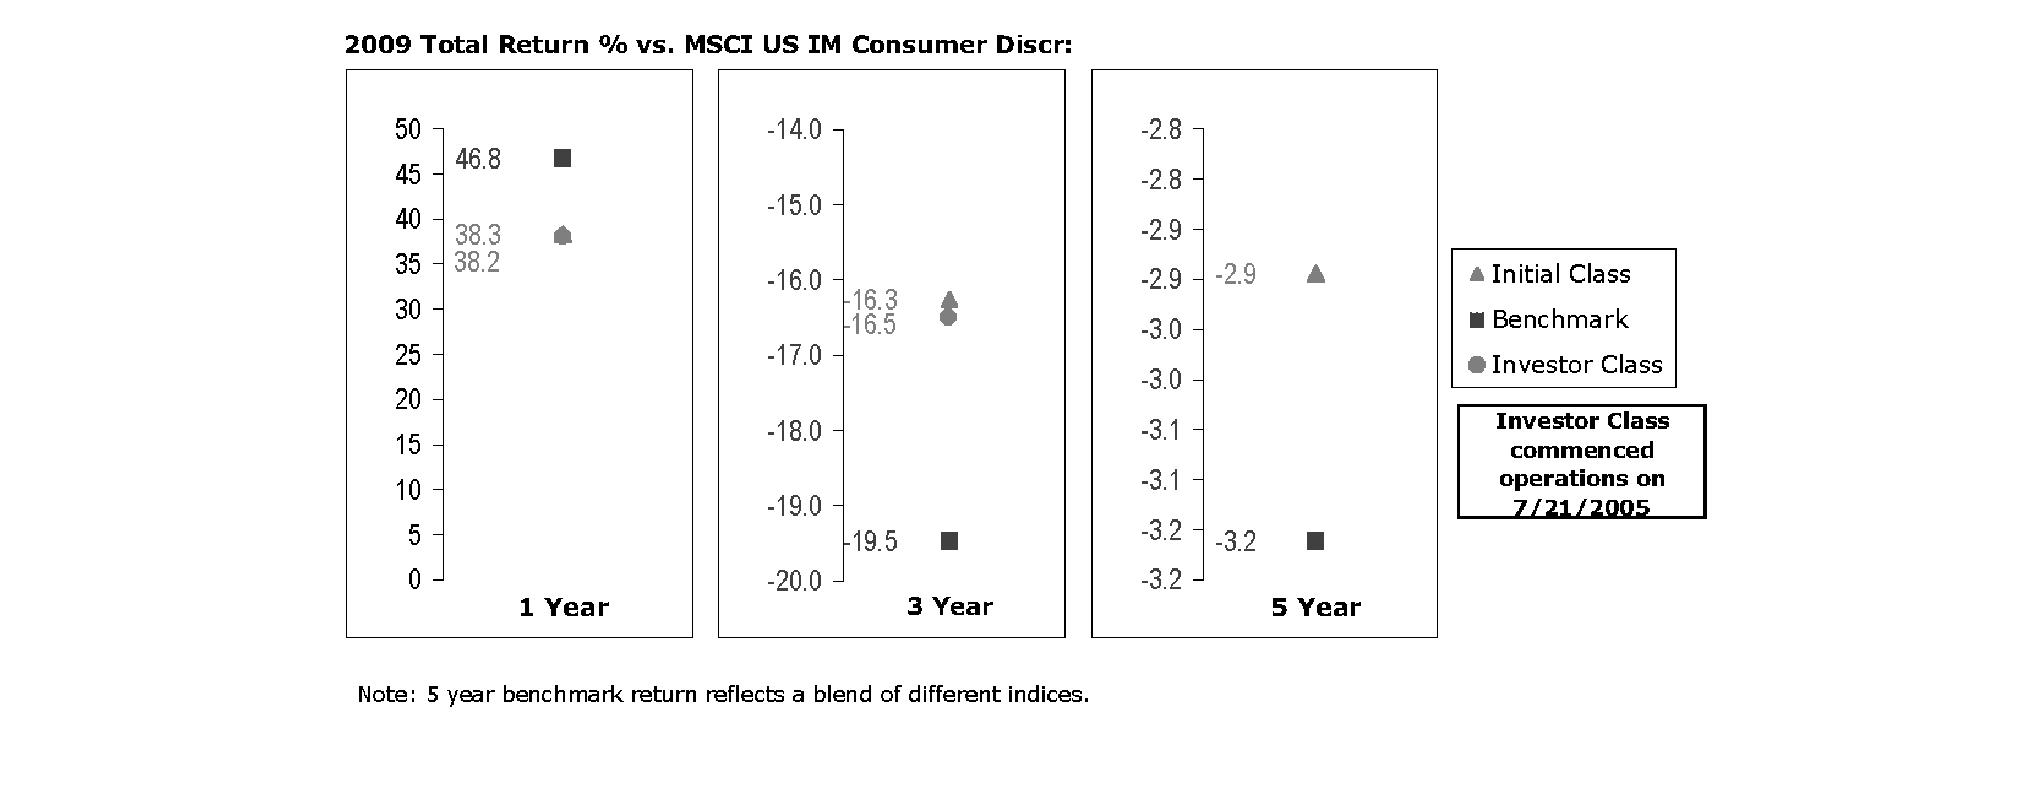
The Board noted that the investment performance of Initial Class of the fund compared favorably to its benchmark for the three- and five-year periods, although the fund's one-year cumulative total return was lower than its benchmark. The Board considered that the variations in performance between the fund's classes reflect the variations in class expenses, which result in lower performance for the higher expense class. The Board also reviewed the fund's performance since inception as well as performance in the current year.
Based on its review, and giving particular weight to the nature and quality of the resources dedicated by the Investment Advisers to maintain and improve relative performance and factoring in the unprecedented market events in recent years, the Board concluded that the nature, extent, and quality of investment management and support services and of shareholder and administrative services provided to the fund will benefit the fund's shareholders, particularly in light of the Board's view that the fund's shareholders benefit from investing in a fund that is part of a large family of funds offering a variety of investment disciplines and services.
Competitiveness of Management Fee and Total Fund Expenses. The Board considered the fund's management fee and total expenses compared to "mapped groups" of competitive funds and classes. Fidelity creates "mapped groups" by combining similar Lipper investment objective categories that have comparable management fee characteristics. Combining Lipper investment objective categories aids the Board's management fee and total expense comparisons by broadening the competitive group used for comparison and by reducing the number of universes to which various Fidelity funds are compared.
Management Fee. The Board considered two proprietary management fee comparisons for the 12-month periods shown in the chart below. The group of Lipper funds used by the Board for management fee comparisons is referred to below as the "Total Mapped Group." The Total Mapped Group comparison focuses on a fund's standing relative to the total universe of comparable funds available to investors, in terms of gross management fees before expense reimbursements or caps. "TMG %" represents the percentage of funds in the Total Mapped Group that had management fees that were lower than the fund's. For example, a TMG % of 3% means that 97% of the funds in the Total Mapped Group had higher management fees than the fund. The "Asset-Size Peer Group" (ASPG) comparison focuses on a fund's standing relative to non-Fidelity funds similar in size to the fund within the Total Mapped Group. The ASPG represents at least 15% of the funds in the Total Mapped Group with comparable asset size and management fee characteristics, subject to a minimum of 50 funds (or all funds in the Total Mapped Group if fewer than 50). Additional information, such as the ASPG quartile in which the fund's management fee ranked, is also included in the chart and considered by the Board.
Annual Report
Board Approval of Investment Advisory Contracts and Management Fees - continued
VIP Consumer Discretionary Portfolio
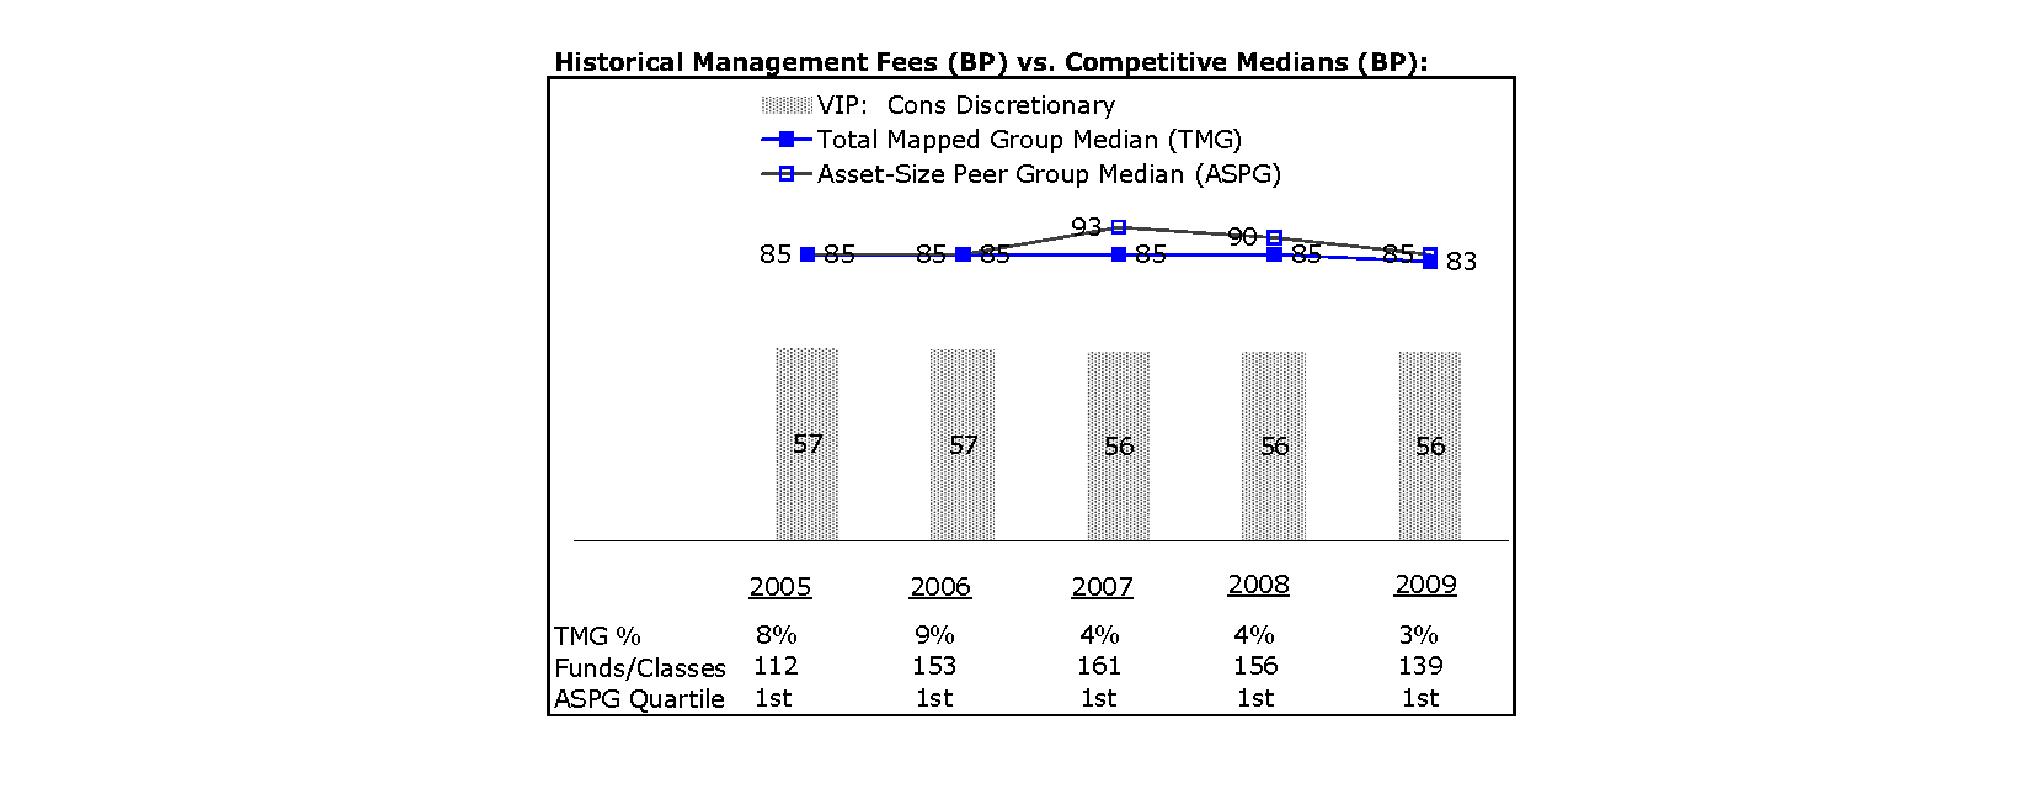
The Board noted that the fund's management fee ranked below the median of its Total Mapped Group and below the median of its ASPG for 2009.
Based on its review, the Board concluded that the fund's management fee is fair and reasonable in light of the services that the fund receives and the other factors considered.
Total Expenses. In its review of each class's total expenses, the Board considered the fund's management fee as well as other fund or class expenses, as applicable, such as transfer agent fees, pricing and bookkeeping fees, and custodial, legal, and audit fees. The Board also noted the effects of any waivers and reimbursements on fees and expenses. As part of its review, the Board also considered current and historical total expenses of each class of the fund compared to competitive fund median expenses. Each class of the fund is compared to those funds and classes in the Total Mapped Group (used by the Board for management fee comparisons) that have a similar sales load structure.
The Board noted that the total expenses of Initial Class ranked below its competitive median for 2009 and the total expenses of Investor Class ranked above its competitive median for 2009. The Board considered that the total expenses of Investor Class were above the median primarily due to its higher transfer agent fee. The Board noted that the fund offers multiple classes and that the multiple structures are intended to offer pricing options for the intermediary market. The Board also noted that the total expenses of the classes vary primarily due to differences in transfer agent fees.
Fees Charged to Other Fidelity Clients. The Board also considered Fidelity fee structures and other information with respect to clients of FMR and its affiliates, such as other mutual funds advised or subadvised by FMR or its affiliates, pension plan clients, and other institutional clients. In March 2010, the Board created an ad hoc joint committee with the board of other Fidelity funds (the Committee) to review and compare Fidelity's institutional investment advisory business with its business of providing services to the Fidelity funds, including the differences in services provided, fees charged, and costs incurred, as well as competition in their respective marketplaces.
Based on its review of total expenses and fees charged to other Fidelity clients, the Board concluded that the total expenses of each class of the fund were reasonable, although in one case above the median of the universe presented for comparison, in light of the services that the fund and its shareholders receive and the other factors considered, including the findings of the Committee.
Costs of the Services and Profitability. The Board considered the revenues earned and the expenses incurred by Fidelity in conducting the business of developing, marketing, distributing, managing, administering and servicing the fund and its shareholders. The Board also considered the level of Fidelity's profits in respect of all the Fidelity funds.
Annual Report
On an annual basis, FMR presents to the Board Fidelity's profitability for the fund. Fidelity calculates the profitability for each fund, as well as aggregate profitability for groups of Fidelity funds and all Fidelity funds, using a series of detailed revenue and cost allocation methodologies which originate with the audited books and records of Fidelity. The Audit Committee of the Board reviews any significant changes from the prior year's methodologies.
PricewaterhouseCoopers LLP (PwC), independent registered public accounting firm and auditor to Fidelity and certain Fidelity funds, has been engaged annually by the Board as part of the Board's assessment of Fidelity's profitability analysis. PwC's engagement includes the review and assessment of Fidelity's methodologies used in determining the revenues and expenses attributable to Fidelity's mutual fund business, and completion of agreed-upon procedures surrounding the mathematical accuracy of fund profitability and its conformity to allocation methodologies. After considering PwC's reports issued under the engagement and information provided by Fidelity, the Board believes that while other allocation methods may also be reasonable, Fidelity's profitability methodologies are reasonable in all material respects.
The Board has also reviewed Fidelity's non-fund businesses and fall-out benefits related to the mutual fund business as well as cases where Fidelity's affiliates may benefit from or be related to the fund's business.
The Board considered the costs of the services provided by and the profits realized by Fidelity in connection with the operation of the fund and were satisfied that the profitability was not excessive in the circumstances.
Economies of Scale. The Board considered whether there have been economies of scale in respect of the management of the Fidelity funds, whether the Fidelity funds (including the fund) have appropriately benefited from any such economies of scale, and whether there is potential for realization of any further economies of scale. The Board considered the extent to which the fund will benefit from economies of scale through increased services to the fund, through waivers or reimbursements, or through fee or expense reductions.
In February 2009, the Board and the board of other Fidelity funds created an ad hoc committee (the Economies of Scale Committee) to analyze whether FMR attains economies of scale in respect of the management and servicing of the Fidelity funds, whether the Fidelity funds have appropriately benefited from such economies of scale, and whether there is potential for realization of any further economies of scale.
The Board recognized that the fund's management contract incorporates a "group fee" structure, which provides for lower group fee rates as total fund assets under FMR's management increase, and for higher group fee rates as total fund assets under FMR's management decrease. FMR calculates the group fee rates based on a tiered asset "breakpoint" schedule that varies based on asset class. The Board considered that the group fee is designed to deliver the benefits of economies of scale to fund shareholders when total Fidelity fund assets increase, even if assets of any particular fund are unchanged or have declined, because some portion of Fidelity's costs are attributable to services provided to all Fidelity funds, and all funds benefit if those costs can be allocated among more assets. The Board concluded that, given the group fee structure, fund shareholders will benefit from lower management fees as assets under FMR's management increase at the fund complex level, regardless of whether Fidelity achieves any such economies of scale.
The Board concluded, considering the findings of the Economies of Scale Committee, that any potential economies of scale are being appropriately shared between fund shareholders and Fidelity.
Additional Information Requested by the Board. In order to develop fully the factual basis for consideration of the Fidelity funds' Advisory Contracts, the Board requested and received additional information on certain topics, including (i) fund performance trends, actions to be taken by FMR to improve certain funds' overall performance, and Fidelity's long-term strategies for certain funds; (ii) portfolio manager changes that have occurred during the past year and length of portfolio manager tenure for different categories of funds over time; (iii) Fidelity's compensation structure for portfolio managers, research analysts, and other key personnel, the rationale for the compensation structure, and how the compensation structure provides appropriate performance incentives; (iv) the amount of the investment that each portfolio manager has made in the Fidelity fund(s) that he or she manages; (v) management and other fees paid by FMR to affiliated sub-advisers on behalf of the Fidelity funds; (vi) Fidelity's fee structures and rationale for recommending different fees among different categories of funds; (vii) Fidelity's rationale for recommending which funds should have a performance adjustment component as part of their management fees; (viii) the rationale for any differences between fund fee structures and fee structures in place for other Fidelity clients; and (ix) explanations regarding the relative total expenses borne by certain funds and classes, total expense competitive trends, and actions that might be taken by FMR to reduce total expenses for certain funds and classes.
Based on its evaluation of all of the conclusions noted above, and after considering all factors it believed relevant, the Board ultimately concluded that the advisory fee structures are fair and reasonable, and that the fund's Advisory Contracts should be renewed.
Annual Report
Investment Adviser
Fidelity Management & Research Company
Boston, MA
Investment Sub-Advisers
FMR Co., Inc.
Fidelity Management & Research (U.K.) Inc.
Fidelity Management & Research (Hong Kong) Limited
Fidelity Management & Research (Japan) Inc.
General Distributor
Fidelity Distributors Corporation
Boston, MA
Transfer and Service Agents
Fidelity Investments Institutional Operations Company, Inc.
Boston, MA
Fidelity Service Company, Inc.
Boston, MA
Custodian
JPMorgan Chase Bank
New York, NY
VCONIC-ANN-0211
1.817355.105
Fidelity® Variable Insurance Products:
Consumer Staples Portfolio
Annual Report
December 31, 2010
(2_fidelity_logos) (Registered_Trademark)
Contents
Performance | <Click Here> | How the fund has done over time. |
Management's Discussion of Fund Performance | <Click Here> | The Portfolio Manager's review of fund performance and strategy. |
Shareholder Expense Example | <Click Here> | An example of shareholder expenses. |
Investment Changes | <Click Here> | A summary of major shifts in the fund's investments over the past six months. |
Investments | <Click Here> | A complete list of the fund's investments with their market values. |
Financial Statements | <Click Here> | Statements of assets and liabilities, operations, and changes in net assets, as well as financial highlights. |
Notes | <Click Here> | Notes to the financial statements. |
Report of Independent Registered Public Accounting Firm | <Click Here> | |
Trustees and Officers | <Click Here> | |
Distributions | <Click Here> | |
Board Approval of Investment Advisory Contracts and Management Fees | <Click Here> | |
To view a fund's proxy voting guidelines and proxy voting record for the 12-month period ended June 30, visit http://www.fidelity.com/proxyvotingresults or visit the Securities and Exchange Commission's (SEC) web site at http://www.sec.gov. You may also call 1-877-208-0098 to request a free copy of the proxy voting guidelines.
Fidelity Variable Insurance Products are separate account options which are purchased through a variable insurance contract.
Standard & Poor's, S&P and S&P 500 are registered service marks of The McGraw-Hill Companies, Inc. and have been licensed for use by Fidelity Distributors Corporation.
Other third party marks appearing herein are the property of their respective owners.
All other marks appearing herein are registered or unregistered trademarks or service marks of FMR LLC or an affiliated company.
The general research services agreement with Fidelity Research & Analysis Company has been terminated and is no longer in effect for the fund.
This report and the financial statements contained herein are submitted for the general information of the shareholders of the fund. This report is not authorized for distribution to prospective investors in the fund unless preceded or accompanied by an effective prospectus.
A fund files its complete schedule of portfolio holdings with the SEC for the first and third quarters of each fiscal year on Form N-Q. Forms N-Q are available on the SEC's web site at http://www.sec.gov. A fund's Forms N-Q may be reviewed and copied at the SEC's Public Reference Room in Washington, DC. Information regarding the operation of the SEC's Public Reference Room may be obtained by calling 1-800-SEC-0330. For a complete list of a fund's portfolio holdings, view the most recent holdings listing, semiannual report, or annual report on Fidelity's web site at http://www.fidelity.com, http://www.advisor.fidelity.com, or http://www.401k.com, as applicable.
NOT FDIC INSURED • MAY LOSE VALUE • NO BANK GUARANTEE
Neither the fund nor Fidelity Distributors Corporation is a bank.
Annual Report
Average annual total return reflects the change in the value of an investment, assuming reinvestment of the class' distributions from dividend income and capital gains (the profits earned upon the sale of securities that have grown in value, if any) and assuming a constant rate of performance each year. During periods of reimbursement by Fidelity, a fund's total return will be greater than it would be had the reimbursement not occurred. Performance numbers are net of all underlying fund operating expenses, but do not include any insurance charges imposed by your insurance company's separate account. If performance information included the effect of these additional charges, the total returns would have been lower. How a fund did yesterday is no guarantee of how it will do tomorrow.
Average Annual Total Returns
Periods ended December 31, 2010 | Past 1
year | Life of
fundA |
VIP Consumer Staples Portfolio - Initial Class | 15.23% | 5.64% |
VIP Consumer Staples Portfolio - Investor Class | 15.09% | 5.55% |
A From April 24, 2007.
$10,000 Over Life of Fund
Let's say hypothetically that $10,000 was invested in VIP Consumer Staples Portfolio - Initial Class on April 24, 2007, when the fund started. The chart shows how the value of your investment would have changed, and also shows how the S&P 500® Index performed over the same period.
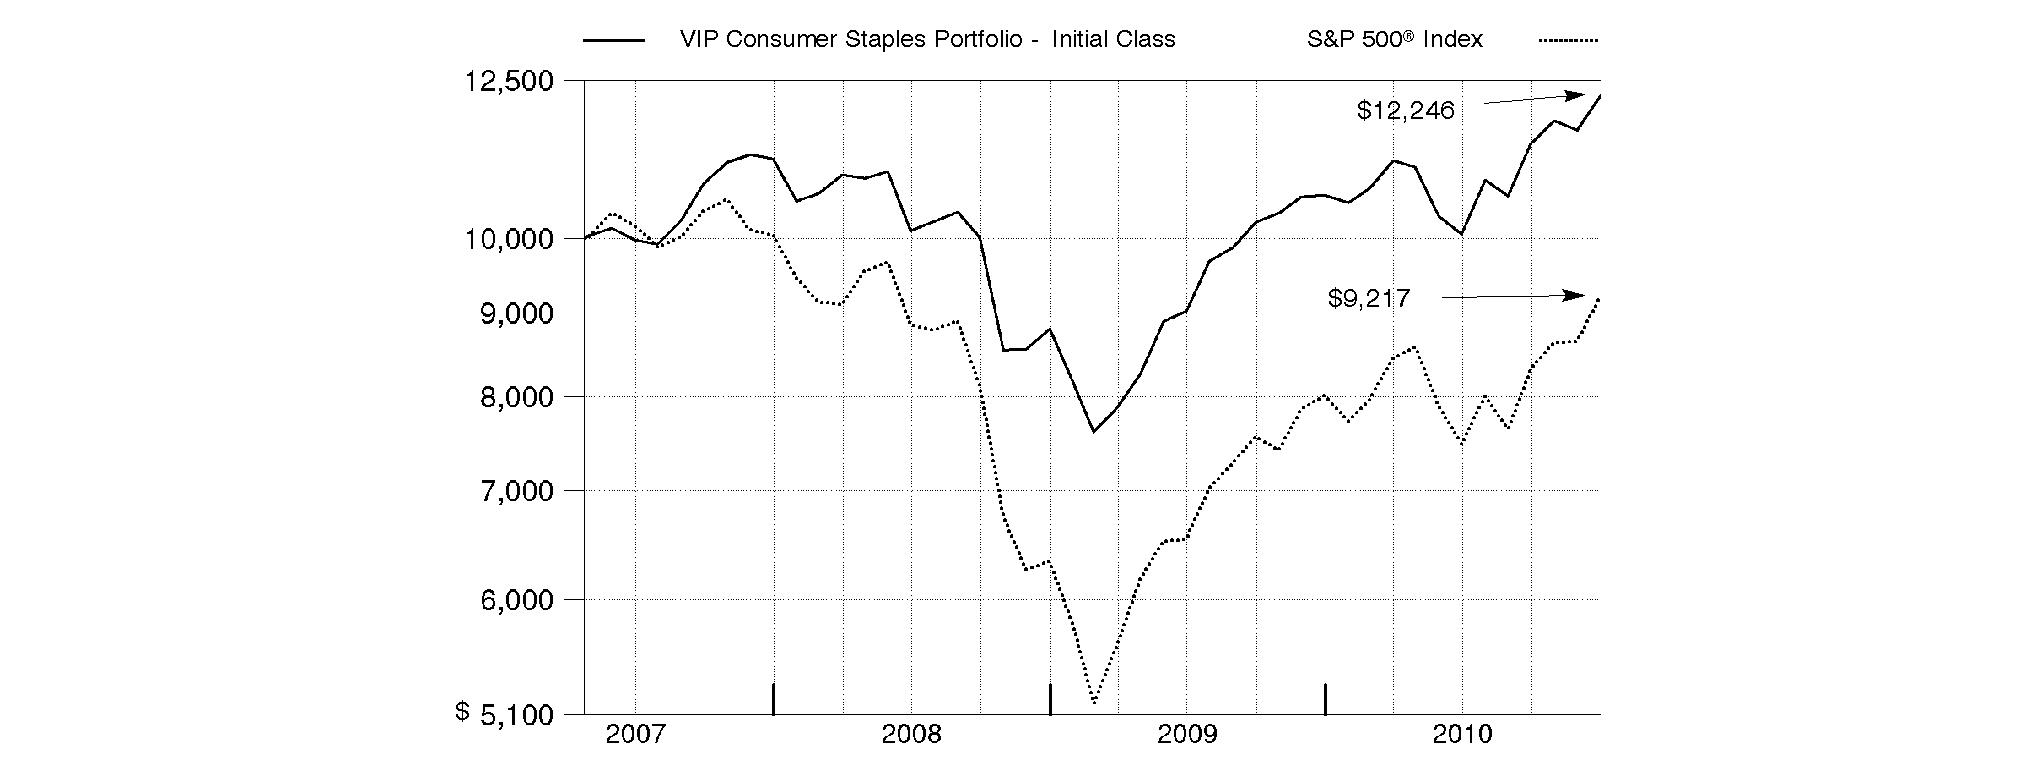
Annual Report
Market Recap: While market improvements around the world hit a speed bump in the first half of the 12-month period ending December 31, 2010, world economies re-accelerated in August, supported by a broadening recovery and low inflation in the U.S. Domestic stock markets recorded solid gains for the year, lifted by a strong second-half rally fueled by economic optimism, encouraging earnings reports and a wave of corporate mergers. The large-cap S&P 500® Index rose 15.06%, the blue-chip-laden Dow Jones Industrial AverageSM added 14.06% and the technology-heavy Nasdaq Composite® Index climbed 18.02%. Meanwhile, international stocks, as represented by the MSCI® ACWI® (All Country World Index) ex USA Index, gained 11.29%, boosted in part by a depreciating U.S. dollar. In the fixed-income arena, U.S. taxable investment-grade bonds generated positive results during 2010, as the Barclays Capital® U.S. Aggregate Bond Index gained 6.54%. With ultra-low interest rates bolstering nearly all fixed-income securities for most of the year, sectors in the index with higher yields and more credit risk generally fared best, while most high-quality bonds generated more-moderate returns. Meanwhile, high-yield bonds, as represented by The BofA Merrill LynchSM US High Yield Constrained Index, returned 15.07%, a result of improved economic data and strengthening investor demand. Overseas, foreign bond markets showed mixed results, with a sizable disparity between the 3.97% return of the Citigroup® Non-U.S. Group of 7 Index - which measures the performance of sovereign debt of the major global economies outside the U.S. - and the 12.04% advance of the JPMorgan Emerging Markets Bond Index Global (EMBI Global), which benefited from the rising overall credit quality of emerging-markets debt issuers.
Comments from Robert Lee, Portfolio Manager of VIP Consumer Staples Portfolio: For the 12 months ending December 31, 2010, the fund's share classes modestly outperformed the broadly based S&P 500® and the 14.69% gain of the MSCI® U.S. IM Consumer Staples 25/50 Index, which was adopted in January 2010 as a better representation of the fund's investment universe. (For specific portfolio results, please refer to the performance section of this report.) The portfolio benefited from strong positioning in the soft drinks industry, including stakes in Coca-Cola and Coca-Cola Enterprises. Coke shares rose amid building momentum in higher-growth emerging economies, as well as from better-than-expected results in more-mature markets, such as the U.S., Japan and Western Europe. Coca-Cola Enterprises' stock got a boost when Coke acquired the company's North American bottling operations at a premium price during the year. Solid positioning in household products aided performance, including an underweighting in Colgate-Palmolive and not owning index component Kimberly-Clark, both companies that experienced aggressive price competition that hurt their profits. An underweighting and good stock picking in the hypermarkets/super centers industry was a plus. Underweighting major index constituent Wal-Mart Stores paid off when the stock lagged in the face of increased competition, while overweighting BJ's Wholesale Club was a positive, as the company executed well and garnered investor speculation as a potential buy-out play. Elsewhere, the fund saw good results from global wine distributor Constellation Brands and cigarette manufacturer British American Tobacco. On the other hand, positioning in packaged foods/meats hurt, including the fund's largest detractor, Dean Foods, a North American milk retailer. Dean faced increased price competition by grocery stores on their private-label milk offerings, and the stock lost ground. A stake in Netherlands-based Unilever and not owning index component Sara Lee also detracted in that space. Stock picking in personal products was another weak spot, including not owning cosmetics manufacturer and index component Estee Lauder. An out-of-index position in pharmaceutical and medical products giant Johnson & Johnson hurt, as the company was hampered by a number of quality-related product recalls. Elsewhere, underweighting tobacco manufacturer Philip Morris International was costly. Some stocks I've mentioned were sold prior to period end.
The views expressed above reflect those of the portfolio manager(s) only through the end of the period as stated on the cover of this report and do not necessarily represent the views of Fidelity or any other person in the Fidelity organization. Any such views are subject to change at any time based upon market or other conditions and Fidelity disclaims any responsibility to update such views. These views may not be relied on as investment advice and, because investment decisions for a Fidelity fund are based on numerous factors, may not be relied on as an indication of trading intent on behalf of any Fidelity fund.
Annual Report
As a shareholder of the Fund, you incur two types of costs: (1) transaction costs, including redemption fees, and (2) ongoing costs, including management fees and other Fund expenses. This Example is intended to help you understand your ongoing costs (in dollars) of investing in the Fund and to compare these costs with the ongoing costs of investing in other mutual funds.
The Example is based on an investment of $1,000 invested at the beginning of the period and held for the entire period (July 1, 2010 to December 31, 2010).
Actual Expenses
The first line of the accompanying table for each class of the Fund provides information about actual account values and actual expenses. You may use the information in this line, together with the amount you invested, to estimate the expenses that you paid over the period. Simply divide your account value by $1,000.00 (for example, an $8,600 account value divided by $1,000.00 = 8.6), then multiply the result by the number in the first line for a class of the Fund under the heading entitled "Expenses Paid During Period" to estimate the expenses you paid on your account during this period. The estimate of expenses does not include any fees or other expenses of any variable annuity or variable life insurance product. If they were, the estimate of expenses you paid during the period would be higher, and your ending account value would be lower. In addition, the Fund, as a shareholder in the underlying Fidelity Central Funds, will indirectly bear its pro-rata share of the fees and expenses incurred by the underlying Fidelity Central Funds. These fees and expenses are not included in the Fund's annualized expense ratio used to calculate the expense estimate in the table below.
Hypothetical Example for Comparison Purposes
The second line of the accompanying table for each class of the Fund provides information about hypothetical account values and hypothetical expenses based on a Class' actual expense ratio and an assumed rate of return of 5% per year before expenses, which is not the Class' actual return. The hypothetical account values and expenses may not be used to estimate the actual ending account balance or expenses you paid for the period. You may use this information to compare the ongoing costs of investing in the Fund and other funds. To do so, compare this 5% hypothetical example with the 5% hypothetical examples that appear in the shareholder reports of the other funds. The estimate of expenses does not include any fees or other expenses of any variable annuity or variable life insurance product. If they were, the estimate of expenses you paid during the period would be higher, and your ending account value would be lower. In addition, the Fund, as a shareholder in the underlying Fidelity Central Funds, will indirectly bear its pro-rata share of the fees and expenses incurred by the underlying Fidelity Central Funds. These fees and expenses are not included in the Fund's annualized expense ratio used to calculate the expense estimate in the table below.
Please note that the expenses shown in the table are meant to highlight your ongoing costs only and do not reflect any transaction costs. Therefore, the second line of the table is useful in comparing ongoing costs only, and will not help you determine the relative total costs of owning different funds. In addition, if these transactional costs were included, your costs would have been higher.
| Annualized
Expense Ratio | Beginning
Account Value
July 1, 2010 | Ending
Account Value
December 31, 2010 | Expenses Paid
During Period*
July 1, 2010
to December 31, 2010 |
Initial Class | 1.00% | | | |
Actual | | $ 1,000.00 | $ 1,216.50 | $ 5.59 |
HypotheticalA | | $ 1,000.00 | $ 1,020.16 | $ 5.09 |
Investor Class | 1.08% | | | |
Actual | | $ 1,000.00 | $ 1,216.50 | $ 6.03 |
HypotheticalA | | $ 1,000.00 | $ 1,019.76 | $ 5.50 |
A 5% return per year before expenses
* Expenses are equal to each Class' annualized expense ratio, multiplied by the average account value over the period, multiplied by 184/365 (to reflect the one-half year period).
Annual Report
Investment Changes (Unaudited)
Top Ten Stocks as of December 31, 2010 |
| % of fund's
net assets | % of fund's net assets
6 months ago |
Procter & Gamble Co. | 15.0 | 13.0 |
The Coca-Cola Co. | 11.5 | 11.0 |
CVS Caremark Corp. | 6.2 | 4.5 |
British American Tobacco PLC sponsored ADR | 5.6 | 5.1 |
Altria Group, Inc. | 5.0 | 4.6 |
PepsiCo, Inc. | 4.6 | 5.7 |
Colgate-Palmolive Co. | 4.1 | 1.1 |
Walgreen Co. | 3.7 | 4.9 |
Johnson & Johnson | 3.0 | 3.1 |
Unilever NV unit | 3.0 | 2.4 |
| 61.7 | |
Top Industries (% of fund's net assets) |
As of December 31, 2010 |
 | Beverages | 28.7% | |
 | Household Products | 19.1% | |
 | Food & Staples Retailing | 16.7% | |
 | Tobacco | 13.2% | |
 | Food Products | 12.7% | |
 | All Others* | 9.6% | |

As of June 30, 2010 |
| Beverages | 31.1% | |
| Food & Staples Retailing | 21.2% | |
| Household Products | 15.5% | |
| Food Products | 12.0% | |
| Tobacco | 11.8% | |
| All Others* | 8.4% | |

* Includes short-term investments and net other assets. |
Annual Report
Investments December 31, 2010
Showing Percentage of Net Assets
Common Stocks - 96.3% |
| Shares | | Value |
BEVERAGES - 28.7% |
Brewers - 5.6% |
Anadolu Efes Biracilik ve Malt Sanayii AS | 3,200 | | $ 48,563 |
Anheuser-Busch InBev SA NV | 8,825 | | 504,998 |
Companhia de Bebidas das Americas (AmBev) (PN) sponsored ADR | 3,900 | | 121,017 |
Molson Coors Brewing Co. Class B | 12,766 | | 640,726 |
| | 1,315,304 |
Distillers & Vintners - 5.2% |
Constellation Brands, Inc. Class A (sub. vtg.) (a) | 23,826 | | 527,746 |
Diageo PLC sponsored ADR | 9,287 | | 690,303 |
Pernod-Ricard SA | 200 | | 18,814 |
| | 1,236,863 |
Soft Drinks - 17.9% |
Coca-Cola Bottling Co. Consolidated | 1,901 | | 105,658 |
Coca-Cola FEMSA SAB de CV sponsored ADR | 1,270 | | 104,686 |
Coca-Cola Icecek AS | 4,450 | | 58,875 |
Cott Corp. (a) | 100 | | 897 |
Embotelladora Andina SA sponsored ADR | 3,500 | | 105,945 |
Fomento Economico Mexicano SAB de CV sponsored ADR | 985 | | 55,081 |
PepsiCo, Inc. | 16,621 | | 1,085,850 |
The Coca-Cola Co. | 41,227 | | 2,711,500 |
| | 4,228,492 |
TOTAL BEVERAGES | | 6,780,659 |
BIOTECHNOLOGY - 0.1% |
Biotechnology - 0.1% |
Martek Biosciences (a) | 600 | | 18,780 |
FOOD & STAPLES RETAILING - 16.7% |
Drug Retail - 9.9% |
CVS Caremark Corp. | 42,448 | | 1,475,917 |
Walgreen Co. | 22,415 | | 873,288 |
| | 2,349,205 |
Food Distributors - 0.2% |
United Natural Foods, Inc. (a) | 1,500 | | 55,020 |
Food Retail - 3.4% |
Koninklijke Ahold NV | 7,089 | | 93,605 |
Kroger Co. | 5,329 | | 119,156 |
Safeway, Inc. | 19,838 | | 446,157 |
Susser Holdings Corp. (a) | 4,223 | | 58,489 |
The Pantry, Inc. (a) | 3,744 | | 74,356 |
| | 791,763 |
|
| Shares | | Value |
Hypermarkets & Super Centers - 3.2% |
BJ's Wholesale Club, Inc. (a) | 3,113 | | $ 149,113 |
Wal-Mart Stores, Inc. | 11,386 | | 614,047 |
| | 763,160 |
TOTAL FOOD & STAPLES RETAILING | | 3,959,148 |
FOOD PRODUCTS - 12.7% |
Agricultural Products - 4.0% |
Archer Daniels Midland Co. | 9,486 | | 285,339 |
Bunge Ltd. | 7,632 | | 500,049 |
Cresud S.A.C.I.F. y A. sponsored ADR | 1,319 | | 25,035 |
Origin Agritech Ltd. (a) | 1,500 | | 15,975 |
SLC Agricola SA | 4,500 | | 59,655 |
Viterra, Inc. | 5,600 | | 52,109 |
| | 938,162 |
Packaged Foods & Meats - 8.7% |
Ausnutria Dairy Hunan Co. Ltd. (H Shares) | 5,000 | | 1,666 |
Brasil Foods SA | 200 | | 3,295 |
Calavo Growers, Inc. | 2,400 | | 55,320 |
Cermaq ASA | 4,000 | | 61,793 |
Cosan Ltd. Class A | 1,700 | | 23,154 |
Danone | 854 | | 53,687 |
Dean Foods Co. (a) | 19,390 | | 171,408 |
Kraft Foods, Inc. Class A | 5,870 | | 184,964 |
Lindt & Spruengli AG | 2 | | 64,433 |
Mead Johnson Nutrition Co. Class A | 2,586 | | 160,979 |
Nestle SA | 8,677 | | 508,472 |
Smart Balance, Inc. (a) | 1,000 | | 4,330 |
Smithfield Foods, Inc. (a) | 488 | | 10,067 |
Tyson Foods, Inc. Class A | 203 | | 3,496 |
Unilever NV unit | 22,409 | | 703,643 |
Want Want China Holdings Ltd. | 61,000 | | 53,446 |
| | 2,064,153 |
TOTAL FOOD PRODUCTS | | 3,002,315 |
HOTELS, RESTAURANTS & LEISURE - 0.5% |
Restaurants - 0.5% |
Domino's Pizza, Inc. (a) | 3,512 | | 56,016 |
Sonic Corp. (a) | 5,406 | | 54,709 |
| | 110,725 |
HOUSEHOLD DURABLES - 0.1% |
Housewares & Specialties - 0.1% |
Tupperware Brands Corp. | 330 | | 15,731 |
HOUSEHOLD PRODUCTS - 19.1% |
Household Products - 19.1% |
Colgate-Palmolive Co. | 12,114 | | 973,602 |
Procter & Gamble Co. | 55,056 | | 3,541,752 |
| | 4,515,354 |
Common Stocks - continued |
| Shares | | Value |
PERSONAL PRODUCTS - 2.2% |
Personal Products - 2.2% |
Avon Products, Inc. | 16,031 | | $ 465,861 |
China-Biotics, Inc. (a) | 85 | | 1,250 |
Natura Cosmeticos SA | 2,100 | | 60,347 |
| | 527,458 |
PHARMACEUTICALS - 3.0% |
Pharmaceuticals - 3.0% |
Johnson & Johnson | 11,388 | | 704,348 |
Perrigo Co. | 53 | | 3,356 |
| | 707,704 |
TOBACCO - 13.2% |
Tobacco - 13.2% |
Altria Group, Inc. | 47,576 | | 1,171,321 |
British American Tobacco PLC sponsored ADR | 17,032 | | 1,323,386 |
KT&G Corp. | 859 | | 49,567 |
Philip Morris International, Inc. | 8,863 | | 518,751 |
Souza Cruz Industria Comerico | 1,100 | | 59,913 |
| | 3,122,938 |
TOTAL COMMON STOCKS (Cost $21,250,550) | 22,760,812 |
Money Market Funds - 4.0% |
| Shares | | Value |
Fidelity Cash Central Fund, 0.19% (b)
(Cost $953,992) | 953,992 | | $ 953,992 |
TOTAL INVESTMENT PORTFOLIO - 100.3% (Cost $22,204,542) | | 23,714,804 |
NET OTHER ASSETS (LIABILITIES) - (0.3)% | | (73,686) |
NET ASSETS - 100% | $ 23,641,118 |
Legend |
(a) Non-income producing |
(b) Affiliated fund that is available only to investment companies and other accounts managed by Fidelity Investments. The rate quoted is the annualized seven-day yield of the fund at period end. A complete unaudited listing of the fund's holdings as of its most recent quarter end is available upon request. In addition, each Fidelity Central Fund's financial statements, which are not covered by the Fund's Report of Independent Registered Public Accounting Firm, are available on the SEC's website or upon request. |
Affiliated Central Funds |
Information regarding fiscal year to date income earned by the Fund from investments in Fidelity Central Funds is as follows: |
Fund | Income earned |
Fidelity Cash Central Fund | $ 1,034 |
Other Information |
All investments are categorized as Level 1 under the Fair Value Hierarchy. The inputs or methodology used for valuing securities may not be an indication of the risk associated with investing in those securities. For more information on valuation inputs, please refer to the Security Valuation section in the accompanying Notes to Financial Statements. |
Distribution of investments by country of issue, as a percentage of total net assets, is as follows: (Unaudited) |
United States of America | 77.0% |
United Kingdom | 8.5% |
Netherlands | 3.4% |
Switzerland | 2.5% |
Bermuda | 2.2% |
Belgium | 2.2% |
Brazil | 1.2% |
Others (Individually Less Than 1%) | 3.0% |
| 100.0% |
Income Tax Information |
At December 31, 2010, the Fund had a capital loss carryforward of approximately $453,672 all of which will expire in fiscal 2017. Capital loss carryforwards are only available to offset future capital gains of the Fund to the extent provided by regulations and may be limited. |
See accompanying notes which are an integral part of the financial statements.
Annual Report
Statement of Assets and Liabilities
| December 31, 2010 |
Assets | | |
Investment in securities, at value - See accompanying schedule: Unaffiliated issuers (cost $21,250,550) | $ 22,760,812 | |
Fidelity Central Funds (cost $953,992) | 953,992 | |
Total Investments (cost $22,204,542) | | $ 23,714,804 |
Receivable for investments sold | | 90,929 |
Receivable for fund shares sold | | 10,034 |
Dividends receivable | | 45,145 |
Distributions receivable from Fidelity Central Funds | | 122 |
Prepaid expenses | | 61 |
Other receivables | | 327 |
Total assets | | 23,861,422 |
| | |
Liabilities | | |
Payable for investments purchased | $ 165,396 | |
Payable for fund shares redeemed | 3,949 | |
Accrued management fee | 11,211 | |
Other affiliated payables | 2,991 | |
Other payables and accrued
expenses | 36,757 | |
Total liabilities | | 220,304 |
| | |
Net Assets | | $ 23,641,118 |
Net Assets consist of: | | |
Paid in capital | | $ 22,773,266 |
Distributions in excess of net investment income | | (887) |
Accumulated undistributed net realized gain (loss) on investments and foreign currency transactions | | (641,282) |
Net unrealized appreciation (depreciation) on investments and assets and liabilities in foreign
currencies | | 1,510,021 |
Net Assets | | $ 23,641,118 |
Statement of Assets and Liabilities - continued
| December 31, 2010 |
Initial Class:
Net Asset Value, offering price and redemption price per share ($8,105,528 ÷ 698,322 shares) | | $ 11.61 |
| | |
Investor Class:
Net Asset Value, offering price and redemption price per share ($15,535,590 ÷ 1,340,639 shares) | | $ 11.59 |
See accompanying notes which are an integral part of the financial statements.
Annual Report
Financial Statements - continued
Statement of Operations
| Year ended December 31, 2010 |
| | |
Investment Income | | |
Dividends | | $ 520,825 |
Interest | | 9 |
Income from Fidelity Central Funds | | 1,034 |
Total income | | 521,868 |
| | |
Expenses | | |
Management fee | $ 112,043 | |
Transfer agent fees | 30,978 | |
Accounting fees and expenses | 7,800 | |
Custodian fees and expenses | 26,555 | |
Independent trustees' compensation | 111 | |
Audit | 37,318 | |
Legal | 84 | |
Miscellaneous | 226 | |
Total expenses before reductions | 215,115 | |
Expense reductions | (6,055) | 209,060 |
Net investment income (loss) | | 312,808 |
Realized and Unrealized Gain (Loss) Net realized gain (loss) on: | | |
Investment securities: | | |
Unaffiliated issuers | 657,078 | |
Foreign currency transactions | (1,059) | |
Total net realized gain (loss) | | 656,019 |
Change in net unrealized appreciation (depreciation) on: Investment securities | 1,857,994 | |
Assets and liabilities in foreign currencies | (215) | |
Total change in net unrealized appreciation (depreciation) | | 1,857,779 |
Net gain (loss) | | 2,513,798 |
Net increase (decrease) in net assets resulting from operations | | $ 2,826,606 |
Statement of Changes in Net Assets
| Year ended
December 31, 2010 | Year ended
December 31, 2009 |
Increase (Decrease) in Net Assets | | |
Operations | | |
Net investment income (loss) | $ 312,808 | $ 284,979 |
Net realized gain (loss) | 656,019 | (815,764) |
Change in net unrealized appreciation (depreciation) | 1,857,779 | 3,023,613 |
Net increase (decrease) in net assets resulting
from operations | 2,826,606 | 2,492,828 |
Distributions to shareholders from net investment income | (318,633) | (282,510) |
Share transactions - net increase (decrease) | 2,147,026 | (6,462,234) |
Redemption fees | 8,532 | 5,770 |
Total increase (decrease) in net assets | 4,663,531 | (4,246,146) |
| | |
Net Assets | | |
Beginning of period | 18,977,587 | 23,223,733 |
End of period (including distributions in excess of net investment income of $887 and undistributed net investment
income of $0, respectively) | $ 23,641,118 | $ 18,977,587 |
See accompanying notes which are an integral part of the financial statements.
Annual Report
Financial Highlights - Initial Class
Years ended December 31, | 2010 | 2009 | 2008 | 2007H |
Selected Per-Share Data | | | | |
Net asset value, beginning of period | $ 10.22 | $ 8.60 | $ 11.08 | $ 10.00 |
Income from Investment Operations | | | | |
Net investment income (loss)E | .17 | .15 | .15 | .08 |
Net realized and unrealized gain (loss) | 1.39 | 1.63 | (2.53) | 1.11 |
Total from investment operations | 1.56 | 1.78 | (2.38) | 1.19 |
Distributions from net investment income | (.17) | (.16) | (.11) | (.04) |
Distributions from net realized gain | - | - | - | (.07) |
Total distributions | (.17) | (.16) | (.11) | (.11) |
Redemption fees added to paid in capitalE | -J | -J | .01 | -J |
Net asset value, end of period | $ 11.61 | $ 10.22 | $ 8.60 | $ 11.08 |
Total ReturnB,C,D | 15.23% | 20.73% | (21.35)% | 11.92% |
Ratios to Average Net AssetsF,I | | | | |
Expenses before reductions | 1.03% | 1.12% | 1.12% | 1.66%A |
Expenses net of fee waivers, if any | 1.00% | 1.00% | 1.00% | 1.00%A |
Expenses net of all reductions | .99% | 1.00% | 1.00% | 1.00%A |
Net investment income (loss) | 1.61% | 1.68% | 1.47% | 1.05%A |
Supplemental Data | | | | |
Net assets, end of period (000 omitted) | $ 8,106 | $ 8,532 | $ 9,706 | $ 7,964 |
Portfolio turnover rateG | 60% | 71% | 91% | 35%A |
A Annualized B Total returns for periods of less than one year are not annualized. C Total returns do not reflect charges attributable to your insurance company's separate account. Inclusion of these charges would reduce the total returns shown. D Total returns would have been lower had certain expenses not been reduced during the periods shown. E Calculated based on average shares outstanding during the period. F Fees and expenses of the underlying Fidelity Central Funds are not included in the Fund's expense ratio. The Fund indirectly bears its proportionate share of the expenses of any underlying Fidelity Central Funds. G Amount does not include the portfolio activity of any underlying Fidelity Central Funds. H For the period April 24, 2007 (commencement of operations) to December 31, 2007. I Expense ratios reflect operating expenses of the class. Expenses before reductions do not reflect amounts reimbursed by the investment adviser or reductions from brokerage service arrangements or reductions from other expense offset arrangements and do not represent the amount paid by the class during periods when reimbursements or reductions occur. Expense ratios before reductions for start-up periods may not be representative of longer-term operating periods. Expenses net of fee waivers reflect expenses after reimbursement by the investment adviser but prior to reductions from brokerage service arrangements or other expense offset arrangements. Expenses net of all reductions represent the net expenses paid by the class. J Amount represents less than $.01 per share. |
Financial Highlights - Investor Class
Years ended December 31, | 2010 | 2009 | 2008 | 2007H |
Selected Per-Share Data | | | | |
Net asset value, beginning of period | $ 10.21 | $ 8.59 | $ 11.07 | $ 10.00 |
Income from Investment Operations | | | | |
Net investment income (loss)E | .16 | .14 | .14 | .07 |
Net realized and unrealized gain (loss) | 1.38 | 1.63 | (2.52) | 1.11 |
Total from investment operations | 1.54 | 1.77 | (2.38) | 1.18 |
Distributions from net investment income | (.16) | (.15) | (.11) | (.04) |
Distributions from net realized gain | - | - | - | (.07) |
Total distributions | (.16) | (.15) | (.11) | (.11) |
Redemption fees added to paid in capitalE | -J | -J | .01 | -J |
Net asset value, end of period | $ 11.59 | $ 10.21 | $ 8.59 | $ 11.07 |
Total ReturnB,C,D | 15.09% | 20.68% | (21.41)% | 11.82% |
Ratios to Average Net AssetsF,I | | | | |
Expenses before reductions | 1.10% | 1.22% | 1.22% | 1.79%A |
Expenses net of fee waivers, if any | 1.08% | 1.08% | 1.08% | 1.15%A |
Expenses net of all reductions | 1.07% | 1.08% | 1.08% | 1.15%A |
Net investment income (loss) | 1.53% | 1.60% | 1.39% | .90%A |
Supplemental Data | | | | |
Net assets, end of period (000 omitted) | $ 15,536 | $ 10,446 | $ 13,518 | $ 7,018 |
Portfolio turnover rateG | 60% | 71% | 91% | 35%A |
A Annualized B Total returns for periods of less than one year are not annualized. C Total returns do not reflect charges attributable to your insurance company's separate account. Inclusion of these charges would reduce the total returns shown. D Total returns would have been lower had certain expenses not been reduced during the periods shown. E Calculated based on average shares outstanding during the period. F Fees and expenses of the underlying Fidelity Central Funds are not included in the Fund's expense ratio. The Fund indirectly bears its proportionate share of the expenses of any underlying Fidelity Central Funds. G Amount does not include the portfolio activity of any underlying Fidelity Central Funds. H For the period April 24, 2007 (commencement of operations) to December 31, 2007. I Expense ratios reflect operating expenses of the class. Expenses before reductions do not reflect amounts reimbursed by the investment adviser or reductions from brokerage service arrangements or reductions from other expense offset arrangements and do not represent the amount paid by the class during periods when reimbursements or reductions occur. Expense ratios before reductions for start-up periods may not be representative of longer-term operating periods. Expenses net of fee waivers reflect expenses after reimbursement by the investment adviser but prior to reductions from brokerage service arrangements or other expense offset arrangements. Expenses net of all reductions represent the net expenses paid by the class. J Amount represents less than $.01 per share. |
See accompanying notes which are an integral part of the financial statements.
Annual Report
Notes to Financial Statements
For the period ended December 31, 2010
1. Organization.
VIP Consumer Staples Portfolio (the Fund) is a non-diversified fund of Variable Insurance Products Fund IV (the Trust) and is authorized to issue an unlimited number of shares. The Trust is registered under the Investment Company Act of 1940, as amended (the 1940 Act), as an open-end management investment company organized as a Massachusetts business trust. Shares of the Fund may only be purchased by insurance companies for the purpose of funding variable annuity or variable life insurance contracts. The Fund offers the following classes of shares: Initial Class shares and Investor Class shares. All classes have equal rights and voting privileges, except for matters affecting a single class. Investment income, realized and unrealized capital gains and losses, the common expenses of the Fund, and certain fund-level expense reductions, if any, are allocated on a pro-rata basis to each class based on the relative net assets of each class to the total net assets of the Fund. Each class differs with respect to transfer agent fees incurred. Certain expense reductions may also differ by class.
2. Investments in Fidelity Central Funds.
The Fund may invest in Fidelity Central Funds, which are open-end investment companies available only to other investment companies and accounts managed by Fidelity Management & Research Company (FMR) and its affiliates. The Fund's Schedule of Investments lists each of the Fidelity Central Funds held as of period end, if any, as an investment of the Fund, but does not include the underlying holdings of each Fidelity Central Fund. As an Investing Fund, the Fund indirectly bears its proportionate share of the expenses of the underlying Fidelity Central Funds.
The Money Market Central Funds seek preservation of capital and current income and are managed by Fidelity Investments Money Management, Inc. (FIMM), an affiliate of FMR.
A complete unaudited list of holdings for each Fidelity Central Fund is available upon request or at the Securities and Exchange Commission (the SEC) web site at www.sec.gov. In addition, the financial statements of the Fidelity Central Funds, which are not covered by the Fund's Report of Independent Registered Public Accounting Firm, are available on the SEC web site or upon request.
3. Significant Accounting Policies.
The financial statements have been prepared in conformity with accounting principles generally accepted in the United States of America (GAAP), which require management to make certain estimates and assumptions at the date of the financial statements. Actual results could differ from those estimates. Subsequent events, if any, through the date that the financial statements were issued have been evaluated in the preparation of the financial statements. The following summarizes the significant accounting policies of the Fund:
Security Valuation. Investments are valued as of 4:00 p.m. Eastern time on the last calendar day of the period. The Fund uses independent pricing services approved by the Board of Trustees to value its investments. When current market prices or quotations are not readily available or reliable, valuations may be determined in good faith in accordance with procedures adopted by the Board of Trustees. Factors used in determining value may include market or security specific events. The frequency with which these procedures are used cannot be predicted and they may be utilized to a significant extent. The value used for net asset value (NAV) calculation under these procedures may differ from published prices for the same securities.
The Fund categorizes the inputs to valuation techniques used to value its investments into a disclosure hierarchy consisting of three levels as shown below.
Level 1 - quoted prices in active markets for identical investments
Level 2 - other significant observable inputs (including quoted prices for similar investments, interest rates, prepayment speeds, etc.)
Level 3 - unobservable inputs (including the Fund's own assumptions based on the best information available)
Changes in valuation techniques may result in transfers in or out of an assigned level within the disclosure hierarchy. Valuation techniques used to value the Fund's investments by major category are as follows.
Equity securities, including restricted securities, for which market quotations are readily available, are valued at the last reported sale price or official closing price as reported by an independent pricing service on the primary market or exchange on which they are traded and are categorized as Level 1 in the hierarchy. In the event there were no sales during the day or closing prices are not available, securities are valued at the last quoted bid price or may be valued using the last available price and are generally categorized as Level 2 in the hierarchy. For foreign equity securities, when significant market or security specific events arise, comparisons to the valuation of American Depositary Receipts (ADRs), futures contracts, Exchange-traded funds (ETFs) and certain indexes as well as quoted prices for similar securities are used and are categorized as Level 2 in the hierarchy in these circumstances. Utilizing these techniques may result in transfers between Level 1 and Level 2. For restricted equity securities and private placements where observable inputs are limited, assumptions about market activity and risk are used and are categorized as Level 3 in the hierarchy.
Investments in open-end mutual funds, including the Fidelity Central Funds, are valued at their closing net asset value each business day and are categorized as Level 1 in the hierarchy.
Annual Report
3. Significant Accounting Policies - continued
Foreign Currency. The Fund uses foreign currency contracts to facilitate transactions in foreign-denominated securities. Gains and losses from these transactions may arise from changes in the value of the foreign currency or if the counterparties do not perform under the contracts' terms.
Foreign-denominated assets, including investment securities, and liabilities are translated into U.S. dollars at the exchange rate at period end. Purchases and sales of investment securities, income and dividends received and expenses denominated in foreign currencies are translated into U.S. dollars at the exchange rate in effect on the transaction date.
The effects of exchange rate fluctuations on investments are included with the net realized and unrealized gain (loss) on investment securities. Other foreign currency transactions resulting in realized and unrealized gain (loss) are disclosed separately.
Investment Transactions and Income. For financial reporting purposes, the Fund's investment holdings and NAV include trades executed through the end of the last business day of the period. The NAV per share for processing shareholder transactions is calculated as of the close of business of the New York Stock Exchange (NYSE), normally 4:00 p.m. Eastern time and includes trades executed through the end of the prior business day. Gains and losses on securities sold are determined on the basis of identified cost. Dividend income is recorded on the ex-dividend date, except for certain dividends from foreign securities where the ex-dividend date may have passed, which are recorded as soon as the Fund is informed of the ex-dividend date. Non-cash dividends included in dividend income, if any, are recorded at the fair market value of the securities received. Interest income and distributions from the Fidelity Central Funds are accrued as earned. Interest income includes coupon interest and amortization of premium and accretion of discount on debt securities. Investment income is recorded net of foreign taxes withheld where recovery of such taxes is uncertain.
Expenses. Expenses directly attributable to a fund are charged to that fund. Expenses attributable to more than one fund are allocated among the respective funds on the basis of relative net assets or other appropriate methods. Expense estimates are accrued in the period to which they relate and adjustments are made when actual amounts are known.
Income Tax Information and Distributions to Shareholders. Each year the Fund intends to qualify as a regulated investment company, including distributing substantially all of its taxable income and realized gains under Subchapter M of the Internal Revenue Code and filing its U.S. federal tax return. As a result, no provision for income taxes is required. As of December 31, 2010, the Fund did not have any unrecognized tax benefits in the accompanying financial statements. A fund's federal tax return is subject to examination by the Internal Revenue Service (IRS) for a period of three years. Foreign taxes are provided for based on the Fund's understanding of the tax rules and rates that exist in the foreign markets in which it invests.
Distributions are declared and recorded on the ex-dividend date. Income dividends and capital gain distributions are declared separately for each class. Income and capital gain distributions are determined in accordance with income tax regulations, which may differ from GAAP.
Capital accounts within the financial statements are adjusted for permanent book-tax differences. These adjustments have no impact on net assets or the results of operations. Temporary book-tax differences will reverse in a subsequent period.
Book-tax differences are primarily due to foreign currency transactions, capital loss carryforwards and losses deferred due to wash sales and excise tax regulations.
The federal tax cost of investment securities and unrealized appreciation (depreciation) as of period end were as follows:
Gross unrealized appreciation | $ 2,451,908 |
Gross unrealized depreciation | (1,118,607) |
Net unrealized appreciation (depreciation) | $ 1,333,301 |
| |
Tax Cost | $ 22,381,503 |
The tax-based components of distributable earnings as of period end were as follows:
Capital loss carryforward | $ (453,672) |
Net unrealized appreciation (depreciation) | $ 1,333,060 |
The tax character of distributions paid was as follows:
| December 31, 2010 | December 31, 2009 |
Ordinary Income | $ 318,633 | $ 282,510 |
Annual Report
Notes to Financial Statements - continued
3. Significant Accounting Policies - continued
Trading (Redemption) Fees. Shares held by investors less than 60 days are subject to a redemption fee equal to 1% of the net asset value of shares redeemed. All redemption fees, which reduce the proceeds of the shareholder redemption, are retained by the Fund and accounted for as an addition to paid in capital.
4. Purchases and Sales of Investments.
Purchases and sales of securities, other than short-term securities, aggregated $13,495,970 and $11,698,459, respectively.
5. Fees and Other Transactions with Affiliates.
Management Fee. FMR and its affiliates provide the Fund with investment management related services for which the Fund pays a monthly management fee. The management fee is the sum of an individual fund fee rate that is based on an annual rate of .30% of the Fund's average net assets and a group fee rate that averaged .26% during the period. The group fee rate is based upon the average net assets of all the mutual funds advised by FMR. The group fee rate decreases as assets under management increase and increases as assets under management decrease. For the period, the total annual management fee rate was .56% of the Fund's average net assets.
Transfer Agent Fees. Fidelity Investments Institutional Operations Company, Inc. (FIIOC), an affiliate of FMR, is the Fund's transfer, dividend disbursing, and shareholder servicing agent. FIIOC receives an asset-based fee with respect to each class. Each class (with the exception of Investor Class) pays a transfer agent fee, excluding out of pocket expenses, equal to an annual rate of .07% of average net assets. Investor Class pays a monthly asset-based transfer agent fee of .15% of average net assets. In addition, FIIOC receives an asset-based fee of .01% of average net assets for typesetting, printing and mailing of shareholder reports, except proxy statements. FIIOC has agreed to voluntarily waive this fee until December 31, 2010. (See Note 7: Expense Reductions.) For the period, transfer agent fees for each class, including printing and out of pocket expenses, were as follows:
Initial Class | $ 9,084 |
Investor Class | 21,894 |
| $ 30,978 |
Accounting Fees. Fidelity Service Company, Inc. (FSC), an affiliate of FMR, maintains the Fund's accounting records. The fee is based on the level of average net assets for the month.
Brokerage Commissions. The Fund placed a portion of its portfolio transactions with brokerage firms which are affiliates of the investment adviser. The commissions paid to these affiliated firms were $223 for the period.
6. Committed Line of Credit.
The Fund participates with other funds managed by FMR or an affiliate in a $3.75 billion credit facility (the "line of credit") to be utilized for temporary or emergency purposes to fund shareholder redemptions or for other short-term liquidity purposes. The Fund has agreed to pay commitment fees on its pro-rata portion of the line of credit, which amounted to $75 and is reflected in Miscellaneous expenses on the Statement of Operations. During the period, there were no borrowings on this line of credit.
7. Expense Reductions.
In addition to FIIOC waiving a portion of its transfer agent fees, FMR voluntarily agreed to reimburse each class to the extent annual operating expenses exceeded certain levels of average net assets as noted in the table below. Some expenses, for example interest expense, including commitment fees, are excluded from this reimbursement.
The following classes were in reimbursement during the period:
| Expense
Limitations | Reimbursement/
Waiver |
Initial Class | 1.00% | $ 2,458 |
Investor Class | 1.08 | 2,518 |
| | $ 4,976 |
Annual Report
7. Expense Reductions - continued
Many of the brokers with whom FMR places trades on behalf of the Fund provided services to the Fund in addition to trade execution. These services included payments of certain expenses on behalf of the Fund totaling $1,079 for the period.
8. Distributions to Shareholders.
Distributions to shareholders of each class were as follows:
Years ended December 31, | 2010 | 2009 |
From net investment income | | |
Initial Class | $ 114,030 | $ 131,298 |
Investor Class | 204,603 | 151,212 |
Total | $ 318,633 | $ 282,510 |
9. Share Transactions.
Transactions for each class of shares were as follows:
| Shares | Dollars |
Years ended December 31, | 2010 | 2009 | 2010 | 2009 |
Initial Class | | | | |
Shares sold | 208,392 | 438,229 | $ 2,240,019 | $ 4,041,941 |
Reinvestment of distributions | 9,881 | 13,013 | 114,030 | 131,298 |
Shares redeemed | (354,465) | (745,202) | (3,773,876) | (6,159,466) |
Net increase (decrease) | (136,192) | (293,960) | $ (1,419,827) | $ (1,986,227) |
Investor Class | | | | |
Shares sold | 656,909 | 562,478 | $ 7,132,294 | $ 5,117,088 |
Reinvestment of distributions | 17,761 | 15,001 | 204,603 | 151,212 |
Shares redeemed | (357,080) | (1,127,994) | (3,770,044) | (9,744,307) |
Net increase (decrease) | 317,590 | (550,515) | $ 3,566,853 | $ (4,476,007) |
10. Other.
The Fund's organizational documents provide former and current trustees and officers with a limited indemnification against liabilities arising in connection with the performance of their duties to the Fund. In the normal course of business, the Fund may also enter into contracts that provide general indemnifications. The Fund's maximum exposure under these arrangements is unknown as this would be dependent on future claims that may be made against the Fund. The risk of material loss from such claims is considered remote.
At the end of the period, FMR or its affiliates were the owners of record of 100% of the total outstanding shares of the Fund.
Annual Report
Report of Independent Registered Public Accounting Firm
To the Trustees of Variable Insurance Products Fund IV and the Shareholders of VIP Consumer Staples Portfolio:
In our opinion, the accompanying statement of assets and liabilities, including the schedule of investments, and the related statements of operations and of changes in net assets and the financial highlights present fairly, in all material respects, the financial position of VIP Consumer Staples Portfolio (a fund of Variable Insurance Products Fund IV) at December 31, 2010, the results of its operations for the year then ended, the changes in its net assets for each of the periods indicated and the financial highlights for each of the periods indicated, in conformity with accounting principles generally accepted in the United States of America. These financial statements and financial highlights (hereafter referred to as "financial statements") are the responsibility of the VIP Consumer Staples Portfolio's management. Our responsibility is to express an opinion on these financial statements based on our audits. We conducted our audits of these financial statements in accordance with the standards of the Public Company Accounting Oversight Board (United States). Those standards require that we plan and perform the audit to obtain reasonable assurance about whether the financial statements are free of material misstatement. An audit includes examining, on a test basis, evidence supporting the amounts and disclosures in the financial statements, assessing the accounting principles used and significant estimates made by management, and evaluating the overall financial statement presentation. We believe that our audits, which included confirmation of securities at December 31, 2010 by correspondence with the custodian and brokers, provide a reasonable basis for our opinion.
/s/ PricewaterhouseCoopers LLP
PricewaterhouseCoopers LLP
Boston, Massachusetts
February 17, 2011
Annual Report
The Trustees, Members of the Advisory Board, and executive officers of the trust and funds, as applicable, are listed below. The Board of Trustees governs each fund and is responsible for protecting the interests of shareholders. The Trustees are experienced executives who meet periodically throughout the year to oversee each fund's activities, review contractual arrangements with companies that provide services to each fund, oversee management of the risks associated with such activities and contractual arrangements, and review each fund's performance. Except for James C. Curvey, each of the Trustees oversees 219 funds advised by FMR or an affiliate. Mr. Curvey oversees 408 funds advised by FMR or an affiliate.
The Trustees hold office without limit in time except that (a) any Trustee may resign; (b) any Trustee may be removed by written instrument, signed by at least two-thirds of the number of Trustees prior to such removal; (c) any Trustee who requests to be retired or who has become incapacitated by illness or injury may be retired by written instrument signed by a majority of the other Trustees; and (d) any Trustee may be removed at any special meeting of shareholders by a two-thirds vote of the outstanding voting securities of the trust. Each Trustee who is not an interested person (as defined in the 1940 Act) (Independent Trustee), shall retire not later than the last day of the calendar year in which his or her 72nd birthday occurs. The Independent Trustees may waive this mandatory retirement age policy with respect to individual Trustees. The executive officers and Advisory Board Members hold office without limit in time, except that any officer and Advisory Board Member may resign or may be removed by a vote of a majority of the Trustees at any regular meeting or any special meeting of the Trustees. Except as indicated, each individual has held the office shown or other offices in the same company for the past five years.
Experience, Skills, Attributes, and Qualifications of the Fund's Trustees. The Governance and Nominating Committee has adopted a statement of policy that describes the experience, qualifications, attributes, and skills that are necessary and desirable for potential Independent Trustee candidates (Statement of Policy). The Board believes that each Trustee satisfied at the time he or she was initially elected or appointed a Trustee, and continues to satisfy, the standards contemplated by the Statement of Policy. The Governance and Nominating Committee also engages professional search firms to help identify potential Independent Trustee candidates who have the experience, qualifications, attributes, and skills consistent with the Statement of Policy. From time to time, additional criteria based on the composition and skills of the current Independent Trustees, as well as experience or skills that may be appropriate in light of future changes to board composition, business conditions, and regulatory or other developments, have also been considered by the professional search firms and the Governance and Nominating Committee. In addition, the Board takes into account the Trustees' commitment and participation in Board and committee meetings, as well as their leadership of standing and ad hoc committees throughout their tenure.
In determining that a particular Trustee was and continues to be qualified to serve as a Trustee, the Board has considered a variety of criteria, none of which, in isolation, was controlling. The Board believes that, collectively, the Trustees have balanced and diverse experience, qualifications, attributes, and skills, which allow the Board to operate effectively in governing each fund and protecting the interests of shareholders. Information about the specific experience, skills, attributes, and qualifications of each Trustee, which in each case led to the Board's conclusion that the Trustee should serve (or continue to serve) as a trustee of the funds, is provided below.
Board Structure and Oversight Function. James C. Curvey is an interested person (as defined in the 1940 Act) and currently serves as Acting Chairman. The Trustees have determined that an interested Chairman is appropriate and benefits shareholders because an interested Chairman has a personal and professional stake in the quality and continuity of services provided to the funds. Independent Trustees exercise their informed business judgment to appoint an individual of their choosing to serve as Chairman, regardless of whether the Trustee happens to be independent or a member of management. The Independent Trustees have determined that they can act independently and effectively without having an Independent Trustee serve as Chairman and that a key structural component for assuring that they are in a position to do so is for the Independent Trustees to constitute a substantial majority for the Board. The Independent Trustees also regularly meet in executive session. Ned C. Lautenbach serves as Chairman of the Independent Trustees and as such (i) acts as a liaison between the Independent Trustees and management with respect to matters important to the Independent Trustees and (ii) with management prepares agendas for Board meetings.
Fidelity funds are overseen by different Boards of Trustees. The funds' Board oversees Fidelity's equity and high income funds and another Board oversees Fidelity's investment-grade bond, money market, and asset allocation funds. The asset allocation funds may invest in Fidelity funds overseen by the funds' Board. The use of separate Boards, each with its own committee structure, allows the Trustees of each group of Fidelity funds to focus on the unique issues of the funds they oversee, including common research, investment, and operational issues. On occasion, the separate Boards establish joint committees to address issues of overlapping consequences for the Fidelity funds overseen by each Board.
The Trustees operate using a system of committees to facilitate the timely and efficient consideration of all matters of importance to the Trustees, each fund, and fund shareholders and to facilitate compliance with legal and regulatory requirements and oversight of the funds' activities and associated risks. The Board, acting through its committees, has charged FMR and its affiliates with (i) identifying events or circumstances the occurrence of which could have demonstrably adverse effects on the funds' business and/or reputation; (ii) implementing processes and controls to lessen the possibility that such events or circumstances occur or to mitigate the effects of such events or circumstances if they do occur; and (iii) creating and maintaining a system designed to evaluate continuously business and market conditions in order to facilitate the identification and implementation processes described in (i) and (ii) above. Because the day-to-day operations and activities of the funds are carried out by or through FMR, its affiliates and other service providers, the funds' exposure to risks is mitigated but not eliminated by the processes overseen by the Trustees. While each of the Board's committees has responsibility for overseeing different aspects of the funds' activities, oversight is exercised primarily through the Operations, Audit, and Compliance Committees. Appropriate personnel, including but not limited to the funds' Chief Compliance Officer (CCO), FMR's internal auditor, the independent accountants, the funds' Treasurer and portfolio management personnel, make periodic reports to the Board's committees, as appropriate. The responsibilities of each committee, including their oversight responsibilities, are described further under "Standing Committees of the Fund's Trustees."
Annual Report
The fund's Statement of Additional Information (SAI) includes more information about the Trustees. To request a free copy, call Fidelity at 1-877-208-0098.
Interested Trustees*:
Correspondence intended for each Trustee who is an interested person may be sent to Fidelity Investments, 82 Devonshire Street, Boston, Massachusetts 02109.
Name, Age; Principal Occupations and Other Relevant Experience+ |
James C. Curvey (75) |
| Year of Election or Appointment: 2007 Mr. Curvey is Trustee and Acting Chairman of the Board of Trustees of certain Trusts. Mr. Curvey also serves as Trustee (2007-present) of other investment companies advised by FMR. Mr. Curvey is a Director of Fidelity Investments Money Management, Inc. (2009-present), Director of Fidelity Research & Analysis Co. (2009-present) and Director of FMR and FMR Co., Inc. (2007-present). Mr. Curvey is also Vice Chairman (2007-present) and Director of FMR LLC. In addition, Mr. Curvey serves as an Overseer for the Boston Symphony Orchestra and a member of the Trustees of Villanova University. Previously, Mr. Curvey was the Vice Chairman (2006-2007) and Director (2000-2007) of FMR Corp. |
Ronald P. O'Hanley (54) |
| Year of Election or Appointment: 2011 Mr. O'Hanley is President of Fidelity Asset Management and Corporate Services and a member of Fidelity's Executive Committee (2010-present). Previously, Mr. O'Hanley served as President and Chief Executive Officer of BNY Mellon Asset Management (2007-2010). Mr. O'Hanley also served as Vice Chairman of Bank New York Mellon Corp. and a member of that firm's Executive Committee. Prior to the 2007 merger of The Bank of New York and Mellon Financial Corporation, he was Vice Chairman of Mellon Financial Corporation and President and Chief Executive Officer of Mellon Asset Management. He joined Mellon in February 1997. Mr. O'Hanley currently serves as Chairman of the Boston Public Library Foundation Board of Directors and sits on the Board of Directors of Beth Israel Deaconess Medical Center, the Board of Trustees of the Marine Biological Laboratory and the Advisory Board of the Maxwell School of Citizenship and Public Administration at Syracuse University. Mr. O'Hanley also chairs the Council on Asset Management for the Financial Services Roundtable and is a member of the Board of Directors of Institutional Investor's U.S. Institute. |
* Trustees have been determined to be "Interested Trustees" by virtue of, among other things, their affiliation with the trust or various entities under common control with FMR.
+ The information above includes each Trustee's principal occupation during the last five years and other information relating to the experience, attributes, and skills relevant to each Trustee's qualifications to serve as a Trustee, which led to the conclusion that each Trustee should serve as a Trustee for each fund.
Independent Trustees:
Correspondence intended for each Independent Trustee (that is, the Trustees other than the Interested Trustees) may be sent to Fidelity Investments, P.O. Box 55235, Boston, Massachusetts 02205-5235.
Name, Age; Principal Occupations and Other Relevant Experience+ |
Dennis J. Dirks (62) |
| Year of Election or Appointment: 2005 Prior to his retirement in May 2003, Mr. Dirks was Chief Operating Officer and a member of the Board of The Depository Trust & Clearing Corporation (DTCC). He also served as President, Chief Operating Officer, and Board member of The Depository Trust Company (DTC) and President and Board member of the National Securities Clearing Corporation (NSCC). In addition, Mr. Dirks served as Chief Executive Officer and Board member of the Government Securities Clearing Corporation, Chief Executive Officer and Board member of the Mortgage-Backed Securities Clearing Corporation, as a Trustee and a member of the Finance Committee of Manhattan College (2005-2008), and as a Trustee and a member of the Finance Committee of AHRC of Nassau County (2006-2008). Mr. Dirks is a member of the Independent Directors Council (IDC) Governing Council (2010-Present) and Board of Directors for The Brookville Center for Children's Services, Inc. (2009-present). |
Alan J. Lacy (57) |
| Year of Election or Appointment: 2008 Mr. Lacy serves as Senior Adviser (2007-present) of Oak Hill Capital Partners, L.P. (private equity). Mr. Lacy also served as Chief Executive Officer (2000-2005) and Vice Chairman (2005-2006) of Sears Holdings Corporation and Sears, Roebuck and Co. (retail). In addition, Mr. Lacy serves as a member of the Board of Directors of The Western Union Company (global money transfer, 2006-present) and Bristol-Myers Squibb Company (global pharmaceuticals, 2007-present). Mr. Lacy is Chairman (2008-present) and a member (2006-present) of the Board of Trustees of The National Parks Conservation Association. |
Ned C. Lautenbach (66) |
| Year of Election or Appointment: 2000 Mr. Lautenbach is Chairman of the Independent Trustees of the Equity and High Income Funds (2006-present). Mr. Lautenbach currently serves as the Lead Director of the Eaton Corporation Board of Directors (diversified industrial, 1997-present). Mr. Lautenbach is also a member of the Board of Directors of the Philharmonic Center for the Arts in Naples, Florida (1999-present); a member of the Board of Trustees of Fairfield University (2005-present); and a member of the Council on Foreign Relations (1994-present). Previously, Mr. Lautenbach was a Partner/Advisory Partner at Clayton, Dubilier & Rice, Inc. (private equity investment, 1998-2010), as well as a Director of Sony Corporation (2006-2007). |
Joseph Mauriello (66) |
| Year of Election or Appointment: 2008 Prior to his retirement in January 2006, Mr. Mauriello served in numerous senior management positions including Deputy Chairman and Chief Operating Officer (2004-2005), and Vice Chairman of Financial Services (2002-2004) of KPMG LLP US (professional services, 1965-2005). Mr. Mauriello currently serves as a member of the Board of Directors of XL Group plc. (global insurance and re-insurance, 2006-present) and of Arcadia Resources Inc. (health care services and products, 2007-present). Previously, Mr. Mauriello served as a Director of the Hamilton Funds of the Bank of New York (2006-2007). |
Cornelia M. Small (66) |
| Year of Election or Appointment: 2005 Ms. Small is a member of the Board of Directors of the Teagle Foundation (2009-present). Ms. Small is also a member of the Investment Committee, and Chair (2008-present) and a member of the Board of Trustees of Smith College. In addition, Ms. Small serves on the Investment Committee of the Berkshire Taconic Community Foundation (2008-present). Previously, Ms. Small served as Chairperson of the Investment Committee (2002-2008) of Smith College. In addition, Ms. Small served as Chief Investment Officer, Director of Global Equity Investments, and a member of the Board of Directors of Scudder, Stevens & Clark and Scudder Kemper Investments. |
William S. Stavropoulos (71) |
| Year of Election or Appointment: 2001 Mr. Stavropoulos is Vice Chairman of the Independent Trustees of the Equity and High Income Funds (2006-present). Mr. Stavropoulos serves as President and Founder of the Michigan Baseball Foundation, the Great Lakes Loons (2007-present). Mr. Stavropoulos is Chairman Emeritus of the Board of Directors of The Dow Chemical Company, where he previously served in numerous senior management positions, including President, CEO (1995-2000; 2002-2004), Chairman of the Executive Committee (2000-2006), and as a member of the Board of Directors (1990-2006). Currently, Mr. Stavropoulos is Chairman of Univar (global distributor of commodity and specialty chemicals, 2010-present), a Director of Teradata Corporation (data warehousing and technology solutions, 2008-present), Chemical Financial Corporation, Maersk Inc. (industrial conglomerate), Tyco International, Inc. (multinational manufacturing and services, 2007-present), and a member of the Advisory Board for Metalmark Capital (private equity investment, 2005-present). Mr. Stavropoulos is a special advisor to Clayton, Dubilier & Rice, LLC (private equity investment). In addition, Mr. Stavropoulos is a member of the University of Notre Dame Advisory Council for the College of Science. |
David M. Thomas (61) |
| Year of Election or Appointment: 2008 Previously, Mr. Thomas served as Executive Chairman (2005-2006) and Chairman and Chief Executive Officer (2000-2005) of IMS Health, Inc. (pharmaceutical and healthcare information solutions). In addition, Mr. Thomas serves as a member of the Board of Directors of Fortune Brands, Inc. (consumer products), and Interpublic Group of Companies, Inc. (marketing communication, 2004-present). |
Michael E. Wiley (60) |
| Year of Election or Appointment: 2008 Mr. Wiley also serves as a Director of Asia Pacific Exploration Consolidated (international oil and gas exploration and production, 2008-present). Mr. Wiley serves as a Director of Tesoro Corporation (independent oil refiner and marketer, 2005-present), and a Director of Bill Barrett Corporation (exploration and production, 2005-present). In addition, Mr. Wiley also serves as a Director of Post Oak Bank (privately-held bank, 2004-present). Previously, Mr. Wiley served as a member of the Board of Trustees of the University of Tulsa (2000-2006; 2007-2010), as a Senior Energy Advisor of Katzenbach Partners, LLC (consulting, 2006-2007), as an Advisory Director of Riverstone Holdings (private investment), Chairman, President, and CEO of Baker Hughes, Inc. (oilfield services, 2000-2004), and as Director of Spinnaker Exploration Company (exploration and production, 2001-2005). |
+ The information above includes each Trustee's principal occupation during the last five years and other information relating to the experience, attributes, and skills relevant to each Trustee's qualifications to serve as a Trustee, which led to the conclusion that each Trustee should serve as a Trustee for each fund.
Advisory Board Members and Executive Officers:
Correspondence intended for each executive officer, Edward C. Johnson 3d, and and Peter S. Lynch may be sent to Fidelity Investments, 82 Devonshire Street, Boston, Massachusetts 02109.
Name, Age; Principal Occupation |
Edward C. Johnson 3d (80) |
| Year of Election or Appointment: 2011 Member of the Advisory Board of Fidelity's Equity and High Income Funds. Formerly Trustee and Chairman of the Board of Trustees of certain Trusts, Mr. Johnson serves as Chief Executive Officer, Chairman, and a Director of FMR LLC; Chairman and a Director of FMR; and Chairman and a Director of FMR Co., Inc. In addition, Mr. Johnson serves as Chairman and Director of FIL Limited. Previously, Mr. Johnson served as President of FMR LLC (2006-2007). |
Peter S. Lynch (66) |
| Year of Election or Appointment: 2003 Member of the Advisory Board of Fidelity's Equity and High Income Funds. Mr. Lynch is Vice Chairman and a Director of FMR and FMR Co., Inc. In addition, Mr. Lynch serves as a Trustee of Boston College and as the Chairman of the Inner-City Scholarship Fund. Previously, Mr. Lynch served on the Special Olympics International Board of Directors (1997-2006). |
Kenneth B. Robins (41) |
| Year of Election or Appointment: 2008 President and Treasurer of Fidelity's Equity and High Income Funds. Mr. Robins also serves as President and Treasurer (2010-present) and Assistant Treasurer (2009-present) of other Fidelity funds and is an employee of Fidelity Investments (2004-present). Previously, Mr. Robins served as Deputy Treasurer of the Fidelity funds (2005-2008) and Treasurer and Chief Financial Officer of The North Carolina Capital Management Trust: Cash and Term Portfolios (2006-2008). |
Brian B. Hogan (46) |
| Year of Election or Appointment: 2009 Vice President of certain Equity Funds and Vice President of Sector Funds. Mr. Hogan also serves as President of FMR's Equity Division (2009-present). Previously, Mr. Hogan served as Senior Vice President, Equity Research of FMR (2006-2009) and as a portfolio manager. |
Christopher S. Bartel (39) |
| Year of Election or Appointment: 2009 Vice President of Fidelity's Sector and Real Estate Equity Funds. Mr. Bartel also serves as Senior Vice President of Equity Research (2009-present). Previously, Mr. Bartel served as Managing Director of Research (2006-2009) and an analyst and portfolio manager (2000-2006). |
Scott C. Goebel (42) |
| Year of Election or Appointment: 2008 Secretary and Chief Legal Officer (CLO) of the Fidelity funds. Mr. Goebel also serves as Secretary and CLO of The North Carolina Capital Management Trust: Cash and Term Portfolio (2008-present); General Counsel, Secretary, and Senior Vice President of FMR (2008-present) and FMR Co., Inc. (2008-present); Deputy General Counsel of FMR LLC; Chief Legal Officer of Fidelity Management & Research (Hong Kong) Limited (2008-present) and Assistant Secretary of Fidelity Management & Research (Japan) Inc. (2008-present), Fidelity Investments Money Management, Inc. (2008-present), Fidelity Management & Research (U.K.) Inc. (2008-present), and Fidelity Research and Analysis Company (2008-present). Previously, Mr. Goebel served as Assistant Secretary of the Funds (2007-2008) and as Vice President and Secretary of Fidelity Distributors Corporation (FDC) (2005-2007). |
William C. Coffey (41) |
| Year of Election or Appointment: 2009 Assistant Secretary of Fidelity's Equity and High Income Funds. Mr. Coffey also serves as Senior Vice President and Deputy General Counsel of FMR LLC (2010-present), and is an employee of Fidelity Investments. Previously, Mr. Coffey served as Vice President and Associate General Counsel of FMR LLC (2005-2009). |
Holly C. Laurent (56) |
| Year of Election or Appointment: 2008 Anti-Money Laundering (AML) Officer of the Fidelity funds. Ms. Laurent also serves as AML Officer of The North Carolina Capital Management Trust: Cash and Term Portfolio (2008-present) and is an employee of Fidelity Investments. Previously, Ms. Laurent was Senior Vice President and Head of Legal for Fidelity Business Services India Pvt. Ltd. (2006-2008), and Senior Vice President, Deputy General Counsel and Group Head for FMR LLC (2005-2006). |
Christine Reynolds (52) |
| Year of Election or Appointment: 2008 Chief Financial Officer of the Fidelity funds. Ms. Reynolds became President of Fidelity Pricing and Cash Management Services (FPCMS) in August 2008. Ms. Reynolds served as Chief Operating Officer of FPCMS (2007-2008). Previously, Ms. Reynolds served as President, Treasurer, and Anti-Money Laundering officer of the Fidelity funds (2004-2007). |
Kenneth A. Rathgeber (63) |
| Year of Election or Appointment: 2004 Chief Compliance Officer of Fidelity's Equity and High Income Funds. Mr. Rathgeber is Chief Compliance Officer of Fidelity Management & Research (Hong Kong) Limited (2008-present), Fidelity Management & Research (Japan) Inc. (2008-present), FMR (2005-present), FMR Co., Inc. (2005-present), Fidelity Management & Research (U.K.) Inc. (2005-present), Fidelity Research & Analysis Company (2005-present), Fidelity Investments Money Management, Inc. (2005-present), Pyramis Global Advisors, LLC (2005-present), and Strategic Advisers, Inc. (2005-present). |
Jeffrey S. Christian (49) |
| Year of Election or Appointment: 2009 Deputy Treasurer of the Fidelity funds. Mr. Christian is an employee of Fidelity Investments. Previously, Mr. Christian served as Chief Financial Officer (2008-2009) of certain Fidelity funds and Senior Vice President of Fidelity Pricing and Cash Management Services (FPCMS) (2004-2009). |
Bryan A. Mehrmann (49) |
| Year of Election or Appointment: 2005 Deputy Treasurer of the Fidelity funds. Mr. Mehrmann is an employee of Fidelity Investments. |
Adrien E. Deberghes (43) |
| Year of Election or Appointment: 2008 Deputy Treasurer of Fidelity's Equity and High Income Funds. Mr. Deberghes also serves as Assistant Treasurer of other Fidelity funds (2010-present) and is an employee of Fidelity Investments (2008-present). Previously, Mr. Deberghes served as Senior Vice President of Mutual Fund Administration at State Street Corporation (2007-2008), Senior Director of Mutual Fund Administration at Investors Bank & Trust (2005-2007), and Director of Finance for Dunkin' Brands (2000-2005). |
Stephanie J. Dorsey (41) |
| Year of Election or Appointment: 2010 Assistant Treasurer of Fidelity's Equity and High Income Funds. Ms. Dorsey also serves as Deputy Treasurer of other Fidelity funds (2008-present) and is an employee of Fidelity Investments (2008-present). Previously, Ms. Dorsey served as Treasurer (2004-2008) of the JPMorgan Mutual Funds and Vice President (2004-2008) of JPMorgan Chase Bank. |
John R. Hebble (52) |
| Year of Election or Appointment: 2009 Assistant Treasurer of Fidelity's Equity and High Income Funds. Mr. Hebble also serves as Treasurer and Chief Financial Officer of The North Carolina Capital Management Trust: Cash and Term Portfolio (2008-present), President and Treasurer of other Fidelity funds (2008-present) and is an employee of Fidelity Investments. |
Gary W. Ryan (52) |
| Year of Election or Appointment: 2005 Assistant Treasurer of the Fidelity funds. Mr. Ryan is an employee of Fidelity Investments. Previously, Mr. Ryan served as Vice President of Fund Reporting in Fidelity Pricing and Cash Management Services (FPCMS) (1999-2005). |
Jonathan Davis (42) |
| Year of Election or Appointment: 2010 Assistant Treasurer of the Fidelity funds. Mr. Davis is an employee of Fidelity Investments. Previously, Mr. Davis served as Vice President and Associate General Counsel of FMR LLC (2003-2010). |
Annual Report
Initial Class and Investor Class designate 100% of the dividends distributed in December 2010, during the fiscal year as qualifying for the dividends-received deduction for corporate shareholders.
Annual Report
Board Approval of Investment Advisory Contracts and Management Fees
VIP Consumer Staples Portfolio
Each year, the Board of Trustees, including the Independent Trustees (together, the Board), votes on the renewal of the management contract and sub-advisory agreements (together, the Advisory Contracts) for the fund. The Board, assisted by the advice of fund counsel and Independent Trustees' counsel, requests and considers a broad range of information relevant to the renewal of the Advisory Contracts throughout the year.
The Board meets regularly and considers at each of its meetings factors that are relevant to its annual consideration of the renewal of the fund's Advisory Contracts, including the services and support provided to the fund and its shareholders. The Board has established various standing committees, each composed of Independent Trustees with varying backgrounds, to which the Board has assigned specific subject matter responsibilities in order to enhance effective decision-making by the Board. The Board, acting directly and through its Committees, requests and receives information concerning the annual consideration of the renewal of the fund's Advisory Contracts. The Board also meets as needed to consider matters specifically related to the Board's annual consideration of the renewal of Advisory Contracts. Members of the Board may also meet with trustees of other Fidelity funds through ad hoc joint committees to discuss certain matters relevant to the Fidelity funds.
At its July 2010 meeting, the Board of Trustees, including the Independent Trustees, unanimously determined to renew the fund's Advisory Contracts. In reaching its determination, the Board considered all factors it believed relevant, including (i) the nature, extent, and quality of the services to be provided to the fund and its shareholders (including the investment performance of the fund); (ii) the competitiveness of the fund's management fee and total expenses; (iii) the total costs of the services to be provided by and the profits to be realized by Fidelity from its relationship with the fund; (iv) the extent to which economies of scale would be realized as the fund grows; and (v) whether fee levels reflect these economies of scale, if any, for the benefit of fund shareholders.
In considering whether to renew the Advisory Contracts for the fund, the Board reached a determination, with the assistance of fund counsel and Independent Trustees' counsel and through the exercise of its business judgment, that the renewal of the Advisory Contracts is in the best interests of fund shareholders and that the compensation to be received by Fidelity under the management contract is fair and reasonable. The Board's decision to renew the Advisory Contracts was not based on any single factor noted above, but rather was based on a comprehensive consideration of all the information provided to the Board at its meetings throughout the year. The Board, in reaching its determination to renew the Advisory Contracts, is aware that shareholders in the fund have a broad range of investment choices available to them, including a wide choice among mutual funds offered by Fidelity's competitors, and that the fund's shareholders, with the opportunity to review and weigh the disclosure provided by the fund in its prospectus and other public disclosures, have chosen to invest in this fund, managed by Fidelity.
Nature, Extent, and Quality of Services Provided. The Board considered the staffing within the investment adviser, FMR, and the sub-advisers (together, the Investment Advisers), including the backgrounds of the fund's investment personnel and the fund's investment objective and discipline. The Independent Trustees also had discussions with senior management of Fidelity's investment operations and investment groups. The Board considered the structure of the portfolio manager compensation program and whether this structure provides appropriate incentives to act in the best interest of the fund.
Resources Dedicated to Investment Management and Support Services. The Board and the equity research subcommittee of the Board's Fund Oversight Committee reviewed the size, education, and experience of the Investment Advisers' investment staff, their use of technology, and the Investment Advisers' approach to recruiting, training, and retaining portfolio managers and other research, advisory, and management personnel. The Board noted that Fidelity's analysts have access to a variety of technological tools and market and securities data that enable them to perform both fundamental and quantitative analysis and to specialize in various disciplines. The Board considered Fidelity's extensive global research capabilities that enable the Investment Advisers to aggregate data from various sources in an effort to produce positive investment results. The Board also considered that Fidelity's portfolio managers and analysts have access to daily portfolio attribution that allows for monitoring of a fund's portfolio, as well as an electronic communication system that provides immediate real-time access to research concerning issuers and credit enhancers. The Board noted FMR's continued focus on strengthening the organization and discipline of equity portfolio management and research.
Shareholder and Administrative Services. The Board considered (i) the nature, extent, quality, and cost of advisory, administrative, and shareholder services performed by the Investment Advisers and their affiliates under the Advisory Contracts and under separate agreements covering transfer agency, pricing and bookkeeping, and securities lending services for the fund; (ii) the nature and extent of the investment adviser's supervision of third party service providers, principally custodians and subcustodians; and (iii) the resources devoted to, and the record of compliance with, the fund's compliance policies and procedures. The Board also reviewed the allocation of fund brokerage, including allocations to brokers affiliated with the Investment Advisers, the use of brokerage commissions to pay fund expenses, and the use of "soft" commission dollars to pay for research services.
The Board noted that the growth of fund assets over time across the complex allows Fidelity to reinvest in the development of services designed to enhance the value or convenience of the Fidelity funds as investment vehicles. These services include 24-hour access to account information and market information through phone representatives and over the Internet, and investor education materials and asset allocation tools.
Investment in a Large Fund Family. The Board considered the benefits to shareholders of investing in a Fidelity fund, including the benefits of investing in a fund that is part of a large family of funds offering a variety of investment disciplines and providing a large variety of mutual fund investor services. The Board noted that Fidelity had taken, or had made recommendations that resulted in the Fidelity funds taking, a number of actions over the previous year that benefited particular funds, including (i) dedicating additional resources to investment research and restructuring and broadening the focus of the investment research teams; (ii) bolstering the senior management team that oversees asset management; (iii) launching Class F of certain funds as a lower-fee class available to Freedom K and Freedom Index Funds; (iv) lowering the initial investment minimums and ongoing balance requirements for Real Estate High Income Fund; (v) eliminating subsequent purchase minimums for all funds and adding a waiver of the investment minimum requirement for new accounts opened with the proceeds of a systematic withdrawal plan; (vi) eliminating the withdrawal minimum and maximum limits for systematic withdrawals from Advisor funds; (vii) expanding sales load waivers on Class A shares for Destiny Planholders and expanding Institutional Class eligibility for Class O Destiny Planholders; and (viii) changing certain Class A and Class T sales charge structures to further align them with industry practices.
Annual Report
Board Approval of Investment Advisory Contracts and Management Fees - continued
Investment Performance. The Board considered whether the fund has operated in accordance with its investment objective, as well as its record of compliance with its investment restrictions. It also reviewed the fund's absolute investment performance for each class, as well as the fund's relative investment performance for each class measured against a third-party-sponsored index that reflects the market sector in which the fund invests. The Board noted that FMR does not believe that a meaningful peer group exists against which to compare the fund's performance. Because the fund had been in existence less than three calendar years, the following chart considered by the Board shows, for the one-year period ended December 31, 2009, the total returns of Initial Class and Investor Class of the fund and the total return of a third-party-sponsored index ("benchmark").
VIP Consumer Staples Portfolio
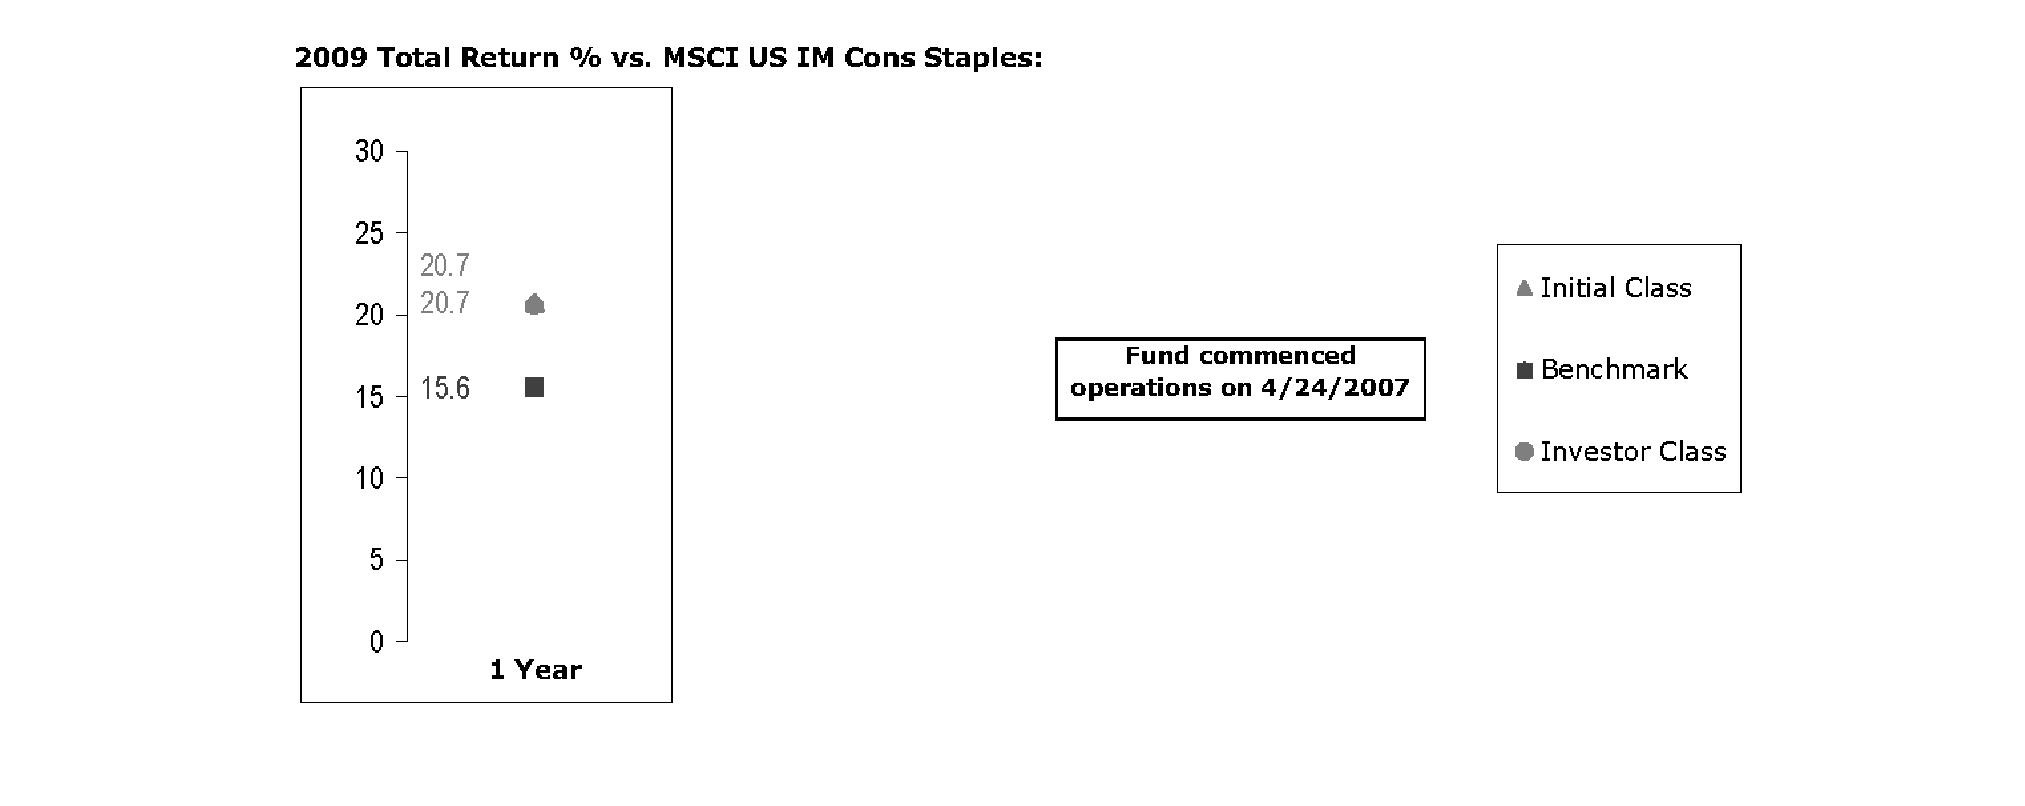
The Board noted that the investment performance of Initial Class of the fund compared favorably to its benchmark for the period shown. The Board considered that the variations in performance between the fund's classes reflect the variations in class expenses, which result in lower performance for the higher expense class. The Board also reviewed the fund's performance since inception as well as performance in the current year. The Board noted that it is difficult to evaluate in any comprehensive fashion the performance of the fund, in light of its relatively recent commencement of operations.
Based on its review, and giving particular weight to the nature and quality of the resources dedicated by the Investment Advisers to maintain and improve relative performance and factoring in the unprecedented market events in recent years, the Board concluded that the nature, extent, and quality of investment management and support services and of shareholder and administrative services provided to the fund will benefit the fund's shareholders, particularly in light of the Board's view that the fund's shareholders benefit from investing in a fund that is part of a large family of funds offering a variety of investment disciplines and services.
Competitiveness of Management Fee and Total Fund Expenses. The Board considered the fund's management fee and total expenses compared to "mapped groups" of competitive funds and classes. Fidelity creates "mapped groups" by combining similar Lipper investment objective categories that have comparable management fee characteristics. Combining Lipper investment objective categories aids the Board's management fee and total expense comparisons by broadening the competitive group used for comparison and by reducing the number of universes to which various Fidelity funds are compared.
Management Fee. The Board considered two proprietary management fee comparisons for the 12-month (or shorter) periods shown in the chart below. The group of Lipper funds used by the Board for management fee comparisons is referred to below as the "Total Mapped Group." The Total Mapped Group comparison focuses on a fund's standing relative to the total universe of comparable funds available to investors, in terms of gross management fees before expense reimbursements or caps. "TMG %" represents the percentage of funds in the Total Mapped Group that had management fees that were lower than the fund's. For example, a TMG % of 3% means that 97% of the funds in the Total Mapped Group had higher management fees than the fund. The "Asset-Size Peer Group" (ASPG) comparison focuses on a fund's standing relative to non-Fidelity funds similar in size to the fund within the Total Mapped Group. The ASPG represents at least 15% of the funds in the Total Mapped Group with comparable asset size and management fee characteristics, subject to a minimum of 50 funds (or all funds in the Total Mapped Group if fewer than 50). Additional information, such as the ASPG quartile in which the fund's management fee ranked, is also included in the chart and considered by the Board.
Annual Report
VIP Consumer Staples Portfolio

The Board noted that the fund's management fee ranked below the median of its Total Mapped Group and below the median of its ASPG for 2009.
Based on its review, the Board concluded that the fund's management fee is fair and reasonable in light of the services that the fund receives and the other factors considered.
Total Expenses. In its review of each class's total expenses, the Board considered the fund's management fee as well as other fund or class expenses, as applicable, such as transfer agent fees, pricing and bookkeeping fees, and custodial, legal, and audit fees. The Board also noted the effects of any waivers and reimbursements on fees and expenses. As part of its review, the Board also considered current and historical total expenses of each class of the fund compared to competitive fund median expenses. Each class of the fund is compared to those funds and classes in the Total Mapped Group (used by the Board for management fee comparisons) that have a similar sales load structure.
The Board noted that the total expenses of Initial Class ranked below its competitive median for 2009 and the total expenses of Investor Class ranked above its competitive median for 2009. The Board considered that the total expenses of Investor Class were above the median primarily due to its higher transfer agent fee. The Board noted that the fund offers multiple classes and that the multiple structures are intended to offer pricing options for the intermediary market. The Board also noted that the total expenses of the classes vary primarily due to differences in transfer agent fees.
Fees Charged to Other Fidelity Clients. The Board also considered Fidelity fee structures and other information with respect to clients of FMR and its affiliates, such as other mutual funds advised or subadvised by FMR or its affiliates, pension plan clients, and other institutional clients. In March 2010, the Board created an ad hoc joint committee with the board of other Fidelity funds (the Committee) to review and compare Fidelity's institutional investment advisory business with its business of providing services to the Fidelity funds, including the differences in services provided, fees charged, and costs incurred, as well as competition in their respective marketplaces.
Based on its review of total expenses and fees charged to other Fidelity clients, the Board concluded that the total expenses of each class of the fund were reasonable, although in one case above the median of the universe presented for comparison, in light of the services that the fund and its shareholders receive and the other factors considered, including the findings of the Committee.
Costs of the Services and Profitability. The Board considered the revenues earned and the expenses incurred by Fidelity in conducting the business of developing, marketing, distributing, managing, administering and servicing the fund and its shareholders. The Board also considered the level of Fidelity's profits in respect of all the Fidelity funds.
Annual Report
Board Approval of Investment Advisory Contracts and Management Fees - continued
On an annual basis, FMR presents to the Board Fidelity's profitability for the fund. Fidelity calculates the profitability for each fund, as well as aggregate profitability for groups of Fidelity funds and all Fidelity funds, using a series of detailed revenue and cost allocation methodologies which originate with the audited books and records of Fidelity. The Audit Committee of the Board reviews any significant changes from the prior year's methodologies.
PricewaterhouseCoopers LLP (PwC), independent registered public accounting firm and auditor to Fidelity and certain Fidelity funds, has been engaged annually by the Board as part of the Board's assessment of Fidelity's profitability analysis. PwC's engagement includes the review and assessment of Fidelity's methodologies used in determining the revenues and expenses attributable to Fidelity's mutual fund business, and completion of agreed-upon procedures surrounding the mathematical accuracy of fund profitability and its conformity to allocation methodologies. After considering PwC's reports issued under the engagement and information provided by Fidelity, the Board believes that while other allocation methods may also be reasonable, Fidelity's profitability methodologies are reasonable in all material respects.
The Board has also reviewed Fidelity's non-fund businesses and fall-out benefits related to the mutual fund business as well as cases where Fidelity's affiliates may benefit from or be related to the fund's business.
The Board considered the costs of the services provided by and the profits realized by Fidelity in connection with the operation of the fund and were satisfied that the profitability was not excessive in the circumstances.
Economies of Scale. The Board considered whether there have been economies of scale in respect of the management of the Fidelity funds, whether the Fidelity funds (including the fund) have appropriately benefited from any such economies of scale, and whether there is potential for realization of any further economies of scale. The Board considered the extent to which the fund will benefit from economies of scale through increased services to the fund, through waivers or reimbursements, or through fee or expense reductions.
In February 2009, the Board and the board of other Fidelity funds created an ad hoc committee (the Economies of Scale Committee) to analyze whether FMR attains economies of scale in respect of the management and servicing of the Fidelity funds, whether the Fidelity funds have appropriately benefited from such economies of scale, and whether there is potential for realization of any further economies of scale.
The Board recognized that the fund's management contract incorporates a "group fee" structure, which provides for lower group fee rates as total fund assets under FMR's management increase, and for higher group fee rates as total fund assets under FMR's management decrease. FMR calculates the group fee rates based on a tiered asset "breakpoint" schedule that varies based on asset class. The Board considered that the group fee is designed to deliver the benefits of economies of scale to fund shareholders when total Fidelity fund assets increase, even if assets of any particular fund are unchanged or have declined, because some portion of Fidelity's costs are attributable to services provided to all Fidelity funds, and all funds benefit if those costs can be allocated among more assets. The Board concluded that, given the group fee structure, fund shareholders will benefit from lower management fees as assets under FMR's management increase at the fund complex level, regardless of whether Fidelity achieves any such economies of scale.
The Board concluded, considering the findings of the Economies of Scale Committee, that any potential economies of scale are being appropriately shared between fund shareholders and Fidelity.
Additional Information Requested by the Board. In order to develop fully the factual basis for consideration of the Fidelity funds' Advisory Contracts, the Board requested and received additional information on certain topics, including (i) fund performance trends, actions to be taken by FMR to improve certain funds' overall performance, and Fidelity's long-term strategies for certain funds; (ii) portfolio manager changes that have occurred during the past year and length of portfolio manager tenure for different categories of funds over time; (iii) Fidelity's compensation structure for portfolio managers, research analysts, and other key personnel, the rationale for the compensation structure, and how the compensation structure provides appropriate performance incentives; (iv) the amount of the investment that each portfolio manager has made in the Fidelity fund(s) that he or she manages; (v) management and other fees paid by FMR to affiliated sub-advisers on behalf of the Fidelity funds; (vi) Fidelity's fee structures and rationale for recommending different fees among different categories of funds; (vii) Fidelity's rationale for recommending which funds should have a performance adjustment component as part of their management fees; (viii) the rationale for any differences between fund fee structures and fee structures in place for other Fidelity clients; and (ix) explanations regarding the relative total expenses borne by certain funds and classes, total expense competitive trends, and actions that might be taken by FMR to reduce total expenses for certain funds and classes.
Based on its evaluation of all of the conclusions noted above, and after considering all factors it believed relevant, the Board ultimately concluded that the advisory fee structures are fair and reasonable, and that the fund's Advisory Contracts should be renewed.
Annual Report
Investment Adviser
Fidelity Management & Research Company
Boston, MA
Investment Sub-Advisers
FMR Co., Inc.
Fidelity Management & Research (U.K.) Inc.
Fidelity Management & Research (Hong Kong) Limited
Fidelity Management & Research (Japan) Inc.
General Distributor
Fidelity Distributors Corporation
Boston, MA
Transfer and Service Agents
Fidelity Investments Institutional Operations Company, Inc.
Boston, MA
Fidelity Service Company, Inc.
Boston, MA
Custodian
State Street Bank and Trust Company
Quincy, MA
VCSP-ANN-0211
1.850994.103
Fidelity® Variable Insurance Products:
Emerging Markets Portfolio
Annual Report
December 31, 2010
(2_fidelity_logos) (Registered_Trademark)
Contents
Performance | <Click Here> | How the fund has done over time. |
Management's Discussion of Fund Performance | <Click Here> | The Portfolio Manager's review of fund performance and strategy. |
Shareholder Expense Example | <Click Here> | An example of shareholder expenses. |
Investment Changes | <Click Here> | A summary of major shifts in the fund's investments over the past six months. |
Investments | <Click Here> | A complete list of the fund's investments with their market values. |
Financial Statements | <Click Here> | Statements of assets and liabilities, operations, and changes in net assets, as well as financial highlights. |
Notes | <Click Here> | Notes to the financial statements. |
Report of Independent Registered Public Accounting Firm | <Click Here> | |
Trustees and Officers | <Click Here> | |
Distributions | <Click Here> | |
Board Approval of Investment Advisory Contracts and Management Fees | <Click Here> | |
To view a fund's proxy voting guidelines and proxy voting record for the 12-month period ended June 30, visit http://www.fidelity.com/proxyvotingresults or visit the Securities and Exchange Commission's (SEC) web site at http://www.sec.gov. You may also call 1-877-208-0098 to request a free copy of the proxy voting guidelines.
Fidelity Variable Insurance Products are separate account options which are purchased through a variable insurance contract.
Standard & Poor's, S&P and S&P 500 are registered service marks of The McGraw-Hill Companies, Inc. and have been licensed for use by Fidelity Distributors Corporation.
Other third party marks appearing herein are the property of their respective owners.
All other marks appearing herein are registered or unregistered trademarks or service marks of FMR LLC or an affiliated company.
The general research services agreement with Fidelity Research & Analysis Company has been terminated and is no longer in effect for the fund.
This report and the financial statements contained herein are submitted for the general information of the shareholders of the fund. This report is not authorized for distribution to prospective investors in the fund unless preceded or accompanied by an effective prospectus.
A fund files its complete schedule of portfolio holdings with the SEC for the first and third quarters of each fiscal year on Form N-Q. Forms N-Q are available on the SEC's web site at http://www.sec.gov. A fund's Forms N-Q may be reviewed and copied at the SEC's Public Reference Room in Washington, DC. Information regarding the operation of the SEC's Public Reference Room may be obtained by calling 1-800-SEC-0330. For a complete list of a fund's portfolio holdings, view the most recent holdings listing, semiannual report, or annual report on Fidelity's web site at http://www.fidelity.com, http://www.advisor.fidelity.com, or http://www.401k.com, as applicable.
NOT FDIC INSURED • MAY LOSE VALUE • NO BANK GUARANTEE
Neither the fund nor Fidelity Distributors Corporation is a bank.
Annual Report
Average annual total return reflects the change in the value of an investment, assuming reinvestment of the class' distributions from dividend income and capital gains (the profits earned upon the sale of securities that have grown in value, if any) and assuming a constant rate of performance each year. During periods of reimbursement by Fidelity, a fund's total return will be greater than it would be had the reimbursement not occurred. Performance numbers are net of all underlying fund operating expenses, but do not include any insurance charges imposed by your insurance company's separate account. If performance information included the effect of these additional charges, the total returns would have been lower. How a fund did yesterday is no guarantee of how it will do tomorrow.
Average Annual Total Returns
Periods ended December 31, 2010 | Past 1
year | Life of
fund A |
VIP Emerging Markets Portfolio - Initial Class | 17.89% | 0.83% |
VIP Emerging Markets Portfolio - Service Class | 17.70% | 0.74% |
VIP Emerging Markets Portfolio - Service Class 2 | 17.57% | 0.60% |
A From January 23, 2008.
$10,000 Over Life of Fund
Let's say hypothetically that $10,000 was invested in VIP Emerging Markets Portfolio - Initial Class on January 23, 2008, when the fund started. The chart shows how the value of your investment would have changed, and also shows how the MSCI® Emerging Markets Index performed over the same period.
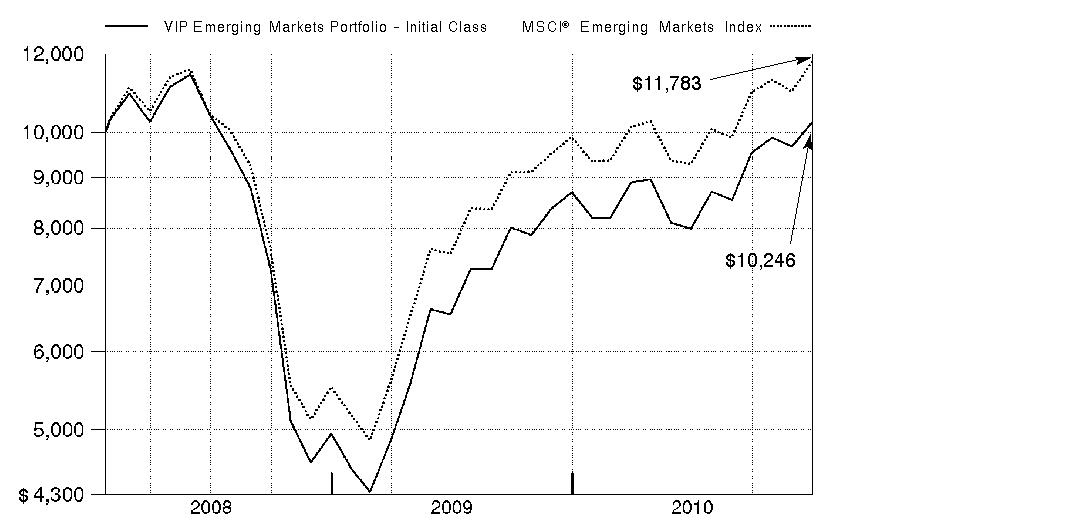
Annual Report
Market Recap: While market improvements around the world hit a speed bump in the first half of the 12-month period ending December 31, 2010, world economies re-accelerated in August, supported by a broadening recovery and low inflation in the U.S. Domestic stock markets recorded solid gains for the year, lifted by a strong second-half rally fueled by economic optimism, encouraging earnings reports and a wave of corporate mergers. The large-cap S&P 500® Index rose 15.06%, the blue-chip-laden Dow Jones Industrial AverageSM added 14.06% and the technology-heavy Nasdaq Composite® Index climbed 18.02%. Meanwhile, international stocks, as represented by the MSCI® ACWI® (All Country World Index) ex USA Index, gained 11.29%, boosted in part by a depreciating U.S. dollar. In the fixed-income arena, U.S. taxable investment-grade bonds generated positive results during 2010, as the Barclays Capital® U.S. Aggregate Bond Index gained 6.54%. With ultra-low interest rates bolstering nearly all fixed-income securities for most of the year, sectors in the index with higher yields and more credit risk generally fared best, while most high-quality bonds generated more-moderate returns. Meanwhile, high-yield bonds, as represented by The BofA Merrill LynchSM US High Yield Constrained Index, returned 15.07%, a result of improved economic data and strengthening investor demand. Overseas, foreign bond markets showed mixed results, with a sizable disparity between the 3.97% return of the Citigroup® Non-U.S. Group of 7 Index - which measures the performance of sovereign debt of the major global economies outside the U.S. - and the 12.04% advance of the JPMorgan Emerging Markets Bond Index Global (EMBI Global), which benefited from the rising overall credit quality of emerging-markets debt issuers.
Comments from Robert von Rekowsky, Portfolio Manager of VIP Emerging Markets Portfolio: During the past year, the fund's share classes trailed the 19.20% return of the MSCI® Emerging Markets Index. (For specific portfolio results, please refer to the performance section of this report.) Weak stock selection in telecommunication services and the banking segment of financials weighed on relative performance. In industrials, unrewarding security selection and an underweighting in capital goods, a group I added to during the period, also detracted. A modest cash position in a rising market had a negative impact as well. Geographically, security selection in Brazil worked against the fund's results. At the stock level, Russian oil exploration and production stock Rosneft was our largest relative detractor, as a drop in crude oil prices in the first half of the period weighed on the position. An out-of-index stake in Australia-based Aquarius Platinum, with operations in South Africa, also hampered performance. Other detractors included untimely ownership of China Construction Bank and China's Geely Auto Holdings, as well as underweighting index component Taiwan Semiconductor Manufacturing. Conversely, stock picking in information technology bolstered fund performance, as did a combination of favorable picks and an overweighting in consumer discretionary. From a country standpoint, security selection in Russia and positioning in China aided performance. Taiwan-based wireless handset maker HTC benefited from robust global demand for handsets running Google's AndroidTM operating system. Not owning index component China Life Insurance also was a good call, as the stock finished the period with a double-digit loss. Likewise, not owning South Korean steel maker POSCO - another index component - was beneficial, given China's slackening demand for imported steel. Meanwhile, overweighted exposure to Russian natural gas producer NOVATEK, which saw its share price rise by more than 82%, bolstered fund performance. The company acquired new acreage for exploration and gained share in a market with relatively flat demand.
The views expressed above reflect those of the portfolio manager(s) only through the end of the period as stated on the cover of this report and do not necessarily represent the views of Fidelity or any other person in the Fidelity organization. Any such views are subject to change at any time based upon market or other conditions and Fidelity disclaims any responsibility to update such views. These views may not be relied on as investment advice and, because investment decisions for a Fidelity fund are based on numerous factors, may not be relied on as an indication of trading intent on behalf of any Fidelity fund.
Annual Report
As a shareholder of the Fund, you incur two types of costs: (1) transaction costs, including redemption fees, and (2) ongoing costs, including management fees, distribution and/or service (12b-1) fees and other Fund expenses. This Example is intended to help you understand your ongoing costs (in dollars) of investing in the Fund and to compare these costs with the ongoing costs of investing in other mutual funds.
The Example is based on an investment of $1,000 invested at the beginning of the period and held for the entire period (July 1, 2010 to December 31, 2010).
Actual Expenses
The first line of the accompanying table for each class of the Fund provides information about actual account values and actual expenses. You may use the information in this line, together with the amount you invested, to estimate the expenses that you paid over the period. Simply divide your account value by $1,000.00 (for example, an $8,600 account value divided by $1,000.00 = 8.6), then multiply the result by the number in the first line for a class of the Fund under the heading entitled "Expenses Paid During Period" to estimate the expenses you paid on your account during this period. The estimate of expenses does not include any fees or other expenses of any variable annuity or variable life insurance product. If they were, the estimate of expenses you paid during the period would be higher, and your ending account value would be lower. In addition, the Fund, as a shareholder in the underlying Fidelity Central Funds, will indirectly bear its pro-rata share of the fees and expenses incurred by the underlying Fidelity Central Funds. These fees and expenses are not included in the Fund's annualized expense ratio used to calculate the expense estimate in the table below.
Hypothetical Example for Comparison Purposes
The second line of the accompanying table for each class of the Fund provides information about hypothetical account values and hypothetical expenses based on a Class' actual expense ratio and an assumed rate of return of 5% per year before expenses, which is not the Class' actual return. The hypothetical account values and expenses may not be used to estimate the actual ending account balance or expenses you paid for the period. You may use this information to compare the ongoing costs of investing in the Fund and other funds. To do so, compare this 5% hypothetical example with the 5% hypothetical examples that appear in the shareholder reports of the other funds. The estimate of expenses does not include any fees or other expenses of any variable annuity or variable life insurance product. If they were, the estimate of expenses you paid during the period would be higher, and your ending account value would be lower. In addition, the Fund, as a shareholder in the underlying Fidelity Central Funds, will indirectly bear its pro-rata share of the fees and expenses incurred by the underlying Fidelity Central Funds. These fees and expenses are not included in the Fund's annualized expense ratio used to calculate the expense estimate in the table below.
Please note that the expenses shown in the table are meant to highlight your ongoing costs only and do not reflect any transaction costs. Therefore, the second line of the table is useful in comparing ongoing costs only, and will not help you determine the relative total costs of owning different funds. In addition, if these transactional costs were included, your costs would have been higher.
| Annualized
Expense Ratio | Beginning
Account Value
July 1, 2010 | Ending
Account Value
December 31, 2010 | Expenses Paid
During Period*
July 1, 2010 to December 31, 2010 |
Initial Class | 1.10% | | | |
Actual | | $ 1,000.00 | $ 1,282.40 | $ 6.33 |
HypotheticalA | | $ 1,000.00 | $ 1,019.66 | $ 5.60 |
Service Class | 1.20% | | | |
Actual | | $ 1,000.00 | $ 1,281.60 | $ 6.90 |
HypotheticalA | | $ 1,000.00 | $ 1,019.16 | $ 6.11 |
Service Class 2 | 1.35% | | | |
Actual | | $ 1,000.00 | $ 1,281.60 | $ 7.76 |
HypotheticalA | | $ 1,000.00 | $ 1,018.40 | $ 6.87 |
Initial Class R | 1.10% | | | |
Actual | | $ 1,000.00 | $ 1,283.70 | $ 6.33 |
HypotheticalA | | $ 1,000.00 | $ 1,019.66 | $ 5.60 |
Service Class 2R | 1.35% | | | |
Actual | | $ 1,000.00 | $ 1,281.90 | $ 7.76 |
HypotheticalA | | $ 1,000.00 | $ 1,018.40 | $ 6.87 |
Investor Class R | 1.18% | | | |
Actual | | $ 1,000.00 | $ 1,281.50 | $ 6.79 |
HypotheticalA | | $ 1,000.00 | $ 1,019.26 | $ 6.01 |
A 5% return per year before expenses
* Expenses are equal to each Class' annualized expense ratio, multiplied by the average account value over the period, multiplied by 184/365 (to reflect the one-half year period).
Annual Report
Investment Changes (Unaudited)
Geographic Diversification (% of fund's net assets) |
As of December 31, 2010 |
| Brazil | 13.4% | |
 | Korea (South) | 12.9% | |
| Russia | 8.7% | |
 | Taiwan | 8.4% | |
| China | 8.2% | |
 | India | 6.6% | |
| South Africa | 6.4% | |
 | Indonesia | 5.5% | |
| Hong Kong | 3.7% | |
| Other* | 26.2% | |

* Includes short term investments and other assets. |
Percentages are adjusted for the effect of futures contracts, if applicable. |
As of June 30, 2010 |
| Brazil | 13.6% | |
| Korea (South) | 12.6% | |
| Russia | 8.7% | |
| South Africa | 8.1% | |
| India | 7.0% | |
| China | 6.8% | |
| Indonesia | 5.7% | |
| Taiwan | 5.7% | |
| Hong Kong | 5.3% | |
| Other* | 26.5% | |

* Includes short term investments and other assets. |
Percentages are adjusted for the effect of futures contracts, if applicable. |
Asset Allocation |
| % of fund's
net assets | % of fund's net assets
6 months ago |
Stocks | 99.0 | 96.4 |
Short-Term Investments and Net Other Assets | 1.0 | 3.6 |
Top Ten Stocks as of December 31, 2010 |
| % of fund's
net assets | % of fund's net assets
6 months ago |
Samsung Electronics Co. Ltd. (Korea (South), Semiconductors & Semiconductor Equipment) | 2.4 | 2.3 |
America Movil SAB de CV Series L sponsored ADR (Mexico, Wireless Telecommunication Services) | 2.1 | 1.8 |
Vale SA (PN-A) sponsored ADR (Brazil, Metals & Mining) | 2.0 | 2.9 |
CNOOC Ltd. (Hong Kong, Oil, Gas & Consumable Fuels) | 2.0 | 1.9 |
Banco Bradesco SA (PN) sponsored ADR (Brazil, Commercial Banks) | 1.7 | 1.3 |
Industrial & Commercial Bank of China Ltd. (H Shares) (China, Commercial Banks) | 1.7 | 1.7 |
Sberbank (Russia, Savings Bank of the Russian Federation) (Russia, Commercial Banks) | 1.4 | 1.5 |
China Construction Bank Corp. (H Shares) (China, Commercial Banks) | 1.4 | 0.0 |
HTC Corp. (Taiwan, Communications Equipment) | 1.3 | 0.7 |
Petroleo Brasileiro SA - Petrobras (PN) (non-vtg.) (Brazil, Oil, Gas & Consumable Fuels) | 1.2 | 1.8 |
| 17.2 | |
Market Sectors as of December 31, 2010 |
| % of fund's
net assets | % of fund's net assets
6 months ago |
Financials | 24.3 | 22.7 |
Materials | 17.0 | 15.0 |
Energy | 13.8 | 13.2 |
Information Technology | 10.9 | 12.3 |
Consumer Discretionary | 10.6 | 8.6 |
Industrials | 7.1 | 5.2 |
Telecommunication Services | 6.6 | 9.4 |
Consumer Staples | 5.5 | 4.7 |
Utilities | 1.8 | 3.0 |
Health Care | 1.4 | 2.3 |
Annual Report
Investments December 31, 2010
Showing Percentage of Net Assets
Common Stocks - 99.0% |
| Shares | | Value |
Argentina - 0.4% |
Banco Macro SA sponsored ADR | 7,500 | | $ 376,500 |
Austria - 0.3% |
Erste Bank AG | 6,700 | | 314,781 |
Bahamas (Nassau) - 0.3% |
Petrominerales Ltd. | 11,000 | | 365,748 |
Bailiwick of Jersey - 0.7% |
Heritage Oil PLC | 43,239 | | 302,690 |
Randgold Resources Ltd. sponsored ADR | 4,200 | | 345,786 |
West China Cement Ltd. (a) | 266,000 | | 97,536 |
TOTAL BAILIWICK OF JERSEY | | 746,012 |
Bermuda - 2.4% |
Aquarius Platinum Ltd. (Australia) | 82,011 | | 448,280 |
Cheung Kong Infrastructure Holdings Ltd. | 33,000 | | 151,148 |
China Yurun Food Group Ltd. | 142,000 | | 466,787 |
Credicorp Ltd. (NY Shares) | 3,500 | | 416,185 |
Orient Overseas International Ltd. | 59,000 | | 572,351 |
Shenzhen International Holdings Ltd. | 2,580,000 | | 219,080 |
Sparkle Roll Group Ltd. | 272,000 | | 50,393 |
Texwinca Holdings Ltd. | 128,000 | | 162,213 |
TOTAL BERMUDA | | 2,486,437 |
Brazil - 13.4% |
AES Tiete SA (PN) (non-vtg.) | 12,300 | | 177,880 |
Anhanguera Educacional Participacoes SA | 3,100 | | 74,719 |
Banco Bradesco SA (PN) sponsored ADR | 86,840 | | 1,761,984 |
Banco do Brasil SA | 36,700 | | 694,835 |
Banco do Estado do Rio Grande do Sul SA | 23,200 | | 246,742 |
Brasil Insurance Participacoes e Administracao SA | 100 | | 119,309 |
Cia Hering SA | 8,500 | | 138,291 |
Companhia Brasileira de Distribuicao Grupo Pao de Acucar sponsored ADR (d) | 8,800 | | 369,424 |
Companhia de Bebidas das Americas (AmBev) (PN) sponsored ADR | 31,000 | | 961,930 |
Companhia Energetica de Minas Gerais (CEMIG) (PN) sponsored ADR (non-vtg.) | 82 | | 1,360 |
Companhia Siderurgica Nacional SA (CSN) sponsored ADR (d) | 45,300 | | 755,151 |
Confab Industrial SA (PN) (non-vtg.) | 14,800 | | 54,400 |
Drogasil SA | 17,100 | | 139,104 |
Eletropaulo Metropolitana SA (PN-B) | 11,200 | | 216,705 |
Estacio Participacoes SA | 9,700 | | 157,814 |
Even Construtora e Incorporadora SA | 11,300 | | 58,558 |
Fleury SA | 6,700 | | 107,592 |
Gafisa SA sponsored ADR (d) | 15,041 | | 218,546 |
Light SA | 12,000 | | 183,881 |
Lojas Renner SA | 11,700 | | 397,626 |
Natura Cosmeticos SA | 18,100 | | 520,134 |
|
| Shares | | Value |
OGX Petroleo e Gas Participacoes SA (a) | 79,100 | | $ 953,270 |
PDG Realty SA Empreendimentos e Participacoes | 82,200 | | 503,240 |
Petroleo Brasileiro SA - Petrobras: | | | |
(ON) sponsored ADR | 8,700 | | 329,208 |
(PN) (non-vtg.) | 40,000 | | 657,769 |
(PN) sponsored ADR (non-vtg.) | 37,948 | | 1,296,683 |
SLC Agricola SA | 11,900 | | 157,754 |
Tegma Gestao Logistica | 8,400 | | 128,818 |
TIM Participacoes SA sponsored ADR (non-vtg.) | 14,400 | | 491,616 |
Vale SA (PN-A) sponsored ADR | 67,974 | | 2,054,174 |
TOTAL BRAZIL | | 13,928,517 |
British Virgin Islands - 0.3% |
Camelot Information Systems, Inc. ADR | 4,935 | | 118,045 |
Mail.ru Group Ltd. GDR unit (a)(e) | 5,800 | | 208,800 |
TOTAL BRITISH VIRGIN ISLANDS | | 326,845 |
Canada - 1.6% |
China Gold International Resources Corp. Ltd. (a) | 4,000 | | 21,615 |
Eldorado Gold Corp. | 25,094 | | 465,496 |
First Quantum Minerals Ltd. | 4,100 | | 443,999 |
First Uranium Corp. (a)(d) | 133,000 | | 178,703 |
Niko Resources Ltd. | 2,000 | | 206,919 |
Pacific Rubiales Energy Corp. | 3,100 | | 104,908 |
Uranium One, Inc. | 47,800 | | 228,144 |
TOTAL CANADA | | 1,649,784 |
Cayman Islands - 3.3% |
3SBio, Inc. sponsored ADR (a) | 8,811 | | 133,751 |
Alibaba.com Ltd. | 59,500 | | 106,713 |
Bitauto Holdings Ltd. ADR | 8,500 | | 75,140 |
China Shanshui Cement Group Ltd. | 476,000 | | 339,891 |
China ZhengTong Auto Services Holdings Ltd. | 106,500 | | 100,437 |
Country Garden Holdings Co. Ltd. | 278,000 | | 106,586 |
Daphne International Holdings Ltd. | 54,000 | | 50,578 |
E-Commerce China Dangdang, Inc. ADR | 4,400 | | 119,108 |
Eurasia Drilling Co. Ltd. GDR (Reg. S) | 16,185 | | 526,013 |
EVA Precision Industrial Holdings Ltd. | 308,000 | | 297,202 |
Geely Automobile Holdings Ltd. | 95,000 | | 41,557 |
Hidili Industry International Development Ltd. | 277,000 | | 234,145 |
hiSoft Technology International Ltd. ADR (a) | 1,700 | | 51,340 |
International Mining Machinery Holdings Ltd. | 195,000 | | 157,806 |
Kingboard Chemical Holdings Ltd. | 85,500 | | 512,065 |
Kingboard Chemical Holdings Ltd. warrants 10/31/12 (a) | 5,000 | | 5,307 |
Microport Scientific Corp. | 3,000 | | 2,872 |
Sany Heavy Equipment International Holdings Co. Ltd. | 99,000 | | 145,968 |
Common Stocks - continued |
| Shares | | Value |
Cayman Islands - continued |
Shenguan Holdings Group Ltd. | 194,000 | | $ 254,091 |
Trina Solar Ltd. ADR (a) | 6,100 | | 142,862 |
TOTAL CAYMAN ISLANDS | | 3,403,432 |
Chile - 0.2% |
Empresas La Polar SA | 28,137 | | 203,813 |
China - 8.2% |
Anhui Expressway Co. Ltd. (H Shares) | 174,000 | | 152,677 |
Baidu.com, Inc. sponsored ADR (a) | 3,850 | | 371,641 |
Changsha Zoomlion Heavy Industry Science & Technology Development Co. Ltd. (H Shares) | 52,000 | | 117,481 |
China Communications Services Corp. Ltd. (H Shares) | 264,000 | | 157,262 |
China Construction Bank Corp. (H Shares) | 1,571,000 | | 1,408,796 |
China Merchants Bank Co. Ltd. (H Shares) | 260,356 | | 657,213 |
China Minsheng Banking Corp. Ltd. (H Shares) | 335,500 | | 287,047 |
Chongqing Rural Commercial Bank Co. Ltd. (H Shares) | 157,000 | | 105,643 |
Digital China Holdings Ltd. (H Shares) | 100,000 | | 187,070 |
Dongfeng Motor Group Co. Ltd. (H Shares) | 130,000 | | 224,124 |
Golden Eagle Retail Group Ltd. (H Shares) | 143,000 | | 352,510 |
Harbin Power Equipment Co. Ltd. (H Shares) | 272,000 | | 429,041 |
Industrial & Commercial Bank of China Ltd. (H Shares) | 2,327,070 | | 1,733,514 |
Minth Group Ltd. | 217,000 | | 356,246 |
Ping An Insurance Group Co. China Ltd. (H Shares) | 90,500 | | 1,011,830 |
Weichai Power Co. Ltd. (H Shares) | 40,000 | | 246,253 |
Yantai Changyu Pioneer Wine Co. (B Shares) | 57,199 | | 608,749 |
Zhaojin Mining Industry Co. Ltd. (H Shares) | 15,000 | | 61,370 |
TOTAL CHINA | | 8,468,467 |
Colombia - 0.6% |
BanColombia SA sponsored ADR | 1,600 | | 99,056 |
Ecopetrol SA ADR (d) | 13,400 | | 584,508 |
TOTAL COLOMBIA | | 683,564 |
Czech Republic - 0.6% |
Komercni Banka AS | 2,800 | | 663,426 |
Egypt - 0.6% |
Commercial International Bank Ltd. sponsored GDR | 77,830 | | 649,881 |
Georgia - 0.2% |
Bank of Georgia unit (a) | 9,448 | | 190,850 |
|
| Shares | | Value |
Hong Kong - 3.7% |
China Mobile (Hong Kong) Ltd. | 118,000 | | $ 1,169,999 |
CNOOC Ltd. | 632,000 | | 1,504,425 |
CNOOC Ltd. sponsored ADR | 2,300 | | 548,251 |
I.T Ltd. | 152,000 | | 115,186 |
Shanghai Industrial Holdings Ltd. | 114,000 | | 492,814 |
TOTAL HONG KONG | | 3,830,675 |
India - 6.6% |
Adani Enterprises Ltd. | 21,974 | | 319,394 |
Apollo Tyres Ltd. | 64,943 | | 96,879 |
Bank of Baroda | 28,703 | | 595,780 |
BGR Energy Systems Ltd. | 8,311 | | 135,058 |
Idea Cellular Ltd. (a) | 121,331 | | 188,730 |
Indian Oil Corp. Ltd. | 36,476 | | 279,326 |
Indian Overseas Bank | 78,970 | | 258,921 |
Infosys Technologies Ltd. sponsored ADR | 15,582 | | 1,185,479 |
Infrastructure Development Finance Co. Ltd. | 122,943 | | 502,083 |
Jain Irrigation Systems Ltd. | 80,480 | | 378,348 |
JSW Steel Ltd. | 19,409 | | 510,939 |
LIC Housing Finance Ltd. | 15,590 | | 68,131 |
Radico Khaitan Ltd. | 14,779 | | 52,026 |
Reliance Industries Ltd. | 17,528 | | 415,027 |
Rural Electrification Corp. Ltd. | 44,753 | | 299,371 |
Shree Renuka Sugars Ltd. | 25,927 | | 56,304 |
Shriram Transport Finance Co. Ltd. | 11,314 | | 197,636 |
Tata Consultancy Services Ltd. | 35,482 | | 925,012 |
Tata Steel Ltd. | 14,506 | | 220,741 |
Ultratech Cement Ltd. | 8,226 | | 199,475 |
TOTAL INDIA | | 6,884,660 |
Indonesia - 5.5% |
PT Astra International Tbk | 117,500 | | 711,391 |
PT Bank Mandiri (Persero) Tbk | 234,500 | | 169,173 |
PT Bank Negara Indonesia (Persero) Tbk | 551,500 | | 237,188 |
PT Bank Rakyat Indonesia Tbk | 559,000 | | 651,444 |
PT Bank Tabungan Negara Tbk | 581,000 | | 105,754 |
PT Bumi Serpong Damai Tbk | 1,288,000 | | 128,657 |
PT Ciputra Development Tbk (a) | 1,939,500 | | 75,341 |
PT Delta Dunia Petroindo Tbk (a) | 1,165,000 | | 208,175 |
PT Gudang Garam Tbk | 81,500 | | 361,821 |
PT Indo Tambangraya Megah Tbk | 55,000 | | 309,795 |
PT Indocement Tunggal Prakarsa Tbk | 296,500 | | 524,882 |
PT Indofood Sukses Makmur Tbk | 956,500 | | 517,530 |
PT Kalbe Farma Tbk | 601,000 | | 216,787 |
PT Mitra Adiperkasa Tbk | 169,500 | | 50,323 |
PT Perusahaan Gas Negara Tbk Series B | 1,144,800 | | 562,236 |
PT Tambang Batubbara Bukit Asam Tbk | 84,000 | | 213,963 |
PT Tower Bersama Infrastructure Tbk | 874,500 | | 242,648 |
PT XL Axiata Tbk (a) | 654,000 | | 384,707 |
TOTAL INDONESIA | | 5,671,815 |
Common Stocks - continued |
| Shares | | Value |
Isle of Man - 0.1% |
Bahamas Petroleum Co. PLC (a) | 305,100 | | $ 72,590 |
Kazakhstan - 0.5% |
KazMunaiGas Exploration & Production JSC (Reg. S) GDR | 26,100 | | 517,563 |
Korea (South) - 12.9% |
Busan Bank | 16,500 | | 211,171 |
CJ CGV Co. Ltd. | 1,740 | | 43,452 |
CJ Corp. | 5,887 | | 414,256 |
Daegu Bank Co. Ltd. | 14,810 | | 206,052 |
Daelim Industrial Co. | 2,797 | | 293,108 |
DC Chemical Co. Ltd. | 1,230 | | 362,007 |
Doosan Co. Ltd. | 1,673 | | 229,781 |
GS Holdings Corp. | 8,272 | | 481,012 |
Hanjin Heavy Industries & Consolidated Co. Ltd. | 9,090 | | 306,446 |
Honam Petrochemical Corp. | 2,283 | | 547,717 |
Hynix Semiconductor, Inc. (a) | 4,970 | | 106,381 |
Hyundai Department Store Co. Ltd. | 1,743 | | 216,855 |
Hyundai Heavy Industries Co. Ltd. | 2,306 | | 911,089 |
Hyundai Mobis | 3,474 | | 881,474 |
Hyundai Motor Co. | 8,071 | | 1,248,891 |
Hyundai Steel Co. | 3,961 | | 439,817 |
Industrial Bank of Korea | 45,330 | | 758,027 |
Kia Motors Corp. | 16,500 | | 744,616 |
KT Corp. | 9,950 | | 409,015 |
LG Chemical Ltd. | 2,162 | | 753,928 |
Paradise Co. Ltd. | 14,000 | | 49,882 |
Samsung Electronics Co. Ltd. | 2,905 | | 2,458,719 |
Shinhan Financial Group Co. Ltd. | 22,060 | | 1,040,780 |
Tong Yang Securities, Inc. | 20,960 | | 186,000 |
Young Poong Precision Corp. | 4,384 | | 45,160 |
TOTAL KOREA (SOUTH) | | 13,345,636 |
Lebanon - 0.0% |
BLOM Bank SAL GDR | 4,370 | | 45,448 |
Luxembourg - 0.9% |
Evraz Group SA GDR (a) | 14,784 | | 530,302 |
Millicom International Cellular SA | 3,800 | | 363,280 |
TOTAL LUXEMBOURG | | 893,582 |
Malaysia - 0.8% |
AirAsia Bhd (a) | 149,700 | | 122,828 |
Axiata Group Bhd (a) | 321,000 | | 494,487 |
RHB Capital Bhd | 67,400 | | 190,604 |
TOTAL MALAYSIA | | 807,919 |
Mexico - 3.4% |
America Movil SAB de CV Series L sponsored ADR | 37,844 | | 2,169,975 |
Compartamos SAB de CV | 208,000 | | 452,566 |
|
| Shares | | Value |
Genomma Lab Internacional SA de CV (a) | 73,100 | | $ 175,104 |
Grupo Televisa SA de CV (CPO) sponsored ADR | 27,622 | | 716,238 |
TOTAL MEXICO | | 3,513,883 |
Nigeria - 0.3% |
Guaranty Trust Bank PLC GDR (Reg. S) | 50,375 | | 297,213 |
Norway - 0.1% |
Det Norske Oljeselskap ASA (DNO) (A Shares) (a) | 54,600 | | 85,004 |
Peru - 0.6% |
Compania de Minas Buenaventura SA sponsored ADR | 12,390 | | 606,614 |
Grana y Montero SA | 22,533 | | 53,397 |
TOTAL PERU | | 660,011 |
Qatar - 0.2% |
Commercial Bank of Qatar GDR (Reg. S) | 52,974 | | 267,707 |
Russia - 8.7% |
Cherkizovo Group OJSC GDR (a) | 9,400 | | 178,637 |
LSR Group OJSC GDR (Reg. S) (a) | 12,700 | | 116,967 |
Magnit OJSC GDR (Reg. S) | 19,400 | | 568,420 |
Mechel Steel Group OAO sponsored ADR | 19,700 | | 575,831 |
Novolipetsk Steel Ojsc (a) | 26,800 | | 126,800 |
OAO Gazprom sponsored ADR | 26,000 | | 661,440 |
OAO NOVATEK GDR | 9,922 | | 1,185,679 |
OAO Raspadskaya (a) | 25,500 | | 179,035 |
OAO Tatneft sponsored ADR | 19,476 | | 644,656 |
OJSC Oil Co. Rosneft GDR (Reg. S) | 137,500 | | 984,500 |
Polymetal JSC GDR (Reg. S) (a) | 30,888 | | 565,559 |
RusHydro JSC: | | | |
rights 6/30/10 (a) | 15,118 | | 807 |
rights 1/13/11 (a) | 454 | | 79 |
rights 6/30/11 (a) | 97 | | 0 |
sponsored ADR (a) | 85,944 | | 468,395 |
Sberbank (Savings Bank of the Russian Federation) (a) | 319,300 | | 1,089,778 |
Sberbank (Savings Bank of the Russian Federation) GDR | 950 | | 407,083 |
Severstal JSC (a) | 14,200 | | 240,648 |
Sistema JSFC sponsored GDR | 20,175 | | 502,963 |
TGK-1 OAO (a) | 121,003,300 | | 85,077 |
Uralkali JSC GDR (Reg. S) | 13,000 | | 477,360 |
TOTAL RUSSIA | | 9,059,714 |
Singapore - 0.9% |
Keppel Corp. Ltd. | 48,000 | | 423,425 |
Straits Asia Resources Ltd. | 198,000 | | 384,196 |
Yanlord Land Group Ltd. | 70,000 | | 91,642 |
TOTAL SINGAPORE | | 899,263 |
Common Stocks - continued |
| Shares | | Value |
South Africa - 6.4% |
African Bank Investments Ltd. | 120,600 | | $ 705,396 |
African Rainbow Minerals Ltd. | 19,859 | | 629,793 |
AngloGold Ashanti Ltd. | 12,100 | | 596,868 |
AngloGold Ashanti Ltd. sponsored ADR | 7,600 | | 374,148 |
Aspen Pharmacare Holdings Ltd. | 28,699 | | 398,580 |
Clicks Group Ltd. | 49,186 | | 321,769 |
Foschini Ltd. | 39,740 | | 539,864 |
Imperial Holdings Ltd. | 13,340 | | 256,692 |
Mr Price Group Ltd. | 48,717 | | 489,008 |
Mvelaphanda Resources Ltd. (a) | 61,987 | | 467,639 |
Shoprite Holdings Ltd. | 28,188 | | 423,990 |
Standard Bank Group Ltd. | 53,747 | | 872,527 |
Wilson Bayly Holmes-Ovcon Ltd. | 7,535 | | 158,093 |
Woolworths Holdings Ltd. | 110,850 | | 450,762 |
TOTAL SOUTH AFRICA | | 6,685,129 |
Taiwan - 8.4% |
Advanced Semiconductor Engineering, Inc. | 102,291 | | 117,911 |
Advanced Semiconductor Engineering, Inc. sponsored ADR (d) | 108,753 | | 624,242 |
Chroma ATE, Inc. | 85,170 | | 254,313 |
Edison Opto Corp. | 8,776 | | 52,650 |
Farglory Land Development Co. Ltd. | 78,000 | | 209,907 |
Formosa Plastics Corp. | 305,000 | | 1,019,455 |
Fubon Financial Holding Co. Ltd. | 593,329 | | 813,615 |
HTC Corp. | 45,150 | | 1,393,041 |
Huaku Development Co. Ltd. | 53,000 | | 160,617 |
Kinsus Interconnect Technology Corp. | 29,000 | | 98,423 |
Macronix International Co. Ltd. | 827,506 | | 578,715 |
Pegatron Corp. (a) | 261,000 | | 375,797 |
Ruentex Development Co. Ltd. | 211,000 | | 371,076 |
Taishin Financial Holdings Co. Ltd. | 1,435,850 | | 849,106 |
Taiwan Cement Corp. | 413,825 | | 465,323 |
Taiwan Semiconductor Manufacturing Co. Ltd. | 222,609 | | 541,646 |
Unimicron Technology Corp. | 51,000 | | 99,308 |
Wistron Corp. | 342,774 | | 698,004 |
TOTAL TAIWAN | | 8,723,149 |
Thailand - 1.7% |
Advanced Info Service PCL (For. Reg.) | 124,200 | | 350,964 |
Banpu PCL (For. Reg.) | 10,900 | | 286,995 |
BEC World PCL (For. Reg.) | 198,100 | | 209,098 |
PTT PCL (For. Reg.) | 34,500 | | 367,021 |
Siam Commercial Bank PCL (For. Reg.) | 161,300 | | 555,005 |
Total Access Communication PCL (For. Reg.) | 400 | | 559 |
TOTAL THAILAND | | 1,769,642 |
Turkey - 2.0% |
Dogus Otomotiv Servis ve Ticaret AS | 13,000 | | 55,814 |
Sinpas Gayrimenkul Yatirim Ortakligi AS | 81,000 | | 109,268 |
|
| Shares | | Value |
Tofas Turk Otomobil Fabrikasi AS | 38,658 | | $ 199,570 |
Turk Hava Yollari AO | 159,285 | | 557,844 |
Turkiye Garanti Bankasi AS | 186,000 | | 943,330 |
Turkiye Halk Bankasi AS | 20,000 | | 169,920 |
TOTAL TURKEY | | 2,035,746 |
United Kingdom - 1.2% |
Eurasian Natural Resources Corp. PLC | 19,801 | | 323,754 |
Hikma Pharmaceuticals PLC | 28,642 | | 362,625 |
Xstrata PLC | 23,651 | | 555,516 |
TOTAL UNITED KINGDOM | | 1,241,895 |
United States of America - 1.0% |
Central European Distribution Corp. (a) | 6,500 | | 148,850 |
China Agritech, Inc. (a)(d) | 3,700 | | 45,399 |
China Valves Technology, Inc. (a)(d) | 9,378 | | 98,281 |
CTC Media, Inc. | 6,339 | | 148,523 |
Freeport-McMoRan Copper & Gold, Inc. | 4,700 | | 564,423 |
TOTAL UNITED STATES OF AMERICA | | 1,005,476 |
TOTAL COMMON STOCKS (Cost $79,699,600) | 102,771,777 |
Money Market Funds - 2.4% |
| | | |
Fidelity Cash Central Fund, 0.19% (b) | 363,328 | | 363,328 |
Fidelity Securities Lending Cash Central Fund, 0.21% (b)(c) | 2,174,100 | | 2,174,100 |
TOTAL MONEY MARKET FUNDS (Cost $2,537,428) | 2,537,428 |
Cash Equivalents - 0.1% |
| Maturity Amount | | |
Investments in repurchase agreements in a joint trading account at 0.2%, dated 12/31/10 due 1/3/11 (Collateralized by U.S. Treasury Obligations) #
(Cost $49,000) | $ 49,001 | | 49,000 |
TOTAL INVESTMENT PORTFOLIO - 101.5% (Cost $82,286,028) | | 105,358,205 |
NET OTHER ASSETS (LIABILITIES) - (1.5)% | | (1,589,728) |
NET ASSETS - 100% | $ 103,768,477 |
Legend |
(a) Non-income producing |
(b) Affiliated fund that is available only to investment companies and other accounts managed by Fidelity Investments. The rate quoted is the annualized seven-day yield of the fund at period end. A complete unaudited listing of the fund's holdings as of its most recent quarter end is available upon request. In addition, each Fidelity Central Fund's financial statements, which are not covered by the Fund's Report of Independent Registered Public Accounting Firm, are available on the SEC's website or upon request. |
(c) Investment made with cash collateral received from securities on loan. |
(d) Security or a portion of the security is on loan at period end. |
(e) Security exempt from registration under Rule 144A of the Securities Act of 1933. These securities may be resold in transactions exempt from registration, normally to qualified institutional buyers. At the end of the period, the value of these securities amounted to $208,800 or 0.2% of net assets. |
# Additional information on each counterparty to the repurchase agreement is as follows: |
Repurchase Agreement / Counterparty | Value |
$49,000 due 1/03/11 at 0.20% |
BNP Paribas Securities Corp. | $ 5,794 |
Barclays Capital, Inc. | 11,559 |
Citigroup Global Markets, Inc. | 3,729 |
Credit Agricole Securities (USA), Inc. | 7,458 |
Deutsche Bank Securities, Inc. | 1,492 |
HSBC Securities (USA), Inc. | 4,396 |
J.P. Morgan Securities, Inc. | 3,729 |
Merrill Lynch, Pierce, Fenner & Smith, Inc. | 1,119 |
Mizuho Securities USA, Inc. | 6,339 |
RBS Securities, Inc. | 2,080 |
Societe Generale, New York Branch | 932 |
Wells Fargo Securities LLC | 373 |
| $ 49,000 |
Affiliated Central Funds |
Information regarding fiscal year to date income earned by the Fund from investments in Fidelity Central Funds is as follows: |
Fund | Income earned |
Fidelity Cash Central Fund | $ 4,081 |
Fidelity Securities Lending Cash Central Fund | 11,306 |
Total | $ 15,387 |
Other Information |
The following is a summary of the inputs used, as of December 31, 2010, involving the Fund's assets and liabilities carried at fair value. The inputs or methodology used for valuing securities may not be an indication of the risk associated with investing in those securities. For more information on valuation inputs, and their aggregation into the levels used in the table below, please refer to the Security Valuation section in the accompanying Notes to Financial Statements. |
Valuation Inputs at Reporting Date: |
Description | Total | Level 1 | Level 2 | Level 3 |
Investments in Securities: | | | | |
Equities: | | | | |
Brazil | $ 13,928,517 | $ 13,928,517 | $ - | $ - |
Korea (South) | 13,345,636 | 12,936,621 | 409,015 | - |
Russia | 9,059,714 | 9,059,635 | 79 | - |
Taiwan | 8,723,149 | 8,063,592 | 659,557 | - |
China | 8,468,467 | 8,468,467 | - | - |
India | 6,884,660 | 6,192,001 | 692,659 | - |
South Africa | 6,685,129 | 6,088,261 | 596,868 | - |
Indonesia | 5,671,815 | 5,671,815 | - | - |
Hong Kong | 3,830,675 | 1,156,251 | 2,674,424 | - |
Other | 26,174,015 | 26,174,015 | - | - |
Money Market Funds | 2,537,428 | 2,537,428 | - | - |
Cash Equivalents | 49,000 | - | 49,000 | - |
Total Investments in Securities: | $ 105,358,205 | $ 100,276,603 | $ 5,081,602 | $ - |
Income Tax Information |
At December 31, 2010, the Fund had a capital loss carryforward of approximately $3,598,173 of which $773,916 and $2,824,257 will expire in fiscal 2016 and 2017, respectively. Capital loss carryforwards are only available to offset future capital gains of the Fund to the extent provided by regulations and may be limited. |
See accompanying notes which are an integral part of the financial statements.
Annual Report
Statement of Assets and Liabilities
| December 31, 2010 |
| | |
Assets | | |
Investment in securities, at value (including securities loaned of $2,137,709 and repurchase agreements of $49,000) - See accompanying schedule: Unaffiliated issuers (cost $79,748,600) | $ 102,820,777 | |
Fidelity Central Funds (cost $2,537,428) | 2,537,428 | |
Total Investments (cost $82,286,028) | | $ 105,358,205 |
Cash | | 821 |
Foreign currency held at value (cost $299,911) | | 307,247 |
Receivable for investments sold | | 41,604 |
Receivable for fund shares sold | | 192,801 |
Dividends receivable | | 225,400 |
Distributions receivable from Fidelity Central Funds | | 2,995 |
Prepaid expenses | | 232 |
Receivable from investment adviser for expense reductions | | 20,542 |
Other receivables | | 11,964 |
Total assets | | 106,161,811 |
| | |
Liabilities | | |
Payable for investments purchased | $ 23,403 | |
Payable for fund shares redeemed | 16,582 | |
Accrued management fee | 69,290 | |
Distribution and service plan fees payable | 281 | |
Other affiliated payables | 13,770 | |
Other payables and accrued expenses | 95,908 | |
Collateral on securities loaned, at value | 2,174,100 | |
Total liabilities | | 2,393,334 |
| | |
Net Assets | | $ 103,768,477 |
Net Assets consist of: | | |
Paid in capital | | $ 85,005,096 |
Distributions in excess of net investment income | | (126,246) |
Accumulated undistributed net realized gain (loss) on investments and foreign currency transactions | | (4,186,351) |
Net unrealized appreciation (depreciation) on investments and assets and liabilities in foreign currencies | | 23,075,978 |
Net Assets | | $ 103,768,477 |
Statement of Assets and Liabilities - continued
| December 31, 2010 |
| | |
Initial Class:
Net Asset Value, offering price and redemption price per share ($18,478,431 ÷ 1,863,703 shares) | | $ 9.91 |
| | |
Service Class:
Net Asset Value, offering price and redemption price per share ($101,793 ÷ 10,237 shares) | | $ 9.94 |
| | |
Service Class 2:
Net Asset Value, offering price and redemption price per share ($1,348,451 ÷ 135,530 shares) | | $ 9.95 |
| | |
Initial Class R:
Net Asset Value, offering price and redemption price per share ($30,648,857 ÷ 3,090,625 shares) | | $ 9.92 |
| | |
Service Class 2R:
Net Asset Value, offering price and redemption price per share ($101,537 ÷ 10,188 shares) | | $ 9.97 |
| | |
Investor Class R:
Net Asset Value, offering price and redemption price per share ($53,089,408 ÷ 5,366,314 shares) | | $ 9.89 |
See accompanying notes which are an integral part of the financial statements.
Annual Report
Financial Statements - continued
Statement of Operations
| Year ended December 31, 2010 |
| | |
Investment Income | | |
Dividends | | $ 1,908,076 |
Interest | | 2 |
Income from Fidelity Central Funds | | 15,387 |
Income before foreign taxes withheld | | 1,923,465 |
Less foreign taxes withheld | | (222,613) |
Total income | | 1,700,852 |
| | |
Expenses | | |
Management fee | $ 656,958 | |
Transfer agent fees | 103,167 | |
Distribution and service plan fees | 1,420 | |
Accounting and security lending fees | 42,409 | |
Custodian fees and expenses | 243,942 | |
Independent trustees' compensation | 439 | |
Audit | 78,868 | |
Legal | 331 | |
Miscellaneous | 720 | |
Total expenses before reductions | 1,128,254 | |
Expense reductions | (245,235) | 883,019 |
Net investment income (loss) | | 817,833 |
Realized and Unrealized Gain (Loss) Net realized gain (loss) on: | | |
Investment securities: | | |
Unaffiliated issuers | 1,675,448 | |
Foreign currency transactions | (192,845) | |
Total net realized gain (loss) | | 1,482,603 |
Change in net unrealized appreciation (depreciation) on: Investment securities (net of decrease in deferred foreign taxes of $92,230) | 11,339,908 | |
Assets and liabilities in foreign currencies | 8,697 | |
Total change in net unrealized appreciation (depreciation) | | 11,348,605 |
Net gain (loss) | | 12,831,208 |
Net increase (decrease) in net assets resulting from operations | | $ 13,649,041 |
Statement of Changes in Net Assets
| Year ended
December 31, 2010 | Year ended
December 31, 2009 |
Increase (Decrease) in Net Assets | | |
Operations | | |
Net investment income (loss) | $ 817,833 | $ 170,709 |
Net realized gain (loss) | 1,482,603 | (1,776,237) |
Change in net unrealized appreciation (depreciation) | 11,348,605 | 16,723,804 |
Net increase (decrease) in net assets resulting from operations | 13,649,041 | 15,118,276 |
Distributions to shareholders from net investment income | (839,007) | (171,137) |
Distributions to shareholders from net realized gain | (380,090) | (219,436) |
Total distributions | (1,219,097) | (390,573) |
Share transactions - net increase (decrease) | 19,330,340 | 48,999,079 |
Redemption fees | 21,709 | 22,594 |
Total increase (decrease) in net assets | 31,781,993 | 63,749,376 |
| | |
Net Assets | | |
Beginning of period | 71,986,484 | 8,237,108 |
End of period (including distributions in excess of net investment income of $126,246 and undistributed net investment income of $0, respectively) | $ 103,768,477 | $ 71,986,484 |
See accompanying notes which are an integral part of the financial statements.
Annual Report
Financial Highlights - Initial Class
Years ended December 31, | 2010 | 2009 | 2008 H |
Selected Per-Share Data | | | |
Net asset value, beginning of period | $ 8.51 | $ 4.88 | $ 10.00 |
Income from Investment Operations | | | |
Net investment income (loss) E | .09 | .04 | .13 |
Net realized and unrealized gain (loss) | 1.43 | 3.64 | (5.19) |
Total from investment operations | 1.52 | 3.68 | (5.06) |
Distributions from net investment income | (.08) | (.02) | (.08) |
Distributions from net realized gain | (.04) | (.03) | - |
Total distributions | (.12) | (.05) | (.08) |
Redemption fees added to paid in capital E | - J | - J | .02 |
Net asset value, end of period | $ 9.91 | $ 8.51 | $ 4.88 |
Total Return B, C, D | 17.89% | 75.40% | (50.45)% |
Ratios to Average Net Assets F, I | | | |
Expenses before reductions | 1.33% | 2.85% | 3.92% A |
Expenses net of fee waivers, if any | 1.10% | 1.10% | 1.10% A |
Expenses net of all reductions | 1.04% | 1.02% | 1.02% A |
Net investment income (loss) | 1.05% | .60% | 1.54% A |
Supplemental Data | | | |
Net assets, end of period (000 omitted) | $ 18,478 | $ 250 | $ 516 |
Portfolio turnover rate G | 100% | 70% | 79% |
A Annualized
B Total returns for periods of less than one year are not annualized.
C Total returns do not reflect charges attributable to your insurance company's separate account. Inclusion of these charges would reduce the total returns shown.
D Total returns would have been lower had certain expenses not been reduced during the periods shown.
E Calculated based on average shares outstanding during the period.
F Fees and expenses of the underlying Fidelity Central Funds are not included in the Fund's expense ratio. The Fund indirectly bears its proportionate share of the expenses of any underlying Fidelity Central Funds.
G Amount does not include the portfolio activity of any underlying Fidelity Central Funds.
H For the period January 23, 2008 (commencement of operations) to December 31, 2008.
I Expense ratios reflect operating expenses of the class. Expenses before reductions do not reflect amounts reimbursed by the investment adviser or reductions from brokerage service arrangements or reductions from other expense offset arrangements and do not represent the amount paid by the class during periods when reimbursements or reductions occur. Expense ratios before reductions for start-up periods may not be representative of longer-term operating periods. Expenses net of fee waivers reflect expenses after reimbursement by the investment adviser but prior to reductions from brokerage service arrangements or other expense offset arrangements. Expenses net of all reductions represent the net expenses paid by the class.
J Amount represents less than $.01 per share.
Financial Highlights - Service Class
Years ended December 31, | 2010 | 2009 | 2008 H |
Selected Per-Share Data | | | |
Net asset value, beginning of period | $ 8.54 | $ 4.88 | $ 10.00 |
Income from Investment Operations | | | |
Net investment income (loss) E | .08 | .03 | .12 |
Net realized and unrealized gain (loss) | 1.43 | 3.65 | (5.19) |
Total from investment operations | 1.51 | 3.68 | (5.07) |
Distributions from net investment income | (.07) | - J | (.07) |
Distributions from net realized gain | (.04) | (.02) | - |
Total distributions | (.11) | (.02) | (.07) |
Redemption fees added to paid in capital E | - J | - J | .02 |
Net asset value, end of period | $ 9.94 | $ 8.54 | $ 4.88 |
Total Return B, C, D | 17.70% | 75.49% | (50.53)% |
Ratios to Average Net Assets F, I | | | |
Expenses before reductions | 1.48% | 3.02% | 4.02% A |
Expenses net of fee waivers, if any | 1.20% | 1.20% | 1.20% A |
Expenses net of all reductions | 1.14% | 1.12% | 1.12% A |
Net investment income (loss) | .95% | .50% | 1.44% A |
Supplemental Data | | | |
Net assets, end of period (000 omitted) | $ 102 | $ 118 | $ 396 |
Portfolio turnover rate G | 100% | 70% | 79% |
A Annualized
B Total returns for periods of less than one year are not annualized.
C Total returns do not reflect charges attributable to your insurance company's separate account. Inclusion of these charges would reduce the total returns shown.
D Total returns would have been lower had certain expenses not been reduced during the periods shown.
E Calculated based on average shares outstanding during the period.
F Fees and expenses of the underlying Fidelity Central Funds are not included in the Fund's expense ratio. The Fund indirectly bears its proportionate share of the expenses of any underlying Fidelity Central Funds.
G Amount does not include the portfolio activity of any underlying Fidelity Central Funds.
H For the period January 23, 2008 (commencement of operations) to December 31, 2008.
I Expense ratios reflect operating expenses of the class. Expenses before reductions do not reflect amounts reimbursed by the investment adviser or reductions from brokerage service arrangements or reductions from other expense offset arrangements and do not represent the amount paid by the class during periods when reimbursements or reductions occur. Expense ratios before reductions for start-up periods may not be representative of longer-term operating periods. Expenses net of fee waivers reflect expenses after reimbursement by the investment adviser but prior to reductions from brokerage service arrangements or other expense offset arrangements. Expenses net of all reductions represent the net expenses paid by the class.
J Amount represents less than $.01 per share.
See accompanying notes which are an integral part of the financial statements.
Annual Report
Financial Highlights - Service Class 2
Years ended December 31, | 2010 | 2009 | 2008 H |
Selected Per-Share Data | | | |
Net asset value, beginning of period | $ 8.56 | $ 4.88 | $ 10.00 |
Income from Investment Operations | | | |
Net investment income (loss) E | .07 | .02 | .11 |
Net realized and unrealized gain (loss) | 1.43 | 3.66 | (5.19) |
Total from investment operations | 1.50 | 3.68 | (5.08) |
Distributions from net investment income | (.07) | - | (.06) |
Distributions from net realized gain | (.04) | - | - |
Total distributions | (.11) | - | (.06) |
Redemption fees added to paid in capital E | - J | - J | .02 |
Net asset value, end of period | $ 9.95 | $ 8.56 | $ 4.88 |
Total Return B, C, D | 17.57% | 75.41% | (50.65)% |
Ratios to Average Net Assets F, I | | | |
Expenses before reductions | 1.59% | 3.17% | 4.17% A |
Expenses net of fee waivers, if any | 1.35% | 1.35% | 1.35% A |
Expenses net of all reductions | 1.30% | 1.27% | 1.27% A |
Net investment income (loss) | .80% | .35% | 1.29% A |
Supplemental Data | | | |
Net assets, end of period (000 omitted) | $ 1,348 | $ 117 | $ 395 |
Portfolio turnover rate G | 100% | 70% | 79% |
A Annualized
B Total returns for periods of less than one year are not annualized.
C Total returns do not reflect charges attributable to your insurance company's separate account. Inclusion of these charges would reduce the total returns shown.
D Total returns would have been lower had certain expenses not been reduced during the periods shown.
E Calculated based on average shares outstanding during the period.
F Fees and expenses of the underlying Fidelity Central Funds are not included in the Fund's expense ratio. The Fund indirectly bears its proportionate share of the expenses of any underlying Fidelity Central Funds.
G Amount does not include the portfolio activity of any underlying Fidelity Central Funds.
H For the period January 23, 2008 (commencement of operations) to December 31, 2008.
I Expense ratios reflect operating expenses of the class. Expenses before reductions do not reflect amounts reimbursed by the investment adviser or reductions from brokerage service arrangements or reductions from other expense offset arrangements and do not represent the amount paid by the class during periods when reimbursements or reductions occur. Expense ratios before reductions for start-up periods may not be representative of longer-term operating periods. Expenses net of fee waivers reflect expenses after reimbursement by the investment adviser but prior to reductions from brokerage service arrangements or other expense offset arrangements. Expenses net of all reductions represent the net expenses paid by the class.
J Amount represents less than $.01 per share.
Financial Highlights - Initial Class R
Years ended December 31, | 2010 | 2009 | 2008 H |
Selected Per-Share Data | | | |
Net asset value, beginning of period | $ 8.51 | $ 4.88 | $ 10.00 |
Income from Investment Operations | | | |
Net investment income (loss) E | .09 | .04 | .11 |
Net realized and unrealized gain (loss) | 1.44 | 3.63 | (5.16) |
Total from investment operations | 1.53 | 3.67 | (5.05) |
Distributions from net investment income | (.08) | (.02) | (.08) |
Distributions from net realized gain | (.04) | (.03) | - |
Total distributions | (.12) | (.05) | (.08) |
Redemption fees added to paid in capital E | - J | .01 | .01 |
Net asset value, end of period | $ 9.92 | $ 8.51 | $ 4.88 |
Total Return B, C, D | 18.01% | 75.40% | (50.45)% |
Ratios to Average Net Assets F, I | | | |
Expenses before reductions | 1.35% | 2.03% | 3.71% A |
Expenses net of fee waivers, if any | 1.10% | 1.10% | 1.10% A |
Expenses net of all reductions | 1.04% | 1.02% | 1.02% A |
Net investment income (loss) | 1.05% | .60% | 1.54% A |
Supplemental Data | | | |
Net assets, end of period (000 omitted) | $ 30,649 | $ 31,314 | $ 3,158 |
Portfolio turnover rate G | 100% | 70% | 79% |
A Annualized
B Total returns for periods of less than one year are not annualized.
C Total returns do not reflect charges attributable to your insurance company's separate account. Inclusion of these charges would reduce the total returns shown.
D Total returns would have been lower had certain expenses not been reduced during the periods shown.
E Calculated based on average shares outstanding during the period.
F Fees and expenses of the underlying Fidelity Central Funds are not included in the Fund's expense ratio. The Fund indirectly bears its proportionate share of the expenses of any underlying Fidelity Central Funds.
G Amount does not include the portfolio activity of any underlying Fidelity Central Funds.
H For the period January 23, 2008 (commencement of operations) to December 31, 2008.
I Expense ratios reflect operating expenses of the class. Expenses before reductions do not reflect amounts reimbursed by the investment adviser or reductions from brokerage service arrangements or reductions from other expense offset arrangements and do not represent the amount paid by the class during periods when reimbursements or reductions occur. Expense ratios before reductions for start-up periods may not be representative of longer-term operating periods. Expenses net of fee waivers reflect expenses after reimbursement by the investment adviser but prior to reductions from brokerage service arrangements or other expense offset arrangements. Expenses net of all reductions represent the net expenses paid by the class.
J Amount represents less than $.01 per share.
See accompanying notes which are an integral part of the financial statements.
Annual Report
Financial Highlights - Service Class 2R
Years ended December 31, | 2010 | 2009 | 2008 H |
Selected Per-Share Data | | | |
Net asset value, beginning of period | $ 8.56 | $ 4.88 | $ 10.00 |
Income from Investment Operations | | | |
Net investment income (loss) E | .07 | .02 | .11 |
Net realized and unrealized gain (loss) | 1.43 | 3.66 | (5.19) |
Total from investment operations | 1.50 | 3.68 | (5.08) |
Distributions from net investment income | (.06) | - | (.06) |
Distributions from net realized gain | (.04) | - | - |
Total distributions | (.09) K | - | (.06) |
Redemption fees added to paid in capital E | - J | - J | .02 |
Net asset value, end of period | $ 9.97 | $ 8.56 | $ 4.88 |
Total Return B, C, D | 17.60% | 75.41% | (50.65)% |
Ratios to Average Net Assets F, I | | | |
Expenses before reductions | 1.63% | 3.17% | 4.17% A |
Expenses net of fee waivers, if any | 1.35% | 1.35% | 1.35% A |
Expenses net of all reductions | 1.29% | 1.27% | 1.27% A |
Net investment income (loss) | .80% | .35% | 1.29% A |
Supplemental Data | | | |
Net assets, end of period (000 omitted) | $ 102 | $ 117 | $ 395 |
Portfolio turnover rate G | 100% | 70% | 79% |
A Annualized
B Total returns for periods of less than one year are not annualized.
C Total returns do not reflect charges attributable to your insurance company's separate account. Inclusion of these charges would reduce the total returns shown.
D Total returns would have been lower had certain expenses not been reduced during the periods shown.
E Calculated based on average shares outstanding during the period.
F Fees and expenses of the underlying Fidelity Central Funds are not included in the Fund's expense ratio. The Fund indirectly bears its proportionate share of the expenses of any underlying Fidelity Central Funds.
G Amount does not include the portfolio activity of any underlying Fidelity Central Funds.
H For the period January 23, 2008 (commencement of operations) to December 31, 2008.
I Expense ratios reflect operating expenses of the class. Expenses before reductions do not reflect amounts reimbursed by the investment adviser or reductions from brokerage service arrangements or reductions from other expense offset arrangements and do not represent the amount paid by the class during periods when reimbursements or reductions occur. Expense ratios before reductions for start-up periods may not be representative of longer-term operating periods. Expenses net of fee waivers reflect expenses after reimbursement by the investment adviser but prior to reductions from brokerage service arrangements or other expense offset arrangements. Expenses net of all reductions represent the net expenses paid by the class.
J Amount represents less than $.01 per share.
K Total distributions of $.09 per share is comprised of distributions from net investment income of $.056 and distributions from net realized gain of $.037 per share.
Financial Highlights - Investor Class R
Years ended December 31, | 2010 | 2009 | 2008 H |
Selected Per-Share Data | | | |
Net asset value, beginning of period | $ 8.50 | $ 4.87 | $ 10.00 |
Income from Investment Operations | | | |
Net investment income (loss) E | .08 | .04 | .10 |
Net realized and unrealized gain (loss) | 1.43 | 3.63 | (5.16) |
Total from investment operations | 1.51 | 3.67 | (5.06) |
Distributions from net investment income | (.08) | (.02) | (.08) |
Distributions from net realized gain | (.04) | (.03) | - |
Total distributions | (.12) | (.05) | (.08) |
Redemption fees added to paid in capital E | - J | .01 | .01 |
Net asset value, end of period | $ 9.89 | $ 8.50 | $ 4.87 |
Total Return B, C, D | 17.79% | 75.56% | (50.55)% |
Ratios to Average Net Assets F, I | | | |
Expenses before reductions | 1.42% | 2.07% | 3.81% A |
Expenses net of fee waivers, if any | 1.18% | 1.18% | 1.18% A |
Expenses net of all reductions | 1.12% | 1.10% | 1.10% A |
Net investment income (loss) | .97% | .52% | 1.46% A |
Supplemental Data | | | |
Net assets, end of period (000 omitted) | $ 53,089 | $ 40,070 | $ 3,377 |
Portfolio turnover rate G | 100% | 70% | 79% |
A Annualized
B Total returns for periods of less than one year are not annualized.
C Total returns do not reflect charges attributable to your insurance company's separate account. Inclusion of these charges would reduce the total returns shown.
D Total returns would have been lower had certain expenses not been reduced during the periods shown.
E Calculated based on average shares outstanding during the period.
F Fees and expenses of the underlying Fidelity Central Funds are not included in the Fund's expense ratio. The Fund indirectly bears its proportionate share of the expenses of any underlying Fidelity Central Funds.
G Amount does not include the portfolio activity of any underlying Fidelity Central Funds.
H For the period January 23, 2008 (commencement of operations) to December 31, 2008.
I Expense ratios reflect operating expenses of the class. Expenses before reductions do not reflect amounts reimbursed by the investment adviser or reductions from brokerage service arrangements or reductions from other expense offset arrangements and do not represent the amount paid by the class during periods when reimbursements or reductions occur. Expense ratios before reductions for start-up periods may not be representative of longer-term operating periods. Expenses net of fee waivers reflect expenses after reimbursement by the investment adviser but prior to reductions from brokerage service arrangements or other expense offset arrangements. Expenses net of all reductions represent the net expenses paid by the class.
J Amount represents less than $.01 per share.
See accompanying notes which are an integral part of the financial statements.
Annual Report
Notes to Financial Statements
For the period ended December 31, 2010
1. Organization.
VIP Emerging Markets Portfolio (the Fund) is a fund of Variable Insurance Products Fund IV (the Trust) and is authorized to issue an unlimited number of shares. The Trust is registered under the Investment Company Act of 1940, as amended (the 1940 Act), as an open-end management investment company organized as a Massachusetts business trust. Shares of the Fund may only be purchased by insurance companies for the purpose of funding variable annuity or variable life insurance contracts. The Fund offers the following classes of shares: Initial Class shares, Service Class shares, Service Class 2 shares, Initial Class R shares, Service Class 2R shares, and Investor Class R shares. All classes have equal rights and voting privileges, except for matters affecting a single class. Investment income, realized and unrealized capital gains and losses, the common expenses of the Fund, and certain fund-level expense reductions, if any, are allocated on a pro-rata basis to each class based on the relative net assets of each class to the total net assets of the Fund. Each class differs with respect to transfer agent and distribution and service plan fees incurred. Certain expense reductions may also differ by class. The Fund's investments in emerging markets can be subject to social, economic, regulatory, and political uncertainties and can be extremely volatile.
2. Investments in Fidelity Central Funds.
The Fund may invest in Fidelity Central Funds, which are open-end investment companies available only to other investment companies and accounts managed by Fidelity Management & Research Company (FMR) and its affiliates. The Fund's Schedule of Investments lists each of the Fidelity Central Funds held as of period end, if any, as an investment of the Fund, but does not include the underlying holdings of each Fidelity Central Fund. As an Investing Fund, the Fund indirectly bears its proportionate share of the expenses of the underlying Fidelity Central Funds.
The Money Market Central Funds seek preservation of capital and current income and are managed by Fidelity Investments Money Management, Inc. (FIMM), an affiliate of FMR.
A complete unaudited list of holdings for each Fidelity Central Fund is available upon request or at the Securities and Exchange Commission (the SEC) web site at www.sec.gov. In addition, the financial statements of the Fidelity Central Funds, which are not covered by the Fund's Report of Independent Registered Public Accounting Firm, are available on the SEC web site or upon request.
3. Significant Accounting Policies.
The financial statements have been prepared in conformity with accounting principles generally accepted in the United States of America (GAAP), which require management to make certain estimates and assumptions at the date of the financial statements. Actual results could differ from those estimates. Subsequent events, if any, through the date that the financial statements were issued have been evaluated in the preparation of the financial statements. The following summarizes the significant accounting policies of the Fund:
Security Valuation. Investments are valued as of 4:00 p.m. Eastern time on the last calendar day of the period. The Fund uses independent pricing services approved by the Board of Trustees to value its investments. When current market prices or quotations are not readily available or reliable, valuations may be determined in good faith in accordance with procedures adopted by the Board of Trustees. Factors used in determining value may include market or security specific events, changes in interest rates and credit quality. The frequency with which these procedures are used cannot be predicted and they may be utilized to a significant extent. The value used for net asset value (NAV) calculation under these procedures may differ from published prices for the same securities.
The Fund categorizes the inputs to valuation techniques used to value its investments into a disclosure hierarchy consisting of three levels as shown below.
Level 1 - quoted prices in active markets for identical investments
Level 2 - other significant observable inputs (including quoted prices for similar investments, interest rates, prepayment speeds, etc.)
Level 3 - unobservable inputs (including the Fund's own assumptions based on the best information available)
Changes in valuation techniques may result in transfers in or out of an assigned level within the disclosure hierarchy. The aggregate value of investments by input level, as of December 31, 2010, is included at the end of the Fund's Schedule of Investments. Valuation techniques used to value the Fund's investments by major category are as follows.
Equity securities, including restricted securities, for which market quotations are readily available, are valued at the last reported sale price or official closing price as reported by an independent pricing service on the primary market or exchange on which they are traded and are categorized as Level 1 in the hierarchy. In the event there were no sales during the day or closing prices are not available, securities are valued at the last quoted bid price or may be valued using the last available price and are generally categorized as Level 2 in the hierarchy. For foreign equity securities, when significant market or security specific events arise, comparisons to the valuation of American Depositary Receipts (ADRs), futures contracts, Exchange-traded funds (ETFs)and certain indexes as well as quoted prices for similar securities are used and are categorized as Level 2 in the hierarchy in these
Annual Report
Notes to Financial Statements - continued
3. Significant Accounting Policies - continued
Security Valuation - continued
circumstances. Utilizing these techniques may result in transfers between Level 1 and Level 2. For restricted equity securities and private placements where observable inputs are limited, assumptions about market activity and risk are used and are categorized as Level 3 in the hierarchy.
Investments in affiliated open-end mutual funds, including the Fidelity Central Funds, are valued at their closing net asset value each business day and are categorized as Level 1 in the hierarchy. Short-term securities with remaining maturities of sixty days or less for which quotations are not readily available are valued at amortized cost, which approximates fair value and are categorized as Level 2 in the hierarchy.
Foreign Currency. The Fund uses foreign currency contracts to facilitate transactions in foreign-denominated securities. Gains and losses from these transactions may arise from changes in the value of the foreign currency or if the counterparties do not perform under the contracts' terms.
Foreign-denominated assets, including investment securities, and liabilities are translated into U.S. dollars at the exchange rate at period end. Purchases and sales of investment securities, income and dividends received and expenses denominated in foreign currencies are translated into U.S. dollars at the exchange rate in effect on the transaction date.
The effects of exchange rate fluctuations on investments are included with the net realized and unrealized gain (loss) on investment securities. Other foreign currency transactions resulting in realized and unrealized gain (loss) are disclosed separately.
Investment Transactions and Income. For financial reporting purposes, the Fund's investment holdings and NAV include trades executed through the end of the last business day of the period. The NAV per share for processing shareholder transactions is calculated as of the close of business of the New York Stock Exchange (NYSE), normally 4:00 p.m. Eastern time and includes trades executed through the end of the prior business day. Gains and losses on securities sold are determined on the basis of identified cost. Dividend income is recorded on the ex-dividend date, except for certain dividends from foreign securities where the ex-dividend date may have passed, which are recorded as soon as the Fund is informed of the ex-dividend date. Non-cash dividends included in dividend income, if any, are recorded at the fair market value of the securities received. Distributions received on securities that represent a return of capital or capital gain are recorded as a reduction of cost of investments and/or as a realized gain. The Fund estimates the components of distributions received that may be considered return of capital distributions or capital gain distributions. Interest income and distributions from the Fidelity Central Funds are accrued as earned. Interest income includes coupon interest and amortization of premium and accretion of discount on debt securities. Investment income is recorded net of foreign taxes withheld where recovery of such taxes is uncertain.
Expenses. Expenses directly attributable to a fund are charged to that fund. Expenses attributable to more than one fund are allocated among the respective funds on the basis of relative net assets or other appropriate methods. Expense estimates are accrued in the period to which they relate and adjustments are made when actual amounts are known.
Income Tax Information and Distributions to Shareholders. Each year the Fund intends to qualify as a regulated investment company, including distributing substantially all of its taxable income and realized gains under Subchapter M of the Internal Revenue Code and filing its U.S. federal tax return. As a result, no provision for income taxes is required. As of December 31, 2010, the Fund did not have any unrecognized tax benefits in the accompanying financial statements. A fund's federal tax return is subject to examination by the Internal Revenue Service (IRS) for a period of three years. Foreign taxes are provided for based on the Fund's understanding of the tax rules and rates that exist in the foreign markets in which it invests. The Fund is subject to a tax imposed on realized short term capital gains on securities of certain issuers domiciled in India. An estimated deferred tax liability for net unrealized gains on these securities is included in Other payables and accrued expenses on the Statement of Assets & Liabilities.
Distributions are declared and recorded on the ex-dividend date. Income dividends and capital gain distributions are declared separately for each class. Income and capital gain distributions are determined in accordance with income tax regulations, which may differ from GAAP.
Capital accounts within the financial statements are adjusted for permanent book-tax differences. These adjustments have no impact on net assets or the results of operations. Temporary book-tax differences will reverse in a subsequent period.
Book-tax differences are primarily due to foreign currency transactions, passive foreign investment companies (PFIC), capital loss carryforwards and losses deferred due to was sales and excise tax regulations.
The federal tax cost of investment securities and unrealized appreciation (depreciation) as of period end were as follows:
Gross unrealized appreciation | $ 23,864,182 |
Gross unrealized depreciation | (1,380,183) |
Net unrealized appreciation (depreciation) | $ 22,483,999 |
Tax Cost | $ 82,874,206 |
Annual Report
3. Significant Accounting Policies - continued
Income Tax Information and Distributions to Shareholders - continued
The tax-based components of distributable earnings as of period end were as follows
Capital loss carryforward | $ (3,598,173) |
Net unrealized appreciation (depreciation) | $ 22,492,603 |
The tax character of distributions paid was as follows:
| December 31, 2010 | December 2009 |
Ordinary Income | $ 1,219,097 | $ 390,573 |
Trading (Redemption) Fees. Initial Class R shares, Service Class 2 R shares and Investor Class R shares held by investors less than 60 days are subject to a redemption fee equal to 1% of the net asset value of shares redeemed. All redemption fees, which reduce the proceeds of the shareholder redemption, are retained by the Fund and accounted for as an addition to paid in capital.
4. Operating Policies.
Repurchase Agreements. FMR has received an Exemptive Order from the SEC which permits the Fund and other affiliated entities of FMR to transfer uninvested cash balances into joint trading accounts which are then invested in repurchase agreements. The Fund may also invest directly with institutions in repurchase agreements. Repurchase agreements are collateralized by government or non-government securities. Upon settlement date, collateral is held in segregated accounts with custodian banks and may be obtained in the event of a default of the counterparty. The Fund monitors, on a daily basis, the value of the collateral to ensure it is at least equal to the principal amount of the repurchase agreement (including accrued interest). In the event of a default by the counterparty, realization of the collateral proceeds could be delayed, during which time the value of the collateral may decline.
Restricted Securities. The Fund may invest in securities that are subject to legal or contractual restrictions on resale. These securities generally may be resold in transactions exempt from registration or to the public if the securities are registered. Disposal of these securities may involve time-consuming negotiations and expense, and prompt sale at an acceptable price may be difficult. Information regarding restricted securities is included at the end of the Fund's Schedule of Investments.
5. Purchases and Sales of Investments.
Purchases and sales of securities, other than short-term securities, aggregated $100,429,770 and $78,509,593, respectively.
6. Fees and Other Transactions with Affiliates.
Management Fee. FMR and its affiliates provide the Fund with investment management related services for which the Fund pays a monthly management fee. The management fee is the sum of an individual fund fee rate that is based on an annual rate of .55% of the Fund's average net assets and a group fee rate that averaged .26% during the period. The group fee rate is based upon the average net assets of all the mutual funds advised by FMR. The group fee rate decreases as assets under management increase and increases as assets under management decrease. For the period, the total annual management fee rate was .81% of the Fund's average net assets.
Distribution and Service Plan Fees. In accordance with Rule 12b-1 of the 1940 Act, the Fund has adopted separate 12b-1 Plans for each Service Class of shares. Each Service Class pays Fidelity Distributors Corporation (FDC), an affiliate of FMR, a service fee. For the period, the service fee is based on an annual rate of .10% of Service Class' average net assets and .25% of Service Class 2's and Service Class 2R's average net assets.
For the period, total fees, all of which were re-allowed to insurance companies for the distribution of shares and providing shareholder support services were as follows:
Service Class | $ 102 |
Service Class 2 | 1,063 |
Service Class 2 R | 255 |
| $ 1,420 |
Annual Report
Notes to Financial Statements - continued
6. Fees and Other Transactions with Affiliates - continued
Transfer Agent Fees. Fidelity Investments Institutional Operations Company, Inc. (FIIOC), an affiliate of FMR, is the Fund's transfer, dividend disbursing, and shareholder servicing agent. FIIOC receives an asset-based fee with respect to each class. Each class (with the exception of Investor Class R) pays a transfer agent fee, excluding out of pocket expenses, equal to an annual rate of .07% of average net assets. Investor Class R pays a monthly asset-based transfer agent fee of .15% of average net assets. In addition, FIIOC receives an asset-based fee of .01% of average net assets for typesetting, printing and mailing of shareholder reports, except proxy statements. FIIOC has agreed to voluntarily waive this fee until December 31, 2010. (See note 9: Expense Reductions). For the period, transfer agent fees for each class, including printing and out of pocket expenses, were as follows:
Initial Class | $ 7,478 |
Service Class | 117 |
Service Class 2 | 372 |
Initial Class R | 23,780 |
Service Class 2R | 117 |
Investor Class R | 71,303 |
| $ 103,167 |
Accounting and Security Lending Fees. Fidelity Service Company, Inc. (FSC), an affiliate of FMR, maintains the Fund's accounting records. The accounting fee is based on the level of average net assets for the month. Under a separate contract, FSC administers the security lending program. The security lending fee is based on the number and duration of lending transactions.
Brokerage Commissions. The Fund placed a portion of its portfolio transactions with brokerage firms which are affiliates of the investment adviser. The commissions paid to these affiliated firms were $47 for the period.
7. Committed Line of Credit.
The Fund participates with other funds managed by FMR or an affiliate in a $3.75 billion credit facility (the "line of credit") to be utilized for temporary or emergency purposes to fund shareholder redemptions or for other short-term liquidity purposes. The Fund has agreed to pay commitment fees on its pro-rata portion of the line of credit, which amounted to $284 and is reflected in Miscellaneous expenses on the Statement of Operations. During the period, there were no borrowings on this line of credit.
8. Security Lending.
The Fund lends portfolio securities through a lending agent from time to time in order to earn additional income. The lending agent may loan securities to certain qualified borrowers, including Fidelity Capital Markets (FCM), a broker-dealer affiliated with the Fund. On the settlement date of the loan, the Fund receives collateral (in the form of U.S. Treasury obligations, letters of credit and/or cash) against the loaned securities and maintains collateral in an amount not less than 100% of the market value of the loaned securities during the period of the loan. The market value of the loaned securities is determined at the close of business of the Fund and any additional required collateral is delivered to the Fund on the next business day. If the borrower defaults on its obligation to return the securities loaned because of insolvency or other reasons, a fund could experience delays and costs in recovering the securities loaned or in gaining access to the collateral. Any cash collateral received is invested in the Fidelity Securities Lending Cash Central Fund. The value of loaned securities and cash collateral at period end are disclosed on the Fund's Statement of Assets and Liabilities. Security lending income represents the income earned on investing cash collateral, less rebates paid to borrowers and lending agent fees associated with the loan, plus any premium payments received for lending certain types of securities. Security lending income is presented in the Statement of Operations as a component of income from Fidelity Central Funds. Total security lending income during the period amounted to $11,306. During the period, there were no securities loaned to FCM.
9. Expense Reductions.
In addition to FIIOC waiving a portion of its transfer agent fees, FMR voluntarily agreed to reimburse each class to the extent annual operating expenses exceeded certain levels of average net assets as noted in the table below. Some expenses, for example interest expense, including commitment fees, are excluded from this reimbursement.
Annual Report
9. Expense Reductions - continued
The following classes were in reimbursement during the period:
| Expense
Limitations | Reimbursement/waiver |
Initial Class | 1.10% | $ 19,723 |
Service Class | 1.20% | 283 |
Service Class 2 | 1.35% | 1,027 |
Initial Class R | 1.10% | 71,003 |
Service Class 2R | 1.35% | 283 |
Investor Class R | 1.18% | 106,018 |
| | $ 198,337 |
Many of the brokers with whom FMR places trades on behalf of the Fund provided services to the Fund in addition to trade execution. These services included payments of certain expenses on behalf of the Fund totaling $46,898 for the period.
10. Distributions to Shareholders.
Distributions to shareholders of each class were as follows:
Years ended December 31, | 2010 | 2009 |
From net investment income | | |
Initial Class | $ 147,657 | $ 596 |
Service Class | 719 | 41 |
Service Class 2 | 8,901 | - |
Initial Class R | 247,442 | 75,536 |
Service Class 2R | 565 | - |
Investor Class R | 433,723 | 94,964 |
Total | $ 839,007 | $ 171,137 |
From net realized gain | | |
Initial Class | $ 62,064 | $ 762 |
Service Class | 383 | 275 |
Service Class 2 | 4,185 | - |
Initial Class R | 115,662 | 96,805 |
Service Class 2R | 382 | - |
Investor Class R | 197,414 | 121,594 |
Total | $ 380,090 | $ 219,436 |
11. Share Transactions.
Transactions for each class of shares were as follows:
| Shares | Dollars |
Years ended December 31, | 2010 | 2009 | 2010 | 2009 |
Initial Class | | | | |
Shares sold | 1,907,445 | 16,945 | $ 16,225,751 | $ 120,071 |
Reinvestment of distributions | 21,780 | 165 | 209,721 | 1,358 |
Shares redeemed | (94,931) | (93,578) | (856,392) | (691,714) |
Net increase (decrease) | 1,834,294 | (76,468) | $ 15,579,080 | $ (570,285) |
Service Class | | | | |
Shares sold | - | - | $ - | $ - |
Reinvestment of distributions | 115 | 38 | 1,102 | 316 |
Shares redeemed | (3,650) | (67,365) | (31,523) | (502,507) |
Net increase (decrease) | (3,535) | (67,327) | $ (30,421) | $ (502,191) |
Service Class 2 | | | | |
Shares sold | 137,437 | - | $ 1,250,469 | $ - |
Reinvestment of distributions | 1,356 | - | 13,086 | - |
Shares redeemed | (16,991) | (67,175) | (155,917) | (501,199) |
Net increase (decrease) | 121,802 | (67,175) | $ 1,107,638 | $ (501,199) |
Annual Report
Notes to Financial Statements - continued
11. Share Transactions - continued
| Shares | Dollars |
Years ended December 31, | 2010 | 2009 | 2010 | 2009 |
Initial Class R | | | | |
Shares sold | 1,547,303 | 3,509,051 | $ 14,204,050 | $ 24,423,527 |
Reinvestment of distributions | 38,007 | 20,952 | 363,104 | 172,342 |
Shares redeemed | (2,173,155) | (499,141) | (18,591,867) | (3,003,566) |
Net increase (decrease) | (587,845) | 3,030,862 | $ (4,024,713) | $ 21,592,303 |
Service Class 2R | | | | |
Shares sold | - | - | $ - | $ - |
Reinvestment of distributions | 99 | - | 947 | - |
Shares redeemed | (3,639) | (67,175) | (31,476) | (501,199) |
Net increase (decrease) | (3,540) | (67,175) | $ (30,529) | $ (501,199) |
Investor Class R | | | | |
Shares sold | 3,120,989 | 4,321,090 | $ 27,575,797 | $ 31,280,354 |
Reinvestment of distributions | 66,066 | 26,389 | 631,137 | 216,557 |
Shares redeemed | (2,534,983) | (326,280) | (21,477,649) | (2,015,261) |
Net increase (decrease) | 652,072 | 4,021,199 | $ 6,729,285 | $ 29,481,650 |
12. Other.
The Fund's organizational documents provide former and current trustees and officers with a limited indemnification against liabilities arising in connection with the performance of their duties to the Fund. In the normal course of business, the Fund may also enter into contracts that provide general indemnifications. The Fund's maximum exposure under these arrangements is unknown as this would be dependent on future claims that may be made against the Fund. The risk of material loss from such claims is considered remote.
At the period end, FMR or its affiliates were the owners of record of approximately 98% of the total outstanding shares of the Fund.
Annual Report
Report of Independent Registered Public Accounting Firm
To the Trustees of Variable Insurance Products Fund IV and Shareholders of VIP Emerging Markets Portfolio:
We have audited the accompanying statement of assets and liabilities of VIP Emerging Markets Portfolio (the Fund), a fund of Variable Insurance Products Fund IV, including the schedule of investments, as of December 31, 2010, and the related statement of operations for the year then ended, the statement of changes in net assets for each of the two years in the period then ended, and the financial highlights for each of the periods presented. These financial statements and financial highlights are the responsibility of the Fund's management. Our responsibility is to express an opinion on these financial statements and financial highlights based on our audits.
We conducted our audits in accordance with the standards of the Public Company Accounting Oversight Board (United States). Those standards require that we plan and perform the audit to obtain reasonable assurance about whether the financial statements and financial highlights are free of material misstatement. The Fund is not required to have, nor were we engaged to perform, an audit of its internal control over financial reporting. Our audits included consideration of internal control over financial reporting as a basis for designing audit procedures that are appropriate in the circumstances, but not for the purpose of expressing an opinion on the effectiveness of the Fund's internal control over financial reporting. Accordingly, we express no such opinion. An audit also includes examining, on a test basis, evidence supporting the amounts and disclosures in the financial statements, assessing the accounting principles used and significant estimates made by management, as well as evaluating the overall financial statement presentation. Our procedures included confirmation of securities owned as of December 31, 2010, by correspondence with the custodians and brokers; where replies were not received from brokers, we performed other auditing procedures. We believe that our audits provide a reasonable basis for our opinion.
In our opinion, the financial statements and financial highlights referred to above present fairly, in all material respects, the financial position of VIP Emerging Markets Portfolio as of December 31, 2010, the results of its operations for the year then ended, the changes in its net assets for each of the two years in the period then ended, and the financial highlights for each of the periods presented, in conformity with accounting principles generally accepted in the United States of America.
/s/ Deloitte & Touche LLP
DELOITTE & TOUCHE LLP
Boston, Massachusetts
February 17, 2011
Annual Report
The Trustees, Members of the Advisory Board, and executive officers of the trust and fund, as applicable, are listed below. The Board of Trustees governs the fund and is responsible for protecting the interests of shareholders. The Trustees are experienced executives who meet periodically throughout the year to oversee the fund's activities, review contractual arrangements with companies that provide services to the fund, oversee management of the risks associated with such activities and contractual arrangements, and review the fund's performance. Except for James C. Curvey, each of the Trustees oversees 219 funds advised by FMR or an affiliate. Mr. Curvey oversees 408 funds advised by FMR or an affiliate.
The Trustees hold office without limit in time except that (a) any Trustee may resign; (b) any Trustee may be removed by written instrument, signed by at least two-thirds of the number of Trustees prior to such removal; (c) any Trustee who requests to be retired or who has become incapacitated by illness or injury may be retired by written instrument signed by a majority of the other Trustees; and (d) any Trustee may be removed at any special meeting of shareholders by a two-thirds vote of the outstanding voting securities of the trust. Each Trustee who is not an interested person (as defined in the 1940 Act) (Independent Trustee), shall retire not later than the last day of the calendar year in which his or her 72nd birthday occurs. The Independent Trustees may waive this mandatory retirement age policy with respect to individual Trustees. The executive officers and Advisory Board Members hold office without limit in time, except that any officer and Advisory Board Member may resign or may be removed by a vote of a majority of the Trustees at any regular meeting or any special meeting of the Trustees. Except as indicated, each individual has held the office shown or other offices in the same company for the past five years.
Experience, Skills, Attributes, and Qualifications of the Fund's Trustees. The Governance and Nominating Committee has adopted a statement of policy that describes the experience, qualifications, attributes, and skills that are necessary and desirable for potential Independent Trustee candidates (Statement of Policy). The Board believes that each Trustee satisfied at the time he or she was initially elected or appointed a Trustee, and continues to satisfy, the standards contemplated by the Statement of Policy. The Governance and Nominating Committee also engages professional search firms to help identify potential Independent Trustee candidates who have the experience, qualifications, attributes, and skills consistent with the Statement of Policy. From time to time, additional criteria based on the composition and skills of the current Independent Trustees, as well as experience or skills that may be appropriate in light of future changes to board composition, business conditions, and regulatory or other developments, have also been considered by the professional search firms and the Governance and Nominating Committee. In addition, the Board takes into account the Trustees' commitment and participation in Board and committee meetings, as well as their leadership of standing and ad hoc committees throughout their tenure.
In determining that a particular Trustee was and continues to be qualified to serve as a Trustee, the Board has considered a variety of criteria, none of which, in isolation, was controlling. The Board believes that, collectively, the Trustees have balanced and diverse experience, qualifications, attributes, and skills, which allow the Board to operate effectively in governing the fund and protecting the interests of shareholders. Information about the specific experience, skills, attributes, and qualifications of each Trustee, which in each case led to the Board's conclusion that the Trustee should serve (or continue to serve) as a trustee of the fund, is provided below.
Board Structure and Oversight Function. James C. Curvey is an interested person (as defined in the 1940 Act) and currently serves as Acting Chairman. The Trustees have determined that an interested Chairman is appropriate and benefits shareholders because an interested Chairman has a personal and professional stake in the quality and continuity of services provided to the fund. Independent Trustees exercise their informed business judgment to appoint an individual of their choosing to serve as Chairman, regardless of whether the Trustee happens to be independent or a member of management. The Independent Trustees have determined that they can act independently and effectively without having an Independent Trustee serve as Chairman and that a key structural component for assuring that they are in a position to do so is for the Independent Trustees to constitute a substantial majority for the Board. The Independent Trustees also regularly meet in executive session. Ned C. Lautenbach serves as Chairman of the Independent Trustees and as such (i) acts as a liaison between the Independent Trustees and management with respect to matters important to the Independent Trustees and (ii) with management prepares agendas for Board meetings.
Fidelity funds are overseen by different Boards of Trustees. The fund's Board oversees Fidelity's equity and high income funds and another Board oversees Fidelity's investment-grade bond, money market, and asset allocation funds. The asset allocation funds may invest in Fidelity funds overseen by the fund's Board. The use of separate Boards, each with its own committee structure, allows the Trustees of each group of Fidelity funds to focus on the unique issues of the funds they oversee, including common research, investment, and operational issues. On occasion, the separate Boards establish joint committees to address issues of overlapping consequences for the Fidelity funds overseen by each Board.
The Trustees operate using a system of committees to facilitate the timely and efficient consideration of all matters of importance to the Trustees, the fund, and fund shareholders and to facilitate compliance with legal and regulatory requirements and oversight of the fund's activities and associated risks. The Board, acting through its committees, has charged FMR and its affiliates with (i) identifying events or circumstances the occurrence of which could have demonstrably adverse effects on the fund's business and/or reputation; (ii) implementing processes and controls to lessen the possibility that such events or circumstances occur or to mitigate the effects of such events or circumstances if they do occur; and (iii) creating and maintaining a system designed to evaluate continuously business and market conditions in order to facilitate the identification and implementation processes described in (i) and (ii) above. Because the day-to-day operations and activities of the fund are carried out by or through FMR, its affiliates and other service providers, the fund's exposure to risks is mitigated but not eliminated by the processes overseen by the Trustees. While each of the Board's committees has responsibility for overseeing different aspects of the fund's activities, oversight is exercised primarily through the Operations, Audit, and Compliance Committees. Appropriate personnel, including but not limited to the fund's Chief Compliance Officer (CCO), FMR's internal auditor, the independent accountants, the fund's Treasurer and portfolio management personnel, make periodic reports to the Board's committees, as appropriate. The responsibilities of each committee, including their oversight responsibilities, are described further under "Standing Committees of the Fund's Trustees."
Annual Report
The funds' Statement of Additional Information (SAI) includes more information about the Trustees. To request a free copy, call Fidelity at 1-877-208-0098.
Interested Trustees*:
Correspondence intended for each Trustee who is an interested person may be sent to Fidelity Investments, 82 Devonshire Street, Boston, Massachusetts 02109.
Name, Age; Principal Occupations and Other Relevant Experience+ |
James C. Curvey (75) |
| Year of Election or Appointment: 2007 Mr. Curvey is Trustee and Acting Chairman of the Board of Trustees of certain Trusts. Mr. Curvey also serves as Trustee (2007-present) of other investment companies advised by FMR. Mr. Curvey is a Director of Fidelity Investments Money Management, Inc. (2009-present), Director of Fidelity Research & Analysis Co. (2009-present) and Director of FMR and FMR Co., Inc. (2007-present). Mr. Curvey is also Vice Chairman (2007-present) and Director of FMR LLC. In addition, Mr. Curvey serves as an Overseer for the Boston Symphony Orchestra and a member of the Trustees of Villanova University. Previously, Mr. Curvey was the Vice Chairman (2006-2007) and Director (2000-2007) of FMR Corp. |
Ronald P. O'Hanley (54) |
| Year of Election or Appointment: 2011 Mr. O'Hanley is President of Fidelity Asset Management and Corporate Services and a member of Fidelity's Executive Committee (2010-present). Previously, Mr. O'Hanley served as President and Chief Executive Officer of BNY Mellon Asset Management (2007-2010). Mr. O'Hanley also served as Vice Chairman of Bank New York Mellon Corp. and a member of that firm's Executive Committee. Prior to the 2007 merger of The Bank of New York and Mellon Financial Corporation, he was Vice Chairman of Mellon Financial Corporation and President and Chief Executive Officer of Mellon Asset Management. He joined Mellon in February 1997. Mr. O'Hanley currently serves as Chairman of the Boston Public Library Foundation Board of Directors and sits on the Board of Directors of Beth Israel Deaconess Medical Center, the Board of Trustees of the Marine Biological Laboratory and the Advisory Board of the Maxwell School of Citizenship and Public Administration at Syracuse University. Mr. O'Hanley also chairs the Council on Asset Management for the Financial Services Roundtable and is a member of the Board of Directors of Institutional Investor's U.S. Institute. |
* Trustees have been determined to be "Interested Trustees" by virtue of, among other things, their affiliation with the trust or various entities under common control with FMR.
+ The information above includes each Trustee's principal occupation during the last five years and other information relating to the experience, attributes, and skills relevant to each Trustee's qualifications to serve as a Trustee, which led to the conclusion that each Trustee should serve as a Trustee for the fund.
Independent Trustees:
Correspondence intended for each Independent Trustee (that is, the Trustees other than the Interested Trustees) may be sent to Fidelity Investments, P.O. Box 55235, Boston, Massachusetts 02205-5235.
Name, Age; Principal Occupations and Other Relevant Experience+ |
Dennis J. Dirks (62) |
| Year of Election or Appointment: 2005 Prior to his retirement in May 2003, Mr. Dirks was Chief Operating Officer and a member of the Board of The Depository Trust & Clearing Corporation (DTCC). He also served as President, Chief Operating Officer, and Board member of The Depository Trust Company (DTC) and President and Board member of the National Securities Clearing Corporation (NSCC). In addition, Mr. Dirks served as Chief Executive Officer and Board member of the Government Securities Clearing Corporation, Chief Executive Officer and Board member of the Mortgage-Backed Securities Clearing Corporation, as a Trustee and a member of the Finance Committee of Manhattan College (2005-2008), and as a Trustee and a member of the Finance Committee of AHRC of Nassau County (2006-2008). Mr. Dirks is a member of the Independent Directors Council (IDC) Governing Council (2010-Present) and Board of Directors for The Brookville Center for Children's Services, Inc. (2009-present). |
Alan J. Lacy (57) |
| Year of Election or Appointment: 2008 Mr. Lacy serves as Senior Adviser (2007-present) of Oak Hill Capital Partners, L.P. (private equity). Mr. Lacy also served as Chief Executive Officer (2000-2005) and Vice Chairman (2005-2006) of Sears Holdings Corporation and Sears, Roebuck and Co. (retail). In addition, Mr. Lacy serves as a member of the Board of Directors of The Western Union Company (global money transfer, 2006-present) and Bristol-Myers Squibb Company (global pharmaceuticals, 2007-present). Mr. Lacy is Chairman (2008-present) and a member (2006-present) of the Board of Trustees of The National Parks Conservation Association. |
Ned C. Lautenbach (66) |
| Year of Election or Appointment: 2000 Mr. Lautenbach is Chairman of the Independent Trustees of the Equity and High Income Funds (2006-present). Mr. Lautenbach currently serves as the Lead Director of the Eaton Corporation Board of Directors (diversified industrial, 1997-present). Mr. Lautenbach is also a member of the Board of Directors of the Philharmonic Center for the Arts in Naples, Florida (1999-present); a member of the Board of Trustees of Fairfield University (2005-present); and a member of the Council on Foreign Relations (1994-present). Previously, Mr. Lautenbach was a Partner/Advisory Partner at Clayton, Dubilier & Rice, Inc. (private equity investment, 1998-2010), as well as a Director of Sony Corporation (2006-2007). |
Joseph Mauriello (66) |
| Year of Election or Appointment: 2008 Prior to his retirement in January 2006, Mr. Mauriello served in numerous senior management positions including Deputy Chairman and Chief Operating Officer (2004-2005), and Vice Chairman of Financial Services (2002-2004) of KPMG LLP US (professional services, 1965-2005). Mr. Mauriello currently serves as a member of the Board of Directors of XL Group plc. (global insurance and re-insurance, 2006-present) and of Arcadia Resources Inc. (health care services and products, 2007-present). Previously, Mr. Mauriello served as a Director of the Hamilton Funds of the Bank of New York (2006-2007). |
Cornelia M. Small (66) |
| Year of Election or Appointment: 2005 Ms. Small is a member of the Board of Directors of the Teagle Foundation (2009-present). Ms. Small is also a member of the Investment Committee, and Chair (2008-present) and a member of the Board of Trustees of Smith College. In addition, Ms. Small serves on the Investment Committee of the Berkshire Taconic Community Foundation (2008-present). Previously, Ms. Small served as Chairperson of the Investment Committee (2002-2008) of Smith College. In addition, Ms. Small served as Chief Investment Officer, Director of Global Equity Investments, and a member of the Board of Directors of Scudder, Stevens & Clark and Scudder Kemper Investments. |
William S. Stavropoulos (71) |
| Year of Election or Appointment: 2001 Mr. Stavropoulos is Vice Chairman of the Independent Trustees of the Equity and High Income Funds (2006-present). Mr. Stavropoulos serves as President and Founder of the Michigan Baseball Foundation, the Great Lakes Loons (2007-present). Mr. Stavropoulos is Chairman Emeritus of the Board of Directors of The Dow Chemical Company, where he previously served in numerous senior management positions, including President, CEO (1995-2000; 2002-2004), Chairman of the Executive Committee (2000-2006), and as a member of the Board of Directors (1990-2006). Currently, Mr. Stavropoulos is Chairman of Univar (global distributor of commodity and specialty chemicals, 2010-present), a Director of Teradata Corporation (data warehousing and technology solutions, 2008-present), Chemical Financial Corporation, Maersk Inc. (industrial conglomerate), Tyco International, Inc. (multinational manufacturing and services, 2007-present), and a member of the Advisory Board for Metalmark Capital (private equity investment, 2005-present). Mr. Stavropoulos is a special advisor to Clayton, Dubilier & Rice, LLC (private equity investment). In addition, Mr. Stavropoulos is a member of the University of Notre Dame Advisory Council for the College of Science. |
David M. Thomas (61) |
| Year of Election or Appointment: 2008 Previously, Mr. Thomas served as Executive Chairman (2005-2006) and Chairman and Chief Executive Officer (2000-2005) of IMS Health, Inc. (pharmaceutical and healthcare information solutions). In addition, Mr. Thomas serves as a member of the Board of Directors of Fortune Brands, Inc. (consumer products), and Interpublic Group of Companies, Inc. (marketing communication, 2004-present). |
Michael E. Wiley (60) |
| Year of Election or Appointment: 2008 Mr. Wiley also serves as a Director of Asia Pacific Exploration Consolidated (international oil and gas exploration and production, 2008-present). Mr. Wiley serves as a Director of Tesoro Corporation (independent oil refiner and marketer, 2005-present), and a Director of Bill Barrett Corporation (exploration and production, 2005-present). In addition, Mr. Wiley also serves as a Director of Post Oak Bank (privately-held bank, 2004-present). Previously, Mr. Wiley served as a member of the Board of Trustees of the University of Tulsa (2000-2006; 2007-2010), as a Senior Energy Advisor of Katzenbach Partners, LLC (consulting, 2006-2007), as an Advisory Director of Riverstone Holdings (private investment), Chairman, President, and CEO of Baker Hughes, Inc. (oilfield services, 2000-2004), and as Director of Spinnaker Exploration Company (exploration and production, 2001-2005). |
+ The information above includes each Trustee's principal occupation during the last five years and other information relating to the experience, attributes, and skills relevant to each Trustee's qualifications to serve as a Trustee, which led to the conclusion that each Trustee should serve as a Trustee for the fund.
Advisory Board Members and Executive Officers:
Correspondence intended for each executive officer, Edward C. Johnson 3d, and Peter S. Lynch may be sent to Fidelity Investments, 82 Devonshire Street, Boston, Massachusetts 02109.
Name, Age; Principal Occupation |
Edward C. Johnson 3d (80) |
| Year of Election or Appointment: 2011 Member of the Advisory Board of Fidelity's Equity and High Income Funds. Formerly Trustee and Chairman of the Board of Trustees of certain Trusts, Mr. Johnson serves as Chief Executive Officer, Chairman, and a Director of FMR LLC; Chairman and a Director of FMR; and Chairman and a Director of FMR Co., Inc. In addition, Mr. Johnson serves as Chairman and Director of FIL Limited. Previously, Mr. Johnson served as President of FMR LLC (2006-2007). |
Peter S. Lynch (66) |
| Year of Election or Appointment: 2003 Member of the Advisory Board of Fidelity's Equity and High Income Funds. Mr. Lynch is Vice Chairman and a Director of FMR and FMR Co., Inc. In addition, Mr. Lynch serves as a Trustee of Boston College and as the Chairman of the Inner-City Scholarship Fund. Previously, Mr. Lynch served on the Special Olympics International Board of Directors (1997-2006). |
Kenneth B. Robins (41) |
| Year of Election or Appointment: 2008 President and Treasurer of Fidelity's Equity and High Income Funds. Mr. Robins also serves as President and Treasurer (2010-present) and Assistant Treasurer (2009-present) of other Fidelity funds and is an employee of Fidelity Investments (2004-present). Previously, Mr. Robins served as Deputy Treasurer of the Fidelity funds (2005-2008) and Treasurer and Chief Financial Officer of The North Carolina Capital Management Trust: Cash and Term Portfolios (2006-2008). |
Bruce T. Herring (45) |
| Year of Election or Appointment: 2006 Vice President of certain Equity Funds. Mr. Herring also serves as Chief Investment Officer and Director of Fidelity Management & Research (U.K.) Inc. (2010-present) and Group Chief Investments Officer of FMR. Previously, Mr. Herring served as Vice President (2005-2006) and Senior Vice President (2006-2007) of Fidelity Management & Research Company, Vice President of FMR Co., Inc. (2001-2007) and as a portfolio manager for Fidelity U.S. Equity Funds. |
Brian B. Hogan (46) |
| Year of Election or Appointment: 2009 Vice President of certain Equity Funds and Vice President of Sector Funds. Mr. Hogan also serves as President of FMR's Equity Division (2009-present). Previously, Mr. Hogan served as Senior Vice President, Equity Research of FMR (2006-2009) and as a portfolio manager. |
Scott C. Goebel (42) |
| Year of Election or Appointment: 2008 Secretary and Chief Legal Officer (CLO) of the Fidelity funds. Mr. Goebel also serves as Secretary and CLO of The North Carolina Capital Management Trust: Cash and Term Portfolio (2008-present); General Counsel, Secretary, and Senior Vice President of FMR (2008-present) and FMR Co., Inc. (2008-present); Deputy General Counsel of FMR LLC; Chief Legal Officer of Fidelity Management & Research (Hong Kong) Limited (2008-present) and Assistant Secretary of Fidelity Management & Research (Japan) Inc. (2008-present), Fidelity Investments Money Management, Inc. (2008-present), Fidelity Management & Research (U.K.) Inc. (2008-present), and Fidelity Research and Analysis Company (2008-present). Previously, Mr. Goebel served as Assistant Secretary of the Funds (2007-2008) and as Vice President and Secretary of Fidelity Distributors Corporation (FDC) (2005-2007). |
William C. Coffey (41) |
| Year of Election or Appointment: 2009 Assistant Secretary of Fidelity's Equity and High Income Funds. Mr. Coffey also serves as Senior Vice President and Deputy General Counsel of FMR LLC (2010-present), and is an employee of Fidelity Investments. Previously, Mr. Coffey served as Vice President and Associate General Counsel of FMR LLC (2005-2009). |
Holly C. Laurent (56) |
| Year of Election or Appointment: 2008 Anti-Money Laundering (AML) Officer of the Fidelity funds. Ms. Laurent also serves as AML Officer of The North Carolina Capital Management Trust: Cash and Term Portfolio (2008-present) and is an employee of Fidelity Investments. Previously, Ms. Laurent was Senior Vice President and Head of Legal for Fidelity Business Services India Pvt. Ltd. (2006-2008), and Senior Vice President, Deputy General Counsel and Group Head for FMR LLC (2005-2006). |
Christine Reynolds (52) |
| Year of Election or Appointment: 2008 Chief Financial Officer of the Fidelity funds. Ms. Reynolds became President of Fidelity Pricing and Cash Management Services (FPCMS) in August 2008. Ms. Reynolds served as Chief Operating Officer of FPCMS (2007-2008). Previously, Ms. Reynolds served as President, Treasurer, and Anti-Money Laundering officer of the Fidelity funds (2004-2007). |
Kenneth A. Rathgeber (63) |
| Year of Election or Appointment: 2004 Chief Compliance Officer of Fidelity's Equity and High Income Funds. Mr. Rathgeber is Chief Compliance Officer of Fidelity Management & Research (Hong Kong) Limited (2008-present), Fidelity Management & Research (Japan) Inc. (2008-present), FMR (2005-present), FMR Co., Inc. (2005-present), Fidelity Management & Research (U.K.) Inc. (2005-present), Fidelity Research & Analysis Company (2005-present), Fidelity Investments Money Management, Inc. (2005-present), Pyramis Global Advisors, LLC (2005-present), and Strategic Advisers, Inc. (2005-present). |
Jeffrey S. Christian (49) |
| Year of Election or Appointment: 2009 Deputy Treasurer of the Fidelity funds. Mr. Christian is an employee of Fidelity Investments. Previously, Mr. Christian served as Chief Financial Officer (2008-2009) of certain Fidelity funds and Senior Vice President of Fidelity Pricing and Cash Management Services (FPCMS) (2004-2009). |
Bryan A. Mehrmann (49) |
| Year of Election or Appointment: 2005 Deputy Treasurer of the Fidelity funds. Mr. Mehrmann is an employee of Fidelity Investments. |
Adrien E. Deberghes (43) |
| Year of Election or Appointment: 2008 Deputy Treasurer of Fidelity's Equity and High Income Funds. Mr. Deberghes also serves as Assistant Treasurer of other Fidelity funds (2010-present) and is an employee of Fidelity Investments (2008-present). Previously, Mr. Deberghes served as Senior Vice President of Mutual Fund Administration at State Street Corporation (2007-2008), Senior Director of Mutual Fund Administration at Investors Bank & Trust (2005-2007), and Director of Finance for Dunkin' Brands (2000-2005). |
Stephanie J. Dorsey (41) |
| Year of Election or Appointment: 2010 Assistant Treasurer of Fidelity's Equity and High Income Funds. Ms. Dorsey also serves as Deputy Treasurer of other Fidelity funds (2008-present) and is an employee of Fidelity Investments (2008-present). Previously, Ms. Dorsey served as Treasurer (2004-2008) of the JPMorgan Mutual Funds and Vice President (2004-2008) of JPMorgan Chase Bank. |
Name, Age; Principal Occupation |
John R. Hebble (52) |
| Year of Election or Appointment: 2009 Assistant Treasurer of Fidelity's Equity and High Income Funds. Mr. Hebble also serves as Treasurer and Chief Financial Officer of The North Carolina Capital Management Trust: Cash and Term Portfolio (2008-present), President and Treasurer of other Fidelity funds (2008-present) and is an employee of Fidelity Investments. |
Gary W. Ryan (52) |
| Year of Election or Appointment: 2005 Assistant Treasurer of the Fidelity funds. Mr. Ryan is an employee of Fidelity Investments. Previously, Mr. Ryan served as Vice President of Fund Reporting in Fidelity Pricing and Cash Management Services (FPCMS) (1999-2005). |
Jonathan Davis (42) |
| Year of Election or Appointment: 2010 Assistant Treasurer of the Fidelity funds. Mr. Davis is an employee of Fidelity Investments. Previously, Mr. Davis served as Vice President and Associate General Counsel of FMR LLC (2003-2010). |
Annual Report
The amounts per share which represent income derived from sources within, and taxes paid to, foreign countries or possessions of the United States are as follows:
| Pay Date | Income | Taxes |
Initial Class | 02/05/10 | $.003 | $.000 |
| 12/17/10 | $.135 | $.020 |
Service Class | 02/05/10 | $.003 | $.000 |
| 12/17/10 | $.125 | $.020 |
Service Class 2 | 02/05/10 | $.003 | $.000 |
| 12/17/10 | $.127 | $.020 |
Annual Report
Board Approval of Investment Advisory Contracts and Management Fees
VIP Emerging Markets Portfolio
Each year, the Board of Trustees, including the Independent Trustees (together, the Board), votes on the renewal of the management contract and sub-advisory agreements (together, the Advisory Contracts) for the fund. The Board, assisted by the advice of fund counsel and Independent Trustees' counsel, requests and considers a broad range of information relevant to the renewal of the Advisory Contracts throughout the year.
The Board meets regularly and considers at each of its meetings factors that are relevant to its annual consideration of the renewal of the fund's Advisory Contracts, including the services and support provided to the fund and its shareholders. The Board has established various standing committees, each composed of Independent Trustees with varying backgrounds, to which the Board has assigned specific subject matter responsibilities in order to enhance effective decision-making by the Board. The Board, acting directly and through its Committees, requests and receives information concerning the annual consideration of the renewal of the fund's Advisory Contracts. The Board also meets as needed to consider matters specifically related to the Board's annual consideration of the renewal of Advisory Contracts. Members of the Board may also meet with trustees of other Fidelity funds through ad hoc joint committees to discuss certain matters relevant to the Fidelity funds.
At its July 2010 meeting, the Board of Trustees, including the Independent Trustees, unanimously determined to renew the fund's Advisory Contracts. In reaching its determination, the Board considered all factors it believed relevant, including (i) the nature, extent, and quality of the services to be provided to the fund and its shareholders (including the investment performance of the fund); (ii) the competitiveness of the fund's management fee and total expenses; (iii) the total costs of the services to be provided by and the profits to be realized by Fidelity from its relationship with the fund; (iv) the extent to which economies of scale would be realized as the fund grows; and (v) whether fee levels reflect these economies of scale, if any, for the benefit of fund shareholders.
In considering whether to renew the Advisory Contracts for the fund, the Board reached a determination, with the assistance of fund counsel and Independent Trustees' counsel and through the exercise of its business judgment, that the renewal of the Advisory Contracts is in the best interests of fund shareholders and that the compensation to be received by Fidelity under the management contract is fair and reasonable. The Board's decision to renew the Advisory Contracts was not based on any single factor noted above, but rather was based on a comprehensive consideration of all the information provided to the Board at its meetings throughout the year. The Board, in reaching its determination to renew the Advisory Contracts, is aware that shareholders in the fund have a broad range of investment choices available to them, including a wide choice among mutual funds offered by Fidelity's competitors, and that the fund's shareholders, with the opportunity to review and weigh the disclosure provided by the fund in its prospectus and other public disclosures, have chosen to invest in this fund, managed by Fidelity.
Nature, Extent, and Quality of Services Provided. The Board considered the staffing within the investment adviser, FMR, and the sub-advisers (together, the Investment Advisers), including the backgrounds of the fund's investment personnel and the fund's investment objective and discipline. The Independent Trustees also had discussions with senior management of Fidelity's investment operations and investment groups. The Board considered the structure of the portfolio manager compensation program and whether this structure provides appropriate incentives to act in the best interest of the fund.
Resources Dedicated to Investment Management and Support Services. The Board and the equity research subcommittee of the Board's Fund Oversight Committee reviewed the size, education, and experience of the Investment Advisers' investment staff, their use of technology, and the Investment Advisers' approach to recruiting, training, and retaining portfolio managers and other research, advisory, and management personnel. The Board noted that Fidelity's analysts have access to a variety of technological tools and market and securities data that enable them to perform both fundamental and quantitative analysis and to specialize in various disciplines. The Board considered Fidelity's extensive global research capabilities that enable the Investment Advisers to aggregate data from various sources in an effort to produce positive investment results. The Board also considered that Fidelity's portfolio managers and analysts have access to daily portfolio attribution that allows for monitoring of a fund's portfolio, as well as an electronic communication system that provides immediate real-time access to research concerning issuers and credit enhancers. The Board noted FMR's continued focus on strengthening the organization and discipline of equity portfolio management and research.
Shareholder and Administrative Services. The Board considered (i) the nature, extent, quality, and cost of advisory, administrative, and shareholder services performed by the Investment Advisers and their affiliates under the Advisory Contracts and under separate agreements covering transfer agency, pricing and bookkeeping, and securities lending services for the fund; (ii) the nature and extent of the investment adviser's supervision of third party service providers, principally custodians and subcustodians; and (iii) the resources devoted to, and the record of compliance with, the fund's compliance policies and procedures. The Board also reviewed the allocation of fund brokerage, including allocations to brokers affiliated with the Investment Advisers, the use of brokerage commissions to pay fund expenses, and the use of "soft" commission dollars to pay for research services.
The Board noted that the growth of fund assets over time across the complex allows Fidelity to reinvest in the development of services designed to enhance the value or convenience of the Fidelity funds as investment vehicles. These services include 24-hour access to account information and market information through phone representatives and over the Internet, and investor education materials and asset allocation tools.
Investment in a Large Fund Family. The Board considered the benefits to shareholders of investing in a Fidelity fund, including the benefits of investing in a fund that is part of a large family of funds offering a variety of investment disciplines and providing a large variety of mutual fund investor services. The Board noted that Fidelity had taken, or had made recommendations that resulted in the Fidelity funds taking, a number of actions over the previous year that benefited particular funds, including (i) dedicating additional resources to investment research and restructuring and broadening the focus of the investment research teams; (ii) bolstering the senior management team that oversees asset management; (iii) launching Class F of certain funds as a lower-fee class available to Freedom K and Freedom Index Funds; (iv) lowering the initial investment minimums and ongoing balance requirements for Real Estate High Income Fund; (v) eliminating subsequent purchase minimums for all funds and adding a waiver of the investment minimum requirement for new accounts opened with the proceeds of a systematic withdrawal plan; (vi) eliminating the withdrawal minimum and maximum limits for systematic withdrawals from Advisor funds; (vii) expanding sales load waivers on Class A shares for Destiny Planholders and expanding Institutional Class eligibility for Class O Destiny Planholders; and (viii) changing certain Class A and Class T sales charge structures to further align them with industry practices.
Annual Report
Board Approval of Investment Advisory Contracts and Management Fees - continued
Investment Performance. The Board considered whether the fund has operated in accordance with its investment objective, as well as its record of compliance with its investment restrictions. It also reviewed the fund's absolute investment performance for each class, as well as the fund's relative investment performance for each class measured against (i) a broad-based securities market index, and (ii) a peer group of mutual funds deemed appropriate by Fidelity and reviewed by the Board. Because the fund had been in existence less than three calendar years, the following chart considered by the Board shows, for the one-year period ended December 31, 2009, the total returns of Investor Class R and Initial Class of the fund, the total return of a broad-based securities market index ("benchmark"), and a range of total returns of a peer group of mutual funds identified by Morningstar, Inc. as having an investment style similar to that of the fund based on underlying portfolio holdings. The returns of Investor Class R and Initial Class show the performance of the highest and lowest performing classes, respectively. The box within the chart shows the 25th percentile return (bottom of box) and the 75th percentile return (top of box) of the peer group. Returns shown above the box are in the first quartile and returns shown below the box are in the fourth quartile. The percentage beaten numbers noted below the chart correspond to the percentile box and represent the percentage of funds in the peer group whose performance was equal to or lower than that of the class indicated.
VIP Emerging Markets Portfolio

The Board reviewed the fund's relative investment performance against its peer group and noted that the performance of Investor Class R of the fund was in the second quartile for the period shown. The Board also noted that the investment performance of the fund was lower than its benchmark for the period shown. The Board considered that the variations in performance among the fund's classes reflect the variations in class expenses, which result in lower performance for higher expense classes. The Board also reviewed the fund's performance since inception as well as performance in the current year. The Board noted that it is difficult to evaluate in any comprehensive fashion the performance of the fund, in light of its relatively recent commencement of operations.
Based on its review, and giving particular weight to the nature and quality of the resources dedicated by the Investment Advisers to maintain and improve relative performance and factoring in the unprecedented market events in recent years, the Board concluded that the nature, extent, and quality of investment management and support services and of shareholder and administrative services provided to the fund will benefit the fund's shareholders, particularly in light of the Board's view that the fund's shareholders benefit from investing in a fund that is part of a large family of funds offering a variety of investment disciplines and services.
Competitiveness of Management Fee and Total Fund Expenses. The Board considered the fund's management fee and total expenses compared to "mapped groups" of competitive funds and classes. Fidelity creates "mapped groups" by combining similar Lipper investment objective categories that have comparable management fee characteristics. Combining Lipper investment objective categories aids the Board's management fee and total expense comparisons by broadening the competitive group used for comparison and by reducing the number of universes to which various Fidelity funds are compared.
Annual Report
Management Fee. The Board considered two proprietary management fee comparisons for the 12-month (or shorter) periods shown in the chart below. The group of Lipper funds used by the Board for management fee comparisons is referred to below as the "Total Mapped Group." The Total Mapped Group comparison focuses on a fund's standing relative to the total universe of comparable funds available to investors, in terms of gross management fees before expense reimbursements or caps. "TMG %" represents the percentage of funds in the Total Mapped Group that had management fees that were lower than the fund's. For example, a TMG % of 31% means that 69% of the funds in the Total Mapped Group had higher management fees than the fund. The "Asset-Size Peer Group" (ASPG) comparison focuses on a fund's standing relative to non-Fidelity funds similar in size to the fund within the Total Mapped Group. The ASPG represents at least 15% of the funds in the Total Mapped Group with comparable asset size and management fee characteristics, subject to a minimum of 50 funds (or all funds in the Total Mapped Group if fewer than 50). Additional information, such as the ASPG quartile in which the fund's management fee ranked, is also included in the chart and considered by the Board.
VIP Emerging Markets Portfolio
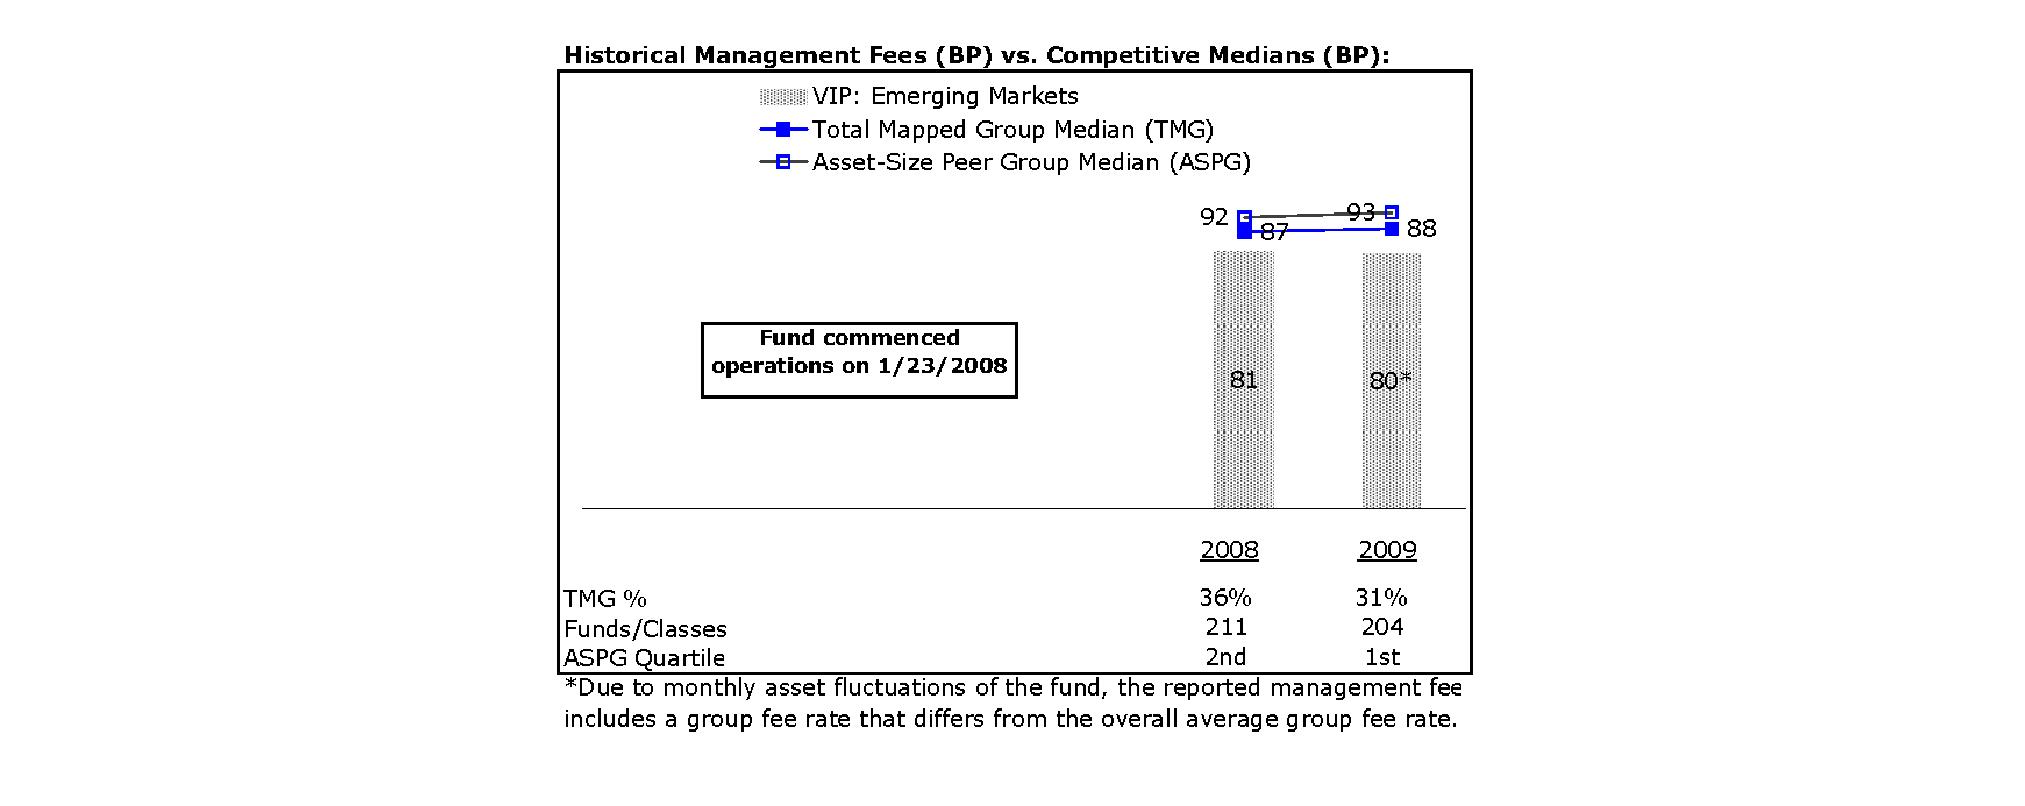
The Board noted that the fund's management fee ranked below the median of its Total Mapped Group and below the median of its ASPG for 2009.
Based on its review, the Board concluded that the fund's management fee is fair and reasonable in light of the services that the fund receives and the other factors considered.
Total Expenses. In its review of each class's total expenses, the Board considered the fund's management fee as well as other fund or class expenses, as applicable, such as transfer agent fees, pricing and bookkeeping fees, fund-paid 12b-1 fees, and custodial, legal, and audit fees. The Board also noted the effects of any waivers and reimbursements on fees and expenses. As part of its review, the Board also considered current and historical total expenses of each class of the fund compared to competitive fund median expenses. Each class of the fund is compared to those funds and classes in the Total Mapped Group (used by the Board for management fee comparisons) that have a similar sales load structure.
The Board noted that the total expenses of each of Initial Class and Initial Class R ranked equal to its competitive median for 2009 and the total expenses of each of Investor Class R, Service Class, Service Class 2, and Service Class 2 R ranked above its competitive median for 2009. The Board considered that the total expenses of Investor Class R were above the median primarily due to its higher transfer agent fee. The Board noted that the fund offers multiple classes, each of which has a different 12b-1 fee structure, and that the multiple structures are intended to offer a range of pricing options for the intermediary market. The Board also noted that the total expenses of the classes vary primarily by the level of their 12b-1 fees, although differences in transfer agent fees may also cause expenses to vary from class to class.
Fees Charged to Other Fidelity Clients. The Board also considered Fidelity fee structures and other information with respect to clients of FMR and its affiliates, such as other mutual funds advised or subadvised by FMR or its affiliates, pension plan clients, and other institutional clients. In March 2010, the Board created an ad hoc joint committee with the board of other Fidelity funds (the Committee) to review and compare Fidelity's institutional investment advisory business with its business of providing services to the Fidelity funds, including the differences in services provided, fees charged, and costs incurred, as well as competition in their respective marketplaces.
Annual Report
Board Approval of Investment Advisory Contracts and Management Fees - continued
Based on its review of total expenses and fees charged to other Fidelity clients, the Board concluded that the total expenses of each class of the fund were reasonable, although in some cases above the median of the universe presented for comparison, in light of the services that the fund and its shareholders receive and the other factors considered, including the findings of the Committee.
Costs of the Services and Profitability. The Board considered the revenues earned and the expenses incurred by Fidelity in conducting the business of developing, marketing, distributing, managing, administering and servicing the fund and its shareholders. The Board also considered the level of Fidelity's profits in respect of all the Fidelity funds.
On an annual basis, FMR presents to the Board Fidelity's profitability for the fund. Fidelity calculates the profitability for each fund, as well as aggregate profitability for groups of Fidelity funds and all Fidelity funds, using a series of detailed revenue and cost allocation methodologies which originate with the audited books and records of Fidelity. The Audit Committee of the Board reviews any significant changes from the prior year's methodologies.
PricewaterhouseCoopers LLP (PwC), independent registered public accounting firm and auditor to Fidelity and certain Fidelity funds, has been engaged annually by the Board as part of the Board's assessment of Fidelity's profitability analysis. PwC's engagement includes the review and assessment of Fidelity's methodologies used in determining the revenues and expenses attributable to Fidelity's mutual fund business, and completion of agreed-upon procedures surrounding the mathematical accuracy of fund profitability and its conformity to allocation methodologies. After considering PwC's reports issued under the engagement and information provided by Fidelity, the Board believes that while other allocation methods may also be reasonable, Fidelity's profitability methodologies are reasonable in all material respects.
The Board has also reviewed Fidelity's non-fund businesses and fall-out benefits related to the mutual fund business as well as cases where Fidelity's affiliates may benefit from or be related to the fund's business.
The Board considered the costs of the services provided by and the profits realized by Fidelity in connection with the operation of the fund and were satisfied that the profitability was not excessive in the circumstances.
Economies of Scale. The Board considered whether there have been economies of scale in respect of the management of the Fidelity funds, whether the Fidelity funds (including the fund) have appropriately benefited from any such economies of scale, and whether there is potential for realization of any further economies of scale. The Board considered the extent to which the fund will benefit from economies of scale through increased services to the fund, through waivers or reimbursements, or through fee or expense reductions.
In February 2009, the Board and the board of other Fidelity funds created an ad hoc committee (the Economies of Scale Committee) to analyze whether FMR attains economies of scale in respect of the management and servicing of the Fidelity funds, whether the Fidelity funds have appropriately benefited from such economies of scale, and whether there is potential for realization of any further economies of scale.
The Board recognized that the fund's management contract incorporates a "group fee" structure, which provides for lower group fee rates as total fund assets under FMR's management increase, and for higher group fee rates as total fund assets under FMR's management decrease. FMR calculates the group fee rates based on a tiered asset "breakpoint" schedule that varies based on asset class. The Board considered that the group fee is designed to deliver the benefits of economies of scale to fund shareholders when total Fidelity fund assets increase, even if assets of any particular fund are unchanged or have declined, because some portion of Fidelity's costs are attributable to services provided to all Fidelity funds, and all funds benefit if those costs can be allocated among more assets. The Board concluded that, given the group fee structure, fund shareholders will benefit from lower management fees as assets under FMR's management increase at the fund complex level, regardless of whether Fidelity achieves any such economies of scale.
The Board concluded, considering the findings of the Economies of Scale Committee, that any potential economies of scale are being appropriately shared between fund shareholders and Fidelity.
Additional Information Requested by the Board. In order to develop fully the factual basis for consideration of the Fidelity funds' Advisory Contracts, the Board requested and received additional information on certain topics, including (i) fund performance trends, actions to be taken by FMR to improve certain funds' overall performance, and Fidelity's long-term strategies for certain funds; (ii) portfolio manager changes that have occurred during the past year and length of portfolio manager tenure for different categories of funds over time; (iii) Fidelity's compensation structure for portfolio managers, research analysts, and other key personnel, the rationale for the compensation structure, and how the compensation structure provides appropriate performance incentives; (iv) the amount of the investment that each portfolio manager has made in the Fidelity fund(s) that he or she manages; (v) management and other fees paid by FMR to affiliated sub-advisers on behalf of the Fidelity funds; (vi) Fidelity's fee structures and rationale for recommending different fees among different categories of funds; (vii) Fidelity's rationale for recommending which funds should have a performance adjustment component as part of their management fees; (viii) the rationale for any differences between fund fee structures and fee structures in place for other Fidelity clients; and (ix) explanations regarding the relative total expenses borne by certain funds and classes, total expense competitive trends, and actions that might be taken by FMR to reduce total expenses for certain funds and classes.
Based on its evaluation of all of the conclusions noted above, and after considering all factors it believed relevant, the Board ultimately concluded that the advisory fee structures are fair and reasonable, and that the fund's Advisory Contracts should be renewed.
Annual Report
Investment Adviser
Fidelity Management & Research Company
Boston, MA
Investment Sub-Advisers
FMR Co., Inc.
Fidelity Management & Research (U.K.) Inc.
Fidelity Management & Research (Hong Kong) Limited
Fidelity Management & Research (Japan) Inc.
FIL Investment Advisors
FIL Investment Advisors (U.K.) Ltd.
FIL Investments (Japan) Limited
General Distributor
Fidelity Distributors Corporation
Boston, MA
Transfer and Service Agents
Fidelity Investments Institutional Operations Company, Inc.
Boston, MA
Fidelity Service Company, Inc.
Boston, MA
Custodian
State Street Bank and Trust Company
Quincy, MA
VIPEM-ANN-0211
1.858135.102
Fidelity® Variable Insurance Products:
Emerging Markets Portfolio - Class R
Annual Report
December 31, 2010
(2_fidelity_logos) (Registered_Trademark)
Contents
Performance | <Click Here> | How the fund has done over time. |
Management's Discussion of Fund Performance | <Click Here> | The Portfolio Manager's review of fund performance and strategy. |
Shareholder Expense Example | <Click Here> | An example of shareholder expenses. |
Investment Changes | <Click Here> | A summary of major shifts in the fund's investments over the past six months. |
Investments | <Click Here> | A complete list of the fund's investments with their market values. |
Financial Statements | <Click Here> | Statements of assets and liabilities, operations, and changes in net assets, as well as financial highlights. |
Notes | <Click Here> | Notes to the financial statements. |
Report of Independent Registered Public Accounting Firm | <Click Here> | |
Trustees and Officers | <Click Here> | |
Distributions | <Click Here> | |
Board Approval of Investment Advisory Contracts and Management Fees | <Click Here> | |
To view a fund's proxy voting guidelines and proxy voting record for the 12-month period ended June 30, visit http://www.fidelity.com/proxyvotingresults or visit the Securities and Exchange Commission's (SEC) web site at http://www.sec.gov. You may also call 1-877-208-0098 to request a free copy of the proxy voting guidelines.
Fidelity Variable Insurance Products are separate account options which are purchased through a variable insurance contract.
Standard & Poor's, S&P and S&P 500 are registered service marks of The McGraw-Hill Companies, Inc. and have been licensed for use by Fidelity Distributors Corporation.
Other third party marks appearing herein are the property of their respective owners.
All other marks appearing herein are registered or unregistered trademarks or service marks of FMR LLC or an affiliated company.
The general research services agreement with Fidelity Research & Analysis Company has been terminated and is no longer in effect for the fund.
This report and the financial statements contained herein are submitted for the general information of the shareholders of the fund. This report is not authorized for distribution to prospective investors in the fund unless preceded or accompanied by an effective prospectus.
A fund files its complete schedule of portfolio holdings with the SEC for the first and third quarters of each fiscal year on Form N-Q. Forms N-Q are available on the SEC's web site at http://www.sec.gov. A fund's Forms N-Q may be reviewed and copied at the SEC's Public Reference Room in Washington, DC. Information regarding the operation of the SEC's Public Reference Room may be obtained by calling 1-800-SEC-0330. For a complete list of a fund's portfolio holdings, view the most recent holdings listing, semiannual report, or annual report on Fidelity's web site at http://www.fidelity.com, http://www.advisor.fidelity.com, or http://www.401k.com, as applicable.
NOT FDIC INSURED • MAY LOSE VALUE • NO BANK GUARANTEE
Neither the fund nor Fidelity Distributors Corporation is a bank.
Annual Report
Average annual total return reflects the change in the value of an investment, assuming reinvestment of the class' distributions from dividend income and capital gains (the profits earned upon the sale of securities that have grown in value, if any) and assuming a constant rate of performance each year. During periods of reimbursement by Fidelity, a fund's total return will be greater than it would be had the reimbursement not occurred. Performance numbers are net of all underlying fund operating expenses, but do not include any insurance charges imposed by your insurance company's separate account. If performance information included the effect of these additional charges, the total returns would have been lower. How a fund did yesterday is no guarantee of how it will do tomorrow.
Average Annual Total Returns
Periods ended December 31, 2010 | Past 1
year | Life of
fund A |
VIP Emerging Markets Portfolio - Initial Class R | 18.01% | 0.87% |
VIP Emerging Markets Portfolio - Service Class 2R | 17.60% | 0.61% |
VIP Emerging Markets Portfolio - Investor Class R | 17.79% | 0.76% |
A From January 23, 2008.
$10,000 Over Life of Fund
Let's say hypothetically that $10,000 was invested in VIP Emerging Markets Portfolio - Initial Class R on January 23, 2008, when the fund started. The chart shows how the value of your investment would have changed, and also shows how the MSCI® Emerging Markets Index performed over the same period.
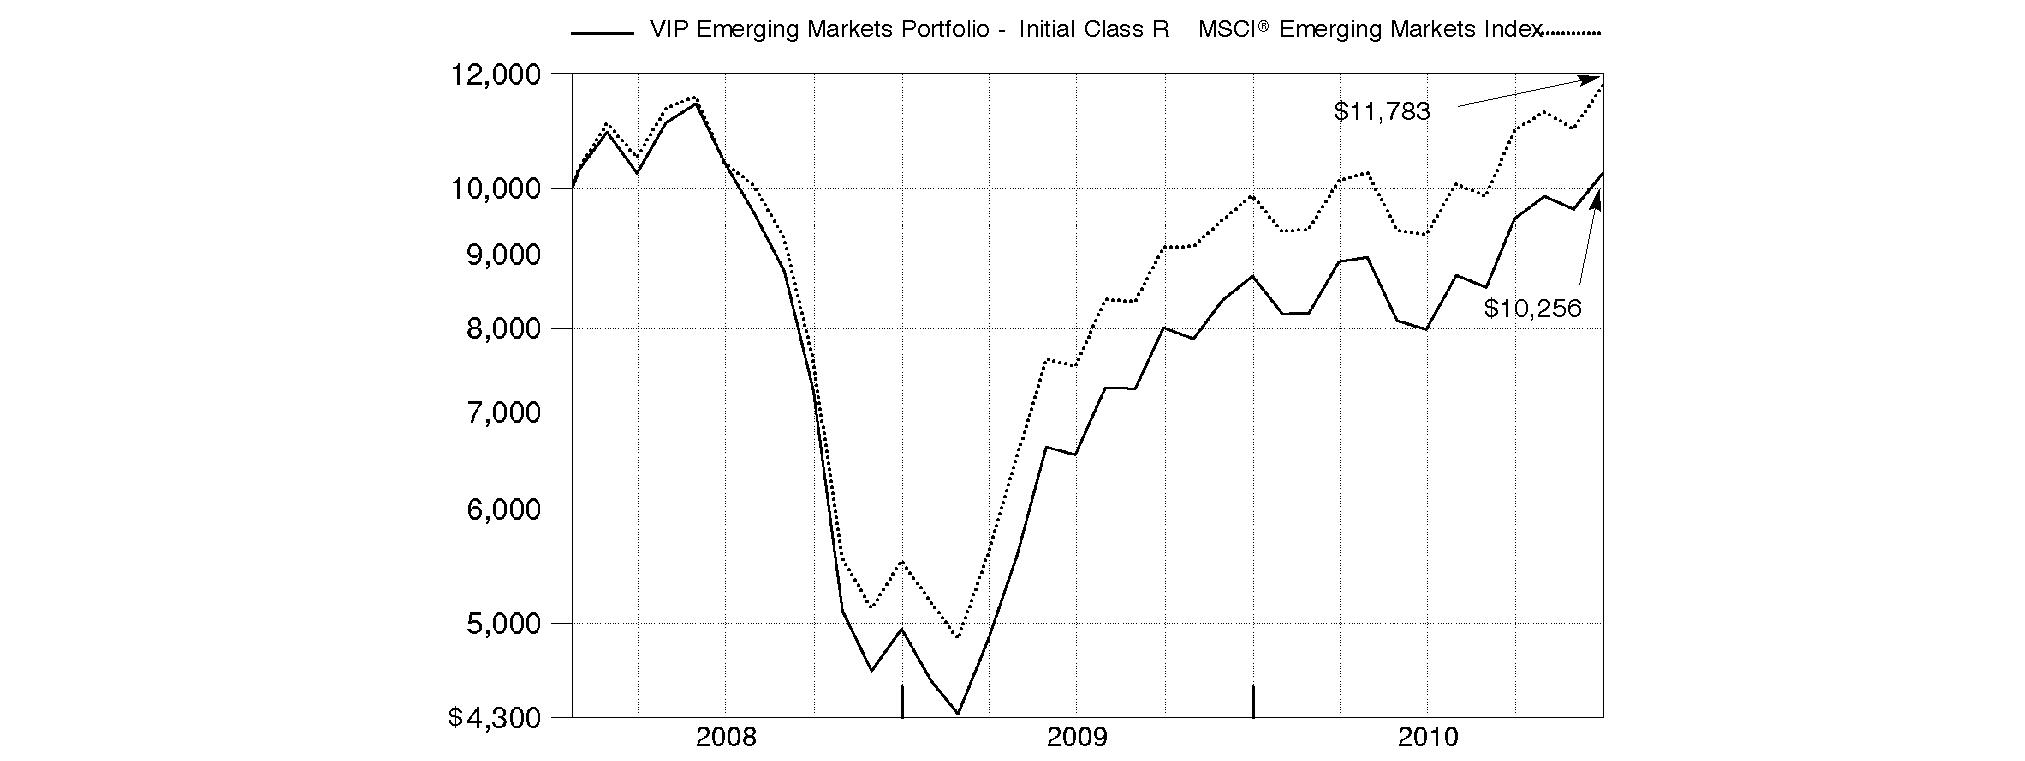
Annual Report
Market Recap: While market improvements around the world hit a speed bump in the first half of the 12-month period ending December 31, 2010, world economies re-accelerated in August, supported by a broadening recovery and low inflation in the U.S. Domestic stock markets recorded solid gains for the year, lifted by a strong second-half rally fueled by economic optimism, encouraging earnings reports and a wave of corporate mergers. The large-cap S&P 500® Index rose 15.06%, the blue-chip-laden Dow Jones Industrial AverageSM added 14.06% and the technology-heavy Nasdaq Composite® Index climbed 18.02%. Meanwhile, international stocks, as represented by the MSCI® ACWI® (All Country World Index) ex USA Index, gained 11.29%, boosted in part by a depreciating U.S. dollar. In the fixed-income arena, U.S. taxable investment-grade bonds generated positive results during 2010, as the Barclays Capital® U.S. Aggregate Bond Index gained 6.54%. With ultra-low interest rates bolstering nearly all fixed-income securities for most of the year, sectors in the index with higher yields and more credit risk generally fared best, while most high-quality bonds generated more-moderate returns. Meanwhile, high-yield bonds, as represented by The BofA Merrill LynchSM US High Yield Constrained Index, returned 15.07%, a result of improved economic data and strengthening investor demand. Overseas, foreign bond markets showed mixed results, with a sizable disparity between the 3.97% return of the Citigroup® Non-U.S. Group of 7 Index - which measures the performance of sovereign debt of the major global economies outside the U.S. - and the 12.04% advance of the JPMorgan Emerging Markets Bond Index Global (EMBI Global), which benefited from the rising overall credit quality of emerging-markets debt issuers.
Comments from Robert von Rekowsky, Portfolio Manager of VIP Emerging Markets Portfolio: During the past year, the fund's share classes trailed the 19.20% return of the MSCI® Emerging Markets Index. (For specific portfolio results, please refer to the performance section of this report.) Weak stock selection in telecommunication services and the banking segment of financials weighed on relative performance. In industrials, unrewarding security selection and an underweighting in capital goods, a group I added to during the period, also detracted. A modest cash position in a rising market had a negative impact as well. Geographically, security selection in Brazil worked against the fund's results. At the stock level, Russian oil exploration and production stock Rosneft was our largest relative detractor, as a drop in crude oil prices in the first half of the period weighed on the position. An out-of-index stake in Australia-based Aquarius Platinum, with operations in South Africa, also hampered performance. Other detractors included untimely ownership of China Construction Bank and China's Geely Auto Holdings, as well as underweighting index component Taiwan Semiconductor Manufacturing. Conversely, stock picking in information technology bolstered fund performance, as did a combination of favorable picks and an overweighting in consumer discretionary. From a country standpoint, security selection in Russia and positioning in China aided performance. Taiwan-based wireless handset maker HTC benefited from robust global demand for handsets running Google's AndroidTM operating system. Not owning index component China Life Insurance also was a good call, as the stock finished the period with a double-digit loss. Likewise, not owning South Korean steel maker POSCO - another index component - was beneficial, given China's slackening demand for imported steel. Meanwhile, overweighted exposure to Russian natural gas producer NOVATEK, which saw its share price rise by more than 82%, bolstered fund performance. The company acquired new acreage for exploration and gained share in a market with relatively flat demand.
The views expressed above reflect those of the portfolio manager(s) only through the end of the period as stated on the cover of this report and do not necessarily represent the views of Fidelity or any other person in the Fidelity organization. Any such views are subject to change at any time based upon market or other conditions and Fidelity disclaims any responsibility to update such views. These views may not be relied on as investment advice and, because investment decisions for a Fidelity fund are based on numerous factors, may not be relied on as an indication of trading intent on behalf of any Fidelity fund.
Annual Report
As a shareholder of the Fund, you incur two types of costs: (1) transaction costs, including redemption fees, and (2) ongoing costs, including management fees, distribution and/or service (12b-1) fees and other Fund expenses. This Example is intended to help you understand your ongoing costs (in dollars) of investing in the Fund and to compare these costs with the ongoing costs of investing in other mutual funds.
The Example is based on an investment of $1,000 invested at the beginning of the period and held for the entire period (July 1, 2010 to December 31, 2010).
Actual Expenses
The first line of the accompanying table for each class of the Fund provides information about actual account values and actual expenses. You may use the information in this line, together with the amount you invested, to estimate the expenses that you paid over the period. Simply divide your account value by $1,000.00 (for example, an $8,600 account value divided by $1,000.00 = 8.6), then multiply the result by the number in the first line for a class of the Fund under the heading entitled "Expenses Paid During Period" to estimate the expenses you paid on your account during this period. The estimate of expenses does not include any fees or other expenses of any variable annuity or variable life insurance product. If they were, the estimate of expenses you paid during the period would be higher, and your ending account value would be lower. In addition, the Fund, as a shareholder in the underlying Fidelity Central Funds, will indirectly bear its pro-rata share of the fees and expenses incurred by the underlying Fidelity Central Funds. These fees and expenses are not included in the Fund's annualized expense ratio used to calculate the expense estimate in the table below.
Hypothetical Example for Comparison Purposes
The second line of the accompanying table for each class of the Fund provides information about hypothetical account values and hypothetical expenses based on a Class' actual expense ratio and an assumed rate of return of 5% per year before expenses, which is not the Class' actual return. The hypothetical account values and expenses may not be used to estimate the actual ending account balance or expenses you paid for the period. You may use this information to compare the ongoing costs of investing in the Fund and other funds. To do so, compare this 5% hypothetical example with the 5% hypothetical examples that appear in the shareholder reports of the other funds. The estimate of expenses does not include any fees or other expenses of any variable annuity or variable life insurance product. If they were, the estimate of expenses you paid during the period would be higher, and your ending account value would be lower. In addition, the Fund, as a shareholder in the underlying Fidelity Central Funds, will indirectly bear its pro-rata share of the fees and expenses incurred by the underlying Fidelity Central Funds. These fees and expenses are not included in the Fund's annualized expense ratio used to calculate the expense estimate in the table below.
Please note that the expenses shown in the table are meant to highlight your ongoing costs only and do not reflect any transaction costs. Therefore, the second line of the table is useful in comparing ongoing costs only, and will not help you determine the relative total costs of owning different funds. In addition, if these transactional costs were included, your costs would have been higher.
| Annualized
Expense Ratio | Beginning
Account Value
July 1, 2010 | Ending
Account Value
December 31, 2010 | Expenses Paid
During Period*
July 1, 2010 to December 31, 2010 |
Initial Class | 1.10% | | | |
Actual | | $ 1,000.00 | $ 1,282.40 | $ 6.33 |
HypotheticalA | | $ 1,000.00 | $ 1,019.66 | $ 5.60 |
Service Class | 1.20% | | | |
Actual | | $ 1,000.00 | $ 1,281.60 | $ 6.90 |
HypotheticalA | | $ 1,000.00 | $ 1,019.16 | $ 6.11 |
Service Class 2 | 1.35% | | | |
Actual | | $ 1,000.00 | $ 1,281.60 | $ 7.76 |
HypotheticalA | | $ 1,000.00 | $ 1,018.40 | $ 6.87 |
Initial Class R | 1.10% | | | |
Actual | | $ 1,000.00 | $ 1,283.70 | $ 6.33 |
HypotheticalA | | $ 1,000.00 | $ 1,019.66 | $ 5.60 |
Service Class 2R | 1.35% | | | |
Actual | | $ 1,000.00 | $ 1,281.90 | $ 7.76 |
HypotheticalA | | $ 1,000.00 | $ 1,018.40 | $ 6.87 |
Investor Class R | 1.18% | | | |
Actual | | $ 1,000.00 | $ 1,281.50 | $ 6.79 |
HypotheticalA | | $ 1,000.00 | $ 1,019.26 | $ 6.01 |
A 5% return per year before expenses
* Expenses are equal to each Class' annualized expense ratio, multiplied by the average account value over the period, multiplied by 184/365 (to reflect the one-half year period).
Annual Report
Investment Changes (Unaudited)
Geographic Diversification (% of fund's net assets) |
As of December 31, 2010 |
| Brazil | 13.4% | |
| Korea (South) | 12.9% | |
| Russia | 8.7% | |
| Taiwan | 8.4% | |
| China | 8.2% | |
| India | 6.6% | |
| South Africa | 6.4% | |
| Indonesia | 5.5% | |
| Hong Kong | 3.7% | |
| Other* | 26.2% | |

* Includes short term investments and other assets. |
Percentages are adjusted for the effect of futures contracts, if applicable. |
As of June 30, 2010 |
| Brazil | 13.6% | |
| Korea (South) | 12.6% | |
| Russia | 8.7% | |
| South Africa | 8.1% | |
| India | 7.0% | |
| China | 6.8% | |
| Indonesia | 5.7% | |
| Taiwan | 5.7% | |
| Hong Kong | 5.3% | |
| Other* | 26.5% | |

* Includes short term investments and other assets. |
Percentages are adjusted for the effect of futures contracts, if applicable. |
Asset Allocation |
| % of fund's
net assets | % of fund's net assets
6 months ago |
Stocks | 99.0 | 96.4 |
Short-Term Investments and Net Other Assets | 1.0 | 3.6 |
Top Ten Stocks as of December 31, 2010 |
| % of fund's
net assets | % of fund's net assets
6 months ago |
Samsung Electronics Co. Ltd. (Korea (South), Semiconductors & Semiconductor Equipment) | 2.4 | 2.3 |
America Movil SAB de CV Series L sponsored ADR (Mexico, Wireless Telecommunication Services) | 2.1 | 1.8 |
Vale SA (PN-A) sponsored ADR (Brazil, Metals & Mining) | 2.0 | 2.9 |
CNOOC Ltd. (Hong Kong, Oil, Gas & Consumable Fuels) | 2.0 | 1.9 |
Banco Bradesco SA (PN) sponsored ADR (Brazil, Commercial Banks) | 1.7 | 1.3 |
Industrial & Commercial Bank of China Ltd. (H Shares) (China, Commercial Banks) | 1.7 | 1.7 |
Sberbank (Russia, Savings Bank of the Russian Federation) (Russia, Commercial Banks) | 1.4 | 1.5 |
China Construction Bank Corp. (H Shares) (China, Commercial Banks) | 1.4 | 0.0 |
HTC Corp. (Taiwan, Communications Equipment) | 1.3 | 0.7 |
Petroleo Brasileiro SA - Petrobras (PN) (non-vtg.) (Brazil, Oil, Gas & Consumable Fuels) | 1.2 | 1.8 |
| 17.2 | |
Market Sectors as of December 31, 2010 |
| % of fund's
net assets | % of fund's net assets
6 months ago |
Financials | 24.3 | 22.7 |
Materials | 17.0 | 15.0 |
Energy | 13.8 | 13.2 |
Information Technology | 10.9 | 12.3 |
Consumer Discretionary | 10.6 | 8.6 |
Industrials | 7.1 | 5.2 |
Telecommunication Services | 6.6 | 9.4 |
Consumer Staples | 5.5 | 4.7 |
Utilities | 1.8 | 3.0 |
Health Care | 1.4 | 2.3 |
Annual Report
Investments December 31, 2010
Showing Percentage of Net Assets
Common Stocks - 99.0% |
| Shares | | Value |
Argentina - 0.4% |
Banco Macro SA sponsored ADR | 7,500 | | $ 376,500 |
Austria - 0.3% |
Erste Bank AG | 6,700 | | 314,781 |
Bahamas (Nassau) - 0.3% |
Petrominerales Ltd. | 11,000 | | 365,748 |
Bailiwick of Jersey - 0.7% |
Heritage Oil PLC | 43,239 | | 302,690 |
Randgold Resources Ltd. sponsored ADR | 4,200 | | 345,786 |
West China Cement Ltd. (a) | 266,000 | | 97,536 |
TOTAL BAILIWICK OF JERSEY | | 746,012 |
Bermuda - 2.4% |
Aquarius Platinum Ltd. (Australia) | 82,011 | | 448,280 |
Cheung Kong Infrastructure Holdings Ltd. | 33,000 | | 151,148 |
China Yurun Food Group Ltd. | 142,000 | | 466,787 |
Credicorp Ltd. (NY Shares) | 3,500 | | 416,185 |
Orient Overseas International Ltd. | 59,000 | | 572,351 |
Shenzhen International Holdings Ltd. | 2,580,000 | | 219,080 |
Sparkle Roll Group Ltd. | 272,000 | | 50,393 |
Texwinca Holdings Ltd. | 128,000 | | 162,213 |
TOTAL BERMUDA | | 2,486,437 |
Brazil - 13.4% |
AES Tiete SA (PN) (non-vtg.) | 12,300 | | 177,880 |
Anhanguera Educacional Participacoes SA | 3,100 | | 74,719 |
Banco Bradesco SA (PN) sponsored ADR | 86,840 | | 1,761,984 |
Banco do Brasil SA | 36,700 | | 694,835 |
Banco do Estado do Rio Grande do Sul SA | 23,200 | | 246,742 |
Brasil Insurance Participacoes e Administracao SA | 100 | | 119,309 |
Cia Hering SA | 8,500 | | 138,291 |
Companhia Brasileira de Distribuicao Grupo Pao de Acucar sponsored ADR (d) | 8,800 | | 369,424 |
Companhia de Bebidas das Americas (AmBev) (PN) sponsored ADR | 31,000 | | 961,930 |
Companhia Energetica de Minas Gerais (CEMIG) (PN) sponsored ADR (non-vtg.) | 82 | | 1,360 |
Companhia Siderurgica Nacional SA (CSN) sponsored ADR (d) | 45,300 | | 755,151 |
Confab Industrial SA (PN) (non-vtg.) | 14,800 | | 54,400 |
Drogasil SA | 17,100 | | 139,104 |
Eletropaulo Metropolitana SA (PN-B) | 11,200 | | 216,705 |
Estacio Participacoes SA | 9,700 | | 157,814 |
Even Construtora e Incorporadora SA | 11,300 | | 58,558 |
Fleury SA | 6,700 | | 107,592 |
Gafisa SA sponsored ADR (d) | 15,041 | | 218,546 |
Light SA | 12,000 | | 183,881 |
Lojas Renner SA | 11,700 | | 397,626 |
Natura Cosmeticos SA | 18,100 | | 520,134 |
|
| Shares | | Value |
OGX Petroleo e Gas Participacoes SA (a) | 79,100 | | $ 953,270 |
PDG Realty SA Empreendimentos e Participacoes | 82,200 | | 503,240 |
Petroleo Brasileiro SA - Petrobras: | | | |
(ON) sponsored ADR | 8,700 | | 329,208 |
(PN) (non-vtg.) | 40,000 | | 657,769 |
(PN) sponsored ADR (non-vtg.) | 37,948 | | 1,296,683 |
SLC Agricola SA | 11,900 | | 157,754 |
Tegma Gestao Logistica | 8,400 | | 128,818 |
TIM Participacoes SA sponsored ADR (non-vtg.) | 14,400 | | 491,616 |
Vale SA (PN-A) sponsored ADR | 67,974 | | 2,054,174 |
TOTAL BRAZIL | | 13,928,517 |
British Virgin Islands - 0.3% |
Camelot Information Systems, Inc. ADR | 4,935 | | 118,045 |
Mail.ru Group Ltd. GDR unit (a)(e) | 5,800 | | 208,800 |
TOTAL BRITISH VIRGIN ISLANDS | | 326,845 |
Canada - 1.6% |
China Gold International Resources Corp. Ltd. (a) | 4,000 | | 21,615 |
Eldorado Gold Corp. | 25,094 | | 465,496 |
First Quantum Minerals Ltd. | 4,100 | | 443,999 |
First Uranium Corp. (a)(d) | 133,000 | | 178,703 |
Niko Resources Ltd. | 2,000 | | 206,919 |
Pacific Rubiales Energy Corp. | 3,100 | | 104,908 |
Uranium One, Inc. | 47,800 | | 228,144 |
TOTAL CANADA | | 1,649,784 |
Cayman Islands - 3.3% |
3SBio, Inc. sponsored ADR (a) | 8,811 | | 133,751 |
Alibaba.com Ltd. | 59,500 | | 106,713 |
Bitauto Holdings Ltd. ADR | 8,500 | | 75,140 |
China Shanshui Cement Group Ltd. | 476,000 | | 339,891 |
China ZhengTong Auto Services Holdings Ltd. | 106,500 | | 100,437 |
Country Garden Holdings Co. Ltd. | 278,000 | | 106,586 |
Daphne International Holdings Ltd. | 54,000 | | 50,578 |
E-Commerce China Dangdang, Inc. ADR | 4,400 | | 119,108 |
Eurasia Drilling Co. Ltd. GDR (Reg. S) | 16,185 | | 526,013 |
EVA Precision Industrial Holdings Ltd. | 308,000 | | 297,202 |
Geely Automobile Holdings Ltd. | 95,000 | | 41,557 |
Hidili Industry International Development Ltd. | 277,000 | | 234,145 |
hiSoft Technology International Ltd. ADR (a) | 1,700 | | 51,340 |
International Mining Machinery Holdings Ltd. | 195,000 | | 157,806 |
Kingboard Chemical Holdings Ltd. | 85,500 | | 512,065 |
Kingboard Chemical Holdings Ltd. warrants 10/31/12 (a) | 5,000 | | 5,307 |
Microport Scientific Corp. | 3,000 | | 2,872 |
Sany Heavy Equipment International Holdings Co. Ltd. | 99,000 | | 145,968 |
Common Stocks - continued |
| Shares | | Value |
Cayman Islands - continued |
Shenguan Holdings Group Ltd. | 194,000 | | $ 254,091 |
Trina Solar Ltd. ADR (a) | 6,100 | | 142,862 |
TOTAL CAYMAN ISLANDS | | 3,403,432 |
Chile - 0.2% |
Empresas La Polar SA | 28,137 | | 203,813 |
China - 8.2% |
Anhui Expressway Co. Ltd. (H Shares) | 174,000 | | 152,677 |
Baidu.com, Inc. sponsored ADR (a) | 3,850 | | 371,641 |
Changsha Zoomlion Heavy Industry Science & Technology Development Co. Ltd. (H Shares) | 52,000 | | 117,481 |
China Communications Services Corp. Ltd. (H Shares) | 264,000 | | 157,262 |
China Construction Bank Corp. (H Shares) | 1,571,000 | | 1,408,796 |
China Merchants Bank Co. Ltd. (H Shares) | 260,356 | | 657,213 |
China Minsheng Banking Corp. Ltd. (H Shares) | 335,500 | | 287,047 |
Chongqing Rural Commercial Bank Co. Ltd. (H Shares) | 157,000 | | 105,643 |
Digital China Holdings Ltd. (H Shares) | 100,000 | | 187,070 |
Dongfeng Motor Group Co. Ltd. (H Shares) | 130,000 | | 224,124 |
Golden Eagle Retail Group Ltd. (H Shares) | 143,000 | | 352,510 |
Harbin Power Equipment Co. Ltd. (H Shares) | 272,000 | | 429,041 |
Industrial & Commercial Bank of China Ltd. (H Shares) | 2,327,070 | | 1,733,514 |
Minth Group Ltd. | 217,000 | | 356,246 |
Ping An Insurance Group Co. China Ltd. (H Shares) | 90,500 | | 1,011,830 |
Weichai Power Co. Ltd. (H Shares) | 40,000 | | 246,253 |
Yantai Changyu Pioneer Wine Co. (B Shares) | 57,199 | | 608,749 |
Zhaojin Mining Industry Co. Ltd. (H Shares) | 15,000 | | 61,370 |
TOTAL CHINA | | 8,468,467 |
Colombia - 0.6% |
BanColombia SA sponsored ADR | 1,600 | | 99,056 |
Ecopetrol SA ADR (d) | 13,400 | | 584,508 |
TOTAL COLOMBIA | | 683,564 |
Czech Republic - 0.6% |
Komercni Banka AS | 2,800 | | 663,426 |
Egypt - 0.6% |
Commercial International Bank Ltd. sponsored GDR | 77,830 | | 649,881 |
Georgia - 0.2% |
Bank of Georgia unit (a) | 9,448 | | 190,850 |
|
| Shares | | Value |
Hong Kong - 3.7% |
China Mobile (Hong Kong) Ltd. | 118,000 | | $ 1,169,999 |
CNOOC Ltd. | 632,000 | | 1,504,425 |
CNOOC Ltd. sponsored ADR | 2,300 | | 548,251 |
I.T Ltd. | 152,000 | | 115,186 |
Shanghai Industrial Holdings Ltd. | 114,000 | | 492,814 |
TOTAL HONG KONG | | 3,830,675 |
India - 6.6% |
Adani Enterprises Ltd. | 21,974 | | 319,394 |
Apollo Tyres Ltd. | 64,943 | | 96,879 |
Bank of Baroda | 28,703 | | 595,780 |
BGR Energy Systems Ltd. | 8,311 | | 135,058 |
Idea Cellular Ltd. (a) | 121,331 | | 188,730 |
Indian Oil Corp. Ltd. | 36,476 | | 279,326 |
Indian Overseas Bank | 78,970 | | 258,921 |
Infosys Technologies Ltd. sponsored ADR | 15,582 | | 1,185,479 |
Infrastructure Development Finance Co. Ltd. | 122,943 | | 502,083 |
Jain Irrigation Systems Ltd. | 80,480 | | 378,348 |
JSW Steel Ltd. | 19,409 | | 510,939 |
LIC Housing Finance Ltd. | 15,590 | | 68,131 |
Radico Khaitan Ltd. | 14,779 | | 52,026 |
Reliance Industries Ltd. | 17,528 | | 415,027 |
Rural Electrification Corp. Ltd. | 44,753 | | 299,371 |
Shree Renuka Sugars Ltd. | 25,927 | | 56,304 |
Shriram Transport Finance Co. Ltd. | 11,314 | | 197,636 |
Tata Consultancy Services Ltd. | 35,482 | | 925,012 |
Tata Steel Ltd. | 14,506 | | 220,741 |
Ultratech Cement Ltd. | 8,226 | | 199,475 |
TOTAL INDIA | | 6,884,660 |
Indonesia - 5.5% |
PT Astra International Tbk | 117,500 | | 711,391 |
PT Bank Mandiri (Persero) Tbk | 234,500 | | 169,173 |
PT Bank Negara Indonesia (Persero) Tbk | 551,500 | | 237,188 |
PT Bank Rakyat Indonesia Tbk | 559,000 | | 651,444 |
PT Bank Tabungan Negara Tbk | 581,000 | | 105,754 |
PT Bumi Serpong Damai Tbk | 1,288,000 | | 128,657 |
PT Ciputra Development Tbk (a) | 1,939,500 | | 75,341 |
PT Delta Dunia Petroindo Tbk (a) | 1,165,000 | | 208,175 |
PT Gudang Garam Tbk | 81,500 | | 361,821 |
PT Indo Tambangraya Megah Tbk | 55,000 | | 309,795 |
PT Indocement Tunggal Prakarsa Tbk | 296,500 | | 524,882 |
PT Indofood Sukses Makmur Tbk | 956,500 | | 517,530 |
PT Kalbe Farma Tbk | 601,000 | | 216,787 |
PT Mitra Adiperkasa Tbk | 169,500 | | 50,323 |
PT Perusahaan Gas Negara Tbk Series B | 1,144,800 | | 562,236 |
PT Tambang Batubbara Bukit Asam Tbk | 84,000 | | 213,963 |
PT Tower Bersama Infrastructure Tbk | 874,500 | | 242,648 |
PT XL Axiata Tbk (a) | 654,000 | | 384,707 |
TOTAL INDONESIA | | 5,671,815 |
Common Stocks - continued |
| Shares | | Value |
Isle of Man - 0.1% |
Bahamas Petroleum Co. PLC (a) | 305,100 | | $ 72,590 |
Kazakhstan - 0.5% |
KazMunaiGas Exploration & Production JSC (Reg. S) GDR | 26,100 | | 517,563 |
Korea (South) - 12.9% |
Busan Bank | 16,500 | | 211,171 |
CJ CGV Co. Ltd. | 1,740 | | 43,452 |
CJ Corp. | 5,887 | | 414,256 |
Daegu Bank Co. Ltd. | 14,810 | | 206,052 |
Daelim Industrial Co. | 2,797 | | 293,108 |
DC Chemical Co. Ltd. | 1,230 | | 362,007 |
Doosan Co. Ltd. | 1,673 | | 229,781 |
GS Holdings Corp. | 8,272 | | 481,012 |
Hanjin Heavy Industries & Consolidated Co. Ltd. | 9,090 | | 306,446 |
Honam Petrochemical Corp. | 2,283 | | 547,717 |
Hynix Semiconductor, Inc. (a) | 4,970 | | 106,381 |
Hyundai Department Store Co. Ltd. | 1,743 | | 216,855 |
Hyundai Heavy Industries Co. Ltd. | 2,306 | | 911,089 |
Hyundai Mobis | 3,474 | | 881,474 |
Hyundai Motor Co. | 8,071 | | 1,248,891 |
Hyundai Steel Co. | 3,961 | | 439,817 |
Industrial Bank of Korea | 45,330 | | 758,027 |
Kia Motors Corp. | 16,500 | | 744,616 |
KT Corp. | 9,950 | | 409,015 |
LG Chemical Ltd. | 2,162 | | 753,928 |
Paradise Co. Ltd. | 14,000 | | 49,882 |
Samsung Electronics Co. Ltd. | 2,905 | | 2,458,719 |
Shinhan Financial Group Co. Ltd. | 22,060 | | 1,040,780 |
Tong Yang Securities, Inc. | 20,960 | | 186,000 |
Young Poong Precision Corp. | 4,384 | | 45,160 |
TOTAL KOREA (SOUTH) | | 13,345,636 |
Lebanon - 0.0% |
BLOM Bank SAL GDR | 4,370 | | 45,448 |
Luxembourg - 0.9% |
Evraz Group SA GDR (a) | 14,784 | | 530,302 |
Millicom International Cellular SA | 3,800 | | 363,280 |
TOTAL LUXEMBOURG | | 893,582 |
Malaysia - 0.8% |
AirAsia Bhd (a) | 149,700 | | 122,828 |
Axiata Group Bhd (a) | 321,000 | | 494,487 |
RHB Capital Bhd | 67,400 | | 190,604 |
TOTAL MALAYSIA | | 807,919 |
Mexico - 3.4% |
America Movil SAB de CV Series L sponsored ADR | 37,844 | | 2,169,975 |
Compartamos SAB de CV | 208,000 | | 452,566 |
|
| Shares | | Value |
Genomma Lab Internacional SA de CV (a) | 73,100 | | $ 175,104 |
Grupo Televisa SA de CV (CPO) sponsored ADR | 27,622 | | 716,238 |
TOTAL MEXICO | | 3,513,883 |
Nigeria - 0.3% |
Guaranty Trust Bank PLC GDR (Reg. S) | 50,375 | | 297,213 |
Norway - 0.1% |
Det Norske Oljeselskap ASA (DNO) (A Shares) (a) | 54,600 | | 85,004 |
Peru - 0.6% |
Compania de Minas Buenaventura SA sponsored ADR | 12,390 | | 606,614 |
Grana y Montero SA | 22,533 | | 53,397 |
TOTAL PERU | | 660,011 |
Qatar - 0.2% |
Commercial Bank of Qatar GDR (Reg. S) | 52,974 | | 267,707 |
Russia - 8.7% |
Cherkizovo Group OJSC GDR (a) | 9,400 | | 178,637 |
LSR Group OJSC GDR (Reg. S) (a) | 12,700 | | 116,967 |
Magnit OJSC GDR (Reg. S) | 19,400 | | 568,420 |
Mechel Steel Group OAO sponsored ADR | 19,700 | | 575,831 |
Novolipetsk Steel Ojsc (a) | 26,800 | | 126,800 |
OAO Gazprom sponsored ADR | 26,000 | | 661,440 |
OAO NOVATEK GDR | 9,922 | | 1,185,679 |
OAO Raspadskaya (a) | 25,500 | | 179,035 |
OAO Tatneft sponsored ADR | 19,476 | | 644,656 |
OJSC Oil Co. Rosneft GDR (Reg. S) | 137,500 | | 984,500 |
Polymetal JSC GDR (Reg. S) (a) | 30,888 | | 565,559 |
RusHydro JSC: | | | |
rights 6/30/10 (a) | 15,118 | | 807 |
rights 1/13/11 (a) | 454 | | 79 |
rights 6/30/11 (a) | 97 | | 0 |
sponsored ADR (a) | 85,944 | | 468,395 |
Sberbank (Savings Bank of the Russian Federation) (a) | 319,300 | | 1,089,778 |
Sberbank (Savings Bank of the Russian Federation) GDR | 950 | | 407,083 |
Severstal JSC (a) | 14,200 | | 240,648 |
Sistema JSFC sponsored GDR | 20,175 | | 502,963 |
TGK-1 OAO (a) | 121,003,300 | | 85,077 |
Uralkali JSC GDR (Reg. S) | 13,000 | | 477,360 |
TOTAL RUSSIA | | 9,059,714 |
Singapore - 0.9% |
Keppel Corp. Ltd. | 48,000 | | 423,425 |
Straits Asia Resources Ltd. | 198,000 | | 384,196 |
Yanlord Land Group Ltd. | 70,000 | | 91,642 |
TOTAL SINGAPORE | | 899,263 |
Common Stocks - continued |
| Shares | | Value |
South Africa - 6.4% |
African Bank Investments Ltd. | 120,600 | | $ 705,396 |
African Rainbow Minerals Ltd. | 19,859 | | 629,793 |
AngloGold Ashanti Ltd. | 12,100 | | 596,868 |
AngloGold Ashanti Ltd. sponsored ADR | 7,600 | | 374,148 |
Aspen Pharmacare Holdings Ltd. | 28,699 | | 398,580 |
Clicks Group Ltd. | 49,186 | | 321,769 |
Foschini Ltd. | 39,740 | | 539,864 |
Imperial Holdings Ltd. | 13,340 | | 256,692 |
Mr Price Group Ltd. | 48,717 | | 489,008 |
Mvelaphanda Resources Ltd. (a) | 61,987 | | 467,639 |
Shoprite Holdings Ltd. | 28,188 | | 423,990 |
Standard Bank Group Ltd. | 53,747 | | 872,527 |
Wilson Bayly Holmes-Ovcon Ltd. | 7,535 | | 158,093 |
Woolworths Holdings Ltd. | 110,850 | | 450,762 |
TOTAL SOUTH AFRICA | | 6,685,129 |
Taiwan - 8.4% |
Advanced Semiconductor Engineering, Inc. | 102,291 | | 117,911 |
Advanced Semiconductor Engineering, Inc. sponsored ADR (d) | 108,753 | | 624,242 |
Chroma ATE, Inc. | 85,170 | | 254,313 |
Edison Opto Corp. | 8,776 | | 52,650 |
Farglory Land Development Co. Ltd. | 78,000 | | 209,907 |
Formosa Plastics Corp. | 305,000 | | 1,019,455 |
Fubon Financial Holding Co. Ltd. | 593,329 | | 813,615 |
HTC Corp. | 45,150 | | 1,393,041 |
Huaku Development Co. Ltd. | 53,000 | | 160,617 |
Kinsus Interconnect Technology Corp. | 29,000 | | 98,423 |
Macronix International Co. Ltd. | 827,506 | | 578,715 |
Pegatron Corp. (a) | 261,000 | | 375,797 |
Ruentex Development Co. Ltd. | 211,000 | | 371,076 |
Taishin Financial Holdings Co. Ltd. | 1,435,850 | | 849,106 |
Taiwan Cement Corp. | 413,825 | | 465,323 |
Taiwan Semiconductor Manufacturing Co. Ltd. | 222,609 | | 541,646 |
Unimicron Technology Corp. | 51,000 | | 99,308 |
Wistron Corp. | 342,774 | | 698,004 |
TOTAL TAIWAN | | 8,723,149 |
Thailand - 1.7% |
Advanced Info Service PCL (For. Reg.) | 124,200 | | 350,964 |
Banpu PCL (For. Reg.) | 10,900 | | 286,995 |
BEC World PCL (For. Reg.) | 198,100 | | 209,098 |
PTT PCL (For. Reg.) | 34,500 | | 367,021 |
Siam Commercial Bank PCL (For. Reg.) | 161,300 | | 555,005 |
Total Access Communication PCL (For. Reg.) | 400 | | 559 |
TOTAL THAILAND | | 1,769,642 |
Turkey - 2.0% |
Dogus Otomotiv Servis ve Ticaret AS | 13,000 | | 55,814 |
Sinpas Gayrimenkul Yatirim Ortakligi AS | 81,000 | | 109,268 |
|
| Shares | | Value |
Tofas Turk Otomobil Fabrikasi AS | 38,658 | | $ 199,570 |
Turk Hava Yollari AO | 159,285 | | 557,844 |
Turkiye Garanti Bankasi AS | 186,000 | | 943,330 |
Turkiye Halk Bankasi AS | 20,000 | | 169,920 |
TOTAL TURKEY | | 2,035,746 |
United Kingdom - 1.2% |
Eurasian Natural Resources Corp. PLC | 19,801 | | 323,754 |
Hikma Pharmaceuticals PLC | 28,642 | | 362,625 |
Xstrata PLC | 23,651 | | 555,516 |
TOTAL UNITED KINGDOM | | 1,241,895 |
United States of America - 1.0% |
Central European Distribution Corp. (a) | 6,500 | | 148,850 |
China Agritech, Inc. (a)(d) | 3,700 | | 45,399 |
China Valves Technology, Inc. (a)(d) | 9,378 | | 98,281 |
CTC Media, Inc. | 6,339 | | 148,523 |
Freeport-McMoRan Copper & Gold, Inc. | 4,700 | | 564,423 |
TOTAL UNITED STATES OF AMERICA | | 1,005,476 |
TOTAL COMMON STOCKS (Cost $79,699,600) | 102,771,777 |
Money Market Funds - 2.4% |
| | | |
Fidelity Cash Central Fund, 0.19% (b) | 363,328 | | 363,328 |
Fidelity Securities Lending Cash Central Fund, 0.21% (b)(c) | 2,174,100 | | 2,174,100 |
TOTAL MONEY MARKET FUNDS (Cost $2,537,428) | 2,537,428 |
Cash Equivalents - 0.1% |
| Maturity Amount | | |
Investments in repurchase agreements in a joint trading account at 0.2%, dated 12/31/10 due 1/3/11 (Collateralized by U.S. Treasury Obligations) #
(Cost $49,000) | $ 49,001 | | 49,000 |
TOTAL INVESTMENT PORTFOLIO - 101.5% (Cost $82,286,028) | | 105,358,205 |
NET OTHER ASSETS (LIABILITIES) - (1.5)% | | (1,589,728) |
NET ASSETS - 100% | $ 103,768,477 |
Legend |
(a) Non-income producing |
(b) Affiliated fund that is available only to investment companies and other accounts managed by Fidelity Investments. The rate quoted is the annualized seven-day yield of the fund at period end. A complete unaudited listing of the fund's holdings as of its most recent quarter end is available upon request. In addition, each Fidelity Central Fund's financial statements, which are not covered by the Fund's Report of Independent Registered Public Accounting Firm, are available on the SEC's website or upon request. |
(c) Investment made with cash collateral received from securities on loan. |
(d) Security or a portion of the security is on loan at period end. |
(e) Security exempt from registration under Rule 144A of the Securities Act of 1933. These securities may be resold in transactions exempt from registration, normally to qualified institutional buyers. At the end of the period, the value of these securities amounted to $208,800 or 0.2% of net assets. |
# Additional information on each counterparty to the repurchase agreement is as follows: |
Repurchase Agreement / Counterparty | Value |
$49,000 due 1/03/11 at 0.20% |
BNP Paribas Securities Corp. | $ 5,794 |
Barclays Capital, Inc. | 11,559 |
Citigroup Global Markets, Inc. | 3,729 |
Credit Agricole Securities (USA), Inc. | 7,458 |
Deutsche Bank Securities, Inc. | 1,492 |
HSBC Securities (USA), Inc. | 4,396 |
J.P. Morgan Securities, Inc. | 3,729 |
Merrill Lynch, Pierce, Fenner & Smith, Inc. | 1,119 |
Mizuho Securities USA, Inc. | 6,339 |
RBS Securities, Inc. | 2,080 |
Societe Generale, New York Branch | 932 |
Wells Fargo Securities LLC | 373 |
| $ 49,000 |
Affiliated Central Funds |
Information regarding fiscal year to date income earned by the Fund from investments in Fidelity Central Funds is as follows: |
Fund | Income earned |
Fidelity Cash Central Fund | $ 4,081 |
Fidelity Securities Lending Cash Central Fund | 11,306 |
Total | $ 15,387 |
Other Information |
The following is a summary of the inputs used, as of December 31, 2010, involving the Fund's assets and liabilities carried at fair value. The inputs or methodology used for valuing securities may not be an indication of the risk associated with investing in those securities. For more information on valuation inputs, and their aggregation into the levels used in the table below, please refer to the Security Valuation section in the accompanying Notes to Financial Statements. |
Valuation Inputs at Reporting Date: |
Description | Total | Level 1 | Level 2 | Level 3 |
Investments in Securities: | | | | |
Equities: | | | | |
Brazil | $ 13,928,517 | $ 13,928,517 | $ - | $ - |
Korea (South) | 13,345,636 | 12,936,621 | 409,015 | - |
Russia | 9,059,714 | 9,059,635 | 79 | - |
Taiwan | 8,723,149 | 8,063,592 | 659,557 | - |
China | 8,468,467 | 8,468,467 | - | - |
India | 6,884,660 | 6,192,001 | 692,659 | - |
South Africa | 6,685,129 | 6,088,261 | 596,868 | - |
Indonesia | 5,671,815 | 5,671,815 | - | - |
Hong Kong | 3,830,675 | 1,156,251 | 2,674,424 | - |
Other | 26,174,015 | 26,174,015 | - | - |
Money Market Funds | 2,537,428 | 2,537,428 | - | - |
Cash Equivalents | 49,000 | - | 49,000 | - |
Total Investments in Securities: | $ 105,358,205 | $ 100,276,603 | $ 5,081,602 | $ - |
Income Tax Information |
At December 31, 2010, the Fund had a capital loss carryforward of approximately $3,598,173 of which $773,916 and $2,824,257 will expire in fiscal 2016 and 2017, respectively. Capital loss carryforwards are only available to offset future capital gains of the Fund to the extent provided by regulations and may be limited. |
See accompanying notes which are an integral part of the financial statements.
Annual Report
Statement of Assets and Liabilities
| December 31, 2010 |
| | |
Assets | | |
Investment in securities, at value (including securities loaned of $2,137,709 and repurchase agreements of $49,000) - See accompanying schedule: Unaffiliated issuers (cost $79,748,600) | $ 102,820,777 | |
Fidelity Central Funds (cost $2,537,428) | 2,537,428 | |
Total Investments (cost $82,286,028) | | $ 105,358,205 |
Cash | | 821 |
Foreign currency held at value (cost $299,911) | | 307,247 |
Receivable for investments sold | | 41,604 |
Receivable for fund shares sold | | 192,801 |
Dividends receivable | | 225,400 |
Distributions receivable from Fidelity Central Funds | | 2,995 |
Prepaid expenses | | 232 |
Receivable from investment adviser for expense reductions | | 20,542 |
Other receivables | | 11,964 |
Total assets | | 106,161,811 |
| | |
Liabilities | | |
Payable for investments purchased | $ 23,403 | |
Payable for fund shares redeemed | 16,582 | |
Accrued management fee | 69,290 | |
Distribution and service plan fees payable | 281 | |
Other affiliated payables | 13,770 | |
Other payables and accrued expenses | 95,908 | |
Collateral on securities loaned, at value | 2,174,100 | |
Total liabilities | | 2,393,334 |
| | |
Net Assets | | $ 103,768,477 |
Net Assets consist of: | | |
Paid in capital | | $ 85,005,096 |
Distributions in excess of net investment income | | (126,246) |
Accumulated undistributed net realized gain (loss) on investments and foreign currency transactions | | (4,186,351) |
Net unrealized appreciation (depreciation) on investments and assets and liabilities in foreign currencies | | 23,075,978 |
Net Assets | | $ 103,768,477 |
Statement of Assets and Liabilities - continued
| December 31, 2010 |
| | |
Initial Class:
Net Asset Value, offering price and redemption price per share ($18,478,431 ÷ 1,863,703 shares) | | $ 9.91 |
| | |
Service Class:
Net Asset Value, offering price and redemption price per share ($101,793 ÷ 10,237 shares) | | $ 9.94 |
| | |
Service Class 2:
Net Asset Value, offering price and redemption price per share ($1,348,451 ÷ 135,530 shares) | | $ 9.95 |
| | |
Initial Class R:
Net Asset Value, offering price and redemption price per share ($30,648,857 ÷ 3,090,625 shares) | | $ 9.92 |
| | |
Service Class 2R:
Net Asset Value, offering price and redemption price per share ($101,537 ÷ 10,188 shares) | | $ 9.97 |
| | |
Investor Class R:
Net Asset Value, offering price and redemption price per share ($53,089,408 ÷ 5,366,314 shares) | | $ 9.89 |
See accompanying notes which are an integral part of the financial statements.
Annual Report
Financial Statements - continued
Statement of Operations
| Year ended December 31, 2010 |
| | |
Investment Income | | |
Dividends | | $ 1,908,076 |
Interest | | 2 |
Income from Fidelity Central Funds | | 15,387 |
Income before foreign taxes withheld | | 1,923,465 |
Less foreign taxes withheld | | (222,613) |
Total income | | 1,700,852 |
| | |
Expenses | | |
Management fee | $ 656,958 | |
Transfer agent fees | 103,167 | |
Distribution and service plan fees | 1,420 | |
Accounting and security lending fees | 42,409 | |
Custodian fees and expenses | 243,942 | |
Independent trustees' compensation | 439 | |
Audit | 78,868 | |
Legal | 331 | |
Miscellaneous | 720 | |
Total expenses before reductions | 1,128,254 | |
Expense reductions | (245,235) | 883,019 |
Net investment income (loss) | | 817,833 |
Realized and Unrealized Gain (Loss) Net realized gain (loss) on: | | |
Investment securities: | | |
Unaffiliated issuers | 1,675,448 | |
Foreign currency transactions | (192,845) | |
Total net realized gain (loss) | | 1,482,603 |
Change in net unrealized appreciation (depreciation) on: Investment securities (net of decrease in deferred foreign taxes of $92,230) | 11,339,908 | |
Assets and liabilities in foreign currencies | 8,697 | |
Total change in net unrealized appreciation (depreciation) | | 11,348,605 |
Net gain (loss) | | 12,831,208 |
Net increase (decrease) in net assets resulting from operations | | $ 13,649,041 |
Statement of Changes in Net Assets
| Year ended
December 31, 2010 | Year ended
December 31, 2009 |
Increase (Decrease) in Net Assets | | |
Operations | | |
Net investment income (loss) | $ 817,833 | $ 170,709 |
Net realized gain (loss) | 1,482,603 | (1,776,237) |
Change in net unrealized appreciation (depreciation) | 11,348,605 | 16,723,804 |
Net increase (decrease) in net assets resulting from operations | 13,649,041 | 15,118,276 |
Distributions to shareholders from net investment income | (839,007) | (171,137) |
Distributions to shareholders from net realized gain | (380,090) | (219,436) |
Total distributions | (1,219,097) | (390,573) |
Share transactions - net increase (decrease) | 19,330,340 | 48,999,079 |
Redemption fees | 21,709 | 22,594 |
Total increase (decrease) in net assets | 31,781,993 | 63,749,376 |
| | |
Net Assets | | |
Beginning of period | 71,986,484 | 8,237,108 |
End of period (including distributions in excess of net investment income of $126,246 and undistributed net investment income of $0, respectively) | $ 103,768,477 | $ 71,986,484 |
See accompanying notes which are an integral part of the financial statements.
Annual Report
Financial Highlights - Initial Class
Years ended December 31, | 2010 | 2009 | 2008 H |
Selected Per-Share Data | | | |
Net asset value, beginning of period | $ 8.51 | $ 4.88 | $ 10.00 |
Income from Investment Operations | | | |
Net investment income (loss) E | .09 | .04 | .13 |
Net realized and unrealized gain (loss) | 1.43 | 3.64 | (5.19) |
Total from investment operations | 1.52 | 3.68 | (5.06) |
Distributions from net investment income | (.08) | (.02) | (.08) |
Distributions from net realized gain | (.04) | (.03) | - |
Total distributions | (.12) | (.05) | (.08) |
Redemption fees added to paid in capital E | - J | - J | .02 |
Net asset value, end of period | $ 9.91 | $ 8.51 | $ 4.88 |
Total Return B, C, D | 17.89% | 75.40% | (50.45)% |
Ratios to Average Net Assets F, I | | | |
Expenses before reductions | 1.33% | 2.85% | 3.92% A |
Expenses net of fee waivers, if any | 1.10% | 1.10% | 1.10% A |
Expenses net of all reductions | 1.04% | 1.02% | 1.02% A |
Net investment income (loss) | 1.05% | .60% | 1.54% A |
Supplemental Data | | | |
Net assets, end of period (000 omitted) | $ 18,478 | $ 250 | $ 516 |
Portfolio turnover rate G | 100% | 70% | 79% |
A Annualized
B Total returns for periods of less than one year are not annualized.
C Total returns do not reflect charges attributable to your insurance company's separate account. Inclusion of these charges would reduce the total returns shown.
D Total returns would have been lower had certain expenses not been reduced during the periods shown.
E Calculated based on average shares outstanding during the period.
F Fees and expenses of the underlying Fidelity Central Funds are not included in the Fund's expense ratio. The Fund indirectly bears its proportionate share of the expenses of any underlying Fidelity Central Funds.
G Amount does not include the portfolio activity of any underlying Fidelity Central Funds.
H For the period January 23, 2008 (commencement of operations) to December 31, 2008.
I Expense ratios reflect operating expenses of the class. Expenses before reductions do not reflect amounts reimbursed by the investment adviser or reductions from brokerage service arrangements or reductions from other expense offset arrangements and do not represent the amount paid by the class during periods when reimbursements or reductions occur. Expense ratios before reductions for start-up periods may not be representative of longer-term operating periods. Expenses net of fee waivers reflect expenses after reimbursement by the investment adviser but prior to reductions from brokerage service arrangements or other expense offset arrangements. Expenses net of all reductions represent the net expenses paid by the class.
J Amount represents less than $.01 per share.
Financial Highlights - Service Class
Years ended December 31, | 2010 | 2009 | 2008 H |
Selected Per-Share Data | | | |
Net asset value, beginning of period | $ 8.54 | $ 4.88 | $ 10.00 |
Income from Investment Operations | | | |
Net investment income (loss) E | .08 | .03 | .12 |
Net realized and unrealized gain (loss) | 1.43 | 3.65 | (5.19) |
Total from investment operations | 1.51 | 3.68 | (5.07) |
Distributions from net investment income | (.07) | - J | (.07) |
Distributions from net realized gain | (.04) | (.02) | - |
Total distributions | (.11) | (.02) | (.07) |
Redemption fees added to paid in capital E | - J | - J | .02 |
Net asset value, end of period | $ 9.94 | $ 8.54 | $ 4.88 |
Total Return B, C, D | 17.70% | 75.49% | (50.53)% |
Ratios to Average Net Assets F, I | | | |
Expenses before reductions | 1.48% | 3.02% | 4.02% A |
Expenses net of fee waivers, if any | 1.20% | 1.20% | 1.20% A |
Expenses net of all reductions | 1.14% | 1.12% | 1.12% A |
Net investment income (loss) | .95% | .50% | 1.44% A |
Supplemental Data | | | |
Net assets, end of period (000 omitted) | $ 102 | $ 118 | $ 396 |
Portfolio turnover rate G | 100% | 70% | 79% |
A Annualized
B Total returns for periods of less than one year are not annualized.
C Total returns do not reflect charges attributable to your insurance company's separate account. Inclusion of these charges would reduce the total returns shown.
D Total returns would have been lower had certain expenses not been reduced during the periods shown.
E Calculated based on average shares outstanding during the period.
F Fees and expenses of the underlying Fidelity Central Funds are not included in the Fund's expense ratio. The Fund indirectly bears its proportionate share of the expenses of any underlying Fidelity Central Funds.
G Amount does not include the portfolio activity of any underlying Fidelity Central Funds.
H For the period January 23, 2008 (commencement of operations) to December 31, 2008.
I Expense ratios reflect operating expenses of the class. Expenses before reductions do not reflect amounts reimbursed by the investment adviser or reductions from brokerage service arrangements or reductions from other expense offset arrangements and do not represent the amount paid by the class during periods when reimbursements or reductions occur. Expense ratios before reductions for start-up periods may not be representative of longer-term operating periods. Expenses net of fee waivers reflect expenses after reimbursement by the investment adviser but prior to reductions from brokerage service arrangements or other expense offset arrangements. Expenses net of all reductions represent the net expenses paid by the class.
J Amount represents less than $.01 per share.
See accompanying notes which are an integral part of the financial statements.
Annual Report
Financial Highlights - Service Class 2
Years ended December 31, | 2010 | 2009 | 2008 H |
Selected Per-Share Data | | | |
Net asset value, beginning of period | $ 8.56 | $ 4.88 | $ 10.00 |
Income from Investment Operations | | | |
Net investment income (loss) E | .07 | .02 | .11 |
Net realized and unrealized gain (loss) | 1.43 | 3.66 | (5.19) |
Total from investment operations | 1.50 | 3.68 | (5.08) |
Distributions from net investment income | (.07) | - | (.06) |
Distributions from net realized gain | (.04) | - | - |
Total distributions | (.11) | - | (.06) |
Redemption fees added to paid in capital E | - J | - J | .02 |
Net asset value, end of period | $ 9.95 | $ 8.56 | $ 4.88 |
Total Return B, C, D | 17.57% | 75.41% | (50.65)% |
Ratios to Average Net Assets F, I | | | |
Expenses before reductions | 1.59% | 3.17% | 4.17% A |
Expenses net of fee waivers, if any | 1.35% | 1.35% | 1.35% A |
Expenses net of all reductions | 1.30% | 1.27% | 1.27% A |
Net investment income (loss) | .80% | .35% | 1.29% A |
Supplemental Data | | | |
Net assets, end of period (000 omitted) | $ 1,348 | $ 117 | $ 395 |
Portfolio turnover rate G | 100% | 70% | 79% |
A Annualized
B Total returns for periods of less than one year are not annualized.
C Total returns do not reflect charges attributable to your insurance company's separate account. Inclusion of these charges would reduce the total returns shown.
D Total returns would have been lower had certain expenses not been reduced during the periods shown.
E Calculated based on average shares outstanding during the period.
F Fees and expenses of the underlying Fidelity Central Funds are not included in the Fund's expense ratio. The Fund indirectly bears its proportionate share of the expenses of any underlying Fidelity Central Funds.
G Amount does not include the portfolio activity of any underlying Fidelity Central Funds.
H For the period January 23, 2008 (commencement of operations) to December 31, 2008.
I Expense ratios reflect operating expenses of the class. Expenses before reductions do not reflect amounts reimbursed by the investment adviser or reductions from brokerage service arrangements or reductions from other expense offset arrangements and do not represent the amount paid by the class during periods when reimbursements or reductions occur. Expense ratios before reductions for start-up periods may not be representative of longer-term operating periods. Expenses net of fee waivers reflect expenses after reimbursement by the investment adviser but prior to reductions from brokerage service arrangements or other expense offset arrangements. Expenses net of all reductions represent the net expenses paid by the class.
J Amount represents less than $.01 per share.
Financial Highlights - Initial Class R
Years ended December 31, | 2010 | 2009 | 2008 H |
Selected Per-Share Data | | | |
Net asset value, beginning of period | $ 8.51 | $ 4.88 | $ 10.00 |
Income from Investment Operations | | | |
Net investment income (loss) E | .09 | .04 | .11 |
Net realized and unrealized gain (loss) | 1.44 | 3.63 | (5.16) |
Total from investment operations | 1.53 | 3.67 | (5.05) |
Distributions from net investment income | (.08) | (.02) | (.08) |
Distributions from net realized gain | (.04) | (.03) | - |
Total distributions | (.12) | (.05) | (.08) |
Redemption fees added to paid in capital E | - J | .01 | .01 |
Net asset value, end of period | $ 9.92 | $ 8.51 | $ 4.88 |
Total Return B, C, D | 18.01% | 75.40% | (50.45)% |
Ratios to Average Net Assets F, I | | | |
Expenses before reductions | 1.35% | 2.03% | 3.71% A |
Expenses net of fee waivers, if any | 1.10% | 1.10% | 1.10% A |
Expenses net of all reductions | 1.04% | 1.02% | 1.02% A |
Net investment income (loss) | 1.05% | .60% | 1.54% A |
Supplemental Data | | | |
Net assets, end of period (000 omitted) | $ 30,649 | $ 31,314 | $ 3,158 |
Portfolio turnover rate G | 100% | 70% | 79% |
A Annualized
B Total returns for periods of less than one year are not annualized.
C Total returns do not reflect charges attributable to your insurance company's separate account. Inclusion of these charges would reduce the total returns shown.
D Total returns would have been lower had certain expenses not been reduced during the periods shown.
E Calculated based on average shares outstanding during the period.
F Fees and expenses of the underlying Fidelity Central Funds are not included in the Fund's expense ratio. The Fund indirectly bears its proportionate share of the expenses of any underlying Fidelity Central Funds.
G Amount does not include the portfolio activity of any underlying Fidelity Central Funds.
H For the period January 23, 2008 (commencement of operations) to December 31, 2008.
I Expense ratios reflect operating expenses of the class. Expenses before reductions do not reflect amounts reimbursed by the investment adviser or reductions from brokerage service arrangements or reductions from other expense offset arrangements and do not represent the amount paid by the class during periods when reimbursements or reductions occur. Expense ratios before reductions for start-up periods may not be representative of longer-term operating periods. Expenses net of fee waivers reflect expenses after reimbursement by the investment adviser but prior to reductions from brokerage service arrangements or other expense offset arrangements. Expenses net of all reductions represent the net expenses paid by the class.
J Amount represents less than $.01 per share.
See accompanying notes which are an integral part of the financial statements.
Annual Report
Financial Highlights - Service Class 2R
Years ended December 31, | 2010 | 2009 | 2008 H |
Selected Per-Share Data | | | |
Net asset value, beginning of period | $ 8.56 | $ 4.88 | $ 10.00 |
Income from Investment Operations | | | |
Net investment income (loss) E | .07 | .02 | .11 |
Net realized and unrealized gain (loss) | 1.43 | 3.66 | (5.19) |
Total from investment operations | 1.50 | 3.68 | (5.08) |
Distributions from net investment income | (.06) | - | (.06) |
Distributions from net realized gain | (.04) | - | - |
Total distributions | (.09) K | - | (.06) |
Redemption fees added to paid in capital E | - J | - J | .02 |
Net asset value, end of period | $ 9.97 | $ 8.56 | $ 4.88 |
Total Return B, C, D | 17.60% | 75.41% | (50.65)% |
Ratios to Average Net Assets F, I | | | |
Expenses before reductions | 1.63% | 3.17% | 4.17% A |
Expenses net of fee waivers, if any | 1.35% | 1.35% | 1.35% A |
Expenses net of all reductions | 1.29% | 1.27% | 1.27% A |
Net investment income (loss) | .80% | .35% | 1.29% A |
Supplemental Data | | | |
Net assets, end of period (000 omitted) | $ 102 | $ 117 | $ 395 |
Portfolio turnover rate G | 100% | 70% | 79% |
A Annualized
B Total returns for periods of less than one year are not annualized.
C Total returns do not reflect charges attributable to your insurance company's separate account. Inclusion of these charges would reduce the total returns shown.
D Total returns would have been lower had certain expenses not been reduced during the periods shown.
E Calculated based on average shares outstanding during the period.
F Fees and expenses of the underlying Fidelity Central Funds are not included in the Fund's expense ratio. The Fund indirectly bears its proportionate share of the expenses of any underlying Fidelity Central Funds.
G Amount does not include the portfolio activity of any underlying Fidelity Central Funds.
H For the period January 23, 2008 (commencement of operations) to December 31, 2008.
I Expense ratios reflect operating expenses of the class. Expenses before reductions do not reflect amounts reimbursed by the investment adviser or reductions from brokerage service arrangements or reductions from other expense offset arrangements and do not represent the amount paid by the class during periods when reimbursements or reductions occur. Expense ratios before reductions for start-up periods may not be representative of longer-term operating periods. Expenses net of fee waivers reflect expenses after reimbursement by the investment adviser but prior to reductions from brokerage service arrangements or other expense offset arrangements. Expenses net of all reductions represent the net expenses paid by the class.
J Amount represents less than $.01 per share.
K Total distributions of $.09 per share is comprised of distributions from net investment income of $.056 and distributions from net realized gain of $.037 per share.
Financial Highlights - Investor Class R
Years ended December 31, | 2010 | 2009 | 2008 H |
Selected Per-Share Data | | | |
Net asset value, beginning of period | $ 8.50 | $ 4.87 | $ 10.00 |
Income from Investment Operations | | | |
Net investment income (loss) E | .08 | .04 | .10 |
Net realized and unrealized gain (loss) | 1.43 | 3.63 | (5.16) |
Total from investment operations | 1.51 | 3.67 | (5.06) |
Distributions from net investment income | (.08) | (.02) | (.08) |
Distributions from net realized gain | (.04) | (.03) | - |
Total distributions | (.12) | (.05) | (.08) |
Redemption fees added to paid in capital E | - J | .01 | .01 |
Net asset value, end of period | $ 9.89 | $ 8.50 | $ 4.87 |
Total Return B, C, D | 17.79% | 75.56% | (50.55)% |
Ratios to Average Net Assets F, I | | | |
Expenses before reductions | 1.42% | 2.07% | 3.81% A |
Expenses net of fee waivers, if any | 1.18% | 1.18% | 1.18% A |
Expenses net of all reductions | 1.12% | 1.10% | 1.10% A |
Net investment income (loss) | .97% | .52% | 1.46% A |
Supplemental Data | | | |
Net assets, end of period (000 omitted) | $ 53,089 | $ 40,070 | $ 3,377 |
Portfolio turnover rate G | 100% | 70% | 79% |
A Annualized
B Total returns for periods of less than one year are not annualized.
C Total returns do not reflect charges attributable to your insurance company's separate account. Inclusion of these charges would reduce the total returns shown.
D Total returns would have been lower had certain expenses not been reduced during the periods shown.
E Calculated based on average shares outstanding during the period.
F Fees and expenses of the underlying Fidelity Central Funds are not included in the Fund's expense ratio. The Fund indirectly bears its proportionate share of the expenses of any underlying Fidelity Central Funds.
G Amount does not include the portfolio activity of any underlying Fidelity Central Funds.
H For the period January 23, 2008 (commencement of operations) to December 31, 2008.
I Expense ratios reflect operating expenses of the class. Expenses before reductions do not reflect amounts reimbursed by the investment adviser or reductions from brokerage service arrangements or reductions from other expense offset arrangements and do not represent the amount paid by the class during periods when reimbursements or reductions occur. Expense ratios before reductions for start-up periods may not be representative of longer-term operating periods. Expenses net of fee waivers reflect expenses after reimbursement by the investment adviser but prior to reductions from brokerage service arrangements or other expense offset arrangements. Expenses net of all reductions represent the net expenses paid by the class.
J Amount represents less than $.01 per share.
See accompanying notes which are an integral part of the financial statements.
Annual Report
Notes to Financial Statements
For the period ended December 31, 2010
1. Organization.
VIP Emerging Markets Portfolio (the Fund) is a fund of Variable Insurance Products Fund IV (the Trust) and is authorized to issue an unlimited number of shares. The Trust is registered under the Investment Company Act of 1940, as amended (the 1940 Act), as an open-end management investment company organized as a Massachusetts business trust. Shares of the Fund may only be purchased by insurance companies for the purpose of funding variable annuity or variable life insurance contracts. The Fund offers the following classes of shares: Initial Class shares, Service Class shares, Service Class 2 shares, Initial Class R shares, Service Class 2R shares, and Investor Class R shares. All classes have equal rights and voting privileges, except for matters affecting a single class. Investment income, realized and unrealized capital gains and losses, the common expenses of the Fund, and certain fund-level expense reductions, if any, are allocated on a pro-rata basis to each class based on the relative net assets of each class to the total net assets of the Fund. Each class differs with respect to transfer agent and distribution and service plan fees incurred. Certain expense reductions may also differ by class. The Fund's investments in emerging markets can be subject to social, economic, regulatory, and political uncertainties and can be extremely volatile.
2. Investments in Fidelity Central Funds.
The Fund may invest in Fidelity Central Funds, which are open-end investment companies available only to other investment companies and accounts managed by Fidelity Management & Research Company (FMR) and its affiliates. The Fund's Schedule of Investments lists each of the Fidelity Central Funds held as of period end, if any, as an investment of the Fund, but does not include the underlying holdings of each Fidelity Central Fund. As an Investing Fund, the Fund indirectly bears its proportionate share of the expenses of the underlying Fidelity Central Funds.
The Money Market Central Funds seek preservation of capital and current income and are managed by Fidelity Investments Money Management, Inc. (FIMM), an affiliate of FMR.
A complete unaudited list of holdings for each Fidelity Central Fund is available upon request or at the Securities and Exchange Commission (the SEC) web site at www.sec.gov. In addition, the financial statements of the Fidelity Central Funds, which are not covered by the Fund's Report of Independent Registered Public Accounting Firm, are available on the SEC web site or upon request.
3. Significant Accounting Policies.
The financial statements have been prepared in conformity with accounting principles generally accepted in the United States of America (GAAP), which require management to make certain estimates and assumptions at the date of the financial statements. Actual results could differ from those estimates. Subsequent events, if any, through the date that the financial statements were issued have been evaluated in the preparation of the financial statements. The following summarizes the significant accounting policies of the Fund:
Security Valuation. Investments are valued as of 4:00 p.m. Eastern time on the last calendar day of the period. The Fund uses independent pricing services approved by the Board of Trustees to value its investments. When current market prices or quotations are not readily available or reliable, valuations may be determined in good faith in accordance with procedures adopted by the Board of Trustees. Factors used in determining value may include market or security specific events, changes in interest rates and credit quality. The frequency with which these procedures are used cannot be predicted and they may be utilized to a significant extent. The value used for net asset value (NAV) calculation under these procedures may differ from published prices for the same securities.
The Fund categorizes the inputs to valuation techniques used to value its investments into a disclosure hierarchy consisting of three levels as shown below.
Level 1 - quoted prices in active markets for identical investments
Level 2 - other significant observable inputs (including quoted prices for similar investments, interest rates, prepayment speeds, etc.)
Level 3 - unobservable inputs (including the Fund's own assumptions based on the best information available)
Changes in valuation techniques may result in transfers in or out of an assigned level within the disclosure hierarchy. The aggregate value of investments by input level, as of December 31, 2010, is included at the end of the Fund's Schedule of Investments. Valuation techniques used to value the Fund's investments by major category are as follows.
Equity securities, including restricted securities, for which market quotations are readily available, are valued at the last reported sale price or official closing price as reported by an independent pricing service on the primary market or exchange on which they are traded and are categorized as Level 1 in the hierarchy. In the event there were no sales during the day or closing prices are not available, securities are valued at the last quoted bid price or may be valued using the last available price and are generally categorized as Level 2 in the hierarchy. For foreign equity securities, when significant market or security specific events arise, comparisons to the valuation of American Depositary Receipts (ADRs), futures contracts, Exchange-traded funds (ETFs)and certain indexes as well as quoted prices for similar securities are used and are categorized as Level 2 in the hierarchy in these
Annual Report
Notes to Financial Statements - continued
3. Significant Accounting Policies - continued
Security Valuation - continued
circumstances. Utilizing these techniques may result in transfers between Level 1 and Level 2. For restricted equity securities and private placements where observable inputs are limited, assumptions about market activity and risk are used and are categorized as Level 3 in the hierarchy.
Investments in affiliated open-end mutual funds, including the Fidelity Central Funds, are valued at their closing net asset value each business day and are categorized as Level 1 in the hierarchy. Short-term securities with remaining maturities of sixty days or less for which quotations are not readily available are valued at amortized cost, which approximates fair value and are categorized as Level 2 in the hierarchy.
Foreign Currency. The Fund uses foreign currency contracts to facilitate transactions in foreign-denominated securities. Gains and losses from these transactions may arise from changes in the value of the foreign currency or if the counterparties do not perform under the contracts' terms.
Foreign-denominated assets, including investment securities, and liabilities are translated into U.S. dollars at the exchange rate at period end. Purchases and sales of investment securities, income and dividends received and expenses denominated in foreign currencies are translated into U.S. dollars at the exchange rate in effect on the transaction date.
The effects of exchange rate fluctuations on investments are included with the net realized and unrealized gain (loss) on investment securities. Other foreign currency transactions resulting in realized and unrealized gain (loss) are disclosed separately.
Investment Transactions and Income. For financial reporting purposes, the Fund's investment holdings and NAV include trades executed through the end of the last business day of the period. The NAV per share for processing shareholder transactions is calculated as of the close of business of the New York Stock Exchange (NYSE), normally 4:00 p.m. Eastern time and includes trades executed through the end of the prior business day. Gains and losses on securities sold are determined on the basis of identified cost. Dividend income is recorded on the ex-dividend date, except for certain dividends from foreign securities where the ex-dividend date may have passed, which are recorded as soon as the Fund is informed of the ex-dividend date. Non-cash dividends included in dividend income, if any, are recorded at the fair market value of the securities received. Distributions received on securities that represent a return of capital or capital gain are recorded as a reduction of cost of investments and/or as a realized gain. The Fund estimates the components of distributions received that may be considered return of capital distributions or capital gain distributions. Interest income and distributions from the Fidelity Central Funds are accrued as earned. Interest income includes coupon interest and amortization of premium and accretion of discount on debt securities. Investment income is recorded net of foreign taxes withheld where recovery of such taxes is uncertain.
Expenses. Expenses directly attributable to a fund are charged to that fund. Expenses attributable to more than one fund are allocated among the respective funds on the basis of relative net assets or other appropriate methods. Expense estimates are accrued in the period to which they relate and adjustments are made when actual amounts are known.
Income Tax Information and Distributions to Shareholders. Each year the Fund intends to qualify as a regulated investment company, including distributing substantially all of its taxable income and realized gains under Subchapter M of the Internal Revenue Code and filing its U.S. federal tax return. As a result, no provision for income taxes is required. As of December 31, 2010, the Fund did not have any unrecognized tax benefits in the accompanying financial statements. A fund's federal tax return is subject to examination by the Internal Revenue Service (IRS) for a period of three years. Foreign taxes are provided for based on the Fund's understanding of the tax rules and rates that exist in the foreign markets in which it invests. The Fund is subject to a tax imposed on realized short term capital gains on securities of certain issuers domiciled in India. An estimated deferred tax liability for net unrealized gains on these securities is included in Other payables and accrued expenses on the Statement of Assets & Liabilities.
Distributions are declared and recorded on the ex-dividend date. Income dividends and capital gain distributions are declared separately for each class. Income and capital gain distributions are determined in accordance with income tax regulations, which may differ from GAAP.
Capital accounts within the financial statements are adjusted for permanent book-tax differences. These adjustments have no impact on net assets or the results of operations. Temporary book-tax differences will reverse in a subsequent period.
Book-tax differences are primarily due to foreign currency transactions, passive foreign investment companies (PFIC), capital loss carryforwards and losses deferred due to was sales and excise tax regulations.
The federal tax cost of investment securities and unrealized appreciation (depreciation) as of period end were as follows:
Gross unrealized appreciation | $ 23,864,182 |
Gross unrealized depreciation | (1,380,183) |
Net unrealized appreciation (depreciation) | $ 22,483,999 |
Tax Cost | $ 82,874,206 |
Annual Report
3. Significant Accounting Policies - continued
Income Tax Information and Distributions to Shareholders - continued
The tax-based components of distributable earnings as of period end were as follows
Capital loss carryforward | $ (3,598,173) |
Net unrealized appreciation (depreciation) | $ 22,492,603 |
The tax character of distributions paid was as follows:
| December 31, 2010 | December 2009 |
Ordinary Income | $ 1,219,097 | $ 390,573 |
Trading (Redemption) Fees. Initial Class R shares, Service Class 2 R shares and Investor Class R shares held by investors less than 60 days are subject to a redemption fee equal to 1% of the net asset value of shares redeemed. All redemption fees, which reduce the proceeds of the shareholder redemption, are retained by the Fund and accounted for as an addition to paid in capital.
4. Operating Policies.
Repurchase Agreements. FMR has received an Exemptive Order from the SEC which permits the Fund and other affiliated entities of FMR to transfer uninvested cash balances into joint trading accounts which are then invested in repurchase agreements. The Fund may also invest directly with institutions in repurchase agreements. Repurchase agreements are collateralized by government or non-government securities. Upon settlement date, collateral is held in segregated accounts with custodian banks and may be obtained in the event of a default of the counterparty. The Fund monitors, on a daily basis, the value of the collateral to ensure it is at least equal to the principal amount of the repurchase agreement (including accrued interest). In the event of a default by the counterparty, realization of the collateral proceeds could be delayed, during which time the value of the collateral may decline.
Restricted Securities. The Fund may invest in securities that are subject to legal or contractual restrictions on resale. These securities generally may be resold in transactions exempt from registration or to the public if the securities are registered. Disposal of these securities may involve time-consuming negotiations and expense, and prompt sale at an acceptable price may be difficult. Information regarding restricted securities is included at the end of the Fund's Schedule of Investments.
5. Purchases and Sales of Investments.
Purchases and sales of securities, other than short-term securities, aggregated $100,429,770 and $78,509,593, respectively.
6. Fees and Other Transactions with Affiliates.
Management Fee. FMR and its affiliates provide the Fund with investment management related services for which the Fund pays a monthly management fee. The management fee is the sum of an individual fund fee rate that is based on an annual rate of .55% of the Fund's average net assets and a group fee rate that averaged .26% during the period. The group fee rate is based upon the average net assets of all the mutual funds advised by FMR. The group fee rate decreases as assets under management increase and increases as assets under management decrease. For the period, the total annual management fee rate was .81% of the Fund's average net assets.
Distribution and Service Plan Fees. In accordance with Rule 12b-1 of the 1940 Act, the Fund has adopted separate 12b-1 Plans for each Service Class of shares. Each Service Class pays Fidelity Distributors Corporation (FDC), an affiliate of FMR, a service fee. For the period, the service fee is based on an annual rate of .10% of Service Class' average net assets and .25% of Service Class 2's and Service Class 2R's average net assets.
For the period, total fees, all of which were re-allowed to insurance companies for the distribution of shares and providing shareholder support services were as follows:
Service Class | $ 102 |
Service Class 2 | 1,063 |
Service Class 2 R | 255 |
| $ 1,420 |
Annual Report
Notes to Financial Statements - continued
6. Fees and Other Transactions with Affiliates - continued
Transfer Agent Fees. Fidelity Investments Institutional Operations Company, Inc. (FIIOC), an affiliate of FMR, is the Fund's transfer, dividend disbursing, and shareholder servicing agent. FIIOC receives an asset-based fee with respect to each class. Each class (with the exception of Investor Class R) pays a transfer agent fee, excluding out of pocket expenses, equal to an annual rate of .07% of average net assets. Investor Class R pays a monthly asset-based transfer agent fee of .15% of average net assets. In addition, FIIOC receives an asset-based fee of .01% of average net assets for typesetting, printing and mailing of shareholder reports, except proxy statements. FIIOC has agreed to voluntarily waive this fee until December 31, 2010. (See note 9: Expense Reductions). For the period, transfer agent fees for each class, including printing and out of pocket expenses, were as follows:
Initial Class | $ 7,478 |
Service Class | 117 |
Service Class 2 | 372 |
Initial Class R | 23,780 |
Service Class 2R | 117 |
Investor Class R | 71,303 |
| $ 103,167 |
Accounting and Security Lending Fees. Fidelity Service Company, Inc. (FSC), an affiliate of FMR, maintains the Fund's accounting records. The accounting fee is based on the level of average net assets for the month. Under a separate contract, FSC administers the security lending program. The security lending fee is based on the number and duration of lending transactions.
Brokerage Commissions. The Fund placed a portion of its portfolio transactions with brokerage firms which are affiliates of the investment adviser. The commissions paid to these affiliated firms were $47 for the period.
7. Committed Line of Credit.
The Fund participates with other funds managed by FMR or an affiliate in a $3.75 billion credit facility (the "line of credit") to be utilized for temporary or emergency purposes to fund shareholder redemptions or for other short-term liquidity purposes. The Fund has agreed to pay commitment fees on its pro-rata portion of the line of credit, which amounted to $284 and is reflected in Miscellaneous expenses on the Statement of Operations. During the period, there were no borrowings on this line of credit.
8. Security Lending.
The Fund lends portfolio securities through a lending agent from time to time in order to earn additional income. The lending agent may loan securities to certain qualified borrowers, including Fidelity Capital Markets (FCM), a broker-dealer affiliated with the Fund. On the settlement date of the loan, the Fund receives collateral (in the form of U.S. Treasury obligations, letters of credit and/or cash) against the loaned securities and maintains collateral in an amount not less than 100% of the market value of the loaned securities during the period of the loan. The market value of the loaned securities is determined at the close of business of the Fund and any additional required collateral is delivered to the Fund on the next business day. If the borrower defaults on its obligation to return the securities loaned because of insolvency or other reasons, a fund could experience delays and costs in recovering the securities loaned or in gaining access to the collateral. Any cash collateral received is invested in the Fidelity Securities Lending Cash Central Fund. The value of loaned securities and cash collateral at period end are disclosed on the Fund's Statement of Assets and Liabilities. Security lending income represents the income earned on investing cash collateral, less rebates paid to borrowers and lending agent fees associated with the loan, plus any premium payments received for lending certain types of securities. Security lending income is presented in the Statement of Operations as a component of income from Fidelity Central Funds. Total security lending income during the period amounted to $11,306. During the period, there were no securities loaned to FCM.
9. Expense Reductions.
In addition to FIIOC waiving a portion of its transfer agent fees, FMR voluntarily agreed to reimburse each class to the extent annual operating expenses exceeded certain levels of average net assets as noted in the table below. Some expenses, for example interest expense, including commitment fees, are excluded from this reimbursement.
Annual Report
9. Expense Reductions - continued
The following classes were in reimbursement during the period:
| Expense
Limitations | Reimbursement/waiver |
Initial Class | 1.10% | $ 19,723 |
Service Class | 1.20% | 283 |
Service Class 2 | 1.35% | 1,027 |
Initial Class R | 1.10% | 71,003 |
Service Class 2R | 1.35% | 283 |
Investor Class R | 1.18% | 106,018 |
| | $ 198,337 |
Many of the brokers with whom FMR places trades on behalf of the Fund provided services to the Fund in addition to trade execution. These services included payments of certain expenses on behalf of the Fund totaling $46,898 for the period.
10. Distributions to Shareholders.
Distributions to shareholders of each class were as follows:
Years ended December 31, | 2010 | 2009 |
From net investment income | | |
Initial Class | $ 147,657 | $ 596 |
Service Class | 719 | 41 |
Service Class 2 | 8,901 | - |
Initial Class R | 247,442 | 75,536 |
Service Class 2R | 565 | - |
Investor Class R | 433,723 | 94,964 |
Total | $ 839,007 | $ 171,137 |
From net realized gain | | |
Initial Class | $ 62,064 | $ 762 |
Service Class | 383 | 275 |
Service Class 2 | 4,185 | - |
Initial Class R | 115,662 | 96,805 |
Service Class 2R | 382 | - |
Investor Class R | 197,414 | 121,594 |
Total | $ 380,090 | $ 219,436 |
11. Share Transactions.
Transactions for each class of shares were as follows:
| Shares | Dollars |
Years ended December 31, | 2010 | 2009 | 2010 | 2009 |
Initial Class | | | | |
Shares sold | 1,907,445 | 16,945 | $ 16,225,751 | $ 120,071 |
Reinvestment of distributions | 21,780 | 165 | 209,721 | 1,358 |
Shares redeemed | (94,931) | (93,578) | (856,392) | (691,714) |
Net increase (decrease) | 1,834,294 | (76,468) | $ 15,579,080 | $ (570,285) |
Service Class | | | | |
Shares sold | - | - | $ - | $ - |
Reinvestment of distributions | 115 | 38 | 1,102 | 316 |
Shares redeemed | (3,650) | (67,365) | (31,523) | (502,507) |
Net increase (decrease) | (3,535) | (67,327) | $ (30,421) | $ (502,191) |
Service Class 2 | | | | |
Shares sold | 137,437 | - | $ 1,250,469 | $ - |
Reinvestment of distributions | 1,356 | - | 13,086 | - |
Shares redeemed | (16,991) | (67,175) | (155,917) | (501,199) |
Net increase (decrease) | 121,802 | (67,175) | $ 1,107,638 | $ (501,199) |
Annual Report
Notes to Financial Statements - continued
11. Share Transactions - continued
| Shares | Dollars |
Years ended December 31, | 2010 | 2009 | 2010 | 2009 |
Initial Class R | | | | |
Shares sold | 1,547,303 | 3,509,051 | $ 14,204,050 | $ 24,423,527 |
Reinvestment of distributions | 38,007 | 20,952 | 363,104 | 172,342 |
Shares redeemed | (2,173,155) | (499,141) | (18,591,867) | (3,003,566) |
Net increase (decrease) | (587,845) | 3,030,862 | $ (4,024,713) | $ 21,592,303 |
Service Class 2R | | | | |
Shares sold | - | - | $ - | $ - |
Reinvestment of distributions | 99 | - | 947 | - |
Shares redeemed | (3,639) | (67,175) | (31,476) | (501,199) |
Net increase (decrease) | (3,540) | (67,175) | $ (30,529) | $ (501,199) |
Investor Class R | | | | |
Shares sold | 3,120,989 | 4,321,090 | $ 27,575,797 | $ 31,280,354 |
Reinvestment of distributions | 66,066 | 26,389 | 631,137 | 216,557 |
Shares redeemed | (2,534,983) | (326,280) | (21,477,649) | (2,015,261) |
Net increase (decrease) | 652,072 | 4,021,199 | $ 6,729,285 | $ 29,481,650 |
12. Other.
The Fund's organizational documents provide former and current trustees and officers with a limited indemnification against liabilities arising in connection with the performance of their duties to the Fund. In the normal course of business, the Fund may also enter into contracts that provide general indemnifications. The Fund's maximum exposure under these arrangements is unknown as this would be dependent on future claims that may be made against the Fund. The risk of material loss from such claims is considered remote.
At the period end, FMR or its affiliates were the owners of record of approximately 98% of the total outstanding shares of the Fund.
Annual Report
Report of Independent Registered Public Accounting Firm
To the Trustees of Variable Insurance Products Fund IV and Shareholders of VIP Emerging Markets Portfolio:
We have audited the accompanying statement of assets and liabilities of VIP Emerging Markets Portfolio (the Fund), a fund of Variable Insurance Products Fund IV, including the schedule of investments, as of December 31, 2010, and the related statement of operations for the year then ended, the statement of changes in net assets for each of the two years in the period then ended, and the financial highlights for each of the periods presented. These financial statements and financial highlights are the responsibility of the Fund's management. Our responsibility is to express an opinion on these financial statements and financial highlights based on our audits.
We conducted our audits in accordance with the standards of the Public Company Accounting Oversight Board (United States). Those standards require that we plan and perform the audit to obtain reasonable assurance about whether the financial statements and financial highlights are free of material misstatement. The Fund is not required to have, nor were we engaged to perform, an audit of its internal control over financial reporting. Our audits included consideration of internal control over financial reporting as a basis for designing audit procedures that are appropriate in the circumstances, but not for the purpose of expressing an opinion on the effectiveness of the Fund's internal control over financial reporting. Accordingly, we express no such opinion. An audit also includes examining, on a test basis, evidence supporting the amounts and disclosures in the financial statements, assessing the accounting principles used and significant estimates made by management, as well as evaluating the overall financial statement presentation. Our procedures included confirmation of securities owned as of December 31, 2010, by correspondence with the custodians and brokers; where replies were not received from brokers, we performed other auditing procedures. We believe that our audits provide a reasonable basis for our opinion.
In our opinion, the financial statements and financial highlights referred to above present fairly, in all material respects, the financial position of VIP Emerging Markets Portfolio as of December 31, 2010, the results of its operations for the year then ended, the changes in its net assets for each of the two years in the period then ended, and the financial highlights for each of the periods presented, in conformity with accounting principles generally accepted in the United States of America.
/s/ Deloitte & Touche LLP
DELOITTE & TOUCHE LLP
Boston, Massachusetts
February 17, 2011
Annual Report
The Trustees, Members of the Advisory Board, and executive officers of the trust and fund, as applicable, are listed below. The Board of Trustees governs the fund and is responsible for protecting the interests of shareholders. The Trustees are experienced executives who meet periodically throughout the year to oversee the fund's activities, review contractual arrangements with companies that provide services to the fund, oversee management of the risks associated with such activities and contractual arrangements, and review the fund's performance. Except for James C. Curvey, each of the Trustees oversees 219 funds advised by FMR or an affiliate. Mr. Curvey oversees 408 funds advised by FMR or an affiliate.
The Trustees hold office without limit in time except that (a) any Trustee may resign; (b) any Trustee may be removed by written instrument, signed by at least two-thirds of the number of Trustees prior to such removal; (c) any Trustee who requests to be retired or who has become incapacitated by illness or injury may be retired by written instrument signed by a majority of the other Trustees; and (d) any Trustee may be removed at any special meeting of shareholders by a two-thirds vote of the outstanding voting securities of the trust. Each Trustee who is not an interested person (as defined in the 1940 Act) (Independent Trustee), shall retire not later than the last day of the calendar year in which his or her 72nd birthday occurs. The Independent Trustees may waive this mandatory retirement age policy with respect to individual Trustees. The executive officers and Advisory Board Members hold office without limit in time, except that any officer and Advisory Board Member may resign or may be removed by a vote of a majority of the Trustees at any regular meeting or any special meeting of the Trustees. Except as indicated, each individual has held the office shown or other offices in the same company for the past five years.
Experience, Skills, Attributes, and Qualifications of the Fund's Trustees. The Governance and Nominating Committee has adopted a statement of policy that describes the experience, qualifications, attributes, and skills that are necessary and desirable for potential Independent Trustee candidates (Statement of Policy). The Board believes that each Trustee satisfied at the time he or she was initially elected or appointed a Trustee, and continues to satisfy, the standards contemplated by the Statement of Policy. The Governance and Nominating Committee also engages professional search firms to help identify potential Independent Trustee candidates who have the experience, qualifications, attributes, and skills consistent with the Statement of Policy. From time to time, additional criteria based on the composition and skills of the current Independent Trustees, as well as experience or skills that may be appropriate in light of future changes to board composition, business conditions, and regulatory or other developments, have also been considered by the professional search firms and the Governance and Nominating Committee. In addition, the Board takes into account the Trustees' commitment and participation in Board and committee meetings, as well as their leadership of standing and ad hoc committees throughout their tenure.
In determining that a particular Trustee was and continues to be qualified to serve as a Trustee, the Board has considered a variety of criteria, none of which, in isolation, was controlling. The Board believes that, collectively, the Trustees have balanced and diverse experience, qualifications, attributes, and skills, which allow the Board to operate effectively in governing the fund and protecting the interests of shareholders. Information about the specific experience, skills, attributes, and qualifications of each Trustee, which in each case led to the Board's conclusion that the Trustee should serve (or continue to serve) as a trustee of the fund, is provided below.
Board Structure and Oversight Function. James C. Curvey is an interested person (as defined in the 1940 Act) and currently serves as Acting Chairman. The Trustees have determined that an interested Chairman is appropriate and benefits shareholders because an interested Chairman has a personal and professional stake in the quality and continuity of services provided to the fund. Independent Trustees exercise their informed business judgment to appoint an individual of their choosing to serve as Chairman, regardless of whether the Trustee happens to be independent or a member of management. The Independent Trustees have determined that they can act independently and effectively without having an Independent Trustee serve as Chairman and that a key structural component for assuring that they are in a position to do so is for the Independent Trustees to constitute a substantial majority for the Board. The Independent Trustees also regularly meet in executive session. Ned C. Lautenbach serves as Chairman of the Independent Trustees and as such (i) acts as a liaison between the Independent Trustees and management with respect to matters important to the Independent Trustees and (ii) with management prepares agendas for Board meetings.
Fidelity funds are overseen by different Boards of Trustees. The fund's Board oversees Fidelity's equity and high income funds and another Board oversees Fidelity's investment-grade bond, money market, and asset allocation funds. The asset allocation funds may invest in Fidelity funds overseen by the fund's Board. The use of separate Boards, each with its own committee structure, allows the Trustees of each group of Fidelity funds to focus on the unique issues of the funds they oversee, including common research, investment, and operational issues. On occasion, the separate Boards establish joint committees to address issues of overlapping consequences for the Fidelity funds overseen by each Board.
The Trustees operate using a system of committees to facilitate the timely and efficient consideration of all matters of importance to the Trustees, the fund, and fund shareholders and to facilitate compliance with legal and regulatory requirements and oversight of the fund's activities and associated risks. The Board, acting through its committees, has charged FMR and its affiliates with (i) identifying events or circumstances the occurrence of which could have demonstrably adverse effects on the fund's business and/or reputation; (ii) implementing processes and controls to lessen the possibility that such events or circumstances occur or to mitigate the effects of such events or circumstances if they do occur; and (iii) creating and maintaining a system designed to evaluate continuously business and market conditions in order to facilitate the identification and implementation processes described in (i) and (ii) above. Because the day-to-day operations and activities of the fund are carried out by or through FMR, its affiliates and other service providers, the fund's exposure to risks is mitigated but not eliminated by the processes overseen by the Trustees. While each of the Board's committees has responsibility for overseeing different aspects of the fund's activities, oversight is exercised primarily through the Operations, Audit, and Compliance Committees. Appropriate personnel, including but not limited to the fund's Chief Compliance Officer (CCO), FMR's internal auditor, the independent accountants, the fund's Treasurer and portfolio management personnel, make periodic reports to the Board's committees, as appropriate. The responsibilities of each committee, including their oversight responsibilities, are described further under "Standing Committees of the Fund's Trustees."
Annual Report
The funds' Statement of Additional Information (SAI) includes more information about the Trustees. To request a free copy, call Fidelity at 1-877-208-0098.
Interested Trustees*:
Correspondence intended for each Trustee who is an interested person may be sent to Fidelity Investments, 82 Devonshire Street, Boston, Massachusetts 02109.
Name, Age; Principal Occupations and Other Relevant Experience+ |
James C. Curvey (75) |
| Year of Election or Appointment: 2007 Mr. Curvey is Trustee and Acting Chairman of the Board of Trustees of certain Trusts. Mr. Curvey also serves as Trustee (2007-present) of other investment companies advised by FMR. Mr. Curvey is a Director of Fidelity Investments Money Management, Inc. (2009-present), Director of Fidelity Research & Analysis Co. (2009-present) and Director of FMR and FMR Co., Inc. (2007-present). Mr. Curvey is also Vice Chairman (2007-present) and Director of FMR LLC. In addition, Mr. Curvey serves as an Overseer for the Boston Symphony Orchestra and a member of the Trustees of Villanova University. Previously, Mr. Curvey was the Vice Chairman (2006-2007) and Director (2000-2007) of FMR Corp. |
Ronald P. O'Hanley (54) |
| Year of Election or Appointment: 2011 Mr. O'Hanley is President of Fidelity Asset Management and Corporate Services and a member of Fidelity's Executive Committee (2010-present). Previously, Mr. O'Hanley served as President and Chief Executive Officer of BNY Mellon Asset Management (2007-2010). Mr. O'Hanley also served as Vice Chairman of Bank New York Mellon Corp. and a member of that firm's Executive Committee. Prior to the 2007 merger of The Bank of New York and Mellon Financial Corporation, he was Vice Chairman of Mellon Financial Corporation and President and Chief Executive Officer of Mellon Asset Management. He joined Mellon in February 1997. Mr. O'Hanley currently serves as Chairman of the Boston Public Library Foundation Board of Directors and sits on the Board of Directors of Beth Israel Deaconess Medical Center, the Board of Trustees of the Marine Biological Laboratory and the Advisory Board of the Maxwell School of Citizenship and Public Administration at Syracuse University. Mr. O'Hanley also chairs the Council on Asset Management for the Financial Services Roundtable and is a member of the Board of Directors of Institutional Investor's U.S. Institute. |
* Trustees have been determined to be "Interested Trustees" by virtue of, among other things, their affiliation with the trust or various entities under common control with FMR.
+ The information above includes each Trustee's principal occupation during the last five years and other information relating to the experience, attributes, and skills relevant to each Trustee's qualifications to serve as a Trustee, which led to the conclusion that each Trustee should serve as a Trustee for the fund.
Independent Trustees:
Correspondence intended for each Independent Trustee (that is, the Trustees other than the Interested Trustees) may be sent to Fidelity Investments, P.O. Box 55235, Boston, Massachusetts 02205-5235.
Name, Age; Principal Occupations and Other Relevant Experience+ |
Dennis J. Dirks (62) |
| Year of Election or Appointment: 2005 Prior to his retirement in May 2003, Mr. Dirks was Chief Operating Officer and a member of the Board of The Depository Trust & Clearing Corporation (DTCC). He also served as President, Chief Operating Officer, and Board member of The Depository Trust Company (DTC) and President and Board member of the National Securities Clearing Corporation (NSCC). In addition, Mr. Dirks served as Chief Executive Officer and Board member of the Government Securities Clearing Corporation, Chief Executive Officer and Board member of the Mortgage-Backed Securities Clearing Corporation, as a Trustee and a member of the Finance Committee of Manhattan College (2005-2008), and as a Trustee and a member of the Finance Committee of AHRC of Nassau County (2006-2008). Mr. Dirks is a member of the Independent Directors Council (IDC) Governing Council (2010-Present) and Board of Directors for The Brookville Center for Children's Services, Inc. (2009-present). |
Alan J. Lacy (57) |
| Year of Election or Appointment: 2008 Mr. Lacy serves as Senior Adviser (2007-present) of Oak Hill Capital Partners, L.P. (private equity). Mr. Lacy also served as Chief Executive Officer (2000-2005) and Vice Chairman (2005-2006) of Sears Holdings Corporation and Sears, Roebuck and Co. (retail). In addition, Mr. Lacy serves as a member of the Board of Directors of The Western Union Company (global money transfer, 2006-present) and Bristol-Myers Squibb Company (global pharmaceuticals, 2007-present). Mr. Lacy is Chairman (2008-present) and a member (2006-present) of the Board of Trustees of The National Parks Conservation Association. |
Ned C. Lautenbach (66) |
| Year of Election or Appointment: 2000 Mr. Lautenbach is Chairman of the Independent Trustees of the Equity and High Income Funds (2006-present). Mr. Lautenbach currently serves as the Lead Director of the Eaton Corporation Board of Directors (diversified industrial, 1997-present). Mr. Lautenbach is also a member of the Board of Directors of the Philharmonic Center for the Arts in Naples, Florida (1999-present); a member of the Board of Trustees of Fairfield University (2005-present); and a member of the Council on Foreign Relations (1994-present). Previously, Mr. Lautenbach was a Partner/Advisory Partner at Clayton, Dubilier & Rice, Inc. (private equity investment, 1998-2010), as well as a Director of Sony Corporation (2006-2007). |
Joseph Mauriello (66) |
| Year of Election or Appointment: 2008 Prior to his retirement in January 2006, Mr. Mauriello served in numerous senior management positions including Deputy Chairman and Chief Operating Officer (2004-2005), and Vice Chairman of Financial Services (2002-2004) of KPMG LLP US (professional services, 1965-2005). Mr. Mauriello currently serves as a member of the Board of Directors of XL Group plc. (global insurance and re-insurance, 2006-present) and of Arcadia Resources Inc. (health care services and products, 2007-present). Previously, Mr. Mauriello served as a Director of the Hamilton Funds of the Bank of New York (2006-2007). |
Cornelia M. Small (66) |
| Year of Election or Appointment: 2005 Ms. Small is a member of the Board of Directors of the Teagle Foundation (2009-present). Ms. Small is also a member of the Investment Committee, and Chair (2008-present) and a member of the Board of Trustees of Smith College. In addition, Ms. Small serves on the Investment Committee of the Berkshire Taconic Community Foundation (2008-present). Previously, Ms. Small served as Chairperson of the Investment Committee (2002-2008) of Smith College. In addition, Ms. Small served as Chief Investment Officer, Director of Global Equity Investments, and a member of the Board of Directors of Scudder, Stevens & Clark and Scudder Kemper Investments. |
William S. Stavropoulos (71) |
| Year of Election or Appointment: 2001 Mr. Stavropoulos is Vice Chairman of the Independent Trustees of the Equity and High Income Funds (2006-present). Mr. Stavropoulos serves as President and Founder of the Michigan Baseball Foundation, the Great Lakes Loons (2007-present). Mr. Stavropoulos is Chairman Emeritus of the Board of Directors of The Dow Chemical Company, where he previously served in numerous senior management positions, including President, CEO (1995-2000; 2002-2004), Chairman of the Executive Committee (2000-2006), and as a member of the Board of Directors (1990-2006). Currently, Mr. Stavropoulos is Chairman of Univar (global distributor of commodity and specialty chemicals, 2010-present), a Director of Teradata Corporation (data warehousing and technology solutions, 2008-present), Chemical Financial Corporation, Maersk Inc. (industrial conglomerate), Tyco International, Inc. (multinational manufacturing and services, 2007-present), and a member of the Advisory Board for Metalmark Capital (private equity investment, 2005-present). Mr. Stavropoulos is a special advisor to Clayton, Dubilier & Rice, LLC (private equity investment). In addition, Mr. Stavropoulos is a member of the University of Notre Dame Advisory Council for the College of Science. |
David M. Thomas (61) |
| Year of Election or Appointment: 2008 Previously, Mr. Thomas served as Executive Chairman (2005-2006) and Chairman and Chief Executive Officer (2000-2005) of IMS Health, Inc. (pharmaceutical and healthcare information solutions). In addition, Mr. Thomas serves as a member of the Board of Directors of Fortune Brands, Inc. (consumer products), and Interpublic Group of Companies, Inc. (marketing communication, 2004-present). |
Michael E. Wiley (60) |
| Year of Election or Appointment: 2008 Mr. Wiley also serves as a Director of Asia Pacific Exploration Consolidated (international oil and gas exploration and production, 2008-present). Mr. Wiley serves as a Director of Tesoro Corporation (independent oil refiner and marketer, 2005-present), and a Director of Bill Barrett Corporation (exploration and production, 2005-present). In addition, Mr. Wiley also serves as a Director of Post Oak Bank (privately-held bank, 2004-present). Previously, Mr. Wiley served as a member of the Board of Trustees of the University of Tulsa (2000-2006; 2007-2010), as a Senior Energy Advisor of Katzenbach Partners, LLC (consulting, 2006-2007), as an Advisory Director of Riverstone Holdings (private investment), Chairman, President, and CEO of Baker Hughes, Inc. (oilfield services, 2000-2004), and as Director of Spinnaker Exploration Company (exploration and production, 2001-2005). |
+ The information above includes each Trustee's principal occupation during the last five years and other information relating to the experience, attributes, and skills relevant to each Trustee's qualifications to serve as a Trustee, which led to the conclusion that each Trustee should serve as a Trustee for the fund.
Advisory Board Members and Executive Officers:
Correspondence intended for each executive officer, Edward C. Johnson 3d, and Peter S. Lynch may be sent to Fidelity Investments, 82 Devonshire Street, Boston, Massachusetts 02109.
Name, Age; Principal Occupation |
Edward C. Johnson 3d (80) |
| Year of Election or Appointment: 2011 Member of the Advisory Board of Fidelity's Equity and High Income Funds. Formerly Trustee and Chairman of the Board of Trustees of certain Trusts, Mr. Johnson serves as Chief Executive Officer, Chairman, and a Director of FMR LLC; Chairman and a Director of FMR; and Chairman and a Director of FMR Co., Inc. In addition, Mr. Johnson serves as Chairman and Director of FIL Limited. Previously, Mr. Johnson served as President of FMR LLC (2006-2007). |
Peter S. Lynch (66) |
| Year of Election or Appointment: 2003 Member of the Advisory Board of Fidelity's Equity and High Income Funds. Mr. Lynch is Vice Chairman and a Director of FMR and FMR Co., Inc. In addition, Mr. Lynch serves as a Trustee of Boston College and as the Chairman of the Inner-City Scholarship Fund. Previously, Mr. Lynch served on the Special Olympics International Board of Directors (1997-2006). |
Kenneth B. Robins (41) |
| Year of Election or Appointment: 2008 President and Treasurer of Fidelity's Equity and High Income Funds. Mr. Robins also serves as President and Treasurer (2010-present) and Assistant Treasurer (2009-present) of other Fidelity funds and is an employee of Fidelity Investments (2004-present). Previously, Mr. Robins served as Deputy Treasurer of the Fidelity funds (2005-2008) and Treasurer and Chief Financial Officer of The North Carolina Capital Management Trust: Cash and Term Portfolios (2006-2008). |
Bruce T. Herring (45) |
| Year of Election or Appointment: 2006 Vice President of certain Equity Funds. Mr. Herring also serves as Chief Investment Officer and Director of Fidelity Management & Research (U.K.) Inc. (2010-present) and Group Chief Investments Officer of FMR. Previously, Mr. Herring served as Vice President (2005-2006) and Senior Vice President (2006-2007) of Fidelity Management & Research Company, Vice President of FMR Co., Inc. (2001-2007) and as a portfolio manager for Fidelity U.S. Equity Funds. |
Brian B. Hogan (46) |
| Year of Election or Appointment: 2009 Vice President of certain Equity Funds and Vice President of Sector Funds. Mr. Hogan also serves as President of FMR's Equity Division (2009-present). Previously, Mr. Hogan served as Senior Vice President, Equity Research of FMR (2006-2009) and as a portfolio manager. |
Scott C. Goebel (42) |
| Year of Election or Appointment: 2008 Secretary and Chief Legal Officer (CLO) of the Fidelity funds. Mr. Goebel also serves as Secretary and CLO of The North Carolina Capital Management Trust: Cash and Term Portfolio (2008-present); General Counsel, Secretary, and Senior Vice President of FMR (2008-present) and FMR Co., Inc. (2008-present); Deputy General Counsel of FMR LLC; Chief Legal Officer of Fidelity Management & Research (Hong Kong) Limited (2008-present) and Assistant Secretary of Fidelity Management & Research (Japan) Inc. (2008-present), Fidelity Investments Money Management, Inc. (2008-present), Fidelity Management & Research (U.K.) Inc. (2008-present), and Fidelity Research and Analysis Company (2008-present). Previously, Mr. Goebel served as Assistant Secretary of the Funds (2007-2008) and as Vice President and Secretary of Fidelity Distributors Corporation (FDC) (2005-2007). |
William C. Coffey (41) |
| Year of Election or Appointment: 2009 Assistant Secretary of Fidelity's Equity and High Income Funds. Mr. Coffey also serves as Senior Vice President and Deputy General Counsel of FMR LLC (2010-present), and is an employee of Fidelity Investments. Previously, Mr. Coffey served as Vice President and Associate General Counsel of FMR LLC (2005-2009). |
Holly C. Laurent (56) |
| Year of Election or Appointment: 2008 Anti-Money Laundering (AML) Officer of the Fidelity funds. Ms. Laurent also serves as AML Officer of The North Carolina Capital Management Trust: Cash and Term Portfolio (2008-present) and is an employee of Fidelity Investments. Previously, Ms. Laurent was Senior Vice President and Head of Legal for Fidelity Business Services India Pvt. Ltd. (2006-2008), and Senior Vice President, Deputy General Counsel and Group Head for FMR LLC (2005-2006). |
Christine Reynolds (52) |
| Year of Election or Appointment: 2008 Chief Financial Officer of the Fidelity funds. Ms. Reynolds became President of Fidelity Pricing and Cash Management Services (FPCMS) in August 2008. Ms. Reynolds served as Chief Operating Officer of FPCMS (2007-2008). Previously, Ms. Reynolds served as President, Treasurer, and Anti-Money Laundering officer of the Fidelity funds (2004-2007). |
Kenneth A. Rathgeber (63) |
| Year of Election or Appointment: 2004 Chief Compliance Officer of Fidelity's Equity and High Income Funds. Mr. Rathgeber is Chief Compliance Officer of Fidelity Management & Research (Hong Kong) Limited (2008-present), Fidelity Management & Research (Japan) Inc. (2008-present), FMR (2005-present), FMR Co., Inc. (2005-present), Fidelity Management & Research (U.K.) Inc. (2005-present), Fidelity Research & Analysis Company (2005-present), Fidelity Investments Money Management, Inc. (2005-present), Pyramis Global Advisors, LLC (2005-present), and Strategic Advisers, Inc. (2005-present). |
Jeffrey S. Christian (49) |
| Year of Election or Appointment: 2009 Deputy Treasurer of the Fidelity funds. Mr. Christian is an employee of Fidelity Investments. Previously, Mr. Christian served as Chief Financial Officer (2008-2009) of certain Fidelity funds and Senior Vice President of Fidelity Pricing and Cash Management Services (FPCMS) (2004-2009). |
Bryan A. Mehrmann (49) |
| Year of Election or Appointment: 2005 Deputy Treasurer of the Fidelity funds. Mr. Mehrmann is an employee of Fidelity Investments. |
Adrien E. Deberghes (43) |
| Year of Election or Appointment: 2008 Deputy Treasurer of Fidelity's Equity and High Income Funds. Mr. Deberghes also serves as Assistant Treasurer of other Fidelity funds (2010-present) and is an employee of Fidelity Investments (2008-present). Previously, Mr. Deberghes served as Senior Vice President of Mutual Fund Administration at State Street Corporation (2007-2008), Senior Director of Mutual Fund Administration at Investors Bank & Trust (2005-2007), and Director of Finance for Dunkin' Brands (2000-2005). |
Stephanie J. Dorsey (41) |
| Year of Election or Appointment: 2010 Assistant Treasurer of Fidelity's Equity and High Income Funds. Ms. Dorsey also serves as Deputy Treasurer of other Fidelity funds (2008-present) and is an employee of Fidelity Investments (2008-present). Previously, Ms. Dorsey served as Treasurer (2004-2008) of the JPMorgan Mutual Funds and Vice President (2004-2008) of JPMorgan Chase Bank. |
Name, Age; Principal Occupation |
John R. Hebble (52) |
| Year of Election or Appointment: 2009 Assistant Treasurer of Fidelity's Equity and High Income Funds. Mr. Hebble also serves as Treasurer and Chief Financial Officer of The North Carolina Capital Management Trust: Cash and Term Portfolio (2008-present), President and Treasurer of other Fidelity funds (2008-present) and is an employee of Fidelity Investments. |
Gary W. Ryan (52) |
| Year of Election or Appointment: 2005 Assistant Treasurer of the Fidelity funds. Mr. Ryan is an employee of Fidelity Investments. Previously, Mr. Ryan served as Vice President of Fund Reporting in Fidelity Pricing and Cash Management Services (FPCMS) (1999-2005). |
Jonathan Davis (42) |
| Year of Election or Appointment: 2010 Assistant Treasurer of the Fidelity funds. Mr. Davis is an employee of Fidelity Investments. Previously, Mr. Davis served as Vice President and Associate General Counsel of FMR LLC (2003-2010). |
Annual Report
The amounts per share which represent income derived from sources within, and taxes paid to, foreign countries or possessions of the United States are as follows:
| Pay Date | Income | Taxes |
Initial Class R | 02/05/10 | $.003 | $.000 |
| 12/17/10 | $.135 | $.020 |
Investor Class R | 02/05/10 | $.003 | $.000 |
| 12/17/10 | $.135 | $.020 |
Service Class 2 R | 02/05/10 | $.003 | $.000 |
| 12/17/10 | $.110 | $.020 |
Annual Report
Board Approval of Investment Advisory Contracts and Management Fees
VIP Emerging Markets Portfolio
Each year, the Board of Trustees, including the Independent Trustees (together, the Board), votes on the renewal of the management contract and sub-advisory agreements (together, the Advisory Contracts) for the fund. The Board, assisted by the advice of fund counsel and Independent Trustees' counsel, requests and considers a broad range of information relevant to the renewal of the Advisory Contracts throughout the year.
The Board meets regularly and considers at each of its meetings factors that are relevant to its annual consideration of the renewal of the fund's Advisory Contracts, including the services and support provided to the fund and its shareholders. The Board has established various standing committees, each composed of Independent Trustees with varying backgrounds, to which the Board has assigned specific subject matter responsibilities in order to enhance effective decision-making by the Board. The Board, acting directly and through its Committees, requests and receives information concerning the annual consideration of the renewal of the fund's Advisory Contracts. The Board also meets as needed to consider matters specifically related to the Board's annual consideration of the renewal of Advisory Contracts. Members of the Board may also meet with trustees of other Fidelity funds through ad hoc joint committees to discuss certain matters relevant to the Fidelity funds.
At its July 2010 meeting, the Board of Trustees, including the Independent Trustees, unanimously determined to renew the fund's Advisory Contracts. In reaching its determination, the Board considered all factors it believed relevant, including (i) the nature, extent, and quality of the services to be provided to the fund and its shareholders (including the investment performance of the fund); (ii) the competitiveness of the fund's management fee and total expenses; (iii) the total costs of the services to be provided by and the profits to be realized by Fidelity from its relationship with the fund; (iv) the extent to which economies of scale would be realized as the fund grows; and (v) whether fee levels reflect these economies of scale, if any, for the benefit of fund shareholders.
In considering whether to renew the Advisory Contracts for the fund, the Board reached a determination, with the assistance of fund counsel and Independent Trustees' counsel and through the exercise of its business judgment, that the renewal of the Advisory Contracts is in the best interests of fund shareholders and that the compensation to be received by Fidelity under the management contract is fair and reasonable. The Board's decision to renew the Advisory Contracts was not based on any single factor noted above, but rather was based on a comprehensive consideration of all the information provided to the Board at its meetings throughout the year. The Board, in reaching its determination to renew the Advisory Contracts, is aware that shareholders in the fund have a broad range of investment choices available to them, including a wide choice among mutual funds offered by Fidelity's competitors, and that the fund's shareholders, with the opportunity to review and weigh the disclosure provided by the fund in its prospectus and other public disclosures, have chosen to invest in this fund, managed by Fidelity.
Nature, Extent, and Quality of Services Provided. The Board considered the staffing within the investment adviser, FMR, and the sub-advisers (together, the Investment Advisers), including the backgrounds of the fund's investment personnel and the fund's investment objective and discipline. The Independent Trustees also had discussions with senior management of Fidelity's investment operations and investment groups. The Board considered the structure of the portfolio manager compensation program and whether this structure provides appropriate incentives to act in the best interest of the fund.
Resources Dedicated to Investment Management and Support Services. The Board and the equity research subcommittee of the Board's Fund Oversight Committee reviewed the size, education, and experience of the Investment Advisers' investment staff, their use of technology, and the Investment Advisers' approach to recruiting, training, and retaining portfolio managers and other research, advisory, and management personnel. The Board noted that Fidelity's analysts have access to a variety of technological tools and market and securities data that enable them to perform both fundamental and quantitative analysis and to specialize in various disciplines. The Board considered Fidelity's extensive global research capabilities that enable the Investment Advisers to aggregate data from various sources in an effort to produce positive investment results. The Board also considered that Fidelity's portfolio managers and analysts have access to daily portfolio attribution that allows for monitoring of a fund's portfolio, as well as an electronic communication system that provides immediate real-time access to research concerning issuers and credit enhancers. The Board noted FMR's continued focus on strengthening the organization and discipline of equity portfolio management and research.
Shareholder and Administrative Services. The Board considered (i) the nature, extent, quality, and cost of advisory, administrative, and shareholder services performed by the Investment Advisers and their affiliates under the Advisory Contracts and under separate agreements covering transfer agency, pricing and bookkeeping, and securities lending services for the fund; (ii) the nature and extent of the investment adviser's supervision of third party service providers, principally custodians and subcustodians; and (iii) the resources devoted to, and the record of compliance with, the fund's compliance policies and procedures. The Board also reviewed the allocation of fund brokerage, including allocations to brokers affiliated with the Investment Advisers, the use of brokerage commissions to pay fund expenses, and the use of "soft" commission dollars to pay for research services.
The Board noted that the growth of fund assets over time across the complex allows Fidelity to reinvest in the development of services designed to enhance the value or convenience of the Fidelity funds as investment vehicles. These services include 24-hour access to account information and market information through phone representatives and over the Internet, and investor education materials and asset allocation tools.
Investment in a Large Fund Family. The Board considered the benefits to shareholders of investing in a Fidelity fund, including the benefits of investing in a fund that is part of a large family of funds offering a variety of investment disciplines and providing a large variety of mutual fund investor services. The Board noted that Fidelity had taken, or had made recommendations that resulted in the Fidelity funds taking, a number of actions over the previous year that benefited particular funds, including (i) dedicating additional resources to investment research and restructuring and broadening the focus of the investment research teams; (ii) bolstering the senior management team that oversees asset management; (iii) launching Class F of certain funds as a lower-fee class available to Freedom K and Freedom Index Funds; (iv) lowering the initial investment minimums and ongoing balance requirements for Real Estate High Income Fund; (v) eliminating subsequent purchase minimums for all funds and adding a waiver of the investment minimum requirement for new accounts opened with the proceeds of a systematic withdrawal plan; (vi) eliminating the withdrawal minimum and maximum limits for systematic withdrawals from Advisor funds; (vii) expanding sales load waivers on Class A shares for Destiny Planholders and expanding Institutional Class eligibility for Class O Destiny Planholders; and (viii) changing certain Class A and Class T sales charge structures to further align them with industry practices.
Annual Report
Board Approval of Investment Advisory Contracts and Management Fees - continued
Investment Performance. The Board considered whether the fund has operated in accordance with its investment objective, as well as its record of compliance with its investment restrictions. It also reviewed the fund's absolute investment performance for each class, as well as the fund's relative investment performance for each class measured against (i) a broad-based securities market index, and (ii) a peer group of mutual funds deemed appropriate by Fidelity and reviewed by the Board. Because the fund had been in existence less than three calendar years, the following chart considered by the Board shows, for the one-year period ended December 31, 2009, the total returns of Investor Class R and Initial Class of the fund, the total return of a broad-based securities market index ("benchmark"), and a range of total returns of a peer group of mutual funds identified by Morningstar, Inc. as having an investment style similar to that of the fund based on underlying portfolio holdings. The returns of Investor Class R and Initial Class show the performance of the highest and lowest performing classes, respectively. The box within the chart shows the 25th percentile return (bottom of box) and the 75th percentile return (top of box) of the peer group. Returns shown above the box are in the first quartile and returns shown below the box are in the fourth quartile. The percentage beaten numbers noted below the chart correspond to the percentile box and represent the percentage of funds in the peer group whose performance was equal to or lower than that of the class indicated.
VIP Emerging Markets Portfolio
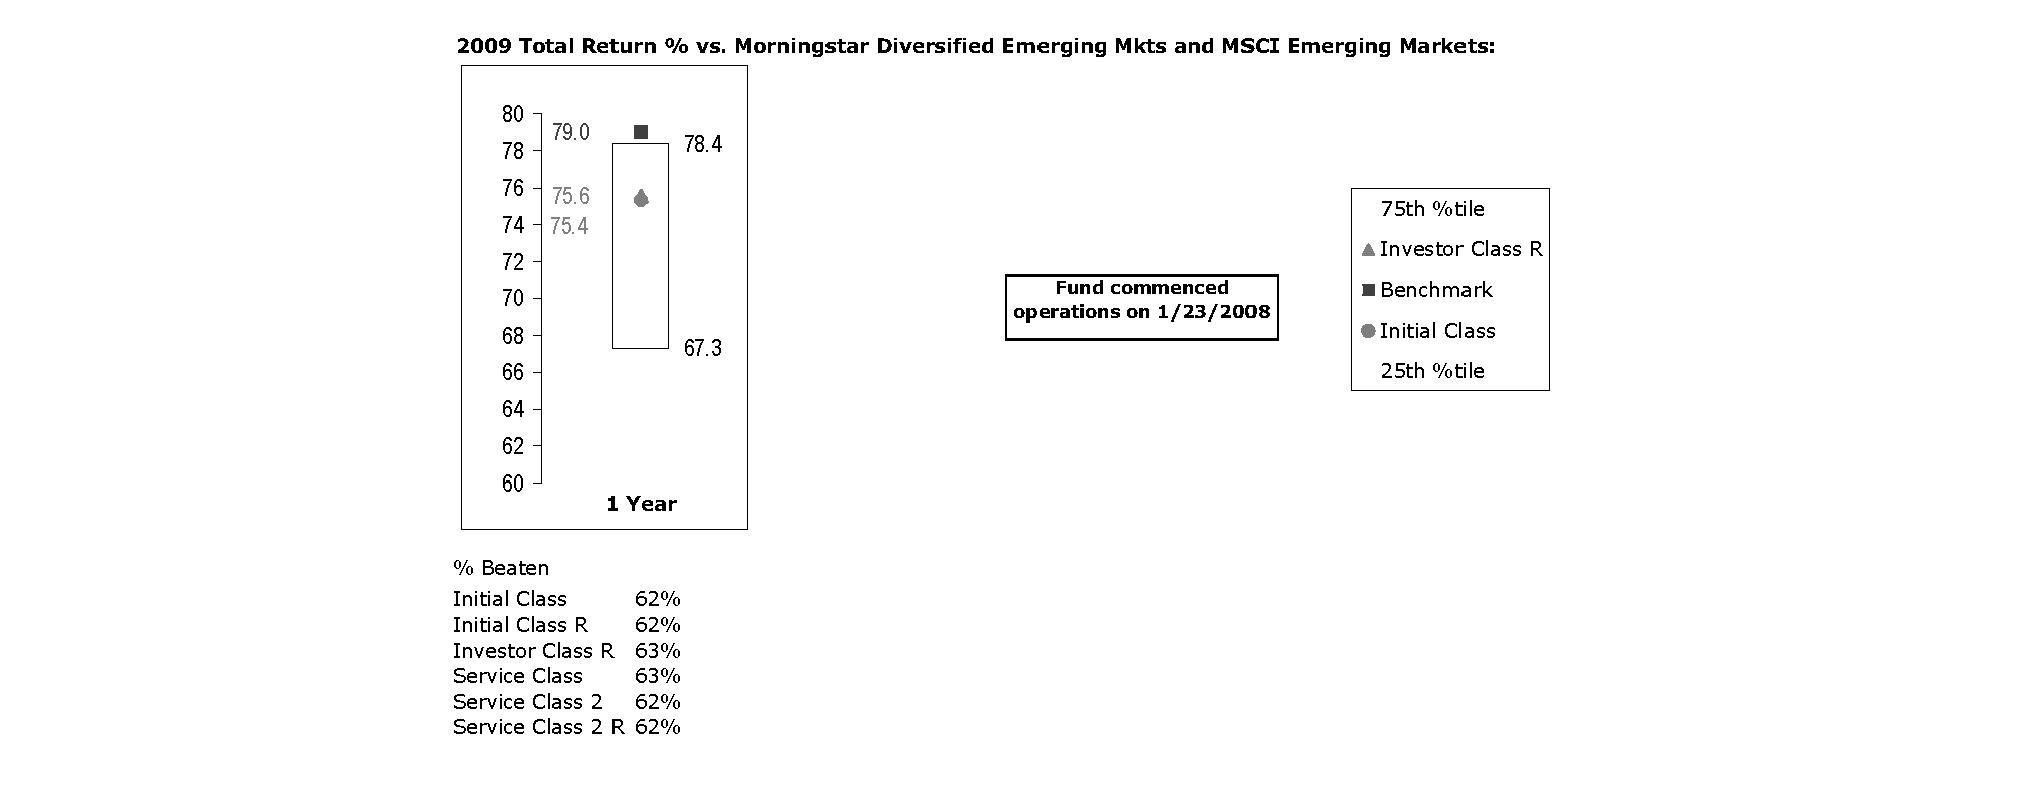
The Board reviewed the fund's relative investment performance against its peer group and noted that the performance of Investor Class R of the fund was in the second quartile for the period shown. The Board also noted that the investment performance of the fund was lower than its benchmark for the period shown. The Board considered that the variations in performance among the fund's classes reflect the variations in class expenses, which result in lower performance for higher expense classes. The Board also reviewed the fund's performance since inception as well as performance in the current year. The Board noted that it is difficult to evaluate in any comprehensive fashion the performance of the fund, in light of its relatively recent commencement of operations.
Based on its review, and giving particular weight to the nature and quality of the resources dedicated by the Investment Advisers to maintain and improve relative performance and factoring in the unprecedented market events in recent years, the Board concluded that the nature, extent, and quality of investment management and support services and of shareholder and administrative services provided to the fund will benefit the fund's shareholders, particularly in light of the Board's view that the fund's shareholders benefit from investing in a fund that is part of a large family of funds offering a variety of investment disciplines and services.
Competitiveness of Management Fee and Total Fund Expenses. The Board considered the fund's management fee and total expenses compared to "mapped groups" of competitive funds and classes. Fidelity creates "mapped groups" by combining similar Lipper investment objective categories that have comparable management fee characteristics. Combining Lipper investment objective categories aids the Board's management fee and total expense comparisons by broadening the competitive group used for comparison and by reducing the number of universes to which various Fidelity funds are compared.
Annual Report
Management Fee. The Board considered two proprietary management fee comparisons for the 12-month (or shorter) periods shown in the chart below. The group of Lipper funds used by the Board for management fee comparisons is referred to below as the "Total Mapped Group." The Total Mapped Group comparison focuses on a fund's standing relative to the total universe of comparable funds available to investors, in terms of gross management fees before expense reimbursements or caps. "TMG %" represents the percentage of funds in the Total Mapped Group that had management fees that were lower than the fund's. For example, a TMG % of 31% means that 69% of the funds in the Total Mapped Group had higher management fees than the fund. The "Asset-Size Peer Group" (ASPG) comparison focuses on a fund's standing relative to non-Fidelity funds similar in size to the fund within the Total Mapped Group. The ASPG represents at least 15% of the funds in the Total Mapped Group with comparable asset size and management fee characteristics, subject to a minimum of 50 funds (or all funds in the Total Mapped Group if fewer than 50). Additional information, such as the ASPG quartile in which the fund's management fee ranked, is also included in the chart and considered by the Board.
VIP Emerging Markets Portfolio

The Board noted that the fund's management fee ranked below the median of its Total Mapped Group and below the median of its ASPG for 2009.
Based on its review, the Board concluded that the fund's management fee is fair and reasonable in light of the services that the fund receives and the other factors considered.
Total Expenses. In its review of each class's total expenses, the Board considered the fund's management fee as well as other fund or class expenses, as applicable, such as transfer agent fees, pricing and bookkeeping fees, fund-paid 12b-1 fees, and custodial, legal, and audit fees. The Board also noted the effects of any waivers and reimbursements on fees and expenses. As part of its review, the Board also considered current and historical total expenses of each class of the fund compared to competitive fund median expenses. Each class of the fund is compared to those funds and classes in the Total Mapped Group (used by the Board for management fee comparisons) that have a similar sales load structure.
The Board noted that the total expenses of each of Initial Class and Initial Class R ranked equal to its competitive median for 2009 and the total expenses of each of Investor Class R, Service Class, Service Class 2, and Service Class 2 R ranked above its competitive median for 2009. The Board considered that the total expenses of Investor Class R were above the median primarily due to its higher transfer agent fee. The Board noted that the fund offers multiple classes, each of which has a different 12b-1 fee structure, and that the multiple structures are intended to offer a range of pricing options for the intermediary market. The Board also noted that the total expenses of the classes vary primarily by the level of their 12b-1 fees, although differences in transfer agent fees may also cause expenses to vary from class to class.
Fees Charged to Other Fidelity Clients. The Board also considered Fidelity fee structures and other information with respect to clients of FMR and its affiliates, such as other mutual funds advised or subadvised by FMR or its affiliates, pension plan clients, and other institutional clients. In March 2010, the Board created an ad hoc joint committee with the board of other Fidelity funds (the Committee) to review and compare Fidelity's institutional investment advisory business with its business of providing services to the Fidelity funds, including the differences in services provided, fees charged, and costs incurred, as well as competition in their respective marketplaces.
Annual Report
Board Approval of Investment Advisory Contracts and Management Fees - continued
Based on its review of total expenses and fees charged to other Fidelity clients, the Board concluded that the total expenses of each class of the fund were reasonable, although in some cases above the median of the universe presented for comparison, in light of the services that the fund and its shareholders receive and the other factors considered, including the findings of the Committee.
Costs of the Services and Profitability. The Board considered the revenues earned and the expenses incurred by Fidelity in conducting the business of developing, marketing, distributing, managing, administering and servicing the fund and its shareholders. The Board also considered the level of Fidelity's profits in respect of all the Fidelity funds.
On an annual basis, FMR presents to the Board Fidelity's profitability for the fund. Fidelity calculates the profitability for each fund, as well as aggregate profitability for groups of Fidelity funds and all Fidelity funds, using a series of detailed revenue and cost allocation methodologies which originate with the audited books and records of Fidelity. The Audit Committee of the Board reviews any significant changes from the prior year's methodologies.
PricewaterhouseCoopers LLP (PwC), independent registered public accounting firm and auditor to Fidelity and certain Fidelity funds, has been engaged annually by the Board as part of the Board's assessment of Fidelity's profitability analysis. PwC's engagement includes the review and assessment of Fidelity's methodologies used in determining the revenues and expenses attributable to Fidelity's mutual fund business, and completion of agreed-upon procedures surrounding the mathematical accuracy of fund profitability and its conformity to allocation methodologies. After considering PwC's reports issued under the engagement and information provided by Fidelity, the Board believes that while other allocation methods may also be reasonable, Fidelity's profitability methodologies are reasonable in all material respects.
The Board has also reviewed Fidelity's non-fund businesses and fall-out benefits related to the mutual fund business as well as cases where Fidelity's affiliates may benefit from or be related to the fund's business.
The Board considered the costs of the services provided by and the profits realized by Fidelity in connection with the operation of the fund and were satisfied that the profitability was not excessive in the circumstances.
Economies of Scale. The Board considered whether there have been economies of scale in respect of the management of the Fidelity funds, whether the Fidelity funds (including the fund) have appropriately benefited from any such economies of scale, and whether there is potential for realization of any further economies of scale. The Board considered the extent to which the fund will benefit from economies of scale through increased services to the fund, through waivers or reimbursements, or through fee or expense reductions.
In February 2009, the Board and the board of other Fidelity funds created an ad hoc committee (the Economies of Scale Committee) to analyze whether FMR attains economies of scale in respect of the management and servicing of the Fidelity funds, whether the Fidelity funds have appropriately benefited from such economies of scale, and whether there is potential for realization of any further economies of scale.
The Board recognized that the fund's management contract incorporates a "group fee" structure, which provides for lower group fee rates as total fund assets under FMR's management increase, and for higher group fee rates as total fund assets under FMR's management decrease. FMR calculates the group fee rates based on a tiered asset "breakpoint" schedule that varies based on asset class. The Board considered that the group fee is designed to deliver the benefits of economies of scale to fund shareholders when total Fidelity fund assets increase, even if assets of any particular fund are unchanged or have declined, because some portion of Fidelity's costs are attributable to services provided to all Fidelity funds, and all funds benefit if those costs can be allocated among more assets. The Board concluded that, given the group fee structure, fund shareholders will benefit from lower management fees as assets under FMR's management increase at the fund complex level, regardless of whether Fidelity achieves any such economies of scale.
The Board concluded, considering the findings of the Economies of Scale Committee, that any potential economies of scale are being appropriately shared between fund shareholders and Fidelity.
Additional Information Requested by the Board. In order to develop fully the factual basis for consideration of the Fidelity funds' Advisory Contracts, the Board requested and received additional information on certain topics, including (i) fund performance trends, actions to be taken by FMR to improve certain funds' overall performance, and Fidelity's long-term strategies for certain funds; (ii) portfolio manager changes that have occurred during the past year and length of portfolio manager tenure for different categories of funds over time; (iii) Fidelity's compensation structure for portfolio managers, research analysts, and other key personnel, the rationale for the compensation structure, and how the compensation structure provides appropriate performance incentives; (iv) the amount of the investment that each portfolio manager has made in the Fidelity fund(s) that he or she manages; (v) management and other fees paid by FMR to affiliated sub-advisers on behalf of the Fidelity funds; (vi) Fidelity's fee structures and rationale for recommending different fees among different categories of funds; (vii) Fidelity's rationale for recommending which funds should have a performance adjustment component as part of their management fees; (viii) the rationale for any differences between fund fee structures and fee structures in place for other Fidelity clients; and (ix) explanations regarding the relative total expenses borne by certain funds and classes, total expense competitive trends, and actions that might be taken by FMR to reduce total expenses for certain funds and classes.
Based on its evaluation of all of the conclusions noted above, and after considering all factors it believed relevant, the Board ultimately concluded that the advisory fee structures are fair and reasonable, and that the fund's Advisory Contracts should be renewed.
Annual Report
Investment Adviser
Fidelity Management & Research Company
Boston, MA
Investment Sub-Advisers
FMR Co., Inc.
Fidelity Management & Research (U.K.) Inc.
Fidelity Management & Research (Hong Kong) Limited
Fidelity Management & Research (Japan) Inc.
FIL Investment Advisors
FIL Investment Advisors (U.K.) Ltd.
FIL Investments (Japan) Limited
General Distributor
Fidelity Distributors Corporation
Boston, MA
Transfer and Service Agents
Fidelity Investments Institutional Operations Company, Inc.
Boston, MA
Fidelity Service Company, Inc.
Boston, MA
Custodian
State Street Bank and Trust Company
Quincy, MA
VIPEMR-ANN-0211
1.888698.102
Fidelity® Variable Insurance Products:
Energy Portfolio
Annual Report
December 31, 2010
(2_fidelity_logos) (Registered_Trademark)
Contents
Performance | <Click Here> | How the fund has done over time. |
Management's Discussion of Fund Performance | <Click Here> | The Portfolio Manager's review of fund performance and strategy. |
Shareholder Expense Example | <Click Here> | An example of shareholder expenses. |
Investment Changes | <Click Here> | A summary of major shifts in the fund's investments over the past six months. |
Investments | <Click Here> | A complete list of the fund's investments with their market values. |
Financial Statements | <Click Here> | Statements of assets and liabilities, operations, and changes in net assets, as well as financial highlights. |
Notes | <Click Here> | Notes to the financial statements. |
Report of Independent Registered Public Accounting Firm | <Click Here> | |
Trustees and Officers | <Click Here> | |
Distributions | <Click Here> | |
Board Approval of Investment Advisory Contracts and Management Fees | <Click Here> | |
To view a fund's proxy voting guidelines and proxy voting record for the 12-month period ended June 30, visit http://www.fidelity.com/proxyvotingresults or visit the Securities and Exchange Commission's (SEC) web site at http://www.sec.gov. You may also call 1-877-208-0098 to request a free copy of the proxy voting guidelines.
Fidelity Variable Insurance Products are separate account options which are purchased through a variable insurance contract.
Standard & Poor's, S&P and S&P 500 are registered service marks of The McGraw-Hill Companies, Inc. and have been licensed for use by Fidelity Distributors Corporation.
Other third party marks appearing herein are the property of their respective owners.
All other marks appearing herein are registered or unregistered trademarks or service marks of FMR LLC or an affiliated company.
The general research services agreement with Fidelity Research & Analysis Company has been terminated and is no longer in effect for the fund.
This report and the financial statements contained herein are submitted for the general information of the shareholders of the fund. This report is not authorized for distribution to prospective investors in the fund unless preceded or accompanied by an effective prospectus.
A fund files its complete schedule of portfolio holdings with the SEC for the first and third quarters of each fiscal year on Form N-Q. Forms N-Q are available on the SEC's web site at http://www.sec.gov. A fund's Forms N-Q may be reviewed and copied at the SEC's Public Reference Room in Washington, DC. Information regarding the operation of the SEC's Public Reference Room may be obtained by calling 1-800-SEC-0330. For a complete list of the fund's portfolio holdings, view the most recent holdings listing, semiannual report, or annual report on Fidelity's web site at http://www.fidelity.com, http://www.advisor.fidelity.com, or http://www.401k.com, as applicable.
NOT FDIC INSURED • MAY LOSE VALUE • NO BANK GUARANTEE
Neither the fund nor Fidelity Distributors Corporation is a bank.
Annual Report
Average annual total return reflects the change in the value of an investment, assuming reinvestment of the class' distributions from dividend income and capital gains (the profits earned upon the sale of securities that have grown in value, if any) and assuming a constant rate of performance each year. During periods of reimbursement by Fidelity, a fund's total return will be greater than it would be had the reimbursement not occurred. Performance numbers are net of all underlying fund operating expenses, but do not include any insurance charges imposed by your insurance company's separate account. If performance information included the effect of these additional charges, the total returns would have been lower. How a fund did yesterday is no guarantee of how it will do tomorrow.
Average Annual Total Returns
Periods ended December 31, 2010 | Past 1
year | Past 5
years | Life of
fundA |
VIP Energy Portfolio - Initial Class C | 19.45% | 6.64% | 11.50% |
VIP Energy Portfolio - Investor ClassB, C | 19.34% | 6.52% | 11.43% |
A From July 19, 2001.
B The initial offering of Investor Class took place on July 21, 2005. Returns prior to July 21, 2005 are those of Initial Class. If Investor Class's transfer agent fee had been reflected, returns prior to July 21, 2005 would have been lower.
C Prior to October 1, 2006, VIP Energy Portfolio operated under certain different investment policies. The historical performance for the fund may not represent its current investment policies.
$10,000 Over Life of Fund
Let's say hypothetically that $10,000 was invested in VIP Energy Portfolio - Initial Class on July 19, 2001, when the fund started. The chart shows how the value of your investment would have changed, and also shows how the S&P 500® Index performed over the same period.
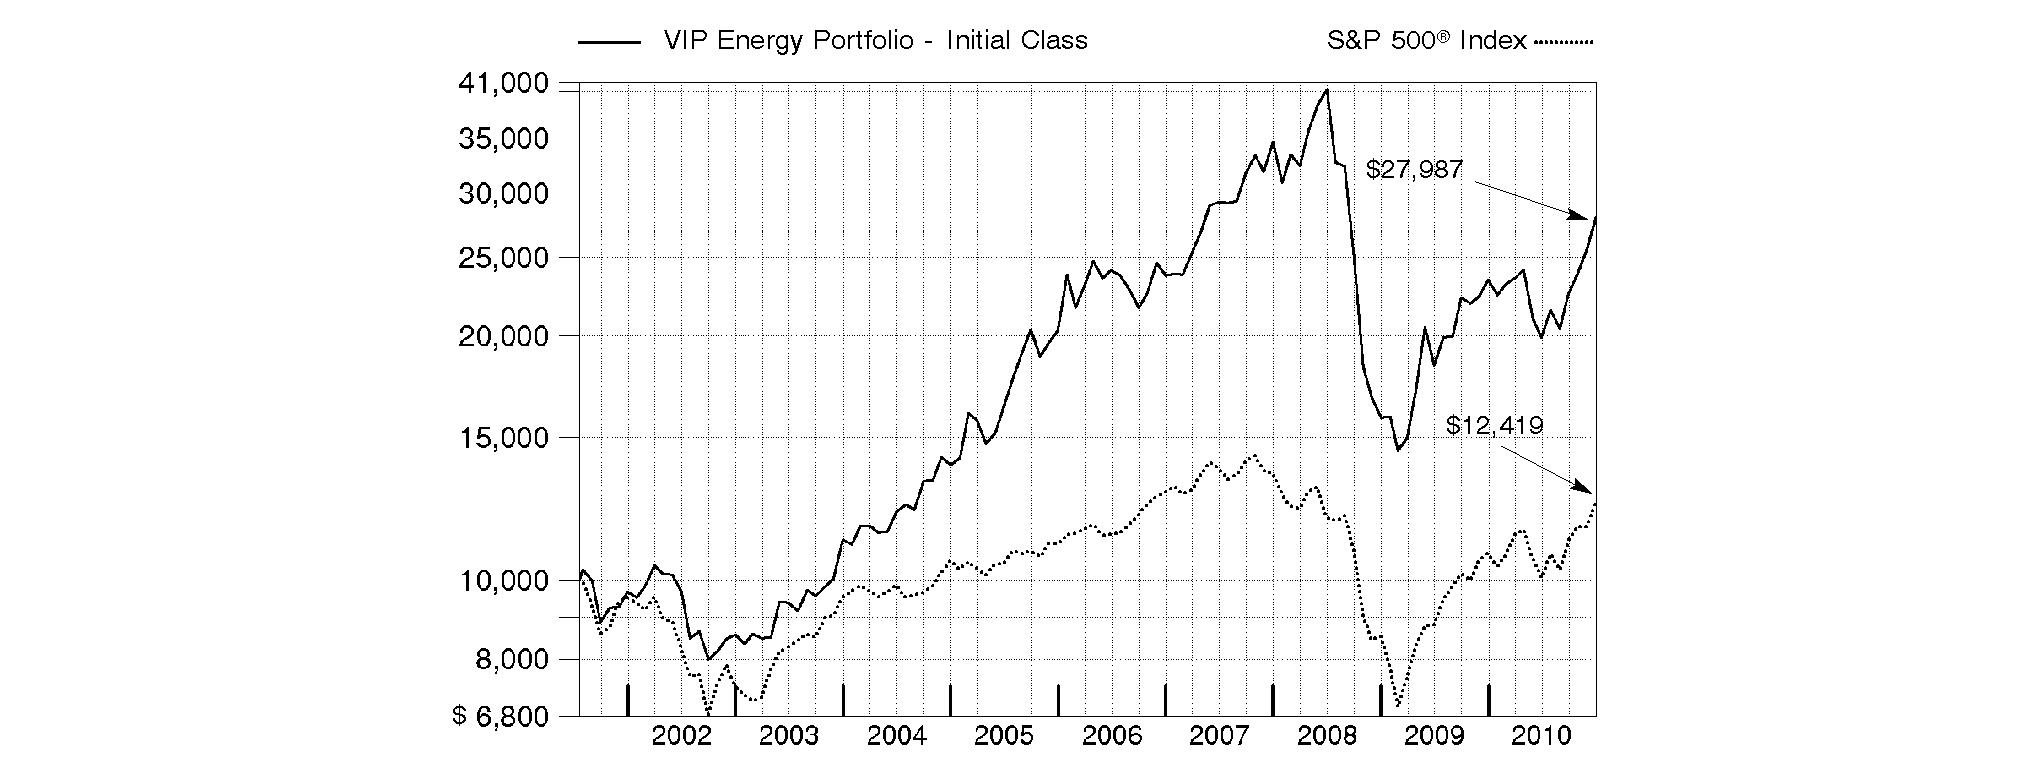
Annual Report
Market Recap: While market improvements around the world hit a speed bump in the first half of the 12-month period ending December 31, 2010, world economies re-accelerated in August, supported by a broadening recovery and low inflation in the U.S. Domestic stock markets recorded solid gains for the year, lifted by a strong second-half rally fueled by economic optimism, encouraging earnings reports and a wave of corporate mergers. The large-cap S&P 500® Index rose 15.06%, the blue-chip-laden Dow Jones Industrial AverageSM added 14.06% and the technology-heavy Nasdaq Composite® Index climbed 18.02%. Meanwhile, international stocks, as represented by the MSCI® ACWI® (All Country World Index) ex USA Index, gained 11.29%, boosted in part by a depreciating U.S. dollar. In the fixed-income arena, U.S. taxable investment-grade bonds generated positive results during 2010, as the Barclays Capital® U.S. Aggregate Bond Index gained 6.54%. With ultra-low interest rates bolstering nearly all fixed-income securities for most of the year, sectors in the index with higher yields and more credit risk generally fared best, while most high-quality bonds generated more-moderate returns. Meanwhile, high-yield bonds, as represented by The BofA Merrill LynchSM US High Yield Constrained Index, returned 15.07%, a result of improved economic data and strengthening investor demand. Overseas, foreign bond markets showed mixed results, with a sizable disparity between the 3.97% return of the Citigroup® Non-U.S. Group of 7 Index - which measures the performance of sovereign debt of the major global economies outside the U.S. - and the 12.04% advance of the JPMorgan Emerging Markets Bond Index Global (EMBI Global), which benefited from the rising overall credit quality of emerging-markets debt issuers.
Comments from John Dowd, Portfolio Manager of VIP Energy Portfolio: For the year, the fund's share classes fell short of the 21.42% return of the MSCI® U.S. IM Energy 25/50 Index - which was adopted in January 2010 as a better representation of the fund's investment universe - - but outperformed the S&P 500®. (For specific portfolio results, please refer to the performance section of this report.) Stock selection in oil/gas exploration and production and an overweighting in the weak oil/gas drilling segment accounted for the fund's largest detractors during the period. Firms directly tied to natural gas production, also known as natural gas "pure plays," were among the biggest individual detractors, as natural gas production rose during the period, and caused gas prices to fall by about 20% for the year. On the positive side, the fund was helped by positioning in the oil/gas equipment services and coal/consumable fuels groups, along with an overweighting in oil/gas refining/marketing. On an individual security basis, natural gas companies Southwestern Energy, Petrohawk Energy and Cabot Oil & Gas detracted. An underweighting in oil company ConocoPhillips hurt, as did a stake in Transocean, owner of the ill-fated Deepwater Horizon rig in the Gulf of Mexico. Underweighting benchmark giant Exxon Mobil was a big positive, even though I started buying the stock aggressively in April, as its stock began to decline. At period end, it was the fund's largest holding and carried a share price of around of $73. Two industry acquisitions also helped. In February, exploration services provider Smith International agreed to be acquired by Schlumberger, and BJ Services was acquired by Baker Hughes in April, both at a premium price. The fund was overweighted in BJ and Smith, along with exploration firm Whiting Petroleum, whose stock rose on successful oil production in the mammoth Bakken Shale formation in North Dakota. The fund also was helped by an underweighted position in EOG Resources, whose exposure to natural gas hurt its stock price. Some of the stocks I've mentioned were sold from the fund by period end.
The views expressed above reflect those of the portfolio manager(s) only through the end of the period as stated on the cover of this report and do not necessarily represent the views of Fidelity or any other person in the Fidelity organization. Any such views are subject to change at any time based upon market or other conditions and Fidelity disclaims any responsibility to update such views. These views may not be relied on as investment advice and, because investment decisions for a Fidelity fund are based on numerous factors, may not be relied on as an indication of trading intent on behalf of any Fidelity fund.
Annual Report
As a shareholder of the Fund, you incur two types of costs: (1) transaction costs, including redemption fees, and (2) ongoing costs, including management fees, distribution and/or service (12b-1) fees and other Fund expenses. This Example is intended to help you understand your ongoing costs (in dollars) of investing in the Fund and to compare these costs with the ongoing costs of investing in other mutual funds.
The Example is based on an investment of $1,000 invested at the beginning of the period and held for the entire period (July 1, 2010 to December 31, 2010).
Actual Expenses
The first line of the accompanying table for each class of the Fund provides information about actual account values and actual expenses. You may use the information in this line, together with the amount you invested, to estimate the expenses that you paid over the period. Simply divide your account value by $1,000.00 (for example, an $8,600 account value divided by $1,000.00 = 8.6), then multiply the result by the number in the first line for a class of the Fund under the heading entitled "Expenses Paid During Period" to estimate the expenses you paid on your account during this period. The estimate of expenses does not include any fees or other expenses of any variable annuity or variable life insurance product. If they were, the estimate of expenses you paid during the period would be higher, and your ending account value would be lower. In addition, the Fund, as a shareholder in the underlying Fidelity Central Funds, will indirectly bear its pro-rata share of the fees and expenses incurred by the underlying Fidelity Central Funds. These fees and expenses are not included in the Fund's annualized expense ratio used to calculate the expense estimate in the table below.
Hypothetical Example for Comparison Purposes
The second line of the accompanying table for each class of the Fund provides information about hypothetical account values and hypothetical expenses based on a Class' actual expense ratio and an assumed rate of return of 5% per year before expenses, which is not the Class' actual return. The hypothetical account values and expenses may not be used to estimate the actual ending account balance or expenses you paid for the period. You may use this information to compare the ongoing costs of investing in the Fund and other funds. To do so, compare this 5% hypothetical example with the 5% hypothetical examples that appear in the shareholder reports of the other funds. The estimate of expenses does not include any fees or other expenses of any variable annuity or variable life insurance product. If they were, the estimate of expenses you paid during the period would be higher, and your ending account value would be lower. In addition, the Fund, as a shareholder in the underlying Fidelity Central Funds, will indirectly bear its pro-rata share of the fees and expenses incurred by the underlying Fidelity Central Funds. These fees and expenses are not included in the Fund's annualized expense ratio used to calculate the expense estimate in the table below.
Please note that the expenses shown in the table are meant to highlight your ongoing costs only and do not reflect any transaction costs. Therefore, the second line of the table is useful in comparing ongoing costs only, and will not help you determine the relative total costs of owning different funds. In addition, if these transactional costs were included, your costs would have been higher.
| Annualized
Expense Ratio | Beginning
Account Value
July 1, 2010 | Ending
Account Value
December 31, 2010 | Expenses Paid
During Period*
July 1, 2010 to
December 31, 2010 |
Initial Class | .69% | | | |
Actual | | $ 1,000.00 | $ 1,407.10 | $ 4.19 |
HypotheticalA | | $ 1,000.00 | $ 1,021.73 | $ 3.52 |
Service Class 2 | .93% | | | |
Actual | | $ 1,000.00 | $ 1,404.90 | $ 5.64 |
HypotheticalA | | $ 1,000.00 | $ 1,020.52 | $ 4.74 |
Investor Class | .77% | | | |
Actual | | $ 1,000.00 | $ 1,407.20 | $ 4.67 |
HypotheticalA | | $ 1,000.00 | $ 1,021.32 | $ 3.92 |
A 5% return per year before expenses
* Expenses are equal to each Class' annualized expense ratio, multiplied by the average account value over the period, multiplied by 184/365 (to reflect the one-half year period).
Annual Report
Investment Changes (Unaudited)
Top Ten Stocks as of December 31, 2010 |
| % of fund's
net assets | % of fund's net assets
6 months ago |
Exxon Mobil Corp. | 17.2 | 15.9 |
Occidental Petroleum Corp. | 6.7 | 3.7 |
Schlumberger Ltd. | 6.5 | 6.0 |
Chevron Corp. | 5.3 | 6.2 |
Marathon Oil Corp. | 4.1 | 4.9 |
National Oilwell Varco, Inc. | 3.9 | 2.3 |
Halliburton Co. | 3.8 | 2.0 |
Apache Corp. | 3.4 | 2.0 |
Massey Energy Co. | 2.9 | 1.6 |
Baker Hughes, Inc. | 2.8 | 4.0 |
| 56.6 | |
Top Industries (% of fund's net assets) |
As of December 31, 2010 |
| Oil, Gas &
Consumable Fuels | 68.4% | |
| Energy Equipment & Services | 26.4% | |
| Construction & Engineering | 2.1% | |
| Chemicals | 1.4% | |
| Metals & Mining | 0.9% | |
| All Others* | 0.8% | |

As of June 30, 2010 |
| Oil, Gas &
Consumable Fuels | 63.9% | |
| Energy Equipment & Services | 32.1% | |
| Electrical Equipment | 1.5% | |
| Construction & Engineering | 1.3% | |
| Gas Utilities | 0.8% | |
| All Others* | 0.4% | |

* Includes short-term investments and net other assets. |
Annual Report
Investments December 31, 2010
Showing Percentage of Net Assets
Common Stocks - 99.2% |
| Shares | | Value |
CHEMICALS - 1.4% |
Specialty Chemicals - 1.4% |
LyondellBasell Industries NV Class A (a) | 161,990 | | $ 5,572,456 |
CONSTRUCTION & ENGINEERING - 2.1% |
Construction & Engineering - 2.1% |
Fluor Corp. | 7,700 | | 510,202 |
Foster Wheeler AG (a) | 27,000 | | 932,040 |
Jacobs Engineering Group, Inc. (a) | 59,000 | | 2,705,150 |
KBR, Inc. | 124,141 | | 3,782,576 |
| | 7,929,968 |
ENERGY EQUIPMENT & SERVICES - 26.4% |
Oil & Gas Drilling - 4.4% |
Ensco International Ltd. ADR | 132,366 | | 7,065,697 |
Noble Corp. | 53,420 | | 1,910,833 |
Northern Offshore Ltd. (a) | 202,628 | | 519,969 |
Ocean Rig UDW, Inc. (a) | 100,500 | | 1,776,807 |
Transocean Ltd. (a) | 74,767 | | 5,197,054 |
Tuscany International Drilling, Inc. (a) | 253,200 | | 355,440 |
| | 16,825,800 |
Oil & Gas Equipment & Services - 22.0% |
Baker Hughes, Inc. | 187,630 | | 10,726,807 |
Dresser-Rand Group, Inc. (a) | 29,100 | | 1,239,369 |
Halliburton Co. | 356,564 | | 14,558,508 |
National Oilwell Varco, Inc. | 223,967 | | 15,061,781 |
Oceaneering International, Inc. (a) | 96,114 | | 7,076,874 |
Oil States International, Inc. (a) | 42,310 | | 2,711,648 |
Schlumberger Ltd. | 298,991 | | 24,965,749 |
Schoeller-Bleckmann Oilfield Equipment AG | 11,149 | | 961,451 |
Superior Energy Services, Inc. (a) | 34,354 | | 1,202,046 |
TSC Offshore Group Ltd. (a) | 746,000 | | 190,999 |
Weatherford International Ltd. (a) | 192,257 | | 4,383,460 |
Willbros Group, Inc. (a) | 77,533 | | 761,374 |
| | 83,840,066 |
TOTAL ENERGY EQUIPMENT & SERVICES | | 100,665,866 |
GAS UTILITIES - 0.0% |
Gas Utilities - 0.0% |
China Gas Holdings Ltd. | 459,260 | | 200,308 |
METALS & MINING - 0.9% |
Diversified Metals & Mining - 0.9% |
Grande Cache Coal Corp. (a) | 39,537 | | 415,073 |
MacArthur Coal Ltd. | 73,566 | | 962,079 |
Walter Energy, Inc. | 16,000 | | 2,045,440 |
| | 3,422,592 |
OIL, GAS & CONSUMABLE FUELS - 68.4% |
Coal & Consumable Fuels - 7.1% |
Alpha Natural Resources, Inc. (a) | 172,883 | | 10,378,166 |
|
| Shares | | Value |
Massey Energy Co. | 205,344 | | $ 11,016,706 |
Peabody Energy Corp. | 86,000 | | 5,502,280 |
| | 26,897,152 |
Integrated Oil & Gas - 37.4% |
Chevron Corp. | 223,989 | | 20,438,996 |
Exxon Mobil Corp. | 896,564 | | 65,556,758 |
Hess Corp. | 59,619 | | 4,563,238 |
Marathon Oil Corp. | 421,489 | | 15,607,738 |
Murphy Oil Corp. | 49,400 | | 3,682,770 |
Occidental Petroleum Corp. | 259,711 | | 25,477,649 |
Royal Dutch Shell PLC Class B ADR | 111,600 | | 7,440,372 |
| | 142,767,521 |
Oil & Gas Exploration & Production - 14.2% |
Alange Energy Corp. (a) | 73,000 | | 39,527 |
Anadarko Petroleum Corp. | 117,798 | | 8,971,496 |
Apache Corp. | 107,519 | | 12,819,490 |
Chesapeake Energy Corp. | 39,500 | | 1,023,445 |
Cimarex Energy Co. | 81,144 | | 7,183,678 |
EXCO Resources, Inc. | 59,194 | | 1,149,547 |
Gran Tierra Energy, Inc. (a) | 104,600 | | 848,505 |
Newfield Exploration Co. (a) | 67,924 | | 4,898,000 |
Niko Resources Ltd. | 7,700 | | 796,637 |
Northern Oil & Gas, Inc. (a) | 5,000 | | 136,050 |
Pacific Rubiales Energy Corp. | 10,700 | | 362,103 |
Painted Pony Petroleum Ltd. Class A (a) | 67,000 | | 587,165 |
Petrobank Energy & Resources Ltd. (a) | 10,800 | | 273,438 |
Petrominerales Ltd. | 19,042 | | 633,142 |
Pioneer Natural Resources Co. | 42,834 | | 3,718,848 |
Talisman Energy, Inc. | 77,900 | | 1,727,813 |
Toreador Resources Corp. (a)(d) | 12,900 | | 200,208 |
Vermilion Energy, Inc. | 4,100 | | 190,015 |
Whiting Petroleum Corp. (a) | 72,703 | | 8,520,065 |
| | 54,079,172 |
Oil & Gas Refining & Marketing - 9.7% |
CVR Energy, Inc. (a) | 183,534 | | 2,786,046 |
Frontier Oil Corp. | 243,781 | | 4,390,496 |
Holly Corp. | 187,106 | | 7,628,312 |
Petroplus Holdings AG | 34,970 | | 461,126 |
Sunoco, Inc. | 159,922 | | 6,446,456 |
Tesoro Corp. | 275,800 | | 5,113,332 |
Valero Energy Corp. | 310,057 | | 7,168,518 |
Western Refining, Inc. (a)(d) | 144,694 | | 1,530,863 |
World Fuel Services Corp. | 42,650 | | 1,542,224 |
| | 37,067,373 |
TOTAL OIL, GAS & CONSUMABLE FUELS | | 260,811,218 |
TOTAL COMMON STOCKS (Cost $300,801,502) | 378,602,408 |
Convertible Bonds - 0.0% |
| Principal Amount | | Value |
SEMICONDUCTORS & SEMICONDUCTOR EQUIPMENT - 0.0% |
Semiconductors - 0.0% |
SunPower Corp. 4.75% 4/15/14
(Cost $180,000) | | $ 180,000 | | $ 165,825 |
Money Market Funds - 1.4% |
| Shares | | |
Fidelity Cash Central Fund, 0.19% (b) | 4,012,389 | | 4,012,389 |
Fidelity Securities Lending Cash Central Fund, 0.21% (b)(c) | 1,141,500 | | 1,141,500 |
TOTAL MONEY MARKET FUNDS (Cost $5,153,889) | 5,153,889 |
TOTAL INVESTMENT PORTFOLIO - 100.6% (Cost $306,135,391) | | 383,922,122 |
NET OTHER ASSETS (LIABILITIES) - (0.6)% | | (2,422,968) |
NET ASSETS - 100% | $ 381,499,154 |
Legend |
(a) Non-income producing |
(b) Affiliated fund that is available only to investment companies and other accounts managed by Fidelity Investments. The rate quoted is the annualized seven-day yield of the fund at period end. A complete unaudited listing of the fund's holdings as of its most recent quarter end is available upon request. In addition, each Fidelity Central Fund's financial statements, which are not covered by the Fund's Report of Independent Registered Public Accounting Firm, are available on the SEC's website or upon request. |
(c) Investment made with cash collateral received from securities on loan. |
(d) Security or a portion of the security is on loan at period end. |
Affiliated Central Funds |
Information regarding fiscal year to date income earned by the Fund from investments in Fidelity Central Funds is as follows: |
Fund | Income earned |
Fidelity Cash Central Fund | $ 3,553 |
Fidelity Securities Lending Cash Central Fund | 51,034 |
Total | $ 54,587 |
Other Information |
The following is a summary of the inputs used, as of December 31, 2010, involving the Fund's assets and liabilities carried at fair value. The inputs or methodology used for valuing securities may not be an indication of the risk associated with investing in those securities. For more information on valuation inputs, and their aggregation into the levels used in the tables below, please refer to the Security Valuation section in the accompanying Notes to Financial Statements. |
Valuation Inputs at Reporting Date: |
Description | Total | Level 1 | Level 2 | Level 3 |
Investments in Securities: | | | | |
Common Stocks | $ 378,602,408 | $ 378,402,100 | $ - | $ 200,308 |
Convertible Bonds | 165,825 | - | 165,825 | - |
Money Market Funds | 5,153,889 | 5,153,889 | - | - |
Total Investments in Securities: | $ 383,922,122 | $ 383,555,989 | $ 165,825 | $ 200,308 |
The following is a reconciliation of Investments in Securities for which Level 3 inputs were used in determining value: |
Investments in Securities: | |
Beginning Balance | $ - |
Total Realized Gain (Loss) | (1,462) |
Total Unrealized Gain (Loss) | (38,184) |
Cost of Purchases | 304,962 |
Proceeds of Sales | (65,008) |
Amortization/Accretion | - |
Transfers in to Level 3 | - |
Transfers out of Level 3 | - |
Ending Balance | $ 200,308 |
The change in unrealized gain (loss) for the period attributable to Level 3 securities held at December 31, 2010 | $ (38,184) |
The information used in the above reconciliation represents fiscal year to date activity for any Investments in Securities identified as using Level 3 inputs at either the beginning or the end of the current fiscal period. Transfers in or out of Level 3 represent the beginning value of any Security or Instrument where a change in the pricing level occurred from the beginning to the end of the period. The cost of purchases and the proceeds of sales may include securities received or delivered through corporate actions or exchanges. Realized and unrealized gains (losses) disclosed in the reconciliation are included in Net Gain (Loss) on the Fund's Statement of Operations. |
Distribution of investments by country of issue, as a percentage of total net assets, is as follows: (Unaudited) |
United States of America | 82.1% |
Netherlands Antilles | 6.5% |
United Kingdom | 3.7% |
Switzerland | 3.5% |
Netherlands | 1.4% |
Canada | 1.3% |
Others (Individually Less Than 1%) | 1.5% |
| 100.0% |
Income Tax Information |
At December 31, 2010, the Fund had a capital loss carryforward of approximately $60,968,108 of which $53,220,311 and $7,747,797 will expire in fiscal 2017 and 2018, respectively. Capital loss carryforwards are only available to offset future capital gains of the Fund to the extent provided by regulations and may be limited. |
See accompanying notes which are an integral part of the financial statements.
Annual Report
Statement of Assets and Liabilities
| December 31, 2010 |
Assets | | |
Investment in securities, at value (including securities loaned of $1,123,620) - See accompanying schedule: Unaffiliated issuers (cost $300,981,502) | $ 378,768,233 | |
Fidelity Central Funds (cost $5,153,889) | 5,153,889 | |
Total Investments (cost $306,135,391) | | $ 383,922,122 |
Foreign currency held at value (cost $96) | | 96 |
Receivable for investments sold | | 1,220,820 |
Receivable for fund shares sold | | 361,128 |
Dividends receivable | | 415,623 |
Interest receivable | | 1,809 |
Distributions receivable from Fidelity Central Funds | | 1,843 |
Prepaid expenses | | 932 |
Other receivables | | 3,022 |
Total assets | | 385,927,395 |
| | |
Liabilities | | |
Payable for investments purchased | $ 2,922,133 | |
Payable for fund shares redeemed | 94,173 | |
Accrued management fee | 168,871 | |
Distribution and service plan fees payable | 25,802 | |
Other affiliated payables | 38,488 | |
Other payables and accrued expenses | 37,274 | |
Collateral on securities loaned, at value | 1,141,500 | |
Total liabilities | | 4,428,241 |
| | |
Net Assets | | $ 381,499,154 |
Net Assets consist of: | | |
Paid in capital | | $ 368,580,479 |
Undistributed net investment income | | 125,041 |
Accumulated undistributed net realized gain (loss) on investments and foreign currency transactions | | (64,992,485) |
Net unrealized appreciation (depreciation) on investments and assets and liabilities in foreign currencies | | 77,786,119 |
Net Assets | | $ 381,499,154 |
Statement of Assets and Liabilities - continued
| December 31, 2010 |
| | |
Initial Class:
Net Asset Value, offering price and redemption price per share ($148,774,480 ÷ 7,421,564 shares) | | $ 20.05 |
| | |
Service Class 2:
Net Asset Value, offering price and redemption price per share ($129,043,148 ÷ 6,470,982 shares) | | $ 19.94 |
| | |
Investor Class:
Net Asset Value, offering price and redemption price per share ($103,681,526 ÷ 5,182,484 shares) | | $ 20.01 |
See accompanying notes which are an integral part of the financial statements.
Annual Report
Financial Statements - continued
Statement of Operations
| Year ended December 31, 2010 |
Investment Income | | |
Dividends | | $ 4,415,850 |
Interest | | 8,552 |
Income from Fidelity Central Funds | | 54,587 |
Total income | | 4,478,989 |
| | |
Expenses | | |
Management fee | $ 1,868,185 | |
Transfer agent fees | 327,093 | |
Distribution and service plan fees | 286,996 | |
Accounting and security lending fees | 131,100 | |
Custodian fees and expenses | 36,881 | |
Independent trustees' compensation | 1,891 | |
Audit | 38,150 | |
Legal | 1,715 | |
Miscellaneous | 4,619 | |
Total expenses before reductions | 2,696,630 | |
Expense reductions | (39,493) | 2,657,137 |
Net investment income (loss) | | 1,821,852 |
Realized and Unrealized Gain (Loss) Net realized gain (loss) on: | | |
Investment securities: | | |
Unaffiliated issuers | 2,142,129 | |
Foreign currency transactions | (12,861) | |
Total net realized gain (loss) | | 2,129,268 |
Change in net unrealized appreciation (depreciation) on: Investment securities | 52,796,838 | |
Assets and liabilities in foreign currencies | 515 | |
Total change in net unrealized appreciation (depreciation) | | 52,797,353 |
Net gain (loss) | | 54,926,621 |
Net increase (decrease) in net assets resulting from operations | | $ 56,748,473 |
Statement of Changes in Net Assets
| Year ended
December 31, 2010 | Year ended
December 31, 2009 |
Increase (Decrease) in Net Assets | | |
Operations | | |
Net investment income (loss) | $ 1,821,852 | $ 1,147,835 |
Net realized gain (loss) | 2,129,268 | (28,944,722) |
Change in net unrealized appreciation (depreciation) | 52,797,353 | 147,681,057 |
Net increase (decrease) in net assets resulting from operations | 56,748,473 | 119,884,170 |
Distributions to shareholders from net investment income | (1,680,556) | (1,156,325) |
Share transactions - net increase (decrease) | (41,330,324) | (14,569,173) |
Redemption fees | 143,706 | 154,874 |
Total increase (decrease) in net assets | 13,881,299 | 104,313,546 |
| | |
Net Assets | | |
Beginning of period | 367,617,855 | 263,304,309 |
End of period (including undistributed net investment income of $125,041 and $0, respectively) | $ 381,499,154 | $ 367,617,855 |
See accompanying notes which are an integral part of the financial statements.
Annual Report
Financial Highlights - Initial Class
Years ended December 31, | 2010 | 2009 | 2008 | 2007 | 2006 |
Selected Per-Share Data | | | | | |
Net asset value, beginning of period | $ 16.88 | $ 11.46 | $ 26.55 | $ 19.04 | $ 18.92 |
Income from Investment Operations | | | | | |
Net investment income (loss) C | .11 | .07 | .03 | .07 | .09 |
Net realized and unrealized gain (loss) | 3.16 | 5.41 | (14.31) | 8.62 | 3.09 |
Total from investment operations | 3.27 | 5.48 | (14.28) | 8.69 | 3.18 |
Distributions from net investment income | (.11) | (.07) | (.03) | (.06) | (.16) |
Distributions from net realized gain | - | - | (.80) | (1.13) | (2.91) |
Total distributions | (.11) | (.07) | (.83) | (1.19) | (3.07) |
Redemption fees added to paid in capital C | .01 | .01 | .02 | .01 | .01 |
Net asset value, end of period | $ 20.05 | $ 16.88 | $ 11.46 | $ 26.55 | $ 19.04 |
Total Return A, B | 19.45% | 47.90% | (54.26)% | 45.97% | 16.91% |
Ratios to Average Net Assets D, F | | | | | |
Expenses before reductions | .70% | .71% | .70% | .70% | .71% |
Expenses net of fee waivers, if any | .69% | .71% | .70% | .70% | .71% |
Expenses net of all reductions | .69% | .70% | .69% | .70% | .70% |
Net investment income (loss) | .65% | .47% | .13% | .31% | .43% |
Supplemental Data | | | | | |
Net assets, end of period (000 omitted) | $ 148,774 | $ 152,028 | $ 117,940 | $ 355,854 | $ 280,537 |
Portfolio turnover rate E | 105% | 113% | 130% | 61% | 151% |
A Total returns do not reflect charges attributable to your insurance company's separate account. Inclusion of these charges would reduce the total returns shown.
B Total returns would have been lower had certain expenses not been reduced during the periods shown.
C Calculated based on average shares outstanding during the period.
D Fees and expenses of the underlying Fidelity Central Funds are not included in the Fund's expense ratio. The Fund indirectly bears its proportionate share of the expenses of any underlying Fidelity Central Funds.
E Amount does not include the portfolio activity of any underlying Fidelity Central Funds.
F Expense ratios reflect operating expenses of the class. Expenses before reductions do not reflect amounts reimbursed by the investment adviser or reductions from brokerage service arrangements or reductions from other expense offset arrangements and do not represent the amount paid by the class during periods when reimbursements or reductions occur. Expenses net of fee waivers reflect expenses after reimbursement by the investment adviser but prior to reductions from brokerage service arrangements or other expense offset arrangements. Expenses net of all reductions represent the net expenses paid by the class.
Financial Highlights - Service Class 2
Years ended December 31, | 2010 | 2009 | 2008 | 2007 | 2006 |
Selected Per-Share Data | | | | | |
Net asset value, beginning of period | $ 16.79 | $ 11.40 | $ 26.44 | $ 18.98 | $ 18.90 |
Income from Investment Operations | | | | | |
Net investment income (loss) C | .07 | .03 | (.03) | .02 | .04 |
Net realized and unrealized gain (loss) | 3.13 | 5.38 | (14.23) | 8.58 | 3.07 |
Total from investment operations | 3.20 | 5.41 | (14.26) | 8.60 | 3.11 |
Distributions from net investment income | (.06) | (.03) | - | (.02) | (.13) |
Distributions from net realized gain | - | - | (.80) | (1.13) | (2.91) |
Total distributions | (.06) | (.03) | (.80) | (1.15) | (3.04) |
Redemption fees added to paid in capital C | .01 | .01 | .02 | .01 | .01 |
Net asset value, end of period | $ 19.94 | $ 16.79 | $ 11.40 | $ 26.44 | $ 18.98 |
Total Return A, B | 19.16% | 47.57% | (54.40)% | 45.64% | 16.55% |
Ratios to Average Net Assets D, F | | | | | |
Expenses before reductions | .95% | .96% | .95% | .95% | .96% |
Expenses net of fee waivers, if any | .94% | .96% | .95% | .95% | .96% |
Expenses net of all reductions | .94% | .95% | .94% | .94% | .95% |
Net investment income (loss) | .40% | .22% | (.12)% | .07% | .18% |
Supplemental Data | | | | | |
Net assets, end of period (000 omitted) | $ 129,043 | $ 125,669 | $ 90,109 | $ 193,887 | $ 70,305 |
Portfolio turnover rate E | 105% | 113% | 130% | 61% | 151% |
A Total returns do not reflect charges attributable to your insurance company's separate account. Inclusion of these charges would reduce the total returns shown.
B Total returns would have been lower had certain expenses not been reduced during the periods shown.
C Calculated based on average shares outstanding during the period.
D Fees and expenses of the underlying Fidelity Central Funds are not included in the Fund's expense ratio. The Fund indirectly bears its proportionate share of the expenses of any underlying Fidelity Central Funds.
E Amount does not include the portfolio activity of any underlying Fidelity Central Funds.
F Expense ratios reflect operating expenses of the class. Expenses before reductions do not reflect amounts reimbursed by the investment adviser or reductions from brokerage service arrangements or reductions from other expense offset arrangements and do not represent the amount paid by the class during periods when reimbursements or reductions occur. Expenses net of fee waivers reflect expenses after reimbursement by the investment adviser but prior to reductions from brokerage service arrangements or other expense offset arrangements. Expenses net of all reductions represent the net expenses paid by the class.
See accompanying notes which are an integral part of the financial statements.
Annual Report
Financial Highlights - Investor Class
Years ended December 31, | 2010 | 2009 | 2008 | 2007 | 2006 |
Selected Per-Share Data | | | | | |
Net asset value, beginning of period | $ 16.85 | $ 11.44 | $ 26.49 | $ 19.00 | $ 18.91 |
Income from Investment Operations | | | | | |
Net investment income (loss) C | .09 | .05 | .01 | .05 | .06 |
Net realized and unrealized gain (loss) | 3.16 | 5.41 | (14.28) | 8.61 | 3.08 |
Total from investment operations | 3.25 | 5.46 | (14.27) | 8.66 | 3.14 |
Distributions from net investment income | (.10) | (.06) | -G | (.05) | (.15) |
Distributions from net realized gain | - | - | (.80) | (1.13) | (2.91) |
Total distributions | (.10) | (.06) | (.80) | (1.18) | (3.06) |
Redemption fees added to paid in capital C | .01 | .01 | .02 | .01 | .01 |
Net asset value, end of period | $ 20.01 | $ 16.85 | $ 11.44 | $ 26.49 | $ 19.00 |
Total Return A,B | 19.34% | 47.79% | (54.32)% | 45.88% | 16.69% |
Ratios to Average Net Assets D, F | | | | | |
Expenses before reductions | .79% | .81% | .79% | .81% | .84% |
Expenses net of fee waivers, if any | .78% | .81% | .79% | .81% | .84% |
Expenses net of all reductions | .77% | .80% | .78% | .81% | .82% |
Net investment income (loss) | .57% | .37% | .04% | .20% | .31% |
Supplemental Data | | | | | |
Net assets, end of period (000 omitted) | $ 103,682 | $ 89,921 | $ 55,256 | $ 131,198 | $ 51,436 |
Portfolio turnover rate E | 105% | 113% | 130% | 61% | 151% |
A Total returns do not reflect charges attributable to your insurance company's separate account. Inclusion of these charges would reduce the total returns shown.
B Total returns would have been lower had certain expenses not been reduced during the periods shown.
C Calculated based on average shares outstanding during the period.
D Fees and expenses of the underlying Fidelity Central Funds are not included in the Fund's expense ratio. The Fund indirectly bears its proportionate share of the expenses of any underlying Fidelity Central Funds.
E Amount does not include the portfolio activity of any underlying Fidelity Central Funds.
F Expense ratios reflect operating expenses of the class. Expenses before reductions do not reflect amounts reimbursed by the investment adviser or reductions from brokerage service arrangements or reductions from other expense offset arrangements and do not represent the amount paid by the class during periods when reimbursements or reductions occur. Expenses net of fee waivers reflect expenses after reimbursement by the investment adviser but prior to reductions from brokerage service arrangements or other expense offset arrangements. Expenses net of all reductions represent the net expenses paid by the class.
G Amount represents less than $.01 per share.
See accompanying notes which are an integral part of the financial statements.
Annual Report
Notes to Financial Statements
For the period ended December 31, 2010
1. Organization.
VIP Energy Portfolio (the Fund) is a non-diversified fund of Variable Insurance Products Fund IV (the Trust) and is authorized to issue an unlimited number of shares. The Trust is registered under the Investment Company Act of 1940, as amended (the 1940 Act), as an open-end management investment company organized as a Massachusetts business trust. Shares of the Fund may only be purchased by insurance companies for the purpose of funding variable annuity or variable life insurance contracts. The Fund offers the following classes of shares: Initial Class shares, Service Class 2 shares and Investor Class shares. All classes have equal rights and voting privileges, except for matters affecting a single class. Investment income, realized and unrealized capital gains and losses, the common expenses of the Fund, and certain fund-level expense reductions, if any, are allocated on a pro-rata basis to each class based on the relative net assets of each class to the total net assets of the Fund. Each class differs with respect to transfer agent and distribution and service plan fees incurred. Certain expense reductions may also differ by class.
2. Investments in Fidelity Central Funds.
The Fund may invest in Fidelity Central Funds, which are open-end investment companies available only to other investment companies and accounts managed by Fidelity Management & Research Company (FMR) and its affiliates. The Fund's Schedule of Investments lists each of the Fidelity Central Funds held as of period end, if any, as an investment of the Fund, but does not include the underlying holdings of each Fidelity Central Fund. As an Investing Fund, the Fund indirectly bears its proportionate share of the expenses of the underlying Fidelity Central Funds.
The Money Market Central Funds seek preservation of capital and current income and are managed by Fidelity Investments Money Management, Inc. (FIMM), an affiliate of FMR.
A complete unaudited list of holdings for each Fidelity Central Fund is available upon request or at the Securities and Exchange Commission (the SEC) web site at www.sec.gov. In addition, the financial statements of the Fidelity Central Funds, which are not covered by the Fund's Report of Independent Registered Public Accounting Firm, are available on the SEC web site or upon request.
3. Significant Accounting Policies.
The financial statements have been prepared in conformity with accounting principles generally accepted in the United States of America (GAAP), which require management to make certain estimates and assumptions at the date of the financial statements. Actual results could differ from those estimates. Subsequent events, if any, through the date that the financial statements were issued have been evaluated in the preparation of the financial statements. The following summarizes the significant accounting policies of the Fund:
Security Valuation. Investments are valued as of 4:00 p.m. Eastern time on the last calendar day of the period. The Fund uses independent pricing services approved by the Board of Trustees to value its investments. When current market prices or quotations are not readily available or reliable, valuations may be determined in good faith in accordance with procedures adopted by the Board of Trustees. Factors used in determining value may include market or security specific events, changes in interest rates and credit quality. The frequency with which these procedures are used cannot be predicted and they may be utilized to a significant extent. The value used for net asset value (NAV) calculation under these procedures may differ from published prices for the same securities.
The Fund categorizes the inputs to valuation techniques used to value its investments into a disclosure hierarchy consisting of three levels as shown below.
Level 1 - quoted prices in active markets for identical investments
Level 2 - other significant observable inputs (including quoted prices for similar investments, interest rates, prepayment speeds, etc.)
Level 3 - unobservable inputs (including the Fund's own assumptions based on the best information available)
Changes in valuation techniques may result in transfers in or out of an assigned level within the disclosure hierarchy. The aggregate value of investments by input level, as of December 31, 2010, as well as a roll forward of Level 3 securities, is included at the end of the Fund's Schedule of Investments. Valuation techniques used to value the Fund's investments by major category are as follows.
Equity securities, including restricted securities, for which market quotations are readily available, are valued at the last reported sale price or official closing price as reported by an independent pricing service on the primary market or exchange on which they are traded and are categorized as Level 1 in the hierarchy. In the event there were no sales during the day or closing prices are not available, securities are valued at the last quoted bid price or may be valued using the last available price and are generally categorized as Level 2 in the hierarchy. For foreign equity securities, when significant market or security specific events arise, comparisons to the valuation of American Depositary Receipts (ADRs), futures contracts, Exchange-traded funds (ETFs) and certain indexes as well as quoted prices for similar securities are used and are categorized as Level 2 in the hierarchy in these circumstances. Utilizing these techniques may result in transfers between Level 1 and Level 2. For restricted equity securities and private placements where observable inputs are limited, assumptions about market activity and risk are used and are categorized as Level 3 in the hierarchy.
Annual Report
Notes to Financial Statements - continued
3. Significant Accounting Policies - continued
Security Valuation - continued
Debt securities, including restricted securities, are valued based on evaluated prices received from independent pricing services or from dealers who make markets in such securities. For corporate bonds, pricing services utilize matrix pricing which considers yield or price of bonds of comparable quality, coupon, maturity and type as well as dealer supplied prices and are generally categorized as Level 2 in the hierarchy.
Investments in open-end mutual funds, including the Fidelity Central Funds, are valued at their closing net asset value each business day and are categorized as Level 1 in the hierarchy.
When independent prices are unavailable or unreliable, debt securities may be valued utilizing pricing matrices which consider similar factors that would be used by independent pricing services. These are generally categorized as Level 2 in the hierarchy but may be Level 3 depending on the circumstances.
Foreign Currency. The Fund uses foreign currency contracts to facilitate transactions in foreign-denominated securities. Gains and losses from these transactions may arise from changes in the value of the foreign currency or if the counterparties do not perform under the contracts' terms.
Foreign-denominated assets, including investment securities, and liabilities are translated into U.S. dollars at the exchange rate at period end. Purchases and sales of investment securities, income and dividends received and expenses denominated in foreign currencies are translated into U.S. dollars at the exchange rate in effect on the transaction date.
The effects of exchange rate fluctuations on investments are included with the net realized and unrealized gain (loss) on investment securities. Other foreign currency transactions resulting in realized and unrealized gain (loss) are disclosed separately.
Investment Transactions and Income. For financial reporting purposes, the Fund's investment holdings and NAV include trades executed through the end of the last business day of the period. The NAV per share for processing shareholder transactions is calculated as of the close of business of the New York Stock Exchange (NYSE), normally 4:00 p.m. Eastern time and includes trades executed through the end of the prior business day. Gains and losses on securities sold are determined on the basis of identified cost and may include proceeds received from litigation. Dividend income is recorded on the ex-dividend date, except for certain dividends from foreign securities where the ex-dividend date may have passed, which are recorded as soon as the Fund is informed of the ex-dividend date. Non-cash dividends included in dividend income, if any, are recorded at the fair market value of the securities received. Distributions received on securities that represent a return of capital or capital gain are recorded as a reduction of cost of investments and/or as a realized gain. The Fund estimates the components of distributions received that may be considered return of capital distributions or capital gain distributions. Interest income and distributions from the Fidelity Central Funds are accrued as earned. Interest income includes coupon interest and amortization of premium and accretion of discount on debt securities. Investment income is recorded net of foreign taxes withheld where recovery of such taxes is uncertain.
Expenses. Expenses directly attributable to a fund are charged to that fund. Expenses attributable to more than one fund are allocated among the respective funds on the basis of relative net assets or other appropriate methods. Expense estimates are accrued in the period to which they relate and adjustments are made when actual amounts are known.
Income Tax Information and Distributions to Shareholders. Each year the Fund intends to qualify as a regulated investment company, including distributing substantially all of its taxable income and realized gains under Subchapter M of the Internal Revenue Code and filing its U.S. federal tax return. As a result, no provision for income taxes is required. As of December 31, 2010, the Fund did not have any unrecognized tax benefits in the accompanying financial statements. A fund's federal tax return is subject to examination by the Internal Revenue Service (IRS) for a period of three years. Foreign taxes are provided for based on the Fund's understanding of the tax rules and rates that exist in the foreign markets in which it invests.
Distributions are declared and recorded on the ex-dividend date. Income dividends and capital gain distributions are declared separately for each class. Income and capital gain distributions are determined in accordance with income tax regulations, which may differ from GAAP.
Capital accounts within the financial statements are adjusted for permanent book-tax differences. These adjustments have no impact on net assets or the results of operations. Temporary book-tax differences will reverse in a subsequent period.
Book-tax differences are primarily due to foreign currency transactions, capital loss carryforwards and losses deferred due to wash sales and excise tax regulations.
Annual Report
3. Significant Accounting Policies - continued
Income Tax Information and Distributions to Shareholders - continued
The federal tax cost of investment securities and unrealized appreciation (depreciation) as of period end were as follows:
Gross unrealized appreciation | $ 87,544,960 |
Gross unrealized depreciation | (13,782,606) |
Net unrealized appreciation (depreciation) | $ 73,762,354 |
Tax Cost | $ 310,159,768 |
The tax-based components of distributable earnings as of period end were as follows:
Undistributed ordinary income | $ 125,041 |
Capital loss carryforward | $ (60,968,108) |
Net unrealized appreciation (depreciation) | $ 73,761,742 |
The tax character of distributions paid was as follows:
| December 31, 2010 | December 31, 2009 |
Ordinary Income | $ 1,680,556 | $ 1,156,325 |
Trading (Redemption) Fees. Initial Class shares, Service Class 2 shares, and Investor Class shares held by investors less than 60 days are subject to a redemption fee equal to 1% of the net asset value of shares redeemed. All redemption fees, which reduce the proceeds of the shareholder redemption, are retained by the Fund and accounted for as an addition to paid in capital.
4. Purchases and Sales of Investments.
Purchases and sales of securities, other than short-term securities, aggregated $345,787,538 and $388,773,530, respectively.
5. Fees and Other Transactions with Affiliates.
Management Fee. FMR and its affiliates provide the Fund with investment management related services for which the Fund pays a monthly management fee. The management fee is the sum of an individual fund fee rate that is based on an annual rate of .30% of the Fund's average net assets and a group fee rate that averaged .26% during the period. The group fee rate is based upon the average net assets of all the mutual funds advised by FMR. The group fee rate decreases as assets under management increase and increases as assets under management decrease. For the period, the total annual management fee rate was .56% of the Fund's average net assets.
Distribution and Service Plan Fees. In accordance with Rule 12b-1 of the 1940 Act, the Fund has adopted a separate 12b-1 Plan for Service Class 2 shares. Service Class 2 pays Fidelity Distributors Corporation (FDC), an affiliate of FMR, a service fee. For the period, the service fee is based on an annual rate of .25% of Service Class 2's average net assets.
For the period, total fees for Service Class 2, all of which was re-allowed to insurance companies for the distribution of shares and providing shareholder support services were $286,996.
Transfer Agent Fees. Fidelity Investments Institutional Operations Company, Inc. (FIIOC), an affiliate of FMR, is the Fund's transfer, dividend disbursing, and shareholder servicing agent. FIIOC receives an asset-based fee with respect to each class. Each class (with the exception of Investor Class) pays a transfer agent fee, excluding out of pocket expenses, equal to an annual rate of .07% of average net assets. Investor Class pays a monthly asset-based transfer agent fee of .15% of average net assets. In addition, FIIOC receives an asset-based fee of .01% of average net assets for typesetting, printing and mailing of shareholder reports, except proxy statements. FIIOC has agreed to voluntarily waive this fee until December 31, 2010. (See Note 8: Expense Reductions.) For the period, transfer agent fees for each class, including printing and out of pocket expenses, were as follows:
Initial Class | $ 104,283 |
Service Class 2 | 85,887 |
Investor Class | 136,923 |
| $ 327,093 |
Annual Report
Notes to Financial Statements - continued
5. Fees and Other Transactions with Affiliates - continued
Accounting and Security Lending Fees. Fidelity Service Company, Inc. (FSC), an affiliate of FMR, maintains the Fund's accounting records. The accounting fee is based on the level of average net assets for the month. Under a separate contract, FSC administers the security lending program. The security lending fee is based on the number and duration of lending transactions.
Brokerage Commissions. The Fund placed a portion of its portfolio transactions with brokerage firms which are affiliates of the investment adviser. The commissions paid to these affiliated firms were $3,400 for the period.
6. Committed Line of Credit.
The Fund participates with other funds managed by FMR or an affiliate in a $3.75 billion credit facility (the "line of credit") to be utilized for temporary or emergency purposes to fund shareholder redemptions or for other short-term liquidity purposes. The Fund has agreed to pay commitment fees on its pro-rata portion of the line of credit, which amounted to $1,356 and is reflected in Miscellaneous expenses on the Statement of Operations. During the period, there were no borrowings on this line of credit.
7. Security Lending.
The Fund lends portfolio securities through a lending agent from time to time in order to earn additional income. The lending agent may loan securities to certain qualified borrowers, including Fidelity Capital Markets (FCM), a broker-dealer affiliated with the Fund. On the settlement date of the loan, the Fund receives collateral (in the form of U.S. Treasury obligations, letters of credit and/or cash) against the loaned securities and maintains collateral in an amount not less than 100% of the market value of the loaned securities during the period of the loan. The market value of the loaned securities is determined at the close of business of the Fund and any additional required collateral is delivered to the Fund on the next business day. If the borrower defaults on its obligation to return the securities loaned because of insolvency or other reasons, a fund could experience delays and costs in recovering the securities loaned or in gaining access to the collateral. Any cash collateral received is invested in the Fidelity Securities Lending Cash Central Fund. The value of loaned securities and cash collateral at period end are disclosed on the Fund's Statement of Assets and Liabilities. Security lending income represents the income earned on investing cash collateral, less rebates paid to borrowers and lending agent fees associated with the loan, plus any premium payments received for lending certain types of securities. Security lending income is presented in the Statement of Operations as a component of income from Fidelity Central Funds. Total security lending income during the period amounted to $51,034. During the period, there were no securities loaned to FCM.
8. Expense Reductions.
FMR or its affiliates agreed to waive certain fees during the period as noted in the table below.
Initial Class | $ 9,817 |
Service Class 2 | 8,324 |
Investor Class | 6,098 |
| $ 24,239 |
Many of the brokers with whom FMR places trades on behalf of the Fund provided services to the Fund in addition to trade execution. These services included payments of certain expenses on behalf of the Fund totaling $15,254 for the period.
9. Distributions to Shareholders.
Distributions to shareholders of each class were as follows:
Years ended December 31, | 2010 | 2009 |
From net investment income | | |
Initial Class | $ 800,107 | $ 612,974 |
Service Class 2 | 408,455 | 245,394 |
Investor Class | 471,994 | 297,957 |
Total | $ 1,680,556 | $ 1,156,325 |
Annual Report
10. Share Transactions.
Transactions for each class of shares were as follows:
| Shares | Dollars |
Years ended December 31, | 2010 | 2009 | 2010 | 2009 |
Initial Class | | | | |
Shares sold | 918,470 | 1,204,844 | $ 15,869,720 | $ 16,607,740 |
Reinvestment of distributions | 41,413 | 36,815 | 800,107 | 612,974 |
Shares redeemed | (2,546,072) | (2,529,302) | (41,769,770) | (35,099,465) |
Net increase (decrease) | (1,586,189) | (1,287,643) | $ (25,099,943) | $ (17,878,751) |
Service Class 2 | | | | |
Shares sold | 892,222 | 1,896,791 | $ 15,494,576 | $ 25,683,905 |
Reinvestment of distributions | 21,240 | 14,810 | 408,455 | 245,394 |
Shares redeemed | (1,926,104) | (2,330,582) | (31,528,158) | (30,821,580) |
Net increase (decrease) | (1,012,642) | (418,981) | $ (15,625,127) | $ (4,892,281) |
Investor Class | | | | |
Shares sold | 1,261,085 | 1,690,015 | $ 22,374,304 | $ 23,990,831 |
Reinvestment of distributions | 24,468 | 17,928 | 471,994 | 297,957 |
Shares redeemed | (1,440,817) | (1,201,221) | (23,451,552) | (16,086,929) |
Net increase (decrease) | (155,264) | 506,722 | $ (605,254) | $ 8,201,859 |
11. Other.
The Fund's organizational documents provide former and current trustees and officers with a limited indemnification against liabilities arising in connection with the performance of their duties to the Fund. In the normal course of business, the Fund may also enter into contracts that provide general indemnifications. The Fund's maximum exposure under these arrangements is unknown as this would be dependent on future claims that may be made against the Fund. The risk of material loss from such claims is considered remote.
At the end of the period, FMR or its affiliates were the owners of record of 66% of the total outstanding shares of the Fund and one otherwise unaffiliated shareholder was the owner of record of 34% of the total outstanding shares of the Fund.
Annual Report
Report of Independent Registered Public Accounting Firm
To the Trustees of Variable Insurance Products Fund IV and the Shareholders of VIP Energy Portfolio:
In our opinion, the accompanying statement of assets and liabilities, including the schedule of investments, and the related statements of operations and of changes in net assets and the financial highlights present fairly, in all material respects, the financial position of VIP Energy Portfolio (a fund of Variable Insurance Products Fund IV) at December 31, 2010, the results of its operations for the year then ended, the changes in its net assets for each of the two years in the period then ended and the financial highlights for each of the five years in the period then ended, in conformity with accounting principles generally accepted in the United States of America. These financial statements and financial highlights (hereafter referred to as "financial statements") are the responsibility of the VIP Energy Portfolio's management. Our responsibility is to express an opinion on these financial statements based on our audits. We conducted our audits of these financial statements in accordance with the standards of the Public Company Accounting Oversight Board (United States). Those standards require that we plan and perform the audit to obtain reasonable assurance about whether the financial statements are free of material misstatement. An audit includes examining, on a test basis, evidence supporting the amounts and disclosures in the financial statements, assessing the accounting principles used and significant estimates made by management, and evaluating the overall financial statement presentation. We believe that our audits, which included confirmation of securities at December 31, 2010 by correspondence with the custodian and brokers, provide a reasonable basis for our opinion.
/s/ PricewaterhouseCoopers LLP
PricewaterhouseCoopers LLP
Boston, Massachusetts
February 17, 2011
Annual Report
The Trustees, Members of the Advisory Board and executive officers of the trust and fund, as applicable, are listed below. The Board of Trustees governs the fund and is responsible for protecting the interests of shareholders. The Trustees are experienced executives who meet periodically throughout the year to oversee the fund's activities, review contractual arrangements with companies that provide services to the fund, oversee management of the risks associated with such activities and contractual arrangements, and review the fund's performance. Except for James C. Curvey, each of the Trustees oversees 219 funds advised by FMR or an affiliate. Mr. Curvey oversees 408 funds advised by FMR or an affiliate.
The Trustees hold office without limit in time except that (a) any Trustee may resign; (b) any Trustee may be removed by written instrument, signed by at least two-thirds of the number of Trustees prior to such removal; (c) any Trustee who requests to be retired or who has become incapacitated by illness or injury may be retired by written instrument signed by a majority of the other Trustees; and (d) any Trustee may be removed at any special meeting of shareholders by a two-thirds vote of the outstanding voting securities of the trust. Each Trustee who is not an interested person (as defined in the 1940 Act) (Independent Trustee), shall retire not later than the last day of the calendar year in which his or her 72nd birthday occurs. The Independent Trustees may waive this mandatory retirement age policy with respect to individual Trustees. The executive officers and Advisory Board Members hold office without limit in time, except that any officer and Advisory Board Member may resign or may be removed by a vote of a majority of the Trustees at any regular meeting or any special meeting of the Trustees. Except as indicated, each individual has held the office shown or other offices in the same company for the past five years.
Experience, Skills, Attributes, and Qualifications of the Fund's Trustees. The Governance and Nominating Committee has adopted a statement of policy that describes the experience, qualifications, attributes, and skills that are necessary and desirable for potential Independent Trustee candidates (Statement of Policy). The Board believes that each Trustee satisfied at the time he or she was initially elected or appointed a Trustee, and continues to satisfy, the standards contemplated by the Statement of Policy. The Governance and Nominating Committee also engages professional search firms to help identify potential Independent Trustee candidates who have the experience, qualifications, attributes, and skills consistent with the Statement of Policy. From time to time, additional criteria based on the composition and skills of the current Independent Trustees, as well as experience or skills that may be appropriate in light of future changes to board composition, business conditions, and regulatory or other developments, have also been considered by the professional search firms and the Governance and Nominating Committee. In addition, the Board takes into account the Trustees' commitment and participation in Board and committee meetings, as well as their leadership of standing and ad hoc committees throughout their tenure.
In determining that a particular Trustee was and continues to be qualified to serve as a Trustee, the Board has considered a variety of criteria, none of which, in isolation, was controlling. The Board believes that, collectively, the Trustees have balanced and diverse experience, qualifications, attributes, and skills, which allow the Board to operate effectively in governing the fund and protecting the interests of shareholders. Information about the specific experience, skills, attributes, and qualifications of each Trustee, which in each case led to the Board's conclusion that the Trustee should serve (or continue to serve) as a trustee of the fund, is provided below.
Board Structure and Oversight Function. James C. Curvey is an interested person (as defined in the 1940 Act) and currently serves as Acting Chairman. The Trustees have determined that an interested Chairman is appropriate and benefits shareholders because an interested Chairman has a personal and professional stake in the quality and continuity of services provided to the fund. Independent Trustees exercise their informed business judgment to appoint an individual of their choosing to serve as Chairman, regardless of whether the Trustee happens to be independent or a member of management. The Independent Trustees have determined that they can act independently and effectively without having an Independent Trustee serve as Chairman and that a key structural component for assuring that they are in a position to do so is for the Independent Trustees to constitute a substantial majority for the Board. The Independent Trustees also regularly meet in executive session. Ned C. Lautenbach serves as Chairman of the Independent Trustees and as such (i) acts as a liaison between the Independent Trustees and management with respect to matters important to the Independent Trustees and (ii) with management prepares agendas for Board meetings.
Fidelity funds are overseen by different Boards of Trustees. The fund's Board oversees Fidelity's equity and high income funds and another Board oversees Fidelity's investment-grade bond, money market, and asset allocation funds. The asset allocation funds may invest in Fidelity funds overseen by the fund's Board. The use of separate Boards, each with its own committee structure, allows the Trustees of each group of Fidelity funds to focus on the unique issues of the funds they oversee, including common research, investment, and operational issues. On occasion, the separate Boards establish joint committees to address issues of overlapping consequences for the Fidelity funds overseen by each Board.
The Trustees operate using a system of committees to facilitate the timely and efficient consideration of all matters of importance to the Trustees, the fund, and fund shareholders and to facilitate compliance with legal and regulatory requirements and oversight of the fund's activities and associated risks. The Board, acting through its committees, has charged FMR and its affiliates with (i) identifying events or circumstances the occurrence of which could have demonstrably adverse effects on the fund's business and/or reputation; (ii) implementing processes and controls to lessen the possibility that such events or circumstances occur or to mitigate the effects of such events or circumstances if they do occur; and (iii) creating and maintaining a system designed to evaluate continuously business and market conditions in order to facilitate the identification and implementation processes described in (i) and (ii) above. Because the day-to-day operations and activities of the fund are carried out by or through FMR, its affiliates and other service providers, the fund's exposure to risks is mitigated but not eliminated by the processes overseen by the Trustees. While each of the Board's committees has responsibility for overseeing different aspects of the fund's activities, oversight is exercised primarily through the Operations, Audit, and Compliance Committees. Appropriate personnel, including but not limited to the fund's Chief Compliance Officer (CCO), FMR's internal auditor, the independent accountants, the fund's Treasurer and portfolio management personnel, make periodic reports to the Board's committees, as appropriate. The responsibilities of each committee, including their oversight responsibilities, are described further under "Standing Committees of the Fund's Trustees."
Annual Report
The fund's Statement of Additional Information (SAI) includes more information about the Trustees. To request a free copy, call Fidelity at 1-877-208-0098.
Interested Trustees*:
Correspondence intended for each Trustee who is an interested person may be sent to Fidelity Investments, 82 Devonshire Street, Boston, Massachusetts 02109.
Name, Age; Principal Occupations and Other Relevant Experience+ |
James C. Curvey (75) |
| Year of Election or Appointment: 2007 Mr. Curvey is Trustee and Acting Chairman of the Board of Trustees of certain Trusts. Mr. Curvey also serves as Trustee (2007-present) of other investment companies advised by FMR. Mr. Curvey is a Director of Fidelity Investments Money Management, Inc. (2009-present), Director of Fidelity Research & Analysis Co. (2009-present) and Director of FMR and FMR Co., Inc. (2007-present). Mr. Curvey is also Vice Chairman (2007-present) and Director of FMR LLC. In addition, Mr. Curvey serves as an Overseer for the Boston Symphony Orchestra and a member of the Trustees of Villanova University. Previously, Mr. Curvey was the Vice Chairman (2006-2007) and Director (2000-2007) of FMR Corp. |
Ronald P. O'Hanley (54) |
| Year of Election or Appointment: 2011 Mr. O'Hanley is President of Fidelity Asset Management and Corporate Services and a member of Fidelity's Executive Committee (2010-present). Previously, Mr. O'Hanley served as President and Chief Executive Officer of BNY Mellon Asset Management (2007-2010). Mr. O'Hanley also served as Vice Chairman of Bank New York Mellon Corp. and a member of that firm's Executive Committee. Prior to the 2007 merger of The Bank of New York and Mellon Financial Corporation, he was Vice Chairman of Mellon Financial Corporation and President and Chief Executive Officer of Mellon Asset Management. He joined Mellon in February 1997. Mr. O'Hanley currently serves as Chairman of the Boston Public Library Foundation Board of Directors and sits on the Board of Directors of Beth Israel Deaconess Medical Center, the Board of Trustees of the Marine Biological Laboratory and the Advisory Board of the Maxwell School of Citizenship and Public Administration at Syracuse University. Mr. O'Hanley also chairs the Council on Asset Management for the Financial Services Roundtable and is a member of the Board of Directors of Institutional Investor's U.S. Institute. |
* Trustees have been determined to be "Interested Trustees" by virtue of, among other things, their affiliation with the trust or various entities under common control with FMR.
+ The information above includes each Trustee's principal occupation during the last five years and other information relating to the experience, attributes, and skills relevant to each Trustee's qualifications to serve as a Trustee, which led to the conclusion that each Trustee should serve as a Trustee for the fund.
Independent Trustees:
Correspondence intended for each Independent Trustee (that is, the Trustees other than the Interested Trustees) may be sent to Fidelity Investments, P.O. Box 55235, Boston, Massachusetts 02205-5235.
Name, Age; Principal Occupations and Other Relevant Experience+ |
Dennis J. Dirks (62) |
| Year of Election or Appointment: 2005 Prior to his retirement in May 2003, Mr. Dirks was Chief Operating Officer and a member of the Board of The Depository Trust & Clearing Corporation (DTCC). He also served as President, Chief Operating Officer, and Board member of The Depository Trust Company (DTC) and President and Board member of the National Securities Clearing Corporation (NSCC). In addition, Mr. Dirks served as Chief Executive Officer and Board member of the Government Securities Clearing Corporation, Chief Executive Officer and Board member of the Mortgage-Backed Securities Clearing Corporation, as a Trustee and a member of the Finance Committee of Manhattan College (2005-2008), and as a Trustee and a member of the Finance Committee of AHRC of Nassau County (2006-2008). Mr. Dirks is a member of the Independent Directors Council (IDC) Governing Council (2010-Present) and Board of Directors for The Brookville Center for Children's Services, Inc. (2009-present). |
Alan J. Lacy (57) |
| Year of Election or Appointment: 2008 Mr. Lacy serves as Senior Adviser (2007-present) of Oak Hill Capital Partners, L.P. (private equity). Mr. Lacy also served as Chief Executive Officer (2000-2005) and Vice Chairman (2005-2006) of Sears Holdings Corporation and Sears, Roebuck and Co. (retail). In addition, Mr. Lacy serves as a member of the Board of Directors of The Western Union Company (global money transfer, 2006-present) and Bristol-Myers Squibb Company (global pharmaceuticals, 2007-present). Mr. Lacy is Chairman (2008-present) and a member (2006-present) of the Board of Trustees of The National Parks Conservation Association. |
Ned C. Lautenbach (66) |
| Year of Election or Appointment: 2000 Mr. Lautenbach is Chairman of the Independent Trustees of the Equity and High Income Funds (2006-present). Mr. Lautenbach currently serves as the Lead Director of the Eaton Corporation Board of Directors (diversified industrial, 1997-present). Mr. Lautenbach is also a member of the Board of Directors of the Philharmonic Center for the Arts in Naples, Florida (1999-present); a member of the Board of Trustees of Fairfield University (2005-present); and a member of the Council on Foreign Relations (1994-present). Previously, Mr. Lautenbach was a Partner/Advisory Partner at Clayton, Dubilier & Rice, Inc. (private equity investment, 1998-2010), as well as a Director of Sony Corporation (2006-2007). |
Joseph Mauriello (66) |
| Year of Election or Appointment: 2008 Prior to his retirement in January 2006, Mr. Mauriello served in numerous senior management positions including Deputy Chairman and Chief Operating Officer (2004-2005), and Vice Chairman of Financial Services (2002-2004) of KPMG LLP US (professional services, 1965-2005). Mr. Mauriello currently serves as a member of the Board of Directors of XL Group plc. (global insurance and re-insurance, 2006-present) and of Arcadia Resources Inc. (health care services and products, 2007-present). Previously, Mr. Mauriello served as a Director of the Hamilton Funds of the Bank of New York (2006-2007). |
Cornelia M. Small (66) |
| Year of Election or Appointment: 2005 Ms. Small is a member of the Board of Directors of the Teagle Foundation (2009-present). Ms. Small is also a member of the Investment Committee, and Chair (2008-present) and a member of the Board of Trustees of Smith College. In addition, Ms. Small serves on the Investment Committee of the Berkshire Taconic Community Foundation (2008-present). Previously, Ms. Small served as Chairperson of the Investment Committee (2002-2008) of Smith College. In addition, Ms. Small served as Chief Investment Officer, Director of Global Equity Investments, and a member of the Board of Directors of Scudder, Stevens & Clark and Scudder Kemper Investments. |
William S. Stavropoulos (71) |
| Year of Election or Appointment: 2001 Mr. Stavropoulos is Vice Chairman of the Independent Trustees of the Equity and High Income Funds (2006-present). Mr. Stavropoulos serves as President and Founder of the Michigan Baseball Foundation, the Great Lakes Loons (2007-present). Mr. Stavropoulos is Chairman Emeritus of the Board of Directors of The Dow Chemical Company, where he previously served in numerous senior management positions, including President, CEO (1995-2000; 2002-2004), Chairman of the Executive Committee (2000-2006), and as a member of the Board of Directors (1990-2006). Currently, Mr. Stavropoulos is Chairman of Univar (global distributor of commodity and specialty chemicals, 2010-present), a Director of Teradata Corporation (data warehousing and technology solutions, 2008-present), Chemical Financial Corporation, Maersk Inc. (industrial conglomerate), Tyco International, Inc. (multinational manufacturing and services, 2007-present), and a member of the Advisory Board for Metalmark Capital (private equity investment, 2005-present). Mr. Stavropoulos is a special advisor to Clayton, Dubilier & Rice, LLC (private equity investment). In addition, Mr. Stavropoulos is a member of the University of Notre Dame Advisory Council for the College of Science. |
David M. Thomas (61) |
| Year of Election or Appointment: 2008 Previously, Mr. Thomas served as Executive Chairman (2005-2006) and Chairman and Chief Executive Officer (2000-2005) of IMS Health, Inc. (pharmaceutical and healthcare information solutions). In addition, Mr. Thomas serves as a member of the Board of Directors of Fortune Brands, Inc. (consumer products), and Interpublic Group of Companies, Inc. (marketing communication, 2004-present). |
Michael E. Wiley (60) |
| Year of Election or Appointment: 2008 Mr. Wiley also serves as a Director of Asia Pacific Exploration Consolidated (international oil and gas exploration and production, 2008-present). Mr. Wiley serves as a Director of Tesoro Corporation (independent oil refiner and marketer, 2005-present), and a Director of Bill Barrett Corporation (exploration and production, 2005-present). In addition, Mr. Wiley also serves as a Director of Post Oak Bank (privately-held bank, 2004-present). Previously, Mr. Wiley served as a member of the Board of Trustees of the University of Tulsa (2000-2006; 2007-2010), as a Senior Energy Advisor of Katzenbach Partners, LLC (consulting, 2006-2007), as an Advisory Director of Riverstone Holdings (private investment), Chairman, President, and CEO of Baker Hughes, Inc. (oilfield services, 2000-2004), and as Director of Spinnaker Exploration Company (exploration and production, 2001-2005). |
+ The information above includes each Trustee's principal occupation during the last five years and other information relating to the experience, attributes, and skills relevant to each Trustee's qualifications to serve as a Trustee, which led to the conclusion that each Trustee should serve as a Trustee for the fund.
Annual Report
Advisory Board Members and Executive Officers:
Correspondence intended for each executive officer, Edward C. Johnson 3d, and Peter S. Lynch may be sent to Fidelity Investments, 82 Devonshire Street, Boston, Massachusetts 02109.
Name, Age; Principal Occupation |
Edward C. Johnson 3d (80) |
| Year of Election or Appointment: 2011 Member of the Advisory Board of Fidelity's Equity and High Income Funds. Formerly Trustee and Chairman of the Board of Trustees of certain Trusts, Mr. Johnson serves as Chief Executive Officer, Chairman, and a Director of FMR LLC; Chairman and a Director of FMR; and Chairman and a Director of FMR Co., Inc. In addition, Mr. Johnson serves as Chairman and Director of FIL Limited. Previously, Mr. Johnson served as President of FMR LLC (2006-2007). |
Peter S. Lynch (66) |
| Year of Election or Appointment: 2003 Member of the Advisory Board of Fidelity's Equity and High Income Funds. Mr. Lynch is Vice Chairman and a Director of FMR and FMR Co., Inc. In addition, Mr. Lynch serves as a Trustee of Boston College and as the Chairman of the Inner-City Scholarship Fund. Previously, Mr. Lynch served on the Special Olympics International Board of Directors (1997-2006). |
Kenneth B. Robins (41) |
| Year of Election or Appointment: 2008 President and Treasurer of Fidelity's Equity and High Income Funds. Mr. Robins also serves as President and Treasurer (2010-present) and Assistant Treasurer (2009-present) of other Fidelity funds and is an employee of Fidelity Investments (2004-present). Previously, Mr. Robins served as Deputy Treasurer of the Fidelity funds (2005-2008) and Treasurer and Chief Financial Officer of The North Carolina Capital Management Trust: Cash and Term Portfolios (2006-2008). |
Brian B. Hogan (46) |
| Year of Election or Appointment: 2009 Vice President of certain Equity Funds and Vice President of Sector Funds. Mr. Hogan also serves as President of FMR's Equity Division (2009-present). Previously, Mr. Hogan served as Senior Vice President, Equity Research of FMR (2006-2009) and as a portfolio manager. |
Christopher S. Bartel (39) |
| Year of Election or Appointment: 2009 Vice President of Fidelity's Sector and Real Estate Equity Funds. Mr. Bartel also serves as Senior Vice President of Equity Research (2009-present). Previously, Mr. Bartel served as Managing Director of Research (2006-2009) and an analyst and portfolio manager (2000-2006). |
Scott C. Goebel (42) |
| Year of Election or Appointment: 2008 Secretary and Chief Legal Officer (CLO) of the Fidelity funds. Mr. Goebel also serves as Secretary and CLO of The North Carolina Capital Management Trust: Cash and Term Portfolio (2008-present); General Counsel, Secretary, and Senior Vice President of FMR (2008-present) and FMR Co., Inc. (2008-present); Deputy General Counsel of FMR LLC; Chief Legal Officer of Fidelity Management & Research (Hong Kong) Limited (2008-present) and Assistant Secretary of Fidelity Management & Research (Japan) Inc. (2008-present), Fidelity Investments Money Management, Inc. (2008-present), Fidelity Management & Research (U.K.) Inc. (2008-present), and Fidelity Research and Analysis Company (2008-present). Previously, Mr. Goebel served as Assistant Secretary of the Funds (2007-2008) and as Vice President and Secretary of Fidelity Distributors Corporation (FDC) (2005-2007). |
William C. Coffey (41) |
| Year of Election or Appointment: 2009 Assistant Secretary of Fidelity's Equity and High Income Funds. Mr. Coffey also serves as Senior Vice President and Deputy General Counsel of FMR LLC (2010-present), and is an employee of Fidelity Investments. Previously, Mr. Coffey served as Vice President and Associate General Counsel of FMR LLC (2005-2009). |
Holly C. Laurent (56) |
| Year of Election or Appointment: 2008 Anti-Money Laundering (AML) Officer of the Fidelity funds. Ms. Laurent also serves as AML Officer of The North Carolina Capital Management Trust: Cash and Term Portfolio (2008-present) and is an employee of Fidelity Investments. Previously, Ms. Laurent was Senior Vice President and Head of Legal for Fidelity Business Services India Pvt. Ltd. (2006-2008), and Senior Vice President, Deputy General Counsel and Group Head for FMR LLC (2005-2006). |
Christine Reynolds (52) |
| Year of Election or Appointment: 2008 Chief Financial Officer of the Fidelity funds. Ms. Reynolds became President of Fidelity Pricing and Cash Management Services (FPCMS) in August 2008. Ms. Reynolds served as Chief Operating Officer of FPCMS (2007-2008). Previously, Ms. Reynolds served as President, Treasurer, and Anti-Money Laundering officer of the Fidelity funds (2004-2007). |
Kenneth A. Rathgeber (63) |
| Year of Election or Appointment: 2004 Chief Compliance Officer of Fidelity's Equity and High Income Funds. Mr. Rathgeber is Chief Compliance Officer of Fidelity Management & Research (Hong Kong) Limited (2008-present), Fidelity Management & Research (Japan) Inc. (2008-present), FMR (2005-present), FMR Co., Inc. (2005-present), Fidelity Management & Research (U.K.) Inc. (2005-present), Fidelity Research & Analysis Company (2005-present), Fidelity Investments Money Management, Inc. (2005-present), Pyramis Global Advisors, LLC (2005-present), and Strategic Advisers, Inc. (2005-present). |
Jeffrey S. Christian (49) |
| Year of Election or Appointment: 2009 Deputy Treasurer of the Fidelity funds. Mr. Christian is an employee of Fidelity Investments. Previously, Mr. Christian served as Chief Financial Officer (2008-2009) of certain Fidelity funds and Senior Vice President of Fidelity Pricing and Cash Management Services (FPCMS) (2004-2009). |
Bryan A. Mehrmann (49) |
| Year of Election or Appointment: 2005 Deputy Treasurer of the Fidelity funds. Mr. Mehrmann is an employee of Fidelity Investments. |
Adrien E. Deberghes (43) |
| Year of Election or Appointment: 2008 Deputy Treasurer of Fidelity's Equity and High Income Funds. Mr. Deberghes also serves as Assistant Treasurer of other Fidelity funds (2010-present) and is an employee of Fidelity Investments (2008-present). Previously, Mr. Deberghes served as Senior Vice President of Mutual Fund Administration at State Street Corporation (2007-2008), Senior Director of Mutual Fund Administration at Investors Bank & Trust (2005-2007), and Director of Finance for Dunkin' Brands (2000-2005). |
Stephanie J. Dorsey (41) |
| Year of Election or Appointment: 2010 Assistant Treasurer of Fidelity's Equity and High Income Funds. Ms. Dorsey also serves as Deputy Treasurer of other Fidelity funds (2008-present) and is an employee of Fidelity Investments (2008-present). Previously, Ms. Dorsey served as Treasurer (2004-2008) of the JPMorgan Mutual Funds and Vice President (2004-2008) of JPMorgan Chase Bank. |
John R. Hebble (52) |
| Year of Election or Appointment: 2009 Assistant Treasurer of Fidelity's Equity and High Income Funds. Mr. Hebble also serves as Treasurer and Chief Financial Officer of The North Carolina Capital Management Trust: Cash and Term Portfolio (2008-present), President and Treasurer of other Fidelity funds (2008-present) and is an employee of Fidelity Investments. |
Gary W. Ryan (52) |
| Year of Election or Appointment: 2005 Assistant Treasurer of the Fidelity funds. Mr. Ryan is an employee of Fidelity Investments. Previously, Mr. Ryan served as Vice President of Fund Reporting in Fidelity Pricing and Cash Management Services (FPCMS) (1999-2005). |
Jonathan Davis (42) |
| Year of Election or Appointment: 2010 Assistant Treasurer of the Fidelity funds. Mr. Davis is an employee of Fidelity Investments. Previously, Mr. Davis served as Vice President and Associate General Counsel of FMR LLC (2003-2010). |
Annual Report
Initial Class and Investor Class designate 100% of the dividends distributed during the fiscal year as qualifying for the dividends-received deduction for corporate shareholders.
Annual Report
Board Approval of Investment Advisory Contracts and Management Fees
VIP Energy Portfolio
Each year, the Board of Trustees, including the Independent Trustees (together, the Board), votes on the renewal of the management contract and sub-advisory agreements (together, the Advisory Contracts) for the fund. The Board, assisted by the advice of fund counsel and Independent Trustees' counsel, requests and considers a broad range of information relevant to the renewal of the Advisory Contracts throughout the year.
The Board meets regularly and considers at each of its meetings factors that are relevant to its annual consideration of the renewal of the fund's Advisory Contracts, including the services and support provided to the fund and its shareholders. The Board has established various standing committees, each composed of Independent Trustees with varying backgrounds, to which the Board has assigned specific subject matter responsibilities in order to enhance effective decision-making by the Board. The Board, acting directly and through its Committees, requests and receives information concerning the annual consideration of the renewal of the fund's Advisory Contracts. The Board also meets as needed to consider matters specifically related to the Board's annual consideration of the renewal of Advisory Contracts. Members of the Board may also meet with trustees of other Fidelity funds through ad hoc joint committees to discuss certain matters relevant to the Fidelity funds.
At its July 2010 meeting, the Board of Trustees, including the Independent Trustees, unanimously determined to renew the fund's Advisory Contracts. In reaching its determination, the Board considered all factors it believed relevant, including (i) the nature, extent, and quality of the services to be provided to the fund and its shareholders (including the investment performance of the fund); (ii) the competitiveness of the fund's management fee and total expenses; (iii) the total costs of the services to be provided by and the profits to be realized by Fidelity from its relationship with the fund; (iv) the extent to which economies of scale would be realized as the fund grows; and (v) whether fee levels reflect these economies of scale, if any, for the benefit of fund shareholders.
In considering whether to renew the Advisory Contracts for the fund, the Board reached a determination, with the assistance of fund counsel and Independent Trustees' counsel and through the exercise of its business judgment, that the renewal of the Advisory Contracts is in the best interests of fund shareholders and that the compensation to be received by Fidelity under the management contract is fair and reasonable. The Board's decision to renew the Advisory Contracts was not based on any single factor noted above, but rather was based on a comprehensive consideration of all the information provided to the Board at its meetings throughout the year. The Board, in reaching its determination to renew the Advisory Contracts, is aware that shareholders in the fund have a broad range of investment choices available to them, including a wide choice among mutual funds offered by Fidelity's competitors, and that the fund's shareholders, with the opportunity to review and weigh the disclosure provided by the fund in its prospectus and other public disclosures, have chosen to invest in this fund, managed by Fidelity.
Nature, Extent, and Quality of Services Provided. The Board considered the staffing within the investment adviser, FMR, and the sub-advisers (together, the Investment Advisers), including the backgrounds of the fund's investment personnel and the fund's investment objective and discipline. The Independent Trustees also had discussions with senior management of Fidelity's investment operations and investment groups. The Board considered the structure of the portfolio manager compensation program and whether this structure provides appropriate incentives to act in the best interest of the fund.
Resources Dedicated to Investment Management and Support Services. The Board and the equity research subcommittee of the Board's Fund Oversight Committee reviewed the size, education, and experience of the Investment Advisers' investment staff, their use of technology, and the Investment Advisers' approach to recruiting, training, and retaining portfolio managers and other research, advisory, and management personnel. The Board noted that Fidelity's analysts have access to a variety of technological tools and market and securities data that enable them to perform both fundamental and quantitative analysis and to specialize in various disciplines. The Board considered Fidelity's extensive global research capabilities that enable the Investment Advisers to aggregate data from various sources in an effort to produce positive investment results. The Board also considered that Fidelity's portfolio managers and analysts have access to daily portfolio attribution that allows for monitoring of a fund's portfolio, as well as an electronic communication system that provides immediate real-time access to research concerning issuers and credit enhancers. The Board noted FMR's continued focus on strengthening the organization and discipline of equity portfolio management and research.
Shareholder and Administrative Services. The Board considered (i) the nature, extent, quality, and cost of advisory, administrative, and shareholder services performed by the Investment Advisers and their affiliates under the Advisory Contracts and under separate agreements covering transfer agency, pricing and bookkeeping, and securities lending services for the fund; (ii) the nature and extent of the investment adviser's supervision of third party service providers, principally custodians and subcustodians; and (iii) the resources devoted to, and the record of compliance with, the fund's compliance policies and procedures. The Board also reviewed the allocation of fund brokerage, including allocations to brokers affiliated with the Investment Advisers, the use of brokerage commissions to pay fund expenses, and the use of "soft" commission dollars to pay for research services.
The Board noted that the growth of fund assets over time across the complex allows Fidelity to reinvest in the development of services designed to enhance the value or convenience of the Fidelity funds as investment vehicles. These services include 24-hour access to account information and market information through phone representatives and over the Internet, and investor education materials and asset allocation tools.
Investment in a Large Fund Family. The Board considered the benefits to shareholders of investing in a Fidelity fund, including the benefits of investing in a fund that is part of a large family of funds offering a variety of investment disciplines and providing a large variety of mutual fund investor services. The Board noted that Fidelity had taken, or had made recommendations that resulted in the Fidelity funds taking, a number of actions over the previous year that benefited particular funds, including (i) dedicating additional resources to investment research and restructuring and broadening the focus of the investment research teams; (ii) bolstering the senior management team that oversees asset management; (iii) launching Class F of certain funds as a lower-fee class available to Freedom K and Freedom Index Funds; (iv) lowering the initial investment minimums and ongoing balance requirements for Real Estate High Income Fund; (v) eliminating subsequent purchase minimums for all funds and adding a waiver of the investment minimum requirement for new accounts opened with the proceeds of a systematic withdrawal plan; (vi) eliminating the withdrawal minimum and maximum limits for systematic withdrawals from Advisor funds; (vii) expanding sales load waivers on Class A shares for Destiny Planholders and expanding Institutional Class eligibility for Class O Destiny Planholders; and (viii) changing certain Class A and Class T sales charge structures to further align them with industry practices.
Annual Report
Board Approval of Investment Advisory Contracts and Management Fees - continued
Investment Performance. The Board considered whether the fund has operated in accordance with its investment objective, as well as its record of compliance with its investment restrictions. It also reviewed the fund's absolute investment performance for each class, as well as the fund's relative investment performance for each class measured over multiple periods against a third-party-sponsored index that reflects the market sector in which the fund invests. The Board noted that FMR does not believe that a meaningful peer group exists against which to compare the fund's performance. The following charts considered by the Board show, over the one-, three-, and five-year periods ended December 31, 2009, as available, the cumulative total returns of Initial Class and Service Class 2 of the fund and the cumulative total returns of a third-party-sponsored index ("benchmark"). The returns of Initial Class and Service Class 2 show the performance of the highest and lowest performing classes, respectively (based on three-year performance).
VIP Energy Portfolio

The Board noted that the investment performance of Initial Class of the fund compared favorably to its benchmark for the one- and five-year periods, although the fund's three-year cumulative total return was lower than its benchmark. The Board considered that the variations in performance among the fund's classes reflect the variations in class expenses, which result in lower performance for higher expense classes. The Board also reviewed the fund's performance since inception as well as performance in the current year.
Based on its review, and giving particular weight to the nature and quality of the resources dedicated by the Investment Advisers to maintain and improve relative performance and factoring in the unprecedented market events in recent years, the Board concluded that the nature, extent, and quality of investment management and support services and of shareholder and administrative services provided to the fund will benefit the fund's shareholders, particularly in light of the Board's view that the fund's shareholders benefit from investing in a fund that is part of a large family of funds offering a variety of investment disciplines and services.
Competitiveness of Management Fee and Total Fund Expenses. The Board considered the fund's management fee and total expenses compared to "mapped groups" of competitive funds and classes. Fidelity creates "mapped groups" by combining similar Lipper investment objective categories that have comparable management fee characteristics. Combining Lipper investment objective categories aids the Board's management fee and total expense comparisons by broadening the competitive group used for comparison and by reducing the number of universes to which various Fidelity funds are compared.
Management Fee. The Board considered two proprietary management fee comparisons for the 12-month periods shown in the chart below. The group of Lipper funds used by the Board for management fee comparisons is referred to below as the "Total Mapped Group." The Total Mapped Group comparison focuses on a fund's standing relative to the total universe of comparable funds available to investors, in terms of gross management fees before expense reimbursements or caps. "TMG %" represents the percentage of funds in the Total Mapped Group that had management fees that were lower than the fund's. For example, a TMG % of 3% means that 97% of the funds in the Total Mapped Group had higher management fees than the fund. The "Asset-Size Peer Group" (ASPG) comparison focuses on a fund's standing relative to non-Fidelity funds similar in size to the fund within the Total Mapped Group. The ASPG represents at least 15% of the funds in the Total Mapped Group with comparable asset size and management fee characteristics, subject to a minimum of 50 funds (or all funds in the Total Mapped Group if fewer than 50). Additional information, such as the ASPG quartile in which the fund's management fee ranked, is also included in the chart and considered by the Board.
Annual Report
VIP Energy Portfolio

The Board noted that the fund's management fee ranked below the median of its Total Mapped Group and below the median of its ASPG for 2009.
Based on its review, the Board concluded that the fund's management fee is fair and reasonable in light of the services that the fund receives and the other factors considered.
Total Expenses. In its review of each class's total expenses, the Board considered the fund's management fee as well as other fund or class expenses, as applicable, such as transfer agent fees, pricing and bookkeeping fees, fund-paid 12b-1 fees, and custodial, legal, and audit fees. The Board also noted the effects of any waivers and reimbursements on fees and expenses. As part of its review, the Board also considered current and historical total expenses of each class of the fund compared to competitive fund median expenses. Each class of the fund is compared to those funds and classes in the Total Mapped Group (used by the Board for management fee comparisons) that have a similar sales load structure.
The Board noted that the total expenses of each class ranked below its competitive median for 2009.
Fees Charged to Other Fidelity Clients. The Board also considered Fidelity fee structures and other information with respect to clients of FMR and its affiliates, such as other mutual funds advised or subadvised by FMR or its affiliates, pension plan clients, and other institutional clients. In March 2010, the Board created an ad hoc joint committee with the board of other Fidelity funds (the Committee) to review and compare Fidelity's institutional investment advisory business with its business of providing services to the Fidelity funds, including the differences in services provided, fees charged, and costs incurred, as well as competition in their respective marketplaces.
Based on its review of total expenses and fees charged to other Fidelity clients, the Board concluded that the total expenses of each class of the fund were reasonable in light of the services that the fund and its shareholders receive and the other factors considered, including the findings of the Committee.
Costs of the Services and Profitability. The Board considered the revenues earned and the expenses incurred by Fidelity in conducting the business of developing, marketing, distributing, managing, administering and servicing the fund and its shareholders. The Board also considered the level of Fidelity's profits in respect of all the Fidelity funds.
On an annual basis, FMR presents to the Board Fidelity's profitability for the fund. Fidelity calculates the profitability for each fund, as well as aggregate profitability for groups of Fidelity funds and all Fidelity funds, using a series of detailed revenue and cost allocation methodologies which originate with the audited books and records of Fidelity. The Audit Committee of the Board reviews any significant changes from the prior year's methodologies.
Annual Report
Board Approval of Investment Advisory Contracts and Management Fees - continued
PricewaterhouseCoopers LLP (PwC), independent registered public accounting firm and auditor to Fidelity and certain Fidelity funds, has been engaged annually by the Board as part of the Board's assessment of Fidelity's profitability analysis. PwC's engagement includes the review and assessment of Fidelity's methodologies used in determining the revenues and expenses attributable to Fidelity's mutual fund business, and completion of agreed-upon procedures surrounding the mathematical accuracy of fund profitability and its conformity to allocation methodologies. After considering PwC's reports issued under the engagement and information provided by Fidelity, the Board believes that while other allocation methods may also be reasonable, Fidelity's profitability methodologies are reasonable in all material respects.
The Board has also reviewed Fidelity's non-fund businesses and fall-out benefits related to the mutual fund business as well as cases where Fidelity's affiliates may benefit from or be related to the fund's business.
The Board considered the costs of the services provided by and the profits realized by Fidelity in connection with the operation of the fund and were satisfied that the profitability was not excessive in the circumstances.
Economies of Scale. The Board considered whether there have been economies of scale in respect of the management of the Fidelity funds, whether the Fidelity funds (including the fund) have appropriately benefited from any such economies of scale, and whether there is potential for realization of any further economies of scale. The Board considered the extent to which the fund will benefit from economies of scale through increased services to the fund, through waivers or reimbursements, or through fee or expense reductions.
In February 2009, the Board and the board of other Fidelity funds created an ad hoc committee (the Economies of Scale Committee) to analyze whether FMR attains economies of scale in respect of the management and servicing of the Fidelity funds, whether the Fidelity funds have appropriately benefited from such economies of scale, and whether there is potential for realization of any further economies of scale.
The Board recognized that the fund's management contract incorporates a "group fee" structure, which provides for lower group fee rates as total fund assets under FMR's management increase, and for higher group fee rates as total fund assets under FMR's management decrease. FMR calculates the group fee rates based on a tiered asset "breakpoint" schedule that varies based on asset class. The Board considered that the group fee is designed to deliver the benefits of economies of scale to fund shareholders when total Fidelity fund assets increase, even if assets of any particular fund are unchanged or have declined, because some portion of Fidelity's costs are attributable to services provided to all Fidelity funds, and all funds benefit if those costs can be allocated among more assets. The Board concluded that, given the group fee structure, fund shareholders will benefit from lower management fees as assets under FMR's management increase at the fund complex level, regardless of whether Fidelity achieves any such economies of scale.
The Board concluded, considering the findings of the Economies of Scale Committee, that any potential economies of scale are being appropriately shared between fund shareholders and Fidelity.
Additional Information Requested by the Board. In order to develop fully the factual basis for consideration of the Fidelity funds' Advisory Contracts, the Board requested and received additional information on certain topics, including (i) fund performance trends, actions to be taken by FMR to improve certain funds' overall performance, and Fidelity's long-term strategies for certain funds; (ii) portfolio manager changes that have occurred during the past year and length of portfolio manager tenure for different categories of funds over time; (iii) Fidelity's compensation structure for portfolio managers, research analysts, and other key personnel, the rationale for the compensation structure, and how the compensation structure provides appropriate performance incentives; (iv) the amount of the investment that each portfolio manager has made in the Fidelity fund(s) that he or she manages; (v) management and other fees paid by FMR to affiliated sub-advisers on behalf of the Fidelity funds; (vi) Fidelity's fee structures and rationale for recommending different fees among different categories of funds; (vii) Fidelity's rationale for recommending which funds should have a performance adjustment component as part of their management fees; (viii) the rationale for any differences between fund fee structures and fee structures in place for other Fidelity clients; and (ix) explanations regarding the relative total expenses borne by certain funds and classes, total expense competitive trends, and actions that might be taken by FMR to reduce total expenses for certain funds and classes.
Based on its evaluation of all of the conclusions noted above, and after considering all factors it believed relevant, the Board ultimately concluded that the advisory fee structures are fair and reasonable, and that the fund's Advisory Contracts should be renewed.
Annual Report
Investment Adviser
Fidelity Management & Research Company
Boston, MA
Investment Sub-Advisers
FMR Co., Inc.
Fidelity Management & Research (U.K.) Inc.
Fidelity Management & Research (Hong Kong) Limited
Fidelity Management & Research (Japan) Inc.
General Distributor
Fidelity Distributors Corporation
Boston, MA
Transfer and Service Agents
Fidelity Investments Institutional Operations Company, Inc.
Boston, MA
Fidelity Service Company, Inc.
Boston, MA
Custodian
State Street Bank & Trust Co.
Quincy, MA
VNRIC-ANN-0211
1.817379.105
Fidelity® Variable Insurance Products:
Energy Portfolio: Service Class 2
Annual Report
December 31, 2010
(2_fidelity_logos) (Registered_Trademark)
Contents
Performance | <Click Here> | How the fund has done over time. |
Management's Discussion of Fund Performance | <Click Here> | The Portfolio Manager's review of fund performance and strategy. |
Shareholder Expense Example | <Click Here> | An example of shareholder expenses. |
Investment Changes | <Click Here> | A summary of major shifts in the fund's investments over the past six months. |
Investments | <Click Here> | A complete list of the fund's investments with their market values. |
Financial Statements | <Click Here> | Statements of assets and liabilities, operations, and changes in net assets, as well as financial highlights. |
Notes | <Click Here> | Notes to the financial statements. |
Report of Independent Registered Public Accounting Firm | <Click Here> | |
Trustees and Officers | <Click Here> | |
Distributions | <Click Here> | |
Board Approval of Investment Advisory Contracts and Management Fees | <Click Here> | |
To view a fund's proxy voting guidelines and proxy voting record for the 12-month period ended June 30, visit http://www.fidelity.com/proxyvotingresults or visit the Securities and Exchange Commission's (SEC) web site at http://www.sec.gov. You may also call 1-877-208-0098 to request a free copy of the proxy voting guidelines.
Fidelity Variable Insurance Products are separate account options which are purchased through a variable insurance contract.
Standard & Poor's, S&P and S&P 500 are registered service marks of The McGraw-Hill Companies, Inc. and have been licensed for use by Fidelity Distributors Corporation.
Other third party marks appearing herein are the property of their respective owners.
All other marks appearing herein are registered or unregistered trademarks or service marks of FMR LLC or an affiliated company.
The general research services agreement with Fidelity Research & Analysis Company has been terminated and is no longer in effect for the fund.
This report and the financial statements contained herein are submitted for the general information of the shareholders of the fund. This report is not authorized for distribution to prospective investors in the fund unless preceded or accompanied by an effective prospectus.
A fund files its complete schedule of portfolio holdings with the SEC for the first and third quarters of each fiscal year on Form N-Q. Forms N-Q are available on the SEC's web site at http://www.sec.gov. A fund's Forms N-Q may be reviewed and copied at the SEC's Public Reference Room in Washington, DC. Information regarding the operation of the SEC's Public Reference Room may be obtained by calling 1-800-SEC-0330. For a complete list of the fund's portfolio holdings, view the most recent holdings listing, semiannual report, or annual report on Fidelity's web site at http://www.fidelity.com, http://www.advisor.fidelity.com, or http://www.401k.com, as applicable.
NOT FDIC INSURED • MAY LOSE VALUE • NO BANK GUARANTEE
Neither the fund nor Fidelity Distributors Corporation is a bank.
Annual Report
Average annual total return reflects the change in the value of an investment, assuming reinvestment of the class' distributions from dividend income and capital gains (the profits earned upon the sale of securities that have grown in value, if any) and assuming a constant rate of performance each year. During periods of reimbursement by Fidelity, a fund's total return will be greater than it would be had the reimbursement not occurred. Performance numbers are net of all underlying fund operating expenses, but do not include any insurance charges imposed by your insurance company's separate account. If performance information included the effect of these additional charges, the total returns would have been lower. How a fund did yesterday is no guarantee of how it will do tomorrow.
Average Annual Total Returns
Periods ended December 31, 2010 | Past 1
year | Past 5
years | Life of
fundA |
VIP Energy Portfolio - Service Class 2 B, C | 19.16% | 6.36% | 11.32% |
A From July 19, 2001.
B The initial offering of Service Class 2 shares took place on April 6, 2005. Returns prior to April 6, 2005 are those of Initial Class and do not include the effects of Service Class 2's 12b-1 fee. Had Service Class 2's 12b-1 fee been reflected, returns prior to April 6, 2005 would have been lower.
C Prior to October 1, 2006, VIP Energy Portfolio operated under certain different investment policies. The historical performance for the fund may not represent its current investment policies.
$10,000 Over Life of Fund
Let's say hypothetically that $10,000 was invested in VIP Energy Portfolio - Service Class 2 on July 19, 2001, when the fund started. The chart shows how the value of your investment would have changed, and also shows how the S&P 500® Index performed over the same period. The initial offering of Service Class 2 took place on April 6, 2005. See above for additional information regarding the performance of Service Class 2.
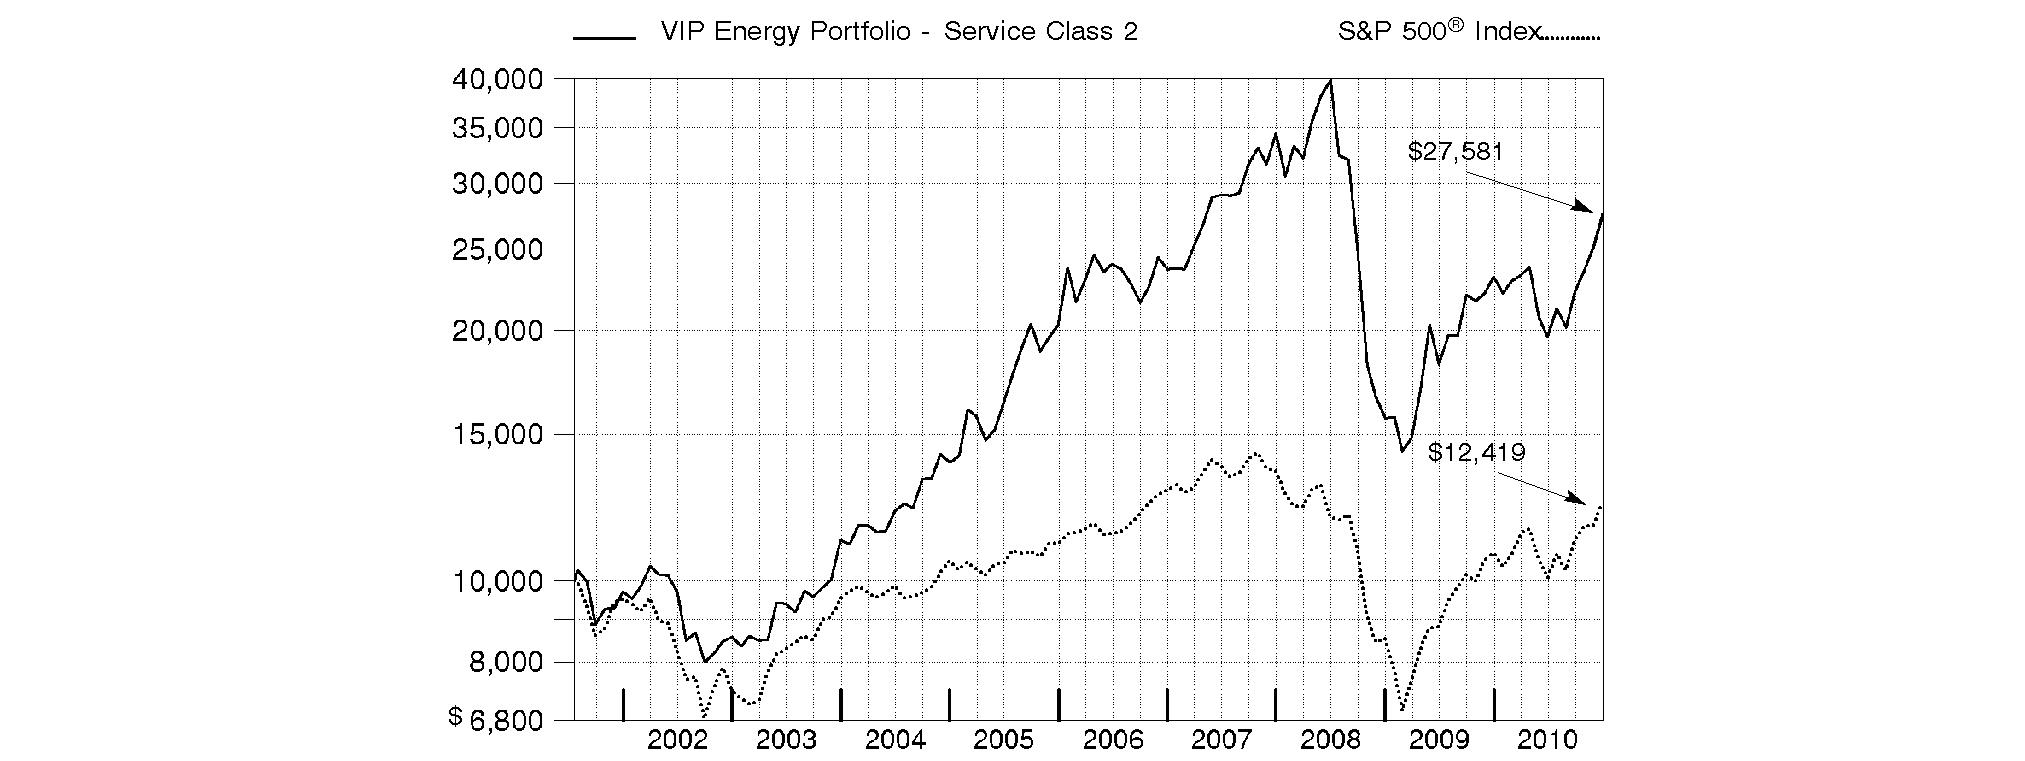
Annual Report
Market Recap: While market improvements around the world hit a speed bump in the first half of the 12-month period ending December 31, 2010, world economies re-accelerated in August, supported by a broadening recovery and low inflation in the U.S. Domestic stock markets recorded solid gains for the year, lifted by a strong second-half rally fueled by economic optimism, encouraging earnings reports and a wave of corporate mergers. The large-cap S&P 500® Index rose 15.06%, the blue-chip-laden Dow Jones Industrial AverageSM added 14.06% and the technology-heavy Nasdaq Composite® Index climbed 18.02%. Meanwhile, international stocks, as represented by the MSCI® ACWI® (All Country World Index) ex USA Index, gained 11.29%, boosted in part by a depreciating U.S. dollar. In the fixed-income arena, U.S. taxable investment-grade bonds generated positive results during 2010, as the Barclays Capital® U.S. Aggregate Bond Index gained 6.54%. With ultra-low interest rates bolstering nearly all fixed-income securities for most of the year, sectors in the index with higher yields and more credit risk generally fared best, while most high-quality bonds generated more-moderate returns. Meanwhile, high-yield bonds, as represented by The BofA Merrill LynchSM US High Yield Constrained Index, returned 15.07%, a result of improved economic data and strengthening investor demand. Overseas, foreign bond markets showed mixed results, with a sizable disparity between the 3.97% return of the Citigroup® Non-U.S. Group of 7 Index - which measures the performance of sovereign debt of the major global economies outside the U.S. - and the 12.04% advance of the JPMorgan Emerging Markets Bond Index Global (EMBI Global), which benefited from the rising overall credit quality of emerging-markets debt issuers.
Comments from John Dowd, Portfolio Manager of VIP Energy Portfolio: For the year, the fund's share classes fell short of the 21.42% return of the MSCI® U.S. IM Energy 25/50 Index - which was adopted in January 2010 as a better representation of the fund's investment universe - - but outperformed the S&P 500®. (For specific portfolio results, please refer to the performance section of this report.) Stock selection in oil/gas exploration and production and an overweighting in the weak oil/gas drilling segment accounted for the fund's largest detractors during the period. Firms directly tied to natural gas production, also known as natural gas "pure plays," were among the biggest individual detractors, as natural gas production rose during the period, and caused gas prices to fall by about 20% for the year. On the positive side, the fund was helped by positioning in the oil/gas equipment services and coal/consumable fuels groups, along with an overweighting in oil/gas refining/marketing. On an individual security basis, natural gas companies Southwestern Energy, Petrohawk Energy and Cabot Oil & Gas detracted. An underweighting in oil company ConocoPhillips hurt, as did a stake in Transocean, owner of the ill-fated Deepwater Horizon rig in the Gulf of Mexico. Underweighting benchmark giant Exxon Mobil was a big positive, even though I started buying the stock aggressively in April, as its stock began to decline. At period end, it was the fund's largest holding and carried a share price of around of $73. Two industry acquisitions also helped. In February, exploration services provider Smith International agreed to be acquired by Schlumberger, and BJ Services was acquired by Baker Hughes in April, both at a premium price. The fund was overweighted in BJ and Smith, along with exploration firm Whiting Petroleum, whose stock rose on successful oil production in the mammoth Bakken Shale formation in North Dakota. The fund also was helped by an underweighted position in EOG Resources, whose exposure to natural gas hurt its stock price. Some of the stocks I've mentioned were sold from the fund by period end.
The views expressed above reflect those of the portfolio manager(s) only through the end of the period as stated on the cover of this report and do not necessarily represent the views of Fidelity or any other person in the Fidelity organization. Any such views are subject to change at any time based upon market or other conditions and Fidelity disclaims any responsibility to update such views. These views may not be relied on as investment advice and, because investment decisions for a Fidelity fund are based on numerous factors, may not be relied on as an indication of trading intent on behalf of any Fidelity fund.
Annual Report
As a shareholder of the Fund, you incur two types of costs: (1) transaction costs, including redemption fees, and (2) ongoing costs, including management fees, distribution and/or service (12b-1) fees and other Fund expenses. This Example is intended to help you understand your ongoing costs (in dollars) of investing in the Fund and to compare these costs with the ongoing costs of investing in other mutual funds.
The Example is based on an investment of $1,000 invested at the beginning of the period and held for the entire period (July 1, 2010 to December 31, 2010).
Actual Expenses
The first line of the accompanying table for each class of the Fund provides information about actual account values and actual expenses. You may use the information in this line, together with the amount you invested, to estimate the expenses that you paid over the period. Simply divide your account value by $1,000.00 (for example, an $8,600 account value divided by $1,000.00 = 8.6), then multiply the result by the number in the first line for a class of the Fund under the heading entitled "Expenses Paid During Period" to estimate the expenses you paid on your account during this period. The estimate of expenses does not include any fees or other expenses of any variable annuity or variable life insurance product. If they were, the estimate of expenses you paid during the period would be higher, and your ending account value would be lower. In addition, the Fund, as a shareholder in the underlying Fidelity Central Funds, will indirectly bear its pro-rata share of the fees and expenses incurred by the underlying Fidelity Central Funds. These fees and expenses are not included in the Fund's annualized expense ratio used to calculate the expense estimate in the table below.
Hypothetical Example for Comparison Purposes
The second line of the accompanying table for each class of the Fund provides information about hypothetical account values and hypothetical expenses based on a Class' actual expense ratio and an assumed rate of return of 5% per year before expenses, which is not the Class' actual return. The hypothetical account values and expenses may not be used to estimate the actual ending account balance or expenses you paid for the period. You may use this information to compare the ongoing costs of investing in the Fund and other funds. To do so, compare this 5% hypothetical example with the 5% hypothetical examples that appear in the shareholder reports of the other funds. The estimate of expenses does not include any fees or other expenses of any variable annuity or variable life insurance product. If they were, the estimate of expenses you paid during the period would be higher, and your ending account value would be lower. In addition, the Fund, as a shareholder in the underlying Fidelity Central Funds, will indirectly bear its pro-rata share of the fees and expenses incurred by the underlying Fidelity Central Funds. These fees and expenses are not included in the Fund's annualized expense ratio used to calculate the expense estimate in the table below.
Please note that the expenses shown in the table are meant to highlight your ongoing costs only and do not reflect any transaction costs. Therefore, the second line of the table is useful in comparing ongoing costs only, and will not help you determine the relative total costs of owning different funds. In addition, if these transactional costs were included, your costs would have been higher.
| Annualized
Expense Ratio | Beginning
Account Value
July 1, 2010 | Ending
Account Value
December 31, 2010 | Expenses Paid
During Period*
July 1, 2010 to
December 31, 2010 |
Initial Class | .69% | | | |
Actual | | $ 1,000.00 | $ 1,407.10 | $ 4.19 |
HypotheticalA | | $ 1,000.00 | $ 1,021.73 | $ 3.52 |
Service Class 2 | .93% | | | |
Actual | | $ 1,000.00 | $ 1,404.90 | $ 5.64 |
HypotheticalA | | $ 1,000.00 | $ 1,020.52 | $ 4.74 |
Investor Class | .77% | | | |
Actual | | $ 1,000.00 | $ 1,407.20 | $ 4.67 |
HypotheticalA | | $ 1,000.00 | $ 1,021.32 | $ 3.92 |
A 5% return per year before expenses
* Expenses are equal to each Class' annualized expense ratio, multiplied by the average account value over the period, multiplied by 184/365 (to reflect the one-half year period).
Annual Report
Investment Changes (Unaudited)
Top Ten Stocks as of December 31, 2010 |
| % of fund's
net assets | % of fund's net assets
6 months ago |
Exxon Mobil Corp. | 17.2 | 15.9 |
Occidental Petroleum Corp. | 6.7 | 3.7 |
Schlumberger Ltd. | 6.5 | 6.0 |
Chevron Corp. | 5.3 | 6.2 |
Marathon Oil Corp. | 4.1 | 4.9 |
National Oilwell Varco, Inc. | 3.9 | 2.3 |
Halliburton Co. | 3.8 | 2.0 |
Apache Corp. | 3.4 | 2.0 |
Massey Energy Co. | 2.9 | 1.6 |
Baker Hughes, Inc. | 2.8 | 4.0 |
| 56.6 | |
Top Industries (% of fund's net assets) |
As of December 31, 2010 |
| Oil, Gas &
Consumable Fuels | 68.4% | |
| Energy Equipment & Services | 26.4% | |
| Construction & Engineering | 2.1% | |
| Chemicals | 1.4% | |
| Metals & Mining | 0.9% | |
| All Others* | 0.8% | |

As of June 30, 2010 |
| Oil, Gas &
Consumable Fuels | 63.9% | |
| Energy Equipment & Services | 32.1% | |
| Electrical Equipment | 1.5% | |
| Construction & Engineering | 1.3% | |
| Gas Utilities | 0.8% | |
| All Others* | 0.4% | |

* Includes short-term investments and net other assets. |
Annual Report
Investments December 31, 2010
Showing Percentage of Net Assets
Common Stocks - 99.2% |
| Shares | | Value |
CHEMICALS - 1.4% |
Specialty Chemicals - 1.4% |
LyondellBasell Industries NV Class A (a) | 161,990 | | $ 5,572,456 |
CONSTRUCTION & ENGINEERING - 2.1% |
Construction & Engineering - 2.1% |
Fluor Corp. | 7,700 | | 510,202 |
Foster Wheeler AG (a) | 27,000 | | 932,040 |
Jacobs Engineering Group, Inc. (a) | 59,000 | | 2,705,150 |
KBR, Inc. | 124,141 | | 3,782,576 |
| | 7,929,968 |
ENERGY EQUIPMENT & SERVICES - 26.4% |
Oil & Gas Drilling - 4.4% |
Ensco International Ltd. ADR | 132,366 | | 7,065,697 |
Noble Corp. | 53,420 | | 1,910,833 |
Northern Offshore Ltd. (a) | 202,628 | | 519,969 |
Ocean Rig UDW, Inc. (a) | 100,500 | | 1,776,807 |
Transocean Ltd. (a) | 74,767 | | 5,197,054 |
Tuscany International Drilling, Inc. (a) | 253,200 | | 355,440 |
| | 16,825,800 |
Oil & Gas Equipment & Services - 22.0% |
Baker Hughes, Inc. | 187,630 | | 10,726,807 |
Dresser-Rand Group, Inc. (a) | 29,100 | | 1,239,369 |
Halliburton Co. | 356,564 | | 14,558,508 |
National Oilwell Varco, Inc. | 223,967 | | 15,061,781 |
Oceaneering International, Inc. (a) | 96,114 | | 7,076,874 |
Oil States International, Inc. (a) | 42,310 | | 2,711,648 |
Schlumberger Ltd. | 298,991 | | 24,965,749 |
Schoeller-Bleckmann Oilfield Equipment AG | 11,149 | | 961,451 |
Superior Energy Services, Inc. (a) | 34,354 | | 1,202,046 |
TSC Offshore Group Ltd. (a) | 746,000 | | 190,999 |
Weatherford International Ltd. (a) | 192,257 | | 4,383,460 |
Willbros Group, Inc. (a) | 77,533 | | 761,374 |
| | 83,840,066 |
TOTAL ENERGY EQUIPMENT & SERVICES | | 100,665,866 |
GAS UTILITIES - 0.0% |
Gas Utilities - 0.0% |
China Gas Holdings Ltd. | 459,260 | | 200,308 |
METALS & MINING - 0.9% |
Diversified Metals & Mining - 0.9% |
Grande Cache Coal Corp. (a) | 39,537 | | 415,073 |
MacArthur Coal Ltd. | 73,566 | | 962,079 |
Walter Energy, Inc. | 16,000 | | 2,045,440 |
| | 3,422,592 |
OIL, GAS & CONSUMABLE FUELS - 68.4% |
Coal & Consumable Fuels - 7.1% |
Alpha Natural Resources, Inc. (a) | 172,883 | | 10,378,166 |
|
| Shares | | Value |
Massey Energy Co. | 205,344 | | $ 11,016,706 |
Peabody Energy Corp. | 86,000 | | 5,502,280 |
| | 26,897,152 |
Integrated Oil & Gas - 37.4% |
Chevron Corp. | 223,989 | | 20,438,996 |
Exxon Mobil Corp. | 896,564 | | 65,556,758 |
Hess Corp. | 59,619 | | 4,563,238 |
Marathon Oil Corp. | 421,489 | | 15,607,738 |
Murphy Oil Corp. | 49,400 | | 3,682,770 |
Occidental Petroleum Corp. | 259,711 | | 25,477,649 |
Royal Dutch Shell PLC Class B ADR | 111,600 | | 7,440,372 |
| | 142,767,521 |
Oil & Gas Exploration & Production - 14.2% |
Alange Energy Corp. (a) | 73,000 | | 39,527 |
Anadarko Petroleum Corp. | 117,798 | | 8,971,496 |
Apache Corp. | 107,519 | | 12,819,490 |
Chesapeake Energy Corp. | 39,500 | | 1,023,445 |
Cimarex Energy Co. | 81,144 | | 7,183,678 |
EXCO Resources, Inc. | 59,194 | | 1,149,547 |
Gran Tierra Energy, Inc. (a) | 104,600 | | 848,505 |
Newfield Exploration Co. (a) | 67,924 | | 4,898,000 |
Niko Resources Ltd. | 7,700 | | 796,637 |
Northern Oil & Gas, Inc. (a) | 5,000 | | 136,050 |
Pacific Rubiales Energy Corp. | 10,700 | | 362,103 |
Painted Pony Petroleum Ltd. Class A (a) | 67,000 | | 587,165 |
Petrobank Energy & Resources Ltd. (a) | 10,800 | | 273,438 |
Petrominerales Ltd. | 19,042 | | 633,142 |
Pioneer Natural Resources Co. | 42,834 | | 3,718,848 |
Talisman Energy, Inc. | 77,900 | | 1,727,813 |
Toreador Resources Corp. (a)(d) | 12,900 | | 200,208 |
Vermilion Energy, Inc. | 4,100 | | 190,015 |
Whiting Petroleum Corp. (a) | 72,703 | | 8,520,065 |
| | 54,079,172 |
Oil & Gas Refining & Marketing - 9.7% |
CVR Energy, Inc. (a) | 183,534 | | 2,786,046 |
Frontier Oil Corp. | 243,781 | | 4,390,496 |
Holly Corp. | 187,106 | | 7,628,312 |
Petroplus Holdings AG | 34,970 | | 461,126 |
Sunoco, Inc. | 159,922 | | 6,446,456 |
Tesoro Corp. | 275,800 | | 5,113,332 |
Valero Energy Corp. | 310,057 | | 7,168,518 |
Western Refining, Inc. (a)(d) | 144,694 | | 1,530,863 |
World Fuel Services Corp. | 42,650 | | 1,542,224 |
| | 37,067,373 |
TOTAL OIL, GAS & CONSUMABLE FUELS | | 260,811,218 |
TOTAL COMMON STOCKS (Cost $300,801,502) | 378,602,408 |
Convertible Bonds - 0.0% |
| Principal Amount | | Value |
SEMICONDUCTORS & SEMICONDUCTOR EQUIPMENT - 0.0% |
Semiconductors - 0.0% |
SunPower Corp. 4.75% 4/15/14
(Cost $180,000) | | $ 180,000 | | $ 165,825 |
Money Market Funds - 1.4% |
| Shares | | |
Fidelity Cash Central Fund, 0.19% (b) | 4,012,389 | | 4,012,389 |
Fidelity Securities Lending Cash Central Fund, 0.21% (b)(c) | 1,141,500 | | 1,141,500 |
TOTAL MONEY MARKET FUNDS (Cost $5,153,889) | 5,153,889 |
TOTAL INVESTMENT PORTFOLIO - 100.6% (Cost $306,135,391) | | 383,922,122 |
NET OTHER ASSETS (LIABILITIES) - (0.6)% | | (2,422,968) |
NET ASSETS - 100% | $ 381,499,154 |
Legend |
(a) Non-income producing |
(b) Affiliated fund that is available only to investment companies and other accounts managed by Fidelity Investments. The rate quoted is the annualized seven-day yield of the fund at period end. A complete unaudited listing of the fund's holdings as of its most recent quarter end is available upon request. In addition, each Fidelity Central Fund's financial statements, which are not covered by the Fund's Report of Independent Registered Public Accounting Firm, are available on the SEC's website or upon request. |
(c) Investment made with cash collateral received from securities on loan. |
(d) Security or a portion of the security is on loan at period end. |
Affiliated Central Funds |
Information regarding fiscal year to date income earned by the Fund from investments in Fidelity Central Funds is as follows: |
Fund | Income earned |
Fidelity Cash Central Fund | $ 3,553 |
Fidelity Securities Lending Cash Central Fund | 51,034 |
Total | $ 54,587 |
Other Information |
The following is a summary of the inputs used, as of December 31, 2010, involving the Fund's assets and liabilities carried at fair value. The inputs or methodology used for valuing securities may not be an indication of the risk associated with investing in those securities. For more information on valuation inputs, and their aggregation into the levels used in the tables below, please refer to the Security Valuation section in the accompanying Notes to Financial Statements. |
Valuation Inputs at Reporting Date: |
Description | Total | Level 1 | Level 2 | Level 3 |
Investments in Securities: | | | | |
Common Stocks | $ 378,602,408 | $ 378,402,100 | $ - | $ 200,308 |
Convertible Bonds | 165,825 | - | 165,825 | - |
Money Market Funds | 5,153,889 | 5,153,889 | - | - |
Total Investments in Securities: | $ 383,922,122 | $ 383,555,989 | $ 165,825 | $ 200,308 |
The following is a reconciliation of Investments in Securities for which Level 3 inputs were used in determining value: |
Investments in Securities: | |
Beginning Balance | $ - |
Total Realized Gain (Loss) | (1,462) |
Total Unrealized Gain (Loss) | (38,184) |
Cost of Purchases | 304,962 |
Proceeds of Sales | (65,008) |
Amortization/Accretion | - |
Transfers in to Level 3 | - |
Transfers out of Level 3 | - |
Ending Balance | $ 200,308 |
The change in unrealized gain (loss) for the period attributable to Level 3 securities held at December 31, 2010 | $ (38,184) |
The information used in the above reconciliation represents fiscal year to date activity for any Investments in Securities identified as using Level 3 inputs at either the beginning or the end of the current fiscal period. Transfers in or out of Level 3 represent the beginning value of any Security or Instrument where a change in the pricing level occurred from the beginning to the end of the period. The cost of purchases and the proceeds of sales may include securities received or delivered through corporate actions or exchanges. Realized and unrealized gains (losses) disclosed in the reconciliation are included in Net Gain (Loss) on the Fund's Statement of Operations. |
Distribution of investments by country of issue, as a percentage of total net assets, is as follows: (Unaudited) |
United States of America | 82.1% |
Netherlands Antilles | 6.5% |
United Kingdom | 3.7% |
Switzerland | 3.5% |
Netherlands | 1.4% |
Canada | 1.3% |
Others (Individually Less Than 1%) | 1.5% |
| 100.0% |
Income Tax Information |
At December 31, 2010, the Fund had a capital loss carryforward of approximately $60,968,108 of which $53,220,311 and $7,747,797 will expire in fiscal 2017 and 2018, respectively. Capital loss carryforwards are only available to offset future capital gains of the Fund to the extent provided by regulations and may be limited. |
See accompanying notes which are an integral part of the financial statements.
Annual Report
Statement of Assets and Liabilities
| December 31, 2010 |
Assets | | |
Investment in securities, at value (including securities loaned of $1,123,620) - See accompanying schedule: Unaffiliated issuers (cost $300,981,502) | $ 378,768,233 | |
Fidelity Central Funds (cost $5,153,889) | 5,153,889 | |
Total Investments (cost $306,135,391) | | $ 383,922,122 |
Foreign currency held at value (cost $96) | | 96 |
Receivable for investments sold | | 1,220,820 |
Receivable for fund shares sold | | 361,128 |
Dividends receivable | | 415,623 |
Interest receivable | | 1,809 |
Distributions receivable from Fidelity Central Funds | | 1,843 |
Prepaid expenses | | 932 |
Other receivables | | 3,022 |
Total assets | | 385,927,395 |
| | |
Liabilities | | |
Payable for investments purchased | $ 2,922,133 | |
Payable for fund shares redeemed | 94,173 | |
Accrued management fee | 168,871 | |
Distribution and service plan fees payable | 25,802 | |
Other affiliated payables | 38,488 | |
Other payables and accrued expenses | 37,274 | |
Collateral on securities loaned, at value | 1,141,500 | |
Total liabilities | | 4,428,241 |
| | |
Net Assets | | $ 381,499,154 |
Net Assets consist of: | | |
Paid in capital | | $ 368,580,479 |
Undistributed net investment income | | 125,041 |
Accumulated undistributed net realized gain (loss) on investments and foreign currency transactions | | (64,992,485) |
Net unrealized appreciation (depreciation) on investments and assets and liabilities in foreign currencies | | 77,786,119 |
Net Assets | | $ 381,499,154 |
Statement of Assets and Liabilities - continued
| December 31, 2010 |
| | |
Initial Class:
Net Asset Value, offering price and redemption price per share ($148,774,480 ÷ 7,421,564 shares) | | $ 20.05 |
| | |
Service Class 2:
Net Asset Value, offering price and redemption price per share ($129,043,148 ÷ 6,470,982 shares) | | $ 19.94 |
| | |
Investor Class:
Net Asset Value, offering price and redemption price per share ($103,681,526 ÷ 5,182,484 shares) | | $ 20.01 |
See accompanying notes which are an integral part of the financial statements.
Annual Report
Financial Statements - continued
Statement of Operations
| Year ended December 31, 2010 |
Investment Income | | |
Dividends | | $ 4,415,850 |
Interest | | 8,552 |
Income from Fidelity Central Funds | | 54,587 |
Total income | | 4,478,989 |
| | |
Expenses | | |
Management fee | $ 1,868,185 | |
Transfer agent fees | 327,093 | |
Distribution and service plan fees | 286,996 | |
Accounting and security lending fees | 131,100 | |
Custodian fees and expenses | 36,881 | |
Independent trustees' compensation | 1,891 | |
Audit | 38,150 | |
Legal | 1,715 | |
Miscellaneous | 4,619 | |
Total expenses before reductions | 2,696,630 | |
Expense reductions | (39,493) | 2,657,137 |
Net investment income (loss) | | 1,821,852 |
Realized and Unrealized Gain (Loss) Net realized gain (loss) on: | | |
Investment securities: | | |
Unaffiliated issuers | 2,142,129 | |
Foreign currency transactions | (12,861) | |
Total net realized gain (loss) | | 2,129,268 |
Change in net unrealized appreciation (depreciation) on: Investment securities | 52,796,838 | |
Assets and liabilities in foreign currencies | 515 | |
Total change in net unrealized appreciation (depreciation) | | 52,797,353 |
Net gain (loss) | | 54,926,621 |
Net increase (decrease) in net assets resulting from operations | | $ 56,748,473 |
Statement of Changes in Net Assets
| Year ended
December 31, 2010 | Year ended
December 31, 2009 |
Increase (Decrease) in Net Assets | | |
Operations | | |
Net investment income (loss) | $ 1,821,852 | $ 1,147,835 |
Net realized gain (loss) | 2,129,268 | (28,944,722) |
Change in net unrealized appreciation (depreciation) | 52,797,353 | 147,681,057 |
Net increase (decrease) in net assets resulting from operations | 56,748,473 | 119,884,170 |
Distributions to shareholders from net investment income | (1,680,556) | (1,156,325) |
Share transactions - net increase (decrease) | (41,330,324) | (14,569,173) |
Redemption fees | 143,706 | 154,874 |
Total increase (decrease) in net assets | 13,881,299 | 104,313,546 |
| | |
Net Assets | | |
Beginning of period | 367,617,855 | 263,304,309 |
End of period (including undistributed net investment income of $125,041 and $0, respectively) | $ 381,499,154 | $ 367,617,855 |
See accompanying notes which are an integral part of the financial statements.
Annual Report
Financial Highlights - Initial Class
Years ended December 31, | 2010 | 2009 | 2008 | 2007 | 2006 |
Selected Per-Share Data | | | | | |
Net asset value, beginning of period | $ 16.88 | $ 11.46 | $ 26.55 | $ 19.04 | $ 18.92 |
Income from Investment Operations | | | | | |
Net investment income (loss) C | .11 | .07 | .03 | .07 | .09 |
Net realized and unrealized gain (loss) | 3.16 | 5.41 | (14.31) | 8.62 | 3.09 |
Total from investment operations | 3.27 | 5.48 | (14.28) | 8.69 | 3.18 |
Distributions from net investment income | (.11) | (.07) | (.03) | (.06) | (.16) |
Distributions from net realized gain | - | - | (.80) | (1.13) | (2.91) |
Total distributions | (.11) | (.07) | (.83) | (1.19) | (3.07) |
Redemption fees added to paid in capital C | .01 | .01 | .02 | .01 | .01 |
Net asset value, end of period | $ 20.05 | $ 16.88 | $ 11.46 | $ 26.55 | $ 19.04 |
Total Return A, B | 19.45% | 47.90% | (54.26)% | 45.97% | 16.91% |
Ratios to Average Net Assets D, F | | | | | |
Expenses before reductions | .70% | .71% | .70% | .70% | .71% |
Expenses net of fee waivers, if any | .69% | .71% | .70% | .70% | .71% |
Expenses net of all reductions | .69% | .70% | .69% | .70% | .70% |
Net investment income (loss) | .65% | .47% | .13% | .31% | .43% |
Supplemental Data | | | | | |
Net assets, end of period (000 omitted) | $ 148,774 | $ 152,028 | $ 117,940 | $ 355,854 | $ 280,537 |
Portfolio turnover rate E | 105% | 113% | 130% | 61% | 151% |
A Total returns do not reflect charges attributable to your insurance company's separate account. Inclusion of these charges would reduce the total returns shown.
B Total returns would have been lower had certain expenses not been reduced during the periods shown.
C Calculated based on average shares outstanding during the period.
D Fees and expenses of the underlying Fidelity Central Funds are not included in the Fund's expense ratio. The Fund indirectly bears its proportionate share of the expenses of any underlying Fidelity Central Funds.
E Amount does not include the portfolio activity of any underlying Fidelity Central Funds.
F Expense ratios reflect operating expenses of the class. Expenses before reductions do not reflect amounts reimbursed by the investment adviser or reductions from brokerage service arrangements or reductions from other expense offset arrangements and do not represent the amount paid by the class during periods when reimbursements or reductions occur. Expenses net of fee waivers reflect expenses after reimbursement by the investment adviser but prior to reductions from brokerage service arrangements or other expense offset arrangements. Expenses net of all reductions represent the net expenses paid by the class.
Financial Highlights - Service Class 2
Years ended December 31, | 2010 | 2009 | 2008 | 2007 | 2006 |
Selected Per-Share Data | | | | | |
Net asset value, beginning of period | $ 16.79 | $ 11.40 | $ 26.44 | $ 18.98 | $ 18.90 |
Income from Investment Operations | | | | | |
Net investment income (loss) C | .07 | .03 | (.03) | .02 | .04 |
Net realized and unrealized gain (loss) | 3.13 | 5.38 | (14.23) | 8.58 | 3.07 |
Total from investment operations | 3.20 | 5.41 | (14.26) | 8.60 | 3.11 |
Distributions from net investment income | (.06) | (.03) | - | (.02) | (.13) |
Distributions from net realized gain | - | - | (.80) | (1.13) | (2.91) |
Total distributions | (.06) | (.03) | (.80) | (1.15) | (3.04) |
Redemption fees added to paid in capital C | .01 | .01 | .02 | .01 | .01 |
Net asset value, end of period | $ 19.94 | $ 16.79 | $ 11.40 | $ 26.44 | $ 18.98 |
Total Return A, B | 19.16% | 47.57% | (54.40)% | 45.64% | 16.55% |
Ratios to Average Net Assets D, F | | | | | |
Expenses before reductions | .95% | .96% | .95% | .95% | .96% |
Expenses net of fee waivers, if any | .94% | .96% | .95% | .95% | .96% |
Expenses net of all reductions | .94% | .95% | .94% | .94% | .95% |
Net investment income (loss) | .40% | .22% | (.12)% | .07% | .18% |
Supplemental Data | | | | | |
Net assets, end of period (000 omitted) | $ 129,043 | $ 125,669 | $ 90,109 | $ 193,887 | $ 70,305 |
Portfolio turnover rate E | 105% | 113% | 130% | 61% | 151% |
A Total returns do not reflect charges attributable to your insurance company's separate account. Inclusion of these charges would reduce the total returns shown.
B Total returns would have been lower had certain expenses not been reduced during the periods shown.
C Calculated based on average shares outstanding during the period.
D Fees and expenses of the underlying Fidelity Central Funds are not included in the Fund's expense ratio. The Fund indirectly bears its proportionate share of the expenses of any underlying Fidelity Central Funds.
E Amount does not include the portfolio activity of any underlying Fidelity Central Funds.
F Expense ratios reflect operating expenses of the class. Expenses before reductions do not reflect amounts reimbursed by the investment adviser or reductions from brokerage service arrangements or reductions from other expense offset arrangements and do not represent the amount paid by the class during periods when reimbursements or reductions occur. Expenses net of fee waivers reflect expenses after reimbursement by the investment adviser but prior to reductions from brokerage service arrangements or other expense offset arrangements. Expenses net of all reductions represent the net expenses paid by the class.
See accompanying notes which are an integral part of the financial statements.
Annual Report
Financial Highlights - Investor Class
Years ended December 31, | 2010 | 2009 | 2008 | 2007 | 2006 |
Selected Per-Share Data | | | | | |
Net asset value, beginning of period | $ 16.85 | $ 11.44 | $ 26.49 | $ 19.00 | $ 18.91 |
Income from Investment Operations | | | | | |
Net investment income (loss) C | .09 | .05 | .01 | .05 | .06 |
Net realized and unrealized gain (loss) | 3.16 | 5.41 | (14.28) | 8.61 | 3.08 |
Total from investment operations | 3.25 | 5.46 | (14.27) | 8.66 | 3.14 |
Distributions from net investment income | (.10) | (.06) | -G | (.05) | (.15) |
Distributions from net realized gain | - | - | (.80) | (1.13) | (2.91) |
Total distributions | (.10) | (.06) | (.80) | (1.18) | (3.06) |
Redemption fees added to paid in capital C | .01 | .01 | .02 | .01 | .01 |
Net asset value, end of period | $ 20.01 | $ 16.85 | $ 11.44 | $ 26.49 | $ 19.00 |
Total Return A,B | 19.34% | 47.79% | (54.32)% | 45.88% | 16.69% |
Ratios to Average Net Assets D, F | | | | | |
Expenses before reductions | .79% | .81% | .79% | .81% | .84% |
Expenses net of fee waivers, if any | .78% | .81% | .79% | .81% | .84% |
Expenses net of all reductions | .77% | .80% | .78% | .81% | .82% |
Net investment income (loss) | .57% | .37% | .04% | .20% | .31% |
Supplemental Data | | | | | |
Net assets, end of period (000 omitted) | $ 103,682 | $ 89,921 | $ 55,256 | $ 131,198 | $ 51,436 |
Portfolio turnover rate E | 105% | 113% | 130% | 61% | 151% |
A Total returns do not reflect charges attributable to your insurance company's separate account. Inclusion of these charges would reduce the total returns shown.
B Total returns would have been lower had certain expenses not been reduced during the periods shown.
C Calculated based on average shares outstanding during the period.
D Fees and expenses of the underlying Fidelity Central Funds are not included in the Fund's expense ratio. The Fund indirectly bears its proportionate share of the expenses of any underlying Fidelity Central Funds.
E Amount does not include the portfolio activity of any underlying Fidelity Central Funds.
F Expense ratios reflect operating expenses of the class. Expenses before reductions do not reflect amounts reimbursed by the investment adviser or reductions from brokerage service arrangements or reductions from other expense offset arrangements and do not represent the amount paid by the class during periods when reimbursements or reductions occur. Expenses net of fee waivers reflect expenses after reimbursement by the investment adviser but prior to reductions from brokerage service arrangements or other expense offset arrangements. Expenses net of all reductions represent the net expenses paid by the class.
G Amount represents less than $.01 per share.
See accompanying notes which are an integral part of the financial statements.
Annual Report
Notes to Financial Statements
For the period ended December 31, 2010
1. Organization.
VIP Energy Portfolio (the Fund) is a non-diversified fund of Variable Insurance Products Fund IV (the Trust) and is authorized to issue an unlimited number of shares. The Trust is registered under the Investment Company Act of 1940, as amended (the 1940 Act), as an open-end management investment company organized as a Massachusetts business trust. Shares of the Fund may only be purchased by insurance companies for the purpose of funding variable annuity or variable life insurance contracts. The Fund offers the following classes of shares: Initial Class shares, Service Class 2 shares and Investor Class shares. All classes have equal rights and voting privileges, except for matters affecting a single class. Investment income, realized and unrealized capital gains and losses, the common expenses of the Fund, and certain fund-level expense reductions, if any, are allocated on a pro-rata basis to each class based on the relative net assets of each class to the total net assets of the Fund. Each class differs with respect to transfer agent and distribution and service plan fees incurred. Certain expense reductions may also differ by class.
2. Investments in Fidelity Central Funds.
The Fund may invest in Fidelity Central Funds, which are open-end investment companies available only to other investment companies and accounts managed by Fidelity Management & Research Company (FMR) and its affiliates. The Fund's Schedule of Investments lists each of the Fidelity Central Funds held as of period end, if any, as an investment of the Fund, but does not include the underlying holdings of each Fidelity Central Fund. As an Investing Fund, the Fund indirectly bears its proportionate share of the expenses of the underlying Fidelity Central Funds.
The Money Market Central Funds seek preservation of capital and current income and are managed by Fidelity Investments Money Management, Inc. (FIMM), an affiliate of FMR.
A complete unaudited list of holdings for each Fidelity Central Fund is available upon request or at the Securities and Exchange Commission (the SEC) web site at www.sec.gov. In addition, the financial statements of the Fidelity Central Funds, which are not covered by the Fund's Report of Independent Registered Public Accounting Firm, are available on the SEC web site or upon request.
3. Significant Accounting Policies.
The financial statements have been prepared in conformity with accounting principles generally accepted in the United States of America (GAAP), which require management to make certain estimates and assumptions at the date of the financial statements. Actual results could differ from those estimates. Subsequent events, if any, through the date that the financial statements were issued have been evaluated in the preparation of the financial statements. The following summarizes the significant accounting policies of the Fund:
Security Valuation. Investments are valued as of 4:00 p.m. Eastern time on the last calendar day of the period. The Fund uses independent pricing services approved by the Board of Trustees to value its investments. When current market prices or quotations are not readily available or reliable, valuations may be determined in good faith in accordance with procedures adopted by the Board of Trustees. Factors used in determining value may include market or security specific events, changes in interest rates and credit quality. The frequency with which these procedures are used cannot be predicted and they may be utilized to a significant extent. The value used for net asset value (NAV) calculation under these procedures may differ from published prices for the same securities.
The Fund categorizes the inputs to valuation techniques used to value its investments into a disclosure hierarchy consisting of three levels as shown below.
Level 1 - quoted prices in active markets for identical investments
Level 2 - other significant observable inputs (including quoted prices for similar investments, interest rates, prepayment speeds, etc.)
Level 3 - unobservable inputs (including the Fund's own assumptions based on the best information available)
Changes in valuation techniques may result in transfers in or out of an assigned level within the disclosure hierarchy. The aggregate value of investments by input level, as of December 31, 2010, as well as a roll forward of Level 3 securities, is included at the end of the Fund's Schedule of Investments. Valuation techniques used to value the Fund's investments by major category are as follows.
Equity securities, including restricted securities, for which market quotations are readily available, are valued at the last reported sale price or official closing price as reported by an independent pricing service on the primary market or exchange on which they are traded and are categorized as Level 1 in the hierarchy. In the event there were no sales during the day or closing prices are not available, securities are valued at the last quoted bid price or may be valued using the last available price and are generally categorized as Level 2 in the hierarchy. For foreign equity securities, when significant market or security specific events arise, comparisons to the valuation of American Depositary Receipts (ADRs), futures contracts, Exchange-traded funds (ETFs) and certain indexes as well as quoted prices for similar securities are used and are categorized as Level 2 in the hierarchy in these circumstances. Utilizing these techniques may result in transfers between Level 1 and Level 2. For restricted equity securities and private placements where observable inputs are limited, assumptions about market activity and risk are used and are categorized as Level 3 in the hierarchy.
Annual Report
Notes to Financial Statements - continued
3. Significant Accounting Policies - continued
Security Valuation - continued
Debt securities, including restricted securities, are valued based on evaluated prices received from independent pricing services or from dealers who make markets in such securities. For corporate bonds, pricing services utilize matrix pricing which considers yield or price of bonds of comparable quality, coupon, maturity and type as well as dealer supplied prices and are generally categorized as Level 2 in the hierarchy.
Investments in open-end mutual funds, including the Fidelity Central Funds, are valued at their closing net asset value each business day and are categorized as Level 1 in the hierarchy.
When independent prices are unavailable or unreliable, debt securities may be valued utilizing pricing matrices which consider similar factors that would be used by independent pricing services. These are generally categorized as Level 2 in the hierarchy but may be Level 3 depending on the circumstances.
Foreign Currency. The Fund uses foreign currency contracts to facilitate transactions in foreign-denominated securities. Gains and losses from these transactions may arise from changes in the value of the foreign currency or if the counterparties do not perform under the contracts' terms.
Foreign-denominated assets, including investment securities, and liabilities are translated into U.S. dollars at the exchange rate at period end. Purchases and sales of investment securities, income and dividends received and expenses denominated in foreign currencies are translated into U.S. dollars at the exchange rate in effect on the transaction date.
The effects of exchange rate fluctuations on investments are included with the net realized and unrealized gain (loss) on investment securities. Other foreign currency transactions resulting in realized and unrealized gain (loss) are disclosed separately.
Investment Transactions and Income. For financial reporting purposes, the Fund's investment holdings and NAV include trades executed through the end of the last business day of the period. The NAV per share for processing shareholder transactions is calculated as of the close of business of the New York Stock Exchange (NYSE), normally 4:00 p.m. Eastern time and includes trades executed through the end of the prior business day. Gains and losses on securities sold are determined on the basis of identified cost and may include proceeds received from litigation. Dividend income is recorded on the ex-dividend date, except for certain dividends from foreign securities where the ex-dividend date may have passed, which are recorded as soon as the Fund is informed of the ex-dividend date. Non-cash dividends included in dividend income, if any, are recorded at the fair market value of the securities received. Distributions received on securities that represent a return of capital or capital gain are recorded as a reduction of cost of investments and/or as a realized gain. The Fund estimates the components of distributions received that may be considered return of capital distributions or capital gain distributions. Interest income and distributions from the Fidelity Central Funds are accrued as earned. Interest income includes coupon interest and amortization of premium and accretion of discount on debt securities. Investment income is recorded net of foreign taxes withheld where recovery of such taxes is uncertain.
Expenses. Expenses directly attributable to a fund are charged to that fund. Expenses attributable to more than one fund are allocated among the respective funds on the basis of relative net assets or other appropriate methods. Expense estimates are accrued in the period to which they relate and adjustments are made when actual amounts are known.
Income Tax Information and Distributions to Shareholders. Each year the Fund intends to qualify as a regulated investment company, including distributing substantially all of its taxable income and realized gains under Subchapter M of the Internal Revenue Code and filing its U.S. federal tax return. As a result, no provision for income taxes is required. As of December 31, 2010, the Fund did not have any unrecognized tax benefits in the accompanying financial statements. A fund's federal tax return is subject to examination by the Internal Revenue Service (IRS) for a period of three years. Foreign taxes are provided for based on the Fund's understanding of the tax rules and rates that exist in the foreign markets in which it invests.
Distributions are declared and recorded on the ex-dividend date. Income dividends and capital gain distributions are declared separately for each class. Income and capital gain distributions are determined in accordance with income tax regulations, which may differ from GAAP.
Capital accounts within the financial statements are adjusted for permanent book-tax differences. These adjustments have no impact on net assets or the results of operations. Temporary book-tax differences will reverse in a subsequent period.
Book-tax differences are primarily due to foreign currency transactions, capital loss carryforwards and losses deferred due to wash sales and excise tax regulations.
Annual Report
3. Significant Accounting Policies - continued
Income Tax Information and Distributions to Shareholders - continued
The federal tax cost of investment securities and unrealized appreciation (depreciation) as of period end were as follows:
Gross unrealized appreciation | $ 87,544,960 |
Gross unrealized depreciation | (13,782,606) |
Net unrealized appreciation (depreciation) | $ 73,762,354 |
Tax Cost | $ 310,159,768 |
The tax-based components of distributable earnings as of period end were as follows:
Undistributed ordinary income | $ 125,041 |
Capital loss carryforward | $ (60,968,108) |
Net unrealized appreciation (depreciation) | $ 73,761,742 |
The tax character of distributions paid was as follows:
| December 31, 2010 | December 31, 2009 |
Ordinary Income | $ 1,680,556 | $ 1,156,325 |
Trading (Redemption) Fees. Initial Class shares, Service Class 2 shares, and Investor Class shares held by investors less than 60 days are subject to a redemption fee equal to 1% of the net asset value of shares redeemed. All redemption fees, which reduce the proceeds of the shareholder redemption, are retained by the Fund and accounted for as an addition to paid in capital.
4. Purchases and Sales of Investments.
Purchases and sales of securities, other than short-term securities, aggregated $345,787,538 and $388,773,530, respectively.
5. Fees and Other Transactions with Affiliates.
Management Fee. FMR and its affiliates provide the Fund with investment management related services for which the Fund pays a monthly management fee. The management fee is the sum of an individual fund fee rate that is based on an annual rate of .30% of the Fund's average net assets and a group fee rate that averaged .26% during the period. The group fee rate is based upon the average net assets of all the mutual funds advised by FMR. The group fee rate decreases as assets under management increase and increases as assets under management decrease. For the period, the total annual management fee rate was .56% of the Fund's average net assets.
Distribution and Service Plan Fees. In accordance with Rule 12b-1 of the 1940 Act, the Fund has adopted a separate 12b-1 Plan for Service Class 2 shares. Service Class 2 pays Fidelity Distributors Corporation (FDC), an affiliate of FMR, a service fee. For the period, the service fee is based on an annual rate of .25% of Service Class 2's average net assets.
For the period, total fees for Service Class 2, all of which was re-allowed to insurance companies for the distribution of shares and providing shareholder support services were $286,996.
Transfer Agent Fees. Fidelity Investments Institutional Operations Company, Inc. (FIIOC), an affiliate of FMR, is the Fund's transfer, dividend disbursing, and shareholder servicing agent. FIIOC receives an asset-based fee with respect to each class. Each class (with the exception of Investor Class) pays a transfer agent fee, excluding out of pocket expenses, equal to an annual rate of .07% of average net assets. Investor Class pays a monthly asset-based transfer agent fee of .15% of average net assets. In addition, FIIOC receives an asset-based fee of .01% of average net assets for typesetting, printing and mailing of shareholder reports, except proxy statements. FIIOC has agreed to voluntarily waive this fee until December 31, 2010. (See Note 8: Expense Reductions.) For the period, transfer agent fees for each class, including printing and out of pocket expenses, were as follows:
Initial Class | $ 104,283 |
Service Class 2 | 85,887 |
Investor Class | 136,923 |
| $ 327,093 |
Annual Report
Notes to Financial Statements - continued
5. Fees and Other Transactions with Affiliates - continued
Accounting and Security Lending Fees. Fidelity Service Company, Inc. (FSC), an affiliate of FMR, maintains the Fund's accounting records. The accounting fee is based on the level of average net assets for the month. Under a separate contract, FSC administers the security lending program. The security lending fee is based on the number and duration of lending transactions.
Brokerage Commissions. The Fund placed a portion of its portfolio transactions with brokerage firms which are affiliates of the investment adviser. The commissions paid to these affiliated firms were $3,400 for the period.
6. Committed Line of Credit.
The Fund participates with other funds managed by FMR or an affiliate in a $3.75 billion credit facility (the "line of credit") to be utilized for temporary or emergency purposes to fund shareholder redemptions or for other short-term liquidity purposes. The Fund has agreed to pay commitment fees on its pro-rata portion of the line of credit, which amounted to $1,356 and is reflected in Miscellaneous expenses on the Statement of Operations. During the period, there were no borrowings on this line of credit.
7. Security Lending.
The Fund lends portfolio securities through a lending agent from time to time in order to earn additional income. The lending agent may loan securities to certain qualified borrowers, including Fidelity Capital Markets (FCM), a broker-dealer affiliated with the Fund. On the settlement date of the loan, the Fund receives collateral (in the form of U.S. Treasury obligations, letters of credit and/or cash) against the loaned securities and maintains collateral in an amount not less than 100% of the market value of the loaned securities during the period of the loan. The market value of the loaned securities is determined at the close of business of the Fund and any additional required collateral is delivered to the Fund on the next business day. If the borrower defaults on its obligation to return the securities loaned because of insolvency or other reasons, a fund could experience delays and costs in recovering the securities loaned or in gaining access to the collateral. Any cash collateral received is invested in the Fidelity Securities Lending Cash Central Fund. The value of loaned securities and cash collateral at period end are disclosed on the Fund's Statement of Assets and Liabilities. Security lending income represents the income earned on investing cash collateral, less rebates paid to borrowers and lending agent fees associated with the loan, plus any premium payments received for lending certain types of securities. Security lending income is presented in the Statement of Operations as a component of income from Fidelity Central Funds. Total security lending income during the period amounted to $51,034. During the period, there were no securities loaned to FCM.
8. Expense Reductions.
FMR or its affiliates agreed to waive certain fees during the period as noted in the table below.
Initial Class | $ 9,817 |
Service Class 2 | 8,324 |
Investor Class | 6,098 |
| $ 24,239 |
Many of the brokers with whom FMR places trades on behalf of the Fund provided services to the Fund in addition to trade execution. These services included payments of certain expenses on behalf of the Fund totaling $15,254 for the period.
9. Distributions to Shareholders.
Distributions to shareholders of each class were as follows:
Years ended December 31, | 2010 | 2009 |
From net investment income | | |
Initial Class | $ 800,107 | $ 612,974 |
Service Class 2 | 408,455 | 245,394 |
Investor Class | 471,994 | 297,957 |
Total | $ 1,680,556 | $ 1,156,325 |
Annual Report
10. Share Transactions.
Transactions for each class of shares were as follows:
| Shares | Dollars |
Years ended December 31, | 2010 | 2009 | 2010 | 2009 |
Initial Class | | | | |
Shares sold | 918,470 | 1,204,844 | $ 15,869,720 | $ 16,607,740 |
Reinvestment of distributions | 41,413 | 36,815 | 800,107 | 612,974 |
Shares redeemed | (2,546,072) | (2,529,302) | (41,769,770) | (35,099,465) |
Net increase (decrease) | (1,586,189) | (1,287,643) | $ (25,099,943) | $ (17,878,751) |
Service Class 2 | | | | |
Shares sold | 892,222 | 1,896,791 | $ 15,494,576 | $ 25,683,905 |
Reinvestment of distributions | 21,240 | 14,810 | 408,455 | 245,394 |
Shares redeemed | (1,926,104) | (2,330,582) | (31,528,158) | (30,821,580) |
Net increase (decrease) | (1,012,642) | (418,981) | $ (15,625,127) | $ (4,892,281) |
Investor Class | | | | |
Shares sold | 1,261,085 | 1,690,015 | $ 22,374,304 | $ 23,990,831 |
Reinvestment of distributions | 24,468 | 17,928 | 471,994 | 297,957 |
Shares redeemed | (1,440,817) | (1,201,221) | (23,451,552) | (16,086,929) |
Net increase (decrease) | (155,264) | 506,722 | $ (605,254) | $ 8,201,859 |
11. Other.
The Fund's organizational documents provide former and current trustees and officers with a limited indemnification against liabilities arising in connection with the performance of their duties to the Fund. In the normal course of business, the Fund may also enter into contracts that provide general indemnifications. The Fund's maximum exposure under these arrangements is unknown as this would be dependent on future claims that may be made against the Fund. The risk of material loss from such claims is considered remote.
At the end of the period, FMR or its affiliates were the owners of record of 66% of the total outstanding shares of the Fund and one otherwise unaffiliated shareholder was the owner of record of 34% of the total outstanding shares of the Fund.
Annual Report
Report of Independent Registered Public Accounting Firm
To the Trustees of Variable Insurance Products Fund IV and the Shareholders of VIP Energy Portfolio:
In our opinion, the accompanying statement of assets and liabilities, including the schedule of investments, and the related statements of operations and of changes in net assets and the financial highlights present fairly, in all material respects, the financial position of VIP Energy Portfolio (a fund of Variable Insurance Products Fund IV) at December 31, 2010, the results of its operations for the year then ended, the changes in its net assets for each of the two years in the period then ended and the financial highlights for each of the five years in the period then ended, in conformity with accounting principles generally accepted in the United States of America. These financial statements and financial highlights (hereafter referred to as "financial statements") are the responsibility of the VIP Energy Portfolio's management. Our responsibility is to express an opinion on these financial statements based on our audits. We conducted our audits of these financial statements in accordance with the standards of the Public Company Accounting Oversight Board (United States). Those standards require that we plan and perform the audit to obtain reasonable assurance about whether the financial statements are free of material misstatement. An audit includes examining, on a test basis, evidence supporting the amounts and disclosures in the financial statements, assessing the accounting principles used and significant estimates made by management, and evaluating the overall financial statement presentation. We believe that our audits, which included confirmation of securities at December 31, 2010 by correspondence with the custodian and brokers, provide a reasonable basis for our opinion.
/s/ PricewaterhouseCoopers LLP
PricewaterhouseCoopers LLP
Boston, Massachusetts
February 17, 2011
Annual Report
The Trustees, Members of the Advisory Board and executive officers of the trust and fund, as applicable, are listed below. The Board of Trustees governs the fund and is responsible for protecting the interests of shareholders. The Trustees are experienced executives who meet periodically throughout the year to oversee the fund's activities, review contractual arrangements with companies that provide services to the fund, oversee management of the risks associated with such activities and contractual arrangements, and review the fund's performance. Except for James C. Curvey, each of the Trustees oversees 219 funds advised by FMR or an affiliate. Mr. Curvey oversees 408 funds advised by FMR or an affiliate.
The Trustees hold office without limit in time except that (a) any Trustee may resign; (b) any Trustee may be removed by written instrument, signed by at least two-thirds of the number of Trustees prior to such removal; (c) any Trustee who requests to be retired or who has become incapacitated by illness or injury may be retired by written instrument signed by a majority of the other Trustees; and (d) any Trustee may be removed at any special meeting of shareholders by a two-thirds vote of the outstanding voting securities of the trust. Each Trustee who is not an interested person (as defined in the 1940 Act) (Independent Trustee), shall retire not later than the last day of the calendar year in which his or her 72nd birthday occurs. The Independent Trustees may waive this mandatory retirement age policy with respect to individual Trustees. The executive officers and Advisory Board Members hold office without limit in time, except that any officer and Advisory Board Member may resign or may be removed by a vote of a majority of the Trustees at any regular meeting or any special meeting of the Trustees. Except as indicated, each individual has held the office shown or other offices in the same company for the past five years.
Experience, Skills, Attributes, and Qualifications of the Fund's Trustees. The Governance and Nominating Committee has adopted a statement of policy that describes the experience, qualifications, attributes, and skills that are necessary and desirable for potential Independent Trustee candidates (Statement of Policy). The Board believes that each Trustee satisfied at the time he or she was initially elected or appointed a Trustee, and continues to satisfy, the standards contemplated by the Statement of Policy. The Governance and Nominating Committee also engages professional search firms to help identify potential Independent Trustee candidates who have the experience, qualifications, attributes, and skills consistent with the Statement of Policy. From time to time, additional criteria based on the composition and skills of the current Independent Trustees, as well as experience or skills that may be appropriate in light of future changes to board composition, business conditions, and regulatory or other developments, have also been considered by the professional search firms and the Governance and Nominating Committee. In addition, the Board takes into account the Trustees' commitment and participation in Board and committee meetings, as well as their leadership of standing and ad hoc committees throughout their tenure.
In determining that a particular Trustee was and continues to be qualified to serve as a Trustee, the Board has considered a variety of criteria, none of which, in isolation, was controlling. The Board believes that, collectively, the Trustees have balanced and diverse experience, qualifications, attributes, and skills, which allow the Board to operate effectively in governing the fund and protecting the interests of shareholders. Information about the specific experience, skills, attributes, and qualifications of each Trustee, which in each case led to the Board's conclusion that the Trustee should serve (or continue to serve) as a trustee of the fund, is provided below.
Board Structure and Oversight Function. James C. Curvey is an interested person (as defined in the 1940 Act) and currently serves as Acting Chairman. The Trustees have determined that an interested Chairman is appropriate and benefits shareholders because an interested Chairman has a personal and professional stake in the quality and continuity of services provided to the fund. Independent Trustees exercise their informed business judgment to appoint an individual of their choosing to serve as Chairman, regardless of whether the Trustee happens to be independent or a member of management. The Independent Trustees have determined that they can act independently and effectively without having an Independent Trustee serve as Chairman and that a key structural component for assuring that they are in a position to do so is for the Independent Trustees to constitute a substantial majority for the Board. The Independent Trustees also regularly meet in executive session. Ned C. Lautenbach serves as Chairman of the Independent Trustees and as such (i) acts as a liaison between the Independent Trustees and management with respect to matters important to the Independent Trustees and (ii) with management prepares agendas for Board meetings.
Fidelity funds are overseen by different Boards of Trustees. The fund's Board oversees Fidelity's equity and high income funds and another Board oversees Fidelity's investment-grade bond, money market, and asset allocation funds. The asset allocation funds may invest in Fidelity funds overseen by the fund's Board. The use of separate Boards, each with its own committee structure, allows the Trustees of each group of Fidelity funds to focus on the unique issues of the funds they oversee, including common research, investment, and operational issues. On occasion, the separate Boards establish joint committees to address issues of overlapping consequences for the Fidelity funds overseen by each Board.
The Trustees operate using a system of committees to facilitate the timely and efficient consideration of all matters of importance to the Trustees, the fund, and fund shareholders and to facilitate compliance with legal and regulatory requirements and oversight of the fund's activities and associated risks. The Board, acting through its committees, has charged FMR and its affiliates with (i) identifying events or circumstances the occurrence of which could have demonstrably adverse effects on the fund's business and/or reputation; (ii) implementing processes and controls to lessen the possibility that such events or circumstances occur or to mitigate the effects of such events or circumstances if they do occur; and (iii) creating and maintaining a system designed to evaluate continuously business and market conditions in order to facilitate the identification and implementation processes described in (i) and (ii) above. Because the day-to-day operations and activities of the fund are carried out by or through FMR, its affiliates and other service providers, the fund's exposure to risks is mitigated but not eliminated by the processes overseen by the Trustees. While each of the Board's committees has responsibility for overseeing different aspects of the fund's activities, oversight is exercised primarily through the Operations, Audit, and Compliance Committees. Appropriate personnel, including but not limited to the fund's Chief Compliance Officer (CCO), FMR's internal auditor, the independent accountants, the fund's Treasurer and portfolio management personnel, make periodic reports to the Board's committees, as appropriate. The responsibilities of each committee, including their oversight responsibilities, are described further under "Standing Committees of the Fund's Trustees."
Annual Report
The fund's Statement of Additional Information (SAI) includes more information about the Trustees. To request a free copy, call Fidelity at 1-877-208-0098.
Interested Trustees*:
Correspondence intended for each Trustee who is an interested person may be sent to Fidelity Investments, 82 Devonshire Street, Boston, Massachusetts 02109.
Name, Age; Principal Occupations and Other Relevant Experience+ |
James C. Curvey (75) |
| Year of Election or Appointment: 2007 Mr. Curvey is Trustee and Acting Chairman of the Board of Trustees of certain Trusts. Mr. Curvey also serves as Trustee (2007-present) of other investment companies advised by FMR. Mr. Curvey is a Director of Fidelity Investments Money Management, Inc. (2009-present), Director of Fidelity Research & Analysis Co. (2009-present) and Director of FMR and FMR Co., Inc. (2007-present). Mr. Curvey is also Vice Chairman (2007-present) and Director of FMR LLC. In addition, Mr. Curvey serves as an Overseer for the Boston Symphony Orchestra and a member of the Trustees of Villanova University. Previously, Mr. Curvey was the Vice Chairman (2006-2007) and Director (2000-2007) of FMR Corp. |
Ronald P. O'Hanley (54) |
| Year of Election or Appointment: 2011 Mr. O'Hanley is President of Fidelity Asset Management and Corporate Services and a member of Fidelity's Executive Committee (2010-present). Previously, Mr. O'Hanley served as President and Chief Executive Officer of BNY Mellon Asset Management (2007-2010). Mr. O'Hanley also served as Vice Chairman of Bank New York Mellon Corp. and a member of that firm's Executive Committee. Prior to the 2007 merger of The Bank of New York and Mellon Financial Corporation, he was Vice Chairman of Mellon Financial Corporation and President and Chief Executive Officer of Mellon Asset Management. He joined Mellon in February 1997. Mr. O'Hanley currently serves as Chairman of the Boston Public Library Foundation Board of Directors and sits on the Board of Directors of Beth Israel Deaconess Medical Center, the Board of Trustees of the Marine Biological Laboratory and the Advisory Board of the Maxwell School of Citizenship and Public Administration at Syracuse University. Mr. O'Hanley also chairs the Council on Asset Management for the Financial Services Roundtable and is a member of the Board of Directors of Institutional Investor's U.S. Institute. |
* Trustees have been determined to be "Interested Trustees" by virtue of, among other things, their affiliation with the trust or various entities under common control with FMR.
+ The information above includes each Trustee's principal occupation during the last five years and other information relating to the experience, attributes, and skills relevant to each Trustee's qualifications to serve as a Trustee, which led to the conclusion that each Trustee should serve as a Trustee for the fund.
Independent Trustees:
Correspondence intended for each Independent Trustee (that is, the Trustees other than the Interested Trustees) may be sent to Fidelity Investments, P.O. Box 55235, Boston, Massachusetts 02205-5235.
Name, Age; Principal Occupations and Other Relevant Experience+ |
Dennis J. Dirks (62) |
| Year of Election or Appointment: 2005 Prior to his retirement in May 2003, Mr. Dirks was Chief Operating Officer and a member of the Board of The Depository Trust & Clearing Corporation (DTCC). He also served as President, Chief Operating Officer, and Board member of The Depository Trust Company (DTC) and President and Board member of the National Securities Clearing Corporation (NSCC). In addition, Mr. Dirks served as Chief Executive Officer and Board member of the Government Securities Clearing Corporation, Chief Executive Officer and Board member of the Mortgage-Backed Securities Clearing Corporation, as a Trustee and a member of the Finance Committee of Manhattan College (2005-2008), and as a Trustee and a member of the Finance Committee of AHRC of Nassau County (2006-2008). Mr. Dirks is a member of the Independent Directors Council (IDC) Governing Council (2010-Present) and Board of Directors for The Brookville Center for Children's Services, Inc. (2009-present). |
Alan J. Lacy (57) |
| Year of Election or Appointment: 2008 Mr. Lacy serves as Senior Adviser (2007-present) of Oak Hill Capital Partners, L.P. (private equity). Mr. Lacy also served as Chief Executive Officer (2000-2005) and Vice Chairman (2005-2006) of Sears Holdings Corporation and Sears, Roebuck and Co. (retail). In addition, Mr. Lacy serves as a member of the Board of Directors of The Western Union Company (global money transfer, 2006-present) and Bristol-Myers Squibb Company (global pharmaceuticals, 2007-present). Mr. Lacy is Chairman (2008-present) and a member (2006-present) of the Board of Trustees of The National Parks Conservation Association. |
Ned C. Lautenbach (66) |
| Year of Election or Appointment: 2000 Mr. Lautenbach is Chairman of the Independent Trustees of the Equity and High Income Funds (2006-present). Mr. Lautenbach currently serves as the Lead Director of the Eaton Corporation Board of Directors (diversified industrial, 1997-present). Mr. Lautenbach is also a member of the Board of Directors of the Philharmonic Center for the Arts in Naples, Florida (1999-present); a member of the Board of Trustees of Fairfield University (2005-present); and a member of the Council on Foreign Relations (1994-present). Previously, Mr. Lautenbach was a Partner/Advisory Partner at Clayton, Dubilier & Rice, Inc. (private equity investment, 1998-2010), as well as a Director of Sony Corporation (2006-2007). |
Joseph Mauriello (66) |
| Year of Election or Appointment: 2008 Prior to his retirement in January 2006, Mr. Mauriello served in numerous senior management positions including Deputy Chairman and Chief Operating Officer (2004-2005), and Vice Chairman of Financial Services (2002-2004) of KPMG LLP US (professional services, 1965-2005). Mr. Mauriello currently serves as a member of the Board of Directors of XL Group plc. (global insurance and re-insurance, 2006-present) and of Arcadia Resources Inc. (health care services and products, 2007-present). Previously, Mr. Mauriello served as a Director of the Hamilton Funds of the Bank of New York (2006-2007). |
Cornelia M. Small (66) |
| Year of Election or Appointment: 2005 Ms. Small is a member of the Board of Directors of the Teagle Foundation (2009-present). Ms. Small is also a member of the Investment Committee, and Chair (2008-present) and a member of the Board of Trustees of Smith College. In addition, Ms. Small serves on the Investment Committee of the Berkshire Taconic Community Foundation (2008-present). Previously, Ms. Small served as Chairperson of the Investment Committee (2002-2008) of Smith College. In addition, Ms. Small served as Chief Investment Officer, Director of Global Equity Investments, and a member of the Board of Directors of Scudder, Stevens & Clark and Scudder Kemper Investments. |
William S. Stavropoulos (71) |
| Year of Election or Appointment: 2001 Mr. Stavropoulos is Vice Chairman of the Independent Trustees of the Equity and High Income Funds (2006-present). Mr. Stavropoulos serves as President and Founder of the Michigan Baseball Foundation, the Great Lakes Loons (2007-present). Mr. Stavropoulos is Chairman Emeritus of the Board of Directors of The Dow Chemical Company, where he previously served in numerous senior management positions, including President, CEO (1995-2000; 2002-2004), Chairman of the Executive Committee (2000-2006), and as a member of the Board of Directors (1990-2006). Currently, Mr. Stavropoulos is Chairman of Univar (global distributor of commodity and specialty chemicals, 2010-present), a Director of Teradata Corporation (data warehousing and technology solutions, 2008-present), Chemical Financial Corporation, Maersk Inc. (industrial conglomerate), Tyco International, Inc. (multinational manufacturing and services, 2007-present), and a member of the Advisory Board for Metalmark Capital (private equity investment, 2005-present). Mr. Stavropoulos is a special advisor to Clayton, Dubilier & Rice, LLC (private equity investment). In addition, Mr. Stavropoulos is a member of the University of Notre Dame Advisory Council for the College of Science. |
David M. Thomas (61) |
| Year of Election or Appointment: 2008 Previously, Mr. Thomas served as Executive Chairman (2005-2006) and Chairman and Chief Executive Officer (2000-2005) of IMS Health, Inc. (pharmaceutical and healthcare information solutions). In addition, Mr. Thomas serves as a member of the Board of Directors of Fortune Brands, Inc. (consumer products), and Interpublic Group of Companies, Inc. (marketing communication, 2004-present). |
Michael E. Wiley (60) |
| Year of Election or Appointment: 2008 Mr. Wiley also serves as a Director of Asia Pacific Exploration Consolidated (international oil and gas exploration and production, 2008-present). Mr. Wiley serves as a Director of Tesoro Corporation (independent oil refiner and marketer, 2005-present), and a Director of Bill Barrett Corporation (exploration and production, 2005-present). In addition, Mr. Wiley also serves as a Director of Post Oak Bank (privately-held bank, 2004-present). Previously, Mr. Wiley served as a member of the Board of Trustees of the University of Tulsa (2000-2006; 2007-2010), as a Senior Energy Advisor of Katzenbach Partners, LLC (consulting, 2006-2007), as an Advisory Director of Riverstone Holdings (private investment), Chairman, President, and CEO of Baker Hughes, Inc. (oilfield services, 2000-2004), and as Director of Spinnaker Exploration Company (exploration and production, 2001-2005). |
+ The information above includes each Trustee's principal occupation during the last five years and other information relating to the experience, attributes, and skills relevant to each Trustee's qualifications to serve as a Trustee, which led to the conclusion that each Trustee should serve as a Trustee for the fund.
Annual Report
Advisory Board Members and Executive Officers:
Correspondence intended for each executive officer, Edward C. Johnson 3d, and Peter S. Lynch may be sent to Fidelity Investments, 82 Devonshire Street, Boston, Massachusetts 02109.
Name, Age; Principal Occupation |
Edward C. Johnson 3d (80) |
| Year of Election or Appointment: 2011 Member of the Advisory Board of Fidelity's Equity and High Income Funds. Formerly Trustee and Chairman of the Board of Trustees of certain Trusts, Mr. Johnson serves as Chief Executive Officer, Chairman, and a Director of FMR LLC; Chairman and a Director of FMR; and Chairman and a Director of FMR Co., Inc. In addition, Mr. Johnson serves as Chairman and Director of FIL Limited. Previously, Mr. Johnson served as President of FMR LLC (2006-2007). |
Peter S. Lynch (66) |
| Year of Election or Appointment: 2003 Member of the Advisory Board of Fidelity's Equity and High Income Funds. Mr. Lynch is Vice Chairman and a Director of FMR and FMR Co., Inc. In addition, Mr. Lynch serves as a Trustee of Boston College and as the Chairman of the Inner-City Scholarship Fund. Previously, Mr. Lynch served on the Special Olympics International Board of Directors (1997-2006). |
Kenneth B. Robins (41) |
| Year of Election or Appointment: 2008 President and Treasurer of Fidelity's Equity and High Income Funds. Mr. Robins also serves as President and Treasurer (2010-present) and Assistant Treasurer (2009-present) of other Fidelity funds and is an employee of Fidelity Investments (2004-present). Previously, Mr. Robins served as Deputy Treasurer of the Fidelity funds (2005-2008) and Treasurer and Chief Financial Officer of The North Carolina Capital Management Trust: Cash and Term Portfolios (2006-2008). |
Brian B. Hogan (46) |
| Year of Election or Appointment: 2009 Vice President of certain Equity Funds and Vice President of Sector Funds. Mr. Hogan also serves as President of FMR's Equity Division (2009-present). Previously, Mr. Hogan served as Senior Vice President, Equity Research of FMR (2006-2009) and as a portfolio manager. |
Christopher S. Bartel (39) |
| Year of Election or Appointment: 2009 Vice President of Fidelity's Sector and Real Estate Equity Funds. Mr. Bartel also serves as Senior Vice President of Equity Research (2009-present). Previously, Mr. Bartel served as Managing Director of Research (2006-2009) and an analyst and portfolio manager (2000-2006). |
Scott C. Goebel (42) |
| Year of Election or Appointment: 2008 Secretary and Chief Legal Officer (CLO) of the Fidelity funds. Mr. Goebel also serves as Secretary and CLO of The North Carolina Capital Management Trust: Cash and Term Portfolio (2008-present); General Counsel, Secretary, and Senior Vice President of FMR (2008-present) and FMR Co., Inc. (2008-present); Deputy General Counsel of FMR LLC; Chief Legal Officer of Fidelity Management & Research (Hong Kong) Limited (2008-present) and Assistant Secretary of Fidelity Management & Research (Japan) Inc. (2008-present), Fidelity Investments Money Management, Inc. (2008-present), Fidelity Management & Research (U.K.) Inc. (2008-present), and Fidelity Research and Analysis Company (2008-present). Previously, Mr. Goebel served as Assistant Secretary of the Funds (2007-2008) and as Vice President and Secretary of Fidelity Distributors Corporation (FDC) (2005-2007). |
William C. Coffey (41) |
| Year of Election or Appointment: 2009 Assistant Secretary of Fidelity's Equity and High Income Funds. Mr. Coffey also serves as Senior Vice President and Deputy General Counsel of FMR LLC (2010-present), and is an employee of Fidelity Investments. Previously, Mr. Coffey served as Vice President and Associate General Counsel of FMR LLC (2005-2009). |
Holly C. Laurent (56) |
| Year of Election or Appointment: 2008 Anti-Money Laundering (AML) Officer of the Fidelity funds. Ms. Laurent also serves as AML Officer of The North Carolina Capital Management Trust: Cash and Term Portfolio (2008-present) and is an employee of Fidelity Investments. Previously, Ms. Laurent was Senior Vice President and Head of Legal for Fidelity Business Services India Pvt. Ltd. (2006-2008), and Senior Vice President, Deputy General Counsel and Group Head for FMR LLC (2005-2006). |
Christine Reynolds (52) |
| Year of Election or Appointment: 2008 Chief Financial Officer of the Fidelity funds. Ms. Reynolds became President of Fidelity Pricing and Cash Management Services (FPCMS) in August 2008. Ms. Reynolds served as Chief Operating Officer of FPCMS (2007-2008). Previously, Ms. Reynolds served as President, Treasurer, and Anti-Money Laundering officer of the Fidelity funds (2004-2007). |
Kenneth A. Rathgeber (63) |
| Year of Election or Appointment: 2004 Chief Compliance Officer of Fidelity's Equity and High Income Funds. Mr. Rathgeber is Chief Compliance Officer of Fidelity Management & Research (Hong Kong) Limited (2008-present), Fidelity Management & Research (Japan) Inc. (2008-present), FMR (2005-present), FMR Co., Inc. (2005-present), Fidelity Management & Research (U.K.) Inc. (2005-present), Fidelity Research & Analysis Company (2005-present), Fidelity Investments Money Management, Inc. (2005-present), Pyramis Global Advisors, LLC (2005-present), and Strategic Advisers, Inc. (2005-present). |
Jeffrey S. Christian (49) |
| Year of Election or Appointment: 2009 Deputy Treasurer of the Fidelity funds. Mr. Christian is an employee of Fidelity Investments. Previously, Mr. Christian served as Chief Financial Officer (2008-2009) of certain Fidelity funds and Senior Vice President of Fidelity Pricing and Cash Management Services (FPCMS) (2004-2009). |
Bryan A. Mehrmann (49) |
| Year of Election or Appointment: 2005 Deputy Treasurer of the Fidelity funds. Mr. Mehrmann is an employee of Fidelity Investments. |
Adrien E. Deberghes (43) |
| Year of Election or Appointment: 2008 Deputy Treasurer of Fidelity's Equity and High Income Funds. Mr. Deberghes also serves as Assistant Treasurer of other Fidelity funds (2010-present) and is an employee of Fidelity Investments (2008-present). Previously, Mr. Deberghes served as Senior Vice President of Mutual Fund Administration at State Street Corporation (2007-2008), Senior Director of Mutual Fund Administration at Investors Bank & Trust (2005-2007), and Director of Finance for Dunkin' Brands (2000-2005). |
Stephanie J. Dorsey (41) |
| Year of Election or Appointment: 2010 Assistant Treasurer of Fidelity's Equity and High Income Funds. Ms. Dorsey also serves as Deputy Treasurer of other Fidelity funds (2008-present) and is an employee of Fidelity Investments (2008-present). Previously, Ms. Dorsey served as Treasurer (2004-2008) of the JPMorgan Mutual Funds and Vice President (2004-2008) of JPMorgan Chase Bank. |
John R. Hebble (52) |
| Year of Election or Appointment: 2009 Assistant Treasurer of Fidelity's Equity and High Income Funds. Mr. Hebble also serves as Treasurer and Chief Financial Officer of The North Carolina Capital Management Trust: Cash and Term Portfolio (2008-present), President and Treasurer of other Fidelity funds (2008-present) and is an employee of Fidelity Investments. |
Gary W. Ryan (52) |
| Year of Election or Appointment: 2005 Assistant Treasurer of the Fidelity funds. Mr. Ryan is an employee of Fidelity Investments. Previously, Mr. Ryan served as Vice President of Fund Reporting in Fidelity Pricing and Cash Management Services (FPCMS) (1999-2005). |
Jonathan Davis (42) |
| Year of Election or Appointment: 2010 Assistant Treasurer of the Fidelity funds. Mr. Davis is an employee of Fidelity Investments. Previously, Mr. Davis served as Vice President and Associate General Counsel of FMR LLC (2003-2010). |
Annual Report
Service Class 2 designates 100% of the dividends distributed during the fiscal year as qualifying for the dividends-received deduction for corporate shareholders.
Annual Report
Board Approval of Investment Advisory Contracts and Management Fees
VIP Energy Portfolio
Each year, the Board of Trustees, including the Independent Trustees (together, the Board), votes on the renewal of the management contract and sub-advisory agreements (together, the Advisory Contracts) for the fund. The Board, assisted by the advice of fund counsel and Independent Trustees' counsel, requests and considers a broad range of information relevant to the renewal of the Advisory Contracts throughout the year.
The Board meets regularly and considers at each of its meetings factors that are relevant to its annual consideration of the renewal of the fund's Advisory Contracts, including the services and support provided to the fund and its shareholders. The Board has established various standing committees, each composed of Independent Trustees with varying backgrounds, to which the Board has assigned specific subject matter responsibilities in order to enhance effective decision-making by the Board. The Board, acting directly and through its Committees, requests and receives information concerning the annual consideration of the renewal of the fund's Advisory Contracts. The Board also meets as needed to consider matters specifically related to the Board's annual consideration of the renewal of Advisory Contracts. Members of the Board may also meet with trustees of other Fidelity funds through ad hoc joint committees to discuss certain matters relevant to the Fidelity funds.
At its July 2010 meeting, the Board of Trustees, including the Independent Trustees, unanimously determined to renew the fund's Advisory Contracts. In reaching its determination, the Board considered all factors it believed relevant, including (i) the nature, extent, and quality of the services to be provided to the fund and its shareholders (including the investment performance of the fund); (ii) the competitiveness of the fund's management fee and total expenses; (iii) the total costs of the services to be provided by and the profits to be realized by Fidelity from its relationship with the fund; (iv) the extent to which economies of scale would be realized as the fund grows; and (v) whether fee levels reflect these economies of scale, if any, for the benefit of fund shareholders.
In considering whether to renew the Advisory Contracts for the fund, the Board reached a determination, with the assistance of fund counsel and Independent Trustees' counsel and through the exercise of its business judgment, that the renewal of the Advisory Contracts is in the best interests of fund shareholders and that the compensation to be received by Fidelity under the management contract is fair and reasonable. The Board's decision to renew the Advisory Contracts was not based on any single factor noted above, but rather was based on a comprehensive consideration of all the information provided to the Board at its meetings throughout the year. The Board, in reaching its determination to renew the Advisory Contracts, is aware that shareholders in the fund have a broad range of investment choices available to them, including a wide choice among mutual funds offered by Fidelity's competitors, and that the fund's shareholders, with the opportunity to review and weigh the disclosure provided by the fund in its prospectus and other public disclosures, have chosen to invest in this fund, managed by Fidelity.
Nature, Extent, and Quality of Services Provided. The Board considered the staffing within the investment adviser, FMR, and the sub-advisers (together, the Investment Advisers), including the backgrounds of the fund's investment personnel and the fund's investment objective and discipline. The Independent Trustees also had discussions with senior management of Fidelity's investment operations and investment groups. The Board considered the structure of the portfolio manager compensation program and whether this structure provides appropriate incentives to act in the best interest of the fund.
Resources Dedicated to Investment Management and Support Services. The Board and the equity research subcommittee of the Board's Fund Oversight Committee reviewed the size, education, and experience of the Investment Advisers' investment staff, their use of technology, and the Investment Advisers' approach to recruiting, training, and retaining portfolio managers and other research, advisory, and management personnel. The Board noted that Fidelity's analysts have access to a variety of technological tools and market and securities data that enable them to perform both fundamental and quantitative analysis and to specialize in various disciplines. The Board considered Fidelity's extensive global research capabilities that enable the Investment Advisers to aggregate data from various sources in an effort to produce positive investment results. The Board also considered that Fidelity's portfolio managers and analysts have access to daily portfolio attribution that allows for monitoring of a fund's portfolio, as well as an electronic communication system that provides immediate real-time access to research concerning issuers and credit enhancers. The Board noted FMR's continued focus on strengthening the organization and discipline of equity portfolio management and research.
Shareholder and Administrative Services. The Board considered (i) the nature, extent, quality, and cost of advisory, administrative, and shareholder services performed by the Investment Advisers and their affiliates under the Advisory Contracts and under separate agreements covering transfer agency, pricing and bookkeeping, and securities lending services for the fund; (ii) the nature and extent of the investment adviser's supervision of third party service providers, principally custodians and subcustodians; and (iii) the resources devoted to, and the record of compliance with, the fund's compliance policies and procedures. The Board also reviewed the allocation of fund brokerage, including allocations to brokers affiliated with the Investment Advisers, the use of brokerage commissions to pay fund expenses, and the use of "soft" commission dollars to pay for research services.
The Board noted that the growth of fund assets over time across the complex allows Fidelity to reinvest in the development of services designed to enhance the value or convenience of the Fidelity funds as investment vehicles. These services include 24-hour access to account information and market information through phone representatives and over the Internet, and investor education materials and asset allocation tools.
Investment in a Large Fund Family. The Board considered the benefits to shareholders of investing in a Fidelity fund, including the benefits of investing in a fund that is part of a large family of funds offering a variety of investment disciplines and providing a large variety of mutual fund investor services. The Board noted that Fidelity had taken, or had made recommendations that resulted in the Fidelity funds taking, a number of actions over the previous year that benefited particular funds, including (i) dedicating additional resources to investment research and restructuring and broadening the focus of the investment research teams; (ii) bolstering the senior management team that oversees asset management; (iii) launching Class F of certain funds as a lower-fee class available to Freedom K and Freedom Index Funds; (iv) lowering the initial investment minimums and ongoing balance requirements for Real Estate High Income Fund; (v) eliminating subsequent purchase minimums for all funds and adding a waiver of the investment minimum requirement for new accounts opened with the proceeds of a systematic withdrawal plan; (vi) eliminating the withdrawal minimum and maximum limits for systematic withdrawals from Advisor funds; (vii) expanding sales load waivers on Class A shares for Destiny Planholders and expanding Institutional Class eligibility for Class O Destiny Planholders; and (viii) changing certain Class A and Class T sales charge structures to further align them with industry practices.
Annual Report
Board Approval of Investment Advisory Contracts and Management Fees - continued
Investment Performance. The Board considered whether the fund has operated in accordance with its investment objective, as well as its record of compliance with its investment restrictions. It also reviewed the fund's absolute investment performance for each class, as well as the fund's relative investment performance for each class measured over multiple periods against a third-party-sponsored index that reflects the market sector in which the fund invests. The Board noted that FMR does not believe that a meaningful peer group exists against which to compare the fund's performance. The following charts considered by the Board show, over the one-, three-, and five-year periods ended December 31, 2009, as available, the cumulative total returns of Initial Class and Service Class 2 of the fund and the cumulative total returns of a third-party-sponsored index ("benchmark"). The returns of Initial Class and Service Class 2 show the performance of the highest and lowest performing classes, respectively (based on three-year performance).
VIP Energy Portfolio
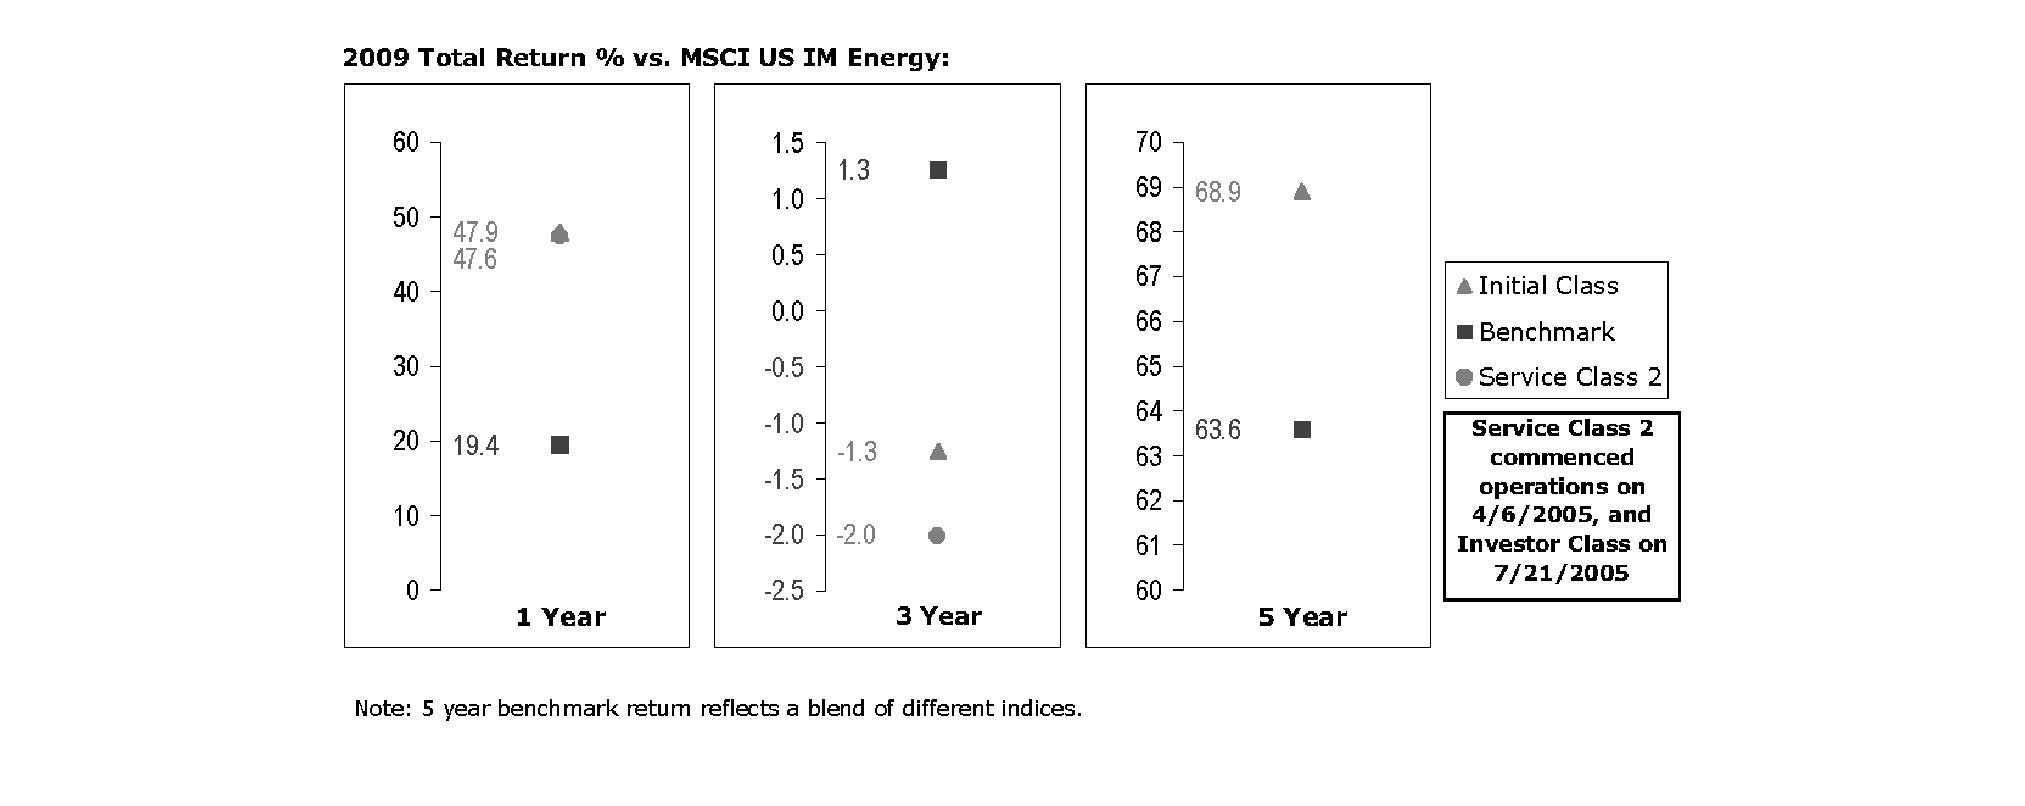
The Board noted that the investment performance of Initial Class of the fund compared favorably to its benchmark for the one- and five-year periods, although the fund's three-year cumulative total return was lower than its benchmark. The Board considered that the variations in performance among the fund's classes reflect the variations in class expenses, which result in lower performance for higher expense classes. The Board also reviewed the fund's performance since inception as well as performance in the current year.
Based on its review, and giving particular weight to the nature and quality of the resources dedicated by the Investment Advisers to maintain and improve relative performance and factoring in the unprecedented market events in recent years, the Board concluded that the nature, extent, and quality of investment management and support services and of shareholder and administrative services provided to the fund will benefit the fund's shareholders, particularly in light of the Board's view that the fund's shareholders benefit from investing in a fund that is part of a large family of funds offering a variety of investment disciplines and services.
Competitiveness of Management Fee and Total Fund Expenses. The Board considered the fund's management fee and total expenses compared to "mapped groups" of competitive funds and classes. Fidelity creates "mapped groups" by combining similar Lipper investment objective categories that have comparable management fee characteristics. Combining Lipper investment objective categories aids the Board's management fee and total expense comparisons by broadening the competitive group used for comparison and by reducing the number of universes to which various Fidelity funds are compared.
Management Fee. The Board considered two proprietary management fee comparisons for the 12-month periods shown in the chart below. The group of Lipper funds used by the Board for management fee comparisons is referred to below as the "Total Mapped Group." The Total Mapped Group comparison focuses on a fund's standing relative to the total universe of comparable funds available to investors, in terms of gross management fees before expense reimbursements or caps. "TMG %" represents the percentage of funds in the Total Mapped Group that had management fees that were lower than the fund's. For example, a TMG % of 3% means that 97% of the funds in the Total Mapped Group had higher management fees than the fund. The "Asset-Size Peer Group" (ASPG) comparison focuses on a fund's standing relative to non-Fidelity funds similar in size to the fund within the Total Mapped Group. The ASPG represents at least 15% of the funds in the Total Mapped Group with comparable asset size and management fee characteristics, subject to a minimum of 50 funds (or all funds in the Total Mapped Group if fewer than 50). Additional information, such as the ASPG quartile in which the fund's management fee ranked, is also included in the chart and considered by the Board.
Annual Report
VIP Energy Portfolio
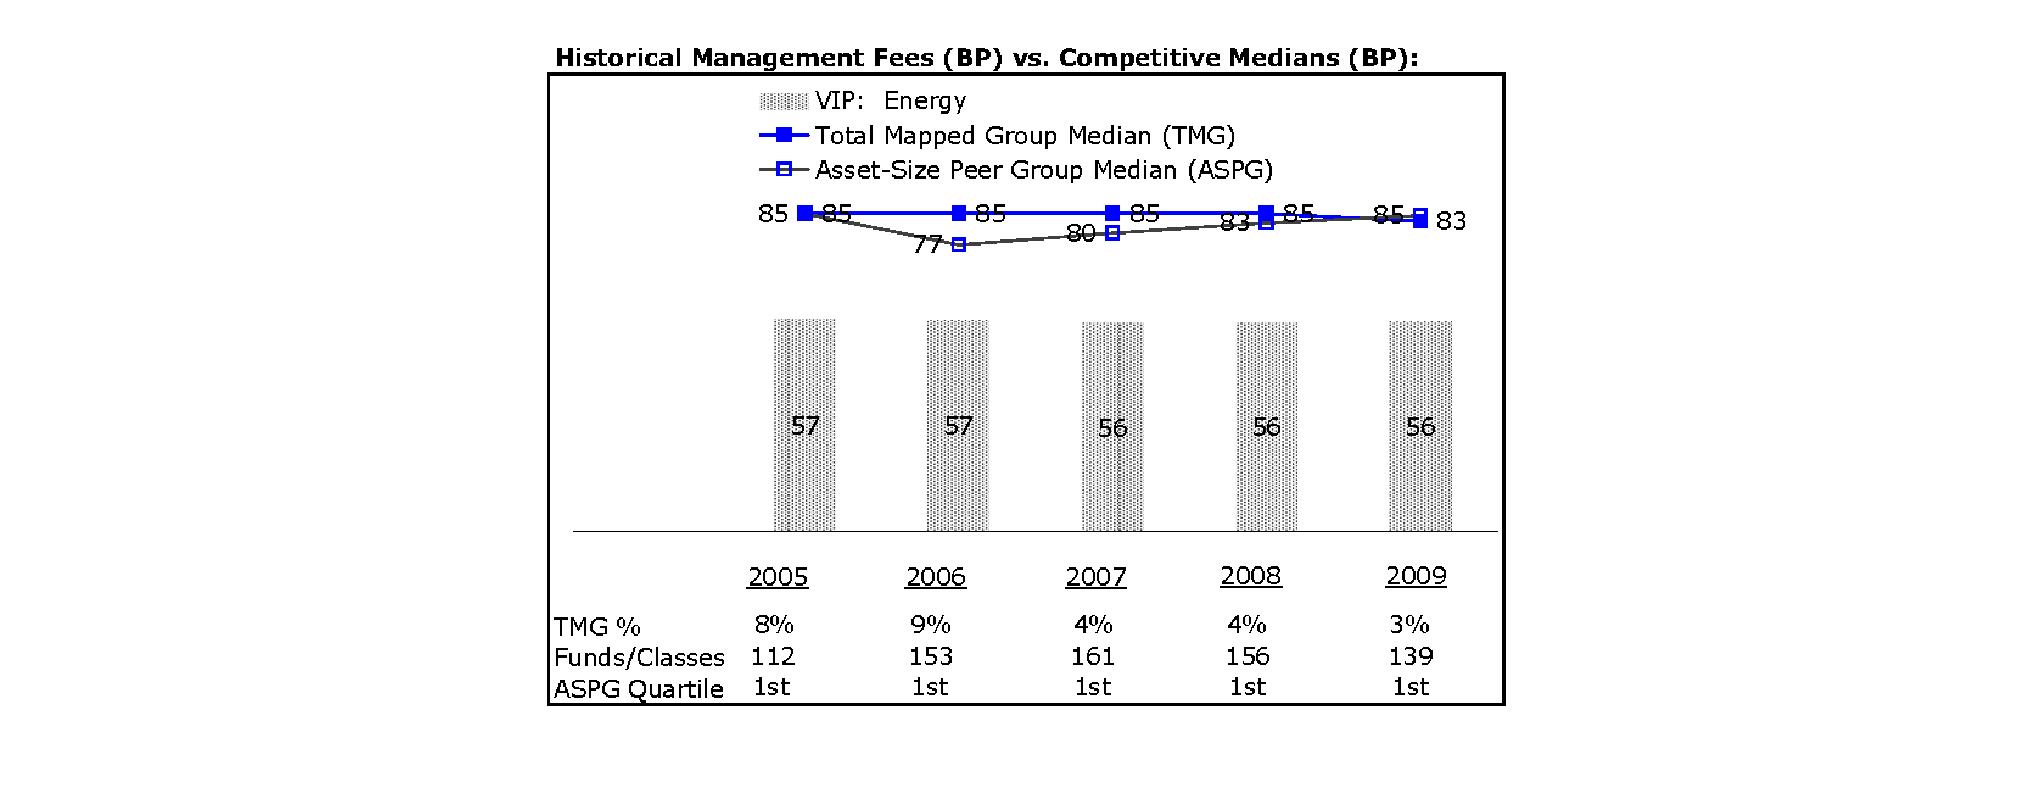
The Board noted that the fund's management fee ranked below the median of its Total Mapped Group and below the median of its ASPG for 2009.
Based on its review, the Board concluded that the fund's management fee is fair and reasonable in light of the services that the fund receives and the other factors considered.
Total Expenses. In its review of each class's total expenses, the Board considered the fund's management fee as well as other fund or class expenses, as applicable, such as transfer agent fees, pricing and bookkeeping fees, fund-paid 12b-1 fees, and custodial, legal, and audit fees. The Board also noted the effects of any waivers and reimbursements on fees and expenses. As part of its review, the Board also considered current and historical total expenses of each class of the fund compared to competitive fund median expenses. Each class of the fund is compared to those funds and classes in the Total Mapped Group (used by the Board for management fee comparisons) that have a similar sales load structure.
The Board noted that the total expenses of each class ranked below its competitive median for 2009.
Fees Charged to Other Fidelity Clients. The Board also considered Fidelity fee structures and other information with respect to clients of FMR and its affiliates, such as other mutual funds advised or subadvised by FMR or its affiliates, pension plan clients, and other institutional clients. In March 2010, the Board created an ad hoc joint committee with the board of other Fidelity funds (the Committee) to review and compare Fidelity's institutional investment advisory business with its business of providing services to the Fidelity funds, including the differences in services provided, fees charged, and costs incurred, as well as competition in their respective marketplaces.
Based on its review of total expenses and fees charged to other Fidelity clients, the Board concluded that the total expenses of each class of the fund were reasonable in light of the services that the fund and its shareholders receive and the other factors considered, including the findings of the Committee.
Costs of the Services and Profitability. The Board considered the revenues earned and the expenses incurred by Fidelity in conducting the business of developing, marketing, distributing, managing, administering and servicing the fund and its shareholders. The Board also considered the level of Fidelity's profits in respect of all the Fidelity funds.
On an annual basis, FMR presents to the Board Fidelity's profitability for the fund. Fidelity calculates the profitability for each fund, as well as aggregate profitability for groups of Fidelity funds and all Fidelity funds, using a series of detailed revenue and cost allocation methodologies which originate with the audited books and records of Fidelity. The Audit Committee of the Board reviews any significant changes from the prior year's methodologies.
Annual Report
Board Approval of Investment Advisory Contracts and Management Fees - continued
PricewaterhouseCoopers LLP (PwC), independent registered public accounting firm and auditor to Fidelity and certain Fidelity funds, has been engaged annually by the Board as part of the Board's assessment of Fidelity's profitability analysis. PwC's engagement includes the review and assessment of Fidelity's methodologies used in determining the revenues and expenses attributable to Fidelity's mutual fund business, and completion of agreed-upon procedures surrounding the mathematical accuracy of fund profitability and its conformity to allocation methodologies. After considering PwC's reports issued under the engagement and information provided by Fidelity, the Board believes that while other allocation methods may also be reasonable, Fidelity's profitability methodologies are reasonable in all material respects.
The Board has also reviewed Fidelity's non-fund businesses and fall-out benefits related to the mutual fund business as well as cases where Fidelity's affiliates may benefit from or be related to the fund's business.
The Board considered the costs of the services provided by and the profits realized by Fidelity in connection with the operation of the fund and were satisfied that the profitability was not excessive in the circumstances.
Economies of Scale. The Board considered whether there have been economies of scale in respect of the management of the Fidelity funds, whether the Fidelity funds (including the fund) have appropriately benefited from any such economies of scale, and whether there is potential for realization of any further economies of scale. The Board considered the extent to which the fund will benefit from economies of scale through increased services to the fund, through waivers or reimbursements, or through fee or expense reductions.
In February 2009, the Board and the board of other Fidelity funds created an ad hoc committee (the Economies of Scale Committee) to analyze whether FMR attains economies of scale in respect of the management and servicing of the Fidelity funds, whether the Fidelity funds have appropriately benefited from such economies of scale, and whether there is potential for realization of any further economies of scale.
The Board recognized that the fund's management contract incorporates a "group fee" structure, which provides for lower group fee rates as total fund assets under FMR's management increase, and for higher group fee rates as total fund assets under FMR's management decrease. FMR calculates the group fee rates based on a tiered asset "breakpoint" schedule that varies based on asset class. The Board considered that the group fee is designed to deliver the benefits of economies of scale to fund shareholders when total Fidelity fund assets increase, even if assets of any particular fund are unchanged or have declined, because some portion of Fidelity's costs are attributable to services provided to all Fidelity funds, and all funds benefit if those costs can be allocated among more assets. The Board concluded that, given the group fee structure, fund shareholders will benefit from lower management fees as assets under FMR's management increase at the fund complex level, regardless of whether Fidelity achieves any such economies of scale.
The Board concluded, considering the findings of the Economies of Scale Committee, that any potential economies of scale are being appropriately shared between fund shareholders and Fidelity.
Additional Information Requested by the Board. In order to develop fully the factual basis for consideration of the Fidelity funds' Advisory Contracts, the Board requested and received additional information on certain topics, including (i) fund performance trends, actions to be taken by FMR to improve certain funds' overall performance, and Fidelity's long-term strategies for certain funds; (ii) portfolio manager changes that have occurred during the past year and length of portfolio manager tenure for different categories of funds over time; (iii) Fidelity's compensation structure for portfolio managers, research analysts, and other key personnel, the rationale for the compensation structure, and how the compensation structure provides appropriate performance incentives; (iv) the amount of the investment that each portfolio manager has made in the Fidelity fund(s) that he or she manages; (v) management and other fees paid by FMR to affiliated sub-advisers on behalf of the Fidelity funds; (vi) Fidelity's fee structures and rationale for recommending different fees among different categories of funds; (vii) Fidelity's rationale for recommending which funds should have a performance adjustment component as part of their management fees; (viii) the rationale for any differences between fund fee structures and fee structures in place for other Fidelity clients; and (ix) explanations regarding the relative total expenses borne by certain funds and classes, total expense competitive trends, and actions that might be taken by FMR to reduce total expenses for certain funds and classes.
Based on its evaluation of all of the conclusions noted above, and after considering all factors it believed relevant, the Board ultimately concluded that the advisory fee structures are fair and reasonable, and that the fund's Advisory Contracts should be renewed.
Annual Report
Investment Adviser
Fidelity Management & Research Company
Boston, MA
Investment Sub-Advisers
FMR Co., Inc.
Fidelity Management & Research (U.K.) Inc.
Fidelity Management & Research (Hong Kong) Limited
Fidelity Management & Research (Japan) Inc.
General Distributor
Fidelity Distributors Corporation
Boston, MA
Transfer and Service Agents
Fidelity Investments Institutional Operations Company, Inc.
Boston, MA
Fidelity Service Company, Inc.
Boston, MA
Custodian
State Street Bank & Trust Co.
Quincy, MA
VNR2-ANN-0211
1.826359.106
Fidelity® Variable Insurance Products:
Financial Services Portfolio
Annual Report
December 31, 2010
(2_fidelity_logos) (Registered_Trademark)
Contents
Performance | <Click Here> | How the fund has done over time. |
Management's Discussion of Fund Performance | <Click Here> | The Portfolio Manager's review of fund performance and strategy. |
Shareholder Expense Example | <Click Here> | An example of shareholder expenses. |
Investment Changes | <Click Here> | A summary of major shifts in the fund's investments over the past six months. |
Investments | <Click Here> | A complete list of the fund's investments with their market values. |
Financial Statements | <Click Here> | Statements of assets and liabilities, operations, and changes in net assets, as well as financial highlights. |
Notes | <Click Here> | Notes to the financial statements. |
Report of Independent Registered Public Accounting Firm | <Click Here> | |
Trustees and Officers | <Click Here> | |
Distributions | <Click Here> | |
Board Approval of Investment Advisory Contracts and Management Fees | <Click Here> | |
To view a fund's proxy voting guidelines and proxy voting record for the 12-month period ended June 30, visit http://www.fidelity.com/proxyvotingresults or visit the Securities and Exchange Commission's (SEC) web site at http://www.sec.gov. You may also call 1-877-208-0098 to request a free copy of the proxy voting guidelines.
Fidelity Variable Insurance Products are separate account options which are purchased through a variable insurance contract.
Standard & Poor's, S&P and S&P 500 are registered service marks of The McGraw-Hill Companies, Inc. and have been licensed for use by Fidelity Distributors Corporation.
Other third party marks appearing herein are the property of their respective owners.
All other marks appearing herein are registered or unregistered trademarks or service marks of FMR LLC or an affiliated company.
This report and the financial statements contained herein are submitted for the general information of the shareholders of the fund. This report is not authorized for distribution to prospective investors in the fund unless preceded or accompanied by an effective prospectus.
A fund files its complete schedule of portfolio holdings with the SEC for the first and third quarters of each fiscal year on Form N-Q. Forms N-Q are available on the SEC's web site at http://www.sec.gov. A fund's Forms N-Q may be reviewed and copied at the SEC's Public Reference Room in Washington, DC. Information regarding the operation of the SEC's Public Reference Room may be obtained by calling 1-800-SEC-0330. For a complete list of the fund's portfolio holdings, view the most recent holdings listing, semiannual report, or annual report on Fidelity's web site at http://www.fidelity.com, http://www.advisor.fidelity.com, or http://www.401k.com, as applicable.
NOT FDIC INSURED • MAY LOSE VALUE • NO BANK GUARANTEE
Neither the fund nor Fidelity Distributors Corporation is a bank.
The general research services agreement with Fidelity Research & Analysis Company has been terminated and is no longer in effect for the fund.
Annual Report
Average annual total return reflects the change in the value of an investment, assuming reinvestment of the class' distributions from dividend income and capital gains (the profits earned upon the sale of securities that have grown in value, if any) and assuming a constant rate of performance each year. During periods of reimbursement by Fidelity, a fund's total return will be greater than it would be had the reimbursement not occurred. Performance numbers are net of all underlying fund operating expenses, but do not include any insurance charges imposed by your insurance company's separate account. If performance information included the effect of these additional charges, the total returns would have been lower. How a fund did yesterday is no guarantee of how it will do tomorrow.
Average Annual Total Returns
Periods ended December 31, 2010 | Past 1
year | Past 5
years | Life of fund A |
VIP Financial Services Portfolio - Initial Class | 7.28% | -7.25% | -0.84% |
VIP Financial Services Portfolio - Investor Class B | 7.24% | -7.36% | -0.90% |
A From July 18, 2001.
B The initial offering of Investor Class shares took place on July 21, 2005. Returns prior to July 21, 2005 are those of Initial Class. Had Investor Class's transfer agent fee been reflected, returns prior to July 21, 2005 would have been lower.
$10,000 Over Life of Fund
Let's say hypothetically that $10,000 was invested in VIP Financial Services Portfolio - Initial Class on July 18, 2001, when the fund started. The chart shows how the value of your investment would have changed, and also shows how the S&P 500® Index performed over the same period.
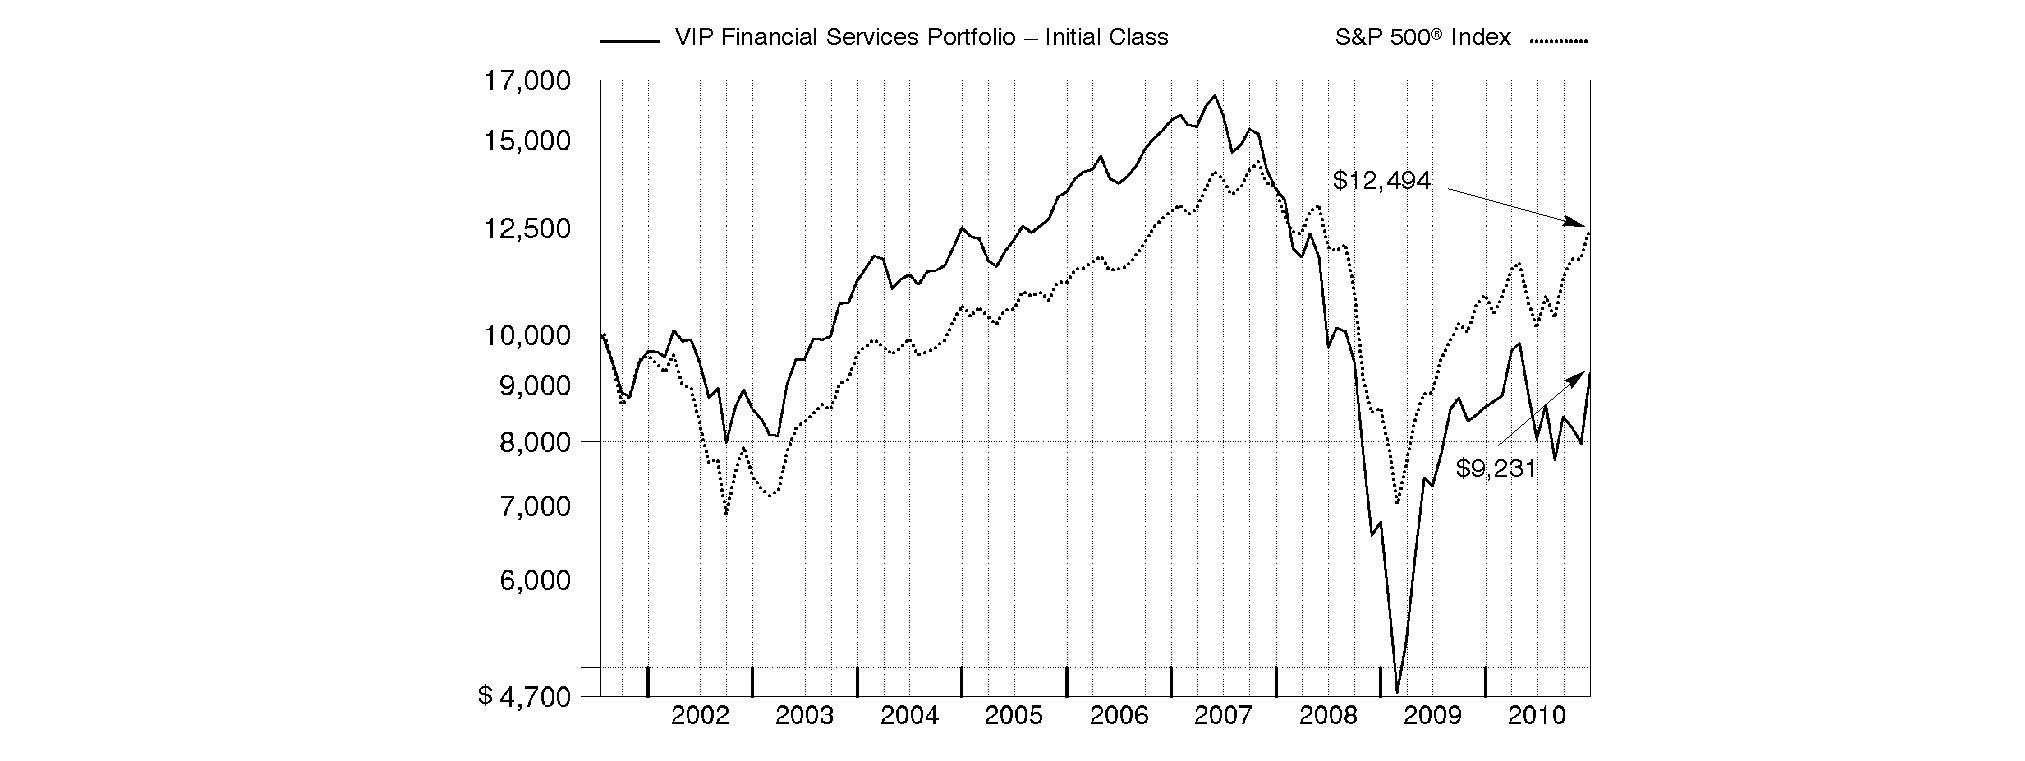
Annual Report
Market Recap: While market improvements around the world hit a speed bump in the first half of the 12-month period ending December 31, 2010, world economies re-accelerated in August, supported by a broadening recovery and low inflation in the U.S. Domestic stock markets recorded solid gains for the year, lifted by a strong second-half rally fueled by economic optimism, encouraging earnings reports and a wave of corporate mergers. The large-cap S&P 500® Index rose 15.06%, the blue-chip-laden Dow Jones Industrial AverageSM added 14.06% and the technology-heavy Nasdaq Composite® Index climbed 18.02%. Meanwhile, international stocks, as represented by the MSCI® ACWI® (All Country World Index) ex USA Index, gained 11.29%, boosted in part by a depreciating U.S. dollar. In the fixed-income arena, U.S. taxable investment-grade bonds generated positive results during 2010, as the Barclays Capital® U.S. Aggregate Bond Index gained 6.54%. With ultra-low interest rates bolstering nearly all fixed-income securities for most of the year, sectors in the index with higher yields and more credit risk generally fared best, while most high-quality bonds generated more-moderate returns. Meanwhile, high-yield bonds, as represented by The BofA Merrill LynchSM US High Yield Constrained Index, returned 15.07%, a result of improved economic data and strengthening investor demand. Overseas, foreign bond markets showed mixed results, with a sizable disparity between the 3.97% return of the Citigroup® Non-U.S. Group of 7 Index - which measures the performance of sovereign debt of the major global economies outside the U.S. - and the 12.04% advance of the JPMorgan Emerging Markets Bond Index Global (EMBI Global), which benefited from the rising overall credit quality of emerging-markets debt issuers.
Comments from Benjamin Hesse, Portfolio Manager of VIP Financial Services Portfolio: For the 12 months ending December 31, 2010, the fund's share classes significantly lagged the S&P 500® and the 14.87% return of the MSCI® U.S. IM Financials 25/50 Index, which was adopted in January 2010 as a better representation of the fund's investment universe. (For specific portfolio results, please refer to the performance section of this report.) Both industry weightings and security selection hurt performance. The fund lost ground versus the index from its positioning in several groups, including data processing/outsourced services, diversified banks, asset management/custody banks, regional banks and investment banking/brokerage. Data processing/outsourced services detracted the most, primarily because of the fund's stake in large credit card issuers, whose shares fell as investors worried about the impact of new regulations affecting debit card swipe fees. Diversified banks were another sizable disappointment, mainly due to exposure overseas. Shares of National Bank of Greece sank when the European Central Bank took longer than expected to offer help in resolving that country's sovereign debt problems, while stock issued by China CITIC Bank declined when the company's credit quality - meaning the number of loan delinquencies and defaults on its balance sheet - did not improve as fast as anticipated. I sold both names by period end. Elsewhere, shares of Synovus Financial, a regional bank located in the Southeast, suffered due to weak credit quality in the company's loan portfolio. Positioning within other diversified financial services and strong stock picking in specialized finance aided performance. Top stock contributors included Zions Bancorporation, a regional bank in the Western U.S., whose stock took off as the company's credit outlook improved, and credit-rating agency Moody's. I took profits and sold Moody's before period end.
The views expressed above reflect those of the portfolio manager(s) only through the end of the period as stated on the cover of this report and do not necessarily represent the views of Fidelity or any other person in the Fidelity organization. Any such views are subject to change at any time based upon market or other conditions and Fidelity disclaims any responsibility to update such views. These views may not be relied on as investment advice and, because investment decisions for a Fidelity fund are based on numerous factors, may not be relied on as an indication of trading intent on behalf of any Fidelity fund.
Annual Report
As a shareholder of the Fund, you incur two types of costs: (1) transaction costs, including redemption fees, and (2) ongoing costs, including management fees and other Fund expenses. This Example is intended to help you understand your ongoing costs (in dollars) of investing in the Fund and to compare these costs with the ongoing costs of investing in other mutual funds.
The Example is based on an investment of $1,000 invested at the beginning of the period and held for the entire period (July 1, 2010 to December 31, 2010).
Actual Expenses
The first line of the accompanying table for each class of the Fund provides information about actual account values and actual expenses. You may use the information in this line, together with the amount you invested, to estimate the expenses that you paid over the period. Simply divide your account value by $1,000.00 (for example, an $8,600 account value divided by $1,000.00 = 8.6), then multiply the result by the number in the first line for a class of the Fund under the heading entitled "Expenses Paid During Period" to estimate the expenses you paid on your account during this period. The estimate of expenses does not include any fees or other expenses of any variable annuity or variable life insurance product. If they were, the estimate of expenses you paid during the period would be higher, and your ending account value would be lower. In addition, the Fund, as a shareholder in the underlying Fidelity Central Funds, will indirectly bear its pro-rata share of the fees and expenses incurred by the underlying Fidelity Central Funds. These fees and expenses are not included in the Fund's annualized expense ratio used to calculate the expense estimate in the table below.
Hypothetical Example for Comparison Purposes
The second line of the accompanying table for each class of the Fund provides information about hypothetical account values and hypothetical expenses based on a Class' actual expense ratio and an assumed rate of return of 5% per year before expenses, which is not the Class' actual return. The hypothetical account values and expenses may not be used to estimate the actual ending account balance or expenses you paid for the period. You may use this information to compare the ongoing costs of investing in the Fund and other funds. To do so, compare this 5% hypothetical example with the 5% hypothetical examples that appear in the shareholder reports of the other funds. The estimate of expenses does not include any fees or other expenses of any variable annuity or variable life insurance product. If they were, the estimate of expenses you paid during the period would be higher, and your ending account value would be lower. In addition, the Fund, as a shareholder in the underlying Fidelity Central Funds, will indirectly bear its pro-rata share of the fees and expenses incurred by the underlying Fidelity Central Funds. These fees and expenses are not included in the Fund's annualized expense ratio used to calculate the expense estimate in the table below.
Please note that the expenses shown in the table are meant to highlight your ongoing costs only and do not reflect any transaction costs. Therefore, the second line of the table is useful in comparing ongoing costs only, and will not help you determine the relative total costs of owning different funds. In addition, if these transactional costs were included, your costs would have been higher.
| Annualized
Expense Ratio | Beginning
Account Value
July 1, 2010 | Ending
Account Value
December 31, 2010 | Expenses Paid
During Period*
July 1, 2010 to
December 31, 2010 |
Initial Class | .87% | | | |
Actual | | $ 1,000.00 | $ 1,147.30 | $ 4.71 |
Hypothetical A | | $ 1,000.00 | $ 1,020.82 | $ 4.43 |
Investor Class | .96% | | | |
Actual | | $ 1,000.00 | $ 1,147.10 | $ 5.20 |
Hypothetical A | | $ 1,000.00 | $ 1,020.37 | $ 4.89 |
A 5% return per year before expenses
* Expenses are equal to each Class' annualized expense ratio, multiplied by the average account value over the period, multiplied by 184/365 (to reflect the one-half year period).
Annual Report
Investment Changes (Unaudited)
Top Ten Stocks as of December 31, 2010 |
| % of fund's
net assets | % of fund's net assets
6 months ago |
Comerica, Inc. | 7.8 | 0.3 |
Regions Financial Corp. | 6.2 | 4.6 |
Marshall & Ilsley Corp. | 5.9 | 0.0 |
Synovus Financial Corp. | 5.0 | 4.4 |
JPMorgan Chase & Co. | 4.9 | 4.7 |
Visa, Inc. Class A | 4.9 | 4.9 |
Morgan Stanley | 4.6 | 4.3 |
Zions Bancorporation | 4.6 | 4.8 |
Bank of America Corp. | 4.6 | 4.7 |
Citigroup, Inc. | 4.4 | 5.5 |
| 52.9 | |
Top Industries (% of fund's net assets) |
As of December 31, 2010 |
| Commercial Banks | 45.8% | |
| Capital Markets | 17.8% | |
| Diversified Financial Services | 14.5% | |
| IT Services | 13.0% | |
| Insurance | 3.2% | |
| All Others* | 5.7% | |

As of June 30, 2010 |
| Commercial Banks | 36.1% | |
| Capital Markets | 21.2% | |
| Diversified Financial Services | 19.8% | |
| IT Services | 11.9% | |
| Insurance | 4.9% | |
| All Others* | 6.1% | |

* Includes short-term investments and net other assets. |
Annual Report
Investments December 31, 2010
Showing Percentage of Net Assets
Common Stocks - 97.5% |
| Shares | | Value |
CAPITAL MARKETS - 17.8% |
Asset Management & Custody Banks - 2.7% |
AllianceBernstein Holding LP | 7,400 | | $ 172,642 |
Bank of New York Mellon Corp. | 10,478 | | 316,436 |
EFG International | 6,997 | | 95,860 |
Invesco Ltd. | 8,500 | | 204,510 |
Janus Capital Group, Inc. | 11,600 | | 150,452 |
Legg Mason, Inc. | 5,062 | | 183,599 |
| | 1,123,499 |
Investment Banking & Brokerage - 15.1% |
Charles Schwab Corp. | 22,700 | | 388,397 |
E*TRADE Financial Corp. (a) | 50,682 | | 810,912 |
Evercore Partners, Inc. Class A | 16,046 | | 545,564 |
GFI Group, Inc. | 125,439 | | 588,309 |
Gleacher & Co., Inc. (a) | 62,101 | | 147,179 |
Goldman Sachs Group, Inc. | 4,839 | | 813,726 |
Jefferies Group, Inc. (d) | 11,195 | | 298,123 |
MF Global Holdings Ltd. (a) | 79,147 | | 661,669 |
Morgan Stanley | 69,595 | | 1,893,680 |
| | 6,147,559 |
TOTAL CAPITAL MARKETS | | 7,271,058 |
COMMERCIAL BANKS - 45.8% |
Diversified Banks - 9.1% |
Banco ABC Brasil SA | 20,000 | | 176,192 |
Banco do Estado do Rio Grande do Sul SA | 3,000 | | 31,906 |
Banco Pine SA | 4,000 | | 36,154 |
Comerica, Inc. | 75,101 | | 3,172,266 |
U.S. Bancorp, Delaware | 11,100 | | 299,367 |
| | 3,715,885 |
Regional Banks - 36.7% |
Banco Daycoval SA (PN) | 22,100 | | 172,453 |
Bancorp New Jersey, Inc. | 715 | | 7,987 |
BancTrust Financial Group, Inc. (a)(d) | 7,400 | | 19,758 |
Bridge Capital Holdings (a) | 1,100 | | 9,570 |
Bridge Capital Holdings (a)(e) | 11,030 | | 86,365 |
CIT Group, Inc. (a) | 23,482 | | 1,106,002 |
Citizens Banking Corp., Michigan (a) | 254,684 | | 156,631 |
City National Corp. | 8,699 | | 533,771 |
CoBiz, Inc. | 53,020 | | 322,362 |
Evans Bancorp, Inc. | 652 | | 9,258 |
First Horizon National Corp. | 57,438 | | 676,620 |
First Interstate Bancsystem, Inc. | 10,900 | | 166,116 |
Glacier Bancorp, Inc. | 25,360 | | 383,190 |
Landmark Bancorp, Inc. | 89 | | 1,452 |
Marshall & Ilsley Corp. | 347,087 | | 2,401,842 |
MidWestOne Financial Group, Inc. | 862 | | 13,025 |
Monroe Bancorp | 1,300 | | 18,681 |
Oriental Financial Group, Inc. | 15,200 | | 189,848 |
Regions Financial Corp. | 359,824 | | 2,518,768 |
|
| Shares | | Value |
Savannah Bancorp, Inc. | 6,662 | | $ 46,634 |
Southwest Bancorp, Inc., Oklahoma | 2,000 | | 24,800 |
Sun Bancorp, Inc., New Jersey (a) | 6,000 | | 27,840 |
SunTrust Banks, Inc. | 46,472 | | 1,371,389 |
Susquehanna Bancshares, Inc., Pennsylvania | 40,856 | | 395,486 |
SVB Financial Group (a) | 6,073 | | 322,173 |
Synovus Financial Corp. | 773,077 | | 2,040,923 |
United Security Bancshares, California (d) | 1,751 | | 6,584 |
Washington Trust Bancorp, Inc. | 700 | | 15,316 |
West Bancorp., Inc. | 1,595 | | 12,425 |
Western Alliance Bancorp. (a) | 6,000 | | 44,160 |
Zions Bancorporation | 78,066 | | 1,891,539 |
| | 14,992,968 |
TOTAL COMMERCIAL BANKS | | 18,708,853 |
CONSUMER FINANCE - 1.4% |
Consumer Finance - 1.4% |
Netspend Holdings, Inc. | 200 | | 2,564 |
SLM Corp. (a) | 45,498 | | 572,820 |
| | 575,384 |
DIVERSIFIED FINANCIAL SERVICES - 14.5% |
Other Diversified Financial Services - 13.9% |
Bank of America Corp. | 140,413 | | 1,873,109 |
Citigroup, Inc. (a) | 385,355 | | 1,822,729 |
JPMorgan Chase & Co. | 46,895 | | 1,989,286 |
| | 5,685,124 |
Specialized Finance - 0.6% |
Infrastructure Development Finance Co. Ltd. | 56,311 | | 229,967 |
TOTAL DIVERSIFIED FINANCIAL SERVICES | | 5,915,091 |
INSURANCE - 3.2% |
Multi-Line Insurance - 3.2% |
American International Group, Inc. (a)(d) | 3,329 | | 191,817 |
Fairfax Financial Holdings Ltd. (sub. vtg.) | 300 | | 123,029 |
Genworth Financial, Inc. Class A (a) | 73,995 | | 972,294 |
| | 1,287,140 |
INTERNET SOFTWARE & SERVICES - 0.7% |
Internet Software & Services - 0.7% |
China Finance Online Co. Ltd. ADR (a)(d) | 43,047 | | 281,097 |
IT SERVICES - 13.0% |
Data Processing & Outsourced Services - 13.0% |
Alliance Data Systems Corp. (a)(d) | 23,135 | | 1,643,279 |
MasterCard, Inc. Class A | 6,200 | | 1,389,482 |
MoneyGram International, Inc. (a) | 109,568 | | 296,929 |
Visa, Inc. Class A | 28,090 | | 1,976,974 |
| | 5,306,664 |
Common Stocks - continued |
| Shares | | Value |
REAL ESTATE INVESTMENT TRUSTS - 0.7% |
Specialized REITs - 0.7% |
Weyerhaeuser Co. | 13,800 | | $ 261,234 |
SPECIALTY RETAIL - 0.1% |
Home Improvement Retail - 0.1% |
Home Depot, Inc. | 1,360 | | 47,682 |
THRIFTS & MORTGAGE FINANCE - 0.3% |
Thrifts & Mortgage Finance - 0.3% |
BofI Holding, Inc. (a) | 4,033 | | 62,552 |
Cheviot Financial Corp. | 6,470 | | 57,583 |
Chicopee Bancorp, Inc. (a) | 600 | | 7,590 |
Mayflower Bancorp, Inc. | 640 | | 5,760 |
Washington Mutual, Inc. (a) | 16,757 | | 948 |
| | 134,433 |
TOTAL COMMON STOCKS (Cost $37,953,658) | 39,788,636 |
Money Market Funds - 4.4% |
| | | |
Fidelity Cash Central Fund, 0.19% (b) | 1,000 | | 1,000 |
Fidelity Securities Lending Cash Central Fund, 0.21% (b)(c) | 1,807,239 | | 1,807,239 |
TOTAL MONEY MARKET FUNDS (Cost $1,808,239) | 1,808,239 |
Cash Equivalents - 4.3% |
| Maturity Amount | | Value |
Investments in repurchase agreements in a joint trading account at 0.2%, dated 12/31/10 due 1/3/11 (Collateralized by U.S. Treasury Obligations) #
(Cost $1,751,000) | $ 1,751,029 | | $ 1,751,000 |
TOTAL INVESTMENT PORTFOLIO - 106.2% (Cost $41,512,897) | | 43,347,875 |
NET OTHER ASSETS (LIABILITIES) - (6.2)% | | (2,534,034) |
NET ASSETS - 100% | $ 40,813,841 |
Legend |
(a) Non-income producing |
(b) Affiliated fund that is available only to investment companies and other accounts managed by Fidelity Investments. The rate quoted is the annualized seven-day yield of the fund at period end. A complete unaudited listing of the fund's holdings as of its most recent quarter end is available upon request. In addition, each Fidelity Central Fund's financial statements, which are not covered by the Fund's Report of Independent Registered Public Accounting Firm, are available on the SEC's website or upon request. |
(c) Investment made with cash collateral received from securities on loan. |
(d) Security or a portion of the security is on loan at period end. |
(e) Restricted securities - Investment in securities not registered under the Securities Act of 1933 (excluding 144A issues). At the end of the period, the value of restricted securities (excluding 144A issues) amounted to $86,365 or 0.2% of net assets. |
Additional information on each holding is as follows: |
Security | Acquisition Date | Acquisition Cost |
Bridge Capital Holdings | 11/19/10 | $ 94,307 |
# Additional information on each counterparty to the repurchase agreement is as follows: |
Repurchase Agreement / Counterparty | Value |
$1,751,000 due 1/03/11 at 0.20% |
BNP Paribas Securities Corp. | $ 207,034 |
Barclays Capital, Inc. | 413,078 |
Citigroup Global Markets, Inc. | 133,252 |
Credit Agricole Securities (USA), Inc. | 266,504 |
Deutsche Bank Securities, Inc. | 53,301 |
HSBC Securities (USA), Inc. | 157,094 |
J.P. Morgan Securities, Inc. | 133,252 |
Merrill Lynch, Pierce, Fenner & Smith, Inc. | 39,976 |
Mizuho Securities USA, Inc. | 226,528 |
RBS Securities, Inc. | 74,343 |
Societe Generale, New York Branch | 33,313 |
Wells Fargo Securities LLC | 13,325 |
| $ 1,751,000 |
Affiliated Central Funds |
Information regarding fiscal year to date income earned by the Fund from investments in Fidelity Central Funds is as follows: |
Fund | Income earned |
Fidelity Cash Central Fund | $ 1,240 |
Fidelity Securities Lending Cash Central Fund | 18,852 |
Total | $ 20,092 |
Other Information |
The following is a summary of the inputs used, as of December 31, 2010, involving the Fund's assets and liabilities carried at fair value. The inputs or methodology used for valuing securities may not be an indication of the risk associated with investing in those securities. For more information on valuation inputs, and their aggregation into the levels used in the table below, please refer to the Security Valuation section in the accompanying Notes to Financial Statements. |
Valuation Inputs at Reporting Date: |
Description | Total | Level 1 | Level 2 | Level 3 |
Investments in Securities: | | | | |
Common Stocks | $ 39,788,636 | $ 39,702,271 | $ 86,365 | $ - |
Money Market Funds | 1,808,239 | 1,808,239 | - | - |
Cash Equivalents | 1,751,000 | - | 1,751,000 | - |
Total Investments in Securities: | $ 43,347,875 | $ 41,510,510 | $ 1,837,365 | $ - |
Income Tax Information |
At December 31, 2010, the Fund had a capital loss carryforward of approximately $13,908,817 of which $5,260,890 and $8,647,927 will expire in fiscal 2016 and 2017, respectively. Capital loss carryforwards are only available to offset future capital gains of the Fund to the extent provided by regulations and may be limited. |
See accompanying notes which are an integral part of the financial statements.
Annual Report
Statement of Assets and Liabilities
| December 31, 2010 |
| | |
Assets | | |
Investment in securities, at value (including securities loaned of $1,764,322 and repurchase agreements of $1,751,000) - See accompanying schedule: Unaffiliated issuers (cost $39,704,658) | $ 41,539,636 | |
Fidelity Central Funds (cost $1,808,239) | 1,808,239 | |
Total Investments (cost $41,512,897) | | $ 43,347,875 |
Cash | | 484 |
Receivable for investments sold | | 2,077 |
Receivable for fund shares sold | | 44,899 |
Dividends receivable | | 23,031 |
Distributions receivable from Fidelity Central Funds | | 728 |
Prepaid expenses | | 126 |
Other receivables | | 2,382 |
Total assets | | 43,421,602 |
| | |
Liabilities | | |
Payable for investments purchased | $ 742,812 | |
Accrued management fee | 16,899 | |
Other affiliated payables | 4,544 | |
Other payables and accrued expenses | 36,267 | |
Collateral on securities loaned, at value | 1,807,239 | |
Total liabilities | | 2,607,761 |
| | |
Net Assets | | $ 40,813,841 |
Net Assets consist of: | | |
Paid in capital | | $ 53,796,778 |
Undistributed net investment income | | 22,678 |
Accumulated undistributed net realized gain (loss) on investments and foreign currency transactions | | (14,840,702) |
Net unrealized appreciation (depreciation) on investments and assets and liabilities in foreign currencies | | 1,835,087 |
Net Assets | | $ 40,813,841 |
Statement of Assets and Liabilities - continued
| December 31, 2010 |
| | |
Initial Class:
Net Asset Value, offering price and redemption price per share ($18,958,708 ÷ 2,704,138 shares) | | $ 7.01 |
| | |
Investor Class:
Net Asset Value, offering price and redemption price per share ($21,855,133 ÷ 3,127,095 shares) | | $ 6.99 |
See accompanying notes which are an integral part of the financial statements.
Annual Report
Financial Statements - continued
Statement of Operations
| Year ended December 31, 2010 |
| | |
Investment Income | | |
Dividends | | $ 474,266 |
Interest | | 388 |
Income from Fidelity Central Funds | | 20,092 |
Total income | | 494,746 |
| | |
Expenses | | |
Management fee | $ 231,926 | |
Transfer agent fees | 54,522 | |
Accounting and security lending fees | 16,959 | |
Custodian fees and expenses | 45,395 | |
Independent trustees' compensation | 237 | |
Audit | 41,396 | |
Legal | 202 | |
Interest | 306 | |
Miscellaneous | 542 | |
Total expenses before reductions | 391,485 | |
Expense reductions | (20,111) | 371,374 |
Net investment income (loss) | | 123,372 |
Realized and Unrealized Gain (Loss) Net realized gain (loss) on: | | |
Investment securities: | | |
Unaffiliated issuers (net of foreign taxes of $463) | 414,970 | |
Foreign currency transactions | (3,154) | |
Total net realized gain (loss) | | 411,816 |
Change in net unrealized appreciation (depreciation) on: Investment securities | (791,822) | |
Assets and liabilities in foreign currencies | 109 | |
Total change in net unrealized appreciation (depreciation) | | (791,713) |
Net gain (loss) | | (379,897) |
Net increase (decrease) in net assets resulting from operations | | $ (256,525) |
Statement of Changes in Net Assets
| Year ended
December 31, 2010 | Year ended
December 31, 2009 |
Increase (Decrease) in Net Assets | | |
Operations | | |
Net investment income (loss) | $ 123,372 | $ 388,983 |
Net realized gain (loss) | 411,816 | (1,578,861) |
Change in net unrealized appreciation (depreciation) | (791,713) | 12,561,654 |
Net increase (decrease) in net assets resulting from operations | (256,525) | 11,371,776 |
Distributions to shareholders from net investment income | (76,655) | (480,612) |
Share transactions - net increase (decrease) | 4,212,776 | (3,476,603) |
Redemption fees | 25,036 | 47,529 |
Total increase (decrease) in net assets | 3,904,632 | 7,462,090 |
| | |
Net Assets | | |
Beginning of period | 36,909,209 | 29,447,119 |
End of period (including undistributed net investment income of $22,678 and undistributed net investment income of $11,496, respectively) | $ 40,813,841 | $ 36,909,209 |
See accompanying notes which are an integral part of the financial statements.
Annual Report
Financial Highlights - Initial Class
Years ended December 31, | 2010 | 2009 | 2008 | 2007 | 2006 |
Selected Per-Share Data | | | | | |
Net asset value, beginning of period | $ 6.55 | $ 5.22 | $ 11.57 | $ 14.60 | $ 12.98 |
Income from Investment Operations | | | | | |
Net investment income (loss) C | .02 | .06 | .21 | .20 | .18 |
Net realized and unrealized gain (loss) | .46 F | 1.35 | (5.68) | (2.02) | 1.86 |
Total from investment operations | .48 | 1.41 | (5.47) | (1.82) | 2.04 |
Distributions from net investment income | (.02) | (.09) | (.15) | (.36) | (.16) |
Distributions from net realized gain | - | - | (.74) | (.86) | (.27) |
Total distributions | (.02) | (.09) | (.89) | (1.22) | (.43) |
Redemption fees added to paid in capital C | - H | .01 | .01 | .01 | .01 |
Net asset value, end of period | $ 7.01 | $ 6.55 | $ 5.22 | $ 11.57 | $ 14.60 |
Total Return A,B | 7.28% | 27.30% | (50.08)% | (13.43)% | 16.29% |
Ratios to Average Net Assets D,G | | | | | |
Expenses before reductions | .90% | .91% | .84% | .87% | .86% |
Expenses net of fee waivers, if any | .90% | .91% | .84% | .87% | .86% |
Expenses net of all reductions | .85% | .87% | .84% | .87% | .85% |
Net investment income (loss) | .34% | 1.09% | 2.64% | 1.48% | 1.36% |
Supplemental Data | | | | | |
Net assets, end of period (000 omitted) | $ 18,959 | $ 20,155 | $ 17,436 | $ 23,631 | $ 44,781 |
Portfolio turnover rate E | 288% | 336% | 100% | 48% | 68% |
A Total returns do not reflect charges attributable to your insurance company's separate account. Inclusion of these charges would reduce the total returns shown.
B Total returns would have been lower had certain expenses not been reduced during the periods shown.
C Calculated based on average shares outstanding during the period.
D Fees and expenses of the underlying Fidelity Central Funds are not included in the Fund's expense ratio. The Fund indirectly bears its proportionate share of the expenses of any underlying Fidelity Central Funds.
E Amount does not include the portfolio activity of any underlying Fidelity Central Funds.
F The amount shown for a share outstanding does not correspond with the aggregate net gain (loss) on investments for the period due to the timing of sales and repurchases of shares in relation to fluctuating market values of the investments of the Fund.
G Expense ratios reflect operating expenses of the class. Expenses before reductions do not reflect amounts reimbursed by the investment adviser or reductions from brokerage service arrangements or reductions from other expense offset arrangements and do not represent the amount paid by the class during periods when reimbursements or reductions occur. Expenses net of fee waivers reflect expenses after reimbursement by the investment adviser but prior to reductions from brokerage service arrangements or other expense offset arrangements. Expenses net of all reductions represent the net expenses paid by the class.
H Amount represents less than $.01 per share.
Financial Highlights - Investor Class
Years ended December 31, | 2010 | 2009 | 2008 | 2007 | 2006 |
Selected Per-Share Data | | | | | |
Net asset value, beginning of period | $ 6.53 | $ 5.20 | $ 11.54 | $ 14.57 | $ 12.98 |
Income from Investment Operations | | | | | |
Net investment income (loss) C | .02 | .06 | .20 | .18 | .16 |
Net realized and unrealized gain (loss) | .45 F | 1.34 | (5.67) | (2.02) | 1.86 |
Total from investment operations | .47 | 1.40 | (5.47) | (1.84) | 2.02 |
Distributions from net investment income | (.01) | (.08) | (.14) | (.34) | (.17) |
Distributions from net realized gain | - | - | (.74) | (.86) | (.27) |
Total distributions | (.01) | (.08) | (.88) | (1.20) | (.44) |
Redemption fees added to paid in capital C | - H | .01 | .01 | .01 | .01 |
Net asset value, end of period | $ 6.99 | $ 6.53 | $ 5.20 | $ 11.54 | $ 14.57 |
Total Return A,B | 7.24% | 27.30% | (50.18)% | (13.60)% | 16.12% |
Ratios to Average Net Assets D,G | | | | | |
Expenses before reductions | .99% | 1.01% | .94% | .99% | 1.00% |
Expenses net of fee waivers, if any | .98% | 1.01% | .94% | .99% | 1.00% |
Expenses net of all reductions | .94% | .97% | .94% | .99% | .99% |
Net investment income (loss) | .25% | .99% | 2.54% | 1.36% | 1.22% |
Supplemental Data | | | | | |
Net assets, end of period (000 omitted) | $ 21,855 | $ 16,754 | $ 12,012 | $ 10,530 | $ 13,030 |
Portfolio turnover rate E | 288% | 336% | 100% | 48% | 68% |
A Total returns do not reflect charges attributable to your insurance company's separate account. Inclusion of these charges would reduce the total returns shown.
B Total returns would have been lower had certain expenses not been reduced during the periods shown.
C Calculated based on average shares outstanding during the period.
D Fees and expenses of the underlying Fidelity Central Funds are not included in the Fund's expense ratio. The Fund indirectly bears its proportionate share of the expenses of any underlying Fidelity Central Funds.
E Amount does not include the portfolio activity of any underlying Fidelity Central Funds.
F The amount shown for a share outstanding does not correspond with the aggregate net gain (loss) on investments for the period due to the timing of sales and repurchases of shares in relation to fluctuating market values of the investments of the Fund.
G Expense ratios reflect operating expenses of the class. Expenses before reductions do not reflect amounts reimbursed by the investment adviser or reductions from brokerage service arrangements or reductions from other expense offset arrangements and do not represent the amount paid by the class during periods when reimbursements or reductions occur. Expenses net of fee waivers reflect expenses after reimbursement by the investment adviser but prior to reductions from brokerage service arrangements or other expense offset arrangements. Expenses net of all reductions represent the net expenses paid by the class.
H Amount represents less than $.01 per share.
See accompanying notes which are an integral part of the financial statements.
Annual Report
Notes to Financial Statements
For the period ended December 31, 2010
1. Organization.
VIP Financial Services Portfolio (the Fund) is a fund of Variable Insurance Products Fund IV (the Trust) and is authorized to issue an unlimited number of shares. The Trust is registered under the Investment Company Act of 1940, as amended (the 1940 Act), as an open-end management investment company organized as a Massachusetts business trust. Shares of the Fund may only be purchased by insurance companies for the purpose of funding variable annuity or variable life insurance contracts. The Fund offers the following classes of shares: Initial Class shares and Investor Class shares. All classes have equal rights and voting privileges, except for matters affecting a single class. Investment income, realized and unrealized capital gains and losses, the common expenses of the Fund, and certain fund-level expense reductions, if any, are allocated on a pro-rata basis to each class based on the relative net assets of each class to the total net assets of the Fund. Each class differs with respect to transfer agent fees incurred. Certain expense reductions may also differ by class.
2. Investments in Fidelity Central Funds.
The Fund may invest in Fidelity Central Funds, which are open-end investment companies available only to other investment companies and accounts managed by Fidelity Management & Research Company (FMR) and its affiliates. The Fund's Schedule of Investments lists each of the Fidelity Central Funds held as of period end, if any, as an investment of the Fund, but does not include the underlying holdings of each Fidelity Central Fund. As an Investing Fund, the Fund indirectly bears its proportionate share of the expenses of the underlying Fidelity Central Funds.
The Money Market Central Funds seek preservation of capital and current income and are managed by Fidelity Investments Money Management, Inc. (FIMM), an affiliate of FMR.
A complete unaudited list of holdings for each Fidelity Central Fund is available upon request or at the Securities and Exchange Commission (the SEC) web site at www.sec.gov. In addition, the financial statements of the Fidelity Central Funds, which are not covered by the Fund's Report of Independent Registered Public Accounting Firm, are available on the SEC web site or upon request.
3. Significant Accounting Policies.
The financial statements have been prepared in conformity with accounting principles generally accepted in the United States of America (GAAP), which require management to make certain estimates and assumptions at the date of the financial statements. Actual results could differ from those estimates. Subsequent events, if any, through the date that the financial statements were issued have been evaluated in the preparation of the financial statements. The following summarizes the significant accounting policies of the Fund:
Security Valuation. Investments are valued as of 4:00 p.m. Eastern time on the last calendar day of the period. The Fund uses independent pricing services approved by the Board of Trustees to value its investments. When current market prices or quotations are not readily available or reliable, valuations may be determined in good faith in accordance with procedures adopted by the Board of Trustees. Factors used in determining value may include market or security specific events. The frequency with which these procedures are used cannot be predicted and they may be utilized to a significant extent. The value used for net asset value (NAV) calculation under these procedures may differ from published prices for the same securities.
The Fund categorizes the inputs to valuation techniques used to value its investments into a disclosure hierarchy consisting of three levels as shown below.
Level 1 - quoted prices in active markets for identical investments
Level 2 - other significant observable inputs (including quoted prices for similar investments, interest rates, prepayment speeds, etc.)
Level 3 - unobservable inputs (including the Fund's own assumptions based on the best information available)
Changes in valuation techniques may result in transfers in or out of an assigned level within the disclosure hierarchy. The aggregate value of investments by input level, as of December 31, 2010, is included at the end of the Fund's Schedule of Investments. Valuation techniques used to value the Fund's investments by major category are as follows.
Equity securities, including restricted securities, for which market quotations are readily available, are valued at the last reported sale price or official closing price as reported by an independent pricing service on the primary market or exchange on which they are traded and are categorized as Level 1 in the hierarchy. In the event there were no sales during the day or closing prices are not available, securities are valued at the last quoted bid price or may be valued using the last available price and are generally categorized as Level 2 in the hierarchy. For foreign equity securities, when significant market or security specific events arise, comparisons to the valuation of American Depositary Receipts (ADRs), futures contracts, Exchange-traded funds (ETFs) and certain indexes as well as quoted prices for similar securities are used and are categorized as Level 2 in the hierarchy in these circumstances. Utilizing these techniques may result in transfers between Level 1 and Level 2. For restricted equity securities and private placements where observable inputs are limited, assumptions about market activity and risk are used and are categorized as Level 3 in the hierarchy.
Annual Report
Notes to Financial Statements - continued
3. Significant Accounting Policies - continued
Security Valuation - continued
Investments in open-end mutual funds, including the Fidelity Central Funds, are valued at their closing net asset value each business day and are categorized as Level 1 in the hierarchy. Short-term securities with remaining maturities of sixty days or less for which quotations are not readily available are valued at amortized cost, which approximates fair value and are categorized as Level 2 in the hierarchy.
Foreign Currency. The Fund uses foreign currency contracts to facilitate transactions in foreign-denominated securities. Gains and losses from these transactions may arise from changes in the value of the foreign currency or if the counterparties do not perform under the contracts' terms.
Foreign-denominated assets, including investment securities, and liabilities are translated into U.S. dollars at the exchange rate at period end. Purchases and sales of investment securities, income and dividends received and expenses denominated in foreign currencies are translated into U.S. dollars at the exchange rate in effect on the transaction date.
The effects of exchange rate fluctuations on investments are included with the net realized and unrealized gain (loss) on investment securities. Other foreign currency transactions resulting in realized and unrealized gain (loss) are disclosed separately.
Investment Transactions and Income. For financial reporting purposes, the Fund's investment holdings and NAV include trades executed through the end of the last business day of the period. The NAV per share for processing shareholder transactions is calculated as of the close of business of the New York Stock Exchange (NYSE), normally 4:00 p.m. Eastern time and includes trades executed through the end of the prior business day. Gains and losses on securities sold are determined on the basis of identified cost and may include proceeds received from litigation. Dividend income is recorded on the ex-dividend date, except for certain dividends from foreign securities where the ex-dividend date may have passed, which are recorded as soon as the Fund is informed of the ex-dividend date. Non-cash dividends included in dividend income, if any, are recorded at the fair market value of the securities received. Distributions received on securities that represent a return of capital or capital gain are recorded as a reduction of cost of investments and/or as a realized gain. The Fund estimates the components of distributions received that may be considered return of capital distributions or capital gain distributions. Interest income and distributions from the Fidelity Central Funds are accrued as earned. Interest income includes coupon interest and amortization of premium and accretion of discount on debt securities. Investment income is recorded net of foreign taxes withheld where recovery of such taxes is uncertain.
Expenses. Expenses directly attributable to a fund are charged to that fund. Expenses attributable to more than one fund are allocated among the respective funds on the basis of relative net assets or other appropriate methods. Expense estimates are accrued in the period to which they relate and adjustments are made when actual amounts are known.
Income Tax Information and Distributions to Shareholders. Each year the Fund intends to qualify as a regulated investment company, including distributing substantially all of its taxable income and realized gains under Subchapter M of the Internal Revenue Code and filing its U.S. federal tax return. As a result, no provision for income taxes is required. As of December 31, 2010, the Fund did not have any unrecognized tax benefits in the accompanying financial statements. A fund's federal tax return is subject to examination by the Internal Revenue Service (IRS) for a period of three years. Foreign taxes are provided for based on the Fund's understanding of the tax rules and rates that exist in the foreign markets in which it invests.
Distributions are declared and recorded on the ex-dividend date. Income dividends and capital gain distributions are declared separately for each class. Income and capital gain distributions are determined in accordance with income tax regulations, which may differ from GAAP.
Capital accounts within the financial statements are adjusted for permanent book-tax differences. These adjustments have no impact on net assets or the results of operations. Temporary book-tax differences will reverse in a subsequent period.
Book-tax differences are primarily due to foreign currency transactions, certain foreign taxes, partnerships, capital loss carryforwards and losses deferred due to wash sales.
The federal tax cost of investment securities and unrealized appreciation (depreciation) as of period end were as follows:
Gross unrealized appreciation | $ 3,471,697 |
Gross unrealized depreciation | (2,568,604) |
Net unrealized appreciation (depreciation) | $ 903,093 |
Tax Cost | $ 42,444,782 |
The tax-based components of distributable earnings as of period end were as follows:
Undistributed ordinary income | $ 22,677 |
Capital loss carryforward | $ (13,908,817) |
Net unrealized appreciation (depreciation) | $ 903,202 |
Annual Report
3. Significant Accounting Policies - continued
Income Tax Information and Distributions to Shareholders - continued
The tax character of distributions paid was as follows:
| December 31, 2010 | December 31, 2009 |
Ordinary Income | $ 76,655 | $ 480,612 |
Trading (Redemption) Fees. Shares held by investors less than 60 days are subject to a redemption fee equal to 1% of the net asset value of shares redeemed. All redemption fees, which reduce the proceeds of the shareholder redemption, are retained by the Fund and accounted for as an addition to paid in capital.
4. Operating Policies.
Repurchase Agreements. FMR has received an Exemptive Order from the SEC which permits the Fund and other affiliated entities of FMR to transfer uninvested cash balances into joint trading accounts which are then invested in repurchase agreements. The Fund may also invest directly with institutions in repurchase agreements. Repurchase agreements are collateralized by government or non-government securities. Upon settlement date, collateral is held in segregated accounts with custodian banks and may be obtained in the event of a default of the counterparty. The Fund monitors, on a daily basis, the value of the collateral to ensure it is at least equal to the principal amount of the repurchase agreement (including accrued interest). In the event of a default by the counterparty, realization of the collateral proceeds could be delayed, during which time the value of the collateral may decline.
Restricted Securities. The Fund may invest in securities that are subject to legal or contractual restrictions on resale. These securities generally may be resold in transactions exempt from registration or to the public if the securities are registered. Disposal of these securities may involve time-consuming negotiations and expense, and prompt sale at an acceptable price may be difficult. Information regarding restricted securities is included at the end of the Fund's Schedule of Investments.
5. Purchases and Sales of Investments.
Purchases and sales of securities, other than short-term securities, aggregated $119,307,358 and $115,859,678, respectively.
6. Fees and Other Transactions with Affiliates.
Management Fee. FMR and its affiliates provide the Fund with investment management related services for which the Fund pays a monthly management fee. The management fee is the sum of an individual fund fee rate that is based on an annual rate of .30% of the Fund's average net assets and a group fee rate that averaged .26% during the period. The group fee rate is based upon the average net assets of all the mutual funds advised by FMR. The group fee rate decreases as assets under management increase and increases as assets under management decrease. For the period, the total annual management fee rate was .56% of the Fund's average net assets.
Transfer Agent Fees. Fidelity Investments Institutional Operations Company, Inc. (FIIOC), an affiliate of FMR, is the Fund's transfer, dividend disbursing, and shareholder servicing agent. FIIOC receives an asset-based fee with respect to each class. Each class (with the exception of Investor Class) pays a transfer agent fee, excluding out of pocket expenses, equal to an annual rate of .07% of average net assets. Investor Class pays a monthly asset-based transfer agent fee of .15% of average net assets. In addition, FIIOC receives an asset-based fee of .01% of average net assets for typesetting, printing and mailing of shareholder reports, except proxy statements. FIIOC has agreed to voluntarily waive this fee until December 31, 2010. (See Note 9: Expense Reductions.) For the period, transfer agent fees for each class, including printing and out of pocket expenses, were as follows:
Initial Class | $ 19,876 |
Investor Class | 34,646 |
| $ 54,522 |
Accounting and Security Lending Fees. Fidelity Service Company, Inc. (FSC), an affiliate of FMR, maintains the Fund's accounting records. The accounting fee is based on the level of average net assets for the month. Under a separate contract, FSC administers the security lending program. The security lending fee is based on the number and duration of lending transactions.
Brokerage Commissions. The Fund placed a portion of its portfolio transactions with brokerage firms which are affiliates of the investment adviser. The commissions paid to these affiliated firms were $10,228 for the period.
Annual Report
Notes to Financial Statements - continued
7. Committed Line of Credit.
The Fund participates with other funds managed by FMR or an affiliate in a $3.75 billion credit facility (the "line of credit") to be utilized for temporary or emergency purposes to fund shareholder redemptions or for other short-term liquidity purposes. The Fund has agreed to pay commitment fees on its pro-rata portion of the line of credit, which amounted to $170 and is reflected in Miscellaneous expenses on the Statement of Operations. During the period, there were no borrowings on this line of credit.
8. Security Lending.
The Fund lends portfolio securities through a lending agent from time to time in order to earn additional income. The lending agent may loan securities to certain qualified borrowers, including Fidelity Capital Markets (FCM), a broker-dealer affiliated with the Fund. On the settlement date of the loan, the Fund receives collateral (in the form of U.S. Treasury obligations, letters of credit and/or cash) against the loaned securities and maintains collateral in an amount not less than 100% of the market value of the loaned securities during the period of the loan. The market value of the loaned securities is determined at the close of business of the Fund and any additional required collateral is delivered to the Fund on the next business day. If the borrower defaults on its obligation to return the securities loaned because of insolvency or other reasons, a fund could experience delays and costs in recovering the securities loaned or in gaining access to the collateral. Any cash collateral received is invested in the Fidelity Securities Lending Cash Central Fund. The value of loaned securities and cash collateral at period end are disclosed on the Fund's Statement of Assets and Liabilities. Security lending income represents the income earned on investing cash collateral, less rebates paid to borrowers and lending agent fees associated with the loan, plus any premium payments received for lending certain types of securities. Security lending income is presented in the Statement of Operations as a component of income from Fidelity Central Funds. Total security lending income during the period amounted to $18,852. During the period, there were no securities loaned to FCM.
9. Bank Borrowings.
The Fund is permitted to have bank borrowings for temporary or emergency purposes to fund shareholder redemptions. The Fund has established borrowing arrangements with certain banks. The interest rate on the borrowings is the bank's base rate, as revised from time to time. The average daily loan balance during the period for which loans were outstanding amounted to $5,352,000. The weighted average interest rate was .69%. The interest expense amounted to $306 under the bank borrowing program. At period end, there were no bank borrowings outstanding.
10. Expense Reductions.
FMR or its affiliates agreed to waive certain fees during the period as noted in the table below.
Initial Class | $ 1,574 |
Investor Class | 1,435 |
| $ 3,009 |
Many of the brokers with whom FMR places trades on behalf of the Fund provided services to the Fund in addition to trade execution. These services included payments of certain expenses on behalf of the Fund totaling $17,102 for the period.
11. Distributions to Shareholders.
Distributions to shareholders of each class were as follows:
Years ended December 31, | 2010 | 2009 |
From net investment income | | |
Initial Class | $ 42,604 | $ 274,450 |
Investor Class | 34,051 | 206,162 |
Total | $ 76,655 | $ 480,612 |
Annual Report
12. Share Transactions.
Transactions for each class of shares were as follows:
| Shares | Dollars |
Years ended December 31, | 2010 | 2009 | 2010 | 2009 |
Initial Class | | | | |
Shares sold | 2,381,105 | 2,435,099 | $ 17,410,002 | $ 12,296,639 |
Reinvestment of distributions | 6,451 | 46,301 | 42,604 | 274,450 |
Shares redeemed | (2,758,772) | (2,748,859) | (17,958,382) | (15,895,754) |
Net increase (decrease) | (371,216) | (267,459) | $ (505,776) | $ (3,324,665) |
Investor Class | | | | |
Shares sold | 2,187,245 | 2,429,823 | $ 15,259,152 | $ 12,249,127 |
Reinvestment of distributions | 5,183 | 34,612 | 34,051 | 206,162 |
Shares redeemed | (1,629,111) | (2,209,743) | (10,574,651) | (12,607,227) |
Net increase (decrease) | 563,317 | 254,692 | $ 4,718,552 | $ (151,938) |
13. Other.
The Fund's organizational documents provide former and current trustees and officers with a limited indemnification against liabilities arising in connection with the performance of their duties to the Fund. In the normal course of business, the Fund may also enter into contracts that provide general indemnifications. The Fund's maximum exposure under these arrangements is unknown as this would be dependent on future claims that may be made against the Fund. The risk of material loss from such claims is considered remote.
At the end of the period, FMR or its affiliates were the owners of record of 100% of the total outstanding shares of the Fund.
Annual Report
Report of Independent Registered Public Accounting Firm
To the Trustees of Variable Insurance Products Fund IV and the Shareholders of VIP Financial Services Portfolio:
In our opinion, the accompanying statement of assets and liabilities, including the schedule of investments, and the related statements of operations and of changes in net assets and the financial highlights present fairly, in all material respects, the financial position of VIP Financial Services Portfolio (a fund of Variable Insurance Products Fund IV) at December 31, 2010, the results of its operations for the year then ended, the changes in its net assets for each of the two years in the period then ended and the financial highlights for each of the five years in the period then ended, in conformity with accounting principles generally accepted in the United States of America. These financial statements and financial highlights (hereafter referred to as "financial statements") are the responsibility of the VIP Financial Services Portfolio's management. Our responsibility is to express an opinion on these financial statements based on our audits. We conducted our audits of these financial statements in accordance with the standards of the Public Company Accounting Oversight Board (United States). Those standards require that we plan and perform the audit to obtain reasonable assurance about whether the financial statements are free of material misstatement. An audit includes examining, on a test basis, evidence supporting the amounts and disclosures in the financial statements, assessing the accounting principles used and significant estimates made by management, and evaluating the overall financial statement presentation. We believe that our audits, which included confirmation of securities at December 31, 2010 by correspondence with the custodian and brokers, provide a reasonable basis for our opinion.
/s/ PricewaterhouseCoopers LLP
PricewaterhouseCoopers LLP
Boston, Massachusetts
February 17, 2011
Annual Report
The Trustees, Members of the Advisory Board, and executive officers of the trust and funds, as applicable, are listed below. The Board of Trustees governs each fund and is responsible for protecting the interests of shareholders. The Trustees are experienced executives who meet periodically throughout the year to oversee each fund's activities, review contractual arrangements with companies that provide services to each fund, oversee management of the risks associated with such activities and contractual arrangements, and review each fund's performance. Except for James C. Curvey, each of the Trustees oversees 219 funds advised by FMR or an affiliate. Mr. Curvey oversees 408 funds advised by FMR or an affiliate.
The Trustees hold office without limit in time except that (a) any Trustee may resign; (b) any Trustee may be removed by written instrument, signed by at least two-thirds of the number of Trustees prior to such removal; (c) any Trustee who requests to be retired or who has become incapacitated by illness or injury may be retired by written instrument signed by a majority of the other Trustees; and (d) any Trustee may be removed at any special meeting of shareholders by a two-thirds vote of the outstanding voting securities of the trust. Each Trustee who is not an interested person (as defined in the 1940 Act) (Independent Trustee), shall retire not later than the last day of the calendar year in which his or her 72nd birthday occurs. The Independent Trustees may waive this mandatory retirement age policy with respect to individual Trustees. The executive officers and Advisory Board Members hold office without limit in time, except that any officer and Advisory Board Member may resign or may be removed by a vote of a majority of the Trustees at any regular meeting or any special meeting of the Trustees. Except as indicated, each individual has held the office shown or other offices in the same company for the past five years.
Experience, Skills, Attributes, and Qualifications of the Fund's Trustees. The Governance and Nominating Committee has adopted a statement of policy that describes the experience, qualifications, attributes, and skills that are necessary and desirable for potential Independent Trustee candidates (Statement of Policy). The Board believes that each Trustee satisfied at the time he or she was initially elected or appointed a Trustee, and continues to satisfy, the standards contemplated by the Statement of Policy. The Governance and Nominating Committee also engages professional search firms to help identify potential Independent Trustee candidates who have the experience, qualifications, attributes, and skills consistent with the Statement of Policy. From time to time, additional criteria based on the composition and skills of the current Independent Trustees, as well as experience or skills that may be appropriate in light of future changes to board composition, business conditions, and regulatory or other developments, have also been considered by the professional search firms and the Governance and Nominating Committee. In addition, the Board takes into account the Trustees' commitment and participation in Board and committee meetings, as well as their leadership of standing and ad hoc committees throughout their tenure.
In determining that a particular Trustee was and continues to be qualified to serve as a Trustee, the Board has considered a variety of criteria, none of which, in isolation, was controlling. The Board believes that, collectively, the Trustees have balanced and diverse experience, qualifications, attributes, and skills, which allow the Board to operate effectively in governing each fund and protecting the interests of shareholders. Information about the specific experience, skills, attributes, and qualifications of each Trustee, which in each case led to the Board's conclusion that the Trustee should serve (or continue to serve) as a trustee of the funds, is provided below.
Board Structure and Oversight Function. James C. Curvey is an interested person (as defined in the 1940 Act) and currently serves as Acting Chairman. The Trustees have determined that an interested Chairman is appropriate and benefits shareholders because an interested Chairman has a personal and professional stake in the quality and continuity of services provided to the funds. Independent Trustees exercise their informed business judgment to appoint an individual of their choosing to serve as Chairman, regardless of whether the Trustee happens to be independent or a member of management. The Independent Trustees have determined that they can act independently and effectively without having an Independent Trustee serve as Chairman and that a key structural component for assuring that they are in a position to do so is for the Independent Trustees to constitute a substantial majority for the Board. The Independent Trustees also regularly meet in executive session. Ned C. Lautenbach serves as Chairman of the Independent Trustees and as such (i) acts as a liaison between the Independent Trustees and management with respect to matters important to the Independent Trustees and (ii) with management prepares agendas for Board meetings.
Fidelity funds are overseen by different Boards of Trustees. The funds' Board oversees Fidelity's equity and high income funds and another Board oversees Fidelity's investment-grade bond, money market, and asset allocation funds. The asset allocation funds may invest in Fidelity funds overseen by the funds' Board. The use of separate Boards, each with its own committee structure, allows the Trustees of each group of Fidelity funds to focus on the unique issues of the funds they oversee, including common research, investment, and operational issues. On occasion, the separate Boards establish joint committees to address issues of overlapping consequences for the Fidelity funds overseen by each Board.
The Trustees operate using a system of committees to facilitate the timely and efficient consideration of all matters of importance to the Trustees, each fund, and fund shareholders and to facilitate compliance with legal and regulatory requirements and oversight of the funds' activities and associated risks. The Board, acting through its committees, has charged FMR and its affiliates with (i) identifying events or circumstances the occurrence of which could have demonstrably adverse effects on the funds' business and/or reputation; (ii) implementing processes and controls to lessen the possibility that such events or circumstances occur or to mitigate the effects of such events or circumstances if they do occur; and (iii) creating and maintaining a system designed to evaluate continuously business and market conditions in order to facilitate the identification and implementation processes described in (i) and (ii) above. Because the day-to-day operations and activities of the funds are carried out by or through FMR, its affiliates and other service providers, the funds' exposure to risks is mitigated but not eliminated by the processes overseen by the Trustees. While each of the Board's committees has responsibility for overseeing different aspects of the funds' activities, oversight is exercised primarily through the Operations, Audit, and Compliance Committees. Appropriate personnel, including but not limited to the funds' Chief Compliance Officer (CCO), FMR's internal auditor, the independent accountants, the funds' Treasurer and portfolio management personnel, make periodic reports to the Board's committees, as appropriate. The responsibilities of each committee, including their oversight responsibilities, are described further under "Standing Committees of the Fund's Trustees."
Annual Report
The fund's Statement of Additional Information (SAI) includes more information about the Trustees. To request a free copy, call Fidelity at 1-877-208-0098.
Interested Trustees*:
Correspondence intended for each Trustee who is an interested person may be sent to Fidelity Investments, 82 Devonshire Street, Boston, Massachusetts 02109.
Name, Age; Principal Occupations and Other Relevant Experience+ |
James C. Curvey (75) |
| Year of Election or Appointment: 2007 Mr. Curvey is Trustee and Acting Chairman of the Board of Trustees of certain Trusts. Mr. Curvey also serves as Trustee (2007-present) of other investment companies advised by FMR. Mr. Curvey is a Director of Fidelity Investments Money Management, Inc. (2009-
present), Director of Fidelity Research & Analysis Co. (2009-present) and Director of FMR and FMR Co., Inc. (2007-present). Mr. Curvey is also Vice Chairman (2007-present) and Director of FMR LLC. In addition, Mr. Curvey serves as an Overseer for the Boston Symphony Orchestra and a member of the Trustees of Villanova University. Previously, Mr. Curvey was the Vice Chairman (2006-2007) and Director (2000-2007) of FMR Corp. |
Ronald P. O'Hanley (54) |
| Year of Election or Appointment: 2011 Mr. O'Hanley is President of Fidelity Asset Management and Corporate Services and a member of Fidelity's Executive Committee (2010-present). Previously, Mr. O'Hanley served as President and Chief Executive Officer of BNY Mellon Asset Management (2007-2010). Mr. O'Hanley also served as Vice Chairman of Bank New York Mellon Corp. and a member of that firm's Executive Committee. Prior to the 2007 merger of The Bank of New York and Mellon Financial Corporation, he was Vice Chairman of Mellon Financial Corporation and President and Chief Executive Officer of Mellon Asset Management. He joined Mellon in February 1997. Mr. O'Hanley currently serves as Chairman of the Boston Public Library Foundation Board of Directors and sits on the Board of Directors of Beth Israel Deaconess Medical Center, the Board of Trustees of the Marine Biological Laboratory and the Advisory Board of the Maxwell School of Citizenship and Public Administration at Syracuse University. Mr. O'Hanley also chairs the Council on Asset Management for the Financial Services Roundtable and is a member of the Board of Directors of Institutional Investor's U.S. Institute. |
* Trustees have been determined to be "Interested Trustees" by virtue of, among other things, their affiliation with the trust or various entities under common control with FMR.
+ The information above includes each Trustee's principal occupation during the last five years and other information relating to the experience, attributes, and skills relevant to each Trustee's qualifications to serve as a Trustee, which led to the conclusion that each Trustee should serve as a Trustee for each fund.
Independent Trustees:
Correspondence intended for each Independent Trustee (that is, the Trustees other than the Interested Trustees) may be sent to Fidelity Investments, P.O. Box 55235, Boston, Massachusetts 02205-5235.
Name, Age; Principal Occupations and Other Relevant Experience+ |
Dennis J. Dirks (62) |
| Year of Election or Appointment: 2005 Prior to his retirement in May 2003, Mr. Dirks was Chief Operating Officer and a member of the Board of The Depository Trust & Clearing Corporation (DTCC). He also served as President, Chief Operating Officer, and Board member of The Depository Trust Company (DTC) and President and Board member of the National Securities Clearing Corporation (NSCC). In addition, Mr. Dirks served as Chief Executive Officer and Board member of the Government Securities Clearing Corporation, Chief Executive Officer and Board member of the Mortgage-Backed Securities Clearing Corporation, as a Trustee and a member of the Finance Committee of Manhattan College (2005-2008), and as a Trustee and a member of the Finance Committee of AHRC of Nassau County (2006-2008). Mr. Dirks is a member of the Independent Directors Council (IDC) Governing Council (2010-Present) and Board of Directors for The Brookville Center for Children's Services, Inc. (2009-present). |
Alan J. Lacy (57) |
| Year of Election or Appointment: 2008 Mr. Lacy serves as Senior Adviser (2007-present) of Oak Hill Capital Partners, L.P. (private equity). Mr. Lacy also served as Chief Executive Officer (2000-2005) and Vice Chairman (2005-2006) of Sears Holdings Corporation and Sears, Roebuck and Co. (retail). In addition, Mr. Lacy serves as a member of the Board of Directors of The Western Union Company (global money transfer, 2006-present) and Bristol-Myers Squibb Company (global pharmaceuticals, 2007-present). Mr. Lacy is Chairman (2008-present) and a member (2006-present) of the Board of Trustees of The National Parks Conservation Association. |
Ned C. Lautenbach (66) |
| Year of Election or Appointment: 2000 Mr. Lautenbach is Chairman of the Independent Trustees of the Equity and High Income Funds (2006-present). Mr. Lautenbach currently serves as the Lead Director of the Eaton Corporation Board of Directors (diversified industrial, 1997-present). Mr. Lautenbach is also a member of the Board of Directors of the Philharmonic Center for the Arts in Naples, Florida (1999-
present); a member of the Board of Trustees of Fairfield University (2005-present); and a member of the Council on Foreign Relations (1994-present). Previously, Mr. Lautenbach was a Partner/Advisory Partner at Clayton, Dubilier & Rice, Inc. (private equity investment, 1998-2010), as well as a Director of Sony Corporation (2006-2007). |
Joseph Mauriello (66) |
| Year of Election or Appointment: 2008 Prior to his retirement in January 2006, Mr. Mauriello served in numerous senior management positions including Deputy Chairman and Chief Operating Officer (2004-2005), and Vice Chairman of Financial Services (2002-2004) of KPMG LLP US (professional services, 1965-2005). Mr. Mauriello currently serves as a member of the Board of Directors of XL Group plc. (global insurance and re-insurance, 2006-present) and of Arcadia Resources Inc. (health care services and products, 2007-present). Previously, Mr. Mauriello served as a Director of the Hamilton Funds of the Bank of New York (2006-2007). |
Cornelia M. Small (66) |
| Year of Election or Appointment: 2005 Ms. Small is a member of the Board of Directors of the Teagle Foundation (2009-present). Ms. Small is also a member of the Investment Committee, and Chair (2008-present) and a member of the Board of Trustees of Smith College. In addition, Ms. Small serves on the Investment Committee of the Berkshire Taconic Community Foundation (2008-present). Previously, Ms. Small served as Chairperson of the Investment Committee (2002-2008) of Smith College. In addition, Ms. Small served as Chief Investment Officer, Director of Global Equity Investments, and a member of the Board of Directors of Scudder, Stevens & Clark and Scudder Kemper Investments. |
William S. Stavropoulos (71) |
| Year of Election or Appointment: 2001 Mr. Stavropoulos is Vice Chairman of the Independent Trustees of the Equity and High Income Funds (2006-present). Mr. Stavropoulos serves as President and Founder of the Michigan Baseball Foundation, the Great Lakes Loons (2007-present). Mr. Stavropoulos is Chairman Emeritus of the Board of Directors of The Dow Chemical Company, where he previously served in numerous senior management positions, including President, CEO (1995-2000; 2002-2004), Chairman of the Executive Committee (2000-2006), and as a member of the Board of Directors (1990-2006). Currently, Mr. Stavropoulos is Chairman of Univar (global distributor of commodity and specialty chemicals, 2010-present), a Director of Teradata Corporation (data warehousing and technology solutions, 2008-present), Chemical Financial Corporation, Maersk Inc. (industrial conglomerate), Tyco International, Inc. (multinational manufacturing and services, 2007-present), and a member of the Advisory Board for Metalmark Capital (private equity investment, 2005-present). Mr. Stavropoulos is a special advisor to Clayton, Dubilier & Rice, LLC (private equity investment). In addition, Mr. Stavropoulos is a member of the University of Notre Dame Advisory Council for the College of Science. |
David M. Thomas (61) |
| Year of Election or Appointment: 2008 Previously, Mr. Thomas served as Executive Chairman (2005-2006) and Chairman and Chief Executive Officer (2000-2005) of IMS Health, Inc. (pharmaceutical and healthcare information solutions). In addition, Mr. Thomas serves as a member of the Board of Directors of Fortune Brands, Inc. (consumer products), and Interpublic Group of Companies, Inc. (marketing communication, 2004-present). |
Michael E. Wiley (60) |
| Year of Election or Appointment: 2008 Mr. Wiley also serves as a Director of Asia Pacific Exploration Consolidated (international oil and gas exploration and production, 2008-present). Mr. Wiley serves as a Director of Tesoro Corporation (independent oil refiner and marketer, 2005-present), and a Director of Bill Barrett Corporation (exploration and production, 2005-present). In addition, Mr. Wiley also serves as a Director of Post Oak Bank (privately-held bank, 2004-present). Previously, Mr. Wiley served as a member of the Board of Trustees of the University of Tulsa (2000-2006; 2007-2010), as a Senior Energy Advisor of Katzenbach Partners, LLC (consulting, 2006-2007), as an Advisory Director of Riverstone Holdings (private investment), Chairman, President, and CEO of Baker Hughes, Inc. (oilfield services, 2000-2004), and as Director of Spinnaker Exploration Company (exploration and production, 2001-2005). |
+ The information above includes each Trustee's principal occupation during the last five years and other information relating to the experience, attributes, and skills relevant to each Trustee's qualifications to serve as a Trustee, which led to the conclusion that each Trustee should serve as a Trustee for each fund.
Advisory Board Members and Executive Officers:
Correspondence intended for each executive officer, Edward C. Johnson 3d, and and Peter S. Lynch may be sent to Fidelity Investments, 82 Devonshire Street, Boston, Massachusetts 02109.
Name, Age; Principal Occupation |
Edward C. Johnson 3d (80) |
| Year of Election or Appointment: 2011 Member of the Advisory Board of Fidelity's Equity and High Income Funds. Formerly Trustee and Chairman of the Board of Trustees of certain Trusts, Mr. Johnson serves as Chief Executive Officer, Chairman, and a Director of FMR LLC; Chairman and a Director of FMR; and Chairman and a Director of FMR Co., Inc. In addition, Mr. Johnson serves as Chairman and Director of FIL Limited. Previously, Mr. Johnson served as President of FMR LLC (2006-2007). |
Peter S. Lynch (66) |
| Year of Election or Appointment: 2003 Member of the Advisory Board of Fidelity's Equity and High Income Funds. Mr. Lynch is Vice Chairman and a Director of FMR and FMR Co., Inc. In addition, Mr. Lynch serves as a Trustee of Boston College and as the Chairman of the Inner-City Scholarship Fund. Previously, Mr. Lynch served on the Special Olympics International Board of Directors (1997-2006). |
Kenneth B. Robins (41) |
| Year of Election or Appointment: 2008 President and Treasurer of Fidelity's Equity and High Income Funds. Mr. Robins also serves as President and Treasurer (2010-
present) and Assistant Treasurer (2009-present) of other Fidelity funds and is an employee of Fidelity Investments (2004-present). Previously, Mr. Robins served as Deputy Treasurer of the Fidelity funds (2005-2008) and Treasurer and Chief Financial Officer of The North Carolina Capital Management Trust: Cash and Term Portfolios (2006-2008). |
Brian B. Hogan (46) |
| Year of Election or Appointment: 2009 Vice President of certain Equity Funds and Vice President of Sector Funds. Mr. Hogan also serves as President of FMR's Equity Division (2009-present). Previously, Mr. Hogan served as Senior Vice President, Equity Research of FMR (2006-2009) and as a portfolio manager. |
Christopher S. Bartel (39) |
| Year of Election or Appointment: 2009 Vice President of Fidelity's Sector and Real Estate Equity Funds. Mr. Bartel also serves as Senior Vice President of Equity Research (2009-present). Previously, Mr. Bartel served as Managing Director of Research (2006-2009) and an analyst and portfolio manager (2000-2006). |
Scott C. Goebel (42) |
| Year of Election or Appointment: 2008 Secretary and Chief Legal Officer (CLO) of the Fidelity funds. Mr. Goebel also serves as Secretary and CLO of The North Carolina Capital Management Trust: Cash and Term Portfolio (2008-present); General Counsel, Secretary, and Senior Vice President of FMR (2008-present) and FMR Co., Inc. (2008-present); Deputy General Counsel of FMR LLC; Chief Legal Officer of Fidelity Management & Research (Hong Kong) Limited (2008-present) and Assistant Secretary of Fidelity Management & Research (Japan) Inc. (2008-present), Fidelity Investments Money Management, Inc. (2008-present), Fidelity Management & Research (U.K.) Inc. (2008-
present), and Fidelity Research and Analysis Company (2008-present). Previously, Mr. Goebel served as Assistant Secretary of the Funds (2007-2008) and as Vice President and Secretary of Fidelity Distributors Corporation (FDC) (2005-2007). |
William C. Coffey (41) |
| Year of Election or Appointment: 2009 Assistant Secretary of Fidelity's Equity and High Income Funds. Mr. Coffey also serves as Senior Vice President and Deputy General Counsel of FMR LLC (2010-present), and is an employee of Fidelity Investments. Previously, Mr. Coffey served as Vice President and Associate General Counsel of FMR LLC (2005-2009). |
Holly C. Laurent (56) |
| Year of Election or Appointment: 2008 Anti-Money Laundering (AML) Officer of the Fidelity funds. Ms. Laurent also serves as AML Officer of The North Carolina Capital Management Trust: Cash and Term Portfolio (2008-present) and is an employee of Fidelity Investments. Previously, Ms. Laurent was Senior Vice President and Head of Legal for Fidelity Business Services India Pvt. Ltd. (2006-2008), and Senior Vice President, Deputy General Counsel and Group Head for FMR LLC (2005-2006). |
Christine Reynolds (52) |
| Year of Election or Appointment: 2008 Chief Financial Officer of the Fidelity funds. Ms. Reynolds became President of Fidelity Pricing and Cash Management Services (FPCMS) in August 2008. Ms. Reynolds served as Chief Operating Officer of FPCMS (2007-2008). Previously, Ms. Reynolds served as President, Treasurer, and Anti-Money Laundering officer of the Fidelity funds (2004-2007). |
Kenneth A. Rathgeber (63) |
| Year of Election or Appointment: 2004 Chief Compliance Officer of Fidelity's Equity and High Income Funds. Mr. Rathgeber is Chief Compliance Officer of Fidelity Management & Research (Hong Kong) Limited (2008-present), Fidelity Management & Research (Japan) Inc. (2008-present), FMR (2005-present), FMR Co., Inc. (2005-present), Fidelity Management & Research (U.K.) Inc. (2005-present), Fidelity Research & Analysis Company (2005-present), Fidelity Investments Money Management, Inc. (2005-present), Pyramis Global Advisors, LLC (2005-present), and Strategic Advisers, Inc. (2005-present). |
Jeffrey S. Christian (49) |
| Year of Election or Appointment: 2009 Deputy Treasurer of the Fidelity funds. Mr. Christian is an employee of Fidelity Investments. Previously, Mr. Christian served as Chief Financial Officer (2008-2009) of certain Fidelity funds and Senior Vice President of Fidelity Pricing and Cash Management Services (FPCMS) (2004-2009). |
Bryan A. Mehrmann (49) |
| Year of Election or Appointment: 2005 Deputy Treasurer of the Fidelity funds. Mr. Mehrmann is an employee of Fidelity Investments. |
Adrien E. Deberghes (43) |
| Year of Election or Appointment: 2008 Deputy Treasurer of Fidelity's Equity and High Income Funds. Mr. Deberghes also serves as Assistant Treasurer of other Fidelity funds (2010-present) and is an employee of Fidelity Investments (2008-present). Previously, Mr. Deberghes served as Senior Vice President of Mutual Fund Administration at State Street Corporation (2007-2008), Senior Director of Mutual Fund Administration at Investors Bank & Trust (2005-2007), and Director of Finance for Dunkin' Brands (2000-2005). |
Stephanie J. Dorsey (41) |
| Year of Election or Appointment: 2010 Assistant Treasurer of Fidelity's Equity and High Income Funds. Ms. Dorsey also serves as Deputy Treasurer of other Fidelity funds (2008-present) and is an employee of Fidelity Investments (2008-present). Previously, Ms. Dorsey served as Treasurer (2004-2008) of the JPMorgan Mutual Funds and Vice President (2004-2008) of JPMorgan Chase Bank. |
John R. Hebble (52) |
| Year of Election or Appointment: 2009 Assistant Treasurer of Fidelity's Equity and High Income Funds. Mr. Hebble also serves as Treasurer and Chief Financial Officer of The North Carolina Capital Management Trust: Cash and Term Portfolio (2008-present), President and Treasurer of other Fidelity funds (2008-present) and is an employee of Fidelity Investments. |
Gary W. Ryan (52) |
| Year of Election or Appointment: 2005 Assistant Treasurer of the Fidelity funds. Mr. Ryan is an employee of Fidelity Investments. Previously, Mr. Ryan served as Vice President of Fund Reporting in Fidelity Pricing and Cash Management Services (FPCMS) (1999-2005). |
Jonathan Davis (42) |
| Year of Election or Appointment: 2010 Assistant Treasurer of the Fidelity funds. Mr. Davis is an employee of Fidelity Investments. Previously, Mr. Davis served as Vice President and Associate General Counsel of FMR LLC (2003-2010). |
Annual Report
Initial Class and Investor Class designate 100% of the dividends distributed during the fiscal year as qualifying for the dividends-received deduction for corporate shareholders.
Annual Report
Board Approval of Investment Advisory Contracts and Management Fees
VIP Financial Services Portfolio
Each year, the Board of Trustees, including the Independent Trustees (together, the Board), votes on the renewal of the management contract and sub-advisory agreements (together, the Advisory Contracts) for the fund. The Board, assisted by the advice of fund counsel and Independent Trustees' counsel, requests and considers a broad range of information relevant to the renewal of the Advisory Contracts throughout the year.
The Board meets regularly and considers at each of its meetings factors that are relevant to its annual consideration of the renewal of the fund's Advisory Contracts, including the services and support provided to the fund and its shareholders. The Board has established various standing committees, each composed of Independent Trustees with varying backgrounds, to which the Board has assigned specific subject matter responsibilities in order to enhance effective decision-making by the Board. The Board, acting directly and through its Committees, requests and receives information concerning the annual consideration of the renewal of the fund's Advisory Contracts. The Board also meets as needed to consider matters specifically related to the Board's annual consideration of the renewal of Advisory Contracts. Members of the Board may also meet with trustees of other Fidelity funds through ad hoc joint committees to discuss certain matters relevant to the Fidelity funds.
At its July 2010 meeting, the Board of Trustees, including the Independent Trustees, unanimously determined to renew the fund's Advisory Contracts. In reaching its determination, the Board considered all factors it believed relevant, including (i) the nature, extent, and quality of the services to be provided to the fund and its shareholders (including the investment performance of the fund); (ii) the competitiveness of the fund's management fee and total expenses; (iii) the total costs of the services to be provided by and the profits to be realized by Fidelity from its relationship with the fund; (iv) the extent to which economies of scale would be realized as the fund grows; and (v) whether fee levels reflect these economies of scale, if any, for the benefit of fund shareholders.
In considering whether to renew the Advisory Contracts for the fund, the Board reached a determination, with the assistance of fund counsel and Independent Trustees' counsel and through the exercise of its business judgment, that the renewal of the Advisory Contracts is in the best interests of fund shareholders and that the compensation to be received by Fidelity under the management contract is fair and reasonable. The Board's decision to renew the Advisory Contracts was not based on any single factor noted above, but rather was based on a comprehensive consideration of all the information provided to the Board at its meetings throughout the year. The Board, in reaching its determination to renew the Advisory Contracts, is aware that shareholders in the fund have a broad range of investment choices available to them, including a wide choice among mutual funds offered by Fidelity's competitors, and that the fund's shareholders, with the opportunity to review and weigh the disclosure provided by the fund in its prospectus and other public disclosures, have chosen to invest in this fund, managed by Fidelity.
Nature, Extent, and Quality of Services Provided. The Board considered the staffing within the investment adviser, FMR, and the sub-advisers (together, the Investment Advisers), including the backgrounds of the fund's investment personnel and the fund's investment objective and discipline. The Independent Trustees also had discussions with senior management of Fidelity's investment operations and investment groups. The Board considered the structure of the portfolio manager compensation program and whether this structure provides appropriate incentives to act in the best interest of the fund.
Resources Dedicated to Investment Management and Support Services. The Board and the equity research subcommittee of the Board's Fund Oversight Committee reviewed the size, education, and experience of the Investment Advisers' investment staff, their use of technology, and the Investment Advisers' approach to recruiting, training, and retaining portfolio managers and other research, advisory, and management personnel. The Board noted that Fidelity's analysts have access to a variety of technological tools and market and securities data that enable them to perform both fundamental and quantitative analysis and to specialize in various disciplines. The Board considered Fidelity's extensive global research capabilities that enable the Investment Advisers to aggregate data from various sources in an effort to produce positive investment results. The Board also considered that Fidelity's portfolio managers and analysts have access to daily portfolio attribution that allows for monitoring of a fund's portfolio, as well as an electronic communication system that provides immediate real-time access to research concerning issuers and credit enhancers. The Board noted FMR's continued focus on strengthening the organization and discipline of equity portfolio management and research.
Shareholder and Administrative Services. The Board considered (i) the nature, extent, quality, and cost of advisory, administrative, and shareholder services performed by the Investment Advisers and their affiliates under the Advisory Contracts and under separate agreements covering transfer agency, pricing and bookkeeping, and securities lending services for the fund; (ii) the nature and extent of the investment adviser's supervision of third party service providers, principally custodians and subcustodians; and (iii) the resources devoted to, and the record of compliance with, the fund's compliance policies and procedures. The Board also reviewed the allocation of fund brokerage, including allocations to brokers affiliated with the Investment Advisers, the use of brokerage commissions to pay fund expenses, and the use of "soft" commission dollars to pay for research services.
The Board noted that the growth of fund assets over time across the complex allows Fidelity to reinvest in the development of services designed to enhance the value or convenience of the Fidelity funds as investment vehicles. These services include 24-hour access to account information and market information through phone representatives and over the Internet, and investor education materials and asset allocation tools.
Investment in a Large Fund Family. The Board considered the benefits to shareholders of investing in a Fidelity fund, including the benefits of investing in a fund that is part of a large family of funds offering a variety of investment disciplines and providing a large variety of mutual fund investor services. The Board noted that Fidelity had taken, or had made recommendations that resulted in the Fidelity funds taking, a number of actions over the previous year that benefited particular funds, including (i) dedicating additional resources to investment research and restructuring and broadening the focus of the investment research teams; (ii) bolstering the senior management team that oversees asset management; (iii) launching Class F of certain funds as a lower-fee class available to Freedom K and Freedom Index Funds; (iv) lowering the initial investment minimums and ongoing balance requirements for Real Estate High Income Fund; (v) eliminating subsequent purchase minimums for all funds and adding a waiver of the investment minimum requirement for new accounts opened with the proceeds of a systematic withdrawal plan; (vi) eliminating the withdrawal minimum and maximum limits for systematic withdrawals from Advisor funds; (vii) expanding sales load waivers on Class A shares for Destiny Planholders and expanding Institutional Class eligibility for Class O Destiny Planholders; and (viii) changing certain Class A and Class T sales charge structures to further align them with industry practices.
Annual Report
Board Approval of Investment Advisory Contracts and Management Fees - continued
Investment Performance. The Board considered whether the fund has operated in accordance with its investment objective, as well as its record of compliance with its investment restrictions. It also reviewed the fund's absolute investment performance for each class, as well as the fund's relative investment performance for each class measured over multiple periods against a third-party-sponsored index that reflects the market sector in which the fund invests. The Board noted that FMR does not believe that a meaningful peer group exists against which to compare the fund's performance. The following charts considered by the Board show, over the one-, three-, and five-year periods ended December 31, 2009, as available, the cumulative total returns of Initial Class and Investor Class of the fund and the cumulative total returns of a third-party-sponsored index ("benchmark").
VIP Financial Services Portfolio
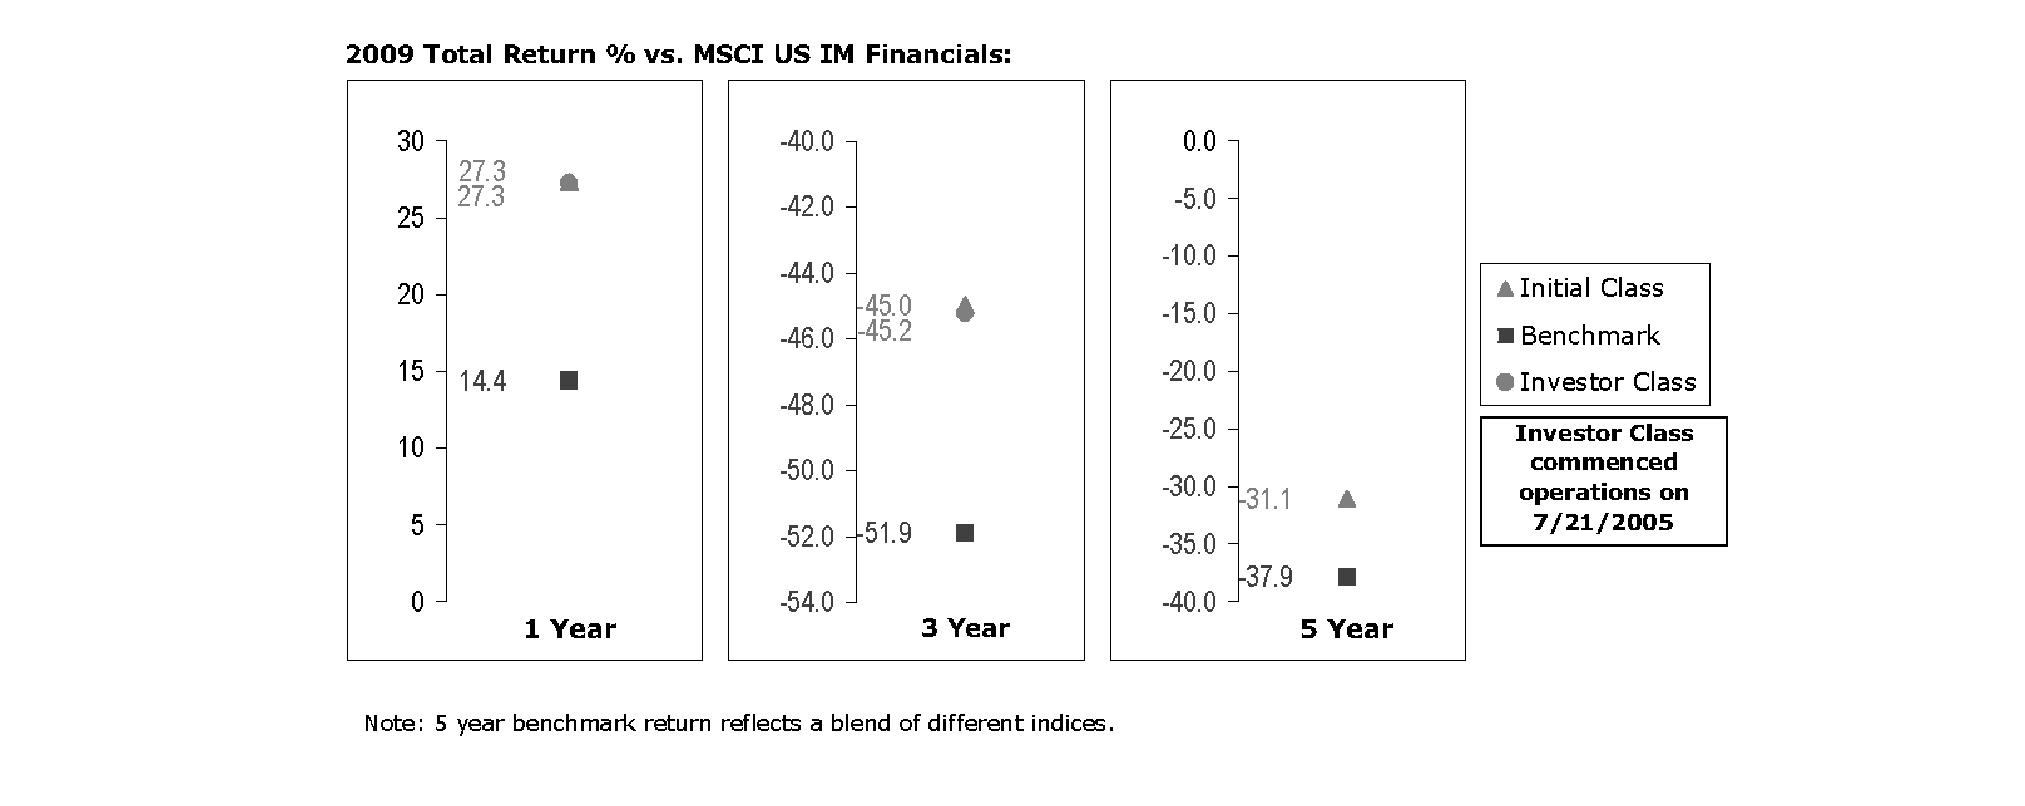
The Board noted that the investment performance of Initial Class of the fund compared favorably to its benchmark for all the periods shown. The Board considered that the variations in performance between the fund's classes reflect the variations in class expenses, which result in lower performance for the higher expense class. The Board also reviewed the fund's performance since inception as well as performance in the current year.
Based on its review, and giving particular weight to the nature and quality of the resources dedicated by the Investment Advisers to maintain and improve relative performance and factoring in the unprecedented market events in recent years, the Board concluded that the nature, extent, and quality of investment management and support services and of shareholder and administrative services provided to the fund will benefit the fund's shareholders, particularly in light of the Board's view that the fund's shareholders benefit from investing in a fund that is part of a large family of funds offering a variety of investment disciplines and services.
Competitiveness of Management Fee and Total Fund Expenses. The Board considered the fund's management fee and total expenses compared to "mapped groups" of competitive funds and classes. Fidelity creates "mapped groups" by combining similar Lipper investment objective categories that have comparable management fee characteristics. Combining Lipper investment objective categories aids the Board's management fee and total expense comparisons by broadening the competitive group used for comparison and by reducing the number of universes to which various Fidelity funds are compared.
Management Fee. The Board considered two proprietary management fee comparisons for the 12-month periods shown in the chart below. The group of Lipper funds used by the Board for management fee comparisons is referred to below as the "Total Mapped Group." The Total Mapped Group comparison focuses on a fund's standing relative to the total universe of comparable funds available to investors, in terms of gross management fees before expense reimbursements or caps. "TMG %" represents the percentage of funds in the Total Mapped Group that had management fees that were lower than the fund's. For example, a TMG % of 3% means that 97% of the funds in the Total Mapped Group had higher management fees than the fund. The "Asset-Size Peer Group" (ASPG) comparison focuses on a fund's standing relative to non-Fidelity funds similar in size to the fund within the Total Mapped Group. The ASPG represents at least 15% of the funds in the Total Mapped Group with comparable asset size and management fee characteristics, subject to a minimum of 50 funds (or all funds in the Total Mapped Group if fewer than 50). Additional information, such as the ASPG quartile in which the fund's management fee ranked, is also included in the chart and considered by the Board.
Annual Report
VIP Financial Services Portfolio
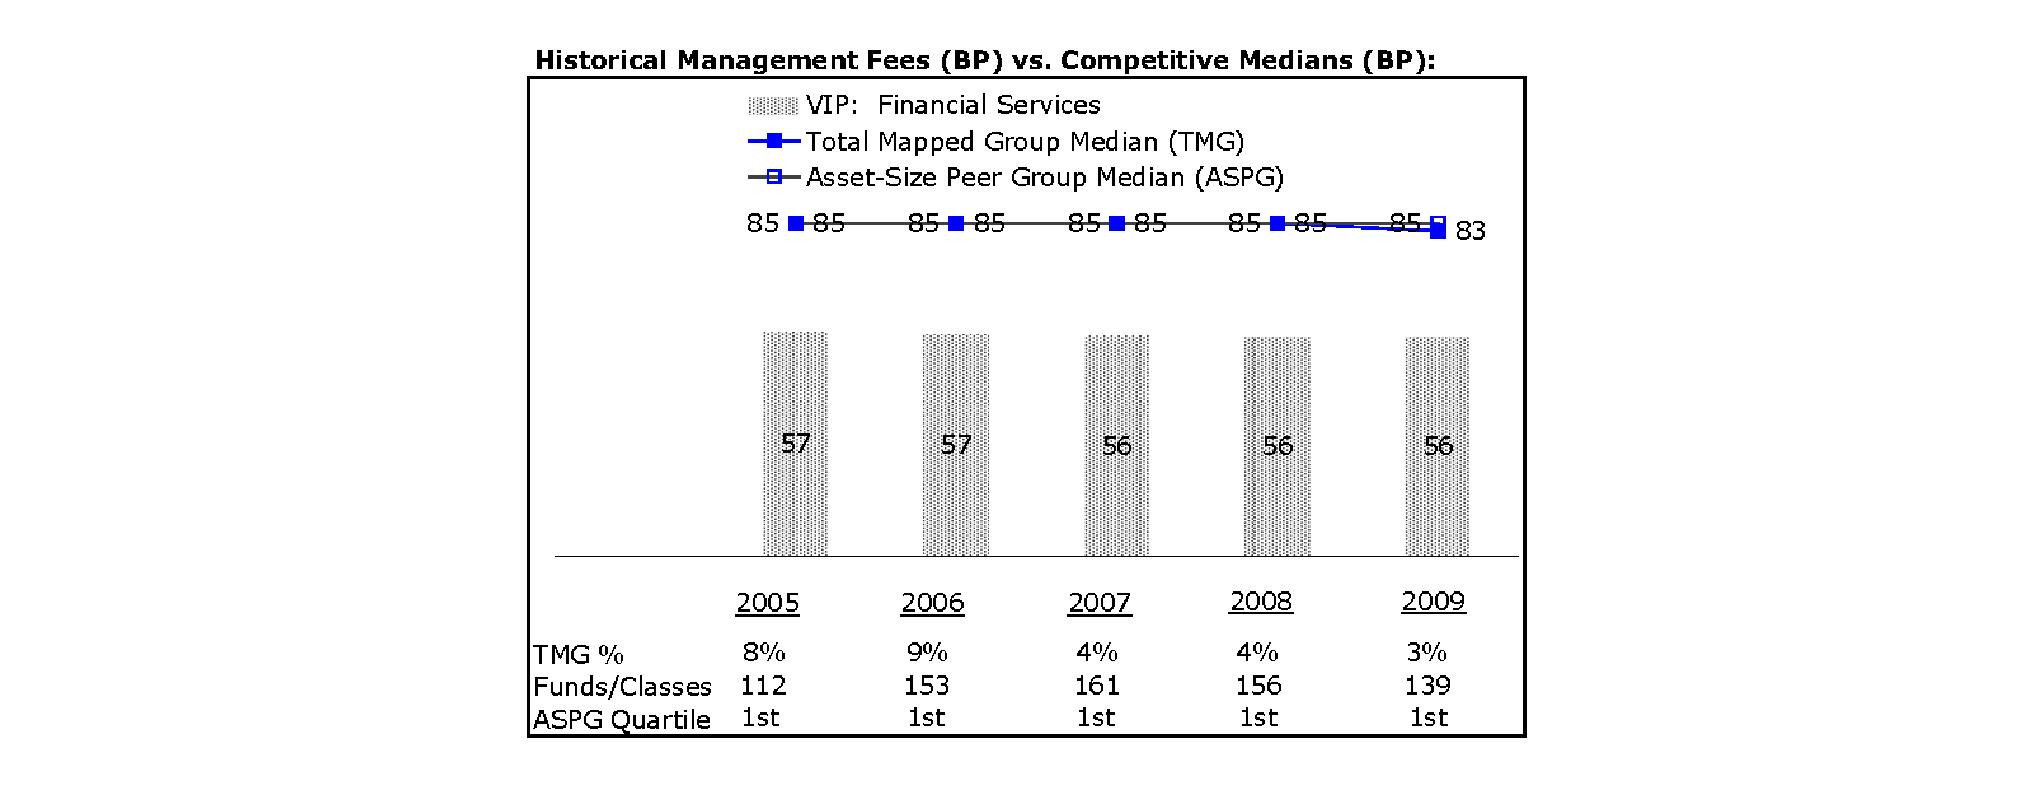
The Board noted that the fund's management fee ranked below the median of its Total Mapped Group and below the median of its ASPG for 2009.
Based on its review, the Board concluded that the fund's management fee is fair and reasonable in light of the services that the fund receives and the other factors considered.
Total Expenses. In its review of each class's total expenses, the Board considered the fund's management fee as well as other fund or class expenses, as applicable, such as transfer agent fees, pricing and bookkeeping fees, and custodial, legal, and audit fees. The Board also noted the effects of any waivers and reimbursements on fees and expenses. As part of its review, the Board also considered current and historical total expenses of each class of the fund compared to competitive fund median expenses. Each class of the fund is compared to those funds and classes in the Total Mapped Group (used by the Board for management fee comparisons) that have a similar sales load structure.
The Board noted that the total expenses of each class ranked below its competitive median for 2009.
Fees Charged to Other Fidelity Clients. The Board also considered Fidelity fee structures and other information with respect to clients of FMR and its affiliates, such as other mutual funds advised or subadvised by FMR or its affiliates, pension plan clients, and other institutional clients. In March 2010, the Board created an ad hoc joint committee with the board of other Fidelity funds (the Committee) to review and compare Fidelity's institutional investment advisory business with its business of providing services to the Fidelity funds, including the differences in services provided, fees charged, and costs incurred, as well as competition in their respective marketplaces.
Based on its review of total expenses and fees charged to other Fidelity clients, the Board concluded that the total expenses of each class of the fund were reasonable in light of the services that the fund and its shareholders receive and the other factors considered, including the findings of the Committee.
Costs of the Services and Profitability. The Board considered the revenues earned and the expenses incurred by Fidelity in conducting the business of developing, marketing, distributing, managing, administering and servicing the fund and its shareholders. The Board also considered the level of Fidelity's profits in respect of all the Fidelity funds.
On an annual basis, FMR presents to the Board Fidelity's profitability for the fund. Fidelity calculates the profitability for each fund, as well as aggregate profitability for groups of Fidelity funds and all Fidelity funds, using a series of detailed revenue and cost allocation methodologies which originate with the audited books and records of Fidelity. The Audit Committee of the Board reviews any significant changes from the prior year's methodologies.
PricewaterhouseCoopers LLP (PwC), independent registered public accounting firm and auditor to Fidelity and certain Fidelity funds, has been engaged annually by the Board as part of the Board's assessment of Fidelity's profitability analysis. PwC's engagement includes the review and assessment of Fidelity's methodologies used in determining the revenues and expenses attributable to Fidelity's mutual fund business, and completion of agreed-upon procedures surrounding the mathematical accuracy of fund profitability and its conformity to allocation methodologies. After considering PwC's reports issued under the engagement and information provided by Fidelity, the Board believes that while other allocation methods may also be reasonable, Fidelity's profitability methodologies are reasonable in all material respects.
Annual Report
Board Approval of Investment Advisory Contracts and Management Fees - continued
The Board has also reviewed Fidelity's non-fund businesses and fall-out benefits related to the mutual fund business as well as cases where Fidelity's affiliates may benefit from or be related to the fund's business.
The Board considered the costs of the services provided by and the profits realized by Fidelity in connection with the operation of the fund and were satisfied that the profitability was not excessive in the circumstances.
Economies of Scale. The Board considered whether there have been economies of scale in respect of the management of the Fidelity funds, whether the Fidelity funds (including the fund) have appropriately benefited from any such economies of scale, and whether there is potential for realization of any further economies of scale. The Board considered the extent to which the fund will benefit from economies of scale through increased services to the fund, through waivers or reimbursements, or through fee or expense reductions.
In February 2009, the Board and the board of other Fidelity funds created an ad hoc committee (the Economies of Scale Committee) to analyze whether FMR attains economies of scale in respect of the management and servicing of the Fidelity funds, whether the Fidelity funds have appropriately benefited from such economies of scale, and whether there is potential for realization of any further economies of scale.
The Board recognized that the fund's management contract incorporates a "group fee" structure, which provides for lower group fee rates as total fund assets under FMR's management increase, and for higher group fee rates as total fund assets under FMR's management decrease. FMR calculates the group fee rates based on a tiered asset "breakpoint" schedule that varies based on asset class. The Board considered that the group fee is designed to deliver the benefits of economies of scale to fund shareholders when total Fidelity fund assets increase, even if assets of any particular fund are unchanged or have declined, because some portion of Fidelity's costs are attributable to services provided to all Fidelity funds, and all funds benefit if those costs can be allocated among more assets. The Board concluded that, given the group fee structure, fund shareholders will benefit from lower management fees as assets under FMR's management increase at the fund complex level, regardless of whether Fidelity achieves any such economies of scale.
The Board concluded, considering the findings of the Economies of Scale Committee, that any potential economies of scale are being appropriately shared between fund shareholders and Fidelity.
Additional Information Requested by the Board. In order to develop fully the factual basis for consideration of the Fidelity funds' Advisory Contracts, the Board requested and received additional information on certain topics, including (i) fund performance trends, actions to be taken by FMR to improve certain funds' overall performance, and Fidelity's long-term strategies for certain funds; (ii) portfolio manager changes that have occurred during the past year and length of portfolio manager tenure for different categories of funds over time; (iii) Fidelity's compensation structure for portfolio managers, research analysts, and other key personnel, the rationale for the compensation structure, and how the compensation structure provides appropriate performance incentives; (iv) the amount of the investment that each portfolio manager has made in the Fidelity fund(s) that he or she manages; (v) management and other fees paid by FMR to affiliated sub-advisers on behalf of the Fidelity funds; (vi) Fidelity's fee structures and rationale for recommending different fees among different categories of funds; (vii) Fidelity's rationale for recommending which funds should have a performance adjustment component as part of their management fees; (viii) the rationale for any differences between fund fee structures and fee structures in place for other Fidelity clients; and (ix) explanations regarding the relative total expenses borne by certain funds and classes, total expense competitive trends, and actions that might be taken by FMR to reduce total expenses for certain funds and classes.
Based on its evaluation of all of the conclusions noted above, and after considering all factors it believed relevant, the Board ultimately concluded that the advisory fee structures are fair and reasonable, and that the fund's Advisory Contracts should be renewed.
Annual Report
Investment Adviser
Fidelity Management & Research Company
Boston, MA
Investment Sub-Advisers
FMR Co., Inc.
Fidelity Management & Research (U.K.) Inc.
Fidelity Management and Research (Hong Kong) Limited
Fidelity Management and Research (Japan) Inc.
General Distributor
Fidelity Distributors Corporation
Boston, MA
Transfer and Service Agents
Fidelity Investments Institutional Operations Company, Inc.
Boston, MA
Fidelity Service Company, Inc.
Boston, MA
Custodian
JPMorgan Chase Bank
New York, NY
VFSIC-ANN-0211
1.817367.106
Fidelity® Variable Insurance Products:
Growth Stock Portfolio
Annual Report
December 31, 2010
(2_fidelity_logos) (Registered_Trademark)
Contents
Performance | <Click Here> | How the fund has done over time. |
Management's Discussion of Fund Performance | <Click Here> | The Portfolio Manager's review of fund performance and strategy. |
Shareholder Expense Example | <Click Here> | An example of shareholder expenses. |
Investment Changes | <Click Here> | A summary of major shifts in the fund's investments over the past six months. |
Investments | <Click Here> | A complete list of the fund's investments with their market values. |
Financial Statements | <Click Here> | Statements of assets and liabilities, operations, and changes in net assets, as well as financial highlights. |
Notes | <Click Here> | Notes to the financial statements. |
Report of Independent Registered Public Accounting Firm | <Click Here> | |
Trustees and Officers | <Click Here> | |
Board Approval of Investment Advisory Contracts and Management Fees | <Click Here> | |
To view a fund's proxy voting guidelines and proxy voting record for the 12-month period ended June 30, visit http://www.fidelity.com/proxyvotingresults or visit the Securities and Exchange Commission's (SEC) web site at http://www.sec.gov. You may also call 1-877-208-0098 to request a free copy of the proxy voting guidelines.
Fidelity Variable Insurance Products are separate account options which are purchased through a variable insurance contract.
Standard & Poor's, S&P and S&P 500 are registered service marks of The McGraw-Hill Companies, Inc. and have been licensed for use by Fidelity Distributors Corporation.
Other third party marks appearing herein are the property of their respective owners.
All other marks appearing herein are registered or unregistered trademarks or service marks of FMR LLC or an affiliated company.
The general research services agreement with Fidelity Research & Analysis Company has been terminated and is no longer in effect for the fund.
This report and the financial statements contained herein are submitted for the general information of the shareholders of the fund. This report is not authorized for distribution to prospective investors in the fund unless preceded or accompanied by an effective prospectus.
A fund files its complete schedule of portfolio holdings with the SEC for the first and third quarters of each fiscal year on Form N-Q. Forms N-Q are available on the SEC's web site at http://www.sec.gov. A fund's Forms N-Q may be reviewed and copied at the SEC's Public Reference Room in Washington, DC. Information regarding the operation of the SEC's Public Reference Room may be obtained by calling 1-800-SEC-0330. For a complete list of a fund's portfolio holdings, view the most recent holdings listing, semiannual report, or annual report on Fidelity's web site at http://www.fidelity.com, http://www.advisor.fidelity.com, or http://www.401k.com, as applicable.
NOT FDIC INSURED • MAY LOSE VALUE • NO BANK GUARANTEE
Neither the fund nor Fidelity Distributors Corporation is a bank.
Annual Report
Average annual total return reflects the change in the value of an investment, assuming reinvestment of the class' distributions from dividend income and capital gains (the profits earned upon the sale of securities that have grown in value, if any) and assuming a constant rate of performance each year. During periods of reimbursement by Fidelity, a fund's total return will be greater than it would be had the reimbursement not occurred. Performance numbers are net of all underlying fund operating expenses, but do not include any insurance charges imposed by your insurance company's separate account. If performance information included the effect of these additional charges, the total returns would have been lower. How a fund did yesterday is no guarantee of how it will do tomorrow.
Average Annual Total Returns
Periods ended December 31, 2010 | Past 1
year | Past 5
years | Life of
fund A |
VIP Growth Stock Portfolio - Initial Class | 20.05% | 3.60% | 6.34% |
VIP Growth Stock Portfolio - Service Class | 19.96% | 3.50% | 6.23% |
VIP Growth Stock Portfolio - Service Class 2 | 19.77% | 3.35% | 6.08% |
VIP Growth Stock Portfolio - Investor Class B | 19.98% | 3.48% | 6.26% |
A From December 11, 2002
B The initial offering of Investor Class shares took place on July 21, 2005. Returns prior to July 21, 2005 are those of Initial Class. Had Investor Class's transfer agent fee been reflected, returns prior to July 21, 2005, would have been lower.
$10,000 Over Life of Fund
Let's say hypothetically that $10,000 was invested in VIP Growth Stock Portfolio - Initial Class on December 11, 2002, when the fund started. The chart shows how the value of your investment would have changed, and also shows how the Russell 1000® Growth Index performed over the same period.
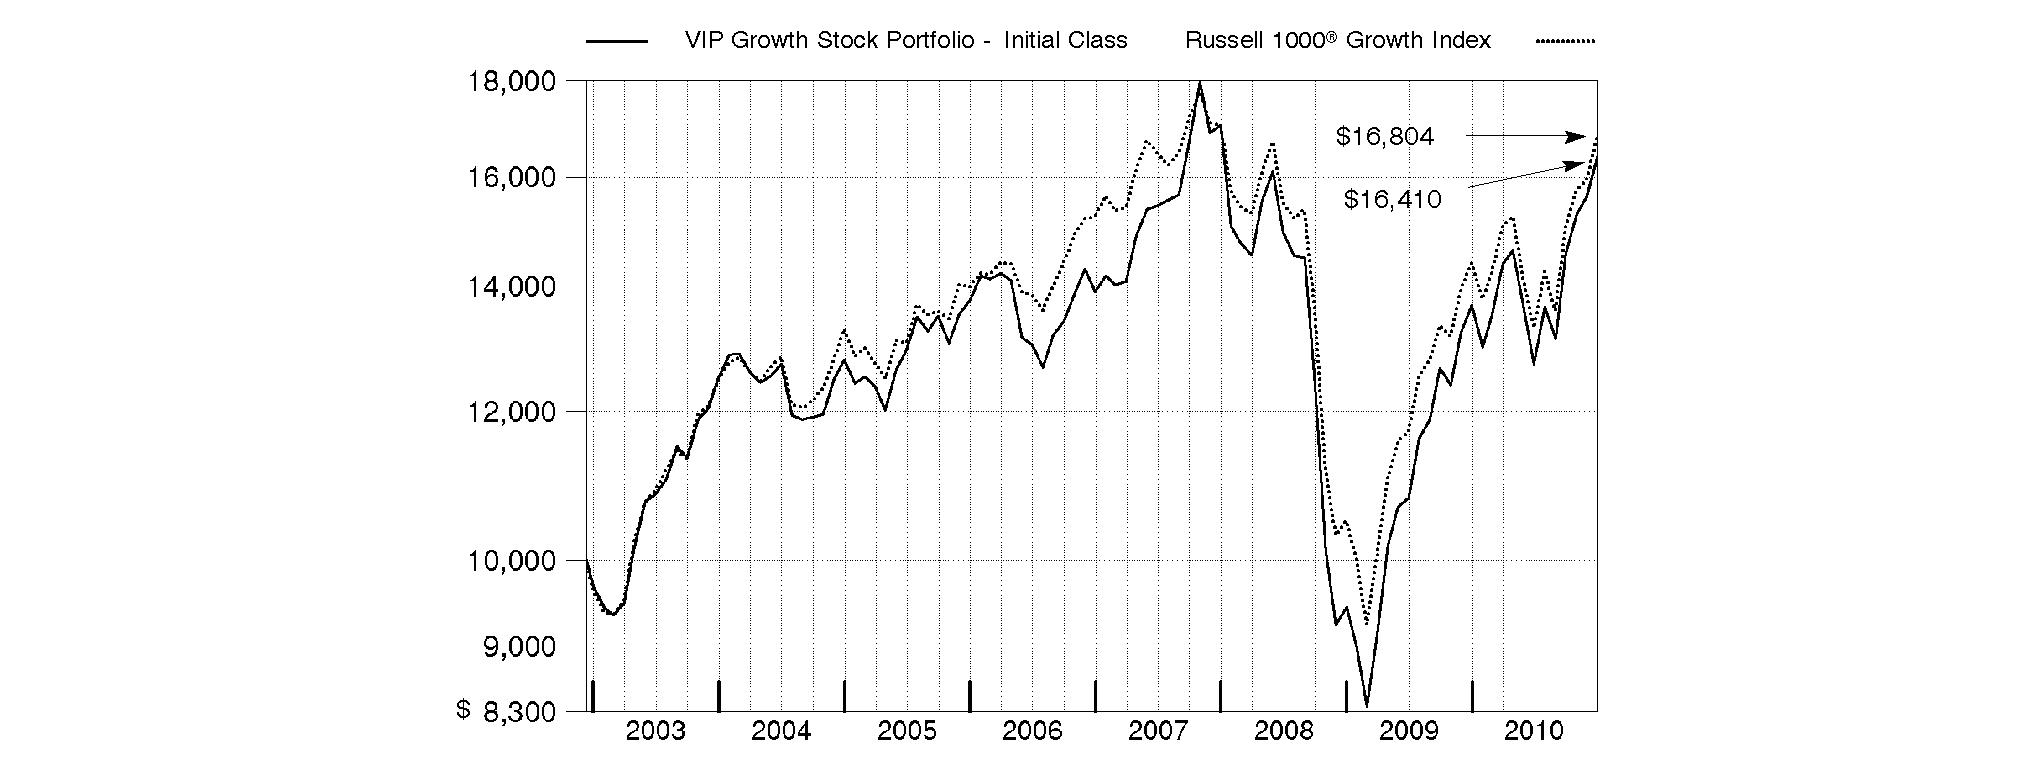
Annual Report
Market Recap: While market improvements around the world hit a speed bump in the first half of the 12-month period ending December 31, 2010, world economies re-accelerated in August, supported by a broadening recovery and low inflation in the U.S. Domestic stock markets recorded solid gains for the year, lifted by a strong second-half rally fueled by economic optimism, encouraging earnings reports and a wave of corporate mergers. The large-cap S&P 500® Index rose 15.06%, the blue-chip-laden Dow Jones Industrial AverageSM added 14.06% and the technology-heavy Nasdaq Composite® Index climbed 18.02%. Meanwhile, international stocks, as represented by the MSCI® ACWI® (All Country World Index) ex USA Index, gained 11.29%, led by strong results from Canada and emerging markets. In the fixed-income arena, U.S. taxable investment-grade bonds generated positive results during 2010, as the Barclays Capital® U.S. Aggregate Bond Index gained 6.54%. With ultra-low interest rates bolstering nearly all fixed-income securities for most of the year, sectors in the index with higher yields and more credit risk generally fared best, while most high-quality bonds generated more-moderate returns. Meanwhile, high-yield bonds, as represented by The BofA Merrill LynchSM US High Yield Constrained Index, returned 15.07%, a result of improved economic data and strengthening investor demand. Overseas, foreign bond markets showed mixed results, with a sizable disparity between the 3.97% return of the Citigroup® Non-U.S. Group of 7 Index - which measures the performance of sovereign debt of the major global economies outside the U.S. - and the 12.04% advance of the JPMorgan Emerging Markets Bond Index Global (EMBI Global), which benefited from the rising overall credit quality of emerging-markets debt issuers.
Comments from Jeffrey Feingold, Portfolio Manager of VIP Growth Stock Portfolio: For the 12-month period ending December 31, 2010, the fund's share classes beat the 16.71% return of its benchmark, the Russell 1000® Growth Index. Strong stock selection within information technology, consumer discretionary, consumer staples and health care helped the most this period. Within consumer discretionary, standouts included Tempur-Pedic International, a leader in premium bedding that enjoyed better-than-expected sales and earnings, and Sally Beauty Holdings, a retailer and distributor of beauty supplies that profited from the acquisition of new customers. In technology, shares of Baidu, the top Chinese Internet search firm, rallied sharply as competition eased and the company's new ad keyword bidding system led to improved pricing. Both Sally Beauty Holdings and Baidu were out-of-index positions. Elsewhere, Herbalife, a consumer staples company that sells weight-management products and nutritional supplements, benefited from expansion in the U.S., Latin America and China. Conversely, industrials detracted from results. The biggest stock disappointments were Internet search engine Google, which ran into censorship problems in China, and Canada's Research In Motion (RIM), maker of the BlackBerry® smart phone. Shares of RIM, which is not in the index, fell as investors worried about growing competition from mobile digital devices like Apple's iPhone® and those operating on Google's AndroidTM platform. A small cash position was a modest detractor.
The views expressed above reflect those of the portfolio manager(s) only through the end of the period as stated on the cover of this report and do not necessarily represent the views of Fidelity or any other person in the Fidelity organization. Any such views are subject to change at any time based upon market or other conditions and Fidelity disclaims any responsibility to update such views. These views may not be relied on as investment advice and, because investment decisions for a Fidelity fund are based on numerous factors, may not be relied on as an indication of trading intent on behalf of any Fidelity fund.
Annual Report
As a shareholder of the Fund, you incur two types of costs: (1) transaction costs, and (2) ongoing costs, including management fees, distribution and/or service (12b-1) fees and other Fund expenses. This Example is intended to help you understand your ongoing costs (in dollars) of investing in the Fund and to compare these costs with the ongoing costs of investing in other mutual funds.
The Example is based on an investment of $1,000 invested at the beginning of the period and held for the entire period (July 1, 2010 to December 31, 2010).
Actual Expenses
The first line of the accompanying table for each class of the Fund provides information about actual account values and actual expenses. You may use the information in this line, together with the amount you invested, to estimate the expenses that you paid over the period. Simply divide your account value by $1,000.00 (for example, an $8,600 account value divided by $1,000.00 = 8.6), then multiply the result by the number in the first line for a class of the Fund under the heading entitled "Expenses Paid During Period" to estimate the expenses you paid on your account during this period. The estimate of expenses does not include any fees or other expenses of any variable annuity or variable life insurance product. If they were, the estimate of expenses you paid during the period would be higher, and your ending account value would be lower. In addition, the Fund, as a shareholder in the underlying Fidelity Central Funds, will indirectly bear its pro-rata share of the fees and expenses incurred by the underlying Fidelity Central Funds. These fees and expenses are not included in the Fund's annualized expense ratio used to calculate the expense estimate in the table below.
Hypothetical Example for Comparison Purposes
The second line of the accompanying table for each class of the Fund provides information about hypothetical account values and hypothetical expenses based on a Class' actual expense ratio and an assumed rate of return of 5% per year before expenses, which is not the Class' actual return. The hypothetical account values and expenses may not be used to estimate the actual ending account balance or expenses you paid for the period. You may use this information to compare the ongoing costs of investing in the Fund and other funds. To do so, compare this 5% hypothetical example with the 5% hypothetical examples that appear in the shareholder reports of the other funds. The estimate of expenses does not include any fees or other expenses of any variable annuity or variable life insurance product. If they were, the estimate of expenses you paid during the period would be higher, and your ending account value would be lower. In addition, the Fund, as a shareholder in the underlying Fidelity Central Funds, will indirectly bear its pro-rata share of the fees and expenses incurred by the underlying Fidelity Central Funds. These fees and expenses are not included in the Fund's annualized expense ratio used to calculate the expense estimate in the table below.
Please note that the expenses shown in the table are meant to highlight your ongoing costs only and do not reflect any transaction costs. Therefore, the second line of the table is useful in comparing ongoing costs only, and will not help you determine the relative total costs of owning different funds.
| Annualized
Expense Ratio | Beginning
Account Value
July 1, 2010 | Ending
Account Value
December 31, 2010 | Expenses Paid
During Period*
July 1, 2010
to December 31, 2010 |
Initial Class | .85% | | | |
Actual | | $ 1,000.00 | $ 1,291.00 | $ 4.91 |
HypotheticalA | | $ 1,000.00 | $ 1,020.92 | $ 4.33 |
Service Class | .95% | | | |
Actual | | $ 1,000.00 | $ 1,291.70 | $ 5.49 |
HypotheticalA | | $ 1,000.00 | $ 1,020.42 | $ 4.84 |
Service Class 2 | 1.10% | | | |
Actual | | $ 1,000.00 | $ 1,290.40 | $ 6.35 |
HypotheticalA | | $ 1,000.00 | $ 1,019.66 | $ 5.60 |
Investor Class | .93% | | | |
Actual | | $ 1,000.00 | $ 1,290.80 | $ 5.37 |
HypotheticalA | | $ 1,000.00 | $ 1,020.52 | $ 4.74 |
A 5% return per year before expenses
* Expenses are equal to each Class' annualized expense ratio, multiplied by the average account value over the period, multiplied by 184/365 (to reflect the one-half year period).
Annual Report
Investment Changes (Unaudited)
Top Ten Stocks as of December 31, 2010 |
| % of fund's
net assets | % of fund's net assets
6 months ago |
Exxon Mobil Corp. | 6.0 | 6.5 |
Apple, Inc. | 5.8 | 5.6 |
Google, Inc. Class A | 3.4 | 1.4 |
United Technologies Corp. | 2.1 | 1.4 |
Cognizant Technology Solutions Corp. Class A | 1.8 | 1.2 |
Amazon.com, Inc. | 1.7 | 1.6 |
eBay, Inc. | 1.6 | 1.7 |
QUALCOMM, Inc. | 1.6 | 0.6 |
Tempur-Pedic International, Inc. | 1.5 | 1.5 |
Oracle Corp. | 1.5 | 0.0 |
| 27.0 | |
Top Five Market Sectors as of December 31, 2010 |
| % of fund's
net assets | % of fund's net assets
6 months ago |
Information Technology | 30.8 | 32.8 |
Consumer Discretionary | 15.6 | 13.7 |
Industrials | 11.6 | 12.8 |
Energy | 10.3 | 10.9 |
Health Care | 8.5 | 9.3 |
Asset Allocation (% of fund's net assets) |
As of December 31, 2010* | As of June 30, 2010** |
 | Stocks 95.8% | | | Stocks 99.7% | |
 | Short-Term
Investments and
Net Other Assets 4.2% | | | Short-Term
Investments and
Net Other Assets 0.3% | |
* Foreign investments | 10.0% | | ** Foreign investments | 9.4% | |

Annual Report
Investments December 31, 2010
Showing Percentage of Net Assets
Common Stocks - 95.8% |
| Shares | | Value |
CONSUMER DISCRETIONARY - 15.6% |
Auto Components - 0.3% |
Minth Group Ltd. | 12,000 | | $ 19,700 |
TRW Automotive Holdings Corp. (a) | 1,200 | | 63,240 |
| | 82,940 |
Automobiles - 1.0% |
Ford Motor Co. (a) | 9,700 | | 162,863 |
General Motors Co. | 1,800 | | 66,348 |
Hyundai Motor Co. | 123 | | 19,033 |
| | 248,244 |
Household Durables - 2.3% |
Beazer Homes USA, Inc. (a) | 7,500 | | 40,425 |
iRobot Corp. (a) | 1,900 | | 47,272 |
Meritage Homes Corp. (a) | 2,153 | | 47,797 |
Ryland Group, Inc. | 3,700 | | 63,011 |
Tempur-Pedic International, Inc. (a) | 9,200 | | 368,552 |
| | 567,057 |
Internet & Catalog Retail - 2.8% |
Amazon.com, Inc. (a) | 2,380 | | 428,400 |
E-Commerce China Dangdang, Inc. ADR | 3,500 | | 94,745 |
Expedia, Inc. | 3,500 | | 87,815 |
Netflix, Inc. (a) | 500 | | 87,850 |
| | 698,810 |
Leisure Equipment & Products - 0.8% |
Hasbro, Inc. | 4,300 | | 202,874 |
Media - 1.3% |
DIRECTV (a) | 3,000 | | 119,790 |
The Walt Disney Co. | 2,500 | | 93,775 |
Virgin Media, Inc. | 3,600 | | 98,064 |
| | 311,629 |
Specialty Retail - 4.4% |
DSW, Inc. Class A (a) | 7,800 | | 304,980 |
Sally Beauty Holdings, Inc. (a) | 20,900 | | 303,677 |
TJX Companies, Inc. | 7,700 | | 341,803 |
Urban Outfitters, Inc. (a) | 3,600 | | 128,916 |
| | 1,079,376 |
Textiles, Apparel & Luxury Goods - 2.7% |
Deckers Outdoor Corp. (a) | 2,800 | | 223,272 |
Phillips-Van Heusen Corp. | 3,500 | | 220,535 |
Polo Ralph Lauren Corp. Class A | 1,400 | | 155,288 |
Vera Bradley, Inc. | 1,600 | | 52,800 |
| | 651,895 |
TOTAL CONSUMER DISCRETIONARY | | 3,842,825 |
CONSUMER STAPLES - 7.3% |
Beverages - 2.1% |
Anheuser-Busch InBev SA NV | 1,425 | | 81,544 |
|
| Shares | | Value |
Dr Pepper Snapple Group, Inc. | 3,000 | | $ 105,480 |
The Coca-Cola Co. | 5,050 | | 332,139 |
| | 519,163 |
Food & Staples Retailing - 0.5% |
Drogasil SA | 3,600 | | 29,285 |
Fresh Market, Inc. | 1,400 | | 57,680 |
Wal-Mart de Mexico SA de CV Series V | 14,500 | | 41,642 |
| | 128,607 |
Food Products - 1.4% |
Danone | 760 | | 47,778 |
Green Mountain Coffee Roasters, Inc. (a) | 1,700 | | 55,862 |
Mead Johnson Nutrition Co. Class A | 900 | | 56,025 |
Nestle SA sponsored ADR | 1,600 | | 94,112 |
The J.M. Smucker Co. | 500 | | 32,825 |
Tingyi (Cayman Islands) Holding Corp. | 10,000 | | 25,603 |
Want Want China Holdings Ltd. ADR | 600 | | 26,284 |
| | 338,489 |
Household Products - 1.1% |
Procter & Gamble Co. | 4,200 | | 270,186 |
Personal Products - 2.2% |
Estee Lauder Companies, Inc. Class A | 1,100 | | 88,770 |
Hengan International Group Co. Ltd. | 3,500 | | 30,193 |
Herbalife Ltd. | 3,600 | | 246,132 |
Schiff Nutrition International, Inc. | 19,655 | | 178,467 |
| | 543,562 |
TOTAL CONSUMER STAPLES | | 1,800,007 |
ENERGY - 10.3% |
Energy Equipment & Services - 1.9% |
Baker Hughes, Inc. | 1,300 | | 74,321 |
Complete Production Services, Inc. (a) | 900 | | 26,595 |
Halliburton Co. | 3,500 | | 142,905 |
Schlumberger Ltd. | 1,990 | | 166,165 |
Weatherford International Ltd. (a) | 2,200 | | 50,160 |
| | 460,146 |
Oil, Gas & Consumable Fuels - 8.4% |
Atlas Pipeline Partners, LP | 2,200 | | 54,274 |
Chesapeake Energy Corp. | 1,700 | | 44,047 |
Exxon Mobil Corp. | 20,290 | | 1,483,605 |
Holly Corp. | 1,500 | | 61,155 |
Massey Energy Co. | 5,000 | | 268,250 |
Southwestern Energy Co. (a) | 2,400 | | 89,832 |
Whiting Petroleum Corp. (a) | 500 | | 58,595 |
| | 2,059,758 |
TOTAL ENERGY | | 2,519,904 |
FINANCIALS - 5.4% |
Capital Markets - 1.7% |
Bank of New York Mellon Corp. | 2,700 | | 81,540 |
Charles Schwab Corp. | 5,600 | | 95,816 |
Common Stocks - continued |
| Shares | | Value |
FINANCIALS - continued |
Capital Markets - continued |
Goldman Sachs Group, Inc. | 300 | | $ 50,448 |
Morgan Stanley | 5,600 | | 152,376 |
TD Ameritrade Holding Corp. | 1,800 | | 34,182 |
| | 414,362 |
Commercial Banks - 1.7% |
Comerica, Inc. | 1,800 | | 76,032 |
Regions Financial Corp. | 8,700 | | 60,900 |
SunTrust Banks, Inc. | 3,500 | | 103,285 |
Synovus Financial Corp. | 22,600 | | 59,664 |
Wells Fargo & Co. | 3,500 | | 108,465 |
| | 408,346 |
Consumer Finance - 0.1% |
SLM Corp. (a) | 2,600 | | 32,734 |
Diversified Financial Services - 1.5% |
Citigroup, Inc. (a) | 50,600 | | 239,338 |
JPMorgan Chase & Co. | 3,300 | | 139,986 |
| | 379,324 |
Real Estate Management & Development - 0.4% |
CB Richard Ellis Group, Inc. Class A (a) | 2,600 | | 53,248 |
Jones Lang LaSalle, Inc. | 600 | | 50,352 |
| | 103,600 |
TOTAL FINANCIALS | | 1,338,366 |
HEALTH CARE - 8.5% |
Biotechnology - 3.5% |
Alexion Pharmaceuticals, Inc. (a) | 1,800 | | 144,990 |
Amgen, Inc. (a) | 1,000 | | 54,900 |
Amicus Therapeutics, Inc. (a) | 9,600 | | 44,256 |
Amylin Pharmaceuticals, Inc. (a) | 500 | | 7,355 |
ARIAD Pharmaceuticals, Inc. (a) | 13,900 | | 70,890 |
ArQule, Inc. (a) | 2,300 | | 13,501 |
BioMarin Pharmaceutical, Inc. (a) | 2,700 | | 72,711 |
Gilead Sciences, Inc. (a) | 4,000 | | 144,960 |
Keryx Biopharmaceuticals, Inc. (a) | 6,300 | | 28,854 |
Nanosphere, Inc. (a) | 2,100 | | 9,156 |
SIGA Technologies, Inc. (a) | 7,100 | | 99,400 |
Theravance, Inc. (a) | 2,600 | | 65,182 |
United Therapeutics Corp. (a) | 1,200 | | 75,864 |
Vertex Pharmaceuticals, Inc. (a) | 500 | | 17,515 |
| | 849,534 |
Health Care Equipment & Supplies - 1.6% |
Alere, Inc. (a) | 3,525 | | 129,015 |
Edwards Lifesciences Corp. (a) | 2,100 | | 169,764 |
Hologic, Inc. (a) | 4,600 | | 86,572 |
Mako Surgical Corp. (a) | 900 | | 13,698 |
| | 399,049 |
|
| Shares | | Value |
Health Care Providers & Services - 1.2% |
Express Scripts, Inc. (a) | 1,700 | | $ 91,885 |
Medco Health Solutions, Inc. (a) | 3,200 | | 196,064 |
| | 287,949 |
Health Care Technology - 1.4% |
Allscripts-Misys Healthcare Solutions, Inc. (a) | 6,400 | | 123,328 |
Cerner Corp. (a) | 2,400 | | 227,376 |
| | 350,704 |
Pharmaceuticals - 0.8% |
Ardea Biosciences, Inc. (a) | 300 | | 7,800 |
Cadence Pharmaceuticals, Inc. (a)(d) | 5,200 | | 39,260 |
GlaxoSmithKline PLC | 3,100 | | 60,159 |
MAP Pharmaceuticals, Inc. (a) | 33 | | 552 |
Teva Pharmaceutical Industries Ltd. sponsored ADR | 800 | | 41,704 |
Valeant Pharmaceuticals International, Inc. | 1,958 | | 55,522 |
| | 204,997 |
TOTAL HEALTH CARE | | 2,092,233 |
INDUSTRIALS - 11.6% |
Aerospace & Defense - 3.3% |
Alliant Techsystems, Inc. | 600 | | 44,658 |
Precision Castparts Corp. | 1,400 | | 194,894 |
Raytheon Co. | 1,100 | | 50,974 |
United Technologies Corp. | 6,600 | | 519,552 |
| | 810,078 |
Airlines - 0.2% |
Southwest Airlines Co. | 3,500 | | 45,430 |
Building Products - 0.2% |
Quanex Building Products Corp. | 2,000 | | 37,940 |
Commercial Services & Supplies - 1.0% |
Stericycle, Inc. (a) | 1,600 | | 129,472 |
Sykes Enterprises, Inc. (a) | 5,500 | | 111,430 |
| | 240,902 |
Construction & Engineering - 0.7% |
Fluor Corp. | 900 | | 59,634 |
Jacobs Engineering Group, Inc. (a) | 1,400 | | 64,190 |
KBR, Inc. | 1,600 | | 48,752 |
| | 172,576 |
Electrical Equipment - 0.7% |
American Superconductor Corp. (a) | 2,500 | | 71,475 |
Satcon Technology Corp. (a)(d) | 19,700 | | 88,650 |
| | 160,125 |
Industrial Conglomerates - 1.0% |
Textron, Inc. | 10,800 | | 255,312 |
Machinery - 2.3% |
Cummins, Inc. | 2,300 | | 253,023 |
Ingersoll-Rand Co. Ltd. | 3,000 | | 141,270 |
Common Stocks - continued |
| Shares | | Value |
INDUSTRIALS - continued |
Machinery - continued |
PACCAR, Inc. | 1,400 | | $ 80,388 |
Weg SA | 7,800 | | 102,462 |
| | 577,143 |
Professional Services - 0.7% |
IHS, Inc. Class A (a) | 700 | | 56,273 |
Towers Watson & Co. | 2,300 | | 119,738 |
| | 176,011 |
Road & Rail - 1.0% |
Old Dominion Freight Lines, Inc. (a) | 1,800 | | 57,582 |
Union Pacific Corp. | 1,900 | | 176,054 |
| | 233,636 |
Trading Companies & Distributors - 0.5% |
WESCO International, Inc. (a) | 2,500 | | 132,000 |
TOTAL INDUSTRIALS | | 2,841,153 |
INFORMATION TECHNOLOGY - 30.8% |
Communications Equipment - 3.6% |
Acme Packet, Inc. (a) | 1,000 | | 53,160 |
F5 Networks, Inc. (a) | 400 | | 52,064 |
Juniper Networks, Inc. (a) | 6,400 | | 236,288 |
QUALCOMM, Inc. | 7,800 | | 386,022 |
Research In Motion Ltd. (a) | 1,700 | | 98,821 |
Riverbed Technology, Inc. (a) | 1,600 | | 56,272 |
| | 882,627 |
Computers & Peripherals - 6.4% |
Apple, Inc. (a) | 4,420 | | 1,425,715 |
SanDisk Corp. (a) | 1,800 | | 89,748 |
Western Digital Corp. (a) | 1,500 | | 50,850 |
| | 1,566,313 |
Electronic Equipment & Components - 0.2% |
Vishay Intertechnology, Inc. (a) | 3,500 | | 51,380 |
Internet Software & Services - 6.8% |
Akamai Technologies, Inc. (a) | 2,700 | | 127,035 |
Baidu.com, Inc. sponsored ADR (a) | 1,000 | | 96,530 |
eBay, Inc. (a) | 14,200 | | 395,186 |
Google, Inc. Class A (a) | 1,390 | | 825,618 |
NetEase.com, Inc. sponsored ADR (a) | 1,500 | | 54,225 |
OpenTable, Inc. (a) | 700 | | 49,336 |
Rackspace Hosting, Inc. (a)(d) | 1,500 | | 47,115 |
YouKu.com, Inc. ADR (a) | 2,100 | | 73,521 |
| | 1,668,566 |
IT Services - 2.6% |
Cognizant Technology Solutions Corp. Class A (a) | 6,060 | | 444,137 |
International Business Machines Corp. | 1,300 | | 190,788 |
| | 634,925 |
|
| Shares | | Value |
Office Electronics - 0.2% |
Xerox Corp. | 5,000 | | $ 57,600 |
Semiconductors & Semiconductor Equipment - 2.2% |
Alpha & Omega Semiconductor Ltd. (a) | 3,300 | | 42,339 |
Broadcom Corp. Class A | 1,200 | | 52,260 |
Inphi Corp. | 100 | | 2,009 |
LTX-Credence Corp. (a) | 3,900 | | 28,860 |
Marvell Technology Group Ltd. (a) | 7,400 | | 137,270 |
NVIDIA Corp. (a) | 3,400 | | 52,360 |
Power Integrations, Inc. | 1,300 | | 52,182 |
Skyworks Solutions, Inc. (a) | 4,500 | | 128,835 |
Varian Semiconductor Equipment Associates, Inc. (a) | 1,500 | | 55,455 |
Verigy Ltd. (a) | 50 | | 651 |
| | 552,221 |
Software - 8.8% |
BMC Software, Inc. (a) | 3,000 | | 141,420 |
CA, Inc. | 10,200 | | 249,288 |
Check Point Software Technologies Ltd. (a) | 1,400 | | 64,764 |
Citrix Systems, Inc. (a) | 1,100 | | 75,251 |
Informatica Corp. (a) | 2,700 | | 118,881 |
Intuit, Inc. (a) | 5,700 | | 281,010 |
Longtop Financial Technologies Ltd. ADR (a) | 1,100 | | 39,798 |
MICROS Systems, Inc. (a) | 5,100 | | 223,686 |
Oracle Corp. | 11,700 | | 366,210 |
Red Hat, Inc. (a) | 2,900 | | 132,385 |
salesforce.com, Inc. (a) | 1,100 | | 145,200 |
Solera Holdings, Inc. | 4,800 | | 246,336 |
VMware, Inc. Class A (a) | 800 | | 71,128 |
| | 2,155,357 |
TOTAL INFORMATION TECHNOLOGY | | 7,568,989 |
MATERIALS - 5.0% |
Chemicals - 2.5% |
Ashland, Inc. | 1,100 | | 55,946 |
Cabot Corp. | 500 | | 18,825 |
CF Industries Holdings, Inc. | 700 | | 94,605 |
LyondellBasell Industries NV Class A (a) | 3,500 | | 120,400 |
Praxair, Inc. | 2,000 | | 190,940 |
The Mosaic Co. | 1,700 | | 129,812 |
| | 610,528 |
Metals & Mining - 2.5% |
Alcoa, Inc. | 4,300 | | 66,177 |
AngloGold Ashanti Ltd. sponsored ADR | 2,100 | | 103,383 |
Freeport-McMoRan Copper & Gold, Inc. | 1,000 | | 120,090 |
Goldcorp, Inc. | 1,100 | | 50,605 |
Newcrest Mining Ltd. | 3,981 | | 164,485 |
Common Stocks - continued |
| Shares | | Value |
MATERIALS - continued |
Metals & Mining - continued |
Reliance Steel & Aluminum Co. | 1,000 | | $ 51,100 |
United States Steel Corp. | 1,100 | | 64,262 |
| | 620,102 |
TOTAL MATERIALS | | 1,230,630 |
TELECOMMUNICATION SERVICES - 1.2% |
Wireless Telecommunication Services - 1.2% |
American Tower Corp. Class A (a) | 5,900 | | 304,676 |
UTILITIES - 0.1% |
Independent Power Producers & Energy Traders - 0.1% |
AES Corp. (a) | 1,700 | | 20,706 |
TOTAL COMMON STOCKS (Cost $19,367,425) | 23,559,489 |
Money Market Funds - 5.0% |
| | | |
Fidelity Cash Central Fund, 0.19% (b) | 1,083,047 | | 1,083,047 |
Fidelity Securities Lending Cash Central Fund, 0.21% (b)(c) | 140,825 | | 140,825 |
TOTAL MONEY MARKET FUNDS (Cost $1,223,872) | 1,223,872 |
Cash Equivalents - 0.1% |
| Maturity Amount | | Value |
Investments in repurchase agreements in a joint trading account at 0.2%, dated 12/31/10 due 1/3/11 (Collateralized by U.S. Treasury Obligations) #
(Cost $27,000) | $ 27,000 | | $ 27,000 |
TOTAL INVESTMENT PORTFOLIO - 100.9% (Cost $20,618,297) | | 24,810,361 |
NET OTHER ASSETS (LIABILITIES) - (0.9)% | | (211,583) |
NET ASSETS - 100% | $ 24,598,778 |
Legend |
(a) Non-income producing |
(b) Affiliated fund that is available only to investment companies and other accounts managed by Fidelity Investments. The rate quoted is the annualized seven-day yield of the fund at period end. A complete unaudited listing of the fund's holdings as of its most recent quarter end is available upon request. In addition, each Fidelity Central Fund's financial statements, which are not covered by the Fund's Report of Independent Registered Public Accounting Firm, are available on the SEC's website or upon request. |
(c) Investment made with cash collateral received from securities on loan. |
(d) Security or a portion of the security is on loan at period end. |
# Additional information on each counterparty to the repurchase agreement is as follows: |
Repurchase Agreement / Counterparty | Value |
$27,000 due 1/03/11 at 0.20% |
BNP Paribas Securities Corp. | $ 3,192 |
Barclays Capital, Inc. | 6,371 |
Citigroup Global Markets, Inc. | 2,055 |
Credit Agricole Securities (USA), Inc. | 4,109 |
Deutsche Bank Securities, Inc. | 822 |
HSBC Securities (USA), Inc. | 2,422 |
J.P. Morgan Securities, Inc. | 2,055 |
Merrill Lynch, Pierce, Fenner & Smith, Inc. | 616 |
Mizuho Securities USA, Inc. | 3,493 |
RBS Securities, Inc. | 1,146 |
Societe Generale, New York Branch | 514 |
Wells Fargo Securities LLC | 205 |
| $ 27,000 |
Affiliated Central Funds |
Information regarding fiscal year to date income earned by the Fund from investments in Fidelity Central Funds is as follows: |
Fund | Income earned |
Fidelity Cash Central Fund | $ 614 |
Fidelity Securities Lending Cash Central Fund | 2,828 |
Total | $ 3,442 |
Other Information |
The following is a summary of the inputs used, as of December 31, 2010, involving the Fund's assets and liabilities carried at fair value. The inputs or methodology used for valuing securities may not be an indication of the risk associated with investing in those securities. For more information on valuation inputs, and their aggregation into the levels used in the table below, please refer to the Security Valuation section in the accompanying Notes to Financial Statements. |
Valuation Inputs at Reporting Date: |
Description | Total | Level 1 | Level 2 | Level 3 |
Investments in Securities: | | | | |
Equities: | | | | |
Consumer Discretionary | $ 3,842,825 | $ 3,842,825 | $ - | $ - |
Consumer Staples | 1,800,007 | 1,800,007 | - | - |
Energy | 2,519,904 | 2,519,904 | - | - |
Financials | 1,338,366 | 1,338,366 | - | - |
Health Care | 2,092,233 | 2,032,074 | 60,159 | - |
Industrials | 2,841,153 | 2,841,153 | - | - |
Information Technology | 7,568,989 | 7,568,989 | - | - |
Materials | 1,230,630 | 1,230,630 | - | - |
Telecommunication Services | 304,676 | 304,676 | - | - |
Utilities | 20,706 | 20,706 | - | - |
Money Market Funds | 1,223,872 | 1,223,872 | - | - |
Cash Equivalents | 27,000 | - | 27,000 | - |
Total Investments in Securities: | $ 24,810,361 | $ 24,723,202 | $ 87,159 | $ - |
Distribution of investments by country of issue, as a percentage of total net assets, is as follows: (Unaudited) |
United States of America | 90.0% |
Cayman Islands | 2.1% |
Others (Individually Less Than 1%) | 7.9% |
| 100.0% |
Income Tax Information |
At December 31, 2010, the Fund had a capital loss carryforward of approximately $3,607,300 of which $1,276,671 and $2,330,629 will expire in fiscal 2016 and 2017, respectively. Capital loss carryforwards are only available to offset future capital gains of the Fund to the extent provided by regulations and may be limited. |
See accompanying notes which are an integral part of the financial statements.
Annual Report
Statement of Assets and Liabilities
| December 31, 2010 |
| | |
Assets | | |
Investment in securities, at value (including securities loaned of $135,310 and repurchase agreements of $27,000) - See accompanying schedule: Unaffiliated issuers (cost $19,394,425) | $ 23,586,489 | |
Fidelity Central Funds (cost $1,223,872) | 1,223,872 | |
Total Investments (cost $20,618,297) | | $ 24,810,361 |
Cash | | 826 |
Dividends receivable | | 5,769 |
Distributions receivable from Fidelity Central Funds | | 494 |
Prepaid expenses | | 52 |
Receivable from investment adviser for expense reductions | | 514 |
Other receivables | | 770 |
Total assets | | 24,818,786 |
| | |
Liabilities | | |
Payable for investments purchased | $ 13,476 | |
Payable for fund shares redeemed | 9,114 | |
Accrued management fee | 10,784 | |
Distribution and service plan fees payable | 552 | |
Other affiliated payables | 2,962 | |
Other payables and accrued
expenses | 42,295 | |
Collateral on securities loaned, at value | 140,825 | |
Total liabilities | | 220,008 |
| | |
Net Assets | | $ 24,598,778 |
Net Assets consist of: | | |
Paid in capital | | $ 24,172,066 |
Accumulated undistributed net realized gain (loss) on investments and foreign currency transactions | | (3,765,318) |
Net unrealized appreciation (depreciation) on investments and assets and liabilities in foreign
currencies | | 4,192,030 |
Net Assets | | $ 24,598,778 |
Statement of Assets and Liabilities - continued
| December 31, 2010 |
| | |
Initial Class:
Net Asset Value, offering price and redemption price per share ($7,007,896 ÷ 517,795 shares) | | $ 13.53 |
| | |
Service Class:
Net Asset Value, offering price and redemption price per share ($572,592 ÷ 42,540 shares) | | $ 13.46 |
| | |
Service Class 2:
Net Asset Value, offering price and redemption price per share ($2,591,690 ÷ 194,440 shares) | | $ 13.33 |
| | |
Investor Class:
Net Asset Value, offering price and redemption price per share ($14,426,600 ÷ 1,072,524 shares) | | $ 13.45 |
See accompanying notes which are an integral part of the financial statements.
Annual Report
Financial Statements - continued
Statement of Operations
| Year ended December 31, 2010 |
| | |
Investment Income | | |
Dividends | | $ 148,781 |
Interest | | 8 |
Income from Fidelity Central Funds | | 3,442 |
Total income | | 152,231 |
| | |
Expenses | | |
Management fee | $ 99,939 | |
Transfer agent fees | 28,657 | |
Distribution and service plan fees | 4,285 | |
Accounting and security lending fees | 6,986 | |
Custodian fees and expenses | 21,934 | |
Independent trustees' compensation | 96 | |
Audit | 46,077 | |
Legal | 74 | |
Miscellaneous | 190 | |
Total expenses before reductions | 208,238 | |
Expense reductions | (44,836) | 163,402 |
Net investment income (loss) | | (11,171) |
Realized and Unrealized Gain (Loss) Net realized gain (loss) on: | | |
Investment securities: | | |
Unaffiliated issuers | 1,080,719 | |
Foreign currency transactions | (3,873) | |
Total net realized gain (loss) | | 1,076,846 |
Change in net unrealized appreciation (depreciation) on: Investment securities | 2,442,706 | |
Assets and liabilities in foreign currencies | 27 | |
Total change in net unrealized appreciation (depreciation) | | 2,442,733 |
Net gain (loss) | | 3,519,579 |
Net increase (decrease) in net assets resulting from operations | | $ 3,508,408 |
Statement of Changes in Net Assets
| Year ended
December 31, 2010 | Year ended
December 31, 2009 |
Increase (Decrease) in Net Assets | | |
Operations | | |
Net investment income (loss) | $ (11,171) | $ 37,560 |
Net realized gain (loss) | 1,076,846 | (949,008) |
Change in net unrealized appreciation (depreciation) | 2,442,733 | 5,507,138 |
Net increase (decrease) in net assets resulting
from operations | 3,508,408 | 4,595,690 |
Distributions to shareholders from net investment income | - | (44,030) |
Share transactions - net increase (decrease) | 6,165,555 | 385,195 |
Total increase (decrease) in net assets | 9,673,963 | 4,936,855 |
| | |
Net Assets | | |
Beginning of period | 14,924,815 | 9,987,960 |
End of period | $ 24,598,778 | $ 14,924,815 |
See accompanying notes which are an integral part of the financial statements.
Annual Report
Financial Highlights - Initial Class
Years ended December 31, | 2010 | 2009 | 2008 | 2007 | 2006 |
Selected Per-Share Data | | | | | |
Net asset value, beginning of period | $ 11.27 | $ 7.81 | $ 14.15 | $ 12.07 | $ 11.94 |
Income from Investment Operations | | | | | |
Net investment income (loss)C | -H | .04 | .02 | -H | -H |
Net realized and unrealized gain (loss) | 2.26 | 3.46 | (6.34) | 2.74 | .13 |
Total from investment operations | 2.26 | 3.50 | (6.32) | 2.74 | .13 |
Distributions from net investment income | - | (.04) | (.02) | - | -H |
Distributions from net realized gain | - | - | - | (.66) | - |
Total distributions | - | (.04) | (.02) | (.66) | -H |
Net asset value, end of period | $ 13.53 | $ 11.27 | $ 7.81 | $ 14.15 | $ 12.07 |
Total ReturnA,B | 20.05% | 44.86% | (44.67)% | 22.67% | 1.12% |
Ratios to Average Net AssetsD,G | | | | | |
Expenses before reductions | 1.09% | 1.35% | 1.16% | 1.10% | .98% |
Expenses net of fee waivers, if any | .85% | .85% | .85% | .85% | .86% |
Expenses net of all reductions | .84% | .84% | .85% | .84% | .86% |
Net investment income (loss) | .01% | .39% | .19% | -%F | .03% |
Supplemental Data | | | | | |
Net assets, end of period (000 omitted) | $ 7,008 | $ 5,374 | $ 3,368 | $ 13,752 | $ 7,414 |
Portfolio turnover rateE | 114% | 173% | 137% | 167% | 93% |
A Total returns do not reflect charges attributable to your insurance company's separate account. Inclusion of these charges would reduce the total returns shown.
B Total returns would have been lower had certain expenses not been reduced during the periods shown.
C Calculated based on average shares outstanding during the period.
D Fees and expenses of the underlying Fidelity Central Funds are not included in the Fund's expense ratio. The Fund indirectly bears its proportionate share of the expenses of any underlying Fidelity Central Funds.
E Amount does not include the portfolio activity of any underlying Fidelity Central Funds.
F Amount represents less than .01%.
G Expense ratios reflect operating expenses of the class. Expenses before reductions do not reflect amounts reimbursed by the investment adviser or reductions from brokerage service arrangements or reductions from other expense offset arrangements and do not represent the amount paid by the class during periods when reimbursements or reductions occur. Expenses net of fee waivers reflect expenses after reimbursement by the investment adviser but prior to reductions from brokerage service arrangements or other expense offset arrangements. Expenses net of all reductions represent the net expenses paid by the class.
H Amount represents less than $.01 per share.
Financial Highlights - Service Class
Years ended December 31, | 2010 | 2009 | 2008 | 2007 | 2006 |
Selected Per-Share Data | | | | | |
Net asset value, beginning of period | $ 11.22 | $ 7.78 | $ 14.08 | $ 12.02 | $ 11.90 |
Income from Investment Operations | | | | | |
Net investment income (loss)C | (.01) | .03 | .01 | (.01) | (.01) |
Net realized and unrealized gain (loss) | 2.25 | 3.44 | (6.30) | 2.73 | .13 |
Total from investment operations | 2.24 | 3.47 | (6.29) | 2.72 | .12 |
Distributions from net investment income | - | (.03) | (.01) | - | - |
Distributions from net realized gain | - | - | - | (.66) | - |
Total distributions | - | (.03) | (.01) | (.66) | - |
Net asset value, end of period | $ 13.46 | $ 11.22 | $ 7.78 | $ 14.08 | $ 12.02 |
Total ReturnA,B | 19.96% | 44.61% | (44.71)% | 22.60% | 1.01% |
Ratios to Average Net AssetsD,F | | | | | |
Expenses before reductions | 1.17% | 1.42% | 1.22% | 1.17% | 1.16% |
Expenses net of fee waivers, if any | .95% | .95% | .95% | .95% | .96% |
Expenses net of all reductions | .94% | .94% | .95% | .95% | .95% |
Net investment income (loss) | (.10)% | .30% | .09% | (.10)% | (.07)% |
Supplemental Data | | | | | |
Net assets, end of period (000 omitted) | $ 573 | $ 823 | $ 1,021 | $ 2,545 | $ 2,077 |
Portfolio turnover rateE | 114% | 173% | 137% | 167% | 93% |
A Total returns do not reflect charges attributable to your insurance company's separate account. Inclusion of these charges would reduce the total returns shown.
B Total returns would have been lower had certain expenses not been reduced during the periods shown.
C Calculated based on average shares outstanding during the period.
D Fees and expenses of the underlying Fidelity Central Funds are not included in the Fund's expense ratio. The Fund indirectly bears its proportionate share of the expenses of any underlying Fidelity Central Funds.
E Amount does not include the portfolio activity of any underlying Fidelity Central Funds.
F Expense ratios reflect operating expenses of the class. Expenses before reductions do not reflect amounts reimbursed by the investment adviser or reductions from brokerage service arrangements or reductions from other expense offset arrangements and do not represent the amount paid by the class during periods when reimbursements or reductions occur. Expenses net of fee waivers reflect expenses after reimbursement by the investment adviser but prior to reductions from brokerage service arrangements or other expense offset arrangements. Expenses net of all reductions represent the net expenses paid by the class.
See accompanying notes which are an integral part of the financial statements.
Annual Report
Financial Highlights - Service Class 2
Years ended December 31, | 2010 | 2009 | 2008 | 2007 | 2006 |
Selected Per-Share Data | | | | | |
Net asset value, beginning of period | $ 11.13 | $ 7.71 | $ 13.96 | $ 11.95 | $ 11.84 |
Income from Investment Operations | | | | | |
Net investment income (loss)C | (.03) | .01 | (.01) | (.03) | (.03) |
Net realized and unrealized gain (loss) | 2.23 | 3.42 | (6.24) | 2.70 | .14 |
Total from investment operations | 2.20 | 3.43 | (6.25) | 2.67 | .11 |
Distributions from net investment income | - | (.01) | - | - | - |
Distributions from net realized gain | - | - | - | (.66) | - |
Total distributions | - | (.01) | - | (.66) | - |
Net asset value, end of period | $ 13.33 | $ 11.13 | $ 7.71 | $ 13.96 | $ 11.95 |
Total ReturnA,B | 19.77% | 44.42% | (44.77)% | 22.31% | .93% |
Ratios to Average Net AssetsD,F | | | | | |
Expenses before reductions | 1.42% | 1.67% | 1.42% | 1.38% | 1.35% |
Expenses net of fee waivers, if any | 1.10% | 1.10% | 1.10% | 1.10% | 1.11% |
Expenses net of all reductions | 1.10% | 1.09% | 1.10% | 1.09% | 1.10% |
Net investment income (loss) | (.25)% | .15% | (.06)% | (.25)% | (.22)% |
Supplemental Data | | | | | |
Net assets, end of period (000 omitted) | $ 2,592 | $ 1,684 | $ 2,183 | $ 5,116 | $ 3,220 |
Portfolio turnover rateE | 114% | 173% | 137% | 167% | 93% |
A Total returns do not reflect charges attributable to your insurance company's separate account. Inclusion of these charges would reduce the total returns shown.
B Total returns would have been lower had certain expenses not been reduced during the periods shown.
C Calculated based on average shares outstanding during the period.
D Fees and expenses of the underlying Fidelity Central Funds are not included in the Fund's expense ratio. The Fund indirectly bears its proportionate share of the expenses of any underlying Fidelity Central Funds.
E Amount does not include the portfolio activity of any underlying Fidelity Central Funds.
F Expense ratios reflect operating expenses of the class. Expenses before reductions do not reflect amounts reimbursed by the investment adviser or reductions from brokerage service arrangements or reductions from other expense offset arrangements and do not represent the amount paid by the class during periods when reimbursements or reductions occur. Expenses net of fee waivers reflect expenses after reimbursement by the investment adviser but prior to reductions from brokerage service arrangements or other expense offset arrangements. Expenses net of all reductions represent the net expenses paid by the class.
Financial Highlights - Investor Class
Years ended December 31, | 2010 | 2009 | 2008 | 2007 | 2006 |
Selected Per-Share Data | | | | | |
Net asset value, beginning of period | $ 11.21 | $ 7.78 | $ 14.10 | $ 12.05 | $ 11.94 |
Income from Investment Operations | | | | | |
Net investment income (loss)C | (.01) | .03 | .01 | (.02) | (.01) |
Net realized and unrealized gain (loss) | 2.25 | 3.44 | (6.31) | 2.73 | .12 |
Total from investment operations | 2.24 | 3.47 | (6.30) | 2.71 | .11 |
Distributions from net investment income | - | (.04) | (.02) | - | -G |
Distributions from net realized gain | - | - | - | (.66) | - |
Total distributions | - | (.04) | (.02) | (.66) | -G |
Net asset value, end of period | $ 13.45 | $ 11.21 | $ 7.78 | $ 14.10 | $ 12.05 |
Total ReturnA,B | 19.98% | 44.64% | (44.69)% | 22.45% | .95% |
Ratios to Average Net AssetsD,F | | | | | |
Expenses before reductions | 1.16% | 1.43% | 1.25% | 1.22% | 1.21% |
Expenses net of fee waivers, if any | .93% | .93% | .93% | 1.00% | 1.01% |
Expenses net of all reductions | .92% | .93% | .93% | .99% | 1.01% |
Net investment income (loss) | (.08)% | .31% | .11% | (.15)% | (.12)% |
Supplemental Data | | | | | |
Net assets, end of period (000 omitted) | $ 14,427 | $ 7,044 | $ 3,416 | $ 9,142 | $ 3,849 |
Portfolio turnover rateE | 114% | 173% | 137% | 167% | 93% |
A Total returns do not reflect charges attributable to your insurance company's separate account. Inclusion of these charges would reduce the total returns shown.
B Total returns would have been lower had certain expenses not been reduced during the periods shown.
C Calculated based on average shares outstanding during the period.
D Fees and expenses of the underlying Fidelity Central Funds are not included in the Fund's expense ratio. The Fund indirectly bears its proportionate share of the expenses of any underlying Fidelity Central Funds.
E Amount does not include the portfolio activity of any underlying Fidelity Central Funds.
F Expense ratios reflect operating expenses of the class. Expenses before reductions do not reflect amounts reimbursed by the investment adviser or reductions from brokerage service arrangements or reductions from other expense offset arrangements and do not represent the amount paid by the class during periods when reimbursements or reductions occur. Expenses net of fee waivers reflect expenses after reimbursement by the investment adviser but prior to reductions from brokerage service arrangements or other expense offset arrangements. Expenses net of all reductions represent the net expenses paid by the class.
G Amount represents less than $.01 per share.
See accompanying notes which are an integral part of the financial statements.
Annual Report
Notes to Financial Statements
For the period ended December 31, 2010
1. Organization.
VIP Growth Stock Portfolio (the Fund) is a fund of Variable Insurance Products Fund IV (the Trust) and is authorized to issue an unlimited number of shares. The Trust is registered under the Investment Company Act of 1940, as amended (the 1940 Act), as an open-end management investment company organized as a Massachusetts business trust. Shares of the Fund may only be purchased by insurance companies for the purpose of funding variable annuity or variable life insurance contracts. The Fund offers the following classes of shares: Initial Class shares, Service Class shares, Service Class 2 shares, and Investor Class shares. All classes have equal rights and voting privileges, except for matters affecting a single class. Investment income, realized and unrealized capital gains and losses, the common expenses of the Fund, and certain fund-level expense reductions, if any, are allocated on a pro-rata basis to each class based on the relative net assets of each class to the total net assets of the Fund. Each class differs with respect to transfer agent and distribution and service plan fees incurred. Certain expense reductions may also differ by class.
2. Investments in Fidelity Central Funds.
The Fund may invest in Fidelity Central Funds, which are open-end investment companies available only to other investment companies and accounts managed by Fidelity Management & Research Company (FMR) and its affiliates. The Fund's Schedule of Investments lists each of the Fidelity Central Funds held as of period end, if any, as an investment of the Fund, but does not include the underlying holdings of each Fidelity Central Fund. As an Investing Fund, the Fund indirectly bears its proportionate share of the expenses of the underlying Fidelity Central Funds.
The Money Market Central Funds seek preservation of capital and current income and are managed by Fidelity Investments Money Management, Inc. (FIMM), an affiliate of FMR.
A complete unaudited list of holdings for each Fidelity Central Fund is available upon request or at the Securities and Exchange Commission (the SEC) web site at www.sec.gov. In addition, the financial statements of the Fidelity Central Funds, which are not covered by the Fund's Report of Independent Registered Public Accounting Firm, are available on the SEC web site or upon request.
3. Significant Accounting Policies.
The financial statements have been prepared in conformity with accounting principles generally accepted in the United States of America (GAAP), which require management to make certain estimates and assumptions at the date of the financial statements. Actual results could differ from those estimates. Subsequent events, if any, through the date that the financial statements were issued have been evaluated in the preparation of the financial statements. The following summarizes the significant accounting policies of the Fund:
Security Valuation. Investments are valued as of 4:00 p.m. Eastern time on the last calendar day of the period. The Fund uses independent pricing services approved by the Board of Trustees to value its investments. When current market prices or quotations are not readily available or reliable, valuations may be determined in good faith in accordance with procedures adopted by the Board of Trustees. Factors used in determining value may include market or security specific events. The frequency with which these procedures are used cannot be predicted and they may be utilized to a significant extent. The value used for net asset value (NAV) calculation under these procedures may differ from published prices for the same securities.
The Fund categorizes the inputs to valuation techniques used to value its investments into a disclosure hierarchy consisting of three levels as shown below.
Level 1 - quoted prices in active markets for identical investments
Level 2 - other significant observable inputs (including quoted prices for similar investments, interest rates, prepayment speeds, etc.)
Level 3 - unobservable inputs (including the Fund's own assumptions based on the best information available)
Changes in valuation techniques may result in transfers in or out of an assigned level within the disclosure hierarchy. The aggregate value of investments by input level, as of December 31, 2010, is included at the end of the Fund's Schedule of Investments. Valuation techniques used to value the Fund's investments by major category are as follows.
Equity securities, including restricted securities, for which market quotations are readily available, are valued at the last reported sale price or official closing price as reported by an independent pricing service on the primary market or exchange on which they are traded and are categorized as Level 1 in the hierarchy. In the event there were no sales during the day or closing prices are not available, securities are valued at the last quoted bid price or may be valued using the last available price and are generally categorized as Level 2 in the hierarchy. For foreign equity securities, when significant market or security specific events arise, comparisons to the valuation of American Depositary Receipts (ADRs), futures contracts, Exchange-traded funds (ETFs) and certain indexes as well as quoted prices for similar securities are used and are categorized as Level 2 in the hierarchy in these circumstances. Utilizing these techniques may result in transfers between Level 1 and Level 2. For restricted equity securities and private placements where observable inputs are limited, assumptions about market activity and risk are used and are categorized as Level 3 in the hierarchy.
Annual Report
Notes to Financial Statements - continued
3. Significant Accounting Policies - continued
Security Valuation - continued
Investments in open-end mutual funds, including the Fidelity Central Funds, are valued at their closing net asset value each business day and are categorized as Level 1 in the hierarchy. Short-term securities with remaining maturities of sixty days or less for which quotations are not readily available are valued at amortized cost, which approximates fair value and are categorized as Level 2 in the hierarchy.
Foreign Currency. The Fund uses foreign currency contracts to facilitate transactions in foreign-denominated securities. Gains and losses from these transactions may arise from changes in the value of the foreign currency or if the counterparties do not perform under the contracts' terms.
Foreign-denominated assets, including investment securities, and liabilities are translated into U.S. dollars at the exchange rate at period end. Purchases and sales of investment securities, income and dividends received and expenses denominated in foreign currencies are translated into U.S. dollars at the exchange rate in effect on the transaction date.
The effects of exchange rate fluctuations on investments are included with the net realized and unrealized gain (loss) on investment securities. Other foreign currency transactions resulting in realized and unrealized gain (loss) are disclosed separately.
Investment Transactions and Income. For financial reporting purposes, the Fund's investment holdings and NAV include trades executed through the end of the last business day of the period. The NAV per share for processing shareholder transactions is calculated as of the close of business of the New York Stock Exchange (NYSE), normally 4:00 p.m. Eastern time and includes trades executed through the end of the prior business day. Gains and losses on securities sold are determined on the basis of identified cost and may include proceeds received from litigation. Dividend income is recorded on the ex-dividend date, except for certain dividends from foreign securities where the ex-dividend date may have passed, which are recorded as soon as the Fund is informed of the ex-dividend date. Non-cash dividends included in dividend income, if any, are recorded at the fair market value of the securities received. Distributions received on securities that represent a return of capital or capital gain are recorded as a reduction of cost of investments and/or as a realized gain. The Fund estimates the components of distributions received that may be considered return of capital distributions or capital gain distributions. Interest income and distributions from the Fidelity Central Funds are accrued as earned. Interest income includes coupon interest and amortization of premium and accretion of discount on debt securities. Investment income is recorded net of foreign taxes withheld where recovery of such taxes is uncertain.
Expenses. Expenses directly attributable to a fund are charged to that fund. Expenses attributable to more than one fund are allocated among the respective funds on the basis of relative net assets or other appropriate methods. Expense estimates are accrued in the period to which they relate and adjustments are made when actual amounts are known.
Income Tax Information and Distributions to Shareholders. Each year the Fund intends to qualify as a regulated investment company, including distributing substantially all of its taxable income and realized gains under Subchapter M of the Internal Revenue Code and filing its U.S. federal tax return. As a result, no provision for income taxes is required. As of December 31, 2010, the Fund did not have any unrecognized tax benefits in the accompanying financial statements. A fund's federal tax return is subject to examination by the Internal Revenue Service (IRS) for a period of three years. Foreign taxes are provided for based on the Fund's understanding of the tax rules and rates that exist in the foreign markets in which it invests.
Distributions are declared and recorded on the ex-dividend date. Income dividends and capital gain distributions are declared separately for each class. Income and capital gain distributions are determined in accordance with income tax regulations, which may differ from GAAP.
Capital accounts within the financial statements are adjusted for permanent book-tax differences. These adjustments have no impact on net assets or the results of operations. Temporary book-tax differences will reverse in a subsequent period.
Book-tax differences are primarily due to foreign currency transactions, partnerships, net operating losses, capital loss carryforwards, losses deferred due to wash sales and excise tax regulations.
The federal tax cost of investment securities and unrealized appreciation (depreciation) as of period end were as follows:
Gross unrealized appreciation | $ 4,458,897 |
Gross unrealized depreciation | (346,692) |
Net unrealized appreciation (depreciation) | $ 4,112,205 |
| |
Tax Cost | $ 20,698,156 |
Annual Report
3. Significant Accounting Policies - continued
Income Tax Information and Distributions to Shareholders - continued
The tax-based components of distributable earnings as of period end were as follows:
Capital loss carryforward | $ (3,607,300) |
Net unrealized appreciation (depreciation) | $ 4,112,171 |
The tax character of distributions paid was as follows:
| December 31, 2010 | December 31, 2009 |
Ordinary Income | $ - | $ 44,030 |
4. Operating Policies.
Repurchase Agreements. FMR has received an Exemptive Order from the SEC which permits the Fund and other affiliated entities of FMR to transfer uninvested cash balances into joint trading accounts which are then invested in repurchase agreements. The Fund may also invest directly with institutions in repurchase agreements. Repurchase agreements are collateralized by government or non-government securities. Upon settlement date, collateral is held in segregated accounts with custodian banks and may be obtained in the event of a default of the counterparty. The Fund monitors, on a daily basis, the value of the collateral to ensure it is at least equal to the principal amount of the repurchase agreement (including accrued interest). In the event of a default by the counterparty, realization of the collateral proceeds could be delayed, during which time the value of the collateral may decline.
5. Purchases and Sales of Investments.
Purchases and sales of securities, other than short-term securities, aggregated $25,789,960 and $20,100,900, respectively.
6. Fees and Other Transactions with Affiliates.
Management Fee. FMR and its affiliates provide the Fund with investment management related services for which the Fund pays a monthly management fee. The management fee is the sum of an individual fund fee rate that is based on an annual rate of .30% of the Fund's average net assets and a group fee rate that averaged .26% during the period. The group fee rate is based upon the average net assets of all the mutual funds advised by FMR. The group fee rate decreases as assets under management increase and increases as assets under management decrease. For the period, the total annual management fee rate was .56% of the Fund's average net assets.
Distribution and Service Plan Fees. In accordance with Rule 12b-1 of the 1940 Act, the Fund has adopted separate 12b-1 Plans for each Service Class of shares. Each Service Class pays Fidelity Distributors Corporation (FDC), an affiliate of FMR, a service fee. For the period, the service fee is based on an annual rate of .10% of Service Class' average net assets and .25% of Service Class 2's average net assets.
For the period, total fees, all of which were re-allowed to insurance companies for the distribution of shares and providing shareholder support services were as follows:
Service Class | $ 678 |
Service Class 2 | 3,607 |
| $ 4,285 |
Transfer Agent Fees. Fidelity Investments Institutional Operations Company, Inc. (FIIOC), an affiliate of FMR, is the Fund's transfer, dividend disbursing, and shareholder servicing agent. FIIOC receives an asset-based fee with respect to each class. Each class (with the exception of Investor Class) pays a transfer agent fee, excluding out of pocket expenses, equal to an annual rate of .07% of average net assets. Investor Class pays a monthly asset-based transfer agent fee of .15% of average net assets. In addition, FIIOC receives an asset-based fee of .01% of average net assets for typesetting, printing and mailing of shareholder reports, except proxy statements. FIIOC has agreed to voluntarily waive this fee until December 31, 2010. (See Note 9: Expense Reductions.) For the period, transfer agent fees for each class, including printing and out of pocket expenses, were as follows:
Initial Class | $ 6,984 |
Service Class | 581 |
Service Class 2 | 2,734 |
Investor Class | 18,358 |
| $ 28,657 |
Annual Report
Notes to Financial Statements - continued
6. Fees and Other Transactions with Affiliates - continued
Accounting and Security Lending Fees. Fidelity Service Company, Inc. (FSC), an affiliate of FMR, maintains the Fund's accounting records. The accounting fee is based on the level of average net assets for the month. Under a separate contract, FSC administers the security lending program. The security lending fee is based on the number and duration of lending transactions.
Brokerage Commissions. The Fund placed a portion of its portfolio transactions with brokerage firms which are affiliates of the investment adviser. The commissions paid to these affiliated firms were $942 for the period.
7. Committed Line of Credit.
The Fund participates with other funds managed by FMR or an affiliate in a $3.75 billion credit facility (the "line of credit") to be utilized for temporary or emergency purposes to fund shareholder redemptions or for other short-term liquidity purposes. The Fund has agreed to pay commitment fees on its pro-rata portion of the line of credit, which amounted to $63 and is reflected in Miscellaneous expenses on the Statement of Operations. During the period, there were no borrowings on this line of credit.
8. Security Lending.
The Fund lends portfolio securities through a lending agent from time to time in order to earn additional income. The lending agent may loan securities to certain qualified borrowers, including Fidelity Capital Markets (FCM), a broker-dealer affiliated with the Fund. On the settlement date of the loan, the Fund receives collateral (in the form of U.S. Treasury obligations, letters of credit and/or cash) against the loaned securities and maintains collateral in an amount not less than 100% of the market value of the loaned securities during the period of the loan. The market value of the loaned securities is determined at the close of business of the Fund and any additional required collateral is delivered to the Fund on the next business day. If the borrower defaults on its obligation to return the securities loaned because of insolvency or other reasons, a fund could experience delays and costs in recovering the securities loaned or in gaining access to the collateral. Any cash collateral received is invested in the Fidelity Securities Lending Cash Central Fund. The value of loaned securities and cash collateral at period end are disclosed on the Fund's Statement of Assets and Liabilities. Security lending income represents the income earned on investing cash collateral, less rebates paid to borrowers and lending agent fees associated with the loan, plus any premium payments received for lending certain types of securities. Security lending income is presented in the Statement of Operations as a component of income from Fidelity Central Funds. Total security lending income during the period amounted to $2,828. During the period, there were no securities loaned to FCM.
9. Expense Reductions.
In addition to FIIOC waiving a portion of its transfer agent fees, FMR voluntarily agreed to reimburse each class to the extent annual operating expenses exceeded certain levels of average net assets as noted in the table below. Some expenses, for example interest expense, including commitment fees, are excluded from this reimbursement.
The following classes were in reimbursement during the period:
| Expense
Limitations | Reimbursement
from adviser |
| | |
Initial Class | .85% | $ 14,706 |
Service Class | .95% | 1,509 |
Service Class 2 | 1.10% | 4,535 |
Investor Class | .93% | 22,977 |
| | $ 43,727 |
Many of the brokers with whom FMR places trades on behalf of the Fund provided services to the Fund in addition to trade execution. These services included payments of certain expenses on behalf of the Fund totaling $1,109 for the period.
Annual Report
10. Distributions to Shareholders.
Distributions to shareholders of each class were as follows:
Years ended December 31, | 2010 | 2009 |
From net investment income | | |
Initial Class | $ - | $ 17,544 |
Service Class | - | 2,306 |
Service Class 2 | - | 753 |
Investor Class | - | 23,427 |
Total | $ - | $ 44,030 |
11. Share Transactions.
Transactions for each class of shares were as follows:
| Shares | Dollars |
Years ended December 31, | 2010 | 2009 | 2010 | 2009 |
Initial Class | | | | |
Shares sold | 260,041 | 340,858 | $ 3,046,011 | $ 3,163,323 |
Reinvestment of distributions | - | 1,690 | - | 17,544 |
Shares redeemed | (219,070) | (296,785) | (2,515,104) | (2,715,001) |
Net increase (decrease) | 40,971 | 45,763 | $ 530,907 | $ 465,866 |
Service Class | | | | |
Shares sold | - | - | $ - | $ - |
Reinvestment of distributions | - | 236 | - | 2,306 |
Shares redeemed | (30,783) | (58,153) | (358,163) | (518,410) |
Net increase (decrease) | (30,783) | (57,917) | $ (358,163) | $ (516,104) |
Service Class 2 | | | | |
Shares sold | 106,491 | 33,227 | $ 1,360,264 | $ 276,521 |
Reinvestment of distributions | - | 69 | - | 753 |
Shares redeemed | (63,429) | (165,102) | (719,641) | (1,439,354) |
Net increase (decrease) | 43,062 | (131,806) | $ 640,623 | $ (1,162,080) |
Investor Class | | | | |
Shares sold | 700,899 | 557,764 | $ 8,319,842 | $ 5,149,675 |
Reinvestment of distributions | - | 2,257 | - | 23,427 |
Shares redeemed | (256,737) | (370,786) | (2,967,654) | (3,575,589) |
Net increase (decrease) | 444,162 | 189,235 | $ 5,352,188 | $ 1,597,513 |
12. Other.
The Fund's organizational documents provide former and current trustees and officers with a limited indemnification against liabilities arising in connection with the performance of their duties to the Fund. In the normal course of business, the Fund may also enter into contracts that provide general indemnifications. The Fund's maximum exposure under these arrangements is unknown as this would be dependent on future claims that may be made against the Fund. The risk of material loss from such claims is considered remote.
At the end of the period, FMR or its affiliates were the owners of record of 89% of the total outstanding shares of the Fund and one otherwise unaffiliated shareholder was the owner of record of 10% of the total outstanding shares of the Fund.
Annual Report
Report of Independent Registered Public Accounting Firm
To the Trustees of Variable Insurance Products Fund IV and the Shareholders of VIP Growth Stock Portfolio:
In our opinion, the accompanying statement of assets and liabilities, including the schedule of investments, and the related statements of operations and of changes in net assets and the financial highlights present fairly, in all material respects, the financial position of VIP Growth Stock Portfolio (a fund of Variable Insurance Products Fund IV) at December 31, 2010, the results of its operations for the year then ended, the changes in its net assets for each of the two years in the period then ended and the financial highlights for each of the five years in the period then ended, in conformity with accounting principles generally accepted in the United States of America. These financial statements and financial highlights (hereafter referred to as "financial statements") are the responsibility of the VIP Growth Stock Portfolio's management. Our responsibility is to express an opinion on these financial statements based on our audits. We conducted our audits of these financial statements in accordance with the standards of the Public Company Accounting Oversight Board (United States). Those standards require that we plan and perform the audit to obtain reasonable assurance about whether the financial statements are free of material misstatement. An audit includes examining, on a test basis, evidence supporting the amounts and disclosures in the financial statements, assessing the accounting principles used and significant estimates made by management, and evaluating the overall financial statement presentation. We believe that our audits, which included confirmation of securities at December 31, 2010 by correspondence with the custodian and brokers, provide a reasonable basis for our opinion.
/s/ PricewaterhouseCoopers LLP
PricewaterhouseCoopers LLP
Boston, Massachusetts
February 17, 2011
Annual Report
The Trustees, Members of the Advisory Board, and executive officers of the trust and fund, as applicable, are listed below. The Board of Trustees governs the fund and is responsible for protecting the interests of shareholders. The Trustees are experienced executives who meet periodically throughout the year to oversee the fund's activities, review contractual arrangements with companies that provide services to the fund, oversee management of the risks associated with such activities and contractual arrangements, and review the fund's performance. Except for James C. Curvey, each of the Trustees oversees 219 funds advised by FMR or an affiliate. Mr. Curvey oversees 408 funds advised by FMR or an affiliate.
The Trustees hold office without limit in time except that (a) any Trustee may resign; (b) any Trustee may be removed by written instrument, signed by at least two-thirds of the number of Trustees prior to such removal; (c) any Trustee who requests to be retired or who has become incapacitated by illness or injury may be retired by written instrument signed by a majority of the other Trustees; and (d) any Trustee may be removed at any special meeting of shareholders by a two-thirds vote of the outstanding voting securities of the trust. Each Trustee who is not an interested person (as defined in the 1940 Act) (Independent Trustee), shall retire not later than the last day of the calendar year in which his or her 72nd birthday occurs. The Independent Trustees may waive this mandatory retirement age policy with respect to individual Trustees. The executive officers and Advisory Board Members hold office without limit in time, except that any officer and Advisory Board Member may resign or may be removed by a vote of a majority of the Trustees at any regular meeting or any special meeting of the Trustees. Except as indicated, each individual has held the office shown or other offices in the same company for the past five years.
Experience, Skills, Attributes, and Qualifications of the Fund's Trustees. The Governance and Nominating Committee has adopted a statement of policy that describes the experience, qualifications, attributes, and skills that are necessary and desirable for potential Independent Trustee candidates (Statement of Policy). The Board believes that each Trustee satisfied at the time he or she was initially elected or appointed a Trustee, and continues to satisfy, the standards contemplated by the Statement of Policy. The Governance and Nominating Committee also engages professional search firms to help identify potential Independent Trustee candidates who have the experience, qualifications, attributes, and skills consistent with the Statement of Policy. From time to time, additional criteria based on the composition and skills of the current Independent Trustees, as well as experience or skills that may be appropriate in light of future changes to board composition, business conditions, and regulatory or other developments, have also been considered by the professional search firms and the Governance and Nominating Committee. In addition, the Board takes into account the Trustees' commitment and participation in Board and committee meetings, as well as their leadership of standing and ad hoc committees throughout their tenure.
In determining that a particular Trustee was and continues to be qualified to serve as a Trustee, the Board has considered a variety of criteria, none of which, in isolation, was controlling. The Board believes that, collectively, the Trustees have balanced and diverse experience, qualifications, attributes, and skills, which allow the Board to operate effectively in governing the fund and protecting the interests of shareholders. Information about the specific experience, skills, attributes, and qualifications of each Trustee, which in each case led to the Board's conclusion that the Trustee should serve (or continue to serve) as a trustee of the fund, is provided below.
Board Structure and Oversight Function. James C. Curvey is an interested person (as defined in the 1940 Act) and currently serves as Acting Chairman. The Trustees have determined that an interested Chairman is appropriate and benefits shareholders because an interested Chairman has a personal and professional stake in the quality and continuity of services provided to the fund. Independent Trustees exercise their informed business judgment to appoint an individual of their choosing to serve as Chairman, regardless of whether the Trustee happens to be independent or a member of management. The Independent Trustees have determined that they can act independently and effectively without having an Independent Trustee serve as Chairman and that a key structural component for assuring that they are in a position to do so is for the Independent Trustees to constitute a substantial majority for the Board. The Independent Trustees also regularly meet in executive session. Ned C. Lautenbach serves as Chairman of the Independent Trustees and as such (i) acts as a liaison between the Independent Trustees and management with respect to matters important to the Independent Trustees and (ii) with management prepares agendas for Board meetings.
Fidelity funds are overseen by different Boards of Trustees. The fund's Board oversees Fidelity's equity and high income funds and another Board oversees Fidelity's investment-grade bond, money market, and asset allocation funds. The asset allocation funds may invest in Fidelity funds overseen by the fund's Board. The use of separate Boards, each with its own committee structure, allows the Trustees of each group of Fidelity funds to focus on the unique issues of the funds they oversee, including common research, investment, and operational issues. On occasion, the separate Boards establish joint committees to address issues of overlapping consequences for the Fidelity funds overseen by each Board.
The Trustees operate using a system of committees to facilitate the timely and efficient consideration of all matters of importance to the Trustees, the fund, and fund shareholders and to facilitate compliance with legal and regulatory requirements and oversight of the fund's activities and associated risks. The Board, acting through its committees, has charged FMR and its affiliates with (i) identifying events or circumstances the occurrence of which could have demonstrably adverse effects on the fund's business and/or reputation; (ii) implementing processes and controls to lessen the possibility that such events or circumstances occur or to mitigate the effects of such events or circumstances if they do occur; and (iii) creating and maintaining a system designed to evaluate continuously business and market conditions in order to facilitate the identification and implementation processes described in (i) and (ii) above. Because the day-to-day operations and activities of the fund are carried out by or through FMR, its affiliates and other service providers, the fund's exposure to risks is mitigated but not eliminated by the processes overseen by the Trustees. While each of the Board's committees has responsibility for overseeing different aspects of the fund's activities, oversight is exercised primarily through the Operations, Audit, and Compliance Committees. Appropriate personnel, including but not limited to the fund's Chief Compliance Officer (CCO), FMR's internal auditor, the independent accountants, the fund's Treasurer and portfolio management personnel, make periodic reports to the Board's committees, as appropriate. The responsibilities of each committee, including their oversight responsibilities, are described further under "Standing Committees of the Fund's Trustees."
Annual Report
The fund's Statement of Additional Information (SAI) includes more information about the Trustees. To request a free copy, call Fidelity at 1-877-208-0098.
Interested Trustees*:
Correspondence intended for each Trustee who is an interested person may be sent to Fidelity Investments, 82 Devonshire Street, Boston, Massachusetts 02109.
Name, Age; Principal Occupations and Other Relevant Experience+ |
James C. Curvey (75) |
| Year of Election or Appointment: 2007 Mr. Curvey is Trustee and Acting Chairman of the Board of Trustees of certain Trusts. Mr. Curvey also serves as Trustee (2007-present) of other investment companies advised by FMR. Mr. Curvey is a Director of Fidelity Investments Money Management, Inc. (2009-present), Director of Fidelity Research & Analysis Co. (2009-present) and Director of FMR and FMR Co., Inc. (2007-present). Mr. Curvey is also Vice Chairman (2007-present) and Director of FMR LLC. In addition, Mr. Curvey serves as an Overseer for the Boston Symphony Orchestra and a member of the Trustees of Villanova University. Previously, Mr. Curvey was the Vice Chairman (2006-2007) and Director (2000-2007) of FMR Corp. |
Ronald P. O'Hanley (54) |
| Year of Election or Appointment: 2011 Mr. O'Hanley is President of Fidelity Asset Management and Corporate Services and a member of Fidelity's Executive Committee (2010-present). Previously, Mr. O'Hanley served as President and Chief Executive Officer of BNY Mellon Asset Management (2007-2010). Mr. O'Hanley also served as Vice Chairman of Bank New York Mellon Corp. and a member of that firm's Executive Committee. Prior to the 2007 merger of The Bank of New York and Mellon Financial Corporation, he was Vice Chairman of Mellon Financial Corporation and President and Chief Executive Officer of Mellon Asset Management. He joined Mellon in February 1997. Mr. O'Hanley currently serves as Chairman of the Boston Public Library Foundation Board of Directors and sits on the Board of Directors of Beth Israel Deaconess Medical Center, the Board of Trustees of the Marine Biological Laboratory and the Advisory Board of the Maxwell School of Citizenship and Public Administration at Syracuse University. Mr. O'Hanley also chairs the Council on Asset Management for the Financial Services Roundtable and is a member of the Board of Directors of Institutional Investor's U.S. Institute. |
* Trustees have been determined to be "Interested Trustees" by virtue of, among other things, their affiliation with the trust or various entities under common control with FMR.
+ The information above includes each Trustee's principal occupation during the last five years and other information relating to the experience, attributes, and skills relevant to each Trustee's qualifications to serve as a Trustee, which led to the conclusion that each Trustee should serve as a Trustee for the fund.
Independent Trustees:
Correspondence intended for each Independent Trustee (that is, the Trustees other than the Interested Trustees) may be sent to Fidelity Investments, P.O. Box 55235, Boston, Massachusetts 02205-5235.
Name, Age; Principal Occupations and Other Relevant Experience+ |
Dennis J. Dirks (62) |
| Year of Election or Appointment: 2005 Prior to his retirement in May 2003, Mr. Dirks was Chief Operating Officer and a member of the Board of The Depository Trust & Clearing Corporation (DTCC). He also served as President, Chief Operating Officer, and Board member of The Depository Trust Company (DTC) and President and Board member of the National Securities Clearing Corporation (NSCC). In addition, Mr. Dirks served as Chief Executive Officer and Board member of the Government Securities Clearing Corporation, Chief Executive Officer and Board member of the Mortgage-Backed Securities Clearing Corporation, as a Trustee and a member of the Finance Committee of Manhattan College (2005-2008), and as a Trustee and a member of the Finance Committee of AHRC of Nassau County (2006-2008). Mr. Dirks is a member of the Independent Directors Council (IDC) Governing Council (2010-Present) and Board of Directors for The Brookville Center for Children's Services, Inc. (2009-present). |
Alan J. Lacy (57) |
| Year of Election or Appointment: 2008 Mr. Lacy serves as Senior Adviser (2007-present) of Oak Hill Capital Partners, L.P. (private equity). Mr. Lacy also served as Chief Executive Officer (2000-2005) and Vice Chairman (2005-2006) of Sears Holdings Corporation and Sears, Roebuck and Co. (retail). In addition, Mr. Lacy serves as a member of the Board of Directors of The Western Union Company (global money transfer, 2006-present) and Bristol-Myers Squibb Company (global pharmaceuticals, 2007-present). Mr. Lacy is Chairman (2008-present) and a member (2006-present) of the Board of Trustees of The National Parks Conservation Association. |
Ned C. Lautenbach (66) |
| Year of Election or Appointment: 2000 Mr. Lautenbach is Chairman of the Independent Trustees of the Equity and High Income Funds (2006-present). Mr. Lautenbach currently serves as the Lead Director of the Eaton Corporation Board of Directors (diversified industrial, 1997-present). Mr. Lautenbach is also a member of the Board of Directors of the Philharmonic Center for the Arts in Naples, Florida (1999-present); a member of the Board of Trustees of Fairfield University (2005-present); and a member of the Council on Foreign Relations (1994-present). Previously, Mr. Lautenbach was a Partner/Advisory Partner at Clayton, Dubilier & Rice, Inc. (private equity investment, 1998-2010), as well as a Director of Sony Corporation (2006-2007). |
Joseph Mauriello (66) |
| Year of Election or Appointment: 2008 Prior to his retirement in January 2006, Mr. Mauriello served in numerous senior management positions including Deputy Chairman and Chief Operating Officer (2004-2005), and Vice Chairman of Financial Services (2002-2004) of KPMG LLP US (professional services, 1965-2005). Mr. Mauriello currently serves as a member of the Board of Directors of XL Group plc. (global insurance and re-insurance, 2006-present) and of Arcadia Resources Inc. (health care services and products, 2007-present). Previously, Mr. Mauriello served as a Director of the Hamilton Funds of the Bank of New York (2006-2007). |
Cornelia M. Small (66) |
| Year of Election or Appointment: 2005 Ms. Small is a member of the Board of Directors of the Teagle Foundation (2009-present). Ms. Small is also a member of the Investment Committee, and Chair (2008-present) and a member of the Board of Trustees of Smith College. In addition, Ms. Small serves on the Investment Committee of the Berkshire Taconic Community Foundation (2008-present). Previously, Ms. Small served as Chairperson of the Investment Committee (2002-2008) of Smith College. In addition, Ms. Small served as Chief Investment Officer, Director of Global Equity Investments, and a member of the Board of Directors of Scudder, Stevens & Clark and Scudder Kemper Investments. |
William S. Stavropoulos (71) |
| Year of Election or Appointment: 2001 Mr. Stavropoulos is Vice Chairman of the Independent Trustees of the Equity and High Income Funds (2006-present). Mr. Stavropoulos serves as President and Founder of the Michigan Baseball Foundation, the Great Lakes Loons (2007-present). Mr. Stavropoulos is Chairman Emeritus of the Board of Directors of The Dow Chemical Company, where he previously served in numerous senior management positions, including President, CEO (1995-2000; 2002-2004), Chairman of the Executive Committee (2000-2006), and as a member of the Board of Directors (1990-2006). Currently, Mr. Stavropoulos is Chairman of Univar (global distributor of commodity and specialty chemicals, 2010-present), a Director of Teradata Corporation (data warehousing and technology solutions, 2008-present), Chemical Financial Corporation, Maersk Inc. (industrial conglomerate), Tyco International, Inc. (multinational manufacturing and services, 2007-present), and a member of the Advisory Board for Metalmark Capital (private equity investment, 2005-present). Mr. Stavropoulos is a special advisor to Clayton, Dubilier & Rice, LLC (private equity investment). In addition, Mr. Stavropoulos is a member of the University of Notre Dame Advisory Council for the College of Science. |
David M. Thomas (61) |
| Year of Election or Appointment: 2008 Previously, Mr. Thomas served as Executive Chairman (2005-2006) and Chairman and Chief Executive Officer (2000-2005) of IMS Health, Inc. (pharmaceutical and healthcare information solutions). In addition, Mr. Thomas serves as a member of the Board of Directors of Fortune Brands, Inc. (consumer products), and Interpublic Group of Companies, Inc. (marketing communication, 2004-present). |
Michael E. Wiley (60) |
| Year of Election or Appointment: 2008 Mr. Wiley also serves as a Director of Asia Pacific Exploration Consolidated (international oil and gas exploration and production, 2008-present). Mr. Wiley serves as a Director of Tesoro Corporation (independent oil refiner and marketer, 2005-present), and a Director of Bill Barrett Corporation (exploration and production, 2005-present). In addition, Mr. Wiley also serves as a Director of Post Oak Bank (privately-held bank, 2004-present). Previously, Mr. Wiley served as a member of the Board of Trustees of the University of Tulsa (2000-2006; 2007-2010), as a Senior Energy Advisor of Katzenbach Partners, LLC (consulting, 2006-2007), as an Advisory Director of Riverstone Holdings (private investment), Chairman, President, and CEO of Baker Hughes, Inc. (oilfield services, 2000-2004), and as Director of Spinnaker Exploration Company (exploration and production, 2001-2005). |
+ The information above includes each Trustee's principal occupation during the last five years and other information relating to the experience, attributes, and skills relevant to each Trustee's qualifications to serve as a Trustee, which led to the conclusion that each Trustee should serve as a Trustee for the fund.
Advisory Board Members and Executive Officers:
Correspondence intended for each executive officer, Edward C. Johnson 3d, and Peter S. Lynch may be sent to Fidelity Investments, 82 Devonshire Street, Boston, Massachusetts 02109.
Name, Age; Principal Occupation |
Edward C. Johnson 3d (80) |
| Year of Election or Appointment: 2011 Member of the Advisory Board of Fidelity's Equity and High Income Funds. Formerly Trustee and Chairman of the Board of Trustees of certain Trusts, Mr. Johnson serves as Chief Executive Officer, Chairman, and a Director of FMR LLC; Chairman and a Director of FMR; and Chairman and a Director of FMR Co., Inc. In addition, Mr. Johnson serves as Chairman and Director of FIL Limited. Previously, Mr. Johnson served as President of FMR LLC (2006-2007). |
Peter S. Lynch (66) |
| Year of Election or Appointment: 2003 Member of the Advisory Board of Fidelity's Equity and High Income Funds. Mr. Lynch is Vice Chairman and a Director of FMR and FMR Co., Inc. In addition, Mr. Lynch serves as a Trustee of Boston College and as the Chairman of the Inner-City Scholarship Fund. Previously, Mr. Lynch served on the Special Olympics International Board of Directors (1997-2006). |
Kenneth B. Robins (41) |
| Year of Election or Appointment: 2008 President and Treasurer of Fidelity's Equity and High Income Funds. Mr. Robins also serves as President and Treasurer (2010-present) and Assistant Treasurer (2009-present) of other Fidelity funds and is an employee of Fidelity Investments (2004-present). Previously, Mr. Robins served as Deputy Treasurer of the Fidelity funds (2005-2008) and Treasurer and Chief Financial Officer of The North Carolina Capital Management Trust: Cash and Term Portfolios (2006-2008). |
Bruce T. Herring (45) |
| Year of Election or Appointment: 2006 Vice President of certain Equity Funds. Mr. Herring also serves as Chief Investment Officer and Director of Fidelity Management & Research (U.K.) Inc. (2010-present) and Group Chief Investments Officer of FMR. Previously, Mr. Herring served as Vice President (2005-2006) and Senior Vice President (2006-2007) of Fidelity Management & Research Company, Vice President of FMR Co., Inc. (2001-2007) and as a portfolio manager for Fidelity U.S. Equity Funds. |
Brian B. Hogan (46) |
| Year of Election or Appointment: 2009 Vice President of certain Equity Funds and Vice President of Sector Funds. Mr. Hogan also serves as President of FMR's Equity Division (2009-present). Previously, Mr. Hogan served as Senior Vice President, Equity Research of FMR (2006-2009) and as a portfolio manager. |
Scott C. Goebel (42) |
| Year of Election or Appointment: 2008 Secretary and Chief Legal Officer (CLO) of the Fidelity funds. Mr. Goebel also serves as Secretary and CLO of The North Carolina Capital Management Trust: Cash and Term Portfolio (2008-present); General Counsel, Secretary, and Senior Vice President of FMR (2008-present) and FMR Co., Inc. (2008-present); Deputy General Counsel of FMR LLC; Chief Legal Officer of Fidelity Management & Research (Hong Kong) Limited (2008-present) and Assistant Secretary of Fidelity Management & Research (Japan) Inc. (2008-present), Fidelity Investments Money Management, Inc. (2008-present), Fidelity Management & Research (U.K.) Inc. (2008-present), and Fidelity Research and Analysis Company (2008-present). Previously, Mr. Goebel served as Assistant Secretary of the Funds (2007-2008) and as Vice President and Secretary of Fidelity Distributors Corporation (FDC) (2005-2007). |
William C. Coffey (41) |
| Year of Election or Appointment: 2009 Assistant Secretary of Fidelity's Equity and High Income Funds. Mr. Coffey also serves as Senior Vice President and Deputy General Counsel of FMR LLC (2010-present), and is an employee of Fidelity Investments. Previously, Mr. Coffey served as Vice President and Associate General Counsel of FMR LLC (2005-2009). |
Holly C. Laurent (56) |
| Year of Election or Appointment: 2008 Anti-Money Laundering (AML) Officer of the Fidelity funds. Ms. Laurent also serves as AML Officer of The North Carolina Capital Management Trust: Cash and Term Portfolio (2008-present) and is an employee of Fidelity Investments. Previously, Ms. Laurent was Senior Vice President and Head of Legal for Fidelity Business Services India Pvt. Ltd. (2006-2008), and Senior Vice President, Deputy General Counsel and Group Head for FMR LLC (2005-2006). |
Christine Reynolds (52) |
| Year of Election or Appointment: 2008 Chief Financial Officer of the Fidelity funds. Ms. Reynolds became President of Fidelity Pricing and Cash Management Services (FPCMS) in August 2008. Ms. Reynolds served as Chief Operating Officer of FPCMS (2007-2008). Previously, Ms. Reynolds served as President, Treasurer, and Anti-Money Laundering officer of the Fidelity funds (2004-2007). |
Kenneth A. Rathgeber (63) |
| Year of Election or Appointment: 2004 Chief Compliance Officer of Fidelity's Equity and High Income Funds. Mr. Rathgeber is Chief Compliance Officer of Fidelity Management & Research (Hong Kong) Limited (2008-present), Fidelity Management & Research (Japan) Inc. (2008-present), FMR (2005-present), FMR Co., Inc. (2005-present), Fidelity Management & Research (U.K.) Inc. (2005-present), Fidelity Research & Analysis Company (2005-present), Fidelity Investments Money Management, Inc. (2005-present), Pyramis Global Advisors, LLC (2005-present), and Strategic Advisers, Inc. (2005-present). |
Jeffrey S. Christian (49) |
| Year of Election or Appointment: 2009 Deputy Treasurer of the Fidelity funds. Mr. Christian is an employee of Fidelity Investments. Previously, Mr. Christian served as Chief Financial Officer (2008-2009) of certain Fidelity funds and Senior Vice President of Fidelity Pricing and Cash Management Services (FPCMS) (2004-2009). |
Bryan A. Mehrmann (49) |
| Year of Election or Appointment: 2005 Deputy Treasurer of the Fidelity funds. Mr. Mehrmann is an employee of Fidelity Investments. |
Adrien E. Deberghes (43) |
| Year of Election or Appointment: 2008 Deputy Treasurer of Fidelity's Equity and High Income Funds. Mr. Deberghes also serves as Assistant Treasurer of other Fidelity funds (2010-present) and is an employee of Fidelity Investments (2008-present). Previously, Mr. Deberghes served as Senior Vice President of Mutual Fund Administration at State Street Corporation (2007-2008), Senior Director of Mutual Fund Administration at Investors Bank & Trust (2005-2007), and Director of Finance for Dunkin' Brands (2000-2005). |
Stephanie J. Dorsey (41) |
| Year of Election or Appointment: 2010 Assistant Treasurer of Fidelity's Equity and High Income Funds. Ms. Dorsey also serves as Deputy Treasurer of other Fidelity funds (2008-present) and is an employee of Fidelity Investments (2008-present). Previously, Ms. Dorsey served as Treasurer (2004-2008) of the JPMorgan Mutual Funds and Vice President (2004-2008) of JPMorgan Chase Bank. |
Name, Age; Principal Occupation |
John R. Hebble (52) |
| Year of Election or Appointment: 2009 Assistant Treasurer of Fidelity's Equity and High Income Funds. Mr. Hebble also serves as Treasurer and Chief Financial Officer of The North Carolina Capital Management Trust: Cash and Term Portfolio (2008-present), President and Treasurer of other Fidelity funds (2008-present) and is an employee of Fidelity Investments. |
Gary W. Ryan (52) |
| Year of Election or Appointment: 2005 Assistant Treasurer of the Fidelity funds. Mr. Ryan is an employee of Fidelity Investments. Previously, Mr. Ryan served as Vice President of Fund Reporting in Fidelity Pricing and Cash Management Services (FPCMS) (1999-2005). |
Jonathan Davis (42) |
| Year of Election or Appointment: 2010 Assistant Treasurer of the Fidelity funds. Mr. Davis is an employee of Fidelity Investments. Previously, Mr. Davis served as Vice President and Associate General Counsel of FMR LLC (2003-2010). |
Annual Report
Board Approval of Investment Advisory Contracts and Management Fees
VIP Growth Stock Portfolio
Each year, the Board of Trustees, including the Independent Trustees (together, the Board), votes on the renewal of the management contract and sub-advisory agreements (together, the Advisory Contracts) for the fund. The Board, assisted by the advice of fund counsel and Independent Trustees' counsel, requests and considers a broad range of information relevant to the renewal of the Advisory Contracts throughout the year.
The Board meets regularly and considers at each of its meetings factors that are relevant to its annual consideration of the renewal of the fund's Advisory Contracts, including the services and support provided to the fund and its shareholders. The Board has established various standing committees, each composed of Independent Trustees with varying backgrounds, to which the Board has assigned specific subject matter responsibilities in order to enhance effective decision-making by the Board. The Board, acting directly and through its Committees, requests and receives information concerning the annual consideration of the renewal of the fund's Advisory Contracts. The Board also meets as needed to consider matters specifically related to the Board's annual consideration of the renewal of Advisory Contracts. Members of the Board may also meet with trustees of other Fidelity funds through ad hoc joint committees to discuss certain matters relevant to the Fidelity funds.
At its July 2010 meeting, the Board of Trustees, including the Independent Trustees, unanimously determined to renew the fund's Advisory Contracts. In reaching its determination, the Board considered all factors it believed relevant, including (i) the nature, extent, and quality of the services to be provided to the fund and its shareholders (including the investment performance of the fund); (ii) the competitiveness of the fund's management fee and total expenses; (iii) the total costs of the services to be provided by and the profits to be realized by Fidelity from its relationship with the fund; (iv) the extent to which economies of scale would be realized as the fund grows; and (v) whether fee levels reflect these economies of scale, if any, for the benefit of fund shareholders.
In considering whether to renew the Advisory Contracts for the fund, the Board reached a determination, with the assistance of fund counsel and Independent Trustees' counsel and through the exercise of its business judgment, that the renewal of the Advisory Contracts is in the best interests of fund shareholders and that the compensation to be received by Fidelity under the management contract is fair and reasonable. The Board's decision to renew the Advisory Contracts was not based on any single factor noted above, but rather was based on a comprehensive consideration of all the information provided to the Board at its meetings throughout the year. The Board, in reaching its determination to renew the Advisory Contracts, is aware that shareholders in the fund have a broad range of investment choices available to them, including a wide choice among mutual funds offered by Fidelity's competitors, and that the fund's shareholders, with the opportunity to review and weigh the disclosure provided by the fund in its prospectus and other public disclosures, have chosen to invest in this fund, managed by Fidelity.
Nature, Extent, and Quality of Services Provided. The Board considered the staffing within the investment adviser, FMR, and the sub-advisers (together, the Investment Advisers), including the backgrounds of the fund's investment personnel and the fund's investment objective and discipline. The Independent Trustees also had discussions with senior management of Fidelity's investment operations and investment groups. The Board considered the structure of the portfolio manager compensation program and whether this structure provides appropriate incentives to act in the best interest of the fund.
Resources Dedicated to Investment Management and Support Services. The Board and the equity research subcommittee of the Board's Fund Oversight Committee reviewed the size, education, and experience of the Investment Advisers' investment staff, their use of technology, and the Investment Advisers' approach to recruiting, training, and retaining portfolio managers and other research, advisory, and management personnel. The Board noted that Fidelity's analysts have access to a variety of technological tools and market and securities data that enable them to perform both fundamental and quantitative analysis and to specialize in various disciplines. The Board considered Fidelity's extensive global research capabilities that enable the Investment Advisers to aggregate data from various sources in an effort to produce positive investment results. The Board also considered that Fidelity's portfolio managers and analysts have access to daily portfolio attribution that allows for monitoring of a fund's portfolio, as well as an electronic communication system that provides immediate real-time access to research concerning issuers and credit enhancers. The Board noted FMR's continued focus on strengthening the organization and discipline of equity portfolio management and research.
Shareholder and Administrative Services. The Board considered (i) the nature, extent, quality, and cost of advisory, administrative, and shareholder services performed by the Investment Advisers and their affiliates under the Advisory Contracts and under separate agreements covering transfer agency, pricing and bookkeeping, and securities lending services for the fund; (ii) the nature and extent of the investment adviser's supervision of third party service providers, principally custodians and subcustodians; and (iii) the resources devoted to, and the record of compliance with, the fund's compliance policies and procedures. The Board also reviewed the allocation of fund brokerage, including allocations to brokers affiliated with the Investment Advisers, the use of brokerage commissions to pay fund expenses, and the use of "soft" commission dollars to pay for research services.
The Board noted that the growth of fund assets over time across the complex allows Fidelity to reinvest in the development of services designed to enhance the value or convenience of the Fidelity funds as investment vehicles. These services include 24-hour access to account information and market information through phone representatives and over the Internet, and investor education materials and asset allocation tools.
Investment in a Large Fund Family. The Board considered the benefits to shareholders of investing in a Fidelity fund, including the benefits of investing in a fund that is part of a large family of funds offering a variety of investment disciplines and providing a large variety of mutual fund investor services. The Board noted that Fidelity had taken, or had made recommendations that resulted in the Fidelity funds taking, a number of actions over the previous year that benefited particular funds, including (i) dedicating additional resources to investment research and restructuring and broadening the focus of the investment research teams; (ii) bolstering the senior management team that oversees asset management; (iii) launching Class F of certain funds as a lower-fee class available to Freedom K and Freedom Index Funds; (iv) lowering the initial investment minimums and ongoing balance requirements for Real Estate High Income Fund; (v) eliminating subsequent purchase minimums for all funds and adding a waiver of the investment minimum requirement for new accounts opened with the proceeds of a systematic withdrawal plan; (vi) eliminating the withdrawal minimum and maximum limits for systematic withdrawals from Advisor funds; (vii) expanding sales load waivers on Class A shares for Destiny Planholders and expanding Institutional Class eligibility for Class O Destiny Planholders; and (viii) changing certain Class A and Class T sales charge structures to further align them with industry practices.
Annual Report
Investment Performance. The Board considered whether the fund has operated in accordance with its investment objective, as well as its record of compliance with its investment restrictions. It also reviewed the fund's absolute investment performance for each class, as well as the fund's relative investment performance for each class measured over multiple periods against (i) a broad-based securities market index, and (ii) a peer group of mutual funds deemed appropriate by Fidelity and reviewed by the Board. The following charts considered by the Board show, over the one-, three-, and five-year periods ended December 31, 2009, the cumulative total returns of Initial Class and Service Class 2 of the fund, the cumulative total returns of a broad-based securities market index ("benchmark"), and a range of cumulative total returns of a peer group of mutual funds identified by Morningstar, Inc. as having an investment style similar to that of the fund based on underlying portfolio holdings. The returns of Initial Class and Service Class 2 show the performance of the highest and lowest performing classes, respectively (based on five-year performance). The box within each chart shows the 25th percentile return (bottom of box) and the 75th percentile return (top of box) of the peer group. Returns shown above the box are in the first quartile and returns shown below the box are in the fourth quartile. The percentage beaten numbers noted below each chart correspond to the percentile box and represent the percentage of funds in the peer group whose performance was equal to or lower than that of the class indicated.
VIP Growth Stock Portfolio
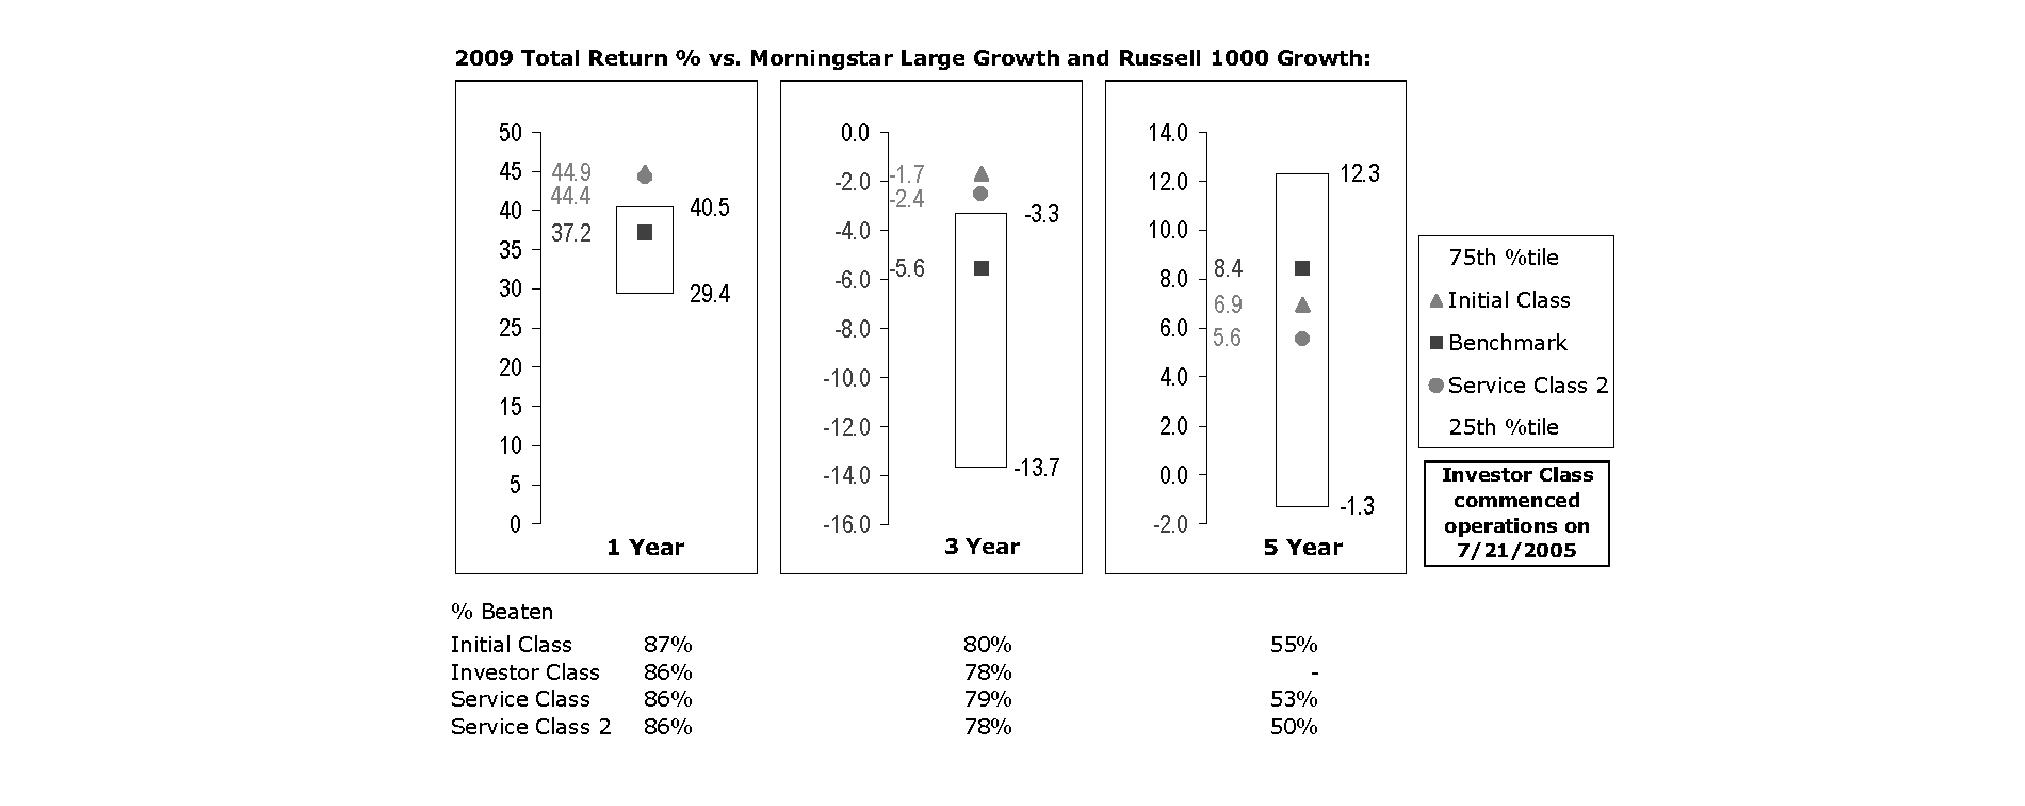
The Board reviewed the fund's relative investment performance against its peer group and noted that the performance of Initial Class of the fund was in the first quartile for the one- and three-year periods and the second quartile for the five-year period. The Board also noted that the investment performance of Initial Class of the fund compared favorably to its benchmark for the one- and three-year periods, although the fund's five-year cumulative total return was lower than its benchmark. The Board considered that the variations in performance among the fund's classes reflect the variations in class expenses, which result in lower performance for higher expense classes. The Board also reviewed the fund's performance since inception as well as performance in the current year.
Based on its review, and giving particular weight to the nature and quality of the resources dedicated by the Investment Advisers to maintain and improve relative performance and factoring in the unprecedented market events in recent years, the Board concluded that the nature, extent, and quality of investment management and support services and of shareholder and administrative services provided to the fund will benefit the fund's shareholders, particularly in light of the Board's view that the fund's shareholders benefit from investing in a fund that is part of a large family of funds offering a variety of investment disciplines and services.
Competitiveness of Management Fee and Total Fund Expenses. The Board considered the fund's management fee and total expenses compared to "mapped groups" of competitive funds and classes. Fidelity creates "mapped groups" by combining similar Lipper investment objective categories that have comparable management fee characteristics. Combining Lipper investment objective categories aids the Board's management fee and total expense comparisons by broadening the competitive group used for comparison and by reducing the number of universes to which various Fidelity funds are compared.
Annual Report
Board Approval of Investment Advisory Contracts and Management Fees - continued
Management Fee. The Board considered two proprietary management fee comparisons for the 12-month periods shown in the chart below. The group of Lipper funds used by the Board for management fee comparisons is referred to below as the "Total Mapped Group." The Total Mapped Group comparison focuses on a fund's standing relative to the total universe of comparable funds available to investors, in terms of gross management fees before expense reimbursements or caps. "TMG %" represents the percentage of funds in the Total Mapped Group that had management fees that were lower than the fund's. For example, a TMG % of 10% means that 90% of the funds in the Total Mapped Group had higher management fees than the fund. The "Asset-Size Peer Group" (ASPG) comparison focuses on a fund's standing relative to non-Fidelity funds similar in size to the fund within the Total Mapped Group. The ASPG represents at least 15% of the funds in the Total Mapped Group with comparable asset size and management fee characteristics, subject to a minimum of 50 funds (or all funds in the Total Mapped Group if fewer than 50). Additional information, such as the ASPG quartile in which the fund's management fee ranked, is also included in the chart and considered by the Board.
VIP Growth Stock Portfolio
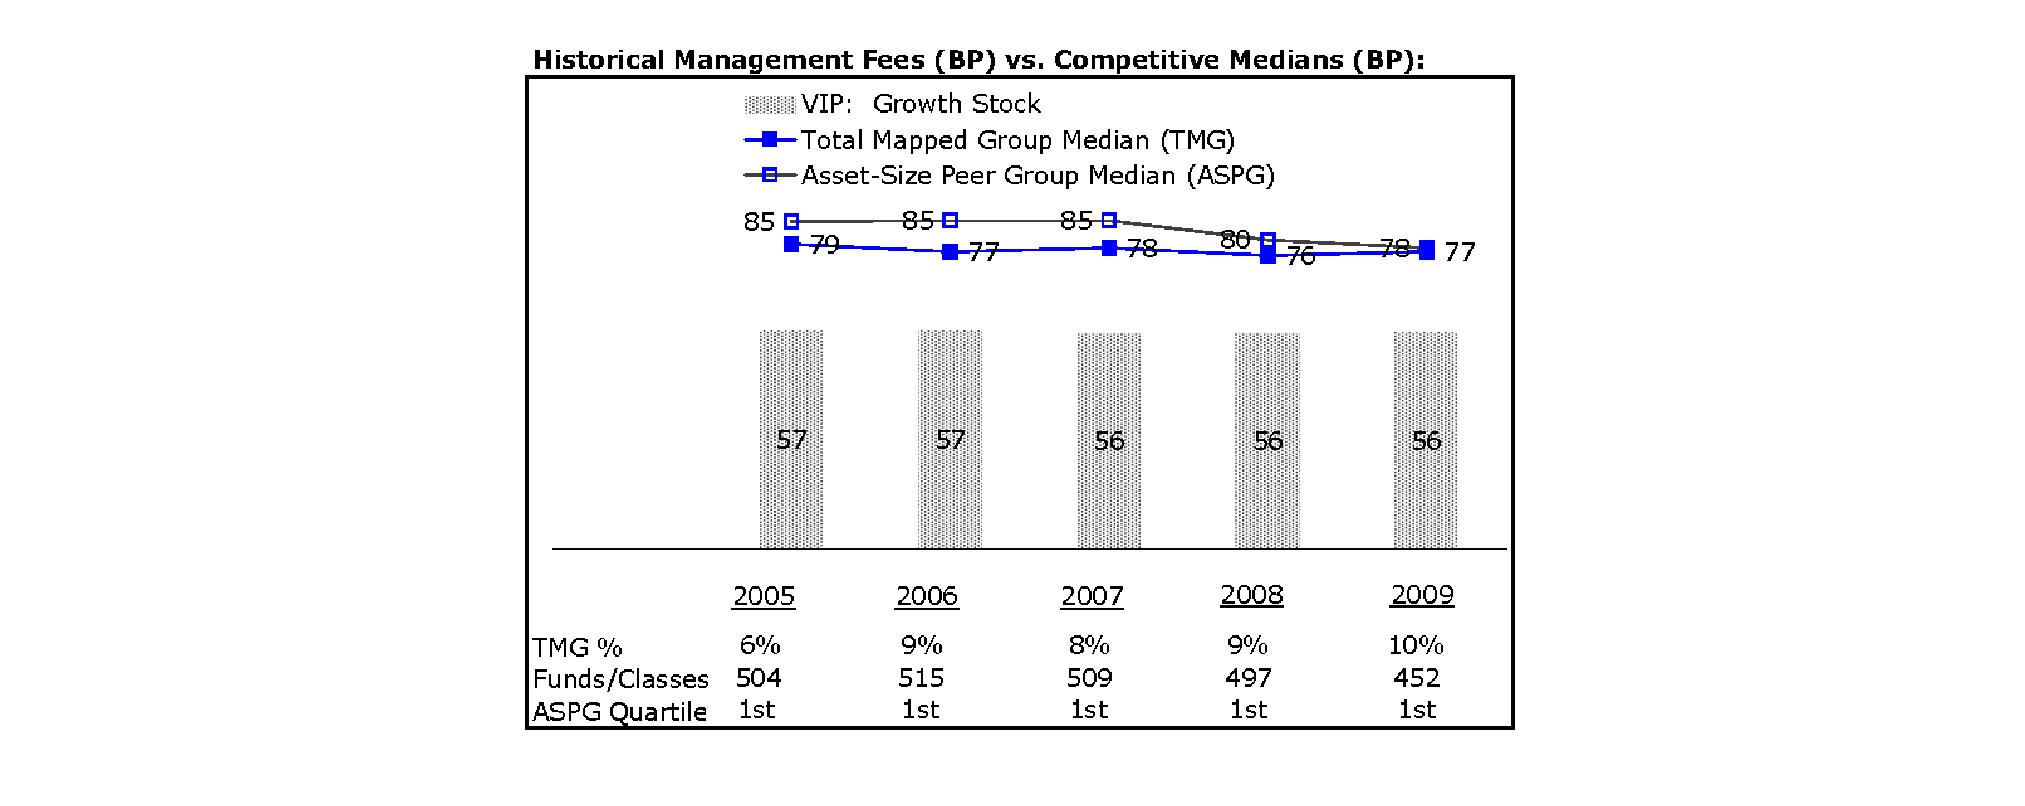
The Board noted that the fund's management fee ranked below the median of its Total Mapped Group and below the median of its ASPG for 2009.
Based on its review, the Board concluded that the fund's management fee is fair and reasonable in light of the services that the fund receives and the other factors considered.
Total Expenses. In its review of each class's total expenses, the Board considered the fund's management fee as well as other fund or class expenses, as applicable, such as transfer agent fees, pricing and bookkeeping fees, fund-paid 12b-1 fees, and custodial, legal, and audit fees. The Board also noted the effects of any waivers and reimbursements on fees and expenses. As part of its review, the Board also considered current and historical total expenses of each class of the fund compared to competitive fund median expenses. Each class of the fund is compared to those funds and classes in the Total Mapped Group (used by the Board for management fee comparisons) that have a similar sales load structure.
The Board noted that the total expenses of Initial Class ranked below its competitive median for 2009, the total expenses of Investor Class ranked equal to its competitive median for 2009, and the total expenses of each of Service Class and Service Class 2 ranked above its competitive median for 2009. The Board noted that the fund offers multiple classes, each of which has a different 12b-1 fee structure, and that the multiple structures are intended to offer a range of pricing options for the intermediary market. The Board also noted that the total expenses of the classes vary primarily by the level of their 12b-1 fees, although differences in transfer agent fees may also cause expenses to vary from class to class.
Fees Charged to Other Fidelity Clients. The Board also considered Fidelity fee structures and other information with respect to clients of FMR and its affiliates, such as other mutual funds advised or subadvised by FMR or its affiliates, pension plan clients, and other institutional clients. In March 2010, the Board created an ad hoc joint committee with the board of other Fidelity funds (the Committee) to review and compare Fidelity's institutional investment advisory business with its business of providing services to the Fidelity funds, including the differences in services provided, fees charged, and costs incurred, as well as competition in their respective marketplaces.
Annual Report
Based on its review of total expenses and fees charged to other Fidelity clients, the Board concluded that the total expenses of each class of the fund were reasonable, although in some cases above the median of the universe presented for comparison, in light of the services that the fund and its shareholders receive and the other factors considered, including the findings of the Committee.
Costs of the Services and Profitability. The Board considered the revenues earned and the expenses incurred by Fidelity in conducting the business of developing, marketing, distributing, managing, administering and servicing the fund and its shareholders. The Board also considered the level of Fidelity's profits in respect of all the Fidelity funds.
On an annual basis, FMR presents to the Board Fidelity's profitability for the fund. Fidelity calculates the profitability for each fund, as well as aggregate profitability for groups of Fidelity funds and all Fidelity funds, using a series of detailed revenue and cost allocation methodologies which originate with the audited books and records of Fidelity. The Audit Committee of the Board reviews any significant changes from the prior year's methodologies.
PricewaterhouseCoopers LLP (PwC), independent registered public accounting firm and auditor to Fidelity and certain Fidelity funds, has been engaged annually by the Board as part of the Board's assessment of Fidelity's profitability analysis. PwC's engagement includes the review and assessment of Fidelity's methodologies used in determining the revenues and expenses attributable to Fidelity's mutual fund business, and completion of agreed-upon procedures surrounding the mathematical accuracy of fund profitability and its conformity to allocation methodologies. After considering PwC's reports issued under the engagement and information provided by Fidelity, the Board believes that while other allocation methods may also be reasonable, Fidelity's profitability methodologies are reasonable in all material respects.
The Board has also reviewed Fidelity's non-fund businesses and fall-out benefits related to the mutual fund business as well as cases where Fidelity's affiliates may benefit from or be related to the fund's business.
The Board considered the costs of the services provided by and the profits realized by Fidelity in connection with the operation of the fund and were satisfied that the profitability was not excessive in the circumstances.
Economies of Scale. The Board considered whether there have been economies of scale in respect of the management of the Fidelity funds, whether the Fidelity funds (including the fund) have appropriately benefited from any such economies of scale, and whether there is potential for realization of any further economies of scale. The Board considered the extent to which the fund will benefit from economies of scale through increased services to the fund, through waivers or reimbursements, or through fee or expense reductions.
In February 2009, the Board and the board of other Fidelity funds created an ad hoc committee (the Economies of Scale Committee) to analyze whether FMR attains economies of scale in respect of the management and servicing of the Fidelity funds, whether the Fidelity funds have appropriately benefited from such economies of scale, and whether there is potential for realization of any further economies of scale.
The Board recognized that the fund's management contract incorporates a "group fee" structure, which provides for lower group fee rates as total fund assets under FMR's management increase, and for higher group fee rates as total fund assets under FMR's management decrease. FMR calculates the group fee rates based on a tiered asset "breakpoint" schedule that varies based on asset class. The Board considered that the group fee is designed to deliver the benefits of economies of scale to fund shareholders when total Fidelity fund assets increase, even if assets of any particular fund are unchanged or have declined, because some portion of Fidelity's costs are attributable to services provided to all Fidelity funds, and all funds benefit if those costs can be allocated among more assets. The Board concluded that, given the group fee structure, fund shareholders will benefit from lower management fees as assets under FMR's management increase at the fund complex level, regardless of whether Fidelity achieves any such economies of scale.
The Board concluded, considering the findings of the Economies of Scale Committee, that any potential economies of scale are being appropriately shared between fund shareholders and Fidelity.
Additional Information Requested by the Board. In order to develop fully the factual basis for consideration of the Fidelity funds' Advisory Contracts, the Board requested and received additional information on certain topics, including (i) fund performance trends, actions to be taken by FMR to improve certain funds' overall performance, and Fidelity's long-term strategies for certain funds; (ii) portfolio manager changes that have occurred during the past year and length of portfolio manager tenure for different categories of funds over time; (iii) Fidelity's compensation structure for portfolio managers, research analysts, and other key personnel, the rationale for the compensation structure, and how the compensation structure provides appropriate performance incentives; (iv) the amount of the investment that each portfolio manager has made in the Fidelity fund(s) that he or she manages; (v) management and other fees paid by FMR to affiliated sub-advisers on behalf of the Fidelity funds; (vi) Fidelity's fee structures and rationale for recommending different fees among different categories of funds; (vii) Fidelity's rationale for recommending which funds should have a performance adjustment component as part of their management fees; (viii) the rationale for any differences between fund fee structures and fee structures in place for other Fidelity clients; and (ix) explanations regarding the relative total expenses borne by certain funds and classes, total expense competitive trends, and actions that might be taken by FMR to reduce total expenses for certain funds and classes.
Based on its evaluation of all of the conclusions noted above, and after considering all factors it believed relevant, the Board ultimately concluded that the advisory fee structures are fair and reasonable, and that the fund's Advisory Contracts should be renewed.
Annual Report
Investment Adviser
Fidelity Management & Research Company
Boston, MA
Investment Sub-Advisers
FMR Co., Inc.
Fidelity Management & Research (U.K.) Inc.
Fidelity Management & Research (Hong Kong) Limited
Fidelity Management & Research (Japan) Inc.
General Distributor
Fidelity Distributors Corporation
Boston, MA
Transfer and Service Agents
Fidelity Investments Institutional Operations Company, Inc.
Boston, MA
Fidelity Service Company, Inc.
Boston, MA
Custodian
The Bank of New York Mellon
New York, NY
VIPGR-ANN-0211
1.781993.108
Fidelity® Variable Insurance Products:
Health Care Portfolio
Annual Report
December 31, 2010
(2_fidelity_logos) (Registered_Trademark)
Contents
Performance | <Click Here> | How the fund has done over time. |
Management's Discussion of Fund Performance | <Click Here> | The Portfolio Manager's review of fund performance and strategy. |
Shareholder Expense Example | <Click Here> | An example of shareholder expenses. |
Investment Changes | <Click Here> | A summary of major shifts in the fund's investments over the past six months. |
Investments | <Click Here> | A complete list of the fund's investments with their market values. |
Financial Statements | <Click Here> | Statements of assets and liabilities, operations, and changes in net assets, as well as financial highlights. |
Notes | <Click Here> | Notes to the financial statements. |
Report of Independent Registered Public Accounting Firm | <Click Here> | |
Trustees and Officers | <Click Here> | |
Distributions | <Click Here> | |
Board Approval of Investment Advisory Contracts and Management Fees | <Click Here> | |
To view a fund's proxy voting guidelines and proxy voting record for the 12-month period ended June 30, visit http://www.fidelity.com/proxyvotingresults or visit the Securities and Exchange Commission's (SEC) web site at http://www.sec.gov. You may also call 1-877-208-0098 to request a free copy of the proxy voting guidelines.
Fidelity Variable Insurance Products are separate account options which are purchased through a variable insurance contract.
Standard & Poor's, S&P and S&P 500 are registered service marks of The McGraw-Hill Companies, Inc. and have been licensed for use by Fidelity Distributors Corporation.
Other third party marks appearing herein are the property of their respective owners.
All other marks appearing herein are registered or unregistered trademarks or service marks of FMR LLC or an affiliated company.
The general research services agreement with Fidelity Research & Analysis Company has been terminated and is no longer in effect for the fund.
This report and the financial statements contained herein are submitted for the general information of the shareholders of the fund. This report is not authorized for distribution to prospective investors in the fund unless preceded or accompanied by an effective prospectus.
The fund files its complete schedule of portfolio holdings with the SEC for the first and third quarters of each fiscal year on Form N-Q. Forms N-Q are available on the SEC's web site at http://www.sec.gov. The fund's Forms N-Q may be reviewed and copied at the SEC's Public Reference Room in Washington, DC. Information regarding the operation of the SEC's Public Reference Room may be obtained by calling 1-800-SEC-0330. For a complete list of the fund's portfolio holdings, view the most recent holdings listing, semiannual report, or annual report on Fidelity's web site at http://www.fidelity.com, http://www.advisor.fidelity.com, or http://www.401k.com, as applicable.
NOT FDIC INSURED • MAY LOSE VALUE • NO BANK GUARANTEE
Neither the fund nor Fidelity Distributors Corporation is a bank.
Annual Report
Average annual total return reflects the change in the value of an investment, assuming reinvestment of the class' distributions from dividend income and capital gains (the profits earned upon the sale of securities that have grown in value, if any) and assuming a constant rate of performance each year. During periods of reimbursement by Fidelity, a fund's total return will be greater than it would be had the reimbursement not occurred. Performance numbers are net of all underlying fund operating expenses, but do not include any insurance charges imposed by your insurance company's separate account. If performance information included the effect of these additional charges, the total returns would have been lower. How a fund did yesterday is no guarantee of how it will do tomorrow.
Average Annual Total Returns
Periods ended December 31, 2010 | Past 1
year | Past 5
years | Life of fund A |
VIP Health Care Portfolio - Initial Class | 17.35% | 4.33% | 4.75% |
VIP Health Care Portfolio - Investor Class B | 17.24% | 4.23% | 4.67% |
A From July 18, 2001.
B The initial offering of Investor Class took place on July 21, 2005. Returns prior to July 21, 2005 are those of Initial Class. Had Investor Class's transfer agent fee been reflected, returns prior to July 21, 2005 would have been lower.
$10,000 Over Life of Fund
Let's say hypothetically that $10,000 was invested in VIP Health Care Portfolio - Initial Class on July 18, 2001, when the fund started. The chart shows how the value of your investment would have changed, and also shows how the S&P 500® Index performed over the same period.
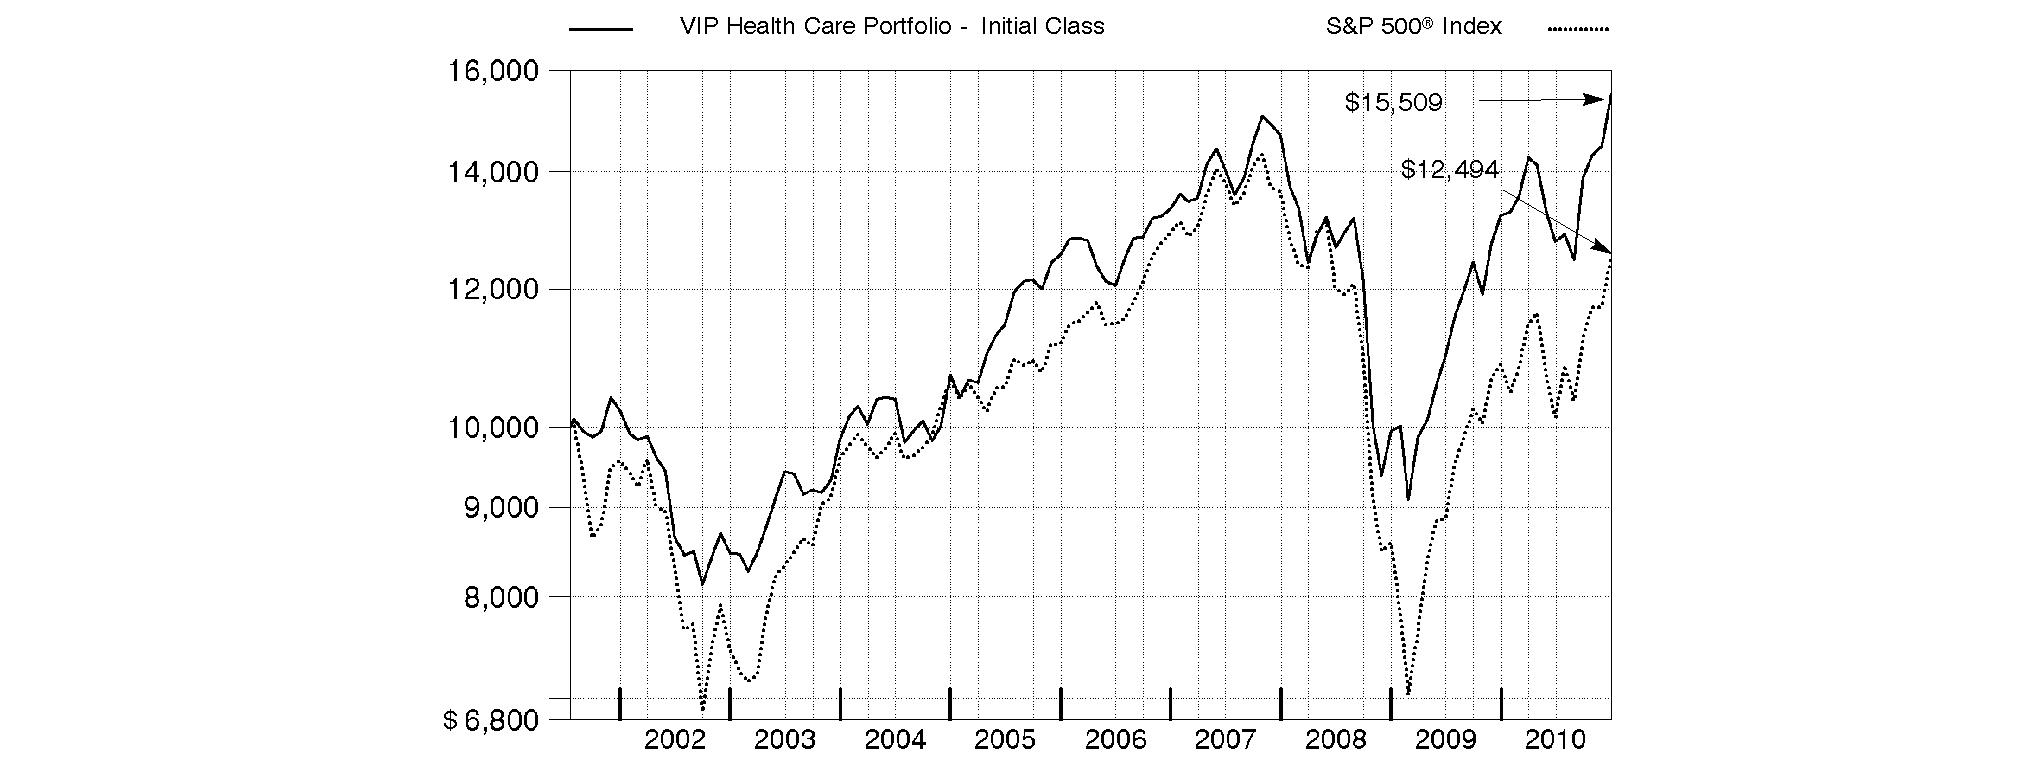
Annual Report
Market Recap: While market improvements around the world hit a speed bump in the first half of the 12-month period ending December 31, 2010, world economies re-accelerated in August, supported by a broadening recovery and low inflation in the U.S. Domestic stock markets recorded solid gains for the year, lifted by a strong second-half rally fueled by economic optimism, encouraging earnings reports and a wave of corporate mergers. The large-cap S&P 500® Index rose 15.06%, the blue-chip-laden Dow Jones Industrial AverageSM added 14.06% and the technology-heavy Nasdaq Composite® Index climbed 18.02%. Meanwhile, international stocks, as represented by the MSCI® ACWI® (All Country World Index) ex USA Index, gained 11.29%, boosted in part by a depreciating U.S. dollar. In the fixed-income arena, U.S. taxable investment-grade bonds generated positive results during 2010, as the Barclays Capital® U.S. Aggregate Bond Index gained 6.54%. With ultra-low interest rates bolstering nearly all fixed-income securities for most of the year, sectors in the index with higher yields and more credit risk generally fared best, while most high-quality bonds generated more-moderate returns. Meanwhile, high-yield bonds, as represented by The BofA Merrill LynchSM US High Yield Constrained Index, returned 15.07%, a result of improved economic data and strengthening investor demand. Overseas, foreign bond markets showed mixed results, with a sizable disparity between the 3.97% return of the Citigroup® Non-U.S. Group of 7 Index - which measures the performance of sovereign debt of the major global economies outside the U.S. - and the 12.04% advance of the JPMorgan Emerging Markets Bond Index Global (EMBI Global), which benefited from the rising overall credit quality of emerging-markets debt issuers.
Comments from Edward Yoon, Portfolio Manager of VIP Health Care Portfolio: For the 12 months ending December 31, 2010, the fund decisively outperformed the 5.97% return of the MSCI® U.S. IM Health Care 25/50 Index, which was adopted in January 2010 as a better representation of the fund's investment universe, and the S&P 500®. (For specific portfolio results, please refer to the performance section of this report.) We successfully identified a number of smaller companies with innovative products and at the same time avoided larger companies facing long-term pressure. Specifically, good stock picking in biotechnology and health care equipment boosted relative performance, as did overall positioning in pharmaceuticals and life science tools/services. Contributing stocks included Illumina, which makes genetic analysis technology; Edwards Lifesciences, a producer of transcatheter heart valves; Valeant Pharmaceuticals International, a specialty drug maker selling Western medicines in emerging markets; and Alexion Pharmaceuticals, a biotech firm with a drug for a rare blood disorder. Underweightings in Johnson & Johnson and Abbott Laboratories, two large-cap pharma stocks, also helped. On the other hand, stock picking in managed health care, health care distributors, and fertilizers and agricultural chemicals detracted. Overweightings in biotech firm InterMune, agrichemical company Monsanto and Nobel Biocare Holding, a Swiss manufacturer of dental implants, hurt relative performance, as did an underweighting in managed care provider UnitedHealth Group. Some of the stocks mentioned were sold by the end of the period.
The views expressed above reflect those of the portfolio manager(s) only through the end of the period as stated on the cover of this report and do not necessarily represent the views of Fidelity or any other person in the Fidelity organization. Any such views are subject to change at any time based upon market or other conditions and Fidelity disclaims any responsibility to update such views. These views may not be relied on as investment advice and, because investment decisions for a Fidelity fund are based on numerous factors, may not be relied on as an indication of trading intent on behalf of any Fidelity fund.
Annual Report
As a shareholder of the Fund, you incur two types of costs: (1) transaction costs, including redemption fees, and (2) ongoing costs, including management fees and other Fund expenses. This Example is intended to help you understand your ongoing costs (in dollars) of investing in the Fund and to compare these costs with the ongoing costs of investing in other mutual funds.
The Example is based on an investment of $1,000 invested at the beginning of the period and held for the entire period (July 1, 2010 to December 31, 2010).
Actual Expenses
The first line of the accompanying table for each class of the Fund provides information about actual account values and actual expenses. You may use the information in this line, together with the amount you invested, to estimate the expenses that you paid over the period. Simply divide your account value by $1,000.00 (for example, an $8,600 account value divided by $1,000.00 = 8.6), then multiply the result by the number in the first line for a class of the Fund under the heading entitled "Expenses Paid During Period" to estimate the expenses you paid on your account during this period. The estimate of expenses does not include any fees or other expenses of any variable annuity or variable life insurance product. If they were, the estimate of expenses you paid during the period would be higher, and your ending account value would be lower. In addition, the Fund, as a shareholder in the underlying Fidelity Central Funds, will indirectly bear its pro-rata share of the fees and expenses incurred by the underlying Fidelity Central Funds. These fees and expenses are not included in the Fund's annualized expense ratio used to calculate the expense estimate in the table below.
Hypothetical Example for Comparison Purposes
The second line of the accompanying table for each class of the Fund provides information about hypothetical account values and hypothetical expenses based on a Class' actual expense ratio and an assumed rate of return of 5% per year before expenses, which is not the Class' actual return. The hypothetical account values and expenses may not be used to estimate the actual ending account balance or expenses you paid for the period. You may use this information to compare the ongoing costs of investing in the Fund and other funds. To do so, compare this 5% hypothetical example with the 5% hypothetical examples that appear in the shareholder reports of the other funds. The estimate of expenses does not include any fees or other expenses of any variable annuity or variable life insurance product. If they were, the estimate of expenses you paid during the period would be higher, and your ending account value would be lower. In addition, the Fund, as a shareholder in the underlying Fidelity Central Funds, will indirectly bear its pro-rata share of the fees and expenses incurred by the underlying Fidelity Central Funds. These fees and expenses are not included in the Fund's annualized expense ratio used to calculate the expense estimate in the table below.
Please note that the expenses shown in the table are meant to highlight your ongoing costs only and do not reflect any transaction costs. Therefore, the second line of the table is useful in comparing ongoing costs only, and will not help you determine the relative total costs of owning different funds. In addition, if these transactional costs were included, your costs would have been higher.
| Annualized Expense Ratio | Beginning
Account Value
July 1, 2010 | Ending
Account Value
December 31, 2010 | Expenses Paid
During Period*
July 1, 2010
to December 31, 2010 |
Initial Class | .79% | | | |
Actual | | $ 1,000.00 | $ 1,214.00 | $ 4.41 |
HypotheticalA | | $ 1,000.00 | $ 1,021.22 | $ 4.02 |
Investor Class | .88% | | | |
Actual | | $ 1,000.00 | $ 1,213.00 | $ 4.91 |
HypotheticalA | | $ 1,000.00 | $ 1,020.77 | $ 4.48 |
A 5% return per year before expenses
* Expenses are equal to each Class' annualized expense ratio, multiplied by the average account value over the period, multiplied by 184/365 (to reflect the one-half year period).
Annual Report
Investment Changes (Unaudited)
Top Ten Stocks as of December 31, 2010 |
| % of fund's
net assets | % of fund's net assets
6 months ago |
Illumina, Inc. | 5.9 | 4.5 |
Medco Health Solutions, Inc. | 5.7 | 6.0 |
Covidien PLC | 4.9 | 3.2 |
McKesson Corp. | 4.1 | 1.9 |
Merck & Co., Inc. | 3.9 | 5.1 |
Agilent Technologies, Inc. | 3.4 | 1.8 |
Edwards Lifesciences Corp. | 3.3 | 2.2 |
Valeant Pharmaceuticals International, Inc. | 2.9 | 2.5 |
Express Scripts, Inc. | 2.9 | 4.5 |
Pfizer, Inc. | 2.9 | 3.6 |
| 39.9 | |
Top Industries (% of fund's net assets) |
As of December 31, 2010 |
| Health Care
Providers & Services | 21.0% | |
| Life Sciences
Tools & Services | 19.8% | |
| Biotechnology | 18.8% | |
| Health Care
Equipment & Supplies | 18.4% | |
| Pharmaceuticals | 15.0% | |
| All Others* | 7.0% | |

As of June 30, 2010 |
| Health Care
Providers & Services | 22.2% | |
| Pharmaceuticals | 21.6% | |
| Biotechnology | 18.7% | |
| Health Care
Equipment & Supplies | 16.6% | |
| Life Sciences
Tools & Services | 12.0% | |
| All Others* | 8.9% | |

* Includes short-term investments and net other assets. |
Annual Report
Investments December 31, 2010
Showing Percentage of Net Assets
Common Stocks - 97.8% |
| Shares | | Value |
BIOTECHNOLOGY - 18.8% |
Biotechnology - 18.8% |
Acorda Therapeutics, Inc. (a) | 11,700 | | $ 318,942 |
Alexion Pharmaceuticals, Inc. (a) | 17,405 | | 1,401,973 |
Amgen, Inc. (a) | 33,341 | | 1,830,421 |
Anthera Pharmaceuticals, Inc. | 30,600 | | 149,328 |
ARIAD Pharmaceuticals, Inc. (a)(d) | 91,253 | | 465,390 |
ArQule, Inc. (a) | 30,700 | | 180,209 |
AVEO Pharmaceuticals, Inc. | 4,555 | | 66,594 |
AVEO Pharmaceuticals, Inc. (e) | 4,421 | | 64,635 |
Biogen Idec, Inc. (a) | 22,300 | | 1,495,215 |
BioMarin Pharmaceutical, Inc. (a) | 46,377 | | 1,248,933 |
Cephalon, Inc. (a) | 3,600 | | 222,192 |
Chelsea Therapeutics International Ltd. (a) | 30,900 | | 231,750 |
Dynavax Technologies Corp. (a) | 83,004 | | 265,613 |
Gilead Sciences, Inc. (a) | 22,215 | | 805,072 |
Human Genome Sciences, Inc. (a) | 11,600 | | 277,124 |
Incyte Corp. (a) | 30,319 | | 502,083 |
Inhibitex, Inc. (a) | 31,500 | | 81,900 |
Keryx Biopharmaceuticals, Inc. (a) | 28,560 | | 130,805 |
Medivir AB (B Shares) (a) | 13,000 | | 270,382 |
Micromet, Inc. (a)(d) | 16,900 | | 137,228 |
Neurocrine Biosciences, Inc. (a) | 17,200 | | 131,408 |
Seattle Genetics, Inc. (a) | 22,250 | | 332,638 |
Targacept, Inc. (a) | 17,533 | | 464,625 |
Theravance, Inc. (a)(d) | 20,100 | | 503,907 |
United Therapeutics Corp. (a) | 15,052 | | 951,587 |
YM Biosciences, Inc. (a) | 28,200 | | 65,601 |
ZIOPHARM Oncology, Inc. (a)(d) | 32,483 | | 151,371 |
| | 12,746,926 |
CAPITAL MARKETS - 0.1% |
Asset Management & Custody Banks - 0.1% |
Safeguard Scientifics, Inc. (a) | 5,423 | | 92,625 |
DIVERSIFIED CONSUMER SERVICES - 0.5% |
Specialized Consumer Services - 0.5% |
Carriage Services, Inc. (a) | 37,339 | | 181,094 |
Stewart Enterprises, Inc. Class A | 25,532 | | 170,809 |
| | 351,903 |
FOOD & STAPLES RETAILING - 0.2% |
Drug Retail - 0.2% |
Rite Aid Corp. (a) | 183,200 | | 161,802 |
HEALTH CARE EQUIPMENT & SUPPLIES - 18.4% |
Health Care Equipment - 17.0% |
American Medical Systems Holdings, Inc. (a) | 37,100 | | 699,706 |
ArthroCare Corp. (a) | 11,365 | | 352,997 |
Boston Scientific Corp. (a) | 60,200 | | 455,714 |
C. R. Bard, Inc. | 19,491 | | 1,788,689 |
Covidien PLC | 72,389 | | 3,305,282 |
|
| Shares | | Value |
Edwards Lifesciences Corp. (a) | 27,474 | | $ 2,220,998 |
Genmark Diagnostics, Inc. | 12,047 | | 49,272 |
HeartWare International, Inc. (a)(d) | 4,327 | | 378,915 |
Hologic, Inc. (a) | 34,000 | | 639,880 |
Masimo Corp. | 18,835 | | 547,533 |
Orthofix International NV (a) | 7,666 | | 222,314 |
Orthovita, Inc. (a) | 103,839 | | 208,716 |
William Demant Holding AS (a) | 5,099 | | 376,796 |
Wright Medical Group, Inc. (a) | 19,033 | | 295,582 |
| | 11,542,394 |
Health Care Supplies - 1.4% |
Cooper Companies, Inc. | 9,179 | | 517,145 |
RTI Biologics, Inc. (a) | 102,193 | | 272,855 |
Shandong Weigao Group Medical Polymer Co. Ltd. (H Shares) | 52,000 | | 147,520 |
| | 937,520 |
TOTAL HEALTH CARE EQUIPMENT & SUPPLIES | | 12,479,914 |
HEALTH CARE PROVIDERS & SERVICES - 21.0% |
Health Care Distributors & Services - 4.3% |
McKesson Corp. | 38,979 | | 2,743,342 |
United Drug PLC (Ireland) | 56,424 | | 158,422 |
| | 2,901,764 |
Health Care Facilities - 2.0% |
Emeritus Corp. (a)(d) | 14,528 | | 286,347 |
Hanger Orthopedic Group, Inc. (a) | 15,290 | | 323,995 |
Kindred Healthcare, Inc. (a) | 18,890 | | 347,009 |
LCA-Vision, Inc. (a) | 23,420 | | 134,665 |
Sunrise Senior Living, Inc. (a) | 52,595 | | 286,643 |
| | 1,378,659 |
Health Care Services - 12.4% |
Air Methods Corp. (a) | 6,500 | | 365,755 |
Express Scripts, Inc. (a) | 36,268 | | 1,960,285 |
Fresenius Medical Care AG & Co. KGaA | 7,600 | | 439,269 |
HMS Holdings Corp. (a) | 9,000 | | 582,930 |
Laboratory Corp. of America Holdings (a) | 5,500 | | 483,560 |
Medco Health Solutions, Inc. (a) | 63,205 | | 3,872,570 |
Sun Healthcare Group, Inc. (a) | 22,500 | | 284,850 |
Team Health Holdings, Inc. | 25,925 | | 402,875 |
| | 8,392,094 |
Managed Health Care - 2.3% |
CIGNA Corp. | 22,632 | | 829,689 |
UnitedHealth Group, Inc. | 20,433 | | 737,836 |
| | 1,567,525 |
TOTAL HEALTH CARE PROVIDERS & SERVICES | | 14,240,042 |
Common Stocks - continued |
| Shares | | Value |
HEALTH CARE TECHNOLOGY - 2.2% |
Health Care Technology - 2.2% |
Allscripts-Misys Healthcare Solutions, Inc. (a) | 57,980 | | $ 1,117,275 |
Computer Programs & Systems, Inc. | 7,466 | | 349,707 |
| | 1,466,982 |
INTERNET SOFTWARE & SERVICES - 0.6% |
Internet Software & Services - 0.6% |
WebMD Health Corp. (a) | 8,000 | | 408,480 |
LIFE SCIENCES TOOLS & SERVICES - 19.8% |
Life Sciences Tools & Services - 19.8% |
Agilent Technologies, Inc. (a) | 55,666 | | 2,306,242 |
Bruker BioSciences Corp. (a) | 27,400 | | 454,840 |
Charles River Laboratories International, Inc. (a) | 6,749 | | 239,859 |
Covance, Inc. (a) | 33,418 | | 1,718,019 |
Illumina, Inc. (a) | 63,303 | | 4,009,611 |
Lonza Group AG | 7,542 | | 605,023 |
Nordion, Inc. (a) | 15,000 | | 169,658 |
PAREXEL International Corp. (a) | 26,083 | | 553,742 |
PerkinElmer, Inc. | 26,446 | | 682,836 |
QIAGEN NV (a)(d) | 63,024 | | 1,232,119 |
Thermo Fisher Scientific, Inc. (a) | 26,300 | | 1,455,968 |
| | 13,427,917 |
MACHINERY - 0.5% |
Industrial Machinery - 0.5% |
Pall Corp. | 6,816 | | 337,937 |
MULTILINE RETAIL - 0.0% |
General Merchandise Stores - 0.0% |
Droga Raia SA | 2,000 | | 30,659 |
PERSONAL PRODUCTS - 0.4% |
Personal Products - 0.4% |
Prestige Brands Holdings, Inc. (a) | 21,500 | | 256,925 |
PHARMACEUTICALS - 15.0% |
Pharmaceuticals - 15.0% |
Ardea Biosciences, Inc. (a) | 21,671 | | 563,446 |
Cadence Pharmaceuticals, Inc. (a)(d) | 24,345 | | 183,805 |
Cardiome Pharma Corp. (a) | 45,500 | | 291,076 |
Jazz Pharmaceuticals, Inc. (a) | 9,700 | | 190,896 |
Merck & Co., Inc. | 74,416 | | 2,681,953 |
Optimer Pharmaceuticals, Inc. (a) | 18,567 | | 209,993 |
Perrigo Co. | 12,774 | | 808,977 |
Pfizer, Inc. | 111,350 | | 1,949,739 |
|
| Shares | | Value |
Piramal Healthcare Ltd. | 25,501 | | $ 268,028 |
Shire PLC sponsored ADR | 12,000 | | 868,560 |
Valeant Pharmaceuticals International, Inc. | 69,260 | | 1,963,976 |
Watson Pharmaceuticals, Inc. (a) | 3,800 | | 196,270 |
| | 10,176,719 |
SOFTWARE - 0.3% |
Application Software - 0.3% |
Nuance Communications, Inc. (a) | 11,100 | | 201,798 |
TOTAL COMMON STOCKS (Cost $53,777,316) | 66,380,629 |
Money Market Funds - 2.8% |
| | | |
Fidelity Cash Central Fund, 0.19% (b) | 1,055,380 | | 1,055,380 |
Fidelity Securities Lending Cash Central Fund, 0.21% (b)(c) | 856,395 | | 856,395 |
TOTAL MONEY MARKET FUNDS (Cost $1,911,775) | 1,911,775 |
TOTAL INVESTMENT PORTFOLIO - 100.6% (Cost $55,689,091) | 68,292,404 |
NET OTHER ASSETS (LIABILITIES) - (0.6)% | (387,819) |
NET ASSETS - 100% | $ 67,904,585 |
Legend |
(a) Non-income producing |
(b) Affiliated fund that is available only to investment companies and other accounts managed by Fidelity Investments. The rate quoted is the annualized seven-day yield of the fund at period end. A complete unaudited listing of the fund's holdings as of its most recent quarter end is available upon request. In addition, each Fidelity Central Fund's financial statements, which are not covered by the Fund's Report of Independent Registered Public Accounting Firm, are available on the SEC's website or upon request. |
(c) Investment made with cash collateral received from securities on loan. |
(d) Security or a portion of the security is on loan at period end. |
(e) Restricted securities - Investment in securities not registered under the Securities Act of 1933 (excluding 144A issues). At the end of the period, the value of restricted securities (excluding 144A issues) amounted to $64,635 or 0.1% of net assets. |
Additional information on each holding is as follows: |
Security | Acquisition Date | Acquisition Cost |
AVEO Pharmaceuticals, Inc. | 10/28/10 | $ 59,684 |
Affiliated Central Funds |
Information regarding fiscal year to date income earned by the Fund from investments in Fidelity Central Funds is as follows: |
Fund | Income earned |
Fidelity Cash Central Fund | $ 2,003 |
Fidelity Securities Lending Cash Central Fund | 27,190 |
Total | $ 29,193 |
Other Information |
All investments are categorized as Level 1 under the Fair Value Hierarchy. The inputs or methodology used for valuing securities may not be an indication of the risk associated with investing in those securities. For more information on valuation inputs, please refer to the Security Valuation section in the accompanying Notes to Financial Statements. |
Distribution of investments by country of issue, as a percentage of total net assets, is as follows: (Unaudited) |
United States of America | 84.9% |
Ireland | 5.1% |
Canada | 3.7% |
Netherlands | 1.8% |
Bailiwick of Jersey | 1.3% |
Others (Individually Less Than 1%) | 3.2% |
| 100.0% |
Income Tax Information |
At December 31, 2010, the Fund had a capital loss carryforward of approximately $4,278,581 all of which will expire in fiscal 2017. Capital loss carryforwards are only available to offset future capital gains of the Fund to the extent provided by regulations and may be limited. |
See accompanying notes which are an integral part of the financial statements.
Annual Report
Statement of Assets and Liabilities
| December 31, 2010 |
| | |
Assets | | |
Investment in securities, at value (including securities loaned of $824,276) - See accompanying schedule: Unaffiliated issuers (cost $53,777,316) | $ 66,380,629 | |
Fidelity Central Funds (cost $1,911,775) | 1,911,775 | |
Total Investments (cost $55,689,091) | | $ 68,292,404 |
Cash | | 11 |
Receivable for investments sold | | 593,637 |
Receivable for fund shares sold | | 149,239 |
Dividends receivable | | 46,346 |
Distributions receivable from Fidelity Central Funds | | 1,832 |
Prepaid expenses | | 183 |
Other receivables | | 6,670 |
Total assets | | 69,090,322 |
| | |
Liabilities | | |
Payable for investments purchased | $ 252,623 | |
Payable for fund shares redeemed | 87 | |
Accrued management fee | 30,800 | |
Other affiliated payables | 7,888 | |
Other payables and accrued expenses | 37,944 | |
Collateral on securities loaned, at value | 856,395 | |
Total liabilities | | 1,185,737 |
| | |
Net Assets | | $ 67,904,585 |
Net Assets consist of: | | |
Paid in capital | | $ 60,057,122 |
Accumulated undistributed net realized gain (loss) on investments and foreign currency transactions | | (4,755,367) |
Net unrealized appreciation (depreciation) on investments and assets and liabilities in foreign currencies | | 12,602,830 |
Net Assets | | $ 67,904,585 |
Statement of Assets and Liabilities - continued
| December 31, 2010 |
Initial Class:
Net Asset Value, offering price and redemption price per share ($36,650,531 ÷ 2,900,544 shares) | | $ 12.64 |
| | |
Investor Class:
Net Asset Value, offering price and redemption price per share ($31,254,054 ÷ 2,482,821 shares) | | $ 12.59 |
See accompanying notes which are an integral part of the financial statements.
Annual Report
Statement of Operations
| Year ended December 31, 2010 |
| | |
Investment Income | | |
Dividends | | $ 498,787 |
Special Dividends | | 84,269 |
Interest | | 3 |
Income from Fidelity Central Funds | | 29,193 |
Total income | | 612,252 |
| | |
Expenses | | |
Management fee | $ 359,893 | |
Transfer agent fees | 77,668 | |
Accounting and security lending fees | 25,905 | |
Custodian fees and expenses | 24,412 | |
Independent trustees' compensation | 362 | |
Audit | 44,131 | |
Legal | 335 | |
Miscellaneous | 780 | |
Total expenses before reductions | 533,486 | |
Expense reductions | (8,630) | 524,856 |
Net investment income (loss) | | 87,396 |
Realized and Unrealized Gain (Loss) Net realized gain (loss) on: | | |
Investment securities: | | |
Unaffiliated issuers | 5,116,827 | |
Foreign currency transactions | 1,468 | |
Total net realized gain (loss) | | 5,118,295 |
Change in net unrealized appreciation (depreciation) on: Investment securities | 4,473,460 | |
Assets and liabilities in foreign currencies | (139) | |
Total change in net unrealized appreciation (depreciation) | | 4,473,321 |
Net gain (loss) | | 9,591,616 |
Net increase (decrease) in net assets resulting from operations | | $ 9,679,012 |
Statement of Changes in Net Assets
| Year ended December 31, 2010 | Year ended December 31, 2009 |
Increase (Decrease) in Net Assets | | |
Operations | | |
Net investment income (loss) | $ 87,396 | $ 153,545 |
Net realized gain (loss) | 5,118,295 | (1,210,476) |
Change in net unrealized appreciation (depreciation) | 4,473,321 | 16,940,553 |
Net increase (decrease) in net assets resulting from operations | 9,679,012 | 15,883,622 |
Distributions to shareholders from net investment income | (95,078) | (167,209) |
Share transactions - net increase (decrease) | (3,931,126) | (13,364,216) |
Redemption fees | 16,002 | 22,083 |
Total increase (decrease) in net assets | 5,668,810 | 2,374,280 |
| | |
Net Assets | | |
Beginning of period | 62,235,775 | 59,861,495 |
End of period | $ 67,904,585 | $ 62,235,775 |
See accompanying notes which are an integral part of the financial statements.
Annual Report
Financial Highlights - Initial Class
Years ended December 31, | 2010 | 2009 | 2008 | 2007 | 2006 |
Selected Per-Share Data | | | | | |
Net asset value, beginning of period | $ 10.79 | $ 8.15 | $ 13.57 | $ 13.17 | $ 12.39 |
Income from Investment Operations | | | | | |
Net investment income (loss) C | .02 H | .03 | .04 | .03 | .04 |
Net realized and unrealized gain (loss) | 1.85 | 2.64 | (4.05) | 1.25 | .75 |
Total from investment operations | 1.87 | 2.67 | (4.01) | 1.28 | .79 |
Distributions from net investment income | (.02) | (.03) | (.04) | (.07) | (.01) |
Distributions from net realized gain | - | - | (1.37) | (.81) | - |
Total distributions | (.02) | (.03) | (1.41) | (.88) | (.01) |
Redemption fees added to paid in capitalC, G | - | - | - | - | - |
Net asset value, end of period | $ 12.64 | $ 10.79 | $ 8.15 | $ 13.57 | $ 13.17 |
Total Return A, B | 17.35% | 32.80% | (32.31)% | 10.21% | 6.34% |
Ratios to Average Net Assets D, F | | | | | |
Expenses before reductions | .79% | .83% | .84% | .81% | .77% |
Expenses net of fee waivers, if any | .78% | .83% | .84% | .81% | .77% |
Expenses net of all reductions | .78% | .82% | .84% | .80% | .76% |
Net investment income (loss) | .17% H | .30% | .36% | .23% | .33% |
Supplemental Data | | | | | |
Net assets, end of period (000 omitted) | $ 36,651 | $ 37,787 | $ 37,961 | $ 55,676 | $ 69,418 |
Portfolio turnover rate E | 108% | 132% | 189% | 128% | 106% |
A Total returns do not reflect charges attributable to your insurance company's separate account. Inclusion of these charges would reduce the total returns shown.
B Total returns would have been lower had certain expenses not been reduced during the periods shown.
C Calculated based on average shares outstanding during the period.
D Fees and expenses of the underlying Fidelity Central Funds are not included in the Fund's expense ratio. The Fund indirectly bears its proportionate share of the expenses of any underlying Fidelity Central Funds.
E Amount does not include the portfolio activity of any underlying Fidelity Central Funds.
F Expense ratios reflect operating expenses of the class. Expenses before reductions do not reflect amounts reimbursed by the investment adviser or reductions from brokerage service arrangements or reductions from other expense offset arrangements and do not represent the amount paid by the class during periods when reimbursements or reductions occur. Expenses net of fee waivers reflect expenses after reimbursement by the investment adviser but prior to reductions from brokerage service arrangements or other expense offset arrangements. Expenses net of all reductions represent the net expenses paid by the class.
G Amount represents less than $.01 per share.
H Investment income per share reflects a special dividend which amounted to $.01 per share. Excluding the special dividend, the ratio of net investment income (loss) to average net assets would have been .04%.
Financial Highlights - Investor Class
Years ended December 31, | 2010 | 2009 | 2008 | 2007 | 2006 |
Selected Per-Share Data | | | | | |
Net asset value, beginning of period | $ 10.75 | $ 8.13 | $ 13.53 | $ 13.14 | $ 12.37 |
Income from Investment Operations | | | | | |
Net investment income (loss) C | .01 H | .02 | .03 | .01 | .03 |
Net realized and unrealized gain (loss) | 1.84 | 2.62 | (4.03) | 1.24 | .75 |
Total from investment operations | 1.85 | 2.64 | (4.00) | 1.25 | .78 |
Distributions from net investment income | (.01) | (.02) | (.03) | (.05) | (.01) |
Distributions from net realized gain | - | - | (1.37) | (.81) | - |
Total distributions | (.01) | (.02) | (1.40) | (.86) | (.01) |
Redemption fees added to paid in capital C, G | - | - | - | - | - |
Net asset value, end of period | $ 12.59 | $ 10.75 | $ 8.13 | $ 13.53 | $ 13.14 |
Total Return A, B | 17.24% | 32.53% | (32.31)% | 10.01% | 6.30% |
Ratios to Average Net Assets D, F | | | | | |
Expenses before reductions | .88% | .94% | .94% | .93% | .90% |
Expenses net of fee waivers, if any | .87% | .94% | .94% | .93% | .90% |
Expenses net of all reductions | .86% | .93% | .93% | .92% | .89% |
Net investment income (loss) | .09% H | .20% | .26% | .11% | .20% |
Supplemental Data | | | | | |
Net assets, end of period (000 omitted) | $ 31,254 | $ 24,448 | $ 21,901 | $ 26,948 | $ 16,229 |
Portfolio turnover rate E | 108% | 132% | 189% | 128% | 106% |
A Total returns do not reflect charges attributable to your insurance company's separate account. Inclusion of these charges would reduce the total returns shown.
B Total returns would have been lower had certain expenses not been reduced during the periods shown.
C Calculated based on average shares outstanding during the period.
D Fees and expenses of the underlying Fidelity Central Funds are not included in the Fund's expense ratio. The Fund indirectly bears its proportionate share of the expenses of any underlying Fidelity Central Funds.
E Amount does not include the portfolio activity of any underlying Fidelity Central Funds.
F Expense ratios reflect operating expenses of the class. Expenses before reductions do not reflect amounts reimbursed by the investment adviser or reductions from brokerage service arrangements or reductions from other expense offset arrangements and do not represent the amount paid by the class during periods when reimbursements or reductions occur. Expenses net of fee waivers reflect expenses after reimbursement by the investment adviser but prior to reductions from brokerage service arrangements or other expense offset arrangements. Expenses net of all reductions represent the net expenses paid by the class.
G Amount represents less than $.01 per share.
H Investment income per share reflects a special dividend which amounted to $.01 per share. Excluding the special dividend, the ratio of net investment income (loss) to average net assets would have been (.04)%.
See accompanying notes which are an integral part of the financial statements.
Annual Report
Notes to Financial Statements
For the period ended December 31, 2010
1. Organization.
VIP Health Care Portfolio (the Fund) is a non-diversified fund of Variable Insurance Products Fund IV (the Trust) and is authorized to issue an unlimited number of shares. The Trust is registered under the Investment Company Act of 1940, as amended (the 1940 Act), as an open-end management investment company organized as a Massachusetts business trust. Shares of the Fund may only be purchased by insurance companies for the purpose of funding variable annuity or variable life insurance contracts. The Fund offers the following classes of shares: Initial Class shares and Investor Class shares. All classes have equal rights and voting privileges, except for matters affecting a single class. Investment income, realized and unrealized capital gains and losses, the common expenses of the Fund, and certain fund-level expense reductions, if any, are allocated on a pro-rata basis to each class based on the relative net assets of each class to the total net assets of the Fund. Each class differs with respect to transfer agent fees incurred. Certain expense reductions may also differ by class.
2. Investments in Fidelity Central Funds.
The Fund may invest in Fidelity Central Funds, which are open-end investment companies available only to other investment companies and accounts managed by Fidelity Management & Research Company (FMR) and its affiliates. The Fund's Schedule of Investments lists each of the Fidelity Central Funds held as of period end, if any, as an investment of the Fund, but does not include the underlying holdings of each Fidelity Central Fund. As an Investing Fund, the Fund indirectly bears its proportionate share of the expenses of the underlying Fidelity Central Funds.
The Money Market Central Funds seek preservation of capital and current income and are managed by Fidelity Investments Money Management, Inc. (FIMM), an affiliate of FMR.
A complete unaudited list of holdings for each Fidelity Central Fund is available upon request or at the Securities and Exchange Commission (the SEC) web site at www.sec.gov. In addition, the financial statements of the Fidelity Central Funds, which are not covered by the Fund's Report of Independent Registered Public Accounting Firm, are available on the SEC web site or upon request.
3. Significant Accounting Policies.
The financial statements have been prepared in conformity with accounting principles generally accepted in the United States of America (GAAP), which require management to make certain estimates and assumptions at the date of the financial statements. Actual results could differ from those estimates. Subsequent events, if any, through the date that the financial statements were issued have been evaluated in the preparation of the financial statements. The following summarizes the significant accounting policies of the Fund:
Security Valuation. Investments are valued as of 4:00 p.m. Eastern time on the last calendar day of the period. The Fund uses independent pricing services approved by the Board of Trustees to value its investments. When current market prices or quotations are not readily available or reliable, valuations may be determined in good faith in accordance with procedures adopted by the Board of Trustees. Factors used in determining value may include market or security specific events. The frequency with which these procedures are used cannot be predicted and they may be utilized to a significant extent. The value used for net asset value (NAV) calculation under these procedures may differ from published prices for the same securities.
The Fund categorizes the inputs to valuation techniques used to value its investments into a disclosure hierarchy consisting of three levels as shown below.
Level 1 - quoted prices in active markets for identical investments
Level 2 - other significant observable inputs (including quoted prices for similar investments, interest rates, prepayment speeds, etc.)
Level 3 - unobservable inputs (including the Fund's own assumptions based on the best information available)
Changes in valuation techniques may result in transfers in or out of an assigned level within the disclosure hierarchy. Valuation techniques used to value the Fund's investments by major category are as follows.
Equity securities, including restricted securities, for which market quotations are readily available, are valued at the last reported sale price or official closing price as reported by an independent pricing service on the primary market or exchange on which they are traded and are categorized as Level 1 in the hierarchy. In the event there were no sales during the day or closing prices are not available, securities are valued at the last quoted bid price or may be valued using the last available price and are generally categorized as Level 2 in the hierarchy. For foreign equity securities, when significant market or security specific events arise, comparisons to the valuation of American Depositary Receipts (ADRs), futures contracts, Exchange-traded funds (ETFs) and certain indexes as well as quoted prices for similar securities are used and are categorized as Level 2 in the hierarchy in these circumstances. Utilizing these techniques may result in transfers between Level 1 and Level 2. For restricted equity securities and private placements where observable inputs are limited, assumptions about market activity and risk are used and are categorized as Level 3 in the hierarchy.
Investments in open-end mutual funds, including the Fidelity Central Funds, are valued at their closing net asset value each business day and are categorized as Level 1 in the hierarchy.
Annual Report
3. Significant Accounting Policies - continued
Foreign Currency. The Fund uses foreign currency contracts to facilitate transactions in foreign-denominated securities. Gains and losses from these transactions may arise from changes in the value of the foreign currency or if the counterparties do not perform under the contracts' terms.
Foreign-denominated assets, including investment securities, and liabilities are translated into U.S. dollars at the exchange rate at period end. Purchases and sales of investment securities, income and dividends received and expenses denominated in foreign currencies are translated into U.S. dollars at the exchange rate in effect on the transaction date.
The effects of exchange rate fluctuations on investments are included with the net realized and unrealized gain (loss) on investment securities. Other foreign currency transactions resulting in realized and unrealized gain (loss) are disclosed separately.
Investment Transactions and Income. For financial reporting purposes, the Fund's investment holdings and NAV include trades executed through the end of the last business day of the period. The NAV per share for processing shareholder transactions is calculated as of the close of business of the New York Stock Exchange (NYSE), normally 4:00 p.m. Eastern time and includes trades executed through the end of the prior business day. Gains and losses on securities sold are determined on the basis of identified cost and may include proceeds received from litigation. Dividend income is recorded on the ex-dividend date, except for certain dividends from foreign securities where the ex-dividend date may have passed, which are recorded as soon as the Fund is informed of the ex-dividend date. Non-cash dividends included in dividend income, if any, are recorded at the fair market value of the securities received. Distributions received on securities that represent a return of capital or capital gain are recorded as a reduction of cost of investments and/or as a realized gain. The Fund estimates the components of distributions received that may be considered return of capital distributions or capital gain distributions. Large, non-recurring dividends recognized by the Fund are presented separately on the Statement of Operations as "Special Dividends" and the impact of these dividends is presented in the Financial Highlights. Interest income and distributions from the Fidelity Central Funds are accrued as earned. Interest income includes coupon interest and amortization of premium and accretion of discount on debt securities. Investment income is recorded net of foreign taxes withheld where recovery of such taxes is uncertain.
Expenses. Expenses directly attributable to a fund are charged to that fund. Expenses attributable to more than one fund are allocated among the respective funds on the basis of relative net assets or other appropriate methods. Expense estimates are accrued in the period to which they relate and adjustments are made when actual amounts are known.
Income Tax Information and Distributions to Shareholders. Each year the Fund intends to qualify as a regulated investment company, including distributing substantially all of its taxable income and realized gains under Subchapter M of the Internal Revenue Code and filing its U.S. federal tax return. As a result, no provision for income taxes is required. As of December 31, 2010, the Fund did not have any unrecognized tax benefits in the accompanying financial statements. A fund's federal tax return is subject to examination by the Internal Revenue Service (IRS) for a period of three years. Foreign taxes are provided for based on the Fund's understanding of the tax rules and rates that exist in the foreign markets in which it invests.
Distributions are declared and recorded on the ex-dividend date. Income dividends and capital gain distributions are declared separately for each class. Income and capital gain distributions are determined in accordance with income tax regulations, which may differ from GAAP.
Capital accounts within the financial statements are adjusted for permanent book-tax differences. These adjustments have no impact on net assets or the results of operations. Temporary book-tax differences will reverse in a subsequent period.
Book-tax differences are primarily due to foreign currency transactions, capital loss carryforwards and losses deferred due to wash sales and excise tax regulations.
The federal tax cost of investment securities and unrealized appreciation (depreciation) as of period end were as follows:
Gross unrealized appreciation | $ 14,123,501 |
Gross unrealized depreciation | (1,996,974) |
Net unrealized appreciation (depreciation) | $ 12,126,527 |
| |
Tax Cost | $ 56,165,877 |
The tax-based components of distributable earnings as of period end were as follows:
Capital loss carryforward | $ (4,278,581) |
Net unrealized appreciation (depreciation) | $ 12,126,044 |
Annual Report
Notes to Financial Statements - continued
3. Significant Accounting Policies - continued
Income Tax Information and Distributions to Shareholders - continued
The tax character of distributions paid was as follows:
| December 31, 2010 | December 31, 2009 |
Ordinary Income | $ 95,078 | $ 167,209 |
Trading (Redemption) Fees. Shares held by investors less than 60 days are subject to a redemption fee equal to 1% of the net asset value of shares redeemed. All redemption fees, which reduce the proceeds of the shareholder redemption, are retained by the Fund and accounted for as an addition to paid in capital.
4. Operating Policies.
Restricted Securities. The Fund may invest in securities that are subject to legal or contractual restrictions on resale. These securities generally may be resold in transactions exempt from registration or to the public if the securities are registered. Disposal of these securities may involve time-consuming negotiations and expense, and prompt sale at an acceptable price may be difficult. Information regarding restricted securities is included at the end of the Fund's Schedule of Investments.
5. Purchases and Sales of Investments.
Purchases and sales of securities, other than short-term securities, aggregated $68,198,674 and $72,082,285, respectively.
6. Fees and Other Transactions with Affiliates.
Management Fee. FMR and its affiliates provide the Fund with investment management related services for which the Fund pays a monthly management fee. The management fee is the sum of an individual fund fee rate that is based on an annual rate of .30% of the Fund's average net assets and a group fee rate that averaged .26% during the period. The group fee rate is based upon the average net assets of all the mutual funds advised by FMR. The group fee rate decreases as assets under management increase and increases as assets under management decrease. For the period, the total annual management fee rate was .56% of the Fund's average net assets.
Transfer Agent Fees. Fidelity Investments Institutional Operations Company, Inc. (FIIOC), an affiliate of FMR, is the Fund's transfer, dividend disbursing, and shareholder servicing agent. FIIOC receives an asset-based fee with respect to each class. Each class (with the exception of Investor Class) pays a transfer agent fee, excluding out of pocket expenses, equal to an annual rate of .07% of average net assets. Investor Class pays a monthly asset-based transfer agent fee of .15% of average net assets. In addition, FIIOC receives an asset-based fee of .01% of average net assets for typesetting, printing and mailing of shareholder reports, except proxy statements. FIIOC has agreed to voluntarily waive this fee until December 31, 2010. (See Note 9: Expense Reductions.) For the period, transfer agent fees for each class, including printing and out of pocket expenses, were as follows:
Initial Class | $ 30,576 |
Investor Class | 47,092 |
| $ 77,668 |
Accounting and Security Lending Fees. Fidelity Service Company, Inc. (FSC), an affiliate of FMR, maintains the Fund's accounting records. The accounting fee is based on the level of average net assets for the month. Under a separate contract, FSC administers the security lending program. The security lending fee is based on the number and duration of lending transactions.
Brokerage Commissions. The Fund placed a portion of its portfolio transactions with brokerage firms which are affiliates of the investment adviser. The commissions paid to these affiliated firms were $1,159 for the period.
7. Committed Line of Credit.
The Fund participates with other funds managed by FMR or an affiliate in a $3.75 billion credit facility (the "line of credit") to be utilized for temporary or emergency purposes to fund shareholder redemptions or for other short-term liquidity purposes. The Fund has agreed to pay commitment fees on its pro-rata portion of the line of credit, which amounted to $251 and is reflected in Miscellaneous expenses on the Statement of Operations. During the period, there were no borrowings on this line of credit.
Annual Report
8. Security Lending.
The Fund lends portfolio securities through a lending agent from time to time in order to earn additional income. The lending agent may loan securities to certain qualified borrowers, including Fidelity Capital Markets (FCM), a broker-dealer affiliated with the Fund. On the settlement date of the loan, the Fund receives collateral (in the form of U.S. Treasury obligations, letters of credit and/or cash) against the loaned securities and maintains collateral in an amount not less than 100% of the market value of the loaned securities during the period of the loan. The market value of the loaned securities is determined at the close of business of the Fund and any additional required collateral is delivered to the Fund on the next business day. If the borrower defaults on its obligation to return the securities loaned because of insolvency or other reasons, a fund could experience delays and costs in recovering the securities loaned or in gaining access to the collateral. Any cash collateral received is invested in the Fidelity Securities Lending Cash Central Fund. The value of loaned securities and cash collateral at period end are disclosed on the Fund's Statement of Assets and Liabilities. Security lending income represents the income earned on investing cash collateral, less rebates paid to borrowers and lending agent fees associated with the loan, plus any premium payments received for lending certain types of securities. Security lending income is presented in the Statement of Operations as a component of income from Fidelity Central Funds. Total security lending income during the period amounted to $27,190. During the period, there were no securities loaned to FCM.
9. Expense Reductions.
FMR or its affiliates agreed to waive certain fees during the period as noted in the table below.
Initial Class | $ 2,664 |
Investor Class | 2,005 |
| $ 4,669 |
Many of the brokers with whom FMR places trades on behalf of the Fund provided services to the Fund in addition to trade execution. These services included payments of certain expenses on behalf of the Fund totaling $3,961 for the period.
10. Distributions to Shareholders.
Distributions to shareholders of each class were as follows:
Years ended December 31, | 2010 | 2009 |
From net investment income | | |
Initial Class | $ 63,626 | $ 113,510 |
Investor Class | 31,452 | 53,699 |
Total | $ 95,078 | $ 167,209 |
11. Share Transactions.
Transactions for each class of shares were as follows:
| Shares | Dollars |
Years ended December 31, | 2010 | 2009 | 2010 | 2009 |
Initial Class | | | | |
Shares sold | 391,589 | 415,891 | $ 4,450,278 | $ 3,763,009 |
Reinvestment of distributions | 4,998 | 10,708 | 63,626 | 113,510 |
Shares redeemed | (998,727) | (1,578,813) | (11,104,327) | (13,902,294) |
Net increase (decrease) | (602,140) | (1,152,214) | $ (6,590,423) | $ (10,025,775) |
Investor Class | | | | |
Shares sold | 834,983 | 787,867 | $ 9,599,046 | $ 7,051,378 |
Reinvestment of distributions | 2,480 | 5,085 | 31,452 | 53,699 |
Shares redeemed | (629,065) | (1,213,276) | (6,971,201) | (10,443,518) |
Net increase (decrease) | 208,398 | (420,324) | $ 2,659,297 | $ (3,338,441) |
12. Other.
The Fund's organizational documents provide former and current trustees and officers with a limited indemnification against liabilities arising in connection with the performance of their duties to the Fund. In the normal course of business, the Fund may also enter into contracts that provide general indemnifications. The Fund's maximum exposure under these arrangements is unknown as this would be dependent on future claims that may be made against the Fund. The risk of material loss from such claims is considered remote.
At the end of the period, FMR or its affiliates were the owners of record of 100% of the total outstanding shares of the Fund.
Annual Report
Report of Independent Registered Public Accounting Firm
To the Trustees of Variable Insurance Products Fund IV and the Shareholders of VIP Health Care Portfolio:
In our opinion, the accompanying statement of assets and liabilities, including the schedule of investments, and the related statements of operations and of changes in net assets and the financial highlights present fairly, in all material respects, the financial position of VIP Health Care Portfolio (a fund of Variable Insurance Products Fund IV) at December 31, 2010, the results of its operations for the year then ended, the changes in its net assets for each of the two years in the period then ended and the financial highlights for each of the five years in the period then ended, in conformity with accounting principles generally accepted in the United States of America. These financial statements and financial highlights (hereafter referred to as "financial statements") are the responsibility of the VIP Health Care Portfolio's management. Our responsibility is to express an opinion on these financial statements based on our audits. We conducted our audits of these financial statements in accordance with the standards of the Public Company Accounting Oversight Board (United States). Those standards require that we plan and perform the audit to obtain reasonable assurance about whether the financial statements are free of material misstatement. An audit includes examining, on a test basis, evidence supporting the amounts and disclosures in the financial statements, assessing the accounting principles used and significant estimates made by management, and evaluating the overall financial statement presentation. We believe that our audits, which included confirmation of securities at December 31, 2010 by correspondence with the custodian and brokers, provide a reasonable basis for our opinion.
/s/ PricewaterhouseCoopers LLP
PricewaterhouseCoopers LLP
Boston, Massachusetts
February 17, 2011
Annual Report
The Trustees, Members of the Advisory Board, and executive officers of the trust and fund, as applicable, are listed below. The Board of Trustees governs the fund and is responsible for protecting the interests of shareholders. The Trustees are experienced executives who meet periodically throughout the year to oversee the fund's activities, review contractual arrangements with companies that provide services to the fund, oversee management of the risks associated with such activities and contractual arrangements, and review the fund's performance. Except for James C. Curvey, each of the Trustees oversees 219 funds advised by FMR or an affiliate. Mr. Curvey oversees 408 funds advised by FMR or an affiliate.
The Trustees hold office without limit in time except that (a) any Trustee may resign; (b) any Trustee may be removed by written instrument, signed by at least two-thirds of the number of Trustees prior to such removal; (c) any Trustee who requests to be retired or who has become incapacitated by illness or injury may be retired by written instrument signed by a majority of the other Trustees; and (d) any Trustee may be removed at any special meeting of shareholders by a two-thirds vote of the outstanding voting securities of the trust. Each Trustee who is not an interested person (as defined in the 1940 Act) (Independent Trustee), shall retire not later than the last day of the calendar year in which his or her 72nd birthday occurs. The Independent Trustees may waive this mandatory retirement age policy with respect to individual Trustees. The executive officers and Advisory Board Member hold office without limit in time, except that any officer and Advisory Board Members may resign or may be removed by a vote of a majority of the Trustees at any regular meeting or any special meeting of the Trustees. Except as indicated, each individual has held the office shown or other offices in the same company for the past five years.
Experience, Skills, Attributes, and Qualifications of the Fund's Trustees. The Governance and Nominating Committee has adopted a statement of policy that describes the experience, qualifications, attributes, and skills that are necessary and desirable for potential Independent Trustee candidates (Statement of Policy). The Board believes that each Trustee satisfied at the time he or she was initially elected or appointed a Trustee, and continues to satisfy, the standards contemplated by the Statement of Policy. The Governance and Nominating Committee also engages professional search firms to help identify potential Independent Trustee candidates who have the experience, qualifications, attributes, and skills consistent with the Statement of Policy. From time to time, additional criteria based on the composition and skills of the current Independent Trustees, as well as experience or skills that may be appropriate in light of future changes to board composition, business conditions, and regulatory or other developments, have also been considered by the professional search firms and the Governance and Nominating Committee. In addition, the Board takes into account the Trustees' commitment and participation in Board and committee meetings, as well as their leadership of standing and ad hoc committees throughout their tenure.
In determining that a particular Trustee was and continues to be qualified to serve as a Trustee, the Board has considered a variety of criteria, none of which, in isolation, was controlling. The Board believes that, collectively, the Trustees have balanced and diverse experience, qualifications, attributes, and skills, which allow the Board to operate effectively in governing the fund and protecting the interests of shareholders. Information about the specific experience, skills, attributes, and qualifications of each Trustee, which in each case led to the Board's conclusion that the Trustee should serve (or continue to serve) as a trustee of the fund, is provided below.
Board Structure and Oversight Function. James C. Curvey is an interested person (as defined in the 1940 Act) and currently serves as Acting Chairman. The Trustees have determined that an interested Chairman is appropriate and benefits shareholders because an interested Chairman has a personal and professional stake in the quality and continuity of services provided to the fund. Independent Trustees exercise their informed business judgment to appoint an individual of their choosing to serve as Chairman, regardless of whether the Trustee happens to be independent or a member of management. The Independent Trustees have determined that they can act independently and effectively without having an Independent Trustee serve as Chairman and that a key structural component for assuring that they are in a position to do so is for the Independent Trustees to constitute a substantial majority for the Board. The Independent Trustees also regularly meet in executive session. Ned C. Lautenbach serves as Chairman of the Independent Trustees and as such (i) acts as a liaison between the Independent Trustees and management with respect to matters important to the Independent Trustees and (ii) with management prepares agendas for Board meetings.
Fidelity funds are overseen by different Boards of Trustees. The fund's Board oversees Fidelity's equity and high income funds and another Board oversees Fidelity's investment-grade bond, money market, and asset allocation funds. The asset allocation funds may invest in Fidelity funds overseen by the fund's Board. The use of separate Boards, each with its own committee structure, allows the Trustees of each group of Fidelity funds to focus on the unique issues of the funds they oversee, including common research, investment, and operational issues. On occasion, the separate Boards establish joint committees to address issues of overlapping consequences for the Fidelity funds overseen by each Board.
The Trustees operate using a system of committees to facilitate the timely and efficient consideration of all matters of importance to the Trustees, the fund, and fund shareholders and to facilitate compliance with legal and regulatory requirements and oversight of the fund's activities and associated risks. The Board, acting through its committees, has charged FMR and its affiliates with (i) identifying events or circumstances the occurrence of which could have demonstrably adverse effects on the fund's business and/or reputation; (ii) implementing processes and controls to lessen the possibility that such events or circumstances occur or to mitigate the effects of such events or circumstances if they do occur; and (iii) creating and maintaining a system designed to evaluate continuously business and market conditions in order to facilitate the identification and implementation processes described in (i) and (ii) above. Because the day-to-day operations and activities of the fund are carried out by or through FMR, its affiliates and other service providers, the fund's exposure to risks is mitigated but not eliminated by the processes overseen by the Trustees. While each of the Board's committees has responsibility for overseeing different aspects of the fund's activities, oversight is exercised primarily through the Operations, Audit, and Compliance Committees. Appropriate personnel, including but not limited to the fund's Chief Compliance Officer (CCO), FMR's internal auditor, the independent accountants, the fund's Treasurer and portfolio management personnel, make periodic reports to the Board's committees, as appropriate. The responsibilities of each committee, including their oversight responsibilities, are described further under "Standing Committees of the Fund's Trustees."
Annual Report
Trustees and Officers - continued
The fund's Statement of Additional Information (SAI) includes more information about the Trustees. To request a free copy, call Fidelity at 1-877-208-0098.
Interested Trustees*:
Correspondence intended for each Trustee who is an interested person may be sent to Fidelity Investments, 82 Devonshire Street, Boston, Massachusetts 02109.
Name, Age; Principal Occupations and Other Relevant Experience+ |
James C. Curvey (75) |
| Year of Election or Appointment: 2007 Mr. Curvey is Trustee and Acting Chairman of the Board of Trustees of certain Trusts. Mr. Curvey also serves as Trustee (2007-present) of other investment companies advised by FMR. Mr. Curvey is a Director of Fidelity Investments Money Management, Inc. (2009-present), Director of Fidelity Research & Analysis Co. (2009-present) and Director of FMR and FMR Co., Inc. (2007-present). Mr. Curvey is also Vice Chairman (2007-present) and Director of FMR LLC. In addition, Mr. Curvey serves as an Overseer for the Boston Symphony Orchestra and a member of the Trustees of Villanova University. Previously, Mr. Curvey was the Vice Chairman (2006-2007) and Director (2000-2007) of FMR Corp. |
Ronald P. O'Hanley (54) |
| Year of Election or Appointment: 2011 Mr. O'Hanley is President of Fidelity Asset Management and Corporate Services and a member of Fidelity's Executive Committee (2010-present). Previously, Mr. O'Hanley served as President and Chief Executive Officer of BNY Mellon Asset Management (2007-2010). Mr. O'Hanley also served as Vice Chairman of Bank New York Mellon Corp. and a member of that firm's Executive Committee. Prior to the 2007 merger of The Bank of New York and Mellon Financial Corporation, he was Vice Chairman of Mellon Financial Corporation and President and Chief Executive Officer of Mellon Asset Management. He joined Mellon in February 1997. Mr. O'Hanley currently serves as Chairman of the Boston Public Library Foundation Board of Directors and sits on the Board of Directors of Beth Israel Deaconess Medical Center, the Board of Trustees of the Marine Biological Laboratory and the Advisory Board of the Maxwell School of Citizenship and Public Administration at Syracuse University. Mr. O'Hanley also chairs the Council on Asset Management for the Financial Services Roundtable and is a member of the Board of Directors of Institutional Investor's U.S. Institute. |
* Trustees have been determined to be "Interested Trustees" by virtue of, among other things, their affiliation with the trust or various entities under common control with FMR.
+ The information above includes each Trustee's principal occupation during the last five years and other information relating to the experience, attributes, and skills relevant to each Trustee's qualifications to serve as a Trustee, which led to the conclusion that each Trustee should serve as a Trustee for the fund.
Independent Trustees:
Correspondence intended for each Independent Trustee (that is, the Trustees other than the Interested Trustees) may be sent to Fidelity Investments, P.O. Box 55235, Boston, Massachusetts 02205-5235.
Name, Age; Principal Occupations and Other Relevant Experience+ |
Dennis J. Dirks (62) |
| Year of Election or Appointment: 2005 Prior to his retirement in May 2003, Mr. Dirks was Chief Operating Officer and a member of the Board of The Depository Trust & Clearing Corporation (DTCC). He also served as President, Chief Operating Officer, and Board member of The Depository Trust Company (DTC) and President and Board member of the National Securities Clearing Corporation (NSCC). In addition, Mr. Dirks served as Chief Executive Officer and Board member of the Government Securities Clearing Corporation, Chief Executive Officer and Board member of the Mortgage-Backed Securities Clearing Corporation, as a Trustee and a member of the Finance Committee of Manhattan College (2005-2008), and as a Trustee and a member of the Finance Committee of AHRC of Nassau County (2006-2008). Mr. Dirks is a member of the Independent Directors Council (IDC) Governing Council (2010-Present) and Board of Directors for The Brookville Center for Children's Services, Inc. (2009-present). |
Alan J. Lacy (57) |
| Year of Election or Appointment: 2008 Mr. Lacy serves as Senior Adviser (2007-present) of Oak Hill Capital Partners, L.P. (private equity). Mr. Lacy also served as Chief Executive Officer (2000-2005) and Vice Chairman (2005-2006) of Sears Holdings Corporation and Sears, Roebuck and Co. (retail). In addition, Mr. Lacy serves as a member of the Board of Directors of The Western Union Company (global money transfer, 2006-present) and Bristol-Myers Squibb Company (global pharmaceuticals, 2007-present). Mr. Lacy is Chairman (2008-present) and a member (2006-present) of the Board of Trustees of The National Parks Conservation Association. |
Ned C. Lautenbach (66) |
| Year of Election or Appointment: 2000 Mr. Lautenbach is Chairman of the Independent Trustees of the Equity and High Income Funds (2006-present). Mr. Lautenbach currently serves as the Lead Director of the Eaton Corporation Board of Directors (diversified industrial, 1997-present). Mr. Lautenbach is also a member of the Board of Directors of the Philharmonic Center for the Arts in Naples, Florida (1999-present); a member of the Board of Trustees of Fairfield University (2005-present); and a member of the Council on Foreign Relations (1994-present). Previously, Mr. Lautenbach was a Partner/Advisory Partner at Clayton, Dubilier & Rice, Inc. (private equity investment, 1998-2010), as well as a Director of Sony Corporation (2006-2007). |
Joseph Mauriello (66) |
| Year of Election or Appointment: 2008 Prior to his retirement in January 2006, Mr. Mauriello served in numerous senior management positions including Deputy Chairman and Chief Operating Officer (2004-2005), and Vice Chairman of Financial Services (2002-2004) of KPMG LLP US (professional services, 1965-2005). Mr. Mauriello currently serves as a member of the Board of Directors of XL Group plc. (global insurance and re-insurance, 2006-present) and of Arcadia Resources Inc. (health care services and products, 2007-present). Previously, Mr. Mauriello served as a Director of the Hamilton Funds of the Bank of New York (2006-2007). |
Cornelia M. Small (66) |
| Year of Election or Appointment: 2005 Ms. Small is a member of the Board of Directors of the Teagle Foundation (2009-present). Ms. Small is also a member of the Investment Committee, and Chair (2008-present) and a member of the Board of Trustees of Smith College. In addition, Ms. Small serves on the Investment Committee of the Berkshire Taconic Community Foundation (2008-present). Previously, Ms. Small served as Chairperson of the Investment Committee (2002-2008) of Smith College. In addition, Ms. Small served as Chief Investment Officer, Director of Global Equity Investments, and a member of the Board of Directors of Scudder, Stevens & Clark and Scudder Kemper Investments. |
William S. Stavropoulos (71) |
| Year of Election or Appointment: 2001 Mr. Stavropoulos is Vice Chairman of the Independent Trustees of the Equity and High Income Funds (2006-present). Mr. Stavropoulos serves as President and Founder of the Michigan Baseball Foundation, the Great Lakes Loons (2007-present). Mr. Stavropoulos is Chairman Emeritus of the Board of Directors of The Dow Chemical Company, where he previously served in numerous senior management positions, including President, CEO (1995-2000; 2002-2004), Chairman of the Executive Committee (2000-2006), and as a member of the Board of Directors (1990-2006). Currently, Mr. Stavropoulos is Chairman of Univar (global distributor of commodity and specialty chemicals, 2010-present), a Director of Teradata Corporation (data warehousing and technology solutions, 2008-present), Chemical Financial Corporation, Maersk Inc. (industrial conglomerate), Tyco International, Inc. (multinational manufacturing and services, 2007-present), and a member of the Advisory Board for Metalmark Capital (private equity investment, 2005-present). Mr. Stavropoulos is a special advisor to Clayton, Dubilier & Rice, LLC (private equity investment). In addition, Mr. Stavropoulos is a member of the University of Notre Dame Advisory Council for the College of Science. |
David M. Thomas (61) |
| Year of Election or Appointment: 2008 Previously, Mr. Thomas served as Executive Chairman (2005-2006) and Chairman and Chief Executive Officer (2000-2005) of IMS Health, Inc. (pharmaceutical and healthcare information solutions). In addition, Mr. Thomas serves as a member of the Board of Directors of Fortune Brands, Inc. (consumer products), and Interpublic Group of Companies, Inc. (marketing communication, 2004-present). |
Michael E. Wiley (60) |
| Year of Election or Appointment: 2008 Mr. Wiley also serves as a Director of Asia Pacific Exploration Consolidated (international oil and gas exploration and production, 2008-present). Mr. Wiley serves as a Director of Tesoro Corporation (independent oil refiner and marketer, 2005-present), and a Director of Bill Barrett Corporation (exploration and production, 2005-present). In addition, Mr. Wiley also serves as a Director of Post Oak Bank (privately-held bank, 2004-present). Previously, Mr. Wiley served as a member of the Board of Trustees of the University of Tulsa (2000-2006; 2007-2010), as a Senior Energy Advisor of Katzenbach Partners, LLC (consulting, 2006-2007), as an Advisory Director of Riverstone Holdings (private investment), Chairman, President, and CEO of Baker Hughes, Inc. (oilfield services, 2000-2004), and as Director of Spinnaker Exploration Company (exploration and production, 2001-2005). |
+ The information above includes each Trustee's principal occupation during the last five years and other information relating to the experience, attributes, and skills relevant to each Trustee's qualifications to serve as a Trustee, which led to the conclusion that each Trustee should serve as a Trustee for the fund.
Advisory Board Members and Executive Officers:
Correspondence intended for each executive officer, Edward C. Johnson 3d, and Peter S. Lynch may be sent to Fidelity Investments, 82 Devonshire Street, Boston, Massachusetts 02109.
Name, Age; Principal Occupation |
Edward C. Johnson 3d (80) |
| Year of Election or Appointment: 2011 Member of the Advisory Board of Fidelity's Equity and High Income Funds. Formerly Trustee and Chairman of the Board of Trustees of certain Trusts, Mr. Johnson serves as Chief Executive Officer, Chairman, and a Director of FMR LLC; Chairman and a Director of FMR; and Chairman and a Director of FMR Co., Inc. In addition, Mr. Johnson serves as Chairman and Director of FIL Limited. Previously, Mr. Johnson served as President of FMR LLC (2006-2007). |
Peter S. Lynch (66) |
| Year of Election or Appointment: 2003 Member of the Advisory Board of Fidelity's Equity and High Income Funds. Mr. Lynch is Vice Chairman and a Director of FMR and FMR Co., Inc. In addition, Mr. Lynch serves as a Trustee of Boston College and as the Chairman of the Inner-City Scholarship Fund. Previously, Mr. Lynch served on the Special Olympics International Board of Directors (1997-2006). |
Kenneth B. Robins (41) |
| Year of Election or Appointment: 2008 President and Treasurer of Fidelity's Equity and High Income Funds. Mr. Robins also serves as President and Treasurer (2010-present) and Assistant Treasurer (2009-present) of other Fidelity funds and is an employee of Fidelity Investments (2004-present). Previously, Mr. Robins served as Deputy Treasurer of the Fidelity funds (2005-2008) and Treasurer and Chief Financial Officer of The North Carolina Capital Management Trust: Cash and Term Portfolios (2006-2008). |
Brian B. Hogan (46) |
| Year of Election or Appointment: 2009 Vice President of certain Equity Funds and Vice President of Sector Funds. Mr. Hogan also serves as President of FMR's Equity Division (2009-present). Previously, Mr. Hogan served as Senior Vice President, Equity Research of FMR (2006-2009) and as a portfolio manager. |
Christopher S. Bartel (39) |
| Year of Election or Appointment: 2009 Vice President of Fidelity's Sector and Real Estate Equity Funds. Mr. Bartel also serves as Senior Vice President of Equity Research (2009-present). Previously, Mr. Bartel served as Managing Director of Research (2006-2009) and an analyst and portfolio manager (2000-2006). |
Scott C. Goebel (42) |
| Year of Election or Appointment: 2008 Secretary and Chief Legal Officer (CLO) of the Fidelity funds. Mr. Goebel also serves as Secretary and CLO of The North Carolina Capital Management Trust: Cash and Term Portfolio (2008-present); General Counsel, Secretary, and Senior Vice President of FMR (2008-present) and FMR Co., Inc. (2008-present); Deputy General Counsel of FMR LLC; Chief Legal Officer of Fidelity Management & Research (Hong Kong) Limited (2008-present) and Assistant Secretary of Fidelity Management & Research (Japan) Inc. (2008-present), Fidelity Investments Money Management, Inc. (2008-present), Fidelity Management & Research (U.K.) Inc. (2008-present), and Fidelity Research and Analysis Company (2008-present). Previously, Mr. Goebel served as Assistant Secretary of the Funds (2007-2008) and as Vice President and Secretary of Fidelity Distributors Corporation (FDC) (2005-2007). |
William C. Coffey (41) |
| Year of Election or Appointment: 2009 Assistant Secretary of Fidelity's Equity and High Income Funds. Mr. Coffey also serves as Senior Vice President and Deputy General Counsel of FMR LLC (2010-present), and is an employee of Fidelity Investments. Previously, Mr. Coffey served as Vice President and Associate General Counsel of FMR LLC (2005-2009). |
Holly C. Laurent (56) |
| Year of Election or Appointment: 2008 Anti-Money Laundering (AML) Officer of the Fidelity funds. Ms. Laurent also serves as AML Officer of The North Carolina Capital Management Trust: Cash and Term Portfolio (2008-present) and is an employee of Fidelity Investments. Previously, Ms. Laurent was Senior Vice President and Head of Legal for Fidelity Business Services India Pvt. Ltd. (2006-2008), and Senior Vice President, Deputy General Counsel and Group Head for FMR LLC (2005-2006). |
Christine Reynolds (52) |
| Year of Election or Appointment: 2008 Chief Financial Officer of the Fidelity funds. Ms. Reynolds became President of Fidelity Pricing and Cash Management Services (FPCMS) in August 2008. Ms. Reynolds served as Chief Operating Officer of FPCMS (2007-2008). Previously, Ms. Reynolds served as President, Treasurer, and Anti-Money Laundering officer of the Fidelity funds (2004-2007). |
Kenneth A. Rathgeber (63) |
| Year of Election or Appointment: 2004 Chief Compliance Officer of Fidelity's Equity and High Income Funds. Mr. Rathgeber is Chief Compliance Officer of Fidelity Management & Research (Hong Kong) Limited (2008-present), Fidelity Management & Research (Japan) Inc. (2008-present), FMR (2005-present), FMR Co., Inc. (2005-present), Fidelity Management & Research (U.K.) Inc. (2005-present), Fidelity Research & Analysis Company (2005-present), Fidelity Investments Money Management, Inc. (2005-present), Pyramis Global Advisors, LLC (2005-present), and Strategic Advisers, Inc. (2005-present). |
Jeffrey S. Christian (49) |
| Year of Election or Appointment: 2009 Deputy Treasurer of the Fidelity funds. Mr. Christian is an employee of Fidelity Investments. Previously, Mr. Christian served as Chief Financial Officer (2008-2009) of certain Fidelity funds and Senior Vice President of Fidelity Pricing and Cash Management Services (FPCMS) (2004-2009). |
Bryan A. Mehrmann (49) |
| Year of Election or Appointment: 2005 Deputy Treasurer of the Fidelity funds. Mr. Mehrmann is an employee of Fidelity Investments. |
Adrien E. Deberghes (43) |
| Year of Election or Appointment: 2008 Deputy Treasurer of Fidelity's Equity and High Income Funds. Mr. Deberghes also serves as Assistant Treasurer of other Fidelity funds (2010-present) and is an employee of Fidelity Investments (2008-present). Previously, Mr. Deberghes served as Senior Vice President of Mutual Fund Administration at State Street Corporation (2007-2008), Senior Director of Mutual Fund Administration at Investors Bank & Trust (2005-2007), and Director of Finance for Dunkin' Brands (2000-2005). |
Stephanie J. Dorsey (41) |
| Year of Election or Appointment: 2010 Assistant Treasurer of Fidelity's Equity and High Income Funds. Ms. Dorsey also serves as Deputy Treasurer of other Fidelity funds (2008-present) and is an employee of Fidelity Investments (2008-present). Previously, Ms. Dorsey served as Treasurer (2004-2008) of the JPMorgan Mutual Funds and Vice President (2004-2008) of JPMorgan Chase Bank. |
John R. Hebble (52) |
| Year of Election or Appointment: 2009 Assistant Treasurer of Fidelity's Equity and High Income Funds. Mr. Hebble also serves as Treasurer and Chief Financial Officer of The North Carolina Capital Management Trust: Cash and Term Portfolio (2008-present), President and Treasurer of other Fidelity funds (2008-present) and is an employee of Fidelity Investments. |
Gary W. Ryan (52) |
| Year of Election or Appointment: 2005 Assistant Treasurer of the Fidelity funds. Mr. Ryan is an employee of Fidelity Investments. Previously, Mr. Ryan served as Vice President of Fund Reporting in Fidelity Pricing and Cash Management Services (FPCMS) (1999-2005). |
Jonathan Davis (42) |
| Year of Election or Appointment: 2010 Assistant Treasurer of the Fidelity funds. Mr. Davis is an employee of Fidelity Investments. Previously, Mr. Davis served as Vice President and Associate General Counsel of FMR LLC (2003-2010). |
Annual Report
Initial Class and Investor Class designate 100% of the dividends distributed in December 2010, as qualifying for the dividends-received deduction for corporate shareholders.
Annual Report
Board Approval of Investment Advisory Contracts and Management Fees
VIP Health Care Portfolio
Each year, the Board of Trustees, including the Independent Trustees (together, the Board), votes on the renewal of the management contract and sub-advisory agreements (together, the Advisory Contracts) for the fund. The Board, assisted by the advice of fund counsel and Independent Trustees' counsel, requests and considers a broad range of information relevant to the renewal of the Advisory Contracts throughout the year.
The Board meets regularly and considers at each of its meetings factors that are relevant to its annual consideration of the renewal of the fund's Advisory Contracts, including the services and support provided to the fund and its shareholders. The Board has established various standing committees, each composed of Independent Trustees with varying backgrounds, to which the Board has assigned specific subject matter responsibilities in order to enhance effective decision-making by the Board. The Board, acting directly and through its Committees, requests and receives information concerning the annual consideration of the renewal of the fund's Advisory Contracts. The Board also meets as needed to consider matters specifically related to the Board's annual consideration of the renewal of Advisory Contracts. Members of the Board may also meet with trustees of other Fidelity funds through ad hoc joint committees to discuss certain matters relevant to the Fidelity funds.
At its July 2010 meeting, the Board of Trustees, including the Independent Trustees, unanimously determined to renew the fund's Advisory Contracts. In reaching its determination, the Board considered all factors it believed relevant, including (i) the nature, extent, and quality of the services to be provided to the fund and its shareholders (including the investment performance of the fund); (ii) the competitiveness of the fund's management fee and total expenses; (iii) the total costs of the services to be provided by and the profits to be realized by Fidelity from its relationship with the fund; (iv) the extent to which economies of scale would be realized as the fund grows; and (v) whether fee levels reflect these economies of scale, if any, for the benefit of fund shareholders.
In considering whether to renew the Advisory Contracts for the fund, the Board reached a determination, with the assistance of fund counsel and Independent Trustees' counsel and through the exercise of its business judgment, that the renewal of the Advisory Contracts is in the best interests of fund shareholders and that the compensation to be received by Fidelity under the management contract is fair and reasonable. The Board's decision to renew the Advisory Contracts was not based on any single factor noted above, but rather was based on a comprehensive consideration of all the information provided to the Board at its meetings throughout the year. The Board, in reaching its determination to renew the Advisory Contracts, is aware that shareholders in the fund have a broad range of investment choices available to them, including a wide choice among mutual funds offered by Fidelity's competitors, and that the fund's shareholders, with the opportunity to review and weigh the disclosure provided by the fund in its prospectus and other public disclosures, have chosen to invest in this fund, managed by Fidelity.
Nature, Extent, and Quality of Services Provided. The Board considered the staffing within the investment adviser, FMR, and the sub-advisers (together, the Investment Advisers), including the backgrounds of the fund's investment personnel and the fund's investment objective and discipline. The Independent Trustees also had discussions with senior management of Fidelity's investment operations and investment groups. The Board considered the structure of the portfolio manager compensation program and whether this structure provides appropriate incentives to act in the best interest of the fund.
Resources Dedicated to Investment Management and Support Services. The Board and the equity research subcommittee of the Board's Fund Oversight Committee reviewed the size, education, and experience of the Investment Advisers' investment staff, their use of technology, and the Investment Advisers' approach to recruiting, training, and retaining portfolio managers and other research, advisory, and management personnel. The Board noted that Fidelity's analysts have access to a variety of technological tools and market and securities data that enable them to perform both fundamental and quantitative analysis and to specialize in various disciplines. The Board considered Fidelity's extensive global research capabilities that enable the Investment Advisers to aggregate data from various sources in an effort to produce positive investment results. The Board also considered that Fidelity's portfolio managers and analysts have access to daily portfolio attribution that allows for monitoring of a fund's portfolio, as well as an electronic communication system that provides immediate real-time access to research concerning issuers and credit enhancers. The Board noted FMR's continued focus on strengthening the organization and discipline of equity portfolio management and research.
Shareholder and Administrative Services. The Board considered (i) the nature, extent, quality, and cost of advisory, administrative, and shareholder services performed by the Investment Advisers and their affiliates under the Advisory Contracts and under separate agreements covering transfer agency, pricing and bookkeeping, and securities lending services for the fund; (ii) the nature and extent of the investment adviser's supervision of third party service providers, principally custodians and subcustodians; and (iii) the resources devoted to, and the record of compliance with, the fund's compliance policies and procedures. The Board also reviewed the allocation of fund brokerage, including allocations to brokers affiliated with the Investment Advisers, the use of brokerage commissions to pay fund expenses, and the use of "soft" commission dollars to pay for research services.
The Board noted that the growth of fund assets over time across the complex allows Fidelity to reinvest in the development of services designed to enhance the value or convenience of the Fidelity funds as investment vehicles. These services include 24-hour access to account information and market information through phone representatives and over the Internet, and investor education materials and asset allocation tools.
Investment in a Large Fund Family. The Board considered the benefits to shareholders of investing in a Fidelity fund, including the benefits of investing in a fund that is part of a large family of funds offering a variety of investment disciplines and providing a large variety of mutual fund investor services. The Board noted that Fidelity had taken, or had made recommendations that resulted in the Fidelity funds taking, a number of actions over the previous year that benefited particular funds, including (i) dedicating additional resources to investment research and restructuring and broadening the focus of the investment research teams; (ii) bolstering the senior management team that oversees asset management; (iii) launching Class F of certain funds as a lower-fee class available to Freedom K and Freedom Index Funds; (iv) lowering the initial investment minimums and ongoing balance requirements for Real Estate High Income Fund; (v) eliminating subsequent purchase minimums for all funds and adding a waiver of the investment minimum requirement for new accounts opened with the proceeds of a systematic withdrawal plan; (vi) eliminating the withdrawal minimum and maximum limits for systematic withdrawals from Advisor funds; (vii) expanding sales load waivers on Class A shares for Destiny Planholders and expanding Institutional Class eligibility for Class O Destiny Planholders; and (viii) changing certain Class A and Class T sales charge structures to further align them with industry practices.
Annual Report
Investment Performance. The Board considered whether the fund has operated in accordance with its investment objective, as well as its record of compliance with its investment restrictions. It also reviewed the fund's absolute investment performance for each class, as well as the fund's relative investment performance for each class measured over multiple periods against a third-party-sponsored index that reflects the market sector in which the fund invests. The Board noted that FMR does not believe that a meaningful peer group exists against which to compare the fund's performance. The following charts considered by the Board show, over the one-, three-, and five-year periods ended December 31, 2009, as available, the cumulative total returns of Initial Class and Investor Class of the fund and the cumulative total returns of a third-party-sponsored index ("benchmark").
VIP Health Care Portfolio
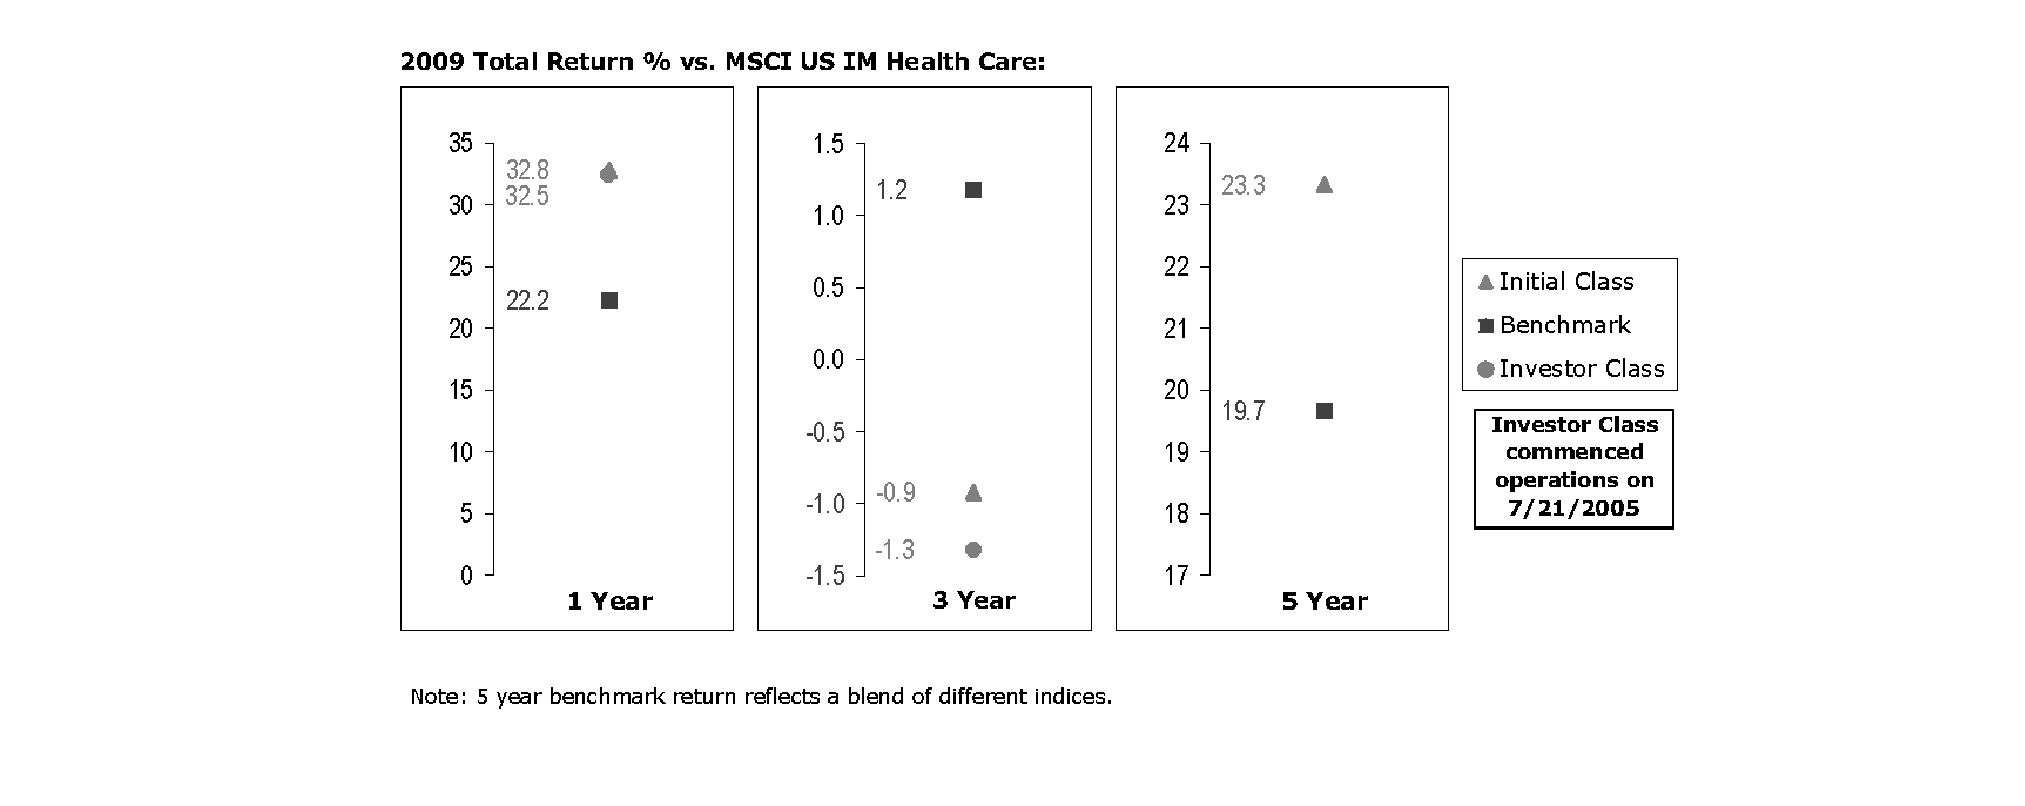
The Board noted that the investment performance of Initial Class of the fund compared favorably to its benchmark for the one- and five-year periods, although the fund's three-year cumulative total return was lower than its benchmark. The Board considered that the variations in performance between the fund's classes reflect the variations in class expenses, which result in lower performance for the higher expense class. The Board also reviewed the fund's performance since inception as well as performance in the current year.
Based on its review, and giving particular weight to the nature and quality of the resources dedicated by the Investment Advisers to maintain and improve relative performance and factoring in the unprecedented market events in recent years, the Board concluded that the nature, extent, and quality of investment management and support services and of shareholder and administrative services provided to the fund will benefit the fund's shareholders, particularly in light of the Board's view that the fund's shareholders benefit from investing in a fund that is part of a large family of funds offering a variety of investment disciplines and services.
Competitiveness of Management Fee and Total Fund Expenses. The Board considered the fund's management fee and total expenses compared to "mapped groups" of competitive funds and classes. Fidelity creates "mapped groups" by combining similar Lipper investment objective categories that have comparable management fee characteristics. Combining Lipper investment objective categories aids the Board's management fee and total expense comparisons by broadening the competitive group used for comparison and by reducing the number of universes to which various Fidelity funds are compared.
Management Fee. The Board considered two proprietary management fee comparisons for the 12-month periods shown in the chart below. The group of Lipper funds used by the Board for management fee comparisons is referred to below as the "Total Mapped Group." The Total Mapped Group comparison focuses on a fund's standing relative to the total universe of comparable funds available to investors, in terms of gross management fees before expense reimbursements or caps. "TMG %" represents the percentage of funds in the Total Mapped Group that had management fees that were lower than the fund's. For example, a TMG % of 3% means that 97% of the funds in the Total Mapped Group had higher management fees than the fund. The "Asset-Size Peer Group" (ASPG) comparison focuses on a fund's standing relative to non-Fidelity funds similar in size to the fund within the Total Mapped Group. The ASPG represents at least 15% of the funds in the Total Mapped Group with comparable asset size and management fee characteristics, subject to a minimum of 50 funds (or all funds in the Total Mapped Group if fewer than 50). Additional information, such as the ASPG quartile in which the fund's management fee ranked, is also included in the chart and considered by the Board.
Annual Report
Board Approval of Investment Advisory Contracts and Management Fees - continued
VIP Health Care Portfolio
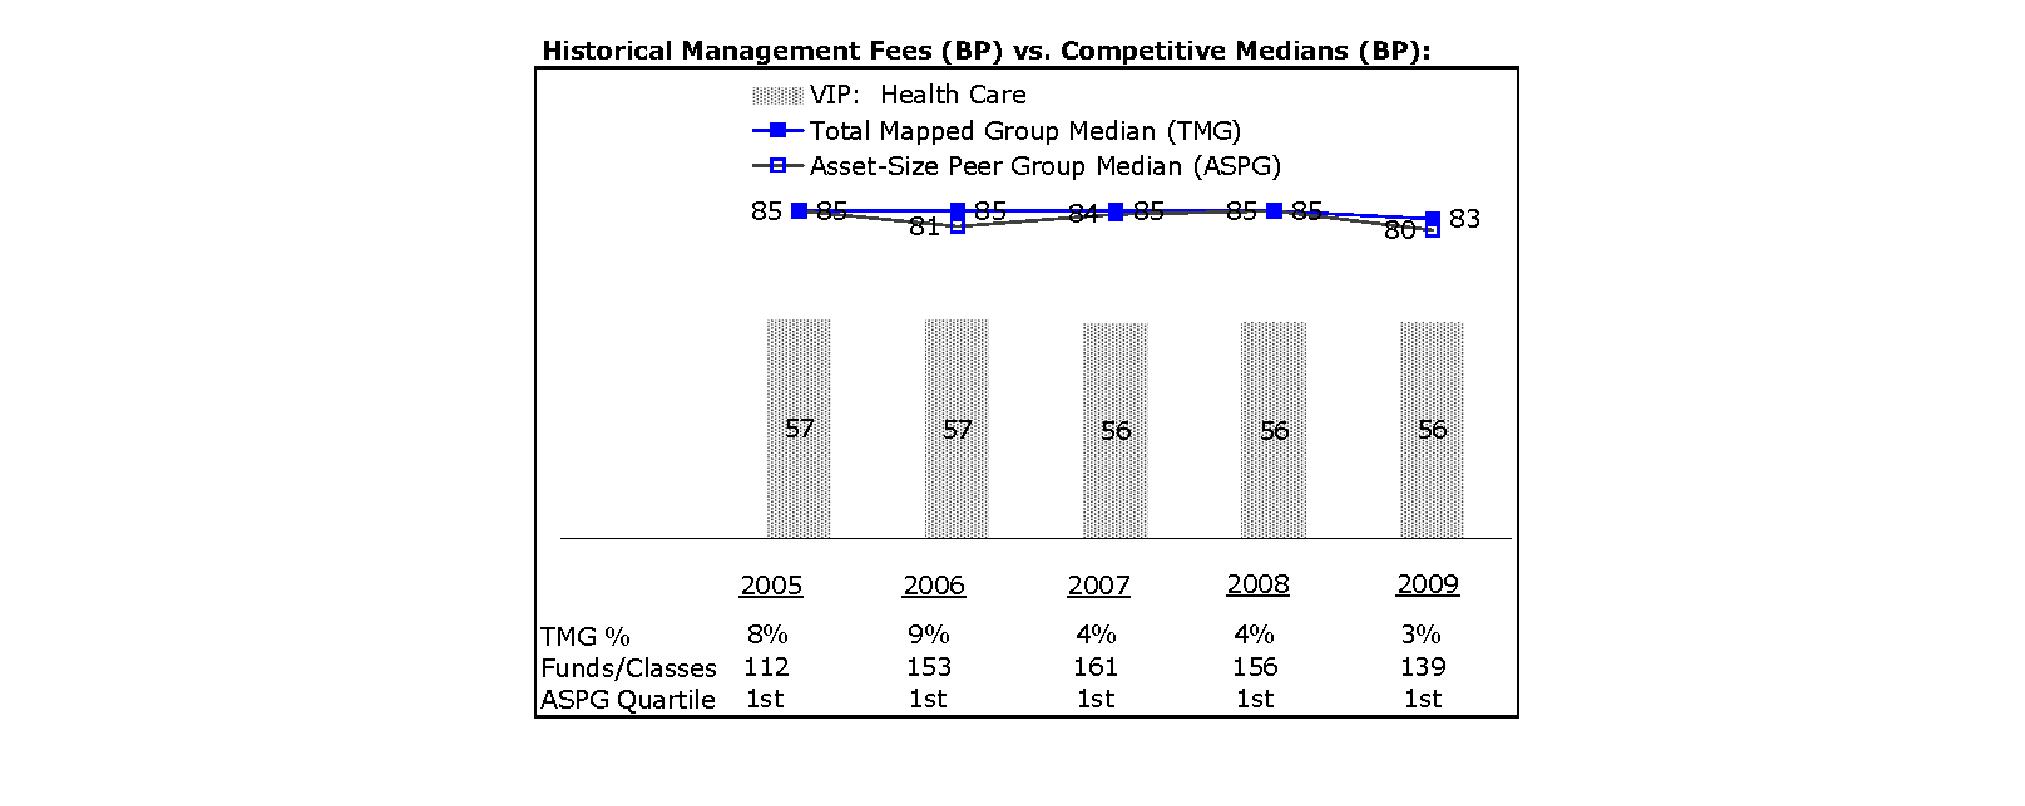
The Board noted that the fund's management fee ranked below the median of its Total Mapped Group and below the median of its ASPG for 2009.
Based on its review, the Board concluded that the fund's management fee is fair and reasonable in light of the services that the fund receives and the other factors considered.
Total Expenses. In its review of each class's total expenses, the Board considered the fund's management fee as well as other fund or class expenses, as applicable, such as transfer agent fees, pricing and bookkeeping fees, and custodial, legal, and audit fees. The Board also noted the effects of any waivers and reimbursements on fees and expenses. As part of its review, the Board also considered current and historical total expenses of each class of the fund compared to competitive fund median expenses. Each class of the fund is compared to those funds and classes in the Total Mapped Group (used by the Board for management fee comparisons) that have a similar sales load structure.
The Board noted that the total expenses of each class ranked below its competitive median for 2009.
Fees Charged to Other Fidelity Clients. The Board also considered Fidelity fee structures and other information with respect to clients of FMR and its affiliates, such as other mutual funds advised or subadvised by FMR or its affiliates, pension plan clients, and other institutional clients. In March 2010, the Board created an ad hoc joint committee with the board of other Fidelity funds (the Committee) to review and compare Fidelity's institutional investment advisory business with its business of providing services to the Fidelity funds, including the differences in services provided, fees charged, and costs incurred, as well as competition in their respective marketplaces.
Based on its review of total expenses and fees charged to other Fidelity clients, the Board concluded that the total expenses of each class of the fund were reasonable in light of the services that the fund and its shareholders receive and the other factors considered, including the findings of the Committee.
Costs of the Services and Profitability. The Board considered the revenues earned and the expenses incurred by Fidelity in conducting the business of developing, marketing, distributing, managing, administering and servicing the fund and its shareholders. The Board also considered the level of Fidelity's profits in respect of all the Fidelity funds.
On an annual basis, FMR presents to the Board Fidelity's profitability for the fund. Fidelity calculates the profitability for each fund, as well as aggregate profitability for groups of Fidelity funds and all Fidelity funds, using a series of detailed revenue and cost allocation methodologies which originate with the audited books and records of Fidelity. The Audit Committee of the Board reviews any significant changes from the prior year's methodologies.
Annual Report
PricewaterhouseCoopers LLP (PwC), independent registered public accounting firm and auditor to Fidelity and certain Fidelity funds, has been engaged annually by the Board as part of the Board's assessment of Fidelity's profitability analysis. PwC's engagement includes the review and assessment of Fidelity's methodologies used in determining the revenues and expenses attributable to Fidelity's mutual fund business, and completion of agreed-upon procedures surrounding the mathematical accuracy of fund profitability and its conformity to allocation methodologies. After considering PwC's reports issued under the engagement and information provided by Fidelity, the Board believes that while other allocation methods may also be reasonable, Fidelity's profitability methodologies are reasonable in all material respects.
The Board has also reviewed Fidelity's non-fund businesses and fall-out benefits related to the mutual fund business as well as cases where Fidelity's affiliates may benefit from or be related to the fund's business.
The Board considered the costs of the services provided by and the profits realized by Fidelity in connection with the operation of the fund and were satisfied that the profitability was not excessive in the circumstances.
Economies of Scale. The Board considered whether there have been economies of scale in respect of the management of the Fidelity funds, whether the Fidelity funds (including the fund) have appropriately benefited from any such economies of scale, and whether there is potential for realization of any further economies of scale. The Board considered the extent to which the fund will benefit from economies of scale through increased services to the fund, through waivers or reimbursements, or through fee or expense reductions.
In February 2009, the Board and the board of other Fidelity funds created an ad hoc committee (the Economies of Scale Committee) to analyze whether FMR attains economies of scale in respect of the management and servicing of the Fidelity funds, whether the Fidelity funds have appropriately benefited from such economies of scale, and whether there is potential for realization of any further economies of scale.
The Board recognized that the fund's management contract incorporates a "group fee" structure, which provides for lower group fee rates as total fund assets under FMR's management increase, and for higher group fee rates as total fund assets under FMR's management decrease. FMR calculates the group fee rates based on a tiered asset "breakpoint" schedule that varies based on asset class. The Board considered that the group fee is designed to deliver the benefits of economies of scale to fund shareholders when total Fidelity fund assets increase, even if assets of any particular fund are unchanged or have declined, because some portion of Fidelity's costs are attributable to services provided to all Fidelity funds, and all funds benefit if those costs can be allocated among more assets. The Board concluded that, given the group fee structure, fund shareholders will benefit from lower management fees as assets under FMR's management increase at the fund complex level, regardless of whether Fidelity achieves any such economies of scale.
The Board concluded, considering the findings of the Economies of Scale Committee, that any potential economies of scale are being appropriately shared between fund shareholders and Fidelity.
Additional Information Requested by the Board. In order to develop fully the factual basis for consideration of the Fidelity funds' Advisory Contracts, the Board requested and received additional information on certain topics, including (i) fund performance trends, actions to be taken by FMR to improve certain funds' overall performance, and Fidelity's long-term strategies for certain funds; (ii) portfolio manager changes that have occurred during the past year and length of portfolio manager tenure for different categories of funds over time; (iii) Fidelity's compensation structure for portfolio managers, research analysts, and other key personnel, the rationale for the compensation structure, and how the compensation structure provides appropriate performance incentives; (iv) the amount of the investment that each portfolio manager has made in the Fidelity fund(s) that he or she manages; (v) management and other fees paid by FMR to affiliated sub-advisers on behalf of the Fidelity funds; (vi) Fidelity's fee structures and rationale for recommending different fees among different categories of funds; (vii) Fidelity's rationale for recommending which funds should have a performance adjustment component as part of their management fees; (viii) the rationale for any differences between fund fee structures and fee structures in place for other Fidelity clients; and (ix) explanations regarding the relative total expenses borne by certain funds and classes, total expense competitive trends, and actions that might be taken by FMR to reduce total expenses for certain funds and classes.
Based on its evaluation of all of the conclusions noted above, and after considering all factors it believed relevant, the Board ultimately concluded that the advisory fee structures are fair and reasonable, and that the fund's Advisory Contracts should be renewed.
Annual Report
Investment Adviser
Fidelity Management & Research Company
Boston, MA
Investment Sub-Advisers
FMR Co., Inc.
Fidelity Management & Research (U.K.) Inc.
Fidelity Management & Research (Hong Kong) Limited
Fidelity Management & Research (Japan) Inc.
General Distributor
Fidelity Distributors Corporation
Boston, MA
Transfer and Service Agents
Fidelity Investments Institutional Operations Company, Inc.
Boston, MA
Fidelity Service Company, Inc.
Boston, MA
Custodian
JPMorgan Chase Bank
New York, NY
VHCIC-ANN-0211
1.817373.105
Fidelity® Variable Insurance Products:
Industrials Portfolio
Annual Report
December 31, 2010
(2_fidelity_logos) (Registered_Trademark)
Contents
Performance | <Click Here> | How the fund has done over time. |
Management's Discussion of Fund Performance | <Click Here> | The Portfolio Manager's review of fund performance and strategy. |
Shareholder Expense Example | <Click Here> | An example of shareholder expenses. |
Investment Changes | <Click Here> | A summary of major shifts in the fund's investments over the past six months. |
Investments | <Click Here> | A complete list of the fund's investments with their market values. |
Financial Statements | <Click Here> | Statements of assets and liabilities, operations, and changes in net assets, as well as financial highlights. |
Notes | <Click Here> | Notes to the financial statements. |
Report of Independent Registered Public Accounting Firm | <Click Here> | |
Trustees and Officers | <Click Here> | |
Distributions | <Click Here> | |
Board Approval of Investment Advisory Contracts and Management Fees | <Click Here> | |
To view a fund's proxy voting guidelines and proxy voting record for the 12-month period ended June 30, visit http://www.fidelity.com/proxyvotingresults or visit the Securities and Exchange Commission's (SEC) web site at http://www.sec.gov. You may also call 1-877-208-0098 to request a free copy of the proxy voting guidelines.
Fidelity Variable Insurance Products are separate account options which are purchased through a variable insurance contract.
Standard & Poor's, S&P and S&P 500 are registered service marks of The McGraw-Hill Companies, Inc. and have been licensed for use by Fidelity Distributors Corporation.
Other third party marks appearing herein are the property of their respective owners.
All other marks appearing herein are registered or unregistered trademarks or service marks of FMR LLC or an affiliated company.
The general research services agreement with Fidelity Research & Analysis Company has been terminated and is no longer in effect for the fund.
This report and the financial statements contained herein are submitted for the general information of the shareholders of the fund. This report is not authorized for distribution to prospective investors in the fund unless preceded or accompanied by an effective prospectus.
A fund files its complete schedule of portfolio holdings with the SEC for the first and third quarters of each fiscal year on Form N-Q. Forms N-Q are available on the SEC's web site at http://www.sec.gov. A fund's Forms N-Q may be reviewed and copied at the SEC's Public Reference Room in Washington, DC. Information regarding the operation of the SEC's Public Reference Room may be obtained by calling 1-800-SEC-0330. For a complete list of the fund's portfolio holdings, view the most recent holdings listing, semiannual report, or annual report on Fidelity's web site at http://www.fidelity.com, http://www.advisor.fidelity.com, or http://www.401k.com, as applicable.
NOT FDIC INSURED • MAY LOSE VALUE • NO BANK GUARANTEE
Neither the fund nor Fidelity Distributors Corporation is a bank.
Annual Report
Average annual total return reflects the change in the value of an investment, assuming reinvestment of the class' distributions from dividend income and capital gains (the profits earned upon the sale of securities that have grown in value, if any) and assuming a constant rate of performance each year. During periods of reimbursement by Fidelity, a fund's total return will be greater than it would be had the reimbursement not occurred. Performance numbers are net of all underlying fund operating expenses, but do not include any insurance charges imposed by your insurance company's separate account. If performance information included the effect of these additional charges, the total returns would have been lower. How a fund did yesterday is no guarantee of how it will do tomorrow.
Average Annual Total Returns
Periods ended December 31, 2010 | Past 1
year | Past 5
years | Life of fund A |
VIP Industrials Portfolio - Initial Class B | 31.09% | 8.63% | 9.56% |
VIP Industrials Portfolio - Investor Class B,C | 30.96% | 8.50% | 9.49% |
A From July 18, 2001.
B Prior to October 1, 2006, VIP Industrials Portfolio operated under certain different investment policies. The historical performance for the fund may not represent its current investment policies.
C The initial offering of Investor Class shares took place on July 21, 2005. Returns prior to July 21, 2005, are those of Initial Class. Had Investor Class's transfer agent fee been reflected, returns prior to July 21, 2005 would have been lower.
$10,000 Over Life of Fund
Let's say hypothetically that $10,000 was invested in VIP Industrials Portfolio - Initial Class on July 18, 2001, when the fund started. The chart shows how the value of your investment would have changed, and also shows how the S&P 500® Index performed over the same period.
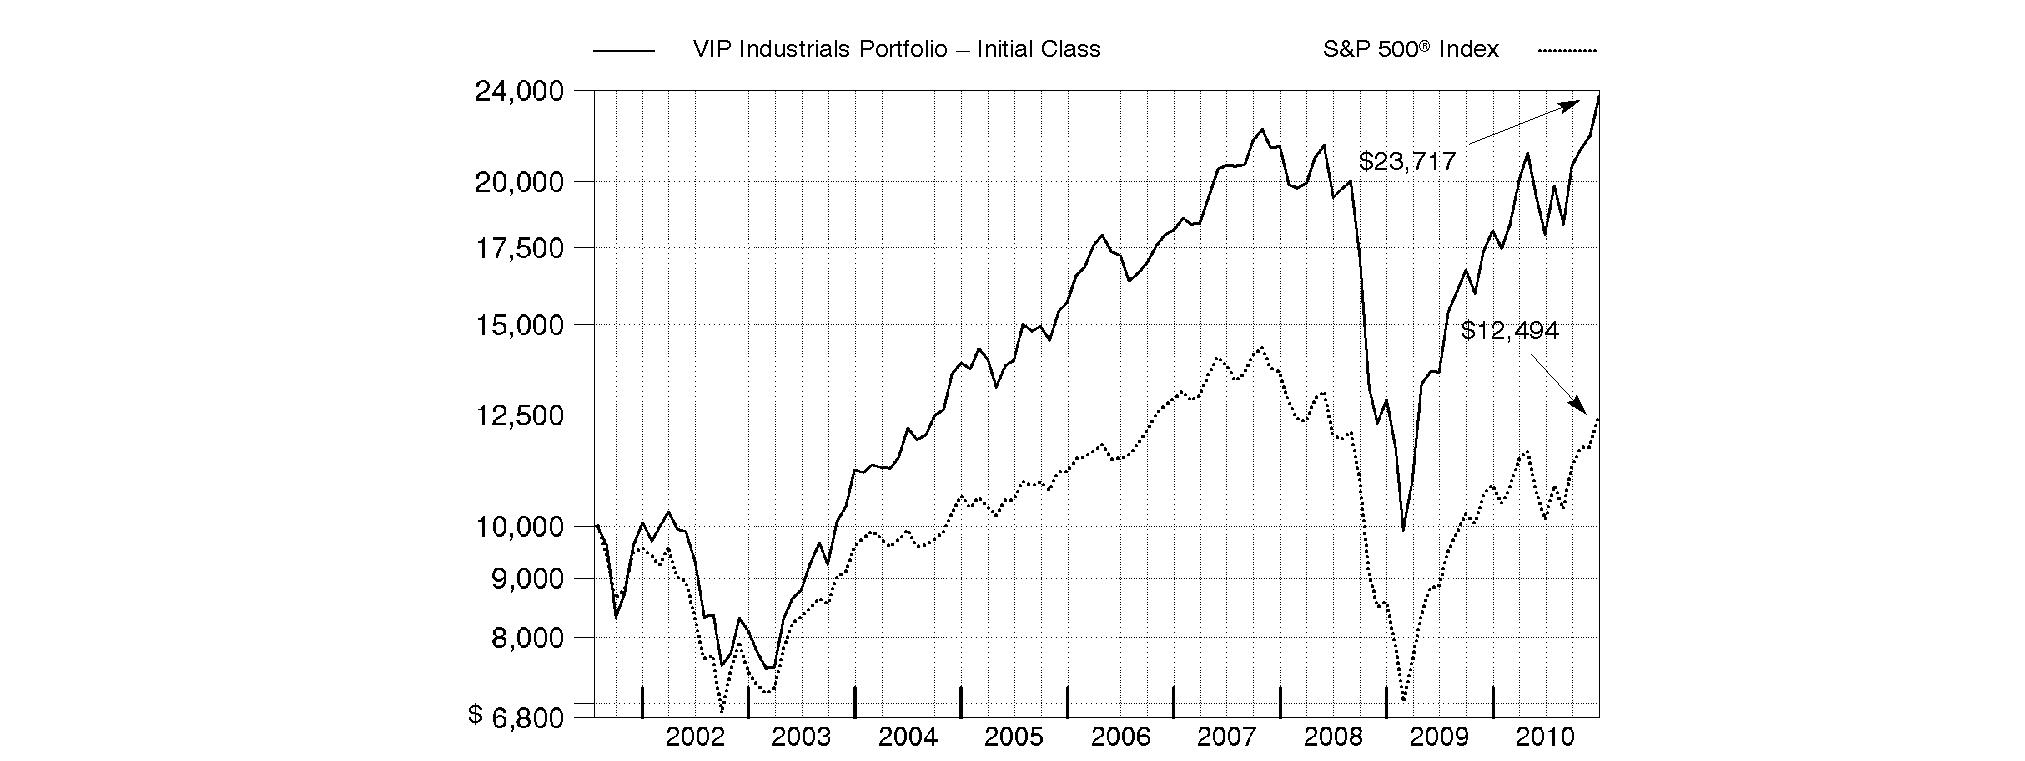
Annual Report
Market Recap: While market improvements around the world hit a speed bump in the first half of the 12-month period ending December 31, 2010, world economies re-accelerated in August, supported by a broadening recovery and low inflation in the U.S. Domestic stock markets recorded solid gains for the year, lifted by a strong second-half rally fueled by economic optimism, encouraging earnings reports and a wave of corporate mergers. The large-cap S&P 500® Index rose 15.06%, the blue-chip-laden Dow Jones Industrial AverageSM added 14.06% and the technology-heavy Nasdaq Composite® Index climbed 18.02%. Meanwhile, international stocks, as represented by the MSCI® ACWI® (All Country World Index) ex USA Index, gained 11.29%, boosted in part by a depreciating U.S. dollar. In the fixed-income arena, U.S. taxable investment-grade bonds generated positive results during 2010, as the Barclays Capital® U.S. Aggregate Bond Index gained 6.54%. With ultra-low interest rates bolstering nearly all fixed-income securities for most of the year, sectors in the index with higher yields and more credit risk generally fared best, while most high-quality bonds generated more-moderate returns. Meanwhile, high-yield bonds, as represented by The BofA Merrill LynchSM US High Yield Constrained Index, returned 15.07%, a result of improved economic data and strengthening investor demand. Overseas, foreign bond markets showed mixed results, with a sizable disparity between the 3.97% return of the Citigroup® Non-U.S. Group of 7 Index - which measures the performance of sovereign debt of the major global economies outside the U.S. - and the 12.04% advance of the JPMorgan Emerging Markets Bond Index Global (EMBI Global), which benefited from the rising overall credit quality of emerging-markets debt issuers.
Comments from Tobias Welo, Portfolio Manager of VIP Industrials Portfolio: During the past year, the fund's share classes outperformed a strong industrials sector, as reflected in the 27.40% return of the MSCI® U.S. IM Industrials 25/50 Index - which was adopted in January 2010 as a better representation of the fund's investment universe - and also handily beat the S&P 500®. (For specific portfolio results, please refer to the performance section of this report.) Stock picking in aerospace and defense, where I tilted the fund's exposure in favor of commercial aerospace firms and away from defense companies, gave the fund's relative performance the biggest boost. Stock selection and an overweighting in the extremely strong-performing construction/farm machinery/heavy trucks segment also aided performance, as did rewarding picks in trading companies/distributors. Heavy-truck engine maker Cummins was the top contributor by a wide margin, as our position delivered a gain of more than 143%. The truck replacement cycle I had foreseen based on aging fleets and tighter environmental standards began to play out as I expected. Additionally, the company's other core business in standby power grew rapidly, due in part to robust demand from emerging markets. Other contributors include Rush Enterprises, a dealer in medium and heavy trucks, as well as underweighted exposure to weak-performing index components Lockheed Martin and Boeing - - both aerospace/defense firms that I sold. Conversely, weak security selection and a modest underweighting in industrial conglomerates weighed on our results, as did my picks in electrical components/equipment and building products. The fund's largest relative detractor was conglomerate and major index component General Electric. Carrying an underweighted exposure to the stock earlier in 2010, when it enjoyed a strong run, undermined performance. Other detractors included Chinese holding SmartHeat, which sells clean technology plate heat exchangers (PHEs) and related systems, and building products supplier Masco, which struggled amid continued weakness in the U.S. residential and commercial construction markets. Masco was sold from the fund by period end.
The views expressed above reflect those of the portfolio manager(s) only through the end of the period as stated on the cover of this report and do not necessarily represent the views of Fidelity or any other person in the Fidelity organization. Any such views are subject to change at any time based upon market or other conditions and Fidelity disclaims any responsibility to update such views. These views may not be relied on as investment advice and, because investment decisions for a Fidelity fund are based on numerous factors, may not be relied on as an indication of trading intent on behalf of any Fidelity fund.
Annual Report
As a shareholder of the Fund, you incur two types of costs: (1) transaction costs, including redemption fees, and (2) ongoing costs, including management fees and other Fund expenses. This Example is intended to help you understand your ongoing costs (in dollars) of investing in the Fund and to compare these costs with the ongoing costs of investing in other mutual funds.
The Example is based on an investment of $1,000 invested at the beginning of the period and held for the entire period (July 1, 2010 to December 31, 2010).
Actual Expenses
The first line of the accompanying table for each class of the Fund provides information about actual account values and actual expenses. You may use the information in this line, together with the amount you invested, to estimate the expenses that you paid over the period. Simply divide your account value by $1,000.00 (for example, an $8,600 account value divided by $1,000.00 = 8.6), then multiply the result by the number in the first line for a class of the Fund under the heading entitled "Expenses Paid During Period" to estimate the expenses you paid on your account during this period. The estimate of expenses does not include any fees or other expenses of any variable annuity or variable life insurance product. If they were, the estimate of expenses you paid during the period would be higher, and your ending account value would be lower. In addition, the Fund, as a shareholder in the underlying Fidelity Central Funds, will indirectly bear its pro-rata share of the fees and expenses incurred by the underlying Fidelity Central Funds. These fees and expenses are not included in the Fund's annualized expense ratio used to calculate the expense estimate in the table below.
Hypothetical Example for Comparison Purposes
The second line of the accompanying table for each class of the Fund provides information about hypothetical account values and hypothetical expenses based on a Class' actual expense ratio and an assumed rate of return of 5% per year before expenses, which is not the Class' actual return. The hypothetical account values and expenses may not be used to estimate the actual ending account balance or expenses you paid for the period. You may use this information to compare the ongoing costs of investing in the Fund and other funds. To do so, compare this 5% hypothetical example with the 5% hypothetical examples that appear in the shareholder reports of the other funds. The estimate of expenses does not include any fees or other expenses of any variable annuity or variable life insurance product. If they were, the estimate of expenses you paid during the period would be higher, and your ending account value would be lower. In addition, the Fund, as a shareholder in the underlying Fidelity Central Funds, will indirectly bear its pro-rata share of the fees and expenses incurred by the underlying Fidelity Central Funds. These fees and expenses are not included in the Fund's annualized expense ratio used to calculate the expense estimate in the table below.
Please note that the expenses shown in the table are meant to highlight your ongoing costs only and do not reflect any transaction costs. Therefore, the second line of the table is useful in comparing ongoing costs only, and will not help you determine the relative total costs of owning different funds. In addition, if these transactional costs were included, your costs would have been higher.
| Annualized
Expense Ratio | Beginning
Account Value
July 1, 2010 | Ending
Account Value
December 31, 2010 | Expenses Paid
During Period*
July 1, 2010
to December 31, 2010 |
Initial Class | .74% | | | |
Actual | | $ 1,000.00 | $ 1,318.90 | $ 4.33 |
HypotheticalA | | $ 1,000.00 | $ 1,021.48 | $ 3.77 |
Investor Class | .83% | | | |
Actual | | $ 1,000.00 | $ 1,318.70 | $ 4.85 |
HypotheticalA | | $ 1,000.00 | $ 1,021.02 | $ 4.23 |
A 5% return per year before expenses
* Expenses are equal to each Class' annualized expense ratio, multiplied by the average account value over the period, multiplied by 184/365 (to reflect the one-half year period).
Annual Report
Investment Changes (Unaudited)
Top Ten Stocks as of December 31, 2010 |
| % of fund's
net assets | % of fund's net assets
6 months ago |
General Electric Co. | 13.1 | 13.2 |
United Technologies Corp. | 6.2 | 6.4 |
Caterpillar, Inc. | 4.8 | 4.2 |
3M Co. | 4.2 | 5.3 |
Union Pacific Corp. | 4.0 | 4.3 |
Emerson Electric Co. | 3.4 | 0.0 |
Danaher Corp. | 2.9 | 2.8 |
Honeywell International, Inc. | 2.7 | 3.1 |
Ingersoll-Rand Co. Ltd. | 2.3 | 3.7 |
Cummins, Inc. | 2.2 | 2.2 |
| 45.8 | |
Top Industries (% of fund's net assets) |
As of December 31, 2010 |
| Machinery | 20.8% | |
| Industrial Conglomerates | 19.5% | |
| Aerospace & Defense | 16.6% | |
| Electrical Equipment | 10.4% | |
| Road & Rail | 8.3% | |
| All Others* | 24.4% | |

As of June 30, 2010 |
| Machinery | 25.5% | |
| Industrial Conglomerates | 20.0% | |
| Aerospace & Defense | 18.1% | |
| Road & Rail | 8.2% | |
| Construction & Engineering | 6.6% | |
| All Others* | 21.6% | |

* Includes short-term investments and net other assets. |
Annual Report
Investments December 31, 2010
Showing Percentage of Net Assets
Common Stocks - 98.4% |
| Shares | | Value |
AEROSPACE & DEFENSE - 16.6% |
Aerospace & Defense - 16.6% |
Alliant Techsystems, Inc. | 2,982 | | $ 221,950 |
DigitalGlobe, Inc. (a) | 25,123 | | 796,650 |
Embraer SA sponsored ADR | 1,600 | | 47,040 |
Esterline Technologies Corp. (a) | 9,538 | | 654,211 |
GeoEye, Inc. (a) | 10,005 | | 424,112 |
Goodrich Corp. | 14,300 | | 1,259,401 |
Honeywell International, Inc. | 47,515 | | 2,525,897 |
Precision Castparts Corp. | 14,400 | | 2,004,624 |
Raytheon Co. | 20,961 | | 971,333 |
TransDigm Group, Inc. (a) | 8,779 | | 632,176 |
United Technologies Corp. | 72,856 | | 5,735,224 |
| | 15,272,618 |
AIR FREIGHT & LOGISTICS - 0.7% |
Air Freight & Logistics - 0.7% |
C.H. Robinson Worldwide, Inc. | 8,553 | | 685,865 |
AUTO COMPONENTS - 0.3% |
Auto Parts & Equipment - 0.3% |
Modine Manufacturing Co. (a) | 15,235 | | 236,143 |
AUTOMOBILES - 1.7% |
Automobile Manufacturers - 1.7% |
Fiat SpA | 41,800 | | 862,330 |
General Motors Co. | 18,600 | | 685,596 |
| | 1,547,926 |
BUILDING PRODUCTS - 2.6% |
Building Products - 2.6% |
A.O. Smith Corp. | 18,681 | | 711,372 |
Lennox International, Inc. | 17,200 | | 813,388 |
Owens Corning (a) | 28,000 | | 872,200 |
| | 2,396,960 |
COMMERCIAL SERVICES & SUPPLIES - 3.1% |
Commercial Printing - 0.0% |
Cenveo, Inc. (a) | 4,300 | | 22,962 |
Diversified Support Services - 0.5% |
Iron Mountain, Inc. | 18,119 | | 453,156 |
Environmental & Facility Services - 0.9% |
Republic Services, Inc. | 28,081 | | 838,499 |
Office Services & Supplies - 0.7% |
Interface, Inc. Class A | 20,877 | | 326,725 |
Sykes Enterprises, Inc. (a) | 13,071 | | 264,818 |
| | 591,543 |
Security & Alarm Services - 1.0% |
The Geo Group, Inc. (a) | 38,200 | | 942,012 |
TOTAL COMMERCIAL SERVICES & SUPPLIES | | 2,848,172 |
|
| Shares | | Value |
CONSTRUCTION & ENGINEERING - 6.1% |
Construction & Engineering - 6.1% |
EMCOR Group, Inc. (a) | 34,841 | | $ 1,009,692 |
Fluor Corp. | 23,078 | | 1,529,148 |
Foster Wheeler AG (a) | 29,500 | | 1,018,340 |
Jacobs Engineering Group, Inc. (a) | 33,500 | | 1,535,975 |
MYR Group, Inc. (a) | 24,386 | | 512,106 |
Shaw Group, Inc. (a) | 1,300 | | 44,499 |
| | 5,649,760 |
ELECTRICAL EQUIPMENT - 10.4% |
Electrical Components & Equipment - 9.6% |
Acuity Brands, Inc. | 5,800 | | 334,486 |
AMETEK, Inc. | 22,325 | | 876,256 |
Cooper Industries PLC Class A | 19,000 | | 1,107,510 |
Emerson Electric Co. | 54,753 | | 3,130,229 |
Fushi Copperweld, Inc. (a) | 68,390 | | 607,303 |
General Cable Corp. (a) | 22,042 | | 773,454 |
GrafTech International Ltd. (a) | 28,800 | | 571,392 |
Hubbell, Inc. Class B | 3,500 | | 210,455 |
Polypore International, Inc. (a) | 5,800 | | 236,234 |
Prysmian SpA | 2,600 | | 44,322 |
Regal-Beloit Corp. | 8,895 | | 593,830 |
Sensata Technologies Holding BV | 10,400 | | 313,144 |
| | 8,798,615 |
Heavy Electrical Equipment - 0.8% |
Alstom SA | 16,052 | | 768,537 |
TOTAL ELECTRICAL EQUIPMENT | | 9,567,152 |
ELECTRONIC EQUIPMENT & COMPONENTS - 0.0% |
Electronic Equipment & Instruments - 0.0% |
HLS Systems International Ltd. (a) | 2,300 | | 34,868 |
ENERGY EQUIPMENT & SERVICES - 0.5% |
Oil & Gas Equipment & Services - 0.5% |
Dresser-Rand Group, Inc. (a) | 10,400 | | 442,936 |
HOUSEHOLD DURABLES - 1.0% |
Household Appliances - 1.0% |
Stanley Black & Decker, Inc. | 13,620 | | 910,769 |
INDUSTRIAL CONGLOMERATES - 19.5% |
Industrial Conglomerates - 19.5% |
3M Co. | 45,240 | | 3,904,212 |
General Electric Co. | 660,697 | | 12,084,151 |
Textron, Inc. | 83,660 | | 1,977,722 |
| | 17,966,085 |
LIFE SCIENCES TOOLS & SERVICES - 0.4% |
Life Sciences Tools & Services - 0.4% |
Agilent Technologies, Inc. (a) | 8,800 | | 364,584 |
Common Stocks - continued |
| Shares | | Value |
MACHINERY - 20.8% |
Construction & Farm Machinery & Heavy Trucks - 10.1% |
Ashok Leyland Ltd. | 48,712 | | $ 69,725 |
Caterpillar, Inc. | 47,146 | | 4,415,694 |
Cummins, Inc. | 18,851 | | 2,073,799 |
MAN SE | 3,545 | | 421,783 |
PACCAR, Inc. | 31,017 | | 1,780,996 |
Tata Motors Ltd. sponsored ADR (d) | 10,200 | | 299,268 |
Weichai Power Co. Ltd. (H Shares) | 46,000 | | 283,191 |
| | 9,344,456 |
Industrial Machinery - 10.7% |
Actuant Corp. Class A | 22,954 | | 611,035 |
Danaher Corp. | 56,400 | | 2,660,388 |
Gardner Denver, Inc. | 9,100 | | 626,262 |
Harsco Corp. | 23,857 | | 675,630 |
Ingersoll-Rand Co. Ltd. | 45,407 | | 2,138,216 |
Kennametal, Inc. | 5,512 | | 217,504 |
Pall Corp. | 2,600 | | 128,908 |
Sandvik AB | 13,900 | | 271,206 |
SmartHeat, Inc. (a)(d) | 66,672 | | 352,028 |
SPX Corp. | 15,600 | | 1,115,244 |
Timken Co. | 11,400 | | 544,122 |
TriMas Corp. (a) | 3,874 | | 79,262 |
Weg SA | 33,200 | | 436,118 |
| | 9,855,923 |
TOTAL MACHINERY | | 19,200,379 |
MARINE - 0.3% |
Marine - 0.3% |
Kuehne & Nagel International AG | 2,060 | | 286,632 |
PROFESSIONAL SERVICES - 1.8% |
Human Resource & Employment Services - 1.4% |
Towers Watson & Co. | 25,000 | | 1,301,500 |
Research & Consulting Services - 0.4% |
IHS, Inc. Class A (a) | 4,784 | | 384,586 |
TOTAL PROFESSIONAL SERVICES | | 1,686,086 |
ROAD & RAIL - 8.3% |
Railroads - 7.8% |
CSX Corp. | 25,361 | | 1,638,574 |
Kansas City Southern (a) | 10,547 | | 504,779 |
|
| Shares | | Value |
Norfolk Southern Corp. | 21,248 | | $ 1,334,799 |
Union Pacific Corp. | 39,315 | | 3,642,928 |
| | 7,121,080 |
Trucking - 0.5% |
Saia, Inc. (a) | 29,044 | | 481,840 |
TOTAL ROAD & RAIL | | 7,602,920 |
TRADING COMPANIES & DISTRIBUTORS - 4.3% |
Trading Companies & Distributors - 4.3% |
Barloworld Ltd. | 45,400 | | 459,140 |
Finning International, Inc. | 11,100 | | 301,513 |
Mills Estruturas e Servicos de Engenharia SA (a) | 45,600 | | 566,033 |
Rush Enterprises, Inc. Class A (a) | 82,458 | | 1,685,442 |
WESCO International, Inc. (a) | 17,350 | | 916,080 |
| | 3,928,208 |
TOTAL COMMON STOCKS (Cost $71,585,913) | 90,628,063 |
Money Market Funds - 3.5% |
| | | |
Fidelity Cash Central Fund, 0.19% (b) | 2,986,811 | | 2,986,811 |
Fidelity Securities Lending Cash Central Fund, 0.21% (b)(c) | 274,000 | | 274,000 |
TOTAL MONEY MARKET FUNDS (Cost $3,260,811) | 3,260,811 |
TOTAL INVESTMENT PORTFOLIO - 101.9% (Cost $74,846,724) | | 93,888,874 |
NET OTHER ASSETS (LIABILITIES) - (1.9)% | | (1,762,349) |
NET ASSETS - 100% | $ 92,126,525 |
Legend |
(a) Non-income producing |
(b) Affiliated fund that is available only to investment companies and other accounts managed by Fidelity Investments. The rate quoted is the annualized seven-day yield of the fund at period end. A complete unaudited listing of the fund's holdings as of its most recent quarter end is available upon request. In addition, each Fidelity Central Fund's financial statements, which are not covered by the Fund's Report of Independent Registered Public Accounting Firm, are available on the SEC's website or upon request. |
(c) Investment made with cash collateral received from securities on loan. |
(d) Security or a portion of the security is on loan at period end. |
Affiliated Central Funds |
Information regarding fiscal year to date income earned by the Fund from investments in Fidelity Central Funds is as follows: |
Fund | Income earned |
Fidelity Cash Central Fund | $ 2,578 |
Fidelity Securities Lending Cash Central Fund | 20,740 |
Total | $ 23,318 |
Other Information |
All investments are categorized as Level 1 under the Fair Value Hierarchy. The inputs or methodology used for valuing securities may not be an indication of the risk associated with investing in those securities. For more information on valuation inputs, please refer to the Security Valuation section in the accompanying Notes to Financial Statements. |
Distribution of investments by country of issue, as a percentage of total net assets, is as follows: (Unaudited) |
United States of America | 89.6% |
Ireland | 3.5% |
Switzerland | 1.4% |
Brazil | 1.1% |
Italy | 1.0% |
Others (Individually Less Than 1%) | 3.4% |
| 100.0% |
Income Tax Information |
At December 31, 2010, the Fund had a capital loss carryforward of approximately $9,628,270 of which $592,150 and $9,036,120 will expire in fiscal 2016 and 2017, respectively. Capital loss carryforwards are only available to offset future capital gains of the Fund to the extent provided by regulations and may be limited. |
See accompanying notes which are an integral part of the financial statements.
Annual Report
Statement of Assets and Liabilities
| December 31, 2010 |
| | |
Assets | | |
Investment in securities, at value (including securities loaned of $266,982) - See accompanying schedule: Unaffiliated issuers (cost $71,585,913) | $ 90,628,063 | |
Fidelity Central Funds (cost $3,260,811) | 3,260,811 | |
Total Investments (cost $74,846,724) | | $ 93,888,874 |
Cash | | 19 |
Receivable for investments sold | | 891,194 |
Receivable for fund shares sold | | 417,888 |
Dividends receivable | | 142,575 |
Distributions receivable from Fidelity Central Funds | | 695 |
Prepaid expenses | | 206 |
Other receivables | | 766 |
Total assets | | 95,342,217 |
| | |
Liabilities | | |
Payable for investments purchased | $ 2,834,814 | |
Payable for fund shares redeemed | 21,626 | |
Accrued management fee | 40,037 | |
Other affiliated payables | 10,657 | |
Other payables and accrued expenses | 34,558 | |
Collateral on securities loaned, at value | 274,000 | |
Total liabilities | | 3,215,692 |
| | |
Net Assets | | $ 92,126,525 |
Net Assets consist of: | | |
Paid in capital | | $ 82,993,498 |
Undistributed net investment income | | 22,058 |
Accumulated undistributed net realized gain (loss) on investments and foreign currency transactions | | (9,931,301) |
Net unrealized appreciation (depreciation) on investments and assets and liabilities in foreign
currencies | | 19,042,270 |
Net Assets | | $ 92,126,525 |
Statement of Assets and Liabilities - continued
| December 31, 2010 |
Initial Class:
Net Asset Value, offering price and redemption price per share ($43,294,986 ÷ 2,854,996 shares) | | $ 15.16 |
| | |
Investor Class:
Net Asset Value, offering price and redemption price per share ($48,831,539 ÷ 3,232,992 shares) | | $ 15.10 |
See accompanying notes which are an integral part of the financial statements.
Annual Report
Financial Statements - continued
Statement of Operations
| Year ended December 31, 2010 |
| | |
Investment Income | | |
Dividends | | $ 1,038,823 |
Interest | | 1 |
Income from Fidelity Central Funds | | 23,318 |
Total income | | 1,062,142 |
| | |
Expenses | | |
Management fee | $ 387,642 | |
Transfer agent fees | 86,028 | |
Accounting and security lending fees | 27,321 | |
Custodian fees and expenses | 21,013 | |
Independent trustees' compensation | 378 | |
Audit | 37,448 | |
Legal | 283 | |
Miscellaneous | 759 | |
Total expenses before reductions | 560,872 | |
Expense reductions | (8,135) | 552,737 |
Net investment income (loss) | | 509,405 |
Realized and Unrealized Gain (Loss) Net realized gain (loss) on: | | |
Investment securities: | | |
Unaffiliated issuers | 5,094,354 | |
Foreign currency transactions | (13,059) | |
Total net realized gain (loss) | | 5,081,295 |
Change in net unrealized appreciation (depreciation) on: Investment securities | 12,728,505 | |
Assets and liabilities in foreign currencies | 187 | |
Total change in net unrealized appreciation (depreciation) | | 12,728,692 |
Net gain (loss) | | 17,809,987 |
Net increase (decrease) in net assets resulting from operations | | $ 18,319,392 |
Statement of Changes in Net Assets
| Year ended
December 31, 2010 | Year ended
December 31, 2009 |
Increase (Decrease) in Net Assets | | |
Operations | | |
Net investment income (loss) | $ 509,405 | $ 494,177 |
Net realized gain (loss) | 5,081,295 | (3,170,037) |
Change in net unrealized appreciation (depreciation) | 12,728,692 | 18,874,981 |
Net increase (decrease) in net assets resulting
from operations | 18,319,392 | 16,199,121 |
Distributions to shareholders from net investment income | (468,304) | (506,005) |
Share transactions - net increase (decrease) | 16,185,455 | 1,252,954 |
Redemption fees | 27,168 | 11,631 |
Total increase (decrease) in net assets | 34,063,711 | 16,957,701 |
| | |
Net Assets | | |
Beginning of period | 58,062,814 | 41,105,113 |
End of period (including undistributed net investment income of $22,058 and distributions in excess of net investment income of $5,985, respectively) | $ 92,126,525 | $ 58,062,814 |
See accompanying notes which are an integral part of the financial statements.
Annual Report
Financial Highlights - Initial Class
Years ended December 31, | 2010 | 2009 | 2008 | 2007 | 2006 |
Selected Per-Share Data | | | | | |
Net asset value, beginning of period | $ 11.63 | $ 8.37 | $ 14.43 | $ 13.90 | $ 14.20 |
Income from Investment Operations | | | | | |
Net investment income (loss)C | .10 | .10 | .12 | .10 | .14 |
Net realized and unrealized gain (loss) | 3.51 | 3.27 | (5.79) | 2.43 | 2.02 |
Total from investment operations | 3.61 | 3.37 | (5.67) | 2.53 | 2.16 |
Distributions from net investment income | (.09) | (.11) | (.14) | (.09) | (.15) |
Distributions from net realized gain | - | - | (.26) | (1.91) | (2.33) |
Total distributions | (.09) | (.11) | (.40) | (2.00) | (2.47)H |
Redemption fees added to paid in capitalC | .01 | -G | .01 | -G | .01 |
Net asset value, end of period | $ 15.16 | $ 11.63 | $ 8.37 | $ 14.43 | $ 13.90 |
Total ReturnA,B | 31.09% | 40.22% | (39.84)% | 18.21% | 15.71% |
Ratios to Average Net AssetsD,F | | | | | |
Expenses before reductions | .77% | .81% | .78% | .78% | .79% |
Expenses net of fee waivers, if any | .76% | .81% | .78% | .78% | .79% |
Expenses net of all reductions | .75% | .80% | .78% | .78% | .78% |
Net investment income (loss) | .77% | 1.10% | 1.02% | .64% | .95% |
Supplemental Data | | | | | |
Net assets, end of period (000 omitted) | $ 43,295 | $ 32,183 | $ 23,747 | $ 50,586 | $ 51,332 |
Portfolio turnover rateE | 91% | 117% | 138% | 122% | 137% |
A Total returns do not reflect charges attributable to your insurance company's separate account. Inclusion of these charges would reduce the total returns shown.
B Total returns would have been lower had certain expenses not been reduced during the periods shown.
C Calculated based on average shares outstanding during the period.
D Fees and expenses of the underlying Fidelity Central Funds are not included in the Fund's expense ratio. The Fund indirectly bears its proportionate share of the expenses of any underlying Fidelity Central Funds.
E Amount does not include the portfolio activity of any underlying Fidelity Central Funds.
F Expense ratios reflect operating expenses of the class. Expenses before reductions do not reflect amounts reimbursed by the investment adviser or reductions from brokerage service arrangements or reductions from other expense offset arrangements and do not represent the amount paid by the class during periods when reimbursements or reductions occur. Expenses net of fee waivers reflect expenses after reimbursement by the investment adviser but prior to reductions from brokerage service arrangements or other expense offset arrangements. Expenses net of all reductions represent the net expenses paid by the class.
G Amount represents less than $.01 per share.
H Total distributions of $2.47 per share is comprised of distributions from net investment income of $.147 and distributions from net realized gain of $2.325 per share.
Financial Highlights - Investor Class
Years ended December 31, | 2010 | 2009 | 2008 | 2007 | 2006 |
Selected Per-Share Data | | | | | |
Net asset value, beginning of period | $ 11.59 | $ 8.35 | $ 14.38 | $ 13.86 | $ 14.19 |
Income from Investment Operations | | | | | |
Net investment income (loss)C | .09 | .09 | .11 | .08 | .12 |
Net realized and unrealized gain (loss) | 3.49 | 3.25 | (5.76) | 2.43 | 2.00 |
Total from investment operations | 3.58 | 3.34 | (5.65) | 2.51 | 2.12 |
Distributions from net investment income | (.08) | (.10) | (.13) | (.08) | (.14) |
Distributions from net realized gain | - | - | (.26) | (1.91) | (2.33) |
Total distributions | (.08) | (.10) | (.39) | (1.99) | (2.46)H |
Redemption fees added to paid in capitalC | .01 | -G | .01 | -G | .01 |
Net asset value, end of period | $ 15.10 | $ 11.59 | $ 8.35 | $ 14.38 | $ 13.86 |
Total ReturnA,B | 30.96% | 39.97% | (39.84)% | 18.12% | 15.43% |
Ratios to Average Net AssetsD,F | | | | | |
Expenses before reductions | .85% | .91% | .88% | .90% | .92% |
Expenses net of fee waivers, if any | .84% | .91% | .88% | .90% | .92% |
Expenses net of all reductions | .84% | .90% | .87% | .90% | .92% |
Net investment income (loss) | .69% | 1.00% | .92% | .52% | .81% |
Supplemental Data | | | | | |
Net assets, end of period (000 omitted) | $ 48,832 | $ 25,879 | $ 17,359 | $ 26,063 | $ 12,758 |
Portfolio turnover rateE | 91% | 117% | 138% | 122% | 137% |
A Total returns do not reflect charges attributable to your insurance company's separate account. Inclusion of these charges would reduce the total returns shown.
B Total returns would have been lower had certain expenses not been reduced during the periods shown.
C Calculated based on average shares outstanding during the period.
D Fees and expenses of the underlying Fidelity Central Funds are not included in the Fund's expense ratio. The Fund indirectly bears its proportionate share of the expenses of any underlying Fidelity Central Funds.
E Amount does not include the portfolio activity of any underlying Fidelity Central Funds.
F Expense ratios reflect operating expenses of the class. Expenses before reductions do not reflect amounts reimbursed by the investment adviser or reductions from brokerage service arrangements or reductions from other expense offset arrangements and do not represent the amount paid by the class during periods when reimbursements or reductions occur. Expenses net of fee waivers reflect expenses after reimbursement by the investment adviser but prior to reductions from brokerage service arrangements or other expense offset arrangements. Expenses net of all reductions represent the net expenses paid by the class.
G Amount represents less than $.01 per share.
H Total distributions of $2.46 per share is comprised of distributions from net investment income of $.138 and distributions from net realized gain of $2.325 per share.
See accompanying notes which are an integral part of the financial statements.
Annual Report
Notes to Financial Statements
For the period ended December 31, 2010
1. Organization.
VIP Industrials Portfolio (the Fund) is a non-diversified fund of Variable Insurance Products Fund IV (the Trust) and is authorized to issue an unlimited number of shares. The Trust is registered under the Investment Company Act of 1940, as amended (the 1940 Act), as an open-end management investment company organized as a Massachusetts business trust. Shares of the Fund may only be purchased by insurance companies for the purpose of funding variable annuity or variable life insurance contracts. The Fund offers the following classes of shares: Initial Class shares and Investor Class shares. All classes have equal rights and voting privileges, except for matters affecting a single class. Investment income, realized and unrealized capital gains and losses, the common expenses of the Fund, and certain fund-level expense reductions, if any, are allocated on a pro-rata basis to each class based on the relative net assets of each class to the total net assets of the Fund. Each class differs with respect to transfer agent fees incurred. Certain expense reductions may also differ by class.
2. Investments in Fidelity Central Funds.
The Fund may invest in Fidelity Central Funds, which are open-end investment companies available only to other investment companies and accounts managed by Fidelity Management & Research Company (FMR) and its affiliates. The Fund's Schedule of Investments lists each of the Fidelity Central Funds held as of period end, if any, as an investment of the Fund, but does not include the underlying holdings of each Fidelity Central Fund. As an Investing Fund, the Fund indirectly bears its proportionate share of the expenses of the underlying Fidelity Central Funds.
The Money Market Central Funds seek preservation of capital and current income and are managed by Fidelity Investments Money Management, Inc. (FIMM), an affiliate of FMR.
A complete unaudited list of holdings for each Fidelity Central Fund is available upon request or at the Securities and Exchange Commission (the SEC) web site at www.sec.gov. In addition, the financial statements of the Fidelity Central Funds, which are not covered by the Fund's Report of Independent Registered Public Accounting Firm, are available on the SEC web site or upon request.
3. Significant Accounting Policies.
The financial statements have been prepared in conformity with accounting principles generally accepted in the United States of America (GAAP), which require management to make certain estimates and assumptions at the date of the financial statements. Actual results could differ from those estimates. Subsequent events, if any, through the date that the financial statements were issued have been evaluated in the preparation of the financial statements. The following summarizes the significant accounting policies of the Fund:
Security Valuation. Investments are valued as of 4:00 p.m. Eastern time on the last calendar day of the period. The Fund uses independent pricing services approved by the Board of Trustees to value its investments. When current market prices or quotations are not readily available or reliable, valuations may be determined in good faith in accordance with procedures adopted by the Board of Trustees. Factors used in determining value may include market or security specific events. The frequency with which these procedures are used cannot be predicted and they may be utilized to a significant extent. The value used for net asset value (NAV) calculation under these procedures may differ from published prices for the same securities.
The Fund categorizes the inputs to valuation techniques used to value its investments into a disclosure hierarchy consisting of three levels as shown below.
Level 1 - quoted prices in active markets for identical investments
Level 2 - other significant observable inputs (including quoted prices for similar investments, interest rates, prepayment speeds, etc.)
Level 3 - unobservable inputs (including the Fund's own assumptions based on the best information available)
Changes in valuation techniques may result in transfers in or out of an assigned level within the disclosure hierarchy. Valuation techniques used to value the Fund's investments by major category are as follows.
Equity securities, including restricted securities, for which market quotations are readily available, are valued at the last reported sale price or official closing price as reported by an independent pricing service on the primary market or exchange on which they are traded and are categorized as Level 1 in the hierarchy. In the event there were no sales during the day or closing prices are not available, securities are valued at the last quoted bid price or may be valued using the last available price and are generally categorized as Level 2 in the hierarchy. For foreign equity securities, when significant market or security specific events arise, comparisons to the valuation of American Depositary Receipts (ADRs), futures contracts, Exchange-traded funds (ETFs) and certain indexes as well as quoted prices for similar securities are used and are categorized as Level 2 in the hierarchy in these circumstances. Utilizing these techniques may result in transfers between Level 1 and Level 2. For restricted equity securities and private placements where observable inputs are limited, assumptions about market activity and risk are used and are categorized as Level 3 in the hierarchy.
Investments in open-end mutual funds, including the Fidelity Central Funds, are valued at their closing net asset value each business day and are categorized as Level 1 in the hierarchy.
Annual Report
3. Significant Accounting Policies - continued
Foreign Currency. The Fund uses foreign currency contracts to facilitate transactions in foreign-denominated securities. Gains and losses from these transactions may arise from changes in the value of the foreign currency or if the counterparties do not perform under the contracts' terms.
Foreign-denominated assets, including investment securities, and liabilities are translated into U.S. dollars at the exchange rate at period end. Purchases and sales of investment securities, income and dividends received and expenses denominated in foreign currencies are translated into U.S. dollars at the exchange rate in effect on the transaction date.
The effects of exchange rate fluctuations on investments are included with the net realized and unrealized gain (loss) on investment securities. Other foreign currency transactions resulting in realized and unrealized gain (loss) are disclosed separately.
Investment Transactions and Income. For financial reporting purposes, the Fund's investment holdings and NAV include trades executed through the end of the last business day of the period. The NAV per share for processing shareholder transactions is calculated as of the close of business of the New York Stock Exchange (NYSE), normally 4:00 p.m. Eastern time and includes trades executed through the end of the prior business day. Gains and losses on securities sold are determined on the basis of identified cost and may include proceeds received from litigation. Dividend income is recorded on the ex-dividend date, except for certain dividends from foreign securities where the ex-dividend date may have passed, which are recorded as soon as the Fund is informed of the ex-dividend date. Non-cash dividends included in dividend income, if any, are recorded at the fair market value of the securities received. Distributions received on securities that represent a return of capital or capital gain are recorded as a reduction of cost of investments and/or as a realized gain. The Fund estimates the components of distributions received that may be considered return of capital distributions or capital gain distributions. Interest income and distributions from the Fidelity Central Funds are accrued as earned. Interest income includes coupon interest and amortization of premium and accretion of discount on debt securities. Investment income is recorded net of foreign taxes withheld where recovery of such taxes is uncertain.
Expenses. Expenses directly attributable to a fund are charged to that fund. Expenses attributable to more than one fund are allocated among the respective funds on the basis of relative net assets or other appropriate methods. Expense estimates are accrued in the period to which they relate and adjustments are made when actual amounts are known.
Income Tax Information and Distributions to Shareholders. Each year the Fund intends to qualify as a regulated investment company, including distributing substantially all of its taxable income and realized gains under Subchapter M of the Internal Revenue Code and filing its U.S. federal tax return. As a result, no provision for income taxes is required. As of December 31, 2010, the Fund did not have any unrecognized tax benefits in the accompanying financial statements. A fund's federal tax return is subject to examination by the Internal Revenue Service (IRS) for a period of three years. Foreign taxes are provided for based on the Fund's understanding of the tax rules and rates that exist in the foreign markets in which it invests.
Distributions are declared and recorded on the ex-dividend date. Income dividends and capital gain distributions are declared separately for each class. Income and capital gain distributions are determined in accordance with income tax regulations, which may differ from GAAP.
Capital accounts within the financial statements are adjusted for permanent book-tax differences. These adjustments have no impact on net assets or the results of operations. Temporary book-tax differences will reverse in a subsequent period.
Book-tax differences are primarily due to foreign currency transactions, capital loss carryforwards and losses deferred due to wash sales and excise tax regulations.
The federal tax cost of investment securities and unrealized appreciation (depreciation) as of period end were as follows:
Gross unrealized appreciation | $ 19,669,937 |
Gross unrealized depreciation | (930,818) |
Net unrealized appreciation (depreciation) | $ 18,739,119 |
| |
Tax Cost | $ 75,149,755 |
The tax-based components of distributable earnings as of period end were as follows:
Undistributed ordinary income | $ 22,058 |
Capital loss carryforward | $ (9,628,270) |
Net unrealized appreciation (depreciation) | $ 18,739,239 |
Annual Report
Notes to Financial Statements - continued
3. Significant Accounting Policies - continued
Income Tax Information and Distributions to Shareholders - continued
The tax character of distributions paid was as follows:
| December 31, 2010 | December 31, 2009 |
Ordinary Income | $ 468,304 | $ 506,005 |
Trading (Redemption) Fees. Shares held by investors less than 60 days are subject to a redemption fee equal to 1% of the net asset value of shares redeemed. All redemption fees, which reduce the proceeds of the shareholder redemption, are retained by the Fund and accounted for as an addition to paid in capital.
4. Purchases and Sales of Investments.
Purchases and sales of securities, other than short-term securities, aggregated $76,827,738 and $61,609,387, respectively.
5. Fees and Other Transactions with Affiliates.
Management Fee. FMR and its affiliates provide the Fund with investment management related services for which the Fund pays a monthly management fee. The management fee is the sum of an individual fund fee rate that is based on an annual rate of .30% of the Fund's average net assets and a group fee rate that averaged .26% during the period. The group fee rate is based upon the average net assets of all the mutual funds advised by FMR. The group fee rate decreases as assets under management increase and increases as assets under management decrease. For the period, the total annual management fee rate was .56% of the Fund's average net assets.
Transfer Agent Fees. Fidelity Investments Institutional Operations Company, Inc. (FIIOC), an affiliate of FMR, is the Fund's transfer, dividend disbursing, and shareholder servicing agent. FIIOC receives an asset-based fee with respect to each class. Each class (with the exception of Investor Class) pays a transfer agent fee, excluding out of pocket expenses, equal to an annual rate of .07% of average net assets. Investor Class pays a monthly asset-based transfer agent fee of .15% of average net assets. In addition, FIIOC receives an asset-based fee of .01% of average net assets for typesetting, printing and mailing of shareholder reports, except proxy statements. FIIOC has agreed to voluntarily waive this fee until December 31, 2010. (See Note 8: Expense Reductions.) For the period, transfer agent fees for each class, including printing and out of pocket expenses, were as follows:
Initial Class | $ 30,033 |
Investor Class | 55,995 |
| $ 86,028 |
Accounting and Security Lending Fees. Fidelity Service Company, Inc. (FSC), an affiliate of FMR, maintains the Fund's accounting records. The accounting fee is based on the level of average net assets for the month. Under a separate contract, FSC administers the security lending program. The security lending fee is based on the number and duration of lending transactions.
Brokerage Commissions. The Fund placed a portion of its portfolio transactions with brokerage firms which are affiliates of the investment adviser. The commissions paid to these affiliated firms were $1,800 for the period.
6. Committed Line of Credit.
The Fund participates with other funds managed by FMR or an affiliate in a $3.75 billion credit facility (the "line of credit") to be utilized for temporary or emergency purposes to fund shareholder redemptions or for other short-term liquidity purposes. The Fund has agreed to pay commitment fees on its pro-rata portion of the line of credit, which amounted to $251 and is reflected in Miscellaneous expenses on the Statement of Operations. During the period, there were no borrowings on this line of credit.
7. Security Lending.
The Fund lends portfolio securities through a lending agent from time to time in order to earn additional income. The lending agent may loan securities to certain qualified borrowers, including Fidelity Capital Markets (FCM), a broker-dealer affiliated with the Fund. On the settlement date of the loan, the Fund receives collateral (in the form of U.S. Treasury obligations, letters of credit and/or cash) against the loaned securities and maintains collateral in an amount not less than 100% of the market value of the loaned securities during the period of the loan. The market value of the loaned securities is determined at the close of business of the Fund and any additional required collateral is delivered to the Fund on the next business day. If the
Annual Report
7. Security Lending - continued
borrower defaults on its obligation to return the securities loaned because of insolvency or other reasons, a fund could experience delays and costs in recovering the securities loaned or in gaining access to the collateral. Any cash collateral received is invested in the Fidelity Securities Lending Cash Central Fund. The value of loaned securities and cash collateral at period end are disclosed on the Fund's Statement of Assets and Liabilities. Security lending income represents the income earned on investing cash collateral, less rebates paid to borrowers and lending agent fees associated with the loan, plus any premium payments received for lending certain types of securities. Security lending income is presented in the Statement of Operations as a component of income from Fidelity Central Funds. Total security lending income during the period amounted to $20,740. During the period, there were no securities loaned to FCM.
8. Expense Reductions.
FMR or its affiliates agreed to waive certain fees during the period as noted in the table below:
Initial Class | $ 2,619 |
Investor Class | 2,410 |
| $ 5,029 |
Many of the brokers with whom FMR places trades on behalf of the Fund provided services to the Fund in addition to trade execution. These services included payments of certain expenses on behalf of the Fund totaling $3,106 for the period.
9. Distributions to Shareholders.
Distributions to shareholders of each class were as follows:
Years ended December 31, | 2010 | 2009 |
From net investment income | | |
Initial Class | $ 236,371 | $ 290,831 |
Investor Class | 231,933 | 215,174 |
Total | $ 468,304 | $ 506,005 |
10. Share Transactions.
Transactions for each class of shares were as follows:
| Shares | Dollars |
Years ended December 31, | 2010 | 2009 | 2010 | 2009 |
Initial Class | | | | |
Shares sold | 772,352 | 744,452 | $ 10,403,734 | $ 6,739,371 |
Reinvestment of distributions | 15,769 | 25,158 | 236,371 | 290,831 |
Shares redeemed | (700,942) | (837,301) | (8,772,538) | (7,230,622) |
Net increase (decrease) | 87,179 | (67,691) | $ 1,867,567 | $ (200,420) |
Investor Class | | | | |
Shares sold | 1,541,960 | 812,669 | $ 20,928,604 | $ 7,438,900 |
Reinvestment of distributions | 15,535 | 18,678 | 231,933 | 215,174 |
Shares redeemed | (558,313) | (677,276) | (6,842,649) | (6,200,700) |
Net increase (decrease) | 999,182 | 154,071 | $ 14,317,888 | $ 1,453,374 |
11. Other.
The Fund's organizational documents provide former and current trustees and officers with a limited indemnification against liabilities arising in connection with the performance of their duties to the Fund. In the normal course of business, the Fund may also enter into contracts that provide general indemnifications. The Fund's maximum exposure under these arrangements is unknown as this would be dependent on future claims that may be made against the Fund. The risk of material loss from such claims is considered remote.
At the end of the period, FMR or its affiliates were owners of record of 100% of the total outstanding shares of the Fund.
Annual Report
Report of Independent Registered Public Accounting Firm
To the Trustees of Variable Insurance Products Fund IV and the Shareholders of VIP Industrials Portfolio:
In our opinion, the accompanying statement of assets and liabilities, including the schedule of investments, and the related statements of operations and of changes in net assets and the financial highlights present fairly, in all material respects, the financial position of VIP Industrials Portfolio (a fund of Variable Insurance Products Fund IV) at December 31, 2010, the results of its operations for the year then ended, the changes in its net assets for each of the two years in the period then ended and the financial highlights for each of the five years in the period then ended, in conformity with accounting principles generally accepted in the United States of America. These financial statements and financial highlights (hereafter referred to as "financial statements") are the responsibility of the VIP Industrials Portfolio's management. Our responsibility is to express an opinion on these financial statements based on our audits. We conducted our audits of these financial statements in accordance with the standards of the Public Company Accounting Oversight Board (United States). Those standards require that we plan and perform the audit to obtain reasonable assurance about whether the financial statements are free of material misstatement. An audit includes examining, on a test basis, evidence supporting the amounts and disclosures in the financial statements, assessing the accounting principles used and significant estimates made by management, and evaluating the overall financial statement presentation. We believe that our audits, which included confirmation of securities at December 31, 2010 by correspondence with the custodian and brokers, provide a reasonable basis for our opinion.
/s/ PricewaterhouseCoopers LLP
PricewaterhouseCoopers LLP
Boston, Massachusetts
February 17, 2011
Annual Report
The Trustees, Members of the Advisory Board, and executive officers of the trust and fund, as applicable, are listed below. The Board of Trustees governs the fund and is responsible for protecting the interests of shareholders. The Trustees are experienced executives who meet periodically throughout the year to oversee the fund's activities, review contractual arrangements with companies that provide services to the fund, oversee management of the risks associated with such activities and contractual arrangements, and review the fund's performance. Except for James C. Curvey, each of the Trustees oversees 219 funds advised by FMR or an affiliate. Mr. Curvey oversees 408 funds advised by FMR or an affiliate.
The Trustees hold office without limit in time except that (a) any Trustee may resign; (b) any Trustee may be removed by written instrument, signed by at least two-thirds of the number of Trustees prior to such removal; (c) any Trustee who requests to be retired or who has become incapacitated by illness or injury may be retired by written instrument signed by a majority of the other Trustees; and (d) any Trustee may be removed at any special meeting of shareholders by a two-thirds vote of the outstanding voting securities of the trust. Each Trustee who is not an interested person (as defined in the 1940 Act) (Independent Trustee), shall retire not later than the last day of the calendar year in which his or her 72nd birthday occurs. The Independent Trustees may waive this mandatory retirement age policy with respect to individual Trustees. The executive officers and Advisory Board Member hold office without limit in time, except that any officer and Advisory Board Members may resign or may be removed by a vote of a majority of the Trustees at any regular meeting or any special meeting of the Trustees. Except as indicated, each individual has held the office shown or other offices in the same company for the past five years.
Experience, Skills, Attributes, and Qualifications of the Fund's Trustees. The Governance and Nominating Committee has adopted a statement of policy that describes the experience, qualifications, attributes, and skills that are necessary and desirable for potential Independent Trustee candidates (Statement of Policy). The Board believes that each Trustee satisfied at the time he or she was initially elected or appointed a Trustee, and continues to satisfy, the standards contemplated by the Statement of Policy. The Governance and Nominating Committee also engages professional search firms to help identify potential Independent Trustee candidates who have the experience, qualifications, attributes, and skills consistent with the Statement of Policy. From time to time, additional criteria based on the composition and skills of the current Independent Trustees, as well as experience or skills that may be appropriate in light of future changes to board composition, business conditions, and regulatory or other developments, have also been considered by the professional search firms and the Governance and Nominating Committee. In addition, the Board takes into account the Trustees' commitment and participation in Board and committee meetings, as well as their leadership of standing and ad hoc committees throughout their tenure.
In determining that a particular Trustee was and continues to be qualified to serve as a Trustee, the Board has considered a variety of criteria, none of which, in isolation, was controlling. The Board believes that, collectively, the Trustees have balanced and diverse experience, qualifications, attributes, and skills, which allow the Board to operate effectively in governing the fund and protecting the interests of shareholders. Information about the specific experience, skills, attributes, and qualifications of each Trustee, which in each case led to the Board's conclusion that the Trustee should serve (or continue to serve) as a trustee of the fund, is provided below.
Board Structure and Oversight Function. James C. Curvey is an interested person (as defined in the 1940 Act) and currently serves as Acting Chairman. The Trustees have determined that an interested Chairman is appropriate and benefits shareholders because an interested Chairman has a personal and professional stake in the quality and continuity of services provided to the fund. Independent Trustees exercise their informed business judgment to appoint an individual of their choosing to serve as Chairman, regardless of whether the Trustee happens to be independent or a member of management. The Independent Trustees have determined that they can act independently and effectively without having an Independent Trustee serve as Chairman and that a key structural component for assuring that they are in a position to do so is for the Independent Trustees to constitute a substantial majority for the Board. The Independent Trustees also regularly meet in executive session. Ned C. Lautenbach serves as Chairman of the Independent Trustees and as such (i) acts as a liaison between the Independent Trustees and management with respect to matters important to the Independent Trustees and (ii) with management prepares agendas for Board meetings.
Fidelity funds are overseen by different Boards of Trustees. The fund's Board oversees Fidelity's equity and high income funds and another Board oversees Fidelity's investment-grade bond, money market, and asset allocation funds. The asset allocation funds may invest in Fidelity funds overseen by the fund's Board. The use of separate Boards, each with its own committee structure, allows the Trustees of each group of Fidelity funds to focus on the unique issues of the funds they oversee, including common research, investment, and operational issues. On occasion, the separate Boards establish joint committees to address issues of overlapping consequences for the Fidelity funds overseen by each Board.
The Trustees operate using a system of committees to facilitate the timely and efficient consideration of all matters of importance to the Trustees, the fund, and fund shareholders and to facilitate compliance with legal and regulatory requirements and oversight of the fund's activities and associated risks. The Board, acting through its committees, has charged FMR and its affiliates with (i) identifying events or circumstances the occurrence of which could have demonstrably adverse effects on the fund's business and/or reputation; (ii) implementing processes and controls to lessen the possibility that such events or circumstances occur or to mitigate the effects of such events or circumstances if they do occur; and (iii) creating and maintaining a system designed to evaluate continuously business and market conditions in order to facilitate the identification and implementation processes described in (i) and (ii) above. Because the day-to-day operations and activities of the fund are carried out by or through FMR, its affiliates and other service providers, the fund's exposure to risks is mitigated but not eliminated by the processes overseen by the Trustees. While each of the Board's committees has responsibility for overseeing different aspects of the fund's activities, oversight is exercised primarily through the Operations, Audit, and Compliance Committees. Appropriate personnel, including but not limited to the fund's Chief Compliance Officer (CCO), FMR's internal auditor, the independent accountants, the fund's Treasurer and portfolio management personnel, make periodic reports to the Board's committees, as appropriate. The responsibilities of each committee, including their oversight responsibilities, are described further under "Standing Committees of the Fund's Trustees."
Annual Report
The fund's Statement of Additional Information (SAI) includes more information about the Trustees. To request a free copy, call Fidelity at 1-877-208-0098.
Interested Trustees*:
Correspondence intended for each Trustee who is an interested person may be sent to Fidelity Investments, 82 Devonshire Street, Boston, Massachusetts 02109.
Name, Age; Principal Occupations and Other Relevant Experience+ |
James C. Curvey (75) |
| Year of Election or Appointment: 2007 Mr. Curvey is Trustee and Acting Chairman of the Board of Trustees of certain Trusts. Mr. Curvey also serves as Trustee (2007-present) of other investment companies advised by FMR. Mr. Curvey is a Director of Fidelity Investments Money Management, Inc. (2009-present), Director of Fidelity Research & Analysis Co. (2009-present) and Director of FMR and FMR Co., Inc. (2007-present). Mr. Curvey is also Vice Chairman (2007-present) and Director of FMR LLC. In addition, Mr. Curvey serves as an Overseer for the Boston Symphony Orchestra and a member of the Trustees of Villanova University. Previously, Mr. Curvey was the Vice Chairman (2006-2007) and Director (2000-2007) of FMR Corp. |
Ronald P. O'Hanley (54) |
| Year of Election or Appointment: 2011 Mr. O'Hanley is President of Fidelity Asset Management and Corporate Services and a member of Fidelity's Executive Committee (2010-present). Previously, Mr. O'Hanley served as President and Chief Executive Officer of BNY Mellon Asset Management (2007-2010). Mr. O'Hanley also served as Vice Chairman of Bank New York Mellon Corp. and a member of that firm's Executive Committee. Prior to the 2007 merger of The Bank of New York and Mellon Financial Corporation, he was Vice Chairman of Mellon Financial Corporation and President and Chief Executive Officer of Mellon Asset Management. He joined Mellon in February 1997. Mr. O'Hanley currently serves as Chairman of the Boston Public Library Foundation Board of Directors and sits on the Board of Directors of Beth Israel Deaconess Medical Center, the Board of Trustees of the Marine Biological Laboratory and the Advisory Board of the Maxwell School of Citizenship and Public Administration at Syracuse University. Mr. O'Hanley also chairs the Council on Asset Management for the Financial Services Roundtable and is a member of the Board of Directors of Institutional Investor's U.S. Institute. |
* Trustees have been determined to be "Interested Trustees" by virtue of, among other things, their affiliation with the trust or various entities under common control with FMR.
+ The information above includes each Trustee's principal occupation during the last five years and other information relating to the experience, attributes, and skills relevant to each Trustee's qualifications to serve as a Trustee, which led to the conclusion that each Trustee should serve as a Trustee for the fund.
Independent Trustees:
Correspondence intended for each Independent Trustee (that is, the Trustees other than the Interested Trustees) may be sent to Fidelity Investments, P.O. Box 55235, Boston, Massachusetts 02205-5235.
Name, Age; Principal Occupations and Other Relevant Experience+ |
Dennis J. Dirks (62) |
| Year of Election or Appointment: 2005 Prior to his retirement in May 2003, Mr. Dirks was Chief Operating Officer and a member of the Board of The Depository Trust & Clearing Corporation (DTCC). He also served as President, Chief Operating Officer, and Board member of The Depository Trust Company (DTC) and President and Board member of the National Securities Clearing Corporation (NSCC). In addition, Mr. Dirks served as Chief Executive Officer and Board member of the Government Securities Clearing Corporation, Chief Executive Officer and Board member of the Mortgage-Backed Securities Clearing Corporation, as a Trustee and a member of the Finance Committee of Manhattan College (2005-2008), and as a Trustee and a member of the Finance Committee of AHRC of Nassau County (2006-2008). Mr. Dirks is a member of the Independent Directors Council (IDC) Governing Council (2010-Present) and Board of Directors for The Brookville Center for Children's Services, Inc. (2009-present). |
Alan J. Lacy (57) |
| Year of Election or Appointment: 2008 Mr. Lacy serves as Senior Adviser (2007-present) of Oak Hill Capital Partners, L.P. (private equity). Mr. Lacy also served as Chief Executive Officer (2000-2005) and Vice Chairman (2005-2006) of Sears Holdings Corporation and Sears, Roebuck and Co. (retail). In addition, Mr. Lacy serves as a member of the Board of Directors of The Western Union Company (global money transfer, 2006-present) and Bristol-Myers Squibb Company (global pharmaceuticals, 2007-present). Mr. Lacy is Chairman (2008-present) and a member (2006-present) of the Board of Trustees of The National Parks Conservation Association. |
Ned C. Lautenbach (66) |
| Year of Election or Appointment: 2000 Mr. Lautenbach is Chairman of the Independent Trustees of the Equity and High Income Funds (2006-present). Mr. Lautenbach currently serves as the Lead Director of the Eaton Corporation Board of Directors (diversified industrial, 1997-present). Mr. Lautenbach is also a member of the Board of Directors of the Philharmonic Center for the Arts in Naples, Florida (1999-present); a member of the Board of Trustees of Fairfield University (2005-present); and a member of the Council on Foreign Relations (1994-present). Previously, Mr. Lautenbach was a Partner/Advisory Partner at Clayton, Dubilier & Rice, Inc. (private equity investment, 1998-2010), as well as a Director of Sony Corporation (2006-2007). |
Joseph Mauriello (66) |
| Year of Election or Appointment: 2008 Prior to his retirement in January 2006, Mr. Mauriello served in numerous senior management positions including Deputy Chairman and Chief Operating Officer (2004-2005), and Vice Chairman of Financial Services (2002-2004) of KPMG LLP US (professional services, 1965-2005). Mr. Mauriello currently serves as a member of the Board of Directors of XL Group plc. (global insurance and re-insurance, 2006-present) and of Arcadia Resources Inc. (health care services and products, 2007-present). Previously, Mr. Mauriello served as a Director of the Hamilton Funds of the Bank of New York (2006-2007). |
Cornelia M. Small (66) |
| Year of Election or Appointment: 2005 Ms. Small is a member of the Board of Directors of the Teagle Foundation (2009-present). Ms. Small is also a member of the Investment Committee, and Chair (2008-present) and a member of the Board of Trustees of Smith College. In addition, Ms. Small serves on the Investment Committee of the Berkshire Taconic Community Foundation (2008-present). Previously, Ms. Small served as Chairperson of the Investment Committee (2002-2008) of Smith College. In addition, Ms. Small served as Chief Investment Officer, Director of Global Equity Investments, and a member of the Board of Directors of Scudder, Stevens & Clark and Scudder Kemper Investments. |
William S. Stavropoulos (71) |
| Year of Election or Appointment: 2001 Mr. Stavropoulos is Vice Chairman of the Independent Trustees of the Equity and High Income Funds (2006-present). Mr. Stavropoulos serves as President and Founder of the Michigan Baseball Foundation, the Great Lakes Loons (2007-present). Mr. Stavropoulos is Chairman Emeritus of the Board of Directors of The Dow Chemical Company, where he previously served in numerous senior management positions, including President, CEO (1995-2000; 2002-2004), Chairman of the Executive Committee (2000-2006), and as a member of the Board of Directors (1990-2006). Currently, Mr. Stavropoulos is Chairman of Univar (global distributor of commodity and specialty chemicals, 2010-present), a Director of Teradata Corporation (data warehousing and technology solutions, 2008-present), Chemical Financial Corporation, Maersk Inc. (industrial conglomerate), Tyco International, Inc. (multinational manufacturing and services, 2007-present), and a member of the Advisory Board for Metalmark Capital (private equity investment, 2005-present). Mr. Stavropoulos is a special advisor to Clayton, Dubilier & Rice, LLC (private equity investment). In addition, Mr. Stavropoulos is a member of the University of Notre Dame Advisory Council for the College of Science. |
David M. Thomas (61) |
| Year of Election or Appointment: 2008 Previously, Mr. Thomas served as Executive Chairman (2005-2006) and Chairman and Chief Executive Officer (2000-2005) of IMS Health, Inc. (pharmaceutical and healthcare information solutions). In addition, Mr. Thomas serves as a member of the Board of Directors of Fortune Brands, Inc. (consumer products), and Interpublic Group of Companies, Inc. (marketing communication, 2004-present). |
Michael E. Wiley (60) |
| Year of Election or Appointment: 2008 Mr. Wiley also serves as a Director of Asia Pacific Exploration Consolidated (international oil and gas exploration and production, 2008-present). Mr. Wiley serves as a Director of Tesoro Corporation (independent oil refiner and marketer, 2005-present), and a Director of Bill Barrett Corporation (exploration and production, 2005-present). In addition, Mr. Wiley also serves as a Director of Post Oak Bank (privately-held bank, 2004-present). Previously, Mr. Wiley served as a member of the Board of Trustees of the University of Tulsa (2000-2006; 2007-2010), as a Senior Energy Advisor of Katzenbach Partners, LLC (consulting, 2006-2007), as an Advisory Director of Riverstone Holdings (private investment), Chairman, President, and CEO of Baker Hughes, Inc. (oilfield services, 2000-2004), and as Director of Spinnaker Exploration Company (exploration and production, 2001-2005). |
+ The information above includes each Trustee's principal occupation during the last five years and other information relating to the experience, attributes, and skills relevant to each Trustee's qualifications to serve as a Trustee, which led to the conclusion that each Trustee should serve as a Trustee for the fund.
Advisory Board Members and Executive Officers:
Correspondence intended for each executive officer, Edward C. Johnson 3d, and Peter S. Lynch may be sent to Fidelity Investments, 82 Devonshire Street, Boston, Massachusetts 02109.
Name, Age; Principal Occupation |
Edward C. Johnson 3d (80) |
| Year of Election or Appointment: 2011 Member of the Advisory Board of Fidelity's Equity and High Income Funds. Formerly Trustee and Chairman of the Board of Trustees of certain Trusts, Mr. Johnson serves as Chief Executive Officer, Chairman, and a Director of FMR LLC; Chairman and a Director of FMR; and Chairman and a Director of FMR Co., Inc. In addition, Mr. Johnson serves as Chairman and Director of FIL Limited. Previously, Mr. Johnson served as President of FMR LLC (2006-2007). |
Peter S. Lynch (66) |
| Year of Election or Appointment: 2003 Member of the Advisory Board of Fidelity's Equity and High Income Funds. Mr. Lynch is Vice Chairman and a Director of FMR and FMR Co., Inc. In addition, Mr. Lynch serves as a Trustee of Boston College and as the Chairman of the Inner-City Scholarship Fund. Previously, Mr. Lynch served on the Special Olympics International Board of Directors (1997-2006). |
Kenneth B. Robins (41) |
| Year of Election or Appointment: 2008 President and Treasurer of Fidelity's Equity and High Income Funds. Mr. Robins also serves as President and Treasurer (2010-present) and Assistant Treasurer (2009-present) of other Fidelity funds and is an employee of Fidelity Investments (2004-present). Previously, Mr. Robins served as Deputy Treasurer of the Fidelity funds (2005-2008) and Treasurer and Chief Financial Officer of The North Carolina Capital Management Trust: Cash and Term Portfolios (2006-2008). |
Brian B. Hogan (46) |
| Year of Election or Appointment: 2009 Vice President of certain Equity Funds and Vice President of Sector Funds. Mr. Hogan also serves as President of FMR's Equity Division (2009-present). Previously, Mr. Hogan served as Senior Vice President, Equity Research of FMR (2006-2009) and as a portfolio manager. |
Christopher S. Bartel (39) |
| Year of Election or Appointment: 2009 Vice President of Fidelity's Sector and Real Estate Equity Funds. Mr. Bartel also serves as Senior Vice President of Equity Research (2009-present). Previously, Mr. Bartel served as Managing Director of Research (2006-2009) and an analyst and portfolio manager (2000-2006). |
Scott C. Goebel (42) |
| Year of Election or Appointment: 2008 Secretary and Chief Legal Officer (CLO) of the Fidelity funds. Mr. Goebel also serves as Secretary and CLO of The North Carolina Capital Management Trust: Cash and Term Portfolio (2008-present); General Counsel, Secretary, and Senior Vice President of FMR (2008-present) and FMR Co., Inc. (2008-present); Deputy General Counsel of FMR LLC; Chief Legal Officer of Fidelity Management & Research (Hong Kong) Limited (2008-present) and Assistant Secretary of Fidelity Management & Research (Japan) Inc. (2008-present), Fidelity Investments Money Management, Inc. (2008-present), Fidelity Management & Research (U.K.) Inc. (2008-present), and Fidelity Research and Analysis Company (2008-present). Previously, Mr. Goebel served as Assistant Secretary of the Funds (2007-2008) and as Vice President and Secretary of Fidelity Distributors Corporation (FDC) (2005-2007). |
William C. Coffey (41) |
| Year of Election or Appointment: 2009 Assistant Secretary of Fidelity's Equity and High Income Funds. Mr. Coffey also serves as Senior Vice President and Deputy General Counsel of FMR LLC (2010-present), and is an employee of Fidelity Investments. Previously, Mr. Coffey served as Vice President and Associate General Counsel of FMR LLC (2005-2009). |
Holly C. Laurent (56) |
| Year of Election or Appointment: 2008 Anti-Money Laundering (AML) Officer of the Fidelity funds. Ms. Laurent also serves as AML Officer of The North Carolina Capital Management Trust: Cash and Term Portfolio (2008-present) and is an employee of Fidelity Investments. Previously, Ms. Laurent was Senior Vice President and Head of Legal for Fidelity Business Services India Pvt. Ltd. (2006-2008), and Senior Vice President, Deputy General Counsel and Group Head for FMR LLC (2005-2006). |
Christine Reynolds (52) |
| Year of Election or Appointment: 2008 Chief Financial Officer of the Fidelity funds. Ms. Reynolds became President of Fidelity Pricing and Cash Management Services (FPCMS) in August 2008. Ms. Reynolds served as Chief Operating Officer of FPCMS (2007-2008). Previously, Ms. Reynolds served as President, Treasurer, and Anti-Money Laundering officer of the Fidelity funds (2004-2007). |
Kenneth A. Rathgeber (63) |
| Year of Election or Appointment: 2004 Chief Compliance Officer of Fidelity's Equity and High Income Funds. Mr. Rathgeber is Chief Compliance Officer of Fidelity Management & Research (Hong Kong) Limited (2008-present), Fidelity Management & Research (Japan) Inc. (2008-present), FMR (2005-present), FMR Co., Inc. (2005-present), Fidelity Management & Research (U.K.) Inc. (2005-present), Fidelity Research & Analysis Company (2005-present), Fidelity Investments Money Management, Inc. (2005-present), Pyramis Global Advisors, LLC (2005-present), and Strategic Advisers, Inc. (2005-present). |
Jeffrey S. Christian (49) |
| Year of Election or Appointment: 2009 Deputy Treasurer of the Fidelity funds. Mr. Christian is an employee of Fidelity Investments. Previously, Mr. Christian served as Chief Financial Officer (2008-2009) of certain Fidelity funds and Senior Vice President of Fidelity Pricing and Cash Management Services (FPCMS) (2004-2009). |
Bryan A. Mehrmann (49) |
| Year of Election or Appointment: 2005 Deputy Treasurer of the Fidelity funds. Mr. Mehrmann is an employee of Fidelity Investments. |
Adrien E. Deberghes (43) |
| Year of Election or Appointment: 2008 Deputy Treasurer of Fidelity's Equity and High Income Funds. Mr. Deberghes also serves as Assistant Treasurer of other Fidelity funds (2010-present) and is an employee of Fidelity Investments (2008-present). Previously, Mr. Deberghes served as Senior Vice President of Mutual Fund Administration at State Street Corporation (2007-2008), Senior Director of Mutual Fund Administration at Investors Bank & Trust (2005-2007), and Director of Finance for Dunkin' Brands (2000-2005). |
Stephanie J. Dorsey (41) |
| Year of Election or Appointment: 2010 Assistant Treasurer of Fidelity's Equity and High Income Funds. Ms. Dorsey also serves as Deputy Treasurer of other Fidelity funds (2008-present) and is an employee of Fidelity Investments (2008-present). Previously, Ms. Dorsey served as Treasurer (2004-2008) of the JPMorgan Mutual Funds and Vice President (2004-2008) of JPMorgan Chase Bank. |
John R. Hebble (52) |
| Year of Election or Appointment: 2009 Assistant Treasurer of Fidelity's Equity and High Income Funds. Mr. Hebble also serves as Treasurer and Chief Financial Officer of The North Carolina Capital Management Trust: Cash and Term Portfolio (2008-present), President and Treasurer of other Fidelity funds (2008-present) and is an employee of Fidelity Investments. |
Gary W. Ryan (52) |
| Year of Election or Appointment: 2005 Assistant Treasurer of the Fidelity funds. Mr. Ryan is an employee of Fidelity Investments. Previously, Mr. Ryan served as Vice President of Fund Reporting in Fidelity Pricing and Cash Management Services (FPCMS) (1999-2005). |
Jonathan Davis (42) |
| Year of Election or Appointment: 2010 Assistant Treasurer of the Fidelity funds. Mr. Davis is an employee of Fidelity Investments. Previously, Mr. Davis served as Vice President and Associate General Counsel of FMR LLC (2003-2010). |
Annual Report
Initial Class and Investor Class designate 100% of the dividends distributed during the fiscal year as qualifying for the dividends-received deduction for corporate shareholders.
Annual Report
Board Approval of Investment Advisory Contracts and Management Fees
VIP Industrials Portfolio
Each year, the Board of Trustees, including the Independent Trustees (together, the Board), votes on the renewal of the management contract and sub-advisory agreements (together, the Advisory Contracts) for the fund. The Board, assisted by the advice of fund counsel and Independent Trustees' counsel, requests and considers a broad range of information relevant to the renewal of the Advisory Contracts throughout the year.
The Board meets regularly and considers at each of its meetings factors that are relevant to its annual consideration of the renewal of the fund's Advisory Contracts, including the services and support provided to the fund and its shareholders. The Board has established various standing committees, each composed of Independent Trustees with varying backgrounds, to which the Board has assigned specific subject matter responsibilities in order to enhance effective decision-making by the Board. The Board, acting directly and through its Committees, requests and receives information concerning the annual consideration of the renewal of the fund's Advisory Contracts. The Board also meets as needed to consider matters specifically related to the Board's annual consideration of the renewal of Advisory Contracts. Members of the Board may also meet with trustees of other Fidelity funds through ad hoc joint committees to discuss certain matters relevant to the Fidelity funds.
At its July 2010 meeting, the Board of Trustees, including the Independent Trustees, unanimously determined to renew the fund's Advisory Contracts. In reaching its determination, the Board considered all factors it believed relevant, including (i) the nature, extent, and quality of the services to be provided to the fund and its shareholders (including the investment performance of the fund); (ii) the competitiveness of the fund's management fee and total expenses; (iii) the total costs of the services to be provided by and the profits to be realized by Fidelity from its relationship with the fund; (iv) the extent to which economies of scale would be realized as the fund grows; and (v) whether fee levels reflect these economies of scale, if any, for the benefit of fund shareholders.
In considering whether to renew the Advisory Contracts for the fund, the Board reached a determination, with the assistance of fund counsel and Independent Trustees' counsel and through the exercise of its business judgment, that the renewal of the Advisory Contracts is in the best interests of fund shareholders and that the compensation to be received by Fidelity under the management contract is fair and reasonable. The Board's decision to renew the Advisory Contracts was not based on any single factor noted above, but rather was based on a comprehensive consideration of all the information provided to the Board at its meetings throughout the year. The Board, in reaching its determination to renew the Advisory Contracts, is aware that shareholders in the fund have a broad range of investment choices available to them, including a wide choice among mutual funds offered by Fidelity's competitors, and that the fund's shareholders, with the opportunity to review and weigh the disclosure provided by the fund in its prospectus and other public disclosures, have chosen to invest in this fund, managed by Fidelity.
Nature, Extent, and Quality of Services Provided. The Board considered the staffing within the investment adviser, FMR, and the sub-advisers (together, the Investment Advisers), including the backgrounds of the fund's investment personnel and the fund's investment objective and discipline. The Independent Trustees also had discussions with senior management of Fidelity's investment operations and investment groups. The Board considered the structure of the portfolio manager compensation program and whether this structure provides appropriate incentives to act in the best interest of the fund.
Resources Dedicated to Investment Management and Support Services. The Board and the equity research subcommittee of the Board's Fund Oversight Committee reviewed the size, education, and experience of the Investment Advisers' investment staff, their use of technology, and the Investment Advisers' approach to recruiting, training, and retaining portfolio managers and other research, advisory, and management personnel. The Board noted that Fidelity's analysts have access to a variety of technological tools and market and securities data that enable them to perform both fundamental and quantitative analysis and to specialize in various disciplines. The Board considered Fidelity's extensive global research capabilities that enable the Investment Advisers to aggregate data from various sources in an effort to produce positive investment results. The Board also considered that Fidelity's portfolio managers and analysts have access to daily portfolio attribution that allows for monitoring of a fund's portfolio, as well as an electronic communication system that provides immediate real-time access to research concerning issuers and credit enhancers. The Board noted FMR's continued focus on strengthening the organization and discipline of equity portfolio management and research.
Shareholder and Administrative Services. The Board considered (i) the nature, extent, quality, and cost of advisory, administrative, and shareholder services performed by the Investment Advisers and their affiliates under the Advisory Contracts and under separate agreements covering transfer agency, pricing and bookkeeping, and securities lending services for the fund; (ii) the nature and extent of the investment adviser's supervision of third party service providers, principally custodians and subcustodians; and (iii) the resources devoted to, and the record of compliance with, the fund's compliance policies and procedures. The Board also reviewed the allocation of fund brokerage, including allocations to brokers affiliated with the Investment Advisers, the use of brokerage commissions to pay fund expenses, and the use of "soft" commission dollars to pay for research services.
The Board noted that the growth of fund assets over time across the complex allows Fidelity to reinvest in the development of services designed to enhance the value or convenience of the Fidelity funds as investment vehicles. These services include 24-hour access to account information and market information through phone representatives and over the Internet, and investor education materials and asset allocation tools.
Investment in a Large Fund Family. The Board considered the benefits to shareholders of investing in a Fidelity fund, including the benefits of investing in a fund that is part of a large family of funds offering a variety of investment disciplines and providing a large variety of mutual fund investor services. The Board noted that Fidelity had taken, or had made recommendations that resulted in the Fidelity funds taking, a number of actions over the previous year that benefited particular funds, including (i) dedicating additional resources to investment research and restructuring and broadening the focus of the investment research teams; (ii) bolstering the senior management team that oversees asset management; (iii) launching Class F of certain funds as a lower-fee class available to Freedom K and Freedom Index Funds; (iv) lowering the initial investment minimums and ongoing balance requirements for Real Estate High Income Fund; (v) eliminating subsequent purchase minimums for all funds and adding a waiver of the investment minimum requirement for new accounts opened with the proceeds of a systematic withdrawal plan; (vi) eliminating the withdrawal minimum and maximum limits for systematic withdrawals from Advisor funds; (vii) expanding sales load waivers on Class A shares for Destiny Planholders and expanding Institutional Class eligibility for Class O Destiny Planholders; and (viii) changing certain Class A and Class T sales charge structures to further align them with industry practices.
Annual Report
Board Approval of Investment Advisory Contracts and Management Fees - continued
Investment Performance. The Board considered whether the fund has operated in accordance with its investment objective, as well as its record of compliance with its investment restrictions. It also reviewed the fund's absolute investment performance for each class, as well as the fund's relative investment performance for each class measured over multiple periods against a third-party-sponsored index that reflects the market sector in which the fund invests. The Board noted that FMR does not believe that a meaningful peer group exists against which to compare the fund's performance. The following charts considered by the Board show, over the one-, three-, and five-year periods ended December 31, 2009, as available, the cumulative total returns of Initial Class and Investor Class of the fund and the cumulative total returns of a third-party-sponsored index ("benchmark").
VIP Industrials Portfolio
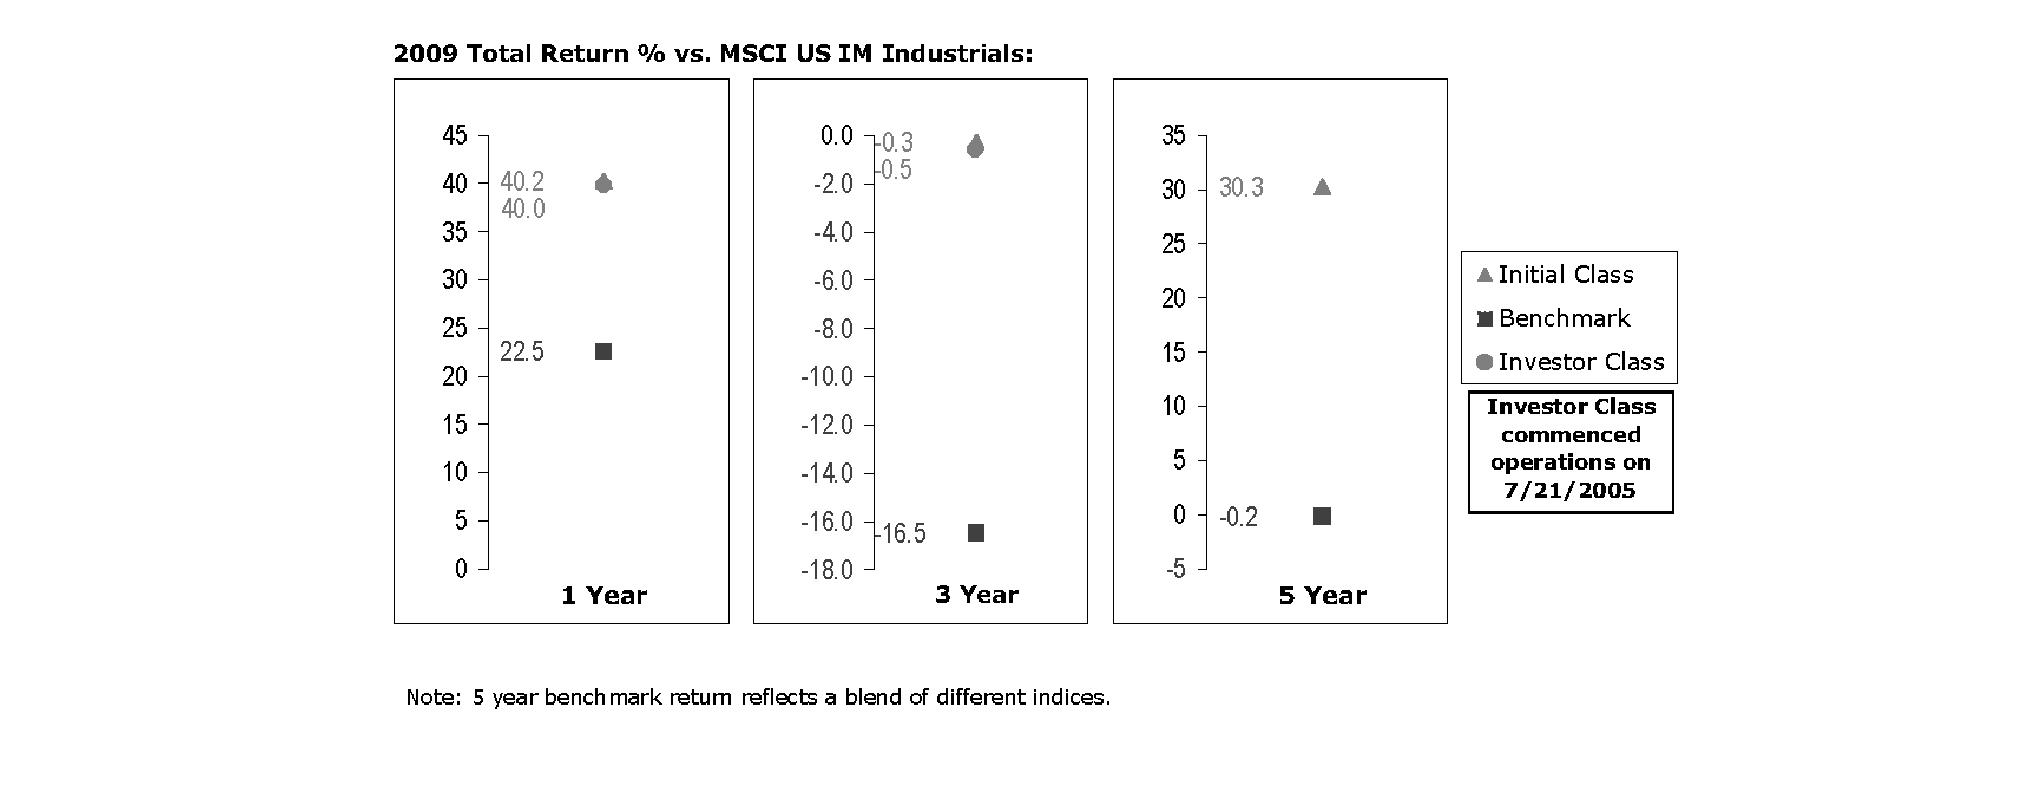
The Board noted that the investment performance of Initial Class of the fund compared favorably to its benchmark for all the periods shown. The Board considered that the variations in performance between the fund's classes reflect the variations in class expenses, which result in lower performance for the higher expense class. The Board also reviewed the fund's performance since inception as well as performance in the current year.
Based on its review, and giving particular weight to the nature and quality of the resources dedicated by the Investment Advisers to maintain and improve relative performance and factoring in the unprecedented market events in recent years, the Board concluded that the nature, extent, and quality of investment management and support services and of shareholder and administrative services provided to the fund will benefit the fund's shareholders, particularly in light of the Board's view that the fund's shareholders benefit from investing in a fund that is part of a large family of funds offering a variety of investment disciplines and services.
Competitiveness of Management Fee and Total Fund Expenses. The Board considered the fund's management fee and total expenses compared to "mapped groups" of competitive funds and classes. Fidelity creates "mapped groups" by combining similar Lipper investment objective categories that have comparable management fee characteristics. Combining Lipper investment objective categories aids the Board's management fee and total expense comparisons by broadening the competitive group used for comparison and by reducing the number of universes to which various Fidelity funds are compared.
Management Fee. The Board considered two proprietary management fee comparisons for the 12-month periods shown in the chart below. The group of Lipper funds used by the Board for management fee comparisons is referred to below as the "Total Mapped Group." The Total Mapped Group comparison focuses on a fund's standing relative to the total universe of comparable funds available to investors, in terms of gross management fees before expense reimbursements or caps. "TMG %" represents the percentage of funds in the Total Mapped Group that had management fees that were lower than the fund's. For example, a TMG % of 3% means that 97% of the funds in the Total Mapped Group had higher management fees than the fund. The "Asset-Size Peer Group" (ASPG) comparison focuses on a fund's standing relative to non-Fidelity funds similar in size to the fund within the Total Mapped Group. The ASPG represents at least 15% of the funds in the Total Mapped Group with comparable asset size and management fee characteristics, subject to a minimum of 50 funds (or all funds in the Total Mapped Group if fewer than 50). Additional information, such as the ASPG quartile in which the fund's management fee ranked, is also included in the chart and considered by the Board.
Annual Report
VIP Industrials Portfolio
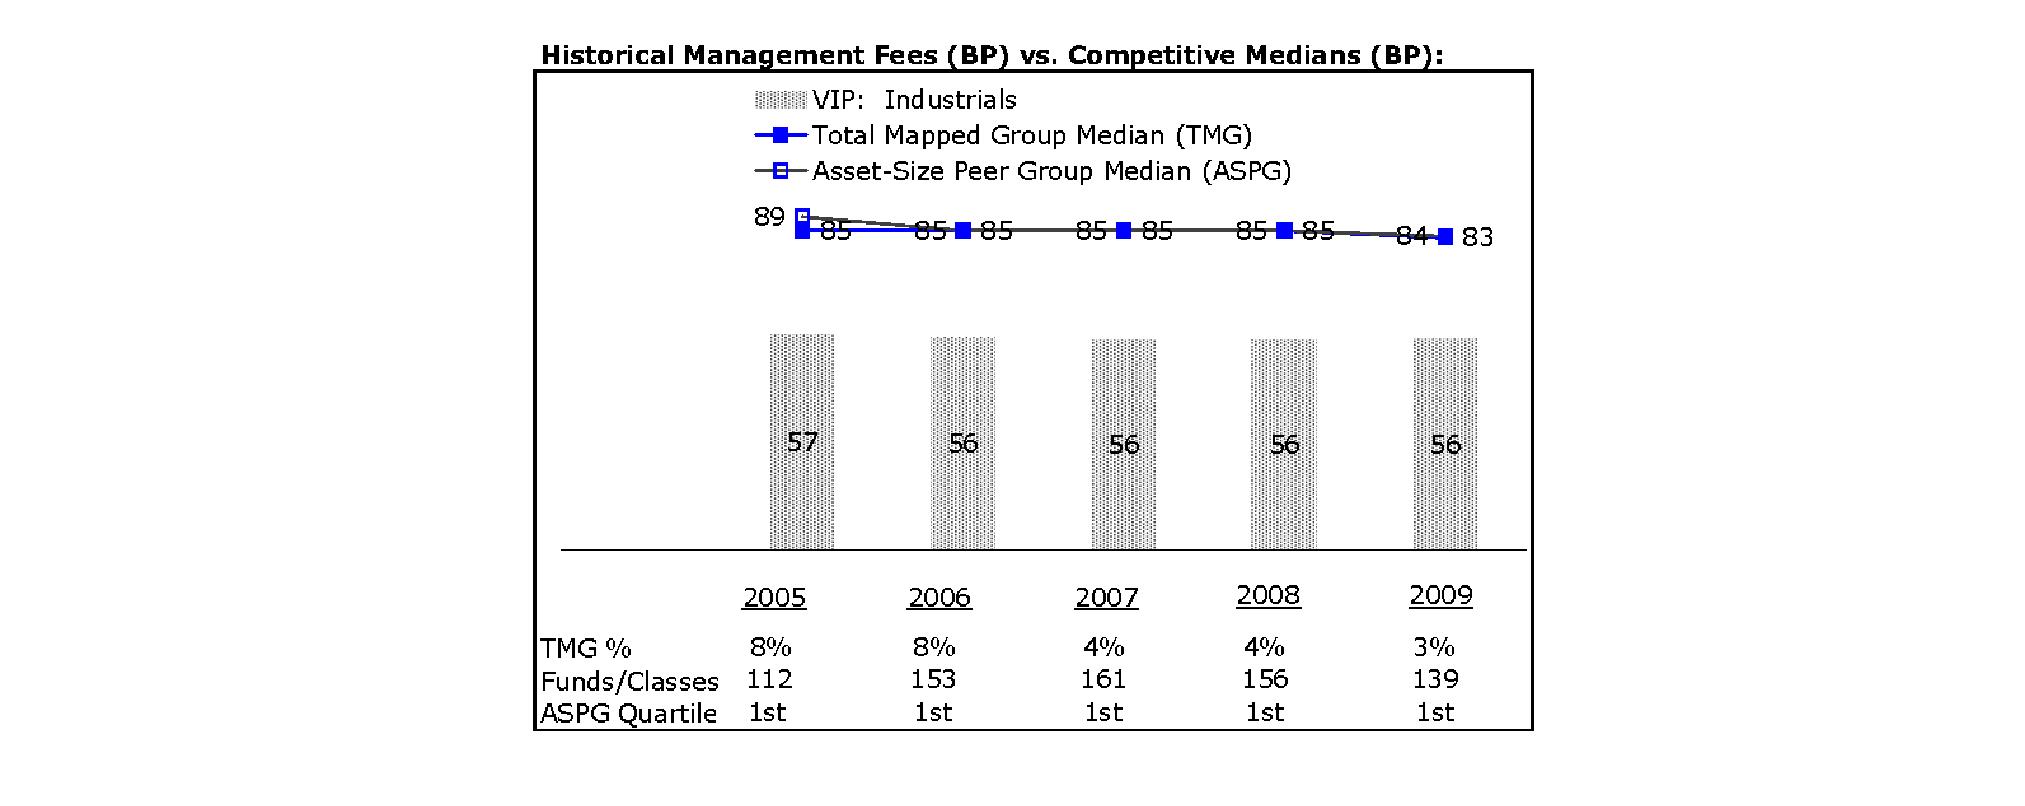
The Board noted that the fund's management fee ranked below the median of its Total Mapped Group and below the median of its ASPG for 2009.
Based on its review, the Board concluded that the fund's management fee is fair and reasonable in light of the services that the fund receives and the other factors considered.
Total Expenses. In its review of each class's total expenses, the Board considered the fund's management fee as well as other fund or class expenses, as applicable, such as transfer agent fees, pricing and bookkeeping fees, and custodial, legal, and audit fees. The Board also noted the effects of any waivers and reimbursements on fees and expenses. As part of its review, the Board also considered current and historical total expenses of each class of the fund compared to competitive fund median expenses. Each class of the fund is compared to those funds and classes in the Total Mapped Group (used by the Board for management fee comparisons) that have a similar sales load structure.
The Board noted that the total expenses of each class ranked below its competitive median for 2009.
Fees Charged to Other Fidelity Clients. The Board also considered Fidelity fee structures and other information with respect to clients of FMR and its affiliates, such as other mutual funds advised or subadvised by FMR or its affiliates, pension plan clients, and other institutional clients. In March 2010, the Board created an ad hoc joint committee with the board of other Fidelity funds (the Committee) to review and compare Fidelity's institutional investment advisory business with its business of providing services to the Fidelity funds, including the differences in services provided, fees charged, and costs incurred, as well as competition in their respective marketplaces.
Based on its review of total expenses and fees charged to other Fidelity clients, the Board concluded that the total expenses of each class of the fund were reasonable in light of the services that the fund and its shareholders receive and the other factors considered, including the findings of the Committee.
Costs of the Services and Profitability. The Board considered the revenues earned and the expenses incurred by Fidelity in conducting the business of developing, marketing, distributing, managing, administering and servicing the fund and its shareholders. The Board also considered the level of Fidelity's profits in respect of all the Fidelity funds.
On an annual basis, FMR presents to the Board Fidelity's profitability for the fund. Fidelity calculates the profitability for each fund, as well as aggregate profitability for groups of Fidelity funds and all Fidelity funds, using a series of detailed revenue and cost allocation methodologies which originate with the audited books and records of Fidelity. The Audit Committee of the Board reviews any significant changes from the prior year's methodologies.
PricewaterhouseCoopers LLP (PwC), independent registered public accounting firm and auditor to Fidelity and certain Fidelity funds, has been engaged annually by the Board as part of the Board's assessment of Fidelity's profitability analysis. PwC's engagement includes the review and assessment of Fidelity's methodologies used in determining the revenues and expenses attributable to Fidelity's mutual fund business, and completion of agreed-upon procedures surrounding the mathematical accuracy of fund profitability and its conformity to allocation methodologies. After considering PwC's reports issued under the engagement and information provided by Fidelity, the Board believes that while other allocation methods may also be reasonable, Fidelity's profitability methodologies are reasonable in all material respects.
Annual Report
Board Approval of Investment Advisory Contracts and Management Fees - continued
The Board has also reviewed Fidelity's non-fund businesses and fall-out benefits related to the mutual fund business as well as cases where Fidelity's affiliates may benefit from or be related to the fund's business.
The Board considered the costs of the services provided by and the profits realized by Fidelity in connection with the operation of the fund and were satisfied that the profitability was not excessive in the circumstances.
Economies of Scale. The Board considered whether there have been economies of scale in respect of the management of the Fidelity funds, whether the Fidelity funds (including the fund) have appropriately benefited from any such economies of scale, and whether there is potential for realization of any further economies of scale. The Board considered the extent to which the fund will benefit from economies of scale through increased services to the fund, through waivers or reimbursements, or through fee or expense reductions.
In February 2009, the Board and the board of other Fidelity funds created an ad hoc committee (the Economies of Scale Committee) to analyze whether FMR attains economies of scale in respect of the management and servicing of the Fidelity funds, whether the Fidelity funds have appropriately benefited from such economies of scale, and whether there is potential for realization of any further economies of scale.
The Board recognized that the fund's management contract incorporates a "group fee" structure, which provides for lower group fee rates as total fund assets under FMR's management increase, and for higher group fee rates as total fund assets under FMR's management decrease. FMR calculates the group fee rates based on a tiered asset "breakpoint" schedule that varies based on asset class. The Board considered that the group fee is designed to deliver the benefits of economies of scale to fund shareholders when total Fidelity fund assets increase, even if assets of any particular fund are unchanged or have declined, because some portion of Fidelity's costs are attributable to services provided to all Fidelity funds, and all funds benefit if those costs can be allocated among more assets. The Board concluded that, given the group fee structure, fund shareholders will benefit from lower management fees as assets under FMR's management increase at the fund complex level, regardless of whether Fidelity achieves any such economies of scale.
The Board concluded, considering the findings of the Economies of Scale Committee, that any potential economies of scale are being appropriately shared between fund shareholders and Fidelity.
Additional Information Requested by the Board. In order to develop fully the factual basis for consideration of the Fidelity funds' Advisory Contracts, the Board requested and received additional information on certain topics, including (i) fund performance trends, actions to be taken by FMR to improve certain funds' overall performance, and Fidelity's long-term strategies for certain funds; (ii) portfolio manager changes that have occurred during the past year and length of portfolio manager tenure for different categories of funds over time; (iii) Fidelity's compensation structure for portfolio managers, research analysts, and other key personnel, the rationale for the compensation structure, and how the compensation structure provides appropriate performance incentives; (iv) the amount of the investment that each portfolio manager has made in the Fidelity fund(s) that he or she manages; (v) management and other fees paid by FMR to affiliated sub-advisers on behalf of the Fidelity funds; (vi) Fidelity's fee structures and rationale for recommending different fees among different categories of funds; (vii) Fidelity's rationale for recommending which funds should have a performance adjustment component as part of their management fees; (viii) the rationale for any differences between fund fee structures and fee structures in place for other Fidelity clients; and (ix) explanations regarding the relative total expenses borne by certain funds and classes, total expense competitive trends, and actions that might be taken by FMR to reduce total expenses for certain funds and classes.
Based on its evaluation of all of the conclusions noted above, and after considering all factors it believed relevant, the Board ultimately concluded that the advisory fee structures are fair and reasonable, and that the fund's Advisory Contracts should be renewed.
Annual Report
Investment Adviser
Fidelity Management & Research Company
Boston, MA
Investment Sub-Advisers
FMR Co., Inc.
Fidelity Management & Research (U.K.) Inc.
Fidelity Management & Research (Hong Kong) Limited
Fidelity Management & Research (Japan) Inc.
General Distributor
Fidelity Distributors Corporation
Boston, MA
Transfer and Service Agents
Fidelity Investments Institutional Operations Company, Inc.
Boston, MA
Fidelity Service Company, Inc.
Boston, MA
Custodian
JPMorgan Chase Bank
New York, NY
VCYLIC-ANN-0211
1.817361.105
Fidelity® Variable Insurance Products:
International Capital Appreciation Portfolio
Annual Report
December 31, 2010
(2_fidelity_logos) (Registered_Trademark)
Contents
Performance | <Click Here> | How the fund has done over time. |
Management's Discussion of Fund Performance | <Click Here> | The Portfolio Manager's review of fund performance and strategy. |
Shareholder Expense Example | <Click Here> | An example of shareholder expenses. |
Investment Changes | <Click Here> | A summary of major shifts in the fund's investments over the past six months. |
Investments | <Click Here> | A complete list of the fund's investments with their market values. |
Financial Statements | <Click Here> | Statements of assets and liabilities, operations, and changes in net assets, as well as financial highlights. |
Notes | <Click Here> | Notes to the financial statements. |
Report of Independent Registered Public Accounting Firm | <Click Here> | |
Trustees and Officers | <Click Here> | |
Distributions | <Click Here> | |
Board Approval of Investment Advisory Contracts and Management Fees | <Click Here> | |
To view a fund's proxy voting guidelines and proxy voting record for the 12-month period ended June 30, visit http://www.fidelity.com/proxyvotingresults or visit the Securities and Exchange Commission's (SEC) web site at http://www.sec.gov. You may also call 1-877-208-0098 to request a free copy of the proxy voting guidelines.
Fidelity Variable Insurance Products are separate account options which are purchased through a variable insurance contract.
Standard & Poor's, S&P and S&P 500 are registered service marks of The McGraw-Hill Companies, Inc. and have been licensed for use by Fidelity Distributors Corporation.
Other third party marks appearing herein are the property of their respective owners.
All other marks appearing herein are registered or unregistered trademarks or service marks of FMR LLC or an affiliated company.
The general research services agreement with Fidelity Research & Analysis Company has been terminated and is no longer in effect for the fund.
This report and the financial statements contained herein are submitted for the general information of the shareholders of the fund. This report is not authorized for distribution to prospective investors in the fund unless preceded or accompanied by an effective prospectus.
A fund files its complete schedule of portfolio holdings with the SEC for the first and third quarters of each fiscal year on Form N-Q. Forms N-Q are available on the SEC's web site at http://www.sec.gov. A fund's Forms N-Q may be reviewed and copied at the SEC's Public Reference Room in Washington, DC. Information regarding the operation of the SEC's Public Reference Room may be obtained by calling 1-800-SEC-0330. For a complete list of a fund's portfolio holdings, view the most recent holdings listing, semiannual report, or annual report on Fidelity's web site at http://www.fidelity.com, http://www.advisor.fidelity.com, or http://www.401k.com, as applicable.
NOT FDIC INSURED • MAY LOSE VALUE • NO BANK GUARANTEE
Neither the fund nor Fidelity Distributors Corporation is a bank.
Annual Report
Average annual total return reflects the change in the value of an investment, assuming reinvestment of the class' distributions from dividend income and capital gains (the profits earned upon the sale of securities that have grown in value, if any) and assuming a constant rate of performance each year. During periods of reimbursement by Fidelity, a fund's total return will be greater than it would be had the reimbursement not occurred. Performance numbers are net of all underlying fund operating expenses, but do not include any insurance charges imposed by your insurance company's separate account. If performance information included the effect of these additional charges, the total returns would have been lower. How a fund did yesterday is no guarantee of how it will do tomorrow.
Average Annual Total Returns
Periods ended December 31, 2010 | Past 1
Year | Past 5
Years | Life of
fundA |
VIP International Capital Appreciation Portfolio - Initial Class | 15.73% | 1.40% | 3.55% |
VIP International Capital Appreciation Portfolio - Service Class | 15.65% | 1.29% | 3.43% |
VIP International Capital Appreciation Portfolio - Service Class 2 | 15.53% | 1.16% | 3.30% |
VIP International Capital Appreciation Portfolio - Initial Class R | 15.73% | 1.41% | 3.55% |
VIP International Capital Appreciation Portfolio - Service Class R | 15.65% | 1.29% | 3.43% |
VIP International Capital Appreciation Portfolio - Service Class 2R | 15.45% | 1.14% | 3.28% |
VIP International Capital Appreciation Portfolio - Investor Class R B | 15.69% | 1.29% | 3.45% |
A From December 22, 2004.
B The initial offering of Investor Class R shares took place on July 21, 2005. Returns prior to July 21, 2005 are those of Initial Class R. Had Investor Class R's transfer agent fee had been reflected, returns prior to July 21, 2005, would have been lower.
$10,000 Over Life of Fund
Let's say hypothetically that $10,000 was invested in VIP International Capital Appreciation Portfolio - Initial Class on December 22, 2004, when the fund started. The chart shows how the value of your investment would have changed, and also shows how the MSCI® ACWI® (All Country World Index) ex USA Index performed over the same period.
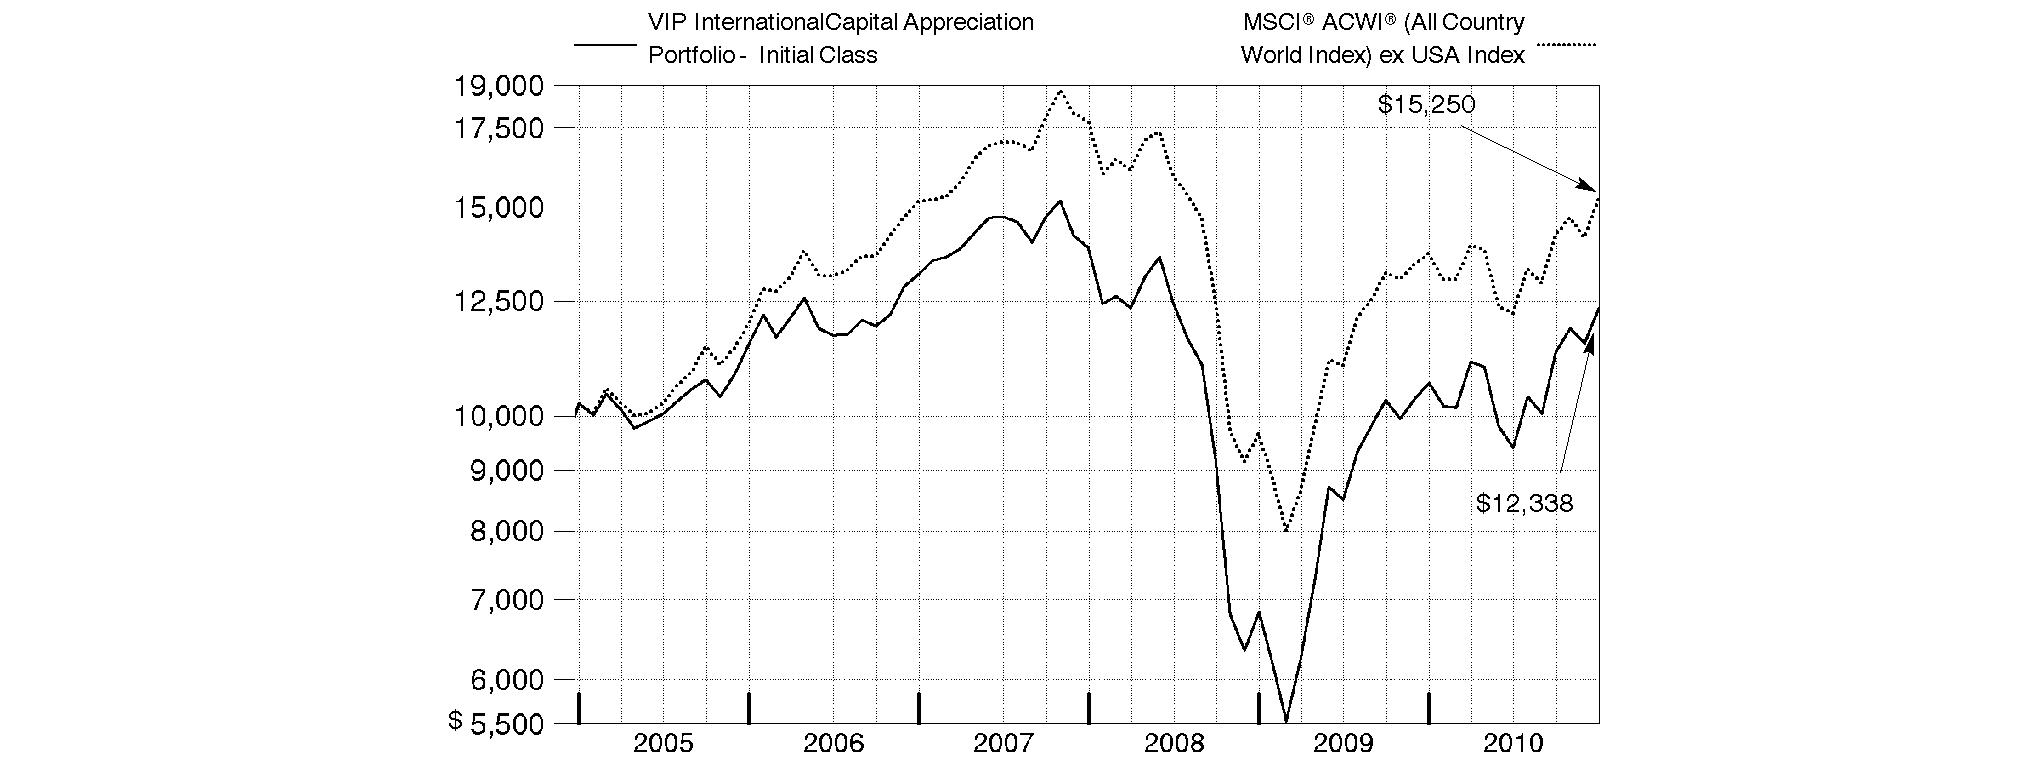
Annual Report
Market Recap: While market improvements around the world hit a speed bump in the first half of the 12-month period ending December 31, 2010, world economies re-accelerated in August, supported by a broadening recovery and low inflation in the U.S. Domestic stock markets recorded solid gains for the year, lifted by a strong second-half rally fueled by economic optimism, encouraging earnings reports and a wave of corporate mergers. The large-cap S&P 500® Index rose 15.06%, the blue-chip-laden Dow Jones Industrial AverageSM added 14.06% and the technology-heavy Nasdaq Composite® Index climbed 18.02%. Meanwhile, international stocks, as represented by the MSCI® ACWI® (All Country World Index) ex USA Index, gained 11.29%, boosted in part by a depreciating U.S. dollar. In the fixed-income arena, U.S. taxable investment-grade bonds generated positive results during 2010, as the Barclays Capital® U.S. Aggregate Bond Index gained 6.54%. With ultra-low interest rates bolstering nearly all fixed-income securities for most of the year, sectors in the index with higher yields and more credit risk generally fared best, while most high-quality bonds generated more-moderate returns. Meanwhile, high-yield bonds, as represented by The BofA Merrill LynchSM US High Yield Constrained Index, returned 15.07%, a result of improved economic data and strengthening investor demand. Overseas, foreign bond markets showed mixed results, with a sizable disparity between the 3.97% return of the Citigroup® Non-U.S. Group of 7 Index - which measures the performance of sovereign debt of the major global economies outside the U.S. - and the 12.04% advance of the JPMorgan Emerging Markets Bond Index Global (EMBI Global), which benefited from the rising overall credit quality of emerging-markets debt issuers.
Comments from Sammy Simnegar, Portfolio Manager of VIP International Capital Appreciation Portfolio: For the 12 months ending December 31, 2010, the fund's share classes finished well ahead of the 11.29% return of the MSCI® ACWI® (All Country World Index) ex USA Index. (For specific portfolio results, please refer to the performance section of this report.) Stock selection in materials and consumer discretionary stood out as strong contributors to relative performance, with stock picking in energy and an underweighting in utilities helping to a lesser extent. Geographically, a sizable out-of-benchmark stake in the United States bolstered performance. My picks in Canada, South Korea and Brazil also were rewarding, as was an underweighting in Japan. Three of the fund's four largest individual contributors were from the materials sector. The top contributor was Aurcana, a small Canadian miner of silver and other metals, with properties in Mexico and Texas. As the price of silver ran up from below $20 per ounce around midyear to more than $30 at the end of December, the company's stock had a strong run as well. Also lifting performance were two Canadian producers of metallurgical coal - that is, coal used to make steel - Western Coal and Grande Cache Coal. Other notable contributors were casino operator Las Vegas Sands and Taiwan-based handset manufacturer HTC. Conversely, security selection in financials, telecommunication services and industrials dampened the fund's gain. Among countries, weak picks in India and an underweighting in Canada were negatives. OPTI Canada, a small Canadian oil company in the process of ramping up production at several sites, hampered performance. The need to raise capital through the sale of bonds hurt the stock. Prime View International, which supplies displays for Amazon.com's KindleTM e-reader, also had a negative impact. Underweighting Australian metals miner BHP Billiton worked against the fund, especially given the stock's strong gain late in the period. Lastly, small positions in two foreign banks that sold off sharply due to sovereign debt concerns, National Bank of Greece and Allied Irish Bank, dampened results. Most of the stocks mentioned in this report were out-of-index positions, and a number of them were sold from the fund by period end.
The views expressed above reflect those of the portfolio manager(s) only through the end of the period as stated on the cover of this report and do not necessarily represent the views of Fidelity or any other person in the Fidelity organization. Any such views are subject to change at any time based upon market or other conditions and Fidelity disclaims any responsibility to update such views. These views may not be relied on as investment advice and, because investment decisions for a Fidelity fund are based on numerous factors, may not be relied on as an indication of trading intent on behalf of any Fidelity fund.
Annual Report
As a shareholder of the Fund, you incur two types of costs: (1) transaction costs, including redemption fees, and (2) ongoing costs, including management fees, distribution and/or service (12b-1) fees and other Fund expenses. This Example is intended to help you understand your ongoing costs (in dollars) of investing in the Fund and to compare these costs with the ongoing costs of investing in other mutual funds.
The Example is based on an investment of $1,000 invested at the beginning of the period and held for the entire period (July 1, 2010 to December 31, 2010).
Actual Expenses
The first line of the accompanying table for each class of the Fund provides information about actual account values and actual expenses. You may use the information in this line, together with the amount you invested, to estimate the expenses that you paid over the period. Simply divide your account value by $1,000.00 (for example, an $8,600 account value divided by $1,000.00 = 8.6), then multiply the result by the number in the first line for a class of the Fund under the heading entitled "Expenses Paid During Period" to estimate the expenses you paid on your account during this period. The estimate of expenses does not include any fees or other expenses of any variable annuity or variable life insurance product. If they were, the estimate of expenses you paid during the period would be higher, and your ending account value would be lower. In addition, the Fund, as a shareholder in the underlying Fidelity Central Funds, will indirectly bear its pro-rata share of the fees and expenses incurred by the underlying Fidelity Central Funds. These fees and expenses are not included in the Fund's annualized expense ratio used to calculate the expense estimate in the table below.
Hypothetical Example for Comparison Purposes
The second line of the accompanying table for each class of the Fund provides information about hypothetical account values and hypothetical expenses based on a Class' actual expense ratio and an assumed rate of return of 5% per year before expenses, which is not the Class' actual return. The hypothetical account values and expenses may not be used to estimate the actual ending account balance or expenses you paid for the period. You may use this information to compare the ongoing costs of investing in the Fund and other funds. To do so, compare this 5% hypothetical example with the 5% hypothetical examples that appear in the shareholder reports of the other funds. The estimate of expenses does not include any fees or other expenses of any variable annuity or variable life insurance product. If they were, the estimate of expenses you paid during the period would be higher, and your ending account value would be lower. In addition, the Fund, as a shareholder in the underlying Fidelity Central Funds, will indirectly bear its pro-rata share of the fees and expenses incurred by the underlying Fidelity Central Funds. These fees and expenses are not included in the Fund's annualized expense ratio used to calculate the expense estimate in the table below.
Please note that the expenses shown in the table are meant to highlight your ongoing costs only and do not reflect any transaction costs. Therefore, the second line of the table is useful in comparing ongoing costs only, and will not help you determine the relative total costs of owning different funds. In addition, if these transactional costs were included, your costs would have been higher.
| Annualized
Expense Ratio | Beginning
Account Value
July 1, 2010 | Ending
Account Value
December 31, 2010 | Expenses Paid
During Period*
July 1, 2010 to
December 31, 2010 |
Initial Class | 1.10% | | | |
Actual | | $ 1,000.00 | $ 1,311.50 | $ 6.41 |
HypotheticalA | | $ 1,000.00 | $ 1,019.66 | $ 5.60 |
Service Class | 1.20% | | | |
Actual | | $ 1,000.00 | $ 1,311.00 | $ 6.99 |
HypotheticalA | | $ 1,000.00 | $ 1,019.16 | $ 6.11 |
Service Class 2 | 1.35% | | | |
Actual | | $ 1,000.00 | $ 1,309.90 | $ 7.86 |
HypotheticalA | | $ 1,000.00 | $ 1,018.40 | $ 6.87 |
Initial Class R | 1.10% | | | |
Actual | | $ 1,000.00 | $ 1,311.50 | $ 6.41 |
HypotheticalA | | $ 1,000.00 | $ 1,019.66 | $ 5.60 |
Service Class R | 1.20% | | | |
Actual | | $ 1,000.00 | $ 1,311.00 | $ 6.99 |
HypotheticalA | | $ 1,000.00 | $ 1,019.16 | $ 6.11 |
Service Class 2R | 1.35% | | | |
Actual | | $ 1,000.00 | $ 1,310.70 | $ 7.86 |
HypotheticalA | | $ 1,000.00 | $ 1,018.40 | $ 6.87 |
Investor Class R | 1.18% | | | |
Actual | | $ 1,000.00 | $ 1,311.90 | $ 6.88 |
HypotheticalA | | $ 1,000.00 | $ 1,019.26 | $ 6.01 |
A 5% return per year before expenses
* Expenses are equal to each Class' annualized expense ratio, multiplied by the average account value over the period, multiplied by 184/365 (to reflect the one-half year period).
Annual Report
Investment Changes (Unaudited)
Geographic Diversification (% of fund's net assets) |
As of December 31, 2010 |
| United Kingdom | 12.1% | |
| Japan | 9.3% | |
| United States of America | 7.1% | |
| India | 6.9% | |
| Cayman Islands | 6.7% | |
| Brazil | 5.6% | |
| France | 5.1% | |
| Russia | 4.9% | |
| Switzerland | 4.3% | |
| Other | 38.0% | |

Percentages are adjusted for the effect of futures contracts, if applicable. |
As of June 30, 2010 |
| Japan | 13.0% | |
| United States of America | 12.6% | |
| United Kingdom | 11.8% | |
| France | 8.3% | |
| Canada | 6.1% | |
| Netherlands | 4.8% | |
| Germany | 4.7% | |
| Spain | 4.4% | |
| Brazil | 3.7% | |
| Other | 30.6% | |

Percentages are adjusted for the effect of futures contracts, if applicable. |
Asset Allocation as of December 31, 2010 |
| % of fund's
net assets | % of fund's net assets
6 months ago |
Stocks | 98.5 | 98.7 |
Bonds | 0.0 | 0.5 |
Short-Term Investments and Net Other Assets | 1.5 | 0.8 |
Top Ten Stocks as of December 31, 2010 |
| % of fund's
net assets | % of fund's net assets
6 months ago |
Royal Dutch Shell PLC Class B (United Kingdom, Oil, Gas & Consumable Fuels) | 1.7 | 0.0 |
Nestle SA (Switzerland, Food Products) | 1.7 | 0.0 |
HSBC Holdings PLC sponsored ADR (United Kingdom, Commercial Banks) | 1.6 | 0.0 |
BP PLC (United Kingdom, Oil, Gas & Consumable Fuels) | 1.3 | 0.0 |
Aurcana Corp. unit (Canada, Metals & Mining) | 1.2 | 0.0 |
Banco Santander SA sponsored ADR (Spain, Commercial Banks) | 1.0 | 1.7 |
Unilever NV unit (Netherlands, Food Products) | 1.0 | 1.2 |
Telefonica SA sponsored ADR (Spain, Diversified Telecommunication Services) | 1.0 | 1.2 |
British American Tobacco PLC (United Kingdom) (United Kingdom, Tobacco) | 0.9 | 1.0 |
Mitsubishi UFJ Financial Group, Inc. sponsored ADR (Japan, Commercial Banks) | 0.9 | 0.0 |
| 12.3 | |
Market Sectors as of December 31, 2010 |
| % of fund's
net assets | % of fund's net assets
6 months ago |
Consumer Discretionary | 25.0 | 10.8 |
Financials | 21.0 | 26.8 |
Consumer Staples | 13.9 | 8.9 |
Materials | 10.9 | 12.4 |
Energy | 9.0 | 6.0 |
Industrials | 8.5 | 9.5 |
Information Technology | 7.6 | 11.5 |
Telecommunication Services | 1.6 | 5.1 |
Utilities | 0.5 | 3.6 |
Health Care | 0.5 | 4.6 |
Annual Report
Investments December 31, 2010
Showing Percentage of Net Assets
Common Stocks - 97.2% |
| Shares | | Value |
Bahamas (Nassau) - 0.2% |
Petrominerales Ltd. | 3,444 | | $ 114,512 |
Belgium - 1.2% |
Anheuser-Busch InBev SA NV | 5,560 | | 318,163 |
KBC Groupe SA (a) | 6,815 | | 232,347 |
TOTAL BELGIUM | | 550,510 |
Bermuda - 2.0% |
China Yurun Food Group Ltd. | 64,000 | | 210,383 |
Credicorp Ltd. (NY Shares) | 1,998 | | 237,582 |
Huabao International Holdings Ltd. | 145,000 | | 234,686 |
Petra Diamonds Ltd. (a) | 107,082 | | 227,207 |
TOTAL BERMUDA | | 909,858 |
Brazil - 5.6% |
Anhanguera Educacional Participacoes SA | 10,047 | | 242,162 |
Banco do Brasil SA | 14,100 | | 266,953 |
BR Malls Participacoes SA | 23,500 | | 242,144 |
Cia Hering SA | 15,000 | | 244,042 |
Companhia de Bebidas das Americas (AmBev) (PN) sponsored ADR | 9,580 | | 297,267 |
Iguatemi Empresa de Shopping
Centers SA | 9,300 | | 232,563 |
Itau Unibanco Banco Multiplo SA ADR (e) | 15,000 | | 360,150 |
Marisa Lojas SA | 15,300 | | 231,959 |
Mills Estruturas e Servicos de Engenharia SA (a) | 18,200 | | 225,917 |
Natura Cosmeticos SA | 8,000 | | 229,894 |
TOTAL BRAZIL | | 2,573,051 |
British Virgin Islands - 1.1% |
ReneSola Ltd. sponsored ADR (a)(d) | 24,700 | | 215,878 |
Sable Mining Africa Ltd. (a) | 715,000 | | 290,032 |
TOTAL BRITISH VIRGIN ISLANDS | | 505,910 |
Canada - 3.8% |
Aurcana Corp. unit (a) | 557,900 | | 538,251 |
Goldcorp, Inc. | 6,500 | | 299,027 |
Petrobank Energy & Resources Ltd. (a) | 5,600 | | 141,783 |
Suncor Energy, Inc. | 10,200 | | 391,513 |
Teck Resources Ltd. Class B (sub. vtg.) | 5,700 | | 353,157 |
TOTAL CANADA | | 1,723,731 |
Cayman Islands - 6.7% |
Ajisen (China) Holdings Ltd. | 153,000 | | 257,083 |
Belle International Holdings Ltd. | 136,000 | | 229,918 |
Bosideng International Holdings Ltd. | 520,000 | | 207,398 |
China ZhengTong Auto Services Holdings Ltd. | 242,000 | | 228,223 |
Ctrip.com International Ltd. sponsored ADR (a) | 5,755 | | 232,790 |
E-Commerce China Dangdang, Inc. ADR | 4,400 | | 119,108 |
Hengan International Group Co. Ltd. | 26,500 | | 228,604 |
|
| Shares | | Value |
Hengdeli Holdings Ltd. | 392,000 | | $ 233,510 |
Maoye International Holdings Ltd. | 498,000 | | 224,893 |
Peak Sport Products Co. Ltd. | 330,000 | | 216,533 |
Shenguan Holdings Group Ltd. | 172,000 | | 225,276 |
Silver Base Group Holdings Ltd. | 271,000 | | 240,928 |
Trina Solar Ltd. ADR (a)(d) | 8,900 | | 208,438 |
Vinda International Holdings Ltd. | 201,000 | | 222,141 |
TOTAL CAYMAN ISLANDS | | 3,074,843 |
China - 1.8% |
Baidu.com, Inc. sponsored ADR (a) | 2,100 | | 202,713 |
Golden Eagle Retail Group Ltd. (H Shares) | 93,000 | | 229,254 |
Lentuo International, Inc. ADR | 22,600 | | 158,200 |
Shandong Weigao Group Medical Polymer Co. Ltd. (H Shares) | 84,000 | | 238,302 |
TOTAL CHINA | | 828,469 |
Colombia - 0.5% |
BanColombia SA sponsored ADR | 3,900 | | 241,449 |
Cyprus - 0.5% |
AFI Development PLC: | | | |
(B Shares) (a) | 151,700 | | 160,802 |
GDR (Reg. S) | 47,000 | | 50,055 |
TOTAL CYPRUS | | 210,857 |
Denmark - 1.0% |
Carlsberg AS Series B | 2,400 | | 240,413 |
Pandora A/S | 3,500 | | 210,927 |
TOTAL DENMARK | | 451,340 |
Finland - 0.7% |
Nokia Corp. sponsored ADR | 33,300 | | 343,656 |
France - 5.1% |
Atos Origin SA (a) | 4,506 | | 240,017 |
BNP Paribas SA | 6,069 | | 386,320 |
Casino Guichard Perrachon et Compagnie | 2,485 | | 242,372 |
Christian Dior SA | 1,700 | | 242,973 |
LVMH Moet Hennessy - Louis Vuitton | 2,059 | | 338,880 |
PPR SA | 1,500 | | 238,655 |
Schneider Electric SA | 2,176 | | 325,843 |
Societe Generale Series A | 6,024 | | 323,935 |
TOTAL FRANCE | | 2,338,995 |
Germany - 2.1% |
Bayerische Motoren Werke AG (BMW) | 3,691 | | 290,417 |
Daimler AG (Germany) (a) | 5,858 | | 397,325 |
HeidelbergCement AG | 4,119 | | 258,283 |
TOTAL GERMANY | | 946,025 |
Hong Kong - 0.5% |
Emperor Watch & Jewellery Ltd. | 1,630,000 | | 234,879 |
Common Stocks - continued |
| Shares | | Value |
India - 6.9% |
Adani Enterprises Ltd. | 15,636 | | $ 227,271 |
Asian Paints India Ltd. | 3,426 | | 220,574 |
Bank of Baroda | 10,821 | | 224,608 |
Crompton Greaves Ltd. | 31,139 | | 215,858 |
Gitanjali Gems Ltd. | 50,017 | | 235,193 |
Housing Development Finance Corp. Ltd. | 16,464 | | 268,192 |
INFO Edge India Ltd. | 1,844 | | 27,254 |
Infrastructure Development Finance Co. Ltd. | 63,280 | | 258,427 |
ITC Ltd. | 61,575 | | 240,516 |
Jain Irrigation Systems Ltd. | 47,966 | | 225,495 |
Rural Electrification Corp. Ltd. | 34,763 | | 232,544 |
Sun TV Ltd. | 19,689 | | 231,578 |
Titan Industries Ltd. | 2,937 | | 236,139 |
United Spirits Ltd. | 7,512 | | 245,920 |
Voltas Ltd. | 8,855 | | 43,114 |
TOTAL INDIA | | 3,132,683 |
Indonesia - 2.6% |
PT Bank Rakyat Indonesia Tbk | 209,000 | | 243,563 |
PT Global Mediacom Tbk | 3,368,500 | | 243,011 |
PT Indofood Sukses Makmur Tbk | 458,500 | | 248,079 |
PT Mayora Indah Tbk | 171,500 | | 204,620 |
PT Mitra Adiperkasa Tbk | 865,500 | | 256,961 |
TOTAL INDONESIA | | 1,196,234 |
Italy - 0.6% |
Saipem SpA | 5,485 | | 270,164 |
Japan - 9.3% |
Canon, Inc. sponsored ADR (d) | 7,300 | | 374,782 |
eAccess Ltd. (d) | 358 | | 216,435 |
Fanuc Ltd. | 2,000 | | 307,086 |
Honda Motor Co. Ltd. sponsored ADR (d) | 9,900 | | 391,050 |
Itochu Corp. | 28,500 | | 288,457 |
Komatsu Ltd. | 10,100 | | 305,556 |
Marubeni Corp. | 40,000 | | 281,229 |
Mitsubishi Corp. | 12,300 | | 332,887 |
Mitsubishi UFJ Financial Group, Inc. sponsored ADR | 77,000 | | 416,570 |
Mitsui & Co. Ltd. | 18,600 | | 307,118 |
ORIX Corp. | 2,740 | | 269,564 |
Rakuten, Inc. | 283 | | 236,951 |
SOFTBANK CORP. | 8,300 | | 287,278 |
Uni-Charm Corp. | 5,600 | | 222,717 |
TOTAL JAPAN | | 4,237,680 |
Korea (South) - 1.1% |
Hyundai Motor Co. | 1,800 | | 278,529 |
Lock & Lock Co. Ltd. | 6,420 | | 206,986 |
TOTAL KOREA (SOUTH) | | 485,515 |
|
| Shares | | Value |
Malaysia - 1.1% |
Genting Bhd | 70,000 | | $ 253,803 |
Parkson Holdings Bhd | 131,200 | | 229,339 |
TOTAL MALAYSIA | | 483,142 |
Mexico - 1.2% |
Grupo Mexico SA de CV Series B | 72,200 | | 295,989 |
Grupo Televisa SA de CV (CPO) sponsored ADR | 9,700 | | 251,521 |
TOTAL MEXICO | | 547,510 |
Netherlands - 2.9% |
ING Groep NV sponsored ADR (a) | 34,314 | | 335,934 |
Koninklijke Philips Electronics NV | 9,627 | | 295,291 |
Unilever NV unit | 14,800 | | 464,720 |
X5 Retail Group NV GDR (Reg. S) (a) | 5,100 | | 235,875 |
TOTAL NETHERLANDS | | 1,331,820 |
Nigeria - 0.5% |
Guaranty Trust Bank PLC GDR (Reg. S) | 37,066 | | 218,689 |
Norway - 0.5% |
Aker Solutions ASA | 14,300 | | 243,615 |
Qatar - 0.5% |
Commercial Bank of Qatar GDR (Reg. S) | 46,168 | | 233,313 |
Russia - 4.9% |
LSR Group OJSC GDR (Reg. S) (a) | 24,200 | | 222,882 |
Magnit OJSC GDR (Reg. S) | 8,300 | | 243,190 |
Mechel Steel Group OAO sponsored ADR (a) | 30,800 | | 294,448 |
OAO Gazprom sponsored ADR | 15,700 | | 399,408 |
OAO NOVATEK GDR | 2,100 | | 250,950 |
Sberbank (Savings Bank of the Russian Federation) (a) | 95,100 | | 324,578 |
TNK-BP Holding (a) | 93,200 | | 248,598 |
Uralkali JSC GDR (Reg. S) | 7,100 | | 260,712 |
TOTAL RUSSIA | | 2,244,766 |
South Africa - 3.3% |
AngloGold Ashanti Ltd. sponsored ADR | 5,800 | | 285,534 |
Blue Label Telecoms Ltd. | 227,800 | | 242,070 |
Clicks Group Ltd. | 33,376 | | 218,342 |
Mr Price Group Ltd. | 23,618 | | 237,071 |
Naspers Ltd. Class N | 5,100 | | 298,648 |
Shoprite Holdings Ltd. | 15,500 | | 233,143 |
TOTAL SOUTH AFRICA | | 1,514,808 |
Spain - 3.1% |
Banco Santander SA sponsored ADR | 44,129 | | 469,974 |
Inditex SA | 3,500 | | 262,192 |
Obrascon Huarte Lain SA | 7,437 | | 225,464 |
Telefonica SA sponsored ADR | 6,780 | | 463,888 |
TOTAL SPAIN | | 1,421,518 |
Common Stocks - continued |
| Shares | | Value |
Sweden - 1.2% |
EnergyO Solutions AB (a) | 31,710 | | $ 239,505 |
H&M Hennes & Mauritz AB (B Shares) | 9,425 | | 314,204 |
TOTAL SWEDEN | | 553,709 |
Switzerland - 4.3% |
Compagnie Financiere Richemont SA Series A | 5,425 | | 319,357 |
Credit Suisse Group sponsored ADR | 9,000 | | 363,690 |
Dufry AG (a) | 1,610 | | 216,780 |
Nestle SA | 13,161 | | 771,235 |
The Swatch Group AG (Bearer) | 640 | | 285,510 |
TOTAL SWITZERLAND | | 1,956,572 |
Taiwan - 2.2% |
E Ink Holdings, Inc. (a) | 117,000 | | 237,048 |
HTC Corp. | 9,650 | | 297,737 |
Ruentex Development Co. Ltd. | 125,000 | | 219,832 |
Synnex Technology International Corp. | 87,000 | | 234,724 |
TOTAL TAIWAN | | 989,341 |
Turkey - 0.5% |
Turkiye Garanti Bankasi AS | 47,000 | | 238,368 |
United Kingdom - 12.1% |
Anglo American PLC (United Kingdom) | 7,900 | | 411,107 |
Barclays PLC Sponsored ADR | 21,400 | | 353,528 |
BG Group PLC | 19,524 | | 394,766 |
BP PLC | 79,600 | | 587,125 |
British American Tobacco PLC (United Kingdom) | 11,000 | | 423,413 |
Burberry Group PLC | 14,700 | | 257,780 |
HSBC Holdings PLC sponsored ADR | 14,100 | | 719,664 |
Imperial Tobacco Group PLC | 10,166 | | 312,134 |
Lloyds Banking Group PLC (a) | 322,800 | | 333,453 |
Reckitt Benckiser Group PLC | 5,700 | | 313,473 |
Royal Dutch Shell PLC Class B | 23,845 | | 790,159 |
Vedanta Resources PLC | 6,400 | | 251,321 |
Xstrata PLC | 15,600 | | 366,414 |
TOTAL UNITED KINGDOM | | 5,514,337 |
United States of America - 5.6% |
Apple, Inc. (a) | 655 | | 211,277 |
Bank of America Corp. | 17,780 | | 237,185 |
Citigroup, Inc. (a) | 47,036 | | 222,480 |
First Cash Financial Services, Inc. (a) | 7,302 | | 226,289 |
Google, Inc. Class A (a) | 400 | | 237,588 |
JPMorgan Chase & Co. | 5,611 | | 238,019 |
|
| Shares | | Value |
MasterCard, Inc. Class A | 1,000 | | $ 224,110 |
Tiffany & Co., Inc. | 3,544 | | 220,685 |
Visa, Inc. Class A | 3,400 | | 239,292 |
Walter Energy, Inc. | 2,000 | | 255,680 |
Wells Fargo & Co. | 7,708 | | 238,871 |
TOTAL UNITED STATES OF AMERICA | | 2,551,476 |
TOTAL COMMON STOCKS (Cost $38,331,434) | 44,413,345 |
Nonconvertible Preferred Stocks - 1.3% |
| | | |
Germany - 0.7% |
Volkswagen AG | 1,900 | | 308,392 |
Italy - 0.6% |
Fiat SpA (Risparmio Shares) | 19,227 | | 285,085 |
TOTAL NONCONVERTIBLE PREFERRED STOCKS (Cost $296,651) | 593,477 |
Money Market Funds - 1.9% |
| | | |
Fidelity Securities Lending Cash Central Fund, 0.21% (b)(c)
(Cost $887,910) | 887,910 | | 887,910 |
TOTAL INVESTMENT PORTFOLIO - 100.4% (Cost $39,515,995) | | 45,894,732 |
NET OTHER ASSETS (LIABILITIES) - (0.4)% | | (184,824) |
NET ASSETS - 100% | $ 45,709,908 |
Legend |
(a) Non-income producing |
(b) Affiliated fund that is available only to investment companies and other accounts managed by Fidelity Investments. The rate quoted is the annualized seven-day yield of the fund at period end. A complete unaudited listing of the fund's holdings as of its most recent quarter end is available upon request. In addition, each Fidelity Central Fund's financial statements, which are not covered by the Fund's Report of Independent Registered Public Accounting Firm, are available on the SEC's website or upon request. |
(c) Investment made with cash collateral received from securities on loan. |
(d) Security or a portion of the security is on loan at period end. |
(e) Security exempt from registration under Rule 144A of the Securities Act of 1933. These securities may be resold in transactions exempt from registration, normally to qualified institutional buyers. At the end of the period, the value of these securities amounted to $360,150 or 0.8% of net assets. |
Affiliated Central Funds |
Information regarding fiscal year to date income earned by the Fund from investments in Fidelity Central Funds is as follows: |
Fund | Income earned |
Fidelity Cash Central Fund | $ 574 |
Fidelity Securities Lending Cash Central Fund | 29,563 |
Total | $ 30,137 |
Other Information |
The following is a summary of the inputs used, as of December 31, 2010, involving the Fund's assets and liabilities carried at fair value. The inputs or methodology used for valuing securities may not be an indication of the risk associated with investing in those securities. For more information on valuation inputs, and their aggregation into the levels used in the tables below, please refer to the Security Valuation section in the accompanying Notes to Financial Statements. |
Valuation Inputs at Reporting Date: |
Description | Total | Level 1 | Level 2 | Level 3 |
Investments in Securities: | | | | |
Equities: | | | | |
United Kingdom | $ 5,514,337 | $ 3,380,187 | $ 2,134,150 | $ - |
Japan | 4,237,680 | 4,237,680 | - | - |
India | 3,132,683 | 2,908,075 | 224,608 | - |
Cayman Islands | 3,074,843 | 3,074,843 | - | - |
Brazil | 2,573,051 | 2,573,051 | - | - |
United States of America | 2,551,476 | 2,551,476 | - | - |
France | 2,338,995 | 2,338,995 | - | - |
Russia | 2,244,766 | 2,244,766 | - | - |
Switzerland | 1,956,572 | 1,956,572 | - | - |
Other | 17,382,419 | 16,548,877 | 833,542 | - |
Money Market Funds | 887,910 | 887,910 | - | - |
Total Investments in Securities: | $ 45,894,732 | $ 42,702,432 | $ 3,192,300 | $ - |
The following is a reconciliation of Investments in Securities for which Level 3 inputs were used in determining value: |
Investments in Securities: | |
Beginning Balance | $ 249,900 |
Total Realized Gain (Loss) | (22,982) |
Total Unrealized Gain (Loss) | (3,667) |
Cost of Purchases | 257,403 |
Proceeds of Sales | (480,654) |
Amortization/Accretion | - |
Transfers in to Level 3 | - |
Transfers out of Level 3 | - |
Ending Balance | $ - |
The change in unrealized gain (loss) for the period attributable to Level 3 securities held at December 31, 2010 | $ - |
The information used in the above reconciliation represents fiscal year to date activity for any Investments in Securities identified as using Level 3 inputs at either the beginning or the end of the current fiscal period. Transfers in or out of Level 3 represent the beginning value of any Security or Instrument where a change in the pricing level occurred from the beginning to the end of the period. The cost of purchases and the proceeds of sales may include securities received or delivered through corporate actions or exchanges. Realized and unrealized gains (losses) disclosed in the reconciliation are included in Net Gain (Loss) on the Fund's Statement of Operations. |
Income Tax Information |
At December 31, 2010, the Fund had a capital loss carryforward of approximately $22,327,177 of which $17,897,995 and $4,429,182 will expire in fiscal 2016 and 2017, respectively. Capital loss carryforwards are only available to offset future capital gains of the Fund to the extent provided by regulations and may be limited. |
See accompanying notes which are an integral part of the financial statements.
Annual Report
Statement of Assets and Liabilities
| December 31, 2010 |
Assets | | |
Investment in securities, at value (including securities loaned of $871,456) - See accompanying schedule: Unaffiliated issuers (cost $38,628,085) | $ 45,006,822 | |
Fidelity Central Funds (cost $887,910) | 887,910 | |
Total Investments (cost $39,515,995) | | $ 45,894,732 |
Foreign currency held at value (cost $93,088) | | 93,641 |
Receivable for investments sold | | 1,687,320 |
Receivable for fund shares sold | | 73,344 |
Dividends receivable | | 123,180 |
Distributions receivable from Fidelity Central Funds | | 522 |
Prepaid expenses | | 126 |
Receivable from investment adviser for expense reductions | | 11,209 |
Other receivables | | 71,495 |
Total assets | | 47,955,569 |
| | |
Liabilities | | |
Payable to custodian bank | $ 330,851 | |
Payable for investments purchased | 862,456 | |
Payable for fund shares redeemed | 26,690 | |
Accrued management fee | 27,245 | |
Distribution and service plan fees payable | 51 | |
Other affiliated payables | 6,576 | |
Other payables and accrued expenses | 103,882 | |
Collateral on securities loaned, at value | 887,910 | |
Total liabilities | | 2,245,661 |
| | |
Net Assets | | $ 45,709,908 |
Net Assets consist of: | | |
Paid in capital | | $ 62,428,728 |
Undistributed net investment income | | 6,999 |
Accumulated undistributed net realized gain (loss) on investments and foreign currency transactions | | (23,076,718) |
Net unrealized appreciation (depreciation) on investments and assets and liabilities in foreign currencies | | 6,350,899 |
Net Assets | | $ 45,709,908 |
Statement of Assets and Liabilities - continued
| December 31, 2010 |
Initial Class:
Net Asset Value, offering price and redemption price per share ($732,354 ÷ 75,221 shares) | | $ 9.74 |
| | |
Service Class:
Net Asset Value, offering price and redemption price per share ($99,693 ÷ 10,256 shares) | | $ 9.72 |
| | |
Service Class 2:
Net Asset Value, offering price and redemption price per share ($114,663 ÷ 11,801 shares) | | $ 9.72 |
| | |
Initial Class R:
Net Asset Value, offering price and redemption price per share ($15,305,412 ÷ 1,571,814 shares) | | $ 9.74 |
| | |
| | |
Service Class R:
Net Asset Value, offering price and redemption price per share ($99,693 ÷ 10,256 shares) | | $ 9.72 |
| | |
Service Class 2R:
Net Asset Value, offering price and redemption price per share ($108,865 ÷ 11,214 shares) | | $ 9.71 |
| | |
Investor Class R:
Net Asset Value, offering price and redemption price per share ($29,249,228 ÷ 3,019,698 shares) | | $ 9.69 |
See accompanying notes which are an integral part of the financial statements.
Annual Report
Statement of Operations
| Year ended December 31, 2010 |
Investment Income | | |
Dividends | | $ 986,457 |
Interest | | 6,476 |
Income from Fidelity Central Funds | | 30,137 |
Income before foreign taxes withheld | | 1,023,070 |
Less foreign taxes withheld | | (77,624) |
Total income | | 945,446 |
| | |
Expenses | | |
Management fee | $ 312,495 | |
Transfer agent fees | 62,307 | |
Distribution and service plan fees | 696 | |
Accounting and security lending fees | 23,398 | |
Custodian fees and expenses | 237,430 | |
Independent trustees' compensation | 249 | |
Audit | 66,687 | |
Legal | 200 | |
Miscellaneous | 500 | |
Total expenses before reductions | 703,962 | |
Expense reductions | (260,065) | 443,897 |
Net investment income (loss) | | 501,549 |
Realized and Unrealized Gain (Loss) Net realized gain (loss) on: | | |
Investment securities: | | |
Unaffiliated issuers (net of foreign taxes of $12,411) | 3,541,168 | |
Foreign currency transactions | (144,911) | |
Total net realized gain (loss) | | 3,396,257 |
Change in net unrealized appreciation (depreciation) on: Investment securities (net of increase in deferred foreign taxes of $15,500) | 2,009,244 | |
Assets and liabilities in foreign currencies | 2,500 | |
Total change in net unrealized appreciation (depreciation) | | 2,011,744 |
Net gain (loss) | | 5,408,001 |
Net increase (decrease) in net assets resulting from operations | | $ 5,909,550 |
Statement of Changes in Net Assets
| Year ended
December 31,
2010 | Year ended
December 31,
2009 |
Increase (Decrease) in Net Assets | | |
Operations | | |
Net investment income (loss) | $ 501,549 | $ 311,982 |
Net realized gain (loss) | 3,396,257 | 3,301,299 |
Change in net unrealized appreciation (depreciation) | 2,011,744 | 9,550,519 |
Net increase (decrease) in net assets resulting from operations | 5,909,550 | 13,163,800 |
Distributions to shareholders from net investment income | (494,828) | (317,347) |
Distributions to shareholders from net realized gain | (483,411) | (478,375) |
Total distributions | (978,239) | (795,722) |
Share transactions - net increase (decrease) | (5,534,279) | 10,098,658 |
Redemption fees | 10,678 | 6,920 |
Total increase (decrease) in net assets | (592,290) | 22,473,656 |
| | |
Net Assets | | |
Beginning of period | 46,302,198 | 23,828,542 |
End of period (including undistributed net investment income of $6,999 and undistributed net investment income of $277, respectively) | $ 45,709,908 | $ 46,302,198 |
See accompanying notes which are an integral part of the financial statements.
Annual Report
Financial Highlights - Initial Class
Years ended December 31, | 2010 | 2009 | 2008 | 2007 | 2006 |
Selected Per-Share Data | | | | | |
Net asset value, beginning of period | $ 8.60 | $ 5.61 | $ 11.44 | $ 12.68 | $ 11.46 |
Income from Investment Operations | | | | | |
Net investment income (loss) C | .10 | .07 | .15 | .11 F | .11 |
Net realized and unrealized gain (loss) | 1.24 | 3.07 | (5.92) | .53 | 1.54 |
Total from investment operations | 1.34 | 3.14 | (5.77) | .64 | 1.65 |
Distributions from net investment income | (.11) | (.06) | - | (.09) | (.10) |
Distributions from net realized gain | (.10) | (.09) | (.06) | (1.79) | (.34) |
Total distributions | (.20) I | (.15) | (.06) | (1.88) | (.43) J |
Redemption fees added to paid in capital C, H | - | - | - | - | - |
Net asset value, end of period | $ 9.74 | $ 8.60 | $ 5.61 | $ 11.44 | $ 12.68 |
Total Return A, B | 15.73% | 56.04% | (50.69)% | 5.17% | 14.49% |
Ratios to Average Net Assets D, G | | | | | |
Expenses before reductions | 1.60% | 1.81% | 1.54% | 1.20% | 1.80% |
Expenses net of fee waivers, if any | 1.10% | 1.10% | 1.10% | 1.10% | 1.10% |
Expenses net of all reductions | .96% | .93% | .91% | 1.07% | 1.00% |
Net investment income (loss) | 1.19% | 1.03% | 1.65% | .82% F | .95% |
Supplemental Data | | | | | |
Net assets, end of period (000 omitted) | $ 732 | $ 645 | $ 388 | $ 1,409 | $ 1,357 |
Portfolio turnover rate E | 463% | 416% | 350% | 224% | 185% |
A Total returns do not reflect charges attributable to your insurance company's separate account. Inclusion of these charges would reduce the total returns shown.
B Total returns would have been lower had certain expenses not been reduced during the periods shown.
C Calculated based on average shares outstanding during the period.
D Fees and expenses of the underlying Fidelity Central Funds are not included in the Fund's expense ratio. The Fund indirectly bears its proportionate share of the expenses of any underlying Fidelity Central Funds.
E Amount does not include the portfolio activity of any underlying Fidelity Central Funds.
F Investment income per share reflects a special dividend which amounted to $.02 per share. Excluding the special dividend, the ratio of net investment income (loss) to average net assets would have been .68%.
G Expense ratios reflect operating expenses of the class. Expenses before reductions do not reflect amounts reimbursed by the investment adviser or reductions from brokerage service arrangements or reductions from other expense offset arrangements and do not represent the amount paid by the class during periods when reimbursements or reductions occur. Expenses net of fee waivers reflect expenses after reimbursement by the investment adviser but prior to reductions from brokerage service arrangements or other expense offset arrangements. Expenses net of all reductions represent the net expenses paid by the class.
H Amount represents less than $.01 per share.
I Total distributions of $.20 per share is comprised of distributions from net investment income of $.105 and distributions from net realized gain of $.097 per share.
J Total distributions of $.43 per share is comprised of distributions from net investment income of $.095 and distributions from net realized gain of $.335 per share.
Financial Highlights - Service Class
Years ended December 31, | 2010 | 2009 | 2008 | 2007 | 2006 |
Selected Per-Share Data | | | | | |
Net asset value, beginning of period | $ 8.58 | $ 5.61 | $ 11.43 | $ 12.67 | $ 11.46 |
Income from Investment Operations | | | | | |
Net investment income (loss) C | .10 | .06 | .14 | .10 F | .10 |
Net realized and unrealized gain (loss) | 1.23 | 3.05 | (5.90) | .53 | 1.53 |
Total from investment operations | 1.33 | 3.11 | (5.76) | .63 | 1.63 |
Distributions from net investment income | (.10) | (.05) | - | (.08) | (.08) |
Distributions from net realized gain | (.10) | (.09) | (.06) | (1.79) | (.34) |
Total distributions | (.19) I | (.14) | (.06) | (1.87) | (.42) J |
Redemption fees added to paid in capital C, H | - | - | - | - | - |
Net asset value, end of period | $ 9.72 | $ 8.58 | $ 5.61 | $ 11.43 | $ 12.67 |
Total Return A, B | 15.65% | 55.52% | (50.64)% | 5.06% | 14.30% |
Ratios to Average Net Assets D, G | | | | | |
Expenses before reductions | 1.67% | 1.73% | 1.51% | 1.20% | 1.62% |
Expenses net of fee waivers, if any | 1.20% | 1.20% | 1.20% | 1.20% | 1.20% |
Expenses net of all reductions | 1.05% | 1.04% | 1.01% | 1.16% | 1.10% |
Net investment income (loss) | 1.09% | .92% | 1.55% | .72% F | .85% |
Supplemental Data | | | | | |
Net assets, end of period (000 omitted) | $ 100 | $ 117 | $ 135 | $ 414 | $ 394 |
Portfolio turnover rate E | 463% | 416% | 350% | 224% | 185% |
A Total returns do not reflect charges attributable to your insurance company's separate account. Inclusion of these charges would reduce the total returns shown.
B Total returns would have been lower had certain expenses not been reduced during the periods shown.
C Calculated based on average shares outstanding during the period.
D Fees and expenses of the underlying Fidelity Central Funds are not included in the Fund's expense ratio. The Fund indirectly bears its proportionate share of the expenses of any underlying Fidelity Central Funds.
E Amount does not include the portfolio activity of any underlying Fidelity Central Funds.
F Investment income per share reflects a special dividend which amounted to $.02 per share. Excluding the special dividend, the ratio of net investment income (loss) to average net assets would have been .58%.
G Expense ratios reflect operating expenses of the class. Expenses before reductions do not reflect amounts reimbursed by the investment adviser or reductions from brokerage service arrangements or reductions from other expense offset arrangements and do not represent the amount paid by the class during periods when reimbursements or reductions occur. Expenses net of fee waivers reflect expenses after reimbursement by the investment adviser but prior to reductions from brokerage service arrangements or other expense offset arrangements. Expenses net of all reductions represent the net expenses paid by the class.
H Amount represents less than $.01 per share.
I Total distributions of $.19 per share is comprised of distributions from net investment income of $.095 and distributions from net realized gain of $.097 per share.
J Total distributions of $.42 per share is comprised of distributions from net investment income of $.084 and distributions from net realized gain of $.335 per share.
See accompanying notes which are an integral part of the financial statements.
Annual Report
Financial Highlights - Service Class 2
Years ended December 31, | 2010 | 2009 | 2008 | 2007 | 2006 |
Selected Per-Share Data | | | | | |
Net asset value, beginning of period | $ 8.57 | $ 5.60 | $ 11.43 | $ 12.67 | $ 11.46 |
Income from Investment Operations | | | | | |
Net investment income (loss) C | .08 | .05 | .12 | .08 F | .08 |
Net realized and unrealized gain (loss) | 1.24 | 3.05 | (5.89) | .53 | 1.53 |
Total from investment operations | 1.32 | 3.10 | (5.77) | .61 | 1.61 |
Distributions from net investment income | (.07) | (.04) | - | (.06) | (.07) |
Distributions from net realized gain | (.10) | (.09) | (.06) | (1.79) | (.34) |
Total distributions | (.17) | (.13) | (.06) | (1.85) | (.40) I |
Redemption fees added to paid in capital C, H | - | - | - | - | - |
Net asset value, end of period | $ 9.72 | $ 8.57 | $ 5.60 | $ 11.43 | $ 12.67 |
Total Return A, B | 15.53% | 55.44% | (50.73)% | 4.89% | 14.14% |
Ratios to Average Net Assets D, G | | | | | |
Expenses before reductions | 1.88% | 2.02% | 1.79% | 1.41% | 1.77% |
Expenses net of fee waivers, if any | 1.35% | 1.35% | 1.35% | 1.35% | 1.35% |
Expenses net of all reductions | 1.21% | 1.19% | 1.16% | 1.32% | 1.25% |
Net investment income (loss) | .94% | .77% | 1.40% | .57% F | .70% |
Supplemental Data | | | | | |
Net assets, end of period (000 omitted) | $ 115 | $ 424 | $ 302 | $ 550 | $ 524 |
Portfolio turnover rate E | 463% | 416% | 350% | 224% | 185% |
A Total returns do not reflect charges attributable to your insurance company's separate account. Inclusion of these charges would reduce the total returns shown.
B Total returns would have been lower had certain expenses not been reduced during the periods shown.
C Calculated based on average shares outstanding during the period.
D Fees and expenses of the underlying Fidelity Central Funds are not included in the Fund's expense ratio. The Fund indirectly bears its proportionate share of the expenses of any underlying Fidelity Central Funds.
E Amount does not include the portfolio activity of any underlying Fidelity Central Funds.
F Investment income per share reflects a special dividend which amounted to $.02 per share. Excluding the special dividend, the ratio of net investment income (loss) to average net assets would have been .43%.
G Expense ratios reflect operating expenses of the class. Expenses before reductions do not reflect amounts reimbursed by the investment adviser or reductions from brokerage service arrangements or reductions from other expense offset arrangements and do not represent the amount paid by the class during periods when reimbursements or reductions occur. Expenses net of fee waivers reflect expenses after reimbursement by the investment adviser but prior to reductions from brokerage service arrangements or other expense offset arrangements. Expenses net of all reductions represent the net expenses paid by the class.
H Amount represents less than $.01 per share.
I Total distributions of $.40 per share is comprised of distributions from net investment income of $.066 and distributions from net realized gain of $.335 per share.
Financial Highlights - Initial Class R
Years ended December 31, | 2010 | 2009 | 2008 | 2007 | 2006 |
Selected Per-Share Data | | | | | |
Net asset value, beginning of period | $ 8.60 | $ 5.62 | $ 11.44 | $ 12.68 | $ 11.46 |
Income from Investment Operations | | | | | |
Net investment income (loss) C | .10 | .07 | .15 | .11 F | .11 |
Net realized and unrealized gain (loss) | 1.24 | 3.06 | (5.91) | .53 | 1.54 |
Total from investment operations | 1.34 | 3.13 | (5.76) | .64 | 1.65 |
Distributions from net investment income | (.11) | (.06) | - | (.09) | (.10) |
Distributions from net realized gain | (.10) | (.09) | (.06) | (1.79) | (.34) |
Total distributions | (.20) I | (.15) | (.06) | (1.88) | (.43) J |
Redemption fees added to paid in capital C, H | - | - | - | - | - |
Net asset value, end of period | $ 9.74 | $ 8.60 | $ 5.62 | $ 11.44 | $ 12.68 |
Total Return A, B | 15.73% | 55.76% | (50.60)% | 5.17% | 14.50% |
Ratios to Average Net Assets D, G | | | | | |
Expenses before reductions | 1.55% | 1.60% | 1.44% | 1.11% | 1.46% |
Expenses net of fee waivers, if any | 1.10% | 1.10% | 1.10% | 1.10% | 1.10% |
Expenses net of all reductions | .95% | .93% | .91% | 1.06% | 1.00% |
Net investment income (loss) | 1.19% | 1.02% | 1.65% | .82% F | .95% |
Supplemental Data | | | | | |
Net assets, end of period (000 omitted) | $ 15,305 | $ 17,150 | $ 8,483 | $ 32,345 | $ 17,219 |
Portfolio turnover rate E | 463% | 416% | 350% | 224% | 185% |
A Total returns do not reflect charges attributable to your insurance company's separate account. Inclusion of these charges would reduce the total returns shown.
B Total returns would have been lower had certain expenses not been reduced during the periods shown.
C Calculated based on average shares outstanding during the period.
D Fees and expenses of the underlying Fidelity Central Funds are not included in the Fund's expense ratio. The Fund indirectly bears its proportionate share of the expenses of any underlying Fidelity Central Funds.
E Amount does not include the portfolio activity of any underlying Fidelity Central Funds.
F Investment income per share reflects a special dividend which amounted to $.02 per share. Excluding the special dividend, the ratio of net investment income (loss) to average net assets would have been .68%.
G Expense ratios reflect operating expenses of the class. Expenses before reductions do not reflect amounts reimbursed by the investment adviser or reductions from brokerage service arrangements or reductions from other expense offset arrangements and do not represent the amount paid by the class during periods when reimbursements or reductions occur. Expenses net of fee waivers reflect expenses after reimbursement by the investment adviser but prior to reductions from brokerage service arrangements or other expense offset arrangements. Expenses net of all reductions represent the net expenses paid by the class.
H Amount represents less than $.01 per share.
I Total distributions of $.20 per share is comprised of distributions from net investment income of $.105 and distributions from net realized gain of $.097 per share.
J Total distributions of $.43 per share is comprised of distributions from net investment income of $.096 and distributions from net realized gain of $.335 per share.
See accompanying notes which are an integral part of the financial statements.
Annual Report
Financial Highlights - Service Class R
Years ended December 31, | 2010 | 2009 | 2008 | 2007 | 2006 |
Selected Per-Share Data | | | | | |
Net asset value, beginning of period | $ 8.58 | $ 5.61 | $ 11.43 | $ 12.67 | $ 11.46 |
Income from Investment Operations | | | | | |
Net investment income (loss) C | .10 | .06 | .14 | .10 F | .10 |
Net realized and unrealized gain (loss) | 1.23 | 3.05 | (5.90) | .53 | 1.53 |
Total from investment operations | 1.33 | 3.11 | (5.76) | .63 | 1.63 |
Distributions from net investment income | (.10) | (.05) | - | (.08) | (.08) |
Distributions from net realized gain | (.10) | (.09) | (.06) | (1.79) | (.34) |
Total distributions | (.19) I | (.14) | (.06) | (1.87) | (.42) J |
Redemption fees added to paid in capital C, H | - | - | - | - | - |
Net asset value, end of period | $ 9.72 | $ 8.58 | $ 5.61 | $ 11.43 | $ 12.67 |
Total Return A, B | 15.65% | 55.52% | (50.64)% | 5.06% | 14.30% |
Ratios to Average Net Assets D, G | | | | | |
Expenses before reductions | 1.67% | 1.73% | 1.51% | 1.20% | 1.62% |
Expenses net of fee waivers, if any | 1.20% | 1.20% | 1.20% | 1.20% | 1.20% |
Expenses net of all reductions | 1.05% | 1.04% | 1.01% | 1.16% | 1.10% |
Net investment income (loss) | 1.09% | .92% | 1.55% | .72% F | .85% |
Supplemental Data | | | | | |
Net assets, end of period (000 omitted) | $ 100 | $ 117 | $ 135 | $ 414 | $ 394 |
Portfolio turnover rate E | 463% | 416% | 350% | 224% | 185% |
A Total returns do not reflect charges attributable to your insurance company's separate account. Inclusion of these charges would reduce the total returns shown.
B Total returns would have been lower had certain expenses not been reduced during the periods shown.
C Calculated based on average shares outstanding during the period.
D Fees and expenses of the underlying Fidelity Central Funds are not included in the Fund's expense ratio. The Fund indirectly bears its proportionate share of the expenses of any underlying Fidelity Central Funds.
E Amount does not include the portfolio activity of any underlying Fidelity Central Funds.
F Investment income per share reflects a special dividend which amounted to $.02 per share. Excluding the special dividend, the ratio of net investment income (loss) to average net assets would have been .58%.
G Expense ratios reflect operating expenses of the class. Expenses before reductions do not reflect amounts reimbursed by the investment adviser or reductions from brokerage service arrangements or reductions from other expense offset arrangements and do not represent the amount paid by the class during periods when reimbursements or reductions occur. Expenses net of fee waivers reflect expenses after reimbursement by the investment adviser but prior to reductions from brokerage service arrangements or other expense offset arrangements. Expenses net of all reductions represent the net expenses paid by the class.
H Amount represents less than $.01 per share.
I Total distributions of $.19 per share is comprised of distributions from net investment income of $.095 and distributions from net realized gain of $.097 per share.
J Total distributions of $.42 per share is comprised of distributions from net investment income of $.084 and distributions from net realized gain of $.335 per share.
Financial Highlights - Service Class 2R
Years ended December 31, | 2010 | 2009 | 2008 | 2007 | 2006 |
Selected Per-Share Data | | | | | |
Net asset value, beginning of period | $ 8.57 | $ 5.60 | $ 11.43 | $ 12.67 | $ 11.46 |
Income from Investment Operations | | | | | |
Net investment income (loss) C | .08 | .05 | .13 | .08 F | .08 |
Net realized and unrealized gain (loss) | 1.23 | 3.05 | (5.90) | .53 | 1.53 |
Total from investment operations | 1.31 | 3.10 | (5.77) | .61 | 1.61 |
Distributions from net investment income | (.08) | (.04) | - | (.06) | (.07) |
Distributions from net realized gain | (.10) | (.09) | (.06) | (1.79) | (.34) |
Total distributions | (.17) I | (.13) | (.06) | (1.85) | (.40) J |
Redemption fees added to paid in capital C, H | - | - | - | - | - |
Net asset value, end of period | $ 9.71 | $ 8.57 | $ 5.60 | $ 11.43 | $ 12.67 |
Total Return A, B | 15.45% | 55.36% | (50.73)% | 4.90% | 14.14% |
Ratios to Average Net Assets D, G | | | | | |
Expenses before reductions | 1.83% | 1.87% | 1.66% | 1.35% | 1.77% |
Expenses net of fee waivers, if any | 1.35% | 1.35% | 1.35% | 1.35% | 1.35% |
Expenses net of all reductions | 1.21% | 1.19% | 1.16% | 1.31% | 1.25% |
Net investment income (loss) | .94% | .77% | 1.40% | .57% F | .70% |
Supplemental Data | | | | | |
Net assets, end of period (000 omitted) | $ 109 | $ 155 | $ 179 | $ 550 | $ 524 |
Portfolio turnover rate E | 463% | 416% | 350% | 224% | 185% |
A Total returns do not reflect charges attributable to your insurance company's separate account. Inclusion of these charges would reduce the total returns shown.
B Total returns would have been lower had certain expenses not been reduced during the periods shown.
C Calculated based on average shares outstanding during the period.
D Fees and expenses of the underlying Fidelity Central Funds are not included in the Fund's expense ratio. The Fund indirectly bears its proportionate share of the expenses of any underlying Fidelity Central Funds.
E Amount does not include the portfolio activity of any underlying Fidelity Central Funds.
F Investment income per share reflects a special dividend which amounted to $.02 per share. Excluding the special dividend, the ratio of net investment income (loss) to average net assets would have been .43%.
G Expense ratios reflect operating expenses of the class. Expenses before reductions do not reflect amounts reimbursed by the investment adviser or reductions from brokerage service arrangements or reductions from other expense offset arrangements and do not represent the amount paid by the class during periods when reimbursements or reductions occur. Expenses net of fee waivers reflect expenses after reimbursement by the investment adviser but prior to reductions from brokerage service arrangements or other expense offset arrangements. Expenses net of all reductions represent the net expenses paid by the class.
H Amount represents less than $.01 per share.
I Total distributions of $.17 per share is comprised of distributions from net investment income of $.077 and distributions from net realized gain of $.097 per share.
J Total distributions of $.40 per share is comprised of distributions from net investment income of $.066 and distributions from net realized gain of $.335 per share.
See accompanying notes which are an integral part of the financial statements.
Annual Report
Financial Highlights - Investor Class R
Years ended December 31, | 2010 | 2009 | 2008 | 2007 | 2006 |
Selected Per-Share Data | | | | | |
Net asset value, beginning of period | $ 8.56 | $ 5.60 | $ 11.41 | $ 12.65 | $ 11.46 |
Income from Investment Operations | | | | | |
Net investment income (loss) C | .10 | .07 | .14 | .09 F | .09 |
Net realized and unrealized gain (loss) | 1.23 | 3.04 | (5.89) | .54 | 1.53 |
Total from investment operations | 1.33 | 3.11 | (5.75) | .63 | 1.62 |
Distributions from net investment income | (.11) | (.06) | - | (.08) | (.10) |
Distributions from net realized gain | (.10) | (.09) | (.06) | (1.79) | (.34) |
Total distributions | (.20) I | (.15) | (.06) | (1.87) | (.43) J |
Redemption fees added to paid in capital C, H | - | - | - | - | - |
Net asset value, end of period | $ 9.69 | $ 8.56 | $ 5.60 | $ 11.41 | $ 12.65 |
Total Return A, B | 15.69% | 55.61% | (50.65)% | 5.07% | 14.23% |
Ratios to Average Net Assets D, G | | | | | |
Expenses before reductions | 1.63% | 1.68% | 1.51% | 1.22% | 1.61% |
Expenses net of fee waivers, if any | 1.18% | 1.18% | 1.17% | 1.22% | 1.25% |
Expenses net of all reductions | 1.04% | 1.01% | .97% | 1.18% | 1.15% |
Net investment income (loss) | 1.11% | .94% | 1.59% | .71% F | .80% |
Supplemental Data | | | | | |
Net assets, end of period (000 omitted) | $ 29,249 | $ 27,695 | $ 14,208 | $ 38,719 | $ 24,505 |
Portfolio turnover rate E | 463% | 416% | 350% | 224% | 185% |
A Total returns do not reflect charges attributable to your insurance company's separate account. Inclusion of these charges would reduce the total returns shown.
B Total returns would have been lower had certain expenses not been reduced during the periods shown.
C Calculated based on average shares outstanding during the period.
D Fees and expenses of the underlying Fidelity Central Funds are not included in the Fund's expense ratio. The Fund indirectly bears its proportionate share of the expenses of any underlying Fidelity Central Funds.
E Amount does not include the portfolio activity of any underlying Fidelity Central Funds.
F Investment income per share reflects a special dividend which amounted to $.02 per share. Excluding the special dividend, the ratio of net investment income (loss) to average net assets would have been .57%.
G Expense ratios reflect operating expenses of the class. Expenses before reductions do not reflect amounts reimbursed by the investment adviser or reductions from brokerage service arrangements or reductions from other expense offset arrangements and do not represent the amount paid by the class during periods when reimbursements or reductions occur. Expenses net of fee waivers reflect expenses after reimbursement by the investment adviser but prior to reductions from brokerage service arrangements or other expense offset arrangements. Expenses net of all reductions represent the net expenses paid by the class.
H Amount represents less than $.01 per share.
I Total distributions of $.20 per share is comprised of distributions from net investment income of $.105 and distributions from net realized gain of $.097 per share.
J Total distributions of $.43 per share is comprised of distributions from net investment income of $.095 and distributions from net realized gain of $.335 per share.
See accompanying notes which are an integral part of the financial statements.
Annual Report
Notes to Financial Statements
For the period ended December 31, 2010
1. Organization.
VIP International Capital Appreciation Portfolio (the Fund) is a fund of Variable Insurance Products Fund IV (the Trust) and is authorized to issue an unlimited number of shares. The Trust is registered under the Investment Company Act of 1940, as amended (the 1940 Act), as an open-end management investment company organized as a Massachusetts business trust. Shares of the Fund may only be purchased by insurance companies for the purpose of funding variable annuity or variable life insurance contracts. The Fund offers the following classes of shares: Initial Class shares, Service Class shares, Service Class 2 shares, Initial Class R shares, Service Class R shares, Service Class 2R shares and Investor Class R shares. All classes have equal rights and voting privileges, except for matters affecting a single class. Investment income, realized and unrealized capital gains and losses, the common expenses of the Fund, and certain fund-level expense reductions, if any, are allocated on a pro-rata basis to each class based on the relative net assets of each class to the total net assets of the Fund. Each class differs with respect to transfer agent and distribution and service plan fees incurred. Certain expense reductions may also differ by class. The Fund's investments in emerging markets can be subject to social, economic, regulatory, and political uncertainties and can be extremely volatile.
2. Investments in Fidelity Central Funds.
The Fund may invest in Fidelity Central Funds, which are open-end investment companies available only to other investment companies and accounts managed by Fidelity Management & Research Company (FMR) and its affiliates. The Fund's Schedule of Investments lists each of the Fidelity Central Funds held as of period end, if any, as an investment of the Fund, but does not include the underlying holdings of each Fidelity Central Fund. As an Investing Fund, the Fund indirectly bears its proportionate share of the expenses of the underlying Fidelity Central Funds.
The Money Market Central Funds seek preservation of capital and current income and are managed by Fidelity Investments Money Management, Inc. (FIMM), an affiliate of FMR.
A complete unaudited list of holdings for each Fidelity Central Fund is available upon request or at the Securities and Exchange Commission (the SEC) web site at www.sec.gov. In addition, the financial statements of the Fidelity Central Funds, which are not covered by the Fund's Report of Independent Registered Public Accounting Firm, are available on the SEC web site or upon request.
3. Significant Accounting Policies.
The financial statements have been prepared in conformity with accounting principles generally accepted in the United States of America (GAAP), which require management to make certain estimates and assumptions at the date of the financial statements. Actual results could differ from those estimates. Subsequent events, if any, through the date that the financial statements were issued have been evaluated in the preparation of the financial statements. The following summarizes the significant accounting policies of the Fund:
Security Valuation. Investments are valued as of 4:00 p.m. Eastern time on the last calendar day of the period. The Fund uses independent pricing services approved by the Board of Trustees to value its investments. When current market prices or quotations are not readily available or reliable, valuations may be determined in good faith in accordance with procedures adopted by the Board of Trustees. Factors used in determining value may include market or security specific events. The frequency with which these procedures are used cannot be predicted and they may be utilized to a significant extent. The value used for net asset value (NAV) calculation under these procedures may differ from published prices for the same securities.
The Fund categorizes the inputs to valuation techniques used to value its investments into a disclosure hierarchy consisting of three levels as shown below.
Level 1 - quoted prices in active markets for identical investments
Level 2 - other significant observable inputs (including quoted prices for similar investments, interest rates, prepayment speeds, etc.)
Level 3 - unobservable inputs (including the Fund's own assumptions based on the best information available)
Changes in valuation techniques may result in transfers in or out of an assigned level within the disclosure hierarchy. The aggregate value of investments by input level, as of December 31, 2010, as well as a roll forward of Level 3 securities, is included at the end of the Fund's Schedule of Investments. Valuation techniques used to value the Fund's investments by major category are as follows.
Equity securities, including restricted securities, for which market quotations are readily available, are valued at the last reported sale price or official closing price as reported by an independent pricing service on the primary market or exchange on which they are traded and are categorized as Level 1 in the hierarchy. In the event there were no sales during the day or closing prices are not available, securities are valued at the last quoted bid price or may be valued using the last available price and are generally categorized as Level 2 in the hierarchy. For foreign equity securities, when significant market or security specific events arise, comparisons to the valuation of American Depositary Receipts (ADRs), futures contracts, Exchange-traded funds (ETFs) and certain indexes as well as quoted prices for similar securities are used and are categorized as Level 2 in the hierarchy in these
Annual Report
Notes to Financial Statements - continued
3. Significant Accounting Policies - continued
Security Valuation - continued
circumstances. Utilizing these techniques may result in transfers between Level 1 and Level 2. For restricted equity securities and private placements where observable inputs are limited, assumptions about market activity and risk are used and are categorized as Level 3 in the hierarchy.
Investments in open-end mutual funds,including the Fidelity Central Funds, are valued at their closing net asset value each business day and are categorized as Level 1 in the hierarchy.
Foreign Currency. The Fund uses foreign currency contracts to facilitate transactions in foreign-denominated securities. Gains and losses from these transactions may arise from changes in the value of the foreign currency or if the counterparties do not perform under the contracts' terms.
Foreign-denominated assets, including investment securities, and liabilities are translated into U.S. dollars at the exchange rate at period end. Purchases and sales of investment securities, income and dividends received and expenses denominated in foreign currencies are translated into U.S. dollars at the exchange rate in effect on the transaction date.
The effects of exchange rate fluctuations on investments are included with the net realized and unrealized gain (loss) on investment securities. Other foreign currency transactions resulting in realized and unrealized gain (loss) are disclosed separately.
Investment Transactions and Income. For financial reporting purposes, the Fund's investment holdings and NAV include trades executed through the end of the last business day of the period. The NAV per share for processing shareholder transactions is calculated as of the close of business of the New York Stock Exchange (NYSE), normally 4:00 p.m. Eastern time and includes trades executed through the end of the prior business day. Gains and losses on securities sold are determined on the basis of identified cost. Dividend income is recorded on the ex-dividend date, except for certain dividends from foreign securities where the ex-dividend date may have passed, which are recorded as soon as the Fund is informed of the ex-dividend date. Non-cash dividends included in dividend income, if any, are recorded at the fair market value of the securities received. Distributions received on securities that represent a return of capital or capital gain are recorded as a reduction of cost of investments and/or as a realized gain. The Fund estimates the components of distributions received that may be considered return of capital distributions or capital gain distributions. Interest income and distributions from the Fidelity Central Funds are accrued as earned. Interest income includes coupon interest and amortization of premium and accretion of discount on debt securities. Investment income is recorded net of foreign taxes withheld where recovery of such taxes is uncertain.
Expenses. Expenses directly attributable to a fund are charged to that fund. Expenses attributable to more than one fund are allocated among the respective funds on the basis of relative net assets or other appropriate methods. Expense estimates are accrued in the period to which they relate and adjustments are made when actual amounts are known.
Income Tax Information and Distributions to Shareholders. Each year the Fund intends to qualify as a regulated investment company, including distributing substantially all of its taxable income and realized gains under Subchapter M of the Internal Revenue Code and filing its U.S. federal tax return. As a result, no provision for income taxes is required. As of December 31, 2010, the Fund did not have any unrecognized tax benefits in the accompanying financial statements. A fund's federal tax return is subject to examination by the Internal Revenue Service (IRS) for a period of three years. Foreign taxes are provided for based on the Fund's understanding of the tax rules and rates that exist in the foreign markets in which it invests. The Fund is subject to a tax imposed on realized short term capital gains on securities of certain issuers domiciled in India. An estimated deferred tax liability for net unrealized gains on these securities is included in Other payables and accrued expenses on the Statement of Assets & Liabilities.
Distributions are declared and recorded on the ex-dividend date. Income dividends and capital gain distributions are declared separately for each class. Income and capital gain distributions are determined in accordance with income tax regulations, which may differ from GAAP.
Capital accounts within the financial statements are adjusted for permanent book-tax differences. These adjustments have no impact on net assets or the results of operations. Temporary book-tax differences will reverse in a subsequent period.
Book-tax differences are primarily due to foreign currency transactions, certain foreign taxes, passive foreign investment companies (PFIC), market discount, capital loss carryforwards, losses deferred due to wash sales and excise tax regulations.
The federal tax cost of investment securities and unrealized appreciation (depreciation) as of period end were as follows:
Gross unrealized appreciation | $ 6,604,821 |
Gross unrealized depreciation | (1,008,387) |
Net unrealized appreciation (depreciation) | $ 5,596,434 |
Tax Cost | $ 40,298,298 |
Annual Report
3. Significant Accounting Policies - continued
Income Tax Information and Distributions to Shareholders - continued
The tax-based components of distributable earnings as of period end were as follows:
Undistributed ordinary income | $ 39,761 |
Capital loss carryforward | $ (22,327,177) |
Net unrealized appreciation (depreciation) | $ 5,596,534 |
The tax character of distributions paid was as follows:
| December 31, 2010 | December 31, 2009 |
Ordinary Income | $ 978,239 | $ 795,722 |
Trading (Redemption) Fees. Initial Class R shares, Service Class R shares, Service Class 2R shares and Investor Class R shares held by investors less than 60 days are subject to a redemption fee equal to 1% of the net asset value of shares redeemed. All redemption fees, which reduce the proceeds of the shareholder redemption, are retained by the Fund and accounted for as an addition to paid in capital.
4. Operating Policies.
Restricted Securities. The Fund may invest in securities that are subject to legal or contractual restrictions on resale. These securities generally may be resold in transactions exempt from registration or to the public if the securities are registered. Disposal of these securities may involve time-consuming negotiations and expense, and prompt sale at an acceptable price may be difficult. Information regarding restricted securities is included at the end of the Fund's Schedule of Investments.
5. Purchases and Sales of Investments.
Purchases and sales of securities, other than short-term securities, aggregated $200,490,099 and $207,300,608, respectively.
6. Fees and Other Transactions with Affiliates.
Management Fee. FMR and its affiliates provide the Fund with investment management related services for which the Fund pays a monthly management fee. The management fee is the sum of an individual fund fee rate that is based on an annual rate of .45% of the Fund's average net assets and a group fee rate that averaged .26% during the period. The group fee rate is based upon the average net assets of all the mutual funds advised by FMR. The group fee rate decreases as assets under management increase and increases as assets under management decrease. For the period, the total annual management fee rate was .71% of the Fund's average net assets.
Distribution and Service Plan Fees. In accordance with Rule 12b-1 of the 1940 Act, the Fund has adopted separate 12b-1 Plans for each Service Class of shares. Each Service Class pays Fidelity Distributors Corporation (FDC), an affiliate of FMR, a service fee. For the period, the service fee is based on an annual rate of .10% of Service Class' and Service Class R's average net assets and .25% of Service Class 2's and Service Class 2R's average net assets.
For the period, total fees, all of which were re-allowed to insurance companies for the distribution of shares and providing shareholder support services were as follows:
Service Class | $ 100 |
Service Class 2 | 180 |
Service Class R | 100 |
Service Class 2R | 316 |
| $ 696 |
Annual Report
Notes to Financial Statements - continued
6. Fees and Other Transactions with Affiliates - continued
Transfer Agent Fees. Fidelity Investments Institutional Operations Company, Inc. (FIIOC), an affiliate of FMR, is the Fund's transfer, dividend disbursing, and shareholder servicing agent. FIIOC receives an asset-based fee with respect to each class. Each class (with the exception of Investor Class) pays a transfer agent fee, excluding out of pocket expenses, equal to an annual rate of .07% of average net assets. Investor Class pays a monthly asset-based transfer agent fee of .15% of average net assets. In addition, FIIOC receives an asset-based fee of .01% of average net assets for typesetting, printing and mailing of shareholder reports, except proxy statements. FIIOC has agreed to voluntarily waive this fee until December 31, 2010. (See Note 9: Expense Reductions.) For the period, transfer agent fees for each class, including printing and out of pocket expenses, were as follows:
Initial Class | $ 903 |
Service Class | 115 |
Service Class 2 | 74 |
Initial Class R | 14,740 |
Service Class R | 115 |
Service Class 2R | 145 |
Investor Class R | 46,215 |
| $ 62,307 |
Accounting and Security Lending Fees. Fidelity Service Company, Inc. (FSC), an affiliate of FMR, maintains the Fund's accounting records. The accounting fee is based on the level of average net assets for the month. Under a separate contract, FSC administers the security lending program. The security lending fee is based on the number and duration of lending transactions.
Brokerage Commissions. The Fund placed a portion of its portfolio transactions with brokerage firms which are affiliates of the investment advisor. The commissions paid to these affiliated firms were $2,142 for the period.
7. Committed Line of Credit.
The Fund participates with other funds managed by FMR or an affiliate in a $3.75 billion credit facility (the "line of credit") to be utilized for temporary or emergency purposes to fund shareholder redemptions or for other short-term liquidity purposes. The Fund has agreed to pay commitment fees on its pro-rata portion of the line of credit, which amounted to $174 and is reflected in Miscellaneous expenses on the Statement of Operations. During the period, there were no borrowings on this line of credit.
8. Security Lending.
The Fund lends portfolio securities through a lending agent from time to time in order to earn additional income. The lending agent may loan securities to certain qualified borrowers, including Fidelity Capital Markets (FCM), a broker-dealer affiliated with the Fund. On the settlement date of the loan, the Fund receives collateral (in the form of U.S. Treasury obligations, letters of credit and/or cash) against the loaned securities and maintains collateral in an amount not less than 100% of the market value of the loaned securities during the period of the loan. The market value of the loaned securities is determined at the close of business of the Fund and any additional required collateral is delivered to the Fund on the next business day. If the borrower defaults on its obligation to return the securities loaned because of insolvency or other reasons, a fund could experience delays and costs in recovering the securities loaned or in gaining access to the collateral. Any cash collateral received is invested in the Fidelity Securities Lending Cash Central Fund. The value of the loaned securities and cash collateral at period end are disclosed on the Fund's Statement of Assets and Liabilities. Security lending income represents the income earned on investing cash collateral, less rebates paid to borrowers and lending agent fees associated with the loan, plus any premium payments received for lending certain types of securities. Security lending income is presented in the Statement of Operations as a component of income from Fidelity Central Funds. Total security lending income during the period amounted to $29,563. During the period, there were no securities loaned to FCM.
Annual Report
9. Expense Reductions.
In addition to FIIOC waiving a portion of its transfer agent fees, FMR voluntarily agreed to reimburse each class to the extent annual operating expenses exceeded certain levels of average net assets as noted in the table below. Some expenses, for example interest expense, including commitment fees, are excluded from this reimbursement.
The following classes were in reimbursement during the period:
| Expense
Limitations | Reimbursement/Waiver |
Initial Class | 1.10% | $ 3,019 |
Service Class | 1.20% | 474 |
Service Class 2 | 1.35% | 368 |
Initial Class R | 1.10% | 70,962 |
Service Class R | 1.20% | 474 |
Service Class 2R | 1.35% | 610 |
Investor Class R | 1.18% | 120,972 |
| | $ 196,879 |
Many of the brokers with whom FMR places trades on behalf of the Fund provided services to the Fund in addition to trade execution. These services included payments of certain expenses on behalf of the Fund totaling $63,186 for the period.
10. Distributions to Shareholders.
Distributions to shareholders of each class were as follows:
Years ended December 31, | 2010 | 2009 |
From net investment income | | |
Initial Class | $ 7,768 | $ 4,242 |
Service Class | 961 | 684 |
Service Class 2 | 434 | 1,982 |
Initial Class R | 168,615 | 119,072 |
Service Class R | 961 | 684 |
Service Class 2R | 883 | 659 |
Investor Class R | 315,206 | 190,024 |
Total | $ 494,828 | $ 317,347 |
From net realized gain | | |
Initial Class | $ 7,019 | $ 6,363 |
Service Class | 1,064 | 1,207 |
Service Class 2 | 542 | 4,350 |
Initial Class R | 168,298 | 178,610 |
Service Class R | 1,064 | 1,207 |
Service Class 2R | 1,291 | 1,602 |
Investor Class R | 304,133 | 285,036 |
Total | $ 483,411 | $ 478,375 |
11. Share Transactions.
Transactions for each class of shares were as follows:
| Shares | Dollars |
Years ended December 31, | 2010 | 2009 | 2010 | 2009 |
Initial Class | | | | |
Shares sold | 25,624 | 23,291 | $ 225,829 | $ 165,986 |
Reinvestment of distributions | 1,589 | 1,265 | 14,787 | 10,605 |
Shares redeemed | (26,957) | (18,636) | (240,709) | (107,450) |
Net increase (decrease) | 256 | 5,920 | $ (93) | $ 69,141 |
Service Class | | | | |
Reinvestment of distributions | 220 | 226 | 2,025 | 1,891 |
Shares redeemed | (3,601) | (10,639) | (31,344) | (71,691) |
Net increase (decrease) | (3,381) | (10,413) | $ (29,319) | $ (69,800) |
Annual Report
Notes to Financial Statements - continued
11. Share Transactions - continued
| Shares | Dollars |
Years ended December 31, | 2010 | 2009 | 2010 | 2009 |
Service Class 2 | | | | |
Shares sold | 6,746 | 19,605 | $ 65,263 | $ 124,280 |
Reinvestment of distributions | 105 | 758 | 976 | 6,332 |
Shares redeemed | (44,506) | (24,845) | (374,788) | (158,018) |
Net increase (decrease) | (37,655) | (4,482) | $ (308,549) | $ (27,406) |
Initial Class R | | | | |
Shares sold | 440,907 | 897,081 | $ 3,898,339 | $ 6,785,884 |
Reinvestment of distributions | 36,492 | 35,523 | 336,913 | 297,682 |
Shares redeemed | (900,018) | (448,753) | (7,801,721) | (2,964,977) |
Net increase (decrease) | (422,619) | 483,851 | $ (3,566,469) | $ 4,118,589 |
Service Class R | | | | |
Reinvestment of distributions | 220 | 226 | 2,025 | 1,891 |
Shares redeemed | (3,601) | (10,639) | (31,344) | (71,691) |
Net increase (decrease) | (3,381) | (10,413) | $ (29,319) | $ (69,800) |
Service Class 2R | | | | |
Reinvestment of distributions | 239 | 271 | 2,174 | 2,261 |
Shares redeemed | (7,096) | (14,127) | (61,060) | (94,930) |
Net increase (decrease) | (6,857) | (13,856) | $ (58,886) | $ (92,669) |
Investor Class R | | | | |
Shares sold | 675,944 | 1,164,413 | $ 6,013,493 | $ 9,035,456 |
Reinvestment of distributions | 67,265 | 56,962 | 619,339 | 475,060 |
Shares redeemed | (958,233) | (525,663) | (8,174,476) | (3,339,913) |
Net increase (decrease) | (215,024) | 695,712 | $ (1,541,644) | $ 6,170,603 |
12. Other.
The Fund's organizational documents provide former and current trustees and officers with a limited indemnification against liabilities arising in connection with the performance of their duties to the Fund. In the normal course of business, the Fund may also enter into contracts that provide general indemnifications. The Fund's maximum exposure under these arrangements is unknown as this would be dependent on future claims that may be made against the Fund. The risk of material loss from such claims is considered remote.
At the end of the period, FMR or its affiliates were the owners of record of 98% of the total outstanding shares of the Fund.
Annual Report
Report of Independent Registered Public Accounting Firm
To the Trustees of Variable Insurance Products Fund IV and the Shareholders of VIP International Capital Appreciation Portfolio:
In our opinion, the accompanying statement of assets and liabilities, including the schedule of investments, and the related statements of operations and of changes in net assets and the financial highlights present fairly, in all material respects, the financial position of VIP International Capital Appreciation Portfolio (a fund of Variable Insurance Products Fund IV) at December 31, 2010, the results of its operations for the year then ended, the changes in its net assets for each of the two years in the period then ended and the financial highlights for each of the five years in the period then ended, in conformity with accounting principles generally accepted in the United States of America. These financial statements and financial highlights (hereafter referred to as "financial statements") are the responsibility of the VIP International Capital Appreciation Portfolio's management. Our responsibility is to express an opinion on these financial statements based on our audits. We conducted our audits of these financial statements in accordance with the standards of the Public Company Accounting Oversight Board (United States). Those standards require that we plan and perform the audit to obtain reasonable assurance about whether the financial statements are free of material misstatement. An audit includes examining, on a test basis, evidence supporting the amounts and disclosures in the financial statements, assessing the accounting principles used and significant estimates made by management, and evaluating the overall financial statement presentation. We believe that our audits, which included confirmation of securities at December 31, 2010 by correspondence with the custodian and brokers, provide a reasonable basis for our opinion.
/s/ PricewaterhouseCoopers LLP
PricewaterhouseCoopers LLP
Boston, Massachusetts
February 17, 2011
Annual Report
The Trustees, Members of the Advisory Board, and executive officers of the trust and fund, as applicable, are listed below. The Board of Trustees governs the fund and is responsible for protecting the interests of shareholders. The Trustees are experienced executives who meet periodically throughout the year to oversee the fund's activities, review contractual arrangements with companies that provide services to the fund, oversee management of the risks associated with such activities and contractual arrangements, and review the fund's performance. Except for James C. Curvey, each of the Trustees oversees 219 funds advised by FMR or an affiliate. Mr. Curvey oversees 408 funds advised by FMR or an affiliate.
The Trustees hold office without limit in time except that (a) any Trustee may resign; (b) any Trustee may be removed by written instrument, signed by at least two-thirds of the number of Trustees prior to such removal; (c) any Trustee who requests to be retired or who has become incapacitated by illness or injury may be retired by written instrument signed by a majority of the other Trustees; and (d) any Trustee may be removed at any special meeting of shareholders by a two-thirds vote of the outstanding voting securities of the trust. Each Trustee who is not an interested person (as defined in the 1940 Act) (Independent Trustee), shall retire not later than the last day of the calendar year in which his or her 72nd birthday occurs. The Independent Trustees may waive this mandatory retirement age policy with respect to individual Trustees. The executive officers and Advisory Board Members hold office without limit in time, except that any officer and Advisory Board Member may resign or may be removed by a vote of a majority of the Trustees at any regular meeting or any special meeting of the Trustees. Except as indicated, each individual has held the office shown or other offices in the same company for the past five years.
Experience, Skills, Attributes, and Qualifications of the Fund's Trustees. The Governance and Nominating Committee has adopted a statement of policy that describes the experience, qualifications, attributes, and skills that are necessary and desirable for potential Independent Trustee candidates (Statement of Policy). The Board believes that each Trustee satisfied at the time he or she was initially elected or appointed a Trustee, and continues to satisfy, the standards contemplated by the Statement of Policy. The Governance and Nominating Committee also engages professional search firms to help identify potential Independent Trustee candidates who have the experience, qualifications, attributes, and skills consistent with the Statement of Policy. From time to time, additional criteria based on the composition and skills of the current Independent Trustees, as well as experience or skills that may be appropriate in light of future changes to board composition, business conditions, and regulatory or other developments, have also been considered by the professional search firms and the Governance and Nominating Committee. In addition, the Board takes into account the Trustees' commitment and participation in Board and committee meetings, as well as their leadership of standing and ad hoc committees throughout their tenure.
In determining that a particular Trustee was and continues to be qualified to serve as a Trustee, the Board has considered a variety of criteria, none of which, in isolation, was controlling. The Board believes that, collectively, the Trustees have balanced and diverse experience, qualifications, attributes, and skills, which allow the Board to operate effectively in governing the fund and protecting the interests of shareholders. Information about the specific experience, skills, attributes, and qualifications of each Trustee, which in each case led to the Board's conclusion that the Trustee should serve (or continue to serve) as a trustee of the fund, is provided below.
Board Structure and Oversight Function. James C. Curvey is an interested person (as defined in the 1940 Act) and currently serves as Acting Chairman. The Trustees have determined that an interested Chairman is appropriate and benefits shareholders because an interested Chairman has a personal and professional stake in the quality and continuity of services provided to the fund. Independent Trustees exercise their informed business judgment to appoint an individual of their choosing to serve as Chairman, regardless of whether the Trustee happens to be independent or a member of management. The Independent Trustees have determined that they can act independently and effectively without having an Independent Trustee serve as Chairman and that a key structural component for assuring that they are in a position to do so is for the Independent Trustees to constitute a substantial majority for the Board. The Independent Trustees also regularly meet in executive session. Ned C. Lautenbach serves as Chairman of the Independent Trustees and as such (i) acts as a liaison between the Independent Trustees and management with respect to matters important to the Independent Trustees and (ii) with management prepares agendas for Board meetings.
Fidelity funds are overseen by different Boards of Trustees. The fund's Board oversees Fidelity's equity and high income funds and another Board oversees Fidelity's investment-grade bond, money market, and asset allocation funds. The asset allocation funds may invest in Fidelity funds overseen by the fund's Board. The use of separate Boards, each with its own committee structure, allows the Trustees of each group of Fidelity funds to focus on the unique issues of the funds they oversee, including common research, investment, and operational issues. On occasion, the separate Boards establish joint committees to address issues of overlapping consequences for the Fidelity funds overseen by each Board.
The Trustees operate using a system of committees to facilitate the timely and efficient consideration of all matters of importance to the Trustees, the fund, and fund shareholders and to facilitate compliance with legal and regulatory requirements and oversight of the fund's activities and associated risks. The Board, acting through its committees, has charged FMR and its affiliates with (i) identifying events or circumstances the occurrence of which could have demonstrably adverse effects on the fund's business and/or reputation; (ii) implementing processes and controls to lessen the possibility that such events or circumstances occur or to mitigate the effects of such events or circumstances if they do occur; and (iii) creating and maintaining a system designed to evaluate continuously business and market conditions in order to facilitate the identification and implementation processes described in (i) and (ii) above. Because the day-to-day operations and activities of the fund are carried out by or through FMR, its affiliates and other service providers, the fund's exposure to risks is mitigated but not eliminated by the processes overseen by the Trustees. While each of the Board's committees has responsibility for overseeing different aspects of the fund's activities, oversight is exercised primarily through the Operations, Audit, and Compliance Committees. Appropriate personnel, including but not limited to the fund's Chief Compliance Officer (CCO), FMR's internal auditor, the independent accountants, the fund's Treasurer and portfolio management personnel, make periodic reports to the Board's committees, as appropriate. The responsibilities of each committee, including their oversight responsibilities, are described further under "Standing Committees of the Fund's Trustees."
Annual Report
Trustees and Officers - continued
The fund's Statement of Additional Information (SAI) includes more information about the Trustees. To request a free copy, call Fidelity at 1-877-208-0098.
Interested Trustees*:
Correspondence intended for each Trustee who is an interested person may be sent to Fidelity Investments, 82 Devonshire Street, Boston, Massachusetts 02109.
Name, Age; Principal Occupations and Other Relevant Experience+ |
James C. Curvey (75) |
| Year of Election or Appointment: 2007 Mr. Curvey is Trustee and Acting Chairman of the Board of Trustees of certain Trusts. Mr. Curvey also serves as Trustee (2007-present) of other investment companies advised by FMR. Mr. Curvey is a Director of Fidelity Investments Money Management, Inc. (2009-present), Director of Fidelity Research & Analysis Co. (2009-present) and Director of FMR and FMR Co., Inc. (2007-present). Mr. Curvey is also Vice Chairman (2007-present) and Director of FMR LLC. In addition, Mr. Curvey serves as an Overseer for the Boston Symphony Orchestra and a member of the Trustees of Villanova University. Previously, Mr. Curvey was the Vice Chairman (2006-2007) and Director (2000-2007) of FMR Corp. |
Ronald P. O'Hanley (54) |
| Year of Election or Appointment: 2011 Mr. O'Hanley is President of Fidelity Asset Management and Corporate Services and a member of Fidelity's Executive Committee (2010-present). Previously, Mr. O'Hanley served as President and Chief Executive Officer of BNY Mellon Asset Management (2007-2010). Mr. O'Hanley also served as Vice Chairman of Bank New York Mellon Corp. and a member of that firm's Executive Committee. Prior to the 2007 merger of The Bank of New York and Mellon Financial Corporation, he was Vice Chairman of Mellon Financial Corporation and President and Chief Executive Officer of Mellon Asset Management. He joined Mellon in February 1997. Mr. O'Hanley currently serves as Chairman of the Boston Public Library Foundation Board of Directors and sits on the Board of Directors of Beth Israel Deaconess Medical Center, the Board of Trustees of the Marine Biological Laboratory and the Advisory Board of the Maxwell School of Citizenship and Public Administration at Syracuse University. Mr. O'Hanley also chairs the Council on Asset Management for the Financial Services Roundtable and is a member of the Board of Directors of Institutional Investor's U.S. Institute. |
* Trustees have been determined to be "Interested Trustees" by virtue of, among other things, their affiliation with the trust or various entities under common control with FMR.
+ The information above includes each Trustee's principal occupation during the last five years and other information relating to the experience, attributes, and skills relevant to each Trustee's qualifications to serve as a Trustee, which led to the conclusion that each Trustee should serve as a Trustee for the fund.
Independent Trustees:
Correspondence intended for each Independent Trustee (that is, the Trustees other than the Interested Trustees) may be sent to Fidelity Investments, P.O. Box 55235, Boston, Massachusetts 02205-5235.
Name, Age; Principal Occupations and Other Relevant Experience+ |
Dennis J. Dirks (62) |
| Year of Election or Appointment: 2005 Prior to his retirement in May 2003, Mr. Dirks was Chief Operating Officer and a member of the Board of The Depository Trust & Clearing Corporation (DTCC). He also served as President, Chief Operating Officer, and Board member of The Depository Trust Company (DTC) and President and Board member of the National Securities Clearing Corporation (NSCC). In addition, Mr. Dirks served as Chief Executive Officer and Board member of the Government Securities Clearing Corporation, Chief Executive Officer and Board member of the Mortgage-Backed Securities Clearing Corporation, as a Trustee and a member of the Finance Committee of Manhattan College (2005-2008), and as a Trustee and a member of the Finance Committee of AHRC of Nassau County (2006-2008). Mr. Dirks is a member of the Independent Directors Council (IDC) Governing Council (2010-Present) and Board of Directors for The Brookville Center for Children's Services, Inc. (2009-present). |
Alan J. Lacy (57) |
| Year of Election or Appointment: 2008 Mr. Lacy serves as Senior Adviser (2007-present) of Oak Hill Capital Partners, L.P. (private equity). Mr. Lacy also served as Chief Executive Officer (2000-2005) and Vice Chairman (2005-2006) of Sears Holdings Corporation and Sears, Roebuck and Co. (retail). In addition, Mr. Lacy serves as a member of the Board of Directors of The Western Union Company (global money transfer, 2006-present) and Bristol-Myers Squibb Company (global pharmaceuticals, 2007-present). Mr. Lacy is Chairman (2008-present) and a member (2006-present) of the Board of Trustees of The National Parks Conservation Association. |
Ned C. Lautenbach (66) |
| Year of Election or Appointment: 2000 Mr. Lautenbach is Chairman of the Independent Trustees of the Equity and High Income Funds (2006-present). Mr. Lautenbach currently serves as the Lead Director of the Eaton Corporation Board of Directors (diversified industrial, 1997-present). Mr. Lautenbach is also a member of the Board of Directors of the Philharmonic Center for the Arts in Naples, Florida (1999-present); a member of the Board of Trustees of Fairfield University (2005-present); and a member of the Council on Foreign Relations (1994-present). Previously, Mr. Lautenbach was a Partner/Advisory Partner at Clayton, Dubilier & Rice, Inc. (private equity investment, 1998-2010), as well as a Director of Sony Corporation (2006-2007). |
Joseph Mauriello (66) |
| Year of Election or Appointment: 2008 Prior to his retirement in January 2006, Mr. Mauriello served in numerous senior management positions including Deputy Chairman and Chief Operating Officer (2004-2005), and Vice Chairman of Financial Services (2002-2004) of KPMG LLP US (professional services, 1965-2005). Mr. Mauriello currently serves as a member of the Board of Directors of XL Group plc. (global insurance and re-insurance, 2006-present) and of Arcadia Resources Inc. (health care services and products, 2007-present). Previously, Mr. Mauriello served as a Director of the Hamilton Funds of the Bank of New York (2006-2007). |
Cornelia M. Small (66) |
| Year of Election or Appointment: 2005 Ms. Small is a member of the Board of Directors of the Teagle Foundation (2009-present). Ms. Small is also a member of the Investment Committee, and Chair (2008-present) and a member of the Board of Trustees of Smith College. In addition, Ms. Small serves on the Investment Committee of the Berkshire Taconic Community Foundation (2008-present). Previously, Ms. Small served as Chairperson of the Investment Committee (2002-2008) of Smith College. In addition, Ms. Small served as Chief Investment Officer, Director of Global Equity Investments, and a member of the Board of Directors of Scudder, Stevens & Clark and Scudder Kemper Investments. |
William S. Stavropoulos (71) |
| Year of Election or Appointment: 2001 Mr. Stavropoulos is Vice Chairman of the Independent Trustees of the Equity and High Income Funds (2006-present). Mr. Stavropoulos serves as President and Founder of the Michigan Baseball Foundation, the Great Lakes Loons (2007-present). Mr. Stavropoulos is Chairman Emeritus of the Board of Directors of The Dow Chemical Company, where he previously served in numerous senior management positions, including President, CEO (1995-2000; 2002-2004), Chairman of the Executive Committee (2000-2006), and as a member of the Board of Directors (1990-2006). Currently, Mr. Stavropoulos is Chairman of Univar (global distributor of commodity and specialty chemicals, 2010-present), a Director of Teradata Corporation (data warehousing and technology solutions, 2008-present), Chemical Financial Corporation, Maersk Inc. (industrial conglomerate), Tyco International, Inc. (multinational manufacturing and services, 2007-present), and a member of the Advisory Board for Metalmark Capital (private equity investment, 2005-present). Mr. Stavropoulos is a special advisor to Clayton, Dubilier & Rice, LLC (private equity investment). In addition, Mr. Stavropoulos is a member of the University of Notre Dame Advisory Council for the College of Science. |
David M. Thomas (61) |
| Year of Election or Appointment: 2008 Previously, Mr. Thomas served as Executive Chairman (2005-2006) and Chairman and Chief Executive Officer (2000-2005) of IMS Health, Inc. (pharmaceutical and healthcare information solutions). In addition, Mr. Thomas serves as a member of the Board of Directors of Fortune Brands, Inc. (consumer products), and Interpublic Group of Companies, Inc. (marketing communication, 2004-present). |
Michael E. Wiley (60) |
| Year of Election or Appointment: 2008 Mr. Wiley also serves as a Director of Asia Pacific Exploration Consolidated (international oil and gas exploration and production, 2008-present). Mr. Wiley serves as a Director of Tesoro Corporation (independent oil refiner and marketer, 2005-present), and a Director of Bill Barrett Corporation (exploration and production, 2005-present). In addition, Mr. Wiley also serves as a Director of Post Oak Bank (privately-held bank, 2004-present). Previously, Mr. Wiley served as a member of the Board of Trustees of the University of Tulsa (2000-2006; 2007-2010), as a Senior Energy Advisor of Katzenbach Partners, LLC (consulting, 2006-2007), as an Advisory Director of Riverstone Holdings (private investment), Chairman, President, and CEO of Baker Hughes, Inc. (oilfield services, 2000-2004), and as Director of Spinnaker Exploration Company (exploration and production, 2001-2005). |
+ The information above includes each Trustee's principal occupation during the last five years and other information relating to the experience, attributes, and skills relevant to each Trustee's qualifications to serve as a Trustee, which led to the conclusion that each Trustee should serve as a Trustee for the fund.
Advisory Board Members and Executive Officers:
Correspondence intended for each executive officer, Edward C. Johnson, and Peter S. Lynch may be sent to Fidelity Investments, 82 Devonshire Street, Boston, Massachusetts 02109.
Name, Age; Principal Occupation |
Edward C. Johnson 3d (80) |
| Year of Election or Appointment: 2011 Member of the Advisory Board of Fidelity's Equity and High Income Funds. Formerly Trustee and Chairman of the Board of Trustees of certain Trusts, Mr. Johnson serves as Chief Executive Officer, Chairman, and a Director of FMR LLC; Chairman and a Director of FMR; and Chairman and a Director of FMR Co., Inc. In addition, Mr. Johnson serves as Chairman and Director of FIL Limited. Previously, Mr. Johnson served as President of FMR LLC (2006-2007). |
Peter S. Lynch (66) |
| Year of Election or Appointment: 2003 Member of the Advisory Board of Fidelity's Equity and High Income Funds. Mr. Lynch is Vice Chairman and a Director of FMR and FMR Co., Inc. In addition, Mr. Lynch serves as a Trustee of Boston College and as the Chairman of the Inner-City Scholarship Fund. Previously, Mr. Lynch served on the Special Olympics International Board of Directors (1997-2006). |
Kenneth B. Robins (41) |
| Year of Election or Appointment: 2008 President and Treasurer of Fidelity's Equity and High Income Funds. Mr. Robins also serves as President and Treasurer (2010-present) and Assistant Treasurer (2009-present) of other Fidelity funds and is an employee of Fidelity Investments (2004-present). Previously, Mr. Robins served as Deputy Treasurer of the Fidelity funds (2005-2008) and Treasurer and Chief Financial Officer of The North Carolina Capital Management Trust: Cash and Term Portfolios (2006-2008). |
Bruce T. Herring (45) |
| Year of Election or Appointment: 2006 Vice President of certain Equity Funds. Mr. Herring also serves as Chief Investment Officer and Director of Fidelity Management & Research (U.K.) Inc. (2010-present) and Group Chief Investments Officer of FMR. Previously, Mr. Herring served as Vice President (2005-2006) and Senior Vice President (2006-2007) of Fidelity Management & Research Company, Vice President of FMR Co., Inc. (2001-2007) and as a portfolio manager for Fidelity U.S. Equity Funds. |
Brian B. Hogan (46) |
| Year of Election or Appointment: 2009 Vice President of certain Equity Funds and Vice President of Sector Funds. Mr. Hogan also serves as President of FMR's Equity Division (2009-present). Previously, Mr. Hogan served as Senior Vice President, Equity Research of FMR (2006-2009) and as a portfolio manager. |
Scott C. Goebel (42) |
| Year of Election or Appointment: 2008 Secretary and Chief Legal Officer (CLO) of the Fidelity funds. Mr. Goebel also serves as Secretary and CLO of The North Carolina Capital Management Trust: Cash and Term Portfolio (2008-present); General Counsel, Secretary, and Senior Vice President of FMR (2008-present) and FMR Co., Inc. (2008-present); Deputy General Counsel of FMR LLC; Chief Legal Officer of Fidelity Management & Research (Hong Kong) Limited (2008-present) and Assistant Secretary of Fidelity Management & Research (Japan) Inc. (2008-present), Fidelity Investments Money Management, Inc. (2008-present), Fidelity Management & Research (U.K.) Inc. (2008-present), and Fidelity Research and Analysis Company (2008-present). Previously, Mr. Goebel served as Assistant Secretary of the Funds (2007-2008) and as Vice President and Secretary of Fidelity Distributors Corporation (FDC) (2005-2007). |
William C. Coffey (41) |
| Year of Election or Appointment: 2009 Assistant Secretary of Fidelity's Equity and High Income Funds. Mr. Coffey also serves as Senior Vice President and Deputy General Counsel of FMR LLC (2010-present), and is an employee of Fidelity Investments. Previously, Mr. Coffey served as Vice President and Associate General Counsel of FMR LLC (2005-2009). |
Holly C. Laurent (56) |
| Year of Election or Appointment: 2008 Anti-Money Laundering (AML) Officer of the Fidelity funds. Ms. Laurent also serves as AML Officer of The North Carolina Capital Management Trust: Cash and Term Portfolio (2008-present) and is an employee of Fidelity Investments. Previously, Ms. Laurent was Senior Vice President and Head of Legal for Fidelity Business Services India Pvt. Ltd. (2006-2008), and Senior Vice President, Deputy General Counsel and Group Head for FMR LLC (2005-2006). |
Christine Reynolds (52) |
| Year of Election or Appointment: 2008 Chief Financial Officer of the Fidelity funds. Ms. Reynolds became President of Fidelity Pricing and Cash Management Services (FPCMS) in August 2008. Ms. Reynolds served as Chief Operating Officer of FPCMS (2007-2008). Previously, Ms. Reynolds served as President, Treasurer, and Anti-Money Laundering officer of the Fidelity funds (2004-2007). |
Kenneth A. Rathgeber (63) |
| Year of Election or Appointment: 2004 Chief Compliance Officer of Fidelity's Equity and High Income Funds. Mr. Rathgeber is Chief Compliance Officer of Fidelity Management & Research (Hong Kong) Limited (2008-present), Fidelity Management & Research (Japan) Inc. (2008-present), FMR (2005-present), FMR Co., Inc. (2005-present), Fidelity Management & Research (U.K.) Inc. (2005-present), Fidelity Research & Analysis Company (2005-present), Fidelity Investments Money Management, Inc. (2005-present), Pyramis Global Advisors, LLC (2005-present), and Strategic Advisers, Inc. (2005-present). |
Jeffrey S. Christian (49) |
| Year of Election or Appointment: 2009 Deputy Treasurer of the Fidelity funds. Mr. Christian is an employee of Fidelity Investments. Previously, Mr. Christian served as Chief Financial Officer (2008-2009) of certain Fidelity funds and Senior Vice President of Fidelity Pricing and Cash Management Services (FPCMS) (2004-2009). |
Bryan A. Mehrmann (49) |
| Year of Election or Appointment: 2005 Deputy Treasurer of the Fidelity funds. Mr. Mehrmann is an employee of Fidelity Investments. |
Adrien E. Deberghes (43) |
| Year of Election or Appointment: 2008 Deputy Treasurer of Fidelity's Equity and High Income Funds. Mr. Deberghes also serves as Assistant Treasurer of other Fidelity funds (2010-present) and is an employee of Fidelity Investments (2008-present). Previously, Mr. Deberghes served as Senior Vice President of Mutual Fund Administration at State Street Corporation (2007-2008), Senior Director of Mutual Fund Administration at Investors Bank & Trust (2005-2007), and Director of Finance for Dunkin' Brands (2000-2005). |
Stephanie J. Dorsey (41) |
| Year of Election or Appointment: 2010 Assistant Treasurer of Fidelity's Equity and High Income Funds. Ms. Dorsey also serves as Deputy Treasurer of other Fidelity funds (2008-present) and is an employee of Fidelity Investments (2008-present). Previously, Ms. Dorsey served as Treasurer (2004-2008) of the JPMorgan Mutual Funds and Vice President (2004-2008) of JPMorgan Chase Bank. |
John R. Hebble (52) |
| Year of Election or Appointment: 2009 Assistant Treasurer of Fidelity's Equity and High Income Funds. Mr. Hebble also serves as Treasurer and Chief Financial Officer of The North Carolina Capital Management Trust: Cash and Term Portfolio (2008-present), President and Treasurer of other Fidelity funds (2008-present) and is an employee of Fidelity Investments. |
Gary W. Ryan (52) |
| Year of Election or Appointment: 2005 Assistant Treasurer of the Fidelity funds. Mr. Ryan is an employee of Fidelity Investments. Previously, Mr. Ryan served as Vice President of Fund Reporting in Fidelity Pricing and Cash Management Services (FPCMS) (1999-2005). |
Jonathan Davis (42) |
| Year of Election or Appointment: 2010 Assistant Treasurer of the Fidelity funds. Mr. Davis is an employee of Fidelity Investments. Previously, Mr. Davis served as Vice President and Associate General Counsel of FMR LLC (2003-2010). |
Annual Report
The Board of Trustees of VIP International Capital Appreciation Portfolio voted to pay to shareholders of record at the opening of business on record date, the following distributions per share derived from capital gains realized from sales of portfolio securities:
| Pay Date | Record Date | Dividends | Capital Gains |
Initial Class | 02/11/11 | 02/11/11 | $0.00 | $0.01 |
Service Class | 02/11/11 | 02/11/11 | $0.00 | $0.01 |
Service Class 2 | 02/11/11 | 02/11/11 | $0.00 | $0.01 |
The percentage of dividends distributed during the fiscal year representing income derived from sources within, and taxes paid to, foreign countries or possessions of the United States are as follows:
| Pay Date | Income | Taxes |
Initial Class | 02/05/2010 | $0.023 | $0.000 |
Initial Class | 12/17/2010 | $0.165 | $0.015 |
Initial Class | 12/30/2010 | $0.022 | $0.000 |
Service Class | 02/05/2010 | $0.023 | $0.000 |
Service Class | 12/17/2010 | $0.155 | $0.015 |
Service Class | 12/30/2010 | $0.022 | $0.000 |
Service Class 2 | 02/05/2010 | $0.023 | $0.000 |
Service Class 2 | 12/17/2010 | $0.134 | $0.015 |
Service Class 2 | 12/30/2010 | $0.022 | $0.000 |
Annual Report
Board Approval of Investment Advisory Contracts and Management Fees
VIP International Capital Appreciation Portfolio
Each year, the Board of Trustees, including the Independent Trustees (together, the Board), votes on the renewal of the management contract and sub-advisory agreements (together, the Advisory Contracts) for the fund. The Board, assisted by the advice of fund counsel and Independent Trustees' counsel, requests and considers a broad range of information relevant to the renewal of the Advisory Contracts throughout the year.
The Board meets regularly and considers at each of its meetings factors that are relevant to its annual consideration of the renewal of the fund's Advisory Contracts, including the services and support provided to the fund and its shareholders. The Board has established various standing committees, each composed of Independent Trustees with varying backgrounds, to which the Board has assigned specific subject matter responsibilities in order to enhance effective decision-making by the Board. The Board, acting directly and through its Committees, requests and receives information concerning the annual consideration of the renewal of the fund's Advisory Contracts. The Board also meets as needed to consider matters specifically related to the Board's annual consideration of the renewal of Advisory Contracts. Members of the Board may also meet with trustees of other Fidelity funds through ad hoc joint committees to discuss certain matters relevant to the Fidelity funds.
At its July 2010 meeting, the Board of Trustees, including the Independent Trustees, unanimously determined to renew the fund's Advisory Contracts. In reaching its determination, the Board considered all factors it believed relevant, including (i) the nature, extent, and quality of the services to be provided to the fund and its shareholders (including the investment performance of the fund); (ii) the competitiveness of the fund's management fee and total expenses; (iii) the total costs of the services to be provided by and the profits to be realized by Fidelity from its relationship with the fund; (iv) the extent to which economies of scale would be realized as the fund grows; and (v) whether fee levels reflect these economies of scale, if any, for the benefit of fund shareholders.
In considering whether to renew the Advisory Contracts for the fund, the Board reached a determination, with the assistance of fund counsel and Independent Trustees' counsel and through the exercise of its business judgment, that the renewal of the Advisory Contracts is in the best interests of fund shareholders and that the compensation to be received by Fidelity under the management contract is fair and reasonable. The Board's decision to renew the Advisory Contracts was not based on any single factor noted above, but rather was based on a comprehensive consideration of all the information provided to the Board at its meetings throughout the year. The Board, in reaching its determination to renew the Advisory Contracts, is aware that shareholders in the fund have a broad range of investment choices available to them, including a wide choice among mutual funds offered by Fidelity's competitors, and that the fund's shareholders, with the opportunity to review and weigh the disclosure provided by the fund in its prospectus and other public disclosures, have chosen to invest in this fund, managed by Fidelity.
Nature, Extent, and Quality of Services Provided. The Board considered the staffing within the investment adviser, FMR, and the sub-advisers (together, the Investment Advisers), including the backgrounds of the fund's investment personnel and the fund's investment objective and discipline. The Independent Trustees also had discussions with senior management of Fidelity's investment operations and investment groups. The Board considered the structure of the portfolio manager compensation program and whether this structure provides appropriate incentives to act in the best interest of the fund.
Resources Dedicated to Investment Management and Support Services. The Board and the equity research subcommittee of the Board's Fund Oversight Committee reviewed the size, education, and experience of the Investment Advisers' investment staff, their use of technology, and the Investment Advisers' approach to recruiting, training, and retaining portfolio managers and other research, advisory, and management personnel. The Board noted that Fidelity's analysts have access to a variety of technological tools and market and securities data that enable them to perform both fundamental and quantitative analysis and to specialize in various disciplines. The Board considered Fidelity's extensive global research capabilities that enable the Investment Advisers to aggregate data from various sources in an effort to produce positive investment results. The Board also considered that Fidelity's portfolio managers and analysts have access to daily portfolio attribution that allows for monitoring of a fund's portfolio, as well as an electronic communication system that provides immediate real-time access to research concerning issuers and credit enhancers. The Board noted FMR's continued focus on strengthening the organization and discipline of equity portfolio management and research.
Shareholder and Administrative Services. The Board considered (i) the nature, extent, quality, and cost of advisory, administrative, and shareholder services performed by the Investment Advisers and their affiliates under the Advisory Contracts and under separate agreements covering transfer agency, pricing and bookkeeping, and securities lending services for the fund; (ii) the nature and extent of the investment adviser's supervision of third party service providers, principally custodians and subcustodians; and (iii) the resources devoted to, and the record of compliance with, the fund's compliance policies and procedures. The Board also reviewed the allocation of fund brokerage, including allocations to brokers affiliated with the Investment Advisers, the use of brokerage commissions to pay fund expenses, and the use of "soft" commission dollars to pay for research services.
The Board noted that the growth of fund assets over time across the complex allows Fidelity to reinvest in the development of services designed to enhance the value or convenience of the Fidelity funds as investment vehicles. These services include 24-hour access to account information and market information through phone representatives and over the Internet, and investor education materials and asset allocation tools.
Investment in a Large Fund Family. The Board considered the benefits to shareholders of investing in a Fidelity fund, including the benefits of investing in a fund that is part of a large family of funds offering a variety of investment disciplines and providing a large variety of mutual fund investor services. The Board noted that Fidelity had taken, or had made recommendations that resulted in the Fidelity funds taking, a number of actions over the previous year that benefited particular funds, including (i) dedicating additional resources to investment research and restructuring and broadening the focus of the investment research teams; (ii) bolstering the senior management team that oversees asset management; (iii) launching Class F of certain funds as a lower-fee class available to Freedom K and Freedom Index Funds; (iv) lowering the initial investment minimums and ongoing balance requirements for Real Estate High Income Fund; (v) eliminating subsequent purchase minimums for all funds and adding a waiver of the investment minimum requirement for new accounts opened with the proceeds of a systematic withdrawal plan; (vi) eliminating the withdrawal minimum and maximum limits for systematic withdrawals from Advisor funds; (vii) expanding sales load waivers on Class A shares for Destiny Planholders and expanding Institutional Class eligibility for Class O Destiny Planholders; and (viii) changing certain Class A and Class T sales charge structures to further align them with industry practices.
Annual Report
Investment Performance. The Board considered whether the fund has operated in accordance with its investment objective, as well as its record of compliance with its investment restrictions. It also reviewed the fund's absolute investment performance for each class, as well as the fund's relative investment performance for each class measured over multiple periods against (i) a broad-based securities market index, and (ii) a custom peer group of mutual funds deemed appropriate by Fidelity and reviewed by the Board. The following charts considered by the Board show, over the one-, three-, and five-year periods ended December 31, 2009, the cumulative total returns of Initial Class R and Service Class 2 R of the fund, the cumulative total returns of a broad-based securities market index ("benchmark"), and a range of cumulative total returns of a custom peer group of mutual funds defined by FMR based on categories assigned by Morningstar, Inc. The returns of Initial Class R and Service Class 2 R show the performance of the highest and lowest performing classes, respectively (based on five-year performance). The box within each chart shows the 25th percentile return (bottom of box) and the 75th percentile return (top of box) of the peer group. Returns shown above the box are in the first quartile and returns shown below the box are in the fourth quartile. The percentage beaten numbers noted below each chart correspond to the percentile box and represent the percentage of funds in the peer group whose performance was equal to or lower than that of the class indicated. The fund's custom peer group, defined by FMR, is a peer group that FMR believes provides a more meaningful performance comparison than the peer group assigned by Morningstar, Inc., which assigns mutual funds to categories based on their investment styles as measured by their underlying portfolio holdings.
VIP International Capital Appreciation Portfolio

The Board reviewed the fund's relative investment performance against its peer group and noted that the performance of Initial Class R of the fund was in the first quartile for the one-year period, the third quartile for the three-year period, and the fourth quartile for the five-year period. The Board also noted that the investment performance of the fund was lower than its benchmark for the three- and five-year periods, although the one-year cumulative total return of Initial Class R compared favorably to its benchmark. The Board considered that the variations in performance among the fund's classes reflect the variations in class expenses, which result in lower performance for higher expense classes. The Board also reviewed the fund's performance since inception as well as performance in the current year.
Based on its review, and giving particular weight to the nature and quality of the resources dedicated by the Investment Advisers to maintain and improve relative performance and factoring in the unprecedented market events in recent years, the Board concluded that the nature, extent, and quality of investment management and support services and of shareholder and administrative services provided to the fund will benefit the fund's shareholders, particularly in light of the Board's view that the fund's shareholders benefit from investing in a fund that is part of a large family of funds offering a variety of investment disciplines and services.
Competitiveness of Management Fee and Total Fund Expenses. The Board considered the fund's management fee and total expenses compared to "mapped groups" of competitive funds and classes. Fidelity creates "mapped groups" by combining similar Lipper investment objective categories that have comparable management fee characteristics. Combining Lipper investment objective categories aids the Board's management fee and total expense comparisons by broadening the competitive group used for comparison and by reducing the number of universes to which various Fidelity funds are compared.
Annual Report
Board Approval of Investment Advisory Contracts and Management Fees - continued
Management Fee. The Board considered two proprietary management fee comparisons for the 12-month periods shown in the chart below. The group of Lipper funds used by the Board for management fee comparisons is referred to below as the "Total Mapped Group." The Total Mapped Group comparison focuses on a fund's standing relative to the total universe of comparable funds available to investors, in terms of gross management fees before expense reimbursements or caps. "TMG %" represents the percentage of funds in the Total Mapped Group that had management fees that were lower than the fund's. For example, a TMG % of 14% means that 86% of the funds in the Total Mapped Group had higher management fees than the fund. The "Asset-Size Peer Group" (ASPG) comparison focuses on a fund's standing relative to non-Fidelity funds similar in size to the fund within the Total Mapped Group. The ASPG represents at least 15% of the funds in the Total Mapped Group with comparable asset size and management fee characteristics, subject to a minimum of 50 funds (or all funds in the Total Mapped Group if fewer than 50). Additional information, such as the ASPG quartile in which the fund's management fee ranked, is also included in the chart and considered by the Board.
VIP International Capital Appreciation Portfolio
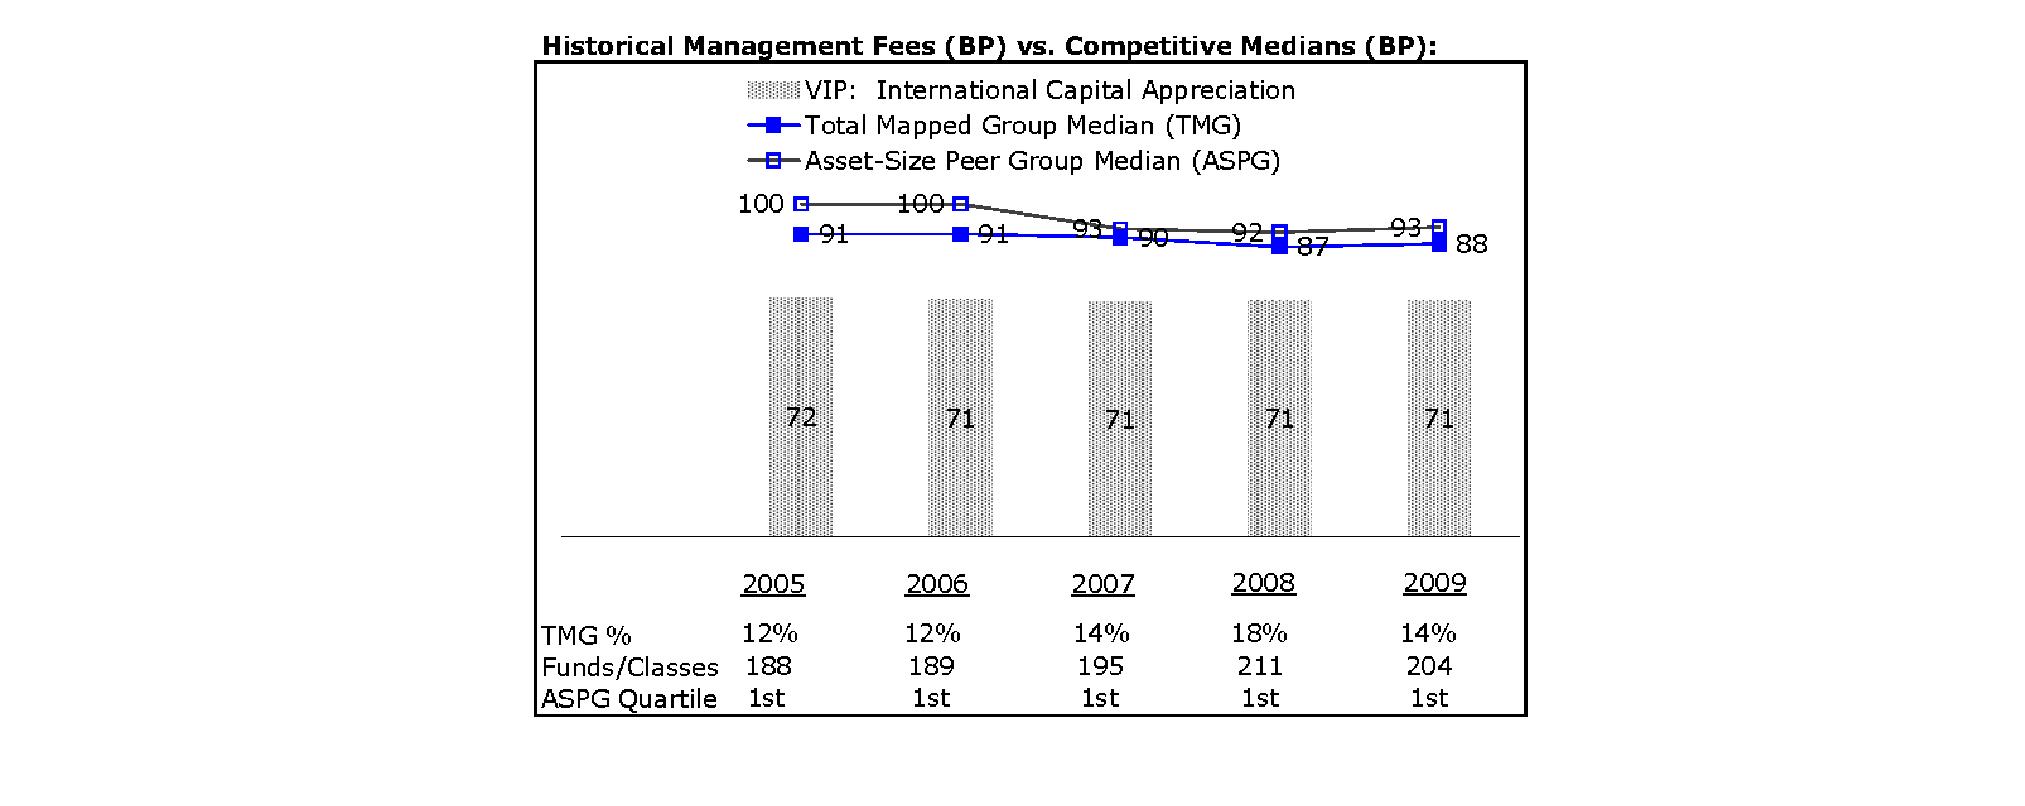
The Board noted that the fund's management fee ranked below the median of its Total Mapped Group and below the median of its ASPG for 2009.
Based on its review, the Board concluded that the fund's management fee is fair and reasonable in light of the services that the fund receives and the other factors considered.
Total Expenses. In its review of each class's total expenses, the Board considered the fund's management fee as well as other fund or class expenses, as applicable, such as transfer agent fees, pricing and bookkeeping fees, fund-paid 12b-1 fees, and custodial, legal, and audit fees. The Board also noted the effects of any waivers and reimbursements on fees and expenses. As part of its review, the Board also considered current and historical total expenses of each class of the fund compared to competitive fund median expenses. Each class of the fund is compared to those funds and classes in the Total Mapped Group (used by the Board for management fee comparisons) that have a similar sales load structure.
The Board noted that the total expenses of each of Initial Class and Initial Class R ranked equal to its competitive median for 2009 and the total expenses of each of Investor Class R, Service Class, Service Class 2, Service Class R, and Service Class 2 R ranked above its competitive median for 2009. The Board considered that the total expenses of Investor Class R were above the median primarily due to its higher transfer agent fee. The Board noted that the fund offers multiple classes, each of which has a different 12b-1 fee structure, and that the multiple structures are intended to offer a range of pricing options for the intermediary market. The Board also noted that the total expenses of the classes vary primarily by the level of their 12b-1 fees, although differences in transfer agent fees may also cause expenses to vary from class to class.
Fees Charged to Other Fidelity Clients. The Board also considered Fidelity fee structures and other information with respect to clients of FMR and its affiliates, such as other mutual funds advised or subadvised by FMR or its affiliates, pension plan clients, and other institutional clients. In March 2010, the Board created an ad hoc joint committee with the board of other Fidelity funds (the Committee) to review and compare Fidelity's institutional investment advisory business with its business of providing services to the Fidelity funds, including the differences in services provided, fees charged, and costs incurred, as well as competition in their respective marketplaces.
Annual Report
Based on its review of total expenses and fees charged to other Fidelity clients, the Board concluded that the total expenses of each class of the fund were reasonable, although in some cases above the median of the universe presented for comparison, in light of the services that the fund and its shareholders receive and the other factors considered, including the findings of the Committee.
Costs of the Services and Profitability. The Board considered the revenues earned and the expenses incurred by Fidelity in conducting the business of developing, marketing, distributing, managing, administering and servicing the fund and its shareholders. The Board also considered the level of Fidelity's profits in respect of all the Fidelity funds.
On an annual basis, FMR presents to the Board Fidelity's profitability for the fund. Fidelity calculates the profitability for each fund, as well as aggregate profitability for groups of Fidelity funds and all Fidelity funds, using a series of detailed revenue and cost allocation methodologies which originate with the audited books and records of Fidelity. The Audit Committee of the Board reviews any significant changes from the prior year's methodologies.
PricewaterhouseCoopers LLP (PwC), independent registered public accounting firm and auditor to Fidelity and certain Fidelity funds, has been engaged annually by the Board as part of the Board's assessment of Fidelity's profitability analysis. PwC's engagement includes the review and assessment of Fidelity's methodologies used in determining the revenues and expenses attributable to Fidelity's mutual fund business, and completion of agreed-upon procedures surrounding the mathematical accuracy of fund profitability and its conformity to allocation methodologies. After considering PwC's reports issued under the engagement and information provided by Fidelity, the Board believes that while other allocation methods may also be reasonable, Fidelity's profitability methodologies are reasonable in all material respects.
The Board has also reviewed Fidelity's non-fund businesses and fall-out benefits related to the mutual fund business as well as cases where Fidelity's affiliates may benefit from or be related to the fund's business.
The Board considered the costs of the services provided by and the profits realized by Fidelity in connection with the operation of the fund and were satisfied that the profitability was not excessive in the circumstances.
Economies of Scale. The Board considered whether there have been economies of scale in respect of the management of the Fidelity funds, whether the Fidelity funds (including the fund) have appropriately benefited from any such economies of scale, and whether there is potential for realization of any further economies of scale. The Board considered the extent to which the fund will benefit from economies of scale through increased services to the fund, through waivers or reimbursements, or through fee or expense reductions.
In February 2009, the Board and the board of other Fidelity funds created an ad hoc committee (the Economies of Scale Committee) to analyze whether FMR attains economies of scale in respect of the management and servicing of the Fidelity funds, whether the Fidelity funds have appropriately benefited from such economies of scale, and whether there is potential for realization of any further economies of scale.
The Board recognized that the fund's management contract incorporates a "group fee" structure, which provides for lower group fee rates as total fund assets under FMR's management increase, and for higher group fee rates as total fund assets under FMR's management decrease. FMR calculates the group fee rates based on a tiered asset "breakpoint" schedule that varies based on asset class. The Board considered that the group fee is designed to deliver the benefits of economies of scale to fund shareholders when total Fidelity fund assets increase, even if assets of any particular fund are unchanged or have declined, because some portion of Fidelity's costs are attributable to services provided to all Fidelity funds, and all funds benefit if those costs can be allocated among more assets. The Board concluded that, given the group fee structure, fund shareholders will benefit from lower management fees as assets under FMR's management increase at the fund complex level, regardless of whether Fidelity achieves any such economies of scale.
The Board concluded, considering the findings of the Economies of Scale Committee, that any potential economies of scale are being appropriately shared between fund shareholders and Fidelity.
Additional Information Requested by the Board. In order to develop fully the factual basis for consideration of the Fidelity funds' Advisory Contracts, the Board requested and received additional information on certain topics, including (i) fund performance trends, actions to be taken by FMR to improve certain funds' overall performance, and Fidelity's long-term strategies for certain funds; (ii) portfolio manager changes that have occurred during the past year and length of portfolio manager tenure for different categories of funds over time; (iii) Fidelity's compensation structure for portfolio managers, research analysts, and other key personnel, the rationale for the compensation structure, and how the compensation structure provides appropriate performance incentives; (iv) the amount of the investment that each portfolio manager has made in the Fidelity fund(s) that he or she manages; (v) management and other fees paid by FMR to affiliated sub-advisers on behalf of the Fidelity funds; (vi) Fidelity's fee structures and rationale for recommending different fees among different categories of funds; (vii) Fidelity's rationale for recommending which funds should have a performance adjustment component as part of their management fees; (viii) the rationale for any differences between fund fee structures and fee structures in place for other Fidelity clients; and (ix) explanations regarding the relative total expenses borne by certain funds and classes, total expense competitive trends, and actions that might be taken by FMR to reduce total expenses for certain funds and classes.
Based on its evaluation of all of the conclusions noted above, and after considering all factors it believed relevant, the Board ultimately concluded that the advisory fee structures are fair and reasonable, and that the fund's Advisory Contracts should be renewed.
Annual Report
Investment Adviser
Fidelity Management & Research Company
Boston, MA
Investment Sub-Advisers
FMR Co., Inc.
Fidelity Management & Research (U.K.) Inc.
FIL Investment Advisors
FIL Investment Advisors (U.K.) Ltd.
Fidelity Management & Research (Hong Kong) Limited
Fidelity Management & Research (Japan) Inc.
General Distributor
Fidelity Distributors Corporation
Boston, MA
Transfer and Service Agents
Fidelity Investments Institutional Operations Company, Inc.
Boston, MA
Fidelity Service Company, Inc.
Boston, MA
Custodian
Brown Brothers Harriman & Co.
Boston, MA
VIPCAP-ANN-0211
1.811843.106
Fidelity® Variable Insurance Products:
International Capital Appreciation Portfolio - Class R
Annual Report
December 31, 2010
(2_fidelity_logos) (Registered_Trademark)
Contents
Performance | <Click Here> | How the fund has done over time. |
Management's Discussion of Fund Performance | <Click Here> | The Portfolio Manager's review of fund performance and strategy. |
Shareholder Expense Example | <Click Here> | An example of shareholder expenses. |
Investment Changes | <Click Here> | A summary of major shifts in the fund's investments over the past six months. |
Investments | <Click Here> | A complete list of the fund's investments with their market values. |
Financial Statements | <Click Here> | Statements of assets and liabilities, operations, and changes in net assets, as well as financial highlights. |
Notes | <Click Here> | Notes to the financial statements. |
Report of Independent Registered Public Accounting Firm | <Click Here> | |
Trustees and Officers | <Click Here> | |
Distributions | <Click Here> | |
Board Approval of Investment Advisory Contracts and Management Fees | <Click Here> | |
To view a fund's proxy voting guidelines and proxy voting record for the 12-month period ended June 30, visit http://www.fidelity.com/proxyvotingresults or visit the Securities and Exchange Commission's (SEC) web site at http://www.sec.gov. You may also call 1-877-208-0098 to request a free copy of the proxy voting guidelines.
Fidelity Variable Insurance Products are separate account options which are purchased through a variable insurance contract.
Standard & Poor's, S&P and S&P 500 are registered service marks of The McGraw-Hill Companies, Inc. and have been licensed for use by Fidelity Distributors Corporation.
Other third party marks appearing herein are the property of their respective owners.
All other marks appearing herein are registered or unregistered trademarks or service marks of FMR LLC or an affiliated company.
The general research services agreement with Fidelity Research & Analysis Company has been terminated and is no longer in effect for the fund.
This report and the financial statements contained herein are submitted for the general information of the shareholders of the fund. This report is not authorized for distribution to prospective investors in the fund unless preceded or accompanied by an effective prospectus.
A fund files its complete schedule of portfolio holdings with the SEC for the first and third quarters of each fiscal year on Form N-Q. Forms N-Q are available on the SEC's web site at http://www.sec.gov. A fund's Forms N-Q may be reviewed and copied at the SEC's Public Reference Room in Washington, DC. Information regarding the operation of the SEC's Public Reference Room may be obtained by calling 1-800-SEC-0330. For a complete list of a fund's portfolio holdings, view the most recent holdings listing, semiannual report, or annual report on Fidelity's web site at http://www.fidelity.com, http://www.advisor.fidelity.com, or http://www.401k.com, as applicable.
NOT FDIC INSURED • MAY LOSE VALUE • NO BANK GUARANTEE
Neither the fund nor Fidelity Distributors Corporation is a bank.
Annual Report
Average annual total return reflects the change in the value of an investment, assuming reinvestment of the class' distributions from dividend income and capital gains (the profits earned upon the sale of securities that have grown in value, if any) and assuming a constant rate of performance each year. During periods of reimbursement by Fidelity, a fund's total return will be greater than it would be had the reimbursement not occurred. Performance numbers are net of all underlying fund operating expenses, but do not include any insurance charges imposed by your insurance company's separate account. If performance information included the effect of these additional charges, the total returns would have been lower. How a fund did yesterday is no guarantee of how it will do tomorrow.
Average Annual Total Returns
Periods ended December 31, 2010 | Past 1
year | Past 5
years | Life of
fundA |
VIP International Capital Appreciation Portfolio - Initial Class | 15.73% | 1.40% | 3.55% |
VIP International Capital Appreciation Portfolio - Service Class | 15.65% | 1.29% | 3.43% |
VIP International Capital Appreciation Portfolio - Service Class 2 | 15.53% | 1.16% | 3.30% |
VIP International Capital Appreciation Portfolio - Initial Class R | 15.73% | 1.41% | 3.55% |
VIP International Capital Appreciation Portfolio - Service Class R | 15.65% | 1.29% | 3.43% |
VIP International Capital Appreciation Portfolio - Service Class 2R | 15.45% | 1.14% | 3.28% |
VIP International Capital Appreciation Portfolio - Investor Class R B | 15.69% | 1.29% | 3.45% |
A From December 22, 2004.
B The initial offering of Investor Class R shares took place on July 21, 2005. Returns prior to July 21, 2005 are those of Initial Class R. Had Investor Class R's transfer agent fee had been reflected, returns prior to July 21, 2005, would have been lower.
$10,000 Over Life of Fund
Let's say hypothetically that $10,000 was invested in VIP International Capital Appreciation Portfolio - Initial Class R on December 22, 2004, when the fund started. The chart shows how the value of your investment would have changed, and also shows the MSCI® ACWI® (All Country World Index) ex USA Index performed over the same period.
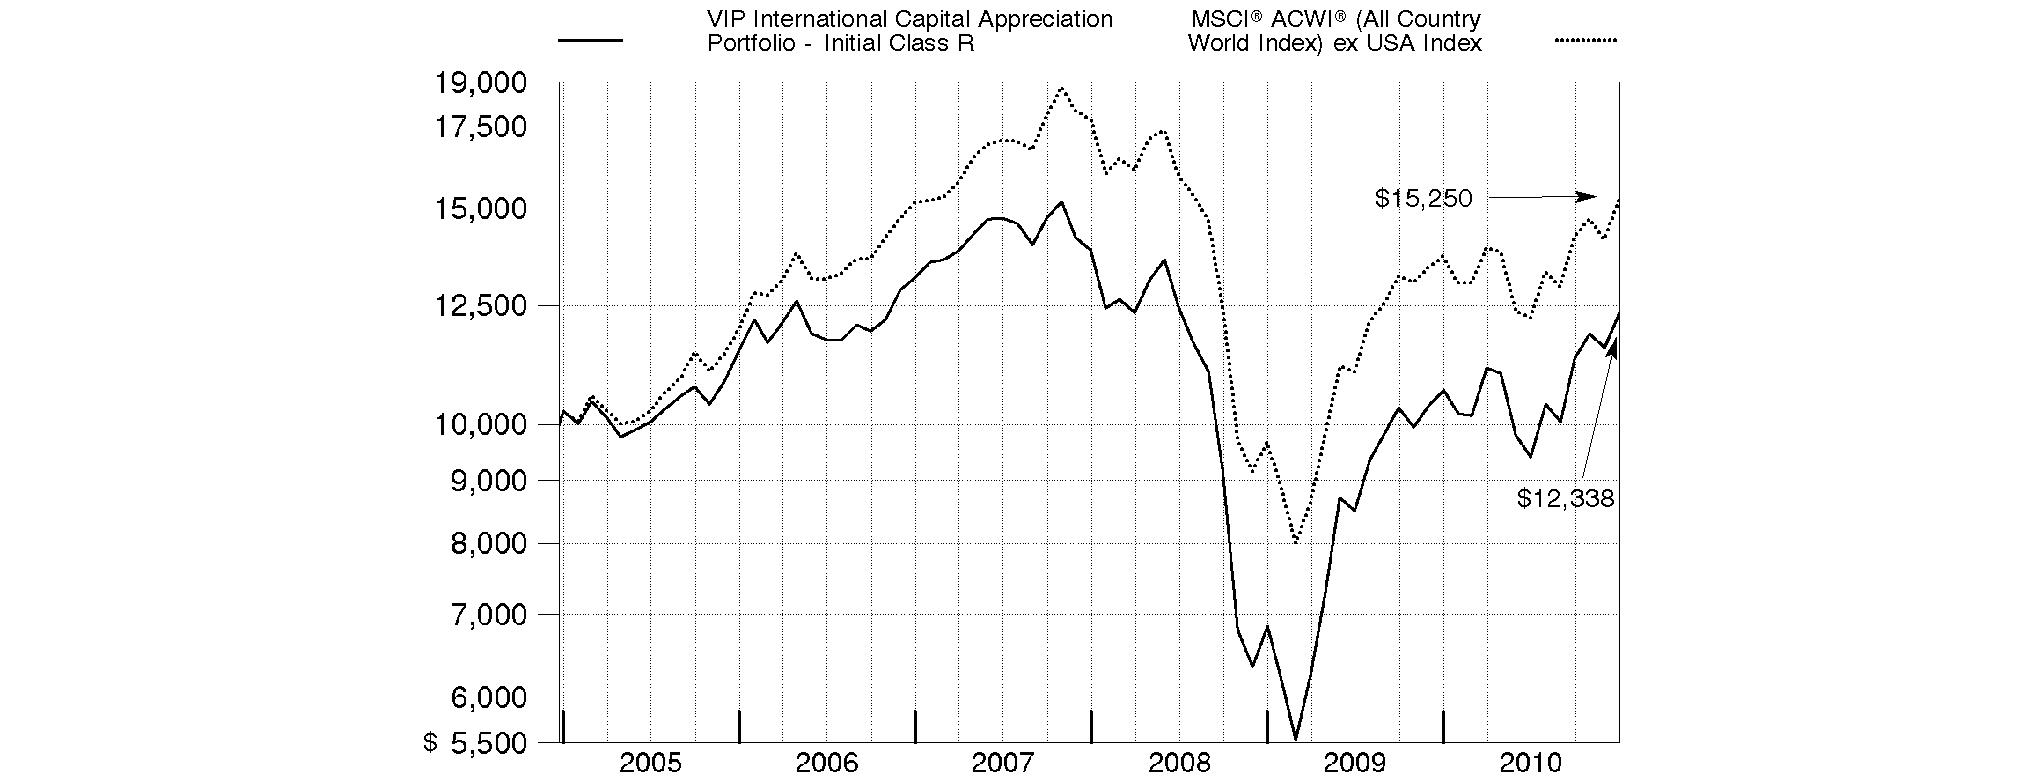
Annual Report
Market Recap: While market improvements around the world hit a speed bump in the first half of the 12-month period ending December 31, 2010, world economies re-accelerated in August, supported by a broadening recovery and low inflation in the U.S. Domestic stock markets recorded solid gains for the year, lifted by a strong second-half rally fueled by economic optimism, encouraging earnings reports and a wave of corporate mergers. The large-cap S&P 500® Index rose 15.06%, the blue-chip-laden Dow Jones Industrial AverageSM added 14.06% and the technology-heavy Nasdaq Composite® Index climbed 18.02%. Meanwhile, international stocks, as represented by the MSCI® ACWI® (All Country World Index) ex USA Index, gained 11.29%, boosted in part by a depreciating U.S. dollar. In the fixed-income arena, U.S. taxable investment-grade bonds generated positive results during 2010, as the Barclays Capital® U.S. Aggregate Bond Index gained 6.54%. With ultra-low interest rates bolstering nearly all fixed-income securities for most of the year, sectors in the index with higher yields and more credit risk generally fared best, while most high-quality bonds generated more-moderate returns. Meanwhile, high-yield bonds, as represented by The BofA Merrill LynchSM US High Yield Constrained Index, returned 15.07%, a result of improved economic data and strengthening investor demand. Overseas, foreign bond markets showed mixed results, with a sizable disparity between the 3.97% return of the Citigroup® Non-U.S. Group of 7 Index - which measures the performance of sovereign debt of the major global economies outside the U.S. - and the 12.04% advance of the JPMorgan Emerging Markets Bond Index Global (EMBI Global), which benefited from the rising overall credit quality of emerging-markets debt issuers.
Comments from Sammy Simnegar, Portfolio Manager of VIP International Capital Appreciation Portfolio: For the 12 months ending December 31, 2010, the fund's share classes finished well ahead of the 11.29% return of the MSCI® ACWI® (All Country World Index) ex USA Index. (For specific portfolio results, please refer to the performance section of this report.) Stock selection in materials and consumer discretionary stood out as strong contributors to relative performance, with stock picking in energy and an underweighting in utilities helping to a lesser extent. Geographically, a sizable out-of-benchmark stake in the United States bolstered performance. My picks in Canada, South Korea and Brazil also were rewarding, as was an underweighting in Japan. Three of the fund's four largest individual contributors were from the materials sector. The top contributor was Aurcana, a small Canadian miner of silver and other metals, with properties in Mexico and Texas. As the price of silver ran up from below $20 per ounce around midyear to more than $30 at the end of December, the company's stock had a strong run as well. Also lifting performance were two Canadian producers of metallurgical coal - that is, coal used to make steel - Western Coal and Grande Cache Coal. Other notable contributors were casino operator Las Vegas Sands and Taiwan-based handset manufacturer HTC. Conversely, security selection in financials, telecommunication services and industrials dampened the fund's gain. Among countries, weak picks in India and an underweighting in Canada were negatives. OPTI Canada, a small Canadian oil company in the process of ramping up production at several sites, hampered performance. The need to raise capital through the sale of bonds hurt the stock. Prime View International, which supplies displays for Amazon.com's KindleTM e-reader, also had a negative impact. Underweighting Australian metals miner BHP Billiton worked against the fund, especially given the stock's strong gain late in the period. Lastly, small positions in two foreign banks that sold off sharply due to sovereign debt concerns, National Bank of Greece and Allied Irish Bank, dampened results. Most of the stocks mentioned in this report were out-of-index positions, and a number of them were sold from the fund by period end.
The views expressed above reflect those of the portfolio manager(s) only through the end of the period as stated on the cover of this report and do not necessarily represent the views of Fidelity or any other person in the Fidelity organization. Any such views are subject to change at any time based upon market or other conditions and Fidelity disclaims any responsibility to update such views. These views may not be relied on as investment advice and, because investment decisions for a Fidelity fund are based on numerous factors, may not be relied on as an indication of trading intent on behalf of any Fidelity fund.
Annual Report
As a shareholder of the Fund, you incur two types of costs: (1) transaction costs, including redemption fees, and (2) ongoing costs, including management fees, distribution and/or service (12b-1) fees and other Fund expenses. This Example is intended to help you understand your ongoing costs (in dollars) of investing in the Fund and to compare these costs with the ongoing costs of investing in other mutual funds.
The Example is based on an investment of $1,000 invested at the beginning of the period and held for the entire period (July 1, 2010 to December 31, 2010).
Actual Expenses
The first line of the accompanying table for each class of the Fund provides information about actual account values and actual expenses. You may use the information in this line, together with the amount you invested, to estimate the expenses that you paid over the period. Simply divide your account value by $1,000.00 (for example, an $8,600 account value divided by $1,000.00 = 8.6), then multiply the result by the number in the first line for a class of the Fund under the heading entitled "Expenses Paid During Period" to estimate the expenses you paid on your account during this period. The estimate of expenses does not include any fees or other expenses of any variable annuity or variable life insurance product. If they were, the estimate of expenses you paid during the period would be higher, and your ending account value would be lower. In addition, the Fund, as a shareholder in the underlying Fidelity Central Funds, will indirectly bear its pro-rata share of the fees and expenses incurred by the underlying Fidelity Central Funds. These fees and expenses are not included in the Fund's annualized expense ratio used to calculate the expense estimate in the table below.
Hypothetical Example for Comparison Purposes
The second line of the accompanying table for each class of the Fund provides information about hypothetical account values and hypothetical expenses based on a Class' actual expense ratio and an assumed rate of return of 5% per year before expenses, which is not the Class' actual return. The hypothetical account values and expenses may not be used to estimate the actual ending account balance or expenses you paid for the period. You may use this information to compare the ongoing costs of investing in the Fund and other funds. To do so, compare this 5% hypothetical example with the 5% hypothetical examples that appear in the shareholder reports of the other funds. The estimate of expenses does not include any fees or other expenses of any variable annuity or variable life insurance product. If they were, the estimate of expenses you paid during the period would be higher, and your ending account value would be lower. In addition, the Fund, as a shareholder in the underlying Fidelity Central Funds, will indirectly bear its pro-rata share of the fees and expenses incurred by the underlying Fidelity Central Funds. These fees and expenses are not included in the Fund's annualized expense ratio used to calculate the expense estimate in the table below.
Please note that the expenses shown in the table are meant to highlight your ongoing costs only and do not reflect any transaction costs. Therefore, the second line of the table is useful in comparing ongoing costs only, and will not help you determine the relative total costs of owning different funds. In addition, if these transactional costs were included, your costs would have been higher.
| Annualized
Expense Ratio | Beginning
Account Value
July 1, 2010 | Ending
Account Value
December 31, 2010 | Expenses Paid
During Period*
July 1, 2010 to
December 31, 2010 |
Initial Class | 1.10% | | | |
Actual | | $ 1,000.00 | $ 1,311.50 | $ 6.41 |
HypotheticalA | | $ 1,000.00 | $ 1,019.66 | $ 5.60 |
Service Class | 1.20% | | | |
Actual | | $ 1,000.00 | $ 1,311.00 | $ 6.99 |
HypotheticalA | | $ 1,000.00 | $ 1,019.16 | $ 6.11 |
Service Class 2 | 1.35% | | | |
Actual | | $ 1,000.00 | $ 1,309.90 | $ 7.86 |
HypotheticalA | | $ 1,000.00 | $ 1,018.40 | $ 6.87 |
Initial Class R | 1.10% | | | |
Actual | | $ 1,000.00 | $ 1,311.50 | $ 6.41 |
HypotheticalA | | $ 1,000.00 | $ 1,019.66 | $ 5.60 |
Service Class R | 1.20% | | | |
Actual | | $ 1,000.00 | $ 1,311.00 | $ 6.99 |
HypotheticalA | | $ 1,000.00 | $ 1,019.16 | $ 6.11 |
Service Class 2R | 1.35% | | | |
Actual | | $ 1,000.00 | $ 1,310.70 | $ 7.86 |
HypotheticalA | | $ 1,000.00 | $ 1,018.40 | $ 6.87 |
Investor Class R | 1.18% | | | |
Actual | | $ 1,000.00 | $ 1,311.90 | $ 6.88 |
HypotheticalA | | $ 1,000.00 | $ 1,019.26 | $ 6.01 |
A 5% return per year before expenses
* Expenses are equal to each Class' annualized expense ratio, multiplied by the average account value over the period, multiplied by 184/365 (to reflect the one-half year period).
Annual Report
Investment Changes (Unaudited)
Geographic Diversification (% of fund's net assets) |
As of December 31, 2010 |
| United Kingdom | 12.1% | |
| Japan | 9.3% | |
| United States of America | 7.1% | |
| India | 6.9% | |
| Cayman Islands | 6.7% | |
| Brazil | 5.6% | |
| France | 5.1% | |
| Russia | 4.9% | |
| Switzerland | 4.3% | |
| Other | 38.0% | |

Percentages are adjusted for the effect of futures contracts, if applicable. |
As of June 30, 2010 |
| Japan | 13.0% | |
| United States of America | 12.6% | |
| United Kingdom | 11.8% | |
| France | 8.3% | |
| Canada | 6.1% | |
| Netherlands | 4.8% | |
| Germany | 4.7% | |
| Spain | 4.4% | |
| Brazil | 3.7% | |
| Other | 30.6% | |

Percentages are adjusted for the effect of futures contracts, if applicable. |
Asset Allocation as of December 31, 2010 |
| % of fund's
net assets | % of fund's net assets
6 months ago |
Stocks | 98.5 | 98.7 |
Bonds | 0.0 | 0.5 |
Short-Term Investments and Net Other Assets | 1.5 | 0.8 |
Top Ten Stocks as of December 31, 2010 |
| % of fund's
net assets | % of fund's net assets
6 months ago |
Royal Dutch Shell PLC Class B (United Kingdom, Oil, Gas & Consumable Fuels) | 1.7 | 0.0 |
Nestle SA (Switzerland, Food Products) | 1.7 | 0.0 |
HSBC Holdings PLC sponsored ADR (United Kingdom, Commercial Banks) | 1.6 | 0.0 |
BP PLC (United Kingdom, Oil, Gas & Consumable Fuels) | 1.3 | 0.0 |
Aurcana Corp. unit (Canada, Metals & Mining) | 1.2 | 0.0 |
Banco Santander SA sponsored ADR (Spain, Commercial Banks) | 1.0 | 1.7 |
Unilever NV unit (Netherlands, Food Products) | 1.0 | 1.2 |
Telefonica SA sponsored ADR (Spain, Diversified Telecommunication Services) | 1.0 | 1.2 |
British American Tobacco PLC (United Kingdom) (United Kingdom, Tobacco) | 0.9 | 1.0 |
Mitsubishi UFJ Financial Group, Inc. sponsored ADR (Japan, Commercial Banks) | 0.9 | 0.0 |
| 12.3 | |
Market Sectors as of December 31, 2010 |
| % of fund's
net assets | % of fund's net assets
6 months ago |
Consumer Discretionary | 25.0 | 10.8 |
Financials | 21.0 | 26.8 |
Consumer Staples | 13.9 | 8.9 |
Materials | 10.9 | 12.4 |
Energy | 9.0 | 6.0 |
Industrials | 8.5 | 9.5 |
Information Technology | 7.6 | 11.5 |
Telecommunication Services | 1.6 | 5.1 |
Utilities | 0.5 | 3.6 |
Health Care | 0.5 | 4.6 |
Annual Report
Investments December 31, 2010
Showing Percentage of Net Assets
Common Stocks - 97.2% |
| Shares | | Value |
Bahamas (Nassau) - 0.2% |
Petrominerales Ltd. | 3,444 | | $ 114,512 |
Belgium - 1.2% |
Anheuser-Busch InBev SA NV | 5,560 | | 318,163 |
KBC Groupe SA (a) | 6,815 | | 232,347 |
TOTAL BELGIUM | | 550,510 |
Bermuda - 2.0% |
China Yurun Food Group Ltd. | 64,000 | | 210,383 |
Credicorp Ltd. (NY Shares) | 1,998 | | 237,582 |
Huabao International Holdings Ltd. | 145,000 | | 234,686 |
Petra Diamonds Ltd. (a) | 107,082 | | 227,207 |
TOTAL BERMUDA | | 909,858 |
Brazil - 5.6% |
Anhanguera Educacional Participacoes SA | 10,047 | | 242,162 |
Banco do Brasil SA | 14,100 | | 266,953 |
BR Malls Participacoes SA | 23,500 | | 242,144 |
Cia Hering SA | 15,000 | | 244,042 |
Companhia de Bebidas das Americas (AmBev) (PN) sponsored ADR | 9,580 | | 297,267 |
Iguatemi Empresa de Shopping
Centers SA | 9,300 | | 232,563 |
Itau Unibanco Banco Multiplo SA ADR (e) | 15,000 | | 360,150 |
Marisa Lojas SA | 15,300 | | 231,959 |
Mills Estruturas e Servicos de Engenharia SA (a) | 18,200 | | 225,917 |
Natura Cosmeticos SA | 8,000 | | 229,894 |
TOTAL BRAZIL | | 2,573,051 |
British Virgin Islands - 1.1% |
ReneSola Ltd. sponsored ADR (a)(d) | 24,700 | | 215,878 |
Sable Mining Africa Ltd. (a) | 715,000 | | 290,032 |
TOTAL BRITISH VIRGIN ISLANDS | | 505,910 |
Canada - 3.8% |
Aurcana Corp. unit (a) | 557,900 | | 538,251 |
Goldcorp, Inc. | 6,500 | | 299,027 |
Petrobank Energy & Resources Ltd. (a) | 5,600 | | 141,783 |
Suncor Energy, Inc. | 10,200 | | 391,513 |
Teck Resources Ltd. Class B (sub. vtg.) | 5,700 | | 353,157 |
TOTAL CANADA | | 1,723,731 |
Cayman Islands - 6.7% |
Ajisen (China) Holdings Ltd. | 153,000 | | 257,083 |
Belle International Holdings Ltd. | 136,000 | | 229,918 |
Bosideng International Holdings Ltd. | 520,000 | | 207,398 |
China ZhengTong Auto Services Holdings Ltd. | 242,000 | | 228,223 |
Ctrip.com International Ltd. sponsored ADR (a) | 5,755 | | 232,790 |
E-Commerce China Dangdang, Inc. ADR | 4,400 | | 119,108 |
Hengan International Group Co. Ltd. | 26,500 | | 228,604 |
|
| Shares | | Value |
Hengdeli Holdings Ltd. | 392,000 | | $ 233,510 |
Maoye International Holdings Ltd. | 498,000 | | 224,893 |
Peak Sport Products Co. Ltd. | 330,000 | | 216,533 |
Shenguan Holdings Group Ltd. | 172,000 | | 225,276 |
Silver Base Group Holdings Ltd. | 271,000 | | 240,928 |
Trina Solar Ltd. ADR (a)(d) | 8,900 | | 208,438 |
Vinda International Holdings Ltd. | 201,000 | | 222,141 |
TOTAL CAYMAN ISLANDS | | 3,074,843 |
China - 1.8% |
Baidu.com, Inc. sponsored ADR (a) | 2,100 | | 202,713 |
Golden Eagle Retail Group Ltd. (H Shares) | 93,000 | | 229,254 |
Lentuo International, Inc. ADR | 22,600 | | 158,200 |
Shandong Weigao Group Medical Polymer Co. Ltd. (H Shares) | 84,000 | | 238,302 |
TOTAL CHINA | | 828,469 |
Colombia - 0.5% |
BanColombia SA sponsored ADR | 3,900 | | 241,449 |
Cyprus - 0.5% |
AFI Development PLC: | | | |
(B Shares) (a) | 151,700 | | 160,802 |
GDR (Reg. S) | 47,000 | | 50,055 |
TOTAL CYPRUS | | 210,857 |
Denmark - 1.0% |
Carlsberg AS Series B | 2,400 | | 240,413 |
Pandora A/S | 3,500 | | 210,927 |
TOTAL DENMARK | | 451,340 |
Finland - 0.7% |
Nokia Corp. sponsored ADR | 33,300 | | 343,656 |
France - 5.1% |
Atos Origin SA (a) | 4,506 | | 240,017 |
BNP Paribas SA | 6,069 | | 386,320 |
Casino Guichard Perrachon et Compagnie | 2,485 | | 242,372 |
Christian Dior SA | 1,700 | | 242,973 |
LVMH Moet Hennessy - Louis Vuitton | 2,059 | | 338,880 |
PPR SA | 1,500 | | 238,655 |
Schneider Electric SA | 2,176 | | 325,843 |
Societe Generale Series A | 6,024 | | 323,935 |
TOTAL FRANCE | | 2,338,995 |
Germany - 2.1% |
Bayerische Motoren Werke AG (BMW) | 3,691 | | 290,417 |
Daimler AG (Germany) (a) | 5,858 | | 397,325 |
HeidelbergCement AG | 4,119 | | 258,283 |
TOTAL GERMANY | | 946,025 |
Hong Kong - 0.5% |
Emperor Watch & Jewellery Ltd. | 1,630,000 | | 234,879 |
Common Stocks - continued |
| Shares | | Value |
India - 6.9% |
Adani Enterprises Ltd. | 15,636 | | $ 227,271 |
Asian Paints India Ltd. | 3,426 | | 220,574 |
Bank of Baroda | 10,821 | | 224,608 |
Crompton Greaves Ltd. | 31,139 | | 215,858 |
Gitanjali Gems Ltd. | 50,017 | | 235,193 |
Housing Development Finance Corp. Ltd. | 16,464 | | 268,192 |
INFO Edge India Ltd. | 1,844 | | 27,254 |
Infrastructure Development Finance Co. Ltd. | 63,280 | | 258,427 |
ITC Ltd. | 61,575 | | 240,516 |
Jain Irrigation Systems Ltd. | 47,966 | | 225,495 |
Rural Electrification Corp. Ltd. | 34,763 | | 232,544 |
Sun TV Ltd. | 19,689 | | 231,578 |
Titan Industries Ltd. | 2,937 | | 236,139 |
United Spirits Ltd. | 7,512 | | 245,920 |
Voltas Ltd. | 8,855 | | 43,114 |
TOTAL INDIA | | 3,132,683 |
Indonesia - 2.6% |
PT Bank Rakyat Indonesia Tbk | 209,000 | | 243,563 |
PT Global Mediacom Tbk | 3,368,500 | | 243,011 |
PT Indofood Sukses Makmur Tbk | 458,500 | | 248,079 |
PT Mayora Indah Tbk | 171,500 | | 204,620 |
PT Mitra Adiperkasa Tbk | 865,500 | | 256,961 |
TOTAL INDONESIA | | 1,196,234 |
Italy - 0.6% |
Saipem SpA | 5,485 | | 270,164 |
Japan - 9.3% |
Canon, Inc. sponsored ADR (d) | 7,300 | | 374,782 |
eAccess Ltd. (d) | 358 | | 216,435 |
Fanuc Ltd. | 2,000 | | 307,086 |
Honda Motor Co. Ltd. sponsored ADR (d) | 9,900 | | 391,050 |
Itochu Corp. | 28,500 | | 288,457 |
Komatsu Ltd. | 10,100 | | 305,556 |
Marubeni Corp. | 40,000 | | 281,229 |
Mitsubishi Corp. | 12,300 | | 332,887 |
Mitsubishi UFJ Financial Group, Inc. sponsored ADR | 77,000 | | 416,570 |
Mitsui & Co. Ltd. | 18,600 | | 307,118 |
ORIX Corp. | 2,740 | | 269,564 |
Rakuten, Inc. | 283 | | 236,951 |
SOFTBANK CORP. | 8,300 | | 287,278 |
Uni-Charm Corp. | 5,600 | | 222,717 |
TOTAL JAPAN | | 4,237,680 |
Korea (South) - 1.1% |
Hyundai Motor Co. | 1,800 | | 278,529 |
Lock & Lock Co. Ltd. | 6,420 | | 206,986 |
TOTAL KOREA (SOUTH) | | 485,515 |
|
| Shares | | Value |
Malaysia - 1.1% |
Genting Bhd | 70,000 | | $ 253,803 |
Parkson Holdings Bhd | 131,200 | | 229,339 |
TOTAL MALAYSIA | | 483,142 |
Mexico - 1.2% |
Grupo Mexico SA de CV Series B | 72,200 | | 295,989 |
Grupo Televisa SA de CV (CPO) sponsored ADR | 9,700 | | 251,521 |
TOTAL MEXICO | | 547,510 |
Netherlands - 2.9% |
ING Groep NV sponsored ADR (a) | 34,314 | | 335,934 |
Koninklijke Philips Electronics NV | 9,627 | | 295,291 |
Unilever NV unit | 14,800 | | 464,720 |
X5 Retail Group NV GDR (Reg. S) (a) | 5,100 | | 235,875 |
TOTAL NETHERLANDS | | 1,331,820 |
Nigeria - 0.5% |
Guaranty Trust Bank PLC GDR (Reg. S) | 37,066 | | 218,689 |
Norway - 0.5% |
Aker Solutions ASA | 14,300 | | 243,615 |
Qatar - 0.5% |
Commercial Bank of Qatar GDR (Reg. S) | 46,168 | | 233,313 |
Russia - 4.9% |
LSR Group OJSC GDR (Reg. S) (a) | 24,200 | | 222,882 |
Magnit OJSC GDR (Reg. S) | 8,300 | | 243,190 |
Mechel Steel Group OAO sponsored ADR (a) | 30,800 | | 294,448 |
OAO Gazprom sponsored ADR | 15,700 | | 399,408 |
OAO NOVATEK GDR | 2,100 | | 250,950 |
Sberbank (Savings Bank of the Russian Federation) (a) | 95,100 | | 324,578 |
TNK-BP Holding (a) | 93,200 | | 248,598 |
Uralkali JSC GDR (Reg. S) | 7,100 | | 260,712 |
TOTAL RUSSIA | | 2,244,766 |
South Africa - 3.3% |
AngloGold Ashanti Ltd. sponsored ADR | 5,800 | | 285,534 |
Blue Label Telecoms Ltd. | 227,800 | | 242,070 |
Clicks Group Ltd. | 33,376 | | 218,342 |
Mr Price Group Ltd. | 23,618 | | 237,071 |
Naspers Ltd. Class N | 5,100 | | 298,648 |
Shoprite Holdings Ltd. | 15,500 | | 233,143 |
TOTAL SOUTH AFRICA | | 1,514,808 |
Spain - 3.1% |
Banco Santander SA sponsored ADR | 44,129 | | 469,974 |
Inditex SA | 3,500 | | 262,192 |
Obrascon Huarte Lain SA | 7,437 | | 225,464 |
Telefonica SA sponsored ADR | 6,780 | | 463,888 |
TOTAL SPAIN | | 1,421,518 |
Common Stocks - continued |
| Shares | | Value |
Sweden - 1.2% |
EnergyO Solutions AB (a) | 31,710 | | $ 239,505 |
H&M Hennes & Mauritz AB (B Shares) | 9,425 | | 314,204 |
TOTAL SWEDEN | | 553,709 |
Switzerland - 4.3% |
Compagnie Financiere Richemont SA Series A | 5,425 | | 319,357 |
Credit Suisse Group sponsored ADR | 9,000 | | 363,690 |
Dufry AG (a) | 1,610 | | 216,780 |
Nestle SA | 13,161 | | 771,235 |
The Swatch Group AG (Bearer) | 640 | | 285,510 |
TOTAL SWITZERLAND | | 1,956,572 |
Taiwan - 2.2% |
E Ink Holdings, Inc. (a) | 117,000 | | 237,048 |
HTC Corp. | 9,650 | | 297,737 |
Ruentex Development Co. Ltd. | 125,000 | | 219,832 |
Synnex Technology International Corp. | 87,000 | | 234,724 |
TOTAL TAIWAN | | 989,341 |
Turkey - 0.5% |
Turkiye Garanti Bankasi AS | 47,000 | | 238,368 |
United Kingdom - 12.1% |
Anglo American PLC (United Kingdom) | 7,900 | | 411,107 |
Barclays PLC Sponsored ADR | 21,400 | | 353,528 |
BG Group PLC | 19,524 | | 394,766 |
BP PLC | 79,600 | | 587,125 |
British American Tobacco PLC (United Kingdom) | 11,000 | | 423,413 |
Burberry Group PLC | 14,700 | | 257,780 |
HSBC Holdings PLC sponsored ADR | 14,100 | | 719,664 |
Imperial Tobacco Group PLC | 10,166 | | 312,134 |
Lloyds Banking Group PLC (a) | 322,800 | | 333,453 |
Reckitt Benckiser Group PLC | 5,700 | | 313,473 |
Royal Dutch Shell PLC Class B | 23,845 | | 790,159 |
Vedanta Resources PLC | 6,400 | | 251,321 |
Xstrata PLC | 15,600 | | 366,414 |
TOTAL UNITED KINGDOM | | 5,514,337 |
United States of America - 5.6% |
Apple, Inc. (a) | 655 | | 211,277 |
Bank of America Corp. | 17,780 | | 237,185 |
Citigroup, Inc. (a) | 47,036 | | 222,480 |
First Cash Financial Services, Inc. (a) | 7,302 | | 226,289 |
Google, Inc. Class A (a) | 400 | | 237,588 |
JPMorgan Chase & Co. | 5,611 | | 238,019 |
|
| Shares | | Value |
MasterCard, Inc. Class A | 1,000 | | $ 224,110 |
Tiffany & Co., Inc. | 3,544 | | 220,685 |
Visa, Inc. Class A | 3,400 | | 239,292 |
Walter Energy, Inc. | 2,000 | | 255,680 |
Wells Fargo & Co. | 7,708 | | 238,871 |
TOTAL UNITED STATES OF AMERICA | | 2,551,476 |
TOTAL COMMON STOCKS (Cost $38,331,434) | 44,413,345 |
Nonconvertible Preferred Stocks - 1.3% |
| | | |
Germany - 0.7% |
Volkswagen AG | 1,900 | | 308,392 |
Italy - 0.6% |
Fiat SpA (Risparmio Shares) | 19,227 | | 285,085 |
TOTAL NONCONVERTIBLE PREFERRED STOCKS (Cost $296,651) | 593,477 |
Money Market Funds - 1.9% |
| | | |
Fidelity Securities Lending Cash Central Fund, 0.21% (b)(c)
(Cost $887,910) | 887,910 | | 887,910 |
TOTAL INVESTMENT PORTFOLIO - 100.4% (Cost $39,515,995) | | 45,894,732 |
NET OTHER ASSETS (LIABILITIES) - (0.4)% | | (184,824) |
NET ASSETS - 100% | $ 45,709,908 |
Legend |
(a) Non-income producing |
(b) Affiliated fund that is available only to investment companies and other accounts managed by Fidelity Investments. The rate quoted is the annualized seven-day yield of the fund at period end. A complete unaudited listing of the fund's holdings as of its most recent quarter end is available upon request. In addition, each Fidelity Central Fund's financial statements, which are not covered by the Fund's Report of Independent Registered Public Accounting Firm, are available on the SEC's website or upon request. |
(c) Investment made with cash collateral received from securities on loan. |
(d) Security or a portion of the security is on loan at period end. |
(e) Security exempt from registration under Rule 144A of the Securities Act of 1933. These securities may be resold in transactions exempt from registration, normally to qualified institutional buyers. At the end of the period, the value of these securities amounted to $360,150 or 0.8% of net assets. |
Affiliated Central Funds |
Information regarding fiscal year to date income earned by the Fund from investments in Fidelity Central Funds is as follows: |
Fund | Income earned |
Fidelity Cash Central Fund | $ 574 |
Fidelity Securities Lending Cash Central Fund | 29,563 |
Total | $ 30,137 |
Other Information |
The following is a summary of the inputs used, as of December 31, 2010, involving the Fund's assets and liabilities carried at fair value. The inputs or methodology used for valuing securities may not be an indication of the risk associated with investing in those securities. For more information on valuation inputs, and their aggregation into the levels used in the tables below, please refer to the Security Valuation section in the accompanying Notes to Financial Statements. |
Valuation Inputs at Reporting Date: |
Description | Total | Level 1 | Level 2 | Level 3 |
Investments in Securities: | | | | |
Equities: | | | | |
United Kingdom | $ 5,514,337 | $ 3,380,187 | $ 2,134,150 | $ - |
Japan | 4,237,680 | 4,237,680 | - | - |
India | 3,132,683 | 2,908,075 | 224,608 | - |
Cayman Islands | 3,074,843 | 3,074,843 | - | - |
Brazil | 2,573,051 | 2,573,051 | - | - |
United States of America | 2,551,476 | 2,551,476 | - | - |
France | 2,338,995 | 2,338,995 | - | - |
Russia | 2,244,766 | 2,244,766 | - | - |
Switzerland | 1,956,572 | 1,956,572 | - | - |
Other | 17,382,419 | 16,548,877 | 833,542 | - |
Money Market Funds | 887,910 | 887,910 | - | - |
Total Investments in Securities: | $ 45,894,732 | $ 42,702,432 | $ 3,192,300 | $ - |
The following is a reconciliation of Investments in Securities for which Level 3 inputs were used in determining value: |
Investments in Securities: | |
Beginning Balance | $ 249,900 |
Total Realized Gain (Loss) | (22,982) |
Total Unrealized Gain (Loss) | (3,667) |
Cost of Purchases | 257,403 |
Proceeds of Sales | (480,654) |
Amortization/Accretion | - |
Transfers in to Level 3 | - |
Transfers out of Level 3 | - |
Ending Balance | $ - |
The change in unrealized gain (loss) for the period attributable to Level 3 securities held at December 31, 2010 | $ - |
The information used in the above reconciliation represents fiscal year to date activity for any Investments in Securities identified as using Level 3 inputs at either the beginning or the end of the current fiscal period. Transfers in or out of Level 3 represent the beginning value of any Security or Instrument where a change in the pricing level occurred from the beginning to the end of the period. The cost of purchases and the proceeds of sales may include securities received or delivered through corporate actions or exchanges. Realized and unrealized gains (losses) disclosed in the reconciliation are included in Net Gain (Loss) on the Fund's Statement of Operations. |
Income Tax Information |
At December 31, 2010, the Fund had a capital loss carryforward of approximately $22,327,177 of which $17,897,995 and $4,429,182 will expire in fiscal 2016 and 2017, respectively. Capital loss carryforwards are only available to offset future capital gains of the Fund to the extent provided by regulations and may be limited. |
See accompanying notes which are an integral part of the financial statements.
Annual Report
Statement of Assets and Liabilities
| December 31, 2010 |
Assets | | |
Investment in securities, at value (including securities loaned of $871,456) - See accompanying schedule: Unaffiliated issuers (cost $38,628,085) | $ 45,006,822 | |
Fidelity Central Funds (cost $887,910) | 887,910 | |
Total Investments (cost $39,515,995) | | $ 45,894,732 |
Foreign currency held at value (cost $93,088) | | 93,641 |
Receivable for investments sold | | 1,687,320 |
Receivable for fund shares sold | | 73,344 |
Dividends receivable | | 123,180 |
Distributions receivable from Fidelity Central Funds | | 522 |
Prepaid expenses | | 126 |
Receivable from investment adviser for expense reductions | | 11,209 |
Other receivables | | 71,495 |
Total assets | | 47,955,569 |
| | |
Liabilities | | |
Payable to custodian bank | $ 330,851 | |
Payable for investments purchased | 862,456 | |
Payable for fund shares redeemed | 26,690 | |
Accrued management fee | 27,245 | |
Distribution and service plan fees payable | 51 | |
Other affiliated payables | 6,576 | |
Other payables and accrued expenses | 103,882 | |
Collateral on securities loaned, at value | 887,910 | |
Total liabilities | | 2,245,661 |
| | |
Net Assets | | $ 45,709,908 |
Net Assets consist of: | | |
Paid in capital | | $ 62,428,728 |
Undistributed net investment income | | 6,999 |
Accumulated undistributed net realized gain (loss) on investments and foreign currency transactions | | (23,076,718) |
Net unrealized appreciation (depreciation) on investments and assets and liabilities in foreign currencies | | 6,350,899 |
Net Assets | | $ 45,709,908 |
Statement of Assets and Liabilities - continued
| December 31, 2010 |
Initial Class:
Net Asset Value, offering price and redemption price per share ($732,354 ÷ 75,221 shares) | | $ 9.74 |
| | |
Service Class:
Net Asset Value, offering price and redemption price per share ($99,693 ÷ 10,256 shares) | | $ 9.72 |
| | |
Service Class 2:
Net Asset Value, offering price and redemption price per share ($114,663 ÷ 11,801 shares) | | $ 9.72 |
| | |
Initial Class R:
Net Asset Value, offering price and redemption price per share ($15,305,412 ÷ 1,571,814 shares) | | $ 9.74 |
| | |
| | |
Service Class R:
Net Asset Value, offering price and redemption price per share ($99,693 ÷ 10,256 shares) | | $ 9.72 |
| | |
Service Class 2R:
Net Asset Value, offering price and redemption price per share ($108,865 ÷ 11,214 shares) | | $ 9.71 |
| | |
Investor Class R:
Net Asset Value, offering price and redemption price per share ($29,249,228 ÷ 3,019,698 shares) | | $ 9.69 |
See accompanying notes which are an integral part of the financial statements.
Annual Report
Statement of Operations
| Year ended December 31, 2010 |
Investment Income | | |
Dividends | | $ 986,457 |
Interest | | 6,476 |
Income from Fidelity Central Funds | | 30,137 |
Income before foreign taxes withheld | | 1,023,070 |
Less foreign taxes withheld | | (77,624) |
Total income | | 945,446 |
| | |
Expenses | | |
Management fee | $ 312,495 | |
Transfer agent fees | 62,307 | |
Distribution and service plan fees | 696 | |
Accounting and security lending fees | 23,398 | |
Custodian fees and expenses | 237,430 | |
Independent trustees' compensation | 249 | |
Audit | 66,687 | |
Legal | 200 | |
Miscellaneous | 500 | |
Total expenses before reductions | 703,962 | |
Expense reductions | (260,065) | 443,897 |
Net investment income (loss) | | 501,549 |
Realized and Unrealized Gain (Loss) Net realized gain (loss) on: | | |
Investment securities: | | |
Unaffiliated issuers (net of foreign taxes of $12,411) | 3,541,168 | |
Foreign currency transactions | (144,911) | |
Total net realized gain (loss) | | 3,396,257 |
Change in net unrealized appreciation (depreciation) on: Investment securities (net of increase in deferred foreign taxes of $15,500) | 2,009,244 | |
Assets and liabilities in foreign currencies | 2,500 | |
Total change in net unrealized appreciation (depreciation) | | 2,011,744 |
Net gain (loss) | | 5,408,001 |
Net increase (decrease) in net assets resulting from operations | | $ 5,909,550 |
Statement of Changes in Net Assets
| Year ended
December 31,
2010 | Year ended
December 31,
2009 |
Increase (Decrease) in Net Assets | | |
Operations | | |
Net investment income (loss) | $ 501,549 | $ 311,982 |
Net realized gain (loss) | 3,396,257 | 3,301,299 |
Change in net unrealized appreciation (depreciation) | 2,011,744 | 9,550,519 |
Net increase (decrease) in net assets resulting from operations | 5,909,550 | 13,163,800 |
Distributions to shareholders from net investment income | (494,828) | (317,347) |
Distributions to shareholders from net realized gain | (483,411) | (478,375) |
Total distributions | (978,239) | (795,722) |
Share transactions - net increase (decrease) | (5,534,279) | 10,098,658 |
Redemption fees | 10,678 | 6,920 |
Total increase (decrease) in net assets | (592,290) | 22,473,656 |
| | |
Net Assets | | |
Beginning of period | 46,302,198 | 23,828,542 |
End of period (including undistributed net investment income of $6,999 and undistributed net investment income of $277, respectively) | $ 45,709,908 | $ 46,302,198 |
See accompanying notes which are an integral part of the financial statements.
Annual Report
Financial Highlights - Initial Class
Years ended December 31, | 2010 | 2009 | 2008 | 2007 | 2006 |
Selected Per-Share Data | | | | | |
Net asset value, beginning of period | $ 8.60 | $ 5.61 | $ 11.44 | $ 12.68 | $ 11.46 |
Income from Investment Operations | | | | | |
Net investment income (loss) C | .10 | .07 | .15 | .11 F | .11 |
Net realized and unrealized gain (loss) | 1.24 | 3.07 | (5.92) | .53 | 1.54 |
Total from investment operations | 1.34 | 3.14 | (5.77) | .64 | 1.65 |
Distributions from net investment income | (.11) | (.06) | - | (.09) | (.10) |
Distributions from net realized gain | (.10) | (.09) | (.06) | (1.79) | (.34) |
Total distributions | (.20) I | (.15) | (.06) | (1.88) | (.43) J |
Redemption fees added to paid in capital C, H | - | - | - | - | - |
Net asset value, end of period | $ 9.74 | $ 8.60 | $ 5.61 | $ 11.44 | $ 12.68 |
Total Return A, B | 15.73% | 56.04% | (50.69)% | 5.17% | 14.49% |
Ratios to Average Net Assets D, G | | | | | |
Expenses before reductions | 1.60% | 1.81% | 1.54% | 1.20% | 1.80% |
Expenses net of fee waivers, if any | 1.10% | 1.10% | 1.10% | 1.10% | 1.10% |
Expenses net of all reductions | .96% | .93% | .91% | 1.07% | 1.00% |
Net investment income (loss) | 1.19% | 1.03% | 1.65% | .82% F | .95% |
Supplemental Data | | | | | |
Net assets, end of period (000 omitted) | $ 732 | $ 645 | $ 388 | $ 1,409 | $ 1,357 |
Portfolio turnover rate E | 463% | 416% | 350% | 224% | 185% |
A Total returns do not reflect charges attributable to your insurance company's separate account. Inclusion of these charges would reduce the total returns shown.
B Total returns would have been lower had certain expenses not been reduced during the periods shown.
C Calculated based on average shares outstanding during the period.
D Fees and expenses of the underlying Fidelity Central Funds are not included in the Fund's expense ratio. The Fund indirectly bears its proportionate share of the expenses of any underlying Fidelity Central Funds.
E Amount does not include the portfolio activity of any underlying Fidelity Central Funds.
F Investment income per share reflects a special dividend which amounted to $.02 per share. Excluding the special dividend, the ratio of net investment income (loss) to average net assets would have been .68%.
G Expense ratios reflect operating expenses of the class. Expenses before reductions do not reflect amounts reimbursed by the investment adviser or reductions from brokerage service arrangements or reductions from other expense offset arrangements and do not represent the amount paid by the class during periods when reimbursements or reductions occur. Expenses net of fee waivers reflect expenses after reimbursement by the investment adviser but prior to reductions from brokerage service arrangements or other expense offset arrangements. Expenses net of all reductions represent the net expenses paid by the class.
H Amount represents less than $.01 per share.
I Total distributions of $.20 per share is comprised of distributions from net investment income of $.105 and distributions from net realized gain of $.097 per share.
J Total distributions of $.43 per share is comprised of distributions from net investment income of $.095 and distributions from net realized gain of $.335 per share.
Financial Highlights - Service Class
Years ended December 31, | 2010 | 2009 | 2008 | 2007 | 2006 |
Selected Per-Share Data | | | | | |
Net asset value, beginning of period | $ 8.58 | $ 5.61 | $ 11.43 | $ 12.67 | $ 11.46 |
Income from Investment Operations | | | | | |
Net investment income (loss) C | .10 | .06 | .14 | .10 F | .10 |
Net realized and unrealized gain (loss) | 1.23 | 3.05 | (5.90) | .53 | 1.53 |
Total from investment operations | 1.33 | 3.11 | (5.76) | .63 | 1.63 |
Distributions from net investment income | (.10) | (.05) | - | (.08) | (.08) |
Distributions from net realized gain | (.10) | (.09) | (.06) | (1.79) | (.34) |
Total distributions | (.19) I | (.14) | (.06) | (1.87) | (.42) J |
Redemption fees added to paid in capital C, H | - | - | - | - | - |
Net asset value, end of period | $ 9.72 | $ 8.58 | $ 5.61 | $ 11.43 | $ 12.67 |
Total Return A, B | 15.65% | 55.52% | (50.64)% | 5.06% | 14.30% |
Ratios to Average Net Assets D, G | | | | | |
Expenses before reductions | 1.67% | 1.73% | 1.51% | 1.20% | 1.62% |
Expenses net of fee waivers, if any | 1.20% | 1.20% | 1.20% | 1.20% | 1.20% |
Expenses net of all reductions | 1.05% | 1.04% | 1.01% | 1.16% | 1.10% |
Net investment income (loss) | 1.09% | .92% | 1.55% | .72% F | .85% |
Supplemental Data | | | | | |
Net assets, end of period (000 omitted) | $ 100 | $ 117 | $ 135 | $ 414 | $ 394 |
Portfolio turnover rate E | 463% | 416% | 350% | 224% | 185% |
A Total returns do not reflect charges attributable to your insurance company's separate account. Inclusion of these charges would reduce the total returns shown.
B Total returns would have been lower had certain expenses not been reduced during the periods shown.
C Calculated based on average shares outstanding during the period.
D Fees and expenses of the underlying Fidelity Central Funds are not included in the Fund's expense ratio. The Fund indirectly bears its proportionate share of the expenses of any underlying Fidelity Central Funds.
E Amount does not include the portfolio activity of any underlying Fidelity Central Funds.
F Investment income per share reflects a special dividend which amounted to $.02 per share. Excluding the special dividend, the ratio of net investment income (loss) to average net assets would have been .58%.
G Expense ratios reflect operating expenses of the class. Expenses before reductions do not reflect amounts reimbursed by the investment adviser or reductions from brokerage service arrangements or reductions from other expense offset arrangements and do not represent the amount paid by the class during periods when reimbursements or reductions occur. Expenses net of fee waivers reflect expenses after reimbursement by the investment adviser but prior to reductions from brokerage service arrangements or other expense offset arrangements. Expenses net of all reductions represent the net expenses paid by the class.
H Amount represents less than $.01 per share.
I Total distributions of $.19 per share is comprised of distributions from net investment income of $.095 and distributions from net realized gain of $.097 per share.
J Total distributions of $.42 per share is comprised of distributions from net investment income of $.084 and distributions from net realized gain of $.335 per share.
See accompanying notes which are an integral part of the financial statements.
Annual Report
Financial Highlights - Service Class 2
Years ended December 31, | 2010 | 2009 | 2008 | 2007 | 2006 |
Selected Per-Share Data | | | | | |
Net asset value, beginning of period | $ 8.57 | $ 5.60 | $ 11.43 | $ 12.67 | $ 11.46 |
Income from Investment Operations | | | | | |
Net investment income (loss) C | .08 | .05 | .12 | .08 F | .08 |
Net realized and unrealized gain (loss) | 1.24 | 3.05 | (5.89) | .53 | 1.53 |
Total from investment operations | 1.32 | 3.10 | (5.77) | .61 | 1.61 |
Distributions from net investment income | (.07) | (.04) | - | (.06) | (.07) |
Distributions from net realized gain | (.10) | (.09) | (.06) | (1.79) | (.34) |
Total distributions | (.17) | (.13) | (.06) | (1.85) | (.40) I |
Redemption fees added to paid in capital C, H | - | - | - | - | - |
Net asset value, end of period | $ 9.72 | $ 8.57 | $ 5.60 | $ 11.43 | $ 12.67 |
Total Return A, B | 15.53% | 55.44% | (50.73)% | 4.89% | 14.14% |
Ratios to Average Net Assets D, G | | | | | |
Expenses before reductions | 1.88% | 2.02% | 1.79% | 1.41% | 1.77% |
Expenses net of fee waivers, if any | 1.35% | 1.35% | 1.35% | 1.35% | 1.35% |
Expenses net of all reductions | 1.21% | 1.19% | 1.16% | 1.32% | 1.25% |
Net investment income (loss) | .94% | .77% | 1.40% | .57% F | .70% |
Supplemental Data | | | | | |
Net assets, end of period (000 omitted) | $ 115 | $ 424 | $ 302 | $ 550 | $ 524 |
Portfolio turnover rate E | 463% | 416% | 350% | 224% | 185% |
A Total returns do not reflect charges attributable to your insurance company's separate account. Inclusion of these charges would reduce the total returns shown.
B Total returns would have been lower had certain expenses not been reduced during the periods shown.
C Calculated based on average shares outstanding during the period.
D Fees and expenses of the underlying Fidelity Central Funds are not included in the Fund's expense ratio. The Fund indirectly bears its proportionate share of the expenses of any underlying Fidelity Central Funds.
E Amount does not include the portfolio activity of any underlying Fidelity Central Funds.
F Investment income per share reflects a special dividend which amounted to $.02 per share. Excluding the special dividend, the ratio of net investment income (loss) to average net assets would have been .43%.
G Expense ratios reflect operating expenses of the class. Expenses before reductions do not reflect amounts reimbursed by the investment adviser or reductions from brokerage service arrangements or reductions from other expense offset arrangements and do not represent the amount paid by the class during periods when reimbursements or reductions occur. Expenses net of fee waivers reflect expenses after reimbursement by the investment adviser but prior to reductions from brokerage service arrangements or other expense offset arrangements. Expenses net of all reductions represent the net expenses paid by the class.
H Amount represents less than $.01 per share.
I Total distributions of $.40 per share is comprised of distributions from net investment income of $.066 and distributions from net realized gain of $.335 per share.
Financial Highlights - Initial Class R
Years ended December 31, | 2010 | 2009 | 2008 | 2007 | 2006 |
Selected Per-Share Data | | | | | |
Net asset value, beginning of period | $ 8.60 | $ 5.62 | $ 11.44 | $ 12.68 | $ 11.46 |
Income from Investment Operations | | | | | |
Net investment income (loss) C | .10 | .07 | .15 | .11 F | .11 |
Net realized and unrealized gain (loss) | 1.24 | 3.06 | (5.91) | .53 | 1.54 |
Total from investment operations | 1.34 | 3.13 | (5.76) | .64 | 1.65 |
Distributions from net investment income | (.11) | (.06) | - | (.09) | (.10) |
Distributions from net realized gain | (.10) | (.09) | (.06) | (1.79) | (.34) |
Total distributions | (.20) I | (.15) | (.06) | (1.88) | (.43) J |
Redemption fees added to paid in capital C, H | - | - | - | - | - |
Net asset value, end of period | $ 9.74 | $ 8.60 | $ 5.62 | $ 11.44 | $ 12.68 |
Total Return A, B | 15.73% | 55.76% | (50.60)% | 5.17% | 14.50% |
Ratios to Average Net Assets D, G | | | | | |
Expenses before reductions | 1.55% | 1.60% | 1.44% | 1.11% | 1.46% |
Expenses net of fee waivers, if any | 1.10% | 1.10% | 1.10% | 1.10% | 1.10% |
Expenses net of all reductions | .95% | .93% | .91% | 1.06% | 1.00% |
Net investment income (loss) | 1.19% | 1.02% | 1.65% | .82% F | .95% |
Supplemental Data | | | | | |
Net assets, end of period (000 omitted) | $ 15,305 | $ 17,150 | $ 8,483 | $ 32,345 | $ 17,219 |
Portfolio turnover rate E | 463% | 416% | 350% | 224% | 185% |
A Total returns do not reflect charges attributable to your insurance company's separate account. Inclusion of these charges would reduce the total returns shown.
B Total returns would have been lower had certain expenses not been reduced during the periods shown.
C Calculated based on average shares outstanding during the period.
D Fees and expenses of the underlying Fidelity Central Funds are not included in the Fund's expense ratio. The Fund indirectly bears its proportionate share of the expenses of any underlying Fidelity Central Funds.
E Amount does not include the portfolio activity of any underlying Fidelity Central Funds.
F Investment income per share reflects a special dividend which amounted to $.02 per share. Excluding the special dividend, the ratio of net investment income (loss) to average net assets would have been .68%.
G Expense ratios reflect operating expenses of the class. Expenses before reductions do not reflect amounts reimbursed by the investment adviser or reductions from brokerage service arrangements or reductions from other expense offset arrangements and do not represent the amount paid by the class during periods when reimbursements or reductions occur. Expenses net of fee waivers reflect expenses after reimbursement by the investment adviser but prior to reductions from brokerage service arrangements or other expense offset arrangements. Expenses net of all reductions represent the net expenses paid by the class.
H Amount represents less than $.01 per share.
I Total distributions of $.20 per share is comprised of distributions from net investment income of $.105 and distributions from net realized gain of $.097 per share.
J Total distributions of $.43 per share is comprised of distributions from net investment income of $.096 and distributions from net realized gain of $.335 per share.
See accompanying notes which are an integral part of the financial statements.
Annual Report
Financial Highlights - Service Class R
Years ended December 31, | 2010 | 2009 | 2008 | 2007 | 2006 |
Selected Per-Share Data | | | | | |
Net asset value, beginning of period | $ 8.58 | $ 5.61 | $ 11.43 | $ 12.67 | $ 11.46 |
Income from Investment Operations | | | | | |
Net investment income (loss) C | .10 | .06 | .14 | .10 F | .10 |
Net realized and unrealized gain (loss) | 1.23 | 3.05 | (5.90) | .53 | 1.53 |
Total from investment operations | 1.33 | 3.11 | (5.76) | .63 | 1.63 |
Distributions from net investment income | (.10) | (.05) | - | (.08) | (.08) |
Distributions from net realized gain | (.10) | (.09) | (.06) | (1.79) | (.34) |
Total distributions | (.19) I | (.14) | (.06) | (1.87) | (.42) J |
Redemption fees added to paid in capital C, H | - | - | - | - | - |
Net asset value, end of period | $ 9.72 | $ 8.58 | $ 5.61 | $ 11.43 | $ 12.67 |
Total Return A, B | 15.65% | 55.52% | (50.64)% | 5.06% | 14.30% |
Ratios to Average Net Assets D, G | | | | | |
Expenses before reductions | 1.67% | 1.73% | 1.51% | 1.20% | 1.62% |
Expenses net of fee waivers, if any | 1.20% | 1.20% | 1.20% | 1.20% | 1.20% |
Expenses net of all reductions | 1.05% | 1.04% | 1.01% | 1.16% | 1.10% |
Net investment income (loss) | 1.09% | .92% | 1.55% | .72% F | .85% |
Supplemental Data | | | | | |
Net assets, end of period (000 omitted) | $ 100 | $ 117 | $ 135 | $ 414 | $ 394 |
Portfolio turnover rate E | 463% | 416% | 350% | 224% | 185% |
A Total returns do not reflect charges attributable to your insurance company's separate account. Inclusion of these charges would reduce the total returns shown.
B Total returns would have been lower had certain expenses not been reduced during the periods shown.
C Calculated based on average shares outstanding during the period.
D Fees and expenses of the underlying Fidelity Central Funds are not included in the Fund's expense ratio. The Fund indirectly bears its proportionate share of the expenses of any underlying Fidelity Central Funds.
E Amount does not include the portfolio activity of any underlying Fidelity Central Funds.
F Investment income per share reflects a special dividend which amounted to $.02 per share. Excluding the special dividend, the ratio of net investment income (loss) to average net assets would have been .58%.
G Expense ratios reflect operating expenses of the class. Expenses before reductions do not reflect amounts reimbursed by the investment adviser or reductions from brokerage service arrangements or reductions from other expense offset arrangements and do not represent the amount paid by the class during periods when reimbursements or reductions occur. Expenses net of fee waivers reflect expenses after reimbursement by the investment adviser but prior to reductions from brokerage service arrangements or other expense offset arrangements. Expenses net of all reductions represent the net expenses paid by the class.
H Amount represents less than $.01 per share.
I Total distributions of $.19 per share is comprised of distributions from net investment income of $.095 and distributions from net realized gain of $.097 per share.
J Total distributions of $.42 per share is comprised of distributions from net investment income of $.084 and distributions from net realized gain of $.335 per share.
Financial Highlights - Service Class 2R
Years ended December 31, | 2010 | 2009 | 2008 | 2007 | 2006 |
Selected Per-Share Data | | | | | |
Net asset value, beginning of period | $ 8.57 | $ 5.60 | $ 11.43 | $ 12.67 | $ 11.46 |
Income from Investment Operations | | | | | |
Net investment income (loss) C | .08 | .05 | .13 | .08 F | .08 |
Net realized and unrealized gain (loss) | 1.23 | 3.05 | (5.90) | .53 | 1.53 |
Total from investment operations | 1.31 | 3.10 | (5.77) | .61 | 1.61 |
Distributions from net investment income | (.08) | (.04) | - | (.06) | (.07) |
Distributions from net realized gain | (.10) | (.09) | (.06) | (1.79) | (.34) |
Total distributions | (.17) I | (.13) | (.06) | (1.85) | (.40) J |
Redemption fees added to paid in capital C, H | - | - | - | - | - |
Net asset value, end of period | $ 9.71 | $ 8.57 | $ 5.60 | $ 11.43 | $ 12.67 |
Total Return A, B | 15.45% | 55.36% | (50.73)% | 4.90% | 14.14% |
Ratios to Average Net Assets D, G | | | | | |
Expenses before reductions | 1.83% | 1.87% | 1.66% | 1.35% | 1.77% |
Expenses net of fee waivers, if any | 1.35% | 1.35% | 1.35% | 1.35% | 1.35% |
Expenses net of all reductions | 1.21% | 1.19% | 1.16% | 1.31% | 1.25% |
Net investment income (loss) | .94% | .77% | 1.40% | .57% F | .70% |
Supplemental Data | | | | | |
Net assets, end of period (000 omitted) | $ 109 | $ 155 | $ 179 | $ 550 | $ 524 |
Portfolio turnover rate E | 463% | 416% | 350% | 224% | 185% |
A Total returns do not reflect charges attributable to your insurance company's separate account. Inclusion of these charges would reduce the total returns shown.
B Total returns would have been lower had certain expenses not been reduced during the periods shown.
C Calculated based on average shares outstanding during the period.
D Fees and expenses of the underlying Fidelity Central Funds are not included in the Fund's expense ratio. The Fund indirectly bears its proportionate share of the expenses of any underlying Fidelity Central Funds.
E Amount does not include the portfolio activity of any underlying Fidelity Central Funds.
F Investment income per share reflects a special dividend which amounted to $.02 per share. Excluding the special dividend, the ratio of net investment income (loss) to average net assets would have been .43%.
G Expense ratios reflect operating expenses of the class. Expenses before reductions do not reflect amounts reimbursed by the investment adviser or reductions from brokerage service arrangements or reductions from other expense offset arrangements and do not represent the amount paid by the class during periods when reimbursements or reductions occur. Expenses net of fee waivers reflect expenses after reimbursement by the investment adviser but prior to reductions from brokerage service arrangements or other expense offset arrangements. Expenses net of all reductions represent the net expenses paid by the class.
H Amount represents less than $.01 per share.
I Total distributions of $.17 per share is comprised of distributions from net investment income of $.077 and distributions from net realized gain of $.097 per share.
J Total distributions of $.40 per share is comprised of distributions from net investment income of $.066 and distributions from net realized gain of $.335 per share.
See accompanying notes which are an integral part of the financial statements.
Annual Report
Financial Highlights - Investor Class R
Years ended December 31, | 2010 | 2009 | 2008 | 2007 | 2006 |
Selected Per-Share Data | | | | | |
Net asset value, beginning of period | $ 8.56 | $ 5.60 | $ 11.41 | $ 12.65 | $ 11.46 |
Income from Investment Operations | | | | | |
Net investment income (loss) C | .10 | .07 | .14 | .09 F | .09 |
Net realized and unrealized gain (loss) | 1.23 | 3.04 | (5.89) | .54 | 1.53 |
Total from investment operations | 1.33 | 3.11 | (5.75) | .63 | 1.62 |
Distributions from net investment income | (.11) | (.06) | - | (.08) | (.10) |
Distributions from net realized gain | (.10) | (.09) | (.06) | (1.79) | (.34) |
Total distributions | (.20) I | (.15) | (.06) | (1.87) | (.43) J |
Redemption fees added to paid in capital C, H | - | - | - | - | - |
Net asset value, end of period | $ 9.69 | $ 8.56 | $ 5.60 | $ 11.41 | $ 12.65 |
Total Return A, B | 15.69% | 55.61% | (50.65)% | 5.07% | 14.23% |
Ratios to Average Net Assets D, G | | | | | |
Expenses before reductions | 1.63% | 1.68% | 1.51% | 1.22% | 1.61% |
Expenses net of fee waivers, if any | 1.18% | 1.18% | 1.17% | 1.22% | 1.25% |
Expenses net of all reductions | 1.04% | 1.01% | .97% | 1.18% | 1.15% |
Net investment income (loss) | 1.11% | .94% | 1.59% | .71% F | .80% |
Supplemental Data | | | | | |
Net assets, end of period (000 omitted) | $ 29,249 | $ 27,695 | $ 14,208 | $ 38,719 | $ 24,505 |
Portfolio turnover rate E | 463% | 416% | 350% | 224% | 185% |
A Total returns do not reflect charges attributable to your insurance company's separate account. Inclusion of these charges would reduce the total returns shown.
B Total returns would have been lower had certain expenses not been reduced during the periods shown.
C Calculated based on average shares outstanding during the period.
D Fees and expenses of the underlying Fidelity Central Funds are not included in the Fund's expense ratio. The Fund indirectly bears its proportionate share of the expenses of any underlying Fidelity Central Funds.
E Amount does not include the portfolio activity of any underlying Fidelity Central Funds.
F Investment income per share reflects a special dividend which amounted to $.02 per share. Excluding the special dividend, the ratio of net investment income (loss) to average net assets would have been .57%.
G Expense ratios reflect operating expenses of the class. Expenses before reductions do not reflect amounts reimbursed by the investment adviser or reductions from brokerage service arrangements or reductions from other expense offset arrangements and do not represent the amount paid by the class during periods when reimbursements or reductions occur. Expenses net of fee waivers reflect expenses after reimbursement by the investment adviser but prior to reductions from brokerage service arrangements or other expense offset arrangements. Expenses net of all reductions represent the net expenses paid by the class.
H Amount represents less than $.01 per share.
I Total distributions of $.20 per share is comprised of distributions from net investment income of $.105 and distributions from net realized gain of $.097 per share.
J Total distributions of $.43 per share is comprised of distributions from net investment income of $.095 and distributions from net realized gain of $.335 per share.
See accompanying notes which are an integral part of the financial statements.
Annual Report
Notes to Financial Statements
For the period ended December 31, 2010
1. Organization.
VIP International Capital Appreciation Portfolio (the Fund) is a fund of Variable Insurance Products Fund IV (the Trust) and is authorized to issue an unlimited number of shares. The Trust is registered under the Investment Company Act of 1940, as amended (the 1940 Act), as an open-end management investment company organized as a Massachusetts business trust. Shares of the Fund may only be purchased by insurance companies for the purpose of funding variable annuity or variable life insurance contracts. The Fund offers the following classes of shares: Initial Class shares, Service Class shares, Service Class 2 shares, Initial Class R shares, Service Class R shares, Service Class 2R shares and Investor Class R shares. All classes have equal rights and voting privileges, except for matters affecting a single class. Investment income, realized and unrealized capital gains and losses, the common expenses of the Fund, and certain fund-level expense reductions, if any, are allocated on a pro-rata basis to each class based on the relative net assets of each class to the total net assets of the Fund. Each class differs with respect to transfer agent and distribution and service plan fees incurred. Certain expense reductions may also differ by class. The Fund's investments in emerging markets can be subject to social, economic, regulatory, and political uncertainties and can be extremely volatile.
2. Investments in Fidelity Central Funds.
The Fund may invest in Fidelity Central Funds, which are open-end investment companies available only to other investment companies and accounts managed by Fidelity Management & Research Company (FMR) and its affiliates. The Fund's Schedule of Investments lists each of the Fidelity Central Funds held as of period end, if any, as an investment of the Fund, but does not include the underlying holdings of each Fidelity Central Fund. As an Investing Fund, the Fund indirectly bears its proportionate share of the expenses of the underlying Fidelity Central Funds.
The Money Market Central Funds seek preservation of capital and current income and are managed by Fidelity Investments Money Management, Inc. (FIMM), an affiliate of FMR.
A complete unaudited list of holdings for each Fidelity Central Fund is available upon request or at the Securities and Exchange Commission (the SEC) web site at www.sec.gov. In addition, the financial statements of the Fidelity Central Funds, which are not covered by the Fund's Report of Independent Registered Public Accounting Firm, are available on the SEC web site or upon request.
3. Significant Accounting Policies.
The financial statements have been prepared in conformity with accounting principles generally accepted in the United States of America (GAAP), which require management to make certain estimates and assumptions at the date of the financial statements. Actual results could differ from those estimates. Subsequent events, if any, through the date that the financial statements were issued have been evaluated in the preparation of the financial statements. The following summarizes the significant accounting policies of the Fund:
Security Valuation. Investments are valued as of 4:00 p.m. Eastern time on the last calendar day of the period. The Fund uses independent pricing services approved by the Board of Trustees to value its investments. When current market prices or quotations are not readily available or reliable, valuations may be determined in good faith in accordance with procedures adopted by the Board of Trustees. Factors used in determining value may include market or security specific events. The frequency with which these procedures are used cannot be predicted and they may be utilized to a significant extent. The value used for net asset value (NAV) calculation under these procedures may differ from published prices for the same securities.
The Fund categorizes the inputs to valuation techniques used to value its investments into a disclosure hierarchy consisting of three levels as shown below.
Level 1 - quoted prices in active markets for identical investments
Level 2 - other significant observable inputs (including quoted prices for similar investments, interest rates, prepayment speeds, etc.)
Level 3 - unobservable inputs (including the Fund's own assumptions based on the best information available)
Changes in valuation techniques may result in transfers in or out of an assigned level within the disclosure hierarchy. The aggregate value of investments by input level, as of December 31, 2010, as well as a roll forward of Level 3 securities, is included at the end of the Fund's Schedule of Investments. Valuation techniques used to value the Fund's investments by major category are as follows.
Equity securities, including restricted securities, for which market quotations are readily available, are valued at the last reported sale price or official closing price as reported by an independent pricing service on the primary market or exchange on which they are traded and are categorized as Level 1 in the hierarchy. In the event there were no sales during the day or closing prices are not available, securities are valued at the last quoted bid price or may be valued using the last available price and are generally categorized as Level 2 in the hierarchy. For foreign equity securities, when significant market or security specific events arise, comparisons to the valuation of American Depositary Receipts (ADRs), futures contracts, Exchange-traded funds (ETFs) and certain indexes as well as quoted prices for similar securities are used and are categorized as Level 2 in the hierarchy in these
Annual Report
Notes to Financial Statements - continued
3. Significant Accounting Policies - continued
Security Valuation - continued
circumstances. Utilizing these techniques may result in transfers between Level 1 and Level 2. For restricted equity securities and private placements where observable inputs are limited, assumptions about market activity and risk are used and are categorized as Level 3 in the hierarchy.
Investments in open-end mutual funds,including the Fidelity Central Funds, are valued at their closing net asset value each business day and are categorized as Level 1 in the hierarchy.
Foreign Currency. The Fund uses foreign currency contracts to facilitate transactions in foreign-denominated securities. Gains and losses from these transactions may arise from changes in the value of the foreign currency or if the counterparties do not perform under the contracts' terms.
Foreign-denominated assets, including investment securities, and liabilities are translated into U.S. dollars at the exchange rate at period end. Purchases and sales of investment securities, income and dividends received and expenses denominated in foreign currencies are translated into U.S. dollars at the exchange rate in effect on the transaction date.
The effects of exchange rate fluctuations on investments are included with the net realized and unrealized gain (loss) on investment securities. Other foreign currency transactions resulting in realized and unrealized gain (loss) are disclosed separately.
Investment Transactions and Income. For financial reporting purposes, the Fund's investment holdings and NAV include trades executed through the end of the last business day of the period. The NAV per share for processing shareholder transactions is calculated as of the close of business of the New York Stock Exchange (NYSE), normally 4:00 p.m. Eastern time and includes trades executed through the end of the prior business day. Gains and losses on securities sold are determined on the basis of identified cost. Dividend income is recorded on the ex-dividend date, except for certain dividends from foreign securities where the ex-dividend date may have passed, which are recorded as soon as the Fund is informed of the ex-dividend date. Non-cash dividends included in dividend income, if any, are recorded at the fair market value of the securities received. Distributions received on securities that represent a return of capital or capital gain are recorded as a reduction of cost of investments and/or as a realized gain. The Fund estimates the components of distributions received that may be considered return of capital distributions or capital gain distributions. Interest income and distributions from the Fidelity Central Funds are accrued as earned. Interest income includes coupon interest and amortization of premium and accretion of discount on debt securities. Investment income is recorded net of foreign taxes withheld where recovery of such taxes is uncertain.
Expenses. Expenses directly attributable to a fund are charged to that fund. Expenses attributable to more than one fund are allocated among the respective funds on the basis of relative net assets or other appropriate methods. Expense estimates are accrued in the period to which they relate and adjustments are made when actual amounts are known.
Income Tax Information and Distributions to Shareholders. Each year the Fund intends to qualify as a regulated investment company, including distributing substantially all of its taxable income and realized gains under Subchapter M of the Internal Revenue Code and filing its U.S. federal tax return. As a result, no provision for income taxes is required. As of December 31, 2010, the Fund did not have any unrecognized tax benefits in the accompanying financial statements. A fund's federal tax return is subject to examination by the Internal Revenue Service (IRS) for a period of three years. Foreign taxes are provided for based on the Fund's understanding of the tax rules and rates that exist in the foreign markets in which it invests. The Fund is subject to a tax imposed on realized short term capital gains on securities of certain issuers domiciled in India. An estimated deferred tax liability for net unrealized gains on these securities is included in Other payables and accrued expenses on the Statement of Assets & Liabilities.
Distributions are declared and recorded on the ex-dividend date. Income dividends and capital gain distributions are declared separately for each class. Income and capital gain distributions are determined in accordance with income tax regulations, which may differ from GAAP.
Capital accounts within the financial statements are adjusted for permanent book-tax differences. These adjustments have no impact on net assets or the results of operations. Temporary book-tax differences will reverse in a subsequent period.
Book-tax differences are primarily due to foreign currency transactions, certain foreign taxes, passive foreign investment companies (PFIC), market discount, capital loss carryforwards, losses deferred due to wash sales and excise tax regulations.
The federal tax cost of investment securities and unrealized appreciation (depreciation) as of period end were as follows:
Gross unrealized appreciation | $ 6,604,821 |
Gross unrealized depreciation | (1,008,387) |
Net unrealized appreciation (depreciation) | $ 5,596,434 |
Tax Cost | $ 40,298,298 |
Annual Report
3. Significant Accounting Policies - continued
Income Tax Information and Distributions to Shareholders - continued
The tax-based components of distributable earnings as of period end were as follows:
Undistributed ordinary income | $ 39,761 |
Capital loss carryforward | $ (22,327,177) |
Net unrealized appreciation (depreciation) | $ 5,596,534 |
The tax character of distributions paid was as follows:
| December 31, 2010 | December 31, 2009 |
Ordinary Income | $ 978,239 | $ 795,722 |
Trading (Redemption) Fees. Initial Class R shares, Service Class R shares, Service Class 2R shares and Investor Class R shares held by investors less than 60 days are subject to a redemption fee equal to 1% of the net asset value of shares redeemed. All redemption fees, which reduce the proceeds of the shareholder redemption, are retained by the Fund and accounted for as an addition to paid in capital.
4. Operating Policies.
Restricted Securities. The Fund may invest in securities that are subject to legal or contractual restrictions on resale. These securities generally may be resold in transactions exempt from registration or to the public if the securities are registered. Disposal of these securities may involve time-consuming negotiations and expense, and prompt sale at an acceptable price may be difficult. Information regarding restricted securities is included at the end of the Fund's Schedule of Investments.
5. Purchases and Sales of Investments.
Purchases and sales of securities, other than short-term securities, aggregated $200,490,099 and $207,300,608, respectively.
6. Fees and Other Transactions with Affiliates.
Management Fee. FMR and its affiliates provide the Fund with investment management related services for which the Fund pays a monthly management fee. The management fee is the sum of an individual fund fee rate that is based on an annual rate of .45% of the Fund's average net assets and a group fee rate that averaged .26% during the period. The group fee rate is based upon the average net assets of all the mutual funds advised by FMR. The group fee rate decreases as assets under management increase and increases as assets under management decrease. For the period, the total annual management fee rate was .71% of the Fund's average net assets.
Distribution and Service Plan Fees. In accordance with Rule 12b-1 of the 1940 Act, the Fund has adopted separate 12b-1 Plans for each Service Class of shares. Each Service Class pays Fidelity Distributors Corporation (FDC), an affiliate of FMR, a service fee. For the period, the service fee is based on an annual rate of .10% of Service Class' and Service Class R's average net assets and .25% of Service Class 2's and Service Class 2R's average net assets.
For the period, total fees, all of which were re-allowed to insurance companies for the distribution of shares and providing shareholder support services were as follows:
Service Class | $ 100 |
Service Class 2 | 180 |
Service Class R | 100 |
Service Class 2R | 316 |
| $ 696 |
Annual Report
Notes to Financial Statements - continued
6. Fees and Other Transactions with Affiliates - continued
Transfer Agent Fees. Fidelity Investments Institutional Operations Company, Inc. (FIIOC), an affiliate of FMR, is the Fund's transfer, dividend disbursing, and shareholder servicing agent. FIIOC receives an asset-based fee with respect to each class. Each class (with the exception of Investor Class) pays a transfer agent fee, excluding out of pocket expenses, equal to an annual rate of .07% of average net assets. Investor Class pays a monthly asset-based transfer agent fee of .15% of average net assets. In addition, FIIOC receives an asset-based fee of .01% of average net assets for typesetting, printing and mailing of shareholder reports, except proxy statements. FIIOC has agreed to voluntarily waive this fee until December 31, 2010. (See Note 9: Expense Reductions.) For the period, transfer agent fees for each class, including printing and out of pocket expenses, were as follows:
Initial Class | $ 903 |
Service Class | 115 |
Service Class 2 | 74 |
Initial Class R | 14,740 |
Service Class R | 115 |
Service Class 2R | 145 |
Investor Class R | 46,215 |
| $ 62,307 |
Accounting and Security Lending Fees. Fidelity Service Company, Inc. (FSC), an affiliate of FMR, maintains the Fund's accounting records. The accounting fee is based on the level of average net assets for the month. Under a separate contract, FSC administers the security lending program. The security lending fee is based on the number and duration of lending transactions.
Brokerage Commissions. The Fund placed a portion of its portfolio transactions with brokerage firms which are affiliates of the investment advisor. The commissions paid to these affiliated firms were $2,142 for the period.
7. Committed Line of Credit.
The Fund participates with other funds managed by FMR or an affiliate in a $3.75 billion credit facility (the "line of credit") to be utilized for temporary or emergency purposes to fund shareholder redemptions or for other short-term liquidity purposes. The Fund has agreed to pay commitment fees on its pro-rata portion of the line of credit, which amounted to $174 and is reflected in Miscellaneous expenses on the Statement of Operations. During the period, there were no borrowings on this line of credit.
8. Security Lending.
The Fund lends portfolio securities through a lending agent from time to time in order to earn additional income. The lending agent may loan securities to certain qualified borrowers, including Fidelity Capital Markets (FCM), a broker-dealer affiliated with the Fund. On the settlement date of the loan, the Fund receives collateral (in the form of U.S. Treasury obligations, letters of credit and/or cash) against the loaned securities and maintains collateral in an amount not less than 100% of the market value of the loaned securities during the period of the loan. The market value of the loaned securities is determined at the close of business of the Fund and any additional required collateral is delivered to the Fund on the next business day. If the borrower defaults on its obligation to return the securities loaned because of insolvency or other reasons, a fund could experience delays and costs in recovering the securities loaned or in gaining access to the collateral. Any cash collateral received is invested in the Fidelity Securities Lending Cash Central Fund. The value of the loaned securities and cash collateral at period end are disclosed on the Fund's Statement of Assets and Liabilities. Security lending income represents the income earned on investing cash collateral, less rebates paid to borrowers and lending agent fees associated with the loan, plus any premium payments received for lending certain types of securities. Security lending income is presented in the Statement of Operations as a component of income from Fidelity Central Funds. Total security lending income during the period amounted to $29,563. During the period, there were no securities loaned to FCM.
Annual Report
9. Expense Reductions.
In addition to FIIOC waiving a portion of its transfer agent fees, FMR voluntarily agreed to reimburse each class to the extent annual operating expenses exceeded certain levels of average net assets as noted in the table below. Some expenses, for example interest expense, including commitment fees, are excluded from this reimbursement.
The following classes were in reimbursement during the period:
| Expense
Limitations | Reimbursement/Waiver |
Initial Class | 1.10% | $ 3,019 |
Service Class | 1.20% | 474 |
Service Class 2 | 1.35% | 368 |
Initial Class R | 1.10% | 70,962 |
Service Class R | 1.20% | 474 |
Service Class 2R | 1.35% | 610 |
Investor Class R | 1.18% | 120,972 |
| | $ 196,879 |
Many of the brokers with whom FMR places trades on behalf of the Fund provided services to the Fund in addition to trade execution. These services included payments of certain expenses on behalf of the Fund totaling $63,186 for the period.
10. Distributions to Shareholders.
Distributions to shareholders of each class were as follows:
Years ended December 31, | 2010 | 2009 |
From net investment income | | |
Initial Class | $ 7,768 | $ 4,242 |
Service Class | 961 | 684 |
Service Class 2 | 434 | 1,982 |
Initial Class R | 168,615 | 119,072 |
Service Class R | 961 | 684 |
Service Class 2R | 883 | 659 |
Investor Class R | 315,206 | 190,024 |
Total | $ 494,828 | $ 317,347 |
From net realized gain | | |
Initial Class | $ 7,019 | $ 6,363 |
Service Class | 1,064 | 1,207 |
Service Class 2 | 542 | 4,350 |
Initial Class R | 168,298 | 178,610 |
Service Class R | 1,064 | 1,207 |
Service Class 2R | 1,291 | 1,602 |
Investor Class R | 304,133 | 285,036 |
Total | $ 483,411 | $ 478,375 |
11. Share Transactions.
Transactions for each class of shares were as follows:
| Shares | Dollars |
Years ended December 31, | 2010 | 2009 | 2010 | 2009 |
Initial Class | | | | |
Shares sold | 25,624 | 23,291 | $ 225,829 | $ 165,986 |
Reinvestment of distributions | 1,589 | 1,265 | 14,787 | 10,605 |
Shares redeemed | (26,957) | (18,636) | (240,709) | (107,450) |
Net increase (decrease) | 256 | 5,920 | $ (93) | $ 69,141 |
Service Class | | | | |
Reinvestment of distributions | 220 | 226 | 2,025 | 1,891 |
Shares redeemed | (3,601) | (10,639) | (31,344) | (71,691) |
Net increase (decrease) | (3,381) | (10,413) | $ (29,319) | $ (69,800) |
Annual Report
Notes to Financial Statements - continued
11. Share Transactions - continued
| Shares | Dollars |
Years ended December 31, | 2010 | 2009 | 2010 | 2009 |
Service Class 2 | | | | |
Shares sold | 6,746 | 19,605 | $ 65,263 | $ 124,280 |
Reinvestment of distributions | 105 | 758 | 976 | 6,332 |
Shares redeemed | (44,506) | (24,845) | (374,788) | (158,018) |
Net increase (decrease) | (37,655) | (4,482) | $ (308,549) | $ (27,406) |
Initial Class R | | | | |
Shares sold | 440,907 | 897,081 | $ 3,898,339 | $ 6,785,884 |
Reinvestment of distributions | 36,492 | 35,523 | 336,913 | 297,682 |
Shares redeemed | (900,018) | (448,753) | (7,801,721) | (2,964,977) |
Net increase (decrease) | (422,619) | 483,851 | $ (3,566,469) | $ 4,118,589 |
Service Class R | | | | |
Reinvestment of distributions | 220 | 226 | 2,025 | 1,891 |
Shares redeemed | (3,601) | (10,639) | (31,344) | (71,691) |
Net increase (decrease) | (3,381) | (10,413) | $ (29,319) | $ (69,800) |
Service Class 2R | | | | |
Reinvestment of distributions | 239 | 271 | 2,174 | 2,261 |
Shares redeemed | (7,096) | (14,127) | (61,060) | (94,930) |
Net increase (decrease) | (6,857) | (13,856) | $ (58,886) | $ (92,669) |
Investor Class R | | | | |
Shares sold | 675,944 | 1,164,413 | $ 6,013,493 | $ 9,035,456 |
Reinvestment of distributions | 67,265 | 56,962 | 619,339 | 475,060 |
Shares redeemed | (958,233) | (525,663) | (8,174,476) | (3,339,913) |
Net increase (decrease) | (215,024) | 695,712 | $ (1,541,644) | $ 6,170,603 |
12. Other.
The Fund's organizational documents provide former and current trustees and officers with a limited indemnification against liabilities arising in connection with the performance of their duties to the Fund. In the normal course of business, the Fund may also enter into contracts that provide general indemnifications. The Fund's maximum exposure under these arrangements is unknown as this would be dependent on future claims that may be made against the Fund. The risk of material loss from such claims is considered remote.
At the end of the period, FMR or its affiliates were the owners of record of 98% of the total outstanding shares of the Fund.
Annual Report
Report of Independent Registered Public Accounting Firm
To the Trustees of Variable Insurance Products Fund IV and the Shareholders of VIP International Capital Appreciation Portfolio:
In our opinion, the accompanying statement of assets and liabilities, including the schedule of investments, and the related statements of operations and of changes in net assets and the financial highlights present fairly, in all material respects, the financial position of VIP International Capital Appreciation Portfolio (a fund of Variable Insurance Products Fund IV) at December 31, 2010, the results of its operations for the year then ended, the changes in its net assets for each of the two years in the period then ended and the financial highlights for each of the five years in the period then ended, in conformity with accounting principles generally accepted in the United States of America. These financial statements and financial highlights (hereafter referred to as "financial statements") are the responsibility of the VIP International Capital Appreciation Portfolio's management. Our responsibility is to express an opinion on these financial statements based on our audits. We conducted our audits of these financial statements in accordance with the standards of the Public Company Accounting Oversight Board (United States). Those standards require that we plan and perform the audit to obtain reasonable assurance about whether the financial statements are free of material misstatement. An audit includes examining, on a test basis, evidence supporting the amounts and disclosures in the financial statements, assessing the accounting principles used and significant estimates made by management, and evaluating the overall financial statement presentation. We believe that our audits, which included confirmation of securities at December 31, 2010 by correspondence with the custodian and brokers, provide a reasonable basis for our opinion.
/s/ PricewaterhouseCoopers LLP
PricewaterhouseCoopers LLP
Boston, Massachusetts
February 17, 2011
Annual Report
The Trustees, Members of the Advisory Board, and executive officers of the trust and fund, as applicable, are listed below. The Board of Trustees governs the fund and is responsible for protecting the interests of shareholders. The Trustees are experienced executives who meet periodically throughout the year to oversee the fund's activities, review contractual arrangements with companies that provide services to the fund, oversee management of the risks associated with such activities and contractual arrangements, and review the fund's performance. Except for James C. Curvey, each of the Trustees oversees 219 funds advised by FMR or an affiliate. Mr. Curvey oversees 408 funds advised by FMR or an affiliate.
The Trustees hold office without limit in time except that (a) any Trustee may resign; (b) any Trustee may be removed by written instrument, signed by at least two-thirds of the number of Trustees prior to such removal; (c) any Trustee who requests to be retired or who has become incapacitated by illness or injury may be retired by written instrument signed by a majority of the other Trustees; and (d) any Trustee may be removed at any special meeting of shareholders by a two-thirds vote of the outstanding voting securities of the trust. Each Trustee who is not an interested person (as defined in the 1940 Act) (Independent Trustee), shall retire not later than the last day of the calendar year in which his or her 72nd birthday occurs. The Independent Trustees may waive this mandatory retirement age policy with respect to individual Trustees. The executive officers and Advisory Board Members hold office without limit in time, except that any officer and Advisory Board Member may resign or may be removed by a vote of a majority of the Trustees at any regular meeting or any special meeting of the Trustees. Except as indicated, each individual has held the office shown or other offices in the same company for the past five years.
Experience, Skills, Attributes, and Qualifications of the Fund's Trustees. The Governance and Nominating Committee has adopted a statement of policy that describes the experience, qualifications, attributes, and skills that are necessary and desirable for potential Independent Trustee candidates (Statement of Policy). The Board believes that each Trustee satisfied at the time he or she was initially elected or appointed a Trustee, and continues to satisfy, the standards contemplated by the Statement of Policy. The Governance and Nominating Committee also engages professional search firms to help identify potential Independent Trustee candidates who have the experience, qualifications, attributes, and skills consistent with the Statement of Policy. From time to time, additional criteria based on the composition and skills of the current Independent Trustees, as well as experience or skills that may be appropriate in light of future changes to board composition, business conditions, and regulatory or other developments, have also been considered by the professional search firms and the Governance and Nominating Committee. In addition, the Board takes into account the Trustees' commitment and participation in Board and committee meetings, as well as their leadership of standing and ad hoc committees throughout their tenure.
In determining that a particular Trustee was and continues to be qualified to serve as a Trustee, the Board has considered a variety of criteria, none of which, in isolation, was controlling. The Board believes that, collectively, the Trustees have balanced and diverse experience, qualifications, attributes, and skills, which allow the Board to operate effectively in governing the fund and protecting the interests of shareholders. Information about the specific experience, skills, attributes, and qualifications of each Trustee, which in each case led to the Board's conclusion that the Trustee should serve (or continue to serve) as a trustee of the fund, is provided below.
Board Structure and Oversight Function. James C. Curvey is an interested person (as defined in the 1940 Act) and currently serves as Acting Chairman. The Trustees have determined that an interested Chairman is appropriate and benefits shareholders because an interested Chairman has a personal and professional stake in the quality and continuity of services provided to the fund. Independent Trustees exercise their informed business judgment to appoint an individual of their choosing to serve as Chairman, regardless of whether the Trustee happens to be independent or a member of management. The Independent Trustees have determined that they can act independently and effectively without having an Independent Trustee serve as Chairman and that a key structural component for assuring that they are in a position to do so is for the Independent Trustees to constitute a substantial majority for the Board. The Independent Trustees also regularly meet in executive session. Ned C. Lautenbach serves as Chairman of the Independent Trustees and as such (i) acts as a liaison between the Independent Trustees and management with respect to matters important to the Independent Trustees and (ii) with management prepares agendas for Board meetings.
Fidelity funds are overseen by different Boards of Trustees. The fund's Board oversees Fidelity's equity and high income funds and another Board oversees Fidelity's investment-grade bond, money market, and asset allocation funds. The asset allocation funds may invest in Fidelity funds overseen by the fund's Board. The use of separate Boards, each with its own committee structure, allows the Trustees of each group of Fidelity funds to focus on the unique issues of the funds they oversee, including common research, investment, and operational issues. On occasion, the separate Boards establish joint committees to address issues of overlapping consequences for the Fidelity funds overseen by each Board.
The Trustees operate using a system of committees to facilitate the timely and efficient consideration of all matters of importance to the Trustees, the fund, and fund shareholders and to facilitate compliance with legal and regulatory requirements and oversight of the fund's activities and associated risks. The Board, acting through its committees, has charged FMR and its affiliates with (i) identifying events or circumstances the occurrence of which could have demonstrably adverse effects on the fund's business and/or reputation; (ii) implementing processes and controls to lessen the possibility that such events or circumstances occur or to mitigate the effects of such events or circumstances if they do occur; and (iii) creating and maintaining a system designed to evaluate continuously business and market conditions in order to facilitate the identification and implementation processes described in (i) and (ii) above. Because the day-to-day operations and activities of the fund are carried out by or through FMR, its affiliates and other service providers, the fund's exposure to risks is mitigated but not eliminated by the processes overseen by the Trustees. While each of the Board's committees has responsibility for overseeing different aspects of the fund's activities, oversight is exercised primarily through the Operations, Audit, and Compliance Committees. Appropriate personnel, including but not limited to the fund's Chief Compliance Officer (CCO), FMR's internal auditor, the independent accountants, the fund's Treasurer and portfolio management personnel, make periodic reports to the Board's committees, as appropriate. The responsibilities of each committee, including their oversight responsibilities, are described further under "Standing Committees of the Fund's Trustees."
Annual Report
Trustees and Officers - continued
The fund's Statement of Additional Information (SAI) includes more information about the Trustees. To request a free copy, call Fidelity at 1-877-208-0098.
Interested Trustees*:
Correspondence intended for each Trustee who is an interested person may be sent to Fidelity Investments, 82 Devonshire Street, Boston, Massachusetts 02109.
Name, Age; Principal Occupations and Other Relevant Experience+ |
James C. Curvey (75) |
| Year of Election or Appointment: 2007 Mr. Curvey is Trustee and Acting Chairman of the Board of Trustees of certain Trusts. Mr. Curvey also serves as Trustee (2007-present) of other investment companies advised by FMR. Mr. Curvey is a Director of Fidelity Investments Money Management, Inc. (2009-present), Director of Fidelity Research & Analysis Co. (2009-present) and Director of FMR and FMR Co., Inc. (2007-present). Mr. Curvey is also Vice Chairman (2007-present) and Director of FMR LLC. In addition, Mr. Curvey serves as an Overseer for the Boston Symphony Orchestra and a member of the Trustees of Villanova University. Previously, Mr. Curvey was the Vice Chairman (2006-2007) and Director (2000-2007) of FMR Corp. |
Ronald P. O'Hanley (54) |
| Year of Election or Appointment: 2011 Mr. O'Hanley is President of Fidelity Asset Management and Corporate Services and a member of Fidelity's Executive Committee (2010-present). Previously, Mr. O'Hanley served as President and Chief Executive Officer of BNY Mellon Asset Management (2007-2010). Mr. O'Hanley also served as Vice Chairman of Bank New York Mellon Corp. and a member of that firm's Executive Committee. Prior to the 2007 merger of The Bank of New York and Mellon Financial Corporation, he was Vice Chairman of Mellon Financial Corporation and President and Chief Executive Officer of Mellon Asset Management. He joined Mellon in February 1997. Mr. O'Hanley currently serves as Chairman of the Boston Public Library Foundation Board of Directors and sits on the Board of Directors of Beth Israel Deaconess Medical Center, the Board of Trustees of the Marine Biological Laboratory and the Advisory Board of the Maxwell School of Citizenship and Public Administration at Syracuse University. Mr. O'Hanley also chairs the Council on Asset Management for the Financial Services Roundtable and is a member of the Board of Directors of Institutional Investor's U.S. Institute. |
* Trustees have been determined to be "Interested Trustees" by virtue of, among other things, their affiliation with the trust or various entities under common control with FMR.
+ The information above includes each Trustee's principal occupation during the last five years and other information relating to the experience, attributes, and skills relevant to each Trustee's qualifications to serve as a Trustee, which led to the conclusion that each Trustee should serve as a Trustee for the fund.
Independent Trustees:
Correspondence intended for each Independent Trustee (that is, the Trustees other than the Interested Trustees) may be sent to Fidelity Investments, P.O. Box 55235, Boston, Massachusetts 02205-5235.
Name, Age; Principal Occupations and Other Relevant Experience+ |
Dennis J. Dirks (62) |
| Year of Election or Appointment: 2005 Prior to his retirement in May 2003, Mr. Dirks was Chief Operating Officer and a member of the Board of The Depository Trust & Clearing Corporation (DTCC). He also served as President, Chief Operating Officer, and Board member of The Depository Trust Company (DTC) and President and Board member of the National Securities Clearing Corporation (NSCC). In addition, Mr. Dirks served as Chief Executive Officer and Board member of the Government Securities Clearing Corporation, Chief Executive Officer and Board member of the Mortgage-Backed Securities Clearing Corporation, as a Trustee and a member of the Finance Committee of Manhattan College (2005-2008), and as a Trustee and a member of the Finance Committee of AHRC of Nassau County (2006-2008). Mr. Dirks is a member of the Independent Directors Council (IDC) Governing Council (2010-Present) and Board of Directors for The Brookville Center for Children's Services, Inc. (2009-present). |
Alan J. Lacy (57) |
| Year of Election or Appointment: 2008 Mr. Lacy serves as Senior Adviser (2007-present) of Oak Hill Capital Partners, L.P. (private equity). Mr. Lacy also served as Chief Executive Officer (2000-2005) and Vice Chairman (2005-2006) of Sears Holdings Corporation and Sears, Roebuck and Co. (retail). In addition, Mr. Lacy serves as a member of the Board of Directors of The Western Union Company (global money transfer, 2006-present) and Bristol-Myers Squibb Company (global pharmaceuticals, 2007-present). Mr. Lacy is Chairman (2008-present) and a member (2006-present) of the Board of Trustees of The National Parks Conservation Association. |
Ned C. Lautenbach (66) |
| Year of Election or Appointment: 2000 Mr. Lautenbach is Chairman of the Independent Trustees of the Equity and High Income Funds (2006-present). Mr. Lautenbach currently serves as the Lead Director of the Eaton Corporation Board of Directors (diversified industrial, 1997-present). Mr. Lautenbach is also a member of the Board of Directors of the Philharmonic Center for the Arts in Naples, Florida (1999-present); a member of the Board of Trustees of Fairfield University (2005-present); and a member of the Council on Foreign Relations (1994-present). Previously, Mr. Lautenbach was a Partner/Advisory Partner at Clayton, Dubilier & Rice, Inc. (private equity investment, 1998-2010), as well as a Director of Sony Corporation (2006-2007). |
Joseph Mauriello (66) |
| Year of Election or Appointment: 2008 Prior to his retirement in January 2006, Mr. Mauriello served in numerous senior management positions including Deputy Chairman and Chief Operating Officer (2004-2005), and Vice Chairman of Financial Services (2002-2004) of KPMG LLP US (professional services, 1965-2005). Mr. Mauriello currently serves as a member of the Board of Directors of XL Group plc. (global insurance and re-insurance, 2006-present) and of Arcadia Resources Inc. (health care services and products, 2007-present). Previously, Mr. Mauriello served as a Director of the Hamilton Funds of the Bank of New York (2006-2007). |
Cornelia M. Small (66) |
| Year of Election or Appointment: 2005 Ms. Small is a member of the Board of Directors of the Teagle Foundation (2009-present). Ms. Small is also a member of the Investment Committee, and Chair (2008-present) and a member of the Board of Trustees of Smith College. In addition, Ms. Small serves on the Investment Committee of the Berkshire Taconic Community Foundation (2008-present). Previously, Ms. Small served as Chairperson of the Investment Committee (2002-2008) of Smith College. In addition, Ms. Small served as Chief Investment Officer, Director of Global Equity Investments, and a member of the Board of Directors of Scudder, Stevens & Clark and Scudder Kemper Investments. |
William S. Stavropoulos (71) |
| Year of Election or Appointment: 2001 Mr. Stavropoulos is Vice Chairman of the Independent Trustees of the Equity and High Income Funds (2006-present). Mr. Stavropoulos serves as President and Founder of the Michigan Baseball Foundation, the Great Lakes Loons (2007-present). Mr. Stavropoulos is Chairman Emeritus of the Board of Directors of The Dow Chemical Company, where he previously served in numerous senior management positions, including President, CEO (1995-2000; 2002-2004), Chairman of the Executive Committee (2000-2006), and as a member of the Board of Directors (1990-2006). Currently, Mr. Stavropoulos is Chairman of Univar (global distributor of commodity and specialty chemicals, 2010-present), a Director of Teradata Corporation (data warehousing and technology solutions, 2008-present), Chemical Financial Corporation, Maersk Inc. (industrial conglomerate), Tyco International, Inc. (multinational manufacturing and services, 2007-present), and a member of the Advisory Board for Metalmark Capital (private equity investment, 2005-present). Mr. Stavropoulos is a special advisor to Clayton, Dubilier & Rice, LLC (private equity investment). In addition, Mr. Stavropoulos is a member of the University of Notre Dame Advisory Council for the College of Science. |
David M. Thomas (61) |
| Year of Election or Appointment: 2008 Previously, Mr. Thomas served as Executive Chairman (2005-2006) and Chairman and Chief Executive Officer (2000-2005) of IMS Health, Inc. (pharmaceutical and healthcare information solutions). In addition, Mr. Thomas serves as a member of the Board of Directors of Fortune Brands, Inc. (consumer products), and Interpublic Group of Companies, Inc. (marketing communication, 2004-present). |
Michael E. Wiley (60) |
| Year of Election or Appointment: 2008 Mr. Wiley also serves as a Director of Asia Pacific Exploration Consolidated (international oil and gas exploration and production, 2008-present). Mr. Wiley serves as a Director of Tesoro Corporation (independent oil refiner and marketer, 2005-present), and a Director of Bill Barrett Corporation (exploration and production, 2005-present). In addition, Mr. Wiley also serves as a Director of Post Oak Bank (privately-held bank, 2004-present). Previously, Mr. Wiley served as a member of the Board of Trustees of the University of Tulsa (2000-2006; 2007-2010), as a Senior Energy Advisor of Katzenbach Partners, LLC (consulting, 2006-2007), as an Advisory Director of Riverstone Holdings (private investment), Chairman, President, and CEO of Baker Hughes, Inc. (oilfield services, 2000-2004), and as Director of Spinnaker Exploration Company (exploration and production, 2001-2005). |
+ The information above includes each Trustee's principal occupation during the last five years and other information relating to the experience, attributes, and skills relevant to each Trustee's qualifications to serve as a Trustee, which led to the conclusion that each Trustee should serve as a Trustee for the fund.
Advisory Board Members and Executive Officers:
Correspondence intended for each executive officer, Edward C. Johnson, and Peter S. Lynch may be sent to Fidelity Investments, 82 Devonshire Street, Boston, Massachusetts 02109.
Name, Age; Principal Occupation |
Edward C. Johnson 3d (80) |
| Year of Election or Appointment: 2011 Member of the Advisory Board of Fidelity's Equity and High Income Funds. Formerly Trustee and Chairman of the Board of Trustees of certain Trusts, Mr. Johnson serves as Chief Executive Officer, Chairman, and a Director of FMR LLC; Chairman and a Director of FMR; and Chairman and a Director of FMR Co., Inc. In addition, Mr. Johnson serves as Chairman and Director of FIL Limited. Previously, Mr. Johnson served as President of FMR LLC (2006-2007). |
Peter S. Lynch (66) |
| Year of Election or Appointment: 2003 Member of the Advisory Board of Fidelity's Equity and High Income Funds. Mr. Lynch is Vice Chairman and a Director of FMR and FMR Co., Inc. In addition, Mr. Lynch serves as a Trustee of Boston College and as the Chairman of the Inner-City Scholarship Fund. Previously, Mr. Lynch served on the Special Olympics International Board of Directors (1997-2006). |
Kenneth B. Robins (41) |
| Year of Election or Appointment: 2008 President and Treasurer of Fidelity's Equity and High Income Funds. Mr. Robins also serves as President and Treasurer (2010-present) and Assistant Treasurer (2009-present) of other Fidelity funds and is an employee of Fidelity Investments (2004-present). Previously, Mr. Robins served as Deputy Treasurer of the Fidelity funds (2005-2008) and Treasurer and Chief Financial Officer of The North Carolina Capital Management Trust: Cash and Term Portfolios (2006-2008). |
Bruce T. Herring (45) |
| Year of Election or Appointment: 2006 Vice President of certain Equity Funds. Mr. Herring also serves as Chief Investment Officer and Director of Fidelity Management & Research (U.K.) Inc. (2010-present) and Group Chief Investments Officer of FMR. Previously, Mr. Herring served as Vice President (2005-2006) and Senior Vice President (2006-2007) of Fidelity Management & Research Company, Vice President of FMR Co., Inc. (2001-2007) and as a portfolio manager for Fidelity U.S. Equity Funds. |
Brian B. Hogan (46) |
| Year of Election or Appointment: 2009 Vice President of certain Equity Funds and Vice President of Sector Funds. Mr. Hogan also serves as President of FMR's Equity Division (2009-present). Previously, Mr. Hogan served as Senior Vice President, Equity Research of FMR (2006-2009) and as a portfolio manager. |
Scott C. Goebel (42) |
| Year of Election or Appointment: 2008 Secretary and Chief Legal Officer (CLO) of the Fidelity funds. Mr. Goebel also serves as Secretary and CLO of The North Carolina Capital Management Trust: Cash and Term Portfolio (2008-present); General Counsel, Secretary, and Senior Vice President of FMR (2008-present) and FMR Co., Inc. (2008-present); Deputy General Counsel of FMR LLC; Chief Legal Officer of Fidelity Management & Research (Hong Kong) Limited (2008-present) and Assistant Secretary of Fidelity Management & Research (Japan) Inc. (2008-present), Fidelity Investments Money Management, Inc. (2008-present), Fidelity Management & Research (U.K.) Inc. (2008-present), and Fidelity Research and Analysis Company (2008-present). Previously, Mr. Goebel served as Assistant Secretary of the Funds (2007-2008) and as Vice President and Secretary of Fidelity Distributors Corporation (FDC) (2005-2007). |
William C. Coffey (41) |
| Year of Election or Appointment: 2009 Assistant Secretary of Fidelity's Equity and High Income Funds. Mr. Coffey also serves as Senior Vice President and Deputy General Counsel of FMR LLC (2010-present), and is an employee of Fidelity Investments. Previously, Mr. Coffey served as Vice President and Associate General Counsel of FMR LLC (2005-2009). |
Holly C. Laurent (56) |
| Year of Election or Appointment: 2008 Anti-Money Laundering (AML) Officer of the Fidelity funds. Ms. Laurent also serves as AML Officer of The North Carolina Capital Management Trust: Cash and Term Portfolio (2008-present) and is an employee of Fidelity Investments. Previously, Ms. Laurent was Senior Vice President and Head of Legal for Fidelity Business Services India Pvt. Ltd. (2006-2008), and Senior Vice President, Deputy General Counsel and Group Head for FMR LLC (2005-2006). |
Christine Reynolds (52) |
| Year of Election or Appointment: 2008 Chief Financial Officer of the Fidelity funds. Ms. Reynolds became President of Fidelity Pricing and Cash Management Services (FPCMS) in August 2008. Ms. Reynolds served as Chief Operating Officer of FPCMS (2007-2008). Previously, Ms. Reynolds served as President, Treasurer, and Anti-Money Laundering officer of the Fidelity funds (2004-2007). |
Kenneth A. Rathgeber (63) |
| Year of Election or Appointment: 2004 Chief Compliance Officer of Fidelity's Equity and High Income Funds. Mr. Rathgeber is Chief Compliance Officer of Fidelity Management & Research (Hong Kong) Limited (2008-present), Fidelity Management & Research (Japan) Inc. (2008-present), FMR (2005-present), FMR Co., Inc. (2005-present), Fidelity Management & Research (U.K.) Inc. (2005-present), Fidelity Research & Analysis Company (2005-present), Fidelity Investments Money Management, Inc. (2005-present), Pyramis Global Advisors, LLC (2005-present), and Strategic Advisers, Inc. (2005-present). |
Jeffrey S. Christian (49) |
| Year of Election or Appointment: 2009 Deputy Treasurer of the Fidelity funds. Mr. Christian is an employee of Fidelity Investments. Previously, Mr. Christian served as Chief Financial Officer (2008-2009) of certain Fidelity funds and Senior Vice President of Fidelity Pricing and Cash Management Services (FPCMS) (2004-2009). |
Bryan A. Mehrmann (49) |
| Year of Election or Appointment: 2005 Deputy Treasurer of the Fidelity funds. Mr. Mehrmann is an employee of Fidelity Investments. |
Adrien E. Deberghes (43) |
| Year of Election or Appointment: 2008 Deputy Treasurer of Fidelity's Equity and High Income Funds. Mr. Deberghes also serves as Assistant Treasurer of other Fidelity funds (2010-present) and is an employee of Fidelity Investments (2008-present). Previously, Mr. Deberghes served as Senior Vice President of Mutual Fund Administration at State Street Corporation (2007-2008), Senior Director of Mutual Fund Administration at Investors Bank & Trust (2005-2007), and Director of Finance for Dunkin' Brands (2000-2005). |
Stephanie J. Dorsey (41) |
| Year of Election or Appointment: 2010 Assistant Treasurer of Fidelity's Equity and High Income Funds. Ms. Dorsey also serves as Deputy Treasurer of other Fidelity funds (2008-present) and is an employee of Fidelity Investments (2008-present). Previously, Ms. Dorsey served as Treasurer (2004-2008) of the JPMorgan Mutual Funds and Vice President (2004-2008) of JPMorgan Chase Bank. |
John R. Hebble (52) |
| Year of Election or Appointment: 2009 Assistant Treasurer of Fidelity's Equity and High Income Funds. Mr. Hebble also serves as Treasurer and Chief Financial Officer of The North Carolina Capital Management Trust: Cash and Term Portfolio (2008-present), President and Treasurer of other Fidelity funds (2008-present) and is an employee of Fidelity Investments. |
Gary W. Ryan (52) |
| Year of Election or Appointment: 2005 Assistant Treasurer of the Fidelity funds. Mr. Ryan is an employee of Fidelity Investments. Previously, Mr. Ryan served as Vice President of Fund Reporting in Fidelity Pricing and Cash Management Services (FPCMS) (1999-2005). |
Jonathan Davis (42) |
| Year of Election or Appointment: 2010 Assistant Treasurer of the Fidelity funds. Mr. Davis is an employee of Fidelity Investments. Previously, Mr. Davis served as Vice President and Associate General Counsel of FMR LLC (2003-2010). |
Annual Report
The Board of Trustees of VIP International Capital Appreciation Portfolio voted to pay to shareholders of record at the opening of business on record date, the following distributions per share derived from capital gains realized from sales of portfolio securities:
| Pay Date | Record Date | Dividends | Capital Gains |
Initial Class R | 02/11/11 | 02/11/11 | $0.00 | $0.01 |
Service Class R | 02/11/11 | 02/11/11 | $0.00 | $0.01 |
Service Class 2R | 02/11/11 | 02/11/11 | $0.00 | $0.01 |
Investor Class R | 02/11/11 | 02/11/11 | $0.00 | $0.01 |
The percentage of dividends distributed during the fiscal year representing income derived from sources within, and taxes paid to, foreign countries or possessions of the United States are as follows:
| Pay Date | Income | Taxes |
Initial Class R | 02/05/2010 | $0.023 | $0.000 |
Initial Class R | 12/17/2010 | $0.165 | $0.015 |
Initial Class R | 12/30/2010 | $0.022 | $0.000 |
Service Class R | 02/05/2010 | $0.023 | $0.000 |
Service Class R | 12/17/2010 | $0.155 | $0.015 |
Service Class R | 12/30/2010 | $0.022 | $0.000 |
Service Class 2R | 02/05/2010 | $0.023 | $0.000 |
Service Class 2R | 12/17/2010 | $0.137 | $0.015 |
Service Class 2R | 12/30/2010 | $0.022 | $0.000 |
Investor Class R | 02/05/2010 | $0.023 | $0.000 |
Investor Class R | 12/17/2010 | $0.165 | $0.015 |
Investor Class R | 12/30/2010 | $0.022 | $0.000 |
Annual Report
Board Approval of Investment Advisory Contracts and Management Fees
VIP International Capital Appreciation Portfolio
Each year, the Board of Trustees, including the Independent Trustees (together, the Board), votes on the renewal of the management contract and sub-advisory agreements (together, the Advisory Contracts) for the fund. The Board, assisted by the advice of fund counsel and Independent Trustees' counsel, requests and considers a broad range of information relevant to the renewal of the Advisory Contracts throughout the year.
The Board meets regularly and considers at each of its meetings factors that are relevant to its annual consideration of the renewal of the fund's Advisory Contracts, including the services and support provided to the fund and its shareholders. The Board has established various standing committees, each composed of Independent Trustees with varying backgrounds, to which the Board has assigned specific subject matter responsibilities in order to enhance effective decision-making by the Board. The Board, acting directly and through its Committees, requests and receives information concerning the annual consideration of the renewal of the fund's Advisory Contracts. The Board also meets as needed to consider matters specifically related to the Board's annual consideration of the renewal of Advisory Contracts. Members of the Board may also meet with trustees of other Fidelity funds through ad hoc joint committees to discuss certain matters relevant to the Fidelity funds.
At its July 2010 meeting, the Board of Trustees, including the Independent Trustees, unanimously determined to renew the fund's Advisory Contracts. In reaching its determination, the Board considered all factors it believed relevant, including (i) the nature, extent, and quality of the services to be provided to the fund and its shareholders (including the investment performance of the fund); (ii) the competitiveness of the fund's management fee and total expenses; (iii) the total costs of the services to be provided by and the profits to be realized by Fidelity from its relationship with the fund; (iv) the extent to which economies of scale would be realized as the fund grows; and (v) whether fee levels reflect these economies of scale, if any, for the benefit of fund shareholders.
In considering whether to renew the Advisory Contracts for the fund, the Board reached a determination, with the assistance of fund counsel and Independent Trustees' counsel and through the exercise of its business judgment, that the renewal of the Advisory Contracts is in the best interests of fund shareholders and that the compensation to be received by Fidelity under the management contract is fair and reasonable. The Board's decision to renew the Advisory Contracts was not based on any single factor noted above, but rather was based on a comprehensive consideration of all the information provided to the Board at its meetings throughout the year. The Board, in reaching its determination to renew the Advisory Contracts, is aware that shareholders in the fund have a broad range of investment choices available to them, including a wide choice among mutual funds offered by Fidelity's competitors, and that the fund's shareholders, with the opportunity to review and weigh the disclosure provided by the fund in its prospectus and other public disclosures, have chosen to invest in this fund, managed by Fidelity.
Nature, Extent, and Quality of Services Provided. The Board considered the staffing within the investment adviser, FMR, and the sub-advisers (together, the Investment Advisers), including the backgrounds of the fund's investment personnel and the fund's investment objective and discipline. The Independent Trustees also had discussions with senior management of Fidelity's investment operations and investment groups. The Board considered the structure of the portfolio manager compensation program and whether this structure provides appropriate incentives to act in the best interest of the fund.
Resources Dedicated to Investment Management and Support Services. The Board and the equity research subcommittee of the Board's Fund Oversight Committee reviewed the size, education, and experience of the Investment Advisers' investment staff, their use of technology, and the Investment Advisers' approach to recruiting, training, and retaining portfolio managers and other research, advisory, and management personnel. The Board noted that Fidelity's analysts have access to a variety of technological tools and market and securities data that enable them to perform both fundamental and quantitative analysis and to specialize in various disciplines. The Board considered Fidelity's extensive global research capabilities that enable the Investment Advisers to aggregate data from various sources in an effort to produce positive investment results. The Board also considered that Fidelity's portfolio managers and analysts have access to daily portfolio attribution that allows for monitoring of a fund's portfolio, as well as an electronic communication system that provides immediate real-time access to research concerning issuers and credit enhancers. The Board noted FMR's continued focus on strengthening the organization and discipline of equity portfolio management and research.
Shareholder and Administrative Services. The Board considered (i) the nature, extent, quality, and cost of advisory, administrative, and shareholder services performed by the Investment Advisers and their affiliates under the Advisory Contracts and under separate agreements covering transfer agency, pricing and bookkeeping, and securities lending services for the fund; (ii) the nature and extent of the investment adviser's supervision of third party service providers, principally custodians and subcustodians; and (iii) the resources devoted to, and the record of compliance with, the fund's compliance policies and procedures. The Board also reviewed the allocation of fund brokerage, including allocations to brokers affiliated with the Investment Advisers, the use of brokerage commissions to pay fund expenses, and the use of "soft" commission dollars to pay for research services.
The Board noted that the growth of fund assets over time across the complex allows Fidelity to reinvest in the development of services designed to enhance the value or convenience of the Fidelity funds as investment vehicles. These services include 24-hour access to account information and market information through phone representatives and over the Internet, and investor education materials and asset allocation tools.
Investment in a Large Fund Family. The Board considered the benefits to shareholders of investing in a Fidelity fund, including the benefits of investing in a fund that is part of a large family of funds offering a variety of investment disciplines and providing a large variety of mutual fund investor services. The Board noted that Fidelity had taken, or had made recommendations that resulted in the Fidelity funds taking, a number of actions over the previous year that benefited particular funds, including (i) dedicating additional resources to investment research and restructuring and broadening the focus of the investment research teams; (ii) bolstering the senior management team that oversees asset management; (iii) launching Class F of certain funds as a lower-fee class available to Freedom K and Freedom Index Funds; (iv) lowering the initial investment minimums and ongoing balance requirements for Real Estate High Income Fund; (v) eliminating subsequent purchase minimums for all funds and adding a waiver of the investment minimum requirement for new accounts opened with the proceeds of a systematic withdrawal plan; (vi) eliminating the withdrawal minimum and maximum limits for systematic withdrawals from Advisor funds; (vii) expanding sales load waivers on Class A shares for Destiny Planholders and expanding Institutional Class eligibility for Class O Destiny Planholders; and (viii) changing certain Class A and Class T sales charge structures to further align them with industry practices.
Annual Report
Investment Performance. The Board considered whether the fund has operated in accordance with its investment objective, as well as its record of compliance with its investment restrictions. It also reviewed the fund's absolute investment performance for each class, as well as the fund's relative investment performance for each class measured over multiple periods against (i) a broad-based securities market index, and (ii) a custom peer group of mutual funds deemed appropriate by Fidelity and reviewed by the Board. The following charts considered by the Board show, over the one-, three-, and five-year periods ended December 31, 2009, the cumulative total returns of Initial Class R and Service Class 2 R of the fund, the cumulative total returns of a broad-based securities market index ("benchmark"), and a range of cumulative total returns of a custom peer group of mutual funds defined by FMR based on categories assigned by Morningstar, Inc. The returns of Initial Class R and Service Class 2 R show the performance of the highest and lowest performing classes, respectively (based on five-year performance). The box within each chart shows the 25th percentile return (bottom of box) and the 75th percentile return (top of box) of the peer group. Returns shown above the box are in the first quartile and returns shown below the box are in the fourth quartile. The percentage beaten numbers noted below each chart correspond to the percentile box and represent the percentage of funds in the peer group whose performance was equal to or lower than that of the class indicated. The fund's custom peer group, defined by FMR, is a peer group that FMR believes provides a more meaningful performance comparison than the peer group assigned by Morningstar, Inc., which assigns mutual funds to categories based on their investment styles as measured by their underlying portfolio holdings.
VIP International Capital Appreciation Portfolio
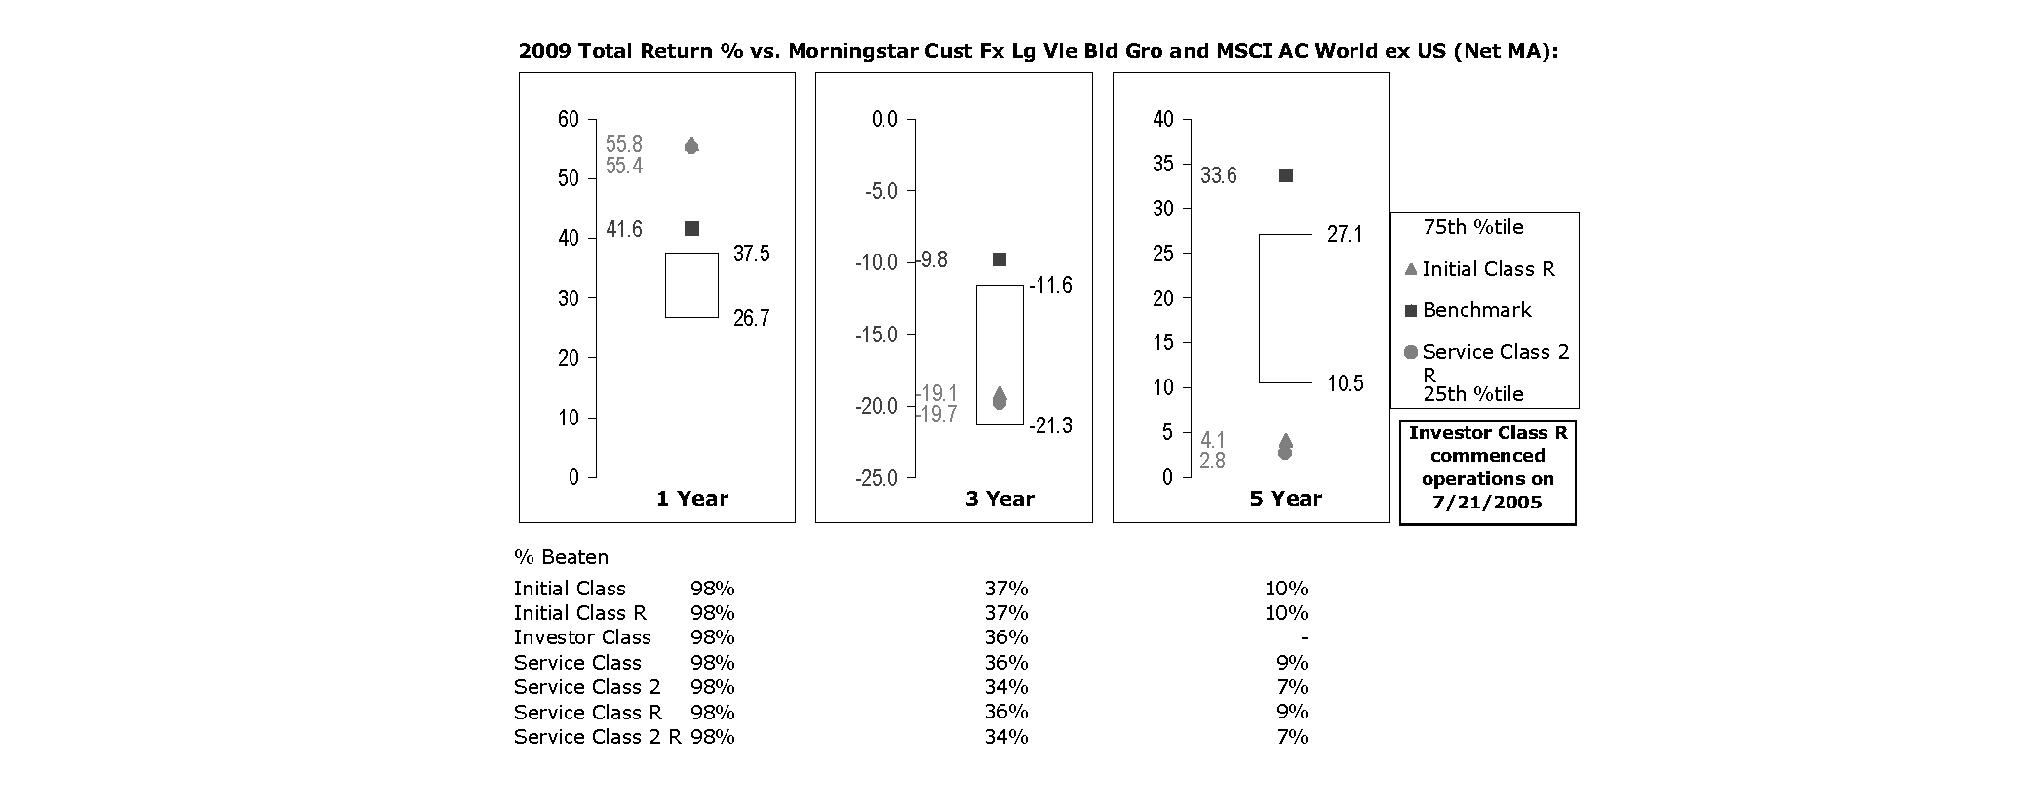
The Board reviewed the fund's relative investment performance against its peer group and noted that the performance of Initial Class R of the fund was in the first quartile for the one-year period, the third quartile for the three-year period, and the fourth quartile for the five-year period. The Board also noted that the investment performance of the fund was lower than its benchmark for the three- and five-year periods, although the one-year cumulative total return of Initial Class R compared favorably to its benchmark. The Board considered that the variations in performance among the fund's classes reflect the variations in class expenses, which result in lower performance for higher expense classes. The Board also reviewed the fund's performance since inception as well as performance in the current year.
Based on its review, and giving particular weight to the nature and quality of the resources dedicated by the Investment Advisers to maintain and improve relative performance and factoring in the unprecedented market events in recent years, the Board concluded that the nature, extent, and quality of investment management and support services and of shareholder and administrative services provided to the fund will benefit the fund's shareholders, particularly in light of the Board's view that the fund's shareholders benefit from investing in a fund that is part of a large family of funds offering a variety of investment disciplines and services.
Competitiveness of Management Fee and Total Fund Expenses. The Board considered the fund's management fee and total expenses compared to "mapped groups" of competitive funds and classes. Fidelity creates "mapped groups" by combining similar Lipper investment objective categories that have comparable management fee characteristics. Combining Lipper investment objective categories aids the Board's management fee and total expense comparisons by broadening the competitive group used for comparison and by reducing the number of universes to which various Fidelity funds are compared.
Annual Report
Board Approval of Investment Advisory Contracts and Management Fees - continued
Management Fee. The Board considered two proprietary management fee comparisons for the 12-month periods shown in the chart below. The group of Lipper funds used by the Board for management fee comparisons is referred to below as the "Total Mapped Group." The Total Mapped Group comparison focuses on a fund's standing relative to the total universe of comparable funds available to investors, in terms of gross management fees before expense reimbursements or caps. "TMG %" represents the percentage of funds in the Total Mapped Group that had management fees that were lower than the fund's. For example, a TMG % of 14% means that 86% of the funds in the Total Mapped Group had higher management fees than the fund. The "Asset-Size Peer Group" (ASPG) comparison focuses on a fund's standing relative to non-Fidelity funds similar in size to the fund within the Total Mapped Group. The ASPG represents at least 15% of the funds in the Total Mapped Group with comparable asset size and management fee characteristics, subject to a minimum of 50 funds (or all funds in the Total Mapped Group if fewer than 50). Additional information, such as the ASPG quartile in which the fund's management fee ranked, is also included in the chart and considered by the Board.
VIP International Capital Appreciation Portfolio

The Board noted that the fund's management fee ranked below the median of its Total Mapped Group and below the median of its ASPG for 2009.
Based on its review, the Board concluded that the fund's management fee is fair and reasonable in light of the services that the fund receives and the other factors considered.
Total Expenses. In its review of each class's total expenses, the Board considered the fund's management fee as well as other fund or class expenses, as applicable, such as transfer agent fees, pricing and bookkeeping fees, fund-paid 12b-1 fees, and custodial, legal, and audit fees. The Board also noted the effects of any waivers and reimbursements on fees and expenses. As part of its review, the Board also considered current and historical total expenses of each class of the fund compared to competitive fund median expenses. Each class of the fund is compared to those funds and classes in the Total Mapped Group (used by the Board for management fee comparisons) that have a similar sales load structure.
The Board noted that the total expenses of each of Initial Class and Initial Class R ranked equal to its competitive median for 2009 and the total expenses of each of Investor Class R, Service Class, Service Class 2, Service Class R, and Service Class 2 R ranked above its competitive median for 2009. The Board considered that the total expenses of Investor Class R were above the median primarily due to its higher transfer agent fee. The Board noted that the fund offers multiple classes, each of which has a different 12b-1 fee structure, and that the multiple structures are intended to offer a range of pricing options for the intermediary market. The Board also noted that the total expenses of the classes vary primarily by the level of their 12b-1 fees, although differences in transfer agent fees may also cause expenses to vary from class to class.
Fees Charged to Other Fidelity Clients. The Board also considered Fidelity fee structures and other information with respect to clients of FMR and its affiliates, such as other mutual funds advised or subadvised by FMR or its affiliates, pension plan clients, and other institutional clients. In March 2010, the Board created an ad hoc joint committee with the board of other Fidelity funds (the Committee) to review and compare Fidelity's institutional investment advisory business with its business of providing services to the Fidelity funds, including the differences in services provided, fees charged, and costs incurred, as well as competition in their respective marketplaces.
Annual Report
Based on its review of total expenses and fees charged to other Fidelity clients, the Board concluded that the total expenses of each class of the fund were reasonable, although in some cases above the median of the universe presented for comparison, in light of the services that the fund and its shareholders receive and the other factors considered, including the findings of the Committee.
Costs of the Services and Profitability. The Board considered the revenues earned and the expenses incurred by Fidelity in conducting the business of developing, marketing, distributing, managing, administering and servicing the fund and its shareholders. The Board also considered the level of Fidelity's profits in respect of all the Fidelity funds.
On an annual basis, FMR presents to the Board Fidelity's profitability for the fund. Fidelity calculates the profitability for each fund, as well as aggregate profitability for groups of Fidelity funds and all Fidelity funds, using a series of detailed revenue and cost allocation methodologies which originate with the audited books and records of Fidelity. The Audit Committee of the Board reviews any significant changes from the prior year's methodologies.
PricewaterhouseCoopers LLP (PwC), independent registered public accounting firm and auditor to Fidelity and certain Fidelity funds, has been engaged annually by the Board as part of the Board's assessment of Fidelity's profitability analysis. PwC's engagement includes the review and assessment of Fidelity's methodologies used in determining the revenues and expenses attributable to Fidelity's mutual fund business, and completion of agreed-upon procedures surrounding the mathematical accuracy of fund profitability and its conformity to allocation methodologies. After considering PwC's reports issued under the engagement and information provided by Fidelity, the Board believes that while other allocation methods may also be reasonable, Fidelity's profitability methodologies are reasonable in all material respects.
The Board has also reviewed Fidelity's non-fund businesses and fall-out benefits related to the mutual fund business as well as cases where Fidelity's affiliates may benefit from or be related to the fund's business.
The Board considered the costs of the services provided by and the profits realized by Fidelity in connection with the operation of the fund and were satisfied that the profitability was not excessive in the circumstances.
Economies of Scale. The Board considered whether there have been economies of scale in respect of the management of the Fidelity funds, whether the Fidelity funds (including the fund) have appropriately benefited from any such economies of scale, and whether there is potential for realization of any further economies of scale. The Board considered the extent to which the fund will benefit from economies of scale through increased services to the fund, through waivers or reimbursements, or through fee or expense reductions.
In February 2009, the Board and the board of other Fidelity funds created an ad hoc committee (the Economies of Scale Committee) to analyze whether FMR attains economies of scale in respect of the management and servicing of the Fidelity funds, whether the Fidelity funds have appropriately benefited from such economies of scale, and whether there is potential for realization of any further economies of scale.
The Board recognized that the fund's management contract incorporates a "group fee" structure, which provides for lower group fee rates as total fund assets under FMR's management increase, and for higher group fee rates as total fund assets under FMR's management decrease. FMR calculates the group fee rates based on a tiered asset "breakpoint" schedule that varies based on asset class. The Board considered that the group fee is designed to deliver the benefits of economies of scale to fund shareholders when total Fidelity fund assets increase, even if assets of any particular fund are unchanged or have declined, because some portion of Fidelity's costs are attributable to services provided to all Fidelity funds, and all funds benefit if those costs can be allocated among more assets. The Board concluded that, given the group fee structure, fund shareholders will benefit from lower management fees as assets under FMR's management increase at the fund complex level, regardless of whether Fidelity achieves any such economies of scale.
The Board concluded, considering the findings of the Economies of Scale Committee, that any potential economies of scale are being appropriately shared between fund shareholders and Fidelity.
Additional Information Requested by the Board. In order to develop fully the factual basis for consideration of the Fidelity funds' Advisory Contracts, the Board requested and received additional information on certain topics, including (i) fund performance trends, actions to be taken by FMR to improve certain funds' overall performance, and Fidelity's long-term strategies for certain funds; (ii) portfolio manager changes that have occurred during the past year and length of portfolio manager tenure for different categories of funds over time; (iii) Fidelity's compensation structure for portfolio managers, research analysts, and other key personnel, the rationale for the compensation structure, and how the compensation structure provides appropriate performance incentives; (iv) the amount of the investment that each portfolio manager has made in the Fidelity fund(s) that he or she manages; (v) management and other fees paid by FMR to affiliated sub-advisers on behalf of the Fidelity funds; (vi) Fidelity's fee structures and rationale for recommending different fees among different categories of funds; (vii) Fidelity's rationale for recommending which funds should have a performance adjustment component as part of their management fees; (viii) the rationale for any differences between fund fee structures and fee structures in place for other Fidelity clients; and (ix) explanations regarding the relative total expenses borne by certain funds and classes, total expense competitive trends, and actions that might be taken by FMR to reduce total expenses for certain funds and classes.
Based on its evaluation of all of the conclusions noted above, and after considering all factors it believed relevant, the Board ultimately concluded that the advisory fee structures are fair and reasonable, and that the fund's Advisory Contracts should be renewed.
Annual Report
Investment Adviser
Fidelity Management & Research Company
Boston, MA
Investment Sub-Advisers
FMR Co., Inc.
Fidelity Management & Research (U.K.) Inc.
FIL Investment Advisors
FIL Investment Advisors (U.K.) Ltd.
Fidelity Management & Research (Hong Kong) Limited
Fidelity Management & Research (Japan) Inc.
General Distributor
Fidelity Distributors Corporation
Boston, MA
Transfer and Service Agents
Fidelity Investments Institutional Operations Company, Inc.
Boston, MA
Fidelity Service Company, Inc.
Boston, MA
Custodian
Brown Brothers Harriman & Co.
Boston, MA
VIPCAR-ANN-0211
1.805787.106
Fidelity® Variable Insurance Products:
Materials Portfolio
Annual Report
December 31, 2010
(2_fidelity_logos) (Registered_Trademark)
Contents
Performance | <Click Here> | How the fund has done over time. |
Management's Discussion of Fund Performance | <Click Here> | The Portfolio Manager's review of fund performance and strategy. |
Shareholder Expense Example | <Click Here> | An example of shareholder expenses. |
Investment Changes | <Click Here> | A summary of major shifts in the fund's investments over the past six months. |
Investments | <Click Here> | A complete list of the fund's investments with their market values. |
Financial Statements | <Click Here> | Statements of assets and liabilities, operations, and changes in net assets, as well as financial highlights. |
Notes | <Click Here> | Notes to the financial statements. |
Report of Independent Registered Public Accounting Firm | <Click Here> | |
Trustees and Officers | <Click Here> | |
Distributions | <Click Here> | |
Board Approval of Investment Advisory Contracts and Management Fees | <Click Here> | |
To view a fund's proxy voting guidelines and proxy voting record for the 12-month period ended June 30, visit http://www.fidelity.com/proxyvotingresults or visit the Securities and Exchange Commission's (SEC) web site at http://www.sec.gov. You may also call 1-877-208-0098 to request a free copy of the proxy voting guidelines.
Fidelity Variable Insurance Products are separate account options which are purchased through a variable insurance contract.
Standard & Poor's, S&P and S&P 500 are registered service marks of The McGraw-Hill Companies, Inc. and have been licensed for use by Fidelity Distributors Corporation.
Other third party marks appearing herein are the property of their respective owners.
All other marks appearing herein are registered or unregistered trademarks or service marks of FMR LLC or an affiliated company.
The general research services agreement with Fidelity Research & Analysis Company has been terminated and is no longer in effect for the fund.
This report and the financial statements contained herein are submitted for the general information of the shareholders of the fund. This report is not authorized for distribution to prospective investors in the fund unless preceded or accompanied by an effective prospectus.
A fund files its complete schedule of portfolio holdings with the SEC for the first and third quarters of each fiscal year on Form N-Q. Forms N-Q are available on the SEC's web site at http://www.sec.gov. A fund's Forms N-Q may be reviewed and copied at the SEC's Public Reference Room in Washington, DC. Information regarding the operation of the SEC's Public Reference Room may be obtained by calling 1-800-SEC-0330. For a complete list of a fund's portfolio holdings, view the most recent holdings listing, semiannual report, or annual report on Fidelity's web site at http://www.fidelity.com, http://www.advisor.fidelity.com, or http://www.401k.com, as applicable.
NOT FDIC INSURED • MAY LOSE VALUE • NO BANK GUARANTEE
Neither the fund nor Fidelity Distributors Corporation is a bank.
Annual Report
Average annual total return reflects the change in the value of an investment, assuming reinvestment of the class' distributions from dividend income and capital gains (the profits earned upon the sale of securities that have grown in value, if any) and assuming a constant rate of performance each year. During periods of reimbursement by Fidelity, a fund's total return will be greater than it would be had the reimbursement not occurred. Performance numbers are net of all underlying fund operating expenses, but do not include any insurance charges imposed by your insurance company's separate account. If performance information included the effect of these additional charges, the total returns would have been lower. How a fund did yesterday is no guarantee of how it will do tomorrow.
Average Annual Total Returns
Periods ended December 31, 2010 | | Past 1
year | Life of fund A |
VIP Materials Portfolio - Initial Class | | 28.54% | 9.02% |
VIP Materials Portfolio - Investor Class | | 28.45% | 8.92% |
A From April 24, 2007.
$10,000 Over Life of Fund
Let's say hypothetically that $10,000 was invested in VIP Materials Portfolio - Initial Class on April 24, 2007, when the fund started. The chart shows how the value of your investment would have changed, and also shows how the S&P 500® Index performed over the same period.
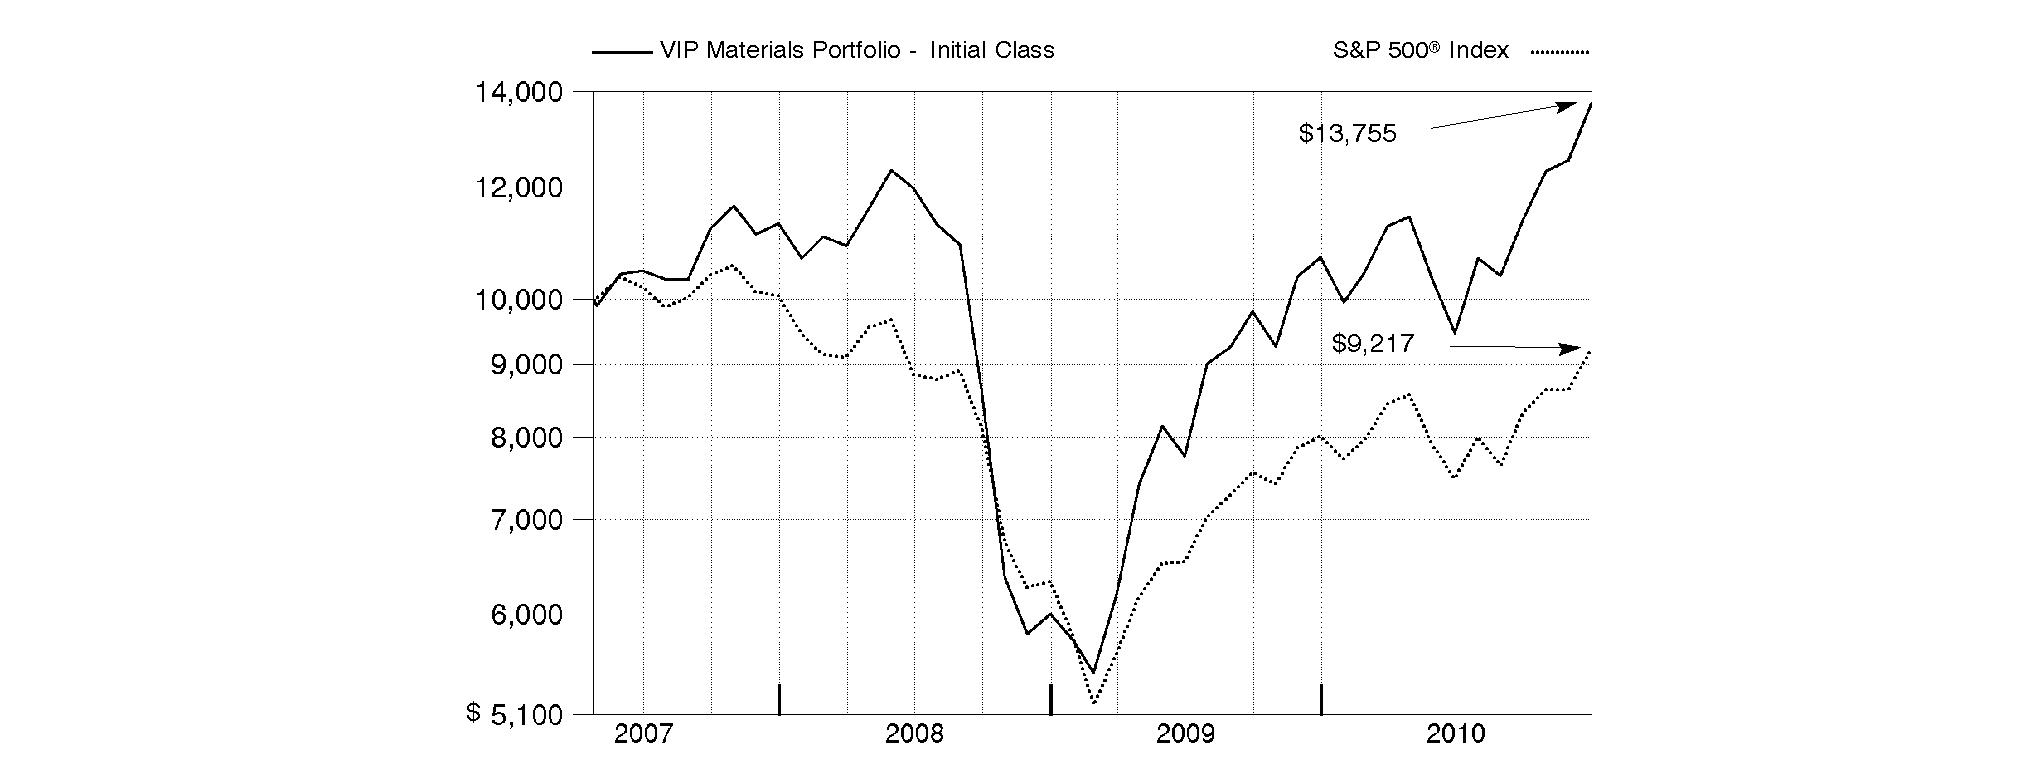
Annual Report
Market Recap: While market improvements around the world hit a speed bump in the first half of the 12-month period ending December 31, 2010, world economies re-accelerated in August, supported by a broadening recovery and low inflation in the U.S. Domestic stock markets recorded solid gains for the year, lifted by a strong second-half rally fueled by economic optimism, encouraging earnings reports and a wave of corporate mergers. The large-cap S&P 500® Index rose 15.06%, the blue-chip-laden Dow Jones Industrial AverageSM added 14.06% and the technology-heavy Nasdaq Composite® Index climbed 18.02%. Meanwhile, international stocks, as represented by the MSCI® ACWI® (All Country World Index) ex USA Index, gained 11.29%, boosted in part by a depreciating U.S. dollar. In the fixed-income arena, U.S. taxable investment-grade bonds generated positive results during 2010, as the Barclays Capital® U.S. Aggregate Bond Index gained 6.54%. With ultra-low interest rates bolstering nearly all fixed-income securities for most of the year, sectors in the index with higher yields and more credit risk generally fared best, while most high-quality bonds generated more-moderate returns. Meanwhile, high-yield bonds, as represented by The BofA Merrill LynchSM US High Yield Constrained Index, returned 15.07%, a result of improved economic data and strengthening investor demand. Overseas, foreign bond markets showed mixed results, with a sizable disparity between the 3.97% return of the Citigroup® Non-U.S. Group of 7 Index - which measures the performance of sovereign debt of the major global economies outside the U.S. - and the 12.04% advance of the JPMorgan Emerging Markets Bond Index Global (EMBI Global), which benefited from the rising overall credit quality of emerging-markets debt issuers.
Comments from Tobias Welo, Portfolio Manager of VIP Materials Portfolio: During the past year, the fund's share classes topped the 24.59% return of the MSCI® U.S. IM Materials 25/50 Index - which was adopted in January 2010 as a better representation of the fund's investment universe - and finished well ahead of the S&P 500®. (For specific portfolio results, please refer to the performance section of this report.) Stock selection in specialty chemicals significantly lifted relative performance, as did underweighting aluminum, a category where the fund had no exposure earlier in the year. From a capitalization standpoint, security selection in the mid-cap range bolstered performance. At the stock level, timely purchases of aluminum producer Alcoa, the fund's largest contributor versus the benchmark, aided results. As China's aluminum exports slowed during the year, and Alcoa's stock fell to around $10 over the summer, I began buying the stock. Alcoa's shares responded by handily outperforming the broader market over the final four months of 2010. Other contributors included specialty chemical producers Ferro and LyondellBasell Industries, as well as Airgas, a provider of industrial, medical and specialty gases, which I sold for a profit during the period after the company received a buyout offer from a competitor. United States Steel, which I purchased partway through the period, also contributed. Conversely, performance was hampered by agricultural products maker Monsanto, the fund's biggest absolute and relative detractor. Growing competition for the company's popular Roundup® agricultural herbicide and its line of genetically modified seeds led the company to cut prices on some products, which ate into profits. Not owning strong-performing steel producer Cliffs Natural Resources, a benchmark component, worked against the fund's results, as did overweighting container maker Owens-Illinois and underweighting PPG Industries, which manufactures auto/industrial coatings and paints. The latter was sold during the period.
The views expressed above reflect those of the portfolio manager(s) only through the end of the period as stated on the cover of this report and do not necessarily represent the views of Fidelity or any other person in the Fidelity organization. Any such views are subject to change at any time based upon market or other conditions and Fidelity disclaims any responsibility to update such views. These views may not be relied on as investment advice and, because investment decisions for a Fidelity fund are based on numerous factors, may not be relied on as an indication of trading intent on behalf of any Fidelity fund.
Annual Report
As a shareholder of the Fund, you incur two types of costs: (1) transaction costs, including redemption fees, and (2) ongoing costs, including management fees and other Fund expenses. This Example is intended to help you understand your ongoing costs (in dollars) of investing in the Fund and to compare these costs with the ongoing costs of investing in other mutual funds.
The Example is based on an investment of $1,000 invested at the beginning of the period and held for the entire period (July 1, 2010 to December 31, 2010).
Actual Expenses
The first line of the accompanying table for each class of the Fund provides information about actual account values and actual expenses. You may use the information in this line, together with the amount you invested, to estimate the expenses that you paid over the period. Simply divide your account value by $1,000.00 (for example, an $8,600 account value divided by $1,000.00 = 8.6), then multiply the result by the number in the first line for a class of the Fund under the heading entitled "Expenses Paid During Period" to estimate the expenses you paid on your account during this period. The estimate of expenses does not include any fees or other expenses of any variable annuity or variable life insurance product. If they were, the estimate of expenses you paid during the period would be higher, and your ending account value would be lower. In addition, the Fund, as a shareholder in the underlying Fidelity Central Funds, will indirectly bear its pro-rata share of the fees and expenses incurred by the underlying Fidelity Central Funds. These fees and expenses are not included in the Fund's annualized expense ratio used to calculate the expense estimate in the table below.
Hypothetical Example for Comparison Purposes
The second line of the accompanying table for each class of the Fund provides information about hypothetical account values and hypothetical expenses based on a Class' actual expense ratio and an assumed rate of return of 5% per year before expenses, which is not the Class' actual return. The hypothetical account values and expenses may not be used to estimate the actual ending account balance or expenses you paid for the period. You may use this information to compare the ongoing costs of investing in the Fund and other funds. To do so, compare this 5% hypothetical example with the 5% hypothetical examples that appear in the shareholder reports of the other funds. The estimate of expenses does not include any fees or other expenses of any variable annuity or variable life insurance product. If they were, the estimate of expenses you paid during the period would be higher, and your ending account value would be lower. In addition, the Fund, as a shareholder in the underlying Fidelity Central Funds, will indirectly bear its pro-rata share of the fees and expenses incurred by the underlying Fidelity Central Funds. These fees and expenses are not included in the Fund's annualized expense ratio used to calculate the expense estimate in the table below.
Please note that the expenses shown in the table are meant to highlight your ongoing costs only and do not reflect any transaction costs. Therefore, the second line of the table is useful in comparing ongoing costs only, and will not help you determine the relative total costs of owning different funds. In addition, if these transactional costs were included, your costs would have been higher.
| Annualized
Expense Ratio | Beginning
Account Value
July 1, 2010 | Ending
Account Value
December 31, 2010 | Expenses Paid
During Period*
July 1, 2010
to December 31, 2010 |
Initial Class | .78% | | | |
Actual | | $ 1,000.00 | $ 1,452.20 | $ 4.82 |
HypotheticalA | | $ 1,000.00 | $ 1,021.27 | $ 3.97 |
Investor Class | .86% | | | |
Actual | | $ 1,000.00 | $ 1,451.20 | $ 5.31 |
HypotheticalA | | $ 1,000.00 | $ 1,020.87 | $ 4.38 |
A 5% return per year before expenses
* Expenses are equal to each Class' annualized expense ratio, multiplied by the average account value over the period, multiplied by 184/365 (to reflect the one-half year period).
Annual Report
Investment Changes (Unaudited)
Top Ten Stocks as of December 31, 2010 |
| % of fund's
net assets | % of fund's net assets
6 months ago |
Dow Chemical Co. | 8.6 | 8.1 |
Freeport-McMoRan Copper & Gold, Inc. | 8.0 | 3.6 |
E.I. du Pont de Nemours & Co. | 6.8 | 7.6 |
Monsanto Co. | 4.9 | 6.8 |
Praxair, Inc. | 4.8 | 7.0 |
Air Products & Chemicals, Inc. | 4.0 | 2.6 |
Newmont Mining Corp. | 3.3 | 3.1 |
The Mosaic Co. | 2.6 | 1.9 |
Celanese Corp. Class A | 2.4 | 2.5 |
United States Steel Corp. | 2.3 | 0.0 |
| 47.7 | |
Top Industries (% of fund's net assets) |
As of December 31, 2010 |
| Chemicals | 55.9% | |
| Metals & Mining | 31.1% | |
| Containers & Packaging | 5.9% | |
| Oil, Gas & Consumable Fuels | 1.7% | |
| Construction Materials | 1.2% | |
| All Others* | 4.2% | |

As of June 30, 2010 |
| Chemicals | 54.8% | |
| Metals & Mining | 24.5% | |
| Containers & Packaging | 9.1% | |
| Construction Materials | 3.8% | |
| Paper & Forest Products | 2.7% | |
| All Others* | 5.1% | |

* Includes short-term investments and net other assets. |
Annual Report
Investments December 31, 2010
Showing Percentage of Net Assets
Common Stocks - 98.3% |
| Shares | | Value |
AUTOMOBILES - 0.5% |
Automobile Manufacturers - 0.5% |
General Motors Co. | 13,791 | | $ 508,336 |
CHEMICALS - 55.9% |
Commodity Chemicals - 3.1% |
Arkema SA | 6,900 | | 496,967 |
Celanese Corp. Class A | 60,377 | | 2,485,721 |
Grasim Industries Ltd. | 3,972 | | 217,512 |
| | 3,200,200 |
Diversified Chemicals - 21.6% |
Ashland, Inc. | 33,577 | | 1,707,726 |
BASF AG | 8,284 | | 661,220 |
Cabot Corp. | 24,656 | | 928,298 |
Dow Chemical Co. | 256,753 | | 8,765,546 |
E.I. du Pont de Nemours & Co. | 139,433 | | 6,954,918 |
FMC Corp. | 13,700 | | 1,094,493 |
Huntsman Corp. | 58,909 | | 919,569 |
Solutia, Inc. (a) | 43,318 | | 999,779 |
| | 22,031,549 |
Fertilizers & Agricultural Chemicals - 10.1% |
CF Industries Holdings, Inc. | 17,294 | | 2,337,284 |
Monsanto Co. | 71,948 | | 5,010,459 |
The Mosaic Co. | 34,308 | | 2,619,759 |
Yara International ASA | 6,100 | | 353,379 |
| | 10,320,881 |
Industrial Gases - 8.8% |
Air Products & Chemicals, Inc. | 44,900 | | 4,083,655 |
Praxair, Inc. | 51,244 | | 4,892,265 |
| | 8,975,920 |
Specialty Chemicals - 12.3% |
Albemarle Corp. | 14,350 | | 800,443 |
Ecolab, Inc. | 46,100 | | 2,324,362 |
Ferro Corp. (a) | 7,123 | | 104,281 |
Innophos Holdings, Inc. | 36,359 | | 1,311,833 |
Kraton Performance Polymers, Inc. | 26,400 | | 817,080 |
LyondellBasell Industries NV Class A (a) | 37,148 | | 1,277,891 |
OMNOVA Solutions, Inc. (a) | 17,400 | | 145,464 |
PolyOne Corp. (a) | 15,900 | | 198,591 |
Rockwood Holdings, Inc. (a) | 23,068 | | 902,420 |
Sherwin-Williams Co. | 22,942 | | 1,921,393 |
Symrise AG | 21,817 | | 598,700 |
Valspar Corp. | 29,800 | | 1,027,504 |
W.R. Grace & Co. (a) | 32,290 | | 1,134,348 |
| | 12,564,310 |
TOTAL CHEMICALS | | 57,092,860 |
|
| Shares | | Value |
CONSTRUCTION & ENGINEERING - 0.5% |
Construction & Engineering - 0.5% |
Fluor Corp. | 7,232 | | $ 479,192 |
CONSTRUCTION MATERIALS - 1.2% |
Construction Materials - 1.2% |
HeidelbergCement AG | 19,220 | | 1,205,196 |
CONTAINERS & PACKAGING - 5.9% |
Metal & Glass Containers - 5.9% |
Ball Corp. | 21,700 | | 1,476,685 |
Crown Holdings, Inc. (a) | 43,862 | | 1,464,114 |
Greif, Inc. Class A | 9,434 | | 583,965 |
Owens-Illinois, Inc. (a) | 65,617 | | 2,014,442 |
Silgan Holdings, Inc. | 15,100 | | 540,731 |
| | 6,079,937 |
FOOD PRODUCTS - 0.5% |
Agricultural Products - 0.5% |
Archer Daniels Midland Co. | 16,559 | | 498,095 |
MACHINERY - 0.5% |
Construction & Farm Machinery & Heavy Trucks - 0.5% |
Caterpillar, Inc. | 5,224 | | 489,280 |
METALS & MINING - 31.1% |
Aluminum - 1.5% |
Alcoa, Inc. | 98,331 | | 1,513,314 |
Diversified Metals & Mining - 15.0% |
Anglo American PLC (United Kingdom) | 20,769 | | 1,080,794 |
BHP Billiton PLC | 15,749 | | 634,040 |
Compass Minerals International, Inc. | 7,600 | | 678,452 |
Freeport-McMoRan Copper & Gold, Inc. | 67,759 | | 8,137,178 |
HudBay Minerals, Inc. | 17,000 | | 306,317 |
Kazakhmys PLC | 16,300 | | 410,447 |
MacArthur Coal Ltd. | 18,996 | | 248,425 |
Mongolian Mining Corp. | 258,000 | | 301,069 |
OJSC MMC Norilsk Nickel ADR | 13,300 | | 314,811 |
Teck Resources Ltd. Class B (sub. vtg.) | 17,800 | | 1,102,840 |
Walter Energy, Inc. | 16,535 | | 2,113,834 |
| | 15,328,207 |
Gold - 6.3% |
AngloGold Ashanti Ltd. sponsored ADR | 17,953 | | 883,826 |
Newcrest Mining Ltd. | 21,009 | | 868,040 |
Newmont Mining Corp. | 54,225 | | 3,331,042 |
Randgold Resources Ltd. sponsored ADR | 5,985 | | 492,745 |
Yamana Gold, Inc. | 68,200 | | 873,272 |
| | 6,448,925 |
Precious Metals & Minerals - 0.2% |
Pan American Silver Corp. | 5,300 | | 218,413 |
Steel - 8.1% |
Allegheny Technologies, Inc. | 14,200 | | 783,556 |
Carpenter Technology Corp. | 30,000 | | 1,207,200 |
Common Stocks - continued |
| Shares | | Value |
METALS & MINING - CONTINUED |
Steel - continued |
Commercial Metals Co. | 54,010 | | $ 896,026 |
Jindal Steel & Power Ltd. | 17,873 | | 284,629 |
Reliance Steel & Aluminum Co. | 33,535 | | 1,713,639 |
Ternium SA sponsored ADR | 13,260 | | 562,357 |
United States Steel Corp. (d) | 40,400 | | 2,360,168 |
Vale SA sponsored ADR (d) | 13,928 | | 481,491 |
| | 8,289,066 |
TOTAL METALS & MINING | | 31,797,925 |
OIL, GAS & CONSUMABLE FUELS - 1.7% |
Coal & Consumable Fuels - 1.7% |
Massey Energy Co. | 18,440 | | 989,306 |
PT Bumi Resources Tbk | 2,178,500 | | 731,407 |
| | 1,720,713 |
REAL ESTATE INVESTMENT TRUSTS - 0.5% |
Specialized REITs - 0.5% |
Weyerhaeuser Co. | 26,191 | | 495,796 |
TOTAL COMMON STOCKS (Cost $82,254,210) | 100,367,330 |
Money Market Funds - 7.2% |
| Shares | | Value |
Fidelity Cash Central Fund, 0.19% (b) | 4,827,212 | | $ 4,827,212 |
Fidelity Securities Lending Cash Central Fund, 0.21% (b)(c) | 2,506,950 | | 2,506,950 |
TOTAL MONEY MARKET FUNDS (Cost $7,334,162) | 7,334,162 |
TOTAL INVESTMENT PORTFOLIO - 105.5% (Cost $89,588,372) | | 107,701,492 |
NET OTHER ASSETS (LIABILITIES) - (5.5)% | | (5,591,627) |
NET ASSETS - 100% | $ 102,109,865 |
Legend |
(a) Non-income producing |
(b) Affiliated fund that is available only to investment companies and other accounts managed by Fidelity Investments. The rate quoted is the annualized seven-day yield of the fund at period end. A complete unaudited listing of the fund's holdings as of its most recent quarter end is available upon request. In addition, each Fidelity Central Fund's financial statements, which are not covered by the Fund's Report of Independent Registered Public Accounting Firm, are available on the SEC's website or upon request. |
(c) Includes investment made with cash collateral received from securities on loan. |
(d) Security or a portion of the security is on loan at period end. |
Affiliated Central Funds |
Information regarding fiscal year to date income earned by the Fund from investments in Fidelity Central Funds is as follows: |
Fund | Income earned |
Fidelity Cash Central Fund | $ 3,633 |
Fidelity Securities Lending Cash Central Fund | 2,948 |
Total | $ 6,581 |
Other Information |
The following is a summary of the inputs used, as of December 31, 2010, involving the Fund's assets and liabilities carried at fair value. The inputs or methodology used for valuing securities may not be an indication of the risk associated with investing in those securities. For more information on valuation inputs, and their aggregation into the levels used in the table below, please refer to the Security Valuation section in the accompanying Notes to Financial Statements. |
Valuation Inputs at Reporting Date: |
Description | Total | Level 1 | Level 2 | Level 3 |
Investments in Securities: | | | | |
Common Stocks | $ 100,367,330 | $ 99,515,778 | $ 851,552 | $ - |
Money Market Funds | 7,334,162 | 7,334,162 | - | - |
Total Investments in Securities: | $ 107,701,492 | $ 106,849,940 | $ 851,552 | $ - |
Distribution of investments by country of issue, as a percentage of total net assets, is as follows: (Unaudited) |
United States of America | 86.0% |
Canada | 2.4% |
Germany | 2.4% |
United Kingdom | 2.0% |
Netherlands | 1.2% |
Australia | 1.0% |
Others (Individually Less Than 1%) | 5.0% |
| 100.0% |
Income Tax Information |
At December 31, 2010, the Fund had a capital loss carryforward of approximately $3,798,653 all of which will expire in fiscal 2016. Capital loss carryforwards are only available to offset future capital gains of the Fund to the extent provided by regulations and may be limited. |
See accompanying notes which are an integral part of the financial statements.
Annual Report
Statement of Assets and Liabilities
| December 31, 2010 |
Assets | | |
Investment in securities, at value (including securities loaned of $2,437,136) - See accompanying schedule: Unaffiliated issuers (cost $82,254,210) | $ 100,367,330 | |
Fidelity Central Funds (cost $7,334,162) | 7,334,162 | |
Total Investments (cost $89,588,372) | | $ 107,701,492 |
Receivable for investments sold | | 2,743,811 |
Receivable for fund shares sold | | 861,757 |
Dividends receivable | | 87,795 |
Distributions receivable from Fidelity Central Funds | | 1,043 |
Prepaid expenses | | 169 |
Other receivables | | 2,185 |
Total assets | | 111,398,252 |
| | |
Liabilities | | |
Payable for investments purchased | $ 6,689,025 | |
Accrued management fee | 42,709 | |
Other affiliated payables | 11,426 | |
Other payables and accrued
expenses | 38,277 | |
Collateral on securities loaned, at value | 2,506,950 | |
Total liabilities | | 9,288,387 |
| | |
Net Assets | | $ 102,109,865 |
Net Assets consist of: | | |
Paid in capital | | $ 88,478,645 |
Accumulated undistributed net realized gain (loss) on investments and foreign currency transactions | | (4,480,997) |
Net unrealized appreciation (depreciation) on investments and assets and liabilities in foreign
currencies | | 18,112,217 |
Net Assets | | $ 102,109,865 |
Statement of Assets and Liabilities - continued
| December 31, 2010 |
Initial Class:
Net Asset Value, offering price and redemption price per share ($46,130,653 ÷ 3,563,958 shares) | | $ 12.94 |
| | |
Investor Class:
Net Asset Value, offering price and redemption price per share ($55,979,212 ÷ 4,325,931 shares) | | $ 12.94 |
See accompanying notes which are an integral part of the financial statements.
Annual Report
Financial Statements - continued
Statement of Operations
| Year ended December 31, 2010 |
Investment Income | | |
Dividends | | $ 1,114,663 |
Special dividends | | 998,126 |
Interest | | 20 |
Income from Fidelity Central Funds | | 6,581 |
Total income | | 2,119,390 |
| | |
Expenses | | |
Management fee | $ 384,627 | |
Transfer agent fees | 89,232 | |
Accounting and security lending fees | 27,016 | |
Custodian fees and expenses | 31,609 | |
Independent trustees' compensation | 377 | |
Audit | 39,110 | |
Legal | 293 | |
Miscellaneous | 703 | |
Total expenses before reductions | 572,967 | |
Expense reductions | (13,422) | 559,545 |
Net investment income (loss) | | 1,559,845 |
Realized and Unrealized Gain (Loss) Net realized gain (loss) on: | | |
Investment securities: | | |
Unaffiliated issuers | 4,683,507 | |
Foreign currency transactions | (6,201) | |
Total net realized gain (loss) | | 4,677,306 |
Change in net unrealized appreciation (depreciation) on: Investment securities (net of increase in deferred foreign taxes of $723) | 10,200,245 | |
Assets and liabilities in foreign currencies | (166) | |
Total change in net unrealized appreciation (depreciation) | | 10,200,079 |
Net gain (loss) | | 14,877,385 |
Net increase (decrease) in net assets resulting from operations | | $ 16,437,230 |
Statement of Changes in Net Assets
| Year ended
December 31, 2010 | Year ended
December 31, 2009 |
Increase (Decrease) in Net Assets | | |
Operations | | |
Net investment income (loss) | $ 1,559,845 | $ 493,800 |
Net realized gain (loss) | 4,677,306 | 1,859,232 |
Change in net unrealized appreciation (depreciation) | 10,200,079 | 18,289,725 |
Net increase (decrease) in net assets resulting
from operations | 16,437,230 | 20,642,757 |
Distributions to shareholders from net investment income | (1,597,131) | (512,074) |
Distributions to shareholders from net realized gain | (21,424) | - |
Total distributions | (1,618,555) | (512,074) |
Share transactions - net increase (decrease) | 14,458,074 | 34,825,755 |
Redemption fees | 42,650 | 26,955 |
Total increase (decrease) in net assets | 29,319,399 | 54,983,393 |
| | |
Net Assets | | |
Beginning of period | 72,790,466 | 17,807,073 |
End of period | $ 102,109,865 | $ 72,790,466 |
See accompanying notes which are an integral part of the financial statements.
Annual Report
Financial Highlights - Initial Class
Years ended December 31, | 2010 | 2009 | 2008 | 2007K |
Selected Per-Share Data | | | | |
Net asset value, beginning of period | $ 10.25 | $ 5.80 | $ 11.13 | $ 10.00 |
Income from Investment Operations | | | | |
Net investment income (loss)E | .25H | .10I | .07 | .10J |
Net realized and unrealized gain (loss) | 2.66 | 4.42 | (5.31) | 1.20 |
Total from investment operations | 2.91 | 4.52 | (5.24) | 1.30 |
Distributions from net investment income | (.23) | (.08) | (.08) | (.07) |
Distributions from net realized gain | -M | - | (.06) | (.11) |
Total distributions | (.23) | (.08) | (.14) | (.18) |
Redemption fees added to paid in capitalE | .01 | .01 | .05 | .01 |
Net asset value, end of period | $ 12.94 | $ 10.25 | $ 5.80 | $ 11.13 |
Total ReturnB,C,D | 28.54% | 78.09% | (46.88)% | 13.12% |
Ratios to Average Net AssetsF,L | | | | |
Expenses before reductions | .79% | .82% | .88% | 1.08%A |
Expenses net of fee waivers, if any | .78% | .82% | .88% | 1.00%A |
Expenses net of all reductions | .77% | .81% | .88% | 1.00%A |
Net investment income (loss) | 2.31%H | 1.27%I | .74% | 1.31%A,J |
Supplemental Data | | | | |
Net assets, end of period (000 omitted) | $ 46,131 | $ 34,218 | $ 9,963 | $ 13,730 |
Portfolio turnover rateG | 115% | 105% | 171% | 35%A |
A Annualized B Total returns for periods of less than one year are not annualized. C Total returns do not reflect charges attributable to your insurance company's separate account. Inclusion of these charges would reduce the total returns shown. D Total returns would have been lower had certain expenses not been reduced during the periods shown. E Calculated based on average shares outstanding during the period. F Fees and expenses of the underlying Fidelity Central Funds are not included in the Fund's expense ratio. The Fund indirectly bears its proportionate share of the expenses of any underlying Fidelity Central Funds. G Amount does not include the portfolio activity of any underlying Fidelity Central Funds. H Investment income per share reflects a special dividend which amounted to $.16 per share. Excluding the special dividend, the ratio of net investment income (loss) to average net assets would have been .86%. I Investment income per share reflects a special dividend which amounted to $.02 per share. Excluding the special dividend, the ratio of net investment income (loss) to average net assets would have been 1.03%. J Investment income per share reflects a special dividend which amounted to $.02 per share. Excluding the special dividend, the ratio of net investment income (loss) to average net assets would have been 1.03%. K For the period April 24, 2007 (commencement of operations) to December 31, 2007. L Expense ratios reflect operating expenses of the class. Expenses before reductions do not reflect amounts reimbursed by the investment adviser or reductions from brokerage service arrangements or reductions from other expense offset arrangements and do not represent the amount paid by the class during periods when reimbursements or reductions occur. Expense ratios before reductions for start-up periods may not be representative of longer-term operating periods. Expenses net of fee waivers reflect expenses after reimbursement by the investment adviser but prior to reductions from brokerage service arrangements or other expense offset arrangements. Expenses net of all reductions represent the net expenses paid by the class. M Amount represents less than $.01 per share. |
Financial Highlights - Investor Class
Years ended December 31, | 2010 | 2009 | 2008 | 2007K |
Selected Per-Share Data | | | | |
Net asset value, beginning of period | $ 10.25 | $ 5.80 | $ 11.13 | $ 10.00 |
Income from Investment Operations | | | | |
Net investment income (loss)E | .24H | .10I | .06 | .09J |
Net realized and unrealized gain (loss) | 2.66 | 4.41 | (5.31) | 1.21 |
Total from investment operations | 2.90 | 4.51 | (5.25) | 1.30 |
Distributions from net investment income | (.22) | (.07) | (.07) | (.07) |
Distributions from net realized gain | -M | - | (.06) | (.11) |
Total distributions | (.22) | (.07) | (.13) | (.18) |
Redemption fees added to paid in capitalE | .01 | .01 | .05 | .01 |
Net asset value, end of period | $ 12.94 | $ 10.25 | $ 5.80 | $ 11.13 |
Total ReturnB,C,D | 28.45% | 78.02% | (46.98)% | 13.05% |
Ratios to Average Net AssetsF,L | | | | |
Expenses before reductions | .87% | .91% | .97% | 1.20%A |
Expenses net of fee waivers, if any | .86% | .91% | .97% | 1.15%A |
Expenses net of all reductions | .85% | .90% | .96% | 1.15%A |
Net investment income (loss) | 2.23%H | 1.18%I | .65% | 1.16%A,J |
Supplemental Data | | | | |
Net assets, end of period (000 omitted) | $ 55,979 | $ 38,572 | $ 7,844 | $ 10,793 |
Portfolio turnover rateG | 115% | 105% | 171% | 35%A |
A Annualized B Total returns for periods of less than one year are not annualized. C Total returns do not reflect charges attributable to your insurance company's separate account. Inclusion of these charges would reduce the total returns shown. D Total returns would have been lower had certain expenses not been reduced during the periods shown. E Calculated based on average shares outstanding during the period. F Fees and expenses of the underlying Fidelity Central Funds are not included in the Fund's expense ratio. The Fund indirectly bears its proportionate share of the expenses of any underlying Fidelity Central Funds. G Amount does not include the portfolio activity of any underlying Fidelity Central Funds. H Investment income per share reflects a special dividend which amounted to $.16 per share. Excluding the special dividend, the ratio of net investment income (loss) to average net assets would have been .78%. I Investment income per share reflects a special dividend which amounted to $.02 per share. Excluding the special dividend, the ratio of net investment income (loss) to average net assets would have been .94%. J Investment income per share reflects a special dividend which amounted to $.02 per share. Excluding the special dividend, the ratio of net investment income (loss) to average net assets would have been .88%. K For the period April 24, 2007 (commencement of operations) to December 31, 2007. L Expense ratios reflect operating expenses of the class. Expenses before reductions do not reflect amounts reimbursed by the investment adviser or reductions from brokerage service arrangements or reductions from other expense offset arrangements and do not represent the amount paid by the class during periods when reimbursements or reductions occur. Expense ratios before reductions for start-up periods may not be representative of longer-term operating periods. Expenses net of fee waivers reflect expenses after reimbursement by the investment adviser but prior to reductions from brokerage service arrangements or other expense offset arrangements. Expenses net of all reductions represent the net expenses paid by the class. M Amount represents less than $.01 per share.
See accompanying notes which are an integral part of the financial statements.
Annual Report
Notes to Financial Statements
For the period ended December 31, 2010
1. Organization.
VIP Materials Portfolio (the Fund) is a non-diversified fund of Variable Insurance Products Fund IV (the Trust) and is authorized to issue an unlimited number of shares. The Trust is registered under the Investment Company Act of 1940, as amended (the 1940 Act), as an open-end management investment company organized as a Massachusetts business trust. Shares of the Fund may only be purchased by insurance companies for the purpose of funding variable annuity or variable life insurance contracts. The Fund offers the following classes of shares: Initial Class shares and Investor Class shares. All classes have equal rights and voting privileges, except for matters affecting a single class. Investment income, realized and unrealized capital gains and losses, the common expenses of the Fund, and certain fund-level expense reductions, if any, are allocated on a pro-rata basis to each class based on the relative net assets of each class to the total net assets of the Fund. Each class differs with respect to transfer agent fees incurred. Certain expense reductions may also differ by class.
2. Investments in Fidelity Central Funds.
The Fund may invest in Fidelity Central Funds, which are open-end investment companies available only to other investment companies and accounts managed by Fidelity Management & Research Company (FMR) and its affiliates. The Fund's Schedule of Investments lists each of the Fidelity Central Funds held as of period end, if any, as an investment of the Fund, but does not include the underlying holdings of each Fidelity Central Fund. As an Investing Fund, the Fund indirectly bears its proportionate share of the expenses of the underlying Fidelity Central Funds.
The Money Market Central Funds seek preservation of capital and current income and are managed by Fidelity Investments Money Management, Inc. (FIMM), an affiliate of FMR.
A complete unaudited list of holdings for each Fidelity Central Fund is available upon request or at the Securities and Exchange Commission (the SEC) web site at www.sec.gov. In addition, the financial statements of the Fidelity Central Funds, which are not covered by the Fund's Report of Independent Registered Public Accounting Firm, are available on the SEC web site or upon request.
3. Significant Accounting Policies.
The financial statements have been prepared in conformity with accounting principles generally accepted in the United States of America (GAAP), which require management to make certain estimates and assumptions at the date of the financial statements. Actual results could differ from those estimates. Subsequent events, if any, through the date that the financial statements were issued have been evaluated in the preparation of the financial statements. The following summarizes the significant accounting policies of the Fund:
Security Valuation. Investments are valued as of 4:00 p.m. Eastern time on the last calendar day of the period. The Fund uses independent pricing services approved by the Board of Trustees to value its investments. When current market prices or quotations are not readily available or reliable, valuations may be determined in good faith in accordance with procedures adopted by the Board of Trustees. Factors used in determining value may include market or security specific events. The frequency with which these procedures are used cannot be predicted and they may be utilized to a significant extent. The value used for net asset value (NAV) calculation under these procedures may differ from published prices for the same securities.
The Fund categorizes the inputs to valuation techniques used to value its investments into a disclosure hierarchy consisting of three levels as shown below.
Level 1 - quoted prices in active markets for identical investments
Level 2 - other significant observable inputs (including quoted prices for similar investments, interest rates, prepayment speeds, etc.)
Level 3 - unobservable inputs (including the Fund's own assumptions based on the best information available)
Changes in valuation techniques may result in transfers in or out of an assigned level within the disclosure hierarchy. The aggregate value of investments by input level, as of December 31, 2010, is included at the end of the Fund's Schedule of Investments. Valuation techniques used to value the Fund's investments by major category are as follows.
Equity securities, including restricted securities, for which market quotations are readily available, are valued at the last reported sale price or official closing price as reported by an independent pricing service on the primary market or exchange on which they are traded and are categorized as Level 1 in the hierarchy. In the event there were no sales during the day or closing prices are not available, securities are valued at the last quoted bid price or may be valued using the last available price and are generally categorized as Level 2 in the hierarchy. For foreign equity securities, when significant market or security specific events arise, comparisons to the valuation of American Depositary Receipts (ADRs), futures contracts, Exchange-traded funds (ETFs) and certain indexes as well as quoted prices for similar securities are used and are categorized as Level 2 in the hierarchy in these circumstances. Utilizing these techniques may result in transfers between Level 1 and Level 2. For restricted equity securities and private placements where observable inputs are limited, assumptions about market activity and risk are used and are categorized as Level 3 in the hierarchy.
Annual Report
Notes to Financial Statements - continued
3. Significant Accounting Policies - continued
Security Valuation - continued
Investments in open-end mutual funds, including the Fidelity Central Funds, are valued at their closing net asset value each business day and are categorized as Level 1 in the hierarchy.
Foreign Currency. The Fund uses foreign currency contracts to facilitate transactions in foreign-denominated securities. Gains and losses from these transactions may arise from changes in the value of the foreign currency or if the counterparties do not perform under the contracts' terms.
Foreign-denominated assets, including investment securities, and liabilities are translated into U.S. dollars at the exchange rate at period end. Purchases and sales of investment securities, income and dividends received and expenses denominated in foreign currencies are translated into U.S. dollars at the exchange rate in effect on the transaction date.
The effects of exchange rate fluctuations on investments are included with the net realized and unrealized gain (loss) on investment securities. Other foreign currency transactions resulting in realized and unrealized gain (loss) are disclosed separately.
Investment Transactions and Income. For financial reporting purposes, the Fund's investment holdings and NAV include trades executed through the end of the last business day of the period. The NAV per share for processing shareholder transactions is calculated as of the close of business of the New York Stock Exchange (NYSE), normally 4:00 p.m. Eastern time and includes trades executed through the end of the prior business day. Gains and losses on securities sold are determined on the basis of identified cost and may include proceeds received from litigation. Dividend income is recorded on the ex-dividend date, except for certain dividends from foreign securities where the ex-dividend date may have passed, which are recorded as soon as the Fund is informed of the ex-dividend date. Non-cash dividends included in dividend income, if any, are recorded at the fair market value of the securities received. Distributions received on securities that represent a return of capital or capital gain are recorded as a reduction of cost of investments and/or as a realized gain. The Fund estimates the components of distributions received that may be considered return of capital distributions or capital gain distributions. Large, non-recurring dividends recognized by the Fund are presented separately on the Statement of Operations as "Special Dividends" and the impact of these dividends is presented in the Financial Highlights. Interest income and distributions from the Fidelity Central Funds are accrued as earned. Interest income includes coupon interest and amortization of premium and accretion of discount on debt securities. Investment income is recorded net of foreign taxes withheld where recovery of such taxes is uncertain.
Expenses. Expenses directly attributable to a fund are charged to that fund. Expenses attributable to more than one fund are allocated among the respective funds on the basis of relative net assets or other appropriate methods. Expense estimates are accrued in the period to which they relate and adjustments are made when actual amounts are known.
Income Tax Information and Distributions to Shareholders. Each year the Fund intends to qualify as a regulated investment company, including distributing substantially all of its taxable income and realized gains under Subchapter M of the Internal Revenue Code and filing its U.S. federal tax return. As a result, no provision for income taxes is required. As of December 31, 2010, the Fund did not have any unrecognized tax benefits in the accompanying financial statements. A fund's federal tax return is subject to examination by the Internal Revenue Service (IRS) for a period of three years. Foreign taxes are provided for based on the Fund's understanding of the tax rules and rates that exist in the foreign markets in which it invests. The Fund is subject to a tax imposed on realized short term capital gains on securities of certain issuers domiciled in India. An estimated deferred tax liability for net unrealized gains on these securities is included in Other payables and accrued expenses on the Statement of Assets & Liabilities.
Distributions are declared and recorded on the ex-dividend date. Income dividends and capital gain distributions are declared separately for each class. Income and capital gain distributions are determined in accordance with income tax regulations, which may differ from GAAP.
Capital accounts within the financial statements are adjusted for permanent book-tax differences. These adjustments have no impact on net assets or the results of operations. Temporary book-tax differences will reverse in a subsequent period.
Book-tax differences are primarily due to foreign currency transactions, passive foreign investment companies (PFIC), capital loss carryforwards, and losses deferred due to wash sales.
The federal tax cost of investment securities and unrealized appreciation (depreciation) as of period end were as follows:
Gross unrealized appreciation | $ 20,696,726 |
Gross unrealized depreciation | (3,265,950) |
Net unrealized appreciation (depreciation) | $ 17,430,776 |
| |
Tax Cost | $ 90,270,716 |
Annual Report
3. Significant Accounting Policies - continued
Income Tax Information and Distributions to Shareholders - continued
The tax-based components of distributable earnings as of period end were as follows:
Capital loss carryforward | $ (3,798,653) |
Net unrealized appreciation (depreciation) | $ 17,430,596 |
The tax character of distributions paid was as follows:
| December 31, 2010 | December 31, 2009 |
Ordinary Income | $ 1,618,555 | $ 512,074 |
Trading (Redemption) Fees. Shares held by investors less than 60 days are subject to a redemption fee equal to 1% of the net asset value of shares redeemed. All redemption fees, which reduce the proceeds of the shareholder redemption, are retained by the Fund and accounted for as an addition to paid in capital.
4. Purchases and Sales of Investments.
Purchases and sales of securities other than short-term securities, aggregated $91,040,448 and $77,714,872, respectively.
5. Fees and Other Transactions with Affiliates.
Management Fee. FMR and its affiliates provide the Fund with investment management related services for which the Fund pays a monthly management fee. The management fee is the sum of an individual fund fee rate that is based on an annual rate of .30% of the Fund's average net assets and a group fee rate that averaged .26% during the period. The group fee rate is based upon the average net assets of all the mutual funds advised by FMR. The group fee rate decreases as assets under management increase and increases as assets under management decrease. For the period, the total annual management fee rate was .56% of the Fund's average net assets.
Transfer Agent Fees. Fidelity Investments Institutional Operations Company, Inc. (FIIOC), an affiliate of FMR, is the Fund's transfer, dividend disbursing, and shareholder servicing agent. FIIOC receives an asset-based fee with respect to each class. Each class (with the exception of Investor Class) pays a transfer agent fee, excluding out of pocket expenses, equal to an annual rate of .07% of average net assets. Investor Class pays a monthly asset-based transfer agent fee of .15% of average net assets. In addition, FIIOC receives an asset-based fee of .01% of average net assets for typesetting, printing and mailing of shareholder reports, except proxy statements. FIIOC has agreed to voluntarily waive this fee until December 31, 2010. (See Note 8: Expense Reductions.) For the period, transfer agent fees for each class, including printing and out of pocket expenses, were as follows:
Initial Class | 27,896 |
Investor Class | 61,336 |
| $ 89,232 |
Accounting and Security Lending Fees. Fidelity Service Company, Inc. (FSC), an affiliate of FMR, maintains the Fund's accounting records. The accounting fee is based on the level of average net assets for the month. Under a separate contract, FSC administers the security lending program. The security lending fee is based on the number and duration of lending transactions.
Brokerage Commissions. The Fund placed a portion of its portfolio transactions with brokerage firms which are affiliates of the investment adviser. The commissions paid to these affiliated firms were $1,784 for the period.
6. Committed Line of Credit.
The Fund participates with other funds managed by FMR or an affiliate in a $3.75 billion credit facility (the "line of credit") to be utilized for temporary or emergency purposes to fund shareholder redemptions or for other short-term liquidity purposes. The Fund has agreed to pay commitment fees on its pro-rata portion of the line of credit, which amounted to $259 and is reflected in Miscellaneous expenses on the Statement of Operations. During the period, there were no borrowings on this line of credit.
Annual Report
Notes to Financial Statements - continued
7. Security Lending.
The Fund lends portfolio securities through a lending agent from time to time in order to earn additional income. The lending agent may loan securities to certain qualified borrowers, including Fidelity Capital Markets (FCM), a broker-dealer affiliated with the Fund. On the settlement date of the loan, the Fund receives collateral (in the form of U.S. Treasury obligations, letters of credit and/or cash) against the loaned securities and maintains collateral in an amount not less than 100% of the market value of the loaned securities during the period of the loan. The market value of the loaned securities is determined at the close of business of the Fund and any additional required collateral is delivered to the Fund on the next business day. If the borrower defaults on its obligation to return the securities loaned because of insolvency or other reasons, a fund could experience delays and costs in recovering the securities loaned or in gaining access to the collateral. Any cash collateral received is invested in the Fidelity Securities Lending Cash Central Fund. The value of loaned securities and cash collateral at period end are disclosed on the Fund's Statement of Assets and Liabilities. Security lending income represents the income earned on investing cash collateral, less rebates paid to borrowers and lending agent fees associated with the loan, plus any premium payments received for lending certain types of securities. Security lending income is presented in the Statement of Operations as a component of income from Fidelity Central Funds. Total security lending income during the period amounted to $2,948. During the period, there were no securities loaned to FCM.
8. Expense Reductions.
FMR or its affiliates agreed to waive certain fees during the period as noted in the table below.
Initial Class | $ 2,317 |
Investor Class | 2,675 |
| $ 4,992 |
Many of the brokers with whom FMR places trades on behalf of the Fund provided services to the Fund in addition to trade execution. These services included payments of certain expenses on behalf of the Fund totaling $8,430 for the period.
9. Distributions to Shareholders.
Distributions to shareholders of each class were as follows:
Years ended December 31, | 2010 | 2009 |
From net investment income | | |
Initial Class | 768,995 | 246,700 |
Investor Class | 828,136 | 265,374 |
Total | $ 1,597,131 | $ 512,074 |
From net realized gain | | |
Initial Class | 9,884 | - |
Investor Class | 11,540 | - |
Total | $ 21,424 | $ - |
10. Share Transactions.
Transactions for each class of shares were as follows:
| Shares | Dollars |
Years ended December 31, | 2010 | 2009 | 2010 | 2009 |
Initial Class | | | | |
Shares sold | 1,674,640 | 2,411,066 | $ 19,438,449 | $ 19,464,964 |
Reinvestment of distributions | 61,964 | 24,695 | 778,878 | 246,700 |
Shares redeemed | (1,510,202) | (816,551) | (15,253,448) | (5,916,524) |
Net increase (decrease) | 226,402 | 1,619,210 | $ 4,963,879 | $ 13,795,140 |
Investor Class | | | | |
Shares sold | 2,259,987 | 2,970,858 | $ 26,397,630 | $ 25,184,648 |
Reinvestment of distributions | 66,823 | 26,564 | 839,676 | 265,374 |
Shares redeemed | (1,763,634) | (586,859) | (17,743,111) | (4,419,407) |
Net increase (decrease) | 563,176 | 2,410,563 | $ 9,494,195 | $ 21,030,615 |
Annual Report
11. Other.
The Fund's organizational documents provide former and current trustees and officers with a limited indemnification against liabilities arising in connection with the performance of their duties to the Fund. In the normal course of business, the Fund may also enter into contracts that provide general indemnifications. The Fund's maximum exposure under these arrangements is unknown as this would be dependent on future claims that may be made against the Fund. The risk of material loss from such claims is considered remote.
At the end of the period, FMR or its affiliates were the owners of record of 100% of the total outstanding shares of the fund.
Annual Report
Report of Independent Registered Public Accounting Firm
To the Trustees of Variable Insurance Products Fund IV and the Shareholders of VIP Materials Portfolio:
In our opinion, the accompanying statement of assets and liabilities, including the schedule of investments, and the related statements of operations and of changes in net assets and the financial highlights present fairly, in all material respects, the financial position of VIP Materials Portfolio (a fund of Variable Insurance Products Fund IV) at December 31, 2010, the results of its operations for the year then ended, the changes in its net assets for each of the two years in the period then ended and the financial highlights for each of the periods indicated, in conformity with accounting principles generally accepted in the United States of America. These financial statements and financial highlights (hereafter referred to as "financial statements") are the responsibility of the VIP Materials Portfolio's management. Our responsibility is to express an opinion on these financial statements based on our audits. We conducted our audits of these financial statements in accordance with the standards of the Public Company Accounting Oversight Board (United States). Those standards require that we plan and perform the audit to obtain reasonable assurance about whether the financial statements are free of material misstatement. An audit includes examining, on a test basis, evidence supporting the amounts and disclosures in the financial statements, assessing the accounting principles used and significant estimates made by management, and evaluating the overall financial statement presentation. We believe that our audits, which included confirmation of securities at December 31, 2010 by correspondence with the custodian and brokers, provide a reasonable basis for our opinion.
/s/ PricewaterhouseCoopers LLP
PricewaterhouseCoopers LLP
Boston, Massachusetts
February 17, 2011
Annual Report
The Trustees, Members of the Advisory Board, and executive officers of the trust and fund, as applicable, are listed below. The Board of Trustees governs the fund and is responsible for protecting the interests of shareholders. The Trustees are experienced executives who meet periodically throughout the year to oversee the fund's activities, review contractual arrangements with companies that provide services to the fund, oversee management of the risks associated with such activities and contractual arrangements, and review the fund's performance. Except for James C. Curvey, each of the Trustees oversees 219 funds advised by FMR or an affiliate. Mr. Curvey oversees 408 funds advised by FMR or an affiliate.
The Trustees hold office without limit in time except that (a) any Trustee may resign; (b) any Trustee may be removed by written instrument, signed by at least two-thirds of the number of Trustees prior to such removal; (c) any Trustee who requests to be retired or who has become incapacitated by illness or injury may be retired by written instrument signed by a majority of the other Trustees; and (d) any Trustee may be removed at any special meeting of shareholders by a two-thirds vote of the outstanding voting securities of the trust. Each Trustee who is not an interested person (as defined in the 1940 Act) (Independent Trustee), shall retire not later than the last day of the calendar year in which his or her 72nd birthday occurs. The Independent Trustees may waive this mandatory retirement age policy with respect to individual Trustees. The executive officers and Advisory Board Member hold office without limit in time, except that any officer and Advisory Board Members may resign or may be removed by a vote of a majority of the Trustees at any regular meeting or any special meeting of the Trustees. Except as indicated, each individual has held the office shown or other offices in the same company for the past five years.
Experience, Skills, Attributes, and Qualifications of the Fund's Trustees. The Governance and Nominating Committee has adopted a statement of policy that describes the experience, qualifications, attributes, and skills that are necessary and desirable for potential Independent Trustee candidates (Statement of Policy). The Board believes that each Trustee satisfied at the time he or she was initially elected or appointed a Trustee, and continues to satisfy, the standards contemplated by the Statement of Policy. The Governance and Nominating Committee also engages professional search firms to help identify potential Independent Trustee candidates who have the experience, qualifications, attributes, and skills consistent with the Statement of Policy. From time to time, additional criteria based on the composition and skills of the current Independent Trustees, as well as experience or skills that may be appropriate in light of future changes to board composition, business conditions, and regulatory or other developments, have also been considered by the professional search firms and the Governance and Nominating Committee. In addition, the Board takes into account the Trustees' commitment and participation in Board and committee meetings, as well as their leadership of standing and ad hoc committees throughout their tenure.
In determining that a particular Trustee was and continues to be qualified to serve as a Trustee, the Board has considered a variety of criteria, none of which, in isolation, was controlling. The Board believes that, collectively, the Trustees have balanced and diverse experience, qualifications, attributes, and skills, which allow the Board to operate effectively in governing the fund and protecting the interests of shareholders. Information about the specific experience, skills, attributes, and qualifications of each Trustee, which in each case led to the Board's conclusion that the Trustee should serve (or continue to serve) as a trustee of the fund, is provided below.
Board Structure and Oversight Function. James C. Curvey is an interested person (as defined in the 1940 Act) and currently serves as Acting Chairman. The Trustees have determined that an interested Chairman is appropriate and benefits shareholders because an interested Chairman has a personal and professional stake in the quality and continuity of services provided to the fund. Independent Trustees exercise their informed business judgment to appoint an individual of their choosing to serve as Chairman, regardless of whether the Trustee happens to be independent or a member of management. The Independent Trustees have determined that they can act independently and effectively without having an Independent Trustee serve as Chairman and that a key structural component for assuring that they are in a position to do so is for the Independent Trustees to constitute a substantial majority for the Board. The Independent Trustees also regularly meet in executive session. Ned C. Lautenbach serves as Chairman of the Independent Trustees and as such (i) acts as a liaison between the Independent Trustees and management with respect to matters important to the Independent Trustees and (ii) with management prepares agendas for Board meetings.
Fidelity funds are overseen by different Boards of Trustees. The fund's Board oversees Fidelity's equity and high income funds and another Board oversees Fidelity's investment-grade bond, money market, and asset allocation funds. The asset allocation funds may invest in Fidelity funds overseen by the fund's Board. The use of separate Boards, each with its own committee structure, allows the Trustees of each group of Fidelity funds to focus on the unique issues of the funds they oversee, including common research, investment, and operational issues. On occasion, the separate Boards establish joint committees to address issues of overlapping consequences for the Fidelity funds overseen by each Board.
The Trustees operate using a system of committees to facilitate the timely and efficient consideration of all matters of importance to the Trustees, the fund, and fund shareholders and to facilitate compliance with legal and regulatory requirements and oversight of the fund's activities and associated risks. The Board, acting through its committees, has charged FMR and its affiliates with (i) identifying events or circumstances the occurrence of which could have demonstrably adverse effects on the fund's business and/or reputation; (ii) implementing processes and controls to lessen the possibility that such events or circumstances occur or to mitigate the effects of such events or circumstances if they do occur; and (iii) creating and maintaining a system designed to evaluate continuously business and market conditions in order to facilitate the identification and implementation processes described in (i) and (ii) above. Because the day-to-day operations and activities of the fund are carried out by or through FMR, its affiliates and other service providers, the fund's exposure to risks is mitigated but not eliminated by the processes overseen by the Trustees. While each of the Board's committees has responsibility for overseeing different aspects of the fund's activities, oversight is exercised primarily through the Operations, Audit, and Compliance Committees. Appropriate personnel, including but not limited to the fund's Chief Compliance Officer (CCO), FMR's internal auditor, the independent accountants, the fund's Treasurer and portfolio management personnel, make periodic reports to the Board's committees, as appropriate. The responsibilities of each committee, including their oversight responsibilities, are described further under "Standing Committees of the Fund's Trustees."
Annual Report
The fund's Statement of Additional Information (SAI) includes more information about the Trustees. To request a free copy, call Fidelity at 1-877-208-0098.
Interested Trustees*:
Correspondence intended for each Trustee who is an interested person may be sent to Fidelity Investments, 82 Devonshire Street, Boston, Massachusetts 02109.
Name, Age; Principal Occupations and Other Relevant Experience+ |
James C. Curvey (75) |
| Year of Election or Appointment: 2007 Mr. Curvey is Trustee and Acting Chairman of the Board of Trustees of certain Trusts. Mr. Curvey also serves as Trustee (2007-present) of other investment companies advised by FMR. Mr. Curvey is a Director of Fidelity Investments Money Management, Inc. (2009-present), Director of Fidelity Research & Analysis Co. (2009-present) and Director of FMR and FMR Co., Inc. (2007-present). Mr. Curvey is also Vice Chairman (2007-present) and Director of FMR LLC. In addition, Mr. Curvey serves as an Overseer for the Boston Symphony Orchestra and a member of the Trustees of Villanova University. Previously, Mr. Curvey was the Vice Chairman (2006-2007) and Director (2000-2007) of FMR Corp. |
Ronald P. O'Hanley (54) |
| Year of Election or Appointment: 2011 Mr. O'Hanley is President of Fidelity Asset Management and Corporate Services and a member of Fidelity's Executive Committee (2010-present). Previously, Mr. O'Hanley served as President and Chief Executive Officer of BNY Mellon Asset Management (2007-2010). Mr. O'Hanley also served as Vice Chairman of Bank New York Mellon Corp. and a member of that firm's Executive Committee. Prior to the 2007 merger of The Bank of New York and Mellon Financial Corporation, he was Vice Chairman of Mellon Financial Corporation and President and Chief Executive Officer of Mellon Asset Management. He joined Mellon in February 1997. Mr. O'Hanley currently serves as Chairman of the Boston Public Library Foundation Board of Directors and sits on the Board of Directors of Beth Israel Deaconess Medical Center, the Board of Trustees of the Marine Biological Laboratory and the Advisory Board of the Maxwell School of Citizenship and Public Administration at Syracuse University. Mr. O'Hanley also chairs the Council on Asset Management for the Financial Services Roundtable and is a member of the Board of Directors of Institutional Investor's U.S. Institute. |
* Trustees have been determined to be "Interested Trustees" by virtue of, among other things, their affiliation with the trust or various entities under common control with FMR.
+ The information above includes each Trustee's principal occupation during the last five years and other information relating to the experience, attributes, and skills relevant to each Trustee's qualifications to serve as a Trustee, which led to the conclusion that each Trustee should serve as a Trustee for the fund.
Independent Trustees:
Correspondence intended for each Independent Trustee (that is, the Trustees other than the Interested Trustees) may be sent to Fidelity Investments, P.O. Box 55235, Boston, Massachusetts 02205-5235.
Name, Age; Principal Occupations and Other Relevant Experience+ |
Dennis J. Dirks (62) |
| Year of Election or Appointment: 2005 Prior to his retirement in May 2003, Mr. Dirks was Chief Operating Officer and a member of the Board of The Depository Trust & Clearing Corporation (DTCC). He also served as President, Chief Operating Officer, and Board member of The Depository Trust Company (DTC) and President and Board member of the National Securities Clearing Corporation (NSCC). In addition, Mr. Dirks served as Chief Executive Officer and Board member of the Government Securities Clearing Corporation, Chief Executive Officer and Board member of the Mortgage-Backed Securities Clearing Corporation, as a Trustee and a member of the Finance Committee of Manhattan College (2005-2008), and as a Trustee and a member of the Finance Committee of AHRC of Nassau County (2006-2008). Mr. Dirks is a member of the Independent Directors Council (IDC) Governing Council (2010-Present) and Board of Directors for The Brookville Center for Children's Services, Inc. (2009-present). |
Alan J. Lacy (57) |
| Year of Election or Appointment: 2008 Mr. Lacy serves as Senior Adviser (2007-present) of Oak Hill Capital Partners, L.P. (private equity). Mr. Lacy also served as Chief Executive Officer (2000-2005) and Vice Chairman (2005-2006) of Sears Holdings Corporation and Sears, Roebuck and Co. (retail). In addition, Mr. Lacy serves as a member of the Board of Directors of The Western Union Company (global money transfer, 2006-present) and Bristol-Myers Squibb Company (global pharmaceuticals, 2007-present). Mr. Lacy is Chairman (2008-present) and a member (2006-present) of the Board of Trustees of The National Parks Conservation Association. |
Ned C. Lautenbach (66) |
| Year of Election or Appointment: 2000 Mr. Lautenbach is Chairman of the Independent Trustees of the Equity and High Income Funds (2006-present). Mr. Lautenbach currently serves as the Lead Director of the Eaton Corporation Board of Directors (diversified industrial, 1997-present). Mr. Lautenbach is also a member of the Board of Directors of the Philharmonic Center for the Arts in Naples, Florida (1999-present); a member of the Board of Trustees of Fairfield University (2005-present); and a member of the Council on Foreign Relations (1994-present). Previously, Mr. Lautenbach was a Partner/Advisory Partner at Clayton, Dubilier & Rice, Inc. (private equity investment, 1998-2010), as well as a Director of Sony Corporation (2006-2007). |
Joseph Mauriello (66) |
| Year of Election or Appointment: 2008 Prior to his retirement in January 2006, Mr. Mauriello served in numerous senior management positions including Deputy Chairman and Chief Operating Officer (2004-2005), and Vice Chairman of Financial Services (2002-2004) of KPMG LLP US (professional services, 1965-2005). Mr. Mauriello currently serves as a member of the Board of Directors of XL Group plc. (global insurance and re-insurance, 2006-present) and of Arcadia Resources Inc. (health care services and products, 2007-present). Previously, Mr. Mauriello served as a Director of the Hamilton Funds of the Bank of New York (2006-2007). |
Cornelia M. Small (66) |
| Year of Election or Appointment: 2005 Ms. Small is a member of the Board of Directors of the Teagle Foundation (2009-present). Ms. Small is also a member of the Investment Committee, and Chair (2008-present) and a member of the Board of Trustees of Smith College. In addition, Ms. Small serves on the Investment Committee of the Berkshire Taconic Community Foundation (2008-present). Previously, Ms. Small served as Chairperson of the Investment Committee (2002-2008) of Smith College. In addition, Ms. Small served as Chief Investment Officer, Director of Global Equity Investments, and a member of the Board of Directors of Scudder, Stevens & Clark and Scudder Kemper Investments. |
William S. Stavropoulos (71) |
| Year of Election or Appointment: 2001 Mr. Stavropoulos is Vice Chairman of the Independent Trustees of the Equity and High Income Funds (2006-present). Mr. Stavropoulos serves as President and Founder of the Michigan Baseball Foundation, the Great Lakes Loons (2007-present). Mr. Stavropoulos is Chairman Emeritus of the Board of Directors of The Dow Chemical Company, where he previously served in numerous senior management positions, including President, CEO (1995-2000; 2002-2004), Chairman of the Executive Committee (2000-2006), and as a member of the Board of Directors (1990-2006). Currently, Mr. Stavropoulos is Chairman of Univar (global distributor of commodity and specialty chemicals, 2010-present), a Director of Teradata Corporation (data warehousing and technology solutions, 2008-present), Chemical Financial Corporation, Maersk Inc. (industrial conglomerate), Tyco International, Inc. (multinational manufacturing and services, 2007-present), and a member of the Advisory Board for Metalmark Capital (private equity investment, 2005-present). Mr. Stavropoulos is a special advisor to Clayton, Dubilier & Rice, LLC (private equity investment). In addition, Mr. Stavropoulos is a member of the University of Notre Dame Advisory Council for the College of Science. |
David M. Thomas (61) |
| Year of Election or Appointment: 2008 Previously, Mr. Thomas served as Executive Chairman (2005-2006) and Chairman and Chief Executive Officer (2000-2005) of IMS Health, Inc. (pharmaceutical and healthcare information solutions). In addition, Mr. Thomas serves as a member of the Board of Directors of Fortune Brands, Inc. (consumer products), and Interpublic Group of Companies, Inc. (marketing communication, 2004-present). |
Michael E. Wiley (60) |
| Year of Election or Appointment: 2008 Mr. Wiley also serves as a Director of Asia Pacific Exploration Consolidated (international oil and gas exploration and production, 2008-present). Mr. Wiley serves as a Director of Tesoro Corporation (independent oil refiner and marketer, 2005-present), and a Director of Bill Barrett Corporation (exploration and production, 2005-present). In addition, Mr. Wiley also serves as a Director of Post Oak Bank (privately-held bank, 2004-present). Previously, Mr. Wiley served as a member of the Board of Trustees of the University of Tulsa (2000-2006; 2007-2010), as a Senior Energy Advisor of Katzenbach Partners, LLC (consulting, 2006-2007), as an Advisory Director of Riverstone Holdings (private investment), Chairman, President, and CEO of Baker Hughes, Inc. (oilfield services, 2000-2004), and as Director of Spinnaker Exploration Company (exploration and production, 2001-2005). |
+ The information above includes each Trustee's principal occupation during the last five years and other information relating to the experience, attributes, and skills relevant to each Trustee's qualifications to serve as a Trustee, which led to the conclusion that each Trustee should serve as a Trustee for the fund.
Advisory Board Members and Executive Officers:
Correspondence intended for each executive officer, Edward C. Johnson 3d, and Peter S. Lynch may be sent to Fidelity Investments, 82 Devonshire Street, Boston, Massachusetts 02109.
Name, Age; Principal Occupation |
Edward C. Johnson 3d (80) |
| Year of Election or Appointment: 2011 Member of the Advisory Board of Fidelity's Equity and High Income Funds. Formerly Trustee and Chairman of the Board of Trustees of certain Trusts, Mr. Johnson serves as Chief Executive Officer, Chairman, and a Director of FMR LLC; Chairman and a Director of FMR; and Chairman and a Director of FMR Co., Inc. In addition, Mr. Johnson serves as Chairman and Director of FIL Limited. Previously, Mr. Johnson served as President of FMR LLC (2006-2007). |
Peter S. Lynch (66) |
| Year of Election or Appointment: 2003 Member of the Advisory Board of Fidelity's Equity and High Income Funds. Mr. Lynch is Vice Chairman and a Director of FMR and FMR Co., Inc. In addition, Mr. Lynch serves as a Trustee of Boston College and as the Chairman of the Inner-City Scholarship Fund. Previously, Mr. Lynch served on the Special Olympics International Board of Directors (1997-2006). |
Kenneth B. Robins (41) |
| Year of Election or Appointment: 2008 President and Treasurer of Fidelity's Equity and High Income Funds. Mr. Robins also serves as President and Treasurer (2010-present) and Assistant Treasurer (2009-present) of other Fidelity funds and is an employee of Fidelity Investments (2004-present). Previously, Mr. Robins served as Deputy Treasurer of the Fidelity funds (2005-2008) and Treasurer and Chief Financial Officer of The North Carolina Capital Management Trust: Cash and Term Portfolios (2006-2008). |
Brian B. Hogan (46) |
| Year of Election or Appointment: 2009 Vice President of certain Equity Funds and Vice President of Sector Funds. Mr. Hogan also serves as President of FMR's Equity Division (2009-present). Previously, Mr. Hogan served as Senior Vice President, Equity Research of FMR (2006-2009) and as a portfolio manager. |
Christopher S. Bartel (39) |
| Year of Election or Appointment: 2009 Vice President of Fidelity's Sector and Real Estate Equity Funds. Mr. Bartel also serves as Senior Vice President of Equity Research (2009-present). Previously, Mr. Bartel served as Managing Director of Research (2006-2009) and an analyst and portfolio manager (2000-2006). |
Scott C. Goebel (42) |
| Year of Election or Appointment: 2008 Secretary and Chief Legal Officer (CLO) of the Fidelity funds. Mr. Goebel also serves as Secretary and CLO of The North Carolina Capital Management Trust: Cash and Term Portfolio (2008-present); General Counsel, Secretary, and Senior Vice President of FMR (2008-present) and FMR Co., Inc. (2008-present); Deputy General Counsel of FMR LLC; Chief Legal Officer of Fidelity Management & Research (Hong Kong) Limited (2008-present) and Assistant Secretary of Fidelity Management & Research (Japan) Inc. (2008-present), Fidelity Investments Money Management, Inc. (2008-present), Fidelity Management & Research (U.K.) Inc. (2008-present), and Fidelity Research and Analysis Company (2008-present). Previously, Mr. Goebel served as Assistant Secretary of the Funds (2007-2008) and as Vice President and Secretary of Fidelity Distributors Corporation (FDC) (2005-2007). |
William C. Coffey (41) |
| Year of Election or Appointment: 2009 Assistant Secretary of Fidelity's Equity and High Income Funds. Mr. Coffey also serves as Senior Vice President and Deputy General Counsel of FMR LLC (2010-present), and is an employee of Fidelity Investments. Previously, Mr. Coffey served as Vice President and Associate General Counsel of FMR LLC (2005-2009). |
Holly C. Laurent (56) |
| Year of Election or Appointment: 2008 Anti-Money Laundering (AML) Officer of the Fidelity funds. Ms. Laurent also serves as AML Officer of The North Carolina Capital Management Trust: Cash and Term Portfolio (2008-present) and is an employee of Fidelity Investments. Previously, Ms. Laurent was Senior Vice President and Head of Legal for Fidelity Business Services India Pvt. Ltd. (2006-2008), and Senior Vice President, Deputy General Counsel and Group Head for FMR LLC (2005-2006). |
Christine Reynolds (52) |
| Year of Election or Appointment: 2008 Chief Financial Officer of the Fidelity funds. Ms. Reynolds became President of Fidelity Pricing and Cash Management Services (FPCMS) in August 2008. Ms. Reynolds served as Chief Operating Officer of FPCMS (2007-2008). Previously, Ms. Reynolds served as President, Treasurer, and Anti-Money Laundering officer of the Fidelity funds (2004-2007). |
Kenneth A. Rathgeber (63) |
| Year of Election or Appointment: 2004 Chief Compliance Officer of Fidelity's Equity and High Income Funds. Mr. Rathgeber is Chief Compliance Officer of Fidelity Management & Research (Hong Kong) Limited (2008-present), Fidelity Management & Research (Japan) Inc. (2008-present), FMR (2005-present), FMR Co., Inc. (2005-present), Fidelity Management & Research (U.K.) Inc. (2005-present), Fidelity Research & Analysis Company (2005-present), Fidelity Investments Money Management, Inc. (2005-present), Pyramis Global Advisors, LLC (2005-present), and Strategic Advisers, Inc. (2005-present). |
Jeffrey S. Christian (49) |
| Year of Election or Appointment: 2009 Deputy Treasurer of the Fidelity funds. Mr. Christian is an employee of Fidelity Investments. Previously, Mr. Christian served as Chief Financial Officer (2008-2009) of certain Fidelity funds and Senior Vice President of Fidelity Pricing and Cash Management Services (FPCMS) (2004-2009). |
Bryan A. Mehrmann (49) |
| Year of Election or Appointment: 2005 Deputy Treasurer of the Fidelity funds. Mr. Mehrmann is an employee of Fidelity Investments. |
Adrien E. Deberghes (43) |
| Year of Election or Appointment: 2008 Deputy Treasurer of Fidelity's Equity and High Income Funds. Mr. Deberghes also serves as Assistant Treasurer of other Fidelity funds (2010-present) and is an employee of Fidelity Investments (2008-present). Previously, Mr. Deberghes served as Senior Vice President of Mutual Fund Administration at State Street Corporation (2007-2008), Senior Director of Mutual Fund Administration at Investors Bank & Trust (2005-2007), and Director of Finance for Dunkin' Brands (2000-2005). |
Stephanie J. Dorsey (41) |
| Year of Election or Appointment: 2010 Assistant Treasurer of Fidelity's Equity and High Income Funds. Ms. Dorsey also serves as Deputy Treasurer of other Fidelity funds (2008-present) and is an employee of Fidelity Investments (2008-present). Previously, Ms. Dorsey served as Treasurer (2004-2008) of the JPMorgan Mutual Funds and Vice President (2004-2008) of JPMorgan Chase Bank. |
John R. Hebble (52) |
| Year of Election or Appointment: 2009 Assistant Treasurer of Fidelity's Equity and High Income Funds. Mr. Hebble also serves as Treasurer and Chief Financial Officer of The North Carolina Capital Management Trust: Cash and Term Portfolio (2008-present), President and Treasurer of other Fidelity funds (2008-present) and is an employee of Fidelity Investments. |
Gary W. Ryan (52) |
| Year of Election or Appointment: 2005 Assistant Treasurer of the Fidelity funds. Mr. Ryan is an employee of Fidelity Investments. Previously, Mr. Ryan served as Vice President of Fund Reporting in Fidelity Pricing and Cash Management Services (FPCMS) (1999-2005). |
Jonathan Davis (42) |
| Year of Election or Appointment: 2010 Assistant Treasurer of the Fidelity funds. Mr. Davis is an employee of Fidelity Investments. Previously, Mr. Davis served as Vice President and Associate General Counsel of FMR LLC (2003-2010). |
Annual Report
Initial Class and Investors Class each designate 100% of each dividend distributed in February and December 2010, respectively during the fiscal year as qualifying for the dividends-received deduction for corporate shareholders.
Annual Report
Board Approval of Investment Advisory Contracts and Management Fees
VIP Materials Portfolio
Each year, the Board of Trustees, including the Independent Trustees (together, the Board), votes on the renewal of the management contract and sub-advisory agreements (together, the Advisory Contracts) for the fund. The Board, assisted by the advice of fund counsel and Independent Trustees' counsel, requests and considers a broad range of information relevant to the renewal of the Advisory Contracts throughout the year.
The Board meets regularly and considers at each of its meetings factors that are relevant to its annual consideration of the renewal of the fund's Advisory Contracts, including the services and support provided to the fund and its shareholders. The Board has established various standing committees, each composed of Independent Trustees with varying backgrounds, to which the Board has assigned specific subject matter responsibilities in order to enhance effective decision-making by the Board. The Board, acting directly and through its Committees, requests and receives information concerning the annual consideration of the renewal of the fund's Advisory Contracts. The Board also meets as needed to consider matters specifically related to the Board's annual consideration of the renewal of Advisory Contracts. Members of the Board may also meet with trustees of other Fidelity funds through ad hoc joint committees to discuss certain matters relevant to the Fidelity funds.
At its July 2010 meeting, the Board of Trustees, including the Independent Trustees, unanimously determined to renew the fund's Advisory Contracts. In reaching its determination, the Board considered all factors it believed relevant, including (i) the nature, extent, and quality of the services to be provided to the fund and its shareholders (including the investment performance of the fund); (ii) the competitiveness of the fund's management fee and total expenses; (iii) the total costs of the services to be provided by and the profits to be realized by Fidelity from its relationship with the fund; (iv) the extent to which economies of scale would be realized as the fund grows; and (v) whether fee levels reflect these economies of scale, if any, for the benefit of fund shareholders.
In considering whether to renew the Advisory Contracts for the fund, the Board reached a determination, with the assistance of fund counsel and Independent Trustees' counsel and through the exercise of its business judgment, that the renewal of the Advisory Contracts is in the best interests of fund shareholders and that the compensation to be received by Fidelity under the management contract is fair and reasonable. The Board's decision to renew the Advisory Contracts was not based on any single factor noted above, but rather was based on a comprehensive consideration of all the information provided to the Board at its meetings throughout the year. The Board, in reaching its determination to renew the Advisory Contracts, is aware that shareholders in the fund have a broad range of investment choices available to them, including a wide choice among mutual funds offered by Fidelity's competitors, and that the fund's shareholders, with the opportunity to review and weigh the disclosure provided by the fund in its prospectus and other public disclosures, have chosen to invest in this fund, managed by Fidelity.
Nature, Extent, and Quality of Services Provided. The Board considered the staffing within the investment adviser, FMR, and the sub-advisers (together, the Investment Advisers), including the backgrounds of the fund's investment personnel and the fund's investment objective and discipline. The Independent Trustees also had discussions with senior management of Fidelity's investment operations and investment groups. The Board considered the structure of the portfolio manager compensation program and whether this structure provides appropriate incentives to act in the best interest of the fund.
Resources Dedicated to Investment Management and Support Services. The Board and the equity research subcommittee of the Board's Fund Oversight Committee reviewed the size, education, and experience of the Investment Advisers' investment staff, their use of technology, and the Investment Advisers' approach to recruiting, training, and retaining portfolio managers and other research, advisory, and management personnel. The Board noted that Fidelity's analysts have access to a variety of technological tools and market and securities data that enable them to perform both fundamental and quantitative analysis and to specialize in various disciplines. The Board considered Fidelity's extensive global research capabilities that enable the Investment Advisers to aggregate data from various sources in an effort to produce positive investment results. The Board also considered that Fidelity's portfolio managers and analysts have access to daily portfolio attribution that allows for monitoring of a fund's portfolio, as well as an electronic communication system that provides immediate real-time access to research concerning issuers and credit enhancers. The Board noted FMR's continued focus on strengthening the organization and discipline of equity portfolio management and research.
Shareholder and Administrative Services. The Board considered (i) the nature, extent, quality, and cost of advisory, administrative, and shareholder services performed by the Investment Advisers and their affiliates under the Advisory Contracts and under separate agreements covering transfer agency, pricing and bookkeeping, and securities lending services for the fund; (ii) the nature and extent of the investment adviser's supervision of third party service providers, principally custodians and subcustodians; and (iii) the resources devoted to, and the record of compliance with, the fund's compliance policies and procedures. The Board also reviewed the allocation of fund brokerage, including allocations to brokers affiliated with the Investment Advisers, the use of brokerage commissions to pay fund expenses, and the use of "soft" commission dollars to pay for research services.
The Board noted that the growth of fund assets over time across the complex allows Fidelity to reinvest in the development of services designed to enhance the value or convenience of the Fidelity funds as investment vehicles. These services include 24-hour access to account information and market information through phone representatives and over the Internet, and investor education materials and asset allocation tools.
Investment in a Large Fund Family. The Board considered the benefits to shareholders of investing in a Fidelity fund, including the benefits of investing in a fund that is part of a large family of funds offering a variety of investment disciplines and providing a large variety of mutual fund investor services. The Board noted that Fidelity had taken, or had made recommendations that resulted in the Fidelity funds taking, a number of actions over the previous year that benefited particular funds, including (i) dedicating additional resources to investment research and restructuring and broadening the focus of the investment research teams; (ii) bolstering the senior management team that oversees asset management; (iii) launching Class F of certain funds as a lower-fee class available to Freedom K and Freedom Index Funds; (iv) lowering the initial investment minimums and ongoing balance requirements for Real Estate High Income Fund; (v) eliminating subsequent purchase minimums for all funds and adding a waiver of the investment minimum requirement for new accounts opened with the proceeds of a systematic withdrawal plan; (vi) eliminating the withdrawal minimum and maximum limits for systematic withdrawals from Advisor funds; (vii) expanding sales load waivers on Class A shares for Destiny Planholders and expanding Institutional Class eligibility for Class O Destiny Planholders; and (viii) changing certain Class A and Class T sales charge structures to further align them with industry practices.
Annual Report
Board Approval of Investment Advisory Contracts and Management Fees - continued
Investment Performance. The Board considered whether the fund has operated in accordance with its investment objective, as well as its record of compliance with its investment restrictions. It also reviewed the fund's absolute investment performance for each class, as well as the fund's relative investment performance for each class measured against a third-party-sponsored index that reflects the market sector in which the fund invests. The Board noted that FMR does not believe that a meaningful peer group exists against which to compare the fund's performance. Because the fund had been in existence less than three calendar years, the following chart considered by the Board shows, for the one-year period ended December 31, 2009, the total returns of Initial Class and Investor Class of the fund and the total return of a third-party-sponsored index ("benchmark").
VIP Materials Portfolio
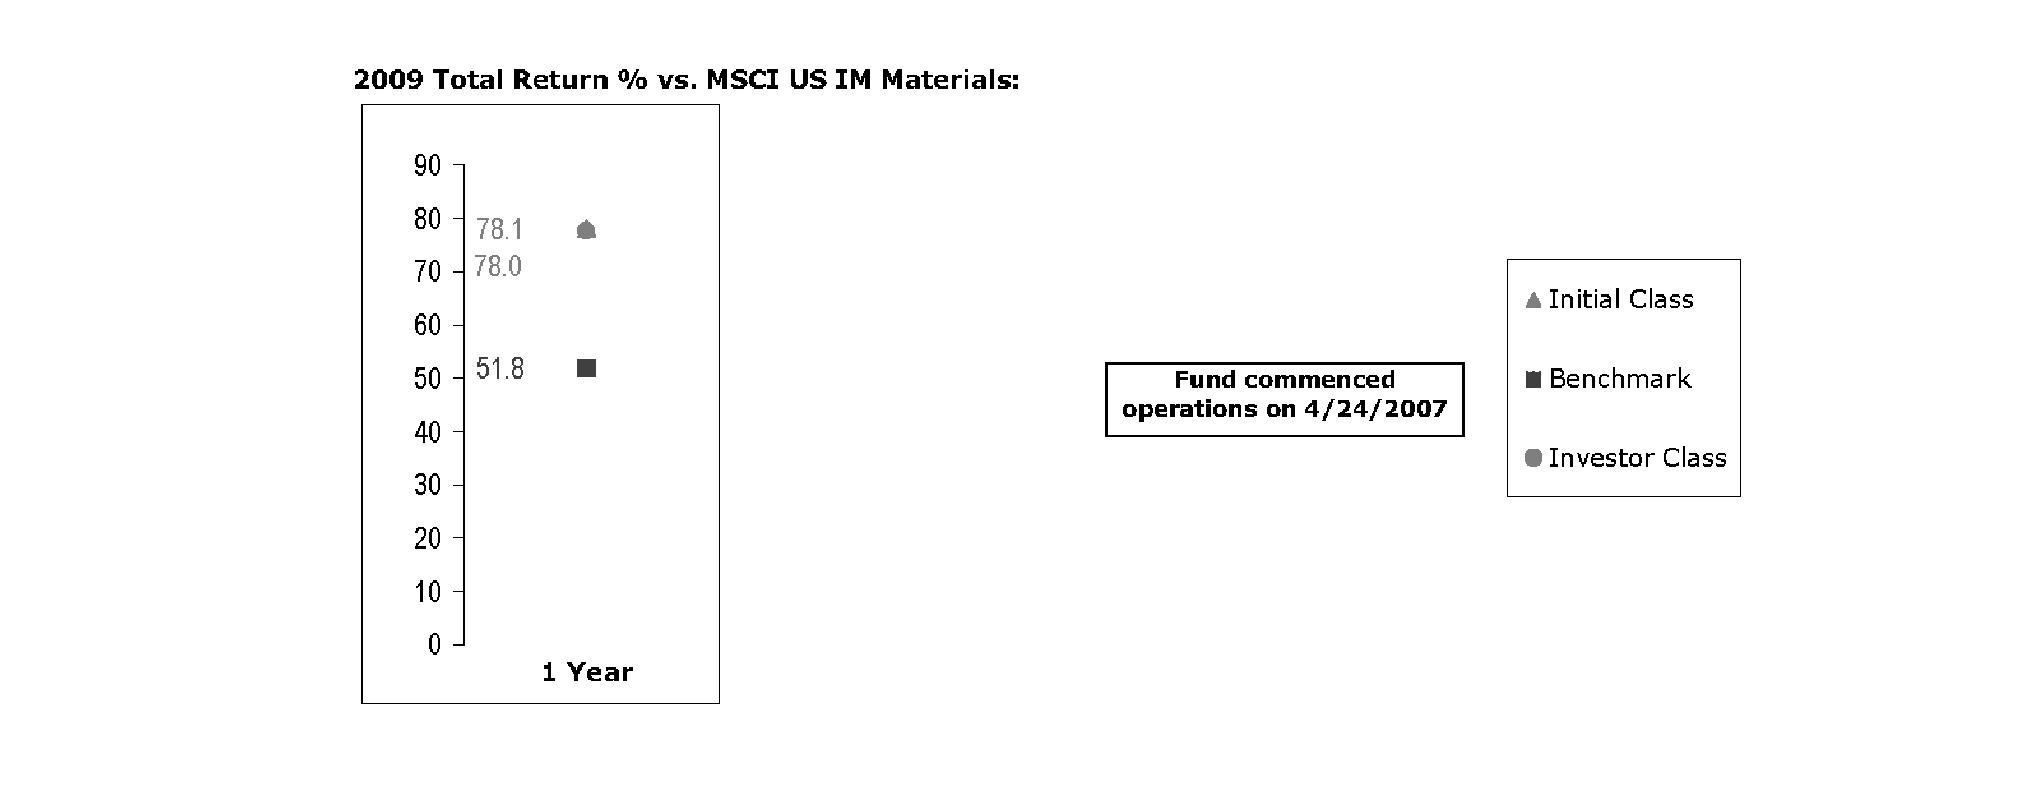
The Board noted that the investment performance of Initial Class of the fund compared favorably to its benchmark for the period shown. The Board considered that the variations in performance between the fund's classes reflect the variations in class expenses, which result in lower performance for the higher expense class. The Board also reviewed the fund's performance since inception as well as performance in the current year. The Board noted that it is difficult to evaluate in any comprehensive fashion the performance of the fund, in light of its relatively recent commencement of operations.
Based on its review, and giving particular weight to the nature and quality of the resources dedicated by the Investment Advisers to maintain and improve relative performance and factoring in the unprecedented market events in recent years, the Board concluded that the nature, extent, and quality of investment management and support services and of shareholder and administrative services provided to the fund will benefit the fund's shareholders, particularly in light of the Board's view that the fund's shareholders benefit from investing in a fund that is part of a large family of funds offering a variety of investment disciplines and services.
Competitiveness of Management Fee and Total Fund Expenses. The Board considered the fund's management fee and total expenses compared to "mapped groups" of competitive funds and classes. Fidelity creates "mapped groups" by combining similar Lipper investment objective categories that have comparable management fee characteristics. Combining Lipper investment objective categories aids the Board's management fee and total expense comparisons by broadening the competitive group used for comparison and by reducing the number of universes to which various Fidelity funds are compared.
Management Fee. The Board considered two proprietary management fee comparisons for the 12-month (or shorter) periods shown in the chart below. The group of Lipper funds used by the Board for management fee comparisons is referred to below as the "Total Mapped Group." The Total Mapped Group comparison focuses on a fund's standing relative to the total universe of comparable funds available to investors, in terms of gross management fees before expense reimbursements or caps. "TMG %" represents the percentage of funds in the Total Mapped Group that had management fees that were lower than the fund's. For example, a TMG % of 3% means that 97% of the funds in the Total Mapped Group had higher management fees than the fund. The "Asset-Size Peer Group" (ASPG) comparison focuses on a fund's standing relative to non-Fidelity funds similar in size to the fund within the Total Mapped Group. The ASPG represents at least 15% of the funds in the Total Mapped Group with comparable asset size and management fee characteristics, subject to a minimum of 50 funds (or all funds in the Total Mapped Group if fewer than 50). Additional information, such as the ASPG quartile in which the fund's management fee ranked, is also included in the chart and considered by the Board.
Annual Report
VIP Materials Portfolio
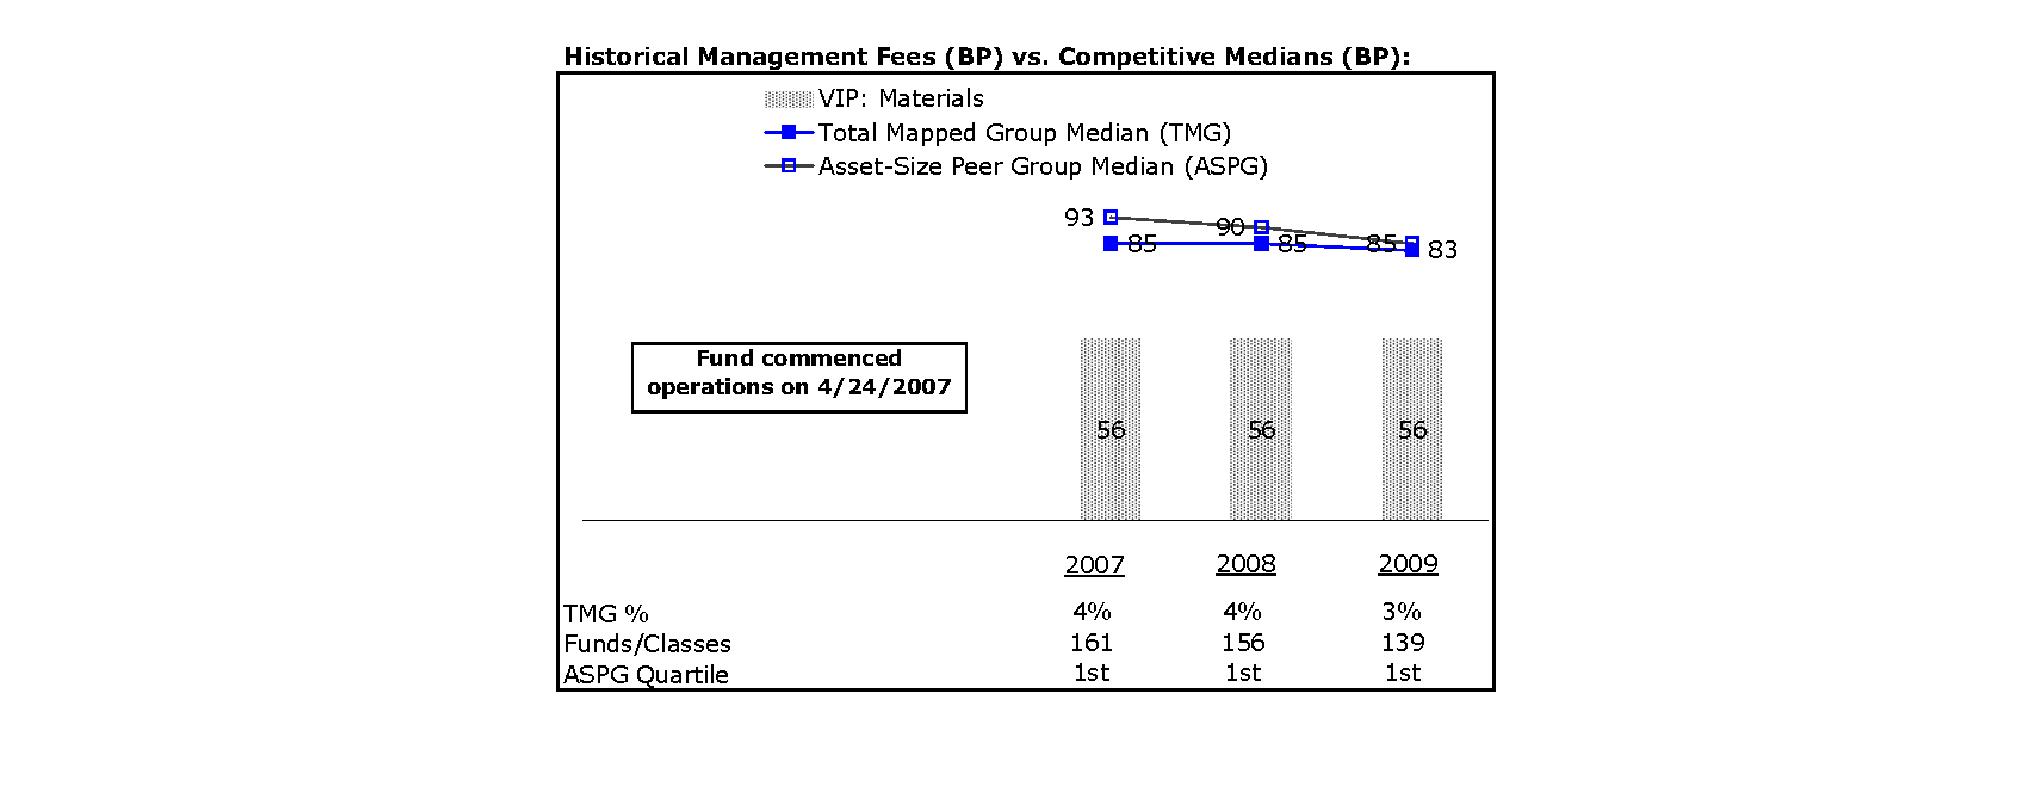
The Board noted that the fund's management fee ranked below the median of its Total Mapped Group and below the median of its ASPG for 2009.
Based on its review, the Board concluded that the fund's management fee is fair and reasonable in light of the services that the fund receives and the other factors considered.
Total Expenses. In its review of each class's total expenses, the Board considered the fund's management fee as well as other fund or class expenses, as applicable, such as transfer agent fees, pricing and bookkeeping fees, and custodial, legal, and audit fees. The Board also noted the effects of any waivers and reimbursements on fees and expenses. As part of its review, the Board also considered current and historical total expenses of each class of the fund compared to competitive fund median expenses. Each class of the fund is compared to those funds and classes in the Total Mapped Group (used by the Board for management fee comparisons) that have a similar sales load structure.
The Board noted that the total expenses of each class ranked below its competitive median for 2009.
Fees Charged to Other Fidelity Clients. The Board also considered Fidelity fee structures and other information with respect to clients of FMR and its affiliates, such as other mutual funds advised or subadvised by FMR or its affiliates, pension plan clients, and other institutional clients. In March 2010, the Board created an ad hoc joint committee with the board of other Fidelity funds (the Committee) to review and compare Fidelity's institutional investment advisory business with its business of providing services to the Fidelity funds, including the differences in services provided, fees charged, and costs incurred, as well as competition in their respective marketplaces.
Based on its review of total expenses and fees charged to other Fidelity clients, the Board concluded that the total expenses of each class of the fund were reasonable in light of the services that the fund and its shareholders receive and the other factors considered, including the findings of the Committee.
Costs of the Services and Profitability. The Board considered the revenues earned and the expenses incurred by Fidelity in conducting the business of developing, marketing, distributing, managing, administering and servicing the fund and its shareholders. The Board also considered the level of Fidelity's profits in respect of all the Fidelity funds.
On an annual basis, FMR presents to the Board Fidelity's profitability for the fund. Fidelity calculates the profitability for each fund, as well as aggregate profitability for groups of Fidelity funds and all Fidelity funds, using a series of detailed revenue and cost allocation methodologies which originate with the audited books and records of Fidelity. The Audit Committee of the Board reviews any significant changes from the prior year's methodologies.
Annual Report
Board Approval of Investment Advisory Contracts and Management Fees - continued
PricewaterhouseCoopers LLP (PwC), independent registered public accounting firm and auditor to Fidelity and certain Fidelity funds, has been engaged annually by the Board as part of the Board's assessment of Fidelity's profitability analysis. PwC's engagement includes the review and assessment of Fidelity's methodologies used in determining the revenues and expenses attributable to Fidelity's mutual fund business, and completion of agreed-upon procedures surrounding the mathematical accuracy of fund profitability and its conformity to allocation methodologies. After considering PwC's reports issued under the engagement and information provided by Fidelity, the Board believes that while other allocation methods may also be reasonable, Fidelity's profitability methodologies are reasonable in all material respects.
The Board has also reviewed Fidelity's non-fund businesses and fall-out benefits related to the mutual fund business as well as cases where Fidelity's affiliates may benefit from or be related to the fund's business.
The Board considered the costs of the services provided by and the profits realized by Fidelity in connection with the operation of the fund and were satisfied that the profitability was not excessive in the circumstances.
Economies of Scale. The Board considered whether there have been economies of scale in respect of the management of the Fidelity funds, whether the Fidelity funds (including the fund) have appropriately benefited from any such economies of scale, and whether there is potential for realization of any further economies of scale. The Board considered the extent to which the fund will benefit from economies of scale through increased services to the fund, through waivers or reimbursements, or through fee or expense reductions.
In February 2009, the Board and the board of other Fidelity funds created an ad hoc committee (the Economies of Scale Committee) to analyze whether FMR attains economies of scale in respect of the management and servicing of the Fidelity funds, whether the Fidelity funds have appropriately benefited from such economies of scale, and whether there is potential for realization of any further economies of scale.
The Board recognized that the fund's management contract incorporates a "group fee" structure, which provides for lower group fee rates as total fund assets under FMR's management increase, and for higher group fee rates as total fund assets under FMR's management decrease. FMR calculates the group fee rates based on a tiered asset "breakpoint" schedule that varies based on asset class. The Board considered that the group fee is designed to deliver the benefits of economies of scale to fund shareholders when total Fidelity fund assets increase, even if assets of any particular fund are unchanged or have declined, because some portion of Fidelity's costs are attributable to services provided to all Fidelity funds, and all funds benefit if those costs can be allocated among more assets. The Board concluded that, given the group fee structure, fund shareholders will benefit from lower management fees as assets under FMR's management increase at the fund complex level, regardless of whether Fidelity achieves any such economies of scale.
The Board concluded, considering the findings of the Economies of Scale Committee, that any potential economies of scale are being appropriately shared between fund shareholders and Fidelity.
Additional Information Requested by the Board. In order to develop fully the factual basis for consideration of the Fidelity funds' Advisory Contracts, the Board requested and received additional information on certain topics, including (i) fund performance trends, actions to be taken by FMR to improve certain funds' overall performance, and Fidelity's long-term strategies for certain funds; (ii) portfolio manager changes that have occurred during the past year and length of portfolio manager tenure for different categories of funds over time; (iii) Fidelity's compensation structure for portfolio managers, research analysts, and other key personnel, the rationale for the compensation structure, and how the compensation structure provides appropriate performance incentives; (iv) the amount of the investment that each portfolio manager has made in the Fidelity fund(s) that he or she manages; (v) management and other fees paid by FMR to affiliated sub-advisers on behalf of the Fidelity funds; (vi) Fidelity's fee structures and rationale for recommending different fees among different categories of funds; (vii) Fidelity's rationale for recommending which funds should have a performance adjustment component as part of their management fees; (viii) the rationale for any differences between fund fee structures and fee structures in place for other Fidelity clients; and (ix) explanations regarding the relative total expenses borne by certain funds and classes, total expense competitive trends, and actions that might be taken by FMR to reduce total expenses for certain funds and classes.
Based on its evaluation of all of the conclusions noted above, and after considering all factors it believed relevant, the Board ultimately concluded that the advisory fee structures are fair and reasonable, and that the fund's Advisory Contracts should be renewed.
Annual Report
Investment Adviser
Fidelity Management & Research Company
Boston, MA
Investment Sub-Advisers
FMR Co., Inc.
Fidelity Management & Research (U.K.) Inc.
Fidelity Management & Research (Hong Kong) Limited
Fidelity Management & Research (Japan) Inc.
General Distributor
Fidelity Distributors Corporation
Boston, MA
Transfer and Service Agents
Fidelity Investments Institutional Operations Company, Inc.
Boston, MA
Fidelity Service Company, Inc.
Boston, MA
Custodian
State Street Bank and Trust Company
Quincy, MA
VMATP-ANN-0211
1.850999.103
Fidelity® Variable Insurance Products:
Real Estate Portfolio
Annual Report
December 31, 2010
(2_fidelity_logos) (Registered_Trademark)
Contents
Performance | <Click Here> | How the fund has done over time. |
Management's Discussion of Fund Performance | <Click Here> | The Portfolio Manager's review of fund performance and strategy. |
Shareholder Expense Example | <Click Here> | An example of shareholder expenses. |
Investment Changes | <Click Here> | A summary of major shifts in the fund's investments over the past six months. |
Investments | <Click Here> | A complete list of the fund's investments with their market values. |
Financial Statements | <Click Here> | Statements of assets and liabilities, operations, and changes in net assets, as well as financial highlights. |
Notes | <Click Here> | Notes to the financial statements. |
Report of Independent Registered Public Accounting Firm | <Click Here> | |
Trustees and Officers | <Click Here> | |
Board Approval of Investment Advisory Contracts and Management Fees | <Click Here> | |
To view a fund's proxy voting guidelines and proxy voting record for the 12-month period ended June 30, visit http://www.fidelity.com/proxyvotingresults or visit the Securities and Exchange Commission's (SEC) web site at http://www.sec.gov. You may also call 1-877-208-0098 to request a free copy of the proxy voting guidelines.
Fidelity Variable Insurance Products are separate account options which are purchased through a variable insurance contract.
Standard & Poor's, S&P and S&P 500 are registered service marks of The McGraw-Hill Companies, Inc. and have been licensed for use by Fidelity Distributors Corporation.
Other third party marks appearing herein are the property of their respective owners.
All other marks appearing herein are registered or unregistered trademarks or service marks of FMR LLC or an affiliated company.
The general research services agreement with Fidelity Research & Analysis Company has been terminated and is no longer in effect for the fund.
This report and the financial statements contained herein are submitted for the general information of the shareholders of the fund. This report is not authorized for distribution to prospective investors in the fund unless preceded or accompanied by an effective prospectus.
A fund files its complete schedule of portfolio holdings with the SEC for the first and third quarters of each fiscal year on Form N-Q. Forms N-Q are available on the SEC's web site at http://www.sec.gov. A fund's Forms N-Q may be reviewed and copied at the SEC's Public Reference Room in Washington, DC. Information regarding the operation of the SEC's Public Reference Room may be obtained by calling 1-800-SEC-0330. For a complete list of a fund's portfolio holdings, view the most recent holdings listing, semiannual report, or annual report on Fidelity's web site at http://www.fidelity.com, http://www.advisor.fidelity.com, or http://www.401k.com as applicable.
NOT FDIC INSURED • MAY LOSE VALUE • NO BANK GUARANTEE
Neither the fund nor Fidelity Distributors Corporation is a bank.
Annual Report
Average annual total return reflects the change in the value of an investment, assuming reinvestment of the class' distributions from dividend income and capital gains (the profits earned upon the sale of securities that have grown in value, if any) and assuming a constant rate of performance each year. During periods of reimbursement by Fidelity, a fund's total return will be greater than it would be had the reimbursement not occurred. Performance numbers are net of all underlying fund operating expenses, but do not include any insurance charges imposed by your insurance company's separate account. If performance information included the effect of these additional charges, the total returns would have been lower. How a fund did yesterday is no guarantee of how it will do tomorrow.
Average Annual Total Returns
Periods ended December 31, 2010 | Past 1
year | Past 5
years | Life of fund A |
VIP Real Estate Portfolio - Initial Class | 30.42% | 3.97% | 12.24% |
VIP Real Estate Portfolio - Service Class | 30.30% | 3.87% | 12.13% |
VIP Real Estate Portfolio - Service Class 2 | 30.09% | 3.70% | 11.95% |
VIP Real Estate Portfolio - Investor Class B | 30.25% | 3.85% | 12.15% |
A From November 6, 2002.
B The initial offering of Investor Class shares took place on July 21, 2005. Returns prior to July 21, 2005, are those of Initial Class. Had Investor Class's transfer agent fee been reflected, returns prior to July 21, 2005, would have been lower.
$10,000 Over Life of Fund
Let's say hypothetically that $10,000 was invested in VIP Real Estate Portfolio - Initial Class on November 6, 2002, when the fund started. The chart shows how the value of your investment would have changed, and also shows how the S&P 500® Index performed over the same period.
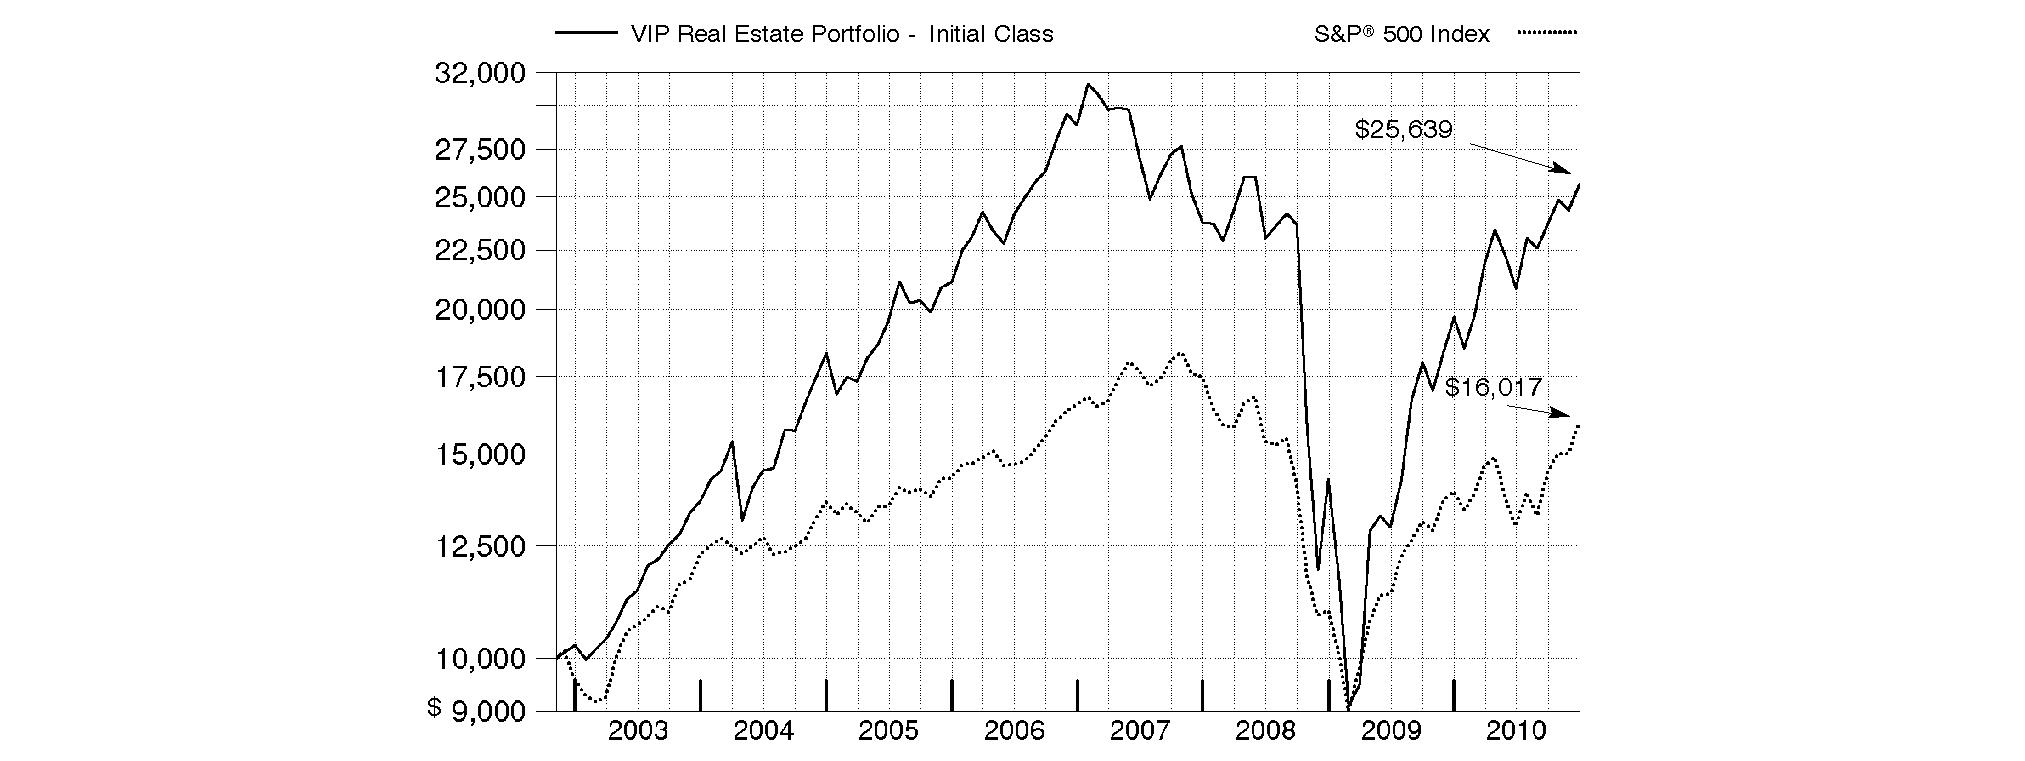
Annual Report
Market Recap: While market improvements around the world hit a speed bump in the first half of the 12-month period ending December 31, 2010, world economies re-accelerated in August, supported by a broadening recovery and low inflation in the U.S. Domestic stock markets recorded solid gains for the year, lifted by a strong second-half rally fueled by economic optimism, encouraging earnings reports and a wave of corporate mergers. The large-cap S&P 500® Index rose 15.06%, the blue-chip-laden Dow Jones Industrial AverageSM added 14.06% and the technology-heavy Nasdaq Composite® Index climbed 18.02%. Meanwhile, international stocks, as represented by the MSCI® ACWI® (All Country World Index) ex USA Index, gained 11.29%, boosted in part by a depreciating U.S. dollar. In the fixed-income arena, U.S. taxable investment-grade bonds generated positive results during 2010, as the Barclays Capital® U.S. Aggregate Bond Index gained 6.54%. With ultra-low interest rates bolstering nearly all fixed-income securities for most of the year, sectors in the index with higher yields and more credit risk generally fared best, while most high-quality bonds generated more-moderate returns. Meanwhile, high-yield bonds, as represented by The BofA Merrill LynchSM US High Yield Constrained Index, returned 15.07%, a result of improved economic data and strengthening investor demand. Overseas, foreign bond markets showed mixed results, with a sizable disparity between the 3.97% return of the Citigroup® Non-U.S. Group of 7 Index - which measures the performance of sovereign debt of the major global economies outside the U.S. - and the 12.04% advance of the JPMorgan Emerging Markets Bond Index Global (EMBI Global), which benefited from the rising overall credit quality of emerging-markets debt issuers.
Comments from Samuel Wald, Portfolio Manager of VIP Real Estate Portfolio: For the year, the fund's share classes outperformed the 28.47% gain of the Dow Jones U.S. Select Real Estate Securities IndexSM. The fund's share classes outpaced the broad equity market, as measured by the S&P 500®, by an even wider margin. (For specific portfolio results, please refer to the performance section of this report.) In past shareholder reports, I've discussed the fund's elevated weighting in more-aggressive investments. As credit markets began to heal, that stance proved effective throughout much of 2009 and continued to work in 2010. The fund's top individual contributor was CBL & Associates, which was overleveraged going into the financial crisis. Investors were concerned about the company's debt level and the potential for a slowdown in retail activity. But CBL bounced back strongly, and I ultimately sold some shares during the period to keep the portfolio's overweighted stake from growing too big. Two other stocks fit the risk-oriented theme - shopping center REIT Developers Diversified Realty (DDR) and real estate services company CB Richard Ellis Group, an out-of-index position. As investors' confidence grew and capital markets healed, both stocks did very well. DDR further benefited from growing optimism that the supply/demand picture was shifting in the company's favor. I traded DDR throughout the year and owned the stock at opportune times. My decision to avoid or significantly underweight a handful of benchmark components - including office and industrial REIT Liberty Property Trust, office REIT Mack Cali Realty, and health care property companies Nationwide Health Properties and Health Care REIT - proved helpful. I steered clear of all four stocks because I saw better-valued investment opportunities elsewhere in these industries. Of final note, the fund had an unusually large cash position for a very brief time as new cash awaited investment - a helpful factor during a few days of negative returns for the REIT market. In contrast, data center operator Digital Realty Trust lagged. This is a very high-quality company with a good management team. But early in the fourth quarter, the stock was caught up in the market's concern about an excess of data center space, which could lower rental rates. I didn't agree with this thesis, however, and maintained my overweighting in Digital Realty - and even added a little to the fund's holdings. Elsewhere, underweighting Host Hotels & Resorts hurt. Although I liked the stock during the period, it was relatively highly valued and I thought better opportunities could be found elsewhere, but this stance hurt during the reporting period. Other detractors included office REIT Highwoods Properties and underweighting Equity Residential, which owns and operates apartment buildings.
The views expressed above reflect those of the portfolio manager(s) only through the end of the period as stated on the cover of this report and do not necessarily represent the views of Fidelity or any other person in the Fidelity organization. Any such views are subject to change at any time based upon market or other conditions and Fidelity disclaims any responsibility to update such views. These views may not be relied on as investment advice and, because investment decisions for a Fidelity fund are based on numerous factors, may not be relied on as an indication of trading intent on behalf of any Fidelity fund.
Annual Report
As a shareholder of the Fund, you incur two types of costs: (1) transaction costs, and (2) ongoing costs, including management fees, distribution and/or service (12b-1) fees and other Fund expenses. This Example is intended to help you understand your ongoing costs (in dollars) of investing in the Fund and to compare these costs with the ongoing costs of investing in other mutual funds.
The Example is based on an investment of $1,000 invested at the beginning of the period and held for the entire period (July 1, 2010 to December 31, 2010).
Actual Expenses
The first line of the accompanying table for each class of the Fund provides information about actual account values and actual expenses. You may use the information in this line, together with the amount you invested, to estimate the expenses that you paid over the period. Simply divide your account value by $1,000.00 (for example, an $8,600 account value divided by $1,000.00 = 8.6), then multiply the result by the number in the first line for a class of the Fund under the heading entitled "Expenses Paid During Period" to estimate the expenses you paid on your account during this period. The estimate of expenses does not include any fees or other expenses of any variable annuity or variable life insurance product. If they were, the estimate of expenses you paid during the period would be higher, and your ending account value would be lower. In addition, the Fund, as a shareholder in the underlying Fidelity Central Funds, will indirectly bear its pro-rata share of the fees and expenses incurred by the underlying Fidelity Central Funds. These fees and expenses are not included in the Fund's annualized expense ratio used to calculate the expense estimate in the table below.
Hypothetical Example for Comparison Purposes
The second line of the accompanying table for each class of the Fund provides information about hypothetical account values and hypothetical expenses based on a Class' actual expense ratio and an assumed rate of return of 5% per year before expenses, which is not the Class' actual return. The hypothetical account values and expenses may not be used to estimate the actual ending account balance or expenses you paid for the period. You may use this information to compare the ongoing costs of investing in the Fund and other funds. To do so, compare this 5% hypothetical example with the 5% hypothetical examples that appear in the shareholder reports of the other funds. The estimate of expenses does not include any fees or other expenses of any variable annuity or variable life insurance product. If they were, the estimate of expenses you paid during the period would be higher, and your ending account value would be lower. In addition, the Fund, as a shareholder in the underlying Fidelity Central Funds, will indirectly bear its pro-rata share of the fees and expenses incurred by the underlying Fidelity Central Funds. These fees and expenses are not included in the Fund's annualized expense ratio used to calculate the expense estimate in the table below.
Please note that the expenses shown in the table are meant to highlight your ongoing costs only and do not reflect any transaction costs. Therefore, the second line of the table is useful in comparing ongoing costs only, and will not help you determine the relative total costs of owning different funds.
| Annualized Expense Ratio | Beginning
Account Value
July 1, 2010 | Ending
Account Value
December 31, 2010 | Expenses Paid
During Period*
July 1, 2010 to December 31, 2010 |
Initial Class | .70% | | | |
Actual | | $ 1,000.00 | $ 1,231.20 | $ 3.94 |
HypotheticalA | | $ 1,000.00 | $ 1,021.68 | $ 3.57 |
Service Class | .78% | | | |
Actual | | $ 1,000.00 | $ 1,229.90 | $ 4.38 |
HypotheticalA | | $ 1,000.00 | $ 1,021.27 | $ 3.97 |
Service Class 2 | .98% | | | |
Actual | | $ 1,000.00 | $ 1,229.60 | $ 5.51 |
HypotheticalA | | $ 1,000.00 | $ 1,020.27 | $ 4.99 |
Investor Class | .79% | | | |
Actual | | $ 1,000.00 | $ 1,230.50 | $ 4.44 |
HypotheticalA | | $ 1,000.00 | $ 1,021.22 | $ 4.02 |
A 5% return per year before expenses
* Expenses are equal to each Class' annualized expense ratio, multiplied by the average account value over the period, multiplied by 184/365 (to reflect the one-half year period).
Annual Report
Investment Changes (Unaudited)
Top Ten Stocks as of December 31, 2010 |
| % of fund's
net assets | % of fund's net assets
6 months ago |
Simon Property Group, Inc. | 10.2 | 6.8 |
Public Storage | 7.2 | 4.8 |
ProLogis Trust | 5.7 | 2.8 |
Ventas, Inc. | 5.5 | 3.5 |
Vornado Realty Trust | 4.3 | 3.4 |
SL Green Realty Corp. | 4.3 | 2.5 |
Digital Realty Trust, Inc. | 4.3 | 2.3 |
Alexandria Real Estate Equities, Inc. | 3.5 | 1.9 |
Mid-America Apartment Communities, Inc. | 3.2 | 1.9 |
Equity Residential (SBI) | 3.1 | 1.9 |
| 51.3 | |
Top Five REIT Sectors as of December 31, 2010 |
| % of fund's
net assets | % of fund's net assets
6 months ago |
REITs - Malls | 15.5 | 10.2 |
REITs - Apartments | 15.1 | 9.6 |
REITs - Office Buildings | 14.0 | 9.6 |
REITs - Industrial Buildings | 13.5 | 7.8 |
REITs - Health Care Facilities | 10.8 | 7.9 |
Asset Allocation (% of fund's net assets) |
As of December 31, 2010* | As of June 30, 2010** |
 | Stocks 98.2% | | | Stocks 62.0% | |
 | Convertible
Securities 0.2% | | | Convertible
Securities 0.2% | |
 | Short-Term
Investments and
Net Other Assets 1.6% | | | Short-Term
Investments and
Net Other Assets 37.8% | |
* Foreign investments | 1.3% | | ** Foreign investments | 0.9% | |

Annual Report
Investments December 31, 2010
Showing Percentage of Net Assets
Common Stocks - 98.2% |
| Shares | | Value |
HEALTH CARE PROVIDERS & SERVICES - 3.2% |
Health Care Facilities - 3.2% |
Brookdale Senior Living, Inc. (a) | 131,900 | | $ 2,823,979 |
Emeritus Corp. (a)(d) | 179,637 | | 3,540,645 |
Sunrise Senior Living, Inc. (a) | 146,931 | | 800,774 |
TOTAL HEALTH CARE FACILITIES | | 7,165,398 |
REAL ESTATE INVESTMENT TRUSTS - 91.4% |
REITs - Apartments - 15.1% |
American Campus Communities, Inc. | 15,884 | | 504,476 |
AvalonBay Communities, Inc. | 21,524 | | 2,422,526 |
Camden Property Trust (SBI) | 23,200 | | 1,252,336 |
Colonial Properties Trust (SBI) | 27,600 | | 498,180 |
Education Realty Trust, Inc. | 522,200 | | 4,057,494 |
Equity Residential (SBI) | 131,554 | | 6,834,230 |
Essex Property Trust, Inc. | 59,334 | | 6,777,129 |
Mid-America Apartment Communities, Inc. | 113,000 | | 7,174,370 |
Post Properties, Inc. | 109,400 | | 3,971,220 |
TOTAL REITS - APARTMENTS | | 33,491,961 |
REITs - Factory Outlets - 0.5% |
Tanger Factory Outlet Centers, Inc. | 19,800 | | 1,013,562 |
REITs - Health Care Facilities - 10.8% |
HCP, Inc. | 175,766 | | 6,466,431 |
Healthcare Realty Trust, Inc. | 133,100 | | 2,817,727 |
Omega Healthcare Investors, Inc. | 104,576 | | 2,346,685 |
Ventas, Inc. | 233,400 | | 12,248,832 |
TOTAL REITS - HEALTH CARE FACILITIES | | 23,879,675 |
REITs - Hotels - 7.3% |
Chesapeake Lodging Trust | 77,039 | | 1,449,104 |
DiamondRock Hospitality Co. | 506,220 | | 6,074,640 |
Host Hotels & Resorts, Inc. | 246,430 | | 4,403,704 |
Sunstone Hotel Investors, Inc. (a) | 399,986 | | 4,131,855 |
TOTAL REITS - HOTELS | | 16,059,303 |
REITs - Industrial Buildings - 13.5% |
DCT Industrial Trust, Inc. | 266,300 | | 1,414,053 |
ProLogis Trust | 867,666 | | 12,529,097 |
Public Storage | 157,149 | | 15,938,052 |
TOTAL REITS - INDUSTRIAL BUILDINGS | | 29,881,202 |
REITs - Malls - 15.5% |
CBL & Associates Properties, Inc. | 315,644 | | 5,523,770 |
|
| Shares | | Value |
Simon Property Group, Inc. | 225,562 | | $ 22,441,166 |
The Macerich Co. | 131,059 | | 6,208,265 |
TOTAL REITS - MALLS | | 34,173,201 |
REITs - Management/Investment - 5.0% |
Digital Realty Trust, Inc. (d) | 183,154 | | 9,439,757 |
Weyerhaeuser Co. | 87,605 | | 1,658,363 |
TOTAL REITS - MANAGEMENT/INVESTMENT | | 11,098,120 |
REITs - Office Buildings - 14.0% |
Alexandria Real Estate Equities, Inc. (d) | 106,062 | | 7,770,102 |
Boston Properties, Inc. | 71,663 | | 6,170,184 |
Brandywine Realty Trust (SBI) | 302,869 | | 3,528,424 |
Highwoods Properties, Inc. (SBI) | 125,638 | | 4,001,570 |
SL Green Realty Corp. | 140,100 | | 9,458,151 |
TOTAL REITS - OFFICE BUILDINGS | | 30,928,431 |
REITs - Shopping Centers - 9.7% |
Acadia Realty Trust (SBI) | 174,000 | | 3,173,760 |
Cedar Shopping Centers, Inc. | 87,100 | | 547,859 |
Developers Diversified Realty Corp. | 301,653 | | 4,250,291 |
Excel Trust, Inc. | 36,162 | | 437,560 |
Glimcher Realty Trust | 107,311 | | 901,412 |
Kimco Realty Corp. | 89,574 | | 1,615,915 |
Kite Realty Group Trust | 201,115 | | 1,088,032 |
Vornado Realty Trust | 114,439 | | 9,536,202 |
TOTAL REITS - SHOPPING CENTERS | | 21,551,031 |
TOTAL REAL ESTATE INVESTMENT TRUSTS | | 202,076,486 |
REAL ESTATE MANAGEMENT & DEVELOPMENT - 3.6% |
Diversified Real Estate Activities - 0.4% |
Beni Stabili SpA | 242,900 | | 205,571 |
Coresite Realty Corp. | 41,687 | | 568,611 |
TOTAL DIVERSIFIED REAL ESTATE ACTIVITIES | | 774,182 |
Real Estate Development - 0.1% |
Helical Bar PLC | 20,600 | | 91,596 |
Real Estate Operating Companies - 1.4% |
Brookfield Properties Corp. (d) | 136,190 | | 2,397,971 |
Forest City Enterprises, Inc. Class A (a)(d) | 45,600 | | 761,064 |
TOTAL REAL ESTATE OPERATING COMPANIES | | 3,159,035 |
Real Estate Services - 1.7% |
CB Richard Ellis Group, Inc. Class A (a) | 187,916 | | 3,848,520 |
TOTAL REAL ESTATE MANAGEMENT & DEVELOPMENT | | 7,873,333 |
Common Stocks - continued |
| Shares | | Value |
THRIFTS & MORTGAGE FINANCE - 0.0% |
Thrifts & Mortgage Finance - 0.0% |
Walker & Dunlop, Inc. | 5,200 | | $ 52,468 |
TOTAL COMMON STOCKS (Cost $175,862,094) | 217,167,685 |
Convertible Preferred Stocks - 0.1% |
| | | |
REAL ESTATE MANAGEMENT & DEVELOPMENT - 0.1% |
Real Estate Services - 0.1% |
Grubb & Ellis Co. 12.00% (e)
(Cost $270,000) | 2,700 | | 244,431 |
Convertible Bonds - 0.1% |
| Principal
Amount | | |
REAL ESTATE MANAGEMENT & DEVELOPMENT - 0.1% |
Real Estate Services - 0.1% |
Grubb & Ellis Co. 7.95% 5/1/15 (e)
(Cost $116,000) | $ 116,000 | | 108,564 |
Money Market Funds - 7.1% |
| Principal
Amount | | Value |
Fidelity Cash Central Fund, 0.19% (b) | $ 5,374,511 | | $ 5,374,511 |
Fidelity Securities Lending Cash Central Fund, 0.21% (b)(c) | 10,323,078 | | 10,323,078 |
TOTAL MONEY MARKET FUNDS (Cost $15,697,589) | 15,697,589 |
TOTAL INVESTMENT PORTFOLIO - 105.5% (Cost $191,945,683) | | 233,218,269 |
NET OTHER ASSETS (LIABILITIES) - (5.5)% | | (12,123,145) |
NET ASSETS - 100% | $ 221,095,124 |
Legend |
(a) Non-income producing |
(b) Affiliated fund that is available only to investment companies and other accounts managed by Fidelity Investments. The rate quoted is the annualized seven-day yield of the fund at period end. A complete unaudited listing of the fund's holdings as of its most recent quarter end is available upon request. In addition, each Fidelity Central Fund's financial statements, which are not covered by the Fund's Report of Independent Registered Public Accounting Firm, are available on the SEC's website or upon request. |
(c) Investment made with cash collateral received from securities on loan. |
(d) Security or a portion of the security is on loan at period end. |
(e) Security exempt from registration under Rule 144A of the Securities Act of 1933. These securities may be resold in transactions exempt from registration, normally to qualified institutional buyers. At the end of the period, the value of these securities amounted to $352,995 or 0.2% of net assets. |
Affiliated Central Funds |
Information regarding fiscal year to date income earned by the Fund from investments in Fidelity Central Funds is as follows: |
Fund | Income earned |
Fidelity Cash Central Fund | $ 8,452 |
Fidelity Securities Lending Cash Central Fund | 21,022 |
Total | $ 29,474 |
Other Information |
The following is a summary of the inputs used, as of December 31, 2010, involving the Fund's assets and liabilities carried at fair value. The inputs or methodology used for valuing securities may not be an indication of the risk associated with investing in those securities. For more information on valuation inputs, and their aggregation into the levels used in the table below, please refer to the Security Valuation section in the accompanying Notes to Financial Statements. |
Valuation Inputs at Reporting Date: |
Description | Total | Level 1 | Level 2 | Level 3 |
Investments in Securities: | | | | |
Common Stocks | $ 217,167,685 | $ 217,167,685 | $ - | $ - |
Convertible Preferred Stocks | 244,431 | - | 244,431 | - |
Convertible Bonds | 108,564 | - | 108,564 | - |
Money Market Funds | 15,697,589 | 15,697,589 | - | - |
Total Investments in Securities: | $ 233,218,269 | $ 232,865,274 | $ 352,995 | $ - |
Income Tax Information |
At December 31, 2010, the Fund had a capital loss carryforward of approximately $15,606,914 all of which will expire in fiscal 2017. Capital loss carryforwards are only available to offset future capital gains of the Fund to the extent provided by regulations and may be limited. |
See accompanying notes which are an integral part of the financial statements.
Annual Report
Statement of Assets and Liabilities
| December 31, 2010 |
| | |
Assets | | |
Investment in securities, at value (including securities loaned of $10,102,789) - See accompanying schedule: Unaffiliated issuers (cost $176,248,094) | $ 217,520,680 | |
Fidelity Central Funds (cost $15,697,589) | 15,697,589 | |
Total Investments (cost $191,945,683) | | $ 233,218,269 |
Cash | | 6,468 |
Foreign currency held at value (cost $10,320) | | 10,320 |
Receivable for investments sold | | 343,138 |
Receivable for fund shares sold | | 496,567 |
Dividends receivable | | 536,172 |
Interest receivable | | 1,529 |
Distributions receivable from Fidelity Central Funds | | 2,774 |
Prepaid expenses | | 700 |
Other receivables | | 5,583 |
Total assets | | 234,621,520 |
| | |
Liabilities | | |
Payable for investments purchased | $ 1,639,076 | |
Payable for fund shares redeemed | 1,378,780 | |
Accrued management fee | 99,773 | |
Distribution and service plan fees payable | 20,338 | |
Other affiliated payables | 22,983 | |
Other payables and accrued expenses | 42,368 | |
Collateral on securities loaned, at value | 10,323,078 | |
Total liabilities | | 13,526,396 |
| | |
Net Assets | | $ 221,095,124 |
Net Assets consist of: | | |
Paid in capital | | $ 198,822,315 |
Distribution in excess of net investment income | | (686,298) |
Accumulated undistributed net realized gain (loss) on investments and foreign currency transactions | | (18,313,479) |
Net unrealized appreciation (depreciation) on investments and assets and liabilities in foreign currencies | | 41,272,586 |
Net Assets | | $ 221,095,124 |
Statement of Assets and Liabilities - continued
| December 31, 2010 |
| | |
Initial Class:
Net Asset Value, offering price and redemption price per share ($56,893,046 ÷ 4,046,351 shares) | | $ 14.06 |
| | |
Service Class:
Net Asset Value, offering price and redemption price per share ($792,714 ÷ 56,470 shares) | | $ 14.04 |
| | |
Service Class 2:
Net Asset Value, offering price and redemption price per share ($101,038,048 ÷ 7,259,637 shares) | | $ 13.92 |
| | |
Investor Class:
Net Asset Value, offering price and redemption price per share ($62,371,316 ÷ 4,451,521 shares) | | $ 14.01 |
See accompanying notes which are an integral part of the financial statements.
Annual Report
Financial Statements - continued
Statement of Operations
| Year ended December 31, 2010 |
| | |
Investment Income | | |
Dividends | | $ 2,833,357 |
Interest | | 7,391 |
Income from Fidelity Central Funds | | 29,474 |
Total income | | 2,870,222 |
| | |
Expenses | | |
Management fee | $ 823,458 | |
Transfer agent fees | 156,953 | |
Distribution and service plan fees | 125,787 | |
Accounting and security lending fees | 59,340 | |
Custodian fees and expenses | 35,083 | |
Independent trustees' compensation | 768 | |
Audit | 48,664 | |
Legal | 531 | |
Miscellaneous | 1,243 | |
Total expenses before reductions | 1,251,827 | |
Expense reductions | (24,648) | 1,227,179 |
Net investment income (loss) | | 1,643,043 |
Realized and Unrealized Gain (Loss) Net realized gain (loss) on: | | |
Investment securities: | | |
Unaffiliated issuers | 5,427,500 | |
Foreign currency transactions | (3,240) | |
Total net realized gain (loss) | | 5,424,260 |
Change in net unrealized appreciation (depreciation) on: Investment securities | 34,601,483 | |
Assets and liabilities in foreign currencies | 15 | |
Total change in net unrealized appreciation (depreciation) | | 34,601,498 |
Net gain (loss) | | 40,025,758 |
Net increase (decrease) in net assets resulting from operations | | $ 41,668,801 |
Statement of Changes in Net Assets
| Year ended
December 31,
2010 | Year ended
December 31,
2009 |
Increase (Decrease) in Net Assets | | |
Operations | | |
Net investment income (loss) | $ 1,643,043 | $ 1,810,307 |
Net realized gain (loss) | 5,424,260 | (13,001,012) |
Change in net unrealized appreciation (depreciation) | 34,601,498 | 34,416,327 |
Net increase (decrease) in net assets resulting from operations | 41,668,801 | 23,225,622 |
Distributions to shareholders from net investment income | (2,468,435) | (1,808,445) |
Share transactions - net increase (decrease) | 95,325,522 | 5,274,720 |
Total increase (decrease) in net assets | 134,525,888 | 26,691,897 |
| | |
Net Assets | | |
Beginning of period | 86,569,236 | 59,877,339 |
End of period (including distribution in excess of net investment income of $686,298 and undistributed net investment income of $154,144, respectively) | $ 221,095,124 | $ 86,569,236 |
See accompanying notes which are an integral part of the financial statements.
Annual Report
Financial Highlights - Initial Class
Years ended December 31, | 2010 | 2009 | 2008 | 2007 | 2006 |
Selected Per-Share Data | | | | | |
Net asset value, beginning of period | $ 10.93 | $ 8.13 | $ 14.38 | $ 22.74 | $ 18.48 |
Income from Investment Operations | | | | | |
Net investment income (loss) C | .15 | .24 | .33 | .27 | .38 |
Net realized and unrealized gain (loss) | 3.16 | 2.80 | (6.06) | (4.15) | 6.23 |
Total from investment operations | 3.31 | 3.04 | (5.73) | (3.88) | 6.61 |
Distributions from net investment income | (.18) | (.24) | (.36) | (.36) | (.33) |
Distributions from net realized gain | - | - | (.16) | (4.12) | (2.02) |
Total distributions | (.18) | (.24) | (.52) | (4.48) | (2.35) |
Net asset value, end of period | $ 14.06 | $ 10.93 | $ 8.13 | $ 14.38 | $ 22.74 |
Total Return A, B | 30.42% | 37.69% | (39.87)% | (17.72)% | 36.71% |
Ratios to Average Net Assets D, F | | | | | |
Expenses before reductions | .73% | .80% | .76% | .74% | .72% |
Expenses net of fee waivers, if any | .73% | .80% | .76% | .74% | .72% |
Expenses net of all reductions | .72% | .80% | .76% | .74% | .71% |
Net investment income (loss) | 1.22% | 3.01% | 2.51% | 1.21% | 1.76% |
Supplemental Data | | | | | |
Net assets, end of period (000 omitted) | $ 56,893 | $ 41,714 | $ 32,918 | $ 68,401 | $ 205,802 |
Portfolio turnover rate E | 64% | 94% | 87% | 102% | 70% |
A Total returns do not reflect charges attributable to your insurance company's separate account. Inclusion of these charges would reduce the total returns shown.
B Total returns would have been lower had certain expenses not been reduced during the periods shown.
C Calculated based on average shares outstanding during the period.
D Fees and expenses of the underlying Fidelity Central Funds are not included in the Fund's expense ratio. The Fund indirectly bears its proportionate share of the expenses of any underlying Fidelity Central Funds.
E Amount does not include the portfolio activity of any underlying Fidelity Central Funds.
F Expense ratios reflect operating expenses of the class. Expenses before reductions do not reflect amounts reimbursed by the investment adviser or reductions from brokerage service arrangements or reductions from other expense offset arrangements and do not represent the amount paid by the class during periods when reimbursements or reductions occur. Expenses net of fee waivers reflect expenses after reimbursement by the investment adviser but prior to reductions from brokerage service arrangements or other expense offset arrangements. Expenses net of all reductions represent the net expenses paid by the class.
Financial Highlights - Service Class
Years ended December 31, | 2010 | 2009 | 2008 | 2007 | 2006 |
Selected Per-Share Data | | | | | |
Net asset value, beginning of period | $ 10.91 | $ 8.11 | $ 14.33 | $ 22.69 | $ 18.44 |
Income from Investment Operations | | | | | |
Net investment income (loss) C | .14 | .23 | .32 | .24 | .35 |
Net realized and unrealized gain (loss) | 3.15 | 2.80 | (6.04) | (4.13) | 6.22 |
Total from investment operations | 3.29 | 3.03 | (5.72) | (3.89) | 6.57 |
Distributions from net investment income | (.16) | (.23) | (.34) | (.35) | (.30) |
Distributions from net realized gain | - | - | (.16) | (4.12) | (2.02) |
Total distributions | (.16) | (.23) | (.50) | (4.47) | (2.32) |
Net asset value, end of period | $ 14.04 | $ 10.91 | $ 8.11 | $ 14.33 | $ 22.69 |
Total Return A, B | 30.30% | 37.62% | (39.95)% | (17.80)% | 36.61% |
Ratios to Average Net Assets D, F | | | | | |
Expenses before reductions | .83% | .90% | .86% | .83% | .82% |
Expenses net of fee waivers, if any | .83% | .90% | .86% | .83% | .82% |
Expenses net of all reductions | .82% | .89% | .85% | .83% | .81% |
Net investment income (loss) | 1.12% | 2.91% | 2.41% | 1.12% | 1.66% |
Supplemental Data | | | | | |
Net assets, end of period (000 omitted) | $ 793 | $ 1,051 | $ 1,385 | $ 3,543 | $ 4,311 |
Portfolio turnover rate E | 64% | 94% | 87% | 102% | 70% |
A Total returns do not reflect charges attributable to your insurance company's separate account. Inclusion of these charges would reduce the total returns shown.
B Total returns would have been lower had certain expenses not been reduced during the periods shown.
C Calculated based on average shares outstanding during the period.
D Fees and expenses of the underlying Fidelity Central Funds are not included in the Fund's expense ratio. The Fund indirectly bears its proportionate share of the expenses of any underlying Fidelity Central Funds.
E Amount does not include the portfolio activity of any underlying Fidelity Central Funds.
F Expense ratios reflect operating expenses of the class. Expenses before reductions do not reflect amounts reimbursed by the investment adviser or reductions from brokerage service arrangements or reductions from other expense offset arrangements and do not represent the amount paid by the class during periods when reimbursements or reductions occur. Expenses net of fee waivers reflect expenses after reimbursement by the investment adviser but prior to reductions from brokerage service arrangements or other expense offset arrangements. Expenses net of all reductions represent the net expenses paid by the class.
See accompanying notes which are an integral part of the financial statements.
Annual Report
Financial Highlights - Service Class 2
Years ended December 31, | 2010 | 2009 | 2008 | 2007 | 2006 |
Selected Per-Share Data | | | | | |
Net asset value, beginning of period | $ 10.84 | $ 8.07 | $ 14.28 | $ 22.62 | $ 18.40 |
Income from Investment Operations | | | | | |
Net investment income (loss) C | .12 | .23 | .28 | .21 | .32 |
Net realized and unrealized gain (loss) | 3.13 | 2.76 | (5.99) | (4.11) | 6.19 |
Total from investment operations | 3.25 | 2.99 | (5.71) | (3.90) | 6.51 |
Distributions from net investment income | (.17) | (.22) | (.34) | (.32) | (.27) |
Distributions from net realized gain | - | - | (.16) | (4.12) | (2.02) |
Total distributions | (.17) | (.22) | (.50) | (4.44) | (2.29) |
Net asset value, end of period | $ 13.92 | $ 10.84 | $ 8.07 | $ 14.28 | $ 22.62 |
Total Return A, B | 30.09% | 37.40% | (40.06)% | (17.91)% | 36.35% |
Ratios to Average Net Assets D, F | | | | | |
Expenses before reductions | .98% | 1.07% | 1.03% | .98% | .97% |
Expenses net of fee waivers, if any | .97% | 1.07% | 1.03% | .98% | .97% |
Expenses net of all reductions | .96% | 1.06% | 1.03% | .98% | .96% |
Net investment income (loss) | .97% | 2.74% | 2.24% | .97% | 1.51% |
Supplemental Data | | | | | |
Net assets, end of period (000 omitted) | $ 101,038 | $ 9,878 | $ 2,864 | $ 3,558 | $ 4,284 |
Portfolio turnover rate E | 64% | 94% | 87% | 102% | 70% |
A Total returns do not reflect charges attributable to your insurance company's separate account. Inclusion of these charges would reduce the total returns shown.
B Total returns would have been lower had certain expenses not been reduced during the periods shown.
C Calculated based on average shares outstanding during the period.
D Fees and expenses of the underlying Fidelity Central Funds are not included in the Fund's expense ratio. The Fund indirectly bears its proportionate share of the expenses of any underlying Fidelity Central Funds.
E Amount does not include the portfolio activity of any underlying Fidelity Central Funds.
F Expense ratios reflect operating expenses of the class. Expenses before reductions do not reflect amounts reimbursed by the investment adviser or reductions from brokerage service arrangements or reductions from other expense offset arrangements and do not represent the amount paid by the class during periods when reimbursements or reductions occur. Expenses net of fee waivers reflect expenses after reimbursement by the investment adviser but prior to reductions from brokerage service arrangements or other expense offset arrangements. Expenses net of all reductions represent the net expenses paid by the class.
Financial Highlights - Investor Class
Years ended December 31, | 2010 | 2009 | 2008 | 2007 | 2006 |
Selected Per-Share Data | | | | | |
Net asset value, beginning of period | $ 10.90 | $ 8.11 | $ 14.34 | $ 22.69 | $ 18.46 |
Income from Investment Operations | | | | | |
Net investment income (loss) C | .14 | .24 | .31 | .24 | .35 |
Net realized and unrealized gain (loss) | 3.14 | 2.78 | (6.03) | (4.13) | 6.22 |
Total from investment operations | 3.28 | 3.02 | (5.72) | (3.89) | 6.57 |
Distributions from net investment income | (.17) | (.23) | (.35) | (.34) | (.32) |
Distributions from net realized gain | - | - | (.16) | (4.12) | (2.02) |
Total distributions | (.17) | (.23) | (.51) | (4.46) | (2.34) |
Net asset value, end of period | $ 14.01 | $ 10.90 | $ 8.11 | $ 14.34 | $ 22.69 |
Total Return A, B | 30.25% | 37.57% | (39.91)% | (17.83)% | 36.53% |
Ratios to Average Net Assets D, F | | | | | |
Expenses before reductions | .82% | .90% | .85% | .85% | .85% |
Expenses net of fee waivers, if any | .81% | .90% | .85% | .85% | .85% |
Expenses net of all reductions | .80% | .89% | .85% | .85% | .85% |
Net investment income (loss) | 1.13% | 2.91% | 2.42% | 1.10% | 1.62% |
Supplemental Data | | | | | |
Net assets, end of period (000 omitted) | $ 62,371 | $ 33,926 | $ 22,711 | $ 31,632 | $ 50,198 |
Portfolio turnover rate E | 64% | 94% | 87% | 102% | 70% |
A Total returns do not reflect charges attributable to your insurance company's separate account. Inclusion of these charges would reduce the total returns shown.
B Total returns would have been lower had certain expenses not been reduced during the periods shown.
C Calculated based on average shares outstanding during the period.
D Fees and expenses of the underlying Fidelity Central Funds are not included in the Fund's expense ratio. The Fund indirectly bears its proportionate share of the expenses of any underlying Fidelity Central Funds.
E Amount does not include the portfolio activity of any underlying Fidelity Central Funds.
F Expense ratios reflect operating expenses of the class. Expenses before reductions do not reflect amounts reimbursed by the investment adviser or reductions from brokerage service arrangements or reductions from other expense offset arrangements and do not represent the amount paid by the class during periods when reimbursements or reductions occur. Expenses net of fee waivers reflect expenses after reimbursement by the investment adviser but prior to reductions from brokerage service arrangements or other expense offset arrangements. Expenses net of all reductions represent the net expenses paid by the class.
See accompanying notes which are an integral part of the financial statements.
Annual Report
Notes to Financial Statements
For the period ended December 31, 2010
1. Organization.
VIP Real Estate Portfolio (the Fund) is a fund of Variable Insurance Products Fund IV (the Trust) and is authorized to issue an unlimited number of shares. The Trust is registered under the Investment Company Act of 1940, as amended (the 1940 Act), as an open-end management investment company organized as a Massachusetts business trust. Shares of the Fund may only be purchased by insurance companies for the purpose of funding variable annuity or variable life insurance contracts. The Fund offers the following classes of shares: Initial Class shares, Service Class shares, Service Class 2 shares, and Investor Class shares. All classes have equal rights and voting privileges, except for matters affecting a single class. Investment income, realized and unrealized capital gains and losses, the common expenses of the Fund, and certain fund-level expense reductions, if any, are allocated on a pro-rata basis to each class based on the relative net assets of each class to the total net assets of the Fund. Each class differs with respect to transfer agent and distribution and service plan fees incurred. Certain expense reductions may also differ by class.
2. Investments in Fidelity Central Funds.
The Fund may invest in Fidelity Central Funds, which are open-end investment companies available only to other investment companies and accounts managed by Fidelity Management & Research Company (FMR) and its affiliates. The Fund's Schedule of Investments lists each of the Fidelity Central Funds held as of period end, if any, as an investment of the Fund, but does not include the underlying holdings of each Fidelity Central Fund. As an Investing Fund, the Fund indirectly bears its proportionate share of the expenses of the underlying Fidelity Central Funds.
The Money Market Central Funds seek preservation of capital and current income and are managed by Fidelity Investments Money Management, Inc. (FIMM), an affiliate of FMR.
A complete unaudited list of holdings for each Fidelity Central Fund is available upon request or at the Securities and Exchange Commission (the SEC) web site at www.sec.gov. In addition, the financial statements of the Fidelity Central Funds, which are not covered by the Fund's Report of Independent Registered Public Accounting Firm, are available on the SEC web site or upon request.
3. Significant Accounting Policies.
The financial statements have been prepared in conformity with accounting principles generally accepted in the United States of America (GAAP), which require management to make certain estimates and assumptions at the date of the financial statements. Actual results could differ from those estimates. Subsequent events, if any, through the date that the financial statements were issued have been evaluated in the preparation of the financial statements. The following summarizes the significant accounting policies of the Fund:
Security Valuation. Investments are valued as of 4:00 p.m. Eastern time on the last calendar day of the period. The Fund uses independent pricing services approved by the Board of Trustees to value its investments. When current market prices or quotations are not readily available or reliable, valuations may be determined in good faith in accordance with procedures adopted by the Board of Trustees. Factors used in determining value may include market or security specific events, changes in interest rates and credit quality. The frequency with which these procedures are used cannot be predicted and they may be utilized to a significant extent. The value used for net asset value (NAV) calculation under these procedures may differ from published prices for the same securities.
The Fund categorizes the inputs to valuation techniques used to value its investments into a disclosure hierarchy consisting of three levels as shown below.
Level 1 - quoted prices in active markets for identical investments
Level 2 - other significant observable inputs (including quoted prices for similar investments, interest rates, prepayment speeds, etc.)
Level 3 - unobservable inputs (including the Fund's own assumptions based on the best information available)
Changes in valuation techniques may result in transfers in or out of an assigned level within the disclosure hierarchy. The aggregate value of investments by input level, as of December 31, 2010, is included at the end of the Fund's Schedule of Investments. Valuation techniques used to value the Fund's investments by major category are as follows.
Equity securities, including restricted securities, for which market quotations are readily available, are valued at the last reported sale price or official closing price as reported by an independent pricing service on the primary market or exchange on which they are traded and are categorized as Level 1 in the hierarchy. In the event there were no sales during the day or closing prices are not available, securities are valued at the last quoted bid price or may be valued using the last available price and are generally categorized as Level 2 in the hierarchy. For foreign equity securities, when significant market or security specific events arise, comparisons to the valuation of American Depositary Receipts (ADRs), futures contracts, Exchange-traded funds (ETFs) and certain indexes as well as quoted prices for similar securities are used and are categorized as Level 2 in the hierarchy in these circumstances. Utilizing these techniques may result in transfers between Level 1 and Level 2. For restricted equity securities and private placements where observable inputs are limited, assumptions about market activity and risk are used and are categorized as Level 3 in the hierarchy.
Annual Report
Notes to Financial Statements - continued
3. Significant Accounting Policies - continued
Security Valuation - continued
Debt securities, including restricted securities, are valued based on evaluated prices received from independent pricing services or from dealers who make markets in such securities. For corporate bonds, pricing services utilize matrix pricing which considers yield or price of bonds of comparable quality, coupon, maturity and type as well as dealer supplied prices and are generally categorized as Level 2 in the hierarchy.
Investments in open-end mutual funds, including the Fidelity Central Funds, are valued at their closing net asset value each business day and are categorized as Level 1 in the hierarchy.
When independent prices are unavailable or unreliable, debt securities may be valued utilizing pricing matrices which consider similar factors that would be used by independent pricing services. These are generally categorized as Level 2 in the hierarchy but may be Level 3 depending on the circumstances.
Foreign Currency. The Fund uses foreign currency contracts to facilitate transactions in foreign-denominated securities. Gains and losses from these transactions may arise from changes in the value of the foreign currency or if the counterparties do not perform under the contracts' terms.
Foreign-denominated assets, including investment securities, and liabilities are translated into U.S. dollars at the exchange rate at period end. Purchases and sales of investment securities, income and dividends received and expenses denominated in foreign currencies are translated into U.S. dollars at the exchange rate in effect on the transaction date.
The effects of exchange rate fluctuations on investments are included with the net realized and unrealized gain (loss) on investment securities. Other foreign currency transactions resulting in realized and unrealized gain (loss) are disclosed separately.
Investment Transactions and Income. For financial reporting purposes, the Fund's investment holdings and NAV include trades executed through the end of the last business day of the period. The NAV per share for processing shareholder transactions is calculated as of the close of business of the New York Stock Exchange (NYSE) normally 4:00 p.m. Eastern time and includes trades executed through the end of the prior business day. Gains and losses on securities sold are determined on the basis of identified cost. Dividend income is recorded on the ex-dividend date, except for certain dividends from foreign securities where the ex-dividend date may have passed, which are recorded as soon as the Fund is informed of the ex-dividend date. Non-cash dividends included in dividend income, if any, are recorded at the fair market value of the securities received. Distributions received on securities that represent a return of capital or capital gain are recorded as a reduction of cost of investments and/or as a realized gain. The Fund estimates the components of distributions received that may be considered return of capital distributions or capital gain distributions. Interest income and distributions from the Fidelity Central Funds are accrued as earned. Interest income includes coupon interest and amortization of premium and accretion of discount on debt securities. Investment income is recorded net of foreign taxes withheld where recovery of such taxes is uncertain.
Expenses. Expenses directly attributable to a fund are charged to that fund. Expenses attributable to more than one fund are allocated among the respective funds on the basis of relative net assets or other appropriate methods. Expense estimates are accrued in the period to which they relate and adjustments are made when actual amounts are known.
Income Tax Information and Distributions to Shareholders. Each year the Fund intends to qualify as a regulated investment company, including distributing substantially all of its taxable income and realized gains under Subchapter M of the Internal Revenue Code and filing its U.S. federal tax return. As a result, no provision for income taxes is required. As of December 31, 2010, the Fund did not have any unrecognized tax benefits in the accompanying financial statements. A fund's federal tax return is subject to examination by the Internal Revenue Service (IRS) for a period of three years. Foreign taxes are provided for based on the Fund's understanding of the tax rules and rates that exist in the foreign markets in which it invests.
Distributions are declared and recorded on the ex-dividend date. Income dividends and capital gain distributions are declared separately for each class. Income and capital gain distributions are determined in accordance with income tax regulations, which may differ from GAAP.
Capital accounts within the financial statements are adjusted for permanent book-tax differences. These adjustments have no impact on net assets or the results of operations. Temporary book-tax differences will reverse in a subsequent period.
Book-tax differences are primarily due to foreign currency transactions, capital loss carryforwards, and losses deferred due to wash sales and excise tax regulations.
Annual Report
3. Significant Accounting Policies - continued
Income Tax Information and Distributions to Shareholders - continued
The federal tax cost of investment securities and unrealized appreciation (depreciation) as of period end were as follows:
Gross unrealized appreciation | $ 47,226,795 |
Gross unrealized depreciation | (8,660,774) |
Net unrealized appreciation (depreciation) | $ 38,566,021 |
Tax Cost | $ 194,652,248 |
The tax-based components of distributable earnings as of period end were as follows:
Capital loss carryforward | $ (15,606,914) |
Net unrealized appreciation (depreciation) | $ 38,566,021 |
The tax character of distributions paid was as follows:
| December 31, 2010 | December 31, 2009 |
Ordinary Income | $ 2,468,435 | $ 1,808,445 |
4. Operating Policies.
Restricted Securities. The Fund may invest in securities that are subject to legal or contractual restrictions on resale. These securities generally may be resold in transactions exempt from registration or to the public if the securities are registered. Disposal of these securities may involve time-consuming negotiations and expense, and prompt sale at an acceptable price may be difficult. Information regarding restricted securities is included at the end of the Fund's Schedule of Investments.
5. Purchases and Sales of Investments.
Purchases and sales of securities, other than short-term securities, aggregated $184,990,894 and $90,047,489, respectively.
6. Fees and Other Transactions with Affiliates.
Management Fee. FMR and its affiliates provide the Fund with investment management related services for which the Fund pays a monthly management fee. The management fee is the sum of an individual fund fee rate that is based on an annual rate of .30% of the Fund's average net assets and a group fee rate that averaged .26% during the period. The group fee rate is based upon the average net assets of all the mutual funds advised by FMR. The group fee rate decreases as assets under management increase and increases as assets under management decrease. For the period, the total annual management fee rate was .56% of the Fund's average net assets.
Distribution and Service Plan Fees. In accordance with Rule 12b-1 of the 1940 Act, the Fund has adopted separate 12b-1 Plans for each Service Class of shares. Each Service Class pays Fidelity Distributors Corporation (FDC), an affiliate of FMR, a service fee. For the period, the service fee is based on an annual rate of .10% of Service Class' average net assets and .25% of Service Class 2's average net assets.
For the period, total fees, all of which were re-allowed to insurance companies for the distribution of shares and providing shareholder support services were as follows:
Service Class | $ 945 |
Service Class 2 | 124,842 |
| $ 125,787 |
Annual Report
Notes to Financial Statements - continued
6. Fees and Other Transactions with Affiliates - continued
Transfer Agent Fees. Fidelity Investments Institutional Operations Company, Inc. (FIIOC), an affiliate of FMR, is the Fund's transfer, dividend disbursing, and shareholder servicing agent. FIIOC receives an asset-based fee with respect to each class. Each class (with the exception of Investor Class) pays a transfer agent fee, excluding out of pocket expenses, equal to an annual rate of .07% of average net assets. Investor Class pays a monthly asset-based transfer agent fee of .15% of average net assets. In addition, FIIOC receives an asset-based fee of .01% of average net assets for typesetting, printing and mailing of shareholder reports, except proxy statements. FIIOC has agreed to voluntarily waive this fee until December 31, 2010. (See Note 9: Expense Reductions.) For the period, transfer agent fees for each class, including printing and out of pocket expenses, were as follows:
Initial Class | $ 40,889 |
Service Class | 764 |
Service Class 2 | 38,864 |
Investor Class | 76,436 |
| $ 156,953 |
Accounting and Security Lending Fees. Fidelity Service Company, Inc. (FSC), an affiliate of FMR, maintains the Fund's accounting records. The accounting fee is based on the level of average net assets for the month. Under a separate contract, FSC administers the security lending program. The security lending fee is based on the number and duration of lending transactions.
Brokerage Commissions. The Fund placed a portion of its portfolio transactions with brokerage firms which are affiliates of the investment adviser. The commissions paid to these affiliated firms were $6,522 for the period.
7. Committed Line of Credit.
The Fund participates with other funds managed by FMR or an affiliate in a $3.75 billion credit facility (the "line of credit") to be utilized for temporary or emergency purposes to fund shareholder redemptions or for other short-term liquidity purposes. The Fund has agreed to pay commitment fees on its pro-rata portion of the line of credit, which amounted to $448 and is reflected in Miscellaneous expenses on the Statement of Operations. During the period, there were no borrowings on this line of credit.
8. Security Lending.
The Fund lends portfolio securities through a lending agent from time to time in order to earn additional income. The lending agent may loan securities to certain qualified borrowers, including Fidelity Capital Markets (FCM), a broker-dealer affiliated with the Fund. On the settlement date of the loan, the Fund receives collateral (in the form of U.S. Treasury obligations, letters of credit and/or cash) against the loaned securities and maintains collateral in an amount not less than 100% of the market value of the loaned securities during the period of the loan. The market value of the loaned securities is determined at the close of business of the Fund and any additional required collateral is delivered to the Fund on the next business day. If the borrower defaults on its obligation to return the securities loaned because of insolvency or other reasons, a fund could experience delays and costs in recovering the securities loaned or in gaining access to the collateral. Any cash collateral received is invested in the Fidelity Securities Lending Cash Central Fund. The value of loaned securities and cash collateral at period end are disclosed on the Fund's Statement of Assets and Liabilities. Security lending income represents the income earned on investing cash collateral, less rebates paid to borrowers and lending agent fees associated with the loan, plus any premium payments received for lending certain types of securities. Security lending income is presented in the Statement of Operations as a component of income from Fidelity Central Funds. Total security lending income during the period amounted to $21,022. During the period, there were no securities loaned to FCM.
9. Expense Reductions.
FMR or its affiliates agreed to waive certain fees during the period as noted in the table below.
Initial Class | $ 3,614 |
Service Class | 68 |
Service Class 2 | 3,643 |
Investor Class | 3,357 |
| $ 10,682 |
Many of the brokers with whom FMR places trades on behalf of the Fund provided services to the Fund in addition to trade execution. These services included payments of certain expenses on behalf of the Fund totaling $13,966 for the period.
Annual Report
10. Distributions to Shareholders.
Distributions to shareholders of each class were as follows:
Years ended December 31, | 2010 | 2009 |
From net investment income | | |
Initial Class | $ 709,586 | $ 903,193 |
Service Class | 10,202 | 22,932 |
Service Class 2 | 1,025,592 | 186,016 |
Investor Class | 723,055 | 696,304 |
Total | $ 2,468,435 | $ 1,808,445 |
11. Share Transactions.
Transactions for each class of shares were as follows:
| Shares | Dollars |
Years ended December 31, | 2010 | 2009 | 2010 | 2009 |
Initial Class | | | | |
Shares sold | 1,702,146 | 949,053 | $ 21,466,837 | $ 7,760,404 |
Reinvestment of distributions | 54,676 | 91,070 | 709,586 | 903,194 |
Shares redeemed | (1,525,235) | (1,274,438) | (18,550,051) | (10,025,868) |
Net increase (decrease) | 231,587 | (234,315) | $ 3,626,372 | $ (1,362,270) |
Service Class | | | | |
Shares sold | - | - | $ - | $ - |
Reinvestment of distributions | 811 | 2,420 | 10,202 | 22,932 |
Shares redeemed | (40,685) | (76,755) | (503,857) | (593,994) |
Net increase (decrease) | (39,874) | (74,335) | $ (493,655) | $ (571,062) |
Service Class 2 | | | | |
Shares sold | 7,627,300 | 1,276,261 | $ 90,519,353 | $ 9,920,540 |
Reinvestment of distributions | 77,314 | 18,182 | 1,025,592 | 186,016 |
Shares redeemed | (1,356,033) | (738,205) | (16,978,350) | (6,212,786) |
Net increase (decrease) | 6,348,581 | 556,238 | $ 74,566,595 | $ 3,893,770 |
Investor Class | | | | |
Shares sold | 2,227,709 | 1,144,876 | $ 28,497,534 | $ 9,684,422 |
Reinvestment of distributions | 55,531 | 69,851 | 723,055 | 696,304 |
Shares redeemed | (943,977) | (903,755) | (11,594,379) | (7,066,444) |
Net increase (decrease) | 1,339,263 | 310,972 | $ 17,626,210 | $ 3,314,282 |
12. Other.
The Fund's organizational documents provide former and current trustees and officers with a limited indemnification against liabilities arising in connection with the performance of their duties to the Fund. In the normal course of business, the Fund may also enter into contracts that provide general indemnifications. The Fund's maximum exposure under these arrangements is unknown as this would be dependent on future claims that may be made against the Fund. The risk of material loss from such claims is considered remote.
At the end of the period, FMR or its affiliates were the owners of record of 53% of the total outstanding shares of the Fund.
Annual Report
Report of Independent Registered Public Accounting Firm
To the Trustees of Variable Insurance Products Fund IV and the Shareholders of VIP Real Estate Portfolio:
In our opinion, the accompanying statement of assets and liabilities, including the schedule of investments, and the related statements of operations and of changes in net assets and the financial highlights present fairly, in all material respects, the financial position of VIP Real Estate Portfolio (a fund of Variable Insurance Products Fund IV) at December 31, 2010, the results of its operations for the year then ended, the changes in its net assets for each of the two years in the period then ended and the financial highlights for each of the five years in the period then ended, in conformity with accounting principles generally accepted in the United States of America. These financial statements and financial highlights (hereafter referred to as "financial statements") are the responsibility of the VIP Real Estate Portfolio's management. Our responsibility is to express an opinion on these financial statements based on our audits. We conducted our audits of these financial statements in accordance with the standards of the Public Company Accounting Oversight Board (United States). Those standards require that we plan and perform the audit to obtain reasonable assurance about whether the financial statements are free of material misstatement. An audit includes examining, on a test basis, evidence supporting the amounts and disclosures in the financial statements, assessing the accounting principles used and significant estimates made by management, and evaluating the overall financial statement presentation. We believe that our audits, which included confirmation of securities at December 31, 2010 by correspondence with the custodian and brokers, provide a reasonable basis for our opinion.
/s/ PricewaterhouseCoopers LLP
PricewaterhouseCoopers LLP
Boston, Massachusetts
February 17, 2011
Annual Report
The Trustees, Members of the Advisory Board, and executive officers of the trust and fund, as applicable, are listed below. The Board of Trustees governs the fund and is responsible for protecting the interests of shareholders. The Trustees are experienced executives who meet periodically throughout the year to oversee the fund's activities, review contractual arrangements with companies that provide services to the fund, oversee management of the risks associated with such activities and contractual arrangements, and review the fund's performance. Except for James C. Curvey, each of the Trustees oversees 219 funds advised by FMR or an affiliate. Mr. Curvey oversees 408 funds advised by FMR or an affiliate.
The Trustees hold office without limit in time except that (a) any Trustee may resign; (b) any Trustee may be removed by written instrument, signed by at least two-thirds of the number of Trustees prior to such removal; (c) any Trustee who requests to be retired or who has become incapacitated by illness or injury may be retired by written instrument signed by a majority of the other Trustees; and (d) any Trustee may be removed at any special meeting of shareholders by a two-thirds vote of the outstanding voting securities of the trust. Each Trustee who is not an interested person (as defined in the 1940 Act) (Independent Trustee), shall retire not later than the last day of the calendar year in which his or her 72nd birthday occurs. The Independent Trustees may waive this mandatory retirement age policy with respect to individual Trustees. The executive officers and Advisory Board Members hold office without limit in time, except that any officer and Advisory Board Member may resign or may be removed by a vote of a majority of the Trustees at any regular meeting or any special meeting of the Trustees. Except as indicated, each individual has held the office shown or other offices in the same company for the past five years.
Experience, Skills, Attributes, and Qualifications of the Fund's Trustees. The Governance and Nominating Committee has adopted a statement of policy that describes the experience, qualifications, attributes, and skills that are necessary and desirable for potential Independent Trustee candidates (Statement of Policy). The Board believes that each Trustee satisfied at the time he or she was initially elected or appointed a Trustee, and continues to satisfy, the standards contemplated by the Statement of Policy. The Governance and Nominating Committee also engages professional search firms to help identify potential Independent Trustee candidates who have the experience, qualifications, attributes, and skills consistent with the Statement of Policy. From time to time, additional criteria based on the composition and skills of the current Independent Trustees, as well as experience or skills that may be appropriate in light of future changes to board composition, business conditions, and regulatory or other developments, have also been considered by the professional search firms and the Governance and Nominating Committee. In addition, the Board takes into account the Trustees' commitment and participation in Board and committee meetings, as well as their leadership of standing and ad hoc committees throughout their tenure.
In determining that a particular Trustee was and continues to be qualified to serve as a Trustee, the Board has considered a variety of criteria, none of which, in isolation, was controlling. The Board believes that, collectively, the Trustees have balanced and diverse experience, qualifications, attributes, and skills, which allow the Board to operate effectively in governing the fund and protecting the interests of shareholders. Information about the specific experience, skills, attributes, and qualifications of each Trustee, which in each case led to the Board's conclusion that the Trustee should serve (or continue to serve) as a trustee of the fund, is provided below.
Board Structure and Oversight Function. James C. Curvey is an interested person (as defined in the 1940 Act) and currently serves as Acting Chairman. The Trustees have determined that an interested Chairman is appropriate and benefits shareholders because an interested Chairman has a personal and professional stake in the quality and continuity of services provided to the fund. Independent Trustees exercise their informed business judgment to appoint an individual of their choosing to serve as Chairman, regardless of whether the Trustee happens to be independent or a member of management. The Independent Trustees have determined that they can act independently and effectively without having an Independent Trustee serve as Chairman and that a key structural component for assuring that they are in a position to do so is for the Independent Trustees to constitute a substantial majority for the Board. The Independent Trustees also regularly meet in executive session. Ned C. Lautenbach serves as Chairman of the Independent Trustees and as such (i) acts as a liaison between the Independent Trustees and management with respect to matters important to the Independent Trustees and (ii) with management prepares agendas for Board meetings.
Fidelity funds are overseen by different Boards of Trustees. The fund's Board oversees Fidelity's equity and high income funds and another Board oversees Fidelity's investment-grade bond, money market, and asset allocation funds. The asset allocation funds may invest in Fidelity funds overseen by the fund's Board. The use of separate Boards, each with its own committee structure, allows the Trustees of each group of Fidelity funds to focus on the unique issues of the funds they oversee, including common research, investment, and operational issues. On occasion, the separate Boards establish joint committees to address issues of overlapping consequences for the Fidelity funds overseen by each Board.
The Trustees operate using a system of committees to facilitate the timely and efficient consideration of all matters of importance to the Trustees, the fund, and fund shareholders and to facilitate compliance with legal and regulatory requirements and oversight of the fund's activities and associated risks. The Board, acting through its committees, has charged FMR and its affiliates with (i) identifying events or circumstances the occurrence of which could have demonstrably adverse effects on the fund's business and/or reputation; (ii) implementing processes and controls to lessen the possibility that such events or circumstances occur or to mitigate the effects of such events or circumstances if they do occur; and (iii) creating and maintaining a system designed to evaluate continuously business and market conditions in order to facilitate the identification and implementation processes described in (i) and (ii) above. Because the day-to-day operations and activities of the fund are carried out by or through FMR, its affiliates and other service providers, the fund's exposure to risks is mitigated but not eliminated by the processes overseen by the Trustees. While each of the Board's committees has responsibility for overseeing different aspects of the fund's activities, oversight is exercised primarily through the Operations, Audit, and Compliance Committees. Appropriate personnel, including but not limited to the fund's Chief Compliance Officer (CCO), FMR's internal auditor, the independent accountants, the fund's Treasurer and portfolio management personnel, make periodic reports to the Board's committees, as appropriate. The responsibilities of each committee, including their oversight responsibilities, are described further under "Standing Committees of the Fund's Trustees."
Annual Report
Trustees and Officers - continued
The fund's Statement of Additional Information (SAI) includes more information about the Trustees. To request a free copy, call Fidelity at 1-877-208-0098.
Interested Trustees*:
Correspondence intended for each Trustee who is an interested person may be sent to Fidelity Investments, 82 Devonshire Street, Boston, Massachusetts 02109.
Name, Age; Principal Occupations and Other Relevant Experience+ |
James C. Curvey (75) |
| Year of Election or Appointment: 2007 Mr. Curvey is Trustee and Acting Chairman of the Board of Trustees of certain Trusts. Mr. Curvey also serves as Trustee (2007-present) of other investment companies advised by FMR. Mr. Curvey is a Director of Fidelity Investments Money Management, Inc. (2009-present), Director of Fidelity Research & Analysis Co. (2009-present) and Director of FMR and FMR Co., Inc. (2007-present). Mr. Curvey is also Vice Chairman (2007-present) and Director of FMR LLC. In addition, Mr. Curvey serves as an Overseer for the Boston Symphony Orchestra and a member of the Trustees of Villanova University. Previously, Mr. Curvey was the Vice Chairman (2006-2007) and Director (2000-2007) of FMR Corp. |
Ronald P. O'Hanley (54) |
| Year of Election or Appointment: 2011 Mr. O'Hanley is President of Fidelity Asset Management and Corporate Services and a member of Fidelity's Executive Committee (2010-present). Previously, Mr. O'Hanley served as President and Chief Executive Officer of BNY Mellon Asset Management (2007-2010). Mr. O'Hanley also served as Vice Chairman of Bank New York Mellon Corp. and a member of that firm's Executive Committee. Prior to the 2007 merger of The Bank of New York and Mellon Financial Corporation, he was Vice Chairman of Mellon Financial Corporation and President and Chief Executive Officer of Mellon Asset Management. He joined Mellon in February 1997. Mr. O'Hanley currently serves as Chairman of the Boston Public Library Foundation Board of Directors and sits on the Board of Directors of Beth Israel Deaconess Medical Center, the Board of Trustees of the Marine Biological Laboratory and the Advisory Board of the Maxwell School of Citizenship and Public Administration at Syracuse University. Mr. O'Hanley also chairs the Council on Asset Management for the Financial Services Roundtable and is a member of the Board of Directors of Institutional Investor's U.S. Institute. |
* Trustees have been determined to be "Interested Trustees" by virtue of, among other things, their affiliation with the trust or various entities under common control with FMR.
+ The information above includes each Trustee's principal occupation during the last five years and other information relating to the experience, attributes, and skills relevant to each Trustee's qualifications to serve as a Trustee, which led to the conclusion that each Trustee should serve as a Trustee for the fund.
Independent Trustees:
Correspondence intended for each Independent Trustee (that is, the Trustees other than the Interested Trustees) may be sent to Fidelity Investments, P.O. Box 55235, Boston, Massachusetts 02205-5235.
Name, Age; Principal Occupations and Other Relevant Experience+ |
Dennis J. Dirks (62) |
| Year of Election or Appointment: 2005 Prior to his retirement in May 2003, Mr. Dirks was Chief Operating Officer and a member of the Board of The Depository Trust & Clearing Corporation (DTCC). He also served as President, Chief Operating Officer, and Board member of The Depository Trust Company (DTC) and President and Board member of the National Securities Clearing Corporation (NSCC). In addition, Mr. Dirks served as Chief Executive Officer and Board member of the Government Securities Clearing Corporation, Chief Executive Officer and Board member of the Mortgage-Backed Securities Clearing Corporation, as a Trustee and a member of the Finance Committee of Manhattan College (2005-2008), and as a Trustee and a member of the Finance Committee of AHRC of Nassau County (2006-2008). Mr. Dirks is a member of the Independent Directors Council (IDC) Governing Council (2010-Present) and Board of Directors for The Brookville Center for Children's Services, Inc. (2009-present). |
Alan J. Lacy (57) |
| Year of Election or Appointment: 2008 Mr. Lacy serves as Senior Adviser (2007-present) of Oak Hill Capital Partners, L.P. (private equity). Mr. Lacy also served as Chief Executive Officer (2000-2005) and Vice Chairman (2005-2006) of Sears Holdings Corporation and Sears, Roebuck and Co. (retail). In addition, Mr. Lacy serves as a member of the Board of Directors of The Western Union Company (global money transfer, 2006-present) and Bristol-Myers Squibb Company (global pharmaceuticals, 2007-present). Mr. Lacy is Chairman (2008-present) and a member (2006-present) of the Board of Trustees of The National Parks Conservation Association. |
Ned C. Lautenbach (66) |
| Year of Election or Appointment: 2000 Mr. Lautenbach is Chairman of the Independent Trustees of the Equity and High Income Funds (2006-present). Mr. Lautenbach currently serves as the Lead Director of the Eaton Corporation Board of Directors (diversified industrial, 1997-present). Mr. Lautenbach is also a member of the Board of Directors of the Philharmonic Center for the Arts in Naples, Florida (1999-
present); a member of the Board of Trustees of Fairfield University (2005-present); and a member of the Council on Foreign Relations (1994-present). Previously, Mr. Lautenbach was a Partner/Advisory Partner at Clayton, Dubilier & Rice, Inc. (private equity investment, 1998-2010), as well as a Director of Sony Corporation (2006-2007). |
Joseph Mauriello (66) |
| Year of Election or Appointment: 2008 Prior to his retirement in January 2006, Mr. Mauriello served in numerous senior management positions including Deputy Chairman and Chief Operating Officer (2004-2005), and Vice Chairman of Financial Services (2002-2004) of KPMG LLP US (professional services, 1965-2005). Mr. Mauriello currently serves as a member of the Board of Directors of XL Group plc. (global insurance and re-insurance, 2006-present) and of Arcadia Resources Inc. (health care services and products, 2007-present). Previously, Mr. Mauriello served as a Director of the Hamilton Funds of the Bank of New York (2006-2007). |
Cornelia M. Small (66) |
| Year of Election or Appointment: 2005 Ms. Small is a member of the Board of Directors of the Teagle Foundation (2009-present). Ms. Small is also a member of the Investment Committee, and Chair (2008-present) and a member of the Board of Trustees of Smith College. In addition, Ms. Small serves on the Investment Committee of the Berkshire Taconic Community Foundation (2008-present). Previously, Ms. Small served as Chairperson of the Investment Committee (2002-2008) of Smith College. In addition, Ms. Small served as Chief Investment Officer, Director of Global Equity Investments, and a member of the Board of Directors of Scudder, Stevens & Clark and Scudder Kemper Investments. |
William S. Stavropoulos (71) |
| Year of Election or Appointment: 2001 Mr. Stavropoulos is Vice Chairman of the Independent Trustees of the Equity and High Income Funds (2006-present). Mr. Stavropoulos serves as President and Founder of the Michigan Baseball Foundation, the Great Lakes Loons (2007-present). Mr. Stavropoulos is Chairman Emeritus of the Board of Directors of The Dow Chemical Company, where he previously served in numerous senior management positions, including President, CEO (1995-2000; 2002-2004), Chairman of the Executive Committee (2000-2006), and as a member of the Board of Directors (1990-2006). Currently, Mr. Stavropoulos is Chairman of Univar (global distributor of commodity and specialty chemicals, 2010-present), a Director of Teradata Corporation (data warehousing and technology solutions, 2008-present), Chemical Financial Corporation, Maersk Inc. (industrial conglomerate), Tyco International, Inc. (multinational manufacturing and services, 2007-present), and a member of the Advisory Board for Metalmark Capital (private equity investment, 2005-present). Mr. Stavropoulos is a special advisor to Clayton, Dubilier & Rice, LLC (private equity investment). In addition, Mr. Stavropoulos is a member of the University of Notre Dame Advisory Council for the College of Science. |
David M. Thomas (61) |
| Year of Election or Appointment: 2008 Previously, Mr. Thomas served as Executive Chairman (2005-2006) and Chairman and Chief Executive Officer (2000-2005) of IMS Health, Inc. (pharmaceutical and healthcare information solutions). In addition, Mr. Thomas serves as a member of the Board of Directors of Fortune Brands, Inc. (consumer products), and Interpublic Group of Companies, Inc. (marketing communication, 2004-present). |
Michael E. Wiley (60) |
| Year of Election or Appointment: 2008 Mr. Wiley also serves as a Director of Asia Pacific Exploration Consolidated (international oil and gas exploration and production, 2008-present). Mr. Wiley serves as a Director of Tesoro Corporation (independent oil refiner and marketer, 2005-present), and a Director of Bill Barrett Corporation (exploration and production, 2005-present). In addition, Mr. Wiley also serves as a Director of Post Oak Bank (privately-held bank, 2004-present). Previously, Mr. Wiley served as a member of the Board of Trustees of the University of Tulsa (2000-2006; 2007-2010), as a Senior Energy Advisor of Katzenbach Partners, LLC (consulting, 2006-2007), as an Advisory Director of Riverstone Holdings (private investment), Chairman, President, and CEO of Baker Hughes, Inc. (oilfield services, 2000-2004), and as Director of Spinnaker Exploration Company (exploration and production, 2001-2005). |
+ The information above includes each Trustee's principal occupation during the last five years and other information relating to the experience, attributes, and skills relevant to each Trustee's qualifications to serve as a Trustee, which led to the conclusion that each Trustee should serve as a Trustee for the fund.
Advisory Board Members and Executive Officers:
Correspondence intended for each executive officer, Edward C. Johnson 3d, and Peter S. Lynch may be sent to Fidelity Investments, 82 Devonshire Street, Boston, Massachusetts 02109.
Name, Age; Principal Occupation |
Edward C. Johnson 3d (80) |
| Year of Election or Appointment: 2011 Member of the Advisory Board of Fidelity's Equity and High Income Funds. Formerly Trustee and Chairman of the Board of Trustees of certain Trusts, Mr. Johnson serves as Chief Executive Officer, Chairman, and a Director of FMR LLC; Chairman and a Director of FMR; and Chairman and a Director of FMR Co., Inc. In addition, Mr. Johnson serves as Chairman and Director of FIL Limited. Previously, Mr. Johnson served as President of FMR LLC (2006-2007). |
Peter S. Lynch (66) |
| Year of Election or Appointment: 2003 Member of the Advisory Board of Fidelity's Equity and High Income Funds. Mr. Lynch is Vice Chairman and a Director of FMR and FMR Co., Inc. In addition, Mr. Lynch serves as a Trustee of Boston College and as the Chairman of the Inner-City Scholarship Fund. Previously, Mr. Lynch served on the Special Olympics International Board of Directors (1997-2006). |
Kenneth B. Robins (41) |
| Year of Election or Appointment: 2008 President and Treasurer of Fidelity's Equity and High Income Funds. Mr. Robins also serves as President and Treasurer (2010-
present) and Assistant Treasurer (2009-present) of other Fidelity funds and is an employee of Fidelity Investments (2004-present). Previously, Mr. Robins served as Deputy Treasurer of the Fidelity funds (2005-2008) and Treasurer and Chief Financial Officer of The North Carolina Capital Management Trust: Cash and Term Portfolios (2006-2008). |
Brian B. Hogan (46) |
| Year of Election or Appointment: 2009 Vice President of certain Equity Funds and Vice President of Sector Funds. Mr. Hogan also serves as President of FMR's Equity Division (2009-present). Previously, Mr. Hogan served as Senior Vice President, Equity Research of FMR (2006-2009) and as a portfolio manager. |
Christopher S. Bartel (39) |
| Year of Election or Appointment: 2009 Vice President of Fidelity's Sector and Real Estate Equity Funds. Mr. Bartel also serves as Senior Vice President of Equity Research (2009-present). Previously, Mr. Bartel served as Managing Director of Research (2006-2009) and an analyst and portfolio manager (2000-2006). |
Scott C. Goebel (42) |
| Year of Election or Appointment: 2008 Secretary and Chief Legal Officer (CLO) of the Fidelity funds. Mr. Goebel also serves as Secretary and CLO of The North Carolina Capital Management Trust: Cash and Term Portfolio (2008-present); General Counsel, Secretary, and Senior Vice President of FMR (2008-present) and FMR Co., Inc. (2008-present); Deputy General Counsel of FMR LLC; Chief Legal Officer of Fidelity Management & Research (Hong Kong) Limited (2008-present) and Assistant Secretary of Fidelity Management & Research (Japan) Inc. (2008-present), Fidelity Investments Money Management, Inc. (2008-present), Fidelity Management & Research (U.K.) Inc. (2008-present), and Fidelity Research and Analysis Company (2008-present). Previously, Mr. Goebel served as Assistant Secretary of the Funds (2007-2008) and as Vice President and Secretary of Fidelity Distributors Corporation (FDC) (2005-2007). |
William C. Coffey (41) |
| Year of Election or Appointment: 2009 Assistant Secretary of Fidelity's Equity and High Income Funds. Mr. Coffey also serves as Senior Vice President and Deputy General Counsel of FMR LLC (2010-present), and is an employee of Fidelity Investments. Previously, Mr. Coffey served as Vice President and Associate General Counsel of FMR LLC (2005-2009). |
Holly C. Laurent (56) |
| Year of Election or Appointment: 2008 Anti-Money Laundering (AML) Officer of the Fidelity funds. Ms. Laurent also serves as AML Officer of The North Carolina Capital Management Trust: Cash and Term Portfolio (2008-present) and is an employee of Fidelity Investments. Previously, Ms. Laurent was Senior Vice President and Head of Legal for Fidelity Business Services India Pvt. Ltd. (2006-2008), and Senior Vice President, Deputy General Counsel and Group Head for FMR LLC (2005-2006). |
Christine Reynolds (52) |
| Year of Election or Appointment: 2008 Chief Financial Officer of the Fidelity funds. Ms. Reynolds became President of Fidelity Pricing and Cash Management Services (FPCMS) in August 2008. Ms. Reynolds served as Chief Operating Officer of FPCMS (2007-2008). Previously, Ms. Reynolds served as President, Treasurer, and Anti-Money Laundering officer of the Fidelity funds (2004-2007). |
Kenneth A. Rathgeber (63) |
| Year of Election or Appointment: 2004 Chief Compliance Officer of Fidelity's Equity and High Income Funds. Mr. Rathgeber is Chief Compliance Officer of Fidelity Management & Research (Hong Kong) Limited (2008-present), Fidelity Management & Research (Japan) Inc. (2008-present), FMR (2005-present), FMR Co., Inc. (2005-present), Fidelity Management & Research (U.K.) Inc. (2005-present), Fidelity Research & Analysis Company (2005-present), Fidelity Investments Money Management, Inc. (2005-present), Pyramis Global Advisors, LLC (2005-present), and Strategic Advisers, Inc. (2005-present). |
Jeffrey S. Christian (49) |
| Year of Election or Appointment: 2009 Deputy Treasurer of the Fidelity funds. Mr. Christian is an employee of Fidelity Investments. Previously, Mr. Christian served as Chief Financial Officer (2008-2009) of certain Fidelity funds and Senior Vice President of Fidelity Pricing and Cash Management Services (FPCMS) (2004-2009). |
Bryan A. Mehrmann (49) |
| Year of Election or Appointment: 2005 Deputy Treasurer of the Fidelity funds. Mr. Mehrmann is an employee of Fidelity Investments. |
Adrien E. Deberghes (43) |
| Year of Election or Appointment: 2008 Deputy Treasurer of Fidelity's Equity and High Income Funds. Mr. Deberghes also serves as Assistant Treasurer of other Fidelity funds (2010-present) and is an employee of Fidelity Investments (2008-present). Previously, Mr. Deberghes served as Senior Vice President of Mutual Fund Administration at State Street Corporation (2007-2008), Senior Director of Mutual Fund Administration at Investors Bank & Trust (2005-2007), and Director of Finance for Dunkin' Brands (2000-2005). |
Stephanie J. Dorsey (41) |
| Year of Election or Appointment: 2010 Assistant Treasurer of Fidelity's Equity and High Income Funds. Ms. Dorsey also serves as Deputy Treasurer of other Fidelity funds (2008-present) and is an employee of Fidelity Investments (2008-present). Previously, Ms. Dorsey served as Treasurer (2004-2008) of the JPMorgan Mutual Funds and Vice President (2004-2008) of JPMorgan Chase Bank. |
John R. Hebble (52) |
| Year of Election or Appointment: 2009 Assistant Treasurer of Fidelity's Equity and High Income Funds. Mr. Hebble also serves as Treasurer and Chief Financial Officer of The North Carolina Capital Management Trust: Cash and Term Portfolio (2008-present), President and Treasurer of other Fidelity funds (2008-present) and is an employee of Fidelity Investments. |
Gary W. Ryan (52) |
| Year of Election or Appointment: 2005 Assistant Treasurer of the Fidelity funds. Mr. Ryan is an employee of Fidelity Investments. Previously, Mr. Ryan served as Vice President of Fund Reporting in Fidelity Pricing and Cash Management Services (FPCMS) (1999-2005). |
Jonathan Davis (42) |
| Year of Election or Appointment: 2010 Assistant Treasurer of the Fidelity funds. Mr. Davis is an employee of Fidelity Investments. Previously, Mr. Davis served as Vice President and Associate General Counsel of FMR LLC (2003-2010). |
Annual Report
Board Approval of Investment Advisory Contracts and Management Fees
VIP Real Estate Portfolio
Each year, the Board of Trustees, including the Independent Trustees (together, the Board), votes on the renewal of the management contract and sub-advisory agreements (together, the Advisory Contracts) for the fund. The Board, assisted by the advice of fund counsel and Independent Trustees' counsel, requests and considers a broad range of information relevant to the renewal of the Advisory Contracts throughout the year.
The Board meets regularly and considers at each of its meetings factors that are relevant to its annual consideration of the renewal of the fund's Advisory Contracts, including the services and support provided to the fund and its shareholders. The Board has established various standing committees, each composed of Independent Trustees with varying backgrounds, to which the Board has assigned specific subject matter responsibilities in order to enhance effective decision-making by the Board. The Board, acting directly and through its Committees, requests and receives information concerning the annual consideration of the renewal of the fund's Advisory Contracts. The Board also meets as needed to consider matters specifically related to the Board's annual consideration of the renewal of Advisory Contracts. Members of the Board may also meet with trustees of other Fidelity funds through ad hoc joint committees to discuss certain matters relevant to the Fidelity funds.
At its July 2010 meeting, the Board of Trustees, including the Independent Trustees, unanimously determined to renew the fund's Advisory Contracts. In reaching its determination, the Board considered all factors it believed relevant, including (i) the nature, extent, and quality of the services to be provided to the fund and its shareholders (including the investment performance of the fund); (ii) the competitiveness of the fund's management fee and total expenses; (iii) the total costs of the services to be provided by and the profits to be realized by Fidelity from its relationship with the fund; (iv) the extent to which economies of scale would be realized as the fund grows; and (v) whether fee levels reflect these economies of scale, if any, for the benefit of fund shareholders.
In considering whether to renew the Advisory Contracts for the fund, the Board reached a determination, with the assistance of fund counsel and Independent Trustees' counsel and through the exercise of its business judgment, that the renewal of the Advisory Contracts is in the best interests of fund shareholders and that the compensation to be received by Fidelity under the management contract is fair and reasonable. The Board's decision to renew the Advisory Contracts was not based on any single factor noted above, but rather was based on a comprehensive consideration of all the information provided to the Board at its meetings throughout the year. The Board, in reaching its determination to renew the Advisory Contracts, is aware that shareholders in the fund have a broad range of investment choices available to them, including a wide choice among mutual funds offered by Fidelity's competitors, and that the fund's shareholders, with the opportunity to review and weigh the disclosure provided by the fund in its prospectus and other public disclosures, have chosen to invest in this fund, managed by Fidelity.
Nature, Extent, and Quality of Services Provided. The Board considered the staffing within the investment adviser, FMR, and the sub-advisers (together, the Investment Advisers), including the backgrounds of the fund's investment personnel and the fund's investment objective and discipline. The Independent Trustees also had discussions with senior management of Fidelity's investment operations and investment groups. The Board considered the structure of the portfolio manager compensation program and whether this structure provides appropriate incentives to act in the best interest of the fund.
Resources Dedicated to Investment Management and Support Services. The Board and the equity research subcommittee of the Board's Fund Oversight Committee reviewed the size, education, and experience of the Investment Advisers' investment staff, their use of technology, and the Investment Advisers' approach to recruiting, training, and retaining portfolio managers and other research, advisory, and management personnel. The Board noted that Fidelity's analysts have access to a variety of technological tools and market and securities data that enable them to perform both fundamental and quantitative analysis and to specialize in various disciplines. The Board considered Fidelity's extensive global research capabilities that enable the Investment Advisers to aggregate data from various sources in an effort to produce positive investment results. The Board also considered that Fidelity's portfolio managers and analysts have access to daily portfolio attribution that allows for monitoring of a fund's portfolio, as well as an electronic communication system that provides immediate real-time access to research concerning issuers and credit enhancers. The Board noted FMR's continued focus on strengthening the organization and discipline of equity portfolio management and research.
Shareholder and Administrative Services. The Board considered (i) the nature, extent, quality, and cost of advisory, administrative, and shareholder services performed by the Investment Advisers and their affiliates under the Advisory Contracts and under separate agreements covering transfer agency, pricing and bookkeeping, and securities lending services for the fund; (ii) the nature and extent of the investment adviser's supervision of third party service providers, principally custodians and subcustodians; and (iii) the resources devoted to, and the record of compliance with, the fund's compliance policies and procedures. The Board also reviewed the allocation of fund brokerage, including allocations to brokers affiliated with the Investment Advisers, the use of brokerage commissions to pay fund expenses, and the use of "soft" commission dollars to pay for research services.
The Board noted that the growth of fund assets over time across the complex allows Fidelity to reinvest in the development of services designed to enhance the value or convenience of the Fidelity funds as investment vehicles. These services include 24-hour access to account information and market information through phone representatives and over the Internet, and investor education materials and asset allocation tools.
Investment in a Large Fund Family. The Board considered the benefits to shareholders of investing in a Fidelity fund, including the benefits of investing in a fund that is part of a large family of funds offering a variety of investment disciplines and providing a large variety of mutual fund investor services. The Board noted that Fidelity had taken, or had made recommendations that resulted in the Fidelity funds taking, a number of actions over the previous year that benefited particular funds, including (i) dedicating additional resources to investment research and restructuring and broadening the focus of the investment research teams; (ii) bolstering the senior management team that oversees asset management; (iii) launching Class F of certain funds as a lower-fee class available to Freedom K and Freedom Index Funds; (iv) lowering the initial investment minimums and ongoing balance requirements for Real Estate High Income Fund; (v) eliminating subsequent purchase minimums for all funds and adding a waiver of the investment minimum requirement for new accounts opened with the proceeds of a systematic withdrawal plan; (vi) eliminating the withdrawal minimum and maximum limits for systematic withdrawals from Advisor funds; (vii) expanding sales load waivers on Class A shares for Destiny Planholders and expanding Institutional Class eligibility for Class O Destiny Planholders; and (viii) changing certain Class A and Class T sales charge structures to further align them with industry practices.
Annual Report
Board Approval of Investment Advisory Contracts and Management Fees - continued
Investment Performance. The Board considered whether the fund has operated in accordance with its investment objective, as well as its record of compliance with its investment restrictions. It also reviewed the fund's absolute investment performance for each class, as well as the fund's relative investment performance for each class measured over multiple periods against a broad-based securities market index. The Board noted that FMR does not believe that a meaningful peer group exists against which to compare the fund's performance. The following charts considered by the Board show, over the one-, three-, and five-year periods ended December 31, 2009, the cumulative total returns of Initial Class and Service Class 2 of the fund and the cumulative total returns of a broad-based securities market index ("benchmark"). The returns of Initial Class and Service Class 2 show the performance of the highest and lowest performing classes, respectively (based on five-year performance).
VIP Real Estate Portfolio
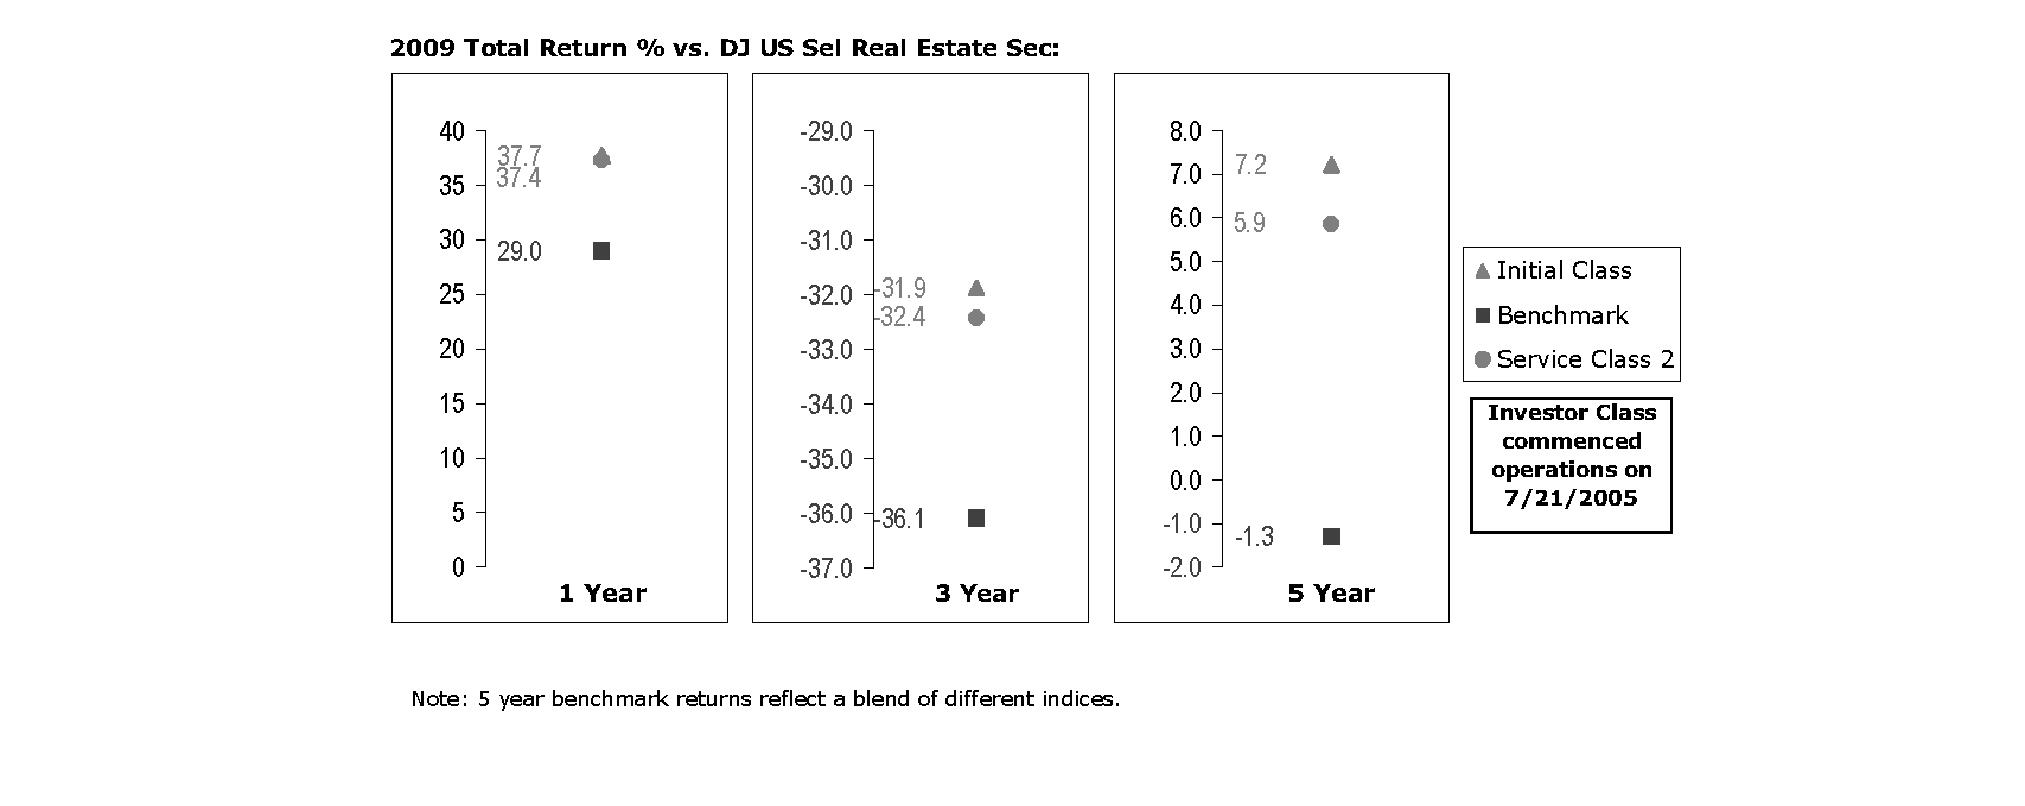
The Board noted that the investment performance of Initial Class of the fund compared favorably to its benchmark for all the periods shown. The Board considered that the variations in performance among the fund's classes reflect the variations in class expenses, which result in lower performance for higher expense classes. The Board also reviewed the fund's performance since inception as well as performance in the current year.
Based on its review, and giving particular weight to the nature and quality of the resources dedicated by the Investment Advisers to maintain and improve relative performance and factoring in the unprecedented market events in recent years, the Board concluded that the nature, extent, and quality of investment management and support services and of shareholder and administrative services provided to the fund will benefit the fund's shareholders, particularly in light of the Board's view that the fund's shareholders benefit from investing in a fund that is part of a large family of funds offering a variety of investment disciplines and services.
Competitiveness of Management Fee and Total Fund Expenses. The Board considered the fund's management fee and total expenses compared to "mapped groups" of competitive funds and classes. Fidelity creates "mapped groups" by combining similar Lipper investment objective categories that have comparable management fee characteristics. Combining Lipper investment objective categories aids the Board's management fee and total expense comparisons by broadening the competitive group used for comparison and by reducing the number of universes to which various Fidelity funds are compared.
Management Fee. The Board considered two proprietary management fee comparisons for the 12-month periods shown in the chart below. The group of Lipper funds used by the Board for management fee comparisons is referred to below as the "Total Mapped Group." The Total Mapped Group comparison focuses on a fund's standing relative to the total universe of comparable funds available to investors, in terms of gross management fees before expense reimbursements or caps. "TMG %" represents the percentage of funds in the Total Mapped Group that had management fees that were lower than the fund's. For example, a TMG % of 3% means that 97% of the funds in the Total Mapped Group had higher management fees than the fund. The "Asset-Size Peer Group" (ASPG) comparison focuses on a fund's standing relative to non-Fidelity funds similar in size to the fund within the Total Mapped Group. The ASPG represents at least 15% of the funds in the Total Mapped Group with comparable asset size and management fee characteristics, subject to a minimum of 50 funds (or all funds in the Total Mapped Group if fewer than 50). Additional information, such as the ASPG quartile in which the fund's management fee ranked, is also included in the chart and considered by the Board.
Annual Report
VIP Real Estate Portfolio
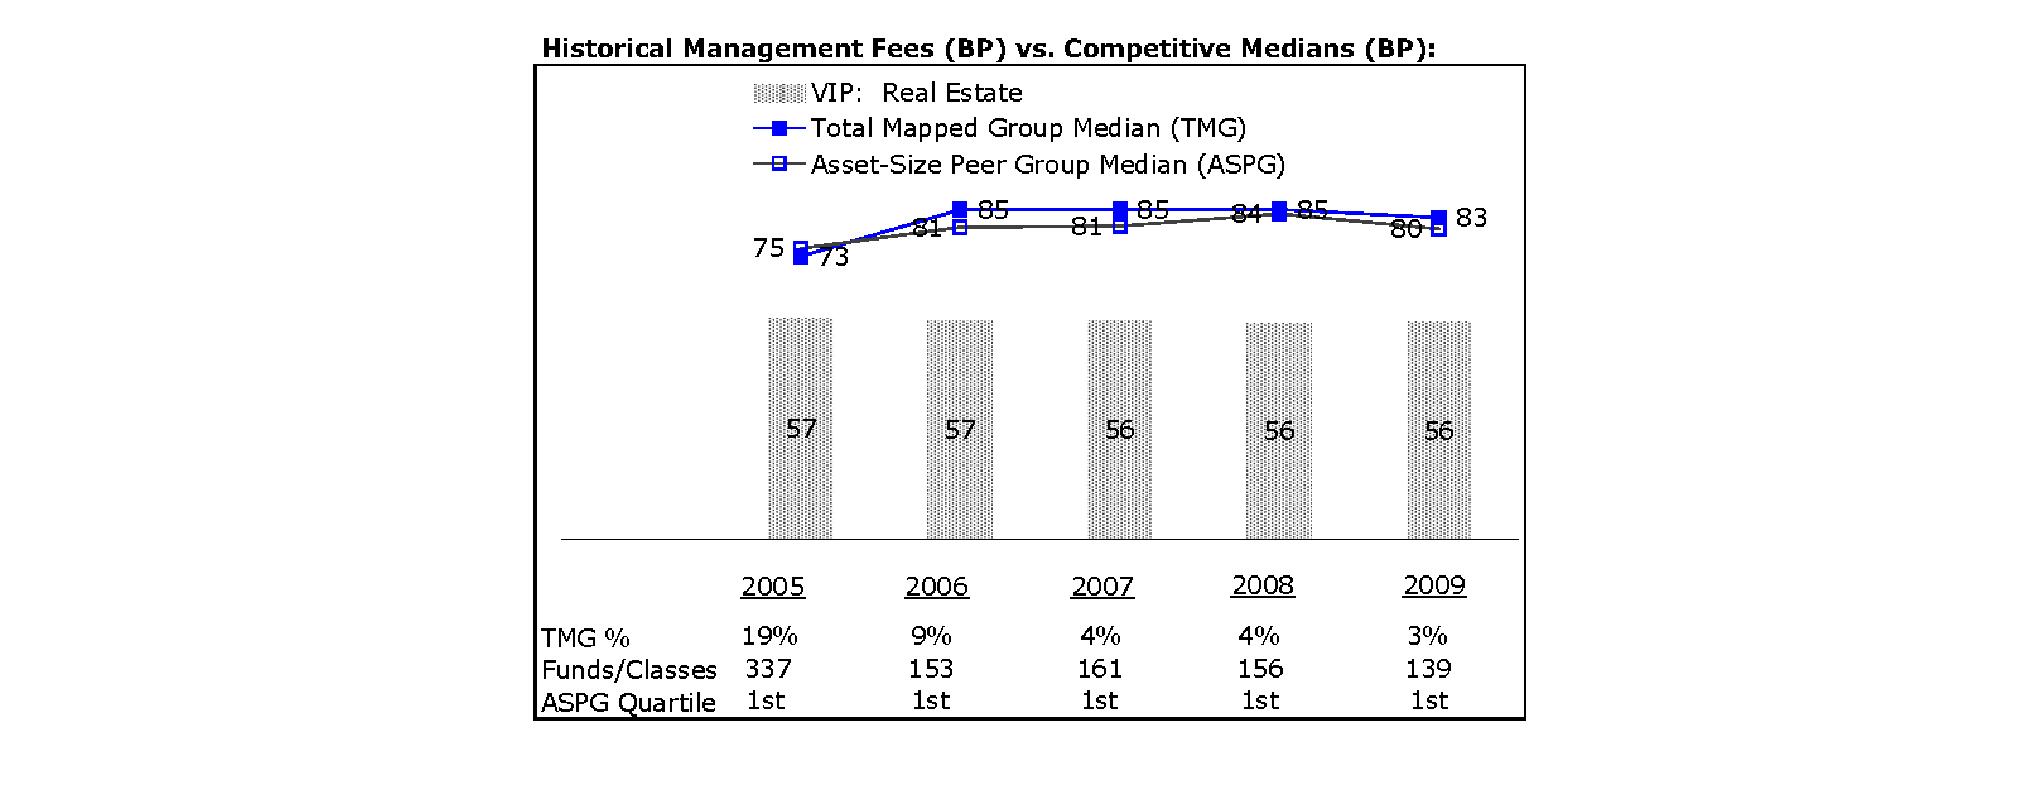
The Board noted that the fund's management fee ranked below the median of its Total Mapped Group and below the median of its ASPG for 2009.
Based on its review, the Board concluded that the fund's management fee is fair and reasonable in light of the services that the fund receives and the other factors considered.
Total Expenses. In its review of each class's total expenses, the Board considered the fund's management fee as well as other fund or class expenses, as applicable, such as transfer agent fees, pricing and bookkeeping fees, fund-paid 12b-1 fees, and custodial, legal, and audit fees. The Board also noted the effects of any waivers and reimbursements on fees and expenses. As part of its review, the Board also considered current and historical total expenses of each class of the fund compared to competitive fund median expenses. Each class of the fund is compared to those funds and classes in the Total Mapped Group (used by the Board for management fee comparisons) that have a similar sales load structure.
The Board noted that the total expenses of each of Initial Class, Investor Class, and Service Class ranked below its competitive median for 2009 and the total expenses of Service Class 2 ranked equal to its competitive median for 2009.
Fees Charged to Other Fidelity Clients. The Board also considered Fidelity fee structures and other information with respect to clients of FMR and its affiliates, such as other mutual funds advised or subadvised by FMR or its affiliates, pension plan clients, and other institutional clients. In March 2010, the Board created an ad hoc joint committee with the board of other Fidelity funds (the Committee) to review and compare Fidelity's institutional investment advisory business with its business of providing services to the Fidelity funds, including the differences in services provided, fees charged, and costs incurred, as well as competition in their respective marketplaces.
Based on its review of total expenses and fees charged to other Fidelity clients, the Board concluded that the total expenses of each class of the fund were reasonable in light of the services that the fund and its shareholders receive and the other factors considered, including the findings of the Committee.
Costs of the Services and Profitability. The Board considered the revenues earned and the expenses incurred by Fidelity in conducting the business of developing, marketing, distributing, managing, administering and servicing the fund and its shareholders. The Board also considered the level of Fidelity's profits in respect of all the Fidelity funds.
On an annual basis, FMR presents to the Board Fidelity's profitability for the fund. Fidelity calculates the profitability for each fund, as well as aggregate profitability for groups of Fidelity funds and all Fidelity funds, using a series of detailed revenue and cost allocation methodologies which originate with the audited books and records of Fidelity. The Audit Committee of the Board reviews any significant changes from the prior year's methodologies.
Annual Report
Board Approval of Investment Advisory Contracts and Management Fees - continued
PricewaterhouseCoopers LLP (PwC), independent registered public accounting firm and auditor to Fidelity and certain Fidelity funds, has been engaged annually by the Board as part of the Board's assessment of Fidelity's profitability analysis. PwC's engagement includes the review and assessment of Fidelity's methodologies used in determining the revenues and expenses attributable to Fidelity's mutual fund business, and completion of agreed-upon procedures surrounding the mathematical accuracy of fund profitability and its conformity to allocation methodologies. After considering PwC's reports issued under the engagement and information provided by Fidelity, the Board believes that while other allocation methods may also be reasonable, Fidelity's profitability methodologies are reasonable in all material respects.
The Board has also reviewed Fidelity's non-fund businesses and fall-out benefits related to the mutual fund business as well as cases where Fidelity's affiliates may benefit from or be related to the fund's business.
The Board considered the costs of the services provided by and the profits realized by Fidelity in connection with the operation of the fund and were satisfied that the profitability was not excessive in the circumstances.
Economies of Scale. The Board considered whether there have been economies of scale in respect of the management of the Fidelity funds, whether the Fidelity funds (including the fund) have appropriately benefited from any such economies of scale, and whether there is potential for realization of any further economies of scale. The Board considered the extent to which the fund will benefit from economies of scale through increased services to the fund, through waivers or reimbursements, or through fee or expense reductions.
In February 2009, the Board and the board of other Fidelity funds created an ad hoc committee (the Economies of Scale Committee) to analyze whether FMR attains economies of scale in respect of the management and servicing of the Fidelity funds, whether the Fidelity funds have appropriately benefited from such economies of scale, and whether there is potential for realization of any further economies of scale.
The Board recognized that the fund's management contract incorporates a "group fee" structure, which provides for lower group fee rates as total fund assets under FMR's management increase, and for higher group fee rates as total fund assets under FMR's management decrease. FMR calculates the group fee rates based on a tiered asset "breakpoint" schedule that varies based on asset class. The Board considered that the group fee is designed to deliver the benefits of economies of scale to fund shareholders when total Fidelity fund assets increase, even if assets of any particular fund are unchanged or have declined, because some portion of Fidelity's costs are attributable to services provided to all Fidelity funds, and all funds benefit if those costs can be allocated among more assets. The Board concluded that, given the group fee structure, fund shareholders will benefit from lower management fees as assets under FMR's management increase at the fund complex level, regardless of whether Fidelity achieves any such economies of scale.
The Board concluded, considering the findings of the Economies of Scale Committee, that any potential economies of scale are being appropriately shared between fund shareholders and Fidelity.
Additional Information Requested by the Board. In order to develop fully the factual basis for consideration of the Fidelity funds' Advisory Contracts, the Board requested and received additional information on certain topics, including (i) fund performance trends, actions to be taken by FMR to improve certain funds' overall performance, and Fidelity's long-term strategies for certain funds; (ii) portfolio manager changes that have occurred during the past year and length of portfolio manager tenure for different categories of funds over time; (iii) Fidelity's compensation structure for portfolio managers, research analysts, and other key personnel, the rationale for the compensation structure, and how the compensation structure provides appropriate performance incentives; (iv) the amount of the investment that each portfolio manager has made in the Fidelity fund(s) that he or she manages; (v) management and other fees paid by FMR to affiliated sub-advisers on behalf of the Fidelity funds; (vi) Fidelity's fee structures and rationale for recommending different fees among different categories of funds; (vii) Fidelity's rationale for recommending which funds should have a performance adjustment component as part of their management fees; (viii) the rationale for any differences between fund fee structures and fee structures in place for other Fidelity clients; and (ix) explanations regarding the relative total expenses borne by certain funds and classes, total expense competitive trends, and actions that might be taken by FMR to reduce total expenses for certain funds and classes.
Based on its evaluation of all of the conclusions noted above, and after considering all factors it believed relevant, the Board ultimately concluded that the advisory fee structures are fair and reasonable, and that the fund's Advisory Contracts should be renewed.
Annual Report
Investment Adviser
Fidelity Management & Research Company
Boston, MA
Investment Sub-Advisers
FMR Co., Inc.
Fidelity Management & Research (U.K.) Inc.
Fidelity Management & Research (Japan) Inc.
Fidelity Management & Research (Hong Kong) Limited
General Distributor
Fidelity Distributors Corporation
Boston, MA
Transfer and Service Agents
Fidelity Investments Institutional Operations Company, Inc.
Boston, MA
Fidelity Service Company, Inc.
Boston, MA
Custodian
The Bank of New York Mellon
New York, NY
VIPRE-ANN-0211
1.781992.108
Fidelity® Variable Insurance Products:
Technology Portfolio
Annual Report
December 31, 2010
(2_fidelity_logos) (Registered_Trademark)
Contents
Performance | <Click Here> | How the fund has done over time. |
Management's Discussion of Fund Performance | <Click Here> | The Portfolio Manager's review of fund performance and strategy. |
Shareholder Expense Example | <Click Here> | An example of shareholder expenses. |
Investment Changes | <Click Here> | A summary of major shifts in the fund's investments over the past six months. |
Investments | <Click Here> | A complete list of the fund's investments with their market values. |
Financial Statements | <Click Here> | Statements of assets and liabilities, operations, and changes in net assets, as well as financial highlights. |
Notes | <Click Here> | Notes to the financial statements. |
Report of Independent Registered Public Accounting Firm | <Click Here> | |
Trustees and Officers | <Click Here> | |
Distributions | <Click Here> | |
Board Approval of Investment Advisory Contracts and Management Fees | <Click Here> | |
To view a fund's proxy voting guidelines and proxy voting record for the 12-month period ended June 30, visit http://www.fidelity.com/proxyvotingresults or visit the Securities and Exchange Commission's (SEC) web site at http://www.sec.gov. You may also call 1-877-208-0098 to request a free copy of the proxy voting guidelines.
Fidelity® Variable Insurance Products are separate account options which are purchased through a variable insurance contract.
Standard & Poor's, S&P and S&P 500 are registered service marks of The McGraw-Hill Companies, Inc. and have been licensed for use by Fidelity Distributors Corporation.
Other third party marks appearing herein are the property of their respective owners.
All other marks appearing herein are registered or unregistered trademarks or service marks of FMR LLC or an affiliated company.
The general research services agreement with Fidelity Research & Analysis Company has been terminated and is no longer in effect for the fund.
This report and the financial statements contained herein are submitted for the general information of the shareholders of the fund. This report is not authorized for distribution to prospective investors in the fund unless preceded or accompanied by an effective prospectus.
A fund files its complete schedule of portfolio holdings with the SEC for the first and third quarters of each fiscal year on Form N-Q. Forms N-Q are available on the SEC's web site at http://www.sec.gov. A fund's Forms N-Q may be reviewed and copied at the SEC's Public Reference Room in Washington, DC. Information regarding the operation of the SEC's Public Reference Room may be obtained by calling 1-800-SEC-0330. For a complete list of a fund's portfolio holdings, view the most recent holdings listing, semiannual report, or annual report on Fidelity's web site at http://www.fidelity.com, http://www.advisor.fidelity.com, or http://www.401k.com, as applicable.
NOT FDIC INSURED • MAY LOSE VALUE • NO BANK GUARANTEE
Neither the fund nor Fidelity Distributors Corporation is a bank.
Annual Report
Average annual total return reflects the change in the value of an investment, assuming reinvestment of the class' distributions from dividend income and capital gains (the profits earned upon the sale of securities that have grown in value, if any) and assuming a constant rate of performance each year. During periods of reimbursement by Fidelity, a fund's total return will be greater than it would be had the reimbursement not occurred. Performance numbers are net of all underlying fund operating expenses, but do not include any insurance charges imposed by your insurance company's separate account. If performance information included the effect of these additional charges, the total returns would have been lower. How a fund did yesterday is no guarantee of how it will do tomorrow.
Average Annual Total Returns
Periods ended December 31, 2010 | Past 1
year | Past 5
years | Life of fund A |
VIP Technology Portfolio - Initial Class | 27.75% | 9.00% | 5.08% |
VIP Technology Portfolio - Investor Class B | 27.65% | 8.88% | 5.00% |
A From July 19, 2001.
B The initial offering of Investor Class shares took place on July 21, 2005. Returns prior to July 21, 2005 are those of Initial Class. Had Investor Class's transfer agent fee been reflected, returns prior to July 21, 2005 would have been lower.
$10,000 Over Life of Fund
Let's say hypothetically that $10,000 was invested in VIP Technology Portfolio - Initial Class on July 19, 2001, when the fund started. The chart shows how the value of your investment would have changed, and also shows how the S&P 500® Index performed over the same period.
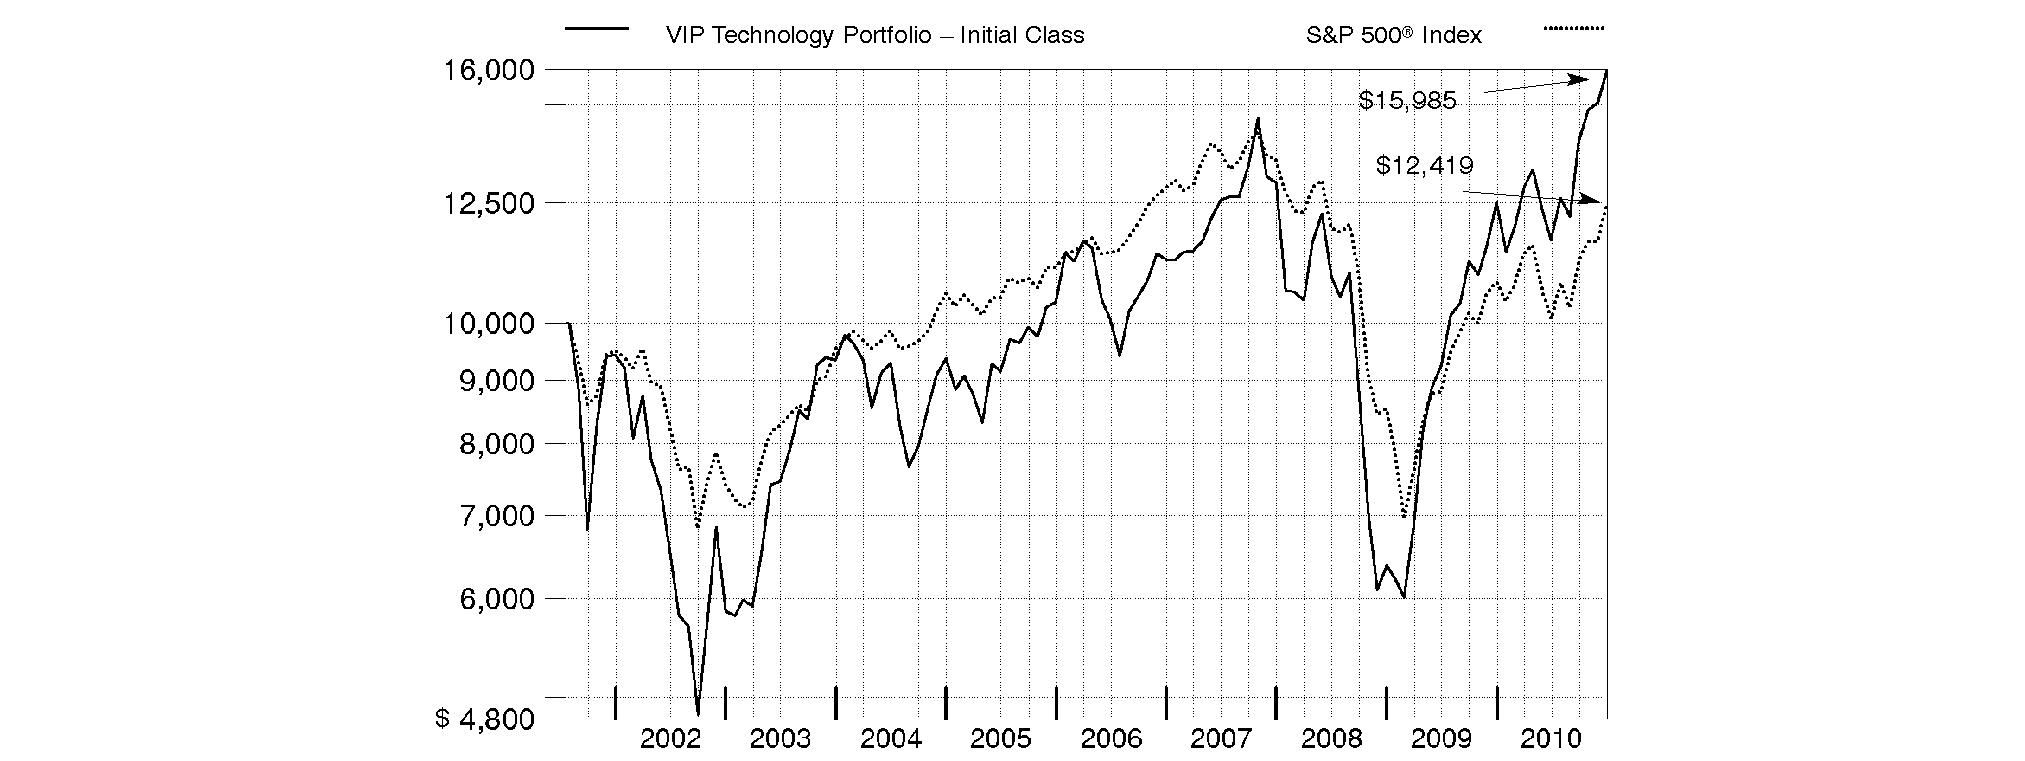
Annual Report
Market Recap: While market improvements around the world hit a speed bump in the first half of the 12-month period ending December 31, 2010, world economies re-accelerated in August, supported by a broadening recovery and low inflation in the U.S. Domestic stock markets recorded solid gains for the year, lifted by a strong second-half rally fueled by economic optimism, encouraging earnings reports and a wave of corporate mergers. The large-cap S&P 500® Index rose 15.06%, the blue-chip-laden Dow Jones Industrial AverageSM added 14.06% and the technology-heavy Nasdaq Composite® Index climbed 18.02%. Meanwhile, international stocks, as represented by the MSCI® ACWI® (All Country World Index) ex USA Index, gained 11.29%, boosted in part by a depreciating U.S. dollar. In the fixed-income arena, U.S. taxable investment-grade bonds generated positive results during 2010, as the Barclays Capital® U.S. Aggregate Bond Index gained 6.54%. With ultra-low interest rates bolstering nearly all fixed-income securities for most of the year, sectors in the index with higher yields and more credit risk generally fared best, while most high-quality bonds generated more-moderate returns. Meanwhile, high-yield bonds, as represented by The BofA Merrill LynchSM US High Yield Constrained Index, returned 15.07%, a result of improved economic data and strengthening investor demand. Overseas, foreign bond markets showed mixed results, with a sizable disparity between the 3.97% return of the Citigroup® Non-U.S. Group of 7 Index - which measures the performance of sovereign debt of the major global economies outside the U.S. - and the 12.04% advance of the JPMorgan Emerging Markets Bond Index Global (EMBI Global), which benefited from the rising overall credit quality of emerging-markets debt issuers.
Comments from Charlie Chai, Portfolio Manager of VIP Technology Portfolio: During the past year, the fund's share classes more than doubled the 13.09% return of the MSCI® U.S. IM Information Technology 25/50 Index - which was adopted in January 2010 as a better representation of the fund's investment universe - and also handily outperformed the S&P 500®. (For specific portfolio results, please refer to the performance section of this report.) Solid stock selection in a number of industries - including communications equipment, computer hardware and application software - drove the fund's outperformance, as did a large overweighting in application software, one of the stronger groups in the index during the period. From a capitalization standpoint, stock picking in the mid- and small-cap areas worked particularly well, and our positioning within the mega-cap group - $100 billion and above - also made a meaningful contribution to relative performance. Looking at individual contributors, underweighting networking equipment maker and major index component Cisco Systems was a good call. The stock pulled back in November when the company lowered its fiscal 2011 revenue guidance. Likewise, underweighting personal computer and printer firm Hewlett-Packard - another large index component - worked out well. The fund also benefited from an out-of-index position in wireless handset maker HTC, based in Taiwan, and from a large overweighting in salesforce.com, an important player in cloud computing for customer relationship management and other applications. Also of note, computer/consumer electronics maker Apple - by far the fund's largest holding for most of the period - bolstered relative performance and was the fund's largest absolute contributor. Conversely, weak stock selection in electronic components - mostly due to a poor showing by Prime View International, the fund's largest relative detractor during the period - had a negative impact. The company supplies displays for Amazon.com's KindleTM e-reader. Amazon priced the Kindle aggressively to compete with Apple's iPad® tablet computer, which put pressure on Prime View's revenue and earnings. Consequently, I sold the stock. A large underweighting in the strong-performing IT consulting/other services group also worked against performance. Other detractors at the stock level included VisionChina Media, a Chinese firm specializing in advertising via electronic public-transit media, and underweighting enterprise software maker Oracle, one of the better-performing large-cap components in the MSCI index. Prime View International and VisionChina Media were out-of-index holdings.
The views expressed above reflect those of the portfolio manager(s) only through the end of the period as stated on the cover of this report and do not necessarily represent the views of Fidelity or any other person in the Fidelity organization. Any such views are subject to change at any time based upon market or other conditions and Fidelity disclaims any responsibility to update such views. These views may not be relied on as investment advice and, because investment decisions for a Fidelity fund are based on numerous factors, may not be relied on as an indication of trading intent on behalf of any Fidelity fund.
Annual Report
As a shareholder of the Fund, you incur two types of costs: (1) transaction costs, including redemption fees, and (2) ongoing costs, including management fees and other Fund expenses. This Example is intended to help you understand your ongoing costs (in dollars) of investing in the Fund and to compare these costs with the ongoing costs of investing in other mutual funds.
The Example is based on an investment of $1,000 invested at the beginning of the period and held for the entire period (July 1, 2010 to December 31, 2010).
Actual Expenses
The first line of the accompanying table for each class of the Fund provides information about actual account values and actual expenses. You may use the information in this line, together with the amount you invested, to estimate the expenses that you paid over the period. Simply divide your account value by $1,000.00 (for example, an $8,600 account value divided by $1,000.00 = 8.6), then multiply the result by the number in the first line for a class of the Fund under the heading entitled "Expenses Paid During Period" to estimate the expenses you paid on your account during this period. The estimate of expenses does not include any fees or other expenses of any variable annuity or variable life insurance product. If they were, the estimate of expenses you paid during the period would be higher, and your ending account value would be lower. In addition, the Fund, as a shareholder in the underlying Fidelity Central Funds, will indirectly bear its pro-rata share of the fees and expenses incurred by the underlying Fidelity Central Funds. These fees and expenses are not included in the Fund's annualized expense ratio used to calculate the expense estimate in the table below.
Hypothetical Example for Comparison Purposes
The second line of the accompanying table for each class of the Fund provides information about hypothetical account values and hypothetical expenses based on a Class' actual expense ratio and an assumed rate of return of 5% per year before expenses, which is not the Class' actual return. The hypothetical account values and expenses may not be used to estimate the actual ending account balance or expenses you paid for the period. You may use this information to compare the ongoing costs of investing in the Fund and other funds. To do so, compare this 5% hypothetical example with the 5% hypothetical examples that appear in the shareholder reports of the other funds. The estimate of expenses does not include any fees or other expenses of any variable annuity or variable life insurance product. If they were, the estimate of expenses you paid during the period would be higher, and your ending account value would be lower. In addition, the Fund, as a shareholder in the underlying Fidelity Central Funds, will indirectly bear its pro-rata share of the fees and expenses incurred by the underlying Fidelity Central Funds. These fees and expenses are not included in the Fund's annualized expense ratio used to calculate the expense estimate in the table below.
Please note that the expenses shown in the table are meant to highlight your ongoing costs only and do not reflect any transaction costs. Therefore, the second line of the table is useful in comparing ongoing costs only, and will not help you determine the relative total costs of owning different funds. In addition, if these transactional costs were included, your costs would have been higher.
| Annualized Expense Ratio | Beginning
Account Value
July 1, 2010 | Ending
Account Value
December 31, 2010 | Expenses Paid
During Period*
July 1, 2010
to December 31, 2010 |
Initial Class | .72% | | | |
Actual | | $ 1,000.00 | $ 1,368.90 | $ 4.30 |
HypotheticalA | | $ 1,000.00 | $ 1,021.58 | $ 3.67 |
Investor Class | .81% | | | |
Actual | | $ 1,000.00 | $ 1,368.30 | $ 4.84 |
HypotheticalA | | $ 1,000.00 | $ 1,021.12 | $ 4.13 |
A 5% return per year before expenses
* Expenses are equal to each Class' annualized expense ratio, multiplied by the average account value over the period, multiplied by 184/365 (to reflect the one-half year period).
Annual Report
Investment Changes (Unaudited)
Top Ten Stocks as of December 31, 2010 |
| % of fund's
net assets | % of fund's net assets
6 months ago |
Apple, Inc. | 14.1 | 14.5 |
Google, Inc. Class A | 6.6 | 4.0 |
QUALCOMM, Inc. | 3.4 | 0.5 |
Corning, Inc. | 2.7 | 0.9 |
Oracle Corp. | 2.4 | 4.0 |
EMC Corp. | 2.3 | 0.6 |
salesforce.com, Inc. | 1.8 | 2.4 |
Seagate Technology | 1.6 | 0.0 |
Marvell Technology Group Ltd. | 1.5 | 0.7 |
Trimble Navigation Ltd. | 1.5 | 1.6 |
| 37.9 | |
Top Industries (% of fund's net assets) |
As of December 31, 2010 |
| Computers & Peripherals | 22.1% | |
| Software | 19.3% | |
| Semiconductors & Semiconductor Equipment | 17.6% | |
| Internet Software & Services | 11.9% | |
| Communications Equipment | 8.6% | |
| All Others* | 20.5% | |

As of June 30, 2010 |
| Software | 29.3% | |
| Computers & Peripherals | 21.6% | |
| Semiconductors & Semiconductor Equipment | 14.3% | |
| Internet Software & Services | 10.0% | |
| Communications Equipment | 9.7% | |
| All Others* | 15.1% | |

* Includes short-term investments and net other assets. |
Annual Report
Investments December 31, 2010
Showing Percentage of Net Assets
Common Stocks - 99.2% |
| Shares | | Value |
AUTOMOBILES - 0.1% |
Automobile Manufacturers - 0.1% |
Tesla Motors, Inc. (a)(d) | 5,600 | | $ 149,128 |
BUILDING PRODUCTS - 0.1% |
Building Products - 0.1% |
Asahi Glass Co. Ltd. | 10,000 | | 116,850 |
CHEMICALS - 0.1% |
Commodity Chemicals - 0.1% |
STR Holdings, Inc. (a)(d) | 6,300 | | 126,000 |
Specialty Chemicals - 0.0% |
Shin-Etsu Chemical Co., Ltd. | 200 | | 10,835 |
TOTAL CHEMICALS | | 136,835 |
COMMUNICATIONS EQUIPMENT - 8.5% |
Communications Equipment - 8.5% |
Acme Packet, Inc. (a) | 18,200 | | 967,512 |
Adtran, Inc. | 8,000 | | 289,680 |
Aruba Networks, Inc. (a) | 3,500 | | 73,080 |
Balda AG (a) | 20,000 | | 184,426 |
Brocade Communications Systems, Inc. (a) | 100 | | 529 |
Ciena Corp. (a)(d) | 5,200 | | 109,460 |
Cisco Systems, Inc. (a) | 16,337 | | 330,498 |
Comverse Technology, Inc. (a) | 12,970 | | 94,162 |
F5 Networks, Inc. (a) | 2,318 | | 301,711 |
HTC Corp. | 76,850 | | 2,371,100 |
Infinera Corp. (a) | 13,800 | | 142,554 |
Juniper Networks, Inc. (a) | 13,900 | | 513,188 |
Mitel Networks, Inc. (a) | 2,300 | | 12,673 |
Motorola Mobility Holdings, Inc. (a) | 25,700 | | 747,870 |
Motorola, Inc. (a) | 169,400 | | 1,536,458 |
Netronix, Inc. | 24,240 | | 61,909 |
QUALCOMM, Inc. | 131,434 | | 6,504,669 |
Riverbed Technology, Inc. (a) | 11,500 | | 404,455 |
Sandvine Corp. (a) | 100,288 | | 283,200 |
Sandvine Corp. (U.K.) (a) | 140,500 | | 395,874 |
ShoreTel, Inc. (a) | 20,000 | | 156,200 |
Sonus Networks, Inc. (a) | 5,300 | | 14,151 |
Tekelec (a) | 9,000 | | 107,190 |
Telefonaktiebolaget LM Ericsson
(B Shares) sponsored ADR | 32,700 | | 377,031 |
ZTE Corp. (H Shares) | 106,600 | | 423,794 |
| | 16,403,374 |
COMPUTERS & PERIPHERALS - 22.1% |
Computer Hardware - 14.3% |
Apple, Inc. (a) | 84,145 | | 27,141,813 |
Hewlett-Packard Co. | 417 | | 17,556 |
Stratasys, Inc. (a) | 13,110 | | 427,910 |
| | 27,587,279 |
|
| Shares | | Value |
Computer Storage & Peripherals - 7.8% |
Chicony Electronics Co. Ltd. | 11,830 | | $ 26,361 |
EMC Corp. (a) | 194,500 | | 4,454,050 |
Imagination Technologies Group PLC (a) | 63,000 | | 354,432 |
Intevac, Inc. (a) | 25,300 | | 354,453 |
NetApp, Inc. (a) | 21,400 | | 1,176,144 |
Qisda Corp. (a) | 26,000 | | 17,737 |
SanDisk Corp. (a) | 52,019 | | 2,593,667 |
Seagate Technology (a) | 199,300 | | 2,995,479 |
Smart Technologies, Inc. Class A (a) | 11,200 | | 105,728 |
Synaptics, Inc. (a) | 5,900 | | 173,342 |
Western Digital Corp. (a) | 78,200 | | 2,650,980 |
| | 14,902,373 |
TOTAL COMPUTERS & PERIPHERALS | | 42,489,652 |
CONSUMER FINANCE - 0.2% |
Consumer Finance - 0.2% |
Discover Financial Services | 19,300 | | 357,629 |
Netspend Holdings, Inc. | 700 | | 8,974 |
| | 366,603 |
DIVERSIFIED CONSUMER SERVICES - 0.3% |
Education Services - 0.1% |
New Oriental Education & Technology Group, Inc. sponsored ADR (a) | 1,600 | | 168,368 |
Specialized Consumer Services - 0.2% |
Coinstar, Inc. (a) | 6,700 | | 378,148 |
TOTAL DIVERSIFIED CONSUMER SERVICES | | 546,516 |
ELECTRICAL EQUIPMENT - 0.0% |
Electrical Components & Equipment - 0.0% |
A123 Systems, Inc. (a) | 500 | | 4,770 |
Acuity Brands, Inc. | 316 | | 18,224 |
| | 22,994 |
ELECTRONIC EQUIPMENT & COMPONENTS - 8.4% |
Electronic Components - 4.8% |
Aeroflex Holding Corp. | 10,900 | | 179,305 |
Amphenol Corp. Class A | 300 | | 15,834 |
AU Optronics Corp. sponsored ADR (a)(d) | 77,900 | | 811,718 |
Cando Corp. (a) | 447,842 | | 334,692 |
Cando Corp. rights 2/11/11 (a) | 108,019 | | 14,072 |
Chimei Innolux Corp. (a) | 115,000 | | 158,879 |
Corning, Inc. | 264,700 | | 5,114,004 |
DigiTech Systems Co., Ltd. | 15,029 | | 285,501 |
DTS, Inc. (a) | 400 | | 19,620 |
E Ink Holdings, Inc. (a) | 70,000 | | 141,824 |
E Ink Holdings, Inc. GDR (a)(e) | 1,000 | | 20,270 |
LG Display Co. Ltd. sponsored ADR (d) | 50,800 | | 901,700 |
Nippon Electric Glass Co. Ltd. | 27,000 | | 389,632 |
Power-One, Inc. (a)(d) | 1,900 | | 19,380 |
Universal Display Corp. (a)(d) | 13,600 | | 416,840 |
Common Stocks - continued |
| Shares | | Value |
ELECTRONIC EQUIPMENT & COMPONENTS - CONTINUED |
Electronic Components - continued |
Vishay Intertechnology, Inc. (a) | 12,300 | | $ 180,564 |
Young Fast Optoelectron Co. Ltd. | 22,000 | | 210,045 |
| | 9,213,880 |
Electronic Equipment & Instruments - 0.2% |
Chroma ATE, Inc. | 90,678 | | 270,759 |
Comverge, Inc. (a) | 1,211 | | 8,368 |
Itron, Inc. (a) | 200 | | 11,090 |
National Instruments Corp. | 2,237 | | 84,201 |
Vishay Precision Group, Inc. (a) | 1,178 | | 22,194 |
| | 396,612 |
Electronic Manufacturing Services - 2.5% |
Jabil Circuit, Inc. | 67,200 | | 1,350,048 |
Ju Teng International Holdings Ltd. | 62,000 | | 30,073 |
Multi-Fineline Electronix, Inc. (a) | 411 | | 10,887 |
SMART Modular Technologies (WWH), Inc. (a) | 58,100 | | 334,656 |
Trimble Navigation Ltd. (a) | 71,585 | | 2,858,389 |
Tyco Electronics Ltd. | 5,200 | | 184,080 |
| | 4,768,133 |
Technology Distributors - 0.9% |
Anixter International, Inc. | 5,800 | | 346,434 |
Arrow Electronics, Inc. (a) | 11,200 | | 383,600 |
Avnet, Inc. (a) | 11,600 | | 383,148 |
Digital China Holdings Ltd. (H Shares) | 165,000 | | 308,665 |
Inspur International Ltd. | 411,000 | | 35,958 |
Supreme Electronics Co. Ltd. | 13,000 | | 10,161 |
Synnex Technology International Corp. | 60,237 | | 162,518 |
VST Holdings Ltd. (a) | 270,000 | | 79,550 |
WPG Holding Co. Ltd. | 43,896 | | 84,722 |
| | 1,794,756 |
TOTAL ELECTRONIC EQUIPMENT & COMPONENTS | | 16,173,381 |
HEALTH CARE EQUIPMENT & SUPPLIES - 0.6% |
Health Care Equipment - 0.4% |
Biosensors International Group Ltd. (a) | 378,000 | | 332,858 |
China Kanghui Holdings sponsored ADR (a) | 10,600 | | 196,206 |
China Medical Technologies, Inc. sponsored ADR (a) | 300 | | 3,372 |
Golden Meditech Holdings Ltd. (a) | 262,000 | | 49,215 |
Microport Scientific Corp. | 132,000 | | 126,353 |
Mingyuan Medicare Development Co. Ltd. | 200,000 | | 27,533 |
| | 735,537 |
Health Care Supplies - 0.2% |
Shandong Weigao Group Medical Polymer Co. Ltd. (H Shares) | 184,000 | | 521,994 |
TOTAL HEALTH CARE EQUIPMENT & SUPPLIES | | 1,257,531 |
|
| Shares | | Value |
HEALTH CARE TECHNOLOGY - 0.2% |
Health Care Technology - 0.2% |
athenahealth, Inc. (a) | 100 | | $ 4,098 |
Cerner Corp. (a) | 3,400 | | 322,116 |
| | 326,214 |
HOUSEHOLD DURABLES - 0.1% |
Consumer Electronics - 0.0% |
Sharp Corp. | 2,000 | | 20,612 |
Skyworth Digital Holdings Ltd. | 150,000 | | 88,968 |
Sony Corp. sponsored ADR | 500 | | 17,855 |
| | 127,435 |
Household Appliances - 0.1% |
Haier Electronics Group Co. Ltd. (a) | 150,000 | | 174,461 |
TOTAL HOUSEHOLD DURABLES | | 301,896 |
INTERNET & CATALOG RETAIL - 1.0% |
Internet Retail - 1.0% |
Amazon.com, Inc. (a) | 3,400 | | 612,000 |
E-Commerce China Dangdang, Inc. ADR | 5,700 | | 154,299 |
Expedia, Inc. | 15,500 | | 388,895 |
MakeMyTrip Ltd. | 3,400 | | 91,902 |
Priceline.com, Inc. (a) | 1,688 | | 674,440 |
| | 1,921,536 |
INTERNET SOFTWARE & SERVICES - 11.9% |
Internet Software & Services - 11.9% |
Akamai Technologies, Inc. (a) | 13,100 | | 616,355 |
Alibaba.com Ltd. | 355,500 | | 637,590 |
Baidu.com, Inc. sponsored ADR (a) | 2,800 | | 270,284 |
China Finance Online Co. Ltd. ADR (a) | 16,800 | | 109,704 |
Constant Contact, Inc. (a) | 9,500 | | 294,405 |
DealerTrack Holdings, Inc. (a) | 1,500 | | 30,105 |
Digital River, Inc. (a) | 9,100 | | 313,222 |
eBay, Inc. (a) | 30,100 | | 837,683 |
Google, Inc. Class A (a) | 21,500 | | 12,770,355 |
Internap Network Services Corp. (a) | 16,500 | | 100,320 |
IntraLinks Holdings, Inc. | 23,200 | | 434,072 |
Kakaku.com, Inc. | 25 | | 148,679 |
LivePerson, Inc. (a) | 17,400 | | 196,620 |
Local.com Corp. (a)(d) | 9,700 | | 62,953 |
LogMeIn, Inc. (a) | 6,691 | | 296,679 |
Mail.ru Group Ltd. GDR unit (a)(e) | 9,700 | | 349,200 |
MediaMind Technologies, Inc. (a) | 6,800 | | 93,160 |
Mercadolibre, Inc. (a) | 10,600 | | 706,490 |
ModusLink Global Solutions, Inc. (a) | 15,000 | | 100,500 |
Monster Worldwide, Inc. (a) | 33,700 | | 796,331 |
NetEase.com, Inc. sponsored ADR (a) | 13,500 | | 488,025 |
Open Text Corp. (a) | 6,700 | | 307,220 |
OpenTable, Inc. (a) | 2,200 | | 155,056 |
Rackspace Hosting, Inc. (a) | 9,300 | | 292,113 |
RightNow Technologies, Inc. (a) | 6,600 | | 156,222 |
Common Stocks - continued |
| Shares | | Value |
INTERNET SOFTWARE & SERVICES - CONTINUED |
Internet Software & Services - continued |
SouFun Holdings Ltd. ADR | 370 | | $ 26,462 |
Tencent Holdings Ltd. | 6,700 | | 145,594 |
The Knot, Inc. (a) | 28,100 | | 277,628 |
VeriSign, Inc. | 8,900 | | 290,763 |
VistaPrint Ltd. (a) | 17,800 | | 818,800 |
Vocus, Inc. (a) | 15,000 | | 414,900 |
YouKu.com, Inc. ADR (a) | 9,300 | | 325,593 |
| | 22,863,083 |
IT SERVICES - 6.4% |
Data Processing & Outsourced Services - 3.0% |
hiSoft Technology International Ltd. ADR (a) | 26,900 | | 812,380 |
MasterCard, Inc. Class A | 4,400 | | 986,084 |
Paychex, Inc. | 30,000 | | 927,300 |
Teletech Holdings, Inc. (a) | 4,994 | | 102,826 |
VeriFone Systems, Inc. (a) | 12,000 | | 462,720 |
Visa, Inc. Class A | 35,900 | | 2,526,642 |
| | 5,817,952 |
IT Consulting & Other Services - 3.4% |
Accenture PLC Class A | 44,367 | | 2,151,356 |
Atos Origin SA (a) | 10,856 | | 578,257 |
Camelot Information Systems, Inc. ADR | 4,900 | | 117,208 |
China Information Technology, Inc. (a) | 83 | | 432 |
Cognizant Technology Solutions Corp. Class A (a) | 19,400 | | 1,421,826 |
iGate Corp. | 35,200 | | 693,792 |
Lionbridge Technologies, Inc. (a) | 158,200 | | 583,758 |
Teradata Corp. (a) | 20,700 | | 852,012 |
Virtusa Corp. (a) | 10,000 | | 163,600 |
| | 6,562,241 |
TOTAL IT SERVICES | | 12,380,193 |
LIFE SCIENCES TOOLS & SERVICES - 0.5% |
Life Sciences Tools & Services - 0.5% |
Agilent Technologies, Inc. (a) | 23,000 | | 952,890 |
MACHINERY - 0.0% |
Industrial Machinery - 0.0% |
Meyer Burger Technology AG (a) | 450 | | 14,040 |
Shin Zu Shing Co. Ltd. | 3,515 | | 9,423 |
| | 23,463 |
MEDIA - 0.8% |
Advertising - 0.8% |
AirMedia Group, Inc. ADR (a) | 51,900 | | 357,591 |
ReachLocal, Inc. | 24,600 | | 489,786 |
VisionChina Media, Inc. ADR (a) | 124,300 | | 576,752 |
| | 1,424,129 |
|
| Shares | | Value |
Publishing - 0.0% |
Next Media Ltd. (a) | 400,000 | | $ 55,066 |
TOTAL MEDIA | | 1,479,195 |
METALS & MINING - 0.0% |
Diversified Metals & Mining - 0.0% |
Timminco Ltd. (a) | 700 | | 232 |
Steel - 0.0% |
Xingda International Holdings Ltd. | 78,000 | | 84,297 |
TOTAL METALS & MINING | | 84,529 |
OFFICE ELECTRONICS - 0.4% |
Office Electronics - 0.4% |
Xerox Corp. | 64,000 | | 737,280 |
REAL ESTATE MANAGEMENT & DEVELOPMENT - 0.1% |
Real Estate Services - 0.1% |
China Real Estate Information Corp. ADR (a)(d) | 28,400 | | 272,640 |
SEMICONDUCTORS & SEMICONDUCTOR EQUIPMENT - 17.6% |
Semiconductor Equipment - 4.3% |
Amkor Technology, Inc. (a) | 157,895 | | 1,166,844 |
Applied Materials, Inc. | 83,000 | | 1,166,150 |
ASM International NV unit (a) | 9,200 | | 322,184 |
ASML Holding NV | 5,200 | | 199,368 |
ATMI, Inc. (a) | 4,500 | | 89,730 |
centrotherm photovoltaics AG (a) | 500 | | 18,009 |
Cymer, Inc. (a) | 16,800 | | 757,176 |
GCL-Poly Energy Holdings Ltd. (a) | 100,000 | | 36,796 |
KLA-Tencor Corp. | 4,100 | | 158,424 |
Lam Research Corp. (a) | 13,900 | | 719,742 |
LTX-Credence Corp. (a) | 17,238 | | 127,561 |
MEMC Electronic Materials, Inc. (a) | 1,200 | | 13,512 |
Photronics, Inc. (a) | 9,700 | | 57,327 |
Roth & Rau AG (a) | 700 | | 11,502 |
Teradyne, Inc. (a) | 131,300 | | 1,843,452 |
Tessera Technologies, Inc. (a) | 4,100 | | 90,815 |
Varian Semiconductor Equipment Associates, Inc. (a) | 26,300 | | 972,311 |
Verigy Ltd. (a) | 43,750 | | 569,625 |
| | 8,320,528 |
Semiconductors - 13.3% |
Applied Micro Circuits Corp. (a) | 7,200 | | 76,896 |
ARM Holdings PLC sponsored ADR | 18,100 | | 375,575 |
Atmel Corp. (a) | 8,800 | | 108,416 |
Avago Technologies Ltd. | 24,200 | | 688,974 |
Broadcom Corp. Class A | 39,400 | | 1,715,870 |
Cavium Networks, Inc. (a) | 13,491 | | 508,341 |
Cirrus Logic, Inc. (a) | 19,100 | | 305,218 |
Cree, Inc. (a) | 1,360 | | 89,610 |
CSR PLC (a) | 31,800 | | 176,671 |
Cypress Semiconductor Corp. (a) | 59,100 | | 1,098,078 |
Common Stocks - continued |
| Shares | | Value |
SEMICONDUCTORS & SEMICONDUCTOR EQUIPMENT - CONTINUED |
Semiconductors - continued |
Elpida Memory, Inc. (a)(d) | 14,100 | | $ 164,065 |
Energy Conversion Devices, Inc. (a) | 2,100 | | 9,660 |
Fairchild Semiconductor International, Inc. (a) | 111,200 | | 1,735,832 |
First Solar, Inc. (a) | 586 | | 76,262 |
Global Unichip Corp. | 20,994 | | 87,805 |
Hittite Microwave Corp. (a) | 321 | | 19,594 |
Hynix Semiconductor, Inc. (a) | 11,290 | | 241,659 |
Infineon Technologies AG | 10,364 | | 96,484 |
Inphi Corp. | 16,500 | | 331,485 |
Intel Corp. | 600 | | 12,618 |
International Rectifier Corp. (a) | 12,000 | | 356,280 |
Intersil Corp. Class A | 120,000 | | 1,832,400 |
JA Solar Holdings Co. Ltd. ADR (a) | 13,300 | | 92,036 |
Jinkosolar Holdings Co. Ltd. ADR | 500 | | 10,060 |
LSI Corp. (a) | 15,500 | | 92,845 |
Marvell Technology Group Ltd. (a) | 158,395 | | 2,938,227 |
MediaTek, Inc. | 1,008 | | 14,427 |
Micron Technology, Inc. (a) | 111,100 | | 891,022 |
Microsemi Corp. (a) | 900 | | 20,610 |
Monolithic Power Systems, Inc. (a) | 36,200 | | 598,024 |
National Semiconductor Corp. | 52,900 | | 727,904 |
Netlogic Microsystems, Inc. (a) | 2,700 | | 84,807 |
NVIDIA Corp. (a) | 145,200 | | 2,236,080 |
NXP Semiconductors NV | 42,000 | | 879,060 |
Power Integrations, Inc. | 22,414 | | 899,698 |
Radiant Opto-Electronics Corp. | 2,284 | | 4,541 |
Rambus, Inc. (a) | 11,300 | | 231,424 |
Realtek Semiconductor Corp. | 32,000 | | 76,352 |
Silicon Laboratories, Inc. (a) | 4,700 | | 216,294 |
Siliconware Precision Industries Co. Ltd. sponsored ADR | 134,800 | | 802,060 |
Skyworks Solutions, Inc. (a) | 16,330 | | 467,528 |
Spreadtrum Communications, Inc. ADR (a)(d) | 38,340 | | 704,306 |
Standard Microsystems Corp. (a) | 43,500 | | 1,254,105 |
SunPower Corp. Class B (a) | 1,042 | | 12,931 |
Suntech Power Holdings Co. Ltd. sponsored ADR (a)(d) | 600 | | 4,806 |
Texas Instruments, Inc. | 40,700 | | 1,322,750 |
Trina Solar Ltd. ADR (a)(d) | 16,000 | | 374,720 |
TriQuint Semiconductor, Inc. (a) | 23,900 | | 279,391 |
Volterra Semiconductor Corp. (a) | 2,000 | | 46,320 |
Wolfson Microelectronics PLC (a) | 19,300 | | 87,623 |
YoungTek Electronics Corp. | 17,170 | | 49,679 |
| | 25,527,423 |
TOTAL SEMICONDUCTORS & SEMICONDUCTOR EQUIPMENT | | 33,847,951 |
|
| Shares | | Value |
SOFTWARE - 19.3% |
Application Software - 12.1% |
Adobe Systems, Inc. (a) | 600 | | $ 18,468 |
ANSYS, Inc. (a) | 12,500 | | 650,875 |
AsiaInfo Holdings, Inc. (a) | 4,500 | | 74,565 |
Aspen Technology, Inc. (a) | 17,600 | | 223,520 |
Autodesk, Inc. (a) | 23,700 | | 905,340 |
AutoNavi Holdings Ltd. ADR | 8,900 | | 142,667 |
Autonomy Corp. PLC (a) | 14,900 | | 349,856 |
BroadSoft, Inc. (a) | 25,000 | | 597,000 |
Cadence Design Systems, Inc. (a) | 21,400 | | 176,764 |
Citrix Systems, Inc. (a) | 1,300 | | 88,933 |
Compuware Corp. (a) | 93,500 | | 1,091,145 |
Concur Technologies, Inc. (a) | 12,200 | | 633,546 |
Convio, Inc. (a) | 33,200 | | 274,896 |
Epicor Software Corp. (a) | 17,795 | | 179,730 |
FactSet Research Systems, Inc. | 5,000 | | 468,800 |
Gameloft (a) | 27,500 | | 200,751 |
Informatica Corp. (a) | 44,000 | | 1,937,320 |
Intuit, Inc. (a) | 35,300 | | 1,740,290 |
JDA Software Group, Inc. (a) | 6,243 | | 174,804 |
Kenexa Corp. (a) | 4,200 | | 91,518 |
Kingdee International Software Group Co. Ltd. | 2,374,000 | | 1,331,700 |
Longtop Financial Technologies Ltd. ADR (a) | 19,300 | | 698,274 |
Magma Design Automation, Inc. (a) | 54,000 | | 270,540 |
Manhattan Associates, Inc. (a) | 2,888 | | 88,200 |
Mentor Graphics Corp. (a) | 15,000 | | 180,000 |
Micro Focus International PLC | 45,300 | | 274,713 |
MicroStrategy, Inc. Class A (a) | 901 | | 77,008 |
Nuance Communications, Inc. (a) | 61,800 | | 1,123,524 |
Parametric Technology Corp. (a) | 40,468 | | 911,744 |
Pegasystems, Inc. | 6,200 | | 227,106 |
QLIK Technologies, Inc. | 15,500 | | 400,055 |
Quest Software, Inc. (a) | 20,100 | | 557,574 |
RealPage, Inc. | 3,300 | | 102,069 |
salesforce.com, Inc. (a) | 25,900 | | 3,418,800 |
SolarWinds, Inc. (a) | 18,500 | | 356,125 |
SuccessFactors, Inc. (a) | 28,100 | | 813,776 |
Synopsys, Inc. (a) | 13,100 | | 352,521 |
Taleo Corp. Class A (a) | 13,200 | | 364,980 |
TeleNav, Inc. | 13,700 | | 99,736 |
TIBCO Software, Inc. (a) | 8,200 | | 161,622 |
Ultimate Software Group, Inc. (a) | 15,000 | | 729,450 |
VanceInfo Technologies, Inc. ADR (a) | 11,200 | | 386,848 |
Verint Systems, Inc. (a) | 9,300 | | 294,810 |
| | 23,241,963 |
Home Entertainment Software - 0.8% |
Activision Blizzard, Inc. | 6,500 | | 80,860 |
NCsoft Corp. | 1,248 | | 232,070 |
Neowiz Games Corp. (a) | 2,059 | | 84,380 |
Nintendo Co. Ltd. ADR | 8,200 | | 297,906 |
Common Stocks - continued |
| Shares | | Value |
SOFTWARE - CONTINUED |
Home Entertainment Software - continued |
Perfect World Co. Ltd. sponsored ADR Class B (a) | 15,200 | | $ 359,480 |
RealD, Inc. (d) | 9,800 | | 254,016 |
Rosetta Stone, Inc. (a) | 1,100 | | 23,342 |
Shanda Games Ltd. sponsored ADR (a) | 30,000 | | 193,200 |
| | 1,525,254 |
Systems Software - 6.4% |
Ariba, Inc. (a) | 35,892 | | 843,103 |
BMC Software, Inc. (a) | 37,900 | | 1,786,606 |
CA, Inc. | 39,300 | | 960,492 |
Check Point Software Technologies Ltd. (a) | 9,600 | | 444,096 |
CommVault Systems, Inc. (a) | 11,000 | | 314,820 |
Fortinet, Inc. (a) | 21,300 | | 689,055 |
Insyde Software Corp. | 24,823 | | 95,309 |
Microsoft Corp. | 625 | | 17,450 |
Oracle Corp. | 150,800 | | 4,720,040 |
Red Hat, Inc. (a) | 11,200 | | 511,280 |
Rovi Corp. (a) | 7,819 | | 484,856 |
Symantec Corp. (a) | 20,100 | | 336,474 |
TeleCommunication Systems, Inc. Class A (a) | 20,600 | | 96,202 |
Totvs SA | 5,700 | | 580,459 |
VMware, Inc. Class A (a) | 5,900 | | 524,569 |
| | 12,404,811 |
TOTAL SOFTWARE | | 37,172,028 |
WIRELESS TELECOMMUNICATION SERVICES - 0.5% |
Wireless Telecommunication Services - 0.5% |
American Tower Corp. Class A (a) | 6,800 | | 351,152 |
Crown Castle International Corp. (a) | 2,000 | | 87,660 |
SBA Communications Corp. Class A (a) | 2,200 | | 90,068 |
Sprint Nextel Corp. (a) | 123,400 | | 521,982 |
| | 1,050,862 |
TOTAL COMMON STOCKS (Cost $144,623,971) | 191,076,624 |
Convertible Bonds - 0.1% |
| Principal Amount | | Value |
COMMUNICATIONS EQUIPMENT - 0.1% |
Communications Equipment - 0.1% |
Ciena Corp. 0.25% 5/1/13
(Cost $157,875) | | $ 150,000 | | $ 137,550 |
Money Market Funds - 3.0% |
| Shares | | |
Fidelity Cash Central Fund, 0.19% (b) | 2,783,183 | | 2,783,183 |
Fidelity Securities Lending Cash Central Fund, 0.21% (b)(c) | 2,983,960 | | 2,983,960 |
TOTAL MONEY MARKET FUNDS (Cost $5,767,143) | 5,767,143 |
TOTAL INVESTMENT PORTFOLIO - 102.3% (Cost $150,548,989) | 196,981,317 |
NET OTHER ASSETS (LIABILITIES) - (2.3)% | (4,383,518) |
NET ASSETS - 100% | $ 192,597,799 |
Legend |
(a) Non-income producing |
(b) Affiliated fund that is available only to investment companies and other accounts managed by Fidelity Investments. The rate quoted is the annualized seven-day yield of the fund at period end. A complete unaudited listing of the fund's holdings as of its most recent quarter end is available upon request. In addition, each Fidelity Central Fund's financial statements, which are not covered by the Fund's Report of Independent Registered Public Accounting Firm, are available on the SEC's website or upon request. |
(c) Investment made with cash collateral received from securities on loan. |
(d) Security or a portion of the security is on loan at period end. |
(e) Security exempt from registration under Rule 144A of the Securities Act of 1933. These securities may be resold in transactions exempt from registration, normally to qualified institutional buyers. At the end of the period, the value of these securities amounted to $369,470 or 0.2% of net assets. |
Affiliated Central Funds |
Information regarding fiscal year to date income earned by the Fund from investments in Fidelity Central Funds is as follows: |
Fund | Income earned |
Fidelity Cash Central Fund | $ 3,870 |
Fidelity Securities Lending Cash Central Fund | 53,282 |
Total | $ 57,152 |
Other Information |
The following is a summary of the inputs used, as of December 31, 2010, involving the Fund's assets and liabilities carried at fair value. The inputs or methodology used for valuing securities may not be an indication of the risk associated with investing in those securities. For more information on valuation inputs, and their aggregation into the levels used in the table below, please refer to the Security Valuation section in the accompanying Notes to Financial Statements. |
Valuation Inputs at Reporting Date: |
Description | Total | Level 1 | Level 2 | Level 3 |
Investments in Securities: | | | | |
Common Stocks | $ 191,076,624 | $ 191,062,552 | $ 14,072 | $ - |
Convertible Bonds | 137,550 | - | 137,550 | - |
Money Market Funds | 5,767,143 | 5,767,143 | - | - |
Total Investments in Securities: | $ 196,981,317 | $ 196,829,695 | $ 151,622 | $ - |
Distribution of investments by country of issue, as a percentage of total net assets, is as follows: (Unaudited) |
United States of America | 80.6% |
Cayman Islands | 4.5% |
Taiwan | 2.7% |
Ireland | 2.7% |
Bermuda | 2.2% |
China | 1.1% |
Others (Individually Less Than 1%) | 6.2% |
| 100.0% |
See accompanying notes which are an integral part of the financial statements.
Annual Report
Statement of Assets and Liabilities
| December 31, 2010 |
| | |
Assets | | |
Investment in securities, at value (including securities loaned of $2,911,297) - See accompanying schedule: Unaffiliated issuers (cost $144,781,846) | $ 191,214,174 | |
Fidelity Central Funds (cost $5,767,143) | 5,767,143 | |
Total Investments (cost $150,548,989) | | $ 196,981,317 |
Cash | | 692,843 |
Foreign currency held at value
(cost $2) | | 2 |
Receivable for fund shares sold | | 382,228 |
Dividends receivable | | 30,410 |
Interest receivable | | 62 |
Distributions receivable from Fidelity Central Funds | | 5,154 |
Prepaid expenses | | 428 |
Other receivables | | 3,868 |
Total assets | | 198,096,312 |
| | |
Liabilities | | |
Payable for investments purchased | $ 2,369,181 | |
Accrued management fee | 86,064 | |
Other affiliated payables | 22,226 | |
Other payables and accrued expenses | 37,082 | |
Collateral on securities loaned, at value | 2,983,960 | |
Total liabilities | | 5,498,513 |
| | |
Net Assets | | $ 192,597,799 |
Net Assets consist of: | | |
Paid in capital | | $ 143,073,566 |
Accumulated undistributed net realized gain (loss) on investments and foreign currency transactions | | 3,091,837 |
Net unrealized appreciation (depreciation) on investments and assets and liabilities in foreign currencies | | 46,432,396 |
Net Assets | | $ 192,597,799 |
Statement of Assets and Liabilities - continued
| December 31, 2010 |
Initial Class:
Net Asset Value, offering price and redemption price per share ($100,854,351 ÷ 8,943,235 shares) | | $ 11.28 |
| | |
Investor Class:
Net Asset Value, offering price and redemption price per share ($91,743,448 ÷ 8,178,446 shares) | | $ 11.22 |
See accompanying notes which are an integral part of the financial statements.
Annual Report
Statement of Operations
| Year ended December 31, 2010 |
| | |
Investment Income | | |
Dividends | | $ 482,054 |
Interest | | 395 |
Income from Fidelity Central Funds (including $53,282 from security lending) | | 57,152 |
Total income | | 539,601 |
| | |
Expenses | | |
Management fee | $ 847,258 | |
Transfer agent fees | 176,810 | |
Accounting and security lending fees | 59,880 | |
Custodian fees and expenses | 36,107 | |
Independent trustees' compensation | 833 | |
Audit | 40,546 | |
Legal | 778 | |
Miscellaneous | 1,559 | |
Total expenses before reductions | 1,163,771 | |
Expense reductions | (29,338) | 1,134,433 |
Net investment income (loss) | | (594,832) |
Realized and Unrealized Gain (Loss) Net realized gain (loss) on: | | |
Investment securities: | | |
Unaffiliated issuers | 21,721,303 | |
Foreign currency transactions | 6,211 | |
Total net realized gain (loss) | | 21,727,514 |
Change in net unrealized appreciation (depreciation) on: Investment securities | 14,642,493 | |
Assets and liabilities in foreign currencies | 67 | |
Total change in net unrealized appreciation (depreciation) | | 14,642,560 |
Net gain (loss) | | 36,370,074 |
Net increase (decrease) in net assets resulting from operations | | $ 35,775,242 |
Statement of Changes in Net Assets
| Year ended December 31, 2010 | Year ended December 31, 2009 |
Increase (Decrease) in Net Assets | | |
Operations | | |
Net investment income (loss) | $ (594,832) | $ 78,876 |
Net realized gain (loss) | 21,727,514 | 6,519,468 |
Change in net unrealized appreciation (depreciation) | 14,642,560 | 49,267,160 |
Net increase (decrease) in net assets resulting from operations | 35,775,242 | 55,865,504 |
Distributions to shareholders from net investment income | - | (143,352) |
Share transactions - net increase (decrease) | 4,540,824 | 58,132,204 |
Redemption fees | 70,230 | 54,256 |
Total increase (decrease) in net assets | 40,386,296 | 113,908,612 |
| | |
Net Assets | | |
Beginning of period | 152,211,503 | 38,302,891 |
End of period | $ 192,597,799 | $ 152,211,503 |
See accompanying notes which are an integral part of the financial statements.
Annual Report
Financial Highlights - Initial Class
Years ended December 31, | 2010 | 2009 | 2008 | 2007 | 2006 |
Selected Per-Share Data | | | | | |
Net asset value, beginning of period | $ 8.83 | $ 4.51 | $ 11.02 | $ 10.37 | $ 10.35 |
Income from Investment Operations | | | | | |
Net investment income (loss) C | (.03) | .01 F | .01 | (.05) | (.04) |
Net realized and unrealized gain (loss) | 2.48 | 4.32 | (5.01) | 1.52 | .88 |
Total from investment operations | 2.45 | 4.33 | (5.00) | 1.47 | .84 |
Distributions from net investment income | - | (.01) | (.01) | - | - |
Distributions from net realized gain | - | - | (1.49) | (.83) | (.83) |
Total distributions | - | (.01) | (1.51) I | (.83) | (.83) |
Redemption fees added to paid in capital C | - H | - H | - H | .01 | .01 |
Net asset value, end of period | $ 11.28 | $ 8.83 | $ 4.51 | $ 11.02 | $ 10.37 |
Total Return A, B | 27.75% | 96.02% | (50.77)% | 15.36% | 8.19% |
Ratios to Average Net Assets D, G | | | | | |
Expenses before reductions | .73% | .78% | .81% | .81% | .80% |
Expenses net of fee waivers, if any | .72% | .78% | .81% | .81% | .80% |
Expenses net of all reductions | .71% | .76% | .79% | .79% | .77% |
Net investment income (loss) | (.35)% | .13% F | .19% | (.44)% | (.43)% |
Supplemental Data | | | | | |
Net assets, end of period (000 omitted) | $ 100,854 | $ 88,231 | $ 25,400 | $ 70,788 | $ 64,689 |
Portfolio turnover rate E | 114% | 130% | 237% | 213% | 269% |
A Total returns do not reflect charges attributable to your insurance company's separate account. Inclusion of these charges would reduce the total returns shown.
B Total returns would have been lower had certain expenses not been reduced during the periods shown.
C Calculated based on average shares outstanding during the period.
D Fees and expenses of the underlying Fidelity Central Funds are not included in the Fund's expense ratio. The Fund indirectly bears its proportionate share of the expenses of any underlying Fidelity Central Funds.
E Amount does not include the portfolio activity of any underlying Fidelity Central Funds.
F Investment income per share reflects a special dividend which amounted to $.01 per share. Excluding the special dividend, the ratio of net investment income (loss) to average net assets would have been (.08)%.
G Expense ratios reflect operating expenses of the class. Expenses before reductions do not reflect amounts reimbursed by the investment adviser or reductions from brokerage service arrangements or reductions from other expense offset arrangements and do not represent the amount paid by the class during periods when reimbursements or reductions occur. Expenses net of fee waivers reflect expenses after reimbursement by the investment adviser but prior to reductions from brokerage service arrangements or other expense offset arrangements. Expenses net of all reductions represent the net expenses paid by the class.
H Amount represents less than $.01 per share.
I Total distributions of $1.51 per share is comprised of distributions from net investment income of $0.011 and distributions from net realized gain of $1.494 per share.
Financial Highlights - Investor Class
Years ended December 31, | 2010 | 2009 | 2008 | 2007 | 2006 |
Selected Per-Share Data | | | | | |
Net asset value, beginning of period | $ 8.79 | $ 4.50 | $ 10.97 | $ 10.34 | $ 10.33 |
Income from Investment Operations | | | | | |
Net investment income (loss) C | (.04) | - F, H | .01 | (.06) | (.06) |
Net realized and unrealized gain (loss) | 2.47 | 4.30 | (4.99) | 1.50 | .89 |
Total from investment operations | 2.43 | 4.30 | (4.98) | 1.44 | .83 |
Distributions from net investment income | - | (.01) | (.01) | - | - |
Distributions from net realized gain | - | - | (1.49) | (.82) | (.83) |
Total distributions | - | (.01) | (1.49) I | (.82) | (.83) |
Redemption fees added to paid in capitalC | - H | - H | - H | .01 | .01 |
Net asset value, end of period | $ 11.22 | $ 8.79 | $ 4.50 | $ 10.97 | $ 10.34 |
Total Return A, B | 27.65% | 95.49% | (50.74)% | 15.15% | 8.10% |
Ratios to Average Net Assets D, G | | | | | |
Expenses before reductions | .81% | .88% | .90% | .93% | .93% |
Expenses net of fee waivers, if any | .81% | .88% | .90% | .93% | .93% |
Expenses net of all reductions | .80% | .85% | .89% | .91% | .90% |
Net investment income (loss) | (.44)% | .03% F | .10% | (.56)% | (.56)% |
Supplemental Data | | | | | |
Net assets, end of period (000 omitted) | $ 91,743 | $ 63,980 | $ 12,903 | $ 34,367 | $ 15,939 |
Portfolio turnover rate E | 114% | 130% | 237% | 213% | 269% |
A Total returns do not reflect charges attributable to your insurance company's separate account. Inclusion of these charges would reduce the total returns shown.
B Total returns would have been lower had certain expenses not been reduced during the periods shown.
C Calculated based on average shares outstanding during the period.
D Fees and expenses of the underlying Fidelity Central Funds are not included in the Fund's expense ratio. The Fund indirectly bears its proportionate share of the expenses of any underlying Fidelity Central Funds.
E Amount does not include the portfolio activity of any underlying Fidelity Central Funds.
F Investment income per share reflects a special dividend which amounted to $.01 per share. Excluding the special dividend, the ratio of net investment income (loss) to average net assets would have been (.17)%.
G Expense ratios reflect operating expenses of the class. Expenses before reductions do not reflect amounts reimbursed by the investment adviser or reductions from brokerage service arrangements or reductions from other expense offset arrangements and do not represent the amount paid by the class during periods when reimbursements or reductions occur. Expenses net of fee waivers reflect expenses after reimbursement by the investment adviser but prior to reductions from brokerage service arrangements or other expense offset arrangements. Expenses net of all reductions represent the net expenses paid by the class.
H Amount represents less than $.01 per share.
I Total distributions of $1.49 per share is comprised of distributions from net investment income of $0.005 and distributions from net realized gain of $1.485 per share.
See accompanying notes which are an integral part of the financial statements.
Annual Report
Notes to Financial Statements
For the period ended December 31, 2010
1. Organization.
VIP Technology Portfolio (the Fund) is a non-diversified fund of Variable Insurance Products Fund IV (the Trust) and is authorized to issue an unlimited number of shares. The Trust is registered under the Investment Company Act of 1940, as amended (the 1940 Act), as an open-end management investment company organized as a Massachusetts business trust. Shares of the Fund may only be purchased by insurance companies for the purpose of funding variable annuity or variable life insurance contracts. The Fund offers the following classes of shares: Initial Class shares and Investor Class shares. All classes have equal rights and voting privileges, except for matters affecting a single class. Investment income, realized and unrealized capital gains and losses, the common expenses of the Fund, and certain fund-level expense reductions, if any, are allocated on a pro-rata basis to each class based on the relative net assets of each class to the total net assets of the Fund. Each class differs with respect to transfer agent fees incurred. Certain expense reductions may also differ by class. The Fund's investments in emerging markets can be subject to social, economic, regulatory and political uncertainties and can be extremely volatile.
2. Investments in Fidelity Central Funds.
The Fund may invest in Fidelity Central Funds, which are open-end investment companies available only to other investment companies and accounts managed by Fidelity Management & Research Company (FMR) and its affiliates. The Fund's Schedule of Investments lists each of the Fidelity Central Funds held as of period end, if any, as an investment of the Fund, but does not include the underlying holdings of each Fidelity Central Fund. As an Investing Fund, the Fund indirectly bears its proportionate share of the expenses of the underlying Fidelity Central Funds.
The Money Market Central Funds seek preservation of capital and current income and are managed by Fidelity Investments Money Management, Inc. (FIMM), an affiliate of FMR.
A complete unaudited list of holdings for each Fidelity Central Fund is available upon request or at the Securities and Exchange Commission (the SEC) web site at www.sec.gov. In addition, the financial statements of the Fidelity Central Funds, which are not covered by the Fund's Report of Independent Registered Public Accounting Firm, are available on the SEC web site or upon request.
3. Significant Accounting Policies.
The financial statements have been prepared in conformity with accounting principles generally accepted in the United States of America (GAAP), which require management to make certain estimates and assumptions at the date of the financial statements. Actual results could differ from those estimates. Subsequent events, if any, through the date that the financial statements were issued have been evaluated in the preparation of the financial statements. The following summarizes the significant accounting policies of the Fund:
Security Valuation. Investments are valued as of 4:00 p.m. Eastern time on the last calendar day of the period. The Fund uses independent pricing services approved by the Board of Trustees to value its investments. When current market prices or quotations are not readily available or reliable, valuations may be determined in good faith in accordance with procedures adopted by the Board of Trustees. Factors used in determining value may include market or security specific events, changes in interest rates and credit quality. The frequency with which these procedures are used cannot be predicted and they may be utilized to a significant extent. The value used for net asset value (NAV) calculation under these procedures may differ from published prices for the same securities.
The Fund categorizes the inputs to valuation techniques used to value its investments into a disclosure hierarchy consisting of three levels as shown below.
Level 1 - quoted prices in active markets for identical investments
Level 2 - other significant observable inputs (including quoted prices for similar investments, interest rates, prepayment speeds, etc.)
Level 3 - unobservable inputs (including the Fund's own assumptions based on the best information available)
Changes in valuation techniques may result in transfers in or out of an assigned level within the disclosure hierarchy. The aggregate value of investments by input level, as of December 31, 2010, is included at the end of the Fund's Schedule of Investments. Valuation techniques used to value the Fund's investments by major category are as follows.
Equity securities, including restricted securities, for which market quotations are readily available, are valued at the last reported sale price or official closing price as reported by an independent pricing service on the primary market or exchange on which they are traded and are categorized as Level 1 in the hierarchy. In the event there were no sales during the day or closing prices are not available, securities are valued at the last quoted bid price or may be valued using the last available price and are generally categorized as Level 2 in the hierarchy. For foreign equity securities, when significant market or security specific events arise, comparisons to the valuation of American Depositary Receipts (ADRs), futures contracts, Exchange-traded
Annual Report
3. Significant Accounting Policies - continued
Security Valuation - continued
funds (ETFs) and certain indexes as well as quoted prices for similar securities are used and are categorized as Level 2 in the hierarchy in these circumstances. Utilizing these techniques may result in transfers between Level 1 and Level 2. For restricted equity securities and private placements where observable inputs are limited, assumptions about market activity and risk are used and are categorized as Level 3 in the hierarchy.
Debt securities, including restricted securities, are valued based on evaluated prices received from independent pricing services or from dealers who make markets in such securities. For corporate bonds, pricing services utilize matrix pricing which considers yield or price of bonds of comparable quality, coupon, maturity and type as well as dealer supplied prices and are generally categorized as Level 2 in the hierarchy.
Investments in open-end mutual funds, including the Fidelity Central Funds, are valued at their closing net asset value each business day and are categorized as Level 1 in the hierarchy.
When independent prices are unavailable or unreliable, debt securities may be valued utilizing pricing matrices which consider similar factors that would be used by independent pricing services. These are generally categorized as Level 2 in the hierarchy but may be Level 3 depending on the circumstances.
Foreign Currency. The Fund uses foreign currency contracts to facilitate transactions in foreign-denominated securities. Gains and losses from these transactions may arise from changes in the value of the foreign currency or if the counterparties do not perform under the contracts' terms.
Foreign-denominated assets, including investment securities, and liabilities are translated into U.S. dollars at the exchange rate at period end. Purchases and sales of investment securities, income and dividends received and expenses denominated in foreign currencies are translated into U.S. dollars at the exchange rate in effect on the transaction date.
The effects of exchange rate fluctuations on investments are included with the net realized and unrealized gain (loss) on investment securities. Other foreign currency transactions resulting in realized and unrealized gain (loss) are disclosed separately.
Investment Transactions and Income. For financial reporting purposes, the Fund's investment holdings and NAV include trades executed through the end of the last business day of the period. The NAV per share for processing shareholder transactions is calculated as of the close of business of the New York Stock Exchange (NYSE), normally 4:00 p.m. Eastern time and includes trades executed through the end of the prior business day. Gains and losses on securities sold are determined on the basis of identified cost and may include proceeds received from litigation. Dividend income is recorded on the ex-dividend date, except for certain dividends from foreign securities where the ex-dividend date may have passed, which are recorded as soon as the Fund is informed of the ex-dividend date. Non-cash dividends included in dividend income, if any, are recorded at the fair market value of the securities received. Distributions received on securities that represent a return of capital or capital gain are recorded as a reduction of cost of investments and/or as a realized gain. The Fund estimates the components of distributions received that may be considered return of capital distributions or capital gain distributions. As a result of a change in the estimate of the return of capital component of dividend income realized in the year ended December 31, 2009, dividend income has been reduced $130,429 with a corresponding increase to net unrealized appreciation (depreciation). The change in estimate has no impact on total net assets or total return of the Fund. Interest income and distributions from the Fidelity Central Funds are accrued as earned. Interest income includes coupon interest and amortization of premium and accretion of discount on debt securities. Investment income is recorded net of foreign taxes withheld where recovery of such taxes is uncertain.
Expenses. Expenses directly attributable to a fund are charged to that fund. Expenses attributable to more than one fund are allocated among the respective funds on the basis of relative net assets or other appropriate methods. Expense estimates are accrued in the period to which they relate and adjustments are made when actual amounts are known.
Income Tax Information and Distributions to Shareholders. Each year the Fund intends to qualify as a regulated investment company, including distributing substantially all of its taxable income and realized gains under Subchapter M of the Internal Revenue Code and filing its U.S. federal tax return. As a result, no provision for income taxes is required. As of December 31, 2010, the Fund did not have any unrecognized tax benefits in the accompanying financial statements. A fund's federal tax return is subject to examination by the Internal Revenue Service (IRS) for a period of three years. Foreign taxes are provided for based on the Fund's understanding of the tax rules and rates that exist in the foreign markets in which it invests.
Distributions are declared and recorded on the ex-dividend date. Income dividends and capital gain distributions are declared separately for each class. Income and capital gain distributions are determined in accordance with income tax regulations, which may differ from GAAP.
Capital accounts within the financial statements are adjusted for permanent book-tax differences. These adjustments have no impact on net assets or the results of operations. Temporary book-tax differences will reverse in a subsequent period.
Book-tax differences are primarily due to foreign currency transactions, net operating losses, capital loss carryforwards, and losses deferred due to wash sales and excise tax regulations.
Annual Report
Notes to Financial Statements - continued
3. Significant Accounting Policies - continued
Income Tax Information and Distributions to Shareholders - continued
The federal tax cost of investment securities and unrealized appreciation (depreciation) as of period end were as follows:
Gross unrealized appreciation | $ 49,226,078 |
Gross unrealized depreciation | (3,168,341) |
Net unrealized appreciation (depreciation) | $ 46,057,737 |
| |
Tax Cost | $ 150,923,580 |
The tax-based components of distributable earnings as of period end were as follows:
Undistributed long-term capital gain | $ 3,466,428 |
Net unrealized appreciation (depreciation) | $ 46,057,805 |
The tax character of distributions paid was as follows:
| December 31, 2010 | December 31, 2009 |
Ordinary Income | $ - | $ 143,352 |
Trading (Redemption) Fees. Shares held by investors less than 60 days are subject to a redemption fee equal to 1% of the net asset value of shares redeemed. All redemption fees, which reduce the proceeds of the shareholder redemption, are retained by the Fund and accounted for as an addition to paid in capital.
4. Operating Policies.
Restricted Securities. The Fund may invest in securities that are subject to legal or contractual restrictions on resale. These securities generally may be resold in transactions exempt from registration or to the public if the securities are registered. Disposal of these securities may involve time-consuming negotiations and expense, and prompt sale at an acceptable price may be difficult. Information regarding restricted securities is included at the end of the Fund's Schedule of Investments.
5. Purchases and Sales of Investments.
Purchases and sales of securities, other than short-term securities, aggregated $181,432,959 and $171,121,899, respectively.
6. Fees and Other Transactions with Affiliates.
Management Fee. FMR and its affiliates provide the Fund with investment management related services for which the Fund pays a monthly management fee. The management fee is the sum of an individual fund fee rate that is based on an annual rate of .30% of the Fund's average net assets and a group fee rate that averaged .26% during the period. The group fee rate is based upon the average net assets of all the mutual funds advised by FMR. The group fee rate decreases as assets under management increase and increases as assets under management decrease. For the period, the total annual management fee rate was .56% of the Fund's average net assets.
Transfer Agent Fees. Fidelity Investments Institutional Operations Company, Inc. (FIIOC), an affiliate of FMR, is the Fund's transfer, dividend disbursing, and shareholder servicing agent. FIIOC receives an asset-based fee with respect to each class. Each class (with the exception of Investor Class) pays a transfer agent fee, excluding out of pocket expenses, equal to an annual rate of .07% of average net assets. Investor Class pays a monthly asset-based transfer agent fee of .15% of average net assets. In addition, FIIOC receives an asset-based fee of .01% of average net assets for typesetting, printing and mailing of shareholder reports, except proxy statements. FIIOC has agreed to voluntarily waive this fee until December 31, 2010. (See Note 9: Expense Reductions.) For the period, transfer agent fees for each class, including printing and out of pocket expenses, were as follows:
Initial Class | $ 66,375 |
Investor Class | 110,435 |
| $ 176,810 |
Accounting and Security Lending Fees. Fidelity Service Company, Inc. (FSC), an affiliate of FMR, maintains the Fund's accounting records. The accounting fee is based on the level of average net assets for the month. Under a separate contract, FSC administers the security lending program. The security lending fee is based on the number and duration of lending transactions.
Annual Report
6. Fees and Other Transactions with Affiliates - continued
Brokerage Commissions. The Fund placed a portion of its portfolio transactions with brokerage firms which are affiliates of the investment adviser. The commissions paid to these affiliated firms were $9,450 for the period.
7. Committed Line of Credit.
The Fund participates with other funds managed by FMR or an affiliate in a $3.75 billion credit facility (the "line of credit") to be utilized for temporary or emergency purposes to fund shareholder redemptions or for other short-term liquidity purposes. The Fund has agreed to pay commitment fees on its pro-rata portion of the line of credit, which amounted to $563 and is reflected in Miscellaneous expenses on the Statement of Operations. During the period, there were no borrowings on this line of credit.
8. Security Lending.
The Fund lends portfolio securities through a lending agent from time to time in order to earn additional income. The lending agent may loan securities to certain qualified borrowers, including Fidelity Capital Markets (FCM), a broker-dealer affiliated with the Fund. On the settlement date of the loan, the Fund receives collateral (in the form of U.S. Treasury obligations, letters of credit and/or cash) against the loaned securities and maintains collateral in an amount not less than 100% of the market value of the loaned securities during the period of the loan. The market value of the loaned securities is determined at the close of business of the Fund and any additional required collateral is delivered to the Fund on the next business day. If the borrower defaults on its obligation to return the securities loaned because of insolvency or other reasons, a fund could experience delays and costs in recovering the securities loaned or in gaining access to the collateral. Any cash collateral received is invested in the Fidelity Securities Lending Cash Central Fund. The value of loaned securities and cash collateral at period end are disclosed on the Fund's Statement of Assets and Liabilities. Security lending income represents the income earned on investing cash collateral, less rebates paid to borrowers and lending agent fees associated with the loan, plus any premium payments received for lending certain types of securities. Security lending income is presented in the Statement of Operations as a component of income from Fidelity Central Funds. During the period, there were no securities loaned to FCM.
9. Expense Reductions.
FMR or its affiliates agreed to waive certain fees during the period as noted in the table below.
Initial Class | $ 6,105 |
Investor Class | 4,885 |
| $ 10,990 |
Many of the brokers with whom FMR places trades on behalf of the Fund provided services to the Fund in addition to trade execution. These services included payments of certain expenses on behalf of the Fund totaling $18,348 for the period.
10. Distributions to Shareholders.
Distributions to shareholders of each class were as follows:
Years ended December 31, | 2010 | 2009 |
From net investment income | | |
Initial Class | $ - | $ 95,944 |
Investor Class | - | 47,408 |
Total | $ - | $ 143,352 |
11. Share Transactions.
Transactions for each class of shares were as follows:
| Shares | Dollars |
Years ended December 31, | 2010 | 2009 | 2010 | 2009 |
Initial Class | | | | |
Shares sold | 2,243,164 | 5,685,392 | $ 22,111,972 | $ 36,339,585 |
Reinvestment of distributions | - | 11,274 | - | 95,944 |
Shares redeemed | (3,290,097) | (1,334,192) | (29,026,956) | (8,872,724) |
Net increase (decrease) | (1,046,933) | 4,362,474 | $ (6,914,984) | $ 27,562,805 |
Annual Report
Notes to Financial Statements - continued
11. Share Transactions - continued
| Shares | Dollars |
Years ended December 31, | 2010 | 2009 | 2010 | 2009 |
Investor Class | | | | |
Shares sold | 3,459,301 | 5,536,402 | $ 34,104,347 | $ 38,178,193 |
Reinvestment of distributions | - | 5,591 | - | 47,408 |
Shares redeemed | (2,557,328) | (1,135,168) | (22,648,539) | (7,656,202) |
Net increase (decrease) | 901,973 | 4,406,825 | $ 11,455,808 | $ 30,569,399 |
12. Other.
The Fund's organizational documents provide former and current trustees and officers with a limited indemnification against liabilities arising in connection with the performance of their duties to the Fund. In the normal course of business, the Fund may also enter into contracts that provide general indemnifications. The Fund's maximum exposure under these arrangements is unknown as this would be dependent on future claims that may be made against the Fund. The risk of material loss from such claims is considered remote.
At the end of the period, FMR or its affiliates were the owners of record of 100% of the total outstanding shares of the fund.
Annual Report
Report of Independent Registered Public Accounting Firm
To the Trustees of Variable Insurance Products Fund IV and the Shareholders of VIP Technology Portfolio:
In our opinion, the accompanying statement of assets and liabilities, including the schedule of investments, and the related statements of operations and of changes in net assets and the financial highlights present fairly, in all material respects, the financial position of VIP Technology Portfolio (a fund of Variable Insurance Products Fund IV) at December 31, 2010, the results of its operations for the year then ended, the changes in its net assets for each of the two years in the period then ended and the financial highlights for each of the five years in the period then ended, in conformity with accounting principles generally accepted in the United States of America. These financial statements and financial highlights (hereafter referred to as "financial statements") are the responsibility of the VIP Technology Portfolio's management. Our responsibility is to express an opinion on these financial statements based on our audits. We conducted our audits of these financial statements in accordance with the standards of the Public Company Accounting Oversight Board (United States). Those standards require that we plan and perform the audit to obtain reasonable assurance about whether the financial statements are free of material misstatement. An audit includes examining, on a test basis, evidence supporting the amounts and disclosures in the financial statements, assessing the accounting principles used and significant estimates made by management, and evaluating the overall financial statement presentation. We believe that our audits, which included confirmation of securities at December 31, 2010 by correspondence with the custodian and brokers, provide a reasonable basis for our opinion.
/s/ PricewaterhouseCoopers LLP
PricewaterhouseCoopers LLP
Boston, Massachusetts
February 17, 2011
Annual Report
The Trustees, Members of the Advisory Board, and executive officers of the trust and fund, as applicable, are listed below. The Board of Trustees governs the fund and is responsible for protecting the interests of shareholders. The Trustees are experienced executives who meet periodically throughout the year to oversee the fund's activities, review contractual arrangements with companies that provide services to the fund, oversee management of the risks associated with such activities and contractual arrangements, and review the fund's performance. Except for James C. Curvey, each of the Trustees oversees 219 funds advised by FMR or an affiliate. Mr. Curvey oversees 408 funds advised by FMR or an affiliate.
The Trustees hold office without limit in time except that (a) any Trustee may resign; (b) any Trustee may be removed by written instrument, signed by at least two-thirds of the number of Trustees prior to such removal; (c) any Trustee who requests to be retired or who has become incapacitated by illness or injury may be retired by written instrument signed by a majority of the other Trustees; and (d) any Trustee may be removed at any special meeting of shareholders by a two-thirds vote of the outstanding voting securities of the trust. Each Trustee who is not an interested person (as defined in the 1940 Act) (Independent Trustee), shall retire not later than the last day of the calendar year in which his or her 72nd birthday occurs. The Independent Trustees may waive this mandatory retirement age policy with respect to individual Trustees. The executive officers and Advisory Board Members hold office without limit in time, except that any officer and Advisory Board Member may resign or may be removed by a vote of a majority of the Trustees at any regular meeting or any special meeting of the Trustees. Except as indicated, each individual has held the office shown or other offices in the same company for the past five years.
Experience, Skills, Attributes, and Qualifications of the Fund's Trustees. The Governance and Nominating Committee has adopted a statement of policy that describes the experience, qualifications, attributes, and skills that are necessary and desirable for potential Independent Trustee candidates (Statement of Policy). The Board believes that each Trustee satisfied at the time he or she was initially elected or appointed a Trustee, and continues to satisfy, the standards contemplated by the Statement of Policy. The Governance and Nominating Committee also engages professional search firms to help identify potential Independent Trustee candidates who have the experience, qualifications, attributes, and skills consistent with the Statement of Policy. From time to time, additional criteria based on the composition and skills of the current Independent Trustees, as well as experience or skills that may be appropriate in light of future changes to board composition, business conditions, and regulatory or other developments, have also been considered by the professional search firms and the Governance and Nominating Committee. In addition, the Board takes into account the Trustees' commitment and participation in Board and committee meetings, as well as their leadership of standing and ad hoc committees throughout their tenure.
In determining that a particular Trustee was and continues to be qualified to serve as a Trustee, the Board has considered a variety of criteria, none of which, in isolation, was controlling. The Board believes that, collectively, the Trustees have balanced and diverse experience, qualifications, attributes, and skills, which allow the Board to operate effectively in governing the fund and protecting the interests of shareholders. Information about the specific experience, skills, attributes, and qualifications of each Trustee, which in each case led to the Board's conclusion that the Trustee should serve (or continue to serve) as a trustee of the fund, is provided below.
Board Structure and Oversight Function. James C. Curvey is an interested person (as defined in the 1940 Act) and currently serves as Acting Chairman. The Trustees have determined that an interested Chairman is appropriate and benefits shareholders because an interested Chairman has a personal and professional stake in the quality and continuity of services provided to the fund. Independent Trustees exercise their informed business judgment to appoint an individual of their choosing to serve as Chairman, regardless of whether the Trustee happens to be independent or a member of management. The Independent Trustees have determined that they can act independently and effectively without having an Independent Trustee serve as Chairman and that a key structural component for assuring that they are in a position to do so is for the Independent Trustees to constitute a substantial majority for the Board. The Independent Trustees also regularly meet in executive session. Ned C. Lautenbach serves as Chairman of the Independent Trustees and as such (i) acts as a liaison between the Independent Trustees and management with respect to matters important to the Independent Trustees and (ii) with management prepares agendas for Board meetings.
Fidelity funds are overseen by different Boards of Trustees. The fund's Board oversees Fidelity's equity and high income funds and another Board oversees Fidelity's investment-grade bond, money market, and asset allocation funds. The asset allocation funds may invest in Fidelity funds overseen by the fund's Board. The use of separate Boards, each with its own committee structure, allows the Trustees of each group of Fidelity funds to focus on the unique issues of the funds they oversee, including common research, investment, and operational issues. On occasion, the separate Boards establish joint committees to address issues of overlapping consequences for the Fidelity funds overseen by each Board.
The Trustees operate using a system of committees to facilitate the timely and efficient consideration of all matters of importance to the Trustees, the fund, and fund shareholders and to facilitate compliance with legal and regulatory requirements and oversight of the fund's activities and associated risks. The Board, acting through its committees, has charged FMR and its affiliates with (i) identifying events or circumstances the occurrence of which could have demonstrably adverse effects on the fund's business and/or reputation; (ii) implementing processes and controls to lessen the possibility that such events or circumstances occur or to mitigate the effects of such events or circumstances if they do occur; and (iii) creating and maintaining a system designed to evaluate continuously business and market conditions in order to facilitate the identification and implementation processes described in (i) and (ii) above. Because the day-to-day operations and activities of the fund are carried out by or through FMR, its affiliates and other service providers, the fund's exposure to risks is mitigated but not eliminated by the processes overseen by the Trustees. While each of the Board's committees has responsibility for overseeing different aspects of the fund's activities, oversight is exercised primarily through the Operations, Audit, and Compliance Committees. Appropriate personnel, including but not limited to the fund's Chief Compliance Officer (CCO), FMR's internal auditor, the independent accountants, the fund's Treasurer and portfolio management personnel, make periodic reports to the Board's committees, as appropriate. The responsibilities of each committee, including their oversight responsibilities, are described further under "Standing Committees of the Fund's Trustees."
Annual Report
The fund's Statement of Additional Information (SAI) includes more information about the Trustees. To request a free copy, call Fidelity at 1-877-208-0098.
Interested Trustees*:
Correspondence intended for each Trustee who is an interested person may be sent to Fidelity Investments, 82 Devonshire Street, Boston, Massachusetts 02109.
Name, Age; Principal Occupations and Other Relevant Experience+ |
James C. Curvey (75) |
| Year of Election or Appointment: 2007 Mr. Curvey is Trustee and Acting Chairman of the Board of Trustees of certain Trusts. Mr. Curvey also serves as Trustee (2007-present) of other investment companies advised by FMR. Mr. Curvey is a Director of Fidelity Investments Money Management, Inc. (2009-present), Director of Fidelity Research & Analysis Co. (2009-present) and Director of FMR and FMR Co., Inc. (2007-present). Mr. Curvey is also Vice Chairman (2007-present) and Director of FMR LLC. In addition, Mr. Curvey serves as an Overseer for the Boston Symphony Orchestra and a member of the Trustees of Villanova University. Previously, Mr. Curvey was the Vice Chairman (2006-2007) and Director (2000-2007) of FMR Corp. |
Ronald P. O'Hanley (54) |
| Year of Election or Appointment: 2011 Mr. O'Hanley is President of Fidelity Asset Management and Corporate Services and a member of Fidelity's Executive Committee (2010-present). Previously, Mr. O'Hanley served as President and Chief Executive Officer of BNY Mellon Asset Management (2007-2010). Mr. O'Hanley also served as Vice Chairman of Bank New York Mellon Corp. and a member of that firm's Executive Committee. Prior to the 2007 merger of The Bank of New York and Mellon Financial Corporation, he was Vice Chairman of Mellon Financial Corporation and President and Chief Executive Officer of Mellon Asset Management. He joined Mellon in February 1997. Mr. O'Hanley currently serves as Chairman of the Boston Public Library Foundation Board of Directors and sits on the Board of Directors of Beth Israel Deaconess Medical Center, the Board of Trustees of the Marine Biological Laboratory and the Advisory Board of the Maxwell School of Citizenship and Public Administration at Syracuse University. Mr. O'Hanley also chairs the Council on Asset Management for the Financial Services Roundtable and is a member of the Board of Directors of Institutional Investor's U.S. Institute. |
* Trustees have been determined to be "Interested Trustees" by virtue of, among other things, their affiliation with the trust or various entities under common control with FMR.
+ The information above includes each Trustee's principal occupation during the last five years and other information relating to the experience, attributes, and skills relevant to each Trustee's qualifications to serve as a Trustee, which led to the conclusion that each Trustee should serve as a Trustee for the fund.
Independent Trustees:
Correspondence intended for each Independent Trustee (that is, the Trustees other than the Interested Trustees) may be sent to Fidelity Investments, P.O. Box 55235, Boston, Massachusetts 02205-5235.
Name, Age; Principal Occupations and Other Relevant Experience+ |
Dennis J. Dirks (62) |
| Year of Election or Appointment: 2005 Prior to his retirement in May 2003, Mr. Dirks was Chief Operating Officer and a member of the Board of The Depository Trust & Clearing Corporation (DTCC). He also served as President, Chief Operating Officer, and Board member of The Depository Trust Company (DTC) and President and Board member of the National Securities Clearing Corporation (NSCC). In addition, Mr. Dirks served as Chief Executive Officer and Board member of the Government Securities Clearing Corporation, Chief Executive Officer and Board member of the Mortgage-Backed Securities Clearing Corporation, as a Trustee and a member of the Finance Committee of Manhattan College (2005-2008), and as a Trustee and a member of the Finance Committee of AHRC of Nassau County (2006-2008). Mr. Dirks is a member of the Independent Directors Council (IDC) Governing Council (2010-Present) and Board of Directors for The Brookville Center for Children's Services, Inc. (2009-present). |
Alan J. Lacy (57) |
| Year of Election or Appointment: 2008 Mr. Lacy serves as Senior Adviser (2007-present) of Oak Hill Capital Partners, L.P. (private equity). Mr. Lacy also served as Chief Executive Officer (2000-2005) and Vice Chairman (2005-2006) of Sears Holdings Corporation and Sears, Roebuck and Co. (retail). In addition, Mr. Lacy serves as a member of the Board of Directors of The Western Union Company (global money transfer, 2006-present) and Bristol-Myers Squibb Company (global pharmaceuticals, 2007-present). Mr. Lacy is Chairman (2008-present) and a member (2006-present) of the Board of Trustees of The National Parks Conservation Association. |
Ned C. Lautenbach (66) |
| Year of Election or Appointment: 2000 Mr. Lautenbach is Chairman of the Independent Trustees of the Equity and High Income Funds (2006-present). Mr. Lautenbach currently serves as the Lead Director of the Eaton Corporation Board of Directors (diversified industrial, 1997-present). Mr. Lautenbach is also a member of the Board of Directors of the Philharmonic Center for the Arts in Naples, Florida (1999-present); a member of the Board of Trustees of Fairfield University (2005-present); and a member of the Council on Foreign Relations (1994-present). Previously, Mr. Lautenbach was a Partner/Advisory Partner at Clayton, Dubilier & Rice, Inc. (private equity investment, 1998-2010), as well as a Director of Sony Corporation (2006-2007). |
Joseph Mauriello (66) |
| Year of Election or Appointment: 2008 Prior to his retirement in January 2006, Mr. Mauriello served in numerous senior management positions including Deputy Chairman and Chief Operating Officer (2004-2005), and Vice Chairman of Financial Services (2002-2004) of KPMG LLP US (professional services, 1965-2005). Mr. Mauriello currently serves as a member of the Board of Directors of XL Group plc. (global insurance and re-insurance, 2006-present) and of Arcadia Resources Inc. (health care services and products, 2007-present). Previously, Mr. Mauriello served as a Director of the Hamilton Funds of the Bank of New York (2006-2007). |
Cornelia M. Small (66) |
| Year of Election or Appointment: 2005 Ms. Small is a member of the Board of Directors of the Teagle Foundation (2009-present). Ms. Small is also a member of the Investment Committee, and Chair (2008-present) and a member of the Board of Trustees of Smith College. In addition, Ms. Small serves on the Investment Committee of the Berkshire Taconic Community Foundation (2008-present). Previously, Ms. Small served as Chairperson of the Investment Committee (2002-2008) of Smith College. In addition, Ms. Small served as Chief Investment Officer, Director of Global Equity Investments, and a member of the Board of Directors of Scudder, Stevens & Clark and Scudder Kemper Investments. |
William S. Stavropoulos (71) |
| Year of Election or Appointment: 2001 Mr. Stavropoulos is Vice Chairman of the Independent Trustees of the Equity and High Income Funds (2006-present). Mr. Stavropoulos serves as President and Founder of the Michigan Baseball Foundation, the Great Lakes Loons (2007-present). Mr. Stavropoulos is Chairman Emeritus of the Board of Directors of The Dow Chemical Company, where he previously served in numerous senior management positions, including President, CEO (1995-2000; 2002-2004), Chairman of the Executive Committee (2000-2006), and as a member of the Board of Directors (1990-2006). Currently, Mr. Stavropoulos is Chairman of Univar (global distributor of commodity and specialty chemicals, 2010-present), a Director of Teradata Corporation (data warehousing and technology solutions, 2008-present), Chemical Financial Corporation, Maersk Inc. (industrial conglomerate), Tyco International, Inc. (multinational manufacturing and services, 2007-present), and a member of the Advisory Board for Metalmark Capital (private equity investment, 2005-present). Mr. Stavropoulos is a special advisor to Clayton, Dubilier & Rice, LLC (private equity investment). In addition, Mr. Stavropoulos is a member of the University of Notre Dame Advisory Council for the College of Science. |
David M. Thomas (61) |
| Year of Election or Appointment: 2008 Previously, Mr. Thomas served as Executive Chairman (2005-2006) and Chairman and Chief Executive Officer (2000-2005) of IMS Health, Inc. (pharmaceutical and healthcare information solutions). In addition, Mr. Thomas serves as a member of the Board of Directors of Fortune Brands, Inc. (consumer products), and Interpublic Group of Companies, Inc. (marketing communication, 2004-present). |
Michael E. Wiley (60) |
| Year of Election or Appointment: 2008 Mr. Wiley also serves as a Director of Asia Pacific Exploration Consolidated (international oil and gas exploration and production, 2008-present). Mr. Wiley serves as a Director of Tesoro Corporation (independent oil refiner and marketer, 2005-present), and a Director of Bill Barrett Corporation (exploration and production, 2005-present). In addition, Mr. Wiley also serves as a Director of Post Oak Bank (privately-held bank, 2004-present). Previously, Mr. Wiley served as a member of the Board of Trustees of the University of Tulsa (2000-2006; 2007-2010), as a Senior Energy Advisor of Katzenbach Partners, LLC (consulting, 2006-2007), as an Advisory Director of Riverstone Holdings (private investment), Chairman, President, and CEO of Baker Hughes, Inc. (oilfield services, 2000-2004), and as Director of Spinnaker Exploration Company (exploration and production, 2001-2005). |
+ The information above includes each Trustee's principal occupation during the last five years and other information relating to the experience, attributes, and skills relevant to each Trustee's qualifications to serve as a Trustee, which led to the conclusion that each Trustee should serve as a Trustee for the fund.
Advisory Board Members and Executive Officers:
Correspondence intended for each executive officer, Edward C. Johnson 3d, and Peter S. Lynch may be sent to Fidelity Investments, 82 Devonshire Street, Boston, Massachusetts 02109.
Name, Age; Principal Occupation |
Edward C. Johnson 3d (80) |
| Year of Election or Appointment: 2011 Member of the Advisory Board of Fidelity's Equity and High Income Funds. Formerly Trustee and Chairman of the Board of Trustees of certain Trusts, Mr. Johnson serves as Chief Executive Officer, Chairman, and a Director of FMR LLC; Chairman and a Director of FMR; and Chairman and a Director of FMR Co., Inc. In addition, Mr. Johnson serves as Chairman and Director of FIL Limited. Previously, Mr. Johnson served as President of FMR LLC (2006-2007). |
Peter S. Lynch (66) |
| Year of Election or Appointment: 2003 Member of the Advisory Board of Fidelity's Equity and High Income Funds. Mr. Lynch is Vice Chairman and a Director of FMR and FMR Co., Inc. In addition, Mr. Lynch serves as a Trustee of Boston College and as the Chairman of the Inner-City Scholarship Fund. Previously, Mr. Lynch served on the Special Olympics International Board of Directors (1997-2006). |
Kenneth B. Robins (41) |
| Year of Election or Appointment: 2008 President and Treasurer of Fidelity's Equity and High Income Funds. Mr. Robins also serves as President and Treasurer (2010-present) and Assistant Treasurer (2009-present) of other Fidelity funds and is an employee of Fidelity Investments (2004-present). Previously, Mr. Robins served as Deputy Treasurer of the Fidelity funds (2005-2008) and Treasurer and Chief Financial Officer of The North Carolina Capital Management Trust: Cash and Term Portfolios (2006-2008). |
Brian B. Hogan (46) |
| Year of Election or Appointment: 2009 Vice President of certain Equity Funds and Vice President of Sector Funds. Mr. Hogan also serves as President of FMR's Equity Division (2009-present). Previously, Mr. Hogan served as Senior Vice President, Equity Research of FMR (2006-2009) and as a portfolio manager. |
Christopher S. Bartel (39) |
| Year of Election or Appointment: 2009 Vice President of Fidelity's Sector and Real Estate Equity Funds. Mr. Bartel also serves as Senior Vice President of Equity Research (2009-present). Previously, Mr. Bartel served as Managing Director of Research (2006-2009) and an analyst and portfolio manager (2000-2006). |
Scott C. Goebel (42) |
| Year of Election or Appointment: 2008 Secretary and Chief Legal Officer (CLO) of the Fidelity funds. Mr. Goebel also serves as Secretary and CLO of The North Carolina Capital Management Trust: Cash and Term Portfolio (2008-present); General Counsel, Secretary, and Senior Vice President of FMR (2008-present) and FMR Co., Inc. (2008-present); Deputy General Counsel of FMR LLC; Chief Legal Officer of Fidelity Management & Research (Hong Kong) Limited (2008-present) and Assistant Secretary of Fidelity Management & Research (Japan) Inc. (2008-present), Fidelity Investments Money Management, Inc. (2008-present), Fidelity Management & Research (U.K.) Inc. (2008-present), and Fidelity Research and Analysis Company (2008-present). Previously, Mr. Goebel served as Assistant Secretary of the Funds (2007-2008) and as Vice President and Secretary of Fidelity Distributors Corporation (FDC) (2005-2007). |
William C. Coffey (41) |
| Year of Election or Appointment: 2009 Assistant Secretary of Fidelity's Equity and High Income Funds. Mr. Coffey also serves as Senior Vice President and Deputy General Counsel of FMR LLC (2010-present), and is an employee of Fidelity Investments. Previously, Mr. Coffey served as Vice President and Associate General Counsel of FMR LLC (2005-2009). |
Holly C. Laurent (56) |
| Year of Election or Appointment: 2008 Anti-Money Laundering (AML) Officer of the Fidelity funds. Ms. Laurent also serves as AML Officer of The North Carolina Capital Management Trust: Cash and Term Portfolio (2008-present) and is an employee of Fidelity Investments. Previously, Ms. Laurent was Senior Vice President and Head of Legal for Fidelity Business Services India Pvt. Ltd. (2006-2008), and Senior Vice President, Deputy General Counsel and Group Head for FMR LLC (2005-2006). |
Christine Reynolds (52) |
| Year of Election or Appointment: 2008 Chief Financial Officer of the Fidelity funds. Ms. Reynolds became President of Fidelity Pricing and Cash Management Services (FPCMS) in August 2008. Ms. Reynolds served as Chief Operating Officer of FPCMS (2007-2008). Previously, Ms. Reynolds served as President, Treasurer, and Anti-Money Laundering officer of the Fidelity funds (2004-2007). |
Kenneth A. Rathgeber (63) |
| Year of Election or Appointment: 2004 Chief Compliance Officer of Fidelity's Equity and High Income Funds. Mr. Rathgeber is Chief Compliance Officer of Fidelity Management & Research (Hong Kong) Limited (2008-present), Fidelity Management & Research (Japan) Inc. (2008-present), FMR (2005-present), FMR Co., Inc. (2005-present), Fidelity Management & Research (U.K.) Inc. (2005-present), Fidelity Research & Analysis Company (2005-present), Fidelity Investments Money Management, Inc. (2005-present), Pyramis Global Advisors, LLC (2005-present), and Strategic Advisers, Inc. (2005-present). |
Jeffrey S. Christian (49) |
| Year of Election or Appointment: 2009 Deputy Treasurer of the Fidelity funds. Mr. Christian is an employee of Fidelity Investments. Previously, Mr. Christian served as Chief Financial Officer (2008-2009) of certain Fidelity funds and Senior Vice President of Fidelity Pricing and Cash Management Services (FPCMS) (2004-2009). |
Bryan A. Mehrmann (49) |
| Year of Election or Appointment: 2005 Deputy Treasurer of the Fidelity funds. Mr. Mehrmann is an employee of Fidelity Investments. |
Adrien E. Deberghes (43) |
| Year of Election or Appointment: 2008 Deputy Treasurer of Fidelity's Equity and High Income Funds. Mr. Deberghes also serves as Assistant Treasurer of other Fidelity funds (2010-present) and is an employee of Fidelity Investments (2008-present). Previously, Mr. Deberghes served as Senior Vice President of Mutual Fund Administration at State Street Corporation (2007-2008), Senior Director of Mutual Fund Administration at Investors Bank & Trust (2005-2007), and Director of Finance for Dunkin' Brands (2000-2005). |
Stephanie J. Dorsey (41) |
| Year of Election or Appointment: 2010 Assistant Treasurer of Fidelity's Equity and High Income Funds. Ms. Dorsey also serves as Deputy Treasurer of other Fidelity funds (2008-present) and is an employee of Fidelity Investments (2008-present). Previously, Ms. Dorsey served as Treasurer (2004-2008) of the JPMorgan Mutual Funds and Vice President (2004-2008) of JPMorgan Chase Bank. |
John R. Hebble (52) |
| Year of Election or Appointment: 2009 Assistant Treasurer of Fidelity's Equity and High Income Funds. Mr. Hebble also serves as Treasurer and Chief Financial Officer of The North Carolina Capital Management Trust: Cash and Term Portfolio (2008-present), President and Treasurer of other Fidelity funds (2008-present) and is an employee of Fidelity Investments. |
Gary W. Ryan (52) |
| Year of Election or Appointment: 2005 Assistant Treasurer of the Fidelity funds. Mr. Ryan is an employee of Fidelity Investments. Previously, Mr. Ryan served as Vice President of Fund Reporting in Fidelity Pricing and Cash Management Services (FPCMS) (1999-2005). |
Jonathan Davis (42) |
| Year of Election or Appointment: 2010 Assistant Treasurer of the Fidelity funds. Mr. Davis is an employee of Fidelity Investments. Previously, Mr. Davis served as Vice President and Associate General Counsel of FMR LLC (2003-2010). |
Annual Report
The Board of Trustees of VIP Technology Portfolio voted to pay to shareholders of record at the opening of business on record date, the following distributions per share derived from capital gains realized from sales of portfolio securities:
| Pay Date | Record Date | Capital Gains |
Initial Class | 02/04/2011 | 02/04/2011 | $0.185 |
Investor Class | 02/04/2011 | 02/04/2011 | $0.185 |
The fund hereby designates as a capital gain dividend with respect to the taxable year ended December 2010, $3,466,428, or, if subsequently determined to be different, the net capital gain of such year.
Annual Report
Board Approval of Investment Advisory Contracts and Management Fees
VIP Technology Portfolio
Each year, the Board of Trustees, including the Independent Trustees (together, the Board), votes on the renewal of the management contract and sub-advisory agreements (together, the Advisory Contracts) for the fund. The Board, assisted by the advice of fund counsel and Independent Trustees' counsel, requests and considers a broad range of information relevant to the renewal of the Advisory Contracts throughout the year.
The Board meets regularly and considers at each of its meetings factors that are relevant to its annual consideration of the renewal of the fund's Advisory Contracts, including the services and support provided to the fund and its shareholders. The Board has established various standing committees, each composed of Independent Trustees with varying backgrounds, to which the Board has assigned specific subject matter responsibilities in order to enhance effective decision-making by the Board. The Board, acting directly and through its Committees, requests and receives information concerning the annual consideration of the renewal of the fund's Advisory Contracts. The Board also meets as needed to consider matters specifically related to the Board's annual consideration of the renewal of Advisory Contracts. Members of the Board may also meet with trustees of other Fidelity funds through ad hoc joint committees to discuss certain matters relevant to the Fidelity funds.
At its July 2010 meeting, the Board of Trustees, including the Independent Trustees, unanimously determined to renew the fund's Advisory Contracts. In reaching its determination, the Board considered all factors it believed relevant, including (i) the nature, extent, and quality of the services to be provided to the fund and its shareholders (including the investment performance of the fund); (ii) the competitiveness of the fund's management fee and total expenses; (iii) the total costs of the services to be provided by and the profits to be realized by Fidelity from its relationship with the fund; (iv) the extent to which economies of scale would be realized as the fund grows; and (v) whether fee levels reflect these economies of scale, if any, for the benefit of fund shareholders.
In considering whether to renew the Advisory Contracts for the fund, the Board reached a determination, with the assistance of fund counsel and Independent Trustees' counsel and through the exercise of its business judgment, that the renewal of the Advisory Contracts is in the best interests of fund shareholders and that the compensation to be received by Fidelity under the management contract is fair and reasonable. The Board's decision to renew the Advisory Contracts was not based on any single factor noted above, but rather was based on a comprehensive consideration of all the information provided to the Board at its meetings throughout the year. The Board, in reaching its determination to renew the Advisory Contracts, is aware that shareholders in the fund have a broad range of investment choices available to them, including a wide choice among mutual funds offered by Fidelity's competitors, and that the fund's shareholders, with the opportunity to review and weigh the disclosure provided by the fund in its prospectus and other public disclosures, have chosen to invest in this fund, managed by Fidelity.
Nature, Extent, and Quality of Services Provided. The Board considered the staffing within the investment adviser, FMR, and the sub-advisers (together, the Investment Advisers), including the backgrounds of the fund's investment personnel and the fund's investment objective and discipline. The Independent Trustees also had discussions with senior management of Fidelity's investment operations and investment groups. The Board considered the structure of the portfolio manager compensation program and whether this structure provides appropriate incentives to act in the best interest of the fund.
Resources Dedicated to Investment Management and Support Services. The Board and the equity research subcommittee of the Board's Fund Oversight Committee reviewed the size, education, and experience of the Investment Advisers' investment staff, their use of technology, and the Investment Advisers' approach to recruiting, training, and retaining portfolio managers and other research, advisory, and management personnel. The Board noted that Fidelity's analysts have access to a variety of technological tools and market and securities data that enable them to perform both fundamental and quantitative analysis and to specialize in various disciplines. The Board considered Fidelity's extensive global research capabilities that enable the Investment Advisers to aggregate data from various sources in an effort to produce positive investment results. The Board also considered that Fidelity's portfolio managers and analysts have access to daily portfolio attribution that allows for monitoring of a fund's portfolio, as well as an electronic communication system that provides immediate real-time access to research concerning issuers and credit enhancers. The Board noted FMR's continued focus on strengthening the organization and discipline of equity portfolio management and research.
Shareholder and Administrative Services. The Board considered (i) the nature, extent, quality, and cost of advisory, administrative, and shareholder services performed by the Investment Advisers and their affiliates under the Advisory Contracts and under separate agreements covering transfer agency, pricing and bookkeeping, and securities lending services for the fund; (ii) the nature and extent of the investment adviser's supervision of third party service providers, principally custodians and subcustodians; and (iii) the resources devoted to, and the record of compliance with, the fund's compliance policies and procedures. The Board also reviewed the allocation of fund brokerage, including allocations to brokers affiliated with the Investment Advisers, the use of brokerage commissions to pay fund expenses, and the use of "soft" commission dollars to pay for research services.
The Board noted that the growth of fund assets over time across the complex allows Fidelity to reinvest in the development of services designed to enhance the value or convenience of the Fidelity funds as investment vehicles. These services include 24-hour access to account information and market information through phone representatives and over the Internet, and investor education materials and asset allocation tools.
Investment in a Large Fund Family. The Board considered the benefits to shareholders of investing in a Fidelity fund, including the benefits of investing in a fund that is part of a large family of funds offering a variety of investment disciplines and providing a large variety of mutual fund investor services. The Board noted that Fidelity had taken, or had made recommendations that resulted in the Fidelity funds taking, a number of actions over the previous year that benefited particular funds, including (i) dedicating additional resources to investment research and restructuring and broadening the focus of the investment research teams; (ii) bolstering the senior management team that oversees asset management; (iii) launching Class F of certain funds as a lower-fee class available to Freedom K and Freedom Index Funds; (iv) lowering the initial investment minimums and ongoing balance requirements for Real Estate High Income Fund; (v) eliminating subsequent purchase minimums for all funds and adding a waiver of the investment minimum requirement for new accounts opened with the proceeds of a systematic withdrawal plan; (vi) eliminating the withdrawal minimum and maximum limits for systematic withdrawals from Advisor funds; (vii) expanding sales load waivers on Class A shares for Destiny Planholders and expanding Institutional Class eligibility for Class O Destiny Planholders; and (viii) changing certain Class A and Class T sales charge structures to further align them with industry practices.
Annual Report
Investment Performance. The Board considered whether the fund has operated in accordance with its investment objective, as well as its record of compliance with its investment restrictions. It also reviewed the fund's absolute investment performance for each class, as well as the fund's relative investment performance for each class measured over multiple periods against a third-party-sponsored index that reflects the market sector in which the fund invests. The Board noted that FMR does not believe that a meaningful peer group exists against which to compare the fund's performance. The following charts considered by the Board show, over the one-, three-, and five-year periods ended December 31, 2009, as available, the cumulative total returns of Initial Class and Investor Class of the fund and the cumulative total returns of a third-party-sponsored index ("benchmark").
VIP Technology Portfolio
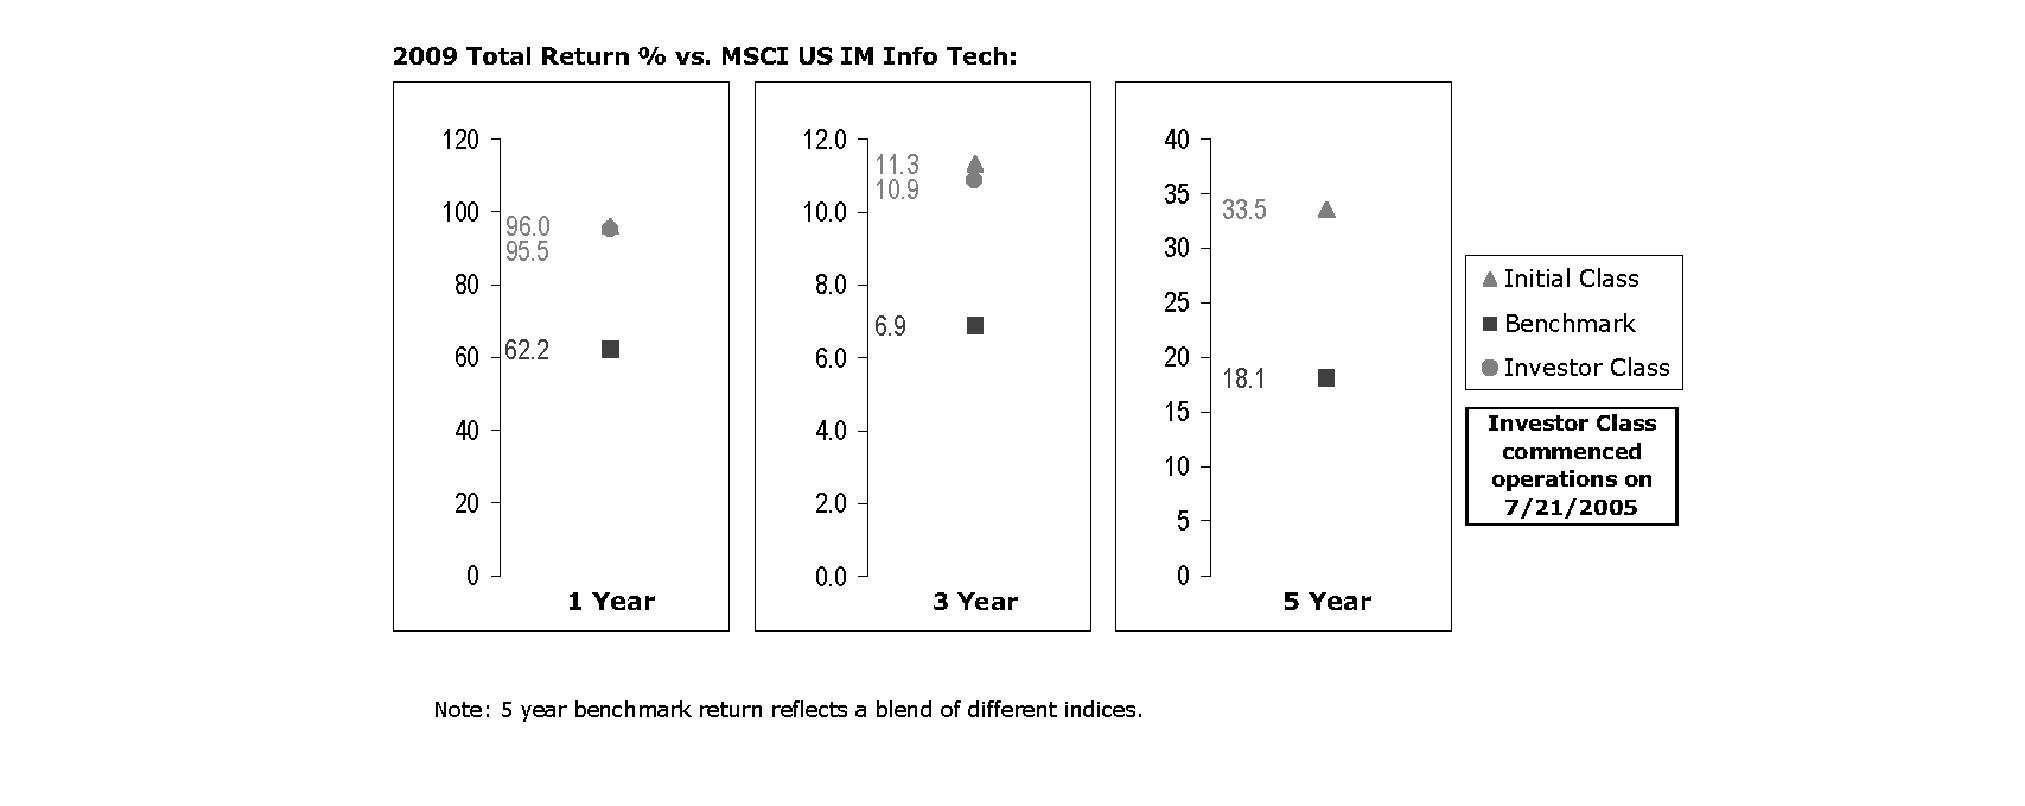
The Board noted that the investment performance of Initial Class of the fund compared favorably to its benchmark for all the periods shown. The Board considered that the variations in performance between the fund's classes reflect the variations in class expenses, which result in lower performance for the higher expense class. The Board also reviewed the fund's performance since inception as well as performance in the current year.
Based on its review, and giving particular weight to the nature and quality of the resources dedicated by the Investment Advisers to maintain and improve relative performance and factoring in the unprecedented market events in recent years, the Board concluded that the nature, extent, and quality of investment management and support services and of shareholder and administrative services provided to the fund will benefit the fund's shareholders, particularly in light of the Board's view that the fund's shareholders benefit from investing in a fund that is part of a large family of funds offering a variety of investment disciplines and services.
Competitiveness of Management Fee and Total Fund Expenses. The Board considered the fund's management fee and total expenses compared to "mapped groups" of competitive funds and classes. Fidelity creates "mapped groups" by combining similar Lipper investment objective categories that have comparable management fee characteristics. Combining Lipper investment objective categories aids the Board's management fee and total expense comparisons by broadening the competitive group used for comparison and by reducing the number of universes to which various Fidelity funds are compared.
Management Fee. The Board considered two proprietary management fee comparisons for the 12-month periods shown in the chart below. The group of Lipper funds used by the Board for management fee comparisons is referred to below as the "Total Mapped Group." The Total Mapped Group comparison focuses on a fund's standing relative to the total universe of comparable funds available to investors, in terms of gross management fees before expense reimbursements or caps. "TMG %" represents the percentage of funds in the Total Mapped Group that had management fees that were lower than the fund's. For example, a TMG % of 3% means that 97% of the funds in the Total Mapped Group had higher management fees than the fund. The "Asset-Size Peer Group" (ASPG) comparison focuses on a fund's standing relative to non-Fidelity funds similar in size to the fund within the Total Mapped Group. The ASPG represents at least 15% of the funds in the Total Mapped Group with comparable asset size and management fee characteristics, subject to a minimum of 50 funds (or all funds in the Total Mapped Group if fewer than 50). Additional information, such as the ASPG quartile in which the fund's management fee ranked, is also included in the chart and considered by the Board.
Annual Report
Board Approval of Investment Advisory Contracts and Management Fees - continued
VIP Technology Portfolio
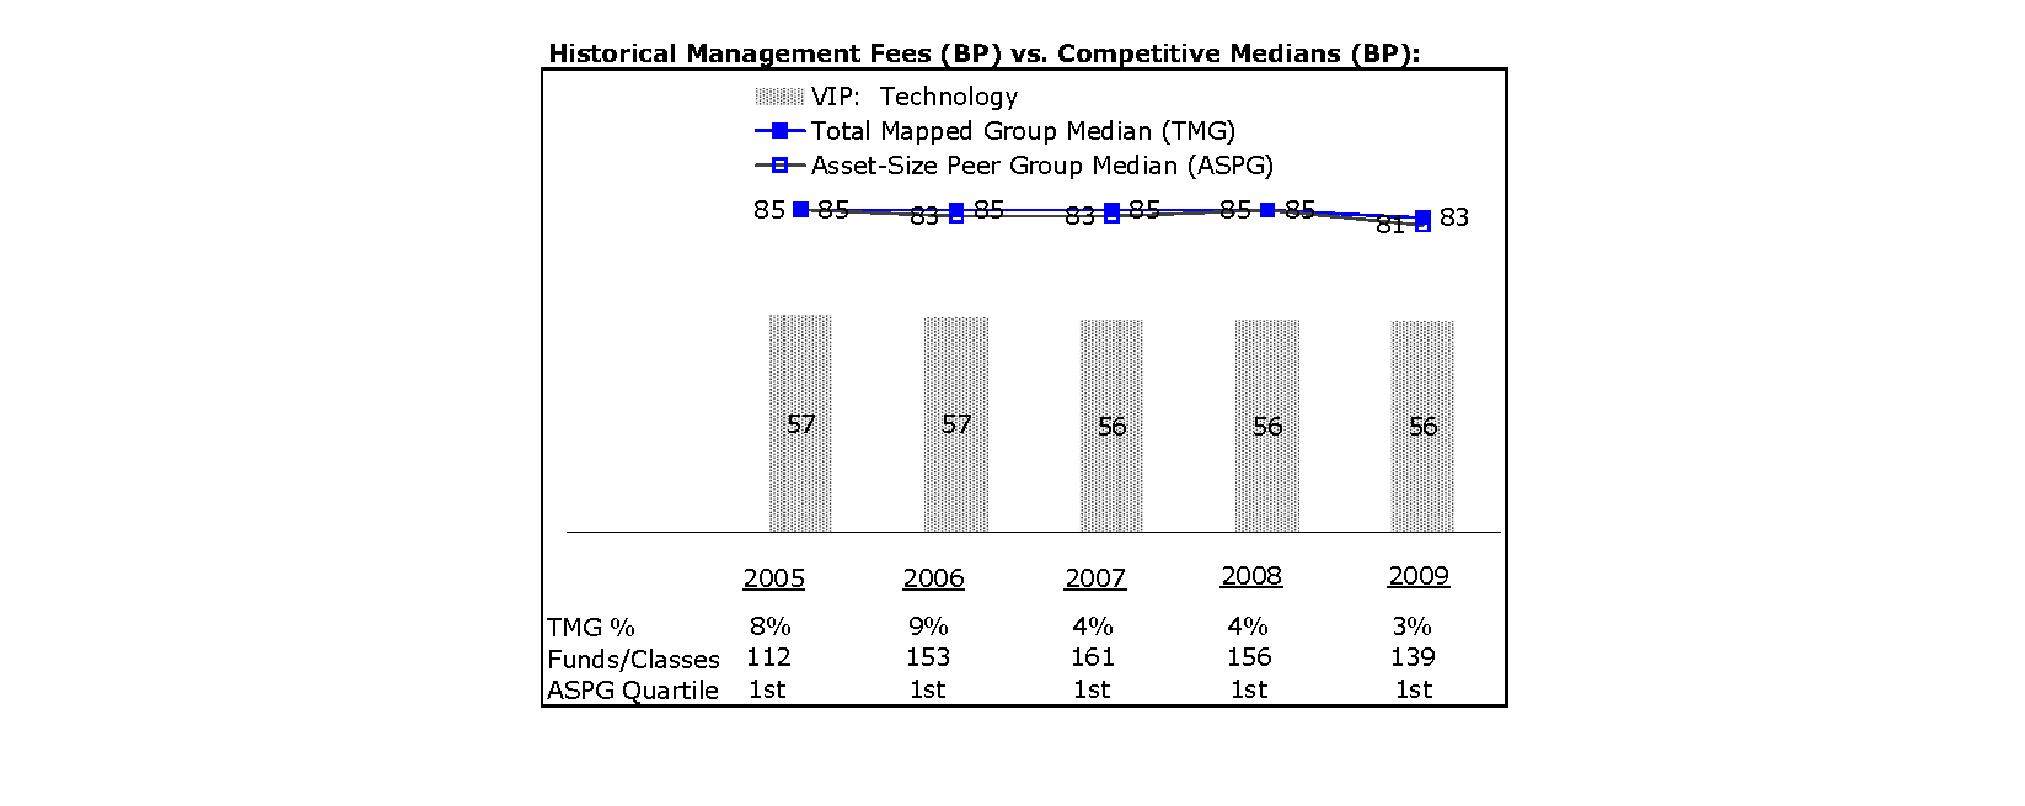
The Board noted that the fund's management fee ranked below the median of its Total Mapped Group and below the median of its ASPG for 2009.
Based on its review, the Board concluded that the fund's management fee is fair and reasonable in light of the services that the fund receives and the other factors considered.
Total Expenses. In its review of each class's total expenses, the Board considered the fund's management fee as well as other fund or class expenses, as applicable, such as transfer agent fees, pricing and bookkeeping fees, and custodial, legal, and audit fees. The Board also noted the effects of any waivers and reimbursements on fees and expenses. As part of its review, the Board also considered current and historical total expenses of each class of the fund compared to competitive fund median expenses. Each class of the fund is compared to those funds and classes in the Total Mapped Group (used by the Board for management fee comparisons) that have a similar sales load structure.
The Board noted that the total expenses of each class ranked below its competitive median for 2009.
Fees Charged to Other Fidelity Clients. The Board also considered Fidelity fee structures and other information with respect to clients of FMR and its affiliates, such as other mutual funds advised or subadvised by FMR or its affiliates, pension plan clients, and other institutional clients. In March 2010, the Board created an ad hoc joint committee with the board of other Fidelity funds (the Committee) to review and compare Fidelity's institutional investment advisory business with its business of providing services to the Fidelity funds, including the differences in services provided, fees charged, and costs incurred, as well as competition in their respective marketplaces.
Based on its review of total expenses and fees charged to other Fidelity clients, the Board concluded that the total expenses of each class of the fund were reasonable in light of the services that the fund and its shareholders receive and the other factors considered, including the findings of the Committee.
Costs of the Services and Profitability. The Board considered the revenues earned and the expenses incurred by Fidelity in conducting the business of developing, marketing, distributing, managing, administering and servicing the fund and its shareholders. The Board also considered the level of Fidelity's profits in respect of all the Fidelity funds.
On an annual basis, FMR presents to the Board Fidelity's profitability for the fund. Fidelity calculates the profitability for each fund, as well as aggregate profitability for groups of Fidelity funds and all Fidelity funds, using a series of detailed revenue and cost allocation methodologies which originate with the audited books and records of Fidelity. The Audit Committee of the Board reviews any significant changes from the prior year's methodologies.
Annual Report
PricewaterhouseCoopers LLP (PwC), independent registered public accounting firm and auditor to Fidelity and certain Fidelity funds, has been engaged annually by the Board as part of the Board's assessment of Fidelity's profitability analysis. PwC's engagement includes the review and assessment of Fidelity's methodologies used in determining the revenues and expenses attributable to Fidelity's mutual fund business, and completion of agreed-upon procedures surrounding the mathematical accuracy of fund profitability and its conformity to allocation methodologies. After considering PwC's reports issued under the engagement and information provided by Fidelity, the Board believes that while other allocation methods may also be reasonable, Fidelity's profitability methodologies are reasonable in all material respects.
The Board has also reviewed Fidelity's non-fund businesses and fall-out benefits related to the mutual fund business as well as cases where Fidelity's affiliates may benefit from or be related to the fund's business.
The Board considered the costs of the services provided by and the profits realized by Fidelity in connection with the operation of the fund and were satisfied that the profitability was not excessive in the circumstances.
Economies of Scale. The Board considered whether there have been economies of scale in respect of the management of the Fidelity funds, whether the Fidelity funds (including the fund) have appropriately benefited from any such economies of scale, and whether there is potential for realization of any further economies of scale. The Board considered the extent to which the fund will benefit from economies of scale through increased services to the fund, through waivers or reimbursements, or through fee or expense reductions.
In February 2009, the Board and the board of other Fidelity funds created an ad hoc committee (the Economies of Scale Committee) to analyze whether FMR attains economies of scale in respect of the management and servicing of the Fidelity funds, whether the Fidelity funds have appropriately benefited from such economies of scale, and whether there is potential for realization of any further economies of scale.
The Board recognized that the fund's management contract incorporates a "group fee" structure, which provides for lower group fee rates as total fund assets under FMR's management increase, and for higher group fee rates as total fund assets under FMR's management decrease. FMR calculates the group fee rates based on a tiered asset "breakpoint" schedule that varies based on asset class. The Board considered that the group fee is designed to deliver the benefits of economies of scale to fund shareholders when total Fidelity fund assets increase, even if assets of any particular fund are unchanged or have declined, because some portion of Fidelity's costs are attributable to services provided to all Fidelity funds, and all funds benefit if those costs can be allocated among more assets. The Board concluded that, given the group fee structure, fund shareholders will benefit from lower management fees as assets under FMR's management increase at the fund complex level, regardless of whether Fidelity achieves any such economies of scale.
The Board concluded, considering the findings of the Economies of Scale Committee, that any potential economies of scale are being appropriately shared between fund shareholders and Fidelity.
Additional Information Requested by the Board. In order to develop fully the factual basis for consideration of the Fidelity funds' Advisory Contracts, the Board requested and received additional information on certain topics, including (i) fund performance trends, actions to be taken by FMR to improve certain funds' overall performance, and Fidelity's long-term strategies for certain funds; (ii) portfolio manager changes that have occurred during the past year and length of portfolio manager tenure for different categories of funds over time; (iii) Fidelity's compensation structure for portfolio managers, research analysts, and other key personnel, the rationale for the compensation structure, and how the compensation structure provides appropriate performance incentives; (iv) the amount of the investment that each portfolio manager has made in the Fidelity fund(s) that he or she manages; (v) management and other fees paid by FMR to affiliated sub-advisers on behalf of the Fidelity funds; (vi) Fidelity's fee structures and rationale for recommending different fees among different categories of funds; (vii) Fidelity's rationale for recommending which funds should have a performance adjustment component as part of their management fees; (viii) the rationale for any differences between fund fee structures and fee structures in place for other Fidelity clients; and (ix) explanations regarding the relative total expenses borne by certain funds and classes, total expense competitive trends, and actions that might be taken by FMR to reduce total expenses for certain funds and classes.
Based on its evaluation of all of the conclusions noted above, and after considering all factors it believed relevant, the Board ultimately concluded that the advisory fee structures are fair and reasonable, and that the fund's Advisory Contracts should be renewed.
Annual Report
Investment Adviser
Fidelity Management & Research Company
Boston, MA
Investment Sub-Advisers
FMR Co., Inc.
Fidelity Management & Research (U.K.) Inc.
Fidelity Management & Research (Hong Kong) Limited
Fidelity Management & Research (Japan) Inc.
General Distributor
Fidelity Distributors Corporation
Boston, MA
Transfer and Service Agents
Fidelity Investments Institutional Operations Company, Inc.
Boston, MA
Fidelity Service Company, Inc.
Boston, MA
Custodian
JPMorgan Chase Bank
New York, NY
VTECIC-ANN-0211
1.817385.105
Fidelity® Variable Insurance Products:
Telecommunications Portfolio
Annual Report
December 31, 2010
(2_fidelity_logos) (Registered_Trademark)
Contents
Performance | <Click Here> | How the fund has done over time. |
Management's Discussion of Fund Performance | <Click Here> | The Portfolio Manager's review of fund performance and strategy. |
Shareholder Expense Example | <Click Here> | An example of shareholder expenses. |
Investment Changes | <Click Here> | A summary of major shifts in the fund's investments over the past six months. |
Investments | <Click Here> | A complete list of the fund's investments with their market values. |
Financial Statements | <Click Here> | Statements of assets and liabilities, operations, and changes in net assets, as well as financial highlights. |
Notes | <Click Here> | Notes to the financial statements. |
Report of Independent Registered Public Accounting Firm | <Click Here> | |
Trustees and Officers | <Click Here> | |
Distributions | <Click Here> | |
Board Approval of Investment Advisory Contracts and Management Fees | <Click Here> | |
To view a fund's proxy voting guidelines and proxy voting record for the 12-month period ended June 30, visit http://www.fidelity.com/proxyvotingresults or visit the Securities and Exchange Commission's (SEC) web site at http://www.sec.gov. You may also call 1-877-208-0098 to request a free copy of the proxy voting guidelines.
Fidelity® Variable Insurance Products are separate account options which are purchased through a variable insurance contract.
Standard & Poor's, S&P and S&P 500 are registered service marks of The McGraw-Hill Companies, Inc. and have been licensed for use by Fidelity Distributors Corporation.
Other third party marks appearing herein are the property of their respective owners.
All other marks appearing herein are registered or unregistered trademarks or service marks of FMR LLC or an affiliated company.
The general research services agreement with Fidelity Research & Analysis Company has been terminated and is no longer in effect for the fund.
This report and the financial statements contained herein are submitted for the general information of the shareholders of the fund. This report is not authorized for distribution to prospective investors in the fund unless preceded or accompanied by an effective prospectus.
A fund files its complete schedule of portfolio holdings with the SEC for the first and third quarters of each fiscal year on Form N-Q. Forms N-Q are available on the SEC's web site at http://www.sec.gov. A fund's Forms N-Q may be reviewed and copied at the SEC's Public Reference Room in Washington, DC. Information regarding the operation of the SEC's Public Reference Room may be obtained by calling 1-800-SEC-0330. For a complete list of a fund's portfolio holdings, view the most recent holdings listing, semiannual report, or annual report on Fidelity's web site at http://www.fidelity.com, http://www.advisor.fidelity.com, or http://www.401k.com, as applicable.
NOT FDIC INSURED • MAY LOSE VALUE • NO BANK GUARANTEE
Neither the fund nor Fidelity Distributors Corporation is a bank.
Annual Report
Average annual total return reflects the change in the value of an investment, assuming reinvestment of the class' distributions from dividend income and capital gains (the profits earned upon the sale of securities that have grown in value, if any) and assuming a constant rate of performance each year. During periods of reimbursement by Fidelity, a fund's total return will be greater than it would be had the reimbursement not occurred. Performance numbers are net of all underlying fund operating expenses, but do not include any insurance charges imposed by your insurance company's separate account. If performance information included the effect of these additional charges, the total returns would have been lower. How a fund did yesterday is no guarantee of how it will do tomorrow.
Average Annual Total Returns
Periods ended December 31, 2010 | Past 1
year | Life of
fundA |
VIP Telecommunications Portfolio - Initial Class | 17.54% | -2.70% |
VIP Telecommunications Portfolio - Investor Class | 17.45% | -2.79% |
A From April 24, 2007.
$10,000 Over Life of Fund
Let's say hypothetically that $10,000 was invested in VIP Telecommunications Portfolio - Initial Class on April 24, 2007, when the fund started. The chart shows how the value of your investment would have changed, and also shows how the S&P 500® Index performed over the same period.
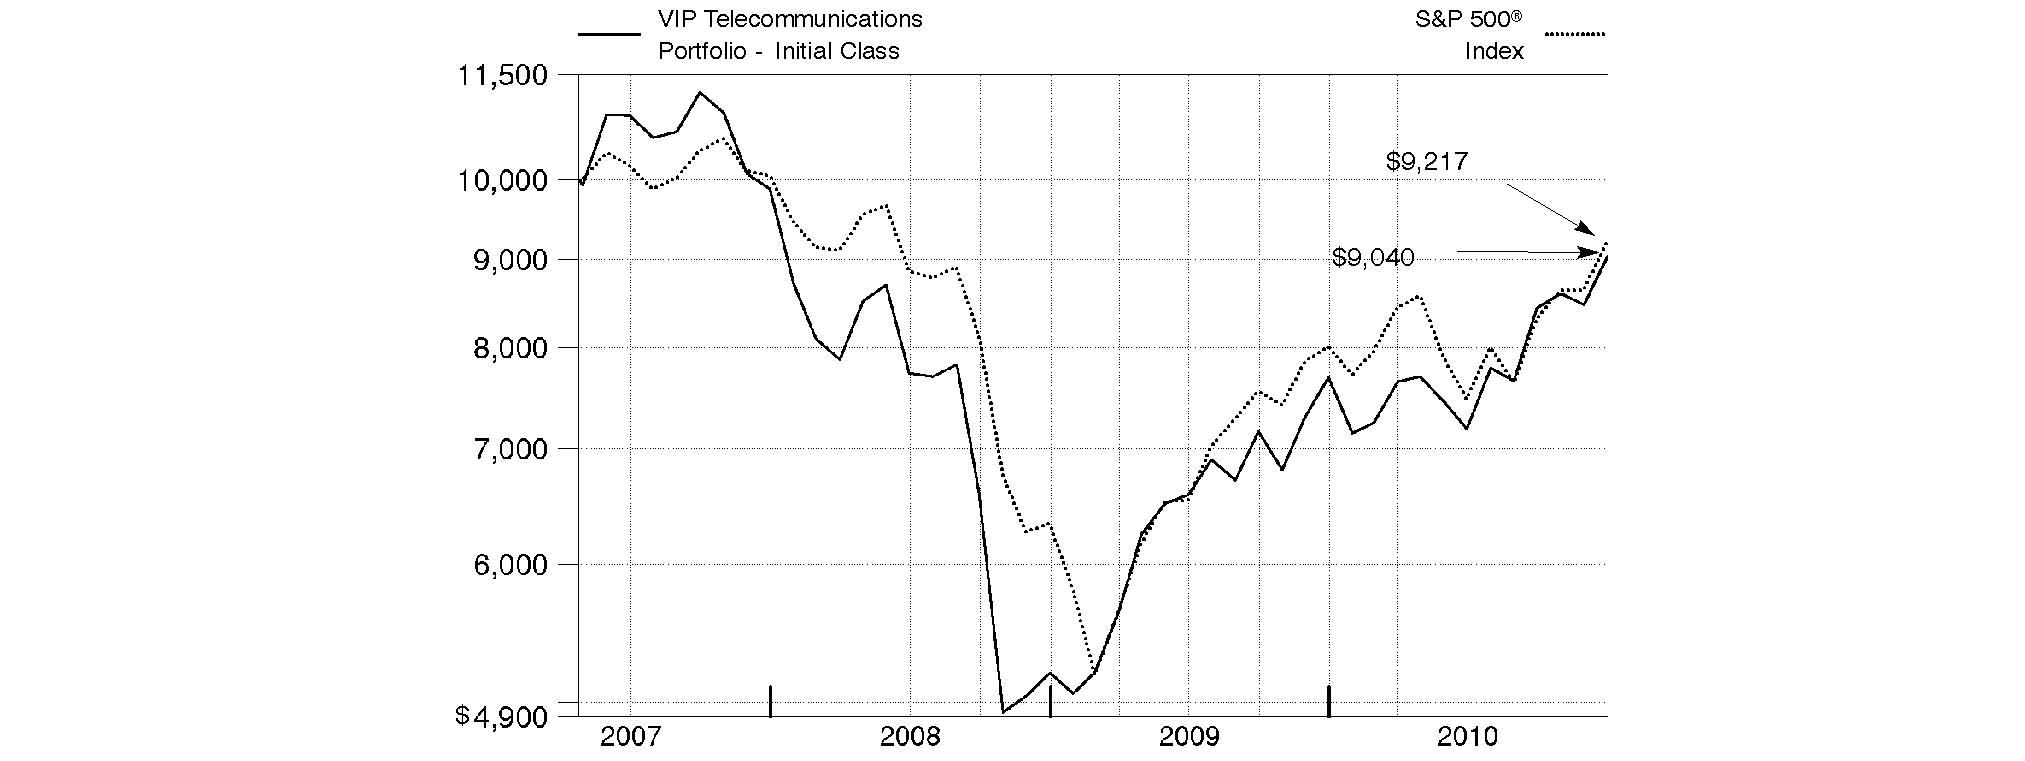
Annual Report
Market Recap: While market improvements around the world hit a speed bump in the first half of the 12-month period ending December 31, 2010, world economies re-accelerated in August, supported by a broadening recovery and low inflation in the U.S. Domestic stock markets recorded solid gains for the year, lifted by a strong second-half rally fueled by economic optimism, encouraging earnings reports and a wave of corporate mergers. The large-cap S&P 500® Index rose 15.06%, the blue-chip-laden Dow Jones Industrial AverageSM added 14.06% and the technology-heavy Nasdaq Composite® Index climbed 18.02%. Meanwhile, international stocks, as represented by the MSCI® ACWI® (All Country World Index) ex USA Index, gained 11.29%, boosted in part by a depreciating U.S. dollar. In the fixed-income arena, U.S. taxable investment-grade bonds generated positive results during 2010, as the Barclays Capital® U.S. Aggregate Bond Index gained 6.54%. With ultra-low interest rates bolstering nearly all fixed-income securities for most of the year, sectors in the index with higher yields and more credit risk generally fared best, while most high-quality bonds generated more-moderate returns. Meanwhile, high-yield bonds, as represented by The BofA Merrill LynchSM US High Yield Constrained Index, returned 15.07%, a result of improved economic data and strengthening investor demand. Overseas, foreign bond markets showed mixed results, with a sizable disparity between the 3.97% return of the Citigroup® Non-U.S. Group of 7 Index - which measures the performance of sovereign debt of the major global economies outside the U.S. - and the 12.04% advance of the JPMorgan Emerging Markets Bond Index Global (EMBI Global), which benefited from the rising overall credit quality of emerging-markets debt issuers.
Comments from Kristina Salen, Portfolio Manager of VIP Telecommunications Portfolio: For the year, the fund's share classes underperformed the 19.44% result of the MSCI® U.S. IM Telecommunications Services 25/50 Index - which was adopted in January 2010 as a better representation of the fund's investment universe - but outpaced the broad market S&P 500®. (For specific portfolio results, please refer to the performance section of this report.) Unsuccessful stock selection in wireless telecom services hurt the most, including a significant position in Clearwire, a provider of wireless high-speed Internet service. The stock was hampered by concern over the company's consortium ownership and an announcement later in the period that the firm faced a capital shortage. Despite these negatives, I remained positive about the stock, as it released a new product and began expanding its market share later in the period. The fund's overweighted position in pre-paid wireless provider Leap Wireless International detracted when the stock fell 30% for the year amid increased competition. Not owning benchmark constituent ICO Global Communications Holdings for most of the first half of the period also was detrimental. The international wireless firm uses satellite technology to provide services to places many other providers cannot, and the company saw strong growth in 2010. I added to the fund's stake in ICO beginning in June. An out-of-benchmark position in Spain-based Telefonica - one of the world's largest telecom companies - also curbed results, as did having no stake in integrated telecom company and benchmark component General Communications. I sold Telefonica by period end. Underweighting benchmark heavyweight Verizon Communications also hurt. Conversely, the fund was aided by an out-of-benchmark position and strong stock selection in the high-growth cable and satellite industry. More specifically, I focused on video-related stocks here that I believed would perform well, including U.K.-based Virgin Media, Liberty Global and Germany-listed Kabel Deutschland Holding. The fund's overweighted position in integrated telecom firm Qwest Communications International was the biggest relative contributor. The stock rose when telephone and Internet service provider CenturyLink announced a bid to acquire Qwest. Underweighting integrated telecom giant AT&T proved beneficial when the stock underperformed on rumors the company would lose exclusivity with Apple's iPhone®, which represented a good deal of its business. An underweighting in the alternative carriers space also helped. Within this industry, having only a scant stake in Internet backbone provider Level 3 Communications and not owning Neutral Tandem, an index constituent that provides third-party interconnection services, proved particularly rewarding.
The views expressed above reflect those of the portfolio manager(s) only through the end of the period as stated on the cover of this report and do not necessarily represent the views of Fidelity or any other person in the Fidelity organization. Any such views are subject to change at any time based upon market or other conditions and Fidelity disclaims any responsibility to update such views. These views may not be relied on as investment advice and, because investment decisions for a Fidelity fund are based on numerous factors, may not be relied on as an indication of trading intent on behalf of any Fidelity fund.
Annual Report
As a shareholder of the Fund, you incur two types of costs: (1) transaction costs, including redemption fees, and (2) ongoing costs, including management fees and other Fund expenses. This Example is intended to help you understand your ongoing costs (in dollars) of investing in the Fund and to compare these costs with the ongoing costs of investing in other mutual funds.
The Example is based on an investment of $1,000 invested at the beginning of the period and held for the entire period (July 1, 2010 to December 31, 2010).
Actual Expenses
The first line of the accompanying table for each class of the Fund provides information about actual account values and actual expenses. You may use the information in this line, together with the amount you invested, to estimate the expenses that you paid over the period. Simply divide your account value by $1,000.00 (for example, an $8,600 account value divided by $1,000.00 = 8.6), then multiply the result by the number in the first line for a class of the Fund under the heading entitled "Expenses Paid During Period" to estimate the expenses you paid on your account during this period. The estimate of expenses does not include any fees or other expenses of any variable annuity or variable life insurance product. If they were, the estimate of expenses you paid during the period would be higher, and your ending account value would be lower. In addition, the Fund, as a shareholder in the underlying Fidelity Central Funds, will indirectly bear its pro-rata share of the fees and expenses incurred by the underlying Fidelity Central Funds. These fees and expenses are not included in the Fund's annualized expense ratio used to calculate the expense estimate in the table below.
Hypothetical Example for Comparison Purposes
The second line of the accompanying table for each class of the Fund provides information about hypothetical account values and hypothetical expenses based on a Class' actual expense ratio and an assumed rate of return of 5% per year before expenses, which is not the Class' actual return. The hypothetical account values and expenses may not be used to estimate the actual ending account balance or expenses you paid for the period. You may use this information to compare the ongoing costs of investing in the Fund and other funds. To do so, compare this 5% hypothetical example with the 5% hypothetical examples that appear in the shareholder reports of the other funds. The estimate of expenses does not include any fees or other expenses of any variable annuity or variable life insurance product. If they were, the estimate of expenses you paid during the period would be higher, and your ending account value would be lower. In addition, the Fund, as a shareholder in the underlying Fidelity Central Funds, will indirectly bear its pro-rata share of the fees and expenses incurred by the underlying Fidelity Central Funds. These fees and expenses are not included in the Fund's annualized expense ratio used to calculate the expense estimate in the table below.
Please note that the expenses shown in the table are meant to highlight your ongoing costs only and do not reflect any transaction costs. Therefore, the second line of the table is useful in comparing ongoing costs only, and will not help you determine the relative total costs of owning different funds. In addition, if these transactional costs were included, your costs would have been higher.
| Annualized
Expense Ratio | Beginning
Account Value
July 1, 2010 | Ending
Account Value
December 31, 2010 | Expenses Paid
During Period*
July 1, 2010 to
December 31, 2010 |
Initial Class | 1.00% | | | |
Actual | | $ 1,000.00 | $ 1,258.40 | $ 5.69 |
HypotheticalA | | $ 1,000.00 | $ 1,020.16 | $ 5.09 |
Investor Class | 1.08% | | | |
Actual | | $ 1,000.00 | $ 1,257.70 | $ 6.15 |
HypotheticalA | | $ 1,000.00 | $ 1,019.76 | $ 5.50 |
A 5% return per year before expenses
* Expenses are equal to each Class' annualized expense ratio, multiplied by the average account value over the period, multiplied by 184/365 (to reflect the one-half year period).
Annual Report
Investment Changes (Unaudited)
Top Ten Stocks as of December 31, 2010 |
| % of fund's
net assets | % of fund's net assets
6 months ago |
Verizon Communications, Inc. | 19.0 | 8.7 |
American Tower Corp. Class A | 6.9 | 8.3 |
Qwest Communications International, Inc. | 6.5 | 6.2 |
AT&T, Inc. | 5.7 | 15.1 |
Crown Castle International Corp. | 5.7 | 6.1 |
CenturyLink, Inc. | 5.1 | 4.8 |
NII Holdings, Inc. | 3.9 | 3.4 |
SBA Communications Corp. Class A | 3.7 | 3.9 |
Windstream Corp. | 3.3 | 1.2 |
MetroPCS Communications, Inc. | 3.2 | 2.8 |
| 63.0 | |
Top Industries (% of fund's net assets) |
As of December 31, 2010 |
| Diversified Telecommunication Services | 48.6% | |
| Wireless Telecommunication Services | 35.9% | |
| Media | 8.8% | |
| Internet Software & Services | 2.5% | |
| Software | 1.9% | |
| All Others* | 2.3% | |

As of June 30, 2010 |
| Diversified Telecommunication Services | 45.0% | |
| Wireless Telecommunication Services | 43.9% | |
| Media | 8.8% | |
| Software | 1.1% | |
| Communications Equipment | 0.7% | |
| All Others* | 0.5% | |

* Includes short-term investments and net other assets. |
Annual Report
Investments December 31, 2010
Showing Percentage of Net Assets
Common Stocks - 99.0% |
| Shares | | Value |
COMMERCIAL SERVICES & SUPPLIES - 0.7% |
Diversified Support Services - 0.7% |
Blue Label Telecoms Ltd. | 65,600 | | $ 69,709 |
COMMUNICATIONS EQUIPMENT - 0.6% |
Communications Equipment - 0.6% |
Aruba Networks, Inc. (a) | 5 | | 104 |
Cisco Systems, Inc. (a) | 1,000 | | 20,230 |
Juniper Networks, Inc. (a) | 1,043 | | 38,508 |
Nortel Networks Corp. (a) | 100 | | 0 |
Sandvine Corp. (U.K.) (a) | 100 | | 282 |
| | 59,124 |
DIVERSIFIED TELECOMMUNICATION SERVICES - 48.6% |
Alternative Carriers - 6.0% |
AboveNet, Inc. | 2,200 | | 128,612 |
Cable & Wireless Worldwide PLC | 309 | | 317 |
Cogent Communications Group, Inc. (a) | 1,606 | | 22,709 |
Global Crossing Ltd. (a) | 6,819 | | 88,101 |
Iliad Group SA | 1,336 | | 145,399 |
Level 3 Communications, Inc. (a) | 192 | | 188 |
PAETEC Holding Corp. (a) | 1,700 | | 6,358 |
tw telecom, inc. (a) | 10,633 | | 181,293 |
| | 572,977 |
Integrated Telecommunication Services - 42.6% |
AT&T, Inc. | 18,383 | | 540,093 |
BT Group PLC | 109 | | 310 |
Cable & Wireless PLC | 309 | | 234 |
Cbeyond, Inc. (a) | 4,150 | | 63,412 |
CenturyLink, Inc. | 10,485 | | 484,092 |
China Unicom (Hong Kong) Ltd. sponsored ADR | 7,900 | | 112,575 |
Cincinnati Bell, Inc. New (a) | 5,400 | | 15,120 |
Deutsche Telekom AG | 17 | | 219 |
FairPoint Communications, Inc. (a) | 522 | | 12 |
Frontier Communications Corp. | 339 | | 3,298 |
Hellenic Telecommunications Organization SA | 37 | | 304 |
Qwest Communications International, Inc. | 81,555 | | 620,634 |
Telenor ASA sponsored ADR | 1,790 | | 87,531 |
Verizon Communications, Inc. | 50,400 | | 1,803,309 |
Windstream Corp. | 22,293 | | 310,764 |
| | 4,041,907 |
TOTAL DIVERSIFIED TELECOMMUNICATION SERVICES | | 4,614,884 |
INTERNET SOFTWARE & SERVICES - 2.5% |
Internet Software & Services - 2.5% |
Akamai Technologies, Inc. (a) | 800 | | 37,640 |
Google, Inc. Class A (a) | 174 | | 103,351 |
|
| Shares | | Value |
Rackspace Hosting, Inc. (a) | 2,100 | | $ 65,961 |
SAVVIS, Inc. (a) | 1 | | 26 |
Support.com, Inc. (a) | 4,300 | | 27,864 |
| | 234,842 |
MEDIA - 8.8% |
Cable & Satellite - 8.8% |
Comcast Corp. Class A | 9,500 | | 208,715 |
DIRECTV (a) | 11 | | 439 |
Dish TV India Ltd. (a) | 112 | | 178 |
Kabel Deutschland Holding AG | 3,800 | | 177,186 |
Liberty Global, Inc. Class A (a) | 3,866 | | 136,779 |
Naspers Ltd. Class N | 800 | | 46,847 |
Time Warner Cable, Inc. | 1,228 | | 81,085 |
Virgin Media, Inc. | 6,700 | | 182,508 |
| | 833,737 |
Movies & Entertainment - 0.0% |
Madison Square Garden, Inc. Class A (a) | 11 | | 284 |
TOTAL MEDIA | | 834,021 |
SOFTWARE - 1.9% |
Application Software - 1.9% |
AsiaInfo Holdings, Inc. (a) | 3,900 | | 64,623 |
Gameloft (a) | 15,614 | | 113,983 |
Synchronoss Technologies, Inc. (a) | 1 | | 27 |
| | 178,633 |
WIRELESS TELECOMMUNICATION SERVICES - 35.9% |
Wireless Telecommunication Services - 35.9% |
American Tower Corp. Class A (a) | 12,700 | | 655,828 |
Axiata Group Bhd (a) | 71,800 | | 110,605 |
Clearwire Corp. Class A (a) | 33,731 | | 173,715 |
Crown Castle International Corp. (a) | 12,217 | | 535,471 |
ICO Global Communications Holdings Ltd. Class A (a) | 55,623 | | 83,435 |
Idea Cellular Ltd. (a) | 63 | | 98 |
Leap Wireless International, Inc. (a) | 13,792 | | 169,090 |
MetroPCS Communications, Inc. (a) | 23,778 | | 300,316 |
Mobile TeleSystems OJSC sponsored ADR | 2,200 | | 45,914 |
NII Holdings, Inc. (a) | 8,281 | | 369,829 |
NTELOS Holdings Corp. | 36 | | 686 |
PT Indosat Tbk | 80,000 | | 47,947 |
SBA Communications Corp. Class A (a) | 8,618 | | 352,821 |
Sprint Nextel Corp. (a) | 53,268 | | 225,324 |
Syniverse Holdings, Inc. (a) | 4,732 | | 145,982 |
Telephone & Data Systems, Inc. | 350 | | 12,793 |
TIM Participacoes SA sponsored ADR (non-vtg.) | 1,300 | | 44,382 |
Common Stocks - continued |
| Shares | | Value |
WIRELESS TELECOMMUNICATION SERVICES - CONTINUED |
Wireless Telecommunication Services - continued |
Vivo Participacoes SA sponsored ADR | 2,700 | | $ 87,993 |
Vodafone Group PLC sponsored ADR | 1,500 | | 39,645 |
| | 3,401,874 |
TOTAL COMMON STOCKS (Cost $8,235,613) | 9,393,087 |
Money Market Funds - 0.8% |
| | | |
Fidelity Cash Central Fund, 0.19% (b)
(Cost $71,299) | 71,299 | | 71,299 |
TOTAL INVESTMENT PORTFOLIO - 99.8% (Cost $8,306,912) | | 9,464,386 |
NET OTHER ASSETS (LIABILITIES) - 0.2% | | 19,205 |
NET ASSETS - 100% | $ 9,483,591 |
Legend |
(a) Non-income producing |
(b) Affiliated fund that is available only to investment companies and other accounts managed by Fidelity Investments. The rate quoted is the annualized seven-day yield of the fund at period end. A complete unaudited listing of the fund's holdings as of its most recent quarter end is available upon request. In addition, each Fidelity Central Fund's financial statements, which are not covered by the Fund's Report of Independent Registered Public Accounting Firm, are available on the SEC's website or upon request. |
Affiliated Central Funds |
Information regarding fiscal year to date income earned by the Fund from investments in Fidelity Central Funds is as follows: |
Fund | Income earned |
Fidelity Cash Central Fund | $ 383 |
Other Information |
The following is a summary of the inputs used, as of December 31, 2010, involving the Fund's assets and liabilities carried at fair value. The inputs or methodology used for valuing securities may not be an indication of the risk associated with investing in those securities. For more information on valuation inputs, and their aggregation into the levels used in the table below, please refer to the Security Valuation section in the accompanying Notes to Financial Statements. |
Valuation Inputs at Reporting Date: |
Description | Total | Level 1 | Level 2 | Level 3 |
Investments in Securities: | | | | |
Common Stocks | $ 9,393,087 | $ 9,392,473 | $ 614 | $ - |
Money Market Funds | 71,299 | 71,299 | - | - |
Total Investments in Securities: | $ 9,464,386 | $ 9,463,772 | $ 614 | $ - |
Distribution of investments by country of issue, as a percentage of total net assets, is as follows: (Unaudited) |
United States of America | 87.2% |
France | 2.7% |
Germany | 1.9% |
Brazil | 1.4% |
South Africa | 1.2% |
Hong Kong | 1.2% |
Malaysia | 1.2% |
Others (Individually Less Than 1%) | 3.2% |
| 100.0% |
Income Tax Information |
At December 31, 2010, the Fund had a capital loss carryforward of approximately $2,037,085 of which $1,678,905 and $358,180 will expire in fiscal 2016 and 2017, respectively. Capital loss carryforwards are only available to offset future capital gains of the Fund to the extent provided by regulations and may be limited. |
See accompanying notes which are an integral part of the financial statements.
Annual Report
Statement of Assets and Liabilities
| December 31, 2010 |
Assets | | |
Investment in securities, at value - See accompanying schedule: Unaffiliated issuers (cost $8,235,613) | $ 9,393,087 | |
Fidelity Central Funds (cost $71,299) | 71,299 | |
Total Investments (cost $8,306,912) | | $ 9,464,386 |
Receivable for fund shares sold | | 79,991 |
Dividends receivable | | 6,464 |
Distributions receivable from Fidelity Central Funds | | 11 |
Prepaid expenses | | 21 |
Receivable from investment adviser for expense reductions | | 3,595 |
Other receivables | | 1,127 |
Total assets | | 9,555,595 |
| | |
Liabilities | | |
Payable for fund shares redeemed | $ 31,559 | |
Accrued management fee | 4,450 | |
Other affiliated payables | 1,212 | |
Other payables and accrued
expenses | 34,783 | |
Total liabilities | | 72,004 |
| | |
Net Assets | | $ 9,483,591 |
Net Assets consist of: | | |
Paid in capital | | $ 10,551,771 |
Distributions in excess of net investment income | | (25,023) |
Accumulated undistributed net realized gain (loss) on investments and foreign currency transactions | | (2,200,508) |
Net unrealized appreciation (depreciation) on investments and assets and liabilities in foreign
currencies | | 1,157,351 |
Net Assets | | $ 9,483,591 |
Statement of Assets and Liabilities - continued
| December 31, 2010 |
Initial Class:
Net Asset Value, offering price and redemption price per share ($3,822,524 ÷ 472,052 shares) | | $ 8.10 |
| | |
Investor Class:
Net Asset Value, offering price and redemption price per share ($5,661,067 ÷ 701,668 shares) | | $ 8.07 |
See accompanying notes which are an integral part of the financial statements.
Annual Report
Financial Statements - continued
Statement of Operations
| Year ended December 31, 2010 |
Investment Income | | |
Dividends | | $ 188,525 |
Interest | | 7 |
Income from Fidelity Central Funds | | 383 |
Total income | | 188,915 |
| | |
Expenses | | |
Management fee | $ 41,274 | |
Transfer agent fees | 14,215 | |
Accounting fees and expenses | 2,874 | |
Custodian fees and expenses | 16,520 | |
Independent trustees' compensation | 40 | |
Audit | 42,172 | |
Legal | 30 | |
Miscellaneous | (312) | |
Total expenses before reductions | 116,813 | |
Expense reductions | (40,937) | 75,876 |
Net investment income (loss) | | 113,039 |
Realized and Unrealized Gain (Loss) Net realized gain (loss) on: | | |
Investment securities: | | |
Unaffiliated issuers | 380,273 | |
Foreign currency transactions | (111) | |
Total net realized gain (loss) | | 380,162 |
Change in net unrealized appreciation (depreciation) on: Investment securities | 797,107 | |
Assets and liabilities in foreign currencies | 38 | |
Total change in net unrealized appreciation (depreciation) | | 797,145 |
Net gain (loss) | | 1,177,307 |
Net increase (decrease) in net assets resulting from operations | | $ 1,290,346 |
Statement of Changes in Net Assets
| Year ended
December 31, 2010 | Year ended
December 31, 2009 |
Increase (Decrease) in Net Assets | | |
Operations | | |
Net investment income (loss) | $ 113,039 | $ 97,649 |
Net realized gain (loss) | 380,162 | (126,183) |
Change in net unrealized appreciation (depreciation) | 797,145 | 2,373,747 |
Net increase (decrease) in net assets resulting
from operations | 1,290,346 | 2,345,213 |
Distributions to shareholders from net investment income | (157,959) | (105,936) |
Share transactions - net increase (decrease) | 1,086,899 | 1,824,836 |
Redemption fees | 9,541 | 9,387 |
Total increase (decrease) in net assets | 2,228,827 | 4,073,500 |
| | |
Net Assets | | |
Beginning of period | 7,254,764 | 3,181,264 |
End of period (including distributions in excess of net investment income of $25,023 and undistributed net investment income of $16,827, respectively) | $ 9,483,591 | $ 7,254,764 |
See accompanying notes which are an integral part of the financial statements.
Annual Report
Financial Highlights - Initial Class
Years ended December 31, | 2010 | 2009 | 2008 | 2007H |
Selected Per-Share Data | | | | |
Net asset value, beginning of period | $ 7.01 | $ 4.81 | $ 9.36 | $ 10.00 |
Income from Investment Operations | | | | |
Net investment income (loss)E | .11 | .09 | .09 | .05 |
Net realized and unrealized gain (loss) | 1.10 | 2.21 | (4.53) | (.17) |
Total from investment operations | 1.21 | 2.30 | (4.44) | (.12) |
Distributions from net investment income | (.13) | (.11) | (.11) | (.05) |
Distributions from net realized gain | - | - | - | (.48) |
Total distributions | (.13) | (.11) | (.11) | (.53) |
Redemption fees added to paid in capitalE | .01 | .01 | -J | .01 |
Net asset value, end of period | $ 8.10 | $ 7.01 | $ 4.81 | $ 9.36 |
Total ReturnB,C,D | 17.54% | 48.00% | (47.41)% | (1.18)% |
Ratios to Average Net AssetsF,I | | | | |
Expenses before reductions | 1.55% | 1.70% | 2.07% | 1.37%A |
Expenses net of fee waivers, if any | 1.00% | 1.00% | 1.00% | 1.00%A |
Expenses net of all reductions | .98% | .98% | .99% | 1.00%A |
Net investment income (loss) | 1.57% | 1.55% | 1.32% | .63%A |
Supplemental Data | | | | |
Net assets, end of period (000 omitted) | $ 3,823 | $ 3,626 | $ 1,549 | $ 3,956 |
Portfolio turnover rateG | 93% | 167% | 203% | 160%A |
A Annualized B Total returns for periods of less than one year are not annualized. C Total returns do not reflect charges attributable to your insurance company's separate account. Inclusion of these charges would reduce the total returns shown. D Total returns would have been lower had certain expenses not been reduced during the periods shown. E Calculated based on average shares outstanding during the period. F Fees and expenses of the underlying Fidelity Central Funds are not included in the Fund's expense ratio. The Fund indirectly bears its proportionate share of the expenses of any underlying Fidelity Central Funds. G Amount does not include the portfolio activity of any underlying Fidelity Central Funds. H For the period April 24, 2007 (commencement of operations) to December 31, 2007. I Expense ratios reflect operating expenses of the class. Expenses before reductions do not reflect amounts reimbursed by the investment adviser or reductions from brokerage service arrangements or reductions from other expense offset arrangements and do not represent the amount paid by the class during periods when reimbursements or reductions occur. Expense ratios before reductions for start-up periods may not be representative of longer-term operating periods. Expenses net of fee waivers reflect expenses after reimbursement by the investment adviser but prior to reductions from brokerage service arrangements or other expense offset arrangements. Expenses net of all reductions represent the net expenses paid by the class. J Amount represents less than $.01 per share.
Financial Highlights - Investor Class
Years ended December 31, | 2010 | 2009 | 2008 | 2007H |
Selected Per-Share Data | | | | |
Net asset value, beginning of period | $ 6.99 | $ 4.80 | $ 9.35 | $ 10.00 |
Income from Investment Operations | | | | |
Net investment income (loss)E | .11 | .09 | .09 | .04 |
Net realized and unrealized gain (loss) | 1.09 | 2.20 | (4.53) | (.17) |
Total from investment operations | 1.20 | 2.29 | (4.44) | (.13) |
Distributions from net investment income | (.13) | (.11) | (.11) | (.05) |
Distributions from net realized gain | - | - | - | (.48) |
Total distributions | (.13) | (.11) | (.11) | (.53) |
Redemption fees added to paid in capitalE | .01 | .01 | -J | .01 |
Net asset value, end of period | $ 8.07 | $ 6.99 | $ 4.80 | $ 9.35 |
Total ReturnB,C,D | 17.45% | 47.90% | (47.46)% | (1.28)% |
Ratios to Average Net AssetsF,I | | | | |
Expenses before reductions | 1.61% | 1.78% | 2.15% | 1.50%A |
Expenses net of fee waivers, if any | 1.08% | 1.08% | 1.09% | 1.15%A |
Expenses net of all reductions | 1.07% | 1.07% | 1.08% | 1.15%A |
Net investment income (loss) | 1.49% | 1.47% | 1.23% | .48%A |
Supplemental Data | | | | |
Net assets, end of period (000 omitted) | $ 5,661 | $ 3,629 | $ 1,632 | $ 4,298 |
Portfolio turnover rateG | 93% | 167% | 203% | 160%A |
A Annualized B Total returns for periods of less than one year are not annualized. C Total returns do not reflect charges attributable to your insurance company's separate account. Inclusion of these charges would reduce the total returns shown. D Total returns would have been lower had certain expenses not been reduced during the periods shown. E Calculated based on average shares outstanding during the period. F Fees and expenses of the underlying Fidelity Central Funds are not included in the Fund's expense ratio. The Fund indirectly bears its proportionate share of the expenses of any underlying Fidelity Central Funds. G Amount does not include the portfolio activity of any underlying Fidelity Central Funds. H For the period April 24, 2007 (commencement of operations) to December 31, 2007. I Expense ratios reflect operating expenses of the class. Expenses before reductions do not reflect amounts reimbursed by the investment adviser or reductions from brokerage service arrangements or reductions from other expense offset arrangements and do not represent the amount paid by the class during periods when reimbursements or reductions occur. Expense ratios before reductions for start-up periods may not be representative of longer-term operating periods. Expenses net of fee waivers reflect expenses after reimbursement by the investment adviser but prior to reductions from brokerage service arrangements or other expense offset arrangements. Expenses net of all reductions represent the net expenses paid by the class. J Amount represents less than $.01 per share.
See accompanying notes which are an integral part of the financial statements.
Annual Report
Notes to Financial Statements
For the period ended December 31, 2010
1. Organization.
VIP Telecommunications Portfolio (the Fund) is a non-diversified fund of Variable Insurance Products Fund IV (the Trust) and is authorized to issue an unlimited number of shares. The Trust is registered under the Investment Company Act of 1940, as amended (the 1940 Act), as an open-end management investment company organized as a Massachusetts business trust. Shares of the Fund may only be purchased by insurance companies for the purpose of funding variable annuity or variable life insurance contracts. The Fund offers the following classes of shares: Initial Class shares and Investor Class shares. All classes have equal rights and voting privileges, except for matters affecting a single class. Investment income, realized and unrealized capital gains and losses, the common expenses of the Fund, and certain fund-level expense reductions, if any, are allocated on a pro-rata basis to each class based on the relative net assets of each class to the total net assets of the Fund. Each class differs with respect to transfer agent fees incurred. Certain expense reductions may also differ by class.
2. Investments in Fidelity Central Funds.
The Fund may invest in Fidelity Central Funds, which are open-end investment companies available only to other investment companies and accounts managed by Fidelity Management & Research Company (FMR) and its affiliates. The Fund's Schedule of Investments lists each of the Fidelity Central Funds held as of period end, if any, as an investment of the Fund, but does not include the underlying holdings of each Fidelity Central Fund. As an Investing Fund, the Fund indirectly bears its proportionate share of the expenses of the underlying Fidelity Central Funds.
The Money Market Central Funds seek preservation of capital and current income and are managed by Fidelity Investments Money Management, Inc. (FIMM), an affiliate of FMR.
A complete unaudited list of holdings for each Fidelity Central Fund is available upon request or at the Securities and Exchange Commission (the SEC) web site at www.sec.gov. In addition, the financial statements of the Fidelity Central Funds, which are not covered by the Fund's Report of Independent Registered Public Accounting Firm, are available on the SEC web site or upon request.
3. Significant Accounting Policies.
The financial statements have been prepared in conformity with accounting principles generally accepted in the United States of America (GAAP), which require management to make certain estimates and assumptions at the date of the financial statements. Actual results could differ from those estimates. Subsequent events, if any, through the date that the financial statements were issued have been evaluated in the preparation of the financial statements. The following summarizes the significant accounting policies of the Fund:
Security Valuation. Investments are valued as of 4:00 p.m. Eastern time on the last calendar day of the period. The Fund uses independent pricing services approved by the Board of Trustees to value its investments. When current market prices or quotations are not readily available or reliable, valuations may be determined in good faith in accordance with procedures adopted by the Board of Trustees. Factors used in determining value may include market or security specific events. The frequency with which these procedures are used cannot be predicted and they may be utilized to a significant extent. The value used for net asset value (NAV) calculation under these procedures may differ from published prices for the same securities.
The Fund categorizes the inputs to valuation techniques used to value its investments into a disclosure hierarchy consisting of three levels as shown below.
Level 1 - quoted prices in active markets for identical investments
Level 2 - other significant observable inputs (including quoted prices for similar investments, interest rates, prepayment speeds, etc.)
Level 3 - unobservable inputs (including the Fund's own assumptions based on the best information available)
Changes in valuation techniques may result in transfers in or out of an assigned level within the disclosure hierarchy. The aggregate value of investments by input level, as of December 31, 2010, is included at the end of the Fund's Schedule of Investments. Valuation techniques used to value the Fund's investments by major category are as follows.
Equity securities, including restricted securities, for which market quotations are readily available, are valued at the last reported sale price or official closing price as reported by an independent pricing service on the primary market or exchange on which they are traded and are categorized as Level 1 in the hierarchy. In the event there were no sales during the day or closing prices are not available, securities are valued at the last quoted bid price or may be valued using the last available price and are generally categorized as Level 2 in the hierarchy. For foreign equity securities, when significant market or security specific events arise, comparisons to the valuation of American Depositary Receipts (ADRs), futures contracts, Exchange-traded funds (ETFs) and certain indexes as well as quoted prices for similar securities are used and are categorized as Level 2 in the hierarchy in these circumstances. Utilizing these techniques may result in transfers between Level 1 and Level 2. For restricted equity securities and private placements where observable inputs are limited, assumptions about market activity and risk are used and are categorized as Level 3 in the hierarchy.
Annual Report
3. Significant Accounting Policies - continued
Security Valuation - continued
Investments in open-end mutual funds, including the Fidelity Central Funds, are valued at their closing net asset value each business day and are categorized as Level 1 in the hierarchy.
Foreign Currency. The Fund uses foreign currency contracts to facilitate transactions in foreign-denominated securities. Gains and losses from these transactions may arise from changes in the value of the foreign currency or if the counterparties do not perform under the contracts' terms.
Foreign-denominated assets, including investment securities, and liabilities are translated into U.S. dollars at the exchange rate at period end. Purchases and sales of investment securities, income and dividends received and expenses denominated in foreign currencies are translated into U.S. dollars at the exchange rate in effect on the transaction date.
The effects of exchange rate fluctuations on investments are included with the net realized and unrealized gain (loss) on investment securities. Other foreign currency transactions resulting in realized and unrealized gain (loss) are disclosed separately.
Investment Transactions and Income. For financial reporting purposes, the Fund's investment holdings and NAV include trades executed through the end of the last business day of the period. The NAV per share for processing shareholder transactions is calculated as of the close of business of the New York Stock Exchange (NYSE), normally 4:00 p.m. Eastern time and includes trades executed through the end of the prior business day. Gains and losses on securities sold are determined on the basis of identified cost. Dividend income is recorded on the ex-dividend date, except for certain dividends from foreign securities where the ex-dividend date may have passed, which are recorded as soon as the Fund is informed of the ex-dividend date. Non-cash dividends included in dividend income, if any, are recorded at the fair market value of the securities received. Distributions received on securities that represent a return of capital or capital gain are recorded as a reduction of cost of investments and/or as a realized gain. The Fund estimates the components of distributions received that may be considered return of capital distributions or capital gain distributions. Interest income and distributions from the Fidelity Central Funds are accrued as earned. Interest income includes coupon interest and amortization of premium and accretion of discount on debt securities. Investment income is recorded net of foreign taxes withheld where recovery of such taxes is uncertain.
Expenses. Expenses directly attributable to a fund are charged to that fund. Expenses attributable to more than one fund are allocated among the respective funds on the basis of relative net assets or other appropriate methods. Expense estimates are accrued in the period to which they relate and adjustments are made when actual amounts are known.
Income Tax Information and Distributions to Shareholders. Each year the Fund intends to qualify as a regulated investment company, including distributing substantially all of its taxable income and realized gains under Subchapter M of the Internal Revenue Code and filing its U.S. federal tax return. As a result, no provision for income taxes is required. As of December 31, 2010, the Fund did not have any unrecognized tax benefits in the accompanying financial statements. A fund's federal tax return is subject to examination by the Internal Revenue Service (IRS) for a period of three years. Foreign taxes are provided for based on the Fund's understanding of the tax rules and rates that exist in the foreign markets in which it invests.
Distributions are declared and recorded on the ex-dividend date. Income dividends and capital gain distributions are declared separately for each class. Income and capital gain distributions are determined in accordance with income tax regulations, which may differ from GAAP.
Capital accounts within the financial statements are adjusted for permanent book-tax differences. These adjustments have no impact on net assets or the results of operations. Temporary book-tax differences will reverse in a subsequent period.
Book-tax differences are primarily due to foreign currency transactions, capital loss carryforwards and losses deferred due to wash sales.
The federal tax cost of investment securities and unrealized appreciation (depreciation) as of period end were as follows:
Gross unrealized appreciation | $ 1,669,636 |
Gross unrealized depreciation | (675,585) |
Net unrealized appreciation (depreciation) | $ 994,051 |
| |
Tax Cost | $ 8,470,335 |
The tax-based components of distributable earnings as of period end were as follows:
Capital loss carryforward | $ (2,037,085) |
Net unrealized appreciation (depreciation) | $ 993,928 |
Annual Report
Notes to Financial Statements - continued
3. Significant Accounting Policies - continued
Income Tax Information and Distributions to Shareholders - continued
The tax character of distributions paid was as follows:
| December 31, 2010 | December 31, 2009 |
Ordinary Income | $ 157,959 | $ 105,936 |
Trading (Redemption) Fees. Shares held by investors less than 60 days are subject to a redemption fee equal to 1% of the net asset value of shares redeemed. All redemption fees, which reduce the proceeds of the shareholder redemption, are retained by the Fund and accounted for as an addition to paid in capital.
4. Purchases and Sales of Investments.
Purchases and sales of securities, other than short-term securities, aggregated $8,049,292 and $6,690,529, respectively.
5. Fees and Other Transactions with Affiliates.
Management Fee. FMR and its affiliates provide the Fund with investment management related services for which the Fund pays a monthly management fee. The management fee is the sum of an individual fund fee rate that is based on an annual rate of .30% of the Fund's average net assets and a group fee rate that averaged .26% during the period. The group fee rate is based upon the average net assets of all the mutual funds advised by FMR. The group fee rate decreases as assets under management increase and increases as assets under management decrease. For the period, the total annual management fee rate was .56% of the Fund's average net assets.
Transfer Agent Fees. Fidelity Investments Institutional Operations Company, Inc. (FIIOC), an affiliate of FMR, is the Fund's transfer, dividend disbursing, and shareholder servicing agent. FIIOC receives an asset-based fee with respect to each class. Each class (with the exception of Investor Class) pays a transfer agent fee, excluding out of pocket expenses, equal to an annual rate of .07% of average net assets. Investor Class pays a monthly asset-based transfer agent fee of .15% of average net assets. In addition, FIIOC receives an asset-based fee of .01% of average net assets for typesetting, printing and mailing of shareholder reports, except proxy statements. FIIOC has agreed to voluntarily waive this fee until December 31, 2010. (See Note 7: Expense Reductions.) For the period, transfer agent fees for each class, including printing and out of pocket expenses, were as follows:
Initial Class | $ 5,530 |
Investor Class | 8,685 |
| $ 14,215 |
Accounting Fees. Fidelity Service Company, Inc. (FSC), an affiliate of FMR, maintains the Fund's accounting records. The fee is based on the level of average net assets for the month.
Brokerage Commissions. The Fund placed a portion of its portfolio transactions with brokerage firms which are affiliates of the investment adviser. The commissions paid to these affiliated firms were $744 for the period.
6. Committed Line of Credit.
The Fund participates with other funds managed by FMR or an affiliate in a $3.75 billion credit facility (the "line of credit") to be utilized for temporary or emergency purposes to fund shareholder redemptions or for other short-term liquidity purposes. The Fund has agreed to pay commitment fees on its pro-rata portion of the line of credit, which amounted to $26 and is reflected in Miscellaneous expenses on the Statement of Operations. During the period, there were no borrowings on this line of credit.
7. Expense Reductions.
In addition to FIIOC waving a portion of its transfer agent fees, FMR voluntarily agreed to reimburse each class to the extent annual operating expenses exceeded certain levels of average net assets as noted in the table below. Some expenses, for example interest expense, including commitment fees, are excluded from this reimbursement.
Annual Report
7. Expense Reductions - continued
The following classes were in reimbursement during the period:
| Expense
Limitations | Reimbursement/Waiver |
| | |
Initial Class | 1.00% | $ 19,247 |
Investor Class | 1.08% | 20,593 |
| | $ 39,840 |
Many of the brokers with whom FMR places trades on behalf of the Fund provided services to the Fund in addition to trade execution. These services included payments of certain expenses on behalf of the Fund totaling $1,097 for the period.
8. Distributions to Shareholders.
Distributions to shareholders of each class were as follows:
Years ended December 31, | 2010 | 2009 |
From net investment income | | |
Initial Class | $ 70,546 | $ 52,826 |
Investor Class | 87,413 | 53,110 |
Total | $ 157,959 | $ 105,936 |
9. Share Transactions.
Transactions for each class of shares were as follows:
| Shares | Dollars |
Years ended December 31, | 2010 | 2009 | 2010 | 2009 |
Initial Class | | | | |
Shares sold | 394,184 | 793,797 | $ 2,812,772 | $ 4,532,094 |
Reinvestment of distributions | 9,174 | 7,678 | 70,546 | 52,826 |
Shares redeemed | (448,829) | (605,766) | (3,234,790) | (3,645,605) |
Net increase (decrease) | (45,471) | 195,709 | $ (351,472) | $ 939,315 |
Investor Class | | | | |
Shares sold | 501,711 | 754,251 | $ 3,672,849 | $ 4,408,596 |
Reinvestment of distributions | 11,365 | 7,742 | 87,413 | 53,110 |
Shares redeemed | (330,817) | (582,365) | (2,321,891) | (3,576,185) |
Net increase (decrease) | 182,259 | 179,628 | $ 1,438,371 | $ 885,521 |
10. Other.
The Fund's organizational documents provide former and current trustees and officers with a limited indemnification against liabilities arising in connection with the performance of their duties to the Fund. In the normal course of business, the Fund may also enter into contracts that provide general indemnifications. The Fund's maximum exposure under these arrangements is unknown as this would be dependent on future claims that may be made against the Fund. The risk of material loss from such claims is considered remote.
At the end of the period, FMR or its affiliates were the owners of record of 100% of the total outstanding shares of the Fund.
Annual Report
Report of Independent Registered Public Accounting Firm
To the Trustees of Variable Insurance Products Fund IV and the Shareholders of VIP Telecommunications Portfolio:
In our opinion, the accompanying statement of assets and liabilities, including the schedule of investments, and the related statements of operations and of changes in net assets and the financial highlights present fairly, in all material respects, the financial position of VIP Telecommunications Portfolio (a fund of Variable Insurance Products Fund IV) at December 31, 2010, the results of its operations for the year then ended, the changes in its net assets for each of the two years in the period then ended and the financial highlights for each of the periods indicated, in conformity with accounting principles generally accepted in the United States of America. These financial statements and financial highlights (hereafter referred to as "financial statements") are the responsibility of the VIP Telecommunications Portfolio's management. Our responsibility is to express an opinion on these financial statements based on our audits. We conducted our audits of these financial statements in accordance with the standards of the Public Company Accounting Oversight Board (United States). Those standards require that we plan and perform the audit to obtain reasonable assurance about whether the financial statements are free of material misstatement. An audit includes examining, on a test basis, evidence supporting the amounts and disclosures in the financial statements, assessing the accounting principles used and significant estimates made by management, and evaluating the overall financial statement presentation. We believe that our audits, which included confirmation of securities at December 31, 2010 by correspondence with the custodian and brokers, provide a reasonable basis for our opinion.
/s/ PricewaterhouseCoopers LLP
PricewaterhouseCoopers LLP
Boston, Massachusetts
February 17, 2011
Annual Report
The Trustees, Members of the Advisory Board, and executive officers of the trust and fund, as applicable, are listed below. The Board of Trustees governs the fund and is responsible for protecting the interests of shareholders. The Trustees are experienced executives who meet periodically throughout the year to oversee the fund's activities, review contractual arrangements with companies that provide services to the fund, oversee management of the risks associated with such activities and contractual arrangements, and review the fund's performance. Except for James C. Curvey, each of the Trustees oversees 219 funds advised by FMR or an affiliate. Mr. Curvey oversees 408 funds advised by FMR or an affiliate.
The Trustees hold office without limit in time except that (a) any Trustee may resign; (b) any Trustee may be removed by written instrument, signed by at least two-thirds of the number of Trustees prior to such removal; (c) any Trustee who requests to be retired or who has become incapacitated by illness or injury may be retired by written instrument signed by a majority of the other Trustees; and (d) any Trustee may be removed at any special meeting of shareholders by a two-thirds vote of the outstanding voting securities of the trust. Each Trustee who is not an interested person (as defined in the 1940 Act) (Independent Trustee), shall retire not later than the last day of the calendar year in which his or her 72nd birthday occurs. The Independent Trustees may waive this mandatory retirement age policy with respect to individual Trustees. The executive officers and Advisory Board Members hold office without limit in time, except that any officer and Advisory Board Member may resign or may be removed by a vote of a majority of the Trustees at any regular meeting or any special meeting of the Trustees. Except as indicated, each individual has held the office shown or other offices in the same company for the past five years.
Experience, Skills, Attributes, and Qualifications of the Fund's Trustees. The Governance and Nominating Committee has adopted a statement of policy that describes the experience, qualifications, attributes, and skills that are necessary and desirable for potential Independent Trustee candidates (Statement of Policy). The Board believes that each Trustee satisfied at the time he or she was initially elected or appointed a Trustee, and continues to satisfy, the standards contemplated by the Statement of Policy. The Governance and Nominating Committee also engages professional search firms to help identify potential Independent Trustee candidates who have the experience, qualifications, attributes, and skills consistent with the Statement of Policy. From time to time, additional criteria based on the composition and skills of the current Independent Trustees, as well as experience or skills that may be appropriate in light of future changes to board composition, business conditions, and regulatory or other developments, have also been considered by the professional search firms and the Governance and Nominating Committee. In addition, the Board takes into account the Trustees' commitment and participation in Board and committee meetings, as well as their leadership of standing and ad hoc committees throughout their tenure.
In determining that a particular Trustee was and continues to be qualified to serve as a Trustee, the Board has considered a variety of criteria, none of which, in isolation, was controlling. The Board believes that, collectively, the Trustees have balanced and diverse experience, qualifications, attributes, and skills, which allow the Board to operate effectively in governing the fund and protecting the interests of shareholders. Information about the specific experience, skills, attributes, and qualifications of each Trustee, which in each case led to the Board's conclusion that the Trustee should serve (or continue to serve) as a trustee of the fund, is provided below.
Board Structure and Oversight Function. James C. Curvey is an interested person (as defined in the 1940 Act) and currently serves as Acting Chairman. The Trustees have determined that an interested Chairman is appropriate and benefits shareholders because an interested Chairman has a personal and professional stake in the quality and continuity of services provided to the fund. Independent Trustees exercise their informed business judgment to appoint an individual of their choosing to serve as Chairman, regardless of whether the Trustee happens to be independent or a member of management. The Independent Trustees have determined that they can act independently and effectively without having an Independent Trustee serve as Chairman and that a key structural component for assuring that they are in a position to do so is for the Independent Trustees to constitute a substantial majority for the Board. The Independent Trustees also regularly meet in executive session. Ned C. Lautenbach serves as Chairman of the Independent Trustees and as such (i) acts as a liaison between the Independent Trustees and management with respect to matters important to the Independent Trustees and (ii) with management prepares agendas for Board meetings.
Fidelity funds are overseen by different Boards of Trustees. The fund's Board oversees Fidelity's equity and high income funds and another Board oversees Fidelity's investment-grade bond, money market, and asset allocation funds. The asset allocation funds may invest in Fidelity funds overseen by the fund's Board. The use of separate Boards, each with its own committee structure, allows the Trustees of each group of Fidelity funds to focus on the unique issues of the funds they oversee, including common research, investment, and operational issues. On occasion, the separate Boards establish joint committees to address issues of overlapping consequences for the Fidelity funds overseen by each Board.
The Trustees operate using a system of committees to facilitate the timely and efficient consideration of all matters of importance to the Trustees, the fund, and fund shareholders and to facilitate compliance with legal and regulatory requirements and oversight of the fund's activities and associated risks. The Board, acting through its committees, has charged FMR and its affiliates with (i) identifying events or circumstances the occurrence of which could have demonstrably adverse effects on the fund's business and/or reputation; (ii) implementing processes and controls to lessen the possibility that such events or circumstances occur or to mitigate the effects of such events or circumstances if they do occur; and (iii) creating and maintaining a system designed to evaluate continuously business and market conditions in order to facilitate the identification and implementation processes described in (i) and (ii) above. Because the day-to-day operations and activities of the fund are carried out by or through FMR, its affiliates and other service providers, the fund's exposure to risks is mitigated but not eliminated by the processes overseen by the Trustees. While each of the Board's committees has responsibility for overseeing different aspects of the fund's activities, oversight is exercised primarily through the Operations, Audit, and Compliance Committees. Appropriate personnel, including but not limited to the fund's Chief Compliance Officer (CCO), FMR's internal auditor, the independent accountants, the fund's Treasurer and portfolio management personnel, make periodic reports to the Board's committees, as appropriate. The responsibilities of each committee, including their oversight responsibilities, are described further under "Standing Committees of the Fund's Trustees."
Annual Report
The fund's Statement of Additional Information (SAI) includes more information about the Trustees. To request a free copy, call Fidelity at 1-877-208-0098.
Interested Trustees*:
Correspondence intended for each Trustee who is an interested person may be sent to Fidelity Investments, 82 Devonshire Street, Boston, Massachusetts 02109.
Name, Age; Principal Occupations and Other Relevant Experience+ |
James C. Curvey (75) |
| Year of Election or Appointment: 2007 Mr. Curvey is Trustee and Acting Chairman of the Board of Trustees of certain Trusts. Mr. Curvey also serves as Trustee (2007-present) of other investment companies advised by FMR. Mr. Curvey is a Director of Fidelity Investments Money Management, Inc. (2009-present), Director of Fidelity Research & Analysis Co. (2009-present) and Director of FMR and FMR Co., Inc. (2007-present). Mr. Curvey is also Vice Chairman (2007-present) and Director of FMR LLC. In addition, Mr. Curvey serves as an Overseer for the Boston Symphony Orchestra and a member of the Trustees of Villanova University. Previously, Mr. Curvey was the Vice Chairman (2006-2007) and Director (2000-2007) of FMR Corp. |
Ronald P. O'Hanley (54) |
| Year of Election or Appointment: 2011 Mr. O'Hanley is President of Fidelity Asset Management and Corporate Services and a member of Fidelity's Executive Committee (2010-present). Previously, Mr. O'Hanley served as President and Chief Executive Officer of BNY Mellon Asset Management (2007-2010). Mr. O'Hanley also served as Vice Chairman of Bank New York Mellon Corp. and a member of that firm's Executive Committee. Prior to the 2007 merger of The Bank of New York and Mellon Financial Corporation, he was Vice Chairman of Mellon Financial Corporation and President and Chief Executive Officer of Mellon Asset Management. He joined Mellon in February 1997. Mr. O'Hanley currently serves as Chairman of the Boston Public Library Foundation Board of Directors and sits on the Board of Directors of Beth Israel Deaconess Medical Center, the Board of Trustees of the Marine Biological Laboratory and the Advisory Board of the Maxwell School of Citizenship and Public Administration at Syracuse University. Mr. O'Hanley also chairs the Council on Asset Management for the Financial Services Roundtable and is a member of the Board of Directors of Institutional Investor's U.S. Institute. |
* Trustees have been determined to be "Interested Trustees" by virtue of, among other things, their affiliation with the trust or various entities under common control with FMR.
+ The information above includes each Trustee's principal occupation during the last five years and other information relating to the experience, attributes, and skills relevant to each Trustee's qualifications to serve as a Trustee, which led to the conclusion that each Trustee should serve as a Trustee for the fund.
Independent Trustees:
Correspondence intended for each Independent Trustee (that is, the Trustees other than the Interested Trustees) may be sent to Fidelity Investments, P.O. Box 55235, Boston, Massachusetts 02205-5235.
Name, Age; Principal Occupations and Other Relevant Experience+ |
Dennis J. Dirks (62) |
| Year of Election or Appointment: 2005 Prior to his retirement in May 2003, Mr. Dirks was Chief Operating Officer and a member of the Board of The Depository Trust & Clearing Corporation (DTCC). He also served as President, Chief Operating Officer, and Board member of The Depository Trust Company (DTC) and President and Board member of the National Securities Clearing Corporation (NSCC). In addition, Mr. Dirks served as Chief Executive Officer and Board member of the Government Securities Clearing Corporation, Chief Executive Officer and Board member of the Mortgage-Backed Securities Clearing Corporation, as a Trustee and a member of the Finance Committee of Manhattan College (2005-2008), and as a Trustee and a member of the Finance Committee of AHRC of Nassau County (2006-2008). Mr. Dirks is a member of the Independent Directors Council (IDC) Governing Council (2010-Present) and Board of Directors for The Brookville Center for Children's Services, Inc. (2009-present). |
Alan J. Lacy (57) |
| Year of Election or Appointment: 2008 Mr. Lacy serves as Senior Adviser (2007-present) of Oak Hill Capital Partners, L.P. (private equity). Mr. Lacy also served as Chief Executive Officer (2000-2005) and Vice Chairman (2005-2006) of Sears Holdings Corporation and Sears, Roebuck and Co. (retail). In addition, Mr. Lacy serves as a member of the Board of Directors of The Western Union Company (global money transfer, 2006-present) and Bristol-Myers Squibb Company (global pharmaceuticals, 2007-present). Mr. Lacy is Chairman (2008-present) and a member (2006-present) of the Board of Trustees of The National Parks Conservation Association. |
Ned C. Lautenbach (66) |
| Year of Election or Appointment: 2000 Mr. Lautenbach is Chairman of the Independent Trustees of the Equity and High Income Funds (2006-present). Mr. Lautenbach currently serves as the Lead Director of the Eaton Corporation Board of Directors (diversified industrial, 1997-present). Mr. Lautenbach is also a member of the Board of Directors of the Philharmonic Center for the Arts in Naples, Florida (1999-present); a member of the Board of Trustees of Fairfield University (2005-present); and a member of the Council on Foreign Relations (1994-present). Previously, Mr. Lautenbach was a Partner/Advisory Partner at Clayton, Dubilier & Rice, Inc. (private equity investment, 1998-2010), as well as a Director of Sony Corporation (2006-2007). |
Joseph Mauriello (66) |
| Year of Election or Appointment: 2008 Prior to his retirement in January 2006, Mr. Mauriello served in numerous senior management positions including Deputy Chairman and Chief Operating Officer (2004-2005), and Vice Chairman of Financial Services (2002-2004) of KPMG LLP US (professional services, 1965-2005). Mr. Mauriello currently serves as a member of the Board of Directors of XL Group plc. (global insurance and re-insurance, 2006-present) and of Arcadia Resources Inc. (health care services and products, 2007-present). Previously, Mr. Mauriello served as a Director of the Hamilton Funds of the Bank of New York (2006-2007). |
Cornelia M. Small (66) |
| Year of Election or Appointment: 2005 Ms. Small is a member of the Board of Directors of the Teagle Foundation (2009-present). Ms. Small is also a member of the Investment Committee, and Chair (2008-present) and a member of the Board of Trustees of Smith College. In addition, Ms. Small serves on the Investment Committee of the Berkshire Taconic Community Foundation (2008-present). Previously, Ms. Small served as Chairperson of the Investment Committee (2002-2008) of Smith College. In addition, Ms. Small served as Chief Investment Officer, Director of Global Equity Investments, and a member of the Board of Directors of Scudder, Stevens & Clark and Scudder Kemper Investments. |
William S. Stavropoulos (71) |
| Year of Election or Appointment: 2001 Mr. Stavropoulos is Vice Chairman of the Independent Trustees of the Equity and High Income Funds (2006-present). Mr. Stavropoulos serves as President and Founder of the Michigan Baseball Foundation, the Great Lakes Loons (2007-present). Mr. Stavropoulos is Chairman Emeritus of the Board of Directors of The Dow Chemical Company, where he previously served in numerous senior management positions, including President, CEO (1995-2000; 2002-2004), Chairman of the Executive Committee (2000-2006), and as a member of the Board of Directors (1990-2006). Currently, Mr. Stavropoulos is Chairman of Univar (global distributor of commodity and specialty chemicals, 2010-present), a Director of Teradata Corporation (data warehousing and technology solutions, 2008-present), Chemical Financial Corporation, Maersk Inc. (industrial conglomerate), Tyco International, Inc. (multinational manufacturing and services, 2007-present), and a member of the Advisory Board for Metalmark Capital (private equity investment, 2005-present). Mr. Stavropoulos is a special advisor to Clayton, Dubilier & Rice, LLC (private equity investment). In addition, Mr. Stavropoulos is a member of the University of Notre Dame Advisory Council for the College of Science. |
David M. Thomas (61) |
| Year of Election or Appointment: 2008 Previously, Mr. Thomas served as Executive Chairman (2005-2006) and Chairman and Chief Executive Officer (2000-2005) of IMS Health, Inc. (pharmaceutical and healthcare information solutions). In addition, Mr. Thomas serves as a member of the Board of Directors of Fortune Brands, Inc. (consumer products), and Interpublic Group of Companies, Inc. (marketing communication, 2004-present). |
Michael E. Wiley (60) |
| Year of Election or Appointment: 2008 Mr. Wiley also serves as a Director of Asia Pacific Exploration Consolidated (international oil and gas exploration and production, 2008-present). Mr. Wiley serves as a Director of Tesoro Corporation (independent oil refiner and marketer, 2005-present), and a Director of Bill Barrett Corporation (exploration and production, 2005-present). In addition, Mr. Wiley also serves as a Director of Post Oak Bank (privately-held bank, 2004-present). Previously, Mr. Wiley served as a member of the Board of Trustees of the University of Tulsa (2000-2006; 2007-2010), as a Senior Energy Advisor of Katzenbach Partners, LLC (consulting, 2006-2007), as an Advisory Director of Riverstone Holdings (private investment), Chairman, President, and CEO of Baker Hughes, Inc. (oilfield services, 2000-2004), and as Director of Spinnaker Exploration Company (exploration and production, 2001-2005). |
+ The information above includes each Trustee's principal occupation during the last five years and other information relating to the experience, attributes, and skills relevant to each Trustee's qualifications to serve as a Trustee, which led to the conclusion that each Trustee should serve as a Trustee for the fund.
Advisory Board Members and Executive Officers:
Correspondence intended for each executive officer, Edward C. Johnson 3d, and Peter S. Lynch may be sent to Fidelity Investments, 82 Devonshire Street, Boston, Massachusetts 02109.
Name, Age; Principal Occupation |
Edward C. Johnson 3d (80) |
| Year of Election or Appointment: 2011 Member of the Advisory Board of Fidelity's Equity and High Income Funds. Formerly Trustee and Chairman of the Board of Trustees of certain Trusts, Mr. Johnson serves as Chief Executive Officer, Chairman, and a Director of FMR LLC; Chairman and a Director of FMR; and Chairman and a Director of FMR Co., Inc. In addition, Mr. Johnson serves as Chairman and Director of FIL Limited. Previously, Mr. Johnson served as President of FMR LLC (2006-2007). |
Peter S. Lynch (66) |
| Year of Election or Appointment: 2003 Member of the Advisory Board of Fidelity's Equity and High Income Funds. Mr. Lynch is Vice Chairman and a Director of FMR and FMR Co., Inc. In addition, Mr. Lynch serves as a Trustee of Boston College and as the Chairman of the Inner-City Scholarship Fund. Previously, Mr. Lynch served on the Special Olympics International Board of Directors (1997-2006). |
Kenneth B. Robins (41) |
| Year of Election or Appointment: 2008 President and Treasurer of Fidelity's Equity and High Income Funds. Mr. Robins also serves as President and Treasurer (2010-present) and Assistant Treasurer (2009-present) of other Fidelity funds and is an employee of Fidelity Investments (2004-present). Previously, Mr. Robins served as Deputy Treasurer of the Fidelity funds (2005-2008) and Treasurer and Chief Financial Officer of The North Carolina Capital Management Trust: Cash and Term Portfolios (2006-2008). |
Brian B. Hogan (46) |
| Year of Election or Appointment: 2009 Vice President of certain Equity Funds and Vice President of Sector Funds. Mr. Hogan also serves as President of FMR's Equity Division (2009-present). Previously, Mr. Hogan served as Senior Vice President, Equity Research of FMR (2006-2009) and as a portfolio manager. |
Christopher S. Bartel (39) |
| Year of Election or Appointment: 2009 Vice President of Fidelity's Sector and Real Estate Equity Funds. Mr. Bartel also serves as Senior Vice President of Equity Research (2009-present). Previously, Mr. Bartel served as Managing Director of Research (2006-2009) and an analyst and portfolio manager (2000-2006). |
Scott C. Goebel (42) |
| Year of Election or Appointment: 2008 Secretary and Chief Legal Officer (CLO) of the Fidelity funds. Mr. Goebel also serves as Secretary and CLO of The North Carolina Capital Management Trust: Cash and Term Portfolio (2008-present); General Counsel, Secretary, and Senior Vice President of FMR (2008-present) and FMR Co., Inc. (2008-present); Deputy General Counsel of FMR LLC; Chief Legal Officer of Fidelity Management & Research (Hong Kong) Limited (2008-present) and Assistant Secretary of Fidelity Management & Research (Japan) Inc. (2008-present), Fidelity Investments Money Management, Inc. (2008-present), Fidelity Management & Research (U.K.) Inc. (2008-present), and Fidelity Research and Analysis Company (2008-present). Previously, Mr. Goebel served as Assistant Secretary of the Funds (2007-2008) and as Vice President and Secretary of Fidelity Distributors Corporation (FDC) (2005-2007). |
William C. Coffey (41) |
| Year of Election or Appointment: 2009 Assistant Secretary of Fidelity's Equity and High Income Funds. Mr. Coffey also serves as Senior Vice President and Deputy General Counsel of FMR LLC (2010-present), and is an employee of Fidelity Investments. Previously, Mr. Coffey served as Vice President and Associate General Counsel of FMR LLC (2005-2009). |
Holly C. Laurent (56) |
| Year of Election or Appointment: 2008 Anti-Money Laundering (AML) Officer of the Fidelity funds. Ms. Laurent also serves as AML Officer of The North Carolina Capital Management Trust: Cash and Term Portfolio (2008-present) and is an employee of Fidelity Investments. Previously, Ms. Laurent was Senior Vice President and Head of Legal for Fidelity Business Services India Pvt. Ltd. (2006-2008), and Senior Vice President, Deputy General Counsel and Group Head for FMR LLC (2005-2006). |
Christine Reynolds (52) |
| Year of Election or Appointment: 2008 Chief Financial Officer of the Fidelity funds. Ms. Reynolds became President of Fidelity Pricing and Cash Management Services (FPCMS) in August 2008. Ms. Reynolds served as Chief Operating Officer of FPCMS (2007-2008). Previously, Ms. Reynolds served as President, Treasurer, and Anti-Money Laundering officer of the Fidelity funds (2004-2007). |
Kenneth A. Rathgeber (63) |
| Year of Election or Appointment: 2004 Chief Compliance Officer of Fidelity's Equity and High Income Funds. Mr. Rathgeber is Chief Compliance Officer of Fidelity Management & Research (Hong Kong) Limited (2008-present), Fidelity Management & Research (Japan) Inc. (2008-present), FMR (2005-present), FMR Co., Inc. (2005-present), Fidelity Management & Research (U.K.) Inc. (2005-present), Fidelity Research & Analysis Company (2005-present), Fidelity Investments Money Management, Inc. (2005-present), Pyramis Global Advisors, LLC (2005-present), and Strategic Advisers, Inc. (2005-present). |
Jeffrey S. Christian (49) |
| Year of Election or Appointment: 2009 Deputy Treasurer of the Fidelity funds. Mr. Christian is an employee of Fidelity Investments. Previously, Mr. Christian served as Chief Financial Officer (2008-2009) of certain Fidelity funds and Senior Vice President of Fidelity Pricing and Cash Management Services (FPCMS) (2004-2009). |
Bryan A. Mehrmann (49) |
| Year of Election or Appointment: 2005 Deputy Treasurer of the Fidelity funds. Mr. Mehrmann is an employee of Fidelity Investments. |
Adrien E. Deberghes (43) |
| Year of Election or Appointment: 2008 Deputy Treasurer of Fidelity's Equity and High Income Funds. Mr. Deberghes also serves as Assistant Treasurer of other Fidelity funds (2010-present) and is an employee of Fidelity Investments (2008-present). Previously, Mr. Deberghes served as Senior Vice President of Mutual Fund Administration at State Street Corporation (2007-2008), Senior Director of Mutual Fund Administration at Investors Bank & Trust (2005-2007), and Director of Finance for Dunkin' Brands (2000-2005). |
Stephanie J. Dorsey (41) |
| Year of Election or Appointment: 2010 Assistant Treasurer of Fidelity's Equity and High Income Funds. Ms. Dorsey also serves as Deputy Treasurer of other Fidelity funds (2008-present) and is an employee of Fidelity Investments (2008-present). Previously, Ms. Dorsey served as Treasurer (2004-2008) of the JPMorgan Mutual Funds and Vice President (2004-2008) of JPMorgan Chase Bank. |
John R. Hebble (52) |
| Year of Election or Appointment: 2009 Assistant Treasurer of Fidelity's Equity and High Income Funds. Mr. Hebble also serves as Treasurer and Chief Financial Officer of The North Carolina Capital Management Trust: Cash and Term Portfolio (2008-present), President and Treasurer of other Fidelity funds (2008-present) and is an employee of Fidelity Investments. |
Gary W. Ryan (52) |
| Year of Election or Appointment: 2005 Assistant Treasurer of the Fidelity funds. Mr. Ryan is an employee of Fidelity Investments. Previously, Mr. Ryan served as Vice President of Fund Reporting in Fidelity Pricing and Cash Management Services (FPCMS) (1999-2005). |
Jonathan Davis (42) |
| Year of Election or Appointment: 2010 Assistant Treasurer of the Fidelity funds. Mr. Davis is an employee of Fidelity Investments. Previously, Mr. Davis served as Vice President and Associate General Counsel of FMR LLC (2003-2010). |
Annual Report
Initial Class and Investors Class each designate 100% of each dividend distributed in December 2010, during the fiscal year as qualifying for the dividends-received deduction for corporate shareholders.
Annual Report
Board Approval of Investment Advisory Contracts and Management Fees
VIP Telecommunications Portfolio
Each year, the Board of Trustees, including the Independent Trustees (together, the Board), votes on the renewal of the management contract and sub-advisory agreements (together, the Advisory Contracts) for the fund. The Board, assisted by the advice of fund counsel and Independent Trustees' counsel, requests and considers a broad range of information relevant to the renewal of the Advisory Contracts throughout the year.
The Board meets regularly and considers at each of its meetings factors that are relevant to its annual consideration of the renewal of the fund's Advisory Contracts, including the services and support provided to the fund and its shareholders. The Board has established various standing committees, each composed of Independent Trustees with varying backgrounds, to which the Board has assigned specific subject matter responsibilities in order to enhance effective decision-making by the Board. The Board, acting directly and through its Committees, requests and receives information concerning the annual consideration of the renewal of the fund's Advisory Contracts. The Board also meets as needed to consider matters specifically related to the Board's annual consideration of the renewal of Advisory Contracts. Members of the Board may also meet with trustees of other Fidelity funds through ad hoc joint committees to discuss certain matters relevant to the Fidelity funds.
At its July 2010 meeting, the Board of Trustees, including the Independent Trustees, unanimously determined to renew the fund's Advisory Contracts. In reaching its determination, the Board considered all factors it believed relevant, including (i) the nature, extent, and quality of the services to be provided to the fund and its shareholders (including the investment performance of the fund); (ii) the competitiveness of the fund's management fee and total expenses; (iii) the total costs of the services to be provided by and the profits to be realized by Fidelity from its relationship with the fund; (iv) the extent to which economies of scale would be realized as the fund grows; and (v) whether fee levels reflect these economies of scale, if any, for the benefit of fund shareholders.
In considering whether to renew the Advisory Contracts for the fund, the Board reached a determination, with the assistance of fund counsel and Independent Trustees' counsel and through the exercise of its business judgment, that the renewal of the Advisory Contracts is in the best interests of fund shareholders and that the compensation to be received by Fidelity under the management contract is fair and reasonable. The Board's decision to renew the Advisory Contracts was not based on any single factor noted above, but rather was based on a comprehensive consideration of all the information provided to the Board at its meetings throughout the year. The Board, in reaching its determination to renew the Advisory Contracts, is aware that shareholders in the fund have a broad range of investment choices available to them, including a wide choice among mutual funds offered by Fidelity's competitors, and that the fund's shareholders, with the opportunity to review and weigh the disclosure provided by the fund in its prospectus and other public disclosures, have chosen to invest in this fund, managed by Fidelity.
Nature, Extent, and Quality of Services Provided. The Board considered the staffing within the investment adviser, FMR, and the sub-advisers (together, the Investment Advisers), including the backgrounds of the fund's investment personnel and the fund's investment objective and discipline. The Independent Trustees also had discussions with senior management of Fidelity's investment operations and investment groups. The Board considered the structure of the portfolio manager compensation program and whether this structure provides appropriate incentives to act in the best interest of the fund.
Resources Dedicated to Investment Management and Support Services. The Board and the equity research subcommittee of the Board's Fund Oversight Committee reviewed the size, education, and experience of the Investment Advisers' investment staff, their use of technology, and the Investment Advisers' approach to recruiting, training, and retaining portfolio managers and other research, advisory, and management personnel. The Board noted that Fidelity's analysts have access to a variety of technological tools and market and securities data that enable them to perform both fundamental and quantitative analysis and to specialize in various disciplines. The Board considered Fidelity's extensive global research capabilities that enable the Investment Advisers to aggregate data from various sources in an effort to produce positive investment results. The Board also considered that Fidelity's portfolio managers and analysts have access to daily portfolio attribution that allows for monitoring of a fund's portfolio, as well as an electronic communication system that provides immediate real-time access to research concerning issuers and credit enhancers. The Board noted FMR's continued focus on strengthening the organization and discipline of equity portfolio management and research.
Shareholder and Administrative Services. The Board considered (i) the nature, extent, quality, and cost of advisory, administrative, and shareholder services performed by the Investment Advisers and their affiliates under the Advisory Contracts and under separate agreements covering transfer agency, pricing and bookkeeping, and securities lending services for the fund; (ii) the nature and extent of the investment adviser's supervision of third party service providers, principally custodians and subcustodians; and (iii) the resources devoted to, and the record of compliance with, the fund's compliance policies and procedures. The Board also reviewed the allocation of fund brokerage, including allocations to brokers affiliated with the Investment Advisers, the use of brokerage commissions to pay fund expenses, and the use of "soft" commission dollars to pay for research services.
The Board noted that the growth of fund assets over time across the complex allows Fidelity to reinvest in the development of services designed to enhance the value or convenience of the Fidelity funds as investment vehicles. These services include 24-hour access to account information and market information through phone representatives and over the Internet, and investor education materials and asset allocation tools.
Investment in a Large Fund Family. The Board considered the benefits to shareholders of investing in a Fidelity fund, including the benefits of investing in a fund that is part of a large family of funds offering a variety of investment disciplines and providing a large variety of mutual fund investor services. The Board noted that Fidelity had taken, or had made recommendations that resulted in the Fidelity funds taking, a number of actions over the previous year that benefited particular funds, including (i) dedicating additional resources to investment research and restructuring and broadening the focus of the investment research teams; (ii) bolstering the senior management team that oversees asset management; (iii) launching Class F of certain funds as a lower-fee class available to Freedom K and Freedom Index Funds; (iv) lowering the initial investment minimums and ongoing balance requirements for Real Estate High Income Fund; (v) eliminating subsequent purchase minimums for all funds and adding a waiver of the investment minimum requirement for new accounts opened with the proceeds of a systematic withdrawal plan; (vi) eliminating the withdrawal minimum and maximum limits for systematic withdrawals from Advisor funds; (vii) expanding sales load waivers on Class A shares for Destiny Planholders and expanding Institutional Class eligibility for Class O Destiny Planholders; and (viii) changing certain Class A and Class T sales charge structures to further align them with industry practices.
Annual Report
Board Approval of Investment Advisory Contracts and Management Fees - continued
Investment Performance. The Board considered whether the fund has operated in accordance with its investment objective, as well as its record of compliance with its investment restrictions. It also reviewed the fund's absolute investment performance for each class, as well as the fund's relative investment performance for each class measured against a third-party-sponsored index that reflects the market sector in which the fund invests. The Board noted that FMR does not believe that a meaningful peer group exists against which to compare the fund's performance. Because the fund had been in existence less than three calendar years, the following chart considered by the Board shows, for the one-year period ended December 31, 2009, the total returns of Initial Class and Investor Class of the fund and the total return of a third-party-sponsored index ("benchmark").
VIP Telecommunications Portfolio
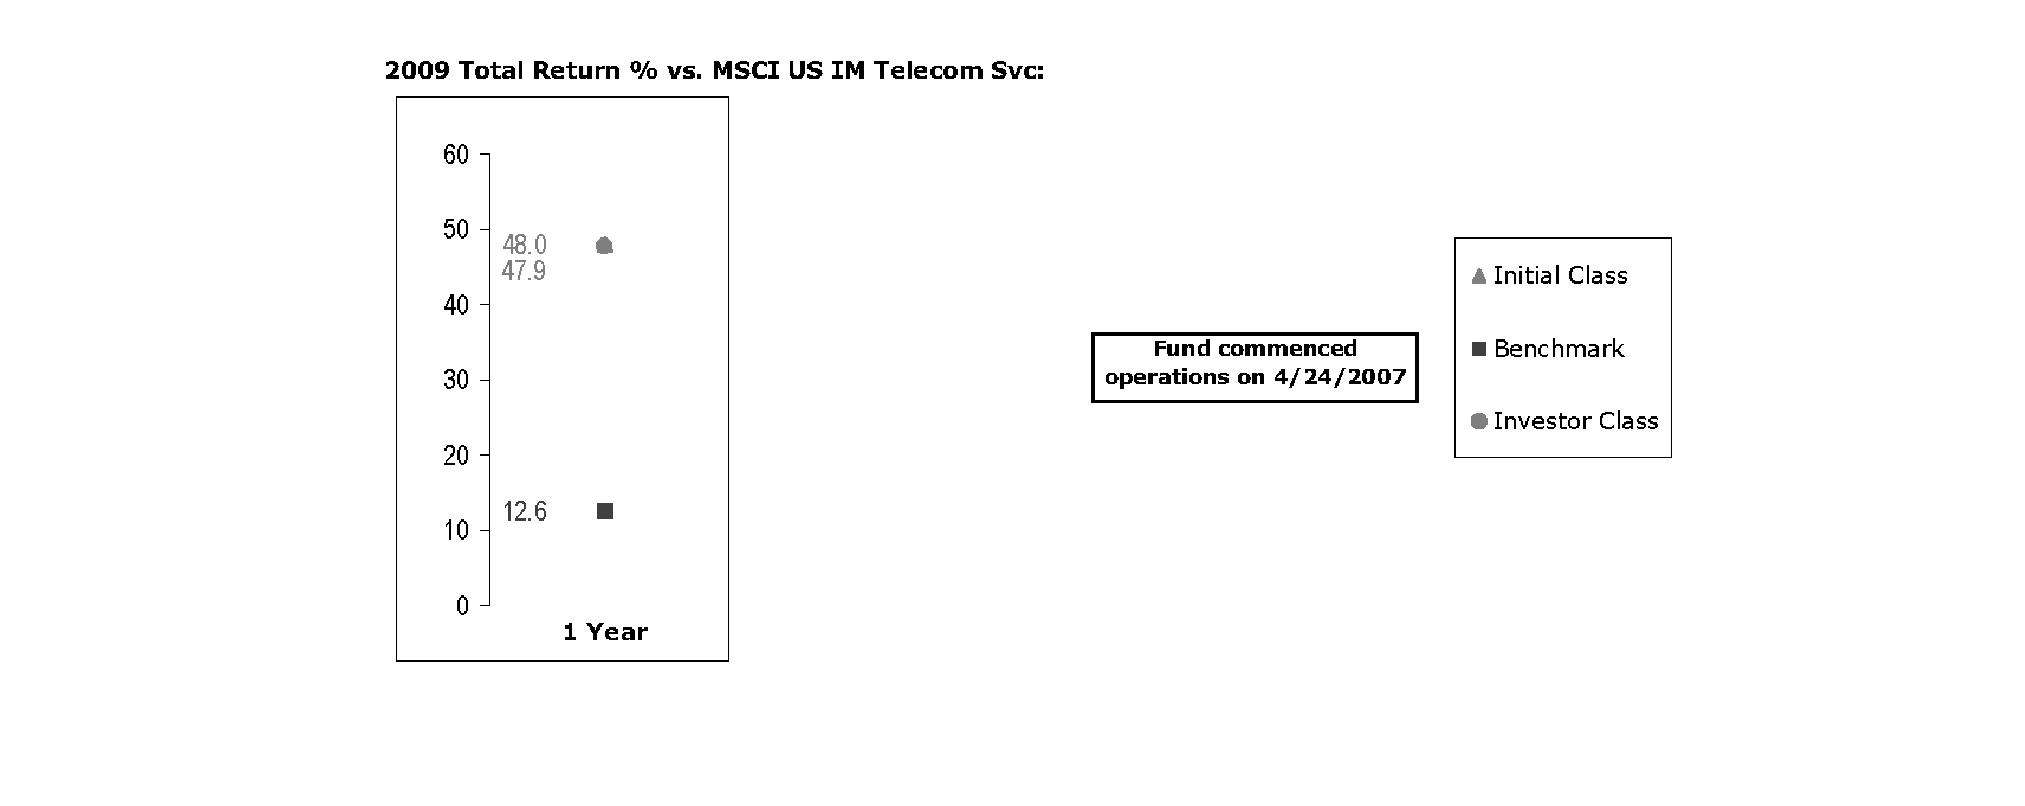
The Board noted that the investment performance of Initial Class of the fund compared favorably to its benchmark for the period shown. The Board considered that the variations in performance between the fund's classes reflect the variations in class expenses, which result in lower performance for the higher expense class. The Board also reviewed the fund's performance since inception as well as performance in the current year. The Board noted that it is difficult to evaluate in any comprehensive fashion the performance of the fund, in light of its relatively recent commencement of operations.
Based on its review, and giving particular weight to the nature and quality of the resources dedicated by the Investment Advisers to maintain and improve relative performance and factoring in the unprecedented market events in recent years, the Board concluded that the nature, extent, and quality of investment management and support services and of shareholder and administrative services provided to the fund will benefit the fund's shareholders, particularly in light of the Board's view that the fund's shareholders benefit from investing in a fund that is part of a large family of funds offering a variety of investment disciplines and services.
Competitiveness of Management Fee and Total Fund Expenses. The Board considered the fund's management fee and total expenses compared to "mapped groups" of competitive funds and classes. Fidelity creates "mapped groups" by combining similar Lipper investment objective categories that have comparable management fee characteristics. Combining Lipper investment objective categories aids the Board's management fee and total expense comparisons by broadening the competitive group used for comparison and by reducing the number of universes to which various Fidelity funds are compared.
Management Fee. The Board considered two proprietary management fee comparisons for the 12-month (or shorter) periods shown in the chart below. The group of Lipper funds used by the Board for management fee comparisons is referred to below as the "Total Mapped Group." The Total Mapped Group comparison focuses on a fund's standing relative to the total universe of comparable funds available to investors, in terms of gross management fees before expense reimbursements or caps. "TMG %" represents the percentage of funds in the Total Mapped Group that had management fees that were lower than the fund's. For example, a TMG % of 3% means that 97% of the funds in the Total Mapped Group had higher management fees than the fund. The "Asset-Size Peer Group" (ASPG) comparison focuses on a fund's standing relative to non-Fidelity funds similar in size to the fund within the Total Mapped Group. The ASPG represents at least 15% of the funds in the Total Mapped Group with comparable asset size and management fee characteristics, subject to a minimum of 50 funds (or all funds in the Total Mapped Group if fewer than 50). Additional information, such as the ASPG quartile in which the fund's management fee ranked, is also included in the chart and considered by the Board.
Annual Report
VIP Telecommunications Portfolio
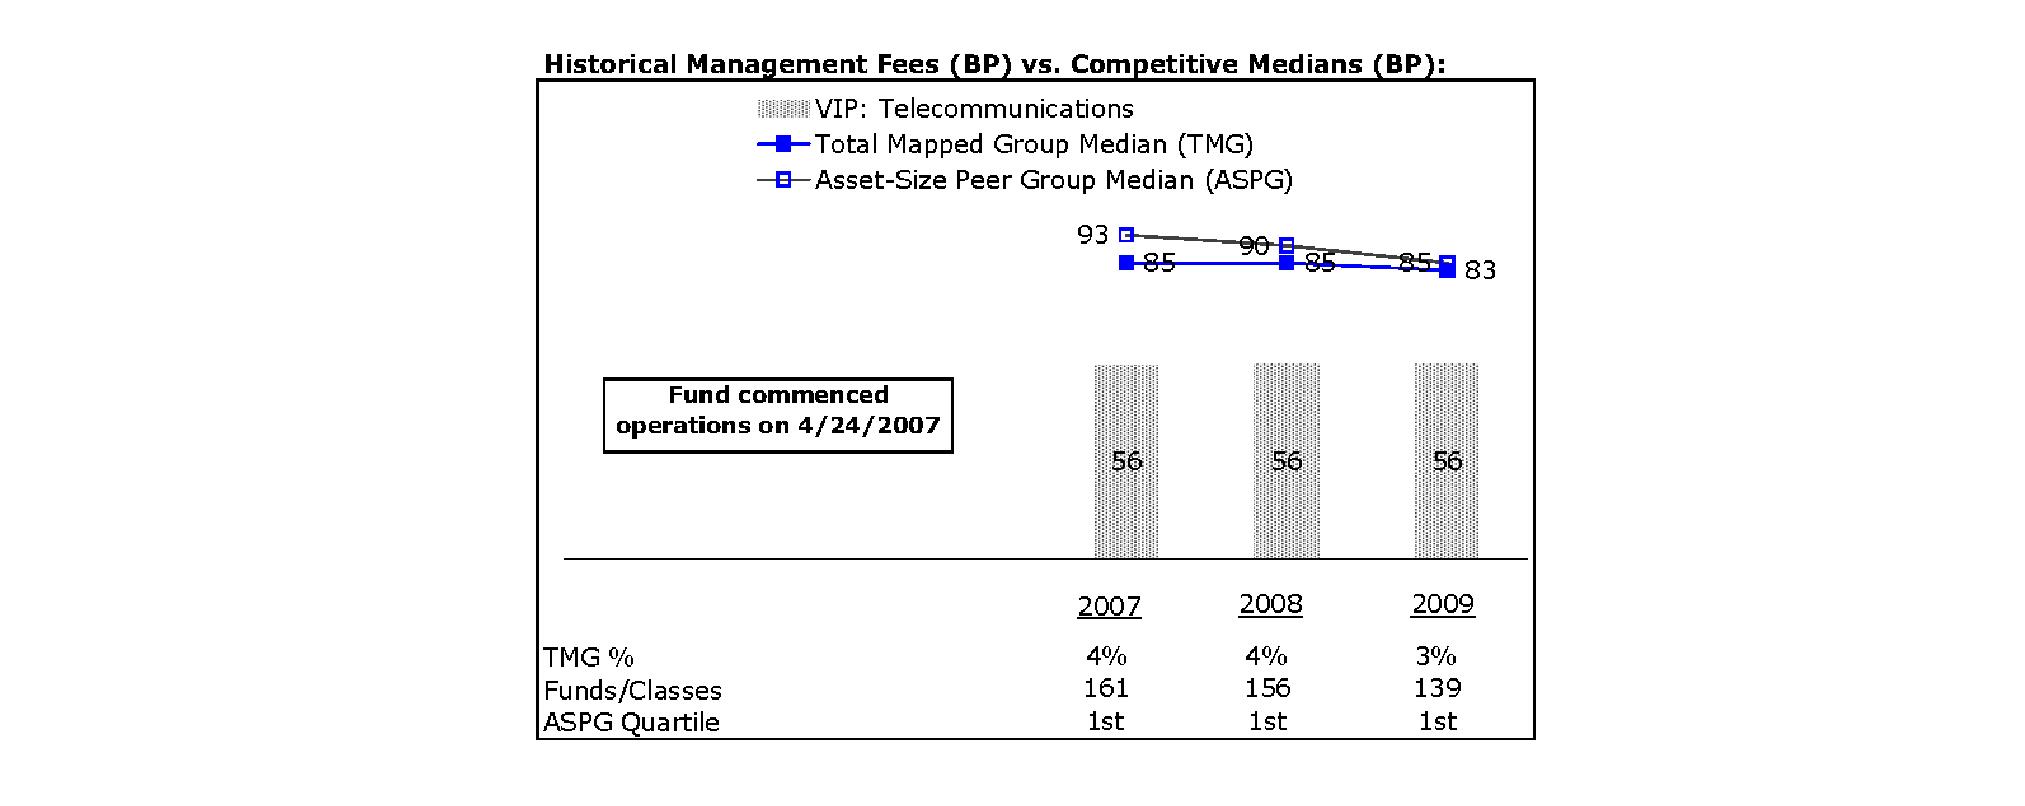
The Board noted that the fund's management fee ranked below the median of its Total Mapped Group and below the median of its ASPG for 2009.
Based on its review, the Board concluded that the fund's management fee is fair and reasonable in light of the services that the fund receives and the other factors considered.
Total Expenses. In its review of each class's total expenses, the Board considered the fund's management fee as well as other fund or class expenses, as applicable, such as transfer agent fees, pricing and bookkeeping fees, and custodial, legal, and audit fees. The Board also noted the effects of any waivers and reimbursements on fees and expenses. As part of its review, the Board also considered current and historical total expenses of each class of the fund compared to competitive fund median expenses. Each class of the fund is compared to those funds and classes in the Total Mapped Group (used by the Board for management fee comparisons) that have a similar sales load structure.
The Board noted that the total expenses of Initial Class ranked below its competitive median for 2009 and the total expenses of Investor Class ranked above its competitive median for 2009. The Board considered that the total expenses of Investor Class were above the median primarily due to its higher transfer agent fee. The Board noted that the fund offers multiple classes and that the multiple structures are intended to offer pricing options for the intermediary market. The Board also noted that the total expenses of the classes vary primarily due to differences in transfer agent fees.
Fees Charged to Other Fidelity Clients. The Board also considered Fidelity fee structures and other information with respect to clients of FMR and its affiliates, such as other mutual funds advised or subadvised by FMR or its affiliates, pension plan clients, and other institutional clients. In March 2010, the Board created an ad hoc joint committee with the board of other Fidelity funds (the Committee) to review and compare Fidelity's institutional investment advisory business with its business of providing services to the Fidelity funds, including the differences in services provided, fees charged, and costs incurred, as well as competition in their respective marketplaces.
Based on its review of total expenses and fees charged to other Fidelity clients, the Board concluded that the total expenses of each class of the fund were reasonable, although in one case above the median of the universe presented for comparison, in light of the services that the fund and its shareholders receive and the other factors considered, including the findings of the Committee.
Costs of the Services and Profitability. The Board considered the revenues earned and the expenses incurred by Fidelity in conducting the business of developing, marketing, distributing, managing, administering and servicing the fund and its shareholders. The Board also considered the level of Fidelity's profits in respect of all the Fidelity funds.
Annual Report
Board Approval of Investment Advisory Contracts and Management Fees - continued
On an annual basis, FMR presents to the Board Fidelity's profitability for the fund. Fidelity calculates the profitability for each fund, as well as aggregate profitability for groups of Fidelity funds and all Fidelity funds, using a series of detailed revenue and cost allocation methodologies which originate with the audited books and records of Fidelity. The Audit Committee of the Board reviews any significant changes from the prior year's methodologies.
PricewaterhouseCoopers LLP (PwC), independent registered public accounting firm and auditor to Fidelity and certain Fidelity funds, has been engaged annually by the Board as part of the Board's assessment of Fidelity's profitability analysis. PwC's engagement includes the review and assessment of Fidelity's methodologies used in determining the revenues and expenses attributable to Fidelity's mutual fund business, and completion of agreed-upon procedures surrounding the mathematical accuracy of fund profitability and its conformity to allocation methodologies. After considering PwC's reports issued under the engagement and information provided by Fidelity, the Board believes that while other allocation methods may also be reasonable, Fidelity's profitability methodologies are reasonable in all material respects.
The Board has also reviewed Fidelity's non-fund businesses and fall-out benefits related to the mutual fund business as well as cases where Fidelity's affiliates may benefit from or be related to the fund's business.
The Board considered the costs of the services provided by and the profits realized by Fidelity in connection with the operation of the fund and were satisfied that the profitability was not excessive in the circumstances.
Economies of Scale. The Board considered whether there have been economies of scale in respect of the management of the Fidelity funds, whether the Fidelity funds (including the fund) have appropriately benefited from any such economies of scale, and whether there is potential for realization of any further economies of scale. The Board considered the extent to which the fund will benefit from economies of scale through increased services to the fund, through waivers or reimbursements, or through fee or expense reductions.
In February 2009, the Board and the board of other Fidelity funds created an ad hoc committee (the Economies of Scale Committee) to analyze whether FMR attains economies of scale in respect of the management and servicing of the Fidelity funds, whether the Fidelity funds have appropriately benefited from such economies of scale, and whether there is potential for realization of any further economies of scale.
The Board recognized that the fund's management contract incorporates a "group fee" structure, which provides for lower group fee rates as total fund assets under FMR's management increase, and for higher group fee rates as total fund assets under FMR's management decrease. FMR calculates the group fee rates based on a tiered asset "breakpoint" schedule that varies based on asset class. The Board considered that the group fee is designed to deliver the benefits of economies of scale to fund shareholders when total Fidelity fund assets increase, even if assets of any particular fund are unchanged or have declined, because some portion of Fidelity's costs are attributable to services provided to all Fidelity funds, and all funds benefit if those costs can be allocated among more assets. The Board concluded that, given the group fee structure, fund shareholders will benefit from lower management fees as assets under FMR's management increase at the fund complex level, regardless of whether Fidelity achieves any such economies of scale.
The Board concluded, considering the findings of the Economies of Scale Committee, that any potential economies of scale are being appropriately shared between fund shareholders and Fidelity.
Additional Information Requested by the Board. In order to develop fully the factual basis for consideration of the Fidelity funds' Advisory Contracts, the Board requested and received additional information on certain topics, including (i) fund performance trends, actions to be taken by FMR to improve certain funds' overall performance, and Fidelity's long-term strategies for certain funds; (ii) portfolio manager changes that have occurred during the past year and length of portfolio manager tenure for different categories of funds over time; (iii) Fidelity's compensation structure for portfolio managers, research analysts, and other key personnel, the rationale for the compensation structure, and how the compensation structure provides appropriate performance incentives; (iv) the amount of the investment that each portfolio manager has made in the Fidelity fund(s) that he or she manages; (v) management and other fees paid by FMR to affiliated sub-advisers on behalf of the Fidelity funds; (vi) Fidelity's fee structures and rationale for recommending different fees among different categories of funds; (vii) Fidelity's rationale for recommending which funds should have a performance adjustment component as part of their management fees; (viii) the rationale for any differences between fund fee structures and fee structures in place for other Fidelity clients; and (ix) explanations regarding the relative total expenses borne by certain funds and classes, total expense competitive trends, and actions that might be taken by FMR to reduce total expenses for certain funds and classes.
Based on its evaluation of all of the conclusions noted above, and after considering all factors it believed relevant, the Board ultimately concluded that the advisory fee structures are fair and reasonable, and that the fund's Advisory Contracts should be renewed.
Annual Report
Investment Adviser
Fidelity Management & Research Company
Boston, MA
Investment Sub-Advisers
FMR Co., Inc.
Fidelity Management & Research (U.K.) Inc.
Fidelity Management & Research (Hong Kong)
Limited
Fidelity Management & Research (Japan) Inc.
General Distributor
Fidelity Distributors Corporation
Boston, MA
Transfer and Service Agents
Fidelity Investments Institutional Operations Company, Inc.
Boston, MA
Fidelity Service Company, Inc.
Boston, MA
Custodian
State Street Bank and Trust Company
Quincy, MA
VTELP-ANN-0211
1.851004.103
Fidelity® Variable Insurance Products:
Utilities Portfolio
Annual Report
December 31, 2010
(2_fidelity_logos) (Registered_Trademark)
Contents
Performance | <Click Here> | How the fund has done over time. |
Management's Discussion of Fund Performance | <Click Here> | The Portfolio Manager's review of fundperformance and strategy. |
Shareholder Expense Example | <Click Here> | An example of shareholder expenses. |
Investment Changes | <Click Here> | A summary of major shifts in the fund's investments over the past six months. |
Investments | <Click Here> | A complete list of the fund's investments with their market values. |
Financial Statements | <Click Here> | Statements of assets and liabilities, operations, and changes in net assets, as well as financial highlights. |
Notes | <Click Here> | Notes to the financial statements. |
Report of Independent Registered Public Accounting Firm | <Click Here> | |
Trustees and Officers | <Click Here> | |
Distributions | <Click Here> | |
Board Approval of Investment Advisory Contracts and Management Fees | <Click Here> | |
To view a fund's proxy voting guidelines and proxy voting record for the 12-month period ended June 30, visit http://www.fidelity.com/proxyvotingresults or visit the Securities and Exchange Commission's (SEC) web site at http://www.sec.gov. You may also call 1-877-208-0098 to request a free copy of the proxy voting guidelines.
Fidelity Variable Insurance Products are separate account options which are purchased through a variable insurance contract.
Standard & Poor's, S&P and S&P 500 are registered service marks of The McGraw-Hill Companies, Inc. and have been licensed for use by Fidelity Distributors Corporation.
Other third party marks appearing herein are the property of their respective owners.
All other marks appearing herein are registered or unregistered trademarks or service marks of FMR LLC or an affiliated company.
The general research services agreement with Fidelity Research & Analysis Company has been terminated and is no longer in effect for the fund.
This report and the financial statements contained herein are submitted for the general information of the shareholders of the fund. This report is not authorized for distribution to prospective investors in the fund unless preceded or accompanied by an effective prospectus.
A fund files its complete schedule of portfolio holdings with the SEC for the first and third quarters of each fiscal year on Form N-Q. Forms N-Q are available on the SEC's web site at http://www.sec.gov. A fund's Forms N-Q may be reviewed and copied at the SEC's Public Reference Room in Washington, DC. Information regarding the operation of the SEC's Public Reference Room may be obtained by calling 1-800-SEC-0330. For a complete list of the fund's portfolio holdings, view the most recent holdings listing, semiannual report, or annual report on Fidelity's web site at http://www.fidelity.com, http://www.advisor.fidelity.com, or http://www.401k.com, as applicable.
NOT FDIC INSURED • MAY LOSE VALUE • NO BANK GUARANTEE
Neither the fund nor Fidelity Distributors Corporation is a bank.
Annual Report
Average annual total return reflects the change in the value of an investment, assuming reinvestment of the class' distributions from dividend income and capital gains (the profits earned upon the sale of securities that have grown in value, if any) and assuming a constant rate of performance each year. During periods of reimbursement by Fidelity, a fund's total return will be greater than it would be had the reimbursement not occurred. Performance numbers are net of all underlying fund operating expenses, but do not include any insurance charges imposed by your insurance company's separate account. If performance information included the effect of these additional charges, the total returns would have been lower. How a fund did yesterday is no guarantee of how it will do tomorrow.
Average Annual Total Returns
Periods ended December 31, 2010 | Past 1
year | Past 5
years | Life of fund A |
VIP Utilities Portfolio - Initial Class C | 11.20% | 5.62% | 3.35% |
VIP Utilities Portfolio - Investor ClassB,C | 11.04% | 5.48% | 3.27% |
A From July 19, 2001.
B The initial offering of Investor Class shares took place on July 21, 2005. Returns prior to July 21, 2005 are those of Initial Class. Had Investor Class's transfer agent fee been reflected, returns prior to July 21, 2005, would have been lower.
C Prior to October 1, 2006, VIP Utilities Portfolio operated under certain different investment policies. The historical performance for the fund may not represent its current investment policies.
$10,000 Over Life of Fund
Let's say hypothetically that $10,000 was invested in VIP Utilities Portfolio - Initial Class on July 19, 2001, when the fund started. The chart shows how the value of your investment would have changed, and also shows how the S&P 500® Index performed over the same period.
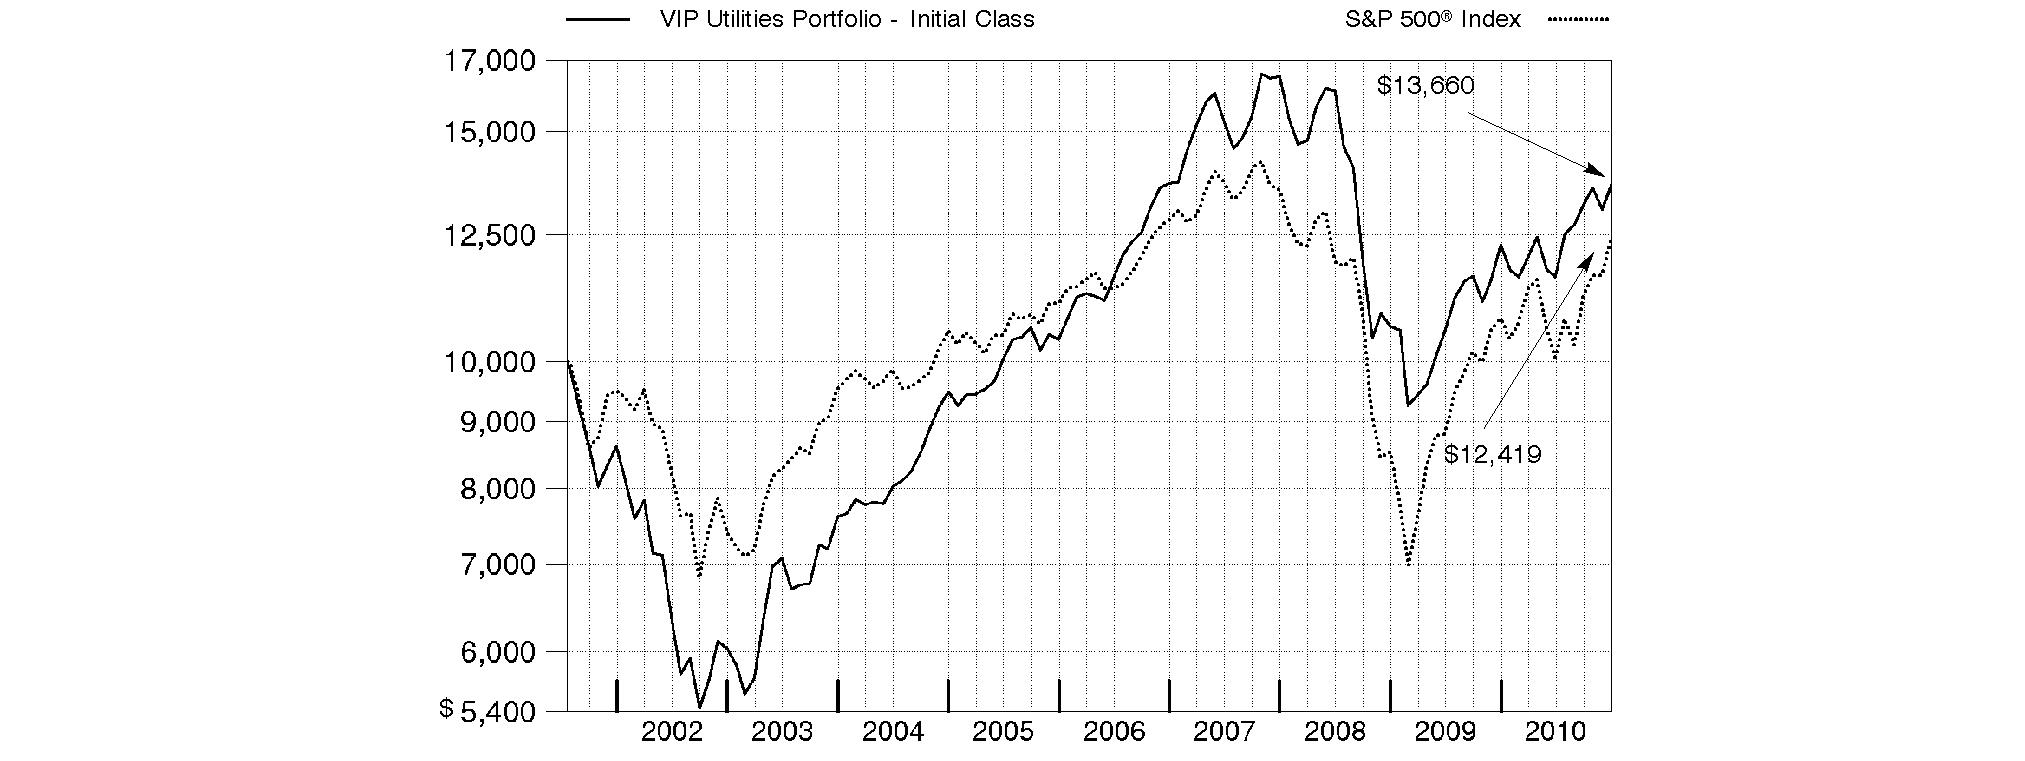
Annual Report
Market Recap: While market improvements around the world hit a speed bump in the first half of the 12-month period ending December 31, 2010, world economies re-accelerated in August, supported by a broadening recovery and low inflation in the U.S. Domestic stock markets recorded solid gains for the year, lifted by a strong second-half rally fueled by economic optimism, encouraging earnings reports and a wave of corporate mergers. The large-cap S&P 500® Index rose 15.06%, the blue-chip-laden Dow Jones Industrial AverageSM added 14.06% and the technology-heavy Nasdaq Composite® Index climbed 18.02%. Meanwhile, international stocks, as represented by the MSCI® ACWI® (All Country World Index) ex USA Index, gained 11.29%, boosted in part by a depreciating U.S. dollar. In the fixed-income arena, U.S. taxable investment-grade bonds generated positive results during 2010, as the Barclays Capital® U.S. Aggregate Bond Index gained 6.54%. With ultra-low interest rates bolstering nearly all fixed-income securities for most of the year, sectors in the index with higher yields and more credit risk generally fared best, while most high-quality bonds generated more-moderate returns. Meanwhile, high-yield bonds, as represented by The BofA Merrill LynchSM US High Yield Constrained Index, returned 15.07%, a result of improved economic data and strengthening investor demand. Overseas, foreign bond markets showed mixed results, with a sizable disparity between the 3.97% return of the Citigroup® Non-U.S. Group of 7 Index - which measures the performance of sovereign debt of the major global economies outside the U.S. - and the 12.04% advance of the JPMorgan Emerging Markets Bond Index Global (EMBI Global), which benefited from the rising overall credit quality of emerging-markets debt issuers.
Comments from Douglas Simmons, Portfolio Manager of VIP Utilities Portfolio: For the year ending December 31, 2010, the fund's share classes significantly outperformed the 7.20% return of the MSCI® U.S. IM Utilities 25/50 Index - which was adopted in January 2010 as a better representation of the fund's investment universe - but underperformed the S&P 500®. (For specific portfolio results, please refer to the performance section of this report.) At the industry level, the fund benefited from strong security selection in multi-utilities, independent power/energy trade and oil/gas exploration/production. Individual contributions came from not owning Chicago-based electric utility and major index component Exelon, along with investments in out-of-index oil and natural gas exploration and production company Canacol Energy - an out-of-benchmark position - Las Vegas electric utility NV Energy, Michigan multi-utility CMS Energy - not held at period end - independent power/energy trader Constellation Energy Group and California electric utility Edison International. Conversely, underweighting gas and water utilities, along with overweighting the independent power/energy trade group, curtailed relative performance. Individual detractors included Ohio-based electric utility FirstEnergy - not held at period end - an underweighting in Atlanta-headquartered Southern Company, Florida's NextEra Energy and not owning multi-utility and sizable index constituent Dominion Resources, located in Virginia.
The views expressed above reflect those of the portfolio manager(s) only through the end of the period as stated on the cover of this report and do not necessarily represent the views of Fidelity or any other person in the Fidelity organization. Any such views are subject to change at any time based upon market or other conditions and Fidelity disclaims any responsibility to update such views. These views may not be relied on as investment advice and, because investment decisions for a Fidelity fund are based on numerous factors, may not be relied on as an indication of trading intent on behalf of any Fidelity fund.
Annual Report
As a shareholder of the Fund, you incur two types of costs: (1) transaction costs, including redemption fees, and (2) ongoing costs, including management fees and other Fund expenses. This Example is intended to help you understand your ongoing costs (in dollars) of investing in the Fund and to compare these costs with the ongoing costs of investing in other mutual funds.
The Example is based on an investment of $1,000 invested at the beginning of the period and held for the entire period (July 1, 2010 to December 31, 2010).
Actual Expenses
The first line of the accompanying table for each class of the Fund provides information about actual account values and actual expenses. You may use the information in this line, together with the amount you invested, to estimate the expenses that you paid over the period. Simply divide your account value by $1,000.00 (for example, an $8,600 account value divided by $1,000.00 = 8.6), then multiply the result by the number in the first line for a class of the Fund under the heading entitled "Expenses Paid During Period" to estimate the expenses you paid on your account during this period. The estimate of expenses does not include any fees or other expenses of any variable annuity or variable life insurance product. If they were, the estimate of expenses you paid during the period would be higher, and your ending account value would be lower. In addition, the Fund, as a shareholder in the underlying Fidelity Central Funds, will indirectly bear its pro-rata share of the fees and expenses incurred by the underlying Fidelity Central Funds. These fees and expenses are not included in the Fund's annualized expense ratio used to calculate the expense estimate in the table below.
Hypothetical Example for Comparison Purposes
The second line of the accompanying table for each class of the Fund provides information about hypothetical account values and hypothetical expenses based on a Class' actual expense ratio and an assumed rate of return of 5% per year before expenses, which is not the Class' actual return. The hypothetical account values and expenses may not be used to estimate the actual ending account balance or expenses you paid for the period. You may use this information to compare the ongoing costs of investing in the Fund and other funds. To do so, compare this 5% hypothetical example with the 5% hypothetical examples that appear in the shareholder reports of the other funds. The estimate of expenses does not include any fees or other expenses of any variable annuity or variable life insurance product. If they were, the estimate of expenses you paid during the period would be higher, and your ending account value would be lower. In addition, the Fund, as a shareholder in the underlying Fidelity Central Funds, will indirectly bear its pro-rata share of the fees and expenses incurred by the underlying Fidelity Central Funds. These fees and expenses are not included in the Fund's annualized expense ratio used to calculate the expense estimate in the table below.
Please note that the expenses shown in the table are meant to highlight your ongoing costs only and do not reflect any transaction costs. Therefore, the second line of the table is useful in comparing ongoing costs only, and will not help you determine the relative total costs of owning different funds. In addition, if these transactional costs were included, your costs would have been higher.
| Annualized Expense Ratio | Beginning
Account Value
July 1, 2010 | Ending
Account Value
December 31, 2010 | Expenses Paid
During Period*
July 1, 2010
to December 31, 2010 |
Initial Class | .81% | | | |
Actual | | $ 1,000.00 | $ 1,176.60 | $ 4.44 |
HypotheticalA | | $ 1,000.00 | $ 1,021.12 | $ 4.13 |
Investor Class | .90% | | | |
Actual | | $ 1,000.00 | $ 1,175.20 | $ 4.93 |
HypotheticalA | | $ 1,000.00 | $ 1,020.67 | $ 4.58 |
A 5% return per year before expenses
* Expenses are equal to each Class' annualized expense ratio, multiplied by the average account value over the period, multiplied by 184/365 (to reflect the one-half year period).
Annual Report
Investment Changes (Unaudited)
Top Ten Stocks as of December 31, 2010 |
| % of fund's
net assets | % of fund's net assets
6 months ago |
NextEra Energy, Inc. | 12.1 | 10.3 |
PPL Corp. | 7.7 | 4.7 |
Sempra Energy | 7.6 | 8.6 |
Edison International | 7.5 | 0.0 |
NV Energy, Inc. | 6.1 | 5.6 |
Southern Co. | 5.4 | 3.3 |
ONEOK, Inc. | 4.9 | 0.0 |
ITC Holdings Corp. | 4.9 | 4.7 |
National Fuel Gas Co. New Jersey | 4.6 | 2.2 |
Veolia Environment | 4.0 | 0.0 |
| 64.8 | |
Top Industries (% of fund's net assets) |
As of December 31, 2010 |
| Electric Utilities | 47.0% | |
| Multi-Utilities | 30.7% | |
| Gas Utilities | 9.5% | |
| Independent Power Producers & Energy Traders | 8.7% | |
| Oil, Gas & Consumable Fuels | 3.9% | |
| All Others* | 0.2% | |

As of June 30, 2010 |
| Electric Utilities | 57.6% | |
| Multi-Utilities | 30.1% | |
| Independent Power Producers & Energy Traders | 6.6% | |
| Gas Utilities | 4.6% | |
| Oil, Gas & Consumable Fuels | 0.6% | |
| All Others* | 0.5% | |

* Includes short-term investments and net other assets. |
Annual Report
Investments December 31, 2010
Showing Percentage of Net Assets
Common Stocks - 99.8% |
| Shares | | Value |
ELECTRIC UTILITIES - 47.0% |
Electric Utilities - 47.0% |
EDF SA | 14,100 | | $ 578,653 |
Edison International | 79,025 | | 3,050,365 |
ITC Holdings Corp. | 32,015 | | 1,984,290 |
NextEra Energy, Inc. | 95,205 | | 4,949,708 |
NV Energy, Inc. | 177,688 | | 2,496,516 |
Pinnacle West Capital Corp. | 19,188 | | 795,343 |
PPL Corp. | 119,212 | | 3,137,660 |
Southern Co. | 57,727 | | 2,206,903 |
| | 19,199,438 |
GAS UTILITIES - 9.5% |
Gas Utilities - 9.5% |
National Fuel Gas Co. New Jersey | 28,907 | | 1,896,877 |
ONEOK, Inc. | 36,174 | | 2,006,572 |
| | 3,903,449 |
INDEPENDENT POWER PRODUCERS & ENERGY TRADERS - 8.7% |
Independent Power Producers & Energy Traders - 8.7% |
AES Corp. (a) | 118,845 | | 1,447,532 |
Constellation Energy Group, Inc. | 33,348 | | 1,021,449 |
GenOn Energy, Inc. (a) | 183,549 | | 699,322 |
International Power PLC | 60,552 | | 413,402 |
| | 3,581,705 |
MULTI-UTILITIES - 30.7% |
Multi-Utilities - 30.7% |
CenterPoint Energy, Inc. | 72,791 | | 1,144,275 |
National Grid PLC | 92,605 | | 800,951 |
NiSource, Inc. | 83,039 | | 1,463,147 |
OGE Energy Corp. | 17,310 | | 788,297 |
PG&E Corp. | 33,456 | | 1,600,535 |
Public Service Enterprise Group, Inc. | 49,788 | | 1,583,756 |
Sempra Energy | 59,228 | | 3,108,285 |
TECO Energy, Inc. | 23,400 | | 416,520 |
Veolia Environnement | 28,100 | | 822,951 |
Veolia Environnement sponsored ADR (d) | 27,507 | | 807,606 |
| | 12,536,323 |
|
| Shares | | Value |
OIL, GAS & CONSUMABLE FUELS - 3.9% |
Oil & Gas Exploration & Production - 2.3% |
Canacol Energy Ltd. (a) | 100,700 | | $ 158,527 |
Pacific Rubiales Energy Corp. | 22,700 | | 768,199 |
| | 926,726 |
Oil & Gas Storage & Transport - 1.6% |
SemGroup Corp. Class A (a) | 9,200 | | 249,964 |
Williams Companies, Inc. | 17,045 | | 421,352 |
| | 671,316 |
TOTAL OIL, GAS & CONSUMABLE FUELS | | 1,598,042 |
TOTAL COMMON STOCKS (Cost $38,078,246) | 40,818,957 |
Money Market Funds - 2.0% |
| | | |
Fidelity Securities Lending Cash Central Fund, 0.21% (b)(c)
(Cost $816,750) | 816,750 | | 816,750 |
TOTAL INVESTMENT PORTFOLIO - 101.8% (Cost $38,894,996) | | 41,635,707 |
NET OTHER ASSETS (LIABILITIES) - (1.8)% | | (753,933) |
NET ASSETS - 100% | $ 40,881,774 |
Legend |
(a) Non-income producing |
(b) Affiliated fund that is available only to investment companies and other accounts managed by Fidelity Investments. The rate quoted is the annualized seven-day yield of the fund at period end. A complete unaudited listing of the fund's holdings as of its most recent quarter end is available upon request. In addition, each Fidelity Central Fund's financial statements, which are not covered by the Fund's Report of Independent Registered Public Accounting Firm, are available on the SEC's website or upon request. |
(c) Investment made with cash collateral received from securities on loan. |
(d) Security or a portion of the security is on loan at period end. |
Affiliated Central Funds |
Information regarding fiscal year to date income earned by the Fund from investments in Fidelity Central Funds is as follows: |
Fund | Income earned |
Fidelity Cash Central Fund | $ 658 |
Fidelity Securities Lending Cash Central Fund | 2,378 |
Total | $ 3,036 |
Other Information |
The following is a summary of the inputs used, as of December 31, 2010, involving the Fund's assets and liabilities carried at fair value. The inputs or methodology used for valuing securities may not be an indication of the risk associated with investing in those securities. For more information on valuation inputs, please refer to the Security Valuation section in the accompanying Notes to Financial Statements. |
Valuation Inputs at Reporting Date: |
Description | Total | Level 1 | Level 2 | Level 3 |
Investments in Securities: | | | | |
Common Stocks | $ 40,818,957 | $ 39,195,055 | $ 1,623,902 | $ - |
Money Market Funds | 816,750 | 816,750 | - | - |
Total Investments in Securities: | $ 41,635,707 | $ 40,011,805 | $ 1,623,902 | $ - |
Distribution of investments by country of issue, as a percentage of total net assets, is as follows: (Unaudited) |
United States of America | 89.3% |
France | 5.4% |
United Kingdom | 3.0% |
Canada | 2.3% |
| 100.0% |
Income Tax Information |
At December 31, 2010, the Fund had a capital loss carryforward of approximately $10,726,953 of which $928,081 and $9,798,872 will expire in fiscal 2016 and 2017, respectively. Capital loss carryforwards are only available to offset future capital gains of the Fund to the extent provided by regulations and may be limited. |
See accompanying notes which are an integral part of the financial statements.
Annual Report
Statement of Assets and Liabilities
| December 31, 2010 |
| | |
Assets | | |
Investment in securities, at value (including securities loaned of $792,720) - See accompanying schedule: Unaffiliated issuers (cost $38,078,246) | $ 40,818,957 | |
Fidelity Central Funds (cost $816,750) | 816,750 | |
Total Investments (cost $38,894,996) | | $ 41,635,707 |
Receivable for investments sold | | 1,659,941 |
Receivable for fund shares sold | | 9,139 |
Dividends receivable | | 144,066 |
Distributions receivable from Fidelity Central Funds | | 1,013 |
Prepaid expenses | | 118 |
Other receivables | | 2,865 |
Total assets | | 43,452,849 |
| | |
Liabilities | | |
Payable to custodian bank | $ 102,267 | |
Payable for investments purchased | 1,548,066 | |
Payable for fund shares redeemed | 48,114 | |
Accrued management fee | 18,849 | |
Other affiliated payables | 4,890 | |
Other payables and accrued expenses | 32,139 | |
Collateral on securities loaned, at value | 816,750 | |
Total liabilities | | 2,571,075 |
| | |
Net Assets | | $ 40,881,774 |
Net Assets consist of: | | |
Paid in capital | | $ 49,506,645 |
Distributions in excess of net investment income | | (1,826) |
Accumulated undistributed net realized gain (loss) on investments and foreign currency transactions | | (11,364,002) |
Net unrealized appreciation (depreciation) on investments and assets and liabilities in foreign currencies | | 2,740,957 |
Net Assets | | $ 40,881,774 |
Statement of Assets and Liabilities - continued
| December 31, 2010 |
Initial Class:
Net Asset Value, offering price and redemption price per share ($21,141,641 ÷ 2,148,660 shares) | | $ 9.84 |
| | |
Investor Class:
Net Asset Value, offering price and redemption price per share ($19,740,133 ÷ 2,013,573 shares) | | $ 9.80 |
See accompanying notes which are an integral part of the financial statements.
Annual Report
Statement of Operations
| Year ended December 31, 2010 |
| | |
Investment Income | | |
Dividends | | $ 1,341,863 |
Interest | | 3 |
Income from Fidelity Central Funds | | 3,036 |
Total income | | 1,344,902 |
| | |
Expenses | | |
Management fee | $ 213,118 | |
Transfer agent fees | 49,144 | |
Accounting and security lending fees | 15,097 | |
Custodian fees and expenses | 12,316 | |
Independent trustees' compensation | 216 | |
Audit | 36,821 | |
Legal | 162 | |
Miscellaneous | 489 | |
Total expenses before reductions | 327,363 | |
Expense reductions | (16,000) | 311,363 |
Net investment income (loss) | | 1,033,539 |
Realized and Unrealized Gain (Loss) Net realized gain (loss) on: | | |
Investment securities: | | |
Unaffiliated issuers | 3,596,807 | |
Foreign currency transactions | (10,790) | |
Total net realized gain (loss) | | 3,586,017 |
Change in net unrealized appreciation (depreciation) on: Investment securities | (708,361) | |
Assets and liabilities in foreign currencies | 246 | |
Total change in net unrealized appreciation (depreciation) | | (708,115) |
Net gain (loss) | | 2,877,902 |
Net increase (decrease) in net assets resulting from operations | | $ 3,911,441 |
Statement of Changes in Net Assets
| Year ended December 31, 2010 | Year ended December 31, 2009 |
Increase (Decrease) in Net Assets | | |
Operations | | |
Net investment income (loss) | $ 1,033,539 | $ 1,252,249 |
Net realized gain (loss) | 3,586,017 | (6,869,922) |
Change in net unrealized appreciation (depreciation) | (708,115) | 10,129,353 |
Net increase (decrease) in net assets resulting from operations | 3,911,441 | 4,511,680 |
Distributions to shareholders from net investment income | (1,110,975) | (1,275,840) |
Share transactions - net increase (decrease) | (2,560,920) | (12,914,534) |
Redemption fees | 31,911 | 10,970 |
Total increase (decrease) in net assets | 271,457 | (9,667,724) |
| | |
Net Assets | | |
Beginning of period | 40,610,317 | 50,278,041 |
End of period (including distributions in excess of net investment income of $1,826 and undistributed net investment income of $0, respectively) | $ 40,881,774 | $ 40,610,317 |
See accompanying notes which are an integral part of the financial statements.
Annual Report
Financial Highlights - Initial Class
Years ended December 31, | 2010 | 2009 | 2008 | 2007 | 2006 |
Selected Per-Share Data | | | | | |
Net asset value, beginning of period | $ 9.10 | $ 8.14 | $ 13.09 | $ 11.29 | $ 9.53 |
Income from Investment Operations | | | | | |
Net investment income (loss) C | .26 | .25 | .20 | .21 | .24 |
Net realized and unrealized gain (loss) | .75 | 1.01 | (4.86) | 2.12 | 2.76 |
Total from investment operations | 1.01 | 1.26 | (4.66) | 2.33 | 3.00 |
Distributions from net investment income | (.28) | (.30) | (.26) | (.25) | (.14) |
Distributions from net realized gain | - | - | (.03) | (.29) | (1.10) |
Total distributions | (.28) | (.30) | (.29) | (.54) | (1.24) F |
Redemption fees added to paid in capital C | .01 | - H | - H | .01 | - H |
Net asset value, end of period | $ 9.84 | $ 9.10 | $ 8.14 | $ 13.09 | $ 11.29 |
Total Return A, B | 11.20% | 15.42% | (35.61)% | 20.67% | 31.79% |
Ratios to Average Net Assets D, G | | | | | |
Expenses before reductions | .82% | .81% | .75% | .73% | .81% |
Expenses net of fee waivers, if any | .81% | .81% | .75% | .73% | .81% |
Expenses net of all reductions | .78% | .79% | .74% | .73% | .80% |
Net investment income (loss) | 2.75% | 3.13% | 1.81% | 1.65% | 2.20% |
Supplemental Data | | | | | |
Net assets, end of period (000 omitted) | $ 21,142 | $ 24,159 | $ 31,760 | $ 84,105 | $ 77,153 |
Portfolio turnover rate E | 249% | 219% | 112% | 90% | 139% |
A Total returns do not reflect charges attributable to your insurance company's separate account. Inclusion of these charges would reduce the total returns shown.
B Total returns would have been lower had certain expenses not been reduced during the periods shown.
C Calculated based on average shares outstanding during the period.
D Fees and expenses of the underlying Fidelity Central Funds are not included in the Fund's expense ratio. The Fund indirectly bears its proportionate share of the expenses of any underlying Fidelity Central Funds.
E Amount does not include the portfolio activity of any underlying Fidelity Central Funds.
F Total distributions of $1.24 per share is comprised of distributions from net investment income of $.139 and distributions from net realized gain of $1.105 per share.
G Expense ratios reflect operating expenses of the class. Expenses before reductions do not reflect amounts reimbursed by the investment adviser or reductions from brokerage service arrangements or reductions from other expense offset arrangements and do not represent the amount paid by the class during periods when reimbursements or reductions occur. Expenses net of fee waivers reflect expenses after reimbursement by the investment adviser but prior to reductions from brokerage service arrangements or other expense offset arrangements. Expenses net of all reductions represent the net expenses paid by the class.
H Amount represents less than $.01 per share.
Financial Highlights - Investor Class
Years ended December 31, | 2010 | 2009 | 2008 | 2007 | 2006 |
Selected Per-Share Data | | | | | |
Net asset value, beginning of period | $ 9.07 | $ 8.12 | $ 13.05 | $ 11.26 | $ 9.52 |
Income from Investment Operations | | | | | |
Net investment income (loss) C | .25 | .25 | .19 | .19 | .23 |
Net realized and unrealized gain (loss) | .74 | .99 | (4.84) | 2.12 | 2.75 |
Total from investment operations | .99 | 1.24 | (4.65) | 2.31 | 2.98 |
Distributions from net investment income | (.27) | (.29) | (.25) | (.24) | (.13) |
Distributions from net realized gain | - | - | (.03) | (.29) | (1.10) |
Total distributions | (.27) | (.29) | (.28) | (.53) | (1.24) F |
Redemption fees added to paid in capital C | .01 | - H | - H | .01 | - H |
Net asset value, end of period | $ 9.80 | $ 9.07 | $ 8.12 | $ 13.05 | $ 11.26 |
Total Return A, B | 11.04% | 15.24% | (35.65)% | 20.53% | 31.56% |
Ratios to Average Net Assets D, G | | | | | |
Expenses before reductions | .91% | .92% | .84% | .84% | .96% |
Expenses net of fee waivers, if any | .90% | .92% | .84% | .84% | .96% |
Expenses net of all reductions | .87% | .90% | .84% | .84% | .96% |
Net investment income (loss) | 2.66% | 3.02% | 1.72% | 1.53% | 2.04% |
Supplemental Data | | | | | |
Net assets, end of period (000 omitted) | $ 19,740 | $ 16,452 | $ 18,518 | $ 42,196 | $ 18,889 |
Portfolio turnover rate E | 249% | 219% | 112% | 90% | 139% |
A Total returns do not reflect charges attributable to your insurance company's separate account. Inclusion of these charges would reduce the total returns shown.
B Total returns would have been lower had certain expenses not been reduced during the periods shown.
C Calculated based on average shares outstanding during the period.
D Fees and expenses of the underlying Fidelity Central Funds are not included in the Fund's expense ratio. The Fund indirectly bears its proportionate share of the expenses of any underlying Fidelity Central Funds.
E Amount does not include the portfolio activity of any underlying Fidelity Central Funds.
F Total distributions of $1.24 per share is comprised of distributions from net investment income of $.134 and distributions from net realized gain of $1.105 per share.
G Expense ratios reflect operating expenses of the class. Expenses before reductions do not reflect amounts reimbursed by the investment adviser or reductions from brokerage service arrangements or reductions from other expense offset arrangements and do not represent the amount paid by the class during periods when reimbursements or reductions occur. Expenses net of fee waivers reflect expenses after reimbursement by the investment adviser but prior to reductions from brokerage service arrangements or other expense offset arrangements. Expenses net of all reductions represent the net expenses paid by the class.
H Amount represents less than $.01 per share.
See accompanying notes which are an integral part of the financial statements.
Annual Report
Notes to Financial Statements
For the period ended December 31, 2010
1. Organization.
VIP Utilities Portfolio (the Fund) is a non-diversified fund of Variable Insurance Products Fund IV (the Trust) and is authorized to issue an unlimited number of shares. The Trust is registered under the Investment Company Act of 1940, as amended (the 1940 Act), as an open-end management investment company organized as a Massachusetts business trust. Shares of the Fund may only be purchased by insurance companies for the purpose of funding variable annuity or variable life insurance contracts. The Fund offers the following classes of shares: Initial Class shares and Investor Class shares. All classes have equal rights and voting privileges, except for matters affecting a single class. Investment income, realized and unrealized capital gains and losses, the common expenses of the Fund, and certain fund-level expense reductions, if any, are allocated on a pro-rata basis to each class based on the relative net assets of each class to the total net assets of the Fund. Each class differs with respect to transfer agent fees incurred. Certain expense reductions may also differ by class.
2. Investments in Fidelity Central Funds.
The Fund may invest in Fidelity Central Funds, which are open-end investment companies available only to other investment companies and accounts managed by Fidelity Management & Research Company (FMR) and its affiliates. The Fund's Schedule of Investments lists each of the Fidelity Central Funds held as of period end, if any, as an investment of the Fund, but does not include the underlying holdings of each Fidelity Central Fund. As an Investing Fund, the Fund indirectly bears its proportionate share of the expenses of the underlying Fidelity Central Funds.
The Money Market Central Funds seek preservation of capital and current income and are managed by Fidelity Investments Money Management, Inc. (FIMM), an affiliate of FMR.
A complete unaudited list of holdings for each Fidelity Central Fund is available upon request or at the Securities and Exchange Commission (the SEC) web site at www.sec.gov. In addition, the financial statements of the Fidelity Central Funds, which are not covered by the Fund's Report of Independent Registered Public Accounting Firm, are available on the SEC web site or upon request.
3. Significant Accounting Policies.
The financial statements have been prepared in conformity with accounting principles generally accepted in the United States of America (GAAP), which require management to make certain estimates and assumptions at the date of the financial statements. Actual results could differ from those estimates. Subsequent events, if any, through the date that the financial statements were issued have been evaluated in the preparation of the financial statements. The following summarizes the significant accounting policies of the Fund:
Security Valuation. Investments are valued as of 4:00 p.m. Eastern time on the last calendar day of the period. The Fund uses independent pricing services approved by the Board of Trustees to value its investments. When current market prices or quotations are not readily available or reliable, valuations may be determined in good faith in accordance with procedures adopted by the Board of Trustees. Factors used in determining value may include market or security specific events. The frequency with which these procedures are used cannot be predicted and they may be utilized to a significant extent. The value used for net asset value (NAV) calculation under these procedures may differ from published prices for the same securities.
The Fund categorizes the inputs to valuation techniques used to value its investments into a disclosure hierarchy consisting of three levels as shown below.
Level 1 - quoted prices in active markets for identical investments
Level 2 - other significant observable inputs (including quoted prices for similar investments, interest rates, prepayment speeds, etc.)
Level 3 - unobservable inputs (including the Fund's own assumptions based on the best information available)
Changes in valuation techniques may result in transfers in or out of an assigned level within the disclosure hierarchy. The aggregate value of investments by input level, as of December 31, 2010, is included at the end of the Fund's Schedule of Investments. Valuation techniques used to value the Fund's investments by major category are as follows.
Equity securities, including restricted securities, for which market quotations are readily available, are valued at the last reported sale price or official closing price as reported by an independent pricing service on the primary market or exchange on which they are traded and are categorized as Level 1 in the hierarchy. In the event there were no sales during the day or closing prices are not available, securities are valued at the last quoted bid price or may be valued using the last available price and are generally categorized as Level 2 in the hierarchy. For foreign equity securities, when significant market or security specific events arise, comparisons to the valuation of American Depositary Receipts (ADRs), futures contracts, Exchange-traded funds (ETFs) and certain indexes as well as quoted prices for similar securities are used and are categorized as Level 2 in the hierarchy in these circumstances. Utilizing these techniques may result in transfers between Level 1 and Level 2. For restricted equity securities and private placements where observable inputs are limited, assumptions about market activity and risk are used and are categorized as Level 3 in the hierarchy.
Investments in open-end mutual funds, including the Fidelity Central Funds, are valued at their closing net asset value each business day and are categorized as Level 1 in the hierarchy.
Annual Report
3. Significant Accounting Policies - continued
Foreign Currency. The Fund uses foreign currency contracts to facilitate transactions in foreign-denominated securities. Gains and losses from these transactions may arise from changes in the value of the foreign currency or if the counterparties do not perform under the contracts' terms.
Foreign-denominated assets, including investment securities, and liabilities are translated into U.S. dollars at the exchange rate at period end. Purchases and sales of investment securities, income and dividends received and expenses denominated in foreign currencies are translated into U.S. dollars at the exchange rate in effect on the transaction date.
The effects of exchange rate fluctuations on investments are included with the net realized and unrealized gain (loss) on investment securities. Other foreign currency transactions resulting in realized and unrealized gain (loss) are disclosed separately.
Investment Transactions and Income. For financial reporting purposes, the Fund's investment holdings and NAV include trades executed through the end of the last business day of the period. The NAV per share for processing shareholder transactions is calculated as of the close of business of the New York Stock Exchange (NYSE), normally 4:00 p.m. Eastern time and includes trades executed through the end of the prior business day. Gains and losses on securities sold are determined on the basis of identified cost and may include proceeds received from litigation. Dividend income is recorded on the ex-dividend date, except for certain dividends from foreign securities where the ex-dividend date may have passed, which are recorded as soon as the Fund is informed of the ex-dividend date. Non-cash dividends included in dividend income, if any, are recorded at the fair market value of the securities received. Distributions received on securities that represent a return of capital or capital gain are recorded as a reduction of cost of investments and/or as a realized gain. The Fund estimates the components of distributions received that may be considered return of capital distributions or capital gain distributions. Interest income and distributions from the Fidelity Central Funds are accrued as earned. Interest income includes coupon interest and amortization of premium and accretion of discount on debt securities. Investment income is recorded net of foreign taxes withheld where recovery of such taxes is uncertain.
Expenses. Expenses directly attributable to a fund are charged to that fund. Expenses attributable to more than one fund are allocated among the respective funds on the basis of relative net assets or other appropriate methods. Expense estimates are accrued in the period to which they relate and adjustments are made when actual amounts are known.
Income Tax Information and Distributions to Shareholders. Each year the Fund intends to qualify as a regulated investment company, including distributing substantially all of its taxable income and realized gains under Subchapter M of the Internal Revenue Code and filing its U.S. federal tax return. As a result, no provision for income taxes is required. As of December 31, 2010, the Fund did not have any unrecognized tax benefits in the accompanying financial statements. A fund's federal tax return is subject to examination by the Internal Revenue Service (IRS) for a period of three years. Foreign taxes are provided for based on the Fund's understanding of the tax rules and rates that exist in the foreign markets in which it invests.
Distributions are declared and recorded on the ex-dividend date. Income dividends and capital gain distributions are declared separately for each class. Income and capital gain distributions are determined in accordance with income tax regulations, which may differ from GAAP.
Capital accounts within the financial statements are adjusted for permanent book-tax differences. These adjustments have no impact on net assets or the results of operations. Temporary book-tax differences will reverse in a subsequent period.
Book-tax differences are primarily due to foreign currency transactions, capital loss carryforwards and losses deferred due to wash sales and excise tax regulations.
The federal tax cost of investment securities and unrealized appreciation (depreciation) as of period end were as follows:
Gross unrealized appreciation | $ 2,763,439 |
Gross unrealized depreciation | (659,777) |
Net unrealized appreciation (depreciation) | $ 2,103,662 |
| |
Tax Cost | $ 39,532,045 |
The tax-based components of distributable earnings as of period end were as follows:
Capital loss carryforward | $ (10,726,953) |
Net unrealized appreciation (depreciation) | $ 2,103,909 |
The tax character of distributions paid was as follows:
| December 31, 2010 | December 31, 2009 |
Ordinary Income | $ 1,110,975 | $ 1,275,840 |
Annual Report
Notes to Financial Statements - continued
3. Significant Accounting Policies - continued
Trading (Redemption) Fees. Shares held by investors less than 60 days are subject to a redemption fee equal to 1% of the net asset value of shares redeemed. All redemption fees, which reduce the proceeds of the shareholder redemption, are retained by the Fund and accounted for as an addition to paid in capital.
4. Purchases and Sales of Investments.
Purchases and sales of securities, other than short-term securities, aggregated $93,557,043 and $96,170,885, respectively.
5. Fees and Other Transactions with Affiliates.
Management Fee. FMR and its affiliates provide the Fund with investment management related services for which the Fund pays a monthly management fee. The management fee is the sum of an individual fund fee rate that is based on an annual rate of .30% of the Fund's average net assets and a group fee rate that averaged .26% during the period. The group fee rate is based upon the average net assets of all the mutual funds advised by FMR. The group fee rate decreases as assets under management increase and increases as assets under management decrease. For the period, the total annual management fee rate was .56% of the Fund's average net assets.
Transfer Agent Fees. Fidelity Investments Institutional Operations Company, Inc. (FIIOC), an affiliate of FMR, is the Fund's transfer, dividend disbursing, and shareholder servicing agent. FIIOC receives an asset-based fee with respect to each class. Each class (with the exception of Investor Class) pays a transfer agent fee, excluding out of pocket expenses, equal to an annual rate of .07% of average net assets. Investor Class pays a monthly asset-based transfer agent fee of .15% of average net assets. In addition, FIIOC receives an asset-based fee of .01% of average net assets for typesetting, printing and mailing of shareholder reports, except proxy statements. FIIOC has agreed to voluntarily waive this fee until December 31, 2010. (See Note 8: Expense Reductions.) For the period, transfer agent fees for each class, including printing and out of pocket expenses, were as follows:
Initial Class | $ 19,166 |
Investor Class | 29,978 |
| $ 49,144 |
Accounting and Security Lending Fees. Fidelity Service Company, Inc. (FSC), an affiliate of FMR, maintains the Fund's accounting records. The accounting fee is based on the level of average net assets for the month. Under a separate contract, FSC administers the security lending program. The security lending fee is based on the number and duration of lending transactions.
Brokerage Commissions. The Fund placed a portion of its portfolio transactions with brokerage firms which are affiliates of the investment adviser. The commissions paid to these affiliated firms were $2,198 for the period.
6. Committed Line of Credit.
The Fund participates with other funds managed by FMR or an affiliate in a $3.75 billion credit facility (the "line of credit") to be utilized for temporary or emergency purposes to fund shareholder redemptions or for other short-term liquidity purposes. The Fund has agreed to pay commitment fees on its pro-rata portion of the line of credit, which amounted to $149 and is reflected in Miscellaneous expenses on the Statement of Operations. During the period, there were no borrowings on this line of credit.
7. Security Lending.
The Fund lends portfolio securities through a lending agent from time to time in order to earn additional income. The lending agent may loan securities to certain qualified borrowers, including Fidelity Capital Markets (FCM), a broker-dealer affiliated with the Fund. On the settlement date of the loan, the Fund receives collateral (in the form of U.S. Treasury obligations, letters of credit and/or cash) against the loaned securities and maintains collateral in an amount not less than 100% of the market value of the loaned securities during the period of the loan. The market value of the loaned securities is determined at the close of business of the Fund and any additional required collateral is delivered to the Fund on the next business day. If the borrower defaults on its obligation to return the securities loaned because of insolvency or other reasons, a fund could experience delays and costs in recovering the securities loaned or in gaining access to the collateral. Any cash collateral received is invested in the Fidelity Securities Lending Cash Central Fund. The value of loaned securities and cash collateral at period end are disclosed on the Fund's Statement of Assets and Liabilities. Security lending income represents the income earned on investing cash collateral, less rebates paid to borrowers and lending agent fees associated with the loan, plus any premium payments received for lending certain types of securities. Security lending income is presented in the Statement of Operations as a component of income from Fidelity Central Funds. Total security lending income during the period amounted to $2,378. During the period, there were no securities loaned to FCM.
Annual Report
8. Expense Reductions.
FMR or its affiliates agreed to waive certain fees during the period as noted in the table below:
Initial Class | $ 1,540 |
Investor Class | 1,225 |
| $ 2,765 |
Many of the brokers with whom FMR places trades on behalf of the Fund provided services to the Fund in addition to trade execution. These services included payments of certain expenses on behalf of the Fund totaling $13,235 for the period
9. Distributions to Shareholders.
Distributions to shareholders of each class were as follows:
Years ended December 31, | 2010 | 2009 |
From net investment income | | |
Initial Class | $ 585,861 | $ 770,027 |
Investor Class | 525,114 | 505,813 |
Total | $ 1,110,975 | $ 1,275,840 |
10. Share Transactions.
Transactions for each class of shares were as follows:
| Shares | Dollars |
Years ended December 31, | 2010 | 2009 | 2010 | 2009 |
Initial Class | | | | |
Shares sold | 227,625 | 189,678 | $ 2,170,873 | $ 1,639,700 |
Reinvestment of distributions | 60,212 | 84,064 | 585,861 | 770,027 |
Shares redeemed | (794,278) | (1,518,047) | (7,319,333) | (12,048,930) |
Net increase (decrease) | (506,441) | (1,244,305) | $ (4,562,599) | $ (9,639,203) |
Investor Class | | | | |
Shares sold | 896,575 | 430,537 | $ 8,491,867 | $ 3,722,045 |
Reinvestment of distributions | 54,135 | 55,401 | 525,114 | 505,813 |
Shares redeemed | (751,317) | (952,381) | (7,015,302) | (7,503,189) |
Net increase (decrease) | 199,393 | (466,443) | $ 2,001,679 | $ (3,275,331) |
11. Other.
The Fund's organizational documents provide former and current trustees and officers with a limited indemnification against liabilities arising in connection with the performance of their duties to the Fund. In the normal course of business, the Fund may also enter into contracts that provide general indemnifications. The Fund's maximum exposure under these arrangements is unknown as this would be dependent on future claims that may be made against the Fund. The risk of material loss from such claims is considered remote.
At the end of the period, FMR or its affiliates were the owners of record of 100% of the total outstanding shares of the Fund.
Annual Report
Report of Independent Registered Public Accounting Firm
To the Trustees of Variable Insurance Products Fund IV and the Shareholders of VIP Utilities Portfolio:
In our opinion, the accompanying statement of assets and liabilities, including the schedule of investments, and the related statements of operations and of changes in net assets and the financial highlights present fairly, in all material respects, the financial position of VIP Utilities Portfolio (a fund of Variable Insurance Products Fund IV) at December 31, 2010, the results of its operations for the year then ended, the changes in its net assets for each of the two years in the period then ended and the financial highlights for each of the five years in the period then ended, in conformity with accounting principles generally accepted in the United States of America. These financial statements and financial highlights (hereafter referred to as "financial statements") are the responsibility of the VIP Utilities Portfolio's management. Our responsibility is to express an opinion on these financial statements based on our audits. We conducted our audits of these financial statements in accordance with the standards of the Public Company Accounting Oversight Board (United States). Those standards require that we plan and perform the audit to obtain reasonable assurance about whether the financial statements are free of material misstatement. An audit includes examining, on a test basis, evidence supporting the amounts and disclosures in the financial statements, assessing the accounting principles used and significant estimates made by management, and evaluating the overall financial statement presentation. We believe that our audits, which included confirmation of securities at December 31, 2010 by correspondence with the custodian and brokers, provide a reasonable basis for our opinion.
/s/ PricewaterhouseCoopers LLP
PricewaterhouseCoopers LLP
Boston, Massachusetts
February 17, 2011
Annual Report
The Trustees, Members of the Advisory Board, and executive officers of the trust and fund, as applicable, are listed below. The Board of Trustees governs the fund and is responsible for protecting the interests of shareholders. The Trustees are experienced executives who meet periodically throughout the year to oversee the fund's activities, review contractual arrangements with companies that provide services to the fund, oversee management of the risks associated with such activities and contractual arrangements, and review the fund's performance. Except for James C. Curvey, each of the Trustees oversees 219 funds advised by FMR or an affiliate. Mr. Curvey oversees 408 funds advised by FMR or an affiliate.
The Trustees hold office without limit in time except that (a) any Trustee may resign; (b) any Trustee may be removed by written instrument, signed by at least two-thirds of the number of Trustees prior to such removal; (c) any Trustee who requests to be retired or who has become incapacitated by illness or injury may be retired by written instrument signed by a majority of the other Trustees; and (d) any Trustee may be removed at any special meeting of shareholders by a two-thirds vote of the outstanding voting securities of the trust. Each Trustee who is not an interested person (as defined in the 1940 Act) (Independent Trustee), shall retire not later than the last day of the calendar year in which his or her 72nd birthday occurs. The Independent Trustees may waive this mandatory retirement age policy with respect to individual Trustees. The executive officers and Advisory Board Members hold office without limit in time, except that any officer and Advisory Board Member may resign or may be removed by a vote of a majority of the Trustees at any regular meeting or any special meeting of the Trustees. Except as indicated, each individual has held the office shown or other offices in the same company for the past five years.
Experience, Skills, Attributes, and Qualifications of the Fund's Trustees. The Governance and Nominating Committee has adopted a statement of policy that describes the experience, qualifications, attributes, and skills that are necessary and desirable for potential Independent Trustee candidates (Statement of Policy). The Board believes that each Trustee satisfied at the time he or she was initially elected or appointed a Trustee, and continues to satisfy, the standards contemplated by the Statement of Policy. The Governance and Nominating Committee also engages professional search firms to help identify potential Independent Trustee candidates who have the experience, qualifications, attributes, and skills consistent with the Statement of Policy. From time to time, additional criteria based on the composition and skills of the current Independent Trustees, as well as experience or skills that may be appropriate in light of future changes to board composition, business conditions, and regulatory or other developments, have also been considered by the professional search firms and the Governance and Nominating Committee. In addition, the Board takes into account the Trustees' commitment and participation in Board and committee meetings, as well as their leadership of standing and ad hoc committees throughout their tenure.
In determining that a particular Trustee was and continues to be qualified to serve as a Trustee, the Board has considered a variety of criteria, none of which, in isolation, was controlling. The Board believes that, collectively, the Trustees have balanced and diverse experience, qualifications, attributes, and skills, which allow the Board to operate effectively in governing the fund and protecting the interests of shareholders. Information about the specific experience, skills, attributes, and qualifications of each Trustee, which in each case led to the Board's conclusion that the Trustee should serve (or continue to serve) as a trustee of the fund, is provided below.
Board Structure and Oversight Function. James C. Curvey is an interested person (as defined in the 1940 Act) and currently serves as Acting Chairman. The Trustees have determined that an interested Chairman is appropriate and benefits shareholders because an interested Chairman has a personal and professional stake in the quality and continuity of services provided to the fund. Independent Trustees exercise their informed business judgment to appoint an individual of their choosing to serve as Chairman, regardless of whether the Trustee happens to be independent or a member of management. The Independent Trustees have determined that they can act independently and effectively without having an Independent Trustee serve as Chairman and that a key structural component for assuring that they are in a position to do so is for the Independent Trustees to constitute a substantial majority for the Board. The Independent Trustees also regularly meet in executive session. Ned C. Lautenbach serves as Chairman of the Independent Trustees and as such (i) acts as a liaison between the Independent Trustees and management with respect to matters important to the Independent Trustees and (ii) with management prepares agendas for Board meetings.
Fidelity funds are overseen by different Boards of Trustees. The fund's Board oversees Fidelity's equity and high income funds and another Board oversees Fidelity's investment-grade bond, money market, and asset allocation funds. The asset allocation funds may invest in Fidelity funds overseen by the fund's Board. The use of separate Boards, each with its own committee structure, allows the Trustees of each group of Fidelity funds to focus on the unique issues of the funds they oversee, including common research, investment, and operational issues. On occasion, the separate Boards establish joint committees to address issues of overlapping consequences for the Fidelity funds overseen by each Board.
The Trustees operate using a system of committees to facilitate the timely and efficient consideration of all matters of importance to the Trustees, the fund, and fund shareholders and to facilitate compliance with legal and regulatory requirements and oversight of the fund's activities and associated risks. The Board, acting through its committees, has charged FMR and its affiliates with (i) identifying events or circumstances the occurrence of which could have demonstrably adverse effects on the fund's business and/or reputation; (ii) implementing processes and controls to lessen the possibility that such events or circumstances occur or to mitigate the effects of such events or circumstances if they do occur; and (iii) creating and maintaining a system designed to evaluate continuously business and market conditions in order to facilitate the identification and implementation processes described in (i) and (ii) above. Because the day-to-day operations and activities of the fund are carried out by or through FMR, its affiliates and other service providers, the fund's exposure to risks is mitigated but not eliminated by the processes overseen by the Trustees. While each of the Board's committees has responsibility for overseeing different aspects of the fund's activities, oversight is exercised primarily through the Operations, Audit, and Compliance Committees. Appropriate personnel, including but not limited to the fund's Chief Compliance Officer (CCO), FMR's internal auditor, the independent accountants, the fund's Treasurer and portfolio management personnel, make periodic reports to the Board's committees, as appropriate. The responsibilities of each committee, including their oversight responsibilities, are described further under "Standing Committees of the Fund's Trustees."
Annual Report
Trustees and Officers - continued
The fund's Statement of Additional Information (SAI) includes more information about the Trustees. To request a free copy, call Fidelity at 1-877-208-0098.
Interested Trustees*:
Correspondence intended for each Trustee who is an interested person may be sent to Fidelity Investments, 82 Devonshire Street, Boston, Massachusetts 02109.
Name, Age; Principal Occupations and Other Relevant Experience+ |
James C. Curvey (75) |
| Year of Election or Appointment: 2007 Mr. Curvey is Trustee and Acting Chairman of the Board of Trustees of certain Trusts. Mr. Curvey also serves as Trustee (2007-present) of other investment companies advised by FMR. Mr. Curvey is a Director of Fidelity Investments Money Management, Inc. (2009-present), Director of Fidelity Research & Analysis Co. (2009-present) and Director of FMR and FMR Co., Inc. (2007-present). Mr. Curvey is also Vice Chairman (2007-present) and Director of FMR LLC. In addition, Mr. Curvey serves as an Overseer for the Boston Symphony Orchestra and a member of the Trustees of Villanova University. Previously, Mr. Curvey was the Vice Chairman (2006-2007) and Director (2000-2007) of FMR Corp. |
Ronald P. O'Hanley (54) |
| Year of Election or Appointment: 2011 Mr. O'Hanley is President of Fidelity Asset Management and Corporate Services and a member of Fidelity's Executive Committee (2010-present). Previously, Mr. O'Hanley served as President and Chief Executive Officer of BNY Mellon Asset Management (2007-2010). Mr. O'Hanley also served as Vice Chairman of Bank New York Mellon Corp. and a member of that firm's Executive Committee. Prior to the 2007 merger of The Bank of New York and Mellon Financial Corporation, he was Vice Chairman of Mellon Financial Corporation and President and Chief Executive Officer of Mellon Asset Management. He joined Mellon in February 1997. Mr. O'Hanley currently serves as Chairman of the Boston Public Library Foundation Board of Directors and sits on the Board of Directors of Beth Israel Deaconess Medical Center, the Board of Trustees of the Marine Biological Laboratory and the Advisory Board of the Maxwell School of Citizenship and Public Administration at Syracuse University. Mr. O'Hanley also chairs the Council on Asset Management for the Financial Services Roundtable and is a member of the Board of Directors of Institutional Investor's U.S. Institute. |
* Trustees have been determined to be "Interested Trustees" by virtue of, among other things, their affiliation with the trust or various entities under common control with FMR.
+ The information above includes each Trustee's principal occupation during the last five years and other information relating to the experience, attributes, and skills relevant to each Trustee's qualifications to serve as a Trustee, which led to the conclusion that each Trustee should serve as a Trustee for the fund.
Independent Trustees:
Correspondence intended for each Independent Trustee (that is, the Trustees other than the Interested Trustees) may be sent to Fidelity Investments, P.O. Box 55235, Boston, Massachusetts 02205-5235.
Name, Age; Principal Occupations and Other Relevant Experience+ |
Dennis J. Dirks (62) |
| Year of Election or Appointment: 2005 Prior to his retirement in May 2003, Mr. Dirks was Chief Operating Officer and a member of the Board of The Depository Trust & Clearing Corporation (DTCC). He also served as President, Chief Operating Officer, and Board member of The Depository Trust Company (DTC) and President and Board member of the National Securities Clearing Corporation (NSCC). In addition, Mr. Dirks served as Chief Executive Officer and Board member of the Government Securities Clearing Corporation, Chief Executive Officer and Board member of the Mortgage-Backed Securities Clearing Corporation, as a Trustee and a member of the Finance Committee of Manhattan College (2005-2008), and as a Trustee and a member of the Finance Committee of AHRC of Nassau County (2006-2008). Mr. Dirks is a member of the Independent Directors Council (IDC) Governing Council (2010-Present) and Board of Directors for The Brookville Center for Children's Services, Inc. (2009-present). |
Alan J. Lacy (57) |
| Year of Election or Appointment: 2008 Mr. Lacy serves as Senior Adviser (2007-present) of Oak Hill Capital Partners, L.P. (private equity). Mr. Lacy also served as Chief Executive Officer (2000-2005) and Vice Chairman (2005-2006) of Sears Holdings Corporation and Sears, Roebuck and Co. (retail). In addition, Mr. Lacy serves as a member of the Board of Directors of The Western Union Company (global money transfer, 2006-present) and Bristol-Myers Squibb Company (global pharmaceuticals, 2007-present). Mr. Lacy is Chairman (2008-present) and a member (2006-present) of the Board of Trustees of The National Parks Conservation Association. |
Ned C. Lautenbach (66) |
| Year of Election or Appointment: 2000 Mr. Lautenbach is Chairman of the Independent Trustees of the Equity and High Income Funds (2006-present). Mr. Lautenbach currently serves as the Lead Director of the Eaton Corporation Board of Directors (diversified industrial, 1997-present). Mr. Lautenbach is also a member of the Board of Directors of the Philharmonic Center for the Arts in Naples, Florida (1999-
present); a member of the Board of Trustees of Fairfield University (2005-present); and a member of the Council on Foreign Relations (1994-present). Previously, Mr. Lautenbach was a Partner/Advisory Partner at Clayton, Dubilier & Rice, Inc. (private equity investment, 1998-2010), as well as a Director of Sony Corporation (2006-2007). |
Joseph Mauriello (66) |
| Year of Election or Appointment: 2008 Prior to his retirement in January 2006, Mr. Mauriello served in numerous senior management positions including Deputy Chairman and Chief Operating Officer (2004-2005), and Vice Chairman of Financial Services (2002-2004) of KPMG LLP US (professional services, 1965-2005). Mr. Mauriello currently serves as a member of the Board of Directors of XL Group plc. (global insurance and re-insurance, 2006-present) and of Arcadia Resources Inc. (health care services and products, 2007-present). Previously, Mr. Mauriello served as a Director of the Hamilton Funds of the Bank of New York (2006-2007). |
Cornelia M. Small (66) |
| Year of Election or Appointment: 2005 Ms. Small is a member of the Board of Directors of the Teagle Foundation (2009-present). Ms. Small is also a member of the Investment Committee, and Chair (2008-present) and a member of the Board of Trustees of Smith College. In addition, Ms. Small serves on the Investment Committee of the Berkshire Taconic Community Foundation (2008-present). Previously, Ms. Small served as Chairperson of the Investment Committee (2002-2008) of Smith College. In addition, Ms. Small served as Chief Investment Officer, Director of Global Equity Investments, and a member of the Board of Directors of Scudder, Stevens & Clark and Scudder Kemper Investments. |
William S. Stavropoulos (71) |
| Year of Election or Appointment: 2001 Mr. Stavropoulos is Vice Chairman of the Independent Trustees of the Equity and High Income Funds (2006-present). Mr. Stavropoulos serves as President and Founder of the Michigan Baseball Foundation, the Great Lakes Loons (2007-present). Mr. Stavropoulos is Chairman Emeritus of the Board of Directors of The Dow Chemical Company, where he previously served in numerous senior management positions, including President, CEO (1995-2000; 2002-2004), Chairman of the Executive Committee (2000-2006), and as a member of the Board of Directors (1990-2006). Currently, Mr. Stavropoulos is Chairman of Univar (global distributor of commodity and specialty chemicals, 2010-present), a Director of Teradata Corporation (data warehousing and technology solutions, 2008-present), Chemical Financial Corporation, Maersk Inc. (industrial conglomerate), Tyco International, Inc. (multinational manufacturing and services, 2007-present), and a member of the Advisory Board for Metalmark Capital (private equity investment, 2005-present). Mr. Stavropoulos is a special advisor to Clayton, Dubilier & Rice, LLC (private equity investment). In addition, Mr. Stavropoulos is a member of the University of Notre Dame Advisory Council for the College of Science. |
David M. Thomas (61) |
| Year of Election or Appointment: 2008 Previously, Mr. Thomas served as Executive Chairman (2005-2006) and Chairman and Chief Executive Officer (2000-2005) of IMS Health, Inc. (pharmaceutical and healthcare information solutions). In addition, Mr. Thomas serves as a member of the Board of Directors of Fortune Brands, Inc. (consumer products), and Interpublic Group of Companies, Inc. (marketing communication, 2004-present). |
Michael E. Wiley (60) |
| Year of Election or Appointment: 2008 Mr. Wiley also serves as a Director of Asia Pacific Exploration Consolidated (international oil and gas exploration and production, 2008-present). Mr. Wiley serves as a Director of Tesoro Corporation (independent oil refiner and marketer, 2005-present), and a Director of Bill Barrett Corporation (exploration and production, 2005-present). In addition, Mr. Wiley also serves as a Director of Post Oak Bank (privately-held bank, 2004-present). Previously, Mr. Wiley served as a member of the Board of Trustees of the University of Tulsa (2000-2006; 2007-2010), as a Senior Energy Advisor of Katzenbach Partners, LLC (consulting, 2006-2007), as an Advisory Director of Riverstone Holdings (private investment), Chairman, President, and CEO of Baker Hughes, Inc. (oilfield services, 2000-2004), and as Director of Spinnaker Exploration Company (exploration and production, 2001-2005). |
+ The information above includes each Trustee's principal occupation during the last five years and other information relating to the experience, attributes, and skills relevant to each Trustee's qualifications to serve as a Trustee, which led to the conclusion that each Trustee should serve as a Trustee for the fund.
Advisory Board Members and Executive Officers:
Correspondence intended for each executive officer, Edward C. Johnson 3d, and Peter S. Lynch may be sent to Fidelity Investments, 82 Devonshire Street, Boston, Massachusetts 02109.
Name, Age; Principal Occupation |
Edward C. Johnson 3d (80) |
| Year of Election or Appointment: 2011 Member of the Advisory Board of Fidelity's Equity and High Income Funds. Formerly Trustee and Chairman of the Board of Trustees of certain Trusts, Mr. Johnson serves as Chief Executive Officer, Chairman, and a Director of FMR LLC; Chairman and a Director of FMR; and Chairman and a Director of FMR Co., Inc. In addition, Mr. Johnson serves as Chairman and Director of FIL Limited. Previously, Mr. Johnson served as President of FMR LLC (2006-2007). |
Peter S. Lynch (66) |
| Year of Election or Appointment: 2003 Member of the Advisory Board of Fidelity's Equity and High Income Funds. Mr. Lynch is Vice Chairman and a Director of FMR and FMR Co., Inc. In addition, Mr. Lynch serves as a Trustee of Boston College and as the Chairman of the Inner-City Scholarship Fund. Previously, Mr. Lynch served on the Special Olympics International Board of Directors (1997-2006). |
Kenneth B. Robins (41) |
| Year of Election or Appointment: 2008 President and Treasurer of Fidelity's Equity and High Income Funds. Mr. Robins also serves as President and Treasurer (2010-present) and Assistant Treasurer (2009-present) of other Fidelity funds and is an employee of Fidelity Investments (2004-present). Previously, Mr. Robins served as Deputy Treasurer of the Fidelity funds (2005-2008) and Treasurer and Chief Financial Officer of The North Carolina Capital Management Trust: Cash and Term Portfolios (2006-2008). |
Brian B. Hogan (46) |
| Year of Election or Appointment: 2009 Vice President of certain Equity Funds and Vice President of Sector Funds. Mr. Hogan also serves as President of FMR's Equity Division (2009-present). Previously, Mr. Hogan served as Senior Vice President, Equity Research of FMR (2006-2009) and as a portfolio manager. |
Christopher S. Bartel (39) |
| Year of Election or Appointment: 2009 Vice President of Fidelity's Sector and Real Estate Equity Funds. Mr. Bartel also serves as Senior Vice President of Equity Research (2009-present). Previously, Mr. Bartel served as Managing Director of Research (2006-2009) and an analyst and portfolio manager (2000-2006). |
Scott C. Goebel (42) |
| Year of Election or Appointment: 2008 Secretary and Chief Legal Officer (CLO) of the Fidelity funds. Mr. Goebel also serves as Secretary and CLO of The North Carolina Capital Management Trust: Cash and Term Portfolio (2008-present); General Counsel, Secretary, and Senior Vice President of FMR (2008-present) and FMR Co., Inc. (2008-present); Deputy General Counsel of FMR LLC; Chief Legal Officer of Fidelity Management & Research (Hong Kong) Limited (2008-present) and Assistant Secretary of Fidelity Management & Research (Japan) Inc. (2008-present), Fidelity Investments Money Management, Inc. (2008-present), Fidelity Management & Research (U.K.) Inc. (2008-present), and Fidelity Research and Analysis Company (2008-present). Previously, Mr. Goebel served as Assistant Secretary of the Funds (2007-2008) and as Vice President and Secretary of Fidelity Distributors Corporation (FDC) (2005-2007). |
William C. Coffey (41) |
| Year of Election or Appointment: 2009 Assistant Secretary of Fidelity's Equity and High Income Funds. Mr. Coffey also serves as Senior Vice President and Deputy General Counsel of FMR LLC (2010-present), and is an employee of Fidelity Investments. Previously, Mr. Coffey served as Vice President and Associate General Counsel of FMR LLC (2005-2009). |
Holly C. Laurent (56) |
| Year of Election or Appointment: 2008 Anti-Money Laundering (AML) Officer of the Fidelity funds. Ms. Laurent also serves as AML Officer of The North Carolina Capital Management Trust: Cash and Term Portfolio (2008-present) and is an employee of Fidelity Investments. Previously, Ms. Laurent was Senior Vice President and Head of Legal for Fidelity Business Services India Pvt. Ltd. (2006-2008), and Senior Vice President, Deputy General Counsel and Group Head for FMR LLC (2005-2006). |
Christine Reynolds (52) |
| Year of Election or Appointment: 2008 Chief Financial Officer of the Fidelity funds. Ms. Reynolds became President of Fidelity Pricing and Cash Management Services (FPCMS) in August 2008. Ms. Reynolds served as Chief Operating Officer of FPCMS (2007-2008). Previously, Ms. Reynolds served as President, Treasurer, and Anti-Money Laundering officer of the Fidelity funds (2004-2007). |
Kenneth A. Rathgeber (63) |
| Year of Election or Appointment: 2004 Chief Compliance Officer of Fidelity's Equity and High Income Funds. Mr. Rathgeber is Chief Compliance Officer of Fidelity Management & Research (Hong Kong) Limited (2008-present), Fidelity Management & Research (Japan) Inc. (2008-present), FMR (2005-present), FMR Co., Inc. (2005-present), Fidelity Management & Research (U.K.) Inc. (2005-present), Fidelity Research & Analysis Company (2005-present), Fidelity Investments Money Management, Inc. (2005-present), Pyramis Global Advisors, LLC (2005-present), and Strategic Advisers, Inc. (2005-present). |
Jeffrey S. Christian (49) |
| Year of Election or Appointment: 2009 Deputy Treasurer of the Fidelity funds. Mr. Christian is an employee of Fidelity Investments. Previously, Mr. Christian served as Chief Financial Officer (2008-2009) of certain Fidelity funds and Senior Vice President of Fidelity Pricing and Cash Management Services (FPCMS) (2004-2009). |
Bryan A. Mehrmann (49) |
| Year of Election or Appointment: 2005 Deputy Treasurer of the Fidelity funds. Mr. Mehrmann is an employee of Fidelity Investments. |
Adrien E. Deberghes (43) |
| Year of Election or Appointment: 2008 Deputy Treasurer of Fidelity's Equity and High Income Funds. Mr. Deberghes also serves as Assistant Treasurer of other Fidelity funds (2010-present) and is an employee of Fidelity Investments (2008-present). Previously, Mr. Deberghes served as Senior Vice President of Mutual Fund Administration at State Street Corporation (2007-2008), Senior Director of Mutual Fund Administration at Investors Bank & Trust (2005-2007), and Director of Finance for Dunkin' Brands (2000-2005). |
Stephanie J. Dorsey (41) |
| Year of Election or Appointment: 2010 Assistant Treasurer of Fidelity's Equity and High Income Funds. Ms. Dorsey also serves as Deputy Treasurer of other Fidelity funds (2008-present) and is an employee of Fidelity Investments (2008-present). Previously, Ms. Dorsey served as Treasurer (2004-2008) of the JPMorgan Mutual Funds and Vice President (2004-2008) of JPMorgan Chase Bank. |
John R. Hebble (52) |
| Year of Election or Appointment: 2009 Assistant Treasurer of Fidelity's Equity and High Income Funds. Mr. Hebble also serves as Treasurer and Chief Financial Officer of The North Carolina Capital Management Trust: Cash and Term Portfolio (2008-present), President and Treasurer of other Fidelity funds (2008-present) and is an employee of Fidelity Investments. |
Gary W. Ryan (52) |
| Year of Election or Appointment: 2005 Assistant Treasurer of the Fidelity funds. Mr. Ryan is an employee of Fidelity Investments. Previously, Mr. Ryan served as Vice President of Fund Reporting in Fidelity Pricing and Cash Management Services (FPCMS) (1999-2005). |
Jonathan Davis (42) |
| Year of Election or Appointment: 2010 Assistant Treasurer of the Fidelity funds. Mr. Davis is an employee of Fidelity Investments. Previously, Mr. Davis served as Vice President and Associate General Counsel of FMR LLC (2003-2010). |
Annual Report
Initial Class and Investor Class designate 100% of the dividends distributed in December 2010, as qualifying for the dividends-received deduction for corporate shareholders.
Annual Report
Board Approval of Investment Advisory Contracts and Management Fees
VIP Utilities Portfolio
Each year, the Board of Trustees, including the Independent Trustees (together, the Board), votes on the renewal of the management contract and sub-advisory agreements (together, the Advisory Contracts) for the fund. The Board, assisted by the advice of fund counsel and Independent Trustees' counsel, requests and considers a broad range of information relevant to the renewal of the Advisory Contracts throughout the year.
The Board meets regularly and considers at each of its meetings factors that are relevant to its annual consideration of the renewal of the fund's Advisory Contracts, including the services and support provided to the fund and its shareholders. The Board has established various standing committees, each composed of Independent Trustees with varying backgrounds, to which the Board has assigned specific subject matter responsibilities in order to enhance effective decision-making by the Board. The Board, acting directly and through its Committees, requests and receives information concerning the annual consideration of the renewal of the fund's Advisory Contracts. The Board also meets as needed to consider matters specifically related to the Board's annual consideration of the renewal of Advisory Contracts. Members of the Board may also meet with trustees of other Fidelity funds through ad hoc joint committees to discuss certain matters relevant to the Fidelity funds.
At its July 2010 meeting, the Board of Trustees, including the Independent Trustees, unanimously determined to renew the fund's Advisory Contracts. In reaching its determination, the Board considered all factors it believed relevant, including (i) the nature, extent, and quality of the services to be provided to the fund and its shareholders (including the investment performance of the fund); (ii) the competitiveness of the fund's management fee and total expenses; (iii) the total costs of the services to be provided by and the profits to be realized by Fidelity from its relationship with the fund; (iv) the extent to which economies of scale would be realized as the fund grows; and (v) whether fee levels reflect these economies of scale, if any, for the benefit of fund shareholders.
In considering whether to renew the Advisory Contracts for the fund, the Board reached a determination, with the assistance of fund counsel and Independent Trustees' counsel and through the exercise of its business judgment, that the renewal of the Advisory Contracts is in the best interests of fund shareholders and that the compensation to be received by Fidelity under the management contract is fair and reasonable. The Board's decision to renew the Advisory Contracts was not based on any single factor noted above, but rather was based on a comprehensive consideration of all the information provided to the Board at its meetings throughout the year. The Board, in reaching its determination to renew the Advisory Contracts, is aware that shareholders in the fund have a broad range of investment choices available to them, including a wide choice among mutual funds offered by Fidelity's competitors, and that the fund's shareholders, with the opportunity to review and weigh the disclosure provided by the fund in its prospectus and other public disclosures, have chosen to invest in this fund, managed by Fidelity.
Nature, Extent, and Quality of Services Provided. The Board considered the staffing within the investment adviser, FMR, and the sub-advisers (together, the Investment Advisers), including the backgrounds of the fund's investment personnel and the fund's investment objective and discipline. The Independent Trustees also had discussions with senior management of Fidelity's investment operations and investment groups. The Board considered the structure of the portfolio manager compensation program and whether this structure provides appropriate incentives to act in the best interest of the fund.
Resources Dedicated to Investment Management and Support Services. The Board and the equity research subcommittee of the Board's Fund Oversight Committee reviewed the size, education, and experience of the Investment Advisers' investment staff, their use of technology, and the Investment Advisers' approach to recruiting, training, and retaining portfolio managers and other research, advisory, and management personnel. The Board noted that Fidelity's analysts have access to a variety of technological tools and market and securities data that enable them to perform both fundamental and quantitative analysis and to specialize in various disciplines. The Board considered Fidelity's extensive global research capabilities that enable the Investment Advisers to aggregate data from various sources in an effort to produce positive investment results. The Board also considered that Fidelity's portfolio managers and analysts have access to daily portfolio attribution that allows for monitoring of a fund's portfolio, as well as an electronic communication system that provides immediate real-time access to research concerning issuers and credit enhancers. The Board noted FMR's continued focus on strengthening the organization and discipline of equity portfolio management and research.
Shareholder and Administrative Services. The Board considered (i) the nature, extent, quality, and cost of advisory, administrative, and shareholder services performed by the Investment Advisers and their affiliates under the Advisory Contracts and under separate agreements covering transfer agency, pricing and bookkeeping, and securities lending services for the fund; (ii) the nature and extent of the investment adviser's supervision of third party service providers, principally custodians and subcustodians; and (iii) the resources devoted to, and the record of compliance with, the fund's compliance policies and procedures. The Board also reviewed the allocation of fund brokerage, including allocations to brokers affiliated with the Investment Advisers, the use of brokerage commissions to pay fund expenses, and the use of "soft" commission dollars to pay for research services.
The Board noted that the growth of fund assets over time across the complex allows Fidelity to reinvest in the development of services designed to enhance the value or convenience of the Fidelity funds as investment vehicles. These services include 24-hour access to account information and market information through phone representatives and over the Internet, and investor education materials and asset allocation tools.
Investment in a Large Fund Family. The Board considered the benefits to shareholders of investing in a Fidelity fund, including the benefits of investing in a fund that is part of a large family of funds offering a variety of investment disciplines and providing a large variety of mutual fund investor services. The Board noted that Fidelity had taken, or had made recommendations that resulted in the Fidelity funds taking, a number of actions over the previous year that benefited particular funds, including (i) dedicating additional resources to investment research and restructuring and broadening the focus of the investment research teams; (ii) bolstering the senior management team that oversees asset management; (iii) launching Class F of certain funds as a lower-fee class available to Freedom K and Freedom Index Funds; (iv) lowering the initial investment minimums and ongoing balance requirements for Real Estate High Income Fund; (v) eliminating subsequent purchase minimums for all funds and adding a waiver of the investment minimum requirement for new accounts opened with the proceeds of a systematic withdrawal plan; (vi) eliminating the withdrawal minimum and maximum limits for systematic withdrawals from Advisor funds; (vii) expanding sales load waivers on Class A shares for Destiny Planholders and expanding Institutional Class eligibility for Class O Destiny Planholders; and (viii) changing certain Class A and Class T sales charge structures to further align them with industry practices.
Annual Report
Investment Performance. The Board considered whether the fund has operated in accordance with its investment objective, as well as its record of compliance with its investment restrictions. It also reviewed the fund's absolute investment performance for each class, as well as the fund's relative investment performance for each class measured over multiple periods against a third-party-sponsored index that reflects the market sector in which the fund invests. The Board noted that FMR does not believe that a meaningful peer group exists against which to compare the fund's performance. The following charts considered by the Board show, over the one-, three-, and five-year periods ended December 31, 2009, as available, the cumulative total returns of Initial Class and Investor Class of the fund and the cumulative total returns of a third-party-sponsored index ("benchmark").
VIP Utilities Portfolio
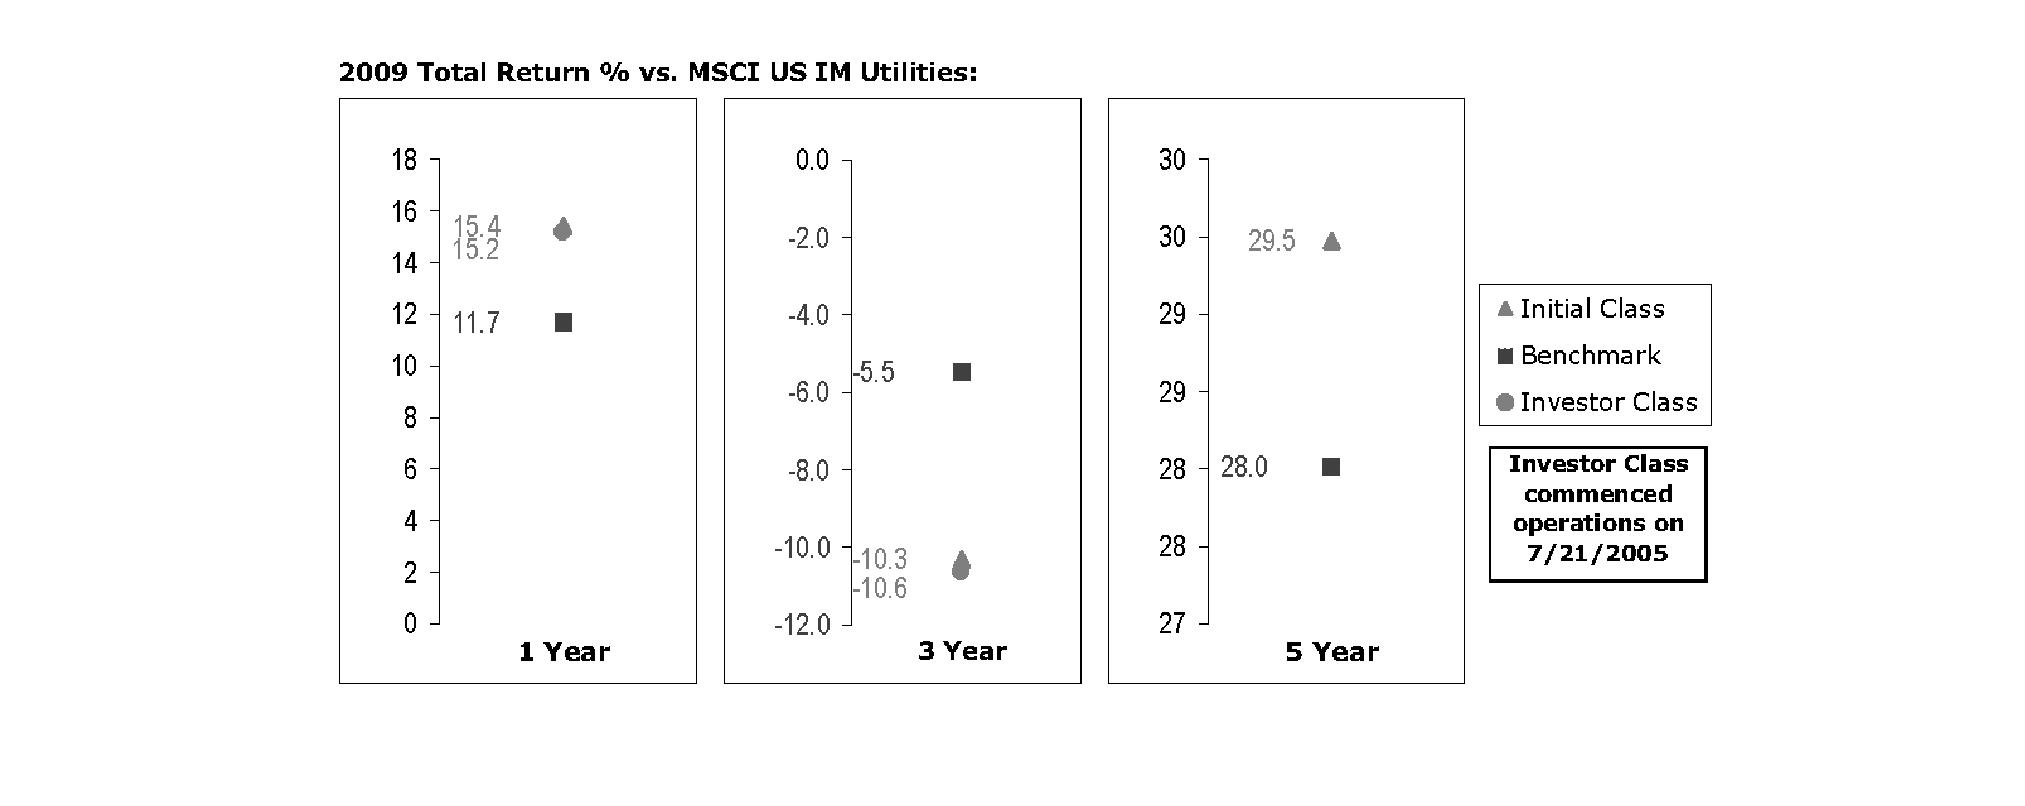
The Board noted that the investment performance of Initial Class of the fund compared favorably to its benchmark for the one- and five-year periods, although the fund's three-year cumulative total return was lower than its benchmark. The Board considered that the variations in performance between the fund's classes reflect the variations in class expenses, which result in lower performance for the higher expense class. The Board also reviewed the fund's performance since inception as well as performance in the current year.
Based on its review, and giving particular weight to the nature and quality of the resources dedicated by the Investment Advisers to maintain and improve relative performance and factoring in the unprecedented market events in recent years, the Board concluded that the nature, extent, and quality of investment management and support services and of shareholder and administrative services provided to the fund will benefit the fund's shareholders, particularly in light of the Board's view that the fund's shareholders benefit from investing in a fund that is part of a large family of funds offering a variety of investment disciplines and services.
Competitiveness of Management Fee and Total Fund Expenses. The Board considered the fund's management fee and total expenses compared to "mapped groups" of competitive funds and classes. Fidelity creates "mapped groups" by combining similar Lipper investment objective categories that have comparable management fee characteristics. Combining Lipper investment objective categories aids the Board's management fee and total expense comparisons by broadening the competitive group used for comparison and by reducing the number of universes to which various Fidelity funds are compared.
Management Fee. The Board considered two proprietary management fee comparisons for the 12-month periods shown in the chart below. The group of Lipper funds used by the Board for management fee comparisons is referred to below as the "Total Mapped Group." The Total Mapped Group comparison focuses on a fund's standing relative to the total universe of comparable funds available to investors, in terms of gross management fees before expense reimbursements or caps. "TMG %" represents the percentage of funds in the Total Mapped Group that had management fees that were lower than the fund's. For example, a TMG % of 3% means that 97% of the funds in the Total Mapped Group had higher management fees than the fund. The "Asset-Size Peer Group" (ASPG) comparison focuses on a fund's standing relative to non-Fidelity funds similar in size to the fund within the Total Mapped Group. The ASPG represents at least 15% of the funds in the Total Mapped Group with comparable asset size and management fee characteristics, subject to a minimum of 50 funds (or all funds in the Total Mapped Group if fewer than 50). Additional information, such as the ASPG quartile in which the fund's management fee ranked, is also included in the chart and considered by the Board.
Annual Report
Board Approval of Investment Advisory Contracts and Management Fees - continued
VIP Utilities Portfolio
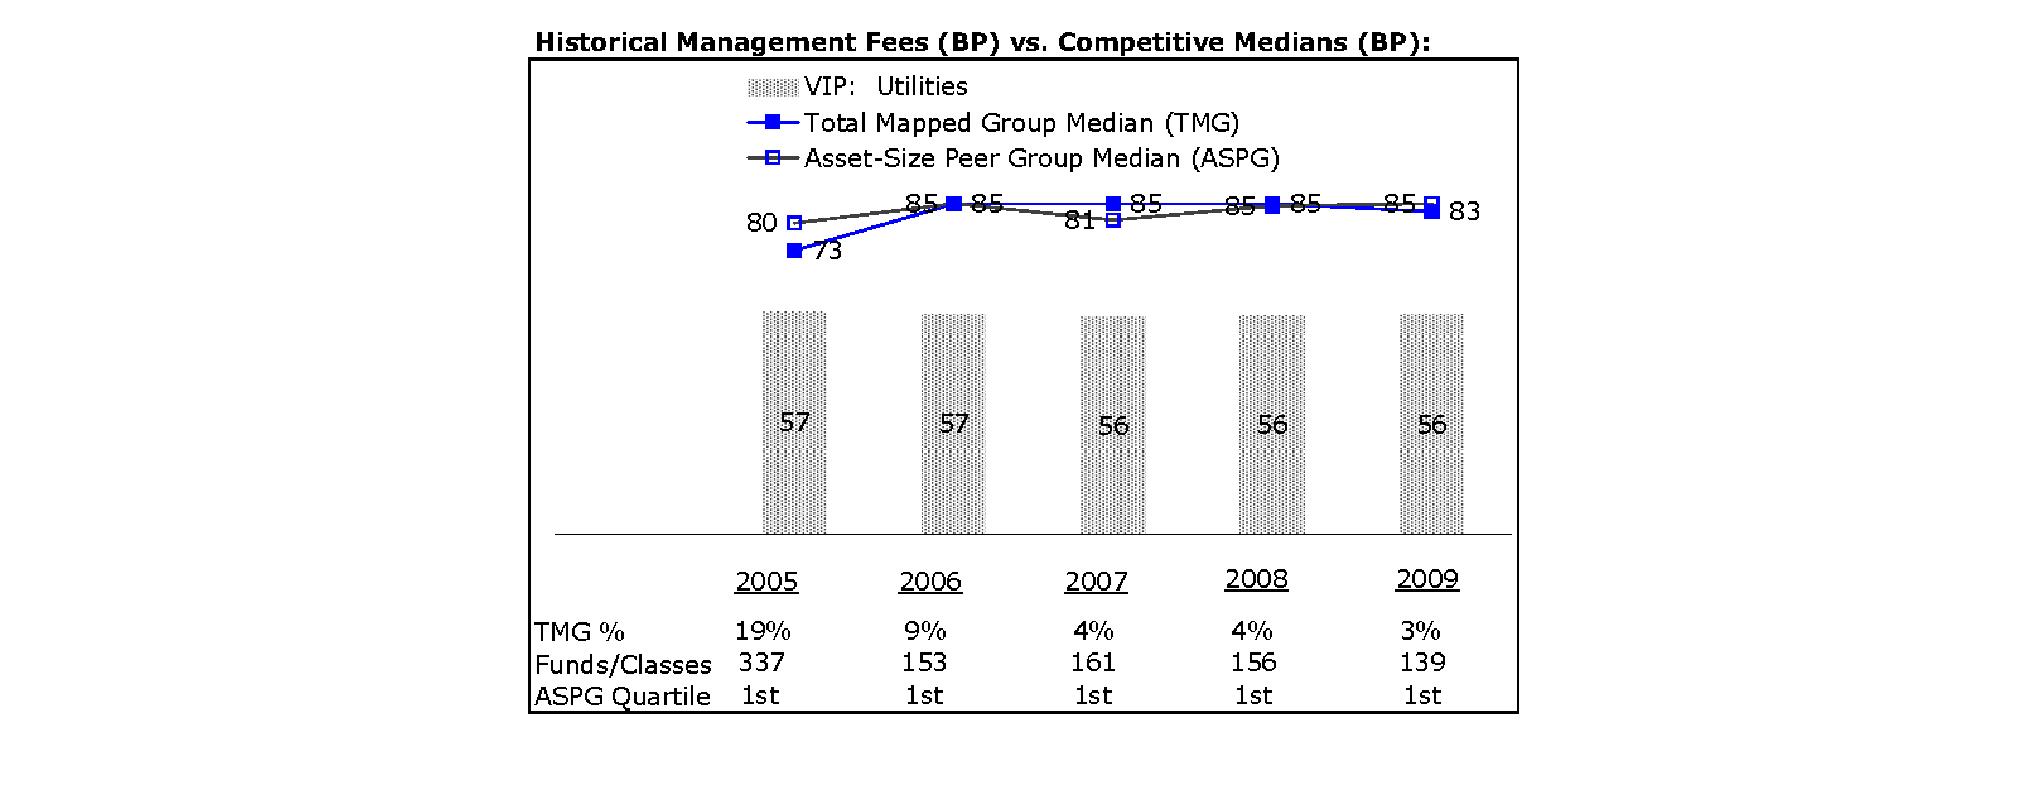
The Board noted that the fund's management fee ranked below the median of its Total Mapped Group and below the median of its ASPG for 2009.
Based on its review, the Board concluded that the fund's management fee is fair and reasonable in light of the services that the fund receives and the other factors considered.
Total Expenses. In its review of each class's total expenses, the Board considered the fund's management fee as well as other fund or class expenses, as applicable, such as transfer agent fees, pricing and bookkeeping fees, and custodial, legal, and audit fees. The Board also noted the effects of any waivers and reimbursements on fees and expenses. As part of its review, the Board also considered current and historical total expenses of each class of the fund compared to competitive fund median expenses. Each class of the fund is compared to those funds and classes in the Total Mapped Group (used by the Board for management fee comparisons) that have a similar sales load structure.
The Board noted that the total expenses of each class ranked below its competitive median for 2009.
Fees Charged to Other Fidelity Clients. The Board also considered Fidelity fee structures and other information with respect to clients of FMR and its affiliates, such as other mutual funds advised or subadvised by FMR or its affiliates, pension plan clients, and other institutional clients. In March 2010, the Board created an ad hoc joint committee with the board of other Fidelity funds (the Committee) to review and compare Fidelity's institutional investment advisory business with its business of providing services to the Fidelity funds, including the differences in services provided, fees charged, and costs incurred, as well as competition in their respective marketplaces.
Based on its review of total expenses and fees charged to other Fidelity clients, the Board concluded that the total expenses of each class of the fund were reasonable in light of the services that the fund and its shareholders receive and the other factors considered, including the findings of the Committee.
Costs of the Services and Profitability. The Board considered the revenues earned and the expenses incurred by Fidelity in conducting the business of developing, marketing, distributing, managing, administering and servicing the fund and its shareholders. The Board also considered the level of Fidelity's profits in respect of all the Fidelity funds.
On an annual basis, FMR presents to the Board Fidelity's profitability for the fund. Fidelity calculates the profitability for each fund, as well as aggregate profitability for groups of Fidelity funds and all Fidelity funds, using a series of detailed revenue and cost allocation methodologies which originate with the audited books and records of Fidelity. The Audit Committee of the Board reviews any significant changes from the prior year's methodologies.
Annual Report
PricewaterhouseCoopers LLP (PwC), independent registered public accounting firm and auditor to Fidelity and certain Fidelity funds, has been engaged annually by the Board as part of the Board's assessment of Fidelity's profitability analysis. PwC's engagement includes the review and assessment of Fidelity's methodologies used in determining the revenues and expenses attributable to Fidelity's mutual fund business, and completion of agreed-upon procedures surrounding the mathematical accuracy of fund profitability and its conformity to allocation methodologies. After considering PwC's reports issued under the engagement and information provided by Fidelity, the Board believes that while other allocation methods may also be reasonable, Fidelity's profitability methodologies are reasonable in all material respects.
The Board has also reviewed Fidelity's non-fund businesses and fall-out benefits related to the mutual fund business as well as cases where Fidelity's affiliates may benefit from or be related to the fund's business.
The Board considered the costs of the services provided by and the profits realized by Fidelity in connection with the operation of the fund and were satisfied that the profitability was not excessive in the circumstances.
Economies of Scale. The Board considered whether there have been economies of scale in respect of the management of the Fidelity funds, whether the Fidelity funds (including the fund) have appropriately benefited from any such economies of scale, and whether there is potential for realization of any further economies of scale. The Board considered the extent to which the fund will benefit from economies of scale through increased services to the fund, through waivers or reimbursements, or through fee or expense reductions.
In February 2009, the Board and the board of other Fidelity funds created an ad hoc committee (the Economies of Scale Committee) to analyze whether FMR attains economies of scale in respect of the management and servicing of the Fidelity funds, whether the Fidelity funds have appropriately benefited from such economies of scale, and whether there is potential for realization of any further economies of scale.
The Board recognized that the fund's management contract incorporates a "group fee" structure, which provides for lower group fee rates as total fund assets under FMR's management increase, and for higher group fee rates as total fund assets under FMR's management decrease. FMR calculates the group fee rates based on a tiered asset "breakpoint" schedule that varies based on asset class. The Board considered that the group fee is designed to deliver the benefits of economies of scale to fund shareholders when total Fidelity fund assets increase, even if assets of any particular fund are unchanged or have declined, because some portion of Fidelity's costs are attributable to services provided to all Fidelity funds, and all funds benefit if those costs can be allocated among more assets. The Board concluded that, given the group fee structure, fund shareholders will benefit from lower management fees as assets under FMR's management increase at the fund complex level, regardless of whether Fidelity achieves any such economies of scale.
The Board concluded, considering the findings of the Economies of Scale Committee, that any potential economies of scale are being appropriately shared between fund shareholders and Fidelity.
Additional Information Requested by the Board. In order to develop fully the factual basis for consideration of the Fidelity funds' Advisory Contracts, the Board requested and received additional information on certain topics, including (i) fund performance trends, actions to be taken by FMR to improve certain funds' overall performance, and Fidelity's long-term strategies for certain funds; (ii) portfolio manager changes that have occurred during the past year and length of portfolio manager tenure for different categories of funds over time; (iii) Fidelity's compensation structure for portfolio managers, research analysts, and other key personnel, the rationale for the compensation structure, and how the compensation structure provides appropriate performance incentives; (iv) the amount of the investment that each portfolio manager has made in the Fidelity fund(s) that he or she manages; (v) management and other fees paid by FMR to affiliated sub-advisers on behalf of the Fidelity funds; (vi) Fidelity's fee structures and rationale for recommending different fees among different categories of funds; (vii) Fidelity's rationale for recommending which funds should have a performance adjustment component as part of their management fees; (viii) the rationale for any differences between fund fee structures and fee structures in place for other Fidelity clients; and (ix) explanations regarding the relative total expenses borne by certain funds and classes, total expense competitive trends, and actions that might be taken by FMR to reduce total expenses for certain funds and classes.
Based on its evaluation of all of the conclusions noted above, and after considering all factors it believed relevant, the Board ultimately concluded that the advisory fee structures are fair and reasonable, and that the fund's Advisory Contracts should be renewed.
Annual Report
Investment Adviser
Fidelity Management & Research Company
Boston, MA
Investment Sub-Advisers
FMR Co., Inc.
Fidelity Management & Research (U.K.) Inc.
Fidelity Management & Research (Hong Kong) Limited
Fidelity Management & Research (Japan) Inc.
General Distributor
Fidelity Distributors Corporation
Boston, MA
Transfer and Service Agents
Fidelity Investments Institutional Operations Company, Inc.
Boston, MA
Fidelity Service Company, Inc.
Boston, MA
Custodian
JPMorgan Chase Bank
New York, NY
VTELIC-ANN-0211
1.817391.105
Fidelity® Variable Insurance Products:
Value Leaders Portfolio
Annual Report
December 31, 2010
(2_fidelity_logos) (Registered_Trademark)
Contents
Performance | <Click Here> | How the fund has done over time. |
Management's Discussion of Fund Performance | <Click Here> | The Portfolio Manager's review of fund performance and strategy. |
Shareholder Expense Example | <Click Here> | An example of shareholder expenses. |
Investment Changes | <Click Here> | A summary of major shifts in the fund's investments over the past six months. |
Investments | <Click Here> | A complete list of the fund's investments with their market values. |
Financial Statements | <Click Here> | Statements of assets and liabilities, operations, and changes in net assets, as well as financial highlights. |
Notes | <Click Here> | Notes to the financial statements. |
Report of Independent Registered Public Accounting Firm | <Click Here> | |
Trustees and Officers | <Click Here> | |
Distributions | <Click Here> | |
Board Approval of Investment Advisory Contracts and Management Fees | <Click Here> | |
To view a fund's proxy voting guidelines and proxy voting record for the 12-month period ended June 30, visit http://www.fidelity.com/proxyvotingresults or visit the Securities and Exchange Commission's (SEC) web site at http://www.sec.gov. You may also call 1-877-208-0098 to request a free copy of the proxy voting guidelines.
Fidelity Variable Insurance Products are separate account options which are purchased through a variable insurance contract.
Standard & Poor's, S&P and S&P 500 are registered service marks of The McGraw-Hill Companies, Inc. and have been licensed for use by Fidelity Distributors Corporation.
Other third party marks appearing herein are the property of their respective owners.
All other marks appearing herein are registered or unregistered trademarks or service marks of FMR Corp. or an affiliated company.
The general research services agreement with Fidelity Research & Analysis Company has been terminated and is no longer in effect for the fund.
This report and the financial statements contained herein are submitted for the general information of the shareholders of the fund. This report is not authorized for distribution to prospective investors in the fund unless preceded or accompanied by an effective prospectus.
A fund files its complete schedule of portfolio holdings with the SEC for the first and third quarters of each fiscal year on Form N-Q. Forms N-Q are available on the SEC's web site at http://www.sec.gov. A fund's Forms N-Q may be reviewed and copied at the SEC's Public Reference Room in Washington, DC. Information regarding the operation of the SEC's Public Reference Room may be obtained by calling 1-800-SEC-0330. For a complete list of a fund's portfolio holdings, view the most recent holdings listing, semiannual report, or annual report on Fidelity's web site at http://www.fidelity.com, http://www.advisor.fidelity.com, or http://www.401k.com, as applicable.
NOT FDIC INSURED • MAY LOSE VALUE • NO BANK GUARANTEE
Neither the fund nor Fidelity Distributors Corporation is a bank.
Annual Report
Average annual total return reflects the change in the value of an investment, assuming reinvestment of the class' distributions from dividend income and capital gains (the profits earned upon the sale of securities that have grown in value, if any) and assuming a constant rate of performance each year. During periods of reimbursement by Fidelity, a fund's total return will be greater than it would be had the reimbursement not occurred. Performance numbers are net of all underlying fund operating expenses, but do not include any insurance charges imposed by your insurance company's separate account. If performance information included the effect of these additional charges, the total returns would have been lower. How a fund did yesterday is no guarantee of how it will do tomorrow.
Average Annual Total Returns
Periods ended December 31, 2010 | Past 1
year | Past 5
years | Life of fund A |
VIP® Value Leaders Portfolio - Initial Class | 10.04% | -1.25% | 3.96% |
VIP Value Leaders Portfolio - Service Class | 10.01% | -1.34% | 3.86% |
VIP Value Leaders Portfolio - Service Class 2 | 9.81% | -1.50% | 3.70% |
VIP Value Leaders Portfolio - Investor Class B | 10.08% | -1.34% | 3.89% |
A From June 17, 2003.
B The initial offering of Investor Class shares took place on July 21, 2005. Returns prior to July 21, 2005 are those of Initial Class. Had Investor Class's transfer agent fee been reflected, returns prior to July 21, 2005, would have been lower.
$10,000 Over Life of Fund
Let's say hypothetically that $10,000 was invested in VIP Value Leaders Portfolio - Initial Class on June 17, 2003, when the fund started. The chart shows how the value of your investment would have changed, and also shows how the Russell 1000® Value Index performed over the same period.
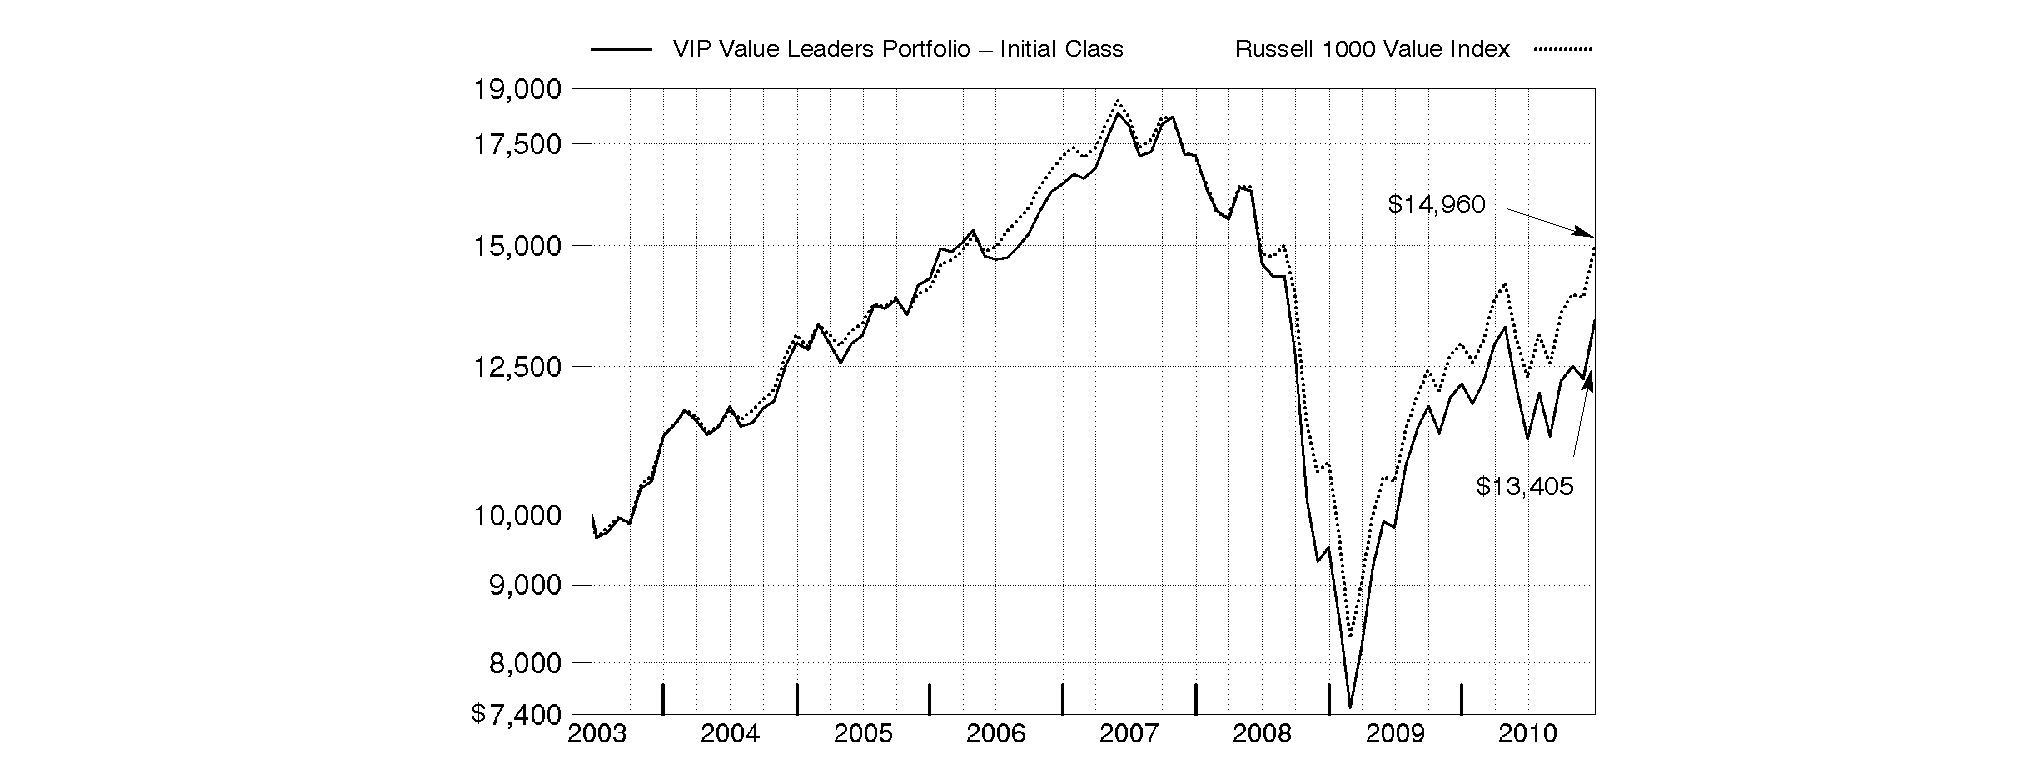
Annual Report
Market Recap: While market improvements around the world hit a speed bump in the first half of the 12-month period ending December 31, 2010, world economies re-accelerated in August, supported by a broadening recovery and low inflation in the U.S. Domestic stock markets recorded solid gains for the year, lifted by a strong second-half rally fueled by economic optimism, encouraging earnings reports and a wave of corporate mergers. The large-cap S&P 500® Index rose 15.06%, the blue-chip-laden Dow Jones Industrial AverageSM added 14.06% and the technology-heavy Nasdaq Composite® Index climbed 18.02%. Meanwhile, international stocks, as represented by the MSCI® ACWI® (All Country World Index) ex USA Index, gained 11.29%, boosted in part by a depreciating U.S. dollar. In the fixed-income arena, U.S. taxable investment-grade bonds generated positive results during 2010, as the Barclays Capital® U.S. Aggregate Bond Index gained 6.54%. With ultra-low interest rates bolstering nearly all fixed-income securities for most of the year, sectors in the index with higher yields and more credit risk generally fared best, while most high-quality bonds generated more-moderate returns. Meanwhile, high-yield bonds, as represented by The BofA Merrill LynchSM US High Yield Constrained Index, returned 15.07%, a result of improved economic data and strengthening investor demand. Overseas, foreign bond markets showed mixed results, with a sizable disparity between the 3.97% return of the Citigroup® Non-U.S. Group of 7 Index - which measures the performance of sovereign debt of the major global economies outside the U.S. - and the 12.04% advance of the JPMorgan Emerging Markets Bond Index Global (EMBI Global), which benefited from the rising overall credit quality of emerging-markets debt issuers.
Comments from Michael Chren, who became Portfolio Manager of VIP Value Leaders Portfolio on November 1, 2010: During the year, the fund's share classes lagged the 15.51% gain of the Russell 1000® Value Index. (For specific portfolio results, please see the performance section of this report.) Positioning in financials was a drag on performance, with stakes in Bank of America, JPMorgan Chase and Morgan Stanley suffering from fears of increased government regulation. Along the same lines, banking firm Wells Fargo detracted. The fund's positioning in consumer discretionary also was negative, including ownership of homebuilder KB Home - sold by period end - which fell after the April expiration of the tax credit for first-time homebuyers. Overweighting technology hardware/equipment firm Hewlett-Packard hurt when the firm's chief executive unexpectedly departed in August. Poor stock selection in energy detracted, as did unfavorable positioning in the pharmaceuticals/biotechnology/life science area, where the fund had a significant overweighting in drug manufacturer Pfizer. On the positive side, strong picks in industrials was the biggest contributor to relative performance, including stakes in truck-engine manufacturer Cummins and rail operator Union Pacific. Both stocks benefited from an improving economy that boosted the firms' profits. Within energy, significantly underweighting integrated oil giant and major index component Exxon Mobil helped when the stock lagged, particularly during the first half of the period. Despite financials' weak performance, the fund benefited from an out-of-index position in commercial real estate broker CB Richard Ellis Group and a large underweighting in insurance-focused conglomerate Berkshire Hathaway. Some of these stocks were sold prior to period end.
The views expressed above reflect those of the portfolio manager(s) only through the end of the period as stated on the cover of this report and do not necessarily represent the views of Fidelity or any other person in the Fidelity organization. Any such views are subject to change at any time based upon market or other conditions and Fidelity disclaims any responsibility to update such views. These views may not be relied on as investment advice and, because investment decisions for a Fidelity fund are based on numerous factors, may not be relied on as an indication of trading intent on behalf of any Fidelity fund.
Annual Report
As a shareholder of the Fund, you incur two types of costs: (1) transaction costs, and (2) ongoing costs, including management fees, distribution and/or service (12b-1) fees and other Fund expenses. This Example is intended to help you understand your ongoing costs (in dollars) of investing in the Fund and to compare these costs with the ongoing costs of investing in other mutual funds.
The Example is based on an investment of $1,000 invested at the beginning of the period and held for the entire period (July 1, 2010 to December 31, 2010).
Actual Expenses
The first line of the accompanying table for each class of the Fund provides information about actual account values and actual expenses. You may use the information in this line, together with the amount you invested, to estimate the expenses that you paid over the period. Simply divide your account value by $1,000.00 (for example, an $8,600 account value divided by $1,000.00 = 8.6), then multiply the result by the number in the first line for a class of the Fund under the heading entitled "Expenses Paid During Period" to estimate the expenses you paid on your account during this period. The estimate of expenses does not include any fees or other expenses of any variable annuity or variable life insurance product. If they were, the estimate of expenses you paid during the period would be higher, and your ending account value would be lower. In addition, the Fund, as a shareholder in the underlying Fidelity Central Funds, will indirectly bear its pro-rata share of the fees and expenses incurred by the underlying Fidelity Central Funds. These fees and expenses are not included in the Fund's annualized expense ratio used to calculate the expense estimate in the table below.
Hypothetical Example for Comparison Purposes
The second line of the accompanying table for each class of the Fund provides information about hypothetical account values and hypothetical expenses based on a Class' actual expense ratio and an assumed rate of return of 5% per year before expenses, which is not the Class' actual return. The hypothetical account values and expenses may not be used to estimate the actual ending account balance or expenses you paid for the period. You may use this information to compare the ongoing costs of investing in the Fund and other funds. To do so, compare this 5% hypothetical example with the 5% hypothetical examples that appear in the shareholder reports of the other funds. The estimate of expenses does not include any fees or other expenses of any variable annuity or variable life insurance product. If they were, the estimate of expenses you paid during the period would be higher, and your ending account value would be lower. In addition, the Fund, as a shareholder in the underlying Fidelity Central Funds, will indirectly bear its pro-rata share of the fees and expenses incurred by the underlying Fidelity Central Funds. These fees and expenses are not included in the Fund's annualized expense ratio used to calculate the expense estimate in the table below.
Please note that the expenses shown in the table are meant to highlight your ongoing costs only and do not reflect any transaction costs. Therefore, the second line of the table is useful in comparing ongoing costs only, and will not help you determine the relative total costs of owning different funds.
| Annualized
Expense Ratio | Beginning
Account Value
July 1, 2010 | Ending
Account Value
December 31, 2010 | Expenses Paid
During Period*
July 1, 2010 to December 31, 2010 |
Initial Class | .85% | | | |
Actual | | $ 1,000.00 | $ 1,196.30 | $ 4.71 |
HypotheticalA | | $ 1,000.00 | $ 1,020.92 | $ 4.33 |
Service Class | .95% | | | |
Actual | | $ 1,000.00 | $ 1,196.10 | $ 5.26 |
HypotheticalA | | $ 1,000.00 | $ 1,020.42 | $ 4.84 |
Service Class 2 | 1.10% | | | |
Actual | | $ 1,000.00 | $ 1,195.50 | $ 6.09 |
HypotheticalA | | $ 1,000.00 | $ 1,019.66 | $ 5.60 |
Investor Class | .93% | | | |
Actual | | $ 1,000.00 | $ 1,195.50 | $ 5.15 |
HypotheticalA | | $ 1,000.00 | $ 1,020.52 | $ 4.74 |
A 5% return per year before expenses
* Expenses are equal to each Class' annualized expense ratio, multiplied by the average account value over the period, multiplied by 184/365 (to reflect the one-half year period).
Annual Report
Investment Changes (Unaudited)
Top Ten Stocks as of December 31, 2010 |
| % of fund's
net assets | % of fund's net assets
6 months ago |
Pfizer, Inc. | 5.8 | 3.3 |
Sprint Nextel Corp. | 4.0 | 0.9 |
Seagate Technology | 3.4 | 0.0 |
General Electric Co. | 3.2 | 1.2 |
Grupo Modelo SAB de CV Series C | 2.8 | 0.3 |
Johnson & Johnson | 2.7 | 2.9 |
Garmin Ltd. | 2.7 | 0.0 |
Citigroup, Inc. | 2.6 | 1.6 |
Chevron Corp. | 2.6 | 2.9 |
JPMorgan Chase & Co. | 2.5 | 4.8 |
| 32.3 | |
Top Five Market Sectors as of December 31, 2010 |
| % of fund's
net assets | % of fund's net assets
6 months ago |
Financials | 23.0 | 29.7 |
Health Care | 14.6 | 14.7 |
Energy | 13.3 | 13.4 |
Information Technology | 10.3 | 6.7 |
Industrials | 10.3 | 11.0 |
Asset Allocation (% of fund's net assets) |
As of December 31, 2010* | As of June 30, 2010** |
 | Stocks 97.8% | | | Stocks 98.9% | |
 | Short-Term
Investments and
Net Other Assets 2.2% | | | Short-Term
Investments and
Net Other Assets 1.1% | |
* Foreign investments | 22.1% | | ** Foreign investments | 9.1% | |

Annual Report
Investments December 31, 2010
Showing Percentage of Net Assets
Common Stocks - 97.8% |
| Shares | | Value |
CONSUMER DISCRETIONARY - 7.3% |
Automobiles - 0.6% |
General Motors Co. | 4,400 | | $ 162,184 |
Household Durables - 2.7% |
D.R. Horton, Inc. | 1,300 | | 15,509 |
Garmin Ltd. (d) | 25,015 | | 775,215 |
| | 790,724 |
Media - 4.0% |
Comcast Corp. Class A (special) (non-vtg.) | 14,600 | | 303,826 |
Time Warner, Inc. | 9,700 | | 312,049 |
Washington Post Co. Class B (d) | 1,200 | | 527,400 |
| | 1,143,275 |
TOTAL CONSUMER DISCRETIONARY | | 2,096,183 |
CONSUMER STAPLES - 7.2% |
Beverages - 3.1% |
Grupo Modelo SAB de CV Series C | 130,800 | | 810,220 |
The Coca-Cola Co. | 1,500 | | 98,655 |
| | 908,875 |
Food & Staples Retailing - 1.3% |
CVS Caremark Corp. | 9,000 | | 312,930 |
Kroger Co. | 2,450 | | 54,782 |
| | 367,712 |
Food Products - 2.2% |
Dean Foods Co. (a) | 22,600 | | 199,784 |
Kraft Foods, Inc. Class A | 11,800 | | 371,818 |
Smithfield Foods, Inc. (a) | 3,339 | | 68,884 |
| | 640,486 |
Household Products - 0.6% |
Procter & Gamble Co. | 2,500 | | 160,825 |
TOTAL CONSUMER STAPLES | | 2,077,898 |
ENERGY - 13.3% |
Energy Equipment & Services - 0.7% |
Transocean Ltd. (a) | 2,800 | | 194,628 |
Oil, Gas & Consumable Fuels - 12.6% |
Anadarko Petroleum Corp. | 4,400 | | 335,104 |
Apache Corp. | 1,100 | | 131,153 |
BP PLC sponsored ADR | 13,900 | | 613,963 |
Chevron Corp. | 8,300 | | 757,375 |
ConocoPhillips | 3,900 | | 265,590 |
Exxon Mobil Corp. | 1,600 | | 116,992 |
Marathon Oil Corp. | 8,900 | | 329,567 |
Massey Energy Co. | 1,812 | | 97,214 |
Occidental Petroleum Corp. | 1,700 | | 166,770 |
Suncor Energy, Inc. | 8,000 | | 307,069 |
|
| Shares | | Value |
Sunoco, Inc. | 10,500 | | $ 423,255 |
Total SA sponsored ADR | 2,100 | | 112,308 |
| | 3,656,360 |
TOTAL ENERGY | | 3,850,988 |
FINANCIALS - 23.0% |
Capital Markets - 5.4% |
Bank of New York Mellon Corp. | 9,700 | | 292,940 |
BlackRock, Inc. Class A | 700 | | 133,406 |
Goldman Sachs Group, Inc. | 2,400 | | 403,584 |
Invesco Ltd. | 5,600 | | 134,736 |
Morgan Stanley | 6,700 | | 182,307 |
Northern Trust Corp. | 4,200 | | 232,722 |
State Street Corp. | 4,000 | | 185,360 |
| | 1,565,055 |
Commercial Banks - 4.0% |
Aozora Bank Ltd. | 51,000 | | 105,498 |
PNC Financial Services Group, Inc. | 750 | | 45,540 |
Sumitomo Mitsui Financial Group, Inc. | 9,000 | | 320,483 |
Wells Fargo & Co. | 22,433 | | 695,199 |
| | 1,166,720 |
Consumer Finance - 0.1% |
Discover Financial Services | 800 | | 14,824 |
Diversified Financial Services - 6.5% |
Bank of America Corp. | 29,912 | | 399,026 |
Citigroup, Inc. (a) | 163,237 | | 772,111 |
JPMorgan Chase & Co. | 16,996 | | 720,970 |
| | 1,892,107 |
Insurance - 5.8% |
Berkshire Hathaway, Inc. Class B (a) | 3,990 | | 319,639 |
Everest Re Group Ltd. | 1,100 | | 93,302 |
First American Financial Corp. | 12,300 | | 183,762 |
Genworth Financial, Inc. Class A (a) | 8,973 | | 117,905 |
Lincoln National Corp. | 7,200 | | 200,232 |
MetLife, Inc. | 7,500 | | 333,300 |
RenaissanceRe Holdings Ltd. | 2,100 | | 133,749 |
XL Capital Ltd. Class A | 13,400 | | 292,388 |
| | 1,674,277 |
Real Estate Investment Trusts - 0.7% |
Weyerhaeuser Co. | 10,732 | | 203,157 |
Thrifts & Mortgage Finance - 0.5% |
Radian Group, Inc. | 17,700 | | 142,839 |
TOTAL FINANCIALS | | 6,658,979 |
HEALTH CARE - 14.6% |
Biotechnology - 1.4% |
Gilead Sciences, Inc. (a) | 10,800 | | 391,392 |
Health Care Equipment & Supplies - 1.3% |
Boston Scientific Corp. (a) | 10,800 | | 81,756 |
Common Stocks - continued |
| Shares | | Value |
HEALTH CARE - continued |
Health Care Equipment & Supplies - continued |
CareFusion Corp. (a) | 6,100 | | $ 156,770 |
Covidien PLC | 2,982 | | 136,158 |
| | 374,684 |
Health Care Providers & Services - 1.0% |
Omnicare, Inc. | 4,482 | | 113,798 |
UnitedHealth Group, Inc. | 4,700 | | 169,717 |
| | 283,515 |
Pharmaceuticals - 10.9% |
Eli Lilly & Co. | 4,812 | | 168,612 |
Johnson & Johnson | 12,615 | | 780,238 |
Merck & Co., Inc. | 15,070 | | 543,123 |
Pfizer, Inc. | 95,518 | | 1,672,519 |
| | 3,164,492 |
TOTAL HEALTH CARE | | 4,214,083 |
INDUSTRIALS - 10.3% |
Aerospace & Defense - 0.9% |
United Technologies Corp. | 3,500 | | 275,520 |
Building Products - 0.5% |
Armstrong World Industries, Inc. | 3,200 | | 137,600 |
Construction & Engineering - 1.8% |
Jacobs Engineering Group, Inc. (a) | 6,850 | | 314,073 |
KBR, Inc. | 6,800 | | 207,196 |
| | 521,269 |
Industrial Conglomerates - 5.0% |
General Electric Co. | 50,800 | | 929,132 |
Siemens AG sponsored ADR | 1,100 | | 136,675 |
Textron, Inc. | 16,240 | | 383,914 |
| | 1,449,721 |
Machinery - 2.1% |
Ingersoll-Rand Co. Ltd. | 7,800 | | 367,302 |
Navistar International Corp. (a) | 4,020 | | 232,798 |
| | 600,100 |
TOTAL INDUSTRIALS | | 2,984,210 |
INFORMATION TECHNOLOGY - 10.3% |
Communications Equipment - 1.3% |
Comverse Technology, Inc. (a) | 52,600 | | 381,876 |
|
| Shares | | Value |
Computers & Peripherals - 3.9% |
Hewlett-Packard Co. | 3,100 | | $ 130,510 |
Seagate Technology (a) | 65,500 | | 984,465 |
| | 1,114,975 |
Electronic Equipment & Components - 1.0% |
Avnet, Inc. (a) | 4,824 | | 159,337 |
Corning, Inc. | 6,020 | | 116,306 |
| | 275,643 |
Internet Software & Services - 0.4% |
eBay, Inc. (a) | 4,700 | | 130,801 |
IT Services - 0.3% |
CoreLogic, Inc. (a) | 5,300 | | 98,156 |
Office Electronics - 1.3% |
Xerox Corp. | 33,250 | | 383,040 |
Semiconductors & Semiconductor Equipment - 0.4% |
MEMC Electronic Materials, Inc. (a) | 9,100 | | 102,466 |
Software - 1.7% |
Microsoft Corp. | 18,100 | | 505,352 |
TOTAL INFORMATION TECHNOLOGY | | 2,992,309 |
MATERIALS - 2.3% |
Chemicals - 1.4% |
Clariant AG (Reg.) (a) | 10,388 | | 210,584 |
Dow Chemical Co. | 5,315 | | 181,454 |
| | 392,038 |
Metals & Mining - 0.9% |
Goldcorp, Inc. | 6,000 | | 276,025 |
TOTAL MATERIALS | | 668,063 |
TELECOMMUNICATION SERVICES - 7.9% |
Diversified Telecommunication Services - 2.8% |
AT&T, Inc. | 14,300 | | 420,134 |
Verizon Communications, Inc. | 11,040 | | 395,011 |
| | 815,145 |
Wireless Telecommunication Services - 5.1% |
Sprint Nextel Corp. (a) | 273,539 | | 1,157,070 |
Vodafone Group PLC sponsored ADR | 11,901 | | 314,543 |
| | 1,471,613 |
TOTAL TELECOMMUNICATION SERVICES | | 2,286,758 |
UTILITIES - 1.6% |
Electric Utilities - 1.6% |
NextEra Energy, Inc. | 5,009 | | 260,418 |
PPL Corp. | 7,700 | | 202,664 |
| | 463,082 |
TOTAL COMMON STOCKS (Cost $27,775,179) | 28,292,553 |
Money Market Funds - 6.1% |
| Shares | | Value |
Fidelity Cash Central Fund, 0.19% (b) | 729,504 | | $ 729,504 |
Fidelity Securities Lending Cash Central Fund, 0.21% (b)(c) | 1,024,350 | | 1,024,350 |
TOTAL MONEY MARKET FUNDS (Cost $1,753,854) | 1,753,854 |
TOTAL INVESTMENT PORTFOLIO - 103.9% (Cost $29,529,033) | | 30,046,407 |
NET OTHER ASSETS (LIABILITIES) - (3.9)% | | (1,124,013) |
NET ASSETS - 100% | $ 28,922,394 |
Legend |
(a) Non-income producing |
(b) Affiliated fund that is available only to investment companies and other accounts managed by Fidelity Investments. The rate quoted is the annualized seven-day yield of the fund at period end. A complete unaudited listing of the fund's holdings as of its most recent quarter end is available upon request. In addition, each Fidelity Central Fund's financial statements, which are not covered by the Fund's Report of Independent Registered Public Accounting Firm, are available on the SEC's website or upon request. |
(c) Investment made with cash collateral received from securities on loan. |
(d) Security or a portion of the security is on loan at period end. |
Affiliated Central Funds |
Information regarding fiscal year to date income earned by the Fund from investments in Fidelity Central Funds is as follows: |
Fund | Income earned |
Fidelity Cash Central Fund | $ 392 |
Fidelity Securities Lending Cash Central Fund | 3,306 |
Total | $ 3,698 |
Other Information |
All investments are categorized as Level 1 under the Fair Value Hierarchy. The inputs or methodology used for valuing securities may not be an indication of the risk associated with investing in those securities. For more information on valuation inputs, please refer to the Security Valuation section in the accompanying Notes to Financial Statements. |
Distribution of investments by country of issue, as a percentage of total net assets, is as follows: (Unaudited) |
United States of America | 77.9% |
Ireland | 6.2% |
Switzerland | 4.2% |
United Kingdom | 3.2% |
Mexico | 2.8% |
Canada | 2.0% |
Japan | 1.5% |
Bermuda | 1.3% |
Others (Individually Less Than 1%) | 0.9% |
| 100.0% |
Income Tax Information |
At December 31, 2010, the Fund had a capital loss carryforward of approximately $23,114,277 of which $11,669,055 and $11,445,222 will expire in fiscal 2016 and 2017, respectively. Capital loss carryforwards are only available to offset future capital gains of the Fund to the extent provided by regulations and may be limited. |
The Fund intends to elect to defer to its fiscal year ending December 31, 2011 approximately $1,302,610 of losses recognized during the period November 1, 2010 to December 31, 2010. |
See accompanying notes which are an integral part of the financial statements.
Annual Report
Statement of Assets and Liabilities
| December 31, 2010 |
| | |
Assets | | |
Investment in securities, at value (including securities loaned of $1,002,390) - See accompanying schedule: Unaffiliated issuers (cost $27,775,179) | $ 28,292,553 | |
Fidelity Central Funds (cost $1,753,854) | 1,753,854 | |
Total Investments (cost $29,529,033) | | $ 30,046,407 |
Cash | | 10 |
Receivable for investments sold | | 80,919 |
Receivable for fund shares sold | | 875 |
Dividends receivable | | 31,978 |
Distributions receivable from Fidelity Central Funds | | 1,965 |
Prepaid expenses | | 91 |
Receivable from investment adviser for expense reductions | | 2,674 |
Other receivables | | 925 |
Total assets | | 30,165,844 |
| | |
Liabilities | | |
Payable for investments purchased | $ 102,553 | |
Payable for fund shares redeemed | 36,417 | |
Accrued management fee | 13,450 | |
Distribution and service plan fees payable | 402 | |
Other affiliated payables | 3,707 | |
Other payables and accrued expenses | 62,571 | |
Collateral on securities loaned, at value | 1,024,350 | |
Total liabilities | | 1,243,450 |
| | |
Net Assets | | $ 28,922,394 |
Net Assets consist of: | | |
Paid in capital | | $ 53,510,789 |
Distributions in excess of net investment income | | (27,180) |
Accumulated undistributed net realized gain (loss) on investments and foreign currency transactions | | (25,058,433) |
Net unrealized appreciation (depreciation) on investments and assets and liabilities in foreign currencies | | 497,218 |
Net Assets | | $ 28,922,394 |
Statement of Assets and Liabilities - continued
| December 31, 2010 |
| | |
Initial Class:
Net Asset Value, offering price and redemption price per share ($9,855,086 ÷ 963,004 shares) | | $ 10.23 |
| | |
Service Class:
Net Asset Value, offering price and redemption price per share ($430,001 ÷ 42,026 shares) | | $ 10.23 |
| | |
Service Class 2:
Net Asset Value, offering price and redemption price per share ($1,779,000 ÷ 174,403 shares) | | $ 10.20 |
| | |
Investor Class:
Net Asset Value, offering price and redemption price per share ($16,858,307 ÷ 1,649,379 shares) | | $ 10.22 |
See accompanying notes which are an integral part of the financial statements.
Annual Report
Statement of Operations
| Year ended December 31, 2010 |
| | |
Investment Income | | |
Dividends | | $ 584,426 |
Interest | | 5 |
Income from Fidelity Central Funds | | 3,698 |
Total income | | 588,129 |
| | |
Expenses | | |
Management fee | $ 173,513 | |
Transfer agent fees | 43,572 | |
Distribution and service plan fees | 4,904 | |
Accounting and security lending fees | 12,140 | |
Custodian fees and expenses | 16,638 | |
Independent trustees' compensation | 179 | |
Audit | 42,630 | |
Legal | 140 | |
Miscellaneous | 434 | |
Total expenses before reductions | 294,150 | |
Expense reductions | (12,697) | 281,453 |
Net investment income (loss) | | 306,676 |
Realized and Unrealized Gain (Loss) Net realized gain (loss) on: | | |
Investment securities: | | |
Unaffiliated issuers | (274,272) | |
Foreign currency transactions | (3,424) | |
Total net realized gain (loss) | | (277,696) |
Change in net unrealized appreciation (depreciation) on: Investment securities | 2,710,198 | |
Assets and liabilities in foreign currencies | (100) | |
Total change in net unrealized appreciation (depreciation) | | 2,710,098 |
Net gain (loss) | | 2,432,402 |
Net increase (decrease) in net assets resulting from operations | | $ 2,739,078 |
Statement of Changes in Net Assets
| Year ended
December 31, 2010 | Year ended
December 31, 2009 |
Increase (Decrease) in Net Assets | | |
Operations | | |
Net investment income (loss) | $ 306,676 | $ 524,359 |
Net realized gain (loss) | (277,696) | (8,606,449) |
Change in net unrealized appreciation (depreciation) | 2,710,098 | 16,401,505 |
Net increase (decrease) in net assets resulting from operations | 2,739,078 | 8,319,415 |
Distributions to shareholders from net investment income | (362,992) | (567,198) |
Share transactions - net increase (decrease) | (7,962,055) | (18,654,274) |
Total increase (decrease) in net assets | (5,585,969) | (10,902,057) |
| | |
Net Assets | | |
Beginning of period | 34,508,363 | 45,410,420 |
End of period (including distributions in excess of net investment income of $27,180 and undistributed net investment income of $8,181, respectively) | $ 28,922,394 | $ 34,508,363 |
See accompanying notes which are an integral part of the financial statements.
Annual Report
Financial Highlights - Initial Class
Years ended December 31, | 2010 | 2009 | 2008 | 2007 | 2006 |
Selected Per-Share Data | | | | | |
Net asset value, beginning of period | $ 9.42 | $ 7.49 | $ 13.89 | $ 14.82 | $ 13.30 |
Income from Investment Operations | | | | | |
Net investment income (loss) C | .10 | .12 | .20 | .20 | .15 |
Net realized and unrealized gain (loss) | .84 | 1.97 | (6.39) | .48 | 1.86 |
Total from investment operations | .94 | 2.09 | (6.19) | .68 | 2.01 |
Distributions from net investment income | (.13) | (.16) | (.19) | (.21) | (.13) |
Distributions from net realized gain | - | - | (.02) | (1.40) | (.37) |
Total distributions | (.13) | (.16) | (.21) | (1.61) | (.49) G |
Net asset value, end of period | $ 10.23 | $ 9.42 | $ 7.49 | $ 13.89 | $ 14.82 |
Total Return A, B | 10.04% | 27.91% | (44.61)% | 4.56% | 15.18% |
Ratios to Average Net Assets D, F | | | | | |
Expenses before reductions | .90% | .89% | .81% | .80% | .84% |
Expenses net of fee waivers, if any | .85% | .85% | .81% | .80% | .84% |
Expenses net of all reductions | .85% | .85% | .81% | .80% | .83% |
Net investment income (loss) | 1.05% | 1.48% | 1.79% | 1.27% | 1.09% |
Supplemental Data | | | | | |
Net assets, end of period (000 omitted) | $ 9,855 | $ 12,826 | $ 18,847 | $ 30,300 | $ 42,725 |
Portfolio turnover rate E | 109% | 58% | 95% | 98% | 94% |
A Total returns do not reflect charges attributable to your insurance company's separate account. Inclusion of these charges would reduce the total returns shown.
B Total returns would have been lower had certain expenses not been reduced during the periods shown.
C Calculated based on average shares outstanding during the period.
D Fees and expenses of the underlying Fidelity Central Funds are not included in the Fund's expense ratio. The Fund indirectly bears its proportionate share of the expenses of any underlying Fidelity Central Funds.
E Amount does not include the portfolio activity of any underlying Fidelity Central Funds.
F Expense ratios reflect operating expenses of the class. Expenses before reductions do not reflect amounts reimbursed by the investment adviser or reductions from brokerage service arrangements or reductions from other expense offset arrangements and do not represent the amount paid by the class during periods when reimbursements or reductions occur. Expenses net of fee waivers reflect expenses after reimbursement by the investment adviser but prior to reductions from brokerage service arrangements or other expense offset arrangements. Expenses net of all reductions represent the net expenses paid by the class.
G Total distributions of $.49 per share is comprised of distributions from net investment income of $.129 and distributions from net realized gain of $.365 per share.
Financial Highlights - Service Class
Years ended December 31, | 2010 | 2009 | 2008 | 2007 | 2006 |
Selected Per-Share Data | | | | | |
Net asset value, beginning of period | $ 9.41 | $ 7.48 | $ 13.86 | $ 14.80 | $ 13.28 |
Income from Investment Operations | | | | | |
Net investment income (loss) C | .09 | .11 | .19 | .18 | .14 |
Net realized and unrealized gain (loss) | .85 | 1.96 | (6.38) | .48 | 1.86 |
Total from investment operations | .94 | 2.07 | (6.19) | .66 | 2.00 |
Distributions from net investment income | (.12) | (.14) | (.17) | (.20) | (.12) |
Distributions from net realized gain | - | - | (.02) | (1.40) | (.37) |
Total distributions | (.12) | (.14) | (.19) | (1.60) | (.48) G |
Net asset value, end of period | $ 10.23 | $ 9.41 | $ 7.48 | $ 13.86 | $ 14.80 |
Total Return A, B | 10.01% | 27.80% | (44.69)% | 4.43% | 15.11% |
Ratios to Average Net Assets D, F | | | | | |
Expenses before reductions | .98% | .97% | .90% | .89% | .93% |
Expenses net of fee waivers, if any | .95% | .95% | .90% | .89% | .93% |
Expenses net of all reductions | .95% | .95% | .90% | .89% | .93% |
Net investment income (loss) | .95% | 1.38% | 1.70% | 1.18% | 1.00% |
Supplemental Data | | | | | |
Net assets, end of period (000 omitted) | $ 430 | $ 677 | $ 956 | $ 2,577 | $ 2,458 |
Portfolio turnover rate E | 109% | 58% | 95% | 98% | 94% |
A Total returns do not reflect charges attributable to your insurance company's separate account. Inclusion of these charges would reduce the total returns shown.
B Total returns would have been lower had certain expenses not been reduced during the periods shown.
C Calculated based on average shares outstanding during the period.
D Fees and expenses of the underlying Fidelity Central Funds are not included in the Fund's expense ratio. The Fund indirectly bears its proportionate share of the expenses of any underlying Fidelity Central Funds.
E Amount does not include the portfolio activity of any underlying Fidelity Central Funds.
F Expense ratios reflect operating expenses of the class. Expenses before reductions do not reflect amounts reimbursed by the investment adviser or reductions from brokerage service arrangements or reductions from other expense offset arrangements and do not represent the amount paid by the class during periods when reimbursements or reductions occur. Expenses net of fee waivers reflect expenses after reimbursement by the investment adviser but prior to reductions from brokerage service arrangements or other expense offset arrangements. Expenses net of all reductions represent the net expenses paid by the class.
G Total distributions of $.48 per share is comprised of distributions from net investment income of $.116 and distributions from net realized gain of $.365 per share.
See accompanying notes which are an integral part of the financial statements.
Annual Report
Financial Highlights - Service Class 2
Years ended December 31, | 2010 | 2009 | 2008 | 2007 | 2006 |
Selected Per-Share Data | | | | | |
Net asset value, beginning of period | $ 9.39 | $ 7.46 | $ 13.80 | $ 14.75 | $ 13.25 |
Income from Investment Operations | | | | | |
Net investment income (loss) C | .08 | .10 | .18 | .15 | .12 |
Net realized and unrealized gain (loss) | .84 | 1.96 | (6.35) | .48 | 1.84 |
Total from investment operations | .92 | 2.06 | (6.17) | .63 | 1.96 |
Distributions from net investment income | (.11) | (.13) | (.15) | (.18) | (.10) |
Distributions from net realized gain | - | - | (.02) | (1.40) | (.37) |
Total distributions | (.11) | (.13) | (.17) | (1.58) | (.46) G |
Net asset value, end of period | $ 10.20 | $ 9.39 | $ 7.46 | $ 13.80 | $ 14.75 |
Total Return A, B | 9.81% | 27.70% | (44.77)% | 4.22% | 14.86% |
Ratios to Average Net Assets D, F | | | | | |
Expenses before reductions | 1.12% | 1.12% | 1.05% | 1.07% | 1.14% |
Expenses net of fee waivers, if any | 1.10% | 1.10% | 1.05% | 1.07% | 1.10% |
Expenses net of all reductions | 1.10% | 1.10% | 1.05% | 1.06% | 1.09% |
Net investment income (loss) | .80% | 1.23% | 1.55% | 1.01% | .83% |
Supplemental Data | | | | | |
Net assets, end of period (000 omitted) | $ 1,779 | $ 1,756 | $ 2,001 | $ 5,724 | $ 4,467 |
Portfolio turnover rate E | 109% | 58% | 95% | 98% | 94% |
A Total returns do not reflect charges attributable to your insurance company's separate account. Inclusion of these charges would reduce the total returns shown.
B Total returns would have been lower had certain expenses not been reduced during the periods shown.
C Calculated based on average shares outstanding during the period.
D Fees and expenses of the underlying Fidelity Central Funds are not included in the Fund's expense ratio. The Fund indirectly bears its proportionate share of the expenses of any underlying Fidelity Central Funds.
E Amount does not include the portfolio activity of any underlying Fidelity Central Funds.
F Expense ratios reflect operating expenses of the class. Expenses before reductions do not reflect amounts reimbursed by the investment adviser or reductions from brokerage service arrangements or reductions from other expense offset arrangements and do not represent the amount paid by the class during periods when reimbursements or reductions occur. Expenses net of fee waivers reflect expenses after reimbursement by the investment adviser but prior to reductions from brokerage service arrangements or other expense offset arrangements. Expenses net of all reductions represent the net expenses paid by the class.
G Total distributions of $.46 per share is comprised of distributions from net investment income of $.99 and distributions from net realized gain of $.365 per share.
Financial Highlights - Investor Class
Years ended December 31, | 2010 | 2009 | 2008 | 2007 | 2006 |
Selected Per-Share Data | | | | | |
Net asset value, beginning of period | $ 9.40 | $ 7.48 | $ 13.87 | $ 14.81 | $ 13.30 |
Income from Investment Operations | | | | | |
Net investment income (loss) C | .09 | .11 | .19 | .18 | .14 |
Net realized and unrealized gain (loss) | .85 | 1.96 | (6.38) | .48 | 1.86 |
Total from investment operations | .94 | 2.07 | (6.19) | .66 | 2.00 |
Distributions from net investment income | (.12) | (.15) | (.18) | (.20) | (.12) |
Distributions from net realized gain | - | - | (.02) | (1.40) | (.37) |
Total distributions | (.12) | (.15) | (.20) | (1.60) | (.49) G |
Net asset value, end of period | $ 10.22 | $ 9.40 | $ 7.48 | $ 13.87 | $ 14.81 |
Total Return A, B | 10.08% | 27.72% | (44.67)% | 4.41% | 15.06% |
Ratios to Average Net Assets D, F | | | | | |
Expenses before reductions | .96% | .97% | .90% | .91% | .97% |
Expenses net of fee waivers, if any | .93% | .93% | .90% | .91% | .97% |
Expenses net of all reductions | .93% | .93% | .90% | .91% | .96% |
Net investment income (loss) | .97% | 1.40% | 1.71% | 1.16% | .96% |
Supplemental Data | | | | | |
Net assets, end of period (000 omitted) | $ 16,858 | $ 19,249 | $ 23,606 | $ 39,614 | $ 28,274 |
Portfolio turnover rate E | 109% | 58% | 95% | 98% | 94% |
A Total returns do not reflect charges attributable to your insurance company's separate account. Inclusion of these charges would reduce the total returns shown.
B Total returns would have been lower had certain expenses not been reduced during the periods shown.
C Calculated based on average shares outstanding during the period.
D Fees and expenses of the underlying Fidelity Central Funds are not included in the Fund's expense ratio. The Fund indirectly bears its proportionate share of the expenses of any underlying Fidelity Central Funds.
E Amount does not include the portfolio activity of any underlying Fidelity Central Funds.
F Expense ratios reflect operating expenses of the class. Expenses before reductions do not reflect amounts reimbursed by the investment adviser or reductions from brokerage service arrangements or reductions from other expense offset arrangements and do not represent the amount paid by the class during periods when reimbursements or reductions occur. Expenses net of fee waivers reflect expenses after reimbursement by the investment adviser but prior to reductions from brokerage service arrangements or other expense offset arrangements. Expenses net of all reductions represent the net expenses paid by the class.
G Total distributions of $.49 per share is comprised of distributions from net investment income of $.123 and distributions from net realized gain of $.365 per share.
See accompanying notes which are an integral part of the financial statements.
Annual Report
Notes to Financial Statements
For the period ended December 31, 2010
1. Organization.
VIP Value Leaders Portfolio (the Fund) is a fund of Variable Insurance Products Fund IV (the Trust) and is authorized to issue an unlimited number of shares. The Trust is registered under the Investment Company Act of 1940, as amended (the 1940 Act), as an open-end management investment company organized as a Massachusetts business trust. Shares of the Fund may only be purchased by insurance companies for the purpose of funding variable annuity or variable life insurance contracts. The Fund offers the following classes of shares: Initial Class shares, Service Class shares, Service Class 2 shares, and Investor Class shares. All classes have equal rights and voting privileges, except for matters affecting a single class. Investment income, realized and unrealized capital gains and losses, the common expenses of the Fund, and certain fund-level expense reductions, if any, are allocated on a pro-rata basis to each class based on the relative net assets of each class to the total net assets of the Fund. Each class differs with respect to distribution and service plan fees incurred. Certain expense reductions may also differ by class.
2. Investments in Fidelity Central Funds.
The Fund may invest in Fidelity Central Funds, which are open-end investment companies available only to other investment companies and accounts managed by Fidelity Management & Research Company (FMR) and its affiliates. The Fund's Schedule of Investments lists each of the Fidelity Central Funds held as of period end, if any, as an investment of the Fund, but does not include the underlying holdings of each Fidelity Central Fund. As an Investing Fund, the Fund indirectly bears its proportionate share of the expenses of the underlying Fidelity Central Funds.
The Money Market Central Funds seek preservation of capital and current income and are managed by Fidelity Investments Money Management, Inc. (FIMM), an affiliate of FMR.
A complete unaudited list of holdings for each Fidelity Central Fund is available upon request or at the Securities and Exchange Commission (the SEC) web site at www.sec.gov. In addition, the financial statements of the Fidelity Central Funds, which are not covered by the Fund's Report of Independent Registered Public Accounting Firm, are available on the SEC web site or upon request.
3. Significant Accounting Policies.
The financial statements have been prepared in conformity with accounting principles generally accepted in the United States of America (GAAP), which require management to make certain estimates and assumptions at the date of the financial statements. Actual results could differ from those estimates. Subsequent events, if any, through the date that the financial statements were issued have been evaluated in the preparation of the financial statements. The following summarizes the significant accounting policies of the Fund:
Security Valuation. Investments are valued as of 4:00 p.m. Eastern time on the last calendar day of the period. The Fund uses independent pricing services approved by the Board of Trustees to value its investments. When current market prices or quotations are not readily available or reliable, valuations may be determined in good faith in accordance with procedures adopted by the Board of Trustees. Factors used in determining value may include market or security specific events. The frequency with which these procedures are used cannot be predicted and they may be utilized to a significant extent. The value used for net asset value (NAV) calculation under these procedures may differ from published prices for the same securities.
The Fund categorizes the inputs to valuation techniques used to value its investments into a disclosure hierarchy consisting of three levels as shown below.
Level 1 - quoted prices in active markets for identical investments
Level 2 - other significant observable inputs (including quoted prices for similar investments, interest rates, prepayment speeds, etc.)
Level 3 - unobservable inputs (including the Fund's own assumptions based on the best information available)
Changes in valuation techniques may result in transfers in or out of an assigned level within the disclosure hierarchy. Valuation techniques used to value the Fund's investments by major category are as follows.
Equity securities, including restricted securities, for which market quotations are readily available, are valued at the last reported sale price or official closing price as reported by an independent pricing service on the primary market or exchange on which they are traded and are categorized as Level 1 in the hierarchy. In the event there were no sales during the day or closing prices are not available, securities are valued at the last quoted bid price or may be valued using the last available price and are generally categorized as Level 2 in the hierarchy. For foreign equity securities, when significant market or security specific events arise, comparisons to the valuation of American Depositary Receipts (ADRs), futures contracts, Exchange-traded funds (ETFs) and certain indexes as well as quoted prices for similar securities are used and are categorized as Level 2 in the hierarchy in these circumstances. Utilizing these techniques may result in transfers between Level 1 and Level 2. For restricted equity securities and private placements where observable inputs are limited, assumptions about market activity and risk are used and are categorized as Level 3 in the hierarchy.
Annual Report
3. Significant Accounting Policies - continued
Security Valuation - continued
Investments in open-end mutual funds, including Fidelity Central Funds, are valued at their closing net asset value each business day and are categorized as Level 1 in the hierarchy.
Foreign Currency. The Fund uses foreign currency contracts to facilitate transactions in foreign-denominated securities. Gains and losses from these transactions may arise from changes in the value of the foreign currency or if the counterparties do not perform under the contracts' terms.
Foreign-denominated assets, including investment securities, and liabilities are translated into U.S. dollars at the exchange rate at period end. Purchases and sales of investment securities, income and dividends received and expenses denominated in foreign currencies are translated into U.S. dollars at the exchange rate in effect on the transaction date.
The effects of exchange rate fluctuations on investments are included with the net realized and unrealized gain (loss) on investment securities. Other foreign currency transactions resulting in realized and unrealized gain (loss) are disclosed separately.
Investment Transactions and Income. For financial reporting purposes, the Fund's investment holdings and NAV include trades executed through the end of the last business day of the period. The NAV per share for processing shareholder transactions is calculated as of the close of business of the New York Stock Exchange (NYSE), normally 4:00 p.m. Eastern time and includes trades executed through the end of the prior business day. Gains and losses on securities sold are determined on the basis of identified cost and may include proceeds received from litigation. Dividend income is recorded on the ex-dividend date, except for certain dividends from foreign securities where the ex-dividend date may have passed, which are recorded as soon as the Fund is informed of the ex-dividend date. Non-cash dividends included in dividend income, if any, are recorded at the fair market value of the securities received. Distributions received on securities that represent a return of capital or capital gain are recorded as a reduction of cost of investments and/or as a realized gain. The Fund estimates the components of distributions received that may be considered return of capital distributions or capital gain distributions. Interest income and distributions from the Fidelity Central Funds are accrued as earned. Interest income includes coupon interest and amortization of premium and accretion of discount on debt securities. Investment income is recorded net of foreign taxes withheld where recovery of such taxes is uncertain.
Expenses. Expenses directly attributable to a fund are charged to that fund. Expenses attributable to more than one fund are allocated among the respective funds on the basis of relative net assets or other appropriate methods. Expense estimates are accrued in the period to which they relate and adjustments are made when actual amounts are known.
Income Tax Information and Distributions to Shareholders. Each year the Fund intends to qualify as a regulated investment company, including distributing substantially all of its taxable income and realized gains under Subchapter M of the Internal Revenue Code and filing its U.S. federal tax return. As a result, no provision for income taxes is required. As of December 31, 2010, the Fund did not have any unrecognized tax benefits in the accompanying financial statements. A fund's federal tax return is subject to examination by the Internal Revenue Service (IRS) for a period of three years. Foreign taxes are provided for based on the Fund's understanding of the tax rules and rates that exist in the foreign markets in which it invests.
Distributions are declared and recorded on the ex-dividend date. Income dividends and capital gain distributions are declared separately for each class. Income and capital gain distributions are determined in accordance with income tax regulations, which may differ from GAAP.
Capital accounts within the financial statements are adjusted for permanent book-tax differences. These adjustments have no impact on net assets or the results of operations. Temporary book-tax differences will reverse in a subsequent period.
Book-tax differences are primarily due to foreign currency transactions, partnerships, capital loss carryforwards and losses deferred due to wash sales and excise tax regulations.
The federal tax cost of investment securities and unrealized appreciation (depreciation) as of period end were as follows:
Gross unrealized appreciation | $ 2,486,494 |
Gross unrealized depreciation | (2,613,688) |
Net unrealized appreciation (depreciation) | $ (127,194) |
Tax Cost | $ 30,173,601 |
The tax-based components of distributable earnings as of period end were as follows:
Capital loss carryforward | $ (23,114,277) |
Net unrealized appreciation (depreciation) | $ (147,350) |
Annual Report
Notes to Financial Statements - continued
3. Significant Accounting Policies - continued
Income Tax Information and Distributions to Shareholders - continued
The tax character of distributions paid was as follows:
| December 31, 2010 | December 31, 2009 |
Ordinary Income | $ 362,992 | $ 567,198 |
4. Purchases and Sales of Investments.
Purchases and sales of securities, other than short-term securities, aggregated $33,365,480 and $41,835,137, respectively.
5. Fees and Other Transactions with Affiliates.
Management Fee. FMR and its affiliates provide the Fund with investment management related services for which the Fund pays a monthly management fee. The management fee is the sum of an individual fund fee rate that is based on an annual rate of .30% of the Fund's average net assets and a group fee rate that averaged .26% during the period. The group fee rate is based upon the average net assets of all the mutual funds advised by FMR. The group fee rate decreases as assets under management increase and increases as assets under management decrease. For the period, the total annual management fee rate was .56% of the Fund's average net assets.
Distribution and Service Plan Fees. In accordance with Rule 12b-1 of the 1940 Act, the Fund has adopted separate 12b-1 Plans for each Service Class of shares. Each Service Class pays Fidelity Distributors Corporation (FDC), an affiliate of FMR, a service fee. For the period, the service fee is based on an annual rate of .10% of Service Class' average net assets and .25% of Service Class 2's average net assets.
For the period, total fees, all of which were re-allowed to insurance companies for the distribution of shares and providing shareholder support services were as follows:
Service Class | $ 545 |
Service Class 2 | 4,359 |
| $ 4,904 |
Transfer Agent Fees. Fidelity Investments Institutional Operations Company, Inc. (FIIOC), an affiliate of FMR, is the Fund's transfer, dividend disbursing, and shareholder servicing agent. FIIOC receives an asset-based fee with respect to each class. Each class (with the exception of Investor Class) pays a transfer agent fee, excluding out of pocket expenses, equal to an annual rate of .07% of average net assets. Investor Class pays a monthly asset-based transfer agent fee of .15% of average net assets. In addition, FIIOC receives an asset-based fee of .01% of average net assets for typesetting, printing and mailing of shareholder reports, except proxy statements. FIIOC has agreed to voluntarily waive this fee until December 31, 2010. (See Note 8: Expense Reductions) For the period, transfer agent fees for each class, including printing and out of pocket expenses, were as follows:
Initial Class | $ 11,346 |
Service Class | 470 |
Service Class 2 | 1,322 |
Investor Class | 30,434 |
| $ 43,572 |
Accounting and Security Lending Fees. Fidelity Service Company, Inc. (FSC), an affiliate of FMR, maintains the Fund's accounting records. The accounting fee is based on the level of average net assets for the month. Under a separate contract, FSC administers the security lending program. The security lending fee is based on the number and duration of lending transactions.
Brokerage Commissions. The Fund placed a portion of is portfolio transactions with brokerage firms which are affiliates of the investment adviser. The commissions paid to these affiliated firms were $1,723 for the period.
6. Committed Line of Credit.
The Fund participates with other funds managed by FMR or an affiliate in a $3.75 billion credit facility (the "line of credit") to be utilized for temporary or emergency purposes to fund shareholder redemptions or for other short-term liquidity purposes. The Fund has agreed to pay commitment fees on its pro-rata portion of the line of credit, which amounted to $129 and is reflected in Miscellaneous expenses on the Statement of Operations. During the period, there were no borrowings on this line of credit.
Annual Report
7. Security Lending.
The Fund lends portfolio securities through a lending agent from time to time in order to earn additional income. The lending agent may loan securities to certain qualified borrowers, including Fidelity Capital Markets (FCM), a broker-dealer affiliated with the Fund. On the settlement date of the loan, the Fund receives collateral (in the form of U.S. Treasury obligations, letters of credit and/or cash) against the loaned securities and maintains collateral in an amount not less than 100% of the market value of the loaned securities during the period of the loan. The market value of the loaned securities is determined at the close of business of the Fund and any additional required collateral is delivered to the Fund on the next business day. If the borrower defaults on its obligation to return the securities loaned because of insolvency or other reasons, a fund could experience delays and costs in recovering the securities loaned or in gaining access to the collateral. Any cash collateral received is invested in the Fidelity Securities Lending Cash Central Fund. The value of loaned securities and cash collateral at period end are disclosed on the Fund's Statement of Assets and Liabilities. Security lending income represents the income earned on investing cash collateral, less rebates paid to borrowers and lending agent fees associated with the loan, plus any premium payments received for lending certain types of securities. Security lending income is presented in the Statement of Operations as a component of income from Fidelity Central Funds. Total security lending income during the period amounted to $3,306. During the period, there were no securities loaned to FCM.
8. Expense Reductions.
In addition to FIIOC waiving a portion of its transfer agent fees, FMR voluntarily agreed to reimburse each class to the extent annual operating expenses exceeded certain levels of average net assets as noted in the table below. Some expenses, for example interest expense, including commitment fees, are excluded from this reimbursement.
The following classes were in reimbursement during the period:
| Expense
Limitations | Reimbursement/Waiver |
Initial Class | .85% | $ 4,990 |
Service Class | .95% | 152 |
Service Class 2 | 1.10% | 322 |
Investor Class | .93 | 5,912 |
| | $ 11,376 |
Many of the brokers with whom FMR places trades on behalf of the Fund provided services to the Fund in addition to trade execution. These services included payments of certain expenses on behalf of the Fund totaling $1,321 for the period.
9. Distributions to Shareholders.
Distributions to shareholders of each class were as follows:
Years ended December 31, | 2010 | 2009 |
From net investment income | | |
Initial Class | $ 130,937 | $ 219,670 |
Service Class | 5,302 | 10,712 |
Service Class 2 | 18,862 | 24,668 |
Investor Class | 207,891 | 312,148 |
Total | $ 362,992 | $ 567,198 |
10. Share Transactions.
Transactions for each class of shares were as follows:
| Shares | Dollars |
Years ended December 31, | 2010 | 2009 | 2010 | 2009 |
Initial Class | | | | |
Shares sold | 106,286 | 239,960 | $ 1,020,513 | $ 1,819,515 |
Reinvestment of distributions | 13,140 | 24,543 | 130,937 | 219,670 |
Shares redeemed | (518,502) | (1,420,346) | (4,946,649) | (10,917,966) |
Net increase (decrease) | (399,076) | (1,155,843) | $ (3,795,199) | $ (8,878,781) |
Annual Report
Notes to Financial Statements - continued
10. Share Transactions - continued
| Shares | Dollars |
Years ended December 31, | 2010 | 2009 | 2010 | 2009 |
Service Class | | | | |
Reinvestment of distributions | 533 | 1,203 | $ 5,302 | $ 10,712 |
Shares redeemed | (30,453) | (57,024) | (288,127) | (445,124) |
Net increase (decrease) | (29,920) | (55,821) | $ (282,825) | $ (434,412) |
Service Class 2 | | | | |
Shares sold | 42,974 | 85,657 | $ 405,896 | $ 640,879 |
Reinvestment of distributions | 1,899 | 2,768 | 18,862 | 24,668 |
Shares redeemed | (57,569) | (169,508) | (536,974) | (1,319,098) |
Net increase (decrease) | (12,696) | (81,083) | $ (112,216) | $ (653,551) |
Investor Class | | | | |
Shares sold | 328,691 | 494,371 | $ 3,157,179 | $ 3,783,197 |
Reinvestment of distributions | 20,878 | 34,870 | 207,891 | 312,148 |
Shares redeemed | (746,921) | (1,639,748) | (7,136,885) | (12,782,875) |
Net increase (decrease) | (397,352) | (1,110,507) | $ (3,771,815) | $ (8,687,530) |
11. Other.
The Fund's organizational documents provide former and current trustees and officers with a limited indemnification against liabilities arising in connection with the performance of their duties to the Fund. In the normal course of business, the Fund may also enter into contracts that provide general indemnifications. The Fund's maximum exposure under these arrangements is unknown as this would be dependent on future claims that may be made against the Fund. The risk of material loss from such claims is considered remote.
At the end of the period, FMR or its affiliates were the owners of record of 95% of the total outstanding shares of the Fund.
Annual Report
Report of Independent Registered Public Accounting Firm
To the Trustees of Variable Insurance Products Fund IV and the Shareholders of VIP Value Leaders Portfolio:
In our opinion, the accompanying statement of assets and liabilities, including the schedule of investments, and the related statements of operations and of changes in net assets and the financial highlights present fairly, in all material respects, the financial position of VIP Value Leaders Portfolio (a fund of Variable Insurance Products Fund IV) at December 31, 2010, the results of its operations for the year then ended, the changes in its net assets for each of the two years in the period then ended and the financial highlights for each of the five years in the period then ended, in conformity with accounting principles generally accepted in the United States of America. These financial statements and financial highlights (hereafter referred to as "financial statements") are the responsibility of the VIP Value Leaders Portfolio's management. Our responsibility is to express an opinion on these financial statements based on our audits. We conducted our audits of these financial statements in accordance with the standards of the Public Company Accounting Oversight Board (United States). Those standards require that we plan and perform the audit to obtain reasonable assurance about whether the financial statements are free of material misstatement. An audit includes examining, on a test basis, evidence supporting the amounts and disclosures in the financial statements, assessing the accounting principles used and significant estimates made by management, and evaluating the overall financial statement presentation. We believe that our audits, which included confirmation of securities at December 31, 2010 by correspondence with the custodian and brokers, provide a reasonable basis for our opinion.
/s/ PricewaterhouseCoopers LLP
PricewaterhouseCoopers LLP
Boston, Massachusetts
February 22, 2011
Annual Report
The Trustees, Members of the Advisory Board, and executive officers of the trust and fund, as applicable, are listed below. The Board of Trustees governs the fund and is responsible for protecting the interests of shareholders. The Trustees are experienced executives who meet periodically throughout the year to oversee the fund's activities, review contractual arrangements with companies that provide services to the fund, oversee management of the risks associated with such activities and contractual arrangements, and review the fund's performance. Except for James C. Curvey, each of the Trustees oversees 219 funds advised by FMR or an affiliate. Mr. Curvey oversees 408 funds advised by FMR or an affiliate.
The Trustees hold office without limit in time except that (a) any Trustee may resign; (b) any Trustee may be removed by written instrument, signed by at least two-thirds of the number of Trustees prior to such removal; (c) any Trustee who requests to be retired or who has become incapacitated by illness or injury may be retired by written instrument signed by a majority of the other Trustees; and (d) any Trustee may be removed at any special meeting of shareholders by a two-thirds vote of the outstanding voting securities of the trust. Each Trustee who is not an interested person (as defined in the 1940 Act) (Independent Trustee), shall retire not later than the last day of the calendar year in which his or her 72nd birthday occurs. The Independent Trustees may waive this mandatory retirement age policy with respect to individual Trustees. The executive officers and Advisory Board Members hold office without limit in time, except that any officer and Advisory Board Member may resign or may be removed by a vote of a majority of the Trustees at any regular meeting or any special meeting of the Trustees. Except as indicated, each individual has held the office shown or other offices in the same company for the past five years.
Experience, Skills, Attributes, and Qualifications of the Fund's Trustees. The Governance and Nominating Committee has adopted a statement of policy that describes the experience, qualifications, attributes, and skills that are necessary and desirable for potential Independent Trustee candidates (Statement of Policy). The Board believes that each Trustee satisfied at the time he or she was initially elected or appointed a Trustee, and continues to satisfy, the standards contemplated by the Statement of Policy. The Governance and Nominating Committee also engages professional search firms to help identify potential Independent Trustee candidates who have the experience, qualifications, attributes, and skills consistent with the Statement of Policy. From time to time, additional criteria based on the composition and skills of the current Independent Trustees, as well as experience or skills that may be appropriate in light of future changes to board composition, business conditions, and regulatory or other developments, have also been considered by the professional search firms and the Governance and Nominating Committee. In addition, the Board takes into account the Trustees' commitment and participation in Board and committee meetings, as well as their leadership of standing and ad hoc committees throughout their tenure.
In determining that a particular Trustee was and continues to be qualified to serve as a Trustee, the Board has considered a variety of criteria, none of which, in isolation, was controlling. The Board believes that, collectively, the Trustees have balanced and diverse experience, qualifications, attributes, and skills, which allow the Board to operate effectively in governing the fund and protecting the interests of shareholders. Information about the specific experience, skills, attributes, and qualifications of each Trustee, which in each case led to the Board's conclusion that the Trustee should serve (or continue to serve) as a trustee of the fund, is provided below.
Board Structure and Oversight Function. James C. Curvey is an interested person (as defined in the 1940 Act) and currently serves as Acting Chairman. The Trustees have determined that an interested Chairman is appropriate and benefits shareholders because an interested Chairman has a personal and professional stake in the quality and continuity of services provided to the fund. Independent Trustees exercise their informed business judgment to appoint an individual of their choosing to serve as Chairman, regardless of whether the Trustee happens to be independent or a member of management. The Independent Trustees have determined that they can act independently and effectively without having an Independent Trustee serve as Chairman and that a key structural component for assuring that they are in a position to do so is for the Independent Trustees to constitute a substantial majority for the Board. The Independent Trustees also regularly meet in executive session. Ned C. Lautenbach serves as Chairman of the Independent Trustees and as such (i) acts as a liaison between the Independent Trustees and management with respect to matters important to the Independent Trustees and (ii) with management prepares agendas for Board meetings.
Fidelity funds are overseen by different Boards of Trustees. The fund's Board oversees Fidelity's equity and high income funds and another Board oversees Fidelity's investment-grade bond, money market, and asset allocation funds. The asset allocation funds may invest in Fidelity funds overseen by the fund's Board. The use of separate Boards, each with its own committee structure, allows the Trustees of each group of Fidelity funds to focus on the unique issues of the funds they oversee, including common research, investment, and operational issues. On occasion, the separate Boards establish joint committees to address issues of overlapping consequences for the Fidelity funds overseen by each Board.
The Trustees operate using a system of committees to facilitate the timely and efficient consideration of all matters of importance to the Trustees, the fund, and fund shareholders and to facilitate compliance with legal and regulatory requirements and oversight of the fund's activities and associated risks. The Board, acting through its committees, has charged FMR and its affiliates with (i) identifying events or circumstances the occurrence of which could have demonstrably adverse effects on the fund's business and/or reputation; (ii) implementing processes and controls to lessen the possibility that such events or circumstances occur or to mitigate the effects of such events or circumstances if they do occur; and (iii) creating and maintaining a system designed to evaluate continuously business and market conditions in order to facilitate the identification and implementation processes described in (i) and (ii) above. Because the day-to-day operations and activities of the fund are carried out by or through FMR, its affiliates and other service providers, the fund's exposure to risks is mitigated but not eliminated by the processes overseen by the Trustees. While each of the Board's committees has responsibility for overseeing different aspects of the fund's activities, oversight is exercised primarily through the Operations, Audit, and Compliance Committees. Appropriate personnel, including but not limited to the fund's Chief Compliance Officer (CCO), FMR's internal auditor, the independent accountants, the fund's Treasurer and portfolio management personnel, make periodic reports to the Board's committees, as appropriate. The responsibilities of each committee, including their oversight responsibilities, are described further under "Standing Committees of the Fund's Trustees."
Annual Report
Trustees and Officers - continued
The fund's Statement of Additional Information (SAI) includes more information about the Trustees. To request a free copy, call Fidelity at 1-877-208-0098.
Interested Trustees*:
Correspondence intended for each Trustee who is an interested person may be sent to Fidelity Investments, 82 Devonshire Street, Boston, Massachusetts 02109.
Name, Age; Principal Occupations and Other Relevant Experience+ |
James C. Curvey (75) |
| Year of Election or Appointment: 2007 Mr. Curvey is Trustee and Acting Chairman of the Board of Trustees of certain Trusts. Mr. Curvey also serves as Trustee (2007-present) of other investment companies advised by FMR. Mr. Curvey is a Director of Fidelity Investments Money Management, Inc. (2009-
present), Director of Fidelity Research & Analysis Co. (2009-present) and Director of FMR and FMR Co., Inc. (2007-present). Mr. Curvey is also Vice Chairman (2007-present) and Director of FMR LLC. In addition, Mr. Curvey serves as an Overseer for the Boston Symphony Orchestra and a member of the Trustees of Villanova University. Previously, Mr. Curvey was the Vice Chairman (2006-2007) and Director (2000-2007) of FMR Corp. |
Ronald P. O'Hanley (54) |
| Year of Election or Appointment: 2011 Mr. O'Hanley is President of Fidelity Asset Management and Corporate Services and a member of Fidelity's Executive Committee (2010-present). Previously, Mr. O'Hanley served as President and Chief Executive Officer of BNY Mellon Asset Management (2007-2010). Mr. O'Hanley also served as Vice Chairman of Bank New York Mellon Corp. and a member of that firm's Executive Committee. Prior to the 2007 merger of The Bank of New York and Mellon Financial Corporation, he was Vice Chairman of Mellon Financial Corporation and President and Chief Executive Officer of Mellon Asset Management. He joined Mellon in February 1997. Mr. O'Hanley currently serves as Chairman of the Boston Public Library Foundation Board of Directors and sits on the Board of Directors of Beth Israel Deaconess Medical Center, the Board of Trustees of the Marine Biological Laboratory and the Advisory Board of the Maxwell School of Citizenship and Public Administration at Syracuse University. Mr. O'Hanley also chairs the Council on Asset Management for the Financial Services Roundtable and is a member of the Board of Directors of Institutional Investor's U.S. Institute. |
* Trustees have been determined to be "Interested Trustees" by virtue of, among other things, their affiliation with the trust various entities under common control with FMR.
+ The information above includes each Trustee's principal occupation during the last five years and other information relating to the experience, attributes, and skills relevant to each Trustee's qualifications to serve as a Trustee, which led to the conclusion that each Trustee should serve as a Trustee for the fund.
Independent Trustees:
Correspondence intended for each Independent Trustee (that is, the Trustees other than the Interested Trustees) may be sent to Fidelity Investments, P.O. Box 55235, Boston, Massachusetts 02205-5235.
Name, Age; Principal Occupations and Other Relevant Experience+ |
Dennis J. Dirks (62) |
| Year of Election or Appointment: 2005 Prior to his retirement in May 2003, Mr. Dirks was Chief Operating Officer and a member of the Board of The Depository Trust & Clearing Corporation (DTCC). He also served as President, Chief Operating Officer, and Board member of The Depository Trust Company (DTC) and President and Board member of the National Securities Clearing Corporation (NSCC). In addition, Mr. Dirks served as Chief Executive Officer and Board member of the Government Securities Clearing Corporation, Chief Executive Officer and Board member of the Mortgage-Backed Securities Clearing Corporation, as a Trustee and a member of the Finance Committee of Manhattan College (2005-2008), and as a Trustee and a member of the Finance Committee of AHRC of Nassau County (2006-2008). Mr. Dirks is a member of the Independent Directors Council (IDC) Governing Council (2010-Present) and Board of Directors for The Brookville Center for Children's Services, Inc. (2009-present). |
Alan J. Lacy (57) |
| Year of Election or Appointment: 2008 Mr. Lacy serves as Senior Adviser (2007-present) of Oak Hill Capital Partners, L.P. (private equity). Mr. Lacy also served as Chief Executive Officer (2000-2005) and Vice Chairman (2005-2006) of Sears Holdings Corporation and Sears, Roebuck and Co. (retail). In addition, Mr. Lacy serves as a member of the Board of Directors of The Western Union Company (global money transfer, 2006-present) and Bristol-Myers Squibb Company (global pharmaceuticals, 2007-present). Mr. Lacy is Chairman (2008-present) and a member (2006-present) of the Board of Trustees of The National Parks Conservation Association. |
Ned C. Lautenbach (66) |
| Year of Election or Appointment: 2000 Mr. Lautenbach is Chairman of the Independent Trustees of the Equity and High Income Funds (2006-present). Mr. Lautenbach currently serves as the Lead Director of the Eaton Corporation Board of Directors (diversified industrial, 1997-present). Mr. Lautenbach is also a member of the Board of Directors of the Philharmonic Center for the Arts in Naples, Florida (1999-present); a member of the Board of Trustees of Fairfield University (2005-present); and a member of the Council on Foreign Relations (1994-present). Previously, Mr. Lautenbach was a Partner/Advisory Partner at Clayton, Dubilier & Rice, Inc. (private equity investment, 1998-2010), as well as a Director of Sony Corporation (2006-2007). |
Joseph Mauriello (66) |
| Year of Election or Appointment: 2008 Prior to his retirement in January 2006, Mr. Mauriello served in numerous senior management positions including Deputy Chairman and Chief Operating Officer (2004-2005), and Vice Chairman of Financial Services (2002-2004) of KPMG LLP US (professional services, 1965-2005). Mr. Mauriello currently serves as a member of the Board of Directors of XL Group plc. (global insurance and re-insurance, 2006-present) and of Arcadia Resources Inc. (health care services and products, 2007-present). Previously, Mr. Mauriello served as a Director of the Hamilton Funds of the Bank of New York (2006-2007). |
Cornelia M. Small (66) |
| Year of Election or Appointment: 2005 Ms. Small is a member of the Board of Directors of the Teagle Foundation (2009-present). Ms. Small is also a member of the Investment Committee, and Chair (2008-present) and a member of the Board of Trustees of Smith College. In addition, Ms. Small serves on the Investment Committee of the Berkshire Taconic Community Foundation (2008-present). Previously, Ms. Small served as Chairperson of the Investment Committee (2002-2008) of Smith College. In addition, Ms. Small served as Chief Investment Officer, Director of Global Equity Investments, and a member of the Board of Directors of Scudder, Stevens & Clark and Scudder Kemper Investments. |
William S. Stavropoulos (71) |
| Year of Election or Appointment: 2001 Mr. Stavropoulos is Vice Chairman of the Independent Trustees of the Equity and High Income Funds (2006-present). Mr. Stavropoulos serves as President and Founder of the Michigan Baseball Foundation, the Great Lakes Loons (2007-present). Mr. Stavropoulos is Chairman Emeritus of the Board of Directors of The Dow Chemical Company, where he previously served in numerous senior management positions, including President, CEO (1995-2000; 2002-2004), Chairman of the Executive Committee (2000-2006), and as a member of the Board of Directors (1990-2006). Currently, Mr. Stavropoulos is Chairman of Univar (global distributor of commodity and specialty chemicals, 2010-present), a Director of Teradata Corporation (data warehousing and technology solutions, 2008-present), Chemical Financial Corporation, Maersk Inc. (industrial conglomerate), Tyco International, Inc. (multinational manufacturing and services, 2007-present), and a member of the Advisory Board for Metalmark Capital (private equity investment, 2005-present). Mr. Stavropoulos is a special advisor to Clayton, Dubilier & Rice, LLC (private equity investment). In addition, Mr. Stavropoulos is a member of the University of Notre Dame Advisory Council for the College of Science. |
David M. Thomas (61) |
| Year of Election or Appointment: 2008 Previously, Mr. Thomas served as Executive Chairman (2005-2006) and Chairman and Chief Executive Officer (2000-2005) of IMS Health, Inc. (pharmaceutical and healthcare information solutions). In addition, Mr. Thomas serves as a member of the Board of Directors of Fortune Brands, Inc. (consumer products), and Interpublic Group of Companies, Inc. (marketing communication, 2004-present). |
Michael E. Wiley (60) |
| Year of Election or Appointment: 2008 Mr. Wiley also serves as a Director of Asia Pacific Exploration Consolidated (international oil and gas exploration and production, 2008-present). Mr. Wiley serves as a Director of Tesoro Corporation (independent oil refiner and marketer, 2005-present), and a Director of Bill Barrett Corporation (exploration and production, 2005-present). In addition, Mr. Wiley also serves as a Director of Post Oak Bank (privately-held bank, 2004-present). Previously, Mr. Wiley served as a member of the Board of Trustees of the University of Tulsa (2000-2006; 2007-2010), as a Senior Energy Advisor of Katzenbach Partners, LLC (consulting, 2006-2007), as an Advisory Director of Riverstone Holdings (private investment), Chairman, President, and CEO of Baker Hughes, Inc. (oilfield services, 2000-2004), and as Director of Spinnaker Exploration Company (exploration and production, 2001-2005). |
+ The information above includes each Trustee's principal occupation during the last five years and other information relating to the experience, attributes, and skills relevant to each Trustee's qualifications to serve as a Trustee, which led to the conclusion that each Trustee should serve as a Trustee for the fund.
Advisory Board Members and Executive Officers:
Correspondence intended for each executive officer, Edward C. Johnson 3d, and Peter S. Lynch may be sent to Fidelity Investments, 82 Devonshire Street, Boston, Massachusetts 02109.
Name, Age; Principal Occupation |
Edward C. Johnson 3d (80) |
| Year of Election or Appointment: 2011 Member of the Advisory Board of Fidelity's Equity and High Income Funds. Formerly Trustee and Chairman of the Board of Trustees of certain Trusts, Mr. Johnson serves as Chief Executive Officer, Chairman, and a Director of FMR LLC; Chairman and a Director of FMR; and Chairman and a Director of FMR Co., Inc. In addition, Mr. Johnson serves as Chairman and Director of FIL Limited. Previously, Mr. Johnson served as President of FMR LLC (2006-2007). |
Peter S. Lynch (66) |
| Year of Election or Appointment: 2003 Member of the Advisory Board of Fidelity's Equity and High Income Funds. Mr. Lynch is Vice Chairman and a Director of FMR and FMR Co., Inc. In addition, Mr. Lynch serves as a Trustee of Boston College and as the Chairman of the Inner-City Scholarship Fund. Previously, Mr. Lynch served on the Special Olympics International Board of Directors (1997-2006). |
Kenneth B. Robins (41) |
| Year of Election or Appointment: 2008 President and Treasurer of Fidelity's Equity and High Income Funds. Mr. Robins also serves as President and Treasurer (2010-present) and Assistant Treasurer (2009-present) of other Fidelity funds and is an employee of Fidelity Investments (2004-present). Previously, Mr. Robins served as Deputy Treasurer of the Fidelity funds (2005-2008) and Treasurer and Chief Financial Officer of The North Carolina Capital Management Trust: Cash and Term Portfolios (2006-2008). |
Brian B. Hogan (46) |
| Year of Election or Appointment: 2009 Vice President of certain Equity Funds and Vice President of Sector Funds. Mr. Hogan also serves as President of FMR's Equity Division (2009-present). Previously, Mr. Hogan served as Senior Vice President, Equity Research of FMR (2006-2009) and as a portfolio manager. |
Thomas C. Hense (46) |
| Year of Election or Appointment: 2008 or 2010 Vice President of Fidelity's High Income (2008), Small Cap (2008), and Value (2010) Funds. Previously, Mr. Hense served as a portfolio manager for Fidelity's Institutional Money Management Group (Pyramis) (2003-2008). |
Scott C. Goebel (42) |
| Year of Election or Appointment: 2008 Secretary and Chief Legal Officer (CLO) of the Fidelity funds. Mr. Goebel also serves as Secretary and CLO of The North Carolina Capital Management Trust: Cash and Term Portfolio (2008-present); General Counsel, Secretary, and Senior Vice President of FMR (2008-present) and FMR Co., Inc. (2008-present); Deputy General Counsel of FMR LLC; Chief Legal Officer of Fidelity Management & Research (Hong Kong) Limited (2008-present) and Assistant Secretary of Fidelity Management & Research (Japan) Inc. (2008-present), Fidelity Investments Money Management, Inc. (2008-present), Fidelity Management & Research (U.K.) Inc. (2008-present), and Fidelity Research and Analysis Company (2008-present). Previously, Mr. Goebel served as Assistant Secretary of the Funds (2007-2008) and as Vice President and Secretary of Fidelity Distributors Corporation (FDC) (2005-2007). |
William C. Coffey (41) |
| Year of Election or Appointment: 2009 Assistant Secretary of Fidelity's Equity and High Income Funds. Mr. Coffey also serves as Senior Vice President and Deputy General Counsel of FMR LLC (2010-present), and is an employee of Fidelity Investments. Previously, Mr. Coffey served as Vice President and Associate General Counsel of FMR LLC (2005-2009). |
Holly C. Laurent (56) |
| Year of Election or Appointment: 2008 Anti-Money Laundering (AML) Officer of the Fidelity funds. Ms. Laurent also serves as AML Officer of The North Carolina Capital Management Trust: Cash and Term Portfolio (2008-present) and is an employee of Fidelity Investments. Previously, Ms. Laurent was Senior Vice President and Head of Legal for Fidelity Business Services India Pvt. Ltd. (2006-2008), and Senior Vice President, Deputy General Counsel and Group Head for FMR LLC (2005-2006). |
Christine Reynolds (52) |
| Year of Election or Appointment: 2008 Chief Financial Officer of the Fidelity funds. Ms. Reynolds became President of Fidelity Pricing and Cash Management Services (FPCMS) in August 2008. Ms. Reynolds served as Chief Operating Officer of FPCMS (2007-2008). Previously, Ms. Reynolds served as President, Treasurer, and Anti-Money Laundering officer of the Fidelity funds (2004-2007). |
Kenneth A. Rathgeber (63) |
| Year of Election or Appointment: 2004 Chief Compliance Officer of Fidelity's Equity and High Income Funds. Mr. Rathgeber is Chief Compliance Officer of Fidelity Management & Research (Hong Kong) Limited (2008-present), Fidelity Management & Research (Japan) Inc. (2008-present), FMR (2005-present), FMR Co., Inc. (2005-present), Fidelity Management & Research (U.K.) Inc. (2005-present), Fidelity Research & Analysis Company (2005-present), Fidelity Investments Money Management, Inc. (2005-present), Pyramis Global Advisors, LLC (2005-present), and Strategic Advisers, Inc. (2005-present). |
Jeffrey S. Christian (49) |
| Year of Election or Appointment: 2009 Deputy Treasurer of the Fidelity funds. Mr. Christian is an employee of Fidelity Investments. Previously, Mr. Christian served as Chief Financial Officer (2008-2009) of certain Fidelity funds and Senior Vice President of Fidelity Pricing and Cash Management Services (FPCMS) (2004-2009). |
Bryan A. Mehrmann (49) |
| Year of Election or Appointment: 2005 Deputy Treasurer of the Fidelity funds. Mr. Mehrmann is an employee of Fidelity Investments. |
Adrien E. Deberghes (43) |
| Year of Election or Appointment: 2008 Deputy Treasurer of Fidelity's Equity and High Income Funds. Mr. Deberghes also serves as Assistant Treasurer of other Fidelity funds (2010-present) and is an employee of Fidelity Investments (2008-present). Previously, Mr. Deberghes served as Senior Vice President of Mutual Fund Administration at State Street Corporation (2007-2008), Senior Director of Mutual Fund Administration at Investors Bank & Trust (2005-2007), and Director of Finance for Dunkin' Brands (2000-2005). |
Stephanie J. Dorsey (41) |
| Year of Election or Appointment: 2010 Assistant Treasurer of Fidelity's Equity and High Income Funds. Ms. Dorsey also serves as Deputy Treasurer of other Fidelity funds (2008-present) and is an employee of Fidelity Investments (2008-present). Previously, Ms. Dorsey served as Treasurer (2004-2008) of the JPMorgan Mutual Funds and Vice President (2004-2008) of JPMorgan Chase Bank. |
John R. Hebble (52) |
| Year of Election or Appointment: 2009 Assistant Treasurer of Fidelity's Equity and High Income Funds. Mr. Hebble also serves as Treasurer and Chief Financial Officer of The North Carolina Capital Management Trust: Cash and Term Portfolio (2008-present), President and Treasurer of other Fidelity funds (2008-present) and is an employee of Fidelity Investments. |
Gary W. Ryan (52) |
| Year of Election or Appointment: 2005 Assistant Treasurer of the Fidelity funds. Mr. Ryan is an employee of Fidelity Investments. Previously, Mr. Ryan served as Vice President of Fund Reporting in Fidelity Pricing and Cash Management Services (FPCMS) (1999-2005). |
Jonathan Davis (42) |
| Year of Election or Appointment: 2010 Assistant Treasurer of the Fidelity funds. Mr. Davis is an employee of Fidelity Investments. Previously, Mr. Davis served as Vice President and Associate General Counsel of FMR LLC (2003-2010). |
Annual Report
Initial Class, Service Class, Service Class 2, and Investor Class designates 100% of the dividends distributed during the fiscal year as qualifying for the dividends-received deduction for corporate shareholders.
Annual Report
Board Approval of Investment Advisory Contracts and Management Fees
VIP Value Leaders Portfolio
Each year, the Board of Trustees, including the Independent Trustees (together, the Board), votes on the renewal of the management contract and sub-advisory agreements (together, the Advisory Contracts) for the fund. The Board, assisted by the advice of fund counsel and Independent Trustees' counsel, requests and considers a broad range of information relevant to the renewal of the Advisory Contracts throughout the year.
The Board meets regularly and considers at each of its meetings factors that are relevant to its annual consideration of the renewal of the fund's Advisory Contracts, including the services and support provided to the fund and its shareholders. The Board has established various standing committees, each composed of Independent Trustees with varying backgrounds, to which the Board has assigned specific subject matter responsibilities in order to enhance effective decision-making by the Board. The Board, acting directly and through its Committees, requests and receives information concerning the annual consideration of the renewal of the fund's Advisory Contracts. The Board also meets as needed to consider matters specifically related to the Board's annual consideration of the renewal of Advisory Contracts. Members of the Board may also meet with trustees of other Fidelity funds through ad hoc joint committees to discuss certain matters relevant to the Fidelity funds.
At its July 2010 meeting, the Board of Trustees, including the Independent Trustees, unanimously determined to renew the fund's Advisory Contracts. In reaching its determination, the Board considered all factors it believed relevant, including (i) the nature, extent, and quality of the services to be provided to the fund and its shareholders (including the investment performance of the fund); (ii) the competitiveness of the fund's management fee and total expenses; (iii) the total costs of the services to be provided by and the profits to be realized by Fidelity from its relationship with the fund; (iv) the extent to which economies of scale would be realized as the fund grows; and (v) whether fee levels reflect these economies of scale, if any, for the benefit of fund shareholders.
In considering whether to renew the Advisory Contracts for the fund, the Board reached a determination, with the assistance of fund counsel and Independent Trustees' counsel and through the exercise of its business judgment, that the renewal of the Advisory Contracts is in the best interests of fund shareholders and that the compensation to be received by Fidelity under the management contract is fair and reasonable. The Board's decision to renew the Advisory Contracts was not based on any single factor noted above, but rather was based on a comprehensive consideration of all the information provided to the Board at its meetings throughout the year. The Board, in reaching its determination to renew the Advisory Contracts, is aware that shareholders in the fund have a broad range of investment choices available to them, including a wide choice among mutual funds offered by Fidelity's competitors, and that the fund's shareholders, with the opportunity to review and weigh the disclosure provided by the fund in its prospectus and other public disclosures, have chosen to invest in this fund, managed by Fidelity.
Nature, Extent, and Quality of Services Provided. The Board considered the staffing within the investment adviser, FMR, and the sub-advisers (together, the Investment Advisers), including the backgrounds of the fund's investment personnel and the fund's investment objective and discipline. The Independent Trustees also had discussions with senior management of Fidelity's investment operations and investment groups. The Board considered the structure of the portfolio manager compensation program and whether this structure provides appropriate incentives to act in the best interest of the fund.
Resources Dedicated to Investment Management and Support Services. The Board and the equity research subcommittee of the Board's Fund Oversight Committee reviewed the size, education, and experience of the Investment Advisers' investment staff, their use of technology, and the Investment Advisers' approach to recruiting, training, and retaining portfolio managers and other research, advisory, and management personnel. The Board noted that Fidelity's analysts have access to a variety of technological tools and market and securities data that enable them to perform both fundamental and quantitative analysis and to specialize in various disciplines. The Board considered Fidelity's extensive global research capabilities that enable the Investment Advisers to aggregate data from various sources in an effort to produce positive investment results. The Board also considered that Fidelity's portfolio managers and analysts have access to daily portfolio attribution that allows for monitoring of a fund's portfolio, as well as an electronic communication system that provides immediate real-time access to research concerning issuers and credit enhancers. The Board noted FMR's continued focus on strengthening the organization and discipline of equity portfolio management and research.
Shareholder and Administrative Services. The Board considered (i) the nature, extent, quality, and cost of advisory, administrative, and shareholder services performed by the Investment Advisers and their affiliates under the Advisory Contracts and under separate agreements covering transfer agency, pricing and bookkeeping, and securities lending services for the fund; (ii) the nature and extent of the investment adviser's supervision of third party service providers, principally custodians and subcustodians; and (iii) the resources devoted to, and the record of compliance with, the fund's compliance policies and procedures. The Board also reviewed the allocation of fund brokerage, including allocations to brokers affiliated with the Investment Advisers, the use of brokerage commissions to pay fund expenses, and the use of "soft" commission dollars to pay for research services.
The Board noted that the growth of fund assets over time across the complex allows Fidelity to reinvest in the development of services designed to enhance the value or convenience of the Fidelity funds as investment vehicles. These services include 24-hour access to account information and market information through phone representatives and over the Internet, and investor education materials and asset allocation tools.
Investment in a Large Fund Family. The Board considered the benefits to shareholders of investing in a Fidelity fund, including the benefits of investing in a fund that is part of a large family of funds offering a variety of investment disciplines and providing a large variety of mutual fund investor services. The Board noted that Fidelity had taken, or had made recommendations that resulted in the Fidelity funds taking, a number of actions over the previous year that benefited particular funds, including (i) dedicating additional resources to investment research and restructuring and broadening the focus of the investment research teams; (ii) bolstering the senior management team that oversees asset management; (iii) launching Class F of certain funds as a lower-fee class available to Freedom K and Freedom Index Funds; (iv) lowering the initial investment minimums and ongoing balance requirements for Real Estate High Income Fund; (v) eliminating subsequent purchase minimums for all funds and adding a waiver of the investment minimum requirement for new accounts opened with the proceeds of a systematic withdrawal plan; (vi) eliminating the withdrawal minimum and maximum limits for systematic withdrawals from Advisor funds; (vii) expanding sales load waivers on Class A shares for Destiny Planholders and expanding Institutional Class eligibility for Class O Destiny Planholders; and (viii) changing certain Class A and Class T sales charge structures to further align them with industry practices.
Annual Report
Investment Performance. The Board considered whether the fund has operated in accordance with its investment objective, as well as its record of compliance with its investment restrictions. It also reviewed the fund's absolute investment performance for each class, as well as the fund's relative investment performance for each class measured over multiple periods against (i) a broad-based securities market index, and (ii) a peer group of mutual funds deemed appropriate by Fidelity and reviewed by the Board. The following charts considered by the Board show, over the one-, three-, and five-year periods ended December 31, 2009, the cumulative total returns of Initial Class and Service Class 2 of the fund, the cumulative total returns of a broad-based securities market index ("benchmark"), and a range of cumulative total returns of a peer group of mutual funds identified by Morningstar, Inc. as having an investment style similar to that of the fund based on underlying portfolio holdings. The returns of Initial Class and Service Class 2 show the performance of the highest and lowest performing classes, respectively (based on five-year performance). The box within each chart shows the 25th percentile return (bottom of box) and the 75th percentile return (top of box) of the peer group. Returns shown above the box are in the first quartile and returns shown below the box are in the fourth quartile. The percentage beaten numbers noted below each chart correspond to the percentile box and represent the percentage of funds in the peer group whose performance was equal to or lower than that of the class indicated.
VIP Value Leaders Portfolio
The Board reviewed the fund's relative investment performance against its peer group and noted that the performance of Initial Class of the fund was in the first quartile for the one-year period and the fourth quartile for the three- and five-year periods. The Board also noted that the investment performance of the fund was lower than its benchmark for the three- and five-year periods, although the one-year cumulative total return of Initial Class compared favorably to its benchmark. The Board considered that the variations in performance among the fund's classes reflect the variations in class expenses, which result in lower performance for higher expense classes. The Board also reviewed the fund's performance since inception as well as performance in the current year.
Based on its review, and giving particular weight to the nature and quality of the resources dedicated by the Investment Advisers to maintain and improve relative performance and factoring in the unprecedented market events in recent years, the Board concluded that the nature, extent, and quality of investment management and support services and of shareholder and administrative services provided to the fund will benefit the fund's shareholders, particularly in light of the Board's view that the fund's shareholders benefit from investing in a fund that is part of a large family of funds offering a variety of investment disciplines and services.
Competitiveness of Management Fee and Total Fund Expenses. The Board considered the fund's management fee and total expenses compared to "mapped groups" of competitive funds and classes. Fidelity creates "mapped groups" by combining similar Lipper investment objective categories that have comparable management fee characteristics. Combining Lipper investment objective categories aids the Board's management fee and total expense comparisons by broadening the competitive group used for comparison and by reducing the number of universes to which various Fidelity funds are compared.
Annual Report
Board Approval of Investment Advisory Contracts and Management Fees - continued
Management Fee. The Board considered two proprietary management fee comparisons for the 12-month periods shown in the chart below. The group of Lipper funds used by the Board for management fee comparisons is referred to below as the "Total Mapped Group." The Total Mapped Group comparison focuses on a fund's standing relative to the total universe of comparable funds available to investors, in terms of gross management fees before expense reimbursements or caps. "TMG %" represents the percentage of funds in the Total Mapped Group that had management fees that were lower than the fund's. For example, a TMG % of 10% means that 90% of the funds in the Total Mapped Group had higher management fees than the fund. The "Asset-Size Peer Group" (ASPG) comparison focuses on a fund's standing relative to non-Fidelity funds similar in size to the fund within the Total Mapped Group. The ASPG represents at least 15% of the funds in the Total Mapped Group with comparable asset size and management fee characteristics, subject to a minimum of 50 funds (or all funds in the Total Mapped Group if fewer than 50). Additional information, such as the ASPG quartile in which the fund's management fee ranked, is also included in the chart and considered by the Board.
VIP Value Leaders Portfolio
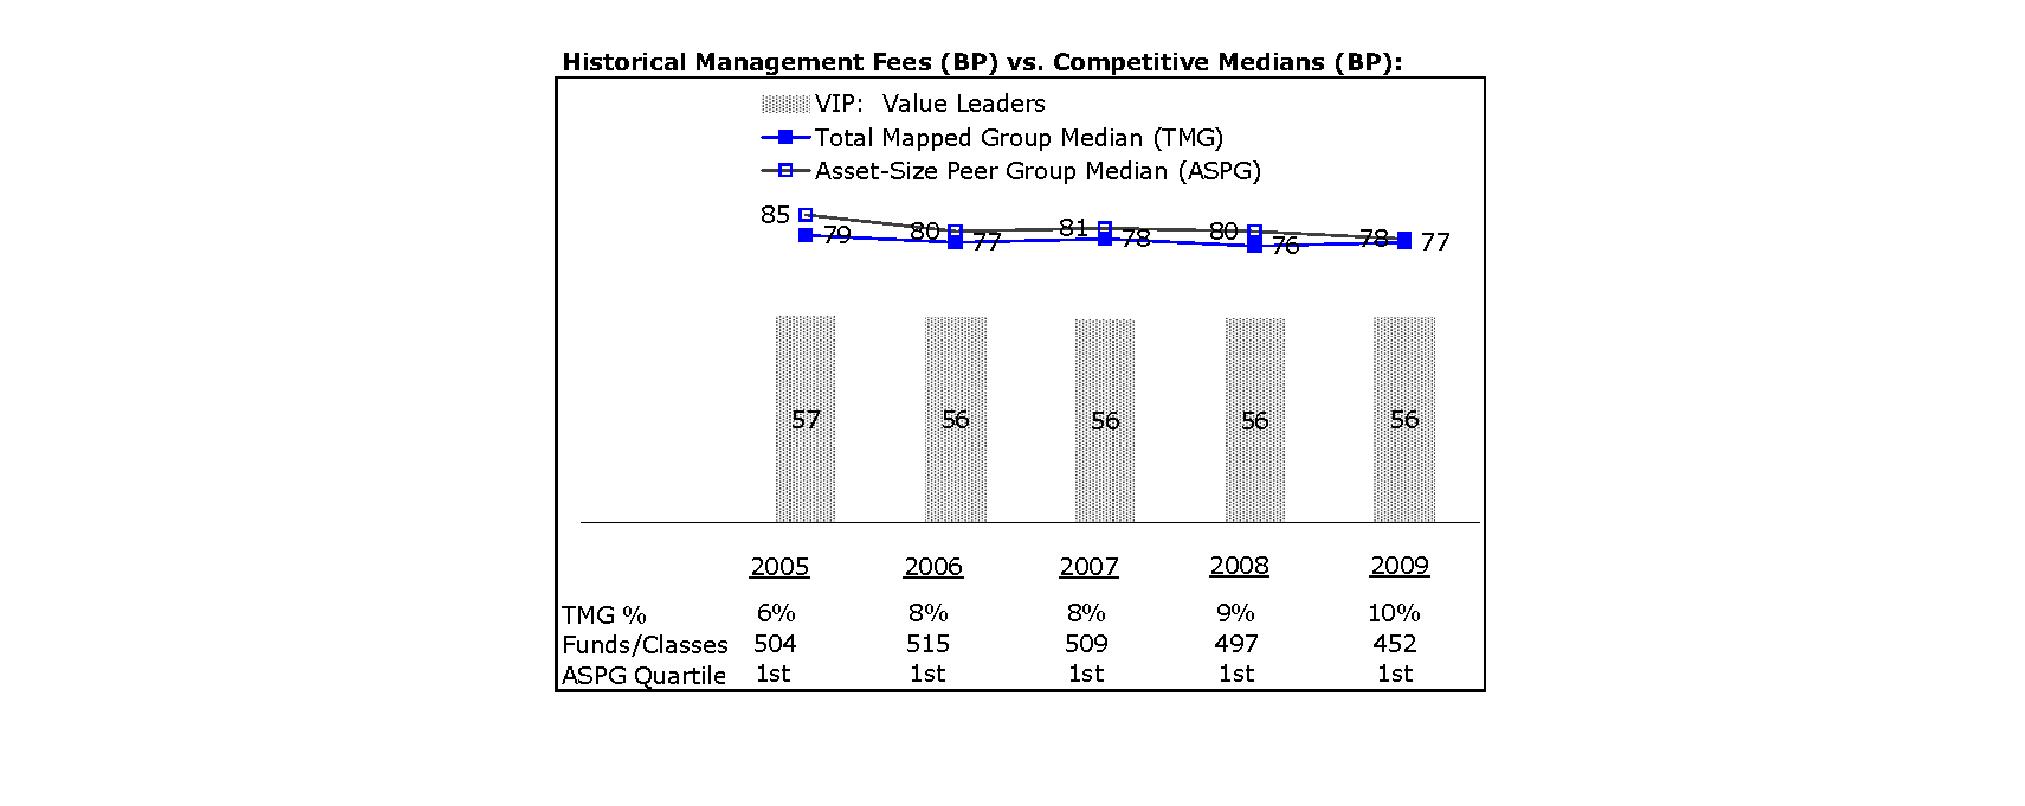
The Board noted that the fund's management fee ranked below the median of its Total Mapped Group and below the median of its ASPG for 2009.
Based on its review, the Board concluded that the fund's management fee is fair and reasonable in light of the services that the fund receives and the other factors considered.
Total Expenses. In its review of each class's total expenses, the Board considered the fund's management fee as well as other fund or class expenses, as applicable, such as transfer agent fees, pricing and bookkeeping fees, fund-paid 12b-1 fees, and custodial, legal, and audit fees. The Board also noted the effects of any waivers and reimbursements on fees and expenses. As part of its review, the Board also considered current and historical total expenses of each class of the fund compared to competitive fund median expenses. Each class of the fund is compared to those funds and classes in the Total Mapped Group (used by the Board for management fee comparisons) that have a similar sales load structure.
The Board noted that the total expenses of Initial Class ranked below its competitive median for 2009, the total expenses of Investor Class ranked equal to its competitive median for 2009, and the total expenses of each of Service Class and Service Class 2 ranked above its competitive median for 2009. The Board noted that the fund offers multiple classes, each of which has a different 12b-1 fee structure, and that the multiple structures are intended to offer a range of pricing options for the intermediary market. The Board also noted that the total expenses of the classes vary primarily by the level of their 12b-1 fees, although differences in transfer agent fees may also cause expenses to vary from class to class.
Fees Charged to Other Fidelity Clients. The Board also considered Fidelity fee structures and other information with respect to clients of FMR and its affiliates, such as other mutual funds advised or subadvised by FMR or its affiliates, pension plan clients, and other institutional clients. In March 2010, the Board created an ad hoc joint committee with the board of other Fidelity funds (the Committee) to review and compare Fidelity's institutional investment advisory business with its business of providing services to the Fidelity funds, including the differences in services provided, fees charged, and costs incurred, as well as competition in their respective marketplaces.
Annual Report
Based on its review of total expenses and fees charged to other Fidelity clients, the Board concluded that the total expenses of each class of the fund were reasonable, although in some cases above the median of the universe presented for comparison, in light of the services that the fund and its shareholders receive and the other factors considered, including the findings of the Committee.
Costs of the Services and Profitability. The Board considered the revenues earned and the expenses incurred by Fidelity in conducting the business of developing, marketing, distributing, managing, administering and servicing the fund and its shareholders. The Board also considered the level of Fidelity's profits in respect of all the Fidelity funds.
On an annual basis, FMR presents to the Board Fidelity's profitability for the fund. Fidelity calculates the profitability for each fund, as well as aggregate profitability for groups of Fidelity funds and all Fidelity funds, using a series of detailed revenue and cost allocation methodologies which originate with the audited books and records of Fidelity. The Audit Committee of the Board reviews any significant changes from the prior year's methodologies.
PricewaterhouseCoopers LLP (PwC), independent registered public accounting firm and auditor to Fidelity and certain Fidelity funds, has been engaged annually by the Board as part of the Board's assessment of Fidelity's profitability analysis. PwC's engagement includes the review and assessment of Fidelity's methodologies used in determining the revenues and expenses attributable to Fidelity's mutual fund business, and completion of agreed-upon procedures surrounding the mathematical accuracy of fund profitability and its conformity to allocation methodologies. After considering PwC's reports issued under the engagement and information provided by Fidelity, the Board believes that while other allocation methods may also be reasonable, Fidelity's profitability methodologies are reasonable in all material respects.
The Board has also reviewed Fidelity's non-fund businesses and fall-out benefits related to the mutual fund business as well as cases where Fidelity's affiliates may benefit from or be related to the fund's business.
The Board considered the costs of the services provided by and the profits realized by Fidelity in connection with the operation of the fund and were satisfied that the profitability was not excessive in the circumstances.
Economies of Scale. The Board considered whether there have been economies of scale in respect of the management of the Fidelity funds, whether the Fidelity funds (including the fund) have appropriately benefited from any such economies of scale, and whether there is potential for realization of any further economies of scale. The Board considered the extent to which the fund will benefit from economies of scale through increased services to the fund, through waivers or reimbursements, or through fee or expense reductions.
In February 2009, the Board and the board of other Fidelity funds created an ad hoc committee (the Economies of Scale Committee) to analyze whether FMR attains economies of scale in respect of the management and servicing of the Fidelity funds, whether the Fidelity funds have appropriately benefited from such economies of scale, and whether there is potential for realization of any further economies of scale.
The Board recognized that the fund's management contract incorporates a "group fee" structure, which provides for lower group fee rates as total fund assets under FMR's management increase, and for higher group fee rates as total fund assets under FMR's management decrease. FMR calculates the group fee rates based on a tiered asset "breakpoint" schedule that varies based on asset class. The Board considered that the group fee is designed to deliver the benefits of economies of scale to fund shareholders when total Fidelity fund assets increase, even if assets of any particular fund are unchanged or have declined, because some portion of Fidelity's costs are attributable to services provided to all Fidelity funds, and all funds benefit if those costs can be allocated among more assets. The Board concluded that, given the group fee structure, fund shareholders will benefit from lower management fees as assets under FMR's management increase at the fund complex level, regardless of whether Fidelity achieves any such economies of scale.
The Board concluded, considering the findings of the Economies of Scale Committee, that any potential economies of scale are being appropriately shared between fund shareholders and Fidelity.
Additional Information Requested by the Board. In order to develop fully the factual basis for consideration of the Fidelity funds' Advisory Contracts, the Board requested and received additional information on certain topics, including (i) fund performance trends, actions to be taken by FMR to improve certain funds' overall performance, and Fidelity's long-term strategies for certain funds; (ii) portfolio manager changes that have occurred during the past year and length of portfolio manager tenure for different categories of funds over time; (iii) Fidelity's compensation structure for portfolio managers, research analysts, and other key personnel, the rationale for the compensation structure, and how the compensation structure provides appropriate performance incentives; (iv) the amount of the investment that each portfolio manager has made in the Fidelity fund(s) that he or she manages; (v) management and other fees paid by FMR to affiliated sub-advisers on behalf of the Fidelity funds; (vi) Fidelity's fee structures and rationale for recommending different fees among different categories of funds; (vii) Fidelity's rationale for recommending which funds should have a performance adjustment component as part of their management fees; (viii) the rationale for any differences between fund fee structures and fee structures in place for other Fidelity clients; and (ix) explanations regarding the relative total expenses borne by certain funds and classes, total expense competitive trends, and actions that might be taken by FMR to reduce total expenses for certain funds and classes.
Based on its evaluation of all of the conclusions noted above, and after considering all factors it believed relevant, the Board ultimately concluded that the advisory fee structures are fair and reasonable, and that the fund's Advisory Contracts should be renewed.
Annual Report
Investment Adviser
Fidelity Management & Research Company
Boston, MA
Investment Sub-Advisers
FMR Co., Inc.
Fidelity Management & Research (U.K.) Inc.
Fidelity Management & Research (Hong Kong) Limited
Fidelity Management & Research (Japan) Inc.
General Distributor
Fidelity Distributors Corporation
Boston, MA
Transfer and Service Agents
Fidelity Investments Institutional Operations Company, Inc.
Boston, MA
Fidelity Service Company, Inc.
Boston, MA
Custodian
Brown Brothers Harriman & Co.
Boston, MA
VVL-ANN-0211
1.796594.107
Item 2. Code of Ethics
As of the end of the period, December 31, 2010, Variable Insurance Products Fund IV (the trust) has adopted a code of ethics, as defined in Item 2 of Form N-CSR, that applies to its President and Treasurer and its Chief Financial Officer. A copy of the code of ethics is filed as an exhibit to this Form N-CSR.
Item 3. Audit Committee Financial Expert
The Board of Trustees of the trust has determined that Joseph Mauriello is an audit committee financial expert, as defined in Item 3 of Form N-CSR. Mr. Mauriello is independent for purposes of Item 3 of Form N-CSR.
Item 4. Principal Accountant Fees and Services
Fees and Services
The following table presents fees billed by Deloitte & Touche LLP, the member firms of Deloitte Touche Tohmatsu, and their respective affiliates (collectively, "Deloitte Entities") in each of the last two fiscal years for services rendered to Emerging Markets Portfolio (the "Fund"):
Services Billed by Deloitte Entities
December 31, 2010 FeesA
| Audit Fees | Audit-Related Fees | Tax Fees | All Other Fees |
Emerging Markets Portfolio | $49,000 | $- | $5,600 | $- |
December 31, 2009 FeesA
| Audit Fees | Audit-Related Fees | Tax Fees | All Other Fees |
Emerging Markets Portfolio | $47,000 | $- | $5,600 | $- |
A Amounts may reflect rounding.
The following table presents fees billed by PricewaterhouseCoopers LLP ("PwC") in each of the last two fiscal years for services rendered to Consumer Discretionary Portfolio, Consumer Staples Portfolio, Energy Portfolio, Financial Services Portfolio, Growth Stock Portfolio, Health Care Portfolio, Industrials Portfolio, International Capital Appreciation Portfolio, Materials Portfolio, Real Estate Portfolio, Technology Portfolio, Telecommunications Portfolio, Utilities Portfolio, and Value Leaders Portfolio (the "Funds"):
Services Billed by PwC
December 31, 2010 FeesA
| Audit Fees | Audit-Related Fees | Tax Fees | All Other Fees |
Consumer Discretionary Portfolio | $37,000 | $- | $2,400 | $2,000 |
Consumer Staples Portfolio | $37,000 | $- | $2,400 | $2,000 |
Energy Portfolio | $36,000 | $- | $2,400 | $2,100 |
Financial Services Portfolio | $37,000 | $- | $2,400 | $2,000 |
Growth Stock Portfolio | $44,000 | $- | $3,000 | $2,000 |
Health Care Portfolio | $39,000 | $- | $2,400 | $2,000 |
Industrials Portfolio | $37,000 | $- | $2,400 | $2,000 |
International Capital Appreciation Portfolio | $46,000 | $- | $4,900 | $2,000 |
Materials Portfolio | $37,000 | $- | $2,400 | $2,000 |
Real Estate Portfolio | $43,000 | $- | $3,400 | $2,000 |
Technology Portfolio | $36,000 | $- | $2,400 | $2,000 |
Telecommunications Portfolio | $37,000 | $- | $2,400 | $2,000 |
Utilities Portfolio | $35,000 | $- | $2,400 | $2,000 |
Value Leaders Portfolio | $42,000 | $- | $3,000 | $2,000 |
December 31, 2009 FeesA
| Audit Fees | Audit-Related Fees | Tax Fees | All Other Fees |
Consumer Discretionary Portfolio | $36,000 | $- | $2,400 | $1,400 |
Consumer Staples Portfolio | $36,000 | $- | $2,400 | $1,500 |
Energy Portfolio | $36,000 | $- | $2,400 | $1,700 |
Financial Services Portfolio | $37,000 | $- | $3,400 | $1,500 |
Growth Stock Portfolio | $43,000 | $- | $3,000 | $1,500 |
Health Care Portfolio | $38,000 | $- | $2,400 | $1,500 |
Industrials Portfolio | $36,000 | $- | $2,400 | $1,500 |
International Capital Appreciation Portfolio | $45,000 | $- | $4,900 | $1,500 |
Materials Portfolio | $36,000 | $- | $2,400 | $1,500 |
Real Estate Portfolio | $43,000 | $- | $3,400 | $1,500 |
Technology Portfolio | $35,000 | $- | $2,400 | $1,500 |
Telecommunications Portfolio | $36,000 | $- | $2,400 | $1,400 |
Utilities Portfolio | $35,000 | $- | $2,400 | $1,500 |
Value Leaders Portfolio | $42,000 | $- | $4,000 | $1,500 |
A Amounts may reflect rounding.
The following table presents fees billed by PwC and Deloitte Entities that were required to be approved by the Audit Committee for services that relate directly to the operations and financial reporting of the Funds and that are rendered on behalf of Fidelity Management & Research Company ("FMR") and entities controlling, controlled by, or under common control with FMR (not including any sub-adviser whose role is primarily portfolio management and is subcontracted with or overseen by another investment adviser) that provide ongoing services to the Funds ("Fund Service Providers"):
Services Billed by Deloitte Entities
| December 31, 2010A | December 31, 2009A |
Audit-Related Fees | $645,000 | $725,000 |
Tax Fees | $- | $- |
All Other Fees | $840,000 | $515,000 |
A Amounts may reflect rounding.
Services Billed by PwC
| December 31, 2010A | December 31, 2009A |
Audit-Related Fees | $2,505,000 | $2,655,000 |
Tax Fees | $- | $- |
All Other Fees | $510,000 | $- |
A Amounts may reflect rounding.
"Audit-Related Fees" represent fees billed for assurance and related services that are reasonably related to the performance of the fund audit or the review of the fund's financial statements and that are not reported under Audit Fees.
"Tax Fees" represent fees billed for tax compliance, tax advice or tax planning that relate directly to the operations and financial reporting of the fund.
"All Other Fees" represent fees billed for services provided to the fund or Fund Service Provider, a significant portion of which are assurance related, that relate directly to the operations and financial reporting of the fund, excluding those services that are reported under Audit Fees, Audit-Related Fees or Tax Fees.
Assurance services must be performed by an independent public accountant.
* * *
The aggregate non-audit fees billed by PwC and Deloitte Entities for services rendered to the Funds, FMR (not including any sub-adviser whose role is primarily portfolio management and is subcontracted with or overseen by another investment adviser), and any Fund Service Provider for each of the last two fiscal years of the Funds are as follows:
Billed By | December 31, 2010 A | December 31, 2009 A |
PwC | $5,075,000 | $4,600,000 |
Deloitte Entities | $1,585,000 | $1,245,000 |
A Amounts may reflect rounding.
The trust's Audit Committee has considered non-audit services that were not pre-approved that were provided by PwC and Deloitte Entities to Fund Service Providers to be compatible with maintaining the independence of PwC and Deloitte Entities in their audits of the Funds, taking into account representations from PwC and Deloitte Entities, in accordance with Public Company Accounting Oversight Board rules, regarding their independence from the Funds and their related entities and FMR's review of the appropriateness and permissibility under applicable law of such non-audit services prior to their provision to the Fund Service Providers.
Audit Committee Pre-Approval Policies and Procedures
The trust's Audit Committee must pre-approve all audit and non-audit services provided by a fund's independent registered public accounting firm relating to the operations or financial reporting of the fund. Prior to the commencement of any audit or non-audit services to a fund, the Audit Committee reviews the services to determine whether they are appropriate and permissible under applicable law.
The Audit Committee has adopted policies and procedures to, among other purposes, provide a framework for the Committee's consideration of non-audit services by the audit firms that audit the Fidelity funds. The policies and procedures require that any non-audit service provided by a fund audit firm to a Fidelity fund and any non-audit service provided by a fund auditor to a Fund Service Provider that relates directly to the operations and financial reporting of a Fidelity fund ("Covered Service") are subject to approval by the Audit Committee before such service is provided.
All Covered Services must be approved in advance of provision of the service either: (i) by formal resolution of the Audit Committee, or (ii) by oral or written approval of the service by the Chair of the Audit Committee (or if the Chair is unavailable, such other member of the Audit Committee as may be designated by the Chair to act in the Chair's absence). The approval contemplated by (ii) above is permitted where the Treasurer determines that action on such an engagement is necessary before the next meeting of the Audit Committee.
Non-audit services provided by a fund audit firm to a Fund Service Provider that do not relate directly to the operations and financial reporting of a Fidelity fund are reported to the Audit Committee on a periodic basis.
Non-Audit Services Approved Pursuant to Rule 2-01(c)(7)(i)(C) and (ii) of Regulation S-X ("De Minimis Exception")
There were no non-audit services approved or required to be approved by the Audit Committee pursuant to the De Minimis Exception during the Funds' last two fiscal years relating to services provided to (i) the Funds or (ii) any Fund Service Provider that relate directly to the operations and financial reporting of the Funds.
Item 5. Audit Committee of Listed Registrants
Not applicable.
Item 6. Investments
(a) Not applicable.
(b) Not applicable
Item 7. Disclosure of Proxy Voting Policies and Procedures for Closed-End Management Investment Companies
Not applicable.
Item 8. Portfolio Managers of Closed-End Management Investment Companies
Not applicable.
Item 9. Purchase of Equity Securities by Closed-End Management Investment Company and Affiliated Purchasers
Not applicable.
Item 10. Submission of Matters to a Vote of Security Holders
There were no material changes to the procedures by which shareholders may recommend nominees to the trust's Board of Trustees.
Item 11. Controls and Procedures
(a)(i) The President and Treasurer and the Chief Financial Officer have concluded that the trust's disclosure controls and procedures (as defined in Rule 30a-3(c) under the Investment Company Act) provide reasonable assurances that material information relating to the trust is made known to them by the appropriate persons, based on their evaluation of these controls and procedures as of a date within 90 days of the filing date of this report.
(a)(ii) There was no change in the trust's internal control over financial reporting (as defined in Rule 30a-3(d) under the Investment Company Act) that occurred during the second fiscal quarter of the period covered by this report that has materially affected, or is reasonably likely to materially affect, the trust's internal control over financial reporting.
Item 12. Exhibits
(a) | (1) | Code of Ethics pursuant to Item 2 of Form N-CSR is filed and attached hereto as EX-99.CODE ETH. |
(a) | (2) | Certification pursuant to Rule 30a-2(a) under the Investment Company Act of 1940 (17 CFR 270.30a-2(a)) is filed and attached hereto as Exhibit 99.CERT. |
(a) | (3) | Not applicable. |
(b) | | Certification pursuant to Rule 30a-2(b) under the Investment Company Act of 1940 (17 CFR 270.30a-2(b)) is furnished and attached hereto as Exhibit 99.906CERT. |
SIGNATURES
Pursuant to the requirements of the Securities Exchange Act of 1934 and the Investment Company Act of 1940, the registrant has duly caused this report to be signed on its behalf by the undersigned, thereunto duly authorized.
Variable Insurance Products Fund IV
By: | /s/Kenneth B. Robins |
| Kenneth B. Robins |
| President and Treasurer |
| |
Date: | February 28, 2011 |
Pursuant to the requirements of the Securities Exchange Act of 1934 and the Investment Company Act of 1940, this report has been signed below by the following persons on behalf of the registrant and in the capacities and on the dates indicated.
By: | /s/Kenneth B. Robins |
| Kenneth B. Robins |
| President and Treasurer |
| |
Date: | February 28, 2011 |
By: | /s/Christine Reynolds |
| Christine Reynolds |
| Chief Financial Officer |
| |
Date: | February 28, 2011 |