UNITED STATES
SECURITIES AND EXCHANGE COMMISSION
Washington, D.C. 20549
FORM N-CSR
CERTIFIED SHAREHOLDER REPORT OF REGISTERED
MANAGEMENT INVESTMENT COMPANIES
Investment Company Act file number 811-3759
Variable Insurance Products Fund IV
(Exact name of registrant as specified in charter)
245 Summer St., Boston, Massachusetts 02210
(Address of principal executive offices) (Zip code)
Marc Bryant, Secretary
245 Summer St.
Boston, Massachusetts 02210
(Name and address of agent for service)
Registrant's telephone number, including area code: 617-563-7000
Date of fiscal year end: | December 31 |
| |
Date of reporting period: | December 31, 2013 |
Item 1. Reports to Stockholders
Fidelity® Variable Insurance Products:
Consumer Discretionary Portfolio
Annual Report
December 31, 2013
(Fidelity Cover Art)
Contents
Performance | (Click Here) | How the fund has done over time. |
Management's Discussion of Fund Performance | (Click Here) | The Portfolio Manager's review of fund performance and strategy. |
Shareholder Expense Example | (Click Here) | An example of shareholder expenses. |
Investment Changes | (Click Here) | A summary of major shifts in the fund's investments over the past six months. |
Investments | (Click Here) | A complete list of the fund's investments with their market values. |
Financial Statements | (Click Here) | Statements of assets and liabilities, operations, and changes in net assets, as well as financial highlights. |
Notes | (Click Here) | Notes to the financial statements. |
Report of Independent Registered Public Accounting Firm | (Click Here) | |
Trustees and Officers | (Click Here) | |
Distributions | (Click Here) | |
Proxy Voting Results | (Click Here) | |
To view a fund's proxy voting guidelines and proxy voting record for the 12-month period ended June 30, visit http://www.fidelity.com/proxyvotingresults or visit the Securities and Exchange Commission's (SEC) web site at http://www.sec.gov. You may also call 1-877-208-0098 to request a free copy of the proxy voting guidelines.
Fidelity Variable Insurance Products are separate account options which are purchased through a variable insurance contract.
Standard & Poor's, S&P and S&P 500 are registered service marks of The McGraw-Hill Companies, Inc. and have been licensed for use by Fidelity Distributors Corporation.
Other third-party marks appearing herein are the property of their respective owners.
All other marks appearing herein are registered or unregistered trademarks or service marks of FMR LLC or an affiliated company. © 2014 FMR LLC. All rights reserved.
This report and the financial statements contained herein are submitted for the general information of the shareholders of the fund. This report is not authorized for distribution to prospective investors in the fund unless preceded or accompanied by an effective prospectus.
A fund files its complete schedule of portfolio holdings with the SEC for the first and third quarters of each fiscal year on Form N-Q. Forms N-Q are available on the SEC's web site at http://www.sec.gov. A fund's Forms N-Q may be reviewed and copied at the SEC's Public Reference Room in Washington, DC. Information regarding the operation of the SEC's Public Reference Room may be obtained by calling 1-800-SEC-0330. For a complete list of a fund's portfolio holdings, view the most recent holdings listings, semiannual report, or annual report on Fidelity's web site at http://www.fidelity.com, http://www.advisor.fidelity.com, or http://www.401k.com, as applicable.
NOT FDIC INSURED • MAY LOSE VALUE • NO BANK GUARANTEE
Neither the fund nor Fidelity Distributors Corporation is a bank.
Annual Report
Average annual total return reflects the change in the value of an investment, assuming reinvestment of the class' distributions from dividend income and capital gains (the profits earned upon the sale of securities that have grown in value, if any) and assuming a constant rate of performance each year. During periods of reimbursement by Fidelity, a fund's total return will be greater than it would be had the reimbursement not occurred. Performance numbers are net of all underlying fund operating expenses, but do not include any insurance charges imposed by your insurance company's separate account. If performance information included the effect of these additional charges, the total returns would have been lower. How a fund did yesterday is no guarantee of how it will do tomorrow.
Average Annual Total Returns
Periods ended December 31, 2013 | Past 1
year | Past 5
years | Past 10
years |
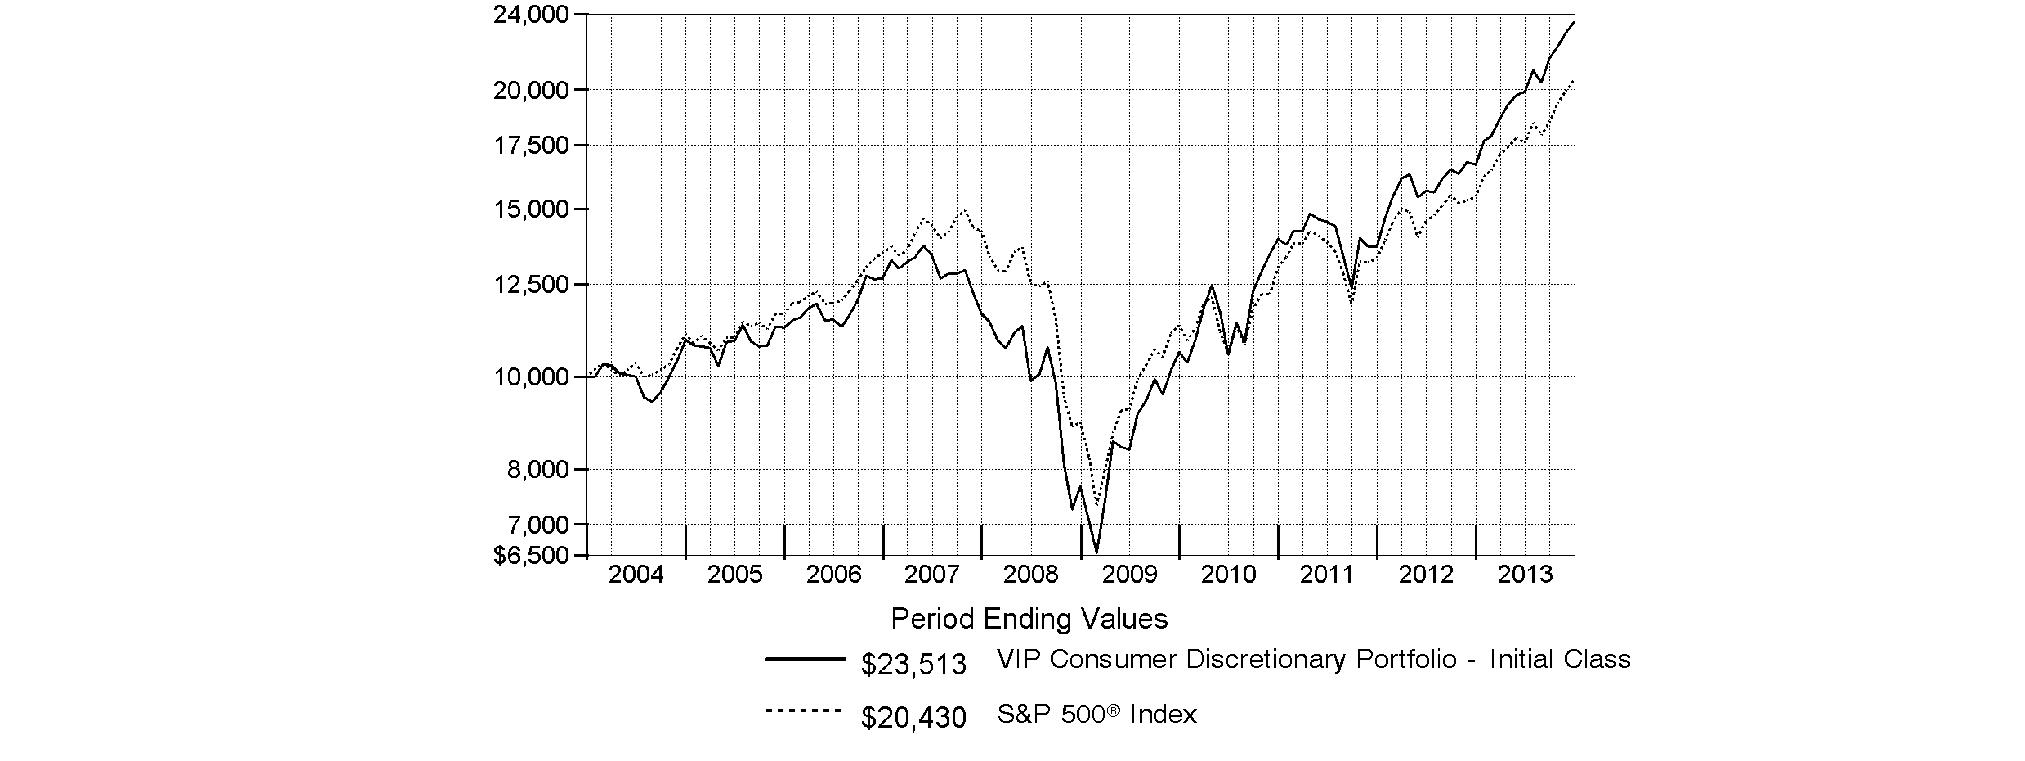
VIP Consumer Discretionary Portfolio - Initial Class B | 41.10% | 25.09% | 8.93% |
VIP Consumer Discretionary Portfolio - Investor Class A,B | 41.05% | 24.98% | 8.85% |
A The initial offering of Investor Class shares took place on July 21, 2005. Returns prior to July 21, 2005, are those of Initial Class. Had Investor Class's transfer agent fee been reflected, returns prior to July 21, 2005, would have been lower.
B Prior to October 1, 2006, VIP Consumer Discretionary Portfolio operated under certain different investment policies. The historical performance for the fund may not represent its current investment policies.
$10,000 Over 10 Years
Let's say hypothetically that $10,000 was invested in VIP Consumer Discretionary Portfolio - Initial Class on December 31, 2003. The chart shows how the value of your investment would have changed, and also shows how the S&P 500® Index performed over the same period.
Annual Report
Market Recap: Global equity markets remained upbeat for the 12 months ending December 31, 2013, propelling the MSCI® ACWI® (All Country World Index) Index to a 23.24% return. Midyear turbulence gave way by autumn when policymakers in the U.S. and China had made clear their intentions to maintain accommodative monetary policies. That stance, combined with modest cyclical improvement around the globe and generally low valuations, underpinned the broad rally in equities, although the relative strength of the U.S. dollar generally tempered gains for U.S. investors holding foreign securities based in local currencies. During the period, the broad-market S&P 500® Index set a series of new highs, finishing the year up 32.39%. For the first time since 1995, the S&P® scored a "perfect 10," with all 10 economic sectors gaining at least 10% for the year. A resurgence in growth-oriented stocks lifted the Nasdaq Composite Index® to a 40.12% result for 2013, while the blue-chip Dow Jones Industrial AverageSM notched a relatively more modest 29.65% gain. International developed-markets equities rose in concert with their U.S. counterparts, with the MSCI® EAFE® Index gaining 22.92% for the period. Meanwhile, foreign exchange and commodity weakness curbed results in resource-heavy emerging markets (EM), especially in the year's waning months. More generally, concern over EM's slowing growth, its declining share of global trade and uncertainty surrounding U.S. central bank intentions were all factors hampering performance. The MSCI Emerging Markets Index returned -2.27% for the period. On the bond side, U.S. high-yield securities rallied with equities for much of the period, with The BofA Merrill LynchSM US High Yield Constrained Index returning 7.41% for 2013. The more rate-sensitive U.S. investment-grade bond category faced headwinds though, as reflected in the -2.02% return of the Barclays® U.S. Aggregate Bond Index. Within the Barclays index, investment-grade corporate credit returned -2.01%, while ultra-safe U.S. Treasuries saw a -2.75% result. Major non-U.S. developed markets performed only slightly better, with the Citigroup® Non-USD Group-of-Seven (G7) Equal Weighted Index logging a -1.59% result. After several years of strong advances, EM debt reversed course in 2013, with the J.P. Morgan Emerging Markets Bond Index Global returning -6.58%.
Comments from Gordon Scott, Portfolio Manager of VIP Consumer Discretionary Portfolio: For the year, fund's share classes trailed the 43.75% gain of the MSCI® U.S. IMI Consumer Discretionary 25-50 Index, but solidly outpaced the broad-based S&P 500®. (For specific portfolio results, please refer to the performance section of this report.) Consumer discretionary stocks were buoyed by improving economic fundamentals in the U.S. and a recovery in housing- and automobile-related industries, as well as signs of economic stabilization in Europe and China. Versus the sector benchmark, positioning in apparel retail hurt the most, especially overweightings in teen fashion retailers American Eagle Outfitters and Abercrombie & Fitch. I established my stake in American Eagle early in the period, when it fit my focus on reasonable valuation and high return on equity. These two stocks faced headwinds this year, both from people shifting their spending to more capital-intensive purchases and from the growing threat of online retail channels. I look for great businesses at great prices, and even though Abercrombie faced issues similar to American Eagle's, I liked its valuation more at period end. Underweighting and eventually selling online retailing heavyweight Amazon.com also hurt, but this stock doesn't work for my criteria. On the plus side, it helped to avoid auto manufacturers - including index name Ford Motor. Instead, I invested in suppliers, which have similar exposure to economic drivers (auto demand) as manufacturers, but enjoy higher returns on capital and better potential for structural growth. It helped the most to avoid fast-food chain McDonald's for nearly the entire period, as the stock significantly lagged the index. During most of the year, I didn't find the stock's valuation attractive, but at the end of 2013 it came more in line with my target. At this point, I established an overweighted position in McDonald's. Elsewhere, it was a good call to largely avoid big-box retailer and index name Target, as the stock sharply reversed course in July and did not move much through the end of the year. I felt this flat stretch in the stock provided an appealing entry point for me to once again buy it at a valuation I liked.
The views expressed above reflect those of the portfolio manager(s) only through the end of the period as stated on the cover of this report and do not necessarily represent the views of Fidelity or any other person in the Fidelity organization. Any such views are subject to change at any time based upon market or other conditions and Fidelity disclaims any responsibility to update such views. These views may not be relied on as investment advice and, because investment decisions for a Fidelity fund are based on numerous factors, may not be relied on as an indication of trading intent on behalf of any Fidelity fund.
Annual Report
As a shareholder of the Fund, you incur two types of costs: (1) transaction costs, including redemption fees and (2) ongoing costs, including management fees and other Fund expenses. This Example is intended to help you understand your ongoing costs (in dollars) of investing in the Fund and to compare these costs with the ongoing costs of investing in other mutual funds.
The Example is based on an investment of $1,000 invested at the beginning of the period and held for the entire period (July 1, 2013 to December 31, 2013).
Actual Expenses
The first line of the accompanying table for each class of the Fund provides information about actual account values and actual expenses. You may use the information in this line, together with the amount you invested, to estimate the expenses that you paid over the period. Simply divide your account value by $1,000.00 (for example, an $8,600 account value divided by $1,000.00 = 8.6), then multiply the result by the number in the first line for a class of the Fund under the heading entitled "Expenses Paid During Period" to estimate the expenses you paid on your account during this period. The estimate of expenses does not include any fees or other expenses of any variable annuity or variable life insurance product. If they were, the estimate of expenses you paid during the period would be higher, and your ending account value would be lower. In addition, the Fund, as a shareholder in the underlying Fidelity Central Funds, will indirectly bear its pro-rata share of the fees and expenses incurred by the underlying Fidelity Central Funds. These fees and expenses are not included in the Fund's annualized expense ratio used to calculate the expense estimate in the table below.
Hypothetical Example for Comparison Purposes
The second line of the accompanying table for each class of the Fund provides information about hypothetical account values and hypothetical expenses based on a Class' actual expense ratio and an assumed rate of return of 5% per year before expenses, which is not the Class' actual return. The hypothetical account values and expenses may not be used to estimate the actual ending account balance or expenses you paid for the period. You may use this information to compare the ongoing costs of investing in the Fund and other funds. To do so, compare this 5% hypothetical example with the 5% hypothetical examples that appear in the shareholder reports of the other funds. The estimate of expenses does not include any fees or other expenses of any variable annuity or variable life insurance product. If they were, the estimate of expenses you paid during the period would be higher, and your ending account value would be lower. In addition, the Fund, as a shareholder in the underlying Fidelity Central Funds, will indirectly bear its pro-rata share of the fees and expenses incurred by the underlying Fidelity Central Funds. These fees and expenses are not included in the Fund's annualized expense ratio used to calculate the expense estimate in the table below.
Please note that the expenses shown in the table are meant to highlight your ongoing costs only and do not reflect any transaction costs. Therefore, the second line of the table is useful in comparing ongoing costs only, and will not help you determine the relative total costs of owning different funds. In addition, if these transactional costs were included, your costs would have been higher.
| Annualized
Expense Ratio B | Beginning
Account Value
July 1, 2013 | Ending
Account Value
December 31, 2013 | Expenses Paid
During Period*
July 1, 2013 to December 31, 2013 |
Initial Class | .73% | | | |
Actual | | $ 1,000.00 | $ 1,182.70 | $ 4.02 |
HypotheticalA | | $ 1,000.00 | $ 1,021.53 | $ 3.72 |
Investor Class | .81% | | | |
Actual | | $ 1,000.00 | $ 1,181.90 | $ 4.45 |
HypotheticalA | | $ 1,000.00 | $ 1,021.12 | $ 4.13 |
A 5% return per year before expenses
B Annualized expense ratio reflects expenses net of applicable fee waivers.
* Expenses are equal to each Class' annualized expense ratio, multiplied by the average account value over the period, multiplied by 184/365 (to reflect the one-half year period).
Annual Report
Investment Changes (Unaudited)
Top Ten Stocks as of December 31, 2013 |
| % of fund's
net assets | % of fund's net assets
6 months ago |
The Walt Disney Co. | 5.8 | 5.1 |
Twenty-First Century Fox, Inc. Class A | 3.7 | 5.0 |
Dollar General Corp. | 3.7 | 2.7 |
Lowe's Companies, Inc. | 3.6 | 3.7 |
McDonald's Corp. | 3.6 | 0.0 |
Yum! Brands, Inc. | 3.6 | 3.3 |
Target Corp. | 3.6 | 0.0 |
DIRECTV | 3.3 | 1.9 |
Dollar Tree, Inc. | 3.0 | 2.3 |
Time Warner, Inc. | 3.0 | 3.6 |
| 36.9 | |
Top Industries (% of fund's net assets) |
As of December 31, 2013 |
 | Specialty Retail | 26.1% | |
 | Media | 21.0% | |
 | Hotels, Restaurants & Leisure | 14.3% | |
 | Multiline Retail | 10.3% | |
 | Textiles, Apparel & Luxury Goods | 9.9% | |
 | All Others* | 18.4% | |

As of June 30, 2013 |
| Specialty Retail | 34.1% | |
| Media | 25.5% | |
| Hotels, Restaurants & Leisure | 12.1% | |
| Textiles, Apparel & Luxury Goods | 9.1% | |
| Multiline Retail | 5.0% | |
| All Others* | 14.2% | |

* Includes short-term investments and net other assets (liabilities). |
Annual Report
Investments December 31, 2013
Showing Percentage of Net Assets
Common Stocks - 98.4% |
| Shares | | Value |
AUTO COMPONENTS - 4.1% |
Auto Parts & Equipment - 4.1% |
Delphi Automotive PLC | 61,932 | | $ 3,723,971 |
TRW Automotive Holdings Corp. (a) | 28,885 | | 2,148,755 |
| | 5,872,726 |
COMMERCIAL SERVICES & SUPPLIES - 1.8% |
Diversified Support Services - 1.8% |
KAR Auction Services, Inc. | 86,100 | | 2,544,255 |
HOTELS, RESTAURANTS & LEISURE - 14.3% |
Hotels, Resorts & Cruise Lines - 1.9% |
Wyndham Worldwide Corp. | 36,600 | | 2,697,054 |
Restaurants - 12.4% |
Bloomin' Brands, Inc. (a) | 31,625 | | 759,316 |
Burger King Worldwide, Inc. | 94,492 | | 2,160,087 |
McDonald's Corp. | 52,615 | | 5,105,233 |
Panera Bread Co. Class A (a) | 13,931 | | 2,461,468 |
Texas Roadhouse, Inc. Class A | 70,692 | | 1,965,238 |
Yum! Brands, Inc. | 67,171 | | 5,078,799 |
| | 17,530,141 |
TOTAL HOTELS, RESTAURANTS & LEISURE | | 20,227,195 |
HOUSEHOLD DURABLES - 3.8% |
Homebuilding - 2.0% |
NVR, Inc. (a) | 2,843 | | 2,916,946 |
Housewares & Specialties - 1.8% |
Jarden Corp. (a) | 41,307 | | 2,534,184 |
TOTAL HOUSEHOLD DURABLES | | 5,451,130 |
INTERNET & CATALOG RETAIL - 5.1% |
Internet Retail - 5.1% |
Liberty Interactive Corp.: | | | |
(Venture Group) Series A (a) | 13,300 | | 1,630,447 |
Series A (a) | 87,844 | | 2,578,221 |
priceline.com, Inc. (a) | 2,661 | | 3,093,146 |
| | 7,301,814 |
INTERNET SOFTWARE & SERVICES - 1.5% |
Internet Software & Services - 1.5% |
eBay, Inc. (a) | 39,116 | | 2,147,077 |
LEISURE EQUIPMENT & PRODUCTS - 0.5% |
Leisure Products - 0.5% |
Brunswick Corp. | 17,037 | | 784,724 |
|
| Shares | | Value |
MEDIA - 21.0% |
Broadcasting - 2.2% |
Discovery Communications, Inc. Class A (a) | 26,548 | | $ 2,400,470 |
Liberty Media Corp. Class A (a) | 5,153 | | 754,657 |
| | 3,155,127 |
Cable & Satellite - 6.3% |
DIRECTV (a) | 67,637 | | 4,673,040 |
DISH Network Corp. Class A | 19,800 | | 1,146,816 |
Liberty Global PLC Class A (a) | 34,702 | | 3,088,131 |
| | 8,907,987 |
Movies & Entertainment - 12.5% |
The Walt Disney Co. | 106,864 | | 8,164,414 |
Time Warner, Inc. | 61,189 | | 4,266,097 |
Twenty-First Century Fox, Inc. Class A | 148,464 | | 5,222,964 |
| | 17,653,475 |
TOTAL MEDIA | | 29,716,589 |
MULTILINE RETAIL - 10.3% |
General Merchandise Stores - 10.3% |
Dollar General Corp. (a) | 85,838 | | 5,177,748 |
Dollar Tree, Inc. (a) | 76,386 | | 4,309,698 |
Target Corp. | 79,818 | | 5,050,085 |
| | 14,537,531 |
SPECIALTY RETAIL - 26.1% |
Apparel Retail - 9.3% |
Abercrombie & Fitch Co. Class A | 27,638 | | 909,567 |
Foot Locker, Inc. | 79,905 | | 3,311,263 |
L Brands, Inc. | 25,937 | | 1,604,203 |
Ross Stores, Inc. | 48,561 | | 3,638,676 |
TJX Companies, Inc. | 58,077 | | 3,701,247 |
| | 13,164,956 |
Automotive Retail - 4.1% |
AutoZone, Inc. (a) | 7,117 | | 3,401,499 |
O'Reilly Automotive, Inc. (a) | 18,672 | | 2,403,273 |
| | 5,804,772 |
Home Improvement Retail - 3.6% |
Lowe's Companies, Inc. | 104,034 | | 5,154,885 |
Homefurnishing Retail - 1.6% |
Williams-Sonoma, Inc. | 38,551 | | 2,246,752 |
Specialty Stores - 7.5% |
Cabela's, Inc. Class A (a) | 22,042 | | 1,469,320 |
Dick's Sporting Goods, Inc. | 50,652 | | 2,942,881 |
PetSmart, Inc. | 34,079 | | 2,479,247 |
Sally Beauty Holdings, Inc. (a) | 85,730 | | 2,591,618 |
Staples, Inc. | 69,526 | | 1,104,768 |
| | 10,587,834 |
TOTAL SPECIALTY RETAIL | | 36,959,199 |
Common Stocks - continued |
| Shares | | Value |
TEXTILES, APPAREL & LUXURY GOODS - 9.9% |
Apparel, Accessories & Luxury Goods - 7.0% |
PVH Corp. | 20,816 | | $ 2,831,392 |
Ralph Lauren Corp. | 14,798 | | 2,612,883 |
Swatch Group AG (Bearer) (Reg.) | 13,950 | | 1,570,069 |
VF Corp. | 46,024 | | 2,869,136 |
| | 9,883,480 |
Footwear - 2.9% |
NIKE, Inc. Class B | 20,620 | | 1,621,557 |
Wolverine World Wide, Inc. | 72,440 | | 2,460,062 |
| | 4,081,619 |
TOTAL TEXTILES, APPAREL & LUXURY GOODS | | 13,965,099 |
TOTAL COMMON STOCKS (Cost $117,138,515) |
139,507,339
|
Money Market Funds - 2.1% |
| Shares | | Value |
Fidelity Cash Central Fund, 0.11% (b)
(Cost $2,943,465) | 2,943,465 | | $ 2,943,465 |
TOTAL INVESTMENT PORTFOLIO - 100.5% (Cost $120,081,980) | | 142,450,804 |
NET OTHER ASSETS (LIABILITIES) - (0.5)% | | (750,483) |
NET ASSETS - 100% | $ 141,700,321 |
Legend |
(a) Non-income producing |
(b) Affiliated fund that is generally available only to investment companies and other accounts managed by Fidelity Investments. The rate quoted is the annualized seven-day yield of the fund at period end. A complete unaudited listing of the fund's holdings as of its most recent quarter end is available upon request. In addition, each Fidelity Central Fund's financial statements, which are not covered by the Fund's Report of Independent Registered Public Accounting Firm, are available on the SEC's website or upon request. |
Affiliated Central Funds |
Information regarding fiscal year to date income earned by the Fund from investments in Fidelity Central Funds is as follows: |
Fund | Income earned |
Fidelity Cash Central Fund | $ 2,702 |
Fidelity Securities Lending Cash Central Fund | 4,528 |
Total | $ 7,230 |
Other Information |
All investments are categorized as Level 1 under the Fair Value Hierarchy. The inputs or methodology used for valuing securities may not be an indication of the risk associated with investing in those securities. For more information on valuation inputs, please refer to the Investment Valuation section in the accompanying Notes to Financial Statements. |
See accompanying notes which are an integral part of the financial statements.
Annual Report
Statement of Assets and Liabilities
| December 31, 2013 |
| | |
Assets | | |
Investment in securities, at value - See accompanying schedule: Unaffiliated issuers (cost $117,138,515) | $ 139,507,339 | |
Fidelity Central Funds (cost $2,943,465) | 2,943,465 | |
Total Investments (cost $120,081,980) | | $ 142,450,804 |
Receivable for fund shares sold | | 172,646 |
Dividends receivable | | 139,224 |
Distributions receivable from Fidelity Central Funds | | 253 |
Prepaid expenses | | 729 |
Other receivables | | 640 |
Total assets | | 142,764,296 |
| | |
Liabilities | | |
Payable for investments purchased | $ 940,019 | |
Payable for fund shares redeemed | 6,070 | |
Accrued management fee | 61,837 | |
Other affiliated payables | 19,068 | |
Other payables and accrued expenses | 36,981 | |
Total liabilities | | 1,063,975 |
| | |
Net Assets | | $ 141,700,321 |
Net Assets consist of: | | |
Paid in capital | | $ 114,061,493 |
Undistributed net investment income | | 1,584 |
Accumulated undistributed net realized gain (loss) on investments and foreign currency transactions | | 5,268,476 |
Net unrealized appreciation (depreciation) on investments and assets and liabilities in foreign currencies | | 22,368,768 |
Net Assets | | $ 141,700,321 |
Statement of Assets and Liabilities - continued
| December 31, 2013 |
Initial Class:
Net Asset Value, offering price and redemption price per share ($32,003,821 ÷ 1,726,522 shares) | | $ 18.54 |
| | |
Investor Class:
Net Asset Value, offering price and redemption price per share ($109,696,500 ÷ 5,929,451 shares) | | $ 18.50 |
See accompanying notes which are an integral part of the financial statements.
Annual Report
Statement of Operations
| Year ended December 31, 2013 |
| | |
Investment Income | | |
Dividends | | $ 811,195 |
Income from Fidelity Central Funds | | 7,230 |
Total income | | 818,425 |
| | |
Expenses | | |
Management fee | $ 496,038 | |
Transfer agent fees | 121,275 | |
Accounting and security lending fees | 34,975 | |
Custodian fees and expenses | 20,962 | |
Independent trustees' compensation | 1,530 | |
Audit | 52,648 | |
Legal | 1,398 | |
Miscellaneous | 5,341 | |
Total expenses before reductions | 734,167 | |
Expense reductions | (6,392) | 727,775 |
Net investment income (loss) | | 90,650 |
Realized and Unrealized Gain (Loss) Net realized gain (loss) on: | | |
Investment securities: | | |
Unaffiliated issuers | 10,115,869 | |
Foreign currency transactions | 992 | |
Total net realized gain (loss) | | 10,116,861 |
Change in net unrealized appreciation (depreciation) on: Investment securities | 18,774,522 | |
Assets and liabilities in foreign currencies | 50 | |
Total change in net unrealized appreciation (depreciation) | | 18,774,572 |
Net gain (loss) | | 28,891,433 |
Net increase (decrease) in net assets resulting from operations | | $ 28,982,083 |
Statement of Changes in Net Assets
| Year ended
December 31,
2013 | Year ended
December 31,
2012 |
Increase (Decrease) in Net Assets | | |
Operations | | |
Net investment income (loss) | $ 90,650 | $ 154,141 |
Net realized gain (loss) | 10,116,861 | 3,486,001 |
Change in net unrealized appreciation (depreciation) | 18,774,572 | 1,524,889 |
Net increase (decrease) in net assets resulting
from operations | 28,982,083 | 5,165,031 |
Distributions to shareholders from net investment income | (106,746) | (114,050) |
Distributions to shareholders from net realized gain | (6,925,390) | (1,413,967) |
Total distributions | (7,032,136) | (1,528,017) |
Share transactions - net increase (decrease) | 80,192,932 | 13,745,246 |
Redemption fees | 44,414 | 14,756 |
Total increase (decrease) in net assets | 102,187,293 | 17,397,016 |
| | |
Net Assets | | |
Beginning of period | 39,513,028 | 22,116,012 |
End of period (including undistributed net investment income of $1,584 and undistributed net investment income of $17,821, respectively) | $ 141,700,321 | $ 39,513,028 |
See accompanying notes which are an integral part of the financial statements.
Annual Report
Financial Highlights - Initial Class
Years ended December 31, | 2013 | 2012 | 2011 | 2010 | 2009 |
Selected Per-Share Data | | | | | |
Net asset value, beginning of period | $ 14.24 | $ 12.26 | $ 12.56 | $ 9.58 | $ 6.96 |
Income from Investment Operations | | | | | |
Net investment income (loss) C | .03 | .07 | .06 | .02 | .04 |
Net realized and unrealized gain (loss) | 5.58 | 2.55 | (.29) | 2.96 | 2.62 |
Total from investment operations | 5.61 | 2.62 | (.23) | 2.98 | 2.66 |
Distributions from net investment income | (.02) | (.05) | (.08) | (.02) | (.05) |
Distributions from net realized gain | (1.30) | (.60) | - | - | - |
Total distributions | (1.32) | (.65) | (.08) | (.02) | (.05) |
Redemption fees added to paid in capital C | .01 | .01 | .01 | .02 | .01 |
Net asset value, end of period | $ 18.54 | $ 14.24 | $ 12.26 | $ 12.56 | $ 9.58 |
Total Return A, B | 41.10% | 21.67% | (1.75)% | 31.29% | 38.32% |
Ratios to Average Net Assets D, F | | | | | |
Expenses before reductions | .76% | .89% | .97% | 1.08% | 1.43% |
Expenses net of fee waivers, if any | .75% | .89% | .97% | 1.00% | 1.00% |
Expenses net of all reductions | .75% | .88% | .96% | .98% | .99% |
Net investment income (loss) | .16% | .53% | .49% | .23% | .57% |
Supplemental Data | | | | | |
Net assets, end of period (000 omitted) | $ 32,004 | $ 11,950 | $ 7,462 | $ 18,113 | $ 4,098 |
Portfolio turnover rate E | 122% | 190% | 182% | 191% | 166% |
A Total returns do not reflect charges attributable to your insurance company's separate account. Inclusion of these charges would reduce the total returns shown.
B Total returns would have been lower if certain expenses had not been reduced during the applicable periods shown.
C Calculated based on average shares outstanding during the period.
D Fees and expenses of any underlying Fidelity Central Funds are not included in the Fund's expense ratio. The Fund indirectly bears its proportionate share of the expenses of any underlying Fidelity Central Funds.
E Amount does not include the portfolio activity of any underlying Fidelity Central Funds.
F Expense ratios reflect operating expenses of the class. Expenses before reductions do not reflect amounts reimbursed by the investment adviser or reductions from brokerage service arrangements or reductions from other expense offset arrangements and do not represent the amount paid by the class during periods when reimbursements or reductions occur. Expenses net of fee waivers reflect expenses after reimbursement by the investment adviser but prior to reductions from brokerage service arrangements or other expense offset arrangements. Expenses net of all reductions represent the net expenses paid by the class.
Financial Highlights - Investor Class
Years ended December 31, | 2013 | 2012 | 2011 | 2010 | 2009 |
Selected Per-Share Data | | | | | |
Net asset value, beginning of period | $ 14.21 | $ 12.25 | $ 12.54 | $ 9.57 | $ 6.96 |
Income from Investment Operations | | | | | |
Net investment income (loss) C | .01 | .06 | .05 | .02 | .04 |
Net realized and unrealized gain (loss) | 5.58 | 2.53 | (.28) | 2.94 | 2.61 |
Total from investment operations | 5.59 | 2.59 | (.23) | 2.96 | 2.65 |
Distributions from net investment income | (.01) | (.04) | (.07) | (.01) | (.05) |
Distributions from net realized gain | (1.30) | (.60) | - | - | - |
Total distributions | (1.31) | (.64) | (.07) | (.01) | (.05) |
Redemption fees added to paid in capital C | .01 | .01 | .01 | .02 | .01 |
Net asset value, end of period | $ 18.50 | $ 14.21 | $ 12.25 | $ 12.54 | $ 9.57 |
Total Return A, B | 41.05% | 21.45% | (1.76)% | 31.16% | 38.17% |
Ratios to Average Net Assets D, F | | | | | |
Expenses before reductions | .83% | .96% | 1.04% | 1.14% | 1.51% |
Expenses net of fee waivers, if any | .83% | .96% | 1.04% | 1.08% | 1.08% |
Expenses net of all reductions | .83% | .94% | 1.03% | 1.06% | 1.08% |
Net investment income (loss) | .08% | .46% | .42% | .15% | .48% |
Supplemental Data | | | | | |
Net assets, end of period (000 omitted) | $ 109,697 | $ 27,563 | $ 14,654 | $ 24,281 | $ 4,224 |
Portfolio turnover rate E | 122% | 190% | 182% | 191% | 166% |
A Total returns do not reflect charges attributable to your insurance company's separate account. Inclusion of these charges would reduce the total returns shown.
B Total returns would have been lower if certain expenses had not been reduced during the applicable periods shown.
C Calculated based on average shares outstanding during the period.
D Fees and expenses of any underlying Fidelity Central Funds are not included in the Fund's expense ratio. The Fund indirectly bears its proportionate share of the expenses of any underlying Fidelity Central Funds.
E Amount does not include the portfolio activity of any underlying Fidelity Central Funds.
F Expense ratios reflect operating expenses of the class. Expenses before reductions do not reflect amounts reimbursed by the investment adviser or reductions from brokerage service arrangements or reductions from other expense offset arrangements and do not represent the amount paid by the class during periods when reimbursements or reductions occur. Expenses net of fee waivers reflect expenses after reimbursement by the investment adviser but prior to reductions from brokerage service arrangements or other expense offset arrangements. Expenses net of all reductions represent the net expenses paid by the class.
See accompanying notes which are an integral part of the financial statements.
Annual Report
Notes to Financial Statements
For the period ended December 31, 2013
1. Organization.
VIP Consumer Discretionary Portfolio (the Fund) is a non-diversified fund of Variable Insurance Products Fund IV (the Trust) and is authorized to issue an unlimited number of shares. The Trust is registered under the Investment Company Act of 1940, as amended (the 1940 Act), as an open-end management investment company organized as a Massachusetts business trust. Shares of the Fund may only be purchased by insurance companies for the purpose of funding variable annuity or variable life insurance contracts. The Fund offers the following classes of shares: Initial Class shares and Investor Class shares. All classes have equal rights and voting privileges, except for matters affecting a single class.
2. Investments in Fidelity Central Funds.
The Fund invests in Fidelity Central Funds, which are open-end investment companies generally available only to other investment companies and accounts managed by the investment adviser and its affiliates. The Fund's Schedule of Investments lists each of the Fidelity Central Funds held as of period end, if any, as an investment of the Fund, but does not include the underlying holdings of each Fidelity Central Fund. As an Investing Fund, the Fund indirectly bears its proportionate share of the expenses of the underlying Fidelity Central Funds.
The Money Market Central Funds seek preservation of capital and current income and are managed by Fidelity Investments Money Management, Inc. (FIMM), an affiliate of the investment adviser. Annualized expenses of the Money Market Central Funds as of their most recent shareholder report date are less than .01%.
A complete unaudited list of holdings for each Fidelity Central Fund is available upon request or at the Securities and Exchange Commission (the SEC) website at www.sec.gov. In addition, the financial statements of the Fidelity Central Funds, which are not covered by the Fund's Report of Independent Registered Public Accounting Firm, are available on the SEC website or upon request.
3. Significant Accounting Policies.
The financial statements have been prepared in conformity with accounting principles generally accepted in the United States of America (GAAP), which require management to make certain estimates and assumptions at the date of the financial statements. Actual results could differ from those estimates. Subsequent events, if any, through the date that the financial statements were issued have been evaluated in the preparation of the financial statements. The following summarizes the significant accounting policies of the Fund:
Investment Valuation. Investments are valued as of 4:00 p.m. Eastern time on the last calendar day of the period. In accordance with valuation policies and procedures approved by the Board of Trustees (the Board), the Fund attempts to obtain prices from one or more third party pricing vendors or brokers to value its investments. When current market prices, quotations or currency exchange rates are not readily available or reliable, investments will be fair valued in good faith by the Fidelity SelectCo, LLC (SelectCo) Fair Value Committee (the Committee), in accordance with procedures adopted by the Board. Factors used in determining fair value vary by investment type and may include market or investment specific events. The frequency with which these procedures are used cannot be predicted and they may be utilized to a significant extent. The Committee oversees the Fund's valuation policies and procedures and is responsible for approving and reporting to the Board all fair value determinations.
The Fund categorizes the inputs to valuation techniques used to value its investments into a disclosure hierarchy consisting of three levels as shown below:
Level 1 - quoted prices in active markets for identical investments
Level 2 - other significant observable inputs (including quoted prices for similar investments, interest rates, prepayment speeds, etc.)
Level 3 - unobservable inputs (including the Fund's own assumptions based on the best information available)
Valuation techniques used to value the Fund's investments by major category are as follows:
Equity securities, including restricted securities, for which market quotations are readily available, are valued at the last reported sale price or official closing price as reported by a third party pricing vendor on the primary market or exchange on which they are traded and are categorized as Level 1 in the hierarchy. In the event there were no sales during the day or closing prices are not available, securities are valued at the last quoted bid price or may be valued using the last available price and are generally categorized as Level 2 in the hierarchy. For foreign equity securities, when market or security specific events arise, comparisons to the valuation of American Depositary Receipts (ADRs), futures contracts, Exchange-Traded Funds (ETFs) and certain indexes as well as quoted prices for similar securities may be used and would be categorized as Level 2 in the hierarchy. Utilizing these techniques may result in transfers between Level 1 and Level 2. For equity securities, including restricted securities, where observable inputs are limited, assumptions about market activity and risk are used and these securities may be categorized as Level 3 in the hierarchy.
Investments in open-end mutual funds, including the Fidelity Central Funds, are valued at their closing net asset value (NAV) each business day and are categorized as Level 1 in the hierarchy.
Changes in valuation techniques may result in transfers in or out of an assigned level within the disclosure hierarchy.
Annual Report
3. Significant Accounting Policies - continued
Foreign Currency. The Fund may use foreign currency contracts to facilitate transactions in foreign-denominated securities. Gains and losses from these transactions may arise from changes in the value of the foreign currency or if the counterparties do not perform under the contracts' terms.
Foreign-denominated assets, including investment securities, and liabilities are translated into U.S. dollars at the exchange rates at period end. Purchases and sales of investment securities, income and dividends received and expenses denominated in foreign currencies are translated into U.S. dollars at the exchange rate in effect on the transaction date.
The effects of exchange rate fluctuations on investments are included with the net realized and unrealized gain (loss) on investment securities. Other foreign currency transactions resulting in realized and unrealized gain (loss) are disclosed separately.
Investment Transactions and Income. For financial reporting purposes, the Fund's investment holdings and NAV include trades executed through the end of the last business day of the period. The NAV per share for processing shareholder transactions is calculated as of the close of business of the New York Stock Exchange (NYSE), normally 4:00 p.m. Eastern time and includes trades executed through the end of the prior business day. Gains and losses on securities sold are determined on the basis of identified cost and may include proceeds received from litigation. Dividend income is recorded on the ex-dividend date, except for certain dividends from foreign securities where the ex-dividend date may have passed, which are recorded as soon as the Fund is informed of the ex-dividend date. Non-cash dividends included in dividend income, if any, are recorded at the fair market value of the securities received. Distributions received on securities that represent a return of capital or capital gain are recorded as a reduction of cost of investments and/or as a realized gain. Subsequent to ex-dividend date the Fund determines the components of these distributions, based upon receipt of tax filings or other correspondence relating to the underlying investment. Interest income and distributions from the Fidelity Central Funds are accrued as earned. Investment income is recorded net of foreign taxes withheld where recovery of such taxes is uncertain.
Class Allocations and Expenses. Investment income, realized and unrealized capital gains and losses, common expenses of the Fund, and certain fund-level expense reductions, if any, are allocated daily on a pro-rata basis to each class based on the relative net assets of each class to the total net assets of the Fund. Each class differs with respect to transfer agent fees incurred. Certain expense reductions may also differ by class. For the reporting period, the allocated portion of income and expenses to each class as a percent of its average net assets may vary due to the timing of recording these transactions in relation to fluctuating net assets of the classes. Expenses directly attributable to a fund are charged to that fund. Expenses attributable to more than one fund are allocated among the respective funds on the basis of relative net assets or other appropriate methods. Expense estimates are accrued in the period to which they relate and adjustments are made when actual amounts are known.
Income Tax Information and Distributions to Shareholders. Each year, the Fund intends to qualify as a regulated investment company under Subchapter M of the Internal Revenue Code, including distributing substantially all of its taxable income and realized gains. As a result, no provision for U.S. Federal income taxes is required. As of December 31, 2013, the Fund did not have any unrecognized tax benefits in the financial statements; nor is the Fund aware of any tax positions for which it is reasonably possible that the total amounts of unrecognized tax benefits will significantly change in the next twelve months. The Fund files a U.S. federal tax return, in addition to state and local tax returns as required. The Fund's federal income tax returns are subject to examination by the Internal Revenue Service (IRS) for a period of three fiscal years after they are filed. State and local tax returns may be subject to examination for an additional fiscal year depending on the jurisdiction. Foreign taxes are provided for based on the Fund's understanding of the tax rules and rates that exist in the foreign markets in which it invests.
Distributions are declared and recorded on the ex-dividend date. Income dividends and capital gain distributions are declared separately for each class. Income and capital gain distributions are determined in accordance with income tax regulations, which may differ from GAAP.
Capital accounts within the financial statements are adjusted for permanent book-tax differences. These adjustments have no impact on net assets or the results of operations. Capital accounts are not adjusted for temporary book-tax differences which will reverse in a subsequent period.
Book-tax differences are primarily due to foreign currency transactions, and losses deferred due to wash sales.
The federal tax cost of investment securities and unrealized appreciation (depreciation) as of period end were as follows:
Gross unrealized appreciation | $ 22,641,755 |
Gross unrealized depreciation | (763,338) |
Net unrealized appreciation (depreciation) on securities and other investments | $ 21,878,417 |
| |
Tax cost | $ 120,572,387 |
Annual Report
Notes to Financial Statements - continued
3. Significant Accounting Policies - continued
Income Tax Information and Distributions to Shareholders - continued
The tax-based components of distributable earnings as of period end were as follows:
Undistributed ordinary income | $ 2,406,058 |
Undistributed long-term capital gain | $ 3,354,410 |
Net unrealized appreciation (depreciation) | $ 21,878,361 |
The tax character of distributions paid was as follows:
| December 31, 2013 | December 31, 2012 |
Ordinary Income | $ 4,654,277 | $ 1,129,298 |
Long-term Capital Gains | 2,377,859 | 398,719 |
Total | $ 7,032,136 | $ 1,528,017 |
Trading (Redemption) Fees. Shares held by investors less than 60 days may be subject to a redemption fee equal to 1% of the NAV of shares redeemed. All redemption fees, which reduce the proceeds of the shareholder redemption, are retained by the Fund and accounted for as an addition to paid in capital.
4. Purchases and Sales of Investments.
Purchases and sales of securities, other than short-term securities, aggregated $179,918,404 and $107,536,811, respectively.
5. Fees and Other Transactions with Affiliates.
Management Fee. Effective August 1, 2013, SelectCo replaced Fidelity Management and Research Company (FMR), an affiliate of SelectCo, as investment adviser to the Fund. The investment adviser and its affiliates provide the Fund with investment management related services for which the Fund pays a monthly management fee. The management fee is the sum of an individual fund fee rate that is based on an annual rate of .30% of the Fund's average net assets and an annualized group fee rate that averaged .25% during the period. The group fee rate is based upon the average net assets of all the mutual funds advised by FMR and the investment adviser. The group fee rate decreases as assets under management increase and increases as assets under management decrease. For the reporting period, the total annual management fee rate was .55% of the Fund's average net assets.
Transfer Agent Fees. Fidelity Investments Institutional Operations Company, Inc. (FIIOC), an affiliate of the investment adviser, is the Fund's transfer, dividend disbursing, and shareholder servicing agent. FIIOC receives an asset-based fee with respect to each class. Each class (with the exception of Investor Class) pays a transfer agent fee, excluding out of pocket expenses, equal to an annual rate of .07% of average net assets. Investor Class pays a monthly asset-based transfer agent fee of .15% of average net assets. In addition, FIIOC receives an asset-based fee of .0035% of average net assets for typesetting, printing and mailing of shareholder reports, except proxy statements. FIIOC voluntarily agreed to reimburse or waive this fee for the period January 1, 2013 through December 31, 2013 (see Expense Reductions note). For the period, transfer agent fees for each class, including printing and out of pocket expenses, were as follows:
Initial Class | $ 17,628 |
Investor Class | 103,647 |
| $ 121,275 |
Effective February 1, 2014, the Board of Trustees approved an amendment to the transfer agent fee agreement whereby each class (with the exception of Investor Class) pays a single fee of .07% of average net assets for transfer agent services, typesetting, printing and mailing of shareholder reports, excluding mailing of proxy statements and out of pocket expenses. Investor Class pays a single fee of .15% of average net assets.
Accounting and Security Lending Fees. Fidelity Service Company, Inc. (FSC), an affiliate of the investment adviser, maintains the Fund's accounting records. The accounting fee is based on the level of average net assets for each month. Under a separate contract, FSC administers the security lending program. The security lending fee is based on the number and duration of lending transactions.
Brokerage Commissions. The Fund placed a portion of its portfolio transactions with brokerage firms which are affiliates of the investment adviser. Brokerage commissions are included in net realized gain (loss) and change in net unrealized appreciation (depreciation) in the Statement of Operations. The commissions paid to these affiliated firms were $4,439 for the period.
Annual Report
6. Committed Line of Credit.
The Fund participates with other funds managed by the investment adviser or an affiliate in a $4.25 billion credit facility (the "line of credit") to be utilized for temporary or emergency purposes to fund shareholder redemptions or for other short-term liquidity purposes. The Fund has agreed to pay commitment fees on its pro-rata portion of the line of credit, which amounted to $136 and is reflected in Miscellaneous expenses on the Statement of Operations. During the period, there were no borrowings on this line of credit.
7. Security Lending.
The Fund lends portfolio securities through a lending agent from time to time in order to earn additional income. For equity securities, a lending agent is used and may loan securities to certain qualified borrowers, which prior to August 1, 2013 included Fidelity Capital Markets (FCM), a broker-dealer affiliated with the Fund. On the settlement date of the loan, the Fund receives collateral (in the form of U.S. Treasury obligations, letters of credit and/or cash) against the loaned securities and maintains collateral in an amount not less than 100% of the market value of the loaned securities during the period of the loan. The market value of the loaned securities is determined at the close of business of the Fund and any additional required collateral is delivered to the Fund on the next business day. If the borrower defaults on its obligation to return the securities loaned because of insolvency or other reasons, the Fund may apply collateral received from the borrower against the obligation. The Fund may experience delays and costs in recovering the securities loaned. Any cash collateral received is invested in the Fidelity Securities Lending Cash Central Fund. At period end, there were no security loans outstanding. Security lending income represents the income earned on investing cash collateral, less rebates paid to borrowers and any lending agent fees associated with the loan, plus any premium payments received for lending certain types of securities. Security lending income is presented in the Statement of Operations as a component of income from Fidelity Central Funds. Total security lending income during the period amounted to $4,528. During the period, there were no securities loaned to FCM.
8. Expense Reductions.
The investment adviser or its affiliates agreed to reimburse or waive certain fees during the period as noted in the table below.
Initial Class | $ 853 |
Investor Class | 2,556 |
| $ 3,409 |
Commissions paid to certain brokers with whom the investment adviser, or its affiliates, places trades on behalf of the Fund include an amount in addition to trade execution, which may be rebated back to the Fund to offset certain expenses. This amount totaled $2,983 for the period.
9. Distributions to Shareholders.
Distributions to shareholders of each class were as follows:
Years ended December 31, | 2013 | 2012 |
From net investment income | | |
Initial Class | $ 33,883 | $ 40,396 |
Investor Class | 72,863 | 73,654 |
Total | $ 106,746 | $ 114,050 |
From net realized gain | | |
Initial Class | $ 1,661,145 | $ 449,784 |
Investor Class | 5,264,245 | 964,183 |
Total | $ 6,925,390 | $ 1,413,967 |
10. Share Transactions.
Transactions for each class of shares were as follows:
| Shares | Dollars |
Years ended December 31, | 2013 | 2012 | 2013 | 2012 |
Initial Class | | | | |
Shares sold | 1,073,425 | 548,097 | $ 17,652,880 | $ 7,706,657 |
Reinvestment of distributions | 102,990 | 35,509 | 1,695,028 | 490,180 |
Shares redeemed | (289,291) | (352,655) | (4,913,481) | (4,899,068) |
Net increase (decrease) | 887,124 | 230,951 | $ 14,434,427 | $ 3,297,769 |
Annual Report
Notes to Financial Statements - continued
10. Share Transactions - continued
| Shares | Dollars |
Years ended December 31, | 2013 | 2012 | 2013 | 2012 |
Investor Class | | | | |
Shares sold | 4,193,984 | 1,327,905 | $ 69,132,736 | $ 18,573,917 |
Reinvestment of distributions | 321,344 | 75,266 | 5,337,108 | 1,037,836 |
Shares redeemed | (524,897) | (660,653) | (8,711,339) | (9,164,276) |
Net increase (decrease) | 3,990,431 | 742,518 | $ 65,758,505 | $ 10,447,477 |
11. Other.
The Fund's organizational documents provide former and current trustees and officers with a limited indemnification against liabilities arising in connection with the performance of their duties to the Fund. In the normal course of business, the Fund may also enter into contracts that provide general indemnifications. The Fund's maximum exposure under these arrangements is unknown as this would be dependent on future claims that may be made against the Fund. The risk of material loss from such claims is considered remote.
At the end of the period, the investment adviser or its affiliates were the owners of record of 100% of the total outstanding shares of the Fund.
Annual Report
Report of Independent Registered Public Accounting Firm
To the Trustees of Variable Insurance Products Fund IV and the Shareholders of VIP Consumer Discretionary Portfolio:
In our opinion, the accompanying statement of assets and liabilities, including the schedule of investments, and the related statements of operations and of changes in net assets and the financial highlights present fairly, in all material respects, the financial position of VIP Consumer Discretionary Portfolio (a fund of Variable Insurance Products Fund IV) at December 31, 2013, the results of its operations for the year then ended, the changes in its net assets for each of the two years in the period then ended and the financial highlights for each of the five years in the period then ended, in conformity with accounting principles generally accepted in the United States of America. These financial statements and financial highlights (hereafter referred to as "financial statements") are the responsibility of the VIP Consumer Discretionary Portfolio's management. Our responsibility is to express an opinion on these financial statements based on our audits. We conducted our audits of these financial statements in accordance with the standards of the Public Company Accounting Oversight Board (United States). Those standards require that we plan and perform the audit to obtain reasonable assurance about whether the financial statements are free of material misstatement. An audit includes examining, on a test basis, evidence supporting the amounts and disclosures in the financial statements, assessing the accounting principles used and significant estimates made by management, and evaluating the overall financial statement presentation. We believe that our audits, which included confirmation of securities at December 31, 2013 by correspondence with the custodian and brokers, provide a reasonable basis for our opinion.
PricewaterhouseCoopers LLP
Boston, Massachusetts
February 14, 2014
Annual Report
The Trustees and officers of the trust and fund, as applicable, are listed below. The Board of Trustees governs the fund and is responsible for protecting the interests of shareholders. The Trustees are experienced executives who meet periodically throughout the year to oversee the fund's activities, review contractual arrangements with companies that provide services to the fund, oversee management of the risks associated with such activities and contractual arrangements, and review the fund's performance. Except for Ned C. Lautenbach, Ronald P. O'Hanley, and William S. Stavropoulos, each of the Trustees oversees 74 funds. Mr. Lautenbach, Mr. O'Hanley, and Mr. Stavropoulos each oversees 247 funds.
The Trustees hold office without limit in time except that (a) any Trustee may resign; (b) any Trustee may be removed by written instrument, signed by at least two-thirds of the number of Trustees prior to such removal; (c) any Trustee who requests to be retired or who has become incapacitated by illness or injury may be retired by written instrument signed by a majority of the other Trustees; and (d) any Trustee may be removed at any special meeting of shareholders by a two-thirds vote of the outstanding voting securities of the trust. The officers hold office without limit in time, except that any officer may resign or may be removed by a vote of a majority of the Trustees at any regular meeting or any special meeting of the Trustees. Except as indicated, each individual has held the office shown or other offices in the same company for the past five years.
Experience, Skills, Attributes, and Qualifications of the Fund's Trustees. The Governance and Nominating Committee has adopted a statement of policy that describes the experience, qualifications, attributes, and skills that are necessary and desirable for potential Independent Trustee candidates (Statement of Policy). The Board believes that each Trustee satisfied at the time he or she was initially elected or appointed a Trustee, and continues to satisfy, the standards contemplated by the Statement of Policy. The Governance and Nominating Committee also engages professional search firms to help identify potential Independent Trustee candidates who have the experience, qualifications, attributes, and skills consistent with the Statement of Policy. From time to time, additional criteria based on the composition and skills of the current Independent Trustees, as well as experience or skills that may be appropriate in light of future changes to board composition, business conditions, and regulatory or other developments, have also been considered by the professional search firms and the Governance and Nominating Committee. In addition, the Board takes into account the Trustees' commitment and participation in Board and committee meetings, as well as their leadership of standing and ad hoc committees throughout their tenure.
In determining that a particular Trustee was and continues to be qualified to serve as a Trustee, the Board has considered a variety of criteria, none of which, in isolation, was controlling. The Board believes that, collectively, the Trustees have balanced and diverse experience, qualifications, attributes, and skills, which allow the Board to operate effectively in governing the fund and protecting the interests of shareholders. Information about the specific experience, skills, attributes, and qualifications of each Trustee, which in each case led to the Board's conclusion that the Trustee should serve (or continue to serve) as a trustee of the fund, is provided below.
Board Structure and Oversight Function. Ronald P. O'Hanley is an interested person (as defined in the 1940 Act) and currently serves as Chairman. The Trustees have determined that an interested Chairman is appropriate and benefits shareholders because an interested Chairman has a personal and professional stake in the quality and continuity of services provided to the fund Independent Trustees exercise their informed business judgment to appoint an individual of their choosing to serve as Chairman, regardless of whether the Trustee happens to be independent or a member of management. The Independent Trustees have determined that they can act independently and effectively without having an Independent Trustee serve as Chairman and that a key structural component for assuring that they are in a position to do so is for the Independent Trustees to constitute a substantial majority for the Board. The Independent Trustees also regularly meet in executive session. Michael E. Wiley serves as Chairman of the Independent Trustees and as such (i) acts as a liaison between the Independent Trustees and management with respect to matters important to the Independent Trustees and (ii) with management prepares agendas for Board meetings.
Fidelity funds are overseen by different Boards of Trustees. The fund's Board oversees Fidelity's sector portfolios. Other Boards oversee Fidelity's equity and high income funds, and Fidelity's investment grade bond, money market, and asset allocation funds. The use of separate Boards, each with its own committee structure, allows the Trustees of each group of Fidelity funds to focus on the unique issues of the funds they oversee, including common research, investment, and operational issues. On occasion, the separate Boards establish joint committees to address issues of overlapping consequences for the Fidelity funds overseen by each Board.
The Trustees operate using a system of committees to facilitate the timely and efficient consideration of all matters of importance to the Trustees,the fund, and fund shareholders and to facilitate compliance with legal and regulatory requirements and oversight of the fund's activities and associated risks. The Board, acting through its committees, has charged SelectCo and its affiliates with (i) identifying events or circumstances the occurrence of which could have demonstrably adverse effects on the fund's business and/or reputation; (ii) implementing processes and controls to lessen the possibility that such events or circumstances occur or to mitigate the effects of such events or circumstances if they do occur; and (iii) creating and maintaining a system designed to evaluate continuously business and market conditions in order to facilitate the identification and implementation processes described in (i) and (ii) above. Because the day-to-day operations and activities of the fund are carried out by or through SelectCo, its affiliates, and other service providers, the fund's exposure to risks is mitigated but not eliminated by the processes overseen by the Trustees. While each of the Board's committees has responsibility for overseeing different aspects of the fund's activities, oversight is exercised primarily through the Operations and Audit Committees. Appropriate personnel, including but not limited to the fund's Chief Compliance Officer (CCO), SelectCo's internal auditor, the independent accountants, the fund's Treasurer and portfolio management personnel, make periodic reports to the Board's committees, as appropriate. The responsibilities of each standing committee, including their oversight responsibilities, are described further under "Standing Committees of the Fund's Trustees."
The fund's Statement of Additional Information (SAI) includes more information about the Trustees. To request a free copy, call Fidelity at 1-877-208-0098.
Annual Report
Interested Trustees*:
Correspondence intended for the Trustee who is an interested person may be sent to Fidelity Investments, 245 Summer Street, Boston, Massachusetts 02210.
Name, Year of Birth; Principal Occupations and Other Relevant Experience+ |
Ronald P. O'Hanley (1957) |
Year of Election or Appointment: 2011 Trustee Chairman of the Board of Trustees |
| Mr. O'Hanley also serves as Trustee of other Fidelity funds. He is Director of Fidelity SelectCo, LLC (2013-present), FMR Co., Inc. (2010-present), Director of Fidelity Investments Money Management, Inc. (2010-present), Director of Fidelity Research & Analysis Company (2010-present), President of Fidelity Asset Management and Corporate Services and a Member of Fidelity's Executive Committee (2010-present). Previously, Mr. O'Hanley served as President and Chief Executive Officer of BNY Mellon Asset Management (2007-2010). Mr. O'Hanley also served as Vice Chairman of Bank New York Mellon Corp. and a member of that firm's Executive Committee. Prior to the 2007 merger of The Bank of New York and Mellon Financial Corporation, he was Vice Chairman of Mellon Financial Corporation and President and Chief Executive Officer of Mellon Asset Management. He joined Mellon in February 1997. Mr. O'Hanley currently serves as Chairman of the Boston Public Library Foundation Board of Directors and sits on the Board of Directors of Beth Israel Deaconess Medical Center, the Board of Trustees of the Marine Biological Laboratory and the Advisory Board of the Maxwell School of Citizenship and Public Administration at Syracuse University. Mr. O'Hanley also chairs the Council on Asset Management for the Financial Services Roundtable and is a member of the Board of Directors of Institutional Investor's U.S. Institute. |
* Trustee has been determined to be an "Interested Trustee" by virtue of, among other things, his affiliation with the trust or various entities under common control with SelectCo.
+ The information above includes the Trustee's principal occupation during the last five years and other information relating to the experience, attributes, and skills relevant to the Trustee's qualifications to serve as a Trustee, which led to the conclusion that the Trustee should serve as a Trustee for the fund.
Independent Trustees:
Correspondence intended for each Independent Trustee (that is, the Trustees other than the Interested Trustees) may be sent to Fidelity Investments, P.O. Box 55235, Boston, Massachusetts 02205-5235.
Name, Year of Birth; Principal Occupations and Other Relevant Experience+ |
Ned C. Lautenbach (1944) |
Year of Election or Appointment: 2000 Trustee |
| Mr. Lautenbach also serves as Trustee of other Fidelity funds. Mr. Lautenbach currently serves as the Lead Director of the Eaton Corporation Board of Directors (diversified industrial, 1997-present). Mr. Lautenbach is Chairman of the Board of Directors of the Philharmonic Center for the Arts in Naples, Florida (2012-present) and a member of the Council on Foreign Relations (1994-present). Previously, Mr. Lautenbach was a Partner/Advisory Partner at Clayton, Dubilier & Rice, LLC (private equity investment, 1998-2010), as well as a Director of Sony Corporation (2006-2007). |
David A. Rosow (1942) |
Year of Election or Appointment: 2013 Trustee |
| Mr. Rosow also serves as Trustee of other Fidelity funds. Mr. Rosow is Chairman and Chief Executive Officer of International Golf Group, Inc. (golf course development, 1989-present). Previously, Mr. Rosow served as Chairman and Chief Executive Officer of Rosow & Company, Inc. (private investment company, 1989-2011), a Lead Director of Hudson United Bancorp (2001-2006) and as a Director of TD Banknorth (1996-2006). In addition, Mr. Rosow is a member (2008-present) and President (2009-present) of the Town Council of Palm Beach, Florida. Mr. Rosow served as a Member of the Advisory Board of other Fidelity funds (2012-2013). |
Garnett A. Smith (1947) |
Year of Election or Appointment: 2013 Trustee |
| Mr. Smith also serves as Trustee of other Fidelity funds. Prior to Mr. Smith's retirement, he served as Chairman and Chief Executive Officer of Inbrand Corp. (manufacturer of personal absorbent products, 1990-1997). He also served as President (1986-1990) of Inbrand Corp. Prior to his employment with Inbrand Corp., he was employed by a retail fabric chain and North Carolina National Bank. In addition, Mr. Smith is a board member of the Jackson Hole Land Trust (2009-present). Mr. Smith served as a Member of the Advisory Board of other Fidelity funds (2012-2013). |
William S. Stavropoulos (1939) |
Year of Election or Appointment: 2001 Trustee |
| Mr. Stavropoulos also serves as Trustee of other Fidelity funds. Mr. Stavropoulos serves as President and Founder of the Michigan Baseball Foundation, the Great Lakes Loons (2007-present). Mr. Stavropoulos is Chairman Emeritus of the Board of Directors of The Dow Chemical Company, where he previously served in numerous senior management positions, including President, CEO (1995-2000; 2002-2004), Chairman of the Executive Committee (2000-2006), and as a member of the Board of Directors (1990-2006). Currently, Mr. Stavropoulos is Chairman of the Board of Directors of Univar Inc. (global distributor of commodity and specialty chemicals), a Director of Teradata Corporation (data warehousing and technology solutions), and Maersk Inc. (industrial conglomerate), and a member of the Advisory Board for Metalmark Capital LLC (private equity investment, 2005-present). Mr. Stavropoulos is an operating advisor to Clayton, Dubilier & Rice, LLC (private equity investment). In addition, Mr. Stavropoulos is a member of the University of Notre Dame Advisory Council for the College of Science, a Trustee of the Rollin L. Gerstacker Foundation, and a Director of the Naples Philharmonic Center for the Arts. Previously, Mr. Stavropoulos served as a Director of Chemical Financial Corporation (bank holding company, 1993-2012) and Tyco International, Ltd. (multinational manufacturing and services, 2007-2012). |
Michael E. Wiley (1950) |
Year of Election or Appointment: 2008 Trustee Chairman of the Independent Trustees |
| Mr. Wiley also serves as Trustee of other Fidelity funds. Mr. Wiley serves as a Director of Asia Pacific Exploration Consolidated (international oil and gas exploration and production, 2008-present). Mr. Wiley serves as a Director of Tesoro Corporation (independent oil refiner and marketer, 2005-present), and a Director of Bill Barrett Corporation (exploration and production, 2005-present). In addition, Mr. Wiley also serves as a Director of Post Oak Bank (privately-held bank, 2004-present). Previously, Mr. Wiley served as a Trustee of other Fidelity funds (2008-2013), as a member of the Board of Trustees of the University of Tulsa (2000-2006; 2007-2010), as a Senior Energy Advisor of Katzenbach Partners, LLC (consulting, 2006-2007), as an Advisory Director of Riverstone Holdings (private investment), Chairman, President, and CEO of Baker Hughes, Inc. (oilfield services, 2000-2004), and as Director of Spinnaker Exploration Company (exploration and production, 2001-2005). |
+ The information above includes each Trustee's principal occupation during the last five years and other information relating to the experience, attributes, and skills relevant to each Trustee's qualifications to serve as a Trustee, which led to the conclusion that each Trustee should serve as a Trustee for the fund.
Officers
Except for Anthony R. Rochte, correspondence intended for each officer may be sent to Fidelity Investments, 245 Summer Street, Boston, Massachusetts 02210. Correspondence intended for Mr. Rochte may be sent to SelectCo, 1225 17th Street, Denver, Colorado 80202-5541. Officers appear below in alphabetical order.
Name, Year of Birth; Principal Occupation |
Christopher S. Bartel (1971) |
Year of Election or Appointment: 2009 Vice President |
| Mr. Bartel also serves as Vice President of other funds. Mr. Bartel serves as a Director, President, and Chief Executive Officer of Fidelity Management & Research (Japan) Inc. (2012-present), a Director of Fidelity Management & Research (Hong Kong) (2012-present), and Senior Vice President of Global Equity Research (2010-present). Previously, Mr. Bartel served as Senior Vice President of Equity Research (2009-2010), Managing Director of Research (2006-2009), and an analyst and portfolio manager (2000-2006). |
Elizabeth Paige Baumann (1968) |
Year of Election or Appointment: 2012 Anti-Money Laundering (AML) Officer |
| Ms. Baumann also serves as AML Officer of other funds. She is Chief AML Officer of FMR LLC (2012-present) and is an employee of Fidelity Investments. Previously, Ms. Baumann served as Vice President and Deputy Anti-Money Laundering Officer (2007-2012). |
Marc Bryant (1966) |
Year of Election or Appointment: 2013 Secretary and Chief Legal Officer (CLO) |
| Mr. Bryant also serves as an officer of other funds. He is Senior Vice President and Deputy General Counsel of FMR LLC. Prior to joining Fidelity Investments, Mr. Bryant served as a Senior Vice President and the Head of Global Retail Legal for AllianceBernstein L.P. (2006-2010), and as the General Counsel for ProFund Advisors LLC (2001-2006). |
William C. Coffey (1969) |
Year of Election or Appointment: 2009 Assistant Secretary |
| Mr. Coffey also serves as Assistant Secretary of other funds. He is Senior Vice President and Deputy General Counsel of FMR LLC (2010-present), and is an employee of Fidelity Investments. Previously, Mr. Coffey served as Vice President and Associate General Counsel of FMR LLC (2005-2009). |
Jonathan Davis (1968) |
Year of Election or Appointment: 2010 Assistant Treasurer |
| Mr. Davis also serves as Assistant Treasurer of other funds. Mr. Davis is an employee of Fidelity Investments. Previously, Mr. Davis served as Vice President and Associate General Counsel of FMR LLC (2003-2010). |
Adrien E. Deberghes (1967) |
Year of Election or Appointment: 2013 President and Treasurer |
| Mr. Deberghes also serves as an officer of other funds. He is an employee of Fidelity Investments (2008-present). Prior to joining Fidelity Investments, Mr. Deberghes was Senior Vice President of Mutual Fund Administration at State Street Corporation (2007-2008), Senior Director of Mutual Fund Administration at Investors Bank & Trust (2005-2007), and Director of Finance for Dunkin' Brands (2000-2005). |
Stephanie J. Dorsey (1969) |
Year of Election or Appointment: 2010 Assistant Treasurer |
| Ms. Dorsey also serves as an officer of other funds. She is an employee of Fidelity Investments (2008-present) and has served in other fund officer roles. Prior to joining Fidelity Investments, Ms. Dorsey served as Treasurer (2004-2008) of the JPMorgan Mutual Funds and Vice President (2004-2008) of JPMorgan Chase Bank. |
Joseph A. Hanlon (1968) |
Year of Election or Appointment: 2012 Chief Compliance Officer |
| Mr. Hanlon also serves as Chief Compliance Officer of other funds. Mr. Hanlon serves as Compliance Officer of FMR, FMR Co., Inc., Fidelity Investments Money Management, Inc. (FIMM), Fidelity Research and Analysis Company (FRAC), and Fidelity Management & Research (Hong Kong) (2009-present), as Senior Vice President of the Fidelity Asset Management Division (2009-present), and is an employee of Fidelity Investments. Previously, Mr. Hanlon served as Compliance Officer of Fidelity Management & Research (Japan) Inc. (2009-2013), Strategic Advisers, Inc. (2009-2013), and Fidelity Management & Research (U.K.) Inc. (2009-2013). |
Brian B. Hogan (1964) |
Year of Election or Appointment: 2009 Vice President |
| Mr. Hogan also serves as Vice President of other funds. Mr. Hogan serves as President of FMR's Equity Division (2009-present). Previously, Mr. Hogan served as Senior Vice President, Equity Research of FMR (2006-2009) and as a portfolio manager. |
Chris Maher (1972) |
Year of Election or Appointment: 2013 Assistant Treasurer |
| Mr. Maher serves as Assistant Treasurer of other funds. Mr. Maher is Vice President of Valuation Oversight and is an employee of Fidelity Investments. Previously, Mr. Maher served as Vice President of Asset Management Compliance (2013), Vice President of FMR's Program Management Group (2010-2013), and Vice President of Valuation Oversight (2008-2010). |
Christine Reynolds (1958) |
Year of Election or Appointment: 2008 Chief Financial Officer |
| Ms. Reynolds also serves as Chief Financial Officer of other funds. Ms. Reynolds became President of Fidelity Pricing and Cash Management Services (FPCMS) in August 2008. Ms. Reynolds served as Chief Operating Officer of FPCMS (2007-2008). Previously, Ms. Reynolds served as President, Treasurer, and Anti-Money Laundering officer of the Fidelity funds (2004-2007). |
Kenneth B. Robins (1969) |
Year of Election or Appointment: 2013 Deputy Treasurer |
| Mr. Robins also serves as an officer of other funds. Mr. Robins serves as Executive Vice President of Fidelity Investments Money Management, Inc. (FIMM) (2013-present) and is an employee of Fidelity Investments (2004-present). Previously, Mr. Robins served in other fund officer roles. |
Anthony R. Rochte (1968) |
Year of Election or Appointment: 2013 Vice President |
| Mr. Rochte also serves as Vice President of other funds. Mr. Rochte serves as President of Fidelity SelectCo, LLC (2012-present) and is an employee of Fidelity Investments (2012-present). Prior to joining Fidelity Investments, Mr. Rochte served as Senior Managing Director and head of State Street Global Advisors' North American Intermediary Business Group (2006-2012). |
Stacie M. Smith (1974) |
Year of Election or Appointment: 2013 Assistant Treasurer |
| Ms. Smith also serves as an officer of other funds. She is an employee of Fidelity Investments (2009-present) and has served in other fund officer roles. Prior to joining Fidelity Investments, Ms. Smith served as Senior Audit Manager of Ernst & Young LLP (1996-2009). |
Renee Stagnone (1975) |
Year of Election or Appointment: 2013 Deputy Treasurer |
| Ms. Stagnone also serves as Deputy Treasurer of other funds. Ms. Stagnone is an employee of Fidelity Investments. |
Joseph F. Zambello (1957) |
Year of Election or Appointment: 2011 Deputy Treasurer |
| Mr. Zambello also serves as Deputy Treasurer of other funds. Mr. Zambello is an employee of Fidelity Investments. Previously, Mr. Zambello served as Vice President of FMR's Program Management Group (2009-2011) and Vice President of the Transfer Agent Oversight Group (2005-2009). |
Annual Report
The Board of Trustees of VIP Consumer Discretionary Portfolio voted to pay to shareholders of record at the opening of business on record date, the following distributions per share derived from capital gains realized from sales of portfolio securities:
| Pay Date | Record Date | Capital Gains |
Initial Class | 02/14/13 | 02/14/13 | $0.790 |
Investor Class | 02/14/13 | 02/14/13 | $0.790 |
The fund hereby designates as a capital gain dividend with respect to the taxable year ended December 31, 2013, $3,358,885, or, if subsequently determined to be different, the net capital gain of such year.
Initial Class designates 16% and Investor Class designates 17% of the dividends distributed in December 2013 during the fiscal year as qualifying for the dividends-received deduction for corporate shareholders.
Annual Report
A special meeting of Consumer Discretionary Portfolio's shareholders was held on May 14, 2013. The results of votes taken among shareholders on the proposals before them are reported below. Each vote reported represents one dollar of net asset value held on the record date for the meeting.
PROPOSAL 1 |
To elect a Board of Trustees.A |
| # of
Votes | % of
Votes |
Ned C. Lautenbach |
Affirmative | 1,555,133,782.46 | 93.955 |
Withheld | 100,063,694.32 | 6.045 |
TOTAL | 1,655,197,476.78 | 100.000 |
Ronald P. O'Hanley |
Affirmative | 1,557,988,095.28 | 94.128 |
Withheld | 97,209,381.50 | 5.872 |
TOTAL | 1,655,197,476.78 | 100.000 |
David A. Rosow |
Affirmative | 1,552,645,347.31 | 93.805 |
Withheld | 102,552,129.47 | 6.195 |
TOTAL | 1,655,197,476.78 | 100.000 |
Garnett A. Smith |
Affirmative | 1,554,582,880.53 | 93.922 |
Withheld | 100,614,596.25 | 6.078 |
TOTAL | 1,655,197,476.78 | 100.000 |
William S. Stavropoulos |
Affirmative | 1,548,352,452.21 | 93.545 |
Withheld | 106,845,024.57 | 6.455 |
TOTAL | 1,655,197,476.78 | 100.000 |
Michael E. Wiley |
Affirmative | 1,556,790,374.70 | 94.055 |
Withheld | 98,407,102.08 | 5.945 |
TOTAL | 1,655,197,476.78 | 100.000 |
PROPOSAL 2 |
To approve a management contract between the fund and Fidelity SelectCo, LLC. |
| # of
Votes | % of
Votes |
Affirmative | 58,627,399.87 | 95.762 |
Against | 1,081,301.06 | 1.766 |
Abstain | 1,513,695.24 | 2.472 |
TOTAL | 61,222,396.17 | 100.000 |
A Denotes trust-wide proposal and voting results. |
Annual Report
Investment Adviser
Fidelity SelectCo, LLC
Denver, CO
Investment Sub-Advisers
FMR Co., Inc.
Fidelity Management & Research (U.K.) Inc.
Fidelity Management & Research (Hong Kong) Limited
Fidelity Management & Research (Japan) Inc.
General Distributor
Fidelity Distributors Corporation
Smithfield, RI
Transfer and Service Agents
Fidelity Investments Institutional Operations Company, Inc.
Boston, MA
Fidelity Service Company, Inc.
Boston, MA
Custodian
JPMorgan Chase Bank
New York, NY
VCONIC-ANN-0214
1.817355.108
Fidelity® Variable Insurance Products:
Consumer Staples Portfolio
Annual Report
December 31, 2013
(Fidelity Cover Art)
Contents
Performance | (Click Here) | How the fund has done over time. |
Management's Discussion of Fund Performance | (Click Here) | The Portfolio Manager's review of fund performance and strategy. |
Shareholder Expense Example | (Click Here) | An example of shareholder expenses. |
Investment Changes | (Click Here) | A summary of major shifts in the fund's investments over the past six months. |
Investments | (Click Here) | A complete list of the fund's investments with their market values. |
Financial Statements | (Click Here) | Statements of assets and liabilities, operations, and changes in net assets, as well as financial highlights. |
Notes | (Click Here) | Notes to the financial statements. |
Report of Independent Registered Public Accounting Firm | (Click Here) | |
Trustees and Officers | (Click Here) | |
Distributions | (Click Here) | |
Proxy Voting Results | (Click Here) | |
To view a fund's proxy voting guidelines and proxy voting record for the 12-month period ended June 30, visit http://www.fidelity.com/proxyvotingresults or visit the Securities and Exchange Commission's (SEC) web site at http://www.sec.gov. You may also call 1-877-208-0098 to request a free copy of the proxy voting guidelines.
Fidelity Variable Insurance Products are separate account options which are purchased through a variable insurance contract.
Standard & Poor's, S&P and S&P 500 are registered service marks of The McGraw-Hill Companies, Inc. and have been licensed for use by Fidelity Distributors Corporation.
Other third-party marks appearing herein are the property of their respective owners.
All other marks appearing herein are registered or unregistered trademarks or service marks of FMR LLC or an affiliated company. © 2014 FMR LLC. All rights reserved.
This report and the financial statements contained herein are submitted for the general information of the shareholders of the fund. This report is not authorized for distribution to prospective investors in the fund unless preceded or accompanied by an effective prospectus.
A fund files its complete schedule of portfolio holdings with the SEC for the first and third quarters of each fiscal year on Form N-Q. Forms N-Q are available on the SEC's web site at http://www.sec.gov. A fund's Forms N-Q may be reviewed and copied at the SEC's Public Reference Room in Washington, DC. Information regarding the operation of the SEC's Public Reference Room may be obtained by calling 1-800-SEC-0330. For a complete list of a fund's portfolio holdings, view the most recent holdings listing, semiannual report, or annual report on Fidelity's web site at http://www.fidelity.com, http://www.advisor.fidelity.com, or http://www.401k.com, as applicable.
NOT FDIC INSURED • MAY LOSE VALUE • NO BANK GUARANTEE
Neither the fund nor Fidelity Distributors Corporation is a bank.
Annual Report
Average annual total return reflects the change in the value of an investment, assuming reinvestment of the class' distributions from dividend income and capital gains (the profits earned upon the sale of securities that have grown in value, if any) and assuming a constant rate of performance each year. During periods of reimbursement by Fidelity, a fund's total return will be greater than it would be had the reimbursement not occurred. Performance numbers are net of all underlying fund operating expenses, but do not include any insurance charges imposed by your insurance company's separate account. If performance information included the effect of these additional charges, the total returns would have been lower. How a fund did yesterday is no guarantee of how it will do tomorrow.
Average Annual Total Returns
Periods ended December 31, 2013 | Past 1
year | Past 5
years | Life of
fundA |
VIP Consumer Staples Portfolio - Initial Class | 21.80% | 16.16% | 9.73% |
VIP Consumer Staples Portfolio - Investor Class | 21.79% | 16.08% | 9.65% |
A From April 24, 2007.
$10,000 Over Life of Fund
Let's say hypothetically that $10,000 was invested in VIP Consumer Staples Portfolio - Initial Class on April 24, 2007, when the fund started. The chart shows how the value of your investment would have changed, and also shows how the S&P 500® Index performed over the same period.
Annual Report
Market Recap: Global equity markets remained upbeat for the 12 months ending December 31, 2013, propelling the MSCI® ACWI® (All Country World Index) Index to a 23.24% return. Midyear turbulence gave way by autumn when policymakers in the U.S. and China had made clear their intentions to maintain accommodative monetary policies. That stance, combined with modest cyclical improvement around the globe and generally low valuations, underpinned the broad rally in equities, although the relative strength of the U.S. dollar generally tempered gains for U.S. investors holding foreign securities based in local currencies. During the period, the broad-market S&P 500® Index set a series of new highs, finishing the year up 32.39%. For the first time since 1995, the S&P® scored a "perfect 10," with all 10 economic sectors gaining at least 10% for the year. A resurgence in growth-oriented stocks lifted the Nasdaq Composite Index® to a 40.12% result for 2013, while the blue-chip Dow Jones Industrial AverageSM notched a relatively more modest 29.65% gain. International developed-markets equities rose in concert with their U.S. counterparts, with the MSCI® EAFE® Index gaining 22.92% for the period. Meanwhile, foreign exchange and commodity weakness curbed results in resource-heavy emerging markets (EM), especially in the year's waning months. More generally, concern over EM's slowing growth, its declining share of global trade and uncertainty surrounding U.S. central bank intentions were all factors hampering performance. The MSCI Emerging Markets Index returned -2.27% for the period. On the bond side, U.S. high-yield securities rallied with equities for much of the period, with The BofA Merrill LynchSM US High Yield Constrained Index returning 7.41% for 2013. The more rate-sensitive U.S. investment-grade bond category faced headwinds though, as reflected in the -2.02% return of the Barclays® U.S. Aggregate Bond Index. Within the Barclays index, investment-grade corporate credit returned -2.01%, while ultra-safe U.S. Treasuries saw a -2.75% result. Major non-U.S. developed markets performed only slightly better, with the Citigroup® Non-USD Group-of-Seven (G7) Equal Weighted Index logging a -1.59% result. After several years of strong advances, EM debt reversed course in 2013, with the J.P. Morgan Emerging Markets Bond Index Global returning -6.58%.
Comments from Robert Lee, Portfolio Manager of VIP Consumer Staples Portfolio: For the year, fund's share classes substantially lagged the 28.18% gain of the MSCI® U.S. IMI Consumer Staples 25-50 Index, as well as the broadly based S&P 500®. (For specific portfolio results, please refer to the performance section of this report.) Consumer staples stocks delivered a strong absolute return in 2013 but trailed many other sectors, which is not unusual in a year when the broader market is up as strong as it was. Additionally, investors had a strong preference for U.S.-based companies, which didn't help staples stocks overall, given their global nature, or the fund, since I tend to focus on owning large multinational companies regardless of where they're based. Versus the sector benchmark, the fund's biggest detractor was a sizable position in British American Tobacco (BAT). The company continued to put up impressive earnings, despite its shares struggling amid currency headwinds, global regulatory concerns for the tobacco industry and a lot of media attention on the potential long-term competitive impact of electronic cigarettes. But my long-term view of BAT's earnings growth remained unchanged. French firms Pernod Ricard and Remy Cointreau also detracted, largely due to a sudden slowdown in their sales in China following new restrictions on gifting high-end spirits to government officials. On the plus side, the fund's underweighting in Philip Morris contributed to relative performance. A big overweighting in retail pharmacy operator CVS Caremark also added nice value. CVS is a great example of a U.S.-based company that I think is poised for long-term growth, especially given its pharmacy benefit management (PBM) division's position to address an aging U.S. population. Consistent with my process, though, I did modestly trim my stake late in the period as the stock's outperformance caused its valuation to become relatively less attractive.
The views expressed above reflect those of the portfolio manager(s) only through the end of the period as stated on the cover of this report and do not necessarily represent the views of Fidelity or any other person in the Fidelity organization. Any such views are subject to change at any time based upon market or other conditions and Fidelity disclaims any responsibility to update such views. These views may not be relied on as investment advice and, because investment decisions for a Fidelity fund are based on numerous factors, may not be relied on as an indication of trading intent on behalf of any Fidelity fund.
Annual Report
As a shareholder of the Fund, you incur two types of costs: (1) transaction costs, including redemption fees and (2) ongoing costs, including management fees and other Fund expenses. This Example is intended to help you understand your ongoing costs (in dollars) of investing in the Fund and to compare these costs with the ongoing costs of investing in other mutual funds.
The Example is based on an investment of $1,000 invested at the beginning of the period and held for the entire period (July 1, 2013 to December 31, 2013).
Actual Expenses
The first line of the accompanying table for each class of the Fund provides information about actual account values and actual expenses. You may use the information in this line, together with the amount you invested, to estimate the expenses that you paid over the period. Simply divide your account value by $1,000.00 (for example, an $8,600 account value divided by $1,000.00 = 8.6), then multiply the result by the number in the first line for a class of the Fund under the heading entitled "Expenses Paid During Period" to estimate the expenses you paid on your account during this period. The estimate of expenses does not include any fees or other expenses of any variable annuity or variable life insurance product. If they were, the estimate of expenses you paid during the period would be higher, and your ending account value would be lower. In addition, the Fund, as a shareholder in the underlying Fidelity Central Funds, will indirectly bear its pro-rata share of the fees and expenses incurred by the underlying Fidelity Central Funds. These fees and expenses are not included in the Fund's annualized expense ratio used to calculate the expense estimate in the table below.
Hypothetical Example for Comparison Purposes
The second line of the accompanying table for each class of the Fund provides information about hypothetical account values and hypothetical expenses based on a Class' actual expense ratio and an assumed rate of return of 5% per year before expenses, which is not the Class' actual return. The hypothetical account values and expenses may not be used to estimate the actual ending account balance or expenses you paid for the period. You may use this information to compare the ongoing costs of investing in the Fund and other funds. To do so, compare this 5% hypothetical example with the 5% hypothetical examples that appear in the shareholder reports of the other funds. The estimate of expenses does not include any fees or other expenses of any variable annuity or variable life insurance product. If they were, the estimate of expenses you paid during the period would be higher, and your ending account value would be lower. In addition, the Fund, as a shareholder in the underlying Fidelity Central Funds, will indirectly bear its pro-rata share of the fees and expenses incurred by the underlying Fidelity Central Funds. These fees and expenses are not included in the Fund's annualized expense ratio used to calculate the expense estimate in the table below.
Please note that the expenses shown in the table are meant to highlight your ongoing costs only and do not reflect any transaction costs. Therefore, the second line of the table is useful in comparing ongoing costs only, and will not help you determine the relative total costs of owning different funds. In addition, if these transactional costs were included, your costs would have been higher.
| Annualized
Expense Ratio B | Beginning
Account Value
July 1, 2013 | Ending
Account Value
December 31, 2013 | Expenses Paid
During Period*
July 1, 2013
to December 31, 2013 |
Initial Class | .72% | | | |
Actual | | $ 1,000.00 | $ 1,095.30 | $ 3.80 |
Hypothetical A | | $ 1,000.00 | $ 1,021.58 | $ 3.67 |
Investor Class | .80% | | | |
Actual | | $ 1,000.00 | $ 1,095.60 | $ 4.23 |
Hypothetical A | | $ 1,000.00 | $ 1,021.17 | $ 4.08 |
A 5% return per year before expenses
B Annualized expense ratio reflects expenses net of applicable fee waivers.
* Expenses are equal to each Class' annualized expense ratio, multiplied by the average account value over the period, multiplied by 184/365 (to reflect the one-half year period).
Annual Report
Investment Changes (Unaudited)
Top Ten Stocks as of December 31, 2013 |
| % of fund's
net assets | % of fund's net assets
6 months ago |
British American Tobacco PLC sponsored ADR | 14.7 | 14.6 |
The Coca-Cola Co. | 12.5 | 11.8 |
Procter & Gamble Co. | 11.1 | 10.6 |
CVS Caremark Corp. | 8.2 | 8.7 |
Altria Group, Inc. | 4.8 | 5.0 |
Kroger Co. | 4.8 | 4.3 |
Wal-Mart Stores, Inc. | 4.2 | 3.1 |
Bunge Ltd. | 2.8 | 2.2 |
PepsiCo, Inc. | 2.4 | 1.9 |
Diageo PLC sponsored ADR | 2.3 | 2.6 |
| 67.8 | |
Top Industries (% of fund's net assets) |
As of December 31, 2013 |
 | Beverages | 27.0% | |
 | Tobacco | 24.3% | |
 | Food & Staples Retailing | 18.9% | |
 | Household Products | 13.4% | |
 | Food Products | 13.2% | |
 | All Others* | 3.2% | |

As of June 30, 2013 |
| Beverages | 26.2% | |
| Tobacco | 25.2% | |
| Food & Staples Retailing | 19.1% | |
| Household Products | 12.7% | |
| Food Products | 10.7% | |
| All Others* | 6.1% | |

* Includes short-term investments and net other assets (liabilities). |
Annual Report
Investments December 31, 2013
Showing Percentage of Net Assets
Common Stocks - 98.5% |
| Shares | | Value |
BEVERAGES - 26.7% |
Brewers - 3.6% |
Anadolu Efes Biracilik Ve Malt Sanayii A/S | 17,000 | | $ 183,923 |
Anheuser-Busch InBev SA NV | 22,936 | | 2,438,929 |
SABMiller PLC | 64,900 | | 3,332,681 |
| | 5,955,533 |
Distillers & Vintners - 6.6% |
Diageo PLC sponsored ADR | 28,580 | | 3,784,564 |
Pernod Ricard SA | 30,363 | | 3,459,005 |
Remy Cointreau SA | 40,237 | | 3,376,043 |
Treasury Wine Estates Ltd. | 92,607 | | 398,560 |
| | 11,018,172 |
Soft Drinks - 16.5% |
Coca-Cola Bottling Co. Consolidated | 5,594 | | 409,425 |
Coca-Cola Central Japan Co. Ltd. | 3,600 | | 74,786 |
Coca-Cola FEMSA S.A.B. de CV sponsored ADR | 3,170 | | 386,011 |
Coca-Cola Icecek A/S | 25,853 | | 622,565 |
Embotelladora Andina SA: | | | |
ADR | 16,898 | | 349,451 |
sponsored ADR | 13,583 | | 383,584 |
Fomento Economico Mexicano S.A.B. de CV sponsored ADR | 4,285 | | 419,373 |
PepsiCo, Inc. | 47,506 | | 3,940,148 |
The Coca-Cola Co. | 503,038 | | 20,780,500 |
| | 27,365,843 |
TOTAL BEVERAGES | | 44,339,548 |
FOOD & STAPLES RETAILING - 18.9% |
Drug Retail - 9.4% |
Clicks Group Ltd. | 23,359 | | 139,820 |
CVS Caremark Corp. | 189,839 | | 13,586,777 |
Drogasil SA | 58,984 | | 372,843 |
Walgreen Co. | 27,723 | | 1,592,409 |
| | 15,691,849 |
Food Retail - 5.3% |
Alimentation Couche-Tard, Inc. Class B (sub. vtg.) | 5,400 | | 406,074 |
Fresh Market, Inc. (a) | 7,628 | | 308,934 |
Kroger Co. | 200,976 | | 7,944,581 |
Whole Foods Market, Inc. | 2,700 | | 156,141 |
| | 8,815,730 |
Hypermarkets & Super Centers - 4.2% |
Wal-Mart Stores, Inc. | 87,904 | | 6,917,166 |
TOTAL FOOD & STAPLES RETAILING | | 31,424,745 |
|
| Shares | | Value |
FOOD PRODUCTS - 13.2% |
Agricultural Products - 5.0% |
Archer Daniels Midland Co. | 76,564 | | $ 3,322,878 |
Bunge Ltd. | 55,912 | | 4,590,934 |
SLC Agricola SA | 48,200 | | 420,527 |
| | 8,334,339 |
Packaged Foods & Meats - 8.2% |
Annie's, Inc. (a)(d) | 10,454 | | 449,940 |
Danone SA | 10,300 | | 741,359 |
Green Mountain Coffee Roasters, Inc. | 19,994 | | 1,511,147 |
Hain Celestial Group, Inc. (a) | 4,690 | | 425,758 |
Kellogg Co. | 23,463 | | 1,432,885 |
Lindt & Spruengli AG | 10 | | 539,207 |
Mead Johnson Nutrition Co. Class A | 41,300 | | 3,459,288 |
Nestle SA | 27,391 | | 2,007,488 |
Orion Corp. | 473 | | 425,183 |
Ulker Biskuvi Sanayi A/S | 52,000 | | 367,799 |
Unilever NV (NY Reg.) | 52,265 | | 2,102,621 |
Want Want China Holdings Ltd. | 98,000 | | 141,547 |
| | 13,604,222 |
TOTAL FOOD PRODUCTS | | 21,938,561 |
HOTELS, RESTAURANTS & LEISURE - 0.2% |
Restaurants - 0.2% |
ARAMARK Holdings Corp. (a) | 14,064 | | 368,758 |
HOUSEHOLD DURABLES - 0.3% |
Housewares & Specialties - 0.3% |
Tupperware Brands Corp. | 4,402 | | 416,121 |
HOUSEHOLD PRODUCTS - 13.4% |
Household Products - 13.4% |
Colgate-Palmolive Co. | 53,690 | | 3,501,125 |
Procter & Gamble Co. | 226,136 | | 18,409,732 |
Svenska Cellulosa AB (SCA) (B Shares) | 14,000 | | 430,980 |
| | 22,341,837 |
PERSONAL PRODUCTS - 1.2% |
Personal Products - 1.2% |
Hengan International Group Co. Ltd. | 32,500 | | 383,916 |
Herbalife Ltd. | 7,500 | | 590,250 |
L'Oreal SA | 3,300 | | 579,734 |
Nu Skin Enterprises, Inc. Class A | 2,788 | | 385,357 |
| | 1,939,257 |
PHARMACEUTICALS - 0.3% |
Pharmaceuticals - 0.3% |
Perrigo Co. PLC | 2,728 | | 418,639 |
TOBACCO - 24.3% |
Tobacco - 24.3% |
Altria Group, Inc. | 209,696 | | 8,050,229 |
British American Tobacco PLC sponsored ADR | 226,859 | | 24,369,194 |
Common Stocks - continued |
| Shares | | Value |
TOBACCO - CONTINUED |
Tobacco - continued |
Imperial Tobacco Group PLC | 21,015 | | $ 813,619 |
ITC Ltd. | 108,173 | | 562,993 |
Japan Tobacco, Inc. | 20,200 | | 657,283 |
Lorillard, Inc. | 35,095 | | 1,778,615 |
Philip Morris International, Inc. | 38,734 | | 3,374,893 |
Souza Cruz SA | 81,400 | | 839,342 |
| | 40,446,168 |
TOTAL COMMON STOCKS (Cost $133,853,041) |
163,633,634
|
Nonconvertible Preferred Stocks - 0.3% |
| | | |
BEVERAGES - 0.3% |
Brewers - 0.3% |
Ambev SA sponsored ADR
(Cost $493,524) | 71,915 | |
528,575
|
Money Market Funds - 0.9% |
| Shares | | Value |
Fidelity Cash Central Fund, 0.11% (b) | 1,150,264 | | $ 1,150,264 |
Fidelity Securities Lending Cash Central Fund, 0.11% (b)(c) | 385,000 | | 385,000 |
TOTAL MONEY MARKET FUNDS (Cost $1,535,264) |
1,535,264
|
TOTAL INVESTMENT PORTFOLIO - 99.7% (Cost $135,881,829) | | 165,697,473 |
NET OTHER ASSETS (LIABILITIES) - 0.3% | | 524,030 |
NET ASSETS - 100% | $ 166,221,503 |
Legend |
(a) Non-income producing |
(b) Affiliated fund that is generally available only to investment companies and other accounts managed by Fidelity Investments. The rate quoted is the annualized seven-day yield of the fund at period end. A complete unaudited listing of the fund's holdings as of its most recent quarter end is available upon request. In addition, each Fidelity Central Fund's financial statements, which are not covered by the Fund's Report of Independent Registered Public Accounting Firm, are available on the SEC's website or upon request. |
(c) Investment made with cash collateral received from securities on loan. |
(d) Security or a portion of the security is on loan at period end. |
Affiliated Central Funds |
Information regarding fiscal year to date income earned by the Fund from investments in Fidelity Central Funds is as follows: |
Fund | Income earned |
Fidelity Cash Central Fund | $ 7,159 |
Fidelity Securities Lending Cash Central Fund | 23,122 |
Total | $ 30,281 |
Other Information |
The following is a summary of the inputs used, as of December 31, 2013, involving the Fund's assets and liabilities carried at fair value. The inputs or methodology used for valuing securities may not be an indication of the risk associated with investing in those securities. For more information on valuation inputs, and their aggregation into the levels used in the tables below, please refer to the Investment Valuation section in the accompanying Notes to Financial Statements. |
Valuation Inputs at Reporting Date: |
Description | Total | Level 1 | Level 2 | Level 3 |
Investments in Securities: | | | | |
Common Stocks | $ 163,633,634 | $ 156,822,436 | $ 6,811,198 | $ - |
Nonconvertible Preferred Stocks | 528,575 | 528,575 | - | - |
Money Market Funds | 1,535,264 | 1,535,264 | - | - |
Total Investments in Securities: | $ 165,697,473 | $ 158,886,275 | $ 6,811,198 | $ - |
The following is a summary of transfers between Level 1 and Level 2 for the period ended December 31, 2013. Transfers are assumed to have occurred at the beginning of the period, and are primarily attributable to the valuation techniques used for foreign equity securities, as discussed in the accompanying Notes to Financial Statements: |
Transfers | Total |
Level 1 to Level 2 | $ 0 |
Level 2 to Level 1 | $ 7,692,590 |
Distribution of investments by country or territory of incorporation, as a percentage of total net assets, is as follows (Unaudited): |
United States of America | 63.1% |
United Kingdom | 19.5% |
France | 4.9% |
Bermuda | 2.8% |
Switzerland | 1.5% |
Belgium | 1.5% |
Netherlands | 1.3% |
Brazil | 1.2% |
Others (Individually Less Than 1%) | 4.2% |
| 100.0% |
See accompanying notes which are an integral part of the financial statements.
Annual Report
Statement of Assets and Liabilities
| December 31, 2013 |
| | |
Assets | | |
Investment in securities, at value (including securities loaned of $378,752) - See accompanying schedule: Unaffiliated issuers (cost $134,346,565) | $ 164,162,209 | |
Fidelity Central Funds (cost $1,535,264) | 1,535,264 | |
Total Investments (cost $135,881,829) | | $ 165,697,473 |
Foreign currency held at value (cost $3) | | 3 |
Receivable for investments sold | | 828,859 |
Receivable for fund shares sold | | 187,442 |
Dividends receivable | | 243,631 |
Distributions receivable from Fidelity Central Funds | | 162 |
Prepaid expenses | | 1,310 |
Other receivables | | 439 |
Total assets | | 166,959,319 |
| | |
Liabilities | | |
Payable for investments purchased | $ 71,944 | |
Payable for fund shares redeemed | 139,817 | |
Accrued management fee | 75,828 | |
Other affiliated payables | 24,169 | |
Other payables and accrued expenses | 41,058 | |
Collateral on securities loaned, at value | 385,000 | |
Total liabilities | | 737,816 |
| | |
Net Assets | | $ 166,221,503 |
Net Assets consist of: | | |
Paid in capital | | $ 132,377,633 |
Undistributed net investment income | | 4,780 |
Accumulated undistributed net realized gain (loss) on investments and foreign currency transactions | | 4,026,385 |
Net unrealized appreciation (depreciation) on investments and assets and liabilities in foreign currencies | | 29,812,705 |
Net Assets | | $ 166,221,503 |
Statement of Assets and Liabilities - continued
| December 31, 2013 |
| | |
Initial Class:
Net Asset Value, offering price and redemption price per share ($25,736,119 ÷ 1,565,415 shares) | | $ 16.44 |
| | |
Investor Class:
Net Asset Value, offering price and redemption price per share ($140,485,384 ÷ 8,567,679 shares) | | $ 16.40 |
See accompanying notes which are an integral part of the financial statements.
Annual Report
Financial Statements - continued
Statement of Operations
| Year ended December 31, 2013 |
| | |
Investment Income | | |
Dividends | | $ 4,178,299 |
Income from Fidelity Central Funds | | 30,281 |
Total income | | 4,208,580 |
| | |
Expenses | | |
Management fee | $ 875,307 | |
Transfer agent fees | 219,269 | |
Accounting and security lending fees | 61,902 | |
Custodian fees and expenses | 28,710 | |
Independent trustees' compensation | 2,547 | |
Audit | 51,086 | |
Legal | 2,709 | |
Miscellaneous | 7,189 | |
Total expenses before reductions | 1,248,719 | |
Expense reductions | (9,696) | 1,239,023 |
Net investment income (loss) | | 2,969,557 |
Realized and Unrealized Gain (Loss) Net realized gain (loss) on: | | |
Investment securities: | | |
Unaffiliated issuers (net of foreign taxes of $765) | 7,021,936 | |
Foreign currency transactions | (2,684) | |
Total net realized gain (loss) | | 7,019,252 |
Change in net unrealized appreciation (depreciation) on: Investment securities (net of increase in deferred foreign taxes of $2,935) | 17,627,358 | |
Assets and liabilities in foreign currencies | 601 | |
Total change in net unrealized appreciation (depreciation) | | 17,627,959 |
Net gain (loss) | | 24,647,211 |
Net increase (decrease) in net assets resulting from operations | | $ 27,616,768 |
Statement of Changes in Net Assets
| Year ended
December 31,
2013 | Year ended
December 31,
2012 |
Increase (Decrease) in Net Assets | | |
Operations | | |
Net investment income (loss) | $ 2,969,557 | $ 1,672,722 |
Net realized gain (loss) | 7,019,252 | 1,359,166 |
Change in net unrealized appreciation (depreciation) | 17,627,959 | 8,294,503 |
Net increase (decrease) in net assets resulting from operations | 27,616,768 | 11,326,391 |
Distributions to shareholders from net investment income | (2,961,327) | (1,672,350) |
Distributions to shareholders from net realized gain | (3,113,789) | (728,139) |
Total distributions | (6,075,116) | (2,400,489) |
Share transactions - net increase (decrease) | 30,884,010 | 45,487,826 |
Redemption fees | 24,915 | 85,003 |
Total increase (decrease) in net assets | 52,450,577 | 54,498,731 |
| | |
Net Assets | | |
Beginning of period | 113,770,926 | 59,272,195 |
End of period (including undistributed net investment income of $4,780 and undistributed net investment income of $0, respectively) | $ 166,221,503 | $ 113,770,926 |
See accompanying notes which are an integral part of the financial statements.
Annual Report
Financial Highlights - Initial Class
Years ended December 31, | 2013 | 2012 | 2011 | 2010 | 2009 |
Selected Per-Share Data | | | | | |
Net asset value, beginning of period | $ 14.03 | $ 12.42 | $ 11.61 | $ 10.22 | $ 8.60 |
Income from Investment Operations | | | | | |
Net investment income (loss) C | .31 | .27 | .21 | .17 | .15 |
Net realized and unrealized gain (loss) | 2.73 | 1.64 | .73 | 1.39 | 1.63 |
Total from investment operations | 3.04 | 1.91 | .94 | 1.56 | 1.78 |
Distributions from net investment income | (.31) | (.22) | (.14) | (.17) | (.16) |
Distributions from net realized gain | (.32) | (.09) | - | - | - |
Total distributions | (.63) | (.31) | (.14) | (.17) | (.16) |
Redemption fees added to paid in capital C | - G | .01 | .01 | - G | - G |
Net asset value, end of period | $ 16.44 | $ 14.03 | $ 12.42 | $ 11.61 | $ 10.22 |
Total Return A, B | 21.80% | 15.40% | 8.18% | 15.23% | 20.73% |
Ratios to Average Net Assets D, F | | | | | |
Expenses before reductions | .73% | .75% | .87% | 1.03% | 1.12% |
Expenses net of fee waivers, if any | .72% | .75% | .87% | 1.00% | 1.00% |
Expenses net of all reductions | .72% | .74% | .87% | .99% | 1.00% |
Net investment income (loss) | 1.94% | 1.95% | 1.76% | 1.61% | 1.68% |
Supplemental Data | | | | | |
Net assets, end of period (000 omitted) | $ 25,736 | $ 24,123 | $ 13,965 | $ 8,106 | $ 8,532 |
Portfolio turnover rate E | 36% | 20% | 18% | 60% | 71% |
A Total returns do not reflect charges attributable to your insurance company's separate account. Inclusion of these charges would reduce the total returns shown.
B Total returns would have been lower if certain expenses had not been reduced during the applicable periods shown.
C Calculated based on average shares outstanding during the period.
D Fees and expenses of any underlying Fidelity Central Funds are not included in the Fund's expense ratio. The Fund indirectly bears its proportionate share of the expenses of any underlying Fidelity Central Funds.
E Amount does not include the portfolio activity of any underlying Fidelity Central Funds.
F Expense ratios reflect operating expenses of the class. Expenses before reductions do not reflect amounts reimbursed by the investment adviser or reductions from brokerage service arrangements or reductions from other expense offset arrangements and do not represent the amount paid by the class during periods when reimbursements or reductions occur. Expenses net of fee waivers reflect expenses after reimbursement by the investment adviser but prior to reductions from brokerage service arrangements or other expense offset arrangements. Expenses net of all reductions represent the net expenses paid by the class.
G Amount represents less than $.01 per share.
Financial Highlights - Investor Class
Years ended December 31, | 2013 | 2012 | 2011 | 2010 | 2009 |
Selected Per-Share Data | | | | | |
Net asset value, beginning of period | $ 13.99 | $ 12.39 | $ 11.59 | $ 10.21 | $ 8.59 |
Income from Investment Operations | | | | | |
Net investment income (loss) C | .30 | .25 | .20 | .16 | .14 |
Net realized and unrealized gain (loss) | 2.73 | 1.64 | .72 | 1.38 | 1.63 |
Total from investment operations | 3.03 | 1.89 | .92 | 1.54 | 1.77 |
Distributions from net investment income | (.30) | (.21) | (.13) | (.16) | (.15) |
Distributions from net realized gain | (.32) | (.09) | - | - | - |
Total distributions | (.62) | (.30) | (.13) | (.16) | (.15) |
Redemption fees added to paid in capital C | - G | .01 | .01 | - G | - G |
Net asset value, end of period | $ 16.40 | $ 13.99 | $ 12.39 | $ 11.59 | $ 10.21 |
Total Return A, B | 21.79% | 15.30% | 8.07% | 15.09% | 20.68% |
Ratios to Average Net Assets D, F | | | | | |
Expenses before reductions | .80% | .82% | .94% | 1.10% | 1.22% |
Expenses net of fee waivers, if any | .80% | .82% | .94% | 1.08% | 1.08% |
Expenses net of all reductions | .80% | .82% | .93% | 1.07% | 1.08% |
Net investment income (loss) | 1.86% | 1.87% | 1.69% | 1.53% | 1.60% |
Supplemental Data | | | | | |
Net assets, end of period (000 omitted) | $ 140,485 | $ 89,648 | $ 45,307 | $ 15,536 | $ 10,446 |
Portfolio turnover rate E | 36% | 20% | 18% | 60% | 71% |
A Total returns do not reflect charges attributable to your insurance company's separate account. Inclusion of these charges would reduce the total returns shown.
B Total returns would have been lower if certain expenses had not been reduced during the applicable periods shown.
C Calculated based on average shares outstanding during the period.
D Fees and expenses of any underlying Fidelity Central Funds are not included in the Fund's expense ratio. The Fund indirectly bears its proportionate share of the expenses of any underlying Fidelity Central Funds.
E Amount does not include the portfolio activity of any underlying Fidelity Central Funds.
F Expense ratios reflect operating expenses of the class. Expenses before reductions do not reflect amounts reimbursed by the investment adviser or reductions from brokerage service arrangements or reductions from other expense offset arrangements and do not represent the amount paid by the class during periods when reimbursements or reductions occur. Expenses net of fee waivers reflect expenses after reimbursement by the investment adviser but prior to reductions from brokerage service arrangements or other expense offset arrangements. Expenses net of all reductions represent the net expenses paid by the class.
G Amount represents less than $.01 per share.
See accompanying notes which are an integral part of the financial statements.
Annual Report
Notes to Financial Statements
For the period ended December 31, 2013
1. Organization.
VIP Consumer Staples Portfolio (the Fund) is a non-diversified fund of Variable Insurance Products Fund IV (the Trust) and is authorized to issue an unlimited number of shares. The Trust is registered under the Investment Company Act of 1940, as amended (the 1940 Act), as an open-end management investment company organized as a Massachusetts business trust. Shares of the Fund may only be purchased by insurance companies for the purpose of funding variable annuity or variable life insurance contracts. The Fund offers the following classes of shares: Initial Class shares and Investor Class shares. All classes have equal rights and voting privileges, except for matters affecting a single class.
2. Investments in Fidelity Central Funds.
The Fund invests in Fidelity Central Funds, which are open-end investment companies generally available only to other investment companies and accounts managed by the investment adviser and its affiliates. The Fund's Schedule of Investments lists each of the Fidelity Central Funds held as of period end, if any, as an investment of the Fund, but does not include the underlying holdings of each Fidelity Central Fund. As an Investing Fund, the Fund indirectly bears its proportionate share of the expenses of the underlying Fidelity Central Funds.
The Money Market Central Funds seek preservation of capital and current income and are managed by Fidelity Investments Money Management, Inc. (FIMM), an affiliate of the investment adviser. Annualized expenses of the Money Market Central Funds as of their most recent shareholder report date are less than .01%.
A complete unaudited list of holdings for each Fidelity Central Fund is available upon request or at the Securities and Exchange Commission (the SEC) website at www.sec.gov. In addition, the financial statements of the Fidelity Central Funds, which are not covered by the Fund's Report of Independent Registered Public Accounting Firm, are available on the SEC website or upon request.
3. Significant Accounting Policies.
The financial statements have been prepared in conformity with accounting principles generally accepted in the United States of America (GAAP), which require management to make certain estimates and assumptions at the date of the financial statements. Actual results could differ from those estimates. Subsequent events, if any, through the date that the financial statements were issued have been evaluated in the preparation of the financial statements. The following summarizes the significant accounting policies of the Fund:
Investment Valuation. Investments are valued as of 4:00 p.m. Eastern time on the last calendar day of the period. In accordance with valuation policies and procedures approved by the Board of Trustees (the Board), the Fund attempts to obtain prices from one or more third party pricing vendors or brokers to value its investments. When current market prices, quotations or currency exchange rates are not readily available or reliable, investments will be fair valued in good faith by the Fidelity SelectCo, LLC (SelectCo) Fair Value Committee (the Committee), in accordance with procedures adopted by the Board. Factors used in determining fair value vary by investment type and may include market or investment specific events. The frequency with which these procedures are used cannot be predicted and they may be utilized to a significant extent. The Committee oversees the Fund's valuation policies and procedures and is responsible for approving and reporting to the Board all fair value determinations.
The Fund categorizes the inputs to valuation techniques used to value its investments into a disclosure hierarchy consisting of three levels as shown below:
Level 1 - quoted prices in active markets for identical investments
Level 2 - other significant observable inputs (including quoted prices for similar investments, interest rates, prepayment speeds, etc.)
Level 3 - unobservable inputs (including the Fund's own assumptions based on the best information available)
Valuation techniques used to value the Fund's investments by major category are as follows:
Equity securities, including restricted securities, for which market quotations are readily available, are valued at the last reported sale price or official closing price as reported by a third party pricing vendor on the primary market or exchange on which they are traded and are categorized as Level 1 in the hierarchy. In the event there were no sales during the day or closing prices are not available, securities are valued at the last quoted bid price or may be valued using the last available price and are generally categorized as Level 2 in the hierarchy. For foreign equity securities, when market or security specific events arise, comparisons to the valuation of American Depositary Receipts (ADRs), futures contracts, Exchange-Traded Funds (ETFs) and certain indexes as well as quoted prices for similar securities may be used and would be categorized as Level 2 in the hierarchy. Utilizing these techniques may result in transfers between Level 1 and Level 2. For equity securities, including restricted securities, where observable inputs are limited, assumptions about market activity and risk are used and these securities may be categorized as Level 3 in the hierarchy.
Investments in open-end mutual funds, including the Fidelity Central Funds, are valued at their closing net asset value (NAV) each business day and are categorized as Level 1 in the hierarchy.
Annual Report
3. Significant Accounting Policies - continued
Investment Valuation - continued
Changes in valuation techniques may result in transfers in or out of an assigned level within the disclosure hierarchy. The aggregate value of investments by input level, as of December 31, 2013, including information on transfers between Levels 1 and 2 is included at the end of the Fund's Schedule of Investments.
Foreign Currency. The Fund may use foreign currency contracts to facilitate transactions in foreign-denominated securities. Gains and losses from these transactions may arise from changes in the value of the foreign currency or if the counterparties do not perform under the contracts' terms.
Foreign-denominated assets, including investment securities, and liabilities are translated into U.S. dollars at the exchange rates at period end. Purchases and sales of investment securities, income and dividends received and expenses denominated in foreign currencies are translated into U.S. dollars at the exchange rate in effect on the transaction date.
The effects of exchange rate fluctuations on investments are included with the net realized and unrealized gain (loss) on investment securities. Other foreign currency transactions resulting in realized and unrealized gain (loss) are disclosed separately.
Investment Transactions and Income. For financial reporting purposes, the Fund's investment holdings and NAV include trades executed through the end of the last business day of the period. The NAV per share for processing shareholder transactions is calculated as of the close of business of the New York Stock Exchange (NYSE), normally 4:00 p.m. Eastern time and includes trades executed through the end of the prior business day. Gains and losses on securities sold are determined on the basis of identified cost. Dividend income is recorded on the ex-dividend date, except for certain dividends from foreign securities where the ex-dividend date may have passed, which are recorded as soon as the Fund is informed of the ex-dividend date. Non-cash dividends included in dividend income, if any, are recorded at the fair market value of the securities received. Interest income and distributions from the Fidelity Central Funds are accrued as earned. Investment income is recorded net of foreign taxes withheld where recovery of such taxes is uncertain.
Class Allocations and Expenses. Investment income, realized and unrealized capital gains and losses, common expenses of the Fund, and certain fund-level expense reductions, if any, are allocated daily on a pro-rata basis to each class based on the relative net assets of each class to the total net assets of the Fund. Each class differs with respect to transfer agent fees incurred. Certain expense reductions may also differ by class. For the reporting period, the allocated portion of income and expenses to each class as a percent of its average net assets may vary due to the timing of recording these transactions in relation to fluctuating net assets of the classes. Expenses directly attributable to a fund are charged to that fund. Expenses attributable to more than one fund are allocated among the respective funds on the basis of relative net assets or other appropriate methods. Expense estimates are accrued in the period to which they relate and adjustments are made when actual amounts are known.
Income Tax Information and Distributions to Shareholders. Each year, the Fund intends to qualify as a regulated investment company under Subchapter M of the Internal Revenue Code, including distributing substantially all of its taxable income and realized gains. As a result, no provision for U.S. Federal income taxes is required. As of December 31, 2013, the Fund did not have any unrecognized tax benefits in the financial statements; nor is the Fund aware of any tax positions for which it is reasonably possible that the total amounts of unrecognized tax benefits will significantly change in the next twelve months. The Fund files a U.S. federal tax return, in addition to state and local tax returns as required. The Fund's federal income tax returns are subject to examination by the Internal Revenue Service (IRS) for a period of three fiscal years after they are filed. State and local tax returns may be subject to examination for an additional fiscal year depending on the jurisdiction. Foreign taxes are provided for based on the Fund's understanding of the tax rules and rates that exist in the foreign markets in which it invests. The Fund is subject to a tax imposed on capital gains by certain countries in which it invests. An estimated deferred tax liability for net unrealized appreciation on the applicable securities is included in Other payables and accrued expenses on the Statement of Assets & Liabilities.
Distributions are declared and recorded on the ex-dividend date. Income dividends and capital gain distributions are declared separately for each class. Income and capital gain distributions are determined in accordance with income tax regulations, which may differ from GAAP.
Capital accounts within the financial statements are adjusted for permanent book-tax differences. These adjustments have no impact on net assets or the results of operations. Capital accounts are not adjusted for temporary book-tax differences which will reverse in a subsequent period.
Book-tax differences are primarily due to foreign currency transactions, certain foreign taxes and losses deferred due to wash sales.
The federal tax cost of investment securities and unrealized appreciation (depreciation) as of period end were as follows:
Gross unrealized appreciation | $ 31,637,129 |
Gross unrealized depreciation | (1,981,287) |
Net unrealized appreciation (depreciation) on securities and other investments | $ 29,655,842 |
| |
Tax Cost | $ 136,041,631 |
Annual Report
Notes to Financial Statements - continued
3. Significant Accounting Policies - continued
Income Tax Information and Distributions to Shareholders - continued
The tax-based components of distributable earnings as of period end were as follows:
Undistributed ordinary income | $ 610,911 |
Undistributed long-term capital gain | $ 3,576,645 |
Net unrealized appreciation (depreciation) | $ 29,656,314 |
The tax character of distributions paid was as follows:
| December 31, 2013 | December 31, 2012 |
Ordinary Income | $ 5,963,655 | $ 2,400,489 |
Long-term Capital Gains | 111,461 | - |
Total | $ 6,075,116 | $ 2,400,489 |
Trading (Redemption) Fees. Shares held by investors less than 60 days may be subject to a redemption fee equal to 1% of the NAV of shares redeemed. All redemption fees, which reduce the proceeds of the shareholder redemption, are retained by the Fund and accounted for as an addition to paid in capital.
4. Purchases and Sales of Investments.
Purchases and sales of securities, other than short-term securities, aggregated $82,896,525 and $53,786,780, respectively.
5. Fees and Other Transactions with Affiliates.
Management Fee. Effective August 1, 2013, SelectCo replaced Fidelity Management and Research Company (FMR), an affiliate of SelectCo, as investment adviser to the Fund. The investment adviser and its affiliates provide the Fund with investment management related services for which the Fund pays a monthly management fee. The management fee is the sum of an individual fund fee rate that is based on an annual rate of .30% of the Fund's average net assets and an annualized group fee rate that averaged .25% during the period. The group fee rate is based upon the average net assets of all the mutual funds advised by FMR and the investment adviser. The group fee rate decreases as assets under management increase and increases as assets under management decrease. For the reporting period, the total annual management fee rate was .55% of the Fund's average net assets.
Transfer Agent Fees. Fidelity Investments Institutional Operations Company, Inc. (FIIOC), an affiliate of the investment adviser, is the Fund's transfer, dividend disbursing, and shareholder servicing agent. FIIOC receives an asset-based fee with respect to each class. Each class (with the exception of Investor Class) pays a transfer agent fee, excluding out of pocket expenses, equal to an annual rate of .07% of average net assets. Investor Class pays a monthly asset-based transfer agent fee of .15% of average net assets. In addition, FIIOC receives an asset-based fee of .0035% of average net assets for typesetting, printing and mailing of shareholder reports, except proxy statements. FIIOC voluntarily agreed to reimburse or waive this fee for the period January 1, 2013 through December 31, 2013 (see Expense Reductions note). For the period, transfer agent fees for each class, including printing and out of pocket expenses, were as follows:
Initial Class | $ 22,105 |
Investor Class | 197,164 |
| $ 219,269 |
Effective February 1, 2014, the Board of Trustees approved an amendment to the transfer agent fee agreement whereby each class (with the exception of Investor Class) pays a single fee of .07% of average net assets for transfer agent services, typesetting, printing and mailing of shareholder reports, excluding mailing of proxy statements and out of pocket expenses. Investor Class pays a single fee of .15% of average net assets.
Accounting and Security Lending Fees. Fidelity Service Company, Inc. (FSC), an affiliate of the investment adviser, maintains the Fund's accounting records. The accounting fee is based on the level of average net assets for each month. Under a separate contract, FSC administers the security lending program. The security lending fee is based on the number and duration of lending transactions.
Brokerage Commissions. The Fund placed a portion of its portfolio transactions with brokerage firms which are affiliates of the investment adviser. Brokerage commissions are included in net realized gain (loss) and change in net unrealized appreciation (depreciation) in the Statement of Operations. The commissions paid to these affiliated firms were $1,070 for the period.
Annual Report
6. Committed Line of Credit.
The Fund participates with other funds managed by the investment adviser or an affiliate in a $4.25 billion credit facility (the "line of credit") to be utilized for temporary or emergency purposes to fund shareholder redemptions or for other short-term liquidity purposes. The Fund has agreed to pay commitment fees on its pro-rata portion of the line of credit, which amounted to $304 and is reflected in Miscellaneous expenses on the Statement of Operations. During the period, there were no borrowings on this line of credit.
7. Security Lending.
The Fund lends portfolio securities through a lending agent from time to time in order to earn additional income. For equity securities, a lending agent is used and may loan securities to certain qualified borrowers, which prior to August 1, 2013 included Fidelity Capital Markets (FCM), a broker-dealer affiliated with the Fund. On the settlement date of the loan, the Fund receives collateral (in the form of U.S. Treasury obligations, letters of credit and/or cash) against the loaned securities and maintains collateral in an amount not less than 100% of the market value of the loaned securities during the period of the loan. The market value of the loaned securities is determined at the close of business of the Fund and any additional required collateral is delivered to the Fund on the next business day. If the borrower defaults on its obligation to return the securities loaned because of insolvency or other reasons, the Fund may apply collateral received from the borrower against the obligation. The Fund may experience delays and costs in recovering the securities loaned. Any cash collateral received is invested in the Fidelity Securities Lending Cash Central Fund. The value of loaned securities and cash collateral at period end are disclosed on the Fund's Statement of Assets and Liabilities. Security lending income represents the income earned on investing cash collateral, less rebates paid to borrowers and any lending agent fees associated with the loan, plus any premium payments received for lending certain types of securities. Security lending income is presented in the Statement of Operations as a component of income from Fidelity Central Funds. Total security lending income during the period amounted to $23,122. During the period, there were no securities loaned to FCM.
8. Expense Reductions.
The investment adviser or its affiliates agreed to reimburse or waive certain fees during the period as noted in the table below.
Initial Class | $ 1,133 |
Investor Class | 5,031 |
| $ 6,164 |
Commissions paid to certain brokers with whom the investment adviser, or its affiliates, places trades on behalf of the Fund include an amount in addition to trade execution, which may be rebated back to the Fund to offset certain expenses. This amount totaled $3,532 for the period.
9. Distributions to Shareholders.
Distributions to shareholders of each class were as follows:
Years ended December 31, | 2013 | 2012 |
From net investment income | | |
Initial Class | $ 475,514 | $ 370,536 |
Investor Class | 2,485,813 | 1,301,814 |
Total | $ 2,961,327 | $ 1,672,350 |
From net realized gain | | |
Initial Class | $ 497,836 | $ 157,821 |
Investor Class | 2,615,953 | 570,318 |
Total | $ 3,113,789 | $ 728,139 |
10. Share Transactions.
Transactions for each class of shares were as follows:
| Shares | Dollars |
Years ended December 31, | 2013 | 2012 | 2013 | 2012 |
Initial Class | | | | |
Shares sold | 552,341 | 1,406,849 | $ 8,677,009 | $ 19,181,897 |
Reinvestment of distributions | 61,339 | 36,948 | 973,350 | 528,357 |
Shares redeemed | (768,136) | (848,719) | (12,356,323) | (11,776,352) |
Net increase (decrease) | (154,456) | 595,078 | $ (2,705,964) | $ 7,933,902 |
Annual Report
Notes to Financial Statements - continued
10. Share Transactions - continued
| Shares | Dollars |
Years ended December 31, | 2013 | 2012 | 2013 | 2012 |
Investor Class | | | | |
Shares sold | 3,358,481 | 3,432,277 | $ 52,778,758 | $ 46,521,823 |
Reinvestment of distributions | 322,066 | 131,194 | 5,101,766 | 1,872,132 |
Shares redeemed | (1,519,540) | (813,316) | (24,290,550) | (10,840,031) |
Net increase (decrease) | 2,161,007 | 2,750,155 | $ 33,589,974 | $ 37,553,924 |
11. Other.
The Fund's organizational documents provide former and current trustees and officers with a limited indemnification against liabilities arising in connection with the performance of their duties to the Fund. In the normal course of business, the Fund may also enter into contracts that provide general indemnifications. The Fund's maximum exposure under these arrangements is unknown as this would be dependent on future claims that may be made against the Fund. The risk of material loss from such claims is considered remote.
At the end of the period, the investment adviser or its affiliates were the owners of record of 100% of the total outstanding shares of the Fund.
Annual Report
Report of Independent Registered Public Accounting Firm
To the Trustees of Variable Insurance Products Fund IV and the Shareholders of VIP Consumer Staples Portfolio:
In our opinion, the accompanying statement of assets and liabilities, including the schedule of investments, and the related statements of operations and of changes in net assets and the financial highlights present fairly, in all material respects, the financial position of VIP Consumer Staples Portfolio (a fund of Variable Insurance Products Fund IV) at December 31, 2013, the results of its operations for the year then ended, the changes in its net assets for each of the two years in the period then ended and the financial highlights for each of the five years in the period then ended, in conformity with accounting principles generally accepted in the United States of America. These financial statements and financial highlights (hereafter referred to as "financial statements") are the responsibility of the VIP Consumer Staples Portfolio's management. Our responsibility is to express an opinion on these financial statements based on our audits. We conducted our audits of these financial statements in accordance with the standards of the Public Company Accounting Oversight Board (United States). Those standards require that we plan and perform the audit to obtain reasonable assurance about whether the financial statements are free of material misstatement. An audit includes examining, on a test basis, evidence supporting the amounts and disclosures in the financial statements, assessing the accounting principles used and significant estimates made by management, and evaluating the overall financial statement presentation. We believe that our audits, which included confirmation of securities at December 31, 2013 by correspondence with the custodian and brokers, provide a reasonable basis for our opinion.
PricewaterhouseCoopers LLP
Boston, Massachusetts
February 14, 2014
Annual Report
The Trustees and officers of the trust and fund, as applicable, are listed below. The Board of Trustees governs the fund and is responsible for protecting the interests of shareholders. The Trustees are experienced executives who meet periodically throughout the year to oversee the fund's activities, review contractual arrangements with companies that provide services to the fund, oversee management of the risks associated with such activities and contractual arrangements, and review the fund's performance. Except for Ned C. Lautenbach, Ronald P. O'Hanley, and William S. Stavropoulos, each of the Trustees oversees 74 funds. Mr. Lautenbach, Mr. O'Hanley, and Mr. Stavropoulos each oversees 247 funds.
The Trustees hold office without limit in time except that (a) any Trustee may resign; (b) any Trustee may be removed by written instrument, signed by at least two-thirds of the number of Trustees prior to such removal; (c) any Trustee who requests to be retired or who has become incapacitated by illness or injury may be retired by written instrument signed by a majority of the other Trustees; and (d) any Trustee may be removed at any special meeting of shareholders by a two-thirds vote of the outstanding voting securities of the trust. The officers hold office without limit in time, except that any officer may resign or may be removed by a vote of a majority of the Trustees at any regular meeting or any special meeting of the Trustees. Except as indicated, each individual has held the office shown or other offices in the same company for the past five years.
Experience, Skills, Attributes, and Qualifications of the Fund's Trustees. The Governance and Nominating Committee has adopted a statement of policy that describes the experience, qualifications, attributes, and skills that are necessary and desirable for potential Independent Trustee candidates (Statement of Policy). The Board believes that each Trustee satisfied at the time he or she was initially elected or appointed a Trustee, and continues to satisfy, the standards contemplated by the Statement of Policy. The Governance and Nominating Committee also engages professional search firms to help identify potential Independent Trustee candidates who have the experience, qualifications, attributes, and skills consistent with the Statement of Policy. From time to time, additional criteria based on the composition and skills of the current Independent Trustees, as well as experience or skills that may be appropriate in light of future changes to board composition, business conditions, and regulatory or other developments, have also been considered by the professional search firms and the Governance and Nominating Committee. In addition, the Board takes into account the Trustees' commitment and participation in Board and committee meetings, as well as their leadership of standing and ad hoc committees throughout their tenure.
In determining that a particular Trustee was and continues to be qualified to serve as a Trustee, the Board has considered a variety of criteria, none of which, in isolation, was controlling. The Board believes that, collectively, the Trustees have balanced and diverse experience, qualifications, attributes, and skills, which allow the Board to operate effectively in governing the fund and protecting the interests of shareholders. Information about the specific experience, skills, attributes, and qualifications of each Trustee, which in each case led to the Board's conclusion that the Trustee should serve (or continue to serve) as a trustee of the fund, is provided below.
Board Structure and Oversight Function. Ronald P. O'Hanley is an interested person (as defined in the 1940 Act) and currently serves as Chairman. The Trustees have determined that an interested Chairman is appropriate and benefits shareholders because an interested Chairman has a personal and professional stake in the quality and continuity of services provided to the fund Independent Trustees exercise their informed business judgment to appoint an individual of their choosing to serve as Chairman, regardless of whether the Trustee happens to be independent or a member of management. The Independent Trustees have determined that they can act independently and effectively without having an Independent Trustee serve as Chairman and that a key structural component for assuring that they are in a position to do so is for the Independent Trustees to constitute a substantial majority for the Board. The Independent Trustees also regularly meet in executive session. Michael E. Wiley serves as Chairman of the Independent Trustees and as such (i) acts as a liaison between the Independent Trustees and management with respect to matters important to the Independent Trustees and (ii) with management prepares agendas for Board meetings.
Fidelity funds are overseen by different Boards of Trustees. The fund's Board oversees Fidelity's sector portfolios. Other Boards oversee Fidelity's equity and high income funds, and Fidelity's investment grade bond, money market, and asset allocation funds. The use of separate Boards, each with its own committee structure, allows the Trustees of each group of Fidelity funds to focus on the unique issues of the funds they oversee, including common research, investment, and operational issues. On occasion, the separate Boards establish joint committees to address issues of overlapping consequences for the Fidelity funds overseen by each Board.
The Trustees operate using a system of committees to facilitate the timely and efficient consideration of all matters of importance to the Trustees,the fund, and fund shareholders and to facilitate compliance with legal and regulatory requirements and oversight of the fund's activities and associated risks. The Board, acting through its committees, has charged SelectCo and its affiliates with (i) identifying events or circumstances the occurrence of which could have demonstrably adverse effects on the fund's business and/or reputation; (ii) implementing processes and controls to lessen the possibility that such events or circumstances occur or to mitigate the effects of such events or circumstances if they do occur; and (iii) creating and maintaining a system designed to evaluate continuously business and market conditions in order to facilitate the identification and implementation processes described in (i) and (ii) above. Because the day-to-day operations and activities of the fund are carried out by or through SelectCo, its affiliates, and other service providers, the fund's exposure to risks is mitigated but not eliminated by the processes overseen by the Trustees. While each of the Board's committees has responsibility for overseeing different aspects of the fund's activities, oversight is exercised primarily through the Operations and Audit Committees. Appropriate personnel, including but not limited to the fund's Chief Compliance Officer (CCO), SelectCo's internal auditor, the independent accountants, the fund's Treasurer and portfolio management personnel, make periodic reports to the Board's committees, as appropriate. The responsibilities of each standing committee, including their oversight responsibilities, are described further under "Standing Committees of the Fund's Trustees."
The fund's Statement of Additional Information (SAI) includes more information about the Trustees. To request a free copy, call Fidelity at 1-877-208-0098.
Annual Report
Trustees and Officers - continued
Interested Trustees*:
Correspondence intended for the Trustee who is an interested person may be sent to Fidelity Investments, 245 Summer Street, Boston, Massachusetts 02210.
Name, Year of Birth; Principal Occupations and Other Relevant Experience+ |
Ronald P. O'Hanley (1957) |
Year of Election or Appointment: 2011 Trustee Chairman of the Board of Trustees |
| Mr. O'Hanley also serves as Trustee of other Fidelity funds. He is Director of Fidelity SelectCo, LLC (2013-present), FMR Co., Inc. (2010-present), Director of Fidelity Investments Money Management, Inc. (2010-present), Director of Fidelity Research & Analysis Company (2010-present), President of Fidelity Asset Management and Corporate Services and a Member of Fidelity's Executive Committee (2010-present). Previously, Mr. O'Hanley served as President and Chief Executive Officer of BNY Mellon Asset Management (2007-2010). Mr. O'Hanley also served as Vice Chairman of Bank New York Mellon Corp. and a member of that firm's Executive Committee. Prior to the 2007 merger of The Bank of New York and Mellon Financial Corporation, he was Vice Chairman of Mellon Financial Corporation and President and Chief Executive Officer of Mellon Asset Management. He joined Mellon in February 1997. Mr. O'Hanley currently serves as Chairman of the Boston Public Library Foundation Board of Directors and sits on the Board of Directors of Beth Israel Deaconess Medical Center, the Board of Trustees of the Marine Biological Laboratory and the Advisory Board of the Maxwell School of Citizenship and Public Administration at Syracuse University. Mr. O'Hanley also chairs the Council on Asset Management for the Financial Services Roundtable and is a member of the Board of Directors of Institutional Investor's U.S. Institute. |
* Trustee has been determined to be an "Interested Trustee" by virtue of, among other things, his affiliation with the trust or various entities under common control with SelectCo.
+ The information above includes the Trustee's principal occupation during the last five years and other information relating to the experience, attributes, and skills relevant to the Trustee's qualifications to serve as a Trustee, which led to the conclusion that the Trustee should serve as a Trustee for the fund.
Independent Trustees:
Correspondence intended for each Independent Trustee (that is, the Trustees other than the Interested Trustees) may be sent to Fidelity Investments, P.O. Box 55235, Boston, Massachusetts 02205-5235.
Name, Year of Birth; Principal Occupations and Other Relevant Experience+ |
Ned C. Lautenbach (1944) |
Year of Election or Appointment: 2000 Trustee |
| Mr. Lautenbach also serves as Trustee of other Fidelity funds. Mr. Lautenbach currently serves as the Lead Director of the Eaton Corporation Board of Directors (diversified industrial, 1997-present). Mr. Lautenbach is Chairman of the Board of Directors of the Philharmonic Center for the Arts in Naples, Florida (2012-present) and a member of the Council on Foreign Relations (1994-present). Previously, Mr. Lautenbach was a Partner/Advisory Partner at Clayton, Dubilier & Rice, LLC (private equity investment, 1998-2010), as well as a Director of Sony Corporation (2006-2007). |
David A. Rosow (1942) |
Year of Election or Appointment: 2013 Trustee |
| Mr. Rosow also serves as Trustee of other Fidelity funds. Mr. Rosow is Chairman and Chief Executive Officer of International Golf Group, Inc. (golf course development, 1989-present). Previously, Mr. Rosow served as Chairman and Chief Executive Officer of Rosow & Company, Inc. (private investment company, 1989-2011), a Lead Director of Hudson United Bancorp (2001-2006) and as a Director of TD Banknorth (1996-2006). In addition, Mr. Rosow is a member (2008-present) and President (2009-present) of the Town Council of Palm Beach, Florida. Mr. Rosow served as a Member of the Advisory Board of other Fidelity funds (2012-2013). |
Garnett A. Smith (1947) |
Year of Election or Appointment: 2013 Trustee |
| Mr. Smith also serves as Trustee of other Fidelity funds. Prior to Mr. Smith's retirement, he served as Chairman and Chief Executive Officer of Inbrand Corp. (manufacturer of personal absorbent products, 1990-1997). He also served as President (1986-1990) of Inbrand Corp. Prior to his employment with Inbrand Corp., he was employed by a retail fabric chain and North Carolina National Bank. In addition, Mr. Smith is a board member of the Jackson Hole Land Trust (2009-present). Mr. Smith served as a Member of the Advisory Board of other Fidelity funds (2012-2013). |
William S. Stavropoulos (1939) |
Year of Election or Appointment: 2001 Trustee |
| Mr. Stavropoulos also serves as Trustee of other Fidelity funds. Mr. Stavropoulos serves as President and Founder of the Michigan Baseball Foundation, the Great Lakes Loons (2007-present). Mr. Stavropoulos is Chairman Emeritus of the Board of Directors of The Dow Chemical Company, where he previously served in numerous senior management positions, including President, CEO (1995-2000; 2002-2004), Chairman of the Executive Committee (2000-2006), and as a member of the Board of Directors (1990-2006). Currently, Mr. Stavropoulos is Chairman of the Board of Directors of Univar Inc. (global distributor of commodity and specialty chemicals), a Director of Teradata Corporation (data warehousing and technology solutions), and Maersk Inc. (industrial conglomerate), and a member of the Advisory Board for Metalmark Capital LLC (private equity investment, 2005-present). Mr. Stavropoulos is an operating advisor to Clayton, Dubilier & Rice, LLC (private equity investment). In addition, Mr. Stavropoulos is a member of the University of Notre Dame Advisory Council for the College of Science, a Trustee of the Rollin L. Gerstacker Foundation, and a Director of the Naples Philharmonic Center for the Arts. Previously, Mr. Stavropoulos served as a Director of Chemical Financial Corporation (bank holding company, 1993-2012) and Tyco International, Ltd. (multinational manufacturing and services, 2007-2012). |
Michael E. Wiley (1950) |
Year of Election or Appointment: 2008 Trustee Chairman of the Independent Trustees |
| Mr. Wiley also serves as Trustee of other Fidelity funds. Mr. Wiley serves as a Director of Asia Pacific Exploration Consolidated (international oil and gas exploration and production, 2008-present). Mr. Wiley serves as a Director of Tesoro Corporation (independent oil refiner and marketer, 2005-present), and a Director of Bill Barrett Corporation (exploration and production, 2005-present). In addition, Mr. Wiley also serves as a Director of Post Oak Bank (privately-held bank, 2004-present). Previously, Mr. Wiley served as a Trustee of other Fidelity funds (2008-2013), as a member of the Board of Trustees of the University of Tulsa (2000-2006; 2007-2010), as a Senior Energy Advisor of Katzenbach Partners, LLC (consulting, 2006-2007), as an Advisory Director of Riverstone Holdings (private investment), Chairman, President, and CEO of Baker Hughes, Inc. (oilfield services, 2000-2004), and as Director of Spinnaker Exploration Company (exploration and production, 2001-2005). |
+ The information above includes each Trustee's principal occupation during the last five years and other information relating to the experience, attributes, and skills relevant to each Trustee's qualifications to serve as a Trustee, which led to the conclusion that each Trustee should serve as a Trustee for the fund.
Officers
Except for Anthony R. Rochte, correspondence intended for each officer may be sent to Fidelity Investments, 245 Summer Street, Boston, Massachusetts 02210. Correspondence intended for Mr. Rochte may be sent to SelectCo, 1225 17th Street, Denver, Colorado 80202-5541. Officers appear below in alphabetical order.
Name, Year of Birth; Principal Occupation |
Christopher S. Bartel (1971) |
Year of Election or Appointment: 2009 Vice President |
| Mr. Bartel also serves as Vice President of other funds. Mr. Bartel serves as a Director, President, and Chief Executive Officer of Fidelity Management & Research (Japan) Inc. (2012-present), a Director of Fidelity Management & Research (Hong Kong) (2012-present), and Senior Vice President of Global Equity Research (2010-present). Previously, Mr. Bartel served as Senior Vice President of Equity Research (2009-2010), Managing Director of Research (2006-2009), and an analyst and portfolio manager (2000-2006). |
Elizabeth Paige Baumann (1968) |
Year of Election or Appointment: 2012 Anti-Money Laundering (AML) Officer |
| Ms. Baumann also serves as AML Officer of other funds. She is Chief AML Officer of FMR LLC (2012-present) and is an employee of Fidelity Investments. Previously, Ms. Baumann served as Vice President and Deputy Anti-Money Laundering Officer (2007-2012). |
Marc Bryant (1966) |
Year of Election or Appointment: 2013 Secretary and Chief Legal Officer (CLO) |
| Mr. Bryant also serves as an officer of other funds. He is Senior Vice President and Deputy General Counsel of FMR LLC. Prior to joining Fidelity Investments, Mr. Bryant served as a Senior Vice President and the Head of Global Retail Legal for AllianceBernstein L.P. (2006-2010), and as the General Counsel for ProFund Advisors LLC (2001-2006). |
William C. Coffey (1969) |
Year of Election or Appointment: 2009 Assistant Secretary |
| Mr. Coffey also serves as Assistant Secretary of other funds. He is Senior Vice President and Deputy General Counsel of FMR LLC (2010-present), and is an employee of Fidelity Investments. Previously, Mr. Coffey served as Vice President and Associate General Counsel of FMR LLC (2005-2009). |
Jonathan Davis (1968) |
Year of Election or Appointment: 2010 Assistant Treasurer |
| Mr. Davis also serves as Assistant Treasurer of other funds. Mr. Davis is an employee of Fidelity Investments. Previously, Mr. Davis served as Vice President and Associate General Counsel of FMR LLC (2003-2010). |
Adrien E. Deberghes (1967) |
Year of Election or Appointment: 2013 President and Treasurer |
| Mr. Deberghes also serves as an officer of other funds. He is an employee of Fidelity Investments (2008-present). Prior to joining Fidelity Investments, Mr. Deberghes was Senior Vice President of Mutual Fund Administration at State Street Corporation (2007-2008), Senior Director of Mutual Fund Administration at Investors Bank & Trust (2005-2007), and Director of Finance for Dunkin' Brands (2000-2005). |
Stephanie J. Dorsey (1969) |
Year of Election or Appointment: 2010 Assistant Treasurer |
| Ms. Dorsey also serves as an officer of other funds. She is an employee of Fidelity Investments (2008-present) and has served in other fund officer roles. Prior to joining Fidelity Investments, Ms. Dorsey served as Treasurer (2004-2008) of the JPMorgan Mutual Funds and Vice President (2004-2008) of JPMorgan Chase Bank. |
Joseph A. Hanlon (1968) |
Year of Election or Appointment: 2012 Chief Compliance Officer |
| Mr. Hanlon also serves as Chief Compliance Officer of other funds. Mr. Hanlon serves as Compliance Officer of FMR, FMR Co., Inc., Fidelity Investments Money Management, Inc. (FIMM), Fidelity Research and Analysis Company (FRAC), and Fidelity Management & Research (Hong Kong) (2009-present), as Senior Vice President of the Fidelity Asset Management Division (2009-present), and is an employee of Fidelity Investments. Previously, Mr. Hanlon served as Compliance Officer of Fidelity Management & Research (Japan) Inc. (2009-2013), Strategic Advisers, Inc. (2009-2013), and Fidelity Management & Research (U.K.) Inc. (2009-2013). |
Brian B. Hogan (1964) |
Year of Election or Appointment: 2009 Vice President |
| Mr. Hogan also serves as Vice President of other funds. Mr. Hogan serves as President of FMR's Equity Division (2009-present). Previously, Mr. Hogan served as Senior Vice President, Equity Research of FMR (2006-2009) and as a portfolio manager. |
Chris Maher (1972) |
Year of Election or Appointment: 2013 Assistant Treasurer |
| Mr. Maher serves as Assistant Treasurer of other funds. Mr. Maher is Vice President of Valuation Oversight and is an employee of Fidelity Investments. Previously, Mr. Maher served as Vice President of Asset Management Compliance (2013), Vice President of FMR's Program Management Group (2010-2013), and Vice President of Valuation Oversight (2008-2010). |
Christine Reynolds (1958) |
Year of Election or Appointment: 2008 Chief Financial Officer |
| Ms. Reynolds also serves as Chief Financial Officer of other funds. Ms. Reynolds became President of Fidelity Pricing and Cash Management Services (FPCMS) in August 2008. Ms. Reynolds served as Chief Operating Officer of FPCMS (2007-2008). Previously, Ms. Reynolds served as President, Treasurer, and Anti-Money Laundering officer of the Fidelity funds (2004-2007). |
Kenneth B. Robins (1969) |
Year of Election or Appointment: 2013 Deputy Treasurer |
| Mr. Robins also serves as an officer of other funds. Mr. Robins serves as Executive Vice President of Fidelity Investments Money Management, Inc. (FIMM) (2013-present) and is an employee of Fidelity Investments (2004-present). Previously, Mr. Robins served in other fund officer roles. |
Anthony R. Rochte (1968) |
Year of Election or Appointment: 2013 Vice President |
| Mr. Rochte also serves as Vice President of other funds. Mr. Rochte serves as President of Fidelity SelectCo, LLC (2012-present) and is an employee of Fidelity Investments (2012-present). Prior to joining Fidelity Investments, Mr. Rochte served as Senior Managing Director and head of State Street Global Advisors' North American Intermediary Business Group (2006-2012). |
Stacie M. Smith (1974) |
Year of Election or Appointment: 2013 Assistant Treasurer |
| Ms. Smith also serves as an officer of other funds. She is an employee of Fidelity Investments (2009-present) and has served in other fund officer roles. Prior to joining Fidelity Investments, Ms. Smith served as Senior Audit Manager of Ernst & Young LLP (1996-2009). |
Renee Stagnone (1975) |
Year of Election or Appointment: 2013 Deputy Treasurer |
| Ms. Stagnone also serves as Deputy Treasurer of other funds. Ms. Stagnone is an employee of Fidelity Investments. |
Joseph F. Zambello (1957) |
Year of Election or Appointment: 2011 Deputy Treasurer |
| Mr. Zambello also serves as Deputy Treasurer of other funds. Mr. Zambello is an employee of Fidelity Investments. Previously, Mr. Zambello served as Vice President of FMR's Program Management Group (2009-2011) and Vice President of the Transfer Agent Oversight Group (2005-2009). |
Annual Report
The Board of Trustees of VIP Consumer Staples Portfolio voted to pay to shareholders of record at the opening of business on record date, the following distributions per share derived from capital gains realized from sales of portfolio securities:
| Pay Date | Record Date | Capital Gains |
Initial Class | 02/14/2014 | 02/14/2014 | $0.452 |
Investor Class | 02/14/2014 | 02/14/2014 | $0.452 |
The fund hereby designates as a capital gain dividend with respect to the taxable year ended December 31, 2013, $3,576,913 or, if subsequently determined to be different, the net capital gain of such year.
Initial Class designates 3% and 43%; and Investor Class designates 3% and 44% of the dividends distributed in February and December, 2013, respectively as qualifying for the dividends-received deduction for corporate shareholders.
Annual Report
A special meeting of Consumer Staples Portfolio's shareholders was held on May 14, 2013. The results of votes taken among shareholders on the proposals before them are reported below. Each vote reported represents one dollar of net asset value held on the record date for the meeting.
PROPOSAL 1 |
To elect a Board of Trustees.A |
| # of
Votes | % of
Votes |
Ned C. Lautenbach |
Affirmative | 1,555,133,782.46 | 93.955 |
Withheld | 100,063,694.32 | 6.045 |
TOTAL | 1,655,197,476.78 | 100.000 |
Ronald P. O'Hanley |
Affirmative | 1,557,988,095.28 | 94.128 |
Withheld | 97,209,381.50 | 5.872 |
TOTAL | 1,655,197,476.78 | 100.000 |
David A. Rosow |
Affirmative | 1,552,645,347.31 | 93.805 |
Withheld | 102,552,129.47 | 6.195 |
TOTAL | 1,655,197,476.78 | 100.000 |
Garnett A. Smith |
Affirmative | 1,554,582,880.53 | 93.922 |
Withheld | 100,614,596.25 | 6.078 |
TOTAL | 1,655,197,476.78 | 100.000 |
William S. Stavropoulos |
Affirmative | 1,548,352,452.21 | 93.545 |
Withheld | 106,845,024.57 | 6.455 |
TOTAL | 1,655,197,476.78 | 100.000 |
Michael E. Wiley |
Affirmative | 1,556,790,374.70 | 94.055 |
Withheld | 98,407,102.08 | 5.945 |
TOTAL | 1,655,197,476.78 | 100.000 |
PROPOSAL 2 |
To approve a management contract between the fund and Fidelity SelectCo, LLC. |
| # of
Votes | % of
Votes |
Affirmative | 127,370,122.58 | 91.022 |
Against | 5,521,947.29 | 3.946 |
Abstain | 7,041,714.57 | 5.032 |
TOTAL | 139,933,784.44 | 100.000 |
A Denotes trust-wide proposal and voting results. |
Annual Report
Investment Adviser
Fidelity Select Co, LLC
Denver, CO
Investment Sub-Advisers
FMR Co., Inc.
Fidelity Management & Research (U.K.) Inc.
Fidelity Management & Research (Hong Kong) Limited
Fidelity Management & Research (Japan) Inc.
General Distributor
Fidelity Distributors Corporation
Smithfield, RI
Transfer and Service Agents
Fidelity Investments Institutional Operations Company, Inc.
Boston, MA
Fidelity Service Company, Inc.
Boston, MA
Custodian
State Street Bank and Trust Company
Quincy, MA
VCSP-ANN-0214
1.850994.106
Fidelity® Variable Insurance Products:
Energy Portfolio: Service Class 2
Annual Report
December 31, 2013
(Fidelity Cover Art)
Contents
Performance | (Click Here) | How the fund has done over time. |
Management's Discussion of Fund Performance | (Click Here) | The Portfolio Manager's review of fund performance and strategy. |
Shareholder Expense Example | (Click Here) | An example of shareholder expenses. |
Investment Changes | (Click Here) | A summary of major shifts in the fund's investments over the past six months. |
Investments | (Click Here) | A complete list of the fund's investments with their market values. |
Financial Statements | (Click Here) | Statements of assets and liabilities, operations, and changes in net assets, as well as financial highlights. |
Notes | (Click Here) | Notes to the financial statements. |
Report of Independent Registered Public Accounting Firm | (Click Here) | |
Trustees and Officers | (Click Here) | |
Distributions | (Click Here) | |
Proxy Voting Results | (Click Here) | |
To view a fund's proxy voting guidelines and proxy voting record for the 12-month period ended June 30, visit http://www.fidelity.com/proxyvotingresults or visit the Securities and Exchange Commission's (SEC) web site at http://www.sec.gov. You may also call 1-877-208-0098 to request a free copy of the proxy voting guidelines.
Fidelity Variable Insurance Products are separate account options which are purchased through a variable insurance contract.
Standard & Poor's, S&P and S&P 500 are registered service marks of The McGraw-Hill Companies, Inc. and have been licensed for use by Fidelity Distributors Corporation.
Other third-party marks appearing herein are the property of their respective owners.
All other marks appearing herein are registered or unregistered trademarks or service marks of FMR LLC or an affiliated company. © 2014 FMR LLC. All rights reserved.
This report and the financial statements contained herein are submitted for the general information of the shareholders of the fund. This report is not authorized for distribution to prospective investors in the fund unless preceded or accompanied by an effective prospectus.
A fund files its complete schedule of portfolio holdings with the SEC for the first and third quarters of each fiscal year on Form N-Q. Forms N-Q are available on the SEC's web site at http://www.sec.gov. A fund's Forms N-Q may be reviewed and copied at the SEC's Public Reference Room in Washington, DC. Information regarding the operation of the SEC's Public Reference Room may be obtained by calling 1-800-SEC-0330. For a complete list of a fund's portfolio holdings, view the most recent holdings listing, semiannual report, or annual report on Fidelity's web site at http://www.fidelity.com, http://www.advisor.fidelity.com, or http://www.401k.com, as applicable.
NOT FDIC INSURED • MAY LOSE VALUE • NO BANK GUARANTEE
Neither the fund nor Fidelity Distributors Corporation is a bank.
Annual Report
Average annual total return reflects the change in the value of an investment, assuming reinvestment of the class' distributions from dividend income and capital gains (the profits earned upon the sale of securities that have grown in value, if any) and assuming a constant rate of performance each year. During periods of reimbursement by Fidelity, a fund's total return will be greater than it would be had the reimbursement not occurred. Performance numbers are net of all underlying fund operating expenses, but do not include any insurance charges imposed by your insurance company's separate account. If performance information included the effect of these additional charges, the total returns would have been lower. How a fund did yesterday is no guarantee of how it will do tomorrow.
Average Annual Total Returns
Periods ended December 31, 2013 | Past 1
year | Past 5
years | Past 10
years |
VIP Energy Portfolio - Service Class 2 A,B | 24.21% | 16.73% | 11.75% |
A Prior to October 1, 2006, VIP Energy Portfolio was named VIP Natural Resources Portfolio, and the fund operated under certain different investment policies and compared its performance to a different additional index. The fund's historical performance may not represent its current investment policies.
B The initial offering of Service Class 2 shares took place on April 6, 2005. Returns prior to April 6, 2005 are those of Initial Class and do not include the effects of Service Class 2's 12b-1 fee. Had Service Class 2's 12b-1 fee been reflected, returns prior to April 6, 2005 would have been lower.
$10,000 Over 10 Years
Let's say hypothetically that $10,000 was invested in VIP Energy Portfolio - Service Class 2 on December 31, 2003. The chart shows how the value of your investment would have changed, and also shows how the S&P 500® Index performed over the same period. See footnote B above for additional information regarding the performance of Service Class 2.
Annual Report
Market Recap: Global equity markets remained upbeat for the 12 months ending December 31, 2013, propelling the MSCI® ACWI® (All Country World Index) Index to a 23.24% return. Midyear turbulence gave way by autumn when policymakers in the U.S. and China had made clear their intentions to maintain accommodative monetary policies. That stance, combined with modest cyclical improvement around the globe and generally low valuations, underpinned the broad rally in equities, although the relative strength of the U.S. dollar generally tempered gains for U.S. investors holding foreign securities based in local currencies. During the period, the broad-market S&P 500® Index set a series of new highs, finishing the year up 32.39%. For the first time since 1995, the S&P® scored a "perfect 10," with all 10 economic sectors gaining at least 10% for the year. A resurgence in growth-oriented stocks lifted the Nasdaq Composite Index® to a 40.12% result for 2013, while the blue-chip Dow Jones Industrial AverageSM notched a relatively more modest 29.65% gain. International developed-markets equities rose in concert with their U.S. counterparts, with the MSCI® EAFE® Index gaining 22.92% for the period. Meanwhile, foreign exchange and commodity weakness curbed results in resource-heavy emerging markets (EM), especially in the year's waning months. More generally, concern over EM's slowing growth, its declining share of global trade and uncertainty surrounding U.S. central bank intentions were all factors hampering performance. The MSCI Emerging Markets Index returned -2.27% for the period. On the bond side, U.S. high-yield securities rallied with equities for much of the period, with The BofA Merrill LynchSM US High Yield Constrained Index returning 7.41% for 2013. The more rate-sensitive U.S. investment-grade bond category faced headwinds though, as reflected in the -2.02% return of the Barclays® U.S. Aggregate Bond Index. Within the Barclays index, investment-grade corporate credit returned -2.01%, while ultra-safe U.S. Treasuries saw a -2.75% result. Major non-U.S. developed markets performed only slightly better, with the Citigroup Non-USD Group-of-Seven (G7) Equal Weighted Index logging a -1.59% result. After several years of strong advances, EM debt reversed course in 2013, with the J.P. Morgan Emerging Markets Bond Index Global returning -6.58%.
Comments from John Dowd, Portfolio Manager of VIP Energy Portfolio: For the year, the fund's share classes underperformed the 25.93% gain of the MSCI® U.S. IMI Energy 25-50 Index, and the broadly based S&P 500®. (For specific portfolio results, please refer to the performance section of this report.) Energy stocks benefited from big gains in equities overall, but fell short of the broader market due in part to muted global demand. Versus the MSCI sector benchmark, the fund's investments in drilling companies detracted, including an underweighting in Ensco, a U.K.-based offshore rig company that failed to deliver on earnings growth. Exploration & production (E&P) firms were a mixed bag, with Cobalt International Energy the fund's largest individual detractor. Investors didn't like the details behind the company's December announcement of a new geological discovery, and the stock sold off. A sizable stake in Anadarko Petroleum stung when its stock fell on a court ruling over its liability in an environmental clean-up case. Conversely, E&P firms Cimarex Energy and Pioneer Natural Resources contributed, as did energy service giant Haliburton and an underweighting in integrated oil company and benchmark heavyweight Exxon Mobil.
The views expressed above reflect those of the portfolio manager(s) only through the end of the period as stated on the cover of this report and do not necessarily represent the views of Fidelity or any other person in the Fidelity organization. Any such views are subject to change at any time based upon market or other conditions and Fidelity disclaims any responsibility to update such views. These views may not be relied on as investment advice and, because investment decisions for a Fidelity fund are based on numerous factors, may not be relied on as an indication of trading intent on behalf of any Fidelity fund.
Annual Report
As a shareholder of the Fund, you incur two types of costs: (1) transaction costs, including redemption fees and (2) ongoing costs, including management fees, distribution and/or service (12b-1) fees and other Fund expenses. This Example is intended to help you understand your ongoing costs (in dollars) of investing in the Fund and to compare these costs with the ongoing costs of investing in other mutual funds.
The Example is based on an investment of $1,000 invested at the beginning of the period and held for the entire period (July 1, 2013 to December 31, 2013).
Actual Expenses
The first line of the accompanying table for each class of the Fund provides information about actual account values and actual expenses. You may use the information in this line, together with the amount you invested, to estimate the expenses that you paid over the period. Simply divide your account value by $1,000.00 (for example, an $8,600 account value divided by $1,000.00 = 8.6), then multiply the result by the number in the first line for a class of the Fund under the heading entitled "Expenses Paid During Period" to estimate the expenses you paid on your account during this period. The estimate of expenses does not include any fees or other expenses of any variable annuity or variable life insurance product. If they were, the estimate of expenses you paid during the period would be higher, and your ending account value would be lower. In addition, the Fund, as a shareholder in the underlying Fidelity Central Funds, will indirectly bear its pro-rata share of the fees and expenses incurred by the underlying Fidelity Central Funds. These fees and expenses are not included in the Fund's annualized expense ratio used to calculate the expense estimate in the table below.
Hypothetical Example for Comparison Purposes
The second line of the accompanying table for each class of the Fund provides information about hypothetical account values and hypothetical expenses based on a Class' actual expense ratio and an assumed rate of return of 5% per year before expenses, which is not the Class' actual return. The hypothetical account values and expenses may not be used to estimate the actual ending account balance or expenses you paid for the period. You may use this information to compare the ongoing costs of investing in the Fund and other funds. To do so, compare this 5% hypothetical example with the 5% hypothetical examples that appear in the shareholder reports of the other funds. The estimate of expenses does not include any fees or other expenses of any variable annuity or variable life insurance product. If they were, the estimate of expenses you paid during the period would be higher, and your ending account value would be lower. In addition, the Fund, as a shareholder in the underlying Fidelity Central Funds, will indirectly bear its pro-rata share of the fees and expenses incurred by the underlying Fidelity Central Funds. These fees and expenses are not included in the Fund's annualized expense ratio used to calculate the expense estimate in the table below.
Please note that the expenses shown in the table are meant to highlight your ongoing costs only and do not reflect any transaction costs. Therefore, the second line of the table is useful in comparing ongoing costs only, and will not help you determine the relative total costs of owning different funds. In addition, if these transactional costs were included, your costs would have been higher.
| Annualized
Expense RatioB | Beginning
Account Value
July 1, 2013 | Ending
Account Value
December 31, 2013 | Expenses Paid
During Period*
July 1, 2013
to December 31, 2013 |
Initial Class | .70% | | | |
Actual | | $ 1,000.00 | $ 1,133.10 | $ 3.76 |
HypotheticalA | | $ 1,000.00 | $ 1,021.68 | $ 3.57 |
Service Class 2 | .95% | | | |
Actual | | $ 1,000.00 | $ 1,131.20 | $ 5.10 |
HypotheticalA | | $ 1,000.00 | $ 1,020.42 | $ 4.84 |
Investor Class | .78% | | | |
Actual | | $ 1,000.00 | $ 1,132.00 | $ 4.19 |
HypotheticalA | | $ 1,000.00 | $ 1,021.27 | $ 3.97 |
A 5% return per year before expenses
B Annualized expense ratio reflects expenses net of applicable fee waivers.
* Expenses are equal to each Class' annualized expense ratio, multiplied by the average account value over the period, multiplied by 184/365 (to reflect the one-half year period).
Annual Report
Investment Changes (Unaudited)
Top Ten Stocks as of December 31, 2013 |
| % of fund's
net assets | % of fund's net assets
6 months ago |
Chevron Corp. | 11.5 | 8.8 |
Exxon Mobil Corp. | 11.0 | 13.4 |
EOG Resources, Inc. | 7.1 | 3.6 |
Schlumberger Ltd. | 5.6 | 3.3 |
Anadarko Petroleum Corp. | 4.4 | 3.9 |
ConocoPhillips Co. | 4.3 | 0.0 |
National Oilwell Varco, Inc. | 3.4 | 4.3 |
Noble Energy, Inc. | 3.0 | 2.9 |
Cimarex Energy Co. | 2.9 | 1.1 |
Halliburton Co. | 2.8 | 5.2 |
| 56.0 | |
Top Industries (% of fund's net assets) |
As of December 31, 2013 |
| Oil, Gas &Consumable Fuels | 76.9% | |
 | Energy Equipment & Services | 21.1% | |
 | Construction & Engineering | 0.3% | |
| Metals & Mining | 0.1% | |
| All Others* | 1.6% | |

As of June 30, 2013 |
| Oil, Gas &Consumable Fuels | 75.8% | |
| Energy Equipment & Services | 22.3% | |
| Chemicals | 1.3% | |
 | Hotels, Restaurants & Leisure | 0.0% | |
| Specialty Retail | 0.0% | |
| All Others* | 0.6% | |

* Includes short-term investments and net other assets (liabilities). |
Annual Report
Investments December 31, 2013
Showing Percentage of Net Assets
Common Stocks - 98.4% |
| Shares | | Value |
CONSTRUCTION & ENGINEERING - 0.3% |
Construction & Engineering - 0.3% |
URS Corp. | 15,081 | | $ 799,142 |
ENERGY EQUIPMENT & SERVICES - 21.1% |
Oil & Gas Drilling - 3.3% |
Ensco PLC Class A | 98,272 | | 5,619,193 |
Hercules Offshore, Inc. (a) | 55,355 | | 361,468 |
Noble Corp. | 50,070 | | 1,876,123 |
Odfjell Drilling A/S | 120,300 | | 719,979 |
Vantage Drilling Co. (a) | 855,519 | | 1,574,155 |
Xtreme Drilling & Coil Services Corp. (a) | 261,500 | | 891,156 |
| | 11,042,074 |
Oil & Gas Equipment & Services - 17.8% |
Cameron International Corp. (a) | 93,314 | | 5,554,982 |
Core Laboratories NV | 12,175 | | 2,324,816 |
FMC Technologies, Inc. (a) | 102,505 | | 5,351,786 |
Forum Energy Technologies, Inc. (a) | 72,001 | | 2,034,748 |
Halliburton Co. | 183,940 | | 9,334,955 |
National Oilwell Varco, Inc. | 142,405 | | 11,325,470 |
Oceaneering International, Inc. | 11,200 | | 883,456 |
Schlumberger Ltd. | 207,536 | | 18,701,069 |
Total Energy Services, Inc. | 27,900 | | 541,584 |
Weatherford International Ltd. (a) | 203,134 | | 3,146,546 |
| | 59,199,412 |
TOTAL ENERGY EQUIPMENT & SERVICES | | 70,241,486 |
METALS & MINING - 0.1% |
Diversified Metals & Mining - 0.1% |
U.S. Silica Holdings, Inc. | 10,700 | | 364,977 |
OIL, GAS & CONSUMABLE FUELS - 76.9% |
Coal & Consumable Fuels - 1.7% |
Alpha Natural Resources, Inc. (a) | 38,500 | | 274,890 |
Peabody Energy Corp. | 278,961 | | 5,448,108 |
| | 5,722,998 |
Integrated Oil & Gas - 28.1% |
Chevron Corp. | 306,438 | | 38,277,172 |
Exxon Mobil Corp. | 359,603 | | 36,391,824 |
Hess Corp. | 76,943 | | 6,386,269 |
Occidental Petroleum Corp. | 59,275 | | 5,637,053 |
Suncor Energy, Inc. | 188,500 | | 6,608,369 |
| | 93,300,687 |
Oil & Gas Exploration & Production - 39.6% |
Anadarko Petroleum Corp. | 185,034 | | 14,676,897 |
Bankers Petroleum Ltd. (a) | 475,100 | | 1,954,518 |
Bonanza Creek Energy, Inc. (a) | 63,627 | | 2,765,866 |
Cabot Oil & Gas Corp. | 193,678 | | 7,506,959 |
|
| Shares | | Value |
Cimarex Energy Co. | 91,387 | | $ 9,587,410 |
Cobalt International Energy, Inc. (a) | 168,302 | | 2,768,568 |
Concho Resources, Inc. (a) | 3,200 | | 345,600 |
ConocoPhillips Co. | 202,798 | | 14,327,679 |
Continental Resources, Inc. (a)(d) | 50,062 | | 5,632,976 |
Emerald Oil, Inc. (a) | 25,500 | | 195,330 |
Energen Corp. | 7,500 | | 530,625 |
EOG Resources, Inc. | 140,021 | | 23,501,125 |
EPL Oil & Gas, Inc. (a) | 29,282 | | 834,537 |
EQT Corp. | 54,274 | | 4,872,720 |
Evolution Petroleum Corp. | 5,622 | | 69,375 |
Gulfport Energy Corp. (a) | 26,335 | | 1,663,055 |
Halcon Resources Corp. (a) | 150,000 | | 579,000 |
Kodiak Oil & Gas Corp. (a) | 260,021 | | 2,914,835 |
Laredo Petroleum Holdings, Inc. (a) | 73,523 | | 2,035,852 |
Murphy Oil Corp. | 10,400 | | 674,752 |
Noble Energy, Inc. | 146,812 | | 9,999,365 |
Northern Oil & Gas, Inc. (a) | 92,107 | | 1,388,052 |
Oasis Petroleum, Inc. (a) | 12,778 | | 600,183 |
Painted Pony Petroleum Ltd. (a) | 63,475 | | 414,701 |
PDC Energy, Inc. (a) | 61,434 | | 3,269,517 |
Pioneer Natural Resources Co. | 40,365 | | 7,429,986 |
Rex Energy Corp. (a) | 730 | | 14,388 |
Rosetta Resources, Inc. (a) | 18,900 | | 907,956 |
Sanchez Energy Corp. (a) | 32,800 | | 803,928 |
SM Energy Co. | 50,838 | | 4,225,146 |
Synergy Resources Corp. (a) | 33,024 | | 305,802 |
TAG Oil Ltd. (a) | 202,500 | | 627,183 |
Tullow Oil PLC | 22,560 | | 319,413 |
Whiting Petroleum Corp. (a) | 62,800 | | 3,885,436 |
| | 131,628,735 |
Oil & Gas Refining & Marketing - 2.3% |
Marathon Petroleum Corp. | 47,703 | | 4,375,796 |
Phillips 66 Co. | 30,380 | | 2,343,209 |
Tesoro Corp. | 13,000 | | 760,500 |
| | 7,479,505 |
Oil & Gas Storage & Transport - 5.2% |
Access Midstream Partners LP | 72,860 | | 4,122,419 |
Atlas Pipeline Partners LP | 45,360 | | 1,589,868 |
Magellan Midstream Partners LP | 29,936 | | 1,894,051 |
Markwest Energy Partners LP | 22,802 | | 1,507,896 |
MPLX LP | 18,515 | | 824,658 |
Phillips 66 Partners LP | 29,175 | | 1,106,608 |
Spectra Energy Corp. | 24,438 | | 870,482 |
Targa Resources Corp. | 21,700 | | 1,913,289 |
The Williams Companies, Inc. | 91,155 | | 3,515,848 |
Valero Energy Partners LP | 1,400 | | 48,230 |
| | 17,393,349 |
TOTAL OIL, GAS & CONSUMABLE FUELS | | 255,525,274 |
TOTAL COMMON STOCKS (Cost $268,122,995) |
326,930,879
|
Money Market Funds - 3.3% |
| Shares | | Value |
Fidelity Cash Central Fund, 0.11% (b) | 5,471,559 | | $ 5,471,559 |
Fidelity Securities Lending Cash Central Fund, 0.11% (b)(c) | 5,594,550 | | 5,594,550 |
TOTAL MONEY MARKET FUNDS (Cost $11,066,109) |
11,066,109
|
TOTAL INVESTMENT PORTFOLIO - 101.7% (Cost $279,189,104) | | 337,996,988 |
NET OTHER ASSETS (LIABILITIES) - (1.7)% | | (5,618,650) |
NET ASSETS - 100% | $ 332,378,338 |
Legend |
(a) Non-income producing |
(b) Affiliated fund that is generally available only to investment companies and other accounts managed by Fidelity Investments. The rate quoted is the annualized seven-day yield of the fund at period end. A complete unaudited listing of the fund's holdings as of its most recent quarter end is available upon request. In addition, each Fidelity Central Fund's financial statements, which are not covered by the Fund's Report of Independent Registered Public Accounting Firm, are available on the SEC's website or upon request. |
(c) Investment made with cash collateral received from securities on loan. |
(d) Security or a portion of the security is on loan at period end. |
Affiliated Central Funds |
Information regarding fiscal year to date income earned by the Fund from investments in Fidelity Central Funds is as follows: |
Fund | Income earned |
Fidelity Cash Central Fund | $ 4,037 |
Fidelity Securities Lending Cash Central Fund | 123,188 |
Total | $ 127,225 |
Other Information |
All investments are categorized as Level 1 under the Fair Value Hierarchy. The inputs or methodology used for valuing securities may not be an indication of the risk associated with investing in those securities. For more information on valuation inputs, please refer to the Investment Valuation section in the accompanying Notes to Financial Statements. |
Distribution of investments by country or territory of incorporation, as a percentage of total net assets, is as follows (Unaudited): |
United States of America | 85.5% |
Curacao | 5.6% |
Canada | 4.3% |
United Kingdom | 2.3% |
Others (Individually Less Than 1%) | 2.3% |
| 100.0% |
See accompanying notes which are an integral part of the financial statements.
Annual Report
Statement of Assets and Liabilities
| December 31, 2013 |
| | |
Assets | | |
Investment in securities, at value (including securities loaned of $5,558,488) - See accompanying schedule: Unaffiliated issuers (cost $268,122,995) | $ 326,930,879 | |
Fidelity Central Funds (cost $11,066,109) | 11,066,109 | |
Total Investments (cost $279,189,104) | | $ 337,996,988 |
Receivable for fund shares sold | | 331,726 |
Dividends receivable | | 112,833 |
Distributions receivable from Fidelity Central Funds | | 2,788 |
Prepaid expenses | | 2,315 |
Other receivables | | 2,074 |
Total assets | | 338,448,724 |
| | |
Liabilities | | |
Payable for investments purchased | $ 28,782 | |
Payable for fund shares redeemed | 196,772 | |
Accrued management fee | 149,612 | |
Distribution and service plan fees payable | 26,607 | |
Other affiliated payables | 35,820 | |
Other payables and accrued expenses | 38,243 | |
Collateral on securities loaned, at value | 5,594,550 | |
Total liabilities | | 6,070,386 |
| | |
Net Assets | | $ 332,378,338 |
Net Assets consist of: | | |
Paid in capital | | $ 272,677,925 |
Distributions in excess of net investment income | | (395,249) |
Accumulated undistributed net realized gain (loss) on investments and foreign currency transactions | | 1,287,776 |
Net unrealized appreciation (depreciation) on investments and assets and liabilities in foreign currencies | | 58,807,886 |
Net Assets | | $ 332,378,338 |
Statement of Assets and Liabilities - continued
| December 31, 2013 |
| | |
Initial Class:
Net Asset Value, offering price and redemption price per share ($94,201,793 ÷ 3,934,036 shares) | | $ 23.95 |
| | |
Service Class 2:
Net Asset Value, offering price and redemption price per share ($130,099,998 ÷ 5,459,610 shares) | | $ 23.83 |
| | |
Investor Class:
Net Asset Value, offering price and redemption price per share ($108,076,547 ÷ 4,522,435 shares) | | $ 23.90 |
See accompanying notes which are an integral part of the financial statements.
Annual Report
Statement of Operations
| Year ended December 31, 2013 |
| | |
Investment Income | | |
Dividends | | $ 4,904,272 |
Income from Fidelity Central Funds | | 127,225 |
Total income | | 5,031,497 |
| | |
Expenses | | |
Management fee | $ 1,772,177 | |
Transfer agent fees | 307,406 | |
Distribution and service plan fees | 305,378 | |
Accounting and security lending fees | 125,299 | |
Custodian fees and expenses | 32,178 | |
Independent trustees' compensation | 5,048 | |
Audit | 38,597 | |
Legal | 5,206 | |
Interest | 129 | |
Miscellaneous | 22,332 | |
Total expenses before reductions | 2,613,750 | |
Expense reductions | (25,914) | 2,587,836 |
Net investment income (loss) | | 2,443,661 |
Realized and Unrealized Gain (Loss) Net realized gain (loss) on: | | |
Investment securities: | | |
Unaffiliated issuers | 29,992,607 | |
Foreign currency transactions | 240 | |
Total net realized gain (loss) | | 29,992,847 |
Change in net unrealized appreciation (depreciation) on: Investment securities | 36,397,407 | |
Assets and liabilities in foreign currencies | 126 | |
Total change in net unrealized appreciation (depreciation) | | 36,397,533 |
Net gain (loss) | | 66,390,380 |
Net increase (decrease) in net assets resulting from operations | | $ 68,834,041 |
Statement of Changes in Net Assets
| Year ended
December 31, 2013 | Year ended
December 31, 2012 |
Increase (Decrease) in Net Assets | | |
Operations | | |
Net investment income (loss) | $ 2,443,661 | $ 2,956,681 |
Net realized gain (loss) | 29,992,847 | 3,674,511 |
Change in net unrealized appreciation (depreciation) | 36,397,533 | 7,776,477 |
Net increase (decrease) in net assets resulting from operations | 68,834,041 | 14,407,669 |
Distributions to shareholders from net investment income | (2,599,943) | (2,882,991) |
Distributions to shareholders from net realized gain | (1,958,979) | - |
Total distributions | (4,558,922) | (2,882,991) |
Share transactions - net increase (decrease) | (33,910,894) | (70,995,641) |
Redemption fees | 39,603 | 57,627 |
Total increase (decrease) in net assets | 30,403,828 | (59,413,336) |
| | |
Net Assets | | |
Beginning of period | 301,974,510 | 361,387,846 |
End of period (including distributions in excess of net investment income of $395,249 and undistributed net investment income of $20,344, respectively) | $ 332,378,338 | $ 301,974,510 |
See accompanying notes which are an integral part of the financial statements.
Annual Report
Financial Highlights - Initial Class
Years ended December 31, | 2013 | 2012 | 2011 | 2010 | 2009 |
Selected Per-Share Data | | | | | |
Net asset value, beginning of period | $ 19.53 | $ 18.81 | $ 20.05 | $ 16.88 | $ 11.46 |
Income from Investment Operations | | | | | |
Net investment income (loss) C | .20 | .19 | .21 | .11 | .07 |
Net realized and unrealized gain (loss) | 4.58 | .74 | (1.23) | 3.16 | 5.41 |
Total from investment operations | 4.78 | .93 | (1.02) | 3.27 | 5.48 |
Distributions from net investment income | (.22) | (.21) | (.23) | (.11) | (.07) |
Distributions from net realized gain | (.14) | - | - | - | - |
Total distributions | (.36) | (.21) | (.23) | (.11) | (.07) |
Redemption fees added to paid in capital C | - G | - G | .01 | .01 | .01 |
Net asset value, end of period | $ 23.95 | $ 19.53 | $ 18.81 | $ 20.05 | $ 16.88 |
Total Return A, B | 24.55% | 4.94% | (4.99)% | 19.45% | 47.90% |
Ratios to Average Net Assets D, F | | | | | |
Expenses before reductions | .70% | .69% | .69% | .70% | .71% |
Expenses net of fee waivers, if any | .69% | .69% | .69% | .69% | .71% |
Expenses net of all reductions | .69% | .68% | .68% | .69% | .70% |
Net investment income (loss) | .88% | .98% | 1.00% | .65% | .47% |
Supplemental Data | | | | | |
Net assets, end of period (000 omitted) | $ 94,202 | $ 96,822 | $ 126,723 | $ 148,774 | $ 152,028 |
Portfolio turnover rate E | 90% | 81% | 94% | 105% | 113% |
A Total returns do not reflect charges attributable to your insurance company's separate account. Inclusion of these charges would reduce the total returns shown.
B Total returns would have been lower if certain expenses had not been reduced during the applicable periods shown.
C Calculated based on average shares outstanding during the period.
D Fees and expenses of any underlying Fidelity Central Funds are not included in the Fund's expense ratio. The Fund indirectly bears its proportionate share of the expenses of any underlying Fidelity Central Funds.
E Amount does not include the portfolio activity of any underlying Fidelity Central Funds.
F Expense ratios reflect operating expenses of the class. Expenses before reductions do not reflect amounts reimbursed by the investment adviser or reductions from brokerage service arrangements or reductions from other expense offset arrangements and do not represent the amount paid by the class during periods when reimbursements or reductions occur. Expenses net of fee waivers reflect expenses after reimbursement by the investment adviser but prior to reductions from brokerage service arrangements or other expense offset arrangements. Expenses net of all reductions represent the net expenses paid by the class.
G Amount represents less than $.01 per share.
Financial Highlights - Service Class 2
Years ended December 31, | 2013 | 2012 | 2011 | 2010 | 2009 |
Selected Per-Share Data | | | | | |
Net asset value, beginning of period | $ 19.44 | $ 18.72 | $ 19.94 | $ 16.79 | $ 11.40 |
Income from Investment Operations | | | | | |
Net investment income (loss) C | .14 | .14 | .16 | .07 | .03 |
Net realized and unrealized gain (loss) | 4.55 | .73 | (1.21) | 3.13 | 5.38 |
Total from investment operations | 4.69 | .87 | (1.05) | 3.20 | 5.41 |
Distributions from net investment income | (.16) | (.15) | (.18) | (.06) | (.03) |
Distributions from net realized gain | (.14) | - | - | - | - |
Total distributions | (.30) | (.15) | (.18) | (.06) | (.03) |
Redemption fees added to paid in capital C | - G | - G | .01 | .01 | .01 |
Net asset value, end of period | $ 23.83 | $ 19.44 | $ 18.72 | $ 19.94 | $ 16.79 |
Total Return A, B | 24.21% | 4.68% | (5.20)% | 19.16% | 47.57% |
Ratios to Average Net Assets D, F | | | | | |
Expenses before reductions | .94% | .94% | .94% | .95% | .96% |
Expenses net of fee waivers, if any | .94% | .94% | .93% | .94% | .96% |
Expenses net of all reductions | .94% | .93% | .93% | .94% | .95% |
Net investment income (loss) | .64% | .74% | .75% | .40% | .22% |
Supplemental Data | | | | | |
Net assets, end of period (000 omitted) | $ 130,100 | $ 112,819 | $ 127,187 | $ 129,043 | $ 125,669 |
Portfolio turnover rate E | 90% | 81% | 94% | 105% | 113% |
A Total returns do not reflect charges attributable to your insurance company's separate account. Inclusion of these charges would reduce the total returns shown.
B Total returns would have been lower if certain expenses had not been reduced during the applicable periods shown.
C Calculated based on average shares outstanding during the period.
D Fees and expenses of any underlying Fidelity Central Funds are not included in the Fund's expense ratio. The Fund indirectly bears its proportionate share of the expenses of any underlying Fidelity Central Funds.
E Amount does not include the portfolio activity of any underlying Fidelity Central Funds.
F Expense ratios reflect operating expenses of the class. Expenses before reductions do not reflect amounts reimbursed by the investment adviser or reductions from brokerage service arrangements or reductions from other expense offset arrangements and do not represent the amount paid by the class during periods when reimbursements or reductions occur. Expenses net of fee waivers reflect expenses after reimbursement by the investment adviser but prior to reductions from brokerage service arrangements or other expense offset arrangements. Expenses net of all reductions represent the net expenses paid by the class.
G Amount represents less than $.01 per share.
See accompanying notes which are an integral part of the financial statements.
Annual Report
Financial Highlights - Investor Class
Years ended December 31, | 2013 | 2012 | 2011 | 2010 | 2009 |
Selected Per-Share Data | | | | | |
Net asset value, beginning of period | $ 19.49 | $ 18.77 | $ 20.01 | $ 16.85 | $ 11.44 |
Income from Investment Operations | | | | | |
Net investment income (loss) C | .18 | .17 | .19 | .09 | .05 |
Net realized and unrealized gain (loss) | 4.57 | .74 | (1.23) | 3.16 | 5.41 |
Total from investment operations | 4.75 | .91 | (1.04) | 3.25 | 5.46 |
Distributions from net investment income | (.20) | (.19) | (.21) | (.10) | (.06) |
Distributions from net realized gain | (.14) | - | - | - | - |
Total distributions | (.34) | (.19) | (.21) | (.10) | (.06) |
Redemption fees added to paid in capital C | - G | - G | .01 | .01 | .01 |
Net asset value, end of period | $ 23.90 | $ 19.49 | $ 18.77 | $ 20.01 | $ 16.85 |
Total Return A, B | 24.45% | 4.86% | (5.09)% | 19.34% | 47.79% |
Ratios to Average Net Assets D, F | | | | | |
Expenses before reductions | .78% | .77% | .77% | .79% | .81% |
Expenses net of fee waivers, if any | .77% | .77% | .77% | .78% | .81% |
Expenses net of all reductions | .77% | .76% | .77% | .77% | .80% |
Net investment income (loss) | .80% | .90% | .92% | .57% | .37% |
Supplemental Data | | | | | |
Net assets, end of period (000 omitted) | $ 108,077 | $ 92,334 | $ 107,479 | $ 103,682 | $ 89,921 |
Portfolio turnover rate E | 90% | 81% | 94% | 105% | 113% |
A Total returns do not reflect charges attributable to your insurance company's separate account. Inclusion of these charges would reduce the total returns shown.
B Total returns would have been lower if certain expenses had not been reduced during the applicable periods shown.
C Calculated based on average shares outstanding during the period.
D Fees and expenses of any underlying Fidelity Central Funds are not included in the Fund's expense ratio. The Fund indirectly bears its proportionate share of the expenses of any underlying Fidelity Central Funds.
E Amount does not include the portfolio activity of any underlying Fidelity Central Funds.
F Expense ratios reflect operating expenses of the class. Expenses before reductions do not reflect amounts reimbursed by the investment adviser or reductions from brokerage service arrangements or reductions from other expense offset arrangements and do not represent the amount paid by the class during periods when reimbursements or reductions occur. Expenses net of fee waivers reflect expenses after reimbursement by the investment adviser but prior to reductions from brokerage service arrangements or other expense offset arrangements. Expenses net of all reductions represent the net expenses paid by the class.
G Amount represents less than $.01 per share.
See accompanying notes which are an integral part of the financial statements.
Annual Report
Notes to Financial Statements
For the period ended December 31, 2013
1. Organization.
VIP Energy Portfolio (the Fund) is a non-diversified fund of Variable Insurance Products Fund IV (the Trust) and is authorized to issue an unlimited number of shares. The Trust is registered under the Investment Company Act of 1940, as amended (the 1940 Act), as an open-end management investment company organized as a Massachusetts business trust. Shares of the Fund may only be purchased by insurance companies for the purpose of funding variable annuity or variable life insurance contracts. The Fund offers the following classes of shares: Initial Class shares, Service Class 2 shares and Investor Class shares. All classes have equal rights and voting privileges, except for matters affecting a single class.
2. Investments in Fidelity Central Funds.
The Fund invests in Fidelity Central Funds, which are open-end investment companies generally available only to other investment companies and accounts managed by the investment adviser and its affiliates. The Fund's Schedule of Investments lists each of the Fidelity Central Funds held as of period end, if any, as an investment of the Fund, but does not include the underlying holdings of each Fidelity Central Fund. As an Investing Fund, the Fund indirectly bears its proportionate share of the expenses of the underlying Fidelity Central Funds.
The Money Market Central Funds seek preservation of capital and current income and are managed by Fidelity Investments Money Management, Inc. (FIMM), an affiliate of the investment adviser. Annualized expenses of the Money Market Central Funds as of their most recent shareholder report date are less than .01%.
A complete unaudited list of holdings for each Fidelity Central Fund is available upon request or at the Securities and Exchange Commission (the SEC) website at www.sec.gov. In addition, the financial statements of the Fidelity Central Funds, which are not covered by the Fund's Report of Independent Registered Public Accounting Firm, are available on the SEC website or upon request.
3. Significant Accounting Policies.
The financial statements have been prepared in conformity with accounting principles generally accepted in the United States of America (GAAP), which require management to make certain estimates and assumptions at the date of the financial statements. Actual results could differ from those estimates. Subsequent events, if any, through the date that the financial statements were issued have been evaluated in the preparation of the financial statements. The following summarizes the significant accounting policies of the Fund:
Investment Valuation. Investments are valued as of 4:00 p.m. Eastern time on the last calendar day of the period. In accordance with valuation policies and procedures approved by the Board of Trustees (the Board), the Fund attempts to obtain prices from one or more third party pricing vendors or brokers to value its investments. When current market prices, quotations or currency exchange rates are not readily available or reliable, investments will be fair valued in good faith by the Fidelity SelectCo, LLC (SelectCo) Fair Value Committee (the Committee), in accordance with procedures adopted by the Board. Factors used in determining fair value vary by investment type and may include market or investment specific events. The frequency with which these procedures are used cannot be predicted and they may be utilized to a significant extent. The Committee oversees the Fund's valuation policies and procedures and is responsible for approving and reporting to the Board all fair value determinations.
The Fund categorizes the inputs to valuation techniques used to value its investments into a disclosure hierarchy consisting of three levels as shown below:
Level 1 - quoted prices in active markets for identical investments
Level 2 - other significant observable inputs (including quoted prices for similar investments, interest rates, prepayment speeds, etc.)
Level 3 - unobservable inputs (including the Fund's own assumptions based on the best information available)
Valuation techniques used to value the Fund's investments by major category are as follows:
Equity securities, including restricted securities, for which market quotations are readily available, are valued at the last reported sale price or official closing price as reported by a third party pricing vendor on the primary market or exchange on which they are traded and are categorized as Level 1 in the hierarchy. In the event there were no sales during the day or closing prices are not available, securities are valued at the last quoted bid price or may be valued using the last available price and are generally categorized as Level 2 in the hierarchy. For foreign equity securities, when market or security specific events arise, comparisons to the valuation of American Depositary Receipts (ADRs), futures contracts, Exchange-Traded Funds (ETFs) and certain indexes as well as quoted prices for similar securities may be used and would be categorized as Level 2 in the hierarchy. Utilizing these techniques may result in transfers between Level 1 and Level 2. For equity securities, including restricted securities, where observable inputs are limited, assumptions about market activity and risk are used and these securities may be categorized as Level 3 in the hierarchy.
Investments in open-end mutual funds ,including the Fidelity Central Funds, are valued at their closing net asset value (NAV) each business day and are categorized as Level 1 in the hierarchy.
Changes in valuation techniques may result in transfers in or out of an assigned level within the disclosure hierarchy.
Annual Report
3. Significant Accounting Policies - continued
Foreign Currency. The Fund may use foreign currency contracts to facilitate transactions in foreign-denominated securities. Gains and losses from these transactions may arise from changes in the value of the foreign currency or if the counterparties do not perform under the contracts' terms.
Foreign-denominated assets, including investment securities, and liabilities are translated into U.S. dollars at the exchange rates at period end. Purchases and sales of investment securities, income and dividends received and expenses denominated in foreign currencies are translated into U.S. dollars at the exchange rate in effect on the transaction date.
The effects of exchange rate fluctuations on investments are included with the net realized and unrealized gain (loss) on investment securities. Other foreign currency transactions resulting in realized and unrealized gain (loss) are disclosed separately.
Investment Transactions and Income. For financial reporting purposes, the Fund's investment holdings and NAV include trades executed through the end of the last business day of the period. The NAV per share for processing shareholder transactions is calculated as of the close of business of the New York Stock Exchange (NYSE), normally 4:00 p.m. Eastern time and includes trades executed through the end of the prior business day. Gains and losses on securities sold are determined on the basis of identified cost and may include proceeds received from litigation. Dividend income is recorded on the ex-dividend date, except for certain dividends from foreign securities where the ex-dividend date may have passed, which are recorded as soon as the Fund is informed of the ex-dividend date. Non-cash dividends included in dividend income, if any, are recorded at the fair market value of the securities received. Distributions received on securities that represent a return of capital or capital gain are recorded as a reduction of cost of investments and/or as a realized gain. Subsequent to ex-dividend date the Fund determines the components of these distributions, based upon receipt of tax filings or other correspondence relating to the underlying investment. Interest income and distributions from the Fidelity Central Funds are accrued as earned. Investment income is recorded net of foreign taxes withheld where recovery of such taxes is uncertain.
Class Allocations and Expenses. Investment income, realized and unrealized capital gains and losses, common expenses of the Fund, and certain fund-level expense reductions, if any, are allocated daily on a pro-rata basis to each class based on the relative net assets of each class to the total net assets of the Fund. Each class differs with respect to transfer agent and distribution and service plan fees incurred. Certain expense reductions may also differ by class. For the reporting period, the allocated portion of income and expenses to each class as a percent of its average net assets may vary due to the timing of recording these transactions in relation to fluctuating net assets of the classes. Expenses directly attributable to a fund are charged to that fund. Expenses attributable to more than one fund are allocated among the respective funds on the basis of relative net assets or other appropriate methods. Expense estimates are accrued in the period to which they relate and adjustments are made when actual amounts are known.
Income Tax Information and Distributions to Shareholders. Each year, the Fund intends to qualify as a regulated investment company under Subchapter M of the Internal Revenue Code, including distributing substantially all of its taxable income and realized gains. As a result, no provision for U.S. Federal income taxes is required. As of December 31, 2013, the Fund did not have any unrecognized tax benefits in the financial statements; nor is the Fund aware of any tax positions for which it is reasonably possible that the total amounts of unrecognized tax benefits will significantly change in the next twelve months. The Fund files a U.S. federal tax return, in addition to state and local tax returns as required. The Fund's federal income tax returns are subject to examination by the Internal Revenue Service (IRS) for a period of three fiscal years after they are filed. State and local tax returns may be subject to examination for an additional fiscal year depending on the jurisdiction. Foreign taxes are provided for based on the Fund's understanding of the tax rules and rates that exist in the foreign markets in which it invests.
Distributions are declared and recorded on the ex-dividend date. Income dividends and capital gain distributions are declared separately for each class. Income and capital gain distributions are determined in accordance with income tax regulations, which may differ from GAAP.
Capital accounts within the financial statements are adjusted for permanent book-tax differences. These adjustments have no impact on net assets or the results of operations. Capital accounts are not adjusted for temporary book-tax differences which will reverse in a subsequent period.
Book-tax differences are primarily due to foreign currency transactions, partnerships, capital loss carryforwards and losses deferred due to wash sales and excise tax regulations.
The federal tax cost of investment securities and unrealized appreciation (depreciation) as of period end were as follows:
Gross unrealized appreciation | $ 66,728,885 |
Gross unrealized depreciation | (8,429,722) |
Net unrealized appreciation (depreciation) on securities and other investments | $ 58,299,163 |
| |
Tax Cost | $ 279,697,825 |
Annual Report
Notes to Financial Statements - continued
3. Significant Accounting Policies - continued
Income Tax Information and Distributions to Shareholders - continued
The tax-based components of distributable earnings as of period end were as follows:
Undistributed long-term capital gain | $ 1,796,497 |
Net unrealized appreciation (depreciation) | $ 58,299,165 |
The tax character of distributions paid was as follows:
| December 31, 2013 | December 31, 2012 |
Ordinary Income | $ 2,769,245 | $ 2,882,991 |
Long-term Capital Gains | 1,789,677 | - |
Total | $ 4,558,922 | $ 2,882,991 |
Trading (Redemption) Fees. Shares held by investors less than 60 days may be subject to a redemption fee equal to 1% of the NAV of shares redeemed. All redemption fees, which reduce the proceeds of the shareholder redemption, are retained by the Fund and accounted for as an addition to paid in capital.
4. Purchases and Sales of Investments.
Purchases and sales of securities, other than short-term securities, aggregated $281,227,942 and $319,626,280, respectively.
5. Fees and Other Transactions with Affiliates.
Management Fee. Effective August 1, 2013, SelectCo replaced Fidelity Management & Research Company (FMR), an affiliate of SelectCo, as investment adviser to the Fund. The investment adviser and its affiliates provide the Fund with investment management related services for which the Fund pays a monthly management fee. The management fee is the sum of an individual fund fee rate that is based on an annual rate of .30% of the Fund's average net assets and an annualized group fee rate that averaged .25% during the period. The group fee rate is based upon the average net assets of all the mutual funds advised by FMR and the investment adviser. The group fee rate decreases as assets under management increase and increases as assets under management decrease. For the reporting period, the total annual management fee rate was .55% of the Fund's average net assets.
Distribution and Service Plan Fees. In accordance with Rule 12b-1 of the 1940 Act, the Fund has adopted a separate 12b-1 Plan for Service Class 2 shares. Service Class 2 pays Fidelity Distributors Corporation (FDC), an affiliate of the investment adviser, a service fee. For the period, the service fee is based on an annual rate of .25% of Service Class 2's average net assets.
For the period, total fees for Service Class 2, all of which was re-allowed to insurance companies for the distribution of shares and providing shareholder support services were $305,378.
Transfer Agent Fees. Fidelity Investments Institutional Operations Company, Inc. (FIIOC), an affiliate of the investment adviser, is the Fund's transfer, dividend disbursing, and shareholder servicing agent. FIIOC receives an asset-based fee with respect to each class. Each class (with the exception of Investor Class) pays a transfer agent fee, excluding out of pocket expenses, equal to an annual rate of .07% of average net assets. Investor Class pays a monthly asset-based transfer agent fee of .15% of average net assets. In addition, FIIOC receives an asset-based fee of .0035% of average net assets for typesetting, printing and mailing of shareholder reports, except proxy statements. FIIOC voluntarily agreed to reimburse or waive this fee for the period January 1, 2013 through December 31, 2013 (see Expense Reductions note). For the period, transfer agent fees for each class, including printing and out of pocket expenses, were as follows:
Initial Class | $ 69,548 |
Service Class 2 | 84,097 |
Investor Class | 153,761 |
| $ 307,406 |
Effective February 1, 2014, the Board of Trustees approved an amendment to the transfer agent fee agreement whereby each class (with the exception of Investor Class) pays a single fee of .07% of average net assets for transfer agent services, typesetting, printing and mailing of shareholder reports, excluding mailing of proxy statements and out of pocket expenses. Investor Class pays a single fee of .15% of average net assets.
Accounting and Security Lending Fees. Fidelity Service Company, Inc. (FSC), an affiliate of the investment adviser, maintains the Fund's accounting records. The accounting fee is based on the level of average net assets for each month. Under a separate contract, FSC administers the security lending program. The security lending fee is based on the number and duration of lending transactions.
Annual Report
5. Fees and Other Transactions with Affiliates - continued
Brokerage Commissions. The Fund placed a portion of its portfolio transactions with brokerage firms which are affiliates of the investment adviser. Brokerage commissions are included in net realized gain (loss) and change in net unrealized appreciation (depreciation) in the Statement of Operations. The commissions paid to these affiliated firms were $8,419 for the period.
Interfund Lending Program. Pursuant to an Exemptive Order issued by the SEC, the Fund, along with other registered investment companies having management contracts with Fidelity Management & Research Company (FMR) or other affiliated entities of FMR, may participate in an interfund lending program. This program provides an alternative credit facility allowing the funds to borrow from, or lend money to, other participating affiliated funds. The Fund's activity in this program during the period for which loans were outstanding was as follows:
Borrower or Lender | Average Loan
Balance | Weighted Average Interest Rate | Interest
Expense |
Borrower | $ 5,578,000 | .42% | $ 129 |
6. Committed Line of Credit.
The Fund participates with other funds managed by the investment adviser or an affiliate in a $4.25 billion credit facility (the "line of credit") to be utilized for temporary or emergency purposes to fund shareholder redemptions or for other short-term liquidity purposes. The Fund has agreed to pay commitment fees on its pro-rata portion of the line of credit, which amounted to $692 and is reflected in Miscellaneous expenses on the Statement of Operations. During the period, there were no borrowings on this line of credit.
7. Security Lending.
The Fund lends portfolio securities through a lending agent from time to time in order to earn additional income. For equity securities, a lending agent is used and may loan securities to certain qualified borrowers, which prior to August 1, 2013 included Fidelity Capital Markets (FCM), a broker-dealer affiliated with the Fund. On the settlement date of the loan, the Fund receives collateral (in the form of U.S. Treasury obligations, letters of credit and/or cash) against the loaned securities and maintains collateral in an amount not less than 100% of the market value of the loaned securities during the period of the loan. The market value of the loaned securities is determined at the close of business of the Fund and any additional required collateral is delivered to the Fund on the next business day. If the borrower defaults on its obligation to return the securities loaned because of insolvency or other reasons, the Fund may apply collateral received from the borrower against the obligation. The Fund may experience delays and costs in recovering the securities loaned. Any cash collateral received is invested in the Fidelity Securities Lending Cash Central Fund. The value of loaned securities and cash collateral at period end are disclosed on the Fund's Statement of Assets and Liabilities. At period end, there were no security loans outstanding with FCM. Security lending income represents the income earned on investing cash collateral, less rebates paid to borrowers and any lending agent fees associated with the loan, plus any premium payments received for lending certain types of securities. Security lending income is presented in the Statement of Operations as a component of income from Fidelity Central Funds. Total security lending income during the period amounted to $123,188, including $2,463 from securities loaned to FCM.
8. Expense Reductions.
The investment adviser or its affiliates agreed to reimburse or waive certain fees during the period as noted in the table below.
Initial Class | $ 3,827 |
Service Class 2 | 4,793 |
Investor Class | 3,944 |
| $ 12,564 |
Commissions paid to certain brokers with whom the investment adviser, or its affiliates, places trades on behalf of the Fund include an amount in addition to trade execution, which may be rebated back to the Fund to offset certain expenses. This amount totaled $13,350 for the period.
Annual Report
Notes to Financial Statements - continued
9. Distributions to Shareholders.
Distributions to shareholders of each class were as follows:
Years ended December 31, | 2013 | 2012 |
From net investment income | | |
Initial Class | $ 848,957 | $ 1,095,585 |
Service Class 2 | 873,309 | 892,430 |
Investor Class | 877,677 | 894,976 |
Total | $ 2,599,943 | $ 2,882,991 |
From net realized gain | | |
Initial Class | $ 558,971 | $ - |
Service Class 2 | 770,344 | - |
Investor Class | 629,664 | - |
Total | $ 1,958,979 | $ - |
10. Share Transactions.
Transactions for each class of shares were as follows:
| Shares | Dollars |
Years ended December 31, | 2013 | 2012 | 2013 | 2012 |
Initial Class | | | | |
Shares sold | 454,958 | 621,886 | $ 10,149,434 | $ 12,291,507 |
Reinvestment of distributions | 61,357 | 56,914 | 1,407,928 | 1,095,585 |
Shares redeemed | (1,539,411) | (2,458,244) | (34,100,951) | (47,201,779) |
Net increase (decrease) | (1,023,096) | (1,779,444) | $ (22,543,589) | $ (33,814,687) |
Service Class 2 | | | | |
Shares sold | 587,706 | 770,749 | $ 13,184,617 | $ 15,078,815 |
Reinvestment of distributions | 71,977 | 46,578 | 1,643,653 | 892,430 |
Shares redeemed | (1,003,296) | (1,808,109) | (22,009,470) | (34,633,984) |
Net increase (decrease) | (343,613) | (990,782) | $ (7,181,200) | $ (18,662,739) |
Investor Class | | | | |
Shares sold | 759,705 | 673,218 | $ 17,109,559 | $ 13,236,333 |
Reinvestment of distributions | 65,797 | 46,565 | 1,507,341 | 894,976 |
Shares redeemed | (1,039,455) | (1,708,016) | (22,803,005) | (32,649,524) |
Net increase (decrease) | (213,953) | (988,233) | $ (4,186,105) | $ (18,518,215) |
11. Other.
The Fund's organizational documents provide former and current trustees and officers with a limited indemnification against liabilities arising in connection with the performance of their duties to the Fund. In the normal course of business, the Fund may also enter into contracts that provide general indemnifications. The Fund's maximum exposure under these arrangements is unknown as this would be dependent on future claims that may be made against the Fund. The risk of material loss from such claims is considered remote.
At the end of the period, the investment adviser or its affiliates were the owners of record of 60% of the total outstanding shares of the Fund and one otherwise unaffiliated shareholder was the owner of record of 39% of the total outstanding shares of the Fund.
Annual Report
Report of Independent Registered Public Accounting Firm
To the Trustees of Variable Insurance Products Fund IV and the Shareholders of VIP Energy Portfolio:
In our opinion, the accompanying statement of assets and liabilities, including the schedule of investments, and the related statements of operations and of changes in net assets and the financial highlights present fairly, in all material respects, the financial position of VIP Energy Portfolio (a fund of Variable Insurance Products Fund IV) at December 31, 2013, the results of its operations for the year then ended, the changes in its net assets for each of the two years in the period then ended and the financial highlights for each of the five years in the period then ended, in conformity with accounting principles generally accepted in the United States of America. These financial statements and financial highlights (hereafter referred to as "financial statements") are the responsibility of the VIP Energy Portfolio's management. Our responsibility is to express an opinion on these financial statements based on our audits. We conducted our audits of these financial statements in accordance with the standards of the Public Company Accounting Oversight Board (United States). Those standards require that we plan and perform the audit to obtain reasonable assurance about whether the financial statements are free of material misstatement. An audit includes examining, on a test basis, evidence supporting the amounts and disclosures in the financial statements, assessing the accounting principles used and significant estimates made by management, and evaluating the overall financial statement presentation. We believe that our audits, which included confirmation of securities at December 31, 2013 by correspondence with the custodian and brokers, provide a reasonable basis for our opinion.
PricewaterhouseCoopers LLP
Boston, Massachusetts
February 14, 2014
Annual Report
The Trustees and officers of the trust and fund, as applicable, are listed below. The Board of Trustees governs the fund and is responsible for protecting the interests of shareholders. The Trustees are experienced executives who meet periodically throughout the year to oversee the fund's activities, review contractual arrangements with companies that provide services to the fund, oversee management of the risks associated with such activities and contractual arrangements, and review the fund's performance. Ned C. Lautenbach, Ronald P. O'Hanley, and William S. Stavropoulos each oversees 247 funds. David A. Rosow, Garnett A. Smith, and Michael E. Wiley each oversees 74 funds.
The Trustees hold office without limit in time except that (a) any Trustee may resign; (b) any Trustee may be removed by written instrument, signed by at least two-thirds of the number of Trustees prior to such removal; (c) any Trustee who requests to be retired or who has become incapacitated by illness or injury may be retired by written instrument signed by a majority of the other Trustees; and (d) any Trustee may be removed at any special meeting of shareholders by a two-thirds vote of the outstanding voting securities of the trust. The officers hold office without limit in time, except that any officer may resign or may be removed by a vote of a majority of the Trustees at any regular meeting or any special meeting of the Trustees. Except as indicated, each individual has held the office shown or other offices in the same company for the past five years.
Experience, Skills, Attributes, and Qualifications of the Fund's Trustees. The Governance and Nominating Committee has adopted a statement of policy that describes the experience, qualifications, attributes, and skills that are necessary and desirable for potential Independent Trustee candidates (Statement of Policy). The Board believes that each Trustee satisfied at the time he or she was initially elected or appointed a Trustee, and continues to satisfy, the standards contemplated by the Statement of Policy. The Governance and Nominating Committee also engages professional search firms to help identify potential Independent Trustee candidates who have the experience, qualifications, attributes, and skills consistent with the Statement of Policy. From time to time, additional criteria based on the composition and skills of the current Independent Trustees, as well as experience or skills that may be appropriate in light of future changes to board composition, business conditions, and regulatory or other developments, have also been considered by the professional search firms and the Governance and Nominating Committee. In addition, the Board takes into account the Trustees' commitment and participation in Board and committee meetings, as well as their leadership of standing and ad hoc committees throughout their tenure.
In determining that a particular Trustee was and continues to be qualified to serve as a Trustee, the Board has considered a variety of criteria, none of which, in isolation, was controlling. The Board believes that, collectively, the Trustees have balanced and diverse experience, qualifications, attributes, and skills, which allow the Board to operate effectively in governing the fund and protecting the interests of shareholders. Information about the specific experience, skills, attributes, and qualifications of each Trustee, which in each case led to the Board's conclusion that the Trustee should serve (or continue to serve) as a trustee of the fund, is provided below.
Board Structure and Oversight Function. Ronald P. O'Hanley is an interested person (as defined in the 1940 Act) and currently serves as Chairman. The Trustees have determined that an interested Chairman is appropriate and benefits shareholders because an interested Chairman has a personal and professional stake in the quality and continuity of services provided to the fund. Independent Trustees exercise their informed business judgment to appoint an individual of their choosing to serve as Chairman, regardless of whether the Trustee happens to be independent or a member of management. The Independent Trustees have determined that they can act independently and effectively without having an Independent Trustee serve as Chairman and that a key structural component for assuring that they are in a position to do so is for the Independent Trustees to constitute a substantial majority for the Board. The Independent Trustees also regularly meet in executive session. Michael E. Wiley serves as Chairman of the Independent Trustees and as such (i) acts as a liaison between the Independent Trustees and management with respect to matters important to the Independent Trustees and (ii) with management prepares agendas for Board meetings.
Fidelity funds are overseen by different Boards of Trustees. The fund's Board oversees Fidelity's sector portfolios. Other Boards oversee Fidelity's equity and high income funds, and Fidelity's investment grade bond, money market, and asset allocation funds. The use of separate Boards, each with its own committee structure, allows the Trustees of each group of Fidelity funds to focus on the unique issues of the funds they oversee, including common research, investment, and operational issues. On occasion, the separate Boards establish joint committees to address issues of overlapping consequences for the Fidelity funds overseen by each Board.
The Trustees operate using a system of committees to facilitate the timely and efficient consideration of all matters of importance to the Trustees, the fund, and fund shareholders and to facilitate compliance with legal and regulatory requirements and oversight of the fund's activities and associated risks. The Board, acting through its committees, has charged SelectCo and its affiliates with (i) identifying events or circumstances the occurrence of which could have demonstrably adverse effects on the fund's business and/or reputation; (ii) implementing processes and controls to lessen the possibility that such events or circumstances occur or to mitigate the effects of such events or circumstances if they do occur; and (iii) creating and maintaining a system designed to evaluate continuously business and market conditions in order to facilitate the identification and implementation processes described in (i) and (ii) above. Because the day-to-day operations and activities of the fund are carried out by or through SelectCo, its affiliates, and other service providers, the fund's exposure to risks is mitigated but not eliminated by the processes overseen by the Trustees. While each of the Board's committees has responsibility for overseeing different aspects of the fund's activities, oversight is exercised primarily through the Operations and Audit Committees. Appropriate personnel, including but not limited to the fund's Chief Compliance Officer (CCO), SelectCo's internal auditor, the independent accountants, the fund's Treasurer and portfolio management personnel, make periodic reports to the Board's committees, as appropriate. The responsibilities of each standing committee, including their oversight responsibilities, are described further under "Standing Committees of the Fund's Trustees."
The fund's Statement of Additional Information (SAI) includes more information about the Trustees. To request a free copy, call Fidelity at 1-877-208-0098.
Annual Report
Interested Trustee*:
Correspondence intended for the Trustee who is an interested person may be sent to Fidelity Investments, 245 Summer Street, Boston, Massachusetts 02210.
Name, Year of Birth; Principal Occupations and Other Relevant Experience+ |
Ronald P. O'Hanley (1957) |
Year of Election or Appointment: 2011 Trustee Chairman of the Board of Trustees |
| Mr. O'Hanley also serves as Trustee of other Fidelity funds. He is Director of Fidelity SelectCo, LLC (2013-present), FMR Co., Inc. (2010-present), Director of Fidelity Investments Money Management, Inc. (2010-present), Director of Fidelity Research & Analysis Company (2010-present), President of Fidelity Asset Management and Corporate Services and a Member of Fidelity's Executive Committee (2010-present). Previously, Mr. O'Hanley served as President and Chief Executive Officer of BNY Mellon Asset Management (2007-2010). Mr. O'Hanley also served as Vice Chairman of Bank New York Mellon Corp. and a member of that firm's Executive Committee. Prior to the 2007 merger of The Bank of New York and Mellon Financial Corporation, he was Vice Chairman of Mellon Financial Corporation and President and Chief Executive Officer of Mellon Asset Management. He joined Mellon in February 1997. Mr. O'Hanley currently serves as Chairman of the Boston Public Library Foundation Board of Directors and sits on the Board of Directors of Beth Israel Deaconess Medical Center, the Board of Trustees of the Marine Biological Laboratory and the Advisory Board of the Maxwell School of Citizenship and Public Administration at Syracuse University. Mr. O'Hanley also chairs the Council on Asset Management for the Financial Services Roundtable and is a member of the Board of Directors of Institutional Investor's U.S. Institute. |
* Trustee has been determined to be an "Interested Trustee" by virtue of, among other things, his affiliation with the trust or various entities under common control with SelectCo.
+ The information above includes the Trustee's principal occupation during the last five years and other information relating to the experience, attributes, and skills relevant to the Trustee's qualifications to serve as a Trustee, which led to the conclusion that the Trustee should serve as a Trustee for the fund.
Independent Trustees:
Correspondence intended for each Independent Trustee (that is, the Trustees other than the Interested Trustee) may be sent to Fidelity Investments, P.O. Box 55235, Boston, Massachusetts 02205-5235.
Name, Year of Birth; Principal Occupations and Other Relevant Experience+ |
Ned C. Lautenbach (1944) |
Year of Election or Appointment: 2000 Trustee |
| Mr. Lautenbach also serves as Trustee of other Fidelity funds. Mr. Lautenbach currently serves as the Lead Director of the Eaton Corporation Board of Directors (diversified industrial, 1997-present). Mr. Lautenbach is Chairman of the Board of Directors of the Philharmonic Center for the Arts in Naples, Florida (2012-present) and a member of the Council on Foreign Relations (1994-present). Previously, Mr. Lautenbach was a Partner/Advisory Partner at Clayton, Dubilier & Rice, LLC (private equity investment, 1998-2010), as well as a Director of Sony Corporation (2006-2007). |
David A. Rosow (1942) |
Year of Election or Appointment: 2013 Trustee |
| Mr. Rosow also serves as Trustee of other Fidelity funds. Mr. Rosow is Chairman and Chief Executive Officer of International Golf Group, Inc. (golf course development, 1989-present). Previously, Mr. Rosow served as Chairman and Chief Executive Officer of Rosow & Company, Inc. (private investment company, 1989-2011), a Lead Director of Hudson United Bancorp (2001-2006) and as a Director of TD Banknorth (1996-2006). In addition, Mr. Rosow is a member (2008-present) and President (2009-present) of the Town Council of Palm Beach, Florida. Mr. Rosow served as a Member of the Advisory Board of other Fidelity funds (2012-2013). |
Garnett A. Smith (1947) |
Year of Election or Appointment: 2013 Trustee |
| Mr. Smith also serves as Trustee of other Fidelity funds. Prior to Mr. Smith's retirement, he served as Chairman and Chief Executive Officer of Inbrand Corp. (manufacturer of personal absorbent products, 1990-1997). He also served as President (1986-1990) of Inbrand Corp. Prior to his employment with Inbrand Corp., he was employed by a retail fabric chain and North Carolina National Bank. In addition, Mr. Smith is a board member of the Jackson Hole Land Trust (2009-present). Mr. Smith served as a Member of the Advisory Board of other Fidelity funds (2012-2013). |
William S. Stavropoulos (1939) |
Year of Election or Appointment: 2001 Trustee |
| Mr. Stavropoulos also serves as Trustee of other Fidelity funds. Mr. Stavropoulos serves as President and Founder of the Michigan Baseball Foundation, the Great Lakes Loons (2007-present). Mr. Stavropoulos is Chairman Emeritus of the Board of Directors of The Dow Chemical Company, where he previously served in numerous senior management positions, including President, CEO (1995-2000; 2002-2004), Chairman of the Executive Committee (2000-2006), and as a member of the Board of Directors (1990-2006). Currently, Mr. Stavropoulos is Chairman of the Board of Directors of Univar Inc. (global distributor of commodity and specialty chemicals), a Director of Teradata Corporation (data warehousing and technology solutions), and Maersk Inc. (industrial conglomerate), and a member of the Advisory Board for Metalmark Capital LLC (private equity investment, 2005-present). Mr. Stavropoulos is an operating advisor to Clayton, Dubilier & Rice, LLC (private equity investment). In addition, Mr. Stavropoulos is a member of the University of Notre Dame Advisory Council for the College of Science, a Trustee of the Rollin L. Gerstacker Foundation, and a Director of the Naples Philharmonic Center for the Arts. Previously, Mr. Stavropoulos served as a Director of Chemical Financial Corporation (bank holding company, 1993-2012) and Tyco International, Ltd. (multinational manufacturing and services, 2007-2012). |
Michael E. Wiley (1950) |
Year of Election or Appointment: 2008 Trustee Chairman of the Independent Trustees |
| Mr. Wiley also serves as Trustee of other Fidelity funds. Mr. Wiley serves as a Director of Asia Pacific Exploration Consolidated (international oil and gas exploration and production, 2008-present). Mr. Wiley serves as a Director of Tesoro Corporation (independent oil refiner and marketer, 2005-present), and a Director of Bill Barrett Corporation (exploration and production, 2005-present). In addition, Mr. Wiley also serves as a Director of Post Oak Bank (privately-held bank, 2004-present). Previously, Mr. Wiley served as a Trustee of other Fidelity funds (2008-2013), as a member of the Board of Trustees of the University of Tulsa (2000-2006; 2007-2010), as a Senior Energy Advisor of Katzenbach Partners, LLC (consulting, 2006-2007), as an Advisory Director of Riverstone Holdings (private investment), Chairman, President, and CEO of Baker Hughes, Inc. (oilfield services, 2000-2004), and as Director of Spinnaker Exploration Company (exploration and production, 2001-2005). |
+ The information above includes each Trustee's principal occupation during the last five years and other information relating to the experience, attributes, and skills relevant to each Trustee's qualifications to serve as a Trustee, which led to the conclusion that each Trustee should serve as a Trustee for the fund.
Officers:
Except for Anthony R. Rochte, correspondence intended for each officer may be sent to Fidelity Investments, 245 Summer Street, Boston, Massachusetts 02210. Correspondence intended for Mr. Rochte may be sent to SelectCo, 1225 17th Street, Denver, Colorado 80202-5541. Officers appear below in alphabetical order.
Name, Year of Birth; Principal Occupation |
Christopher S. Bartel (1971) |
Year of Election or Appointment: 2009 Vice President |
| Mr. Bartel also serves as Vice President of other funds. Mr. Bartel serves as a Director, President, and Chief Executive Officer of Fidelity Management & Research (Japan) Inc. (2012-present), a Director of Fidelity Management & Research (Hong Kong) (2012-present), and Senior Vice President of Global Equity Research (2010-present). Previously, Mr. Bartel served as Senior Vice President of Equity Research (2009-2010), Managing Director of Research (2006-2009), and an analyst and portfolio manager (2000-2006). |
Elizabeth Paige Baumann (1968) |
Year of Election or Appointment: 2012 Anti-Money Laundering (AML) Officer |
| Ms. Baumann also serves as AML Officer of other funds. She is Chief AML Officer of FMR LLC (2012-present) and is an employee of Fidelity Investments. Previously, Ms. Baumann served as Vice President and Deputy Anti-Money Laundering Officer (2007-2012). |
Marc Bryant (1966) |
Year of Election or Appointment: 2013 Secretary and Chief Legal Officer (CLO) |
| Mr. Bryant also serves as an officer of other funds. He is Senior Vice President and Deputy General Counsel of FMR LLC. Prior to joining Fidelity Investments, Mr. Bryant served as a Senior Vice President and the Head of Global Retail Legal for AllianceBernstein L.P. (2006-2010), and as the General Counsel for ProFund Advisors LLC (2001-2006). |
William C. Coffey (1969) |
Year of Election or Appointment: 2009 Assistant Secretary |
| Mr. Coffey also serves as Assistant Secretary of other funds. He is Senior Vice President and Deputy General Counsel of FMR LLC (2010-present), and is an employee of Fidelity Investments. Previously, Mr. Coffey served as Vice President and Associate General Counsel of FMR LLC (2005-2009). |
Jonathan Davis (1968) |
Year of Election or Appointment: 2010 Assistant Treasurer |
| Mr. Davis also serves as Assistant Treasurer of other funds. Mr. Davis is an employee of Fidelity Investments. Previously, Mr. Davis served as Vice President and Associate General Counsel of FMR LLC (2003-2010). |
Adrien E. Deberghes (1967) |
Year of Election or Appointment: 2013 President and Treasurer |
| Mr. Deberghes also serves as an officer of other funds. He is an employee of Fidelity Investments (2008-present). Prior to joining Fidelity Investments, Mr. Deberghes was Senior Vice President of Mutual Fund Administration at State Street Corporation (2007-2008), Senior Director of Mutual Fund Administration at Investors Bank & Trust (2005-2007), and Director of Finance for Dunkin' Brands (2000-2005). |
Stephanie J. Dorsey (1969) |
Year of Election or Appointment: 2010 Assistant Treasurer |
| Ms. Dorsey also serves as an officer of other funds. She is an employee of Fidelity Investments (2008-present) and has served in other fund officer roles. Prior to joining Fidelity Investments, Ms. Dorsey served as Treasurer (2004-2008) of the JPMorgan Mutual Funds and Vice President (2004-2008) of JPMorgan Chase Bank. |
Joseph A. Hanlon (1968) |
Year of Election or Appointment: 2012 Chief Compliance Officer |
| Mr. Hanlon also serves as Chief Compliance Officer of other funds. Mr. Hanlon serves as Compliance Officer of FMR, FMR Co., Inc., Fidelity Investments Money Management, Inc. (FIMM), Fidelity Research and Analysis Company (FRAC), and Fidelity Management & Research (Hong Kong) (2009-present), as Senior Vice President of the Fidelity Asset Management Division (2009-present), and is an employee of Fidelity Investments. Previously, Mr. Hanlon served as Compliance Officer of Fidelity Management & Research (Japan) Inc. (2009-2013), Strategic Advisers, Inc. (2009-2013), and Fidelity Management & Research (U.K.) Inc. (2009-2013). |
Brian B. Hogan (1964) |
Year of Election or Appointment: 2009 Vice President |
| Mr. Hogan also serves as Vice President of other funds. Mr. Hogan serves as President of FMR's Equity Division (2009-present). Previously, Mr. Hogan served as Senior Vice President, Equity Research of FMR (2006-2009) and as a portfolio manager. |
Chris Maher (1972) |
Year of Election or Appointment: 2013 Assistant Treasurer |
| Mr. Maher serves as Assistant Treasurer of other funds. Mr. Maher is Vice President of Valuation Oversight and is an employee of Fidelity Investments. Previously, Mr. Maher served as Vice President of Asset Management Compliance (2013), Vice President of FMR's Program Management Group (2010-2013), and Vice President of Valuation Oversight (2008-2010). |
Christine Reynolds (1958) |
Year of Election or Appointment: 2008 Chief Financial Officer |
| Ms. Reynolds also serves as Chief Financial Officer of other funds. Ms. Reynolds became President of Fidelity Pricing and Cash Management Services (FPCMS) in August 2008. Ms. Reynolds served as Chief Operating Officer of FPCMS (2007-2008). Previously, Ms. Reynolds served as President, Treasurer, and Anti-Money Laundering officer of the Fidelity funds (2004-2007). |
Kenneth B. Robins (1969) |
Year of Election or Appointment: 2013 Deputy Treasurer |
| Mr. Robins also serves as an officer of other funds. Mr. Robins serves as Executive Vice President of Fidelity Investments Money Management, Inc. (FIMM) (2013-present) and is an employee of Fidelity Investments (2004-present). Previously, Mr. Robins served in other fund officer roles. |
Anthony R. Rochte (1968) |
Year of Election or Appointment: 2013 Vice President |
| Mr. Rochte also serves as Vice President of other funds. Mr. Rochte serves as President of Fidelity SelectCo, LLC (2012-present) and is an employee of Fidelity Investments (2012-present). Prior to joining Fidelity Investments, Mr. Rochte served as Senior Managing Director and head of State Street Global Advisors' North American Intermediary Business Group (2006-2012). |
Stacie M. Smith (1974) |
Year of Election or Appointment: 2013 Assistant Treasurer |
| Ms. Smith also serves as an officer of other funds. She is an employee of Fidelity Investments (2009-present) and has served in other fund officer roles. Prior to joining Fidelity Investments, Ms. Smith served as Senior Audit Manager of Ernst & Young LLP (1996-2009). |
Renee Stagnone (1975) |
Year of Election or Appointment: 2013 Deputy Treasurer |
| Ms. Stagnone also serves as Deputy Treasurer of other funds. Ms. Stagnone is an employee of Fidelity Investments. |
Joseph F. Zambello (1957) |
Year of Election or Appointment: 2011 Deputy Treasurer |
| Mr. Zambello also serves as Deputy Treasurer of other funds. Mr. Zambello is an employee of Fidelity Investments. Previously, Mr. Zambello served as Vice President of FMR's Program Management Group (2009-2011) and Vice President of the Transfer Agent Oversight Group (2005-2009). |
Annual Report
The Board of Trustees of VIP Energy Portfolio voted to pay to shareholders of record at the opening of business on record date, the following distributions per share derived from capital gains realized from sales of portfolio securities:
| Pay Date | Record Date | Capital Gains |
Service Class 2 | 02/14/14 | 02/14/14 | $0.135 |
The fund hereby designates as a capital gain dividend with respect to the taxable year ended December 31, 2013, $3,616,421, or, if subsequently determined to be different, the net capital gain of such year.
Service Class 2 designates 100% of the dividends distributed during the fiscal year as qualifying for the dividends-received deduction for corporate shareholders.
Annual Report
A special meeting of Energy Portfolio's shareholders was held on May 14, 2013. The results of votes taken among shareholders on the proposals before them are reported below. Each vote reported represents one dollar of net asset value held on the record date for the meeting.
PROPOSAL 1 |
To elect a Board of Trustees.A |
| # of
Votes | % of
Votes |
Ned C. Lautenbach |
Affirmative | 1,555,133,782.46 | 93.955 |
Withheld | 100,063,694.32 | 6.045 |
TOTAL | 1,655,197,476.78 | 100.000 |
Ronald P. O'Hanley |
Affirmative | 1,557,988,095.28 | 94.128 |
Withheld | 97,209,381.50 | 5.872 |
TOTAL | 1,655,197,476.78 | 100.000 |
David A. Rosow |
Affirmative | 1,552,645,347.31 | 93.805 |
Withheld | 102,552,129.47 | 6.195 |
TOTAL | 1,655,197,476.78 | 100.000 |
Garnett A. Smith |
Affirmative | 1,554,582,880.53 | 93.922 |
Withheld | 100,614,596.25 | 6.078 |
TOTAL | 1,655,197,476.78 | 100.000 |
William S. Stavropoulos |
Affirmative | 1,548,352,452.21 | 93.545 |
Withheld | 106,845,024.57 | 6.455 |
TOTAL | 1,655,197,476.78 | 100.000 |
Michael E. Wiley |
Affirmative | 1,556,790,374.70 | 94.055 |
Withheld | 98,407,102.08 | 5.945 |
TOTAL | 1,655,197,476.78 | 100.000 |
PROPOSAL 2 |
To approve a management contract between the fund and Fidelity SelectCo, LLC. |
| # of
Votes | % of
Votes |
Affirmative | 287,261,557.88 | 90.277 |
Against | 11,605,272.64 | 3.647 |
Abstain | 19,335,092.44 | 6.076 |
TOTAL | 318,201,922.96 | 100.000 |
A Denotes trust-wide proposal and voting results. |
Annual Report
Investment Adviser
Fidelity SelectCo, LLC
Denver, CO
Investment Sub-Advisers
FMR Co., Inc.
Fidelity Management & Research (U.K.) Inc.
Fidelity Management & Research (Hong Kong) Limited
Fidelity Management & Research (Japan) Inc.
General Distributor
Fidelity Distributors Corporation
Smithfield, RI
Transfer and Service Agents
Fidelity Investments Institutional Operations Company, Inc.
Boston, MA
Fidelity Service Company, Inc.
Boston, MA
Custodian
State Street Bank and Trust Company
Quincy, MA
VNR2-ANN-0214
1.826359.109
Fidelity® Variable Insurance Products:
Energy Portfolio
Annual Report
December 31, 2013
(Fidelity Cover Art)
Contents
Performance | (Click Here) | How the fund has done over time. |
Management's Discussion of Fund Performance | (Click Here) | The Portfolio Manager's review of fund performance and strategy. |
Shareholder Expense Example | (Click Here) | An example of shareholder expenses. |
Investment Changes | (Click Here) | A summary of major shifts in the fund's investments over the past six months. |
Investments | (Click Here) | A complete list of the fund's investments with their market values. |
Financial Statements | (Click Here) | Statements of assets and liabilities, operations, and changes in net assets, as well as financial highlights. |
Notes | (Click Here) | Notes to the financial statements. |
Report of Independent Registered Public Accounting Firm | (Click Here) | |
Trustees and Officers | (Click Here) | |
Distributions | (Click Here) | |
Proxy Voting Results | (Click Here) | |
To view a fund's proxy voting guidelines and proxy voting record for the 12-month period ended June 30, visit http://www.fidelity.com/proxyvotingresults or visit the Securities and Exchange Commission's (SEC) web site at http://www.sec.gov. You may also call 1-877-208-0098 to request a free copy of the proxy voting guidelines.
Fidelity Variable Insurance Products are separate account options which are purchased through a variable insurance contract.
Standard & Poor's, S&P and S&P 500 are registered service marks of The McGraw-Hill Companies, Inc. and have been licensed for use by Fidelity Distributors Corporation.
Other third-party marks appearing herein are the property of their respective owners.
All other marks appearing herein are registered or unregistered trademarks or service marks of FMR LLC or an affiliated company. © 2014 FMR LLC. All rights reserved.
This report and the financial statements contained herein are submitted for the general information of the shareholders of the fund. This report is not authorized for distribution to prospective investors in the fund unless preceded or accompanied by an effective prospectus.
A fund files its complete schedule of portfolio holdings with the SEC for the first and third quarters of each fiscal year on Form N-Q. Forms N-Q are available on the SEC's web site at http://www.sec.gov. A fund's Forms N-Q may be reviewed and copied at the SEC's Public Reference Room in Washington, DC. Information regarding the operation of the SEC's Public Reference Room may be obtained by calling 1-800-SEC-0330. For a complete list of a fund's portfolio holdings, view the most recent holdings listing, semiannual report, or annual report on Fidelity's web site at http://www.fidelity.com, http://www.advisor.fidelity.com, or http://www.401k.com, as applicable.
NOT FDIC INSURED • MAY LOSE VALUE • NO BANK GUARANTEE
Neither the fund nor Fidelity Distributors Corporation is a bank.
Annual Report
Average annual total return reflects the change in the value of an investment, assuming reinvestment of the class' distributions from dividend income and capital gains (the profits earned upon the sale of securities that have grown in value, if any) and assuming a constant rate of performance each year. During periods of reimbursement by Fidelity, a fund's total return will be greater than it would be had the reimbursement not occurred. Performance numbers are net of all underlying fund operating expenses, but do not include any insurance charges imposed by your insurance company's separate account. If performance information included the effect of these additional charges, the total returns would have been lower. How a fund did yesterday is no guarantee of how it will do tomorrow.
Average Annual Total Returns
Periods ended December 31, 2013 | Past 1
year | Past 5
years | Past 10
years |
VIP Energy Portfolio - Initial Class A | 24.55% | 17.01% | 12.00% |
VIP Energy Portfolio - Investor ClassA,B | 24.45% | 16.91% | 11.90% |
A Prior to October 1, 2006, VIP Energy Portfolio was named VIP Natural Resources Portfolio, and the fund operated under certain different investment policies and compared its performance to a different additional index. The fund's historical performance may not represent its current investment policies.
B The initial offering of Investor Class took place on July 21, 2005. Returns prior to July 21, 2005 are those of Initial Class. Had Investor Class's transfer agent fee had been reflected, returns prior to July 21, 2005 would have been lower.
$10,000 Over 10 Years
Let's say hypothetically that $10,000 was invested in VIP Energy Portfolio - Initial Class on December 31, 2003. The chart shows how the value of your investment would have changed, and also shows how the S&P 500® Index performed over the same period.
Annual Report
Market Recap: Global equity markets remained upbeat for the 12 months ending December 31, 2013, propelling the MSCI® ACWI® (All Country World Index) Index to a 23.24% return. Midyear turbulence gave way by autumn when policymakers in the U.S. and China had made clear their intentions to maintain accommodative monetary policies. That stance, combined with modest cyclical improvement around the globe and generally low valuations, underpinned the broad rally in equities, although the relative strength of the U.S. dollar generally tempered gains for U.S. investors holding foreign securities based in local currencies. During the period, the broad-market S&P 500® Index set a series of new highs, finishing the year up 32.39%. For the first time since 1995, the S&P® scored a "perfect 10," with all 10 economic sectors gaining at least 10% for the year. A resurgence in growth-oriented stocks lifted the Nasdaq Composite Index® to a 40.12% result for 2013, while the blue-chip Dow Jones Industrial AverageSM notched a relatively more modest 29.65% gain. International developed-markets equities rose in concert with their U.S. counterparts, with the MSCI® EAFE® Index gaining 22.92% for the period. Meanwhile, foreign exchange and commodity weakness curbed results in resource-heavy emerging markets (EM), especially in the year's waning months. More generally, concern over EM's slowing growth, its declining share of global trade and uncertainty surrounding U.S. central bank intentions were all factors hampering performance. The MSCI Emerging Markets Index returned -2.27% for the period. On the bond side, U.S. high-yield securities rallied with equities for much of the period, with The BofA Merrill LynchSM US High Yield Constrained Index returning 7.41% for 2013. The more rate-sensitive U.S. investment-grade bond category faced headwinds though, as reflected in the -2.02% return of the Barclays® U.S. Aggregate Bond Index. Within the Barclays index, investment-grade corporate credit returned -2.01%, while ultra-safe U.S. Treasuries saw a -2.75% result. Major non-U.S. developed markets performed only slightly better, with the Citigroup Non-USD Group-of-Seven (G7) Equal Weighted Index logging a -1.59% result. After several years of strong advances, EM debt reversed course in 2013, with the J.P. Morgan Emerging Markets Bond Index Global returning -6.58%.
Comments from John Dowd, Portfolio Manager of VIP Energy Portfolio: For the year, the fund's share classes underperformed the 25.93% gain of the MSCI® U.S. IMI Energy 25-50 Index, and the broadly based S&P 500®. (For specific portfolio results, please refer to the performance section of this report.) Energy stocks benefited from big gains in equities overall, but fell short of the broader market due in part to muted global demand. Versus the MSCI sector benchmark, the fund's investments in drilling companies detracted, including an underweighting in Ensco, a U.K.-based offshore rig company that failed to deliver on earnings growth. Exploration & production (E&P) firms were a mixed bag, with Cobalt International Energy the fund's largest individual detractor. Investors didn't like the details behind the company's December announcement of a new geological discovery, and the stock sold off. A sizable stake in Anadarko Petroleum stung when its stock fell on a court ruling over its liability in an environmental clean-up case. Conversely, E&P firms Cimarex Energy and Pioneer Natural Resources contributed, as did energy service giant Haliburton and an underweighting in integrated oil company and benchmark heavyweight Exxon Mobil.
The views expressed above reflect those of the portfolio manager(s) only through the end of the period as stated on the cover of this report and do not necessarily represent the views of Fidelity or any other person in the Fidelity organization. Any such views are subject to change at any time based upon market or other conditions and Fidelity disclaims any responsibility to update such views. These views may not be relied on as investment advice and, because investment decisions for a Fidelity fund are based on numerous factors, may not be relied on as an indication of trading intent on behalf of any Fidelity fund.
Annual Report
As a shareholder of the Fund, you incur two types of costs: (1) transaction costs, including redemption fees and (2) ongoing costs, including management fees, distribution and/or service (12b-1) fees and other Fund expenses. This Example is intended to help you understand your ongoing costs (in dollars) of investing in the Fund and to compare these costs with the ongoing costs of investing in other mutual funds.
The Example is based on an investment of $1,000 invested at the beginning of the period and held for the entire period (July 1, 2013 to December 31, 2013).
Actual Expenses
The first line of the accompanying table for each class of the Fund provides information about actual account values and actual expenses. You may use the information in this line, together with the amount you invested, to estimate the expenses that you paid over the period. Simply divide your account value by $1,000.00 (for example, an $8,600 account value divided by $1,000.00 = 8.6), then multiply the result by the number in the first line for a class of the Fund under the heading entitled "Expenses Paid During Period" to estimate the expenses you paid on your account during this period. The estimate of expenses does not include any fees or other expenses of any variable annuity or variable life insurance product. If they were, the estimate of expenses you paid during the period would be higher, and your ending account value would be lower. In addition, the Fund, as a shareholder in the underlying Fidelity Central Funds, will indirectly bear its pro-rata share of the fees and expenses incurred by the underlying Fidelity Central Funds. These fees and expenses are not included in the Fund's annualized expense ratio used to calculate the expense estimate in the table below.
Hypothetical Example for Comparison Purposes
The second line of the accompanying table for each class of the Fund provides information about hypothetical account values and hypothetical expenses based on a Class' actual expense ratio and an assumed rate of return of 5% per year before expenses, which is not the Class' actual return. The hypothetical account values and expenses may not be used to estimate the actual ending account balance or expenses you paid for the period. You may use this information to compare the ongoing costs of investing in the Fund and other funds. To do so, compare this 5% hypothetical example with the 5% hypothetical examples that appear in the shareholder reports of the other funds. The estimate of expenses does not include any fees or other expenses of any variable annuity or variable life insurance product. If they were, the estimate of expenses you paid during the period would be higher, and your ending account value would be lower. In addition, the Fund, as a shareholder in the underlying Fidelity Central Funds, will indirectly bear its pro-rata share of the fees and expenses incurred by the underlying Fidelity Central Funds. These fees and expenses are not included in the Fund's annualized expense ratio used to calculate the expense estimate in the table below.
Please note that the expenses shown in the table are meant to highlight your ongoing costs only and do not reflect any transaction costs. Therefore, the second line of the table is useful in comparing ongoing costs only, and will not help you determine the relative total costs of owning different funds. In addition, if these transactional costs were included, your costs would have been higher.
| Annualized
Expense RatioB | Beginning
Account Value
July 1, 2013 | Ending
Account Value
December 31, 2013 | Expenses Paid
During Period*
July 1, 2013
to December 31, 2013 |
Initial Class | .70% | | | |
Actual | | $ 1,000.00 | $ 1,133.10 | $ 3.76 |
HypotheticalA | | $ 1,000.00 | $ 1,021.68 | $ 3.57 |
Service Class 2 | .95% | | | |
Actual | | $ 1,000.00 | $ 1,131.20 | $ 5.10 |
HypotheticalA | | $ 1,000.00 | $ 1,020.42 | $ 4.84 |
Investor Class | .78% | | | |
Actual | | $ 1,000.00 | $ 1,132.00 | $ 4.19 |
HypotheticalA | | $ 1,000.00 | $ 1,021.27 | $ 3.97 |
A 5% return per year before expenses
B Annualized expense ratio reflects expenses net of applicable fee waivers.
* Expenses are equal to each Class' annualized expense ratio, multiplied by the average account value over the period, multiplied by 184/365 (to reflect the one-half year period).
Annual Report
Investment Changes (Unaudited)
Top Ten Stocks as of December 31, 2013 |
| % of fund's
net assets | % of fund's net assets
6 months ago |
Chevron Corp. | 11.5 | 8.8 |
Exxon Mobil Corp. | 11.0 | 13.4 |
EOG Resources, Inc. | 7.1 | 3.6 |
Schlumberger Ltd. | 5.6 | 3.3 |
Anadarko Petroleum Corp. | 4.4 | 3.9 |
ConocoPhillips Co. | 4.3 | 0.0 |
National Oilwell Varco, Inc. | 3.4 | 4.3 |
Noble Energy, Inc. | 3.0 | 2.9 |
Cimarex Energy Co. | 2.9 | 1.1 |
Halliburton Co. | 2.8 | 5.2 |
| 56.0 | |
Top Industries (% of fund's net assets) |
As of December 31, 2013 |
 | Oil, Gas &Consumable Fuels | 76.9% | |
 | Energy Equipment & Services | 21.1% | |
 | Construction & Engineering | 0.3% | |
 | Metals & Mining | 0.1% | |
 | All Others* | 1.6% | |

As of June 30, 2013 |
| Oil, Gas &Consumable Fuels | 75.8% | |
 | Energy Equipment & Services | 22.3% | |
 | Chemicals | 1.3% | |
 | Hotels, Restaurants & Leisure | 0.0% | |
| Specialty Retail | 0.0% | |
| All Others* | 0.6% | |

* Includes short-term investments and net other assets (liabilities). |
Annual Report
Investments December 31, 2013
Showing Percentage of Net Assets
Common Stocks - 98.4% |
| Shares | | Value |
CONSTRUCTION & ENGINEERING - 0.3% |
Construction & Engineering - 0.3% |
URS Corp. | 15,081 | | $ 799,142 |
ENERGY EQUIPMENT & SERVICES - 21.1% |
Oil & Gas Drilling - 3.3% |
Ensco PLC Class A | 98,272 | | 5,619,193 |
Hercules Offshore, Inc. (a) | 55,355 | | 361,468 |
Noble Corp. | 50,070 | | 1,876,123 |
Odfjell Drilling A/S | 120,300 | | 719,979 |
Vantage Drilling Co. (a) | 855,519 | | 1,574,155 |
Xtreme Drilling & Coil Services Corp. (a) | 261,500 | | 891,156 |
| | 11,042,074 |
Oil & Gas Equipment & Services - 17.8% |
Cameron International Corp. (a) | 93,314 | | 5,554,982 |
Core Laboratories NV | 12,175 | | 2,324,816 |
FMC Technologies, Inc. (a) | 102,505 | | 5,351,786 |
Forum Energy Technologies, Inc. (a) | 72,001 | | 2,034,748 |
Halliburton Co. | 183,940 | | 9,334,955 |
National Oilwell Varco, Inc. | 142,405 | | 11,325,470 |
Oceaneering International, Inc. | 11,200 | | 883,456 |
Schlumberger Ltd. | 207,536 | | 18,701,069 |
Total Energy Services, Inc. | 27,900 | | 541,584 |
Weatherford International Ltd. (a) | 203,134 | | 3,146,546 |
| | 59,199,412 |
TOTAL ENERGY EQUIPMENT & SERVICES | | 70,241,486 |
METALS & MINING - 0.1% |
Diversified Metals & Mining - 0.1% |
U.S. Silica Holdings, Inc. | 10,700 | | 364,977 |
OIL, GAS & CONSUMABLE FUELS - 76.9% |
Coal & Consumable Fuels - 1.7% |
Alpha Natural Resources, Inc. (a) | 38,500 | | 274,890 |
Peabody Energy Corp. | 278,961 | | 5,448,108 |
| | 5,722,998 |
Integrated Oil & Gas - 28.1% |
Chevron Corp. | 306,438 | | 38,277,172 |
Exxon Mobil Corp. | 359,603 | | 36,391,824 |
Hess Corp. | 76,943 | | 6,386,269 |
Occidental Petroleum Corp. | 59,275 | | 5,637,053 |
Suncor Energy, Inc. | 188,500 | | 6,608,369 |
| | 93,300,687 |
Oil & Gas Exploration & Production - 39.6% |
Anadarko Petroleum Corp. | 185,034 | | 14,676,897 |
Bankers Petroleum Ltd. (a) | 475,100 | | 1,954,518 |
Bonanza Creek Energy, Inc. (a) | 63,627 | | 2,765,866 |
Cabot Oil & Gas Corp. | 193,678 | | 7,506,959 |
|
| Shares | | Value |
Cimarex Energy Co. | 91,387 | | $ 9,587,410 |
Cobalt International Energy, Inc. (a) | 168,302 | | 2,768,568 |
Concho Resources, Inc. (a) | 3,200 | | 345,600 |
ConocoPhillips Co. | 202,798 | | 14,327,679 |
Continental Resources, Inc. (a)(d) | 50,062 | | 5,632,976 |
Emerald Oil, Inc. (a) | 25,500 | | 195,330 |
Energen Corp. | 7,500 | | 530,625 |
EOG Resources, Inc. | 140,021 | | 23,501,125 |
EPL Oil & Gas, Inc. (a) | 29,282 | | 834,537 |
EQT Corp. | 54,274 | | 4,872,720 |
Evolution Petroleum Corp. | 5,622 | | 69,375 |
Gulfport Energy Corp. (a) | 26,335 | | 1,663,055 |
Halcon Resources Corp. (a) | 150,000 | | 579,000 |
Kodiak Oil & Gas Corp. (a) | 260,021 | | 2,914,835 |
Laredo Petroleum Holdings, Inc. (a) | 73,523 | | 2,035,852 |
Murphy Oil Corp. | 10,400 | | 674,752 |
Noble Energy, Inc. | 146,812 | | 9,999,365 |
Northern Oil & Gas, Inc. (a) | 92,107 | | 1,388,052 |
Oasis Petroleum, Inc. (a) | 12,778 | | 600,183 |
Painted Pony Petroleum Ltd. (a) | 63,475 | | 414,701 |
PDC Energy, Inc. (a) | 61,434 | | 3,269,517 |
Pioneer Natural Resources Co. | 40,365 | | 7,429,986 |
Rex Energy Corp. (a) | 730 | | 14,388 |
Rosetta Resources, Inc. (a) | 18,900 | | 907,956 |
Sanchez Energy Corp. (a) | 32,800 | | 803,928 |
SM Energy Co. | 50,838 | | 4,225,146 |
Synergy Resources Corp. (a) | 33,024 | | 305,802 |
TAG Oil Ltd. (a) | 202,500 | | 627,183 |
Tullow Oil PLC | 22,560 | | 319,413 |
Whiting Petroleum Corp. (a) | 62,800 | | 3,885,436 |
| | 131,628,735 |
Oil & Gas Refining & Marketing - 2.3% |
Marathon Petroleum Corp. | 47,703 | | 4,375,796 |
Phillips 66 Co. | 30,380 | | 2,343,209 |
Tesoro Corp. | 13,000 | | 760,500 |
| | 7,479,505 |
Oil & Gas Storage & Transport - 5.2% |
Access Midstream Partners LP | 72,860 | | 4,122,419 |
Atlas Pipeline Partners LP | 45,360 | | 1,589,868 |
Magellan Midstream Partners LP | 29,936 | | 1,894,051 |
Markwest Energy Partners LP | 22,802 | | 1,507,896 |
MPLX LP | 18,515 | | 824,658 |
Phillips 66 Partners LP | 29,175 | | 1,106,608 |
Spectra Energy Corp. | 24,438 | | 870,482 |
Targa Resources Corp. | 21,700 | | 1,913,289 |
The Williams Companies, Inc. | 91,155 | | 3,515,848 |
Valero Energy Partners LP | 1,400 | | 48,230 |
| | 17,393,349 |
TOTAL OIL, GAS & CONSUMABLE FUELS | | 255,525,274 |
TOTAL COMMON STOCKS (Cost $268,122,995) |
326,930,879
|
Money Market Funds - 3.3% |
| Shares | | Value |
Fidelity Cash Central Fund, 0.11% (b) | 5,471,559 | | $ 5,471,559 |
Fidelity Securities Lending Cash Central Fund, 0.11% (b)(c) | 5,594,550 | | 5,594,550 |
TOTAL MONEY MARKET FUNDS (Cost $11,066,109) |
11,066,109
|
TOTAL INVESTMENT PORTFOLIO - 101.7% (Cost $279,189,104) | | 337,996,988 |
NET OTHER ASSETS (LIABILITIES) - (1.7)% | | (5,618,650) |
NET ASSETS - 100% | $ 332,378,338 |
Legend |
(a) Non-income producing |
(b) Affiliated fund that is generally available only to investment companies and other accounts managed by Fidelity Investments. The rate quoted is the annualized seven-day yield of the fund at period end. A complete unaudited listing of the fund's holdings as of its most recent quarter end is available upon request. In addition, each Fidelity Central Fund's financial statements, which are not covered by the Fund's Report of Independent Registered Public Accounting Firm, are available on the SEC's website or upon request. |
(c) Investment made with cash collateral received from securities on loan. |
(d) Security or a portion of the security is on loan at period end. |
Affiliated Central Funds |
Information regarding fiscal year to date income earned by the Fund from investments in Fidelity Central Funds is as follows: |
Fund | Income earned |
Fidelity Cash Central Fund | $ 4,037 |
Fidelity Securities Lending Cash Central Fund | 123,188 |
Total | $ 127,225 |
Other Information |
All investments are categorized as Level 1 under the Fair Value Hierarchy. The inputs or methodology used for valuing securities may not be an indication of the risk associated with investing in those securities. For more information on valuation inputs, please refer to the Investment Valuation section in the accompanying Notes to Financial Statements. |
Distribution of investments by country or territory of incorporation, as a percentage of total net assets, is as follows (Unaudited): |
United States of America | 85.5% |
Curacao | 5.6% |
Canada | 4.3% |
United Kingdom | 2.3% |
Others (Individually Less Than 1%) | 2.3% |
| 100.0% |
See accompanying notes which are an integral part of the financial statements.
Annual Report
Statement of Assets and Liabilities
| December 31, 2013 |
| | |
Assets | | |
Investment in securities, at value (including securities loaned of $5,558,488) - See accompanying schedule: Unaffiliated issuers (cost $268,122,995) | $ 326,930,879 | |
Fidelity Central Funds (cost $11,066,109) | 11,066,109 | |
Total Investments (cost $279,189,104) | | $ 337,996,988 |
Receivable for fund shares sold | | 331,726 |
Dividends receivable | | 112,833 |
Distributions receivable from Fidelity Central Funds | | 2,788 |
Prepaid expenses | | 2,315 |
Other receivables | | 2,074 |
Total assets | | 338,448,724 |
| | |
Liabilities | | |
Payable for investments purchased | $ 28,782 | |
Payable for fund shares redeemed | 196,772 | |
Accrued management fee | 149,612 | |
Distribution and service plan fees payable | 26,607 | |
Other affiliated payables | 35,820 | |
Other payables and accrued expenses | 38,243 | |
Collateral on securities loaned, at value | 5,594,550 | |
Total liabilities | | 6,070,386 |
| | |
Net Assets | | $ 332,378,338 |
Net Assets consist of: | | |
Paid in capital | | $ 272,677,925 |
Distributions in excess of net investment income | | (395,249) |
Accumulated undistributed net realized gain (loss) on investments and foreign currency transactions | | 1,287,776 |
Net unrealized appreciation (depreciation) on investments and assets and liabilities in foreign currencies | | 58,807,886 |
Net Assets | | $ 332,378,338 |
Statement of Assets and Liabilities - continued
| December 31, 2013 |
| | |
Initial Class:
Net Asset Value, offering price and redemption price per share ($94,201,793 ÷ 3,934,036 shares) | | $ 23.95 |
| | |
Service Class 2:
Net Asset Value, offering price and redemption price per share ($130,099,998 ÷ 5,459,610 shares) | | $ 23.83 |
| | |
Investor Class:
Net Asset Value, offering price and redemption price per share ($108,076,547 ÷ 4,522,435 shares) | | $ 23.90 |
See accompanying notes which are an integral part of the financial statements.
Annual Report
Statement of Operations
| Year ended December 31, 2013 |
| | |
Investment Income | | |
Dividends | | $ 4,904,272 |
Income from Fidelity Central Funds | | 127,225 |
Total income | | 5,031,497 |
| | |
Expenses | | |
Management fee | $ 1,772,177 | |
Transfer agent fees | 307,406 | |
Distribution and service plan fees | 305,378 | |
Accounting and security lending fees | 125,299 | |
Custodian fees and expenses | 32,178 | |
Independent trustees' compensation | 5,048 | |
Audit | 38,597 | |
Legal | 5,206 | |
Interest | 129 | |
Miscellaneous | 22,332 | |
Total expenses before reductions | 2,613,750 | |
Expense reductions | (25,914) | 2,587,836 |
Net investment income (loss) | | 2,443,661 |
Realized and Unrealized Gain (Loss) Net realized gain (loss) on: | | |
Investment securities: | | |
Unaffiliated issuers | 29,992,607 | |
Foreign currency transactions | 240 | |
Total net realized gain (loss) | | 29,992,847 |
Change in net unrealized appreciation (depreciation) on: Investment securities | 36,397,407 | |
Assets and liabilities in foreign currencies | 126 | |
Total change in net unrealized appreciation (depreciation) | | 36,397,533 |
Net gain (loss) | | 66,390,380 |
Net increase (decrease) in net assets resulting from operations | | $ 68,834,041 |
Statement of Changes in Net Assets
| Year ended
December 31, 2013 | Year ended
December 31, 2012 |
Increase (Decrease) in Net Assets | | |
Operations | | |
Net investment income (loss) | $ 2,443,661 | $ 2,956,681 |
Net realized gain (loss) | 29,992,847 | 3,674,511 |
Change in net unrealized appreciation (depreciation) | 36,397,533 | 7,776,477 |
Net increase (decrease) in net assets resulting from operations | 68,834,041 | 14,407,669 |
Distributions to shareholders from net investment income | (2,599,943) | (2,882,991) |
Distributions to shareholders from net realized gain | (1,958,979) | - |
Total distributions | (4,558,922) | (2,882,991) |
Share transactions - net increase (decrease) | (33,910,894) | (70,995,641) |
Redemption fees | 39,603 | 57,627 |
Total increase (decrease) in net assets | 30,403,828 | (59,413,336) |
| | |
Net Assets | | |
Beginning of period | 301,974,510 | 361,387,846 |
End of period (including distributions in excess of net investment income of $395,249 and undistributed net investment income of $20,344, respectively) | $ 332,378,338 | $ 301,974,510 |
See accompanying notes which are an integral part of the financial statements.
Annual Report
Financial Highlights - Initial Class
Years ended December 31, | 2013 | 2012 | 2011 | 2010 | 2009 |
Selected Per-Share Data | | | | | |
Net asset value, beginning of period | $ 19.53 | $ 18.81 | $ 20.05 | $ 16.88 | $ 11.46 |
Income from Investment Operations | | | | | |
Net investment income (loss) C | .20 | .19 | .21 | .11 | .07 |
Net realized and unrealized gain (loss) | 4.58 | .74 | (1.23) | 3.16 | 5.41 |
Total from investment operations | 4.78 | .93 | (1.02) | 3.27 | 5.48 |
Distributions from net investment income | (.22) | (.21) | (.23) | (.11) | (.07) |
Distributions from net realized gain | (.14) | - | - | - | - |
Total distributions | (.36) | (.21) | (.23) | (.11) | (.07) |
Redemption fees added to paid in capital C | - G | - G | .01 | .01 | .01 |
Net asset value, end of period | $ 23.95 | $ 19.53 | $ 18.81 | $ 20.05 | $ 16.88 |
Total Return A, B | 24.55% | 4.94% | (4.99)% | 19.45% | 47.90% |
Ratios to Average Net Assets D, F | | | | | |
Expenses before reductions | .70% | .69% | .69% | .70% | .71% |
Expenses net of fee waivers, if any | .69% | .69% | .69% | .69% | .71% |
Expenses net of all reductions | .69% | .68% | .68% | .69% | .70% |
Net investment income (loss) | .88% | .98% | 1.00% | .65% | .47% |
Supplemental Data | | | | | |
Net assets, end of period (000 omitted) | $ 94,202 | $ 96,822 | $ 126,723 | $ 148,774 | $ 152,028 |
Portfolio turnover rate E | 90% | 81% | 94% | 105% | 113% |
A Total returns do not reflect charges attributable to your insurance company's separate account. Inclusion of these charges would reduce the total returns shown.
B Total returns would have been lower if certain expenses had not been reduced during the applicable periods shown.
C Calculated based on average shares outstanding during the period.
D Fees and expenses of any underlying Fidelity Central Funds are not included in the Fund's expense ratio. The Fund indirectly bears its proportionate share of the expenses of any underlying Fidelity Central Funds.
E Amount does not include the portfolio activity of any underlying Fidelity Central Funds.
F Expense ratios reflect operating expenses of the class. Expenses before reductions do not reflect amounts reimbursed by the investment adviser or reductions from brokerage service arrangements or reductions from other expense offset arrangements and do not represent the amount paid by the class during periods when reimbursements or reductions occur. Expenses net of fee waivers reflect expenses after reimbursement by the investment adviser but prior to reductions from brokerage service arrangements or other expense offset arrangements. Expenses net of all reductions represent the net expenses paid by the class.
G Amount represents less than $.01 per share.
Financial Highlights - Service Class 2
Years ended December 31, | 2013 | 2012 | 2011 | 2010 | 2009 |
Selected Per-Share Data | | | | | |
Net asset value, beginning of period | $ 19.44 | $ 18.72 | $ 19.94 | $ 16.79 | $ 11.40 |
Income from Investment Operations | | | | | |
Net investment income (loss) C | .14 | .14 | .16 | .07 | .03 |
Net realized and unrealized gain (loss) | 4.55 | .73 | (1.21) | 3.13 | 5.38 |
Total from investment operations | 4.69 | .87 | (1.05) | 3.20 | 5.41 |
Distributions from net investment income | (.16) | (.15) | (.18) | (.06) | (.03) |
Distributions from net realized gain | (.14) | - | - | - | - |
Total distributions | (.30) | (.15) | (.18) | (.06) | (.03) |
Redemption fees added to paid in capital C | - G | - G | .01 | .01 | .01 |
Net asset value, end of period | $ 23.83 | $ 19.44 | $ 18.72 | $ 19.94 | $ 16.79 |
Total Return A, B | 24.21% | 4.68% | (5.20)% | 19.16% | 47.57% |
Ratios to Average Net Assets D, F | | | | | |
Expenses before reductions | .94% | .94% | .94% | .95% | .96% |
Expenses net of fee waivers, if any | .94% | .94% | .93% | .94% | .96% |
Expenses net of all reductions | .94% | .93% | .93% | .94% | .95% |
Net investment income (loss) | .64% | .74% | .75% | .40% | .22% |
Supplemental Data | | | | | |
Net assets, end of period (000 omitted) | $ 130,100 | $ 112,819 | $ 127,187 | $ 129,043 | $ 125,669 |
Portfolio turnover rate E | 90% | 81% | 94% | 105% | 113% |
A Total returns do not reflect charges attributable to your insurance company's separate account. Inclusion of these charges would reduce the total returns shown.
B Total returns would have been lower if certain expenses had not been reduced during the applicable periods shown.
C Calculated based on average shares outstanding during the period.
D Fees and expenses of any underlying Fidelity Central Funds are not included in the Fund's expense ratio. The Fund indirectly bears its proportionate share of the expenses of any underlying Fidelity Central Funds.
E Amount does not include the portfolio activity of any underlying Fidelity Central Funds.
F Expense ratios reflect operating expenses of the class. Expenses before reductions do not reflect amounts reimbursed by the investment adviser or reductions from brokerage service arrangements or reductions from other expense offset arrangements and do not represent the amount paid by the class during periods when reimbursements or reductions occur. Expenses net of fee waivers reflect expenses after reimbursement by the investment adviser but prior to reductions from brokerage service arrangements or other expense offset arrangements. Expenses net of all reductions represent the net expenses paid by the class.
G Amount represents less than $.01 per share.
See accompanying notes which are an integral part of the financial statements.
Annual Report
Financial Highlights - Investor Class
Years ended December 31, | 2013 | 2012 | 2011 | 2010 | 2009 |
Selected Per-Share Data | | | | | |
Net asset value, beginning of period | $ 19.49 | $ 18.77 | $ 20.01 | $ 16.85 | $ 11.44 |
Income from Investment Operations | | | | | |
Net investment income (loss) C | .18 | .17 | .19 | .09 | .05 |
Net realized and unrealized gain (loss) | 4.57 | .74 | (1.23) | 3.16 | 5.41 |
Total from investment operations | 4.75 | .91 | (1.04) | 3.25 | 5.46 |
Distributions from net investment income | (.20) | (.19) | (.21) | (.10) | (.06) |
Distributions from net realized gain | (.14) | - | - | - | - |
Total distributions | (.34) | (.19) | (.21) | (.10) | (.06) |
Redemption fees added to paid in capital C | - G | - G | .01 | .01 | .01 |
Net asset value, end of period | $ 23.90 | $ 19.49 | $ 18.77 | $ 20.01 | $ 16.85 |
Total Return A, B | 24.45% | 4.86% | (5.09)% | 19.34% | 47.79% |
Ratios to Average Net Assets D, F | | | | | |
Expenses before reductions | .78% | .77% | .77% | .79% | .81% |
Expenses net of fee waivers, if any | .77% | .77% | .77% | .78% | .81% |
Expenses net of all reductions | .77% | .76% | .77% | .77% | .80% |
Net investment income (loss) | .80% | .90% | .92% | .57% | .37% |
Supplemental Data | | | | | |
Net assets, end of period (000 omitted) | $ 108,077 | $ 92,334 | $ 107,479 | $ 103,682 | $ 89,921 |
Portfolio turnover rate E | 90% | 81% | 94% | 105% | 113% |
A Total returns do not reflect charges attributable to your insurance company's separate account. Inclusion of these charges would reduce the total returns shown.
B Total returns would have been lower if certain expenses had not been reduced during the applicable periods shown.
C Calculated based on average shares outstanding during the period.
D Fees and expenses of any underlying Fidelity Central Funds are not included in the Fund's expense ratio. The Fund indirectly bears its proportionate share of the expenses of any underlying Fidelity Central Funds.
E Amount does not include the portfolio activity of any underlying Fidelity Central Funds.
F Expense ratios reflect operating expenses of the class. Expenses before reductions do not reflect amounts reimbursed by the investment adviser or reductions from brokerage service arrangements or reductions from other expense offset arrangements and do not represent the amount paid by the class during periods when reimbursements or reductions occur. Expenses net of fee waivers reflect expenses after reimbursement by the investment adviser but prior to reductions from brokerage service arrangements or other expense offset arrangements. Expenses net of all reductions represent the net expenses paid by the class.
G Amount represents less than $.01 per share.
See accompanying notes which are an integral part of the financial statements.
Annual Report
Notes to Financial Statements
For the period ended December 31, 2013
1. Organization.
VIP Energy Portfolio (the Fund) is a non-diversified fund of Variable Insurance Products Fund IV (the Trust) and is authorized to issue an unlimited number of shares. The Trust is registered under the Investment Company Act of 1940, as amended (the 1940 Act), as an open-end management investment company organized as a Massachusetts business trust. Shares of the Fund may only be purchased by insurance companies for the purpose of funding variable annuity or variable life insurance contracts. The Fund offers the following classes of shares: Initial Class shares, Service Class 2 shares and Investor Class shares. All classes have equal rights and voting privileges, except for matters affecting a single class.
2. Investments in Fidelity Central Funds.
The Fund invests in Fidelity Central Funds, which are open-end investment companies generally available only to other investment companies and accounts managed by the investment adviser and its affiliates. The Fund's Schedule of Investments lists each of the Fidelity Central Funds held as of period end, if any, as an investment of the Fund, but does not include the underlying holdings of each Fidelity Central Fund. As an Investing Fund, the Fund indirectly bears its proportionate share of the expenses of the underlying Fidelity Central Funds.
The Money Market Central Funds seek preservation of capital and current income and are managed by Fidelity Investments Money Management, Inc. (FIMM), an affiliate of the investment adviser. Annualized expenses of the Money Market Central Funds as of their most recent shareholder report date are less than .01%.
A complete unaudited list of holdings for each Fidelity Central Fund is available upon request or at the Securities and Exchange Commission (the SEC) website at www.sec.gov. In addition, the financial statements of the Fidelity Central Funds, which are not covered by the Fund's Report of Independent Registered Public Accounting Firm, are available on the SEC website or upon request.
3. Significant Accounting Policies.
The financial statements have been prepared in conformity with accounting principles generally accepted in the United States of America (GAAP), which require management to make certain estimates and assumptions at the date of the financial statements. Actual results could differ from those estimates. Subsequent events, if any, through the date that the financial statements were issued have been evaluated in the preparation of the financial statements. The following summarizes the significant accounting policies of the Fund:
Investment Valuation. Investments are valued as of 4:00 p.m. Eastern time on the last calendar day of the period. In accordance with valuation policies and procedures approved by the Board of Trustees (the Board), the Fund attempts to obtain prices from one or more third party pricing vendors or brokers to value its investments. When current market prices, quotations or currency exchange rates are not readily available or reliable, investments will be fair valued in good faith by the Fidelity SelectCo, LLC (SelectCo) Fair Value Committee (the Committee), in accordance with procedures adopted by the Board. Factors used in determining fair value vary by investment type and may include market or investment specific events. The frequency with which these procedures are used cannot be predicted and they may be utilized to a significant extent. The Committee oversees the Fund's valuation policies and procedures and is responsible for approving and reporting to the Board all fair value determinations.
The Fund categorizes the inputs to valuation techniques used to value its investments into a disclosure hierarchy consisting of three levels as shown below:
Level 1 - quoted prices in active markets for identical investments
Level 2 - other significant observable inputs (including quoted prices for similar investments, interest rates, prepayment speeds, etc.)
Level 3 - unobservable inputs (including the Fund's own assumptions based on the best information available)
Valuation techniques used to value the Fund's investments by major category are as follows:
Equity securities, including restricted securities, for which market quotations are readily available, are valued at the last reported sale price or official closing price as reported by a third party pricing vendor on the primary market or exchange on which they are traded and are categorized as Level 1 in the hierarchy. In the event there were no sales during the day or closing prices are not available, securities are valued at the last quoted bid price or may be valued using the last available price and are generally categorized as Level 2 in the hierarchy. For foreign equity securities, when market or security specific events arise, comparisons to the valuation of American Depositary Receipts (ADRs), futures contracts, Exchange-Traded Funds (ETFs) and certain indexes as well as quoted prices for similar securities may be used and would be categorized as Level 2 in the hierarchy. Utilizing these techniques may result in transfers between Level 1 and Level 2. For equity securities, including restricted securities, where observable inputs are limited, assumptions about market activity and risk are used and these securities may be categorized as Level 3 in the hierarchy.
Investments in open-end mutual funds ,including the Fidelity Central Funds, are valued at their closing net asset value (NAV) each business day and are categorized as Level 1 in the hierarchy.
Changes in valuation techniques may result in transfers in or out of an assigned level within the disclosure hierarchy.
Annual Report
3. Significant Accounting Policies - continued
Foreign Currency. The Fund may use foreign currency contracts to facilitate transactions in foreign-denominated securities. Gains and losses from these transactions may arise from changes in the value of the foreign currency or if the counterparties do not perform under the contracts' terms.
Foreign-denominated assets, including investment securities, and liabilities are translated into U.S. dollars at the exchange rates at period end. Purchases and sales of investment securities, income and dividends received and expenses denominated in foreign currencies are translated into U.S. dollars at the exchange rate in effect on the transaction date.
The effects of exchange rate fluctuations on investments are included with the net realized and unrealized gain (loss) on investment securities. Other foreign currency transactions resulting in realized and unrealized gain (loss) are disclosed separately.
Investment Transactions and Income. For financial reporting purposes, the Fund's investment holdings and NAV include trades executed through the end of the last business day of the period. The NAV per share for processing shareholder transactions is calculated as of the close of business of the New York Stock Exchange (NYSE), normally 4:00 p.m. Eastern time and includes trades executed through the end of the prior business day. Gains and losses on securities sold are determined on the basis of identified cost and may include proceeds received from litigation. Dividend income is recorded on the ex-dividend date, except for certain dividends from foreign securities where the ex-dividend date may have passed, which are recorded as soon as the Fund is informed of the ex-dividend date. Non-cash dividends included in dividend income, if any, are recorded at the fair market value of the securities received. Distributions received on securities that represent a return of capital or capital gain are recorded as a reduction of cost of investments and/or as a realized gain. Subsequent to ex-dividend date the Fund determines the components of these distributions, based upon receipt of tax filings or other correspondence relating to the underlying investment. Interest income and distributions from the Fidelity Central Funds are accrued as earned. Investment income is recorded net of foreign taxes withheld where recovery of such taxes is uncertain.
Class Allocations and Expenses. Investment income, realized and unrealized capital gains and losses, common expenses of the Fund, and certain fund-level expense reductions, if any, are allocated daily on a pro-rata basis to each class based on the relative net assets of each class to the total net assets of the Fund. Each class differs with respect to transfer agent and distribution and service plan fees incurred. Certain expense reductions may also differ by class. For the reporting period, the allocated portion of income and expenses to each class as a percent of its average net assets may vary due to the timing of recording these transactions in relation to fluctuating net assets of the classes. Expenses directly attributable to a fund are charged to that fund. Expenses attributable to more than one fund are allocated among the respective funds on the basis of relative net assets or other appropriate methods. Expense estimates are accrued in the period to which they relate and adjustments are made when actual amounts are known.
Income Tax Information and Distributions to Shareholders. Each year, the Fund intends to qualify as a regulated investment company under Subchapter M of the Internal Revenue Code, including distributing substantially all of its taxable income and realized gains. As a result, no provision for U.S. Federal income taxes is required. As of December 31, 2013, the Fund did not have any unrecognized tax benefits in the financial statements; nor is the Fund aware of any tax positions for which it is reasonably possible that the total amounts of unrecognized tax benefits will significantly change in the next twelve months. The Fund files a U.S. federal tax return, in addition to state and local tax returns as required. The Fund's federal income tax returns are subject to examination by the Internal Revenue Service (IRS) for a period of three fiscal years after they are filed. State and local tax returns may be subject to examination for an additional fiscal year depending on the jurisdiction. Foreign taxes are provided for based on the Fund's understanding of the tax rules and rates that exist in the foreign markets in which it invests.
Distributions are declared and recorded on the ex-dividend date. Income dividends and capital gain distributions are declared separately for each class. Income and capital gain distributions are determined in accordance with income tax regulations, which may differ from GAAP.
Capital accounts within the financial statements are adjusted for permanent book-tax differences. These adjustments have no impact on net assets or the results of operations. Capital accounts are not adjusted for temporary book-tax differences which will reverse in a subsequent period.
Book-tax differences are primarily due to foreign currency transactions, partnerships, capital loss carryforwards and losses deferred due to wash sales and excise tax regulations.
The federal tax cost of investment securities and unrealized appreciation (depreciation) as of period end were as follows:
Gross unrealized appreciation | $ 66,728,885 |
Gross unrealized depreciation | (8,429,722) |
Net unrealized appreciation (depreciation) on securities and other investments | $ 58,299,163 |
| |
Tax Cost | $ 279,697,825 |
Annual Report
Notes to Financial Statements - continued
3. Significant Accounting Policies - continued
Income Tax Information and Distributions to Shareholders - continued
The tax-based components of distributable earnings as of period end were as follows:
Undistributed long-term capital gain | $ 1,796,497 |
Net unrealized appreciation (depreciation) | $ 58,299,165 |
The tax character of distributions paid was as follows:
| December 31, 2013 | December 31, 2012 |
Ordinary Income | $ 2,769,245 | $ 2,882,991 |
Long-term Capital Gains | 1,789,677 | - |
Total | $ 4,558,922 | $ 2,882,991 |
Trading (Redemption) Fees. Shares held by investors less than 60 days may be subject to a redemption fee equal to 1% of the NAV of shares redeemed. All redemption fees, which reduce the proceeds of the shareholder redemption, are retained by the Fund and accounted for as an addition to paid in capital.
4. Purchases and Sales of Investments.
Purchases and sales of securities, other than short-term securities, aggregated $281,227,942 and $319,626,280, respectively.
5. Fees and Other Transactions with Affiliates.
Management Fee. Effective August 1, 2013, SelectCo replaced Fidelity Management & Research Company (FMR), an affiliate of SelectCo, as investment adviser to the Fund. The investment adviser and its affiliates provide the Fund with investment management related services for which the Fund pays a monthly management fee. The management fee is the sum of an individual fund fee rate that is based on an annual rate of .30% of the Fund's average net assets and an annualized group fee rate that averaged .25% during the period. The group fee rate is based upon the average net assets of all the mutual funds advised by FMR and the investment adviser. The group fee rate decreases as assets under management increase and increases as assets under management decrease. For the reporting period, the total annual management fee rate was .55% of the Fund's average net assets.
Distribution and Service Plan Fees. In accordance with Rule 12b-1 of the 1940 Act, the Fund has adopted a separate 12b-1 Plan for Service Class 2 shares. Service Class 2 pays Fidelity Distributors Corporation (FDC), an affiliate of the investment adviser, a service fee. For the period, the service fee is based on an annual rate of .25% of Service Class 2's average net assets.
For the period, total fees for Service Class 2, all of which was re-allowed to insurance companies for the distribution of shares and providing shareholder support services were $305,378.
Transfer Agent Fees. Fidelity Investments Institutional Operations Company, Inc. (FIIOC), an affiliate of the investment adviser, is the Fund's transfer, dividend disbursing, and shareholder servicing agent. FIIOC receives an asset-based fee with respect to each class. Each class (with the exception of Investor Class) pays a transfer agent fee, excluding out of pocket expenses, equal to an annual rate of .07% of average net assets. Investor Class pays a monthly asset-based transfer agent fee of .15% of average net assets. In addition, FIIOC receives an asset-based fee of .0035% of average net assets for typesetting, printing and mailing of shareholder reports, except proxy statements. FIIOC voluntarily agreed to reimburse or waive this fee for the period January 1, 2013 through December 31, 2013 (see Expense Reductions note). For the period, transfer agent fees for each class, including printing and out of pocket expenses, were as follows:
Initial Class | $ 69,548 |
Service Class 2 | 84,097 |
Investor Class | 153,761 |
| $ 307,406 |
Effective February 1, 2014, the Board of Trustees approved an amendment to the transfer agent fee agreement whereby each class (with the exception of Investor Class) pays a single fee of .07% of average net assets for transfer agent services, typesetting, printing and mailing of shareholder reports, excluding mailing of proxy statements and out of pocket expenses. Investor Class pays a single fee of .15% of average net assets.
Accounting and Security Lending Fees. Fidelity Service Company, Inc. (FSC), an affiliate of the investment adviser, maintains the Fund's accounting records. The accounting fee is based on the level of average net assets for each month. Under a separate contract, FSC administers the security lending program. The security lending fee is based on the number and duration of lending transactions.
Annual Report
5. Fees and Other Transactions with Affiliates - continued
Brokerage Commissions. The Fund placed a portion of its portfolio transactions with brokerage firms which are affiliates of the investment adviser. Brokerage commissions are included in net realized gain (loss) and change in net unrealized appreciation (depreciation) in the Statement of Operations. The commissions paid to these affiliated firms were $8,419 for the period.
Interfund Lending Program. Pursuant to an Exemptive Order issued by the SEC, the Fund, along with other registered investment companies having management contracts with Fidelity Management & Research Company (FMR) or other affiliated entities of FMR, may participate in an interfund lending program. This program provides an alternative credit facility allowing the funds to borrow from, or lend money to, other participating affiliated funds. The Fund's activity in this program during the period for which loans were outstanding was as follows:
Borrower or Lender | Average Loan
Balance | Weighted Average Interest Rate | Interest
Expense |
Borrower | $ 5,578,000 | .42% | $ 129 |
6. Committed Line of Credit.
The Fund participates with other funds managed by the investment adviser or an affiliate in a $4.25 billion credit facility (the "line of credit") to be utilized for temporary or emergency purposes to fund shareholder redemptions or for other short-term liquidity purposes. The Fund has agreed to pay commitment fees on its pro-rata portion of the line of credit, which amounted to $692 and is reflected in Miscellaneous expenses on the Statement of Operations. During the period, there were no borrowings on this line of credit.
7. Security Lending.
The Fund lends portfolio securities through a lending agent from time to time in order to earn additional income. For equity securities, a lending agent is used and may loan securities to certain qualified borrowers, which prior to August 1, 2013 included Fidelity Capital Markets (FCM), a broker-dealer affiliated with the Fund. On the settlement date of the loan, the Fund receives collateral (in the form of U.S. Treasury obligations, letters of credit and/or cash) against the loaned securities and maintains collateral in an amount not less than 100% of the market value of the loaned securities during the period of the loan. The market value of the loaned securities is determined at the close of business of the Fund and any additional required collateral is delivered to the Fund on the next business day. If the borrower defaults on its obligation to return the securities loaned because of insolvency or other reasons, the Fund may apply collateral received from the borrower against the obligation. The Fund may experience delays and costs in recovering the securities loaned. Any cash collateral received is invested in the Fidelity Securities Lending Cash Central Fund. The value of loaned securities and cash collateral at period end are disclosed on the Fund's Statement of Assets and Liabilities. At period end, there were no security loans outstanding with FCM. Security lending income represents the income earned on investing cash collateral, less rebates paid to borrowers and any lending agent fees associated with the loan, plus any premium payments received for lending certain types of securities. Security lending income is presented in the Statement of Operations as a component of income from Fidelity Central Funds. Total security lending income during the period amounted to $123,188, including $2,463 from securities loaned to FCM.
8. Expense Reductions.
The investment adviser or its affiliates agreed to reimburse or waive certain fees during the period as noted in the table below.
Initial Class | $ 3,827 |
Service Class 2 | 4,793 |
Investor Class | 3,944 |
| $ 12,564 |
Commissions paid to certain brokers with whom the investment adviser, or its affiliates, places trades on behalf of the Fund include an amount in addition to trade execution, which may be rebated back to the Fund to offset certain expenses. This amount totaled $13,350 for the period.
Annual Report
Notes to Financial Statements - continued
9. Distributions to Shareholders.
Distributions to shareholders of each class were as follows:
Years ended December 31, | 2013 | 2012 |
From net investment income | | |
Initial Class | $ 848,957 | $ 1,095,585 |
Service Class 2 | 873,309 | 892,430 |
Investor Class | 877,677 | 894,976 |
Total | $ 2,599,943 | $ 2,882,991 |
From net realized gain | | |
Initial Class | $ 558,971 | $ - |
Service Class 2 | 770,344 | - |
Investor Class | 629,664 | - |
Total | $ 1,958,979 | $ - |
10. Share Transactions.
Transactions for each class of shares were as follows:
| Shares | Dollars |
Years ended December 31, | 2013 | 2012 | 2013 | 2012 |
Initial Class | | | | |
Shares sold | 454,958 | 621,886 | $ 10,149,434 | $ 12,291,507 |
Reinvestment of distributions | 61,357 | 56,914 | 1,407,928 | 1,095,585 |
Shares redeemed | (1,539,411) | (2,458,244) | (34,100,951) | (47,201,779) |
Net increase (decrease) | (1,023,096) | (1,779,444) | $ (22,543,589) | $ (33,814,687) |
Service Class 2 | | | | |
Shares sold | 587,706 | 770,749 | $ 13,184,617 | $ 15,078,815 |
Reinvestment of distributions | 71,977 | 46,578 | 1,643,653 | 892,430 |
Shares redeemed | (1,003,296) | (1,808,109) | (22,009,470) | (34,633,984) |
Net increase (decrease) | (343,613) | (990,782) | $ (7,181,200) | $ (18,662,739) |
Investor Class | | | | |
Shares sold | 759,705 | 673,218 | $ 17,109,559 | $ 13,236,333 |
Reinvestment of distributions | 65,797 | 46,565 | 1,507,341 | 894,976 |
Shares redeemed | (1,039,455) | (1,708,016) | (22,803,005) | (32,649,524) |
Net increase (decrease) | (213,953) | (988,233) | $ (4,186,105) | $ (18,518,215) |
11. Other.
The Fund's organizational documents provide former and current trustees and officers with a limited indemnification against liabilities arising in connection with the performance of their duties to the Fund. In the normal course of business, the Fund may also enter into contracts that provide general indemnifications. The Fund's maximum exposure under these arrangements is unknown as this would be dependent on future claims that may be made against the Fund. The risk of material loss from such claims is considered remote.
At the end of the period, the investment adviser or its affiliates were the owners of record of 60% of the total outstanding shares of the Fund and one otherwise unaffiliated shareholder was the owner of record of 39% of the total outstanding shares of the Fund.
Annual Report
Report of Independent Registered Public Accounting Firm
To the Trustees of Variable Insurance Products Fund IV and the Shareholders of VIP Energy Portfolio:
In our opinion, the accompanying statement of assets and liabilities, including the schedule of investments, and the related statements of operations and of changes in net assets and the financial highlights present fairly, in all material respects, the financial position of VIP Energy Portfolio (a fund of Variable Insurance Products Fund IV) at December 31, 2013, the results of its operations for the year then ended, the changes in its net assets for each of the two years in the period then ended and the financial highlights for each of the five years in the period then ended, in conformity with accounting principles generally accepted in the United States of America. These financial statements and financial highlights (hereafter referred to as "financial statements") are the responsibility of the VIP Energy Portfolio's management. Our responsibility is to express an opinion on these financial statements based on our audits. We conducted our audits of these financial statements in accordance with the standards of the Public Company Accounting Oversight Board (United States). Those standards require that we plan and perform the audit to obtain reasonable assurance about whether the financial statements are free of material misstatement. An audit includes examining, on a test basis, evidence supporting the amounts and disclosures in the financial statements, assessing the accounting principles used and significant estimates made by management, and evaluating the overall financial statement presentation. We believe that our audits, which included confirmation of securities at December 31, 2013 by correspondence with the custodian and brokers, provide a reasonable basis for our opinion.
PricewaterhouseCoopers LLP
Boston, Massachusetts
February 14, 2014
Annual Report
The Trustees and officers of the trust and fund, as applicable, are listed below. The Board of Trustees governs the fund and is responsible for protecting the interests of shareholders. The Trustees are experienced executives who meet periodically throughout the year to oversee the fund's activities, review contractual arrangements with companies that provide services to the fund, oversee management of the risks associated with such activities and contractual arrangements, and review the fund's performance. Ned C. Lautenbach, Ronald P. O'Hanley, and William S. Stavropoulos each oversees 247 funds. David A. Rosow, Garnett A. Smith, and Michael E. Wiley each oversees 74 funds.
The Trustees hold office without limit in time except that (a) any Trustee may resign; (b) any Trustee may be removed by written instrument, signed by at least two-thirds of the number of Trustees prior to such removal; (c) any Trustee who requests to be retired or who has become incapacitated by illness or injury may be retired by written instrument signed by a majority of the other Trustees; and (d) any Trustee may be removed at any special meeting of shareholders by a two-thirds vote of the outstanding voting securities of the trust. The officers hold office without limit in time, except that any officer may resign or may be removed by a vote of a majority of the Trustees at any regular meeting or any special meeting of the Trustees. Except as indicated, each individual has held the office shown or other offices in the same company for the past five years.
Experience, Skills, Attributes, and Qualifications of the Fund's Trustees. The Governance and Nominating Committee has adopted a statement of policy that describes the experience, qualifications, attributes, and skills that are necessary and desirable for potential Independent Trustee candidates (Statement of Policy). The Board believes that each Trustee satisfied at the time he or she was initially elected or appointed a Trustee, and continues to satisfy, the standards contemplated by the Statement of Policy. The Governance and Nominating Committee also engages professional search firms to help identify potential Independent Trustee candidates who have the experience, qualifications, attributes, and skills consistent with the Statement of Policy. From time to time, additional criteria based on the composition and skills of the current Independent Trustees, as well as experience or skills that may be appropriate in light of future changes to board composition, business conditions, and regulatory or other developments, have also been considered by the professional search firms and the Governance and Nominating Committee. In addition, the Board takes into account the Trustees' commitment and participation in Board and committee meetings, as well as their leadership of standing and ad hoc committees throughout their tenure.
In determining that a particular Trustee was and continues to be qualified to serve as a Trustee, the Board has considered a variety of criteria, none of which, in isolation, was controlling. The Board believes that, collectively, the Trustees have balanced and diverse experience, qualifications, attributes, and skills, which allow the Board to operate effectively in governing the fund and protecting the interests of shareholders. Information about the specific experience, skills, attributes, and qualifications of each Trustee, which in each case led to the Board's conclusion that the Trustee should serve (or continue to serve) as a trustee of the fund, is provided below.
Board Structure and Oversight Function. Ronald P. O'Hanley is an interested person (as defined in the 1940 Act) and currently serves as Chairman. The Trustees have determined that an interested Chairman is appropriate and benefits shareholders because an interested Chairman has a personal and professional stake in the quality and continuity of services provided to the fund. Independent Trustees exercise their informed business judgment to appoint an individual of their choosing to serve as Chairman, regardless of whether the Trustee happens to be independent or a member of management. The Independent Trustees have determined that they can act independently and effectively without having an Independent Trustee serve as Chairman and that a key structural component for assuring that they are in a position to do so is for the Independent Trustees to constitute a substantial majority for the Board. The Independent Trustees also regularly meet in executive session. Michael E. Wiley serves as Chairman of the Independent Trustees and as such (i) acts as a liaison between the Independent Trustees and management with respect to matters important to the Independent Trustees and (ii) with management prepares agendas for Board meetings.
Fidelity funds are overseen by different Boards of Trustees. The fund's Board oversees Fidelity's sector portfolios. Other Boards oversee Fidelity's equity and high income funds, and Fidelity's investment grade bond, money market, and asset allocation funds. The use of separate Boards, each with its own committee structure, allows the Trustees of each group of Fidelity funds to focus on the unique issues of the funds they oversee, including common research, investment, and operational issues. On occasion, the separate Boards establish joint committees to address issues of overlapping consequences for the Fidelity funds overseen by each Board.
The Trustees operate using a system of committees to facilitate the timely and efficient consideration of all matters of importance to the Trustees, the fund, and fund shareholders and to facilitate compliance with legal and regulatory requirements and oversight of the fund's activities and associated risks. The Board, acting through its committees, has charged SelectCo and its affiliates with (i) identifying events or circumstances the occurrence of which could have demonstrably adverse effects on the fund's business and/or reputation; (ii) implementing processes and controls to lessen the possibility that such events or circumstances occur or to mitigate the effects of such events or circumstances if they do occur; and (iii) creating and maintaining a system designed to evaluate continuously business and market conditions in order to facilitate the identification and implementation processes described in (i) and (ii) above. Because the day-to-day operations and activities of the fund are carried out by or through SelectCo, its affiliates, and other service providers, the fund's exposure to risks is mitigated but not eliminated by the processes overseen by the Trustees. While each of the Board's committees has responsibility for overseeing different aspects of the fund's activities, oversight is exercised primarily through the Operations and Audit Committees. Appropriate personnel, including but not limited to the fund's Chief Compliance Officer (CCO), SelectCo's internal auditor, the independent accountants, the fund's Treasurer and portfolio management personnel, make periodic reports to the Board's committees, as appropriate. The responsibilities of each standing committee, including their oversight responsibilities, are described further under "Standing Committees of the Fund's Trustees."
The fund's Statement of Additional Information (SAI) includes more information about the Trustees. To request a free copy, call Fidelity at 1-877-208-0098.
Annual Report
Interested Trustee*:
Correspondence intended for the Trustee who is an interested person may be sent to Fidelity Investments, 245 Summer Street, Boston, Massachusetts 02210.
Name, Year of Birth; Principal Occupations and Other Relevant Experience+ |
Ronald P. O'Hanley (1957) |
Year of Election or Appointment: 2011 Trustee Chairman of the Board of Trustees |
| Mr. O'Hanley also serves as Trustee of other Fidelity funds. He is Director of Fidelity SelectCo, LLC (2013-present), FMR Co., Inc. (2010-present), Director of Fidelity Investments Money Management, Inc. (2010-present), Director of Fidelity Research & Analysis Company (2010-present), President of Fidelity Asset Management and Corporate Services and a Member of Fidelity's Executive Committee (2010-present). Previously, Mr. O'Hanley served as President and Chief Executive Officer of BNY Mellon Asset Management (2007-2010). Mr. O'Hanley also served as Vice Chairman of Bank New York Mellon Corp. and a member of that firm's Executive Committee. Prior to the 2007 merger of The Bank of New York and Mellon Financial Corporation, he was Vice Chairman of Mellon Financial Corporation and President and Chief Executive Officer of Mellon Asset Management. He joined Mellon in February 1997. Mr. O'Hanley currently serves as Chairman of the Boston Public Library Foundation Board of Directors and sits on the Board of Directors of Beth Israel Deaconess Medical Center, the Board of Trustees of the Marine Biological Laboratory and the Advisory Board of the Maxwell School of Citizenship and Public Administration at Syracuse University. Mr. O'Hanley also chairs the Council on Asset Management for the Financial Services Roundtable and is a member of the Board of Directors of Institutional Investor's U.S. Institute. |
* Trustee has been determined to be an "Interested Trustee" by virtue of, among other things, his affiliation with the trust or various entities under common control with SelectCo.
+ The information above includes the Trustee's principal occupation during the last five years and other information relating to the experience, attributes, and skills relevant to the Trustee's qualifications to serve as a Trustee, which led to the conclusion that the Trustee should serve as a Trustee for the fund.
Independent Trustees:
Correspondence intended for each Independent Trustee (that is, the Trustees other than the Interested Trustee) may be sent to Fidelity Investments, P.O. Box 55235, Boston, Massachusetts 02205-5235.
Name, Year of Birth; Principal Occupations and Other Relevant Experience+ |
Ned C. Lautenbach (1944) |
Year of Election or Appointment: 2000 Trustee |
| Mr. Lautenbach also serves as Trustee of other Fidelity funds. Mr. Lautenbach currently serves as the Lead Director of the Eaton Corporation Board of Directors (diversified industrial, 1997-present). Mr. Lautenbach is Chairman of the Board of Directors of the Philharmonic Center for the Arts in Naples, Florida (2012-present) and a member of the Council on Foreign Relations (1994-present). Previously, Mr. Lautenbach was a Partner/Advisory Partner at Clayton, Dubilier & Rice, LLC (private equity investment, 1998-2010), as well as a Director of Sony Corporation (2006-2007). |
David A. Rosow (1942) |
Year of Election or Appointment: 2013 Trustee |
| Mr. Rosow also serves as Trustee of other Fidelity funds. Mr. Rosow is Chairman and Chief Executive Officer of International Golf Group, Inc. (golf course development, 1989-present). Previously, Mr. Rosow served as Chairman and Chief Executive Officer of Rosow & Company, Inc. (private investment company, 1989-2011), a Lead Director of Hudson United Bancorp (2001-2006) and as a Director of TD Banknorth (1996-2006). In addition, Mr. Rosow is a member (2008-present) and President (2009-present) of the Town Council of Palm Beach, Florida. Mr. Rosow served as a Member of the Advisory Board of other Fidelity funds (2012-2013). |
Garnett A. Smith (1947) |
Year of Election or Appointment: 2013 Trustee |
| Mr. Smith also serves as Trustee of other Fidelity funds. Prior to Mr. Smith's retirement, he served as Chairman and Chief Executive Officer of Inbrand Corp. (manufacturer of personal absorbent products, 1990-1997). He also served as President (1986-1990) of Inbrand Corp. Prior to his employment with Inbrand Corp., he was employed by a retail fabric chain and North Carolina National Bank. In addition, Mr. Smith is a board member of the Jackson Hole Land Trust (2009-present). Mr. Smith served as a Member of the Advisory Board of other Fidelity funds (2012-2013). |
William S. Stavropoulos (1939) |
Year of Election or Appointment: 2001 Trustee |
| Mr. Stavropoulos also serves as Trustee of other Fidelity funds. Mr. Stavropoulos serves as President and Founder of the Michigan Baseball Foundation, the Great Lakes Loons (2007-present). Mr. Stavropoulos is Chairman Emeritus of the Board of Directors of The Dow Chemical Company, where he previously served in numerous senior management positions, including President, CEO (1995-2000; 2002-2004), Chairman of the Executive Committee (2000-2006), and as a member of the Board of Directors (1990-2006). Currently, Mr. Stavropoulos is Chairman of the Board of Directors of Univar Inc. (global distributor of commodity and specialty chemicals), a Director of Teradata Corporation (data warehousing and technology solutions), and Maersk Inc. (industrial conglomerate), and a member of the Advisory Board for Metalmark Capital LLC (private equity investment, 2005-present). Mr. Stavropoulos is an operating advisor to Clayton, Dubilier & Rice, LLC (private equity investment). In addition, Mr. Stavropoulos is a member of the University of Notre Dame Advisory Council for the College of Science, a Trustee of the Rollin L. Gerstacker Foundation, and a Director of the Naples Philharmonic Center for the Arts. Previously, Mr. Stavropoulos served as a Director of Chemical Financial Corporation (bank holding company, 1993-2012) and Tyco International, Ltd. (multinational manufacturing and services, 2007-2012). |
Michael E. Wiley (1950) |
Year of Election or Appointment: 2008 Trustee Chairman of the Independent Trustees |
| Mr. Wiley also serves as Trustee of other Fidelity funds. Mr. Wiley serves as a Director of Asia Pacific Exploration Consolidated (international oil and gas exploration and production, 2008-present). Mr. Wiley serves as a Director of Tesoro Corporation (independent oil refiner and marketer, 2005-present), and a Director of Bill Barrett Corporation (exploration and production, 2005-present). In addition, Mr. Wiley also serves as a Director of Post Oak Bank (privately-held bank, 2004-present). Previously, Mr. Wiley served as a Trustee of other Fidelity funds (2008-2013), as a member of the Board of Trustees of the University of Tulsa (2000-2006; 2007-2010), as a Senior Energy Advisor of Katzenbach Partners, LLC (consulting, 2006-2007), as an Advisory Director of Riverstone Holdings (private investment), Chairman, President, and CEO of Baker Hughes, Inc. (oilfield services, 2000-2004), and as Director of Spinnaker Exploration Company (exploration and production, 2001-2005). |
+ The information above includes each Trustee's principal occupation during the last five years and other information relating to the experience, attributes, and skills relevant to each Trustee's qualifications to serve as a Trustee, which led to the conclusion that each Trustee should serve as a Trustee for the fund.
Officers:
Except for Anthony R. Rochte, correspondence intended for each officer may be sent to Fidelity Investments, 245 Summer Street, Boston, Massachusetts 02210. Correspondence intended for Mr. Rochte may be sent to SelectCo, 1225 17th Street, Denver, Colorado 80202-5541. Officers appear below in alphabetical order.
Name, Year of Birth; Principal Occupation |
Christopher S. Bartel (1971) |
Year of Election or Appointment: 2009 Vice President |
| Mr. Bartel also serves as Vice President of other funds. Mr. Bartel serves as a Director, President, and Chief Executive Officer of Fidelity Management & Research (Japan) Inc. (2012-present), a Director of Fidelity Management & Research (Hong Kong) (2012-present), and Senior Vice President of Global Equity Research (2010-present). Previously, Mr. Bartel served as Senior Vice President of Equity Research (2009-2010), Managing Director of Research (2006-2009), and an analyst and portfolio manager (2000-2006). |
Elizabeth Paige Baumann (1968) |
Year of Election or Appointment: 2012 Anti-Money Laundering (AML) Officer |
| Ms. Baumann also serves as AML Officer of other funds. She is Chief AML Officer of FMR LLC (2012-present) and is an employee of Fidelity Investments. Previously, Ms. Baumann served as Vice President and Deputy Anti-Money Laundering Officer (2007-2012). |
Marc Bryant (1966) |
Year of Election or Appointment: 2013 Secretary and Chief Legal Officer (CLO) |
| Mr. Bryant also serves as an officer of other funds. He is Senior Vice President and Deputy General Counsel of FMR LLC. Prior to joining Fidelity Investments, Mr. Bryant served as a Senior Vice President and the Head of Global Retail Legal for AllianceBernstein L.P. (2006-2010), and as the General Counsel for ProFund Advisors LLC (2001-2006). |
William C. Coffey (1969) |
Year of Election or Appointment: 2009 Assistant Secretary |
| Mr. Coffey also serves as Assistant Secretary of other funds. He is Senior Vice President and Deputy General Counsel of FMR LLC (2010-present), and is an employee of Fidelity Investments. Previously, Mr. Coffey served as Vice President and Associate General Counsel of FMR LLC (2005-2009). |
Jonathan Davis (1968) |
Year of Election or Appointment: 2010 Assistant Treasurer |
| Mr. Davis also serves as Assistant Treasurer of other funds. Mr. Davis is an employee of Fidelity Investments. Previously, Mr. Davis served as Vice President and Associate General Counsel of FMR LLC (2003-2010). |
Adrien E. Deberghes (1967) |
Year of Election or Appointment: 2013 President and Treasurer |
| Mr. Deberghes also serves as an officer of other funds. He is an employee of Fidelity Investments (2008-present). Prior to joining Fidelity Investments, Mr. Deberghes was Senior Vice President of Mutual Fund Administration at State Street Corporation (2007-2008), Senior Director of Mutual Fund Administration at Investors Bank & Trust (2005-2007), and Director of Finance for Dunkin' Brands (2000-2005). |
Stephanie J. Dorsey (1969) |
Year of Election or Appointment: 2010 Assistant Treasurer |
| Ms. Dorsey also serves as an officer of other funds. She is an employee of Fidelity Investments (2008-present) and has served in other fund officer roles. Prior to joining Fidelity Investments, Ms. Dorsey served as Treasurer (2004-2008) of the JPMorgan Mutual Funds and Vice President (2004-2008) of JPMorgan Chase Bank. |
Joseph A. Hanlon (1968) |
Year of Election or Appointment: 2012 Chief Compliance Officer |
| Mr. Hanlon also serves as Chief Compliance Officer of other funds. Mr. Hanlon serves as Compliance Officer of FMR, FMR Co., Inc., Fidelity Investments Money Management, Inc. (FIMM), Fidelity Research and Analysis Company (FRAC), and Fidelity Management & Research (Hong Kong) (2009-present), as Senior Vice President of the Fidelity Asset Management Division (2009-present), and is an employee of Fidelity Investments. Previously, Mr. Hanlon served as Compliance Officer of Fidelity Management & Research (Japan) Inc. (2009-2013), Strategic Advisers, Inc. (2009-2013), and Fidelity Management & Research (U.K.) Inc. (2009-2013). |
Brian B. Hogan (1964) |
Year of Election or Appointment: 2009 Vice President |
| Mr. Hogan also serves as Vice President of other funds. Mr. Hogan serves as President of FMR's Equity Division (2009-present). Previously, Mr. Hogan served as Senior Vice President, Equity Research of FMR (2006-2009) and as a portfolio manager. |
Chris Maher (1972) |
Year of Election or Appointment: 2013 Assistant Treasurer |
| Mr. Maher serves as Assistant Treasurer of other funds. Mr. Maher is Vice President of Valuation Oversight and is an employee of Fidelity Investments. Previously, Mr. Maher served as Vice President of Asset Management Compliance (2013), Vice President of FMR's Program Management Group (2010-2013), and Vice President of Valuation Oversight (2008-2010). |
Christine Reynolds (1958) |
Year of Election or Appointment: 2008 Chief Financial Officer |
| Ms. Reynolds also serves as Chief Financial Officer of other funds. Ms. Reynolds became President of Fidelity Pricing and Cash Management Services (FPCMS) in August 2008. Ms. Reynolds served as Chief Operating Officer of FPCMS (2007-2008). Previously, Ms. Reynolds served as President, Treasurer, and Anti-Money Laundering officer of the Fidelity funds (2004-2007). |
Kenneth B. Robins (1969) |
Year of Election or Appointment: 2013 Deputy Treasurer |
| Mr. Robins also serves as an officer of other funds. Mr. Robins serves as Executive Vice President of Fidelity Investments Money Management, Inc. (FIMM) (2013-present) and is an employee of Fidelity Investments (2004-present). Previously, Mr. Robins served in other fund officer roles. |
Anthony R. Rochte (1968) |
Year of Election or Appointment: 2013 Vice President |
| Mr. Rochte also serves as Vice President of other funds. Mr. Rochte serves as President of Fidelity SelectCo, LLC (2012-present) and is an employee of Fidelity Investments (2012-present). Prior to joining Fidelity Investments, Mr. Rochte served as Senior Managing Director and head of State Street Global Advisors' North American Intermediary Business Group (2006-2012). |
Stacie M. Smith (1974) |
Year of Election or Appointment: 2013 Assistant Treasurer |
| Ms. Smith also serves as an officer of other funds. She is an employee of Fidelity Investments (2009-present) and has served in other fund officer roles. Prior to joining Fidelity Investments, Ms. Smith served as Senior Audit Manager of Ernst & Young LLP (1996-2009). |
Renee Stagnone (1975) |
Year of Election or Appointment: 2013 Deputy Treasurer |
| Ms. Stagnone also serves as Deputy Treasurer of other funds. Ms. Stagnone is an employee of Fidelity Investments. |
Joseph F. Zambello (1957) |
Year of Election or Appointment: 2011 Deputy Treasurer |
| Mr. Zambello also serves as Deputy Treasurer of other funds. Mr. Zambello is an employee of Fidelity Investments. Previously, Mr. Zambello served as Vice President of FMR's Program Management Group (2009-2011) and Vice President of the Transfer Agent Oversight Group (2005-2009). |
Annual Report
The Board of Trustees of VIP Energy Portfolio voted to pay to shareholders of record at the opening of business on record date, the following distributions per share derived from capital gains realized from sales of portfolio securities:
| Pay Date | Record Date | Capital Gains |
Initial Class | 02/14/14 | 02/14/14 | $0.135 |
Investor Class | 02/14/14 | 02/14/14 | $0.135 |
The fund hereby designates as a capital gain dividend with respect to the taxable year ended December 31, 2013, $3,616,421, or, if subsequently determined to be different, the net capital gain of such year.
Initial Class and Investor Class designate 100% of the dividends distributed during the fiscal year as qualifying for the dividends-received deduction for corporate shareholders.
Annual Report
A special meeting of Energy Portfolio's shareholders was held on May 14, 2013. The results of votes taken among shareholders on the proposals before them are reported below. Each vote reported represents one dollar of net asset value held on the record date for the meeting.
PROPOSAL 1 |
To elect a Board of Trustees.A |
| # of
Votes | % of
Votes |
Ned C. Lautenbach |
Affirmative | 1,555,133,782.46 | 93.955 |
Withheld | 100,063,694.32 | 6.045 |
TOTAL | 1,655,197,476.78 | 100.000 |
Ronald P. O'Hanley |
Affirmative | 1,557,988,095.28 | 94.128 |
Withheld | 97,209,381.50 | 5.872 |
TOTAL | 1,655,197,476.78 | 100.000 |
David A. Rosow |
Affirmative | 1,552,645,347.31 | 93.805 |
Withheld | 102,552,129.47 | 6.195 |
TOTAL | 1,655,197,476.78 | 100.000 |
Garnett A. Smith |
Affirmative | 1,554,582,880.53 | 93.922 |
Withheld | 100,614,596.25 | 6.078 |
TOTAL | 1,655,197,476.78 | 100.000 |
William S. Stavropoulos |
Affirmative | 1,548,352,452.21 | 93.545 |
Withheld | 106,845,024.57 | 6.455 |
TOTAL | 1,655,197,476.78 | 100.000 |
Michael E. Wiley |
Affirmative | 1,556,790,374.70 | 94.055 |
Withheld | 98,407,102.08 | 5.945 |
TOTAL | 1,655,197,476.78 | 100.000 |
PROPOSAL 2 |
To approve a management contract between the fund and Fidelity SelectCo, LLC. |
| # of
Votes | % of
Votes |
Affirmative | 287,261,557.88 | 90.277 |
Against | 11,605,272.64 | 3.647 |
Abstain | 19,335,092.44 | 6.076 |
TOTAL | 318,201,922.96 | 100.000 |
A Denotes trust-wide proposal and voting results. |
Annual Report
Investment Adviser
Fidelity SelectCo, LLC
Denver, CO
Investment Sub-Advisers
FMR Co., Inc.
Fidelity Management & Research (U.K.) Inc.
Fidelity Management & Research (Hong Kong) Limited
Fidelity Management & Research (Japan) Inc.
General Distributor
Fidelity Distributors Corporation
Smithfield, RI
Transfer and Service Agents
Fidelity Investments Institutional Operations Company, Inc.
Boston, MA
Fidelity Service Company, Inc.
Boston, MA
Custodian
State Street Bank and Trust Company
Quincy, MA
VNRIC-ANN-0214
1.817379.108
Fidelity® Variable Insurance Products:
Financial Services Portfolio
Annual Report
December 31, 2013
(Fidelity Cover Art)
Contents
Performance | (Click Here) | How the fund has done over time. |
Management's Discussion of Fund Performance | (Click Here) | The Portfolio Manager's review of fund performance and strategy. |
Shareholder Expense Example | (Click Here) | An example of shareholder expenses. |
Investment Changes | (Click Here) | A summary of major shifts in the fund's investments over the past six months. |
Investments | (Click Here) | A complete list of the fund's investments with their market values. |
Financial Statements | (Click Here) | Statements of assets and liabilities, operations, and changes in net assets, as well as financial highlights. |
Notes | (Click Here) | Notes to the financial statements. |
Report of Independent Registered Public Accounting Firm | (Click Here) | |
Trustees and Officers | (Click Here) | |
Distributions | (Click Here) | |
Proxy Voting Results | (Click Here) | |
To view a fund's proxy voting guidelines and proxy voting record for the 12-month period ended June 30, visit http://www.fidelity.com/proxyvotingresults or visit the Securities and Exchange Commission's (SEC) web site at http://www.sec.gov. You may also call 1-877-208-0098 to request a free copy of the proxy voting guidelines.
Fidelity Variable Insurance Products are separate account options which are purchased through a variable insurance contract.
Standard & Poor's, S&P and S&P 500 are registered service marks of The McGraw-Hill Companies, Inc. and have been licensed for use by Fidelity Distributors Corporation.
Other third-party marks appearing herein are the property of their respective owners.
All other marks appearing herein are registered or unregistered trademarks or service marks of FMR LLC or an affiliated company. © 2014 FMR LLC. All rights reserved.
This report and the financial statements contained herein are submitted for the general information of the shareholders of the fund. This report is not authorized for distribution to prospective investors in the fund unless preceded or accompanied by an effective prospectus.
A fund files its complete schedule of portfolio holdings with the SEC for the first and third quarters of each fiscal year on Form N-Q. Forms N-Q are available on the SEC's web site at http://www.sec.gov. A fund's Forms N-Q may be reviewed and copied at the SEC's Public Reference Room in Washington, DC. Information regarding the operation of the SEC's Public Reference Room may be obtained by calling 1-800-SEC-0330. For a complete list of a fund's portfolio holdings, view the most recent holdings listing, semiannual report, or annual report on Fidelity's web site at http://www.fidelity.com, http://www.advisor.fidelity.com, or http://www.401k.com, as applicable.
NOT FDIC INSURED • MAY LOSE VALUE • NO BANK GUARANTEE
Neither the fund nor Fidelity Distributors Corporation is a bank.
Annual Report
Average annual total return reflects the change in the value of an investment, assuming reinvestment of the class' distributions from dividend income and capital gains (the profits earned upon the sale of securities that have grown in value, if any) and assuming a constant rate of performance each year. During periods of reimbursement by Fidelity, a fund's total return will be greater than it would be had the reimbursement not occurred. Performance numbers are net of all underlying fund operating expenses, but do not include any insurance charges imposed by your insurance company's separate account. If performance information included the effect of these additional charges, the total returns would have been lower. How a fund did yesterday is no guarantee of how it will do tomorrow.
Average Annual Total Returns
Periods ended December 31, 2013 | Past 1
year | Past 5
years | Past 10
years |
VIP Financial Services Portfolio - Initial Class | 33.86% | 13.32% | 1.23% |
VIP Financial Services Portfolio - Investor Class A | 33.74% | 13.26% | 1.15% |
A The initial offering of Investor Class shares took place on July 21, 2005. Returns prior to July 21, 2005 are those of Initial Class. Had Investor Class's transfer agent fee been reflected, returns prior to July 21, 2005 would have been lower.
$10,000 Over 10 Years
Let's say hypothetically that $10,000 was invested in VIP Financial Services Portfolio - Initial Class on December 31, 2003. The chart shows how the value of your investment would have changed, and also shows how the S&P 500® Index performed over the same period.
Annual Report
Market Recap: Global equity markets remained upbeat for the 12 months ending December 31, 2013, propelling the MSCI® ACWI® (All Country World Index) Index to a 23.24% return. Midyear turbulence gave way by autumn when policymakers in the U.S. and China had made clear their intentions to maintain accommodative monetary policies. That stance, combined with modest cyclical improvement around the globe and generally low valuations, underpinned the broad rally in equities, although the relative strength of the U.S. dollar generally tempered gains for U.S. investors holding foreign securities based in local currencies. During the period, the broad-market S&P 500® Index set a series of new highs, finishing the year up 32.39%. For the first time since 1995, the S&P® scored a "perfect 10," with all 10 economic sectors gaining at least 10% for the year. A resurgence in growth-oriented stocks lifted the Nasdaq Composite Index® to a 40.12% result for 2013, while the blue-chip Dow Jones Industrial AverageSM notched a relatively more modest 29.65% gain. International developed-markets equities rose in concert with their U.S. counterparts, with the MSCI® EAFE® Index gaining 22.92% for the period. Meanwhile, foreign exchange and commodity weakness curbed results in resource-heavy emerging markets (EM), especially in the year's waning months. More generally, concern over EM's slowing growth, its declining share of global trade and uncertainty surrounding U.S. central bank intentions were all factors hampering performance. The MSCI Emerging Markets Index returned -2.27% for the period. On the bond side, U.S. high-yield securities rallied with equities for much of the period, with The BofA Merrill LynchSM US High Yield Constrained Index returning 7.41% for 2013. The more rate-sensitive U.S. investment-grade bond category faced headwinds though, as reflected in the -2.02% return of the Barclays® U.S. Aggregate Bond Index. Within the Barclays index, investment-grade corporate credit returned -2.01%, while ultra-safe U.S. Treasuries saw a -2.75% result. Major non-U.S. developed markets performed only slightly better, with the Citigroup® Non-USD Group-of-Seven (G7) Equal Weighted Index logging a -1.59% result. After several years of strong advances, EM debt reversed course in 2013, with the J.P. Morgan Emerging Markets Bond Index Global returning -6.58%.
Comments from Christopher Lee, who became Portfolio Manager of VIP Financial Services Portfolio on May 21, 2013: For the year, the fund's share classes topped the 33.14% return of the MSCI® U.S. IMI Financials 25-50 Index. (For specific portfolio results, please refer to the performance section of this report.) A strong equity market, housing recovery and improved credit outlook helped drive returns in the sector. Stock picks in thrifts & mortgage finance and asset management & custody banks and an underweighting in real estate investment trusts (REITs) gave the biggest boost to relative performance. Individual contributors included timely ownership of mortgage giant Fannie Mae, which I sold near its peak last May, and alternative asset manager Blackstone Group, whose shares got a lift from rising equity and real estate markets. By contrast, a modest cash position detracted, as did an out-of-index stake in the data processing & outsourced services segment and an underweighting in life & health insurance. Individual disappointments included card-swipe device maker VeriFone Systems, whose shares were pressured by economic weakness overseas and concern over competitive threats, and pension fund manager AFP Provida in Chile, whose stock slid after a disappointing buyout offer last February. VeriFone and Provida were not in the index and not in the portfolio at period end.
The views expressed above reflect those of the portfolio manager(s) only through the end of the period as stated on the cover of this report and do not necessarily represent the views of Fidelity or any other person in the Fidelity organization. Any such views are subject to change at any time based upon market or other conditions and Fidelity disclaims any responsibility to update such views. These views may not be relied on as investment advice and, because investment decisions for a Fidelity fund are based on numerous factors, may not be relied on as an indication of trading intent on behalf of any Fidelity fund.
Annual Report
As a shareholder of the Fund, you incur two types of costs: (1) transaction costs, including redemption fees and (2) ongoing costs, including management fees and other Fund expenses. This Example is intended to help you understand your ongoing costs (in dollars) of investing in the Fund and to compare these costs with the ongoing costs of investing in other mutual funds.
The Example is based on an investment of $1,000 invested at the beginning of the period and held for the entire period (July 1, 2013 to December 31, 2013).
Actual Expenses
The first line of the accompanying table for each class of the Fund provides information about actual account values and actual expenses. You may use the information in this line, together with the amount you invested, to estimate the expenses that you paid over the period. Simply divide your account value by $1,000.00 (for example, an $8,600 account value divided by $1,000.00 = 8.6), then multiply the result by the number in the first line for a class of the Fund under the heading entitled "Expenses Paid During Period" to estimate the expenses you paid on your account during this period. The estimate of expenses does not include any fees or other expenses of any variable annuity or variable life insurance product. If they were, the estimate of expenses you paid during the period would be higher, and your ending account value would be lower. In addition, the Fund, as a shareholder in the underlying Fidelity Central Funds, will indirectly bear its pro-rata share of the fees and expenses incurred by the underlying Fidelity Central Funds. These fees and expenses are not included in the Fund's annualized expense ratio used to calculate the expense estimate in the table below.
Hypothetical Example for Comparison Purposes
The second line of the accompanying table for each class of the Fund provides information about hypothetical account values and hypothetical expenses based on a Class' actual expense ratio and an assumed rate of return of 5% per year before expenses, which is not the Class' actual return. The hypothetical account values and expenses may not be used to estimate the actual ending account balance or expenses you paid for the period. You may use this information to compare the ongoing costs of investing in the Fund and other funds. To do so, compare this 5% hypothetical example with the 5% hypothetical examples that appear in the shareholder reports of the other funds. The estimate of expenses does not include any fees or other expenses of any variable annuity or variable life insurance product. If they were, the estimate of expenses you paid during the period would be higher, and your ending account value would be lower. In addition, the Fund, as a shareholder in the underlying Fidelity Central Funds, will indirectly bear its pro-rata share of the fees and expenses incurred by the underlying Fidelity Central Funds. These fees and expenses are not included in the Fund's annualized expense ratio used to calculate the expense estimate in the table below.
Please note that the expenses shown in the table are meant to highlight your ongoing costs only and do not reflect any transaction costs. Therefore, the second line of the table is useful in comparing ongoing costs only, and will not help you determine the relative total costs of owning different funds. In addition, if these transactional costs were included, your costs would have been higher.
| Annualized
Expense RatioB | Beginning
Account Value
July 1, 2013 | Ending
Account Value
December 31, 2013 | Expenses Paid
During Period*
July 1, 2013
to December 31, 2013 |
Initial Class | .77% | | | |
Actual | | $ 1,000.00 | $ 1,169.80 | $ 4.21 |
HypotheticalA | | $ 1,000.00 | $ 1,021.32 | $ 3.92 |
Investor Class | .85% | | | |
Actual | | $ 1,000.00 | $ 1,169.70 | $ 4.65 |
HypotheticalA | | $ 1,000.00 | $ 1,020.92 | $ 4.33 |
A 5% return per year before expenses
B Annualized expense ratio reflects expenses net of applicable fee waivers.
* Expenses are equal to each Class' annualized expense ratio, multiplied by the average account value over the period, multiplied by 184/365 (to reflect the one-half year period).
Annual Report
Investment Changes (Unaudited)
Top Ten Stocks as of December 31, 2013 |
| % of fund's
net assets | % of fund's net assets
6 months ago |
JPMorgan Chase & Co. | 5.2 | 4.8 |
Bank of America Corp. | 4.9 | 4.7 |
U.S. Bancorp | 4.9 | 4.2 |
Citigroup, Inc. | 4.9 | 4.8 |
Wells Fargo & Co. | 4.1 | 3.9 |
Capital One Financial Corp. | 4.1 | 3.5 |
American Tower Corp. | 3.3 | 2.7 |
MetLife, Inc. | 3.0 | 2.5 |
Invesco Ltd. | 2.4 | 2.3 |
The Travelers Companies, Inc. | 2.4 | 2.0 |
| 39.2 | |
Top Industries (% of fund's net assets) |
As of December 31, 2013 |
 | Diversified Financial Services | 20.8% | |
 | Insurance | 18.2% | |
 | Commercial Banks | 16.1% | |
 | Capital Markets | 14.6% | |
 | Real Estate Investment Trusts | 9.3% | |
 | All Others* | 21.0% | |

As of June 30, 2013 |
| Insurance | 19.0% | |
| Commercial Banks | 18.8% | |
| Diversified Financial Services | 17.4% | |
| Capital Markets | 12.4% | |
| Real Estate Investment Trusts | 11.5% | |
| All Others* | 20.9% | |

* Includes short-term investments and net other assets (liabilities). |
Annual Report
Investments December 31, 2013
Showing Percentage of Net Assets
Common Stocks - 97.8% |
| Shares | | Value |
CAPITAL MARKETS - 14.6% |
Asset Management & Custody Banks - 11.3% |
Affiliated Managers Group, Inc. (a) | 5,964 | | $ 1,293,472 |
Ameriprise Financial, Inc. | 10,700 | | 1,231,035 |
BlackRock, Inc. Class A | 2,587 | | 818,708 |
Carlyle Group LP | 19,241 | | 685,364 |
Franklin Resources, Inc. | 25,350 | | 1,463,456 |
Invesco Ltd. | 59,527 | | 2,166,783 |
Oaktree Capital Group LLC Class A | 11,400 | | 670,776 |
The Blackstone Group LP | 52,076 | | 1,640,394 |
| | 9,969,988 |
Diversified Capital Markets - 0.3% |
UBS AG (NY Shares) | 10,330 | | 198,853 |
Investment Banking & Brokerage - 3.0% |
E*TRADE Financial Corp. (a) | 42,500 | | 834,700 |
FXCM, Inc. Class A (d) | 26,878 | | 479,504 |
Raymond James Financial, Inc. | 25,800 | | 1,346,502 |
| | 2,660,706 |
TOTAL CAPITAL MARKETS | | 12,829,547 |
COMMERCIAL BANKS - 16.1% |
Diversified Banks - 9.0% |
U.S. Bancorp | 106,873 | | 4,317,669 |
Wells Fargo & Co. | 79,696 | | 3,618,198 |
| | 7,935,867 |
Regional Banks - 7.1% |
BB&T Corp. | 40,600 | | 1,515,192 |
CIT Group, Inc. | 8,770 | | 457,180 |
CoBiz, Inc. | 31,256 | | 373,822 |
Commerce Bancshares, Inc. | 15,625 | | 701,719 |
Fifth Third Bancorp | 59,078 | | 1,242,410 |
M&T Bank Corp. (d) | 10,640 | | 1,238,709 |
Popular, Inc. (a) | 18,600 | | 534,378 |
Texas Capital Bancshares, Inc. (a) | 3,150 | | 195,930 |
| | 6,259,340 |
TOTAL COMMERCIAL BANKS | | 14,195,207 |
CONSUMER FINANCE - 6.3% |
Consumer Finance - 6.3% |
Capital One Financial Corp. | 47,053 | | 3,604,730 |
SLM Corp. | 57,680 | | 1,515,830 |
Springleaf Holdings, Inc. | 18,600 | | 470,208 |
| | 5,590,768 |
DIVERSIFIED CONSUMER SERVICES - 1.0% |
Specialized Consumer Services - 1.0% |
H&R Block, Inc. | 30,900 | | 897,336 |
|
| Shares | | Value |
DIVERSIFIED FINANCIAL SERVICES - 20.8% |
Multi-Sector Holdings - 1.1% |
Berkshire Hathaway, Inc. Class B (a) | 8,493 | | $ 1,006,930 |
Other Diversified Financial Services - 15.0% |
Bank of America Corp. | 277,742 | | 4,324,443 |
Citigroup, Inc. | 82,239 | | 4,285,474 |
JPMorgan Chase & Co. | 78,154 | | 4,570,445 |
| | 13,180,362 |
Specialized Finance - 4.7% |
IntercontinentalExchange Group, Inc. | 7,143 | | 1,606,604 |
McGraw-Hill Companies, Inc. | 21,350 | | 1,669,570 |
MSCI, Inc. Class A (a) | 19,209 | | 839,817 |
| | 4,115,991 |
TOTAL DIVERSIFIED FINANCIAL SERVICES | | 18,303,283 |
HEALTH CARE PROVIDERS & SERVICES - 0.9% |
Health Care Facilities - 0.9% |
Brookdale Senior Living, Inc. (a) | 27,900 | | 758,322 |
INSURANCE - 18.2% |
Insurance Brokers - 1.9% |
Marsh & McLennan Companies, Inc. | 35,500 | | 1,716,780 |
Life & Health Insurance - 4.4% |
MetLife, Inc. | 48,356 | | 2,607,356 |
Prudential PLC | 25,657 | | 573,280 |
Torchmark Corp. | 8,600 | | 672,090 |
| | 3,852,726 |
Multi-Line Insurance - 1.1% |
HCC Insurance Holdings, Inc. | 20,050 | | 925,107 |
Property & Casualty Insurance - 9.4% |
ACE Ltd. | 17,881 | | 1,851,220 |
Allied World Assurance Co. Holdings Ltd. | 11,770 | | 1,327,774 |
Allstate Corp. | 31,850 | | 1,737,099 |
Fidelity National Financial, Inc. Class A | 37,950 | | 1,231,478 |
The Travelers Companies, Inc. | 23,479 | | 2,125,789 |
| | 8,273,360 |
Reinsurance - 1.4% |
Everest Re Group Ltd. | 7,850 | | 1,223,580 |
TOTAL INSURANCE | | 15,991,553 |
INTERNET SOFTWARE & SERVICES - 1.3% |
Internet Software & Services - 1.3% |
eBay, Inc. (a) | 13,700 | | 751,993 |
Equinix, Inc. (a) | 2,320 | | 411,684 |
| | 1,163,677 |
IT SERVICES - 5.1% |
Data Processing & Outsourced Services - 5.1% |
EVERTEC, Inc. | 31,800 | | 784,188 |
Fiserv, Inc. (a) | 21,178 | | 1,250,561 |
Common Stocks - continued |
| Shares | | Value |
IT SERVICES - CONTINUED |
Data Processing & Outsourced Services - continued |
FleetCor Technologies, Inc. (a) | 7,150 | | $ 837,766 |
The Western Union Co. | 38,500 | | 664,125 |
Visa, Inc. Class A | 4,270 | | 950,844 |
| | 4,487,484 |
REAL ESTATE INVESTMENT TRUSTS - 9.3% |
Mortgage REITs - 1.9% |
Blackstone Mortgage Trust, Inc. (d) | 17,100 | | 463,923 |
NorthStar Realty Finance Corp. (d) | 42,800 | | 575,660 |
Redwood Trust, Inc. | 31,000 | | 600,470 |
| | 1,640,053 |
Retail REITs - 2.7% |
CBL & Associates Properties, Inc. | 24,700 | | 443,612 |
Simon Property Group, Inc. | 12,903 | | 1,963,320 |
| | 2,406,932 |
Specialized REITs - 4.7% |
American Tower Corp. | 36,310 | | 2,898,264 |
Rayonier, Inc. | 12,800 | | 538,880 |
Ventas, Inc. | 11,668 | | 668,343 |
| | 4,105,487 |
TOTAL REAL ESTATE INVESTMENT TRUSTS | | 8,152,472 |
REAL ESTATE MANAGEMENT & DEVELOPMENT - 3.1% |
Real Estate Services - 3.1% |
Altisource Portfolio Solutions SA | 6,850 | | 1,086,616 |
CBRE Group, Inc. (a) | 64,188 | | 1,688,144 |
| | 2,774,760 |
THRIFTS & MORTGAGE FINANCE - 1.1% |
Thrifts & Mortgage Finance - 1.1% |
MGIC Investment Corp. (a) | 29,300 | | 247,292 |
|
| Shares | | Value |
Ocwen Financial Corp. (a) | 10,740 | | $ 595,533 |
Radian Group, Inc. | 9,400 | | 132,728 |
Washington Mutual, Inc. (a) | 5,300 | | 0 |
| | 975,553 |
TOTAL COMMON STOCKS (Cost $73,934,405) |
86,119,962
|
Money Market Funds - 5.6% |
| | | |
Fidelity Cash Central Fund, 0.11% (b) | 2,261,724 | | 2,261,724 |
Fidelity Securities Lending Cash Central Fund, 0.11% (b)(c) | 2,698,950 | | 2,698,950 |
TOTAL MONEY MARKET FUNDS (Cost $4,960,674) |
4,960,674
|
TOTAL INVESTMENT PORTFOLIO - 103.4% (Cost $78,895,079) | | 91,080,636 |
NET OTHER ASSETS (LIABILITIES) - (3.4)% | | (2,997,381) |
NET ASSETS - 100% | $ 88,083,255 |
Legend |
(a) Non-income producing |
(b) Affiliated fund that is generally available only to investment companies and other accounts managed by Fidelity Investments. The rate quoted is the annualized seven-day yield of the fund at period end. A complete unaudited listing of the fund's holdings as of its most recent quarter end is available upon request. In addition, each Fidelity Central Fund's financial statements, which are not covered by the Fund's Report of Independent Registered Public Accounting Firm, are available on the SEC's website or upon request. |
(c) Investment made with cash collateral received from securities on loan. |
(d) Security or a portion of the security is on loan at period end. |
Affiliated Central Funds |
Information regarding fiscal year to date income earned by the Fund from investments in Fidelity Central Funds is as follows: |
Fund | Income earned |
Fidelity Cash Central Fund | $ 2,823 |
Fidelity Securities Lending Cash Central Fund | 11,705 |
Total | $ 14,528 |
Other Information |
The following is a summary of the inputs used, as of December 31, 2013, involving the Fund's assets and liabilities carried at fair value. The inputs or methodology used for valuing securities may not be an indication of the risk associated with investing in those securities. For more information on valuation inputs, and their aggregation into the levels used in the table below, please refer to the Investment Valuation section in the accompanying Notes to Financial Statements. |
Valuation Inputs at Reporting Date: |
Description | Total | Level 1 | Level 2 | Level 3 |
Investments in Securities: | | | | |
Common Stocks | $ 86,119,962 | $ 85,546,682 | $ 573,280 | $ - |
Money Market Funds | 4,960,674 | 4,960,674 | - | - |
Total Investments in Securities: | $ 91,080,636 | $ 90,507,356 | $ 573,280 | $ - |
Distribution of investments by country or territory of incorporation, as a percentage of total net assets, is as follows (Unaudited): |
United States of America | 89.0% |
Switzerland | 3.9% |
Bermuda | 3.8% |
Puerto Rico | 1.5% |
Luxembourg | 1.2% |
Others (Individually Less Than 1%) | 0.6% |
| 100.0% |
See accompanying notes which are an integral part of the financial statements.
Annual Report
Statement of Assets and Liabilities
| December 31, 2013 |
| | |
Assets | | |
Investment in securities, at value (including securities loaned of $2,661,292) - See accompanying schedule: Unaffiliated issuers (cost $73,934,405) | $ 86,119,962 | |
Fidelity Central Funds (cost $4,960,674) | 4,960,674 | |
Total Investments (cost $78,895,079) | | $ 91,080,636 |
Foreign currency held at value (cost $174) | | 176 |
Receivable for fund shares sold | | 65,783 |
Dividends receivable | | 82,424 |
Distributions receivable from Fidelity Central Funds | | 450 |
Prepaid expenses | | 544 |
Other receivables | | 706 |
Total assets | | 91,230,719 |
| | |
Liabilities | | |
Payable for investments purchased | $ 177,209 | |
Payable for fund shares redeemed | 185,213 | |
Accrued management fee | 38,521 | |
Other affiliated payables | 11,336 | |
Other payables and accrued expenses | 36,235 | |
Collateral on securities loaned, at value | 2,698,950 | |
Total liabilities | | 3,147,464 |
| | |
Net Assets | | $ 88,083,255 |
Net Assets consist of: | | |
Paid in capital | | $ 82,511,368 |
Accumulated undistributed net realized gain (loss) on investments and foreign currency transactions | | (6,613,546) |
Net unrealized appreciation (depreciation) on investments and assets and liabilities in foreign currencies | | 12,185,433 |
Net Assets | | $ 88,083,255 |
Statement of Assets and Liabilities - continued
| December 31, 2013 |
| | |
Initial Class:
Net Asset Value, offering price and redemption price per share ($27,726,477 ÷ 2,972,605 shares) | | $ 9.33 |
| | |
Investor Class:
Net Asset Value, offering price and redemption price per share ($60,356,778 ÷ 6,492,739 shares) | | $ 9.30 |
See accompanying notes which are an integral part of the financial statements.
Annual Report
Financial Statements - continued
Statement of Operations
| Year ended December 31, 2013 |
| | |
Investment Income | | |
Dividends | | $ 1,443,389 |
Interest | | 672 |
Income from Fidelity Central Funds | | 14,528 |
Total income | | 1,458,589 |
| | |
Expenses | | |
Management fee | $ 387,509 | |
Transfer agent fees | 91,169 | |
Accounting and security lending fees | 27,614 | |
Custodian fees and expenses | 41,267 | |
Independent trustees' compensation | 1,139 | |
Audit | 50,801 | |
Legal | 1,181 | |
Miscellaneous | 5,567 | |
Total expenses before reductions | 606,247 | |
Expense reductions | (17,879) | 588,368 |
Net investment income (loss) | | 870,221 |
Realized and Unrealized Gain (Loss) Net realized gain (loss) on: | | |
Investment securities: | | |
Unaffiliated issuers | 9,456,649 | |
Foreign currency transactions | (1,432) | |
Total net realized gain (loss) | | 9,455,217 |
Change in net unrealized appreciation (depreciation) on: Investment securities | 8,823,766 | |
Assets and liabilities in foreign currencies | (355) | |
Total change in net unrealized appreciation (depreciation) | | 8,823,411 |
Net gain (loss) | | 18,278,628 |
Net increase (decrease) in net assets resulting from operations | | $ 19,148,849 |
Statement of Changes in Net Assets
| Year ended
December 31,
2013 | Year ended
December 31,
2012 |
Increase (Decrease) in Net Assets | | |
Operations | | |
Net investment income (loss) | $ 870,221 | $ 666,312 |
Net realized gain (loss) | 9,455,217 | 1,823,095 |
Change in net unrealized appreciation (depreciation) | 8,823,411 | 5,533,468 |
Net increase (decrease) in net assets resulting from operations | 19,148,849 | 8,022,875 |
Distributions to shareholders from net investment income | (888,052) | (536,969) |
Share transactions - net increase (decrease) | 21,673,318 | 14,995,460 |
Redemption fees | 21,472 | 20,225 |
Total increase (decrease) in net assets | 39,955,587 | 22,501,591 |
| | |
Net Assets | | |
Beginning of period | 48,127,668 | 25,626,077 |
End of period (including undistributed net investment income of $0 and $47,403, respectively) | $ 88,083,255 | $ 48,127,668 |
See accompanying notes which are an integral part of the financial statements.
Annual Report
Financial Highlights - Initial Class
Years ended December 31, | 2013 | 2012 | 2011 | 2010 | 2009 |
Selected Per-Share Data | | | | | |
Net asset value, beginning of period | $ 7.05 | $ 5.55 | $ 7.01 | $ 6.55 | $ 5.22 |
Income from Investment Operations | | | | | |
Net investment income (loss) C | .11 | .11 | .01 | .02 | .06 |
Net realized and unrealized gain (loss) | 2.27 | 1.47 | (1.44) | .46 | 1.35 |
Total from investment operations | 2.38 | 1.58 | (1.43) | .48 | 1.41 |
Distributions from net investment income | (.10) | (.08) | (.03) | (.02) | (.09) |
Redemption fees added to paid in capital C | - G | - G | - G | - G | .01 |
Net asset value, end of period | $ 9.33 | $ 7.05 | $ 5.55 | $ 7.01 | $ 6.55 |
Total Return A, B | 33.86% | 28.55% | (20.46)% | 7.28% | 27.30% |
Ratios to Average Net Assets D, F | | | | | |
Expenses before reductions | .81% | .85% | .92% | .90% | .91% |
Expenses net of fee waivers, if any | .81% | .85% | .91% | .90% | .91% |
Expenses net of all reductions | .79% | .75% | .86% | .85% | .87% |
Net investment income (loss) | 1.29% | 1.66% | .22% | .34% | 1.09% |
Supplemental Data | | | | | |
Net assets, end of period (000 omitted) | $ 27,726 | $ 17,438 | $ 11,805 | $ 18,959 | $ 20,155 |
Portfolio turnover rate E | 211% | 323% | 350% | 288% | 336% |
A Total returns do not reflect charges attributable to your insurance company's separate account. Inclusion of these charges would reduce the total returns shown.
B Total returns would have been lower if certain expenses had not been reduced during the applicable periods shown.
C Calculated based on average shares outstanding during the period.
D Fees and expenses of any underlying Fidelity Central Funds are not included in the Fund's expense ratio. The Fund indirectly bears its proportionate share of the expenses of any underlying Fidelity Central Funds.
E Amount does not include the portfolio activity of any underlying Fidelity Central Funds.
F Expense ratios reflect operating expenses of the class. Expenses before reductions do not reflect amounts reimbursed by the investment adviser or reductions from brokerage service arrangements or reductions from other expense offset arrangements and do not represent the amount paid by the class during periods when reimbursements or reductions occur. Expenses net of fee waivers reflect expenses after reimbursement by the investment adviser but prior to reductions from brokerage service arrangements or other expense offset arrangements. Expenses net of all reductions represent the net expenses paid by the class.
G Amount represents less than $.01 per share.
Financial Highlights - Investor Class
Years ended December 31, | 2013 | 2012 | 2011 | 2010 | 2009 |
Selected Per-Share Data | | | | | |
Net asset value, beginning of period | $ 7.03 | $ 5.54 | $ 6.99 | $ 6.53 | $ 5.20 |
Income from Investment Operations | | | | | |
Net investment income (loss) C | .10 | .10 | .01 | .02 | .06 |
Net realized and unrealized gain (loss) | 2.27 | 1.47 | (1.44) | .45 | 1.34 |
Total from investment operations | 2.37 | 1.57 | (1.43) | .47 | 1.40 |
Distributions from net investment income | (.10) | (.08) | (.02) | (.01) | (.08) |
Redemption fees added to paid in capital C | - G | - G | - G | - G | .01 |
Net asset value, end of period | $ 9.30 | $ 7.03 | $ 5.54 | $ 6.99 | $ 6.53 |
Total Return A, B | 33.74% | 28.36% | (20.47)% | 7.24% | 27.30% |
Ratios to Average Net Assets D, F | | | | | |
Expenses before reductions | .89% | .92% | .99% | .99% | 1.01% |
Expenses net of fee waivers, if any | .89% | .92% | .99% | .98% | 1.01% |
Expenses net of all reductions | .87% | .82% | .93% | .94% | .97% |
Net investment income (loss) | 1.22% | 1.58% | .14% | .25% | .99% |
Supplemental Data | | | | | |
Net assets, end of period (000 omitted) | $ 60,357 | $ 30,690 | $ 13,821 | $ 21,855 | $ 16,754 |
Portfolio turnover rate E | 211% | 323% | 350% | 288% | 336% |
A Total returns do not reflect charges attributable to your insurance company's separate account. Inclusion of these charges would reduce the total returns shown.
B Total returns would have been lower if certain expenses had not been reduced during the applicable periods shown.
C Calculated based on average shares outstanding during the period.
D Fees and expenses of any underlying Fidelity Central Funds are not included in the Fund's expense ratio. The Fund indirectly bears its proportionate share of the expenses of any underlying Fidelity Central Funds.
E Amount does not include the portfolio activity of any underlying Fidelity Central Funds.
F Expense ratios reflect operating expenses of the class. Expenses before reductions do not reflect amounts reimbursed by the investment adviser or reductions from brokerage service arrangements or reductions from other expense offset arrangements and do not represent the amount paid by the class during periods when reimbursements or reductions occur. Expenses net of fee waivers reflect expenses after reimbursement by the investment adviser but prior to reductions from brokerage service arrangements or other expense offset arrangements. Expenses net of all reductions represent the net expenses paid by the class.
G Amount represents less than $.01 per share.
See accompanying notes which are an integral part of the financial statements.
Annual Report
Notes to Financial Statements
For the period ended December 31, 2013
1. Organization.
VIP Financial Services Portfolio (the Fund) is a fund of Variable Insurance Products Fund IV (the Trust) and is authorized to issue an unlimited number of shares. The Trust is registered under the Investment Company Act of 1940, as amended (the 1940 Act), as an open-end management investment company organized as a Massachusetts business trust. Shares of the Fund may only be purchased by insurance companies for the purpose of funding variable annuity or variable life insurance contracts. The Fund offers the following classes of shares: Initial Class shares and Investor Class shares. All classes have equal rights and voting privileges, except for matters affecting a single class.
2. Investments in Fidelity Central Funds.
The Fund invests in Fidelity Central Funds, which are open-end investment companies generally available only to other investment companies and accounts managed by the investment adviser and its affiliates. The Fund's Schedule of Investments lists each of the Fidelity Central Funds held as of period end, if any, as an investment of the Fund, but does not include the underlying holdings of each Fidelity Central Fund. As an Investing Fund, the Fund indirectly bears its proportionate share of the expenses of the underlying Fidelity Central Funds.
The Money Market Central Funds seek preservation of capital and current income and are managed by Fidelity Investments Money Management, Inc. (FIMM), an affiliate of the investment adviser. Annualized expenses of the Money Market Central Funds as of their most recent shareholder report date are less than .01%.
A complete unaudited list of holdings for each Fidelity Central Fund is available upon request or at the Securities and Exchange Commission (the SEC) website at www.sec.gov. In addition, the financial statements of the Fidelity Central Funds, which are not covered by the Fund's Report of Independent Registered Public Accounting Firm, are available on the SEC website or upon request.
3. Significant Accounting Policies.
The financial statements have been prepared in conformity with accounting principles generally accepted in the United States of America (GAAP), which require management to make certain estimates and assumptions at the date of the financial statements. Actual results could differ from those estimates. Subsequent events, if any, through the date that the financial statements were issued have been evaluated in the preparation of the financial statements. The following summarizes the significant accounting policies of the Fund:
Investment Valuation. Investments are valued as of 4:00 p.m. Eastern time on the last calendar day of the period. In accordance with valuation policies and procedures approved by the Board of Trustees (the Board), the Fund attempts to obtain prices from one or more third party pricing vendors or brokers to value its investments. When current market prices, quotations or currency exchange rates are not readily available or reliable, investments will be fair valued in good faith by the Fidelity SelectCo, LLC (SelectCo) Fair Value Committee (the Committee), in accordance with procedures adopted by the Board. Factors used in determining fair value vary by investment type and may include market or investment specific events. The frequency with which these procedures are used cannot be predicted and they may be utilized to a significant extent. The Committee oversees the Fund's valuation policies and procedures and is responsible for approving and reporting to the Board all fair value determinations.
The Fund categorizes the inputs to valuation techniques used to value its investments into a disclosure hierarchy consisting of three levels as shown below:
Level 1 - quoted prices in active markets for identical investments
Level 2 - other significant observable inputs (including quoted prices for similar investments, interest rates, prepayment speeds, etc.)
Level 3 - unobservable inputs (including the Fund's own assumptions based on the best information available)
Valuation techniques used to value the Fund's investments by major category are as follows:
Equity securities, including restricted securities, for which market quotations are readily available, are valued at the last reported sale price or official closing price as reported by a third party pricing vendor on the primary market or exchange on which they are traded and are categorized as Level 1 in the hierarchy. In the event there were no sales during the day or closing prices are not available, securities are valued at the last quoted bid price or may be valued using the last available price and are generally categorized as Level 2 in the hierarchy. For foreign equity securities, when market or security specific events arise, comparisons to the valuation of American Depositary Receipts (ADRs), futures contracts, Exchange-Traded Funds (ETFs) and certain indexes as well as quoted prices for similar securities may be used and would be categorized as Level 2 in the hierarchy. Utilizing these techniques may result in transfers between Level 1 and Level 2. For equity securities, including restricted securities, where observable inputs are limited, assumptions about market activity and risk are used and these securities may be categorized as Level 3 in the hierarchy.
Investments in open-end mutual funds, including the Fidelity Central Funds, are valued at their closing net asset value (NAV) each business day and are categorized as Level 1 in the hierarchy.
Annual Report
3. Significant Accounting Policies - continued
Investment Valuation - continued
Changes in valuation techniques may result in transfers in or out of an assigned level within the disclosure hierarchy. The aggregate value of investments by input level, as of December 31, 2013, is included at the end of the Fund's Schedule of Investments.
Foreign Currency. The Fund may use foreign currency contracts to facilitate transactions in foreign-denominated securities. Gains and losses from these transactions may arise from changes in the value of the foreign currency or if the counterparties do not perform under the contracts' terms.
Foreign-denominated assets, including investment securities, and liabilities are translated into U.S. dollars at the exchange rates at period end. Purchases and sales of investment securities, income and dividends received and expenses denominated in foreign currencies are translated into U.S. dollars at the exchange rate in effect on the transaction date.
The effects of exchange rate fluctuations on investments are included with the net realized and unrealized gain (loss) on investment securities. Other foreign currency transactions resulting in realized and unrealized gain (loss) are disclosed separately.
Investment Transactions and Income. For financial reporting purposes, the Fund's investment holdings and NAV include trades executed through the end of the last business day of the period. The NAV per share for processing shareholder transactions is calculated as of the close of business of the New York Stock Exchange (NYSE), normally 4:00 p.m. Eastern time and includes trades executed through the end of the prior business day. Gains and losses on securities sold are determined on the basis of identified cost and may include proceeds received from litigation. Dividend income is recorded on the ex-dividend date, except for certain dividends from foreign securities where the ex-dividend date may have passed, which are recorded as soon as the Fund is informed of the ex-dividend date. Non-cash dividends included in dividend income, if any, are recorded at the fair market value of the securities received. Distributions received on securities that represent a return of capital or capital gain are recorded as a reduction of cost of investments and/or as a realized gain. Subsequent to ex-dividend date the Fund determines the components of these distributions, based upon receipt of tax filings or other correspondence relating to the underlying investment. Interest income and distributions from the Fidelity Central Funds are accrued as earned. Interest income includes coupon interest and amortization of premium and accretion of discount on debt securities. Investment income is recorded net of foreign taxes withheld where recovery of such taxes is uncertain.
Class Allocations and Expenses. Investment income, realized and unrealized capital gains and losses, common expenses of the Fund, and certain fund-level expense reductions, if any, are allocated daily on a pro-rata basis to each class based on the relative net assets of each class to the total net assets of the Fund. Each class differs with respect to transfer agent fees incurred. Certain expense reductions may also differ by class. For the reporting period, the allocated portion of income and expenses to each class as a percent of its average net assets may vary due to the timing of recording these transactions in relation to fluctuating net assets of the classes. Expenses directly attributable to a fund are charged to that fund. Expenses attributable to more than one fund are allocated among the respective funds on the basis of relative net assets or other appropriate methods. Expense estimates are accrued in the period to which they relate and adjustments are made when actual amounts are known.
Income Tax Information and Distributions to Shareholders. Each year, the Fund intends to qualify as a regulated investment company under Subchapter M of the Internal Revenue Code, including distributing substantially all of its taxable income and realized gains. As a result, no provision for U.S. Federal income taxes is required. As of December 31, 2013, the Fund did not have any unrecognized tax benefits in the financial statements; nor is the Fund aware of any tax positions for which it is reasonably possible that the total amounts of unrecognized tax benefits will significantly change in the next twelve months. The Fund files a U.S. federal tax return, in addition to state and local tax returns as required. The Fund's federal income tax returns are subject to examination by the Internal Revenue Service (IRS) for a period of three fiscal years after they are filed. State and local tax returns may be subject to examination for an additional fiscal year depending on the jurisdiction. Foreign taxes are provided for based on the Fund's understanding of the tax rules and rates that exist in the foreign markets in which it invests.
Distributions are declared and recorded on the ex-dividend date. Income dividends and capital gain distributions are declared separately for each class. Income and capital gain distributions are determined in accordance with income tax regulations, which may differ from GAAP.
Capital accounts within the financial statements are adjusted for permanent book-tax differences. These adjustments have no impact on net assets or the results of operations. Capital accounts are not adjusted for temporary book-tax differences which will reverse in a subsequent period.
Book-tax differences are primarily due to foreign currency transactions, passive foreign investment companies (PFIC), partnerships, capital loss carryforwards, losses deferred due to wash sales and equity-debt classifications.
Annual Report
Notes to Financial Statements - continued
3. Significant Accounting Policies - continued
Income Tax Information and Distributions to Shareholders - continued
The federal tax cost of investment securities and unrealized appreciation (depreciation) as of period end were as follows:
Gross unrealized appreciation | $ 12,350,412 |
Gross unrealized depreciation | (775,315) |
Net unrealized appreciation (depreciation) on securities and other investments | $ 11,575,097 |
| |
Tax Cost | $ 79,505,539 |
The tax-based components of distributable earnings as of period end were as follows:
Capital loss carryforward | $ (6,003,086) |
Net unrealized appreciation (depreciation) | $ 11,574,973 |
Capital loss carryforwards are only available to offset future capital gains of the Fund to the extent provided by regulations and may be limited. Under the Regulated Investment Company Modernization Act of 2010 (the Act), the Fund is permitted to carry forward capital losses incurred in taxable years beginning after December 22, 2010 for an unlimited period and such capital losses are required to be used prior to any losses that expire. The capital loss carryforward information presented below, including any applicable limitation, is estimated as of fiscal period end and is subject to adjustment.
Fiscal year of expiration | |
2017 | $ (6,003,086) |
The tax character of distributions paid was as follows:
| December 31, 2013 | December 31, 2012 |
Ordinary Income | $ 888,052 | $ 536,969 |
Trading (Redemption) Fees. Shares held by investors less than 60 days may be subject to a redemption fee equal to 1% of the NAV of shares redeemed. All redemption fees, which reduce the proceeds of the shareholder redemption, are retained by the Fund and accounted for as an addition to paid in capital.
4. Purchases and Sales of Investments.
Purchases and sales of securities, other than short-term securities, aggregated $163,687,698 and $142,798,575, respectively.
5. Fees and Other Transactions with Affiliates.
Management Fee. Effective August 1, 2013, SelectCo replaced Fidelity Management and Research Company (FMR), an affiliate of SelectCo, as investment adviser to the Fund. The investment adviser and its affiliates provide the Fund with investment management related services for which the Fund pays a monthly management fee. The management fee is the sum of an individual fund fee rate that is based on an annual rate of .30% of the Fund's average net assets and an annualized group fee rate that averaged .25% during the period. The group fee rate is based upon the average net assets of all the mutual funds advised by FMR and the investment adviser. The group fee rate decreases as assets under management increase and increases as assets under management decrease. For the reporting period, the total annual management fee rate was .55% of the Fund's average net assets.
Transfer Agent Fees. Fidelity Investments Institutional Operations Company, Inc. (FIIOC), an affiliate of the investment adviser, is the Fund's transfer, dividend disbursing, and shareholder servicing agent. FIIOC receives an asset-based fee with respect to each class. Each class (with the exception of Investor Class) pays a transfer agent fee, excluding out of pocket expenses, equal to an annual rate of .07% of average net assets. Investor Class pays a monthly asset-based transfer agent fee of .15% of average net assets. In addition, FIIOC receives an asset-based fee of .0035% of average net assets for typesetting, printing and mailing of shareholder reports, except proxy statements. FIIOC voluntarily agreed to reimburse or waive this fee for the period January 1, 2013 through December 31, 2013 (see Expense Reductions note). For the period, transfer agent fees for each class, including printing and out of pocket expenses, were as follows:
Initial Class | $ 19,119 |
Investor Class | 72,050 |
| $ 91,169 |
Annual Report
5. Fees and Other Transactions with Affiliates - continued
Transfer Agent Fees - continued
Effective February 1, 2014, the Board of Trustees approved an amendment to the transfer agent fee agreement whereby each class (with the exception of Investor Class) pays a single fee of .07% of average net assets for transfer agent services, typesetting, printing and mailing of shareholder reports, excluding mailing of proxy statements and out of pocket expenses. Investor Class pays a single fee of .15% of average net assets.
Accounting and Security Lending Fees. Fidelity Service Company, Inc. (FSC), an affiliate of the investment adviser, maintains the Fund's accounting records. The accounting fee is based on the level of average net assets for each month. Under a separate contract, FSC administers the security lending program. The security lending fee is based on the number and duration of lending transactions.
Brokerage Commissions. The Fund placed a portion of its portfolio transactions with brokerage firms which are affiliates of the investment adviser. Brokerage commissions are included in net realized gain (loss) and change in net unrealized appreciation (depreciation) in the Statement of Operations. The commissions paid to these affiliated firms were $6,088 for the period.
6. Committed Line of Credit.
The Fund participates with other funds managed by the investment adviser or an affiliate in a $4.25 billion credit facility (the "line of credit") to be utilized for temporary or emergency purposes to fund shareholder redemptions or for other short-term liquidity purposes. The Fund has agreed to pay commitment fees on its pro-rata portion of the line of credit, which amounted to $130 and is reflected in Miscellaneous expenses on the Statement of Operations. During the period, there were no borrowings on this line of credit.
7. Security Lending.
The Fund lends portfolio securities through a lending agent from time to time in order to earn additional income. For equity securities, a lending agent is used and may loan securities to certain qualified borrowers, which prior to August 1, 2013 included Fidelity Capital Markets (FCM), a broker-dealer affiliated with the Fund. On the settlement date of the loan, the Fund receives collateral (in the form of U.S. Treasury obligations, letters of credit and/or cash) against the loaned securities and maintains collateral in an amount not less than 100% of the market value of the loaned securities during the period of the loan. The market value of the loaned securities is determined at the close of business of the Fund and any additional required collateral is delivered to the Fund on the next business day. If the borrower defaults on its obligation to return the securities loaned because of insolvency or other reasons, the Fund may apply collateral received from the borrower against the obligation. The Fund may experience delays and costs in recovering the securities loaned. Any cash collateral received is invested in the Fidelity Securities Lending Cash Central Fund. The value of loaned securities and cash collateral at period end are disclosed on the Fund's Statement of Assets and Liabilities. Security lending income represents the income earned on investing cash collateral, less rebates paid to borrowers and any lending agent fees associated with the loan, plus any premium payments received for lending certain types of securities. Security lending income is presented in the Statement of Operations as a component of income from Fidelity Central Funds. Total security lending income during the period amounted to $11,705. During the period, there were no securities loaned to FCM.
8. Expense Reductions.
The investment adviser or its affiliates agreed to reimburse or waive certain fees during the period as noted in the table below.
Initial Class | $ 923 |
Investor Class | 1,790 |
| $ 2,713 |
Commissions paid to certain brokers with whom the investment adviser, or its affiliates, places trades on behalf of the Fund include an amount in addition to trade execution, which may be rebated back to the Fund to offset certain expenses. This amount totaled $15,166 for the period.
9. Distributions to Shareholders.
Distributions to shareholders of each class were as follows:
Years ended December 31, | 2013 | 2012 |
From net investment income | | |
Initial Class | $ 293,181 | $ 201,732 |
Investor Class | 594,871 | 335,237 |
Total | $ 888,052 | $ 536,969 |
Annual Report
Notes to Financial Statements - continued
10. Share Transactions.
Transactions for each class of shares were as follows:
| Shares | Dollars |
Years ended December 31, | 2013 | 2012 | 2013 | 2012 |
Initial Class | | | | |
Shares sold | 1,853,924 | 1,951,317 | $ 14,964,904 | $ 12,974,029 |
Reinvestment of distributions | 33,252 | 29,407 | 293,181 | 201,732 |
Shares redeemed | (1,387,229) | (1,634,103) | (11,207,395) | (10,743,032) |
Net increase (decrease) | 499,947 | 346,621 | $ 4,050,690 | $ 2,432,729 |
Investor Class | | | | |
Shares sold | 4,538,176 | 3,243,020 | $ 36,834,102 | $ 21,435,970 |
Reinvestment of distributions | 67,599 | 49,011 | 594,871 | 335,237 |
Shares redeemed | (2,478,371) | (1,422,789) | (19,806,345) | (9,208,476) |
Net increase (decrease) | 2,127,404 | 1,869,242 | $ 17,622,628 | $ 12,562,731 |
11. Other.
The Fund's organizational documents provide former and current trustees and officers with a limited indemnification against liabilities arising in connection with the performance of their duties to the Fund. In the normal course of business, the Fund may also enter into contracts that provide general indemnifications. The Fund's maximum exposure under these arrangements is unknown as this would be dependent on future claims that may be made against the Fund. The risk of material loss from such claims is considered remote.
At the end of the period, the investment adviser or its affiliates were the owners of record of 100% of the total outstanding shares of the Fund.
Annual Report
Report of Independent Registered Public Accounting Firm
To the Trustees of Variable Insurance Products Fund IV and the Shareholders of VIP Financial Services Portfolio:
In our opinion, the accompanying statement of assets and liabilities, including the schedule of investments, and the related statements of operations and of changes in net assets and the financial highlights present fairly, in all material respects, the financial position of VIP Financial Services Portfolio (a fund of Variable Insurance Products Fund IV) at December 31, 2013, the results of its operations for the year then ended, the changes in its net assets for each of the two years in the period then ended and the financial highlights for each of the five years in the period then ended, in conformity with accounting principles generally accepted in the United States of America. These financial statements and financial highlights (hereafter referred to as "financial statements") are the responsibility of the VIP Financial Services Portfolio's management. Our responsibility is to express an opinion on these financial statements based on our audits. We conducted our audits of these financial statements in accordance with the standards of the Public Company Accounting Oversight Board (United States). Those standards require that we plan and perform the audit to obtain reasonable assurance about whether the financial statements are free of material misstatement. An audit includes examining, on a test basis, evidence supporting the amounts and disclosures in the financial statements, assessing the accounting principles used and significant estimates made by management, and evaluating the overall financial statement presentation. We believe that our audits, which included confirmation of securities at December 31, 2013 by correspondence with the custodian and brokers, provide a reasonable basis for our opinion.
PricewaterhouseCoopers LLP
Boston, Massachusetts
February 14, 2014
Annual Report
The Trustees and officers of the trust and fund, as applicable, are listed below. The Board of Trustees governs the fund and is responsible for protecting the interests of shareholders. The Trustees are experienced executives who meet periodically throughout the year to oversee the fund's activities, review contractual arrangements with companies that provide services to the fund, oversee management of the risks associated with such activities and contractual arrangements, and review the fund's performance. Ned C. Lautenbach, Ronald P. O'Hanley, and William S. Stavropoulos each oversees 247 funds. David A. Rosow, Garnett A. Smith, and Michael E. Wiley each oversees 74 funds.
The Trustees hold office without limit in time except that (a) any Trustee may resign; (b) any Trustee may be removed by written instrument, signed by at least two-thirds of the number of Trustees prior to such removal; (c) any Trustee who requests to be retired or who has become incapacitated by illness or injury may be retired by written instrument signed by a majority of the other Trustees; and (d) any Trustee may be removed at any special meeting of shareholders by a two-thirds vote of the outstanding voting securities of the trust. The officers hold office without limit in time, except that any officer may resign or may be removed by a vote of a majority of the Trustees at any regular meeting or any special meeting of the Trustees. Except as indicated, each individual has held the office shown or other offices in the same company for the past five years.
Experience, Skills, Attributes, and Qualifications of the Fund's Trustees. The Governance and Nominating Committee has adopted a statement of policy that describes the experience, qualifications, attributes, and skills that are necessary and desirable for potential Independent Trustee candidates (Statement of Policy). The Board believes that each Trustee satisfied at the time he or she was initially elected or appointed a Trustee, and continues to satisfy, the standards contemplated by the Statement of Policy. The Governance and Nominating Committee also engages professional search firms to help identify potential Independent Trustee candidates who have the experience, qualifications, attributes, and skills consistent with the Statement of Policy. From time to time, additional criteria based on the composition and skills of the current Independent Trustees, as well as experience or skills that may be appropriate in light of future changes to board composition, business conditions, and regulatory or other developments, have also been considered by the professional search firms and the Governance and Nominating Committee. In addition, the Board takes into account the Trustees' commitment and participation in Board and committee meetings, as well as their leadership of standing and ad hoc committees throughout their tenure.
In determining that a particular Trustee was and continues to be qualified to serve as a Trustee, the Board has considered a variety of criteria, none of which, in isolation, was controlling. The Board believes that, collectively, the Trustees have balanced and diverse experience, qualifications, attributes, and skills, which allow the Board to operate effectively in governing the fund and protecting the interests of shareholders. Information about the specific experience, skills, attributes, and qualifications of each Trustee, which in each case led to the Board's conclusion that the Trustee should serve (or continue to serve) as a trustee of the fund, is provided below.
Board Structure and Oversight Function. Ronald P. O'Hanley is an interested person (as defined in the 1940 Act) and currently serves as Chairman. The Trustees have determined that an interested Chairman is appropriate and benefits shareholders because an interested Chairman has a personal and professional stake in the quality and continuity of services provided to the fund. Independent Trustees exercise their informed business judgment to appoint an individual of their choosing to serve as Chairman, regardless of whether the Trustee happens to be independent or a member of management. The Independent Trustees have determined that they can act independently and effectively without having an Independent Trustee serve as Chairman and that a key structural component for assuring that they are in a position to do so is for the Independent Trustees to constitute a substantial majority for the Board. The Independent Trustees also regularly meet in executive session. Michael E. Wiley serves as Chairman of the Independent Trustees and as such (i) acts as a liaison between the Independent Trustees and management with respect to matters important to the Independent Trustees and (ii) with management prepares agendas for Board meetings.
Fidelity funds are overseen by different Boards of Trustees. The fund's Board oversees Fidelity's sector portfolios. Other Boards oversee Fidelity's equity and high income funds, and Fidelity's investment grade bond, money market, and asset allocation funds. The use of separate Boards, each with its own committee structure, allows the Trustees of each group of Fidelity funds to focus on the unique issues of the funds they oversee, including common research, investment, and operational issues. On occasion, the separate Boards establish joint committees to address issues of overlapping consequences for the Fidelity funds overseen by each Board.
The Trustees operate using a system of committees to facilitate the timely and efficient consideration of all matters of importance to the Trustees, the fund, and fund shareholders and to facilitate compliance with legal and regulatory requirements and oversight of the fund's activities and associated risks. The Board, acting through its committees, has charged SelectCo and its affiliates with (i) identifying events or circumstances the occurrence of which could have demonstrably adverse effects on the fund's business and/or reputation; (ii) implementing processes and controls to lessen the possibility that such events or circumstances occur or to mitigate the effects of such events or circumstances if they do occur; and (iii) creating and maintaining a system designed to evaluate continuously business and market conditions in order to facilitate the identification and implementation processes described in (i) and (ii) above. Because the day-to-day operations and activities of the fund are carried out by or through SelectCo, its affiliates, and other service providers, the fund's exposure to risks is mitigated but not eliminated by the processes overseen by the Trustees. While each of the Board's committees has responsibility for overseeing different aspects of the fund's activities, oversight is exercised primarily through the Operations and Audit Committees. Appropriate personnel, including but not limited to the fund's Chief Compliance Officer (CCO), SelectCo's internal auditor, the independent accountants, the fund's Treasurer and portfolio management personnel, make periodic reports to the Board's committees, as appropriate. The responsibilities of each standing committee, including their oversight responsibilities, are described further under "Standing Committees of the Fund's Trustees."
The fund's Statements of Additional Information (SAIs) include more information about the Trustees. To request a free copy, call Fidelity at 1-877-208-0098.
Annual Report
Interested Trustee*:
Correspondence intended for the Trustee who is an interested person may be sent to Fidelity Investments, 245 Summer Street, Boston, Massachusetts 02210.
Name, Year of Birth; Principal Occupations and Other Relevant Experience+ |
Ronald P. O'Hanley (1957) |
Year of Election or Appointment: 2011 Trustee Chairman of the Board of Trustees |
| Mr. O'Hanley also serves as Trustee of other Fidelity funds. He is Director of Fidelity SelectCo, LLC (2013-present), FMR Co., Inc. (2010-present), Director of Fidelity Investments Money Management, Inc. (2010-present), Director of Fidelity Research & Analysis Company (2010-present), President of Fidelity Asset Management and Corporate Services and a Member of Fidelity's Executive Committee (2010-present). Previously, Mr. O'Hanley served as President and Chief Executive Officer of BNY Mellon Asset Management (2007-2010). Mr. O'Hanley also served as Vice Chairman of Bank New York Mellon Corp. and a member of that firm's Executive Committee. Prior to the 2007 merger of The Bank of New York and Mellon Financial Corporation, he was Vice Chairman of Mellon Financial Corporation and President and Chief Executive Officer of Mellon Asset Management. He joined Mellon in February 1997. Mr. O'Hanley currently serves as Chairman of the Boston Public Library Foundation Board of Directors and sits on the Board of Directors of Beth Israel Deaconess Medical Center, the Board of Trustees of the Marine Biological Laboratory and the Advisory Board of the Maxwell School of Citizenship and Public Administration at Syracuse University. Mr. O'Hanley also chairs the Council on Asset Management for the Financial Services Roundtable and is a member of the Board of Directors of Institutional Investor's U.S. Institute. |
* Trustee has been determined to be an "Interested Trustee" by virtue of, among other things, his affiliation with the trust or various entities under common control with SelectCo.
+ The information above includes the Trustee's principal occupation during the last five years and other information relating to the experience, attributes, and skills relevant to the Trustee's qualifications to serve as a Trustee, which led to the conclusion that the Trustee should serve as a Trustee for the fund.
Independent Trustees:
Correspondence intended for each Independent Trustee (that is, the Trustees other than the Interested Trustee) may be sent to Fidelity Investments, P.O. Box 55235, Boston, Massachusetts 02205-5235.
Name, Year of Birth; Principal Occupations and Other Relevant Experience+ |
Ned C. Lautenbach (1944) |
Year of Election or Appointment: 2000 Trustee |
| Mr. Lautenbach also serves as Trustee of other Fidelity funds. Mr. Lautenbach currently serves as the Lead Director of the Eaton Corporation Board of Directors (diversified industrial, 1997-present). Mr. Lautenbach is Chairman of the Board of Directors of the Philharmonic Center for the Arts in Naples, Florida (2012-present) and a member of the Council on Foreign Relations (1994-present). Previously, Mr. Lautenbach was a Partner/Advisory Partner at Clayton, Dubilier & Rice, LLC (private equity investment, 1998-2010), as well as a Director of Sony Corporation (2006-2007). |
David A. Rosow (1942) |
Year of Election or Appointment: 2013 Trustee |
| Mr. Rosow also serves as Trustee of other Fidelity funds. Mr. Rosow is Chairman and Chief Executive Officer of International Golf Group, Inc. (golf course development, 1989-present). Previously, Mr. Rosow served as Chairman and Chief Executive Officer of Rosow & Company, Inc. (private investment company, 1989-2011), a Lead Director of Hudson United Bancorp (2001-2006) and as a Director of TD Banknorth (1996-2006). In addition, Mr. Rosow is a member (2008-present) and President (2009-present) of the Town Council of Palm Beach, Florida. Mr. Rosow served as a Member of the Advisory Board of other Fidelity funds (2012-2013). |
Garnett A. Smith (1947) |
Year of Election or Appointment: 2013 Trustee |
| Mr. Smith also serves as Trustee of other Fidelity funds. Prior to Mr. Smith's retirement, he served as Chairman and Chief Executive Officer of Inbrand Corp. (manufacturer of personal absorbent products, 1990-1997). He also served as President (1986-1990) of Inbrand Corp. Prior to his employment with Inbrand Corp., he was employed by a retail fabric chain and North Carolina National Bank. In addition, Mr. Smith is a board member of the Jackson Hole Land Trust (2009-present). Mr. Smith served as a Member of the Advisory Board of other Fidelity funds (2012-2013). |
William S. Stavropoulos (1939) |
Year of Election or Appointment: 2001 Trustee |
| Mr. Stavropoulos also serves as Trustee of other Fidelity funds. Mr. Stavropoulos serves as President and Founder of the Michigan Baseball Foundation, the Great Lakes Loons (2007-present). Mr. Stavropoulos is Chairman Emeritus of the Board of Directors of The Dow Chemical Company, where he previously served in numerous senior management positions, including President, CEO (1995-2000; 2002-2004), Chairman of the Executive Committee (2000-2006), and as a member of the Board of Directors (1990-2006). Currently, Mr. Stavropoulos is Chairman of the Board of Directors of Univar Inc. (global distributor of commodity and specialty chemicals), a Director of Teradata Corporation (data warehousing and technology solutions), and Maersk Inc. (industrial conglomerate), and a member of the Advisory Board for Metalmark Capital LLC (private equity investment, 2005-present). Mr. Stavropoulos is an operating advisor to Clayton, Dubilier & Rice, LLC (private equity investment). In addition, Mr. Stavropoulos is a member of the University of Notre Dame Advisory Council for the College of Science, a Trustee of the Rollin L. Gerstacker Foundation, and a Director of the Naples Philharmonic Center for the Arts. Previously, Mr. Stavropoulos served as a Director of Chemical Financial Corporation (bank holding company, 1993-2012) and Tyco International, Ltd. (multinational manufacturing and services, 2007-2012). |
Michael E. Wiley (1950) |
Year of Election or Appointment: 2008 Trustee Chairman of the Independent Trustees |
| Mr. Wiley also serves as Trustee of other Fidelity funds. Mr. Wiley serves as a Director of Asia Pacific Exploration Consolidated (international oil and gas exploration and production, 2008-present). Mr. Wiley serves as a Director of Tesoro Corporation (independent oil refiner and marketer, 2005-present), and a Director of Bill Barrett Corporation (exploration and production, 2005-present). In addition, Mr. Wiley also serves as a Director of Post Oak Bank (privately-held bank, 2004-present). Previously, Mr. Wiley served as a Trustee of other Fidelity funds (2008-2013), as a member of the Board of Trustees of the University of Tulsa (2000-2006; 2007-2010), as a Senior Energy Advisor of Katzenbach Partners, LLC (consulting, 2006-2007), as an Advisory Director of Riverstone Holdings (private investment), Chairman, President, and CEO of Baker Hughes, Inc. (oilfield services, 2000-2004), and as Director of Spinnaker Exploration Company (exploration and production, 2001-2005). |
+ The information above includes each Trustee's principal occupation during the last five years and other information relating to the experience, attributes, and skills relevant to each Trustee's qualifications to serve as a Trustee, which led to the conclusion that each Trustee should serve as a Trustee for the fund.
Officers:
Except for Anthony R. Rochte, correspondence intended for each officer may be sent to Fidelity Investments, 245 Summer Street, Boston, Massachusetts 02210. Correspondence intended for Mr. Rochte may be sent to SelectCo, 1225 17th Street, Denver, Colorado 80202-5541. Officers appear below in alphabetical order.
Name, Year of Birth; Principal Occupation |
Christopher S. Bartel (1971) |
Year of Election or Appointment: 2009 Vice President |
| Mr. Bartel also serves as Vice President of other funds. Mr. Bartel serves as a Director, President, and Chief Executive Officer of Fidelity Management & Research (Japan) Inc. (2012-present), a Director of Fidelity Management & Research (Hong Kong) (2012-present), and Senior Vice President of Global Equity Research (2010-present). Previously, Mr. Bartel served as Senior Vice President of Equity Research (2009-2010), Managing Director of Research (2006-2009), and an analyst and portfolio manager (2000-2006). |
Elizabeth Paige Baumann (1968) |
Year of Election or Appointment: 2012 Anti-Money Laundering (AML) Officer |
| Ms. Baumann also serves as AML Officer of other funds. She is Chief AML Officer of FMR LLC (2012-present) and is an employee of Fidelity Investments. Previously, Ms. Baumann served as Vice President and Deputy Anti-Money Laundering Officer (2007-2012). |
Marc Bryant (1966) |
Year of Election or Appointment: 2013 Secretary and Chief Legal Officer (CLO) |
| Mr. Bryant also serves as an officer of other funds. He is Senior Vice President and Deputy General Counsel of FMR LLC. Prior to joining Fidelity Investments, Mr. Bryant served as a Senior Vice President and the Head of Global Retail Legal for AllianceBernstein L.P. (2006-2010), and as the General Counsel for ProFund Advisors LLC (2001-2006). |
William C. Coffey (1969) |
Year of Election or Appointment: 2009 Assistant Secretary |
| Mr. Coffey also serves as Assistant Secretary of other funds. He is Senior Vice President and Deputy General Counsel of FMR LLC (2010-present), and is an employee of Fidelity Investments. Previously, Mr. Coffey served as Vice President and Associate General Counsel of FMR LLC (2005-2009). |
Jonathan Davis (1968) |
Year of Election or Appointment: 2010 Assistant Treasurer |
| Mr. Davis also serves as Assistant Treasurer of other funds. Mr. Davis is an employee of Fidelity Investments. Previously, Mr. Davis served as Vice President and Associate General Counsel of FMR LLC (2003-2010). |
Adrien E. Deberghes (1967) |
Year of Election or Appointment: 2013 President and Treasurer |
| Mr. Deberghes also serves as an officer of other funds. He is an employee of Fidelity Investments (2008-present). Prior to joining Fidelity Investments, Mr. Deberghes was Senior Vice President of Mutual Fund Administration at State Street Corporation (2007-2008), Senior Director of Mutual Fund Administration at Investors Bank & Trust (2005-2007), and Director of Finance for Dunkin' Brands (2000-2005). |
Stephanie J. Dorsey (1969) |
Year of Election or Appointment: 2010 Assistant Treasurer |
| Ms. Dorsey also serves as an officer of other funds. She is an employee of Fidelity Investments (2008-present) and has served in other fund officer roles. Prior to joining Fidelity Investments, Ms. Dorsey served as Treasurer (2004-2008) of the JPMorgan Mutual Funds and Vice President (2004-2008) of JPMorgan Chase Bank. |
Joseph A. Hanlon (1968) |
Year of Election or Appointment: 2012 Chief Compliance Officer |
| Mr. Hanlon also serves as Chief Compliance Officer of other funds. Mr. Hanlon serves as Compliance Officer of FMR, FMR Co., Inc., Fidelity Investments Money Management, Inc. (FIMM), Fidelity Research and Analysis Company (FRAC), and Fidelity Management & Research (Hong Kong) (2009-present), as Senior Vice President of the Fidelity Asset Management Division (2009-present), and is an employee of Fidelity Investments. Previously, Mr. Hanlon served as Compliance Officer of Fidelity Management & Research (Japan) Inc. (2009-2013), Strategic Advisers, Inc. (2009-2013), and Fidelity Management & Research (U.K.) Inc. (2009-2013). |
Brian B. Hogan (1964) |
Year of Election or Appointment: 2009 Vice President |
| Mr. Hogan also serves as Vice President of other funds. Mr. Hogan serves as President of FMR's Equity Division (2009-present). Previously, Mr. Hogan served as Senior Vice President, Equity Research of FMR (2006-2009) and as a portfolio manager. |
Chris Maher (1972) |
Year of Election or Appointment: 2013 Assistant Treasurer |
| Mr. Maher serves as Assistant Treasurer of other funds. Mr. Maher is Vice President of Valuation Oversight and is an employee of Fidelity Investments. Previously, Mr. Maher served as Vice President of Asset Management Compliance (2013), Vice President of FMR's Program Management Group (2010-2013), and Vice President of Valuation Oversight (2008-2010). |
Christine Reynolds (1958) |
Year of Election or Appointment: 2008 Chief Financial Officer |
| Ms. Reynolds also serves as Chief Financial Officer of other funds. Ms. Reynolds became President of Fidelity Pricing and Cash Management Services (FPCMS) in August 2008. Ms. Reynolds served as Chief Operating Officer of FPCMS (2007-2008). Previously, Ms. Reynolds served as President, Treasurer, and Anti-Money Laundering officer of the Fidelity funds (2004-2007). |
Kenneth B. Robins (1969) |
Year of Election or Appointment: 2013 Deputy Treasurer |
| Mr. Robins also serves as an officer of other funds. Mr. Robins serves as Executive Vice President of Fidelity Investments Money Management, Inc. (FIMM) (2013-present) and is an employee of Fidelity Investments (2004-present). Previously, Mr. Robins served in other fund officer roles. |
Anthony R. Rochte (1968) |
Year of Election or Appointment: 2013 Vice President |
| Mr. Rochte also serves as Vice President of other funds. Mr. Rochte serves as President of Fidelity SelectCo, LLC (2012-present) and is an employee of Fidelity Investments (2012-present). Prior to joining Fidelity Investments, Mr. Rochte served as Senior Managing Director and head of State Street Global Advisors' North American Intermediary Business Group (2006-2012). |
Stacie M. Smith (1974) |
Year of Election or Appointment: 2013 Assistant Treasurer |
| Ms. Smith also serves as an officer of other funds. She is an employee of Fidelity Investments (2009-present) and has served in other fund officer roles. Prior to joining Fidelity Investments, Ms. Smith served as Senior Audit Manager of Ernst & Young LLP (1996-2009). |
Renee Stagnone (1975) |
Year of Election or Appointment: 2013 Deputy Treasurer |
| Ms. Stagnone also serves as Deputy Treasurer of other funds. Ms. Stagnone is an employee of Fidelity Investments. |
Joseph F. Zambello (1957) |
Year of Election or Appointment: 2011 Deputy Treasurer |
| Mr. Zambello also serves as Deputy Treasurer of other funds. Mr. Zambello is an employee of Fidelity Investments. Previously, Mr. Zambello served as Vice President of FMR's Program Management Group (2009-2011) and Vice President of the Transfer Agent Oversight Group (2005-2009). |
Annual Report
Initial Class designates 72% and Investor Class designates 76% of the dividends distributed during the fiscal year as qualifying for the dividends-received deduction for corporate shareholders.
Annual Report
A special meeting of Financial Services Portfolio's shareholders was held on May 14, 2013. The results of votes taken among shareholders on the proposals before them are reported below. Each vote reported represents one dollar of net asset value held on the record date for the meeting.
PROPOSAL 1 |
To elect a Board of Trustees.A |
| # of
Votes | % of
Votes |
Ned C. Lautenbach |
Affirmative | 1,555,133,782.46 | 93.955 |
Withheld | 100,063,694.32 | 6.045 |
TOTAL | 1,655,197,476.78 | 100.000 |
Ronald P. O'Hanley |
Affirmative | 1,557,988,095.28 | 94.128 |
Withheld | 97,209,381.50 | 5.872 |
TOTAL | 1,655,197,476.78 | 100.000 |
David A. Rosow |
Affirmative | 1,552,645,347.31 | 93.805 |
Withheld | 102,552,129.47 | 6.195 |
TOTAL | 1,655,197,476.78 | 100.000 |
Garnett A. Smith |
Affirmative | 1,554,582,880.53 | 93.922 |
Withheld | 100,614,596.25 | 6.078 |
TOTAL | 1,655,197,476.78 | 100.000 |
William S. Stavropoulos |
Affirmative | 1,548,352,452.21 | 93.545 |
Withheld | 106,845,024.57 | 6.455 |
TOTAL | 1,655,197,476.78 | 100.000 |
Michael E. Wiley |
Affirmative | 1,556,790,374.70 | 94.055 |
Withheld | 98,407,102.08 | 5.945 |
TOTAL | 1,655,197,476.78 | 100.000 |
PROPOSAL 2 |
To approve a management contract between the fund and Fidelity SelectCo, LLC. |
| # of
Votes | % of
Votes |
Affirmative | 58,500,019.60 | 89.134 |
Against | 5,552,539.71 | 8.460 |
Abstain | 1,579,557.62 | 2.406 |
TOTAL | 65,632,116.93 | 100.000 |
A Denotes trust-wide proposal and voting results. |
Annual Report
Investment Adviser
Fidelity SelectCo, LLC
Denver, CO
Investment Sub-Advisers
FMR Co., Inc.
Fidelity Management & Research (U.K.) Inc.
Fidelity Management & Research (Hong Kong) Limited
Fidelity Management & Research (Japan) Inc.
General Distributor
Fidelity Distributors Corporation
Smithfield, RI
Transfer and Service Agents
Fidelity Investments Institutional Operations Company, Inc.
Boston, MA
Fidelity Service Company, Inc.
Boston, MA
Custodian
JPMorgan Chase Bank
New York, NY
VFSIC-ANN-0214
1.817367.109
Fidelity® Variable Insurance Products:
Health Care Portfolio
Annual Report
December 31, 2013
(Fidelity Cover Art)
Contents
Performance | (Click Here) | How the fund has done over time. |
Management's Discussion of Fund Performance | (Click Here) | The Portfolio Manager's review of fund performance and strategy. |
Shareholder Expense Example | (Click Here) | An example of shareholder expenses. |
Investment Changes | (Click Here) | A summary of major shifts in the fund's investments over the past six months. |
Investments | (Click Here) | A complete list of the fund's investments with their market values. |
Financial Statements | (Click Here) | Statements of assets and liabilities, operations, and changes in net assets, as well as financial highlights. |
Notes | (Click Here) | Notes to the financial statements. |
Report of Independent Registered Public Accounting Firm | (Click Here) | |
Trustees and Officers | (Click Here) | |
Distributions | (Click Here) | |
Proxy Voting Results | (Click Here) | |
To view a fund's proxy voting guidelines and proxy voting record for the 12-month period ended June 30, visit http://www.fidelity.com/proxyvotingresults or visit the Securities and Exchange Commission's (SEC) web site at http://www.sec.gov. You may also call 1-877-208-0098 to request a free copy of the proxy voting guidelines.
Fidelity® Variable Insurance Products are separate account options which are purchased through a variable insurance contract.
Standard & Poor's, S&P and S&P 500 are registered service marks of The McGraw-Hill Companies, Inc. and have been licensed for use by Fidelity Distributors Corporation.
Other third-party marks appearing herein are the property of their respective owners.
All other marks appearing herein are registered or unregistered trademarks or service marks of FMR LLC or an affiliated company. © 2014 FMR LLC. All rights reserved.
This report and the financial statements contained herein are submitted for the general information of the shareholders of the fund. This report is not authorized for distribution to prospective investors in the fund unless preceded or accompanied by an effective prospectus.
A fund files its complete schedule of portfolio holdings with the SEC for the first and third quarters of each fiscal year on Form N-Q. Forms N-Q are available on the SEC's web site at http://www.sec.gov. A fund's Forms N-Q may be reviewed and copied at the SEC's Public Reference Room in Washington, DC. Information regarding the operation of the SEC's Public Reference Room may be obtained by calling 1-800-SEC-0330. For a complete list of the fund's portfolio holdings, view the most recent holdings listing, semiannual report, or annual report on Fidelity's web site at http://www.fidelity.com, http://www.advisor.fidelity.com, or http://www.401k.com, as applicable.
NOT FDIC INSURED • MAY LOSE VALUE • NO BANK GUARANTEE
Neither the fund nor Fidelity Distributors Corporation is a bank.
Annual Report
Average annual total return reflects the change in the value of an investment, assuming reinvestment of the class' distributions from dividend income and capital gains (the profits earned upon the sale of securities that have grown in value, if any) and assuming a constant rate of performance each year. During periods of reimbursement by Fidelity, a fund's total return will be greater than it would be had the reimbursement not occurred. Performance numbers are net of all underlying fund operating expenses, but do not include any insurance charges imposed by your insurance company's separate account. If performance information included the effect of these additional charges, the total returns would have been lower. How a fund did yesterday is no guarantee of how it will do tomorrow.
Average Annual Total Returns
Periods ended December 31, 2013 | Past 1
year | Past 5
years | Past 10
years |
VIP Health Care Portfolio - Initial Class | 56.12% | 26.06% | 12.41% |
VIP Health Care Portfolio - Investor Class A | 55.91% | 25.93% | 12.31% |
A The initial offering of Investor Class took place on July 21, 2005. Returns prior to July 21, 2005 are those of Initial Class. Had Investor Class's transfer agent fee been reflected, returns prior to July 21, 2005 would have been lower.
$10,000 Over 10 Years
Let's say hypothetically that $10,000 was invested in VIP Health Care Portfolio - Initial Class on December 31, 2003. The chart shows how the value of your investment would have changed, and also shows how the S&P 500® Index performed over the same period.
Annual Report
Market Recap: Global equity markets remained upbeat for the 12 months ending December 31, 2013, propelling the MSCI® ACWI® (All Country World Index) Index to a 23.24% return. Midyear turbulence gave way by autumn when policymakers in the U.S. and China had made clear their intentions to maintain accommodative monetary policies. That stance, combined with modest cyclical improvement around the globe and generally low valuations, underpinned the broad rally in equities, although the relative strength of the U.S. dollar generally tempered gains for U.S. investors holding foreign securities based in local currencies. During the period, the broad-market S&P 500® Index set a series of new highs, finishing the year up 32.39%. For the first time since 1995, the S&P® scored a "perfect 10," with all 10 economic sectors gaining at least 10% for the year. A resurgence in growth-oriented stocks lifted the Nasdaq Composite Index® to a 40.12% result for 2013, while the blue-chip Dow Jones Industrial AverageSM notched a relatively more modest 29.65% gain. International developed-markets equities rose in concert with their U.S. counterparts, with the MSCI® EAFE® Index gaining 22.92% for the period. Meanwhile, foreign exchange and commodity weakness curbed results in resource-heavy emerging markets (EM), especially in the year's waning months. More generally, concern over EM's slowing growth, its declining share of global trade and uncertainty surrounding U.S. central bank intentions were all factors hampering performance. The MSCI Emerging Markets Index returned -2.27% for the period. On the bond side, U.S. high-yield securities rallied with equities for much of the period, with The BofA Merrill LynchSM US High Yield Constrained Index returning 7.41% for 2013. The more rate-sensitive U.S. investment-grade bond category faced headwinds though, as reflected in the -2.02% return of The Barclays® U.S. Aggregate Bond Index. Within the Barclays index, investment-grade corporate credit returned -2.01%, while ultra-safe U.S. Treasuries saw a -2.75% result. Major non-U.S. developed markets performed only slightly better, with the Citigroup® Non-USD Group-of-Seven (G7) Equal Weighted Index logging a -1.59% result. After several years of strong advances, EM debt reversed course in 2013, with the J.P. Morgan Emerging Markets Bond Index Global returning -6.58%.
Comments from Edward Yoon, Portfolio Manager of VIP Health Care Portfolio: For the year, fund's share classes easily beat the 42.84% gain of the MSCI® U.S. IMI Health Care 25-50 Index, as well as the broad-based S&P 500®. (For specific portfolio results, please refer to the performance section of this report.) Versus the sector benchmark, the fund did well with life science tools & services companies, where I sought stable firms with open-ended growth opportunities, competitive advantages and strong management teams. In February, I reestablished a stake in genetic analysis toolmaker Illumina, which was a good call since its share price nearly doubled for the year, making the stock our top relative contributor. A substantial overweighting in biotechnology provided a lift, despite security selection here that weighed on performance. Biotech was easily the best-performing area in the index, but the group experienced a major sell-off during the fall. Given my desire to protect investors from material capital impairment, I reduced exposure to parts of the biotech market. An example of a stock here that helped was hepatitis C drugmaker Gilead Sciences. Elsewhere, stock picks in pharmaceuticals helped the most. Conversely, it hurt the most to avoid index name Celgene, a large-cap biotech name that outperformed. Positioning in health care services also hurt, most notably a non-index stake in Canada-based pharmacy benefit manager (PBM) Catamaran. The fund's small cash stake also detracted in an up market.
The views expressed above reflect those of the portfolio manager(s) only through the end of the period as stated on the cover of this report and do not necessarily represent the views of Fidelity or any other person in the Fidelity organization. Any such views are subject to change at any time based upon market or other conditions and Fidelity disclaims any responsibility to update such views. These views may not be relied on as investment advice and, because investment decisions for a Fidelity fund are based on numerous factors, may not be relied on as an indication of trading intent on behalf of any Fidelity fund.
Annual Report
As a shareholder of the Fund, you incur two types of costs: (1) transaction costs, including redemption fees and (2) ongoing costs, including management fees and other Fund expenses. This Example is intended to help you understand your ongoing costs (in dollars) of investing in the Fund and to compare these costs with the ongoing costs of investing in other mutual funds.
The Example is based on an investment of $1,000 invested at the beginning of the period and held for the entire period (July 1, 2013 to December 31, 2013).
Actual Expenses
The first line of the accompanying table for each class of the Fund provides information about actual account values and actual expenses. You may use the information in this line, together with the amount you invested, to estimate the expenses that you paid over the period. Simply divide your account value by $1,000.00 (for example, an $8,600 account value divided by $1,000.00 = 8.6), then multiply the result by the number in the first line for a class of the Fund under the heading entitled "Expenses Paid During Period" to estimate the expenses you paid on your account during this period. The estimate of expenses does not include any fees or other expenses of any variable annuity or variable life insurance product. If they were, the estimate of expenses you paid during the period would be higher, and your ending account value would be lower. In addition, the Fund, as a shareholder in the underlying Fidelity Central Funds, will indirectly bear its pro-rata share of the fees and expenses incurred by the underlying Fidelity Central Funds. These fees and expenses are not included in the Fund's annualized expense ratio used to calculate the expense estimate in the table below.
Hypothetical Example for Comparison Purposes
The second line of the accompanying table for each class of the Fund provides information about hypothetical account values and hypothetical expenses based on a Class' actual expense ratio and an assumed rate of return of 5% per year before expenses, which is not the Class' actual return. The hypothetical account values and expenses may not be used to estimate the actual ending account balance or expenses you paid for the period. You may use this information to compare the ongoing costs of investing in the Fund and other funds. To do so, compare this 5% hypothetical example with the 5% hypothetical examples that appear in the shareholder reports of the other funds. The estimate of expenses does not include any fees or other expenses of any variable annuity or variable life insurance product. If they were, the estimate of expenses you paid during the period would be higher, and your ending account value would be lower. In addition, the Fund, as a shareholder in the underlying Fidelity Central Funds, will indirectly bear its pro-rata share of the fees and expenses incurred by the underlying Fidelity Central Funds. These fees and expenses are not included in the Fund's annualized expense ratio used to calculate the expense estimate in the table below.
Please note that the expenses shown in the table are meant to highlight your ongoing costs only and do not reflect any transaction costs. Therefore, the second line of the table is useful in comparing ongoing costs only, and will not help you determine the relative total costs of owning different funds. In addition, if these transactional costs were included, your costs would have been higher.
| Annualized
Expense Ratio B | Beginning
Account Value
July 1, 2013 | Ending
Account Value
December 31, 2013 | Expenses Paid
During Period*
July 1, 2013
to December 31, 2013 |
Initial Class | .69% | | | |
Actual | | $ 1,000.00 | $ 1,278.40 | $ 3.96 |
HypotheticalA | | $ 1,000.00 | $ 1,021.73 | $ 3.52 |
Investor Class | .77% | | | |
Actual | | $ 1,000.00 | $ 1,277.70 | $ 4.42 |
HypotheticalA | | $ 1,000.00 | $ 1,021.32 | $ 3.92 |
A 5% return per year before expenses
B Annualized expense ratio reflects expenses net of applicable fee waivers.
* Expenses are equal to each Class' annualized expense ratio, multiplied by the average account value over the period, multiplied by 184/365 (to reflect the one-half year period).
Annual Report
Investment Changes (Unaudited)
Top Ten Stocks as of December 31, 2013 |
| % of fund's
net assets | % of fund's net assets
6 months ago |
Gilead Sciences, Inc. | 5.7 | 7.4 |
Actavis PLC | 5.2 | 4.0 |
Amgen, Inc. | 5.0 | 6.9 |
Biogen Idec, Inc. | 4.0 | 0.9 |
Thermo Fisher Scientific, Inc. | 3.6 | 0.0 |
McKesson Corp. | 3.6 | 3.3 |
Boston Scientific Corp. | 3.5 | 3.2 |
Alexion Pharmaceuticals, Inc. | 3.5 | 2.6 |
Perrigo Co. PLC | 2.9 | 1.6 |
Illumina, Inc. | 2.9 | 2.7 |
| 39.9 | |
Top Industries (% of fund's net assets) |
As of December 31, 2013 |
| Biotechnology | 29.3% | |
| Pharmaceuticals | 26.3% | |
| Health Care Providers & Services | 15.5% | |
| Health Care Equipment & Supplies | 14.4% | |
| Life Sciences Tools & Services | 6.9% | |
| All Others* | 7.6% | |

As of June 30, 2013 |
| Biotechnology | 33.4% | |
| Pharmaceuticals | 27.0% | |
| Health Care Providers & Services | 17.0% | |
| Health Care Equipment & Supplies | 9.2% | |
| Health Care Technology | 5.2% | |
| All Others* | 8.2% | |

* Includes short-term investments and net other assets (liabilities). |
Annual Report
Investments December 31, 2013
Showing Percentage of Net Assets
Common Stocks - 99.2% |
| Shares | | Value |
BIOTECHNOLOGY - 29.3% |
Biotechnology - 29.3% |
Actelion Ltd. | 31,961 | | $ 2,699,693 |
Aegerion Pharmaceuticals, Inc. (a) | 47,219 | | 3,350,660 |
Alexion Pharmaceuticals, Inc. (a) | 144,915 | | 19,282,390 |
Alnylam Pharmaceuticals, Inc. (a) | 9,300 | | 598,269 |
AMAG Pharmaceuticals, Inc. (a) | 50,000 | | 1,213,500 |
Amgen, Inc. | 241,177 | | 27,532,766 |
Array BioPharma, Inc. (a) | 300,000 | | 1,503,000 |
Biogen Idec, Inc. (a) | 79,048 | | 22,113,678 |
Cubist Pharmaceuticals, Inc. | 96,691 | | 6,659,109 |
Discovery Laboratories, Inc. (a)(d) | 480,804 | | 1,081,809 |
Dyax Corp. (a) | 150,000 | | 1,129,500 |
Genomic Health, Inc. (a) | 42,200 | | 1,235,194 |
Gilead Sciences, Inc. (a) | 420,290 | | 31,584,792 |
Grifols SA ADR | 148,182 | | 5,352,334 |
Innate Pharma SA (a) | 21,000 | | 143,293 |
Insmed, Inc. (a) | 96,672 | | 1,644,391 |
Intercept Pharmaceuticals, Inc. (a) | 23,179 | | 1,582,662 |
InterMune, Inc. (a) | 205,920 | | 3,033,202 |
Kamada (a) | 108,100 | | 1,607,447 |
Kindred Biosciences, Inc. | 74,100 | | 825,474 |
Medivation, Inc. (a) | 57,400 | | 3,663,268 |
Neurocrine Biosciences, Inc. (a) | 191,700 | | 1,790,478 |
Novavax, Inc. (a) | 300,000 | | 1,536,000 |
NPS Pharmaceuticals, Inc. (a) | 52,669 | | 1,599,031 |
Pharmacyclics, Inc. (a) | 22,515 | | 2,381,637 |
PTC Therapeutics, Inc. (a) | 60,000 | | 1,018,200 |
Puma Biotechnology, Inc. (a) | 29,800 | | 3,085,194 |
Regeneron Pharmaceuticals, Inc. (a) | 24,300 | | 6,688,332 |
Spectrum Pharmaceuticals, Inc. | 92,700 | | 820,395 |
Swedish Orphan Biovitrum AB (a) | 171,696 | | 1,781,868 |
Vanda Pharmaceuticals, Inc. (a)(d) | 115,600 | | 1,434,596 |
Vertex Pharmaceuticals, Inc. (a) | 11,100 | | 824,730 |
ZIOPHARM Oncology, Inc. (a) | 206,000 | | 894,040 |
| | 161,690,932 |
DIVERSIFIED CONSUMER SERVICES - 0.3% |
Specialized Consumer Services - 0.3% |
Carriage Services, Inc. | 92,659 | | 1,809,630 |
FOOD & STAPLES RETAILING - 0.4% |
Drug Retail - 0.4% |
CVS Caremark Corp. | 31,054 | | 2,222,535 |
HEALTH CARE EQUIPMENT & SUPPLIES - 14.4% |
Health Care Equipment - 13.0% |
Accuray, Inc. (a) | 113,000 | | 984,230 |
Boston Scientific Corp. (a) | 1,612,700 | | 19,384,654 |
Cardiovascular Systems, Inc. (a) | 47,600 | | 1,632,204 |
CONMED Corp. | 80,413 | | 3,417,553 |
Covidien PLC | 112,400 | | 7,654,440 |
Edwards Lifesciences Corp. (a) | 48,465 | | 3,187,058 |
|
| Shares | | Value |
Exactech, Inc. (a) | 60,000 | | $ 1,425,600 |
HeartWare International, Inc. (a) | 34,719 | | 3,262,197 |
Insulet Corp. (a) | 69,200 | | 2,567,320 |
Intuitive Surgical, Inc. (a) | 18,550 | | 7,124,684 |
Masimo Corp. | 143,190 | | 4,185,444 |
Smith & Nephew PLC sponsored ADR (d) | 54,000 | | 3,873,960 |
Stryker Corp. | 94,311 | | 7,086,529 |
Volcano Corp. (a)(d) | 172,491 | | 3,768,928 |
Zeltiq Aesthetics, Inc. (a) | 114,972 | | 2,174,121 |
| | 71,728,922 |
Health Care Supplies - 1.4% |
Derma Sciences, Inc. (a) | 130,000 | | 1,406,600 |
The Cooper Companies, Inc. | 48,074 | | 5,953,484 |
| | 7,360,084 |
TOTAL HEALTH CARE EQUIPMENT & SUPPLIES | | 79,089,006 |
HEALTH CARE PROVIDERS & SERVICES - 15.5% |
Health Care Distributors & Services - 4.0% |
Amplifon SpA | 349,800 | | 1,943,166 |
McKesson Corp. | 123,236 | | 19,890,290 |
| | 21,833,456 |
Health Care Facilities - 2.0% |
AmSurg Corp. (a) | 30,000 | | 1,377,600 |
Brookdale Senior Living, Inc. (a) | 63,405 | | 1,723,348 |
Emeritus Corp. (a) | 64,200 | | 1,388,646 |
Hanger, Inc. (a) | 30,890 | | 1,215,213 |
NMC Health PLC | 200,000 | | 1,450,943 |
Ramsay Health Care Ltd. | 36,047 | | 1,392,382 |
Surgical Care Affiliates, Inc. | 68,239 | | 2,377,447 |
| | 10,925,579 |
Health Care Services - 4.2% |
Accretive Health, Inc. (a) | 100,000 | | 916,000 |
Air Methods Corp. | 40,661 | | 2,371,756 |
Catamaran Corp. (a) | 215,200 | | 10,220,607 |
MEDNAX, Inc. (a) | 112,422 | | 6,001,086 |
Quest Diagnostics, Inc. | 66,200 | | 3,544,348 |
| | 23,053,797 |
Managed Health Care - 5.3% |
Aetna, Inc. | 15,408 | | 1,056,835 |
Cigna Corp. | 135,688 | | 11,869,986 |
Humana, Inc. | 77,419 | | 7,991,189 |
UnitedHealth Group, Inc. | 112,407 | | 8,464,247 |
| | 29,382,257 |
TOTAL HEALTH CARE PROVIDERS & SERVICES | | 85,195,089 |
HEALTH CARE TECHNOLOGY - 3.3% |
Health Care Technology - 3.3% |
athenahealth, Inc. (a)(d) | 11,311 | | 1,521,330 |
Cerner Corp. (a) | 250,100 | | 13,940,574 |
Common Stocks - continued |
| Shares | | Value |
HEALTH CARE TECHNOLOGY - CONTINUED |
Health Care Technology - continued |
HealthStream, Inc. (a) | 52,508 | | $ 1,720,687 |
HMS Holdings Corp. (a) | 52,700 | | 1,197,871 |
| | 18,380,462 |
INDUSTRIAL CONGLOMERATES - 1.2% |
Industrial Conglomerates - 1.2% |
Danaher Corp. | 84,195 | | 6,499,854 |
IT SERVICES - 0.4% |
Data Processing & Outsourced Services - 0.4% |
Maximus, Inc. | 53,520 | | 2,354,345 |
LIFE SCIENCES TOOLS & SERVICES - 6.9% |
Life Sciences Tools & Services - 6.9% |
Bruker BioSciences Corp. (a) | 103,100 | | 2,038,287 |
Illumina, Inc. (a)(d) | 143,632 | | 15,888,572 |
Thermo Fisher Scientific, Inc. | 179,234 | | 19,957,706 |
| | 37,884,565 |
PHARMACEUTICALS - 26.3% |
Pharmaceuticals - 26.3% |
AbbVie, Inc. | 226,865 | | 11,980,741 |
Actavis PLC (a) | 171,597 | | 28,828,296 |
Aratana Therapeutics, Inc. | 8,999 | | 171,881 |
Aratana Therapeutics, Inc. (e) | 64,925 | | 1,116,061 |
Bayer AG | 48,100 | | 6,746,151 |
Dechra Pharmaceuticals PLC | 187,900 | | 2,185,850 |
Impax Laboratories, Inc. (a) | 65,257 | | 1,640,561 |
Jazz Pharmaceuticals PLC (a) | 19,453 | | 2,461,972 |
Lee's Pharmaceutical Holdings Ltd. | 1,060,000 | | 1,004,733 |
Merck & Co., Inc. | 193,906 | | 9,704,995 |
Mylan, Inc. (a) | 168,700 | | 7,321,580 |
Ono Pharmaceutical Co. Ltd. | 23,800 | | 2,086,200 |
Orexo AB (a)(d) | 74,881 | | 1,909,324 |
Pacira Pharmaceuticals, Inc. (a) | 41,300 | | 2,374,337 |
Perrigo Co. PLC | 104,000 | | 15,959,840 |
Prestige Brands Holdings, Inc. (a) | 76,944 | | 2,754,595 |
Salix Pharmaceuticals Ltd. (a) | 141,219 | | 12,701,237 |
Shire PLC sponsored ADR | 86,587 | | 12,233,877 |
Teva Pharmaceutical Industries Ltd. sponsored ADR | 136,900 | | 5,486,952 |
The Medicines Company (a) | 100,000 | | 3,862,000 |
UCB SA | 46,500 | | 3,463,339 |
Valeant Pharmaceuticals International, Inc. (Canada) (a) | 55,760 | | 6,541,597 |
Zoetis, Inc. Class A | 78,700 | | 2,572,703 |
| | 145,108,822 |
PROFESSIONAL SERVICES - 1.1% |
Human Resource & Employment Services - 1.1% |
Towers Watson & Co. | 28,802 | | 3,675,423 |
WageWorks, Inc. (a) | 43,104 | | 2,562,102 |
| | 6,237,525 |
|
| Shares | | Value |
REAL ESTATE MANAGEMENT & DEVELOPMENT - 0.1% |
Real Estate Development - 0.1% |
PT Lippo Karawaci Tbk | 8,436,500 | | $ 631,610 |
TOTAL COMMON STOCKS (Cost $419,226,368) |
547,104,375
|
Convertible Preferred Stocks - 0.1% |
| | | |
HEALTH CARE TECHNOLOGY - 0.1% |
Health Care Technology - 0.1% |
Castlight Health, Inc. Series D (a)(e)
(Cost $633,235) | 104,900 | |
835,004
|
Money Market Funds - 3.7% |
| | | |
Fidelity Cash Central Fund, 0.11% (b) | 6,075,555 | | 6,075,555 |
Fidelity Securities Lending Cash Central Fund, 0.11% (b)(c) | 14,481,698 | | 14,481,698 |
TOTAL MONEY MARKET FUNDS (Cost $20,557,253) |
20,557,253
|
TOTAL INVESTMENT PORTFOLIO - 103.0% (Cost $440,416,856) | | 568,496,632 |
NET OTHER ASSETS (LIABILITIES) - (3.0)% | | (16,718,241) |
NET ASSETS - 100% | $ 551,778,391 |
Legend |
(a) Non-income producing |
(b) Affiliated fund that is generally available only to investment companies and other accounts managed by Fidelity Investments. The rate quoted is the annualized seven-day yield of the fund at period end. A complete unaudited listing of the fund's holdings as of its most recent quarter end is available upon request. In addition, each Fidelity Central Fund's financial statements, which are not covered by the Fund's Report of Independent Registered Public Accounting Firm, are available on the SEC's website or upon request. |
(c) Investment made with cash collateral received from securities on loan. |
(d) Security or a portion of the security is on loan at period end. |
(e) Restricted securities - Investment in securities not registered under the Securities Act of 1933 (excluding 144A issues). At the end of the period, the value of restricted securities (excluding 144A issues) amounted to $1,951,065 or 0.4% of net assets. |
Additional information on each restricted holding is as follows: |
Security | Acquisition Date | Acquisition Cost |
Aratana Therapeutics, Inc. | 10/14/13 | $ 1,038,800 |
Castlight Health, Inc. Series D | 4/25/12 | $ 633,235 |
Affiliated Central Funds |
Information regarding fiscal year to date income earned by the Fund from investments in Fidelity Central Funds is as follows: |
Fund | Income earned |
Fidelity Cash Central Fund | $ 7,550 |
Fidelity Securities Lending Cash Central Fund | 92,347 |
Total | $ 99,897 |
Other Information |
The following is a summary of the inputs used, as of December 31, 2013, involving the Fund's assets and liabilities carried at fair value. The inputs or methodology used for valuing securities may not be an indication of the risk associated with investing in those securities. For more information on valuation inputs, and their aggregation into the levels used in the table below, please refer to the Investment Valuation section in the accompanying Notes to Financial Statements. |
Valuation Inputs at Reporting Date: |
Description | Total | Level 1 | Level 2 | Level 3 |
Investments in Securities: | | | | |
Common Stocks | $ 547,104,375 | $ 543,270,504 | $ 3,833,871 | $ - |
Convertible Preferred Stocks | 835,004 | - | - | 835,004 |
Money Market Funds | 20,557,253 | 20,557,253 | - | - |
Total Investments in Securities: | $ 568,496,632 | $ 563,827,757 | $ 3,833,871 | $ 835,004 |
Distribution of investments by country or territory of incorporation, as a percentage of total net assets, is as follows (Unaudited): |
United States of America | 76.7% |
Ireland | 10.0% |
Canada | 3.1% |
Bailiwick of Jersey | 2.2% |
United Kingdom | 1.4% |
Israel | 1.3% |
Germany | 1.2% |
Spain | 1.0% |
Others (Individually Less Than 1%) | 3.1% |
| 100.0% |
See accompanying notes which are an integral part of the financial statements.
Annual Report
Statement of Assets and Liabilities
| December 31, 2013 |
| | |
Assets | | |
Investment in securities, at value (including securities loaned of $14,100,527) - See accompanying schedule: Unaffiliated issuers (cost $419,859,603) | $ 547,939,379 | |
Fidelity Central Funds (cost $20,557,253) | 20,557,253 | |
Total Investments (cost $440,416,856) | | $ 568,496,632 |
Receivable for investments sold | | 68,895 |
Receivable for fund shares sold | | 63,791 |
Dividends receivable | | 217,392 |
Distributions receivable from Fidelity Central Funds | | 10,731 |
Prepaid expenses | | 2,768 |
Other receivables | | 8,060 |
Total assets | | 568,868,269 |
| | |
Liabilities | | |
Payable for investments purchased | $ 1,422,720 | |
Payable for fund shares redeemed | 826,754 | |
Accrued management fee | 243,016 | |
Other affiliated payables | 71,593 | |
Other payables and accrued expenses | 44,097 | |
Collateral on securities loaned, at value | 14,481,698 | |
Total liabilities | | 17,089,878 |
| | |
Net Assets | | $ 551,778,391 |
Net Assets consist of: | | |
Paid in capital | | $ 396,882,353 |
Accumulated undistributed net realized gain (loss) on investments and foreign currency transactions | | 26,818,091 |
Net unrealized appreciation (depreciation) on investments and assets and liabilities in foreign currencies | | 128,077,947 |
Net Assets | | $ 551,778,391 |
Statement of Assets and Liabilities - continued
| December 31, 2013 |
| | |
Initial Class:
Net Asset Value, offering price and redemption price per share ($167,493,324 ÷ 7,423,420 shares) | | $ 22.56 |
| | |
Investor Class:
Net Asset Value, offering price and redemption price per share ($384,285,067 ÷ 17,130,079 shares) | | $ 22.43 |
See accompanying notes which are an integral part of the financial statements.
Annual Report
Financial Statements - continued
Statement of Operations
| Year ended December 31, 2013 |
| | |
Investment Income | | |
Dividends | | $ 2,261,730 |
Income from Fidelity Central Funds | | 99,897 |
Total income | | 2,361,627 |
| | |
Expenses | | |
Management fee | $ 1,945,323 | |
Transfer agent fees | 438,976 | |
Accounting and security lending fees | 139,057 | |
Custodian fees and expenses | 44,153 | |
Independent trustees' compensation | 5,984 | |
Audit | 45,532 | |
Legal | 5,557 | |
Miscellaneous | 11,059 | |
Total expenses before reductions | 2,635,641 | |
Expense reductions | (32,733) | 2,602,908 |
Net investment income (loss) | | (241,281) |
Realized and Unrealized Gain (Loss) Net realized gain (loss) on: | | |
Investment securities: | | |
Unaffiliated issuers | 46,857,997 | |
Foreign currency transactions | (23,742) | |
Total net realized gain (loss) | | 46,834,255 |
Change in net unrealized appreciation (depreciation) on: Investment securities | 106,425,997 | |
Assets and liabilities in foreign currencies | (329) | |
Total change in net unrealized appreciation (depreciation) | | 106,425,668 |
Net gain (loss) | | 153,259,923 |
Net increase (decrease) in net assets resulting from operations | | $ 153,018,642 |
Statement of Changes in Net Assets
| Year ended
December 31,
2013 | Year ended
December 31,
2012 |
Increase (Decrease) in Net Assets | | |
Operations | | |
Net investment income (loss) | $ (241,281) | $ 668,350 |
Net realized gain (loss) | 46,834,255 | 13,185,316 |
Change in net unrealized appreciation (depreciation) | 106,425,668 | 13,646,655 |
Net increase (decrease) in net assets resulting from operations | 153,018,642 | 27,500,321 |
Distributions to shareholders from net investment income | - | (645,289) |
Distributions to shareholders from net realized gain | (26,106,335) | (10,008,923) |
Total distributions | (26,106,335) | (10,654,212) |
Share transactions - net increase (decrease) | 240,283,307 | 44,699,798 |
Redemption fees | 87,026 | 23,037 |
Total increase (decrease) in net assets | 367,282,640 | 61,568,944 |
| | |
Net Assets | | |
Beginning of period | 184,495,751 | 122,926,807 |
End of period | $ 551,778,391 | $ 184,495,751 |
See accompanying notes which are an integral part of the financial statements.
Annual Report
Financial Highlights - Initial Class
Years ended December 31, | 2013 | 2012 | 2011 | 2010 | 2009 |
Selected Per-Share Data | | | | | |
Net asset value, beginning of period | $ 15.51 | $ 13.69 | $ 12.64 | $ 10.79 | $ 8.15 |
Income from Investment Operations | | | | | |
Net investment income (loss) C | - H | .07 | - H | .02 F | .03 |
Net realized and unrealized gain (loss) | 8.42 | 2.74 | 1.04 | 1.85 | 2.64 |
Total from investment operations | 8.42 | 2.81 | 1.04 | 1.87 | 2.67 |
Distributions from net investment income | - | (.06) | - | (.02) | (.03) |
Distributions from net realized gain | (1.37) | (.92) | - | - | - |
Total distributions | (1.37) | (.99) I | - | (.02) | (.03) |
Redemption fees added to paid in capital C | - H | - H | .01 | - H | - H |
Net asset value, end of period | $ 22.56 | $ 15.51 | $ 13.69 | $ 12.64 | $ 10.79 |
Total Return A, B | 56.12% | 20.81% | 8.31% | 17.35% | 32.80% |
Ratios to Average Net Assets D, G | | | | | |
Expenses before reductions | .69% | .72% | .74% | .79% | .83% |
Expenses net of fee waivers, if any | .69% | .72% | .74% | .78% | .83% |
Expenses net of all reductions | .68% | .71% | .73% | .78% | .82% |
Net investment income (loss) | (.01)% | .47% | (.03)% | .17% F | .30% |
Supplemental Data | | | | | |
Net assets, end of period (000 omitted) | $ 167,493 | $ 69,363 | $ 52,430 | $ 36,651 | $ 37,787 |
Portfolio turnover rate E | 93% | 98% | 138% | 108% | 132% |
A Total returns do not reflect charges attributable to your insurance company's separate account. Inclusion of these charges would reduce the total returns shown.
B Total returns would have been lower if certain expenses had not been reduced during the applicable periods shown.
C Calculated based on average shares outstanding during the period.
D Fees and expenses of any underlying Fidelity Central Funds are not included in the Fund's expense ratio. The Fund indirectly bears its proportionate share of the expenses of any underlying Fidelity Central Funds.
E Amount does not include the portfolio activity of any underlying Fidelity Central Funds.
F Investment income per share reflects a large, non-recurring dividend which amounted to $.01 per share. Excluding this non-recurring dividend, the ratio of net investment income (loss) to average net assets would have been .04%.
G Expense ratios reflect operating expenses of the class. Expenses before reductions do not reflect amounts reimbursed by the investment adviser or reductions from brokerage service arrangements or reductions from other expense offset arrangements and do not represent the amount paid by the class during periods when reimbursements or reductions occur. Expenses net of fee waivers reflect expenses after reimbursement by the investment adviser but prior to reductions from brokerage service arrangements or other expense offset arrangements. Expenses net of all reductions represent the net expenses paid by the class.
H Amount represents less than $.01 per share.
I Total distributions of $.99 per share is comprised of distributions from net investment income of $.063 and distributions from net realized gain of $.924 per share.
Financial Highlights - Investor Class
Years ended December 31, | 2013 | 2012 | 2011 | 2010 | 2009 |
Selected Per-Share Data | | | | | |
Net asset value, beginning of period | $ 15.44 | $ 13.63 | $ 12.59 | $ 10.75 | $ 8.13 |
Income from Investment Operations | | | | | |
Net investment income (loss) C | (.02) | .06 | (.01) | .01 F | .02 |
Net realized and unrealized gain (loss) | 8.37 | 2.73 | 1.04 | 1.84 | 2.62 |
Total from investment operations | 8.35 | 2.79 | 1.03 | 1.85 | 2.64 |
Distributions from net investment income | - | (.05) | - | (.01) | (.02) |
Distributions from net realized gain | (1.36) | (.92) | - | - | - |
Total distributions | (1.36) | (.98) I | - | (.01) | (.02) |
Redemption fees added to paid in capital C | - H | - H | .01 | - H | - H |
Net asset value, end of period | $ 22.43 | $ 15.44 | $ 13.63 | $ 12.59 | $ 10.75 |
Total Return A, B | 55.91% | 20.75% | 8.26% | 17.24% | 32.53% |
Ratios to Average Net Assets D, G | | | | | |
Expenses before reductions | .77% | .80% | .82% | .88% | .94% |
Expenses net of fee waivers, if any | .77% | .80% | .82% | .87% | .94% |
Expenses net of all reductions | .76% | .79% | .81% | .86% | .93% |
Net investment income (loss) | (.10)% | .39% | (.11)% | .09% F | .20% |
Supplemental Data | | | | | |
Net assets, end of period (000 omitted) | $ 384,285 | $ 115,132 | $ 70,497 | $ 31,254 | $ 24,448 |
Portfolio turnover rate E | 93% | 98% | 138% | 108% | 132% |
A Total returns do not reflect charges attributable to your insurance company's separate account. Inclusion of these charges would reduce the total returns shown.
B Total returns would have been lower if certain expenses had not been reduced during the applicable periods shown.
C Calculated based on average shares outstanding during the period.
D Fees and expenses of any underlying Fidelity Central Funds are not included in the Fund's expense ratio. The Fund indirectly bears its proportionate share of the expenses of any underlying Fidelity Central Funds.
E Amount does not include the portfolio activity of any underlying Fidelity Central Funds.
F Investment income per share reflects a large, non-recurring dividend which amounted to $.01 per share. Excluding this non-recurring dividend, the ratio of net investment income (loss) to average net assets would have been (.04)%.
G Expense ratios reflect operating expenses of the class. Expenses before reductions do not reflect amounts reimbursed by the investment adviser or reductions from brokerage service arrangements or reductions from other expense offset arrangements and do not represent the amount paid by the class during periods when reimbursements or reductions occur. Expenses net of fee waivers reflect expenses after reimbursement by the investment adviser but prior to reductions from brokerage service arrangements or other expense offset arrangements. Expenses net of all reductions represent the net expenses paid by the class.
H Amount represents less than $.01 per share.
I Total distributions of $.98 per share is comprised of distributions from net investment income of $.052 and distributions from net realized gain of $.924 per share.
See accompanying notes which are an integral part of the financial statements.
Annual Report
Notes to Financial Statements
For the period ended December 31, 2013
1. Organization.
VIP Health Care Portfolio (the Fund) is a non-diversified fund of Variable Insurance Products Fund IV (the Trust) and is authorized to issue an unlimited number of shares. The Trust is registered under the Investment Company Act of 1940, as amended (the 1940 Act), as an open-end management investment company organized as a Massachusetts business trust. Shares of the Fund may only be purchased by insurance companies for the purpose of funding variable annuity or variable life insurance contracts. The Fund offers the following classes of shares: Initial Class shares and Investor Class shares. All classes have equal rights and voting privileges, except for matters affecting a single class.
2. Investments in Fidelity Central Funds.
The Fund invests in Fidelity Central Funds, which are open-end investment companies generally available only to other investment companies and accounts managed by the investment adviser and its affiliates. The Fund's Schedule of Investments lists each of the Fidelity Central Funds held as of period end, if any, as an investment of the Fund, but does not include the underlying holdings of each Fidelity Central Fund. As an Investing Fund, the Fund indirectly bears its proportionate share of the expenses of the underlying Fidelity Central Funds.
The Money Market Central Funds seek preservation of capital and current income and are managed by Fidelity Investments Money Management, Inc. (FIMM), an affiliate of the investment adviser. Annualized expenses of the Money Market Central Funds as of their most recent shareholder report date are less than .01%.
A complete unaudited list of holdings for each Fidelity Central Fund is available upon request or at the Securities and Exchange Commission (the SEC) website at www.sec.gov. In addition, the financial statements of the Fidelity Central Funds, which are not covered by the Fund's Report of Independent Registered Public Accounting Firm, are available on the SEC website or upon request.
3. Significant Accounting Policies.
The financial statements have been prepared in conformity with accounting principles generally accepted in the United States of America (GAAP), which require management to make certain estimates and assumptions at the date of the financial statements. Actual results could differ from those estimates. Subsequent events, if any, through the date that the financial statements were issued have been evaluated in the preparation of the financial statements. The following summarizes the significant accounting policies of the Fund:
Investment Valuation. Investments are valued as of 4:00 p.m. Eastern time on the last calendar day of the period. In accordance with valuation policies and procedures approved by the Board of Trustees (the Board), the Fund attempts to obtain prices from one or more third party pricing vendors or brokers to value its investments. When current market prices, quotations or currency exchange rates are not readily available or reliable, investments will be fair valued in good faith by the Fidelity SelectCo, LLC (SelectCo) Fair Value Committee (the Committee), in accordance with procedures adopted by the Board. Factors used in determining fair value vary by investment type and may include market or investment specific events. The frequency with which these procedures are used cannot be predicted and they may be utilized to a significant extent. The Committee oversees the Fund's valuation policies and procedures and is responsible for approving and reporting to the Board all fair value determinations.
The Fund categorizes the inputs to valuation techniques used to value its investments into a disclosure hierarchy consisting of three levels as shown below:
Level 1 - quoted prices in active markets for identical investments
Level 2 - other significant observable inputs (including quoted prices for similar investments, interest rates, prepayment speeds, etc.)
Level 3 - unobservable inputs (including the Fund's own assumptions based on the best information available)
Valuation techniques used to value the Fund's investments by major category are as follows:
Equity securities, including restricted securities, for which market quotations are readily available, are valued at the last reported sale price or official closing price as reported by a third party pricing vendor on the primary market or exchange on which they are traded and are categorized as Level 1 in the hierarchy. In the event there were no sales during the day or closing prices are not available, securities are valued at the last quoted bid price or may be valued using the last available price and are generally categorized as Level 2 in the hierarchy. For foreign equity securities, when market or security specific events arise, comparisons to the valuation of American Depositary Receipts (ADRs), futures contracts, Exchange-Traded Funds (ETFs) and certain indexes as well as quoted prices for similar securities may be used and would be categorized as Level 2 in the hierarchy. Utilizing these techniques may result in transfers between Level 1 and Level 2. For equity securities, including restricted securities, where observable inputs are limited, assumptions about market activity and risk are used and these securities may be categorized as Level 3 in the hierarchy.
Investments in open-end mutual funds, including the Fidelity Central Funds, are valued at their closing net asset value (NAV) each business day and are categorized as Level 1 in the hierarchy.
Annual Report
Notes to Financial Statements - continued
3. Significant Accounting Policies - continued
Investment Valuation - continued
Changes in valuation techniques may result in transfers in or out of an assigned level within the disclosure hierarchy. The aggregate value of investments by input level, as of December 31, 2013, is included at the end of the Fund's Schedule of Investments.
Foreign Currency. The Fund may use foreign currency contracts to facilitate transactions in foreign-denominated securities. Gains and losses from these transactions may arise from changes in the value of the foreign currency or if the counterparties do not perform under the contracts' terms.
Foreign-denominated assets, including investment securities, and liabilities are translated into U.S. dollars at the exchange rates at period end. Purchases and sales of investment securities, income and dividends received and expenses denominated in foreign currencies are translated into U.S. dollars at the exchange rate in effect on the transaction date.
The effects of exchange rate fluctuations on investments are included with the net realized and unrealized gain (loss) on investment securities. Other foreign currency transactions resulting in realized and unrealized gain (loss) are disclosed separately.
Investment Transactions and Income. For financial reporting purposes, the Fund's investment holdings and NAV include trades executed through the end of the last business day of the period. The NAV per share for processing shareholder transactions is calculated as of the close of business of the New York Stock Exchange (NYSE), normally 4:00 p.m. Eastern time and includes trades executed through the end of the prior business day. Gains and losses on securities sold are determined on the basis of identified cost and may include proceeds received from litigation. Dividend income is recorded on the ex-dividend date, except for certain dividends from foreign securities where the ex-dividend date may have passed, which are recorded as soon as the Fund is informed of the ex-dividend date. Non-cash dividends included in dividend income, if any, are recorded at the fair market value of the securities received. Distributions received on securities that represent a return of capital or capital gain are recorded as a reduction of cost of investments and/or as a realized gain. Subsequent to ex-dividend date the Fund determines the components of these distributions, based upon receipt of tax filings or other correspondence relating to the underlying investment. Interest income and distributions from the Fidelity Central Funds are accrued as earned. Investment income is recorded net of foreign taxes withheld where recovery of such taxes is uncertain.
Class Allocations and Expenses. Investment income, realized and unrealized capital gains and losses, common expenses of the Fund, and certain fund-level expense reductions, if any, are allocated daily on a pro-rata basis to each class based on the relative net assets of each class to the total net assets of the Fund. Each class differs with respect to transfer agent fees incurred. Certain expense reductions may also differ by class. For the reporting period, the allocated portion of income and expenses to each class as a percent of its average net assets may vary due to the timing of recording these transactions in relation to fluctuating net assets of the classes. Expenses directly attributable to a fund are charged to that fund. Expenses attributable to more than one fund are allocated among the respective funds on the basis of relative net assets or other appropriate methods. Expense estimates are accrued in the period to which they relate and adjustments are made when actual amounts are known.
Income Tax Information and Distributions to Shareholders. Each year, the Fund intends to qualify as a regulated investment company under Subchapter M of the Internal Revenue Code, including distributing substantially all of its taxable income and realized gains. As a result, no provision for U.S. Federal income taxes is required. As of December 31, 2013, the Fund did not have any unrecognized tax benefits in the financial statements; nor is the Fund aware of any tax positions for which it is reasonably possible that the total amounts of unrecognized tax benefits will significantly change in the next twelve months. The Fund files a U.S. federal tax return, in addition to state and local tax returns as required. The Fund's federal income tax returns are subject to examination by the Internal Revenue Service (IRS) for a period of three fiscal years after they are filed. State and local tax returns may be subject to examination for an additional fiscal year depending on the jurisdiction. Foreign taxes are provided for based on the Fund's understanding of the tax rules and rates that exist in the foreign markets in which it invests.
Distributions are declared and recorded on the ex-dividend date. Income dividends and capital gain distributions are declared separately for each class. Income and capital gain distributions are determined in accordance with income tax regulations, which may differ from GAAP.
Capital accounts within the financial statements are adjusted for permanent book-tax differences. These adjustments have no impact on net assets or the results of operations. Capital accounts are not adjusted for temporary book-tax differences which will reverse in a subsequent period.
Book-tax differences are primarily due to foreign currency transactions, passive foreign investment companies (PFIC), net operating losses, and losses deferred due to wash sales.
The federal tax cost of investment securities and unrealized appreciation (depreciation) as of period end were as follows:
Gross unrealized appreciation | $ 131,421,434 |
Gross unrealized depreciation | (3,959,112) |
Net unrealized appreciation (depreciation) on securities and other investments | $ 127,462,322 |
| |
Tax Cost | $ 441,034,310 |
Annual Report
3. Significant Accounting Policies - continued
Income Tax Information and Distributions to Shareholders - continued
The tax-based components of distributable earnings as of period end were as follows:
Undistributed ordinary income | $ 10,290,749 |
Undistributed long-term capital gain | $ 17,144,796 |
Net unrealized appreciation (depreciation) | $ 127,460,493 |
The tax character of distributions paid was as follows:
| December 31, 2013 | December 31, 2012 |
Ordinary Income | $ 19,216,416 | $ 6,232,081 |
Long-term Capital Gains | 6,889,919 | 4,422,131 |
Total | $ 26,106,335 | $ 10,654,212 |
Trading (Redemption) Fees. Shares held by investors less than 60 days may be subject to a redemption fee equal to 1% of the NAV of shares redeemed. All redemption fees, which reduce the proceeds of the shareholder redemption, are retained by the Fund and accounted for as an addition to paid in capital.
Restricted Securities. The Fund may invest in securities that are subject to legal or contractual restrictions on resale. These securities generally may be resold in transactions exempt from registration or to the public if the securities are registered. Disposal of these securities may involve time-consuming negotiations and expense, and prompt sale at an acceptable price may be difficult. Information regarding restricted securities is included at the end of the Fund's Schedule of Investments.
4. Purchases and Sales of Investments.
Purchases and sales of securities, other than short-term securities, aggregated $535,744,331 and $324,806,431, respectively.
5. Fees and Other Transactions with Affiliates.
Management Fee. Effective August 1, 2013, SelectCo replaced Fidelity Management and Research Company (FMR), an affiliate of SelectCo, as investment adviser to the Fund. The investment adviser and its affiliates provide the Fund with investment management related services for which the Fund pays a monthly management fee. The management fee is the sum of an individual fund fee rate that is based on an annual rate of .30% of the Fund's average net assets and an annualized group fee rate that averaged .25% during the period. The group fee rate is based upon the average net assets of all the mutual funds advised by FMR and the investment adviser. The group fee rate decreases as assets under management increase and increases as assets under management decrease. For the reporting period, the total annual management fee rate was .55% of the Fund's average net assets.
Transfer Agent Fees. Fidelity Investments Institutional Operations Company, Inc. (FIIOC), an affiliate of the investment adviser, is the Fund's transfer, dividend disbursing, and shareholder servicing agent. FIIOC receives an asset-based fee with respect to each class. Each class (with the exception of Investor Class) pays a transfer agent fee, excluding out of pocket expenses, equal to an annual rate of .07% of average net assets. Investor Class pays a monthly asset-based transfer agent fee of .15% of average net assets. In addition, FIIOC receives an asset-based fee of .0035% of average net assets for typesetting, printing and mailing of shareholder reports, except proxy statements. FIIOC voluntarily agreed to reimburse or waive this fee for the period January 1, 2013 through December 31, 2013 (see Expense Reductions note). For the period, transfer agent fees for each class, including printing and out of pocket expenses, were as follows:
Initial Class | $ 81,746 |
Investor Class | 357,230 |
| $ 438,976 |
Effective February 1, 2014, the Board of Trustees approved an amendment to the transfer agent fee agreement whereby each class (with the exception of Investor Class) pays a single fee of .07% of average net assets for transfer agent services, typesetting, printing and mailing of shareholder reports, excluding mailing of proxy statements and out of pocket expenses. Investor Class pays a single fee of .15% of average net assets.
Accounting and Security Lending Fees. Fidelity Service Company, Inc. (FSC), an affiliate of the investment adviser, maintains the Fund's accounting records. The accounting fee is based on the level of average net assets for each month. Under a separate contract, FSC administers the security lending program. The security lending fee is based on the number and duration of lending transactions.
Brokerage Commissions. The Fund placed a portion of its portfolio transactions with brokerage firms which are affiliates of the investment adviser. Brokerage commissions are included in net realized gain (loss) and change in net unrealized appreciation (depreciation) in the Statement of Operations. The commissions paid to these affiliated firms were $6,079 for the period.
Annual Report
Notes to Financial Statements - continued
6. Committed Line of Credit.
The Fund participates with other funds managed by the investment adviser or an affiliate in a $4.25 billion credit facility (the "line of credit") to be utilized for temporary or emergency purposes to fund shareholder redemptions or for other short-term liquidity purposes. The Fund has agreed to pay commitment fees on its pro-rata portion of the line of credit, which amounted to $560 and is reflected in Miscellaneous expenses on the Statement of Operations. During the period, there were no borrowings on this line of credit.
7. Security Lending.
The Fund lends portfolio securities through a lending agent from time to time in order to earn additional income. For equity securities, a lending agent is used and may loan securities to certain qualified borrowers, which prior to August 1, 2013 included Fidelity Capital Markets (FCM), a broker-dealer affiliated with the Fund. On the settlement date of the loan, the Fund receives collateral (in the form of U.S. Treasury obligations, letters of credit and/or cash) against the loaned securities and maintains collateral in an amount not less than 100% of the market value of the loaned securities during the period of the loan. The market value of the loaned securities is determined at the close of business of the Fund and any additional required collateral is delivered to the Fund on the next business day. If the borrower defaults on its obligation to return the securities loaned because of insolvency or other reasons, the Fund may apply collateral received from the borrower against the obligation. The Fund may experience delays and costs in recovering the securities loaned. Any cash collateral received is invested in the Fidelity Securities Lending Cash Central Fund. The value of loaned securities and cash collateral at period end are disclosed on the Fund's Statement of Assets and Liabilities. Security lending income represents the income earned on investing cash collateral, less rebates paid to borrowers and any lending agent fees associated with the loan, plus any premium payments received for lending certain types of securities. Security lending income is presented in the Statement of Operations as a component income from Fidelity Central Funds. Total security lending income during the period amounted to $92,347. During the period, there were no securities loaned to FCM.
8. Expense Reductions.
The investment adviser or its affiliates agreed to reimburse or waive certain fees during the period as noted in the table below.
Initial Class | $ 4,423 |
Investor Class | 8,966 |
| $ 13,389 |
In addition, commissions paid to certain brokers with whom the investment adviser, or its affiliates, places trades on behalf of the Fund include an amount in addition to trade execution, which may be rebated back to the Fund to offset certain expenses. This amount totaled $19,323 for the period. In addition, through arrangements with the Fund's custodian, credits realized as a result of uninvested cash balances were used to reduce the Fund's expenses. During the period, these credits reduced the Fund's custody expenses by $21.
9. Distributions to Shareholders.
Distributions to shareholders of each class were as follows:
Years ended December 31, | 2013 | 2012 |
From net investment income | | |
Initial Class | $ - | $ 275,106 |
Investor Class | - | 370,183 |
Total | $ - | $ 645,289 |
From net realized gain | | |
Initial Class | $ 8,479,953 | $ 3,972,054 |
Investor Class | 17,626,382 | 6,036,869 |
Total | $ 26,106,335 | $ 10,008,923 |
Annual Report
10. Share Transactions.
Transactions for each class of shares were as follows:
| Shares | Dollars |
Years ended December 31, | 2013 | 2012 | 2013 | 2012 |
Initial Class | | | | |
Shares sold | 3,279,877 | 1,256,626 | $ 62,151,095 | $ 19,160,040 |
Reinvestment of distributions | 432,864 | 280,664 | 8,479,953 | 4,247,160 |
Shares redeemed | (760,418) | (895,956) | (14,693,580) | (13,389,966) |
Net increase (decrease) | 2,952,323 | 641,334 | $ 55,937,468 | $ 10,017,234 |
Investor Class | | | | |
Shares sold | 9,544,125 | 2,698,170 | $ 181,540,476 | $ 40,658,636 |
Reinvestment of distributions | 891,714 | 424,416 | 17,626,382 | 6,407,052 |
Shares redeemed | (764,632) | (836,971) | (14,821,019) | (12,383,124) |
Net increase (decrease) | 9,671,207 | 2,285,615 | $ 184,345,839 | $ 34,682,564 |
11. Other.
The Fund's organizational documents provide former and current trustees and officers with a limited indemnification against liabilities arising in connection with the performance of their duties to the Fund. In the normal course of business, the Fund may also enter into contracts that provide general indemnifications. The Fund's maximum exposure under these arrangements is unknown as this would be dependent on future claims that may be made against the Fund. The risk of material loss from such claims is considered remote.
At the end of the period, the investment adviser or its affiliates were the owners of record of 100% of the total outstanding shares of the Fund.
Annual Report
Report of Independent Registered Public Accounting Firm
To the Trustees of Variable Insurance Products Fund IV and the Shareholders of VIP Health Care Portfolio:
In our opinion, the accompanying statement of assets and liabilities, including the schedule of investments, and the related statements of operations and of changes in net assets and the financial highlights present fairly, in all material respects, the financial position of VIP Health Care Portfolio (a fund of Variable Insurance Products Fund IV) at December 31, 2013, the results of its operations for the year then ended, the changes in its net assets for each of the two years in the period then ended and the financial highlights for each of the five years in the period then ended, in conformity with accounting principles generally accepted in the United States of America. These financial statements and financial highlights (hereafter referred to as "financial statements") are the responsibility of the VIP Health Care Portfolio's management. Our responsibility is to express an opinion on these financial statements based on our audits. We conducted our audits of these financial statements in accordance with the standards of the Public Company Accounting Oversight Board (United States). Those standards require that we plan and perform the audit to obtain reasonable assurance about whether the financial statements are free of material misstatement. An audit includes examining, on a test basis, evidence supporting the amounts and disclosures in the financial statements, assessing the accounting principles used and significant estimates made by management, and evaluating the overall financial statement presentation. We believe that our audits, which included confirmation of securities at December 31, 2013 by correspondence with the custodian and brokers, provide a reasonable basis for our opinion.
PricewaterhouseCoopers LLP
Boston, Massachusetts
February 14, 2014
Annual Report
The Trustees and officers of the trust and fund, as applicable, are listed below. The Board of Trustees governs the fund and is responsible for protecting the interests of shareholders. The Trustees are experienced executives who meet periodically throughout the year to oversee the fund's activities, review contractual arrangements with companies that provide services to the fund, oversee management of the risks associated with such activities and contractual arrangements, and review the fund's performance. Except for Ned C. Lautenbach, Ronald P. O'Hanley, and William S. Stavropoulos, each of the Trustees oversees 74 funds. Mr. Curvey oversees 396 funds. Mr. Lautenbach, Mr. O'Hanley, and Mr. Stavropoulos each oversees 247 funds.
The Trustees hold office without limit in time except that (a) any Trustee may resign; (b) any Trustee may be removed by written instrument, signed by at least two-thirds of the number of Trustees prior to such removal; (c) any Trustee who requests to be retired or who has become incapacitated by illness or injury may be retired by written instrument signed by a majority of the other Trustees; and (d) any Trustee may be removed at any special meeting of shareholders by a two-thirds vote of the outstanding voting securities of the trust. The officers hold office without limit in time, except that any officer may resign or may be removed by a vote of a majority of the Trustees at any regular meeting or any special meeting of the Trustees. Except as indicated, each individual has held the office shown or other offices in the same company for the past five years.
Experience, Skills, Attributes, and Qualifications of the Fund's Trustees. The Governance and Nominating Committee has adopted a statement of policy that describes the experience, qualifications, attributes, and skills that are necessary and desirable for potential Independent Trustee candidates (Statement of Policy). The Board believes that each Trustee satisfied at the time he or she was initially elected or appointed a Trustee, and continues to satisfy, the standards contemplated by the Statement of Policy. The Governance and Nominating Committee also engages professional search firms to help identify potential Independent Trustee candidates who have the experience, qualifications, attributes, and skills consistent with the Statement of Policy. From time to time, additional criteria based on the composition and skills of the current Independent Trustees, as well as experience or skills that may be appropriate in light of future changes to board composition, business conditions, and regulatory or other developments, have also been considered by the professional search firms and the Governance and Nominating Committee. In addition, the Board takes into account the Trustees' commitment and participation in Board and committee meetings, as well as their leadership of standing and ad hoc committees throughout their tenure.
In determining that a particular Trustee was and continues to be qualified to serve as a Trustee, the Board has considered a variety of criteria, none of which, in isolation, was controlling. The Board believes that, collectively, the Trustees have balanced and diverse experience, qualifications, attributes, and skills, which allow the Board to operate effectively in governing the fund and protecting the interests of shareholders. Information about the specific experience, skills, attributes, and qualifications of each Trustee, which in each case led to the Board's conclusion that the Trustee should serve (or continue to serve) as a trustee of the fund, is provided below.
Board Structure and Oversight Function. Ronald P. O'Hanley is an interested person (as defined in the 1940 Act) and currently serves as Chairman. The Trustees have determined that an interested Chairman is appropriate and benefits shareholders because an interested Chairman has a personal and professional stake in the quality and continuity of services provided to the fund. Independent Trustees exercise their informed business judgment to appoint an individual of their choosing to serve as Chairman, regardless of whether the Trustee happens to be independent or a member of management. The Independent Trustees have determined that they can act independently and effectively without having an Independent Trustee serve as Chairman and that a key structural component for assuring that they are in a position to do so is for the Independent Trustees to constitute a substantial majority for the Board. The Independent Trustees also regularly meet in executive session. Michael E. Wiley serves as Chairman of the Independent Trustees and as such (i) acts as a liaison between the Independent Trustees and management with respect to matters important to the Independent Trustees and (ii) with management prepares agendas for Board meetings.
Fidelity funds are overseen by different Boards of Trustees. The fund's Board oversees Fidelity's sector portfolios. Other Boards oversee Fidelity's equity and high income funds, and Fidelity's investment grade bond, money market, and asset allocation funds. The use of separate Boards, each with its own committee structure, allows the Trustees of each group of Fidelity funds to focus on the unique issues of the funds they oversee, including common research, investment, and operational issues. On occasion, the separate Boards establish joint committees to address issues of overlapping consequences for the Fidelity funds overseen by each Board.
The Trustees operate using a system of committees to facilitate the timely and efficient consideration of all matters of importance to the Trustees, the fund, and fund shareholders and to facilitate compliance with legal and regulatory requirements and oversight of the fund's activities and associated risks. The Board, acting through its committees, has charged SelectCo and its affiliates with (i) identifying events or circumstances the occurrence of which could have demonstrably adverse effects on the fund's business and/or reputation; (ii) implementing processes and controls to lessen the possibility that such events or circumstances occur or to mitigate the effects of such events or circumstances if they do occur; and (iii) creating and maintaining a system designed to evaluate continuously business and market conditions in order to facilitate the identification and implementation processes described in (i) and (ii) above. Because the day-to-day operations and activities of the fund are carried out by or through SelectCo, its affiliates, and other service providers, the fund's exposure to risks is mitigated but not eliminated by the processes overseen by the Trustees. While each of the Board's committees has responsibility for overseeing different aspects of the fund's activities, oversight is exercised primarily through the Operations and Audit Committees. Appropriate personnel, including but not limited to the fund's Chief Compliance Officer (CCO), SelectCo's internal auditor, the independent accountants, the fund's Treasurer and portfolio management personnel, make periodic reports to the Board's committees, as appropriate. The responsibilities of each standing committee, including their oversight responsibilities, are described further under "Standing Committees of the Fund's Trustees."
Annual Report
Trustees and Officers - continued
The fund's Statements of Additional Information (SAI) includes more information about the Trustees. To request a free copy, call Fidelity at 1-877-208-0098.
Interested Trustee*:
Correspondence intended for the Trustee who is an interested person may be sent to Fidelity Investments, 245 Summer Street, Boston, Massachusetts 02210.
Name, Year of Birth; Principal Occupations and Other Relevant Experience+ |
Ronald P. O'Hanley (1957) |
Year of Election or Appointment: 2011 Trustee Chairman of the Board of Trustees |
| Mr. O'Hanley also serves as Trustee of other Fidelity funds. He is Director of Fidelity SelectCo, LLC (2013-present), FMR Co., Inc. (2010-present), Director of Fidelity Investments Money Management, Inc. (2010-present), Director of Fidelity Research & Analysis Company (2010-present), President of Fidelity Asset Management and Corporate Services and a Member of Fidelity's Executive Committee (2010-present). Previously, Mr. O'Hanley served as President and Chief Executive Officer of BNY Mellon Asset Management (2007-2010). Mr. O'Hanley also served as Vice Chairman of Bank New York Mellon Corp. and a member of that firm's Executive Committee. Prior to the 2007 merger of The Bank of New York and Mellon Financial Corporation, he was Vice Chairman of Mellon Financial Corporation and President and Chief Executive Officer of Mellon Asset Management. He joined Mellon in February 1997. Mr. O'Hanley currently serves as Chairman of the Boston Public Library Foundation Board of Directors and sits on the Board of Directors of Beth Israel Deaconess Medical Center, the Board of Trustees of the Marine Biological Laboratory and the Advisory Board of the Maxwell School of Citizenship and Public Administration at Syracuse University. Mr. O'Hanley also chairs the Council on Asset Management for the Financial Services Roundtable and is a member of the Board of Directors of Institutional Investor's U.S. Institute. |
* Trustee has been determined to be an "Interested Trustee" by virtue of, among other things, his affiliation with the trust or various entities under common control with SelectCo.
+ The information above includes the Trustee's principal occupation during the last five years and other information relating to the experience, attributes, and skills relevant to the Trustee's qualifications to serve as a Trustee, which led to the conclusion that the Trustee should serve as a Trustee for the fund.
Independent Trustees:
Correspondence intended for each Independent Trustee (that is, the Trustees other than the Interested Trustees) may be sent to Fidelity Investments, P.O. Box 55235, Boston, Massachusetts 02205-5235.
Name, Year of Birth; Principal Occupations and Other Relevant Experience+ |
Ned C. Lautenbach (1944) |
Year of Election or Appointment: 2000 Trustee |
| Mr. Lautenbach also serves as Trustee of other Fidelity funds. Mr. Lautenbach currently serves as the Lead Director of the Eaton Corporation Board of Directors (diversified industrial, 1997-present). Mr. Lautenbach is Chairman of the Board of Directors of the Philharmonic Center for the Arts in Naples, Florida (2012-present) and a member of the Council on Foreign Relations (1994-present). Previously, Mr. Lautenbach was a Partner/Advisory Partner at Clayton, Dubilier & Rice, LLC (private equity investment, 1998-2010), as well as a Director of Sony Corporation (2006-2007). |
David A. Rosow (1942) |
Year of Election or Appointment: 2013 Trustee |
| Mr. Rosow also serves as Trustee of other Fidelity funds. Mr. Rosow is Chairman and Chief Executive Officer of International Golf Group, Inc. (golf course development, 1989-present). Previously, Mr. Rosow served as Chairman and Chief Executive Officer of Rosow & Company, Inc. (private investment company, 1989-2011), a Lead Director of Hudson United Bancorp (2001-2006) and as a Director of TD Banknorth (1996-2006). In addition, Mr. Rosow is a member (2008-present) and President (2009-present) of the Town Council of Palm Beach, Florida. Mr. Rosow served as a Member of the Advisory Board of other Fidelity funds (2012-2013). |
Garnett A. Smith (1947) |
Year of Election or Appointment: 2013 Trustee |
| Mr. Smith also serves as Trustee of other Fidelity funds. Prior to Mr. Smith's retirement, he served as Chairman and Chief Executive Officer of Inbrand Corp. (manufacturer of personal absorbent products, 1990-1997). He also served as President (1986-1990) of Inbrand Corp. Prior to his employment with Inbrand Corp., he was employed by a retail fabric chain and North Carolina National Bank. In addition, Mr. Smith is a board member of the Jackson Hole Land Trust (2009-present). Mr. Smith served as a Member of the Advisory Board of other Fidelity funds (2012-2013). |
William S. Stavropoulos (1939) |
Year of Election or Appointment: 2001 Trustee |
| Mr. Stavropoulos also serves as Trustee of other Fidelity funds. Mr. Stavropoulos serves as President and Founder of the Michigan Baseball Foundation, the Great Lakes Loons (2007-present). Mr. Stavropoulos is Chairman Emeritus of the Board of Directors of The Dow Chemical Company, where he previously served in numerous senior management positions, including President, CEO (1995-2000; 2002-2004), Chairman of the Executive Committee (2000-2006), and as a member of the Board of Directors (1990-2006). Currently, Mr. Stavropoulos is Chairman of the Board of Directors of Univar Inc. (global distributor of commodity and specialty chemicals), a Director of Teradata Corporation (data warehousing and technology solutions), and Maersk Inc. (industrial conglomerate), and a member of the Advisory Board for Metalmark Capital LLC (private equity investment, 2005-present). Mr. Stavropoulos is an operating advisor to Clayton, Dubilier & Rice, LLC (private equity investment). In addition, Mr. Stavropoulos is a member of the University of Notre Dame Advisory Council for the College of Science, a Trustee of the Rollin L. Gerstacker Foundation, and a Director of the Naples Philharmonic Center for the Arts. Previously, Mr. Stavropoulos served as a Director of Chemical Financial Corporation (bank holding company, 1993-2012) and Tyco International, Ltd. (multinational manufacturing and services, 2007-2012). |
Michael E. Wiley (1950) |
Year of Election or Appointment: 2008 Trustee Chairman of the Independent Trustees |
| Mr. Wiley also serves as Trustee of other Fidelity funds. Mr. Wiley serves as a Director of Asia Pacific Exploration Consolidated (international oil and gas exploration and production, 2008-present). Mr. Wiley serves as a Director of Tesoro Corporation (independent oil refiner and marketer, 2005-present), and a Director of Bill Barrett Corporation (exploration and production, 2005-present). In addition, Mr. Wiley also serves as a Director of Post Oak Bank (privately-held bank, 2004-present). Previously, Mr. Wiley served as a Trustee of other Fidelity funds (2008-2013), as a member of the Board of Trustees of the University of Tulsa (2000-2006; 2007-2010), as a Senior Energy Advisor of Katzenbach Partners, LLC (consulting, 2006-2007), as an Advisory Director of Riverstone Holdings (private investment), Chairman, President, and CEO of Baker Hughes, Inc. (oilfield services, 2000-2004), and as Director of Spinnaker Exploration Company (exploration and production, 2001-2005). |
+ The information above includes each Trustee's principal occupation during the last five years and other information relating to the experience, attributes, and skills relevant to each Trustee's qualifications to serve as a Trustee, which led to the conclusion that each Trustee should serve as a Trustee for the fund.
Officers:
Except for Anthony R. Rochte, correspondence intended for each officer may be sent to Fidelity Investments, 245 Summer Street, Boston, Massachusetts 02210. Correspondence intended for Mr. Rochte may be sent to SelectCo, 1225 17th Street, Denver, Colorado 80202-5541. Officers appear below in alphabetical order.
Name, Year of Birth; Principal Occupation |
Christopher S. Bartel (1971) |
Year of Election or Appointment: 2009 Vice President |
| Mr. Bartel also serves as Vice President of other funds. Mr. Bartel serves as a Director, President, and Chief Executive Officer of Fidelity Management & Research (Japan) Inc. (2012-present), a Director of Fidelity Management & Research (Hong Kong) (2012-present), and Senior Vice President of Global Equity Research (2010-present). Previously, Mr. Bartel served as Senior Vice President of Equity Research (2009-2010), Managing Director of Research (2006-2009), and an analyst and portfolio manager (2000-2006). |
Elizabeth Paige Baumann (1968) |
Year of Election or Appointment: 2012 Anti-Money Laundering (AML) Officer |
| Ms. Baumann also serves as AML Officer of other funds. She is Chief AML Officer of FMR LLC (2012-present) and is an employee of Fidelity Investments. Previously, Ms. Baumann served as Vice President and Deputy Anti-Money Laundering Officer (2007-2012). |
Marc Bryant (1966) |
Year of Election or Appointment: 2013 Secretary and Chief Legal Officer (CLO) |
| Mr. Bryant also serves as an officer of other funds. He is Senior Vice President and Deputy General Counsel of FMR LLC. Prior to joining Fidelity Investments, Mr. Bryant served as a Senior Vice President and the Head of Global Retail Legal for AllianceBernstein L.P. (2006-2010), and as the General Counsel for ProFund Advisors LLC (2001-2006). |
William C. Coffey (1969) |
Year of Election or Appointment: 2009 Assistant Secretary |
| Mr. Coffey also serves as Assistant Secretary of other funds. He is Senior Vice President and Deputy General Counsel of FMR LLC (2010-present), and is an employee of Fidelity Investments. Previously, Mr. Coffey served as Vice President and Associate General Counsel of FMR LLC (2005-2009). |
Jonathan Davis (1968) |
Year of Election or Appointment: 2010 Assistant Treasurer |
| Mr. Davis also serves as Assistant Treasurer of other funds. Mr. Davis is an employee of Fidelity Investments. Previously, Mr. Davis served as Vice President and Associate General Counsel of FMR LLC (2003-2010). |
Adrien E. Deberghes (1967) |
Year of Election or Appointment: 2013 President and Treasurer |
| Mr. Deberghes also serves as an officer of other funds. He is an employee of Fidelity Investments (2008-present). Prior to joining Fidelity Investments, Mr. Deberghes was Senior Vice President of Mutual Fund Administration at State Street Corporation (2007-2008), Senior Director of Mutual Fund Administration at Investors Bank & Trust (2005-2007), and Director of Finance for Dunkin' Brands (2000-2005). |
Stephanie J. Dorsey (1969) |
Year of Election or Appointment: 2010 Assistant Treasurer |
| Ms. Dorsey also serves as an officer of other funds. She is an employee of Fidelity Investments (2008-present) and has served in other fund officer roles. Prior to joining Fidelity Investments, Ms. Dorsey served as Treasurer (2004-2008) of the JPMorgan Mutual Funds and Vice President (2004-2008) of JPMorgan Chase Bank. |
Joseph A. Hanlon (1968) |
Year of Election or Appointment: 2012 Chief Compliance Officer |
| Mr. Hanlon also serves as Chief Compliance Officer of other funds. Mr. Hanlon serves as Compliance Officer of FMR, FMR Co., Inc., Fidelity Investments Money Management, Inc. (FIMM), Fidelity Research and Analysis Company (FRAC), and Fidelity Management & Research (Hong Kong) (2009-present), as Senior Vice President of the Fidelity Asset Management Division (2009-present), and is an employee of Fidelity Investments. Previously, Mr. Hanlon served as Compliance Officer of Fidelity Management & Research (Japan) Inc. (2009-2013), Strategic Advisers, Inc. (2009-2013), and Fidelity Management & Research (U.K.) Inc. (2009-2013). |
Brian B. Hogan (1964) |
Year of Election or Appointment: 2009 Vice President |
| Mr. Hogan also serves as Vice President of other funds. Mr. Hogan serves as President of FMR's Equity Division (2009-present). Previously, Mr. Hogan served as Senior Vice President, Equity Research of FMR (2006-2009) and as a portfolio manager. |
Chris Maher (1972) |
Year of Election or Appointment: 2013 Assistant Treasurer |
| Mr. Maher serves as Assistant Treasurer of other funds. Mr. Maher is Vice President of Valuation Oversight and is an employee of Fidelity Investments. Previously, Mr. Maher served as Vice President of Asset Management Compliance (2013), Vice President of FMR's Program Management Group (2010-2013), and Vice President of Valuation Oversight (2008-2010). |
Christine Reynolds (1958) |
Year of Election or Appointment: 2008 Chief Financial Officer |
| Ms. Reynolds also serves as Chief Financial Officer of other funds. Ms. Reynolds became President of Fidelity Pricing and Cash Management Services (FPCMS) in August 2008. Ms. Reynolds served as Chief Operating Officer of FPCMS (2007-2008). Previously, Ms. Reynolds served as President, Treasurer, and Anti-Money Laundering officer of the Fidelity funds (2004-2007). |
Kenneth B. Robins (1969) |
Year of Election or Appointment: 2013 Deputy Treasurer |
| Mr. Robins also serves as an officer of other funds. Mr. Robins serves as Executive Vice President of Fidelity Investments Money Management, Inc. (FIMM) (2013-present) and is an employee of Fidelity Investments (2004-present). Previously, Mr. Robins served in other fund officer roles. |
Anthony R. Rochte (1968) |
Year of Election or Appointment: 2013 Vice President |
| Mr. Rochte also serves as Vice President of other funds. Mr. Rochte serves as President of Fidelity SelectCo, LLC (2012-present) and is an employee of Fidelity Investments (2012-present). Prior to joining Fidelity Investments, Mr. Rochte served as Senior Managing Director and head of State Street Global Advisors' North American Intermediary Business Group (2006-2012). |
Stacie M. Smith (1974) |
Year of Election or Appointment: 2013 Assistant Treasurer |
| Ms. Smith also serves as an officer of other funds. She is an employee of Fidelity Investments (2009-present) and has served in other fund officer roles. Prior to joining Fidelity Investments, Ms. Smith served as Senior Audit Manager of Ernst & Young LLP (1996-2009). |
Renee Stagnone (1975) |
Year of Election or Appointment: 2013 Deputy Treasurer |
| Ms. Stagnone also serves as Deputy Treasurer of other funds. Ms. Stagnone is an employee of Fidelity Investments. |
Joseph F. Zambello (1957) |
Year of Election or Appointment: 2011 Deputy Treasurer |
| Mr. Zambello also serves as Deputy Treasurer of other funds. Mr. Zambello is an employee of Fidelity Investments. Previously, Mr. Zambello served as Vice President of FMR's Program Management Group (2009-2011) and Vice President of the Transfer Agent Oversight Group (2005-2009). |
Annual Report
The Board of Trustees of VIP Health Care Portfolio voted to pay to shareholders of record at the opening of business on record date, the following distributions per share derived from capital gains realized from sales of portfolio securities:
| Pay Date | Record Date | Capital Gains |
Initial Class | 02/14/2014 | 02/14/2014 | $1.045 |
Investor Class | 02/14/2014 | 02/14/2014 | $1.045 |
The fund hereby designates as a capital gain dividend with respect to the taxable year ended December 31, 2013, $17,165,755, or, if subsequently determined to be different, the net capital gain of such year.
Initial Class and Investor Class designate 9% of the dividends distributed during the fiscal year as qualifying for the dividends-received deduction for corporate shareholders.
Annual Report
A special meeting of Health Care Portfolio's shareholders was held on May 14, 2013. The results of votes taken among shareholders on the proposals before them are reported below. Each vote reported represents one dollar of net asset value held on the record date for the meeting.
PROPOSAL 1 |
To elect a Board of Trustees.A |
| # of
Votes | % of
Votes |
Ned C. Lautenbach |
Affirmative | 1,555,133,782.46 | 93.955 |
Withheld | 100,063,694.32 | 6.045 |
TOTAL | 1,655,197,476.78 | 100.000 |
Ronald P. O'Hanley |
Affirmative | 1,557,988,095.28 | 94.128 |
Withheld | 97,209,381.50 | 5.872 |
TOTAL | 1,655,197,476.78 | 100.000 |
David A. Rosow |
Affirmative | 1,552,645,347.31 | 93.805 |
Withheld | 102,552,129.47 | 6.195 |
TOTAL | 1,655,197,476.78 | 100.000 |
Garnett A. Smith |
Affirmative | 1,554,582,880.53 | 93.922 |
Withheld | 100,614,596.25 | 6.078 |
TOTAL | 1,655,197,476.78 | 100.000 |
William S. Stavropoulos |
Affirmative | 1,548,352,452.21 | 93.545 |
Withheld | 106,845,024.57 | 6.455 |
TOTAL | 1,655,197,476.78 | 100.000 |
Michael E. Wiley |
Affirmative | 1,556,790,374.70 | 94.055 |
Withheld | 98,407,102.08 | 5.945 |
TOTAL | 1,655,197,476.78 | 100.000 |
PROPOSAL 2 |
To approve a management contract between the fund and Fidelity SelectCo, LLC. |
| # of
Votes | % of
Votes |
Affirmative | 208,826,444.43 | 90.404 |
Against | 13,521,679.99 | 5.853 |
Abstain | 8,646,893.12 | 3.743 |
TOTAL | 230,995,017.54 | 100.000 |
A Denotes trust-wide proposal and voting results. |
Annual Report
Investment Adviser
Fidelity SelectCo, LLC
Denver, CO
Investment Sub-Advisers
FMR Co., Inc.
Fidelity Management & Research (U.K.) Inc.
Fidelity Management & Research (Hong Kong) Limited
Fidelity Management & Research (Japan) Inc.
General Distributor
Fidelity Distributors Corporation
Smithfield, RI
Transfer and Service Agents
Fidelity Investments Institutional Operations Company, Inc.
Boston, MA
Fidelity Service Company, Inc.
Boston, MA
Custodian
JPMorgan Chase Bank
New York, NY
VHCIC-ANN-0214
1.817373.108
Fidelity® Variable Insurance Products:
Industrials Portfolio
Annual Report
December 31, 2013
(Fidelity Cover Art)
Contents
Performance | (Click Here) | How the fund has done over time. |
Management's Discussion of Fund Performance | (Click Here) | The Portfolio Manager's review of fund performance and strategy. |
Shareholder Expense Example | (Click Here) | An example of shareholder expenses. |
Investment Changes | (Click Here) | A summary of major shifts in the fund's investments over the past six months. |
Investments | (Click Here) | A complete list of the fund's investments with their market values. |
Financial Statements | (Click Here) | Statements of assets and liabilities, operations, and changes in net assets, as well as financial highlights. |
Notes | (Click Here) | Notes to the financial statements. |
Report of Independent Registered Public Accounting Firm | (Click Here) | |
Trustees and Officers | (Click Here) | |
Distributions | (Click Here) | |
Proxy Voting Results | (Click Here) | |
To view a fund's proxy voting guidelines and proxy voting record for the 12-month period ended June 30, visit http://www.fidelity.com/proxyvotingresults or visit the Securities and Exchange Commission's (SEC) web site at http://www.sec.gov. You may also call 1-877-208-0098 to request a free copy of the proxy voting guidelines.
Fidelity Variable Insurance Products are separate account options which are purchased through a variable insurance contract.
Standard & Poor's, S&P and S&P 500 are registered service marks of The McGraw-Hill Companies, Inc. and have been licensed for use by Fidelity Distributors Corporation.
Other third-party marks appearing herein are the property of their respective owners.
All other marks appearing herein are registered or unregistered trademarks or service marks of FMR LLC or an affiliated company. © 2014 FMR LLC. All rights reserved.
This report and the financial statements contained herein are submitted for the general information of the shareholders of the fund. This report is not authorized for distribution to prospective investors in the fund unless preceded or accompanied by an effective prospectus.
A fund files its complete schedule of portfolio holdings with the SEC for the first and third quarters of each fiscal year on Form N-Q. Forms N-Q are available on the SEC's web site at http://www.sec.gov. A fund's Forms N-Q may be reviewed and copied at the SEC's Public Reference Room in Washington, DC. Information regarding the operation of the SEC's Public Reference Room may be obtained by calling 1-800-SEC-0330. For a complete list of a fund's portfolio holdings, view the most recent holdings listing, semiannual report, or annual report on Fidelity's web site at http://www.fidelity.com, http://www.advisor.fidelity.com, or http://www.401k.com, as applicable.
NOT FDIC INSURED • MAY LOSE VALUE • NO BANK GUARANTEE
Neither the fund nor Fidelity Distributors Corporation is a bank.
Annual Report
Average annual total return reflects the change in the value of an investment, assuming reinvestment of the class' distributions from dividend income and capital gains (the profits earned upon the sale of securities that have grown in value, if any) and assuming a constant rate of performance each year. During periods of reimbursement by Fidelity, a fund's total return will be greater than it would be had the reimbursement not occurred. Performance numbers are net of all underlying fund operating expenses, but do not include any insurance charges imposed by your insurance company's separate account. If performance information included the effect of these additional charges, the total returns would have been lower. How a fund did yesterday is no guarantee of how it will do tomorrow.
Average Annual Total Returns
Periods ended December 31, 2013 | Past 1
year | Past 5
years | Past 10
years |
VIP Industrials Portfolio - Initial Class A | 39.80% | 24.04% | 12.97% |
VIP Industrials Portfolio - Investor Class A,B | 39.72% | 23.91% | 12.87% |
A Prior to October 1, 2006, VIP Industrials Portfolio was named VIP Cyclical Industries Portfolio, and the fund operated under certain different investment policies and compared its performance to a different additional index. The fund's historical performance may not represent its current investment policies.
B The initial offering of Investor Class shares took place on July 21, 2005. Returns prior to July 21, 2005, are those of Initial Class. Had Investor Class's transfer agent fee been reflected, returns prior to July 21, 2005, would have been lower.
$10,000 Over 10 Years
Let's say hypothetically that $10,000 was invested in VIP Industrials Portfolio - Initial Class on December 31, 2003. The chart shows how the value of your investment would have changed, and also shows how the S&P 500® Index performed over the same period.
Annual Report
Market Recap: Global equity markets remained upbeat for the 12 months ending December 31, 2013, propelling the MSCI® ACWI® (All Country World Index) Index to a 23.24% return. Midyear turbulence gave way by autumn when policymakers in the U.S. and China had made clear their intentions to maintain accommodative monetary policies. That stance, combined with modest cyclical improvement around the globe and generally low valuations, underpinned the broad rally in equities, although the relative strength of the U.S. dollar generally tempered gains for U.S. investors holding foreign securities based in local currencies. During the period, the broad-market S&P 500® Index set a series of new highs, finishing the year up 32.39%. For the first time since 1995, the S&P® scored a "perfect 10," with all 10 economic sectors gaining at least 10% for the year. A resurgence in growth-oriented stocks lifted the Nasdaq Composite Index® to a 40.12% result for 2013, while the blue-chip Dow Jones Industrial AverageSM notched a relatively more modest 29.65% gain. International developed-markets equities rose in concert with their U.S. counterparts, with the MSCI® EAFE® Index gaining 22.92% for the period. Meanwhile, foreign exchange and commodity weakness curbed results in resource-heavy emerging markets (EM), especially in the year's waning months. More generally, concern over EM's slowing growth, its declining share of global trade and uncertainty surrounding U.S. central bank intentions were all factors hampering performance. The MSCI Emerging Markets Index returned -2.27% for the period. On the bond side, U.S. high-yield securities rallied with equities for much of the period, with The BofA Merrill LynchSM US High Yield Constrained Index returning 7.41% for 2013. The more rate-sensitive U.S. investment-grade bond category faced headwinds though, as reflected in the -2.02% return of the Barclays® U.S. Aggregate Bond Index. Within the Barclays index, investment-grade corporate credit returned -2.01%, while ultra-safe U.S. Treasuries saw a -2.75% result. Major non-U.S. developed markets performed only slightly better, with the Citigroup Non-USD Group-of-Seven (G7) Equal Weighted Index logging a -1.59% result. After several years of strong advances, EM debt reversed course in 2013, with the J.P. Morgan Emerging Markets Bond Index Global returning -6.58%.
Comments from Tobias Welo, Portfolio Manager of VIP Industrials Portfolio: For the year, the fund's share classes trailed the robust 42.13% gain of the MSCI® U.S. IMI Industrials 25-50 Index but handily outpaced the S&P 500®. Compared with the broader market, the industrials sector got an especially strong boost from aerospace & defense and industrial machinery stocks. (For specific portfolio results, please refer to the performance section of this report.) Versus the MSCI index, not owning some strong-performing stocks in the aerospace & defense industry, including Boeing, Lockheed Martin and Northrop Grumman, weighed on performance. Additionally, not owning any airlines held back the fund's results, as this group delivered the best performance in the index, almost doubling in value. Not having a stake in Delta Air Lines particularly hampered performance, while missing the large gain delivered by the shares of Southwest Airlines detracted to a lesser extent. Conversely, stock selection in the construction & farm machinery & heavy trucks segment provided a meaningful boost to relative performance. In particular, not owning index component Caterpillar early in the year, when the shares were weakest, was helpful. While continued sluggishness in China's economy hurt the stock of this heavy-equipment manufacturer beginning in February, I thought investors became overly pessimistic about it, and so I built it into the fund's seventh-largest position by period end. In the same group, negligible exposure to Deere paid off. This firm's core business is making farm equipment, and I thought demand here might remain constrained by weak agriculture fundamentals. Elsewhere, our results were lifted by a sizable overweighting in human resources consultant Towers Watson, the fund's largest relative contributor. I correctly judged that the firm's disappointing revenue growth in 2012 was primarily due to temporary factors, and the stock strongly rebounded during 2013. I'll also mention a beneficial non-index position in Johnson Controls, which makes heating, ventilating and air conditioning systems, as well as auto interiors and lithium-ion batteries for hybrid cars.
The views expressed above reflect those of the portfolio manager(s) only through the end of the period as stated on the cover of this report and do not necessarily represent the views of Fidelity or any other person in the Fidelity organization. Any such views are subject to change at any time based upon market or other conditions and Fidelity disclaims any responsibility to update such views. These views may not be relied on as investment advice and, because investment decisions for a Fidelity fund are based on numerous factors, may not be relied on as an indication of trading intent on behalf of any Fidelity fund.
Annual Report
As a shareholder of the Fund, you incur two types of costs: (1) transaction costs, including redemption fees and (2) ongoing costs, including management fees and other Fund expenses. This Example is intended to help you understand your ongoing costs (in dollars) of investing in the Fund and to compare these costs with the ongoing costs of investing in other mutual funds.
The Example is based on an investment of $1,000 invested at the beginning of the period and held for the entire period (July 1, 2013 to December 31, 2013).
Actual Expenses
The first line of the accompanying table for each class of the Fund provides information about actual account values and actual expenses. You may use the information in this line, together with the amount you invested, to estimate the expenses that you paid over the period. Simply divide your account value by $1,000.00 (for example, an $8,600 account value divided by $1,000.00 = 8.6), then multiply the result by the number in the first line for a class of the Fund under the heading entitled "Expenses Paid During Period" to estimate the expenses you paid on your account during this period. The estimate of expenses does not include any fees or other expenses of any variable annuity or variable life insurance product. If they were, the estimate of expenses you paid during the period would be higher, and your ending account value would be lower. In addition, the Fund, as a shareholder in the underlying Fidelity Central Funds, will indirectly bear its pro-rata share of the fees and expenses incurred by the underlying Fidelity Central Funds. These fees and expenses are not included in the Fund's annualized expense ratio used to calculate the expense estimate in the table below.
Hypothetical Example for Comparison Purposes
The second line of the accompanying table for each class of the Fund provides information about hypothetical account values and hypothetical expenses based on a Class' actual expense ratio and an assumed rate of return of 5% per year before expenses, which is not the Class' actual return. The hypothetical account values and expenses may not be used to estimate the actual ending account balance or expenses you paid for the period. You may use this information to compare the ongoing costs of investing in the Fund and other funds. To do so, compare this 5% hypothetical example with the 5% hypothetical examples that appear in the shareholder reports of the other funds. The estimate of expenses does not include any fees or other expenses of any variable annuity or variable life insurance product. If they were, the estimate of expenses you paid during the period would be higher, and your ending account value would be lower. In addition, the Fund, as a shareholder in the underlying Fidelity Central Funds, will indirectly bear its pro-rata share of the fees and expenses incurred by the underlying Fidelity Central Funds. These fees and expenses are not included in the Fund's annualized expense ratio used to calculate the expense estimate in the table below.
Please note that the expenses shown in the table are meant to highlight your ongoing costs only and do not reflect any transaction costs. Therefore, the second line of the table is useful in comparing ongoing costs only, and will not help you determine the relative total costs of owning different funds. In addition, if these transactional costs were included, your costs would have been higher.
| Annualized
Expense Ratio B | Beginning
Account Value
July 1, 2013 | Ending
Account Value
December 31, 2013 | Expenses Paid
During Period*
July 1, 2013
to December 31, 2013 |
Initial Class | .71% | | | |
Actual | | $ 1,000.00 | $ 1,222.70 | $ 3.98 |
Hypothetical A | | $ 1,000.00 | $ 1,021.63 | $ 3.62 |
Investor Class | .79% | | | |
Actual | | $ 1,000.00 | $ 1,222.00 | $ 4.42 |
Hypothetical A | | $ 1,000.00 | $ 1,021.22 | $ 4.02 |
A 5% return per year before expenses
B Annualized expense ratio reflects expenses net of applicable fee waivers.
* Expenses are equal to each Class' annualized expense ratio, multiplied by the average account value over the period, multiplied by 184/365 (to reflect the one-half year period).
Annual Report
Investment Changes (Unaudited)
Top Ten Stocks as of December 31, 2013 |
| % of fund's
net assets | % of fund's net assets
6 months ago |
General Electric Co. | 8.7 | 12.4 |
United Technologies Corp. | 7.5 | 6.4 |
Danaher Corp. | 5.3 | 5.6 |
FedEx Corp. | 4.0 | 0.0 |
Honeywell International, Inc. | 3.9 | 4.1 |
Union Pacific Corp. | 3.9 | 3.7 |
Caterpillar, Inc. | 3.7 | 3.5 |
Cummins, Inc. | 2.5 | 1.9 |
Nielsen Holdings B.V. | 2.5 | 1.5 |
Eaton Corp. PLC | 2.4 | 3.0 |
| 44.4 | |
Top Industries (% of fund's net assets) |
As of December 31, 2013 |
 | Machinery | 25.0% | |
 | Aerospace & Defense | 17.0% | |
 | Industrial Conglomerates | 14.0% | |
 | Professional Services | 8.8% | |
 | Electrical Equipment | 8.1% | |
 | All Others* | 27.1% | |

As of June 30, 2013 |
| Machinery | 28.9% | |
| Industrial Conglomerates | 21.6% | |
| Aerospace & Defense | 14.0% | |
| Electrical Equipment | 7.2% | |
| Professional Services | 7.1% | |
| All Others* | 21.2% | |

* Includes short-term investments and net other assets (liabilities). |
Annual Report
Investments December 31, 2013
Showing Percentage of Net Assets
Common Stocks - 96.9% |
| Shares | | Value |
AEROSPACE & DEFENSE - 17.0% |
Aerospace & Defense - 17.0% |
Curtiss-Wright Corp. | 900 | | $ 56,007 |
Honeywell International, Inc. | 82,727 | | 7,558,766 |
Precision Castparts Corp. | 14,736 | | 3,968,405 |
Teledyne Technologies, Inc. (a) | 32,715 | | 3,005,200 |
Textron, Inc. | 29,903 | | 1,099,234 |
Triumph Group, Inc. | 32,789 | | 2,494,259 |
United Technologies Corp. | 126,223 | | 14,364,177 |
| | 32,546,048 |
AIR FREIGHT & LOGISTICS - 4.0% |
Air Freight & Logistics - 4.0% |
FedEx Corp. | 53,179 | | 7,645,545 |
AUTO COMPONENTS - 1.9% |
Auto Parts & Equipment - 1.9% |
Johnson Controls, Inc. | 69,929 | | 3,587,358 |
BUILDING PRODUCTS - 2.2% |
Building Products - 2.2% |
A.O. Smith Corp. | 55,897 | | 3,015,084 |
Aspen Aerogels, Inc. warrants 3/28/23 (a)(d) | 822,151 | | 8 |
Lennox International, Inc. | 14,881 | | 1,265,778 |
| | 4,280,870 |
COMMERCIAL SERVICES & SUPPLIES - 2.2% |
Diversified Support Services - 0.5% |
Iron Mountain, Inc. | 32,993 | | 1,001,338 |
Environmental & Facility Services - 1.7% |
Stericycle, Inc. (a) | 10,750 | | 1,248,828 |
Waste Connections, Inc. | 45,673 | | 1,992,713 |
| | 3,241,541 |
TOTAL COMMERCIAL SERVICES & SUPPLIES | | 4,242,879 |
CONSTRUCTION & ENGINEERING - 4.5% |
Construction & Engineering - 4.5% |
Chicago Bridge & Iron Co. NV | 13,056 | | 1,085,476 |
EMCOR Group, Inc. | 59,196 | | 2,512,278 |
KBR, Inc. | 26,635 | | 849,390 |
MasTec, Inc. (a) | 9,227 | | 301,907 |
Tutor Perini Corp. (a) | 20,832 | | 547,882 |
URS Corp. | 61,897 | | 3,279,922 |
| | 8,576,855 |
ELECTRICAL EQUIPMENT - 8.1% |
Electrical Components & Equipment - 8.1% |
Eaton Corp. PLC | 61,133 | | 4,653,444 |
Emerson Electric Co. | 42,105 | | 2,954,929 |
Generac Holdings, Inc. | 28,703 | | 1,625,738 |
|
| Shares | | Value |
Hubbell, Inc. Class B | 29,807 | | $ 3,245,982 |
Rockwell Automation, Inc. | 25,100 | | 2,965,816 |
| | 15,445,909 |
INDUSTRIAL CONGLOMERATES - 14.0% |
Industrial Conglomerates - 14.0% |
Danaher Corp. | 131,485 | | 10,150,642 |
General Electric Co. | 596,548 | | 16,721,243 |
| | 26,871,885 |
MACHINERY - 25.0% |
Construction & Farm Machinery & Heavy Trucks - 11.1% |
Caterpillar, Inc. | 77,525 | | 7,040,045 |
Cummins, Inc. | 34,198 | | 4,820,892 |
Deere & Co. | 4,000 | | 365,320 |
Manitowoc Co., Inc. | 170,003 | | 3,964,470 |
Oshkosh Truck Corp. | 24,622 | | 1,240,456 |
Toro Co. | 19,429 | | 1,235,684 |
Wabtec Corp. | 33,082 | | 2,457,000 |
| | 21,123,867 |
Industrial Machinery - 13.9% |
Dover Corp. | 29,983 | | 2,894,559 |
GEA Group AG | 41,511 | | 1,975,891 |
Global Brass & Copper Holdings, Inc. | 26,775 | | 443,126 |
Graco, Inc. | 13,360 | | 1,043,683 |
Harsco Corp. | 13,002 | | 364,446 |
IDEX Corp. | 30,840 | | 2,277,534 |
ITT Corp. | 49,020 | | 2,128,448 |
Pall Corp. | 29,747 | | 2,538,906 |
Parker Hannifin Corp. | 26,647 | | 3,427,870 |
Pentair Ltd. | 31,464 | | 2,443,809 |
Timken Co. | 38,973 | | 2,146,243 |
TriMas Corp. (a) | 27,291 | | 1,088,638 |
Valmont Industries, Inc. | 26,119 | | 3,894,865 |
| | 26,668,018 |
TOTAL MACHINERY | | 47,791,885 |
OIL, GAS & CONSUMABLE FUELS - 0.5% |
Oil & Gas Storage & Transport - 0.5% |
Navigator Holdings Ltd. (a) | 18,852 | | 507,873 |
Scorpio Tankers, Inc. | 39,500 | | 465,705 |
| | 973,578 |
PROFESSIONAL SERVICES - 8.8% |
Human Resource & Employment Services - 2.3% |
Towers Watson & Co. | 34,520 | | 4,405,097 |
Research & Consulting Services - 6.5% |
CRA International, Inc. (a) | 20,100 | | 397,980 |
Dun & Bradstreet Corp. | 26,555 | | 3,259,626 |
Huron Consulting Group, Inc. (a) | 15,972 | | 1,001,764 |
Common Stocks - continued |
| Shares | | Value |
PROFESSIONAL SERVICES - CONTINUED |
Research & Consulting Services - continued |
Nielsen Holdings B.V. | 102,930 | | $ 4,723,458 |
Verisk Analytics, Inc. (a) | 45,852 | | 3,013,393 |
| | 12,396,221 |
TOTAL PROFESSIONAL SERVICES | | 16,801,318 |
ROAD & RAIL - 5.4% |
Railroads - 3.9% |
Union Pacific Corp. | 44,448 | | 7,467,264 |
Trucking - 1.5% |
J.B. Hunt Transport Services, Inc. | 36,149 | | 2,794,318 |
TOTAL ROAD & RAIL | | 10,261,582 |
TRADING COMPANIES & DISTRIBUTORS - 3.3% |
Trading Companies & Distributors - 3.3% |
Houston Wire & Cable Co. | 12,700 | | 169,926 |
MRC Global, Inc. (a) | 18,607 | | 600,262 |
MSC Industrial Direct Co., Inc. Class A | 9,000 | | 727,830 |
W.W. Grainger, Inc. | 6,337 | | 1,618,597 |
Watsco, Inc. | 1,990 | | 191,159 |
WESCO International, Inc. (a) | 34,227 | | 3,117,053 |
| | 6,424,827 |
TOTAL COMMON STOCKS (Cost $141,416,085) |
185,450,539
|
Convertible Bonds - 0.3% |
| Principal Amount | | |
BUILDING PRODUCTS - 0.3% |
Building Products - 0.3% |
Aspen Aerogels, Inc.: | | | | |
8% 6/1/14 (d) | | $ 305,309 | | 305,309 |
8% 12/6/14 (d) | | 255,652 | | 255,652 |
8% 3/28/16 (d) | | 22,387 | | 22,387 |
TOTAL CONVERTIBLE BONDS (Cost $583,340) |
583,348
|
U.S. Treasury Obligations - 0.1% |
|
U.S. Treasury Bills, yield at date of purchase 0.02% to 0.07% 1/2/14 to 2/27/14 (c)
(Cost $49,998) | | 50,000 | |
49,999
|
Money Market Funds - 4.1% |
| Shares | | Value |
Fidelity Cash Central Fund, 0.11% (b)
(Cost $7,875,016) | 7,875,016 | | $ 7,875,016 |
TOTAL INVESTMENT PORTFOLIO - 101.4% (Cost $149,924,439) | | 193,958,902 |
NET OTHER ASSETS (LIABILITIES) - (1.4)% | | (2,607,555) |
NET ASSETS - 100% | $ 191,351,347 |
Futures Contracts |
| Expiration Date | | Underlying Face Amount at Value | | Unrealized Appreciation/(Depreciation) |
Purchased |
Equity Index Contracts |
28 CME E-mini S&P Select Sector Industrial Index Contracts | March 2014 | | $ 1,458,240 | | $ 72,278 |
|
The face value of futures purchased as a percentage of net assets is 0.8% |
Legend |
(a) Non-income producing |
(b) Affiliated fund that is generally available only to investment companies and other accounts managed by Fidelity Investments. The rate quoted is the annualized seven-day yield of the fund at period end. A complete unaudited listing of the fund's holdings as of its most recent quarter end is available upon request. In addition, each Fidelity Central Fund's financial statements, which are not covered by the Fund's Report of Independent Registered Public Accounting Firm, are available on the SEC's website or upon request. |
(c) Security or a portion of the security was pledged to cover margin requirements for futures contracts. At period end, the value of securities pledged amounted to $49,999. |
(d) Restricted securities - Investment in securities not registered under the Securities Act of 1933 (excluding 144A issues). At the end of the period, the value of restricted securities (excluding 144A issues) amounted to $583,356 or 0.3% of net assets. |
Additional information on each restricted holding is as follows: |
Security | Acquisition Date | Acquisition Cost |
Aspen Aerogels, Inc. warrants 3/28/23 | 5/6/13 | $ 8 |
Aspen Aerogels, Inc. 8% 6/1/14 | 6/14/11 - 12/31/13 | $ 305,309 |
Aspen Aerogels, Inc. 8% 12/6/14 | 12/6/11 - 12/31/13 | $ 255,652 |
Aspen Aerogels, Inc. 8% 3/28/16 | 5/6/13 - 12/31/13 | $ 22,379 |
Affiliated Central Funds |
Information regarding fiscal year to date income earned by the Fund from investments in Fidelity Central Funds is as follows: |
Fund | Income earned |
Fidelity Cash Central Fund | $ 5,368 |
Fidelity Securities Lending Cash Central Fund | 2,014 |
Total | $ 7,382 |
Other Information |
The following is a summary of the inputs used, as of December 31, 2013, involving the Fund's assets and liabilities carried at fair value. The inputs or methodology used for valuing securities may not be an indication of the risk associated with investing in those securities. For more information on valuation inputs, and their aggregation into the levels used in the tables below, please refer to the Investment Valuation section in the accompanying Notes to Financial Statements. |
Valuation Inputs at Reporting Date: |
Description | Total | Level 1 | Level 2 | Level 3 |
Investments in Securities: | | | | |
Common Stocks | $ 185,450,539 | $ 185,450,531 | $ - | $ 8 |
Convertible Bonds | 583,348 | - | - | 583,348 |
U.S. Treasury Obligations | 49,999 | - | 49,999 | - |
Money Market Funds | 7,875,016 | 7,875,016 | - | - |
Total Investments in Securities: | $ 193,958,902 | $ 193,325,547 | $ 49,999 | $ 583,356 |
Derivative Instruments: | | | | |
Assets | | | | |
Futures Contracts | $ 72,278 | $ 72,278 | $ - | $ - |
Value of Derivative Instruments |
The following table is a summary of the Fund's value of derivative instruments by primary risk exposure as of December 31, 2013. For additional information on derivative instruments, please refer to the Derivative Instruments section in the accompanying Notes to Financial Statements. |
Primary Risk Exposure /
Derivative Type | Value |
| Asset | Liability |
Equity Risk | | |
Futures Contracts (a) | $ 72,278 | $ - |
Total Value of Derivatives | $ 72,278 | $ - |
(a) Reflects gross cumulative appreciation (depreciation) on futures contracts as presented in the Schedule of Investments. Only the period end receivable or payable for daily variation margin and net unrealized appreciation (depreciation) are presented in the Statement of Assets and Liabilities. |
See accompanying notes which are an integral part of the financial statements.
Annual Report
Statement of Assets and Liabilities
| December 31, 2013 |
| | |
Assets | | |
Investment in securities, at value - See accompanying schedule: Unaffiliated issuers (cost $142,049,423) | $ 186,083,886 | |
Fidelity Central Funds (cost $7,875,016) | 7,875,016 | |
Total Investments (cost $149,924,439) | | $ 193,958,902 |
Receivable for investments sold | | 1,041,889 |
Receivable for fund shares sold | | 433,394 |
Dividends receivable | | 232,629 |
Interest receivable | | 130 |
Distributions receivable from Fidelity Central Funds | | 434 |
Receivable for daily variation margin for derivative instruments | | 6,160 |
Prepaid expenses | | 976 |
Other receivables | | 265 |
Total assets | | 195,674,779 |
| | |
Liabilities | | |
Payable to custodian bank | $ 13,620 | |
Payable for investments purchased | 3,911,622 | |
Payable for fund shares redeemed | 255,895 | |
Accrued management fee | 81,874 | |
Other affiliated payables | 24,380 | |
Other payables and accrued expenses | 36,041 | |
Total liabilities | | 4,323,432 |
| | |
Net Assets | | $ 191,351,347 |
Net Assets consist of: | | |
Paid in capital | | $ 144,318,357 |
Distributions in excess of net investment income | | (158,936) |
Accumulated undistributed net realized gain (loss) on investments and foreign currency transactions | | 3,085,173 |
Net unrealized appreciation (depreciation) on investments and assets and liabilities in foreign currencies | | 44,106,753 |
Net Assets | | $ 191,351,347 |
Statement of Assets and Liabilities - continued
| December 31, 2013 |
| | |
Initial Class:
Net Asset Value, offering price and redemption price per share ($55,233,876 ÷ 2,491,390 shares) | | $ 22.17 |
| | |
Investor Class:
Net Asset Value, offering price and redemption price per share ($136,117,471 ÷ 6,167,457 shares) | | $ 22.07 |
See accompanying notes which are an integral part of the financial statements.
Annual Report
Statement of Operations
| Year ended December 31, 2013 |
| | |
Investment Income | | |
Dividends | | $ 1,990,023 |
Interest | | 45,926 |
Income from Fidelity Central Funds | | 7,382 |
Total income | | 2,043,331 |
| | |
Expenses | | |
Management fee | $ 722,537 | |
Transfer agent fees | 164,813 | |
Accounting and security lending fees | 50,956 | |
Custodian fees and expenses | 16,171 | |
Independent trustees' compensation | 2,118 | |
Audit | 46,805 | |
Legal | 2,057 | |
Miscellaneous | 7,236 | |
Total expenses before reductions | 1,012,693 | |
Expense reductions | (7,348) | 1,005,345 |
Net investment income (loss) | | 1,037,986 |
Realized and Unrealized Gain (Loss) Net realized gain (loss) on: | | |
Investment securities: | | |
Unaffiliated issuers | 12,724,910 | |
Foreign currency transactions | (204) | |
Futures contracts | 211,707 | |
Total net realized gain (loss) | | 12,936,413 |
Change in net unrealized appreciation (depreciation) on: Investment securities | 29,437,886 | |
Assets and liabilities in foreign currencies | 61 | |
Futures contracts | 67,340 | |
Total change in net unrealized appreciation (depreciation) | | 29,505,287 |
Net gain (loss) | | 42,441,700 |
Net increase (decrease) in net assets resulting from operations | | $ 43,479,686 |
Statement of Changes in Net Assets
| Year ended
December 31,
2013 | Year ended
December 31,
2012 |
Increase (Decrease) in Net Assets | | |
Operations | | |
Net investment income (loss) | $ 1,037,986 | $ 1,088,983 |
Net realized gain (loss) | 12,936,413 | 3,273,411 |
Change in net unrealized appreciation (depreciation) | 29,505,287 | 10,250,032 |
Net increase (decrease) in net assets resulting from operations | 43,479,686 | 14,612,426 |
Distributions to shareholders from net investment income | (1,165,916) | (1,094,087) |
Distributions to shareholders from net realized gain | (9,390,617) | - |
Total distributions | (10,556,533) | (1,094,087) |
Share transactions - net increase (decrease) | 77,029,709 | (15,262,305) |
Redemption fees | 18,548 | 9,220 |
Total increase (decrease) in net assets | 109,971,410 | (1,734,746) |
| | |
Net Assets | | |
Beginning of period | 81,379,937 | 83,114,683 |
End of period (including distributions in excess of net investment income of $158,936 and distributions in excess of net investment income of $2,054, respectively) | $ 191,351,347 | $ 81,379,937 |
See accompanying notes which are an integral part of the financial statements.
Annual Report
Financial Highlights - Initial Class
Years ended December 31, | 2013 | 2012 | 2011 | 2010 | 2009 |
Selected Per-Share Data | | | | | |
Net asset value, beginning of period | $ 16.88 | $ 14.29 | $ 15.16 | $ 11.63 | $ 8.37 |
Income from Investment Operations | | | | | |
Net investment income (loss) C | .17 | .21 | .13 | .10 | .10 |
Net realized and unrealized gain (loss) | 6.48 | 2.62 | (.85) | 3.51 | 3.27 |
Total from investment operations | 6.65 | 2.83 | (.72) | 3.61 | 3.37 |
Distributions from net investment income | (.16) | (.24) | (.16) | (.09) | (.11) |
Distributions from net realized gain | (1.20) | - | - | - | - |
Total distributions | (1.36) | (.24) | (.16) | (.09) | (.11) |
Redemption fees added to paid in capital C | - G | - G | .01 | .01 | - G |
Net asset value, end of period | $ 22.17 | $ 16.88 | $ 14.29 | $ 15.16 | $ 11.63 |
Total Return A, B | 39.80% | 19.82% | (4.65)% | 31.09% | 40.22% |
Ratios to Average Net Assets D, F | | | | | |
Expenses before reductions | .72% | .74% | .74% | .77% | .81% |
Expenses net of fee waivers, if any | .72% | .74% | .74% | .76% | .81% |
Expenses net of all reductions | .72% | .73% | .73% | .75% | .80% |
Net investment income (loss) | .84% | 1.30% | .88% | .77% | 1.10% |
Supplemental Data | | | | | |
Net assets, end of period (000 omitted) | $ 55,234 | $ 31,784 | $ 34,854 | $ 43,295 | $ 32,183 |
Portfolio turnover rate E | 64% | 80% | 111% | 91% | 117% |
A Total returns do not reflect charges attributable to your insurance company's separate account. Inclusion of these charges would reduce the total returns shown.
B Total returns would have been lower if certain expenses had not been reduced during the applicable periods shown.
C Calculated based on average shares outstanding during the period.
D Fees and expenses of any underlying Fidelity Central Funds are not included in the Fund's expense ratio. The Fund indirectly bears its proportionate share of the expenses of any underlying Fidelity Central Funds.
E Amount does not include the portfolio activity of any underlying Fidelity Central Funds.
F Expense ratios reflect operating expenses of the class. Expenses before reductions do not reflect amounts reimbursed by the investment adviser or reductions from brokerage service arrangements or reductions from other expense offset arrangements and do not represent the amount paid by the class during periods when reimbursements or reductions occur. Expenses net of fee waivers reflect expenses after reimbursement by the investment adviser but prior to reductions from brokerage service arrangements or other expense offset arrangements. Expenses net of all reductions represent the net expenses paid by the class.
G Amount represents less than $.01 per share.
Financial Highlights - Investor Class
Years ended December 31, | 2013 | 2012 | 2011 | 2010 | 2009 |
Selected Per-Share Data | | | | | |
Net asset value, beginning of period | $ 16.81 | $ 14.24 | $ 15.10 | $ 11.59 | $ 8.35 |
Income from Investment Operations | | | | | |
Net investment income (loss) C | .15 | .19 | .12 | .09 | .09 |
Net realized and unrealized gain (loss) | 6.46 | 2.61 | (.84) | 3.49 | 3.25 |
Total from investment operations | 6.61 | 2.80 | (.72) | 3.58 | 3.34 |
Distributions from net investment income | (.15) | (.23) | (.15) | (.08) | (.10) |
Distributions from net realized gain | (1.20) | - | - | - | - |
Total distributions | (1.35) | (.23) | (.15) | (.08) | (.10) |
Redemption fees added to paid in capital C | - G | - G | .01 | .01 | - G |
Net asset value, end of period | $ 22.07 | $ 16.81 | $ 14.24 | $ 15.10 | $ 11.59 |
Total Return A, B | 39.72% | 19.65% | (4.70)% | 30.96% | 39.97% |
Ratios to Average Net Assets D, F | | | | | |
Expenses before reductions | .80% | .82% | .82% | .85% | .91% |
Expenses net of fee waivers, if any | .80% | .82% | .82% | .84% | .91% |
Expenses net of all reductions | .79% | .81% | .81% | .84% | .90% |
Net investment income (loss) | .77% | 1.22% | .80% | .69% | 1.00% |
Supplemental Data | | | | | |
Net assets, end of period (000 omitted) | $ 136,117 | $ 49,596 | $ 48,261 | $ 48,832 | $ 25,879 |
Portfolio turnover rate E | 64% | 80% | 111% | 91% | 117% |
A Total returns do not reflect charges attributable to your insurance company's separate account. Inclusion of these charges would reduce the total returns shown.
B Total returns would have been lower if certain expenses had not been reduced during the applicable periods shown.
C Calculated based on average shares outstanding during the period.
D Fees and expenses of any underlying Fidelity Central Funds are not included in the Fund's expense ratio. The Fund indirectly bears its proportionate share of the expenses of any underlying Fidelity Central Funds.
E Amount does not include the portfolio activity of any underlying Fidelity Central Funds.
F Expense ratios reflect operating expenses of the class. Expenses before reductions do not reflect amounts reimbursed by the investment adviser or reductions from brokerage service arrangements or reductions from other expense offset arrangements and do not represent the amount paid by the class during periods when reimbursements or reductions occur. Expenses net of fee waivers reflect expenses after reimbursement by the investment adviser but prior to reductions from brokerage service arrangements or other expense offset arrangements. Expenses net of all reductions represent the net expenses paid by the class.
G Amount represents less than $.01 per share.
See accompanying notes which are an integral part of the financial statements.
Annual Report
Notes to Financial Statements
For the period ended December 31, 2013
1. Organization.
VIP Industrials Portfolio (the Fund) is a non-diversified fund of Variable Insurance Products Fund IV (the Trust) and is authorized to issue an unlimited number of shares. The Trust is registered under the Investment Company Act of 1940, as amended (the 1940 Act), as an open-end management investment company organized as a Massachusetts business trust. Shares of the Fund may only be purchased by insurance companies for the purpose of funding variable annuity or variable life insurance contracts. The Fund offers the following classes of shares: Initial Class shares and Investor Class shares. All classes have equal rights and voting privileges, except for matters affecting a single class.
2. Investments in Fidelity Central Funds.
The Fund invests in Fidelity Central Funds, which are open-end investment companies generally available only to other investment companies and accounts managed by the investment adviser and its affiliates. The Fund's Schedule of Investments lists each of the Fidelity Central Funds held as of period end, if any, as an investment of the Fund, but does not include the underlying holdings of each Fidelity Central Fund. As an Investing Fund, the Fund indirectly bears its proportionate share of the expenses of the underlying Fidelity Central Funds.
The Money Market Central Funds seek preservation of capital and current income and are managed by Fidelity Investments Money Management, Inc. (FIMM), an affiliate of the investment adviser. Annualized expenses of the Money Market Central Funds as of their most recent shareholder report date are less than .01%.
A complete unaudited list of holdings for each Fidelity Central Fund is available upon request or at the Securities and Exchange Commission (the SEC) website at www.sec.gov. In addition, the financial statements of the Fidelity Central Funds, which are not covered by the Fund's Report of Independent Registered Public Accounting Firm, are available on the SEC website or upon request.
3. Significant Accounting Policies.
The financial statements have been prepared in conformity with accounting principles generally accepted in the United States of America (GAAP), which require management to make certain estimates and assumptions at the date of the financial statements. Actual results could differ from those estimates. Subsequent events, if any, through the date that the financial statements were issued have been evaluated in the preparation of the financial statements. The following summarizes the significant accounting policies of the Fund:
Investment Valuation. Investments are valued as of 4:00 p.m. Eastern time on the last calendar day of the period. In accordance with valuation policies and procedures approved by the Board of Trustees (the Board), the Fund attempts to obtain prices from one or more third party pricing vendors or brokers to value its investments. When current market prices, quotations or currency exchange rates are not readily available or reliable, investments will be fair valued in good faith by the Fidelity SelectCo, LLC (SelectCo) Fair Value Committee (the Committee), in accordance with procedures adopted by the Board. Factors used in determining fair value vary by investment type and may include market or investment specific events, changes in interest rates and credit quality. The frequency with which these procedures are used cannot be predicted and they may be utilized to a significant extent. The Committee oversees the Fund's valuation policies and procedures and is responsible for approving and reporting to the Board all fair value determinations.
The Fund categorizes the inputs to valuation techniques used to value its investments into a disclosure hierarchy consisting of three levels as shown below:
Level 1 - quoted prices in active markets for identical investments
Level 2 - other significant observable inputs (including quoted prices for similar investments, interest rates, prepayment speeds, etc.)
Level 3 - unobservable inputs (including the Fund's own assumptions based on the best information available)
Valuation techniques used to value the Fund's investments by major category are as follows:
Equity securities, including restricted securities, for which market quotations are readily available, are valued at the last reported sale price or official closing price as reported by a third party pricing vendor on the primary market or exchange on which they are traded and are categorized as Level 1 in the hierarchy. In the event there were no sales during the day or closing prices are not available, securities are valued at the last quoted bid price or may be valued using the last available price and are generally categorized as Level 2 in the hierarchy. For foreign equity securities, when market or security specific events arise, comparisons to the valuation of American Depositary Receipts (ADRs), futures contracts, Exchange-Traded Funds (ETFs) and certain indexes as well as quoted prices for similar securities may be used and would be categorized as Level 2 in the hierarchy. Utilizing these techniques may result in transfers between Level 1 and Level 2. For equity securities, including restricted securities, where observable inputs are limited, assumptions about market activity and risk are used and these securities may be categorized as Level 3 in the hierarchy.
Debt securities, including restricted securities, are valued based on evaluated prices received from third party pricing vendors or from brokers who make markets in such securities. Corporate bonds and U.S. government and government agency obligations are valued by pricing vendors who utilize
Annual Report
Notes to Financial Statements - continued
3. Significant Accounting Policies - continued
Investment Valuation - continued
matrix pricing which considers yield or price of bonds of comparable quality, coupon, maturity and type or by broker-supplied prices. When independent prices are unavailable or unreliable, debt securities may be valued utilizing pricing methodologies which consider similar factors that would be used by third party pricing vendors. Debt securities are generally categorized as Level 2 in the hierarchy but may be Level 3 depending on the circumstances.
Futures contracts are valued at the settlement price established each day by the board of trade or exchange on which they are traded and are categorized as Level 1 in the hierarchy. Investments in open-end mutual funds, including the Fidelity Central Funds, are valued at their closing net asset value (NAV) each business day and are categorized as Level 1 in the hierarchy.
Changes in valuation techniques may result in transfers in or out of an assigned level within the disclosure hierarchy. The aggregate value of investments by input level, as of December 31, 2013, is included at the end of the Fund's Schedule of Investments.
Foreign Currency. The Fund may use foreign currency contracts to facilitate transactions in foreign-denominated securities. Gains and losses from these transactions may arise from changes in the value of the foreign currency or if the counterparties do not perform under the contracts' terms.
Foreign-denominated assets, including investment securities, and liabilities are translated into U.S. dollars at the exchange rates at period end. Purchases and sales of investment securities, income and dividends received and expenses denominated in foreign currencies are translated into U.S. dollars at the exchange rate in effect on the transaction date.
The effects of exchange rate fluctuations on investments are included with the net realized and unrealized gain (loss) on investment securities. Other foreign currency transactions resulting in realized and unrealized gain (loss) are disclosed separately.
Investment Transactions and Income. For financial reporting purposes, the Fund's investment holdings and NAV include trades executed through the end of the last business day of the period. The NAV per share for processing shareholder transactions is calculated as of the close of business of the New York Stock Exchange (NYSE), normally 4:00 p.m. Eastern time and includes trades executed through the end of the prior business day. Gains and losses on securities sold are determined on the basis of identified cost and may include proceeds received from litigation. Dividend income is recorded on the ex-dividend date, except for certain dividends from foreign securities where the ex-dividend date may have passed, which are recorded as soon as the Fund is informed of the ex-dividend date. Non-cash dividends included in dividend income, if any, are recorded at the fair market value of the securities received. Distributions received on securities that represent a return of capital or capital gain are recorded as a reduction of cost of investments and/or as a realized gain. Subsequent to ex-dividend date the Fund determines the components of these distributions, based upon receipt of tax filings or other correspondence relating to the underlying investment. Interest income and distributions from the Fidelity Central Funds are accrued as earned. Interest income includes coupon interest and amortization of premium and accretion of discount on debt securities. Investment income is recorded net of foreign taxes withheld where recovery of such taxes is uncertain.
Class Allocations and Expenses. Investment income, realized and unrealized capital gains and losses, common expenses of the Fund, and certain fund-level expense reductions, if any, are allocated daily on a pro-rata basis to each class based on the relative net assets of each class to the total net assets of the Fund. Each class differs with respect to transfer agent fees incurred. Certain expense reductions may also differ by class. For the reporting period, the allocated portion of income and expenses to each class as a percent of its average net assets may vary due to the timing of recording these transactions in relation to fluctuating net assets of the classes. Expenses directly attributable to a fund are charged to that fund. Expenses attributable to more than one fund are allocated among the respective funds on the basis of relative net assets or other appropriate methods. Expense estimates are accrued in the period to which they relate and adjustments are made when actual amounts are known.
Income Tax Information and Distributions to Shareholders. Each year, the Fund intends to qualify as a regulated investment company under Subchapter M of the Internal Revenue Code, including distributing substantially all of its taxable income and realized gains. As a result, no provision for U.S. Federal income taxes is required. As of December 31, 2013, the Fund did not have any unrecognized tax benefits in the financial statements; nor is the Fund aware of any tax positions for which it is reasonably possible that the total amounts of unrecognized tax benefits will significantly change in the next twelve months. The Fund files a U.S. federal tax return, in addition to state and local tax returns as required. The Fund's federal income tax returns are subject to examination by the Internal Revenue Service (IRS) for a period of three fiscal years after they are filed. State and local tax returns may be subject to examination for an additional fiscal year depending on the jurisdiction. Foreign taxes are provided for based on the Fund's understanding of the tax rules and rates that exist in the foreign markets in which it invests.
Distributions are declared and recorded on the ex-dividend date. Income dividends and capital gain distributions are declared separately for each class. Income and capital gain distributions are determined in accordance with income tax regulations, which may differ from GAAP.
Capital accounts within the financial statements are adjusted for permanent book-tax differences. These adjustments have no impact on net assets or the results of operations. Capital accounts are not adjusted for temporary book-tax differences which will reverse in a subsequent period. These differences resulted in distribution reclassifications.
Annual Report
3. Significant Accounting Policies - continued
Income Tax Information and Distributions to Shareholders - continued
Book-tax differences are primarily due to futures contracts, foreign currency transactions, original issue discount, equity-debt classifications, capital loss carryforwards, and losses deferred due to wash sales and excise tax regulations.
The federal tax cost of investment securities and unrealized appreciation (depreciation) as of period end were as follows:
Gross unrealized appreciation | $ 43,904,007 |
Gross unrealized depreciation | (177,229) |
Net unrealized appreciation (depreciation) on securities and other investments | $ 43,726,778 |
| |
Tax Cost | $ 150,232,124 |
The tax-based components of distributable earnings as of period end were as follows:
Undistributed ordinary income | $ 1,602,527 |
Undistributed long-term capital gain | $ 1,703,850 |
Net unrealized appreciation (depreciation) | $ 43,726,790 |
The tax character of distributions paid was as follows:
| December 31, 2013 | December 31, 2012 |
Ordinary Income | $ 4,547,415 | $ 1,094,087 |
Long-term Capital Gains | 6,009,118 | - |
Total | $ 10,556,533 | $ 1,094,087 |
Trading (Redemption) Fees. Shares held by investors less than 60 days may be subject to a redemption fee equal to 1% of the NAV of shares redeemed. All redemption fees, which reduce the proceeds of the shareholder redemption, are retained by the Fund and accounted for as an addition to paid in capital.
Restricted Securities. The Fund may invest in securities that are subject to legal or contractual restrictions on resale. These securities generally may be resold in transactions exempt from registration or to the public if the securities are registered. Disposal of these securities may involve time-consuming negotiations and expense, and prompt sale at an acceptable price may be difficult. Information regarding restricted securities is included at the end of the Fund's Schedule of Investments.
4. Derivative Instruments.
Risk Exposures and the Use of Derivative Instruments. The Fund's investment objective allows the Fund to enter into various types of derivative contracts, including futures contracts. Derivatives are investments whose value is primarily derived from underlying assets, indices or reference rates and may be transacted on an exchange or over-the-counter (OTC). Derivatives may involve a future commitment to buy or sell a specified asset based on specified terms, to exchange future cash flows at periodic intervals based on a notional principal amount, or for one party to make one or more payments upon the occurrence of specified events in exchange for periodic payments from the other party.
The Fund used derivatives to increase returns and to manage exposure to certain risks as defined below. The success of any strategy involving derivatives depends on analysis of numerous economic factors, and if the strategies for investment do not work as intended, the Fund may not achieve its objectives.
The Fund's use of derivatives increased or decreased its exposure to the following risk:
Equity Risk | Equity risk relates to the fluctuations in the value of financial instruments as a result of changes in market prices (other than those arising from interest rate risk or foreign exchange risk), whether caused by factors specific to an individual investment, its issuer, or all factors affecting all instruments traded in a market or market segment. |
The Fund is also exposed to additional risks from investing in derivatives, such as liquidity risk and counterparty credit risk. Liquidity risk is the risk that the Fund will be unable to close out the derivative in the open market in a timely manner. Counterparty credit risk is the risk that the counterparty will not be able to fulfill its obligation to the Fund. Counterparty credit risk related to exchange-traded futures contracts may be mitigated by the protection provided by the exchange on which they trade.
Annual Report
Notes to Financial Statements - continued
4. Derivative Instruments - continued
Risk Exposures and the Use of Derivative Instruments - continued
Investing in derivatives may involve greater risks than investing in the underlying assets directly and, to varying degrees, may involve risk of loss in excess of any initial investment and collateral received and amounts recognized in the Statement of Assets and Liabilities. In addition, there may be the risk that the change in value of the derivative contract does not correspond to the change in value of the underlying instrument.
Futures Contracts. A futures contract is an agreement between two parties to buy or sell a specified underlying instrument for a fixed price at a specified future date. The Fund used futures contracts to manage its exposure to the stock markets.
Upon entering into a futures contract, a fund is required to deposit either cash or securities (initial margin) with a clearing broker in an amount equal to a certain percentage of the face value of the contract. Futures contracts are marked-to-market daily and subsequent daily payments (variation margin) are made or received by a fund depending on the daily fluctuations in the value of the futures contracts and are recorded as unrealized appreciation or (depreciation). This receivable and/or payable, if any, is included in daily variation margin for derivative instruments in the Statement of Assets and Liabilities. Realized gain or (loss) is recorded upon the expiration or closing of a futures contract.
Any open futures contracts at period end are presented in the Schedule of Investments under the caption "Futures Contracts." The underlying face amount at value reflects each contract's exposure to the underlying instrument or index at period end and is representative of volume of activity during the period. Securities deposited to meet initial margin requirements are identified in the Schedule of Investments.
During the period the Fund recognized net realized gain (loss) of $211,707 and a change in net unrealized appreciation (depreciation) of $67,340 related to its investment in futures contracts. These amounts are included in the Statement of Operations.
5. Purchases and Sales of Investments.
Purchases and sales of securities, other than short-term securities, aggregated $145,848,109 and $81,018,423, respectively.
6. Fees and Other Transactions with Affiliates.
Management Fee. Effective August 1, 2013, SelectCo replaced Fidelity Management and Research Company (FMR), an affiliate of SelectCo, as investment adviser to the Fund. The investment adviser and its affiliates provide the Fund with investment management related services for which the Fund pays a monthly management fee. The management fee is the sum of an individual fund fee rate that is based on an annual rate of .30% of the Fund's average net assets and an annualized group fee rate that averaged .25% during the period. The group fee rate is based upon the average net assets of all the mutual funds advised by FMR and the investment adviser. The group fee rate decreases as assets under management increase and increases as assets under management decrease. For the reporting period, the total annual management fee rate was .55% of the Fund's average net assets.
Transfer Agent Fees. Fidelity Investments Institutional Operations Company, Inc. (FIIOC), an affiliate of the investment adviser, is the Fund's transfer, dividend disbursing, and shareholder servicing agent. FIIOC receives an asset-based fee with respect to each class. Each class (with the exception of Investor Class) pays a transfer agent fee, excluding out of pocket expenses, equal to an annual rate of .07% of average net assets. Investor Class pays a monthly asset-based transfer agent fee of .15% of average net assets. In addition, FIIOC receives an asset-based fee of .0035% of average net assets for typesetting, printing and mailing of shareholder reports, except proxy statements. FIIOC voluntarily agreed to reimburse or waive this fee for the period January 1, 2013 through December 31, 2013 (see Expense Reductions note). For the period, transfer agent fees for each class, including printing and out of pocket expenses, were as follows:
Initial Class | $ 33,028 |
Investor Class | 131,785 |
| $ 164,813 |
Effective February 1, 2014, the Board of Trustees approved an amendment to the transfer agent fee agreement whereby each class (with the exception of Investor Class) pays a single fee of .07% of average net assets for transfer agent services, typesetting, printing and mailing of shareholder reports, excluding mailing of proxy statements and out of pocket expenses. Investor Class pays a single fee of .15% of average net assets.
Accounting and Security Lending Fees. Fidelity Service Company, Inc. (FSC), an affiliate of the investment adviser, maintains the Fund's accounting records. The accounting fee is based on the level of average net assets for each month. Under a separate contract, FSC administers the security lending program. The security lending fee is based on the number and duration of lending transactions.
Brokerage Commissions. The Fund placed a portion of its portfolio transactions with brokerage firms which are affiliates of the investment adviser. Brokerage commissions are included in net realized gain (loss) and change in net unrealized appreciation (depreciation) in the Statement of Operations. The commissions paid to these affiliated firms were $2,738 for the period.
Annual Report
7. Committed Line of Credit.
The Fund participates with other funds managed by the investment adviser or an affiliate in a $4.25 billion credit facility (the "line of credit") to be utilized for temporary or emergency purposes to fund shareholder redemptions or for other short-term liquidity purposes. The Fund has agreed to pay commitment fees on its pro-rata portion of the line of credit, which amounted to $228 and is reflected in Miscellaneous expenses on the Statement of Operations. During the period, there were no borrowings on this line of credit.
8. Security Lending.
The Fund lends portfolio securities through a lending agent from time to time in order to earn additional income. For equity securities, a lending agent is used and may loan securities to certain qualified borrowers, which prior to August 1, 2013 included Fidelity Capital Markets (FCM), a broker-dealer affiliated with the Fund. On the settlement date of the loan, the Fund receives collateral (in the form of U.S. Treasury obligations, letters of credit and/or cash) against the loaned securities and maintains collateral in an amount not less than 100% of the market value of the loaned securities during the period of the loan. The market value of the loaned securities is determined at the close of business of the Fund and any additional required collateral is delivered to the Fund on the next business day. If the borrower defaults on its obligation to return the securities loaned because of insolvency or other reasons, the Fund may apply collateral received from the borrower against the obligation. The Fund may experience delays and costs in recovering the securities loaned. Any cash collateral received is invested in the Fidelity Securities Lending Cash Central Fund. At period end, there were no security loans outstanding. Security lending income represents the income earned on investing cash collateral, less rebates paid to borrowers and any lending agent fees associated with the loan, plus any premium payments received for lending certain types of securities. Security lending income is presented in the Statement of Operations as a component of income from Fidelity Central Funds. Total security lending income during the period amounted to $2,014. During the period, there were no securities loaned to FCM.
9. Expense Reductions.
The investment adviser or its affiliates agreed to reimburse or waive certain fees during the period as noted in the table below.
Initial Class | $ 1,723 |
Investor Class | 3,316 |
| $ 5,039 |
Commissions paid to certain brokers with whom the investment adviser, or its affiliates, places trades on behalf of the Fund include an amount in addition to trade execution, which may be rebated back to the Fund to offset certain expenses. This amount totaled $2,309 for the period.
10. Distributions to Shareholders.
Distributions to shareholders of each class were as follows:
Years ended December 31, | 2013 | 2012 |
From net investment income | | |
Initial Class | $ 359,328 | $ 446,743 |
Investor Class | 806,588 | 647,344 |
Total | $ 1,165,916 | $ 1,094,087 |
From net realized gain | | |
Initial Class | $ 2,763,413 | $ - |
Investor Class | 6,627,204 | - |
Total | $ 9,390,617 | $ - |
Annual Report
Notes to Financial Statements - continued
11. Share Transactions.
Transactions for each class of shares were as follows:
| Shares | Dollars |
Years ended December 31, | 2013 | 2012 | 2013 | 2012 |
Initial Class | | | | |
Shares sold | 1,229,362 | 299,951 | $ 23,819,924 | $ 4,831,425 |
Reinvestment of distributions | 148,067 | 26,896 | 3,122,740 | 446,743 |
Shares redeemed | (769,138) | (882,110) | (15,056,666) | (13,934,260) |
Net increase (decrease) | 608,291 | (555,263) | $ 11,885,998 | $ (8,656,092) |
Investor Class | | | | |
Shares sold | 3,205,597 | 700,488 | $ 64,412,403 | $ 11,217,346 |
Reinvestment of distributions | 354,159 | 39,114 | 7,433,793 | 647,344 |
Shares redeemed | (342,103) | (1,179,142) | (6,702,485) | (18,470,903) |
Net increase (decrease) | 3,217,653 | (439,540) | $ 65,143,711 | $ (6,606,213) |
12. Other.
The Fund's organizational documents provide former and current trustees and officers with a limited indemnification against liabilities arising in connection with the performance of their duties to the Fund. In the normal course of business, the Fund may also enter into contracts that provide general indemnifications. The Fund's maximum exposure under these arrangements is unknown as this would be dependent on future claims that may be made against the Fund. The risk of material loss from such claims is considered remote.
At the end of the period, the investment adviser or its affiliates were the owners of record of 99% of the total outstanding shares of the Fund.
Annual Report
Report of Independent Registered Public Accounting Firm
To the Trustees of Variable Insurance Products Fund IV and the Shareholders of VIP Industrials Portfolio:
In our opinion, the accompanying statement of assets and liabilities, including the schedule of investments, and the related statements of operations and of changes in net assets and the financial highlights present fairly, in all material respects, the financial position of VIP Industrials Portfolio (a fund of Variable Insurance Products Fund IV) at December 31, 2013, the results of its operations for the year then ended, the changes in its net assets for each of the two years in the period then ended and the financial highlights for each of the five years in the period then ended in conformity with accounting principles generally accepted in the United States of America. These financial statements and financial highlights (hereafter referred to as "financial statements") are the responsibility of the VIP Industrials Portfolio's management. Our responsibility is to express an opinion on these financial statements based on our audits. We conducted our audits of these financial statements in accordance with the standards of the Public Company Accounting Oversight Board (United States). Those standards require that we plan and perform the audit to obtain reasonable assurance about whether the financial statements are free of material misstatement. An audit includes examining, on a test basis, evidence supporting the amounts and disclosures in the financial statements, assessing the accounting principles used and significant estimates made by management, and evaluating the overall financial statement presentation. We believe that our audits, which included confirmation of securities at December 31, 2013 by correspondence with the custodian and brokers, provide a reasonable basis for our opinion.
PricewaterhouseCoopers LLP
Boston, Massachusetts
February 19, 2014
Annual Report
The Trustees and officers of the trust and fund, as applicable, are listed below. The Board of Trustees governs the fund and is responsible for protecting the interests of shareholders. The Trustees are experienced executives who meet periodically throughout the year to oversee the fund's activities, review contractual arrangements with companies that provide services to the fund, oversee management of the risks associated with such activities and contractual arrangements, and review the fund's performance. Ned C. Lautenbach, Ronald P. O'Hanley, and William S. Stavropoulos each oversees 247 funds. David A. Rosow, Garnett A. Smith, and Michael E. Wiley each oversees 74 funds.
The Trustees hold office without limit in time except that (a) any Trustee may resign; (b) any Trustee may be removed by written instrument, signed by at least two-thirds of the number of Trustees prior to such removal; (c) any Trustee who requests to be retired or who has become incapacitated by illness or injury may be retired by written instrument signed by a majority of the other Trustees; and (d) any Trustee may be removed at any special meeting of shareholders by a two-thirds vote of the outstanding voting securities of the trust. The officers hold office without limit in time, except that any officer may resign or may be removed by a vote of a majority of the Trustees at any regular meeting or any special meeting of the Trustees. Except as indicated, each individual has held the office shown or other offices in the same company for the past five years.
Experience, Skills, Attributes, and Qualifications of the Fund's Trustees. The Governance and Nominating Committee has adopted a statement of policy that describes the experience, qualifications, attributes, and skills that are necessary and desirable for potential Independent Trustee candidates (Statement of Policy). The Board believes that each Trustee satisfied at the time he or she was initially elected or appointed a Trustee, and continues to satisfy, the standards contemplated by the Statement of Policy. The Governance and Nominating Committee also engages professional search firms to help identify potential Independent Trustee candidates who have the experience, qualifications, attributes, and skills consistent with the Statement of Policy. From time to time, additional criteria based on the composition and skills of the current Independent Trustees, as well as experience or skills that may be appropriate in light of future changes to board composition, business conditions, and regulatory or other developments, have also been considered by the professional search firms and the Governance and Nominating Committee. In addition, the Board takes into account the Trustees' commitment and participation in Board and committee meetings, as well as their leadership of standing and ad hoc committees throughout their tenure.
In determining that a particular Trustee was and continues to be qualified to serve as a Trustee, the Board has considered a variety of criteria, none of which, in isolation, was controlling. The Board believes that, collectively, the Trustees have balanced and diverse experience, qualifications, attributes, and skills, which allow the Board to operate effectively in governing the fund and protecting the interests of shareholders. Information about the specific experience, skills, attributes, and qualifications of each Trustee, which in each case led to the Board's conclusion that the Trustee should serve (or continue to serve) as a trustee of the fund, is provided below.
Board Structure and Oversight Function. Ronald P. O'Hanley is an interested person (as defined in the 1940 Act) and currently serves as Chairman. The Trustees have determined that an interested Chairman is appropriate and benefits shareholders because an interested Chairman has a personal and professional stake in the quality and continuity of services provided to the fund. Independent Trustees exercise their informed business judgment to appoint an individual of their choosing to serve as Chairman, regardless of whether the Trustee happens to be independent or a member of management. The Independent Trustees have determined that they can act independently and effectively without having an Independent Trustee serve as Chairman and that a key structural component for assuring that they are in a position to do so is for the Independent Trustees to constitute a substantial majority for the Board. The Independent Trustees also regularly meet in executive session. Michael E. Wiley serves as Chairman of the Independent Trustees and as such (i) acts as a liaison between the Independent Trustees and management with respect to matters important to the Independent Trustees and (ii) with management prepares agendas for Board meetings.
Fidelity funds are overseen by different Boards of Trustees. The fund's Board oversees Fidelity's sector portfolios. Other Boards oversee Fidelity's equity and high income funds, and Fidelity's investment grade bond, money market, and asset allocation funds. The use of separate Boards, each with its own committee structure, allows the Trustees of each group of Fidelity funds to focus on the unique issues of the funds they oversee, including common research, investment, and operational issues. On occasion, the separate Boards establish joint committees to address issues of overlapping consequences for the Fidelity funds overseen by each Board.
The Trustees operate using a system of committees to facilitate the timely and efficient consideration of all matters of importance to the Trustees, the fund, and fund shareholders and to facilitate compliance with legal and regulatory requirements and oversight of the fund's activities and associated risks. The Board, acting through its committees, has charged SelectCo and its affiliates with (i) identifying events or circumstances the occurrence of which could have demonstrably adverse effects on the fund's business and/or reputation; (ii) implementing processes and controls to lessen the possibility that such events or circumstances occur or to mitigate the effects of such events or circumstances if they do occur; and (iii) creating and maintaining a system designed to evaluate continuously business and market conditions in order to facilitate the identification and implementation processes described in (i) and (ii) above. Because the day-to-day operations and activities of the fund are carried out by or through SelectCo, its affiliates, and other service providers, the fund's exposure to risks is mitigated but not eliminated by the processes overseen by the Trustees. While each of the Board's committees has responsibility for overseeing different aspects of the fund's activities, oversight is exercised primarily through the Operations and Audit Committees. Appropriate personnel, including but not limited to the fund's Chief Compliance Officer (CCO), SelectCo's internal auditor, the independent accountants, the fund's Treasurer and portfolio management personnel, make periodic reports to the Board's committees, as appropriate. The responsibilities of each standing committee, including their oversight responsibilities, are described further under "Standing Committees of the Fund's Trustees."
Annual Report
Trustees and Officers - continued
The fund's Statements of Additional Information (SAIs) include more information about the Trustees. To request a free copy, call Fidelity at 1-877-208-0098.
Interested Trustee*:
Correspondence intended for each Trustee who is an interested person may be sent to Fidelity Investments, 245 Summer Street, Boston, Massachusetts 02210.
Name, Year of Birth; Principal Occupations and Other Relevant Experience+ |
Ronald P. O'Hanley (1957) |
Year of Election or Appointment: 2011 Trustee Chairman of the Board of Trustees |
| Mr. O'Hanley also serves as Trustee of other Fidelity funds. He is Director of Fidelity SelectCo, LLC (2013-present), FMR Co., Inc. (2010-present), Director of Fidelity Investments Money Management, Inc. (2010-present), Director of Fidelity Research & Analysis Company (2010-present), President of Fidelity Asset Management and Corporate Services and a Member of Fidelity's Executive Committee (2010-present). Previously, Mr. O'Hanley served as President and Chief Executive Officer of BNY Mellon Asset Management (2007-2010). Mr. O'Hanley also served as Vice Chairman of Bank New York Mellon Corp. and a member of that firm's Executive Committee. Prior to the 2007 merger of The Bank of New York and Mellon Financial Corporation, he was Vice Chairman of Mellon Financial Corporation and President and Chief Executive Officer of Mellon Asset Management. He joined Mellon in February 1997. Mr. O'Hanley currently serves as Chairman of the Boston Public Library Foundation Board of Directors and sits on the Board of Directors of Beth Israel Deaconess Medical Center, the Board of Trustees of the Marine Biological Laboratory and the Advisory Board of the Maxwell School of Citizenship and Public Administration at Syracuse University. Mr. O'Hanley also chairs the Council on Asset Management for the Financial Services Roundtable and is a member of the Board of Directors of Institutional Investor's U.S. Institute. |
* Trustee has been determined to be an "Interested Trustee" by virtue of, among other things, his affiliation with the trust or various entities under common control with SelectCo.
+ The information above includes the Trustee's principal occupation during the last five years and other information relating to the experience, attributes, and skills relevant to the Trustee's qualifications to serve as a Trustee, which led to the conclusion that the Trustee should serve as a Trustee for the fund.
Independent Trustees:
Correspondence intended for each Independent Trustee (that is, the Trustees other than the Interested Trustee) may be sent to Fidelity Investments, P.O. Box 55235, Boston, Massachusetts 02205-5235.
Name, Year of Birth; Principal Occupations and Other Relevant Experience+ |
Ned C. Lautenbach (1944) |
Year of Election or Appointment: 2000 Trustee |
| Mr. Lautenbach also serves as Trustee of other Fidelity funds. Mr. Lautenbach currently serves as the Lead Director of the Eaton Corporation Board of Directors (diversified industrial, 1997-present). Mr. Lautenbach is Chairman of the Board of Directors of the Philharmonic Center for the Arts in Naples, Florida (2012-present) and a member of the Council on Foreign Relations (1994-present). Previously, Mr. Lautenbach was a Partner/Advisory Partner at Clayton, Dubilier & Rice, LLC (private equity investment, 1998-2010), as well as a Director of Sony Corporation (2006-2007). |
David A. Rosow (1942) |
Year of Election or Appointment: 2013 Trustee |
| Mr. Rosow also serves as Trustee of other Fidelity funds. Mr. Rosow is Chairman and Chief Executive Officer of International Golf Group, Inc. (golf course development, 1989-present). Previously, Mr. Rosow served as Chairman and Chief Executive Officer of Rosow & Company, Inc. (private investment company, 1989-2011), a Lead Director of Hudson United Bancorp (2001-2006) and as a Director of TD Banknorth (1996-2006). In addition, Mr. Rosow is a member (2008-present) and President (2009-present) of the Town Council of Palm Beach, Florida. Mr. Rosow served as a Member of the Advisory Board of other Fidelity funds (2012-2013). |
Garnett A. Smith (1947) |
Year of Election or Appointment: 2013 Trustee |
| Mr. Smith also serves as Trustee of other Fidelity funds. Prior to Mr. Smith's retirement, he served as Chairman and Chief Executive Officer of Inbrand Corp. (manufacturer of personal absorbent products, 1990-1997). He also served as President (1986-1990) of Inbrand Corp. Prior to his employment with Inbrand Corp., he was employed by a retail fabric chain and North Carolina National Bank. In addition, Mr. Smith is a board member of the Jackson Hole Land Trust (2009-present). Mr. Smith served as a Member of the Advisory Board of other Fidelity funds (2012-2013). |
William S. Stavropoulos (1939) |
Year of Election or Appointment: 2001 Trustee |
| Mr. Stavropoulos also serves as Trustee of other Fidelity funds. Mr. Stavropoulos serves as President and Founder of the Michigan Baseball Foundation, the Great Lakes Loons (2007-present). Mr. Stavropoulos is Chairman Emeritus of the Board of Directors of The Dow Chemical Company, where he previously served in numerous senior management positions, including President, CEO (1995-2000; 2002-2004), Chairman of the Executive Committee (2000-2006), and as a member of the Board of Directors (1990-2006). Currently, Mr. Stavropoulos is Chairman of the Board of Directors of Univar Inc. (global distributor of commodity and specialty chemicals), a Director of Teradata Corporation (data warehousing and technology solutions), and Maersk Inc. (industrial conglomerate), and a member of the Advisory Board for Metalmark Capital LLC (private equity investment, 2005-present). Mr. Stavropoulos is an operating advisor to Clayton, Dubilier & Rice, LLC (private equity investment). In addition, Mr. Stavropoulos is a member of the University of Notre Dame Advisory Council for the College of Science, a Trustee of the Rollin L. Gerstacker Foundation, and a Director of the Naples Philharmonic Center for the Arts. Previously, Mr. Stavropoulos served as a Director of Chemical Financial Corporation (bank holding company, 1993-2012) and Tyco International, Ltd. (multinational manufacturing and services, 2007-2012). |
Michael E. Wiley (1950) |
Year of Election or Appointment: 2008 Trustee Chairman of the Independent Trustees |
| Mr. Wiley also serves as Trustee of other Fidelity funds. Mr. Wiley serves as a Director of Asia Pacific Exploration Consolidated (international oil and gas exploration and production, 2008-present). Mr. Wiley serves as a Director of Tesoro Corporation (independent oil refiner and marketer, 2005-present), and a Director of Bill Barrett Corporation (exploration and production, 2005-present). In addition, Mr. Wiley also serves as a Director of Post Oak Bank (privately-held bank, 2004-present). Previously, Mr. Wiley served as a Trustee of other Fidelity funds (2008-2013), as a member of the Board of Trustees of the University of Tulsa (2000-2006; 2007-2010), as a Senior Energy Advisor of Katzenbach Partners, LLC (consulting, 2006-2007), as an Advisory Director of Riverstone Holdings (private investment), Chairman, President, and CEO of Baker Hughes, Inc. (oilfield services, 2000-2004), and as Director of Spinnaker Exploration Company (exploration and production, 2001-2005). |
+ The information above includes each Trustee's principal occupation during the last five years and other information relating to the experience, attributes, and skills relevant to each Trustee's qualifications to serve as a Trustee, which led to the conclusion that each Trustee should serve as a Trustee for the fund.
Officers:
Except for Anthony R. Rochte, correspondence intended for each officer may be sent to Fidelity Investments, 245 Summer Street, Boston, Massachusetts 02210. Correspondence intended for Mr. Rochte may be sent to SelectCo, 1225 17th Street, Denver, Colorado 80202-5541. Officers appear below in alphabetical order.
Name, Year of Birth; Principal Occupation |
Christopher S. Bartel (1971) |
Year of Election or Appointment: 2009 Vice President |
| Mr. Bartel also serves as Vice President of other funds. Mr. Bartel serves as a Director, President, and Chief Executive Officer of Fidelity Management & Research (Japan) Inc. (2012-present), a Director of Fidelity Management & Research (Hong Kong) (2012-present), and Senior Vice President of Global Equity Research (2010-present). Previously, Mr. Bartel served as Senior Vice President of Equity Research (2009-2010), Managing Director of Research (2006-2009), and an analyst and portfolio manager (2000-2006). |
Elizabeth Paige Baumann (1968) |
Year of Election or Appointment: 2012 Anti-Money Laundering (AML) Officer |
| Ms. Baumann also serves as AML Officer of other funds. She is Chief AML Officer of FMR LLC (2012-present) and is an employee of Fidelity Investments. Previously, Ms. Baumann served as Vice President and Deputy Anti-Money Laundering Officer (2007-2012). |
Marc Bryant (1966) |
Year of Election or Appointment: 2013 Secretary and Chief Legal Officer (CLO) |
| Mr. Bryant also serves as an officer of other funds. He is Senior Vice President and Deputy General Counsel of FMR LLC. Prior to joining Fidelity Investments, Mr. Bryant served as a Senior Vice President and the Head of Global Retail Legal for AllianceBernstein L.P. (2006-2010), and as the General Counsel for ProFund Advisors LLC (2001-2006). |
William C. Coffey (1969) |
Year of Election or Appointment: 2009 Assistant Secretary |
| Mr. Coffey also serves as Assistant Secretary of other funds. He is Senior Vice President and Deputy General Counsel of FMR LLC (2010-present), and is an employee of Fidelity Investments. Previously, Mr. Coffey served as Vice President and Associate General Counsel of FMR LLC (2005-2009). |
Jonathan Davis (1968) |
Year of Election or Appointment: 2010 Assistant Treasurer |
| Mr. Davis also serves as Assistant Treasurer of other funds. Mr. Davis is an employee of Fidelity Investments. Previously, Mr. Davis served as Vice President and Associate General Counsel of FMR LLC (2003-2010). |
Adrien E. Deberghes (1967) |
Year of Election or Appointment: 2013 President and Treasurer |
| Mr. Deberghes also serves as an officer of other funds. He is an employee of Fidelity Investments (2008-present). Prior to joining Fidelity Investments, Mr. Deberghes was Senior Vice President of Mutual Fund Administration at State Street Corporation (2007-2008), Senior Director of Mutual Fund Administration at Investors Bank & Trust (2005-2007), and Director of Finance for Dunkin' Brands (2000-2005). |
Stephanie J. Dorsey (1969) |
Year of Election or Appointment: 2010 Assistant Treasurer |
| Ms. Dorsey also serves as an officer of other funds. She is an employee of Fidelity Investments (2008-present) and has served in other fund officer roles. Prior to joining Fidelity Investments, Ms. Dorsey served as Treasurer (2004-2008) of the JPMorgan Mutual Funds and Vice President (2004-2008) of JPMorgan Chase Bank. |
Joseph A. Hanlon (1968) |
Year of Election or Appointment: 2012 Chief Compliance Officer |
| Mr. Hanlon also serves as Chief Compliance Officer of other funds. Mr. Hanlon serves as Compliance Officer of FMR, FMR Co., Inc., Fidelity Investments Money Management, Inc. (FIMM), Fidelity Research and Analysis Company (FRAC), and Fidelity Management & Research (Hong Kong) (2009-present), as Senior Vice President of the Fidelity Asset Management Division (2009-present), and is an employee of Fidelity Investments. Previously, Mr. Hanlon served as Compliance Officer of Fidelity Management & Research (Japan) Inc. (2009-2013), Strategic Advisers, Inc. (2009-2013), and Fidelity Management & Research (U.K.) Inc. (2009-2013). |
Brian B. Hogan (1964) |
Year of Election or Appointment: 2009 Vice President |
| Mr. Hogan also serves as Vice President of other funds. Mr. Hogan serves as President of FMR's Equity Division (2009-present). Previously, Mr. Hogan served as Senior Vice President, Equity Research of FMR (2006-2009) and as a portfolio manager. |
Chris Maher (1972) |
Year of Election or Appointment: 2013 Assistant Treasurer |
| Mr. Maher serves as Assistant Treasurer of other funds. Mr. Maher is Vice President of Valuation Oversight and is an employee of Fidelity Investments. Previously, Mr. Maher served as Vice President of Asset Management Compliance (2013), Vice President of FMR's Program Management Group (2010-2013), and Vice President of Valuation Oversight (2008-2010). |
Christine Reynolds (1958) |
Year of Election or Appointment: 2008 Chief Financial Officer |
| Ms. Reynolds also serves as Chief Financial Officer of other funds. Ms. Reynolds became President of Fidelity Pricing and Cash Management Services (FPCMS) in August 2008. Ms. Reynolds served as Chief Operating Officer of FPCMS (2007-2008). Previously, Ms. Reynolds served as President, Treasurer, and Anti-Money Laundering officer of the Fidelity funds (2004-2007). |
Kenneth B. Robins (1969) |
Year of Election or Appointment: 2013 Deputy Treasurer |
| Mr. Robins also serves as an officer of other funds. Mr. Robins serves as Executive Vice President of Fidelity Investments Money Management, Inc. (FIMM) (2013-present) and is an employee of Fidelity Investments (2004-present). Previously, Mr. Robins served in other fund officer roles. |
Anthony R. Rochte (1968) |
Year of Election or Appointment: 2013 Vice President |
| Mr. Rochte also serves as Vice President of other funds. Mr. Rochte serves as President of Fidelity SelectCo, LLC (2012-present) and is an employee of Fidelity Investments (2012-present). Prior to joining Fidelity Investments, Mr. Rochte served as Senior Managing Director and head of State Street Global Advisors' North American Intermediary Business Group (2006-2012). |
Stacie M. Smith (1974) |
Year of Election or Appointment: 2013 Assistant Treasurer |
| Ms. Smith also serves as an officer of other funds. She is an employee of Fidelity Investments (2009-present) and has served in other fund officer roles. Prior to joining Fidelity Investments, Ms. Smith served as Senior Audit Manager of Ernst & Young LLP (1996-2009). |
Renee Stagnone (1975) |
Year of Election or Appointment: 2013 Deputy Treasurer |
| Ms. Stagnone also serves as Deputy Treasurer of other funds. Ms. Stagnone is an employee of Fidelity Investments. |
Joseph F. Zambello (1957) |
Year of Election or Appointment: 2011 Deputy Treasurer |
| Mr. Zambello also serves as Deputy Treasurer of other funds. Mr. Zambello is an employee of Fidelity Investments. Previously, Mr. Zambello served as Vice President of FMR's Program Management Group (2009-2011) and Vice President of the Transfer Agent Oversight Group (2005-2009). |
Annual Report
The Board of Trustees of VIP Industrials Portfolio voted to pay to shareholders of record at the opening of business on record date, the following distributions per share derived from capital gains realized from sales of portfolio securities:
| Pay Date | Record Date | Capital Gains |
Initial Class | 02/14/14 | 02/14/14 | $0.372 |
Investor Class | 02/14/14 | 02/14/14 | $0.372 |
The fund hereby designates as a capital gain dividend with respect to the taxable year ended December 31, 2013, $7,712,967 or, if subsequently determined to be different, the net capital gain of such year.
Initial Class and Investor Class designate 39% of the dividends distributed during the fiscal year as qualifying for the dividends-received deduction for corporate shareholders.
Annual Report
A special meeting of Industrials Portfolio's shareholders was held on May 14, 2013. The results of votes taken among shareholders on the proposals before them are reported below. Each vote reported represents one dollar of net asset value held on the record date for the meeting.
PROPOSAL 1 |
To elect a Board of Trustees.A |
| # of
Votes | % of
Votes |
Ned C. Lautenbach |
Affirmative | 1,555,133,782.46 | 93.955 |
Withheld | 100,063,694.32 | 6.045 |
TOTAL | 1,655,197,476.78 | 100.000 |
Ronald P. O'Hanley |
Affirmative | 1,557,988,095.28 | 94.128 |
Withheld | 97,209,381.50 | 5.872 |
TOTAL | 1,655,197,476.78 | 100.000 |
David A. Rosow |
Affirmative | 1,552,645,347.31 | 93.805 |
Withheld | 102,552,129.47 | 6.195 |
TOTAL | 1,655,197,476.78 | 100.000 |
Garnett A. Smith |
Affirmative | 1,554,582,880.53 | 93.922 |
Withheld | 100,614,596.25 | 6.078 |
TOTAL | 1,655,197,476.78 | 100.000 |
William S. Stavropoulos |
Affirmative | 1,548,352,452.21 | 93.545 |
Withheld | 106,845,024.57 | 6.455 |
TOTAL | 1,655,197,476.78 | 100.000 |
Michael E. Wiley |
Affirmative | 1,556,790,374.70 | 94.055 |
Withheld | 98,407,102.08 | 5.945 |
TOTAL | 1,655,197,476.78 | 100.000 |
PROPOSAL 2 |
To approve a management contract between the fund and Fidelity SelectCo, LLC. |
| # of
Votes | % of
Votes |
Affirmative | 104,989,086.88 | 89.482 |
Against | 5,245,254.44 | 4.470 |
Abstain | 7,096,600.86 | 6.048 |
TOTAL | 117,330,942.18 | 100.000 |
A Denotes trust-wide proposal and voting results. |
Annual Report
Investment Adviser
Fidelity SelectCo, LLC
Denver, CO
Investment Sub-Advisers
FMR Co., Inc.
Fidelity Management & Research (U.K.) Inc.
Fidelity Management & Research (Hong Kong) Limited
Fidelity Management & Research (Japan) Inc.
General Distributor
Fidelity Distributors Corporation
Smithfield, RI
Transfer and Service Agents
Fidelity Investments Institutional Operations Company, Inc.
Boston, MA
Fidelity Service Company, Inc.
Boston, MA
Custodian
JPMorgan Chase Bank
New York, NY
VCYLIC-ANN-0214
1.817361.108
Fidelity® Variable Insurance Products:
Materials Portfolio
Annual Report
December 31, 2013
(Fidelity Cover Art)
Contents
Performance | (Click Here) | How the fund has done over time. |
Management's Discussion of Fund Performance | (Click Here) | The Portfolio Manager's review of fund performance and strategy. |
Shareholder Expense Example | (Click Here) | An example of shareholder expenses. |
Investment Changes | (Click Here) | A summary of major shifts in the fund's investments over the past six months. |
Investments | (Click Here) | A complete list of the fund's investments with their market values. |
Financial Statements | (Click Here) | Statements of assets and liabilities, operations, and changes in net assets, as well as financial highlights. |
Notes | (Click Here) | Notes to the financial statements. |
Report of Independent Registered Public Accounting Firm | (Click Here) | |
Trustees and Officers | (Click Here) | |
Distributions | (Click Here) | |
Proxy Voting Results | (Click Here) | |
To view a fund's proxy voting guidelines and proxy voting record for the 12-month period ended June 30, visit http://www.fidelity.com/proxyvotingresults or visit the Securities and Exchange Commission's (SEC) web site at http://www.sec.gov. You may also call 1-877-208-0098 to request a free copy of the proxy voting guidelines.
Fidelity® Variable Insurance Products are separate account options which are purchased through a variable insurance contract.
Standard & Poor's, S&P and S&P 500 are registered service marks of The McGraw-Hill Companies, Inc. and have been licensed for use by Fidelity Distributors Corporation.
Other third-party marks appearing herein are the property of their respective owners.
All other marks appearing herein are registered or unregistered trademarks or service marks of FMR LLC or an affiliated company. © 2014 FMR LLC. All rights reserved.
This report and the financial statements contained herein are submitted for the general information of the shareholders of the fund. This report is not authorized for distribution to prospective investors in the fund unless preceded or accompanied by an effective prospectus.
A fund files its complete schedule of portfolio holdings with the SEC for the first and third quarters of each fiscal year on Form N-Q. Forms N-Q are available on the SEC's web site at http://www.sec.gov. A fund's Forms N-Q may be reviewed and copied at the SEC's Public Reference Room in Washington, DC. Information regarding the operation of the SEC's Public Reference Room may be obtained by calling 1-800-SEC-0330. For a complete list of a fund's portfolio holdings, view the most recent holdings listing, semiannual report, or annual report on Fidelity's web site at http://www.fidelity.com, http://www.advisor.fidelity.com, or http://www.401k.com, as applicable.
NOT FDIC INSURED • MAY LOSE VALUE • NO BANK GUARANTEE
Neither the fund nor Fidelity Distributors Corporation is a bank.
Annual Report
Average annual total return reflects the change in the value of an investment, assuming reinvestment of the class' distributions from dividend income and capital gains (the profits earned upon the sale of securities that have grown in value, if any) and assuming a constant rate of performance each year. During periods of reimbursement by Fidelity, a fund's total return will be greater than it would be had the reimbursement not occurred. Performance numbers are net of all underlying fund operating expenses, but do not include any insurance charges imposed by your insurance company's separate account. If performance information included the effect of these additional charges, the total returns would have been lower. How a fund did yesterday is no guarantee of how it will do tomorrow.
Average Annual Total Returns
Periods ended December 31, 2013 | Past 1
year | Past 5
years | Life of
fund A |
VIP Materials Portfolio - Initial Class | 22.15% | 25.26% | 9.65% |
VIP Materials Portfolio - Investor Class | 22.07% | 25.18% | 9.56% |
A From April 24, 2007.
$10,000 Over Life of Fund
Let's say hypothetically that $10,000 was invested in VIP Materials Portfolio - Initial Class on April 24, 2007, when the fund started. The chart shows how the value of your investment would have changed, and also shows how the S&P 500® Index performed over the same period.
Annual Report
Market Recap: Global equity markets remained upbeat for the 12 months ending December 31, 2013, propelling the MSCI® ACWI® (All Country World Index) Index to a 23.24% return. Midyear turbulence gave way by autumn when policymakers in the U.S. and China had made clear their intentions to maintain accommodative monetary policies. That stance, combined with modest cyclical improvement around the globe and generally low valuations, underpinned the broad rally in equities, although the relative strength of the U.S. dollar generally tempered gains for U.S. investors holding foreign securities based in local currencies. During the period, the broad-market S&P 500® Index set a series of new highs, finishing the year up 32.39%. For the first time since 1995, the S&P® scored a "perfect 10," with all 10 economic sectors gaining at least 10% for the year. A resurgence in growth-oriented stocks lifted the Nasdaq Composite Index® to a 40.12% result for 2013, while the blue-chip Dow Jones Industrial AverageSM notched a relatively more modest 29.65% gain. International developed-markets equities rose in concert with their U.S. counterparts, with the MSCI® EAFE® Index gaining 22.92% for the period. Meanwhile, foreign exchange and commodity weakness curbed results in resource-heavy emerging markets (EM), especially in the year's waning months. More generally, concern over EM's slowing growth, its declining share of global trade and uncertainty surrounding U.S. central bank intentions were all factors hampering performance. The MSCI Emerging Markets Index returned -2.27% for the period. On the bond side, U.S. high-yield securities rallied with equities for much of the period, with The BofA Merrill LynchSM US High Yield Constrained Index returning 7.41% for 2013. The more rate-sensitive U.S. investment-grade bond category faced headwinds though, as reflected in the -2.02% return of the Barclays® U.S. Aggregate Bond Index. Within the Barclays index, investment-grade corporate credit returned -2.01%, while ultra-safe U.S. Treasuries saw a -2.75% result. Major non-U.S. developed markets performed only slightly better, with the Citigroup Non-USD Group-of-Seven (G7) Equal Weighted Index logging a -1.59% result. After several years of strong advances, EM debt reversed course in 2013, with the J.P. Morgan Emerging Markets Bond Index Global returning -6.58%.
Comments from Tobias Welo, Portfolio Manager of VIP Materials Portfolio: For the year, the fund's share classes recorded double-digit gains but lagged the 24.99% return of the MSCI® U.S. IMI Materials 25-50 Index and also trailed the broadly based S&P 500®. (For specific portfolio results, please refer to the performance section of this report.) Versus the broader market, lagging performance in gold, diversified metals & mining, and fertilizers & agricultural chemicals weighted on the materials sector, undercutting strength in diversified chemicals and speciality chemicals. Versus the MSCI index, the fund's performance was held back its underweighted exposure to two large benchmark constituents in diversified chemicals and by some unrewarding non-index picks in metals and coal miners. In diversified chemicals, DuPont and Dow Chemical each detracted significantly because they performed well, and the fund had large underweightings in them, on average, due to negative earnings revisions and what I considered more-attractive valuations and risk/reward profiles in other chemicals firms exposed to similar end markets. I sold DuPont and Dow in April. Elsewhere, gold miner Goldcorp was a significant detractor, despite best-in-class management, assets and balance sheet, in my view. Amid a roughly 28% decline in the price of gold and rising exploration and production costs, I sold Goldcorp to focus on what I considered the two best-positioned gold names: Royal Gold and Canada's Franco-Nevada. Copper miner Copper Mountain Mining also disappointed me, and coal miner Peabody Energy detracted as well. However, I did not change my positive long-term view on Peabody, and I aggressively added to the fund's holdings here. The mining stocks I've just mentioned were not in the index. Conversely, positioning in the fertilizers & agricultural chemicals group aided performance versus the MSCI index. In the second half of the year, I considerably increased the fund's allocation to this group, mainly through building sizable positions in Potash Corp. of Saskatchewan, a non-index stock, and nitrogen fertilizer products producer CF Industries Holdings. For the year overall, CF Industries Holdings was a contributor to the fund's relative performance, while Potash Corp. of Saskatchewan detracted modestly. With that said, the main performance boost from this group came from not owning weak-performing index stock Mosaic, a phosphate producer. Elsewhere, a large underweighting in gold miner and index stock Newmont Mining, which I sold in March, made this stock the fund's largest relative contributor.
The views expressed above reflect those of the portfolio manager(s) only through the end of the period as stated on the cover of this report and do not necessarily represent the views of Fidelity or any other person in the Fidelity organization. Any such views are subject to change at any time based upon market or other conditions and Fidelity disclaims any responsibility to update such views. These views may not be relied on as investment advice and, because investment decisions for a Fidelity fund are based on numerous factors, may not be relied on as an indication of trading intent on behalf of any Fidelity fund.
Annual Report
As a shareholder of the Fund, you incur two types of costs: (1) transaction costs, including redemption fees and (2) ongoing costs, including management fees and other Fund expenses. This Example is intended to help you understand your ongoing costs (in dollars) of investing in the Fund and to compare these costs with the ongoing costs of investing in other mutual funds.
The Example is based on an investment of $1,000 invested at the beginning of the period and held for the entire period (July 1, 2013 to December 31, 2013).
Actual Expenses
The first line of the accompanying table for each class of the Fund provides information about actual account values and actual expenses. You may use the information in this line, together with the amount you invested, to estimate the expenses that you paid over the period. Simply divide your account value by $1,000.00 (for example, an $8,600 account value divided by $1,000.00 = 8.6), then multiply the result by the number in the first line for a class of the Fund under the heading entitled "Expenses Paid During Period" to estimate the expenses you paid on your account during this period. The estimate of expenses does not include any fees or other expenses of any variable annuity or variable life insurance product. If they were, the estimate of expenses you paid during the period would be higher, and your ending account value would be lower. In addition, the Fund, as a shareholder in the underlying Fidelity Central Funds, will indirectly bear its pro-rata share of the fees and expenses incurred by the underlying Fidelity Central Funds. These fees and expenses are not included in the Fund's annualized expense ratio used to calculate the expense estimate in the table below.
Hypothetical Example for Comparison Purposes
The second line of the accompanying table for each class of the Fund provides information about hypothetical account values and hypothetical expenses based on a Class' actual expense ratio and an assumed rate of return of 5% per year before expenses, which is not the Class' actual return. The hypothetical account values and expenses may not be used to estimate the actual ending account balance or expenses you paid for the period. You may use this information to compare the ongoing costs of investing in the Fund and other funds. To do so, compare this 5% hypothetical example with the 5% hypothetical examples that appear in the shareholder reports of the other funds. The estimate of expenses does not include any fees or other expenses of any variable annuity or variable life insurance product. If they were, the estimate of expenses you paid during the period would be higher, and your ending account value would be lower. In addition, the Fund, as a shareholder in the underlying Fidelity Central Funds, will indirectly bear its pro-rata share of the fees and expenses incurred by the underlying Fidelity Central Funds. These fees and expenses are not included in the Fund's annualized expense ratio used to calculate the expense estimate in the table below.
Please note that the expenses shown in the table are meant to highlight your ongoing costs only and do not reflect any transaction costs. Therefore, the second line of the table is useful in comparing ongoing costs only, and will not help you determine the relative total costs of owning different funds. In addition, if these transactional costs were included, your costs would have been higher.
| Annualized
Expense Ratio B | Beginning
Account Value
July 1, 2013 | Ending
Account Value
December 31, 2013 | Expenses Paid
During Period*
July 1, 2013
to December 31, 2013 |
Initial Class | .77% | | | |
Actual | | $ 1,000.00 | $ 1,185.60 | $ 4.24 |
HypotheticalA | | $ 1,000.00 | $ 1,021.32 | $ 3.92 |
Investor Class | .85% | | | |
Actual | | $ 1,000.00 | $ 1,184.80 | $ 4.68 |
HypotheticalA | | $ 1,000.00 | $ 1,020.92 | $ 4.33 |
A 5% return per year before expenses
B Annualized expense ratio reflects expenses net of applicable fee waivers.
* Expenses are equal to each Class' annualized expense ratio, multiplied by the average account value over the period, multiplied by 184/365 (to reflect the one-half year period).
Annual Report
Investment Changes (Unaudited)
Top Ten Stocks as of December 31, 2013 |
| % of fund's
net assets | % of fund's net assets
6 months ago |
Monsanto Co. | 9.8 | 10.4 |
LyondellBasell Industries NV Class A | 6.3 | 5.6 |
Praxair, Inc. | 5.6 | 5.9 |
FMC Corp. | 5.1 | 4.1 |
Eastman Chemical Co. | 4.1 | 4.1 |
Ecolab, Inc. | 3.8 | 5.1 |
PPG Industries, Inc. | 3.7 | 4.7 |
CF Industries Holdings, Inc. | 3.7 | 0.0 |
International Paper Co. | 3.6 | 3.9 |
W.R. Grace & Co. | 3.2 | 2.7 |
| 48.9 | |
Top Industries (% of fund's net assets) |
As of December 31, 2013 |
 | Chemicals | 69.8% | |
 | Containers & Packaging | 9.3% | |
 | Metals & Mining | 7.6% | |
 | Construction Materials | 4.7% | |
 | Paper & Forest Products | 4.5% | |
 | All Others* | 4.1% | |

As of June 30, 2013 |
| Chemicals | 67.4% | |
| Containers & Packaging | 10.4% | |
| Metals & Mining | 9.7% | |
| Paper & Forest Products | 4.6% | |
| Construction Materials | 3.8% | |
| All Others* | 4.1% | |

* Includes short-term investments and net other assets (liabilities). |
Annual Report
Investments December 31, 2013
Showing Percentage of Net Assets
Common Stocks - 98.5% |
| Shares | | Value |
CHEMICALS - 69.8% |
Commodity Chemicals - 10.5% |
Axiall Corp. | 32,704 | | $ 1,551,478 |
Cabot Corp. | 30,478 | | 1,566,569 |
LyondellBasell Industries NV Class A | 59,716 | | 4,794,000 |
| | 7,912,047 |
Diversified Chemicals - 10.7% |
Eastman Chemical Co. | 38,035 | | 3,069,425 |
FMC Corp. | 51,354 | | 3,875,173 |
Lanxess AG | 10,177 | | 678,674 |
Olin Corp. (d) | 16,678 | | 481,160 |
| | 8,104,432 |
Fertilizers & Agricultural Chemicals - 16.5% |
CF Industries Holdings, Inc. | 11,910 | | 2,775,506 |
Intrepid Potash, Inc. (d) | 27,283 | | 432,163 |
Monsanto Co. | 63,816 | | 7,437,754 |
Potash Corp. of Saskatchewan, Inc. | 55,880 | | 1,842,238 |
| | 12,487,661 |
Industrial Gases - 7.5% |
Airgas, Inc. | 13,001 | | 1,454,162 |
Praxair, Inc. | 32,526 | | 4,229,356 |
| | 5,683,518 |
Specialty Chemicals - 24.6% |
Ashland, Inc. | 15,613 | | 1,515,086 |
Celanese Corp. Class A | 12,873 | | 712,006 |
Chemtura Corp. (a) | 20,221 | | 564,570 |
Cytec Industries, Inc. | 13,368 | | 1,245,363 |
Ecolab, Inc. | 27,896 | | 2,908,716 |
H.B. Fuller Co. | 8,432 | | 438,801 |
NewMarket Corp. | 2,729 | | 911,895 |
PPG Industries, Inc. | 14,690 | | 2,786,105 |
Royal DSM NV | 9,220 | | 725,015 |
RPM International, Inc. | 17,197 | | 713,847 |
Sherwin-Williams Co. | 9,758 | | 1,790,593 |
Sigma Aldrich Corp. | 19,888 | | 1,869,671 |
W.R. Grace & Co. (a) | 24,346 | | 2,407,089 |
| | 18,588,757 |
TOTAL CHEMICALS | | 52,776,415 |
CONSTRUCTION MATERIALS - 4.7% |
Construction Materials - 4.7% |
Eagle Materials, Inc. | 16,088 | | 1,245,694 |
Vulcan Materials Co. | 38,567 | | 2,291,651 |
| | 3,537,345 |
|
| Shares | | Value |
CONTAINERS & PACKAGING - 9.3% |
Metal & Glass Containers - 2.8% |
Aptargroup, Inc. | 17,523 | | $ 1,188,235 |
Silgan Holdings, Inc. | 19,749 | | 948,347 |
| | 2,136,582 |
Paper Packaging - 6.5% |
Graphic Packaging Holding Co. (a) | 164,175 | | 1,576,080 |
MeadWestvaco Corp. | 26,995 | | 996,925 |
Rock-Tenn Co. Class A | 22,197 | | 2,330,907 |
| | 4,903,912 |
TOTAL CONTAINERS & PACKAGING | | 7,040,494 |
METALS & MINING - 7.6% |
Diversified Metals & Mining - 1.3% |
Copper Mountain Mining Corp. (a) | 159,225 | | 251,822 |
First Quantum Minerals Ltd. | 39,600 | | 713,527 |
| | 965,349 |
Gold - 1.4% |
Franco-Nevada Corp. | 9,634 | | 392,616 |
Royal Gold, Inc. | 14,385 | | 662,717 |
| | 1,055,333 |
Steel - 4.9% |
Carpenter Technology Corp. | 21,722 | | 1,351,108 |
Haynes International, Inc. | 7,920 | | 437,501 |
Reliance Steel & Aluminum Co. | 21,345 | | 1,618,805 |
Worthington Industries, Inc. | 7,866 | | 331,001 |
| | 3,738,415 |
TOTAL METALS & MINING | | 5,759,097 |
OIL, GAS & CONSUMABLE FUELS - 2.6% |
Coal & Consumable Fuels - 2.6% |
Peabody Energy Corp. | 99,907 | | 1,951,184 |
PAPER & FOREST PRODUCTS - 4.5% |
Forest Products - 0.3% |
Boise Cascade Co. | 9,167 | | 270,243 |
Paper Products - 4.2% |
International Paper Co. | 54,657 | | 2,679,833 |
P.H. Glatfelter Co. | 17,470 | | 482,871 |
| | 3,162,704 |
TOTAL PAPER & FOREST PRODUCTS | | 3,432,947 |
TOTAL COMMON STOCKS (Cost $53,963,665) |
74,497,482
|
Convertible Bonds - 0.8% |
| Principal
Amount | | Value |
BUILDING PRODUCTS - 0.8% |
Building Products - 0.8% |
Aspen Aerogels, Inc. 8% 6/1/14 (e)
(Cost $569,500) | | $ 569,500 | | $ 569,500 |
U.S. Treasury Obligations - 0.0% |
|
U.S. Treasury Bills, yield at date of purchase 0.05% to 0.07% 1/2/14 to 2/6/14
(Cost $29,999) | | 30,000 | |
30,000
|
Money Market Funds - 1.6% |
| Shares | | |
Fidelity Cash Central Fund, 0.11% (b) | 438,705 | | 438,705 |
Fidelity Securities Lending Cash Central Fund, 0.11% (b)(c) | 736,525 | | 736,525 |
TOTAL MONEY MARKET FUNDS (Cost $1,175,230) |
1,175,230
|
TOTAL INVESTMENT PORTFOLIO - 100.9% (Cost $55,738,394) | | 76,272,212 |
NET OTHER ASSETS (LIABILITIES) - (0.9)% | | (644,396) |
NET ASSETS - 100% | $ 75,627,816 |
Legend |
(a) Non-income producing |
(b) Affiliated fund that is generally available only to investment companies and other accounts managed by Fidelity Investments. The rate quoted is the annualized seven-day yield of the fund at period end. A complete unaudited listing of the fund's holdings as of its most recent quarter end is available upon request. In addition, each Fidelity Central Fund's financial statements, which are not covered by the Fund's Report of Independent Registered Public Accounting Firm, are available on the SEC's website or upon request. |
(c) Investment made with cash collateral received from securities on loan. |
(d) Security or a portion of the security is on loan at period end. |
(e) Restricted securities - Investment in securities not registered under the Securities Act of 1933 (excluding 144A issues). At the end of the period, the value of restricted securities (excluding 144A issues) amounted to $569,500 or 0.8% of net assets. |
Additional information on each restricted holding is as follows: |
Security | Acquisition Date | Acquisition Cost |
Aspen Aerogels, Inc. 8% 6/1/14 | 6/1/11 | $ 569,500 |
Affiliated Central Funds |
Information regarding fiscal year to date income earned by the Fund from investments in Fidelity Central Funds is as follows: |
Fund | Income earned |
Fidelity Cash Central Fund | $ 1,716 |
Fidelity Securities Lending Cash Central Fund | 7,592 |
Total | $ 9,308 |
Other Information |
The following is a summary of the inputs used, as of December 31, 2013, involving the Fund's assets and liabilities carried at fair value. The inputs or methodology used for valuing securities may not be an indication of the risk associated with investing in those securities. For more information on valuation inputs, and their aggregation into the levels used in the table below, please refer to the Investment Valuation section in the accompanying Notes to Financial Statements. |
Valuation Inputs at Reporting Date: |
Description | Total | Level 1 | Level 2 | Level 3 |
Investments in Securities: | | | | |
Common Stocks | $ 74,497,482 | $ 74,497,482 | $ - | $ - |
Convertible Bonds | 569,500 | - | - | 569,500 |
U.S. Treasury Obligations | 30,000 | - | 30,000 | - |
Money Market Funds | 1,175,230 | 1,175,230 | - | - |
Total Investments in Securities: | $ 76,272,212 | $ 75,672,712 | $ 30,000 | $ 569,500 |
Distribution of investments by country or territory of incorporation, as a percentage of total net assets, is as follows (Unaudited): |
United States of America | 87.6% |
Netherlands | 7.3% |
Canada | 4.2% |
Others (Individually Less Than 1%) | 0.9% |
| 100.0% |
See accompanying notes which are an integral part of the financial statements.
Annual Report
Statement of Assets and Liabilities
| December 31, 2013 |
| | |
Assets | | |
Investment in securities, at value (including securities loaned of $716,463) - See accompanying schedule: Unaffiliated issuers (cost $54,563,164) | $ 75,096,982 | |
Fidelity Central Funds (cost $1,175,230) | 1,175,230 | |
Total Investments (cost $55,738,394) | | $ 76,272,212 |
Receivable for investments sold | | 465,617 |
Receivable for fund shares sold | | 31,367 |
Dividends receivable | | 42,826 |
Interest receivable | | 128,085 |
Distributions receivable from Fidelity Central Funds | | 949 |
Prepaid expenses | | 518 |
Other receivables | | 206 |
Total assets | | 76,941,780 |
| | |
Liabilities | | |
Payable for investments purchased | $ 455,383 | |
Payable for fund shares redeemed | 42,923 | |
Accrued management fee | 33,794 | |
Other affiliated payables | 10,152 | |
Other payables and accrued expenses | 35,187 | |
Collateral on securities loaned, at value | 736,525 | |
Total liabilities | | 1,313,964 |
| | |
Net Assets | | $ 75,627,816 |
Net Assets consist of: | | |
Paid in capital | | $ 52,818,659 |
Distributions in excess of net investment income | | (217,923) |
Accumulated undistributed net realized gain (loss) on investments and foreign currency transactions | | 2,493,249 |
Net unrealized appreciation (depreciation) on investments and assets and liabilities in foreign currencies | | 20,533,831 |
Net Assets | | $ 75,627,816 |
Statement of Assets and Liabilities - continued
| December 31, 2013 |
| | |
Initial Class:
Net Asset Value, offering price and redemption price per share ($21,066,590 ÷ 1,356,351 shares) | | $ 15.53 |
| | |
Investor Class:
Net Asset Value, offering price and redemption price per share ($54,561,226 ÷ 3,513,531 shares) | | $ 15.53 |
See accompanying notes which are an integral part of the financial statements.
Annual Report
Statement of Operations
| Year ended December 31, 2013 |
| | |
Investment Income | | |
Dividends | | $ 1,085,999 |
Interest | | 55,988 |
Income from Fidelity Central Funds | | 9,308 |
Total income | | 1,151,295 |
| | |
Expenses | | |
Management fee | $ 420,258 | |
Transfer agent fees | 101,036 | |
Accounting and security lending fees | 29,729 | |
Custodian fees and expenses | 16,662 | |
Independent trustees' compensation | 1,155 | |
Audit | 40,448 | |
Legal | 1,209 | |
Miscellaneous | 5,644 | |
Total expenses before reductions | 616,141 | |
Expense reductions | (6,227) | 609,914 |
Net investment income (loss) | | 541,381 |
Realized and Unrealized Gain (Loss) Net realized gain (loss) on: | | |
Investment securities: | | |
Unaffiliated issuers | 5,447,783 | |
Foreign currency transactions | (249) | |
Futures contracts | 130,064 | |
Total net realized gain (loss) | | 5,577,598 |
Change in net unrealized appreciation (depreciation) on: Investment securities | 8,519,787 | |
Assets and liabilities in foreign currencies | 38 | |
Futures contracts | (10,860) | |
Total change in net unrealized appreciation (depreciation) | | 8,508,965 |
Net gain (loss) | | 14,086,563 |
Net increase (decrease) in net assets resulting from operations | | $ 14,627,944 |
Statement of Changes in Net Assets
| Year ended
December 31,
2013 | Year ended
December 31,
2012 |
Increase (Decrease) in Net Assets | | |
Operations | | |
Net investment income (loss) | $ 541,381 | $ 716,871 |
Net realized gain (loss) | 5,577,598 | 958,517 |
Change in net unrealized appreciation (depreciation) | 8,508,965 | 11,650,684 |
Net increase (decrease) in net assets resulting from operations | 14,627,944 | 13,326,072 |
Distributions to shareholders from net investment income | (761,300) | (654,049) |
Distributions to shareholders from net realized gain | (2,556,577) | (4,078,845) |
Total distributions | (3,317,877) | (4,732,894) |
Share transactions - net increase (decrease) | (10,908,022) | (10,666,203) |
Redemption fees | 12,787 | 10,482 |
Total increase (decrease) in net assets | 414,832 | (2,062,543) |
| | |
Net Assets | | |
Beginning of period | 75,212,984 | 77,275,527 |
End of period (including distributions in excess of net investment income of $217,923 and undistributed net investment income of $24,513, respectively) | $ 75,627,816 | $ 75,212,984 |
See accompanying notes which are an integral part of the financial statements.
Annual Report
Financial Highlights - Initial Class
Years ended December 31, | 2013 | 2012 | 2011 | 2010 | 2009 |
Selected Per-Share Data | | | | | |
Net asset value, beginning of period | $ 13.27 | $ 11.67 | $ 12.94 | $ 10.25 | $ 5.80 |
Income from Investment Operations | | | | | |
Net investment income (loss) C | .11 | .12 | .16 F | .25 G | .10 H |
Net realized and unrealized gain (loss) | 2.77 | 2.19 | (1.24) | 2.66 | 4.42 |
Total from investment operations | 2.88 | 2.31 | (1.08) | 2.91 | 4.52 |
Distributions from net investment income | (.17) | (.12) | (.20) | (.23) | (.08) |
Distributions from net realized gain | (.45) | (.59) | - | - J | - |
Total distributions | (.62) | (.71) | (.20) | (.23) | (.08) |
Redemption fees added to paid in capital C | - J | - J | .01 | .01 | .01 |
Net asset value, end of period | $ 15.53 | $ 13.27 | $ 11.67 | $ 12.94 | $ 10.25 |
Total Return A, B | 22.15% | 20.15% | (8.20)% | 28.54% | 78.09% |
Ratios to Average Net Assets D, I | | | | | |
Expenses before reductions | .76% | .75% | .76% | .79% | .82% |
Expenses net of fee waivers, if any | .76% | .75% | .76% | .78% | .82% |
Expenses net of all reductions | .75% | .74% | .75% | .77% | .81% |
Net investment income (loss) | .77% | .96% | 1.28% F | 2.31% G | 1.27% H |
Supplemental Data | | | | | |
Net assets, end of period (000 omitted) | $ 21,067 | $ 25,025 | $ 27,414 | $ 46,131 | $ 34,218 |
Portfolio turnover rate E | 68% | 68% | 105% | 115% | 105% |
A Total returns do not reflect charges attributable to your insurance company's separate account. Inclusion of these charges would reduce the total returns shown. B Total returns would have been lower if certain expenses had not been reduced during the applicable periods shown. C Calculated based on average shares outstanding during the period. D Fees and expenses of any underlying Fidelity Central Funds are not included in the Fund's expense ratio. The Fund indirectly bears its proportionate share of the expenses of any underlying Fidelity Central Funds. E Amount does not include the portfolio activity of any underlying Fidelity Central Funds. F Investment income per share reflects a large, non-recurring dividend which amounted to $.05 per share. Excluding this non-recurring dividend, the ratio of net investment income (loss) to average net assets would have been .93%. G Investment income per share reflects a large, non-recurring dividend which amounted to $.16 per share. Excluding this non-recurring dividend, the ratio of net investment income (loss) to average net assets would have been .86%. H Investment income per share reflects a large, non-recurring dividend which amounted to $.02 per share. Excluding this non-recurring dividend, the ratio of net investment income (loss) to average net assets would have been 1.03%. I Expense ratios reflect operating expenses of the class. Expenses before reductions do not reflect amounts reimbursed by the investment adviser or reductions from brokerage service arrangements or reductions from other expense offset arrangements and do not represent the amount paid by the class during periods when reimbursements or reductions occur. Expenses net of fee waivers reflect expenses after reimbursement by the investment adviser but prior to reductions from brokerage service arrangements or other expense offset arrangements. Expenses net of all reductions represent the net expenses paid by the class. J Amount represents less than $.01 per share. |
Financial Highlights - Investor Class
Years ended December 31, | 2013 | 2012 | 2011 | 2010 | 2009 |
Selected Per-Share Data | | | | | |
Net asset value, beginning of period | $ 13.27 | $ 11.67 | $ 12.94 | $ 10.25 | $ 5.80 |
Income from Investment Operations | | | | | |
Net investment income (loss) C | .10 | .11 | .15 F | .24 G | .10 H |
Net realized and unrealized gain (loss) | 2.77 | 2.19 | (1.24) | 2.66 | 4.41 |
Total from investment operations | 2.87 | 2.30 | (1.09) | 2.90 | 4.51 |
Distributions from net investment income | (.16) | (.11) | (.19) | (.22) | (.07) |
Distributions from net realized gain | (.45) | (.59) | - | - J | - |
Total distributions | (.61) | (.70) | (.19) | (.22) | (.07) |
Redemption fees added to paid in capital C | - J | - J | .01 | .01 | .01 |
Net asset value, end of period | $ 15.53 | $ 13.27 | $ 11.67 | $ 12.94 | $ 10.25 |
Total Return A, B | 22.07% | 20.07% | (8.30)% | 28.45% | 78.02% |
Ratios to Average Net Assets D, I | | | | | |
Expenses before reductions | .83% | .83% | .84% | .87% | .91% |
Expenses net of fee waivers, if any | .83% | .83% | .84% | .86% | .91% |
Expenses net of all reductions | .83% | .82% | .83% | .85% | .90% |
Net investment income (loss) | .69% | .88% | 1.20% F | 2.23% G | 1.18% H |
Supplemental Data | | | | | |
Net assets, end of period (000 omitted) | $ 54,561 | $ 50,188 | $ 49,862 | $ 55,979 | $ 38,572 |
Portfolio turnover rate E | 68% | 68% | 105% | 115% | 105% |
A Total returns do not reflect charges attributable to your insurance company's separate account. Inclusion of these charges would reduce the total returns shown. B Total returns would have been lower if certain expenses had not been reduced during the applicable periods shown. C Calculated based on average shares outstanding during the period. D Fees and expenses of any underlying Fidelity Central Funds are not included in the Fund's expense ratio. The Fund indirectly bears its proportionate share of the expenses of any underlying Fidelity Central Funds. E Amount does not include the portfolio activity of any underlying Fidelity Central Funds. F Investment income per share reflects a large, non-recurring dividend which amounted to $.05 per share. Excluding this non-recurring dividend, the ratio of net investment income (loss) to average net assets would have been .85%. G Investment income per share reflects a large, non-recurring dividend which amounted to $.16 per share. Excluding this non-recurring dividend, the ratio of net investment income (loss) to average net assets would have been .78%. H Investment income per share reflects a large, non-recurring dividend which amounted to $.02 per share. Excluding this non-recurring dividend, the ratio of net investment income (loss) to average net assets would have been .94%. I Expense ratios reflect operating expenses of the class. Expenses before reductions do not reflect amounts reimbursed by the investment adviser or reductions from brokerage service arrangements or reductions from other expense offset arrangements and do not represent the amount paid by the class during periods when reimbursements or reductions occur. Expenses net of fee waivers reflect expenses after reimbursement by the investment adviser but prior to reductions from brokerage service arrangements or other expense offset arrangements. Expenses net of all reductions represent the net expenses paid by the class. J Amount represents less than $.01 per share. |
See accompanying notes which are an integral part of the financial statements.
Annual Report
Notes to Financial Statements
For the period ended December 31, 2013
1. Organization.
VIP Materials Portfolio (the Fund) is a non-diversified fund of Variable Insurance Products Fund IV (the Trust) and is authorized to issue an unlimited number of shares. The Trust is registered under the Investment Company Act of 1940, as amended (the 1940 Act), as an open-end management investment company organized as a Massachusetts business trust. Shares of the Fund may only be purchased by insurance companies for the purpose of funding variable annuity or variable life insurance contracts. The Fund offers the following classes of shares: Initial Class shares and Investor Class shares. All classes have equal rights and voting privileges, except for matters affecting a single class.
2. Investments in Fidelity Central Funds.
The Fund invests in Fidelity Central Funds, which are open-end investment companies generally available only to other investment companies and accounts managed by the investment adviser and its affiliates. The Fund's Schedule of Investments lists each of the Fidelity Central Funds held as of period end, if any, as an investment of the Fund, but does not include the underlying holdings of each Fidelity Central Fund. As an Investing Fund, the Fund indirectly bears its proportionate share of the expenses of the underlying Fidelity Central Funds.
The Money Market Central Funds seek preservation of capital and current income and are managed by Fidelity Investments Money Management, Inc. (FIMM), an affiliate of the investment adviser. Annualized expenses of the Money Market Central Funds as of their most recent shareholder report date are less than .01%.
A complete unaudited list of holdings for each Fidelity Central Fund is available upon request or at the Securities and Exchange Commission (the SEC) website at www.sec.gov. In addition, the financial statements of the Fidelity Central Funds, which are not covered by the Fund's Report of Independent Registered Public Accounting Firm, are available on the SEC website or upon request.
3. Significant Accounting Policies.
The financial statements have been prepared in conformity with accounting principles generally accepted in the United States of America (GAAP), which require management to make certain estimates and assumptions at the date of the financial statements. Actual results could differ from those estimates. Subsequent events, if any, through the date that the financial statements were issued have been evaluated in the preparation of the financial statements. The following summarizes the significant accounting policies of the Fund:
Investment Valuation. Investments are valued as of 4:00 p.m. Eastern time on the last calendar day of the period. In accordance with valuation policies and procedures approved by the Board of Trustees (the Board), the Fund attempts to obtain prices from one or more third party pricing vendors or brokers to value its investments. When current market prices, quotations or currency exchange rates are not readily available or reliable, investments will be fair valued in good faith by the Fidelity SelectCo, LLC (SelectCo) Fair Value Committee (the Committee), in accordance with procedures adopted by the Board. Factors used in determining fair value vary by investment type and may include market or investment specific events, changes in interest rates and credit quality. The frequency with which these procedures are used cannot be predicted and they may be utilized to a significant extent. The Committee oversees the Fund's valuation policies and procedures and is responsible for approving and reporting to the Board all fair value determinations.
The Fund categorizes the inputs to valuation techniques used to value its investments into a disclosure hierarchy consisting of three levels as shown below:
Level 1 - quoted prices in active markets for identical investments
Level 2 - other significant observable inputs (including quoted prices for similar investments, interest rates, prepayment speeds, etc.)
Level 3 - unobservable inputs (including the Fund's own assumptions based on the best information available)
Valuation techniques used to value the Fund's investments by major category are as follows:
Equity securities, including restricted securities, for which market quotations are readily available, are valued at the last reported sale price or official closing price as reported by a third party pricing vendor on the primary market or exchange on which they are traded and are categorized as Level 1 in the hierarchy. In the event there were no sales during the day or closing prices are not available, securities are valued at the last quoted bid price or may be valued using the last available price and are generally categorized as Level 2 in the hierarchy. For foreign equity securities, when market or security specific events arise, comparisons to the valuation of American Depositary Receipts (ADRs), futures contracts, Exchange-Traded Funds (ETFs) and certain indexes as well as quoted prices for similar securities may be used and would be categorized as Level 2 in the hierarchy. Utilizing these techniques may result in transfers between Level 1 and Level 2. For equity securities, including restricted securities, where observable inputs are limited, assumptions about market activity and risk are used and these securities may be categorized as Level 3 in the hierarchy.
Debt securities, including restricted securities, are valued based on evaluated prices received from third party pricing vendors or from brokers who make markets in such securities. Corporate bonds and U.S. government and government agency obligations are valued by pricing vendors who utilize
Annual Report
3. Significant Accounting Policies - continued
Investment Valuation - continued
matrix pricing which considers yield or price of bonds of comparable quality, coupon, maturity and type or by broker-supplied prices. When independent prices are unavailable or unreliable, debt securities may be valued utilizing pricing methodologies which consider similar factors that would be used by third party pricing vendors. Debt securities are generally categorized as Level 2 in the hierarchy but may be Level 3 depending on the circumstances.
Futures contracts are valued at the settlement price established each day by the board of trade or exchange on which they are traded and are categorized as Level 1 in the hierarchy. Investments in open-end mutual funds, including the Fidelity Central Funds, are valued at their closing net asset value (NAV) each business day and are categorized as Level 1 in the hierarchy.
Changes in valuation techniques may result in transfers in or out of an assigned level within the disclosure hierarchy. The aggregate value of investments by input level, as of December 31, 2013, is included at the end of the Fund's Schedule of Investments.
Foreign Currency. The Fund may use foreign currency contracts to facilitate transactions in foreign-denominated securities. Gains and losses from these transactions may arise from changes in the value of the foreign currency or if the counterparties do not perform under the contracts' terms.
Foreign-denominated assets, including investment securities, and liabilities are translated into U.S. dollars at the exchange rates at period end. Purchases and sales of investment securities, income and dividends received and expenses denominated in foreign currencies are translated into U.S. dollars at the exchange rate in effect on the transaction date.
The effects of exchange rate fluctuations on investments are included with the net realized and unrealized gain (loss) on investment securities. Other foreign currency transactions resulting in realized and unrealized gain (loss) are disclosed separately.
Investment Transactions and Income. For financial reporting purposes, the Fund's investment holdings and NAV include trades executed through the end of the last business day of the period. The NAV per share for processing shareholder transactions is calculated as of the close of business of the New York Stock Exchange (NYSE), normally 4:00 p.m. Eastern time and includes trades executed through the end of the prior business day. Gains and losses on securities sold are determined on the basis of identified cost and may include proceeds received from litigation. Dividend income is recorded on the ex-dividend date, except for certain dividends from foreign securities where the ex-dividend date may have passed, which are recorded as soon as the Fund is informed of the ex-dividend date. Non-cash dividends included in dividend income, if any, are recorded at the fair market value of the securities received. Distributions received on securities that represent a return of capital or capital gain are recorded as a reduction of cost of investments and/or as a realized gain. Subsequent to ex-dividend date the Fund determines the components of these distributions, based upon receipt of tax filings or other correspondence relating to the underlying investment. Interest income and distributions from the Fidelity Central Funds are accrued as earned. Interest income includes coupon interest and amortization of premium and accretion of discount on debt securities. Investment income is recorded net of foreign taxes withheld where recovery of such taxes is uncertain.
Class Allocations and Expenses. Investment income, realized and unrealized capital gains and losses, common expenses of the Fund, and certain fund-level expense reductions, if any, are allocated daily on a pro-rata basis to each class based on the relative net assets of each class to the total net assets of the Fund. Each class differs with respect to transfer agent fees incurred. Certain expense reductions may also differ by class. For the reporting period, the allocated portion of income and expenses to each class as a percent of its average net assets may vary due to the timing of recording these transactions in relation to fluctuating net assets of the classes. Expenses directly attributable to a fund are charged to that fund. Expenses attributable to more than one fund are allocated among the respective funds on the basis of relative net assets or other appropriate methods. Expense estimates are accrued in the period to which they relate and adjustments are made when actual amounts are known.
Income Tax Information and Distributions to Shareholders. Each year, the Fund intends to qualify as a regulated investment company under Subchapter M of the Internal Revenue Code, including distributing substantially all of its taxable income and realized gains. As a result, no provision for U.S. Federal income taxes is required. As of December 31, 2013, the Fund did not have any unrecognized tax benefits in the financial statements; nor is the Fund aware of any tax positions for which it is reasonably possible that the total amounts of unrecognized tax benefits will significantly change in the next twelve months. The Fund files a U.S. federal tax return, in addition to state and local tax returns as required. The Fund's federal income tax returns are subject to examination by the Internal Revenue Service (IRS) for a period of three fiscal years after they are filed. State and local tax returns may be subject to examination for an additional fiscal year depending on the jurisdiction. Foreign taxes are provided for based on the Fund's understanding of the tax rules and rates that exist in the foreign markets in which it invests.
Distributions are declared and recorded on the ex-dividend date. Income dividends and capital gain distributions are declared separately for each class. Income and capital gain distributions are determined in accordance with income tax regulations, which may differ from GAAP.
Capital accounts within the financial statements are adjusted for permanent book-tax differences. These adjustments have no impact on net assets or the results of operations. Capital accounts are not adjusted for temporary book-tax differences which will reverse in a subsequent period.
Annual Report
Notes to Financial Statements - continued
3. Significant Accounting Policies - continued
Income Tax Information and Distributions to Shareholders - continued
Book-tax differences are primarily due to futures contracts, foreign currency transactions, passive foreign investment companies (PFIC), original issue discount, and losses deferred due to wash sales and excise tax regulations.
The federal tax cost of investment securities and unrealized appreciation (depreciation) as of period end were as follows:
Gross unrealized appreciation | $ 21,703,561 |
Gross unrealized depreciation | (1,608,150) |
Net unrealized appreciation (depreciation) on securities and other investments | $ 20,095,411 |
| |
Tax Cost | $ 56,176,801 |
The tax-based components of distributable earnings as of period end were as follows:
Undistributed long-term capital gain | $ 2,713,732 |
Net unrealized appreciation (depreciation) | $ 20,095,424 |
The tax character of distributions paid was as follows:
| December 31, 2013 | December 31, 2012 |
Ordinary Income | $ 1,629,716 | $ 1,365,402 |
Long-term Capital Gains | 1,688,161 | 3,367,492 |
Total | $ 3,317,877 | $ 4,732,894 |
Trading (Redemption) Fees. Shares held by investors less than 60 days may be subject to a redemption fee equal to 1% of the NAV of shares redeemed. All redemption fees, which reduce the proceeds of the shareholder redemption, are retained by the Fund and accounted for as an addition to paid in capital.
Restricted Securities. The Fund may invest in securities that are subject to legal or contractual restrictions on resale. These securities generally may be resold in transactions exempt from registration or to the public if the securities are registered. Disposal of these securities may involve time-consuming negotiations and expense, and prompt sale at an acceptable price may be difficult. Information regarding restricted securities is included at the end of the Fund's Schedule of Investments.
4. Derivative Instruments.
Risk Exposures and the Use of Derivative Instruments. The Fund's investment objective allows the Fund to enter into various types of derivative contracts, including futures contracts. Derivatives are investments whose value is primarily derived from underlying assets, indices or reference rates and may be transacted on an exchange or over-the-counter (OTC). Derivatives may involve a future commitment to buy or sell a specified asset based on specified terms, to exchange future cash flows at periodic intervals based on a notional principal amount, or for one party to make one or more payments upon the occurrence of specified events in exchange for periodic payments from the other party.
The Fund used derivatives to increase returns and to manage exposure to certain risks as defined below. The success of any strategy involving derivatives depends on analysis of numerous economic factors, and if the strategies for investment do not work as intended, the Fund may not achieve its objectives.
The Fund's use of derivatives increased or decreased its exposure to the following risk:
Equity Risk | Equity risk relates to the fluctuations in the value of financial instruments as a result of changes in market prices (other than those arising from interest rate risk or foreign exchange risk), whether caused by factors specific to an individual investment, its issuer, or all factors affecting all instruments traded in a market or market segment. |
The Fund is also exposed to additional risks from investing in derivatives, such as liquidity risk and counterparty credit risk. Liquidity risk is the risk that the Fund will be unable to close out the derivative in the open market in a timely manner. Counterparty credit risk is the risk that the counterparty will not be able to fulfill its obligation to the Fund. Counterparty credit risk related to exchange-traded futures contracts may be mitigated by the protection provided by the exchange on which they trade.
Investing in derivatives may involve greater risks than investing in the underlying assets directly and, to varying degrees, may involve risk of loss in excess of any initial investment and collateral received and amounts recognized in the Statement of Assets and Liabilities. In addition, there may be the risk that the change in value of the derivative contract does not correspond to the change in value of the underlying instrument.
Annual Report
4. Derivative Instruments - continued
Futures Contracts. A futures contract is an agreement between two parties to buy or sell a specified underlying instrument for a fixed price at a specified future date. The Fund used futures contracts to manage its exposure to the stock markets.
Upon entering into a futures contract, a fund is required to deposit either cash or securities (initial margin) with a clearing broker in an amount equal to a certain percentage of the face value of the contract. Futures contracts are marked-to-market daily and subsequent daily payments (variation margin) are made or received by a fund depending on the daily fluctuations in the value of the futures contracts and are recorded as unrealized appreciation or (depreciation). This receivable and/or payable, if any, is included in daily variation margin for derivative instruments in the Statement of Assets and Liabilities. Realized gain or (loss) is recorded upon the expiration or closing of a futures contract.
Any open futures contracts at period end are presented in the Schedule of Investments under the caption "Futures Contracts." The underlying face amount at value reflects each contract's exposure to the underlying instrument or index at period end. Securities deposited to meet initial margin requirements are identified in the Schedule of Investments.
During the period the Fund recognized net realized gain (loss) of $130,064 and a change in net unrealized appreciation (depreciation) of $(10,860) related to its investment in futures contracts. These amounts are included in the Statement of Operations.
5. Purchases and Sales of Investments.
Purchases and sales of securities, other than short-term securities, aggregated $50,756,166 and $62,934,098, respectively.
6. Fees and Other Transactions with Affiliates.
Management Fee. Effective August 1, 2013, SelectCo replaced Fidelity Management and Research Company (FMR), an affiliate of SelectCo, as investment adviser to the Fund. The investment adviser and its affiliates provide the Fund with investment management related services for which the Fund pays a monthly management fee. The management fee is the sum of an individual fund fee rate that is based on an annual rate of .30% of the Fund's average net assets and an annualized group fee rate that averaged .25% during the period. The group fee rate is based upon the average net assets of all the mutual funds advised by FMR and the investment adviser. The group fee rate decreases as assets under management increase and increases as assets under management decrease. For the reporting period, the total annual management fee rate was .55% of the Fund's average net assets.
Transfer Agent Fees. Fidelity Investments Institutional Operations Company, Inc. (FIIOC), an affiliate of the investment adviser, is the Fund's transfer, dividend disbursing, and shareholder servicing agent. FIIOC receives an asset-based fee with respect to each class. Each class (with the exception of Investor Class) pays a transfer agent fee, excluding out of pocket expenses, equal to an annual rate of .07% of average net assets. Investor Class pays a monthly asset-based transfer agent fee of .15% of average net assets. In addition, FIIOC receives an asset-based fee of .0035% of average net assets for typesetting, printing and mailing of shareholder reports, except proxy statements. FIIOC voluntarily agreed to reimburse or waive this fee for the period January 1, 2013 through December 31, 2013 (see Expense Reductions note). For the period, transfer agent fees for each class, including printing and out of pocket expenses, were as follows:
Initial Class | $ 18,240 |
Investor Class | 82,796 |
| $ 101,036 |
Effective February 1, 2014, the Board of Trustees approved an amendment to the transfer agent fee agreement whereby each class (with the exception of Investor Class) pays a single fee of .07% of average net assets for transfer agent services, typesetting, printing and mailing of shareholder reports, excluding mailing of proxy statements and out of pocket expenses. Investor Class pays a single fee of .15% of average net assets.
Accounting and Security Lending Fees. Fidelity Service Company, Inc. (FSC), an affiliate of the investment adviser, maintains the Fund's accounting records. The accounting fee is based on the level of average net assets for each month. Under a separate contract, FSC administers the security lending program. The security lending fee is based on the number and duration of lending transactions.
Brokerage Commissions. The Fund placed a portion of its portfolio transactions with brokerage firms which are affiliates of the investment adviser. Brokerage commissions are included in net realized gain (loss) and change in net unrealized appreciation (depreciation) in the Statement of Operations. The commissions paid to these affiliated firms were $1,587 for the period.
7. Committed Line of Credit.
The Fund participates with other funds managed by the investment adviser or an affiliate in a $4.25 billion credit facility (the "line of credit") to be utilized for temporary or emergency purposes to fund shareholder redemptions or for other short-term liquidity purposes. The Fund has agreed to pay
Annual Report
Notes to Financial Statements - continued
7. Committed Line of Credit - continued
commitment fees on its pro-rata portion of the line of credit, which amounted to $167 and is reflected in Miscellaneous expenses on the Statement of Operations. During the period, there were no borrowings on this line of credit.
8. Security Lending.
The Fund lends portfolio securities through a lending agent from time to time in order to earn additional income. For equity securities, a lending agent is used and may loan securities to certain qualified borrowers, which prior to August 1, 2013 included Fidelity Capital Markets (FCM), a broker-dealer affiliated with the Fund. On the settlement date of the loan, the Fund receives collateral (in the form of U.S. Treasury obligations, letters of credit and/or cash) against the loaned securities and maintains collateral in an amount not less than 100% of the market value of the loaned securities during the period of the loan. The market value of the loaned securities is determined at the close of business of the Fund and any additional required collateral is delivered to the Fund on the next business day. If the borrower defaults on its obligation to return the securities loaned because of insolvency or other reasons, the Fund may apply collateral received from the borrower against the obligation. The Fund may experience delays and costs in recovering the securities loaned. Any cash collateral received is invested in the Fidelity Securities Lending Cash Central Fund. The value of loaned securities and cash collateral at period end are disclosed on the Fund's Statement of Assets and Liabilities. Security lending income represents the income earned on investing cash collateral, less rebates paid to borrowers and any lending agent fees associated with the loan, plus any premium payments received for lending certain types of securities. Security lending income is presented in the Statement of Operations as a component of income from Fidelity Central Funds. Total security lending income during the period amounted to $7,592. During the period, there were no securities loaned to FCM.
9. Expense Reductions.
The investment adviser or its affiliates agreed to reimburse or waive certain fees during the period as noted in the table below.
| |
Initial Class | $ 894 |
Investor Class | 2,107 |
| $ 3,001 |
Commissions paid to certain brokers with whom the investment adviser, or its affiliates, places trades on behalf of the Fund include an amount in addition to trade execution, which may be rebated back to the Fund to offset certain expenses. This amount totaled $3,226 for the period.
10. Distributions to Shareholders.
Distributions to shareholders of each class were as follows:
Years ended December 31, | 2013 | 2012 |
From net investment income | | |
Initial Class | $ 221,113 | $ 226,670 |
Investor Class | 540,187 | 427,379 |
Total | $ 761,300 | $ 654,049 |
From net realized gain | | |
Initial Class | $ 774,595 | $ 1,487,882 |
Investor Class | 1,781,982 | 2,590,963 |
Total | $ 2,556,577 | $ 4,078,845 |
11. Share Transactions.
Transactions for each class of shares were as follows:
| Shares | Dollars |
Years ended December 31, | 2013 | 2012 | 2013 | 2012 |
Initial Class | | | | |
Shares sold | 201,235 | 549,001 | $ 2,845,478 | $ 7,169,332 |
Reinvestment of distributions | 70,187 | 134,688 | 995,708 | 1,714,552 |
Shares redeemed | (800,341) | (1,147,926) | (11,168,241) | (13,934,421) |
Net increase (decrease) | (528,919) | (464,237) | $ (7,327,055) | $ (5,050,537) |
Annual Report
11. Share Transactions - continued
| Shares | Dollars |
Years ended December 31, | 2013 | 2012 | 2013 | 2012 |
Investor Class | | | | |
Shares sold | 858,453 | 892,847 | $ 12,056,908 | $ 11,470,871 |
Reinvestment of distributions | 163,237 | 237,115 | 2,322,169 | 3,018,342 |
Shares redeemed | (1,289,391) | (1,622,132) | (17,960,044) | (20,104,879) |
Net increase (decrease) | (267,701) | (492,170) | $ (3,580,967) | $ (5,615,666) |
12. Other.
The Fund's organizational documents provide former and current trustees and officers with a limited indemnification against liabilities arising in connection with the performance of their duties to the Fund. In the normal course of business, the Fund may also enter into contracts that provide general indemnifications. The Fund's maximum exposure under these arrangements is unknown as this would be dependent on future claims that may be made against the Fund. The risk of material loss from such claims is considered remote.
At the end of the period, the investment adviser or its affiliates were the owners of record of 100% of the total outstanding shares of the Fund.
Annual Report
Report of Independent Registered Public Accounting Firm
To the Trustees of Variable Insurance Products Fund IV and the Shareholders of VIP Materials Portfolio:
In our opinion, the accompanying statement of assets and liabilities, including the schedule of investments, and the related statements of operations and of changes in net assets and the financial highlights present fairly, in all material respects, the financial position of VIP Materials Portfolio (a fund of Variable Insurance Products Fund IV) at December 31, 2013, the results of its operations for the year then ended, the changes in its net assets for each of the two years in the period then ended and the financial highlights for each of the five years in the period then ended, in conformity with accounting principles generally accepted in the United States of America. These financial statements and financial highlights (hereafter referred to as "financial statements") are the responsibility of the VIP Materials Portfolio's management. Our responsibility is to express an opinion on these financial statements based on our audits. We conducted our audits of these financial statements in accordance with the standards of the Public Company Accounting Oversight Board (United States). Those standards require that we plan and perform the audit to obtain reasonable assurance about whether the financial statements are free of material misstatement. An audit includes examining, on a test basis, evidence supporting the amounts and disclosures in the financial statements, assessing the accounting principles used and significant estimates made by management, and evaluating the overall financial statement presentation. We believe that our audits, which included confirmation of securities at December 31, 2013 by correspondence with the custodian and brokers, provide a reasonable basis for our opinion.
PricewaterhouseCoopers LLP
Boston, Massachusetts
February 18, 2014
Annual Report
The Trustees and officers of the trust and fund, as applicable, are listed below. The Board of Trustees governs the fund and is responsible for protecting the interests of shareholders. The Trustees are experienced executives who meet periodically throughout the year to oversee the fund's activities, review contractual arrangements with companies that provide services to the fund, oversee management of the risks associated with such activities and contractual arrangements, and review the fund's performance. Ned C. Lautenbach, Ronald P. O'Hanley, and William S. Stavropoulos each oversees 247 funds. David A. Rosow, Garnett A. Smith, and Michael E. Wiley each oversees 74 funds.
The Trustees hold office without limit in time except that (a) any Trustee may resign; (b) any Trustee may be removed by written instrument, signed by at least two-thirds of the number of Trustees prior to such removal; (c) any Trustee who requests to be retired or who has become incapacitated by illness or injury may be retired by written instrument signed by a majority of the other Trustees; and (d) any Trustee may be removed at any special meeting of shareholders by a two-thirds vote of the outstanding voting securities of the trust. The officers hold office without limit in time, except that any officer may resign or may be removed by a vote of a majority of the Trustees at any regular meeting or any special meeting of the Trustees. Except as indicated, each individual has held the office shown or other offices in the same company for the past five years.
Experience, Skills, Attributes, and Qualifications of the Fund's Trustees. The Governance and Nominating Committee has adopted a statement of policy that describes the experience, qualifications, attributes, and skills that are necessary and desirable for potential Independent Trustee candidates (Statement of Policy). The Board believes that each Trustee satisfied at the time he or she was initially elected or appointed a Trustee, and continues to satisfy, the standards contemplated by the Statement of Policy. The Governance and Nominating Committee also engages professional search firms to help identify potential Independent Trustee candidates who have the experience, qualifications, attributes, and skills consistent with the Statement of Policy. From time to time, additional criteria based on the composition and skills of the current Independent Trustees, as well as experience or skills that may be appropriate in light of future changes to board composition, business conditions, and regulatory or other developments, have also been considered by the professional search firms and the Governance and Nominating Committee. In addition, the Board takes into account the Trustees' commitment and participation in Board and committee meetings, as well as their leadership of standing and ad hoc committees throughout their tenure.
In determining that a particular Trustee was and continues to be qualified to serve as a Trustee, the Board has considered a variety of criteria, none of which, in isolation, was controlling. The Board believes that, collectively, the Trustees have balanced and diverse experience, qualifications, attributes, and skills, which allow the Board to operate effectively in governing the fund and protecting the interests of shareholders. Information about the specific experience, skills, attributes, and qualifications of each Trustee, which in each case led to the Board's conclusion that the Trustee should serve (or continue to serve) as a trustee of the fund, is provided below.
Board Structure and Oversight Function. Ronald P. O'Hanley is an interested person (as defined in the 1940 Act) and currently serves as Chairman. The Trustees have determined that an interested Chairman is appropriate and benefits shareholders because an interested Chairman has a personal and professional stake in the quality and continuity of services provided to the fund. Independent Trustees exercise their informed business judgment to appoint an individual of their choosing to serve as Chairman, regardless of whether the Trustee happens to be independent or a member of management. The Independent Trustees have determined that they can act independently and effectively without having an Independent Trustee serve as Chairman and that a key structural component for assuring that they are in a position to do so is for the Independent Trustees to constitute a substantial majority for the Board. The Independent Trustees also regularly meet in executive session. Michael E. Wiley serves as Chairman of the Independent Trustees and as such (i) acts as a liaison between the Independent Trustees and management with respect to matters important to the Independent Trustees and (ii) with management prepares agendas for Board meetings.
Fidelity funds are overseen by different Boards of Trustees. The fund's Board oversees Fidelity's sector portfolios. Other Boards oversee Fidelity's equity and high income funds, and Fidelity's investment grade bond, money market, and asset allocation funds. The use of separate Boards, each with its own committee structure, allows the Trustees of each group of Fidelity funds to focus on the unique issues of the funds they oversee, including common research, investment, and operational issues. On occasion, the separate Boards establish joint committees to address issues of overlapping consequences for the Fidelity funds overseen by each Board.
The Trustees operate using a system of committees to facilitate the timely and efficient consideration of all matters of importance to the Trustees, the fund, and fund shareholders and to facilitate compliance with legal and regulatory requirements and oversight of the fund's activities and associated risks. The Board, acting through its committees, has charged SelectCo and its affiliates with (i) identifying events or circumstances the occurrence of which could have demonstrably adverse effects on the fund's business and/or reputation; (ii) implementing processes and controls to lessen the possibility that such events or circumstances occur or to mitigate the effects of such events or circumstances if they do occur; and (iii) creating and maintaining a system designed to evaluate continuously business and market conditions in order to facilitate the identification and implementation processes described in (i) and (ii) above. Because the day-to-day operations and activities of the fund are carried out by or through SelectCo, its affiliates, and other service providers, the fund's exposure to risks is mitigated but not eliminated by the processes overseen by the Trustees. While each of the Board's committees has responsibility for overseeing different aspects of the fund's activities, oversight is exercised primarily through the Operations and Audit Committees. Appropriate personnel, including but not limited to the fund's Chief Compliance Officer (CCO), SelectCo's internal auditor, the independent accountants, the fund's Treasurer and portfolio management personnel, make periodic reports to the Board's committees, as appropriate. The responsibilities of each standing committee, including their oversight responsibilities, are described further under "Standing Committees of the Fund's Trustees."
The fund's Statement of Additional Information (SAI) includes more information about the Trustees. To request a free copy, call Fidelity at 1-877-208-0098.
Annual Report
Trustees and Officers - continued
Interested Trustee*:
Correspondence intended for the Trustee who is an interested person may be sent to Fidelity Investments, 245 Summer Street, Boston, Massachusetts 02210.
Name, Year of Birth; Principal Occupations and Other Relevant Experience+ |
Ronald P. O'Hanley (1957) |
Year of Election or Appointment: 2011 Trustee Chairman of the Board of Trustees |
| Mr. O'Hanley also serves as Trustee of other Fidelity funds. He is Director of Fidelity SelectCo, LLC (2013-present), FMR Co., Inc. (2010-present), Director of Fidelity Investments Money Management, Inc. (2010-present), Director of Fidelity Research & Analysis Company (2010-present), President of Fidelity Asset Management and Corporate Services and a Member of Fidelity's Executive Committee (2010-present). Previously, Mr. O'Hanley served as President and Chief Executive Officer of BNY Mellon Asset Management (2007-2010). Mr. O'Hanley also served as Vice Chairman of Bank New York Mellon Corp. and a member of that firm's Executive Committee. Prior to the 2007 merger of The Bank of New York and Mellon Financial Corporation, he was Vice Chairman of Mellon Financial Corporation and President and Chief Executive Officer of Mellon Asset Management. He joined Mellon in February 1997. Mr. O'Hanley currently serves as Chairman of the Boston Public Library Foundation Board of Directors and sits on the Board of Directors of Beth Israel Deaconess Medical Center, the Board of Trustees of the Marine Biological Laboratory and the Advisory Board of the Maxwell School of Citizenship and Public Administration at Syracuse University. Mr. O'Hanley also chairs the Council on Asset Management for the Financial Services Roundtable and is a member of the Board of Directors of Institutional Investor's U.S. Institute. |
* Trustee has been determined to be an "Interested Trustee" by virtue of, among other things, his affiliation with the trust or various entities under common control with SelectCo.
+ The information above includes the Trustee's principal occupation during the last five years and other information relating to the experience, attributes, and skills relevant to the Trustee's qualifications to serve as a Trustee, which led to the conclusion that the Trustee should serve as a Trustee for the fund.
Independent Trustees:
Correspondence intended for each Independent Trustee (that is, the Trustees other than the Interested Trustee) may be sent to Fidelity Investments, P.O. Box 55235, Boston, Massachusetts 02205-5235.
Name, Year of Birth; Principal Occupations and Other Relevant Experience+ |
Ned C. Lautenbach (1944) |
Year of Election or Appointment: 2000 Trustee |
| Mr. Lautenbach also serves as Trustee of other Fidelity funds. Mr. Lautenbach currently serves as the Lead Director of the Eaton Corporation Board of Directors (diversified industrial, 1997-present). Mr. Lautenbach is Chairman of the Board of Directors of the Philharmonic Center for the Arts in Naples, Florida (2012-present) and a member of the Council on Foreign Relations (1994-present). Previously, Mr. Lautenbach was a Partner/Advisory Partner at Clayton, Dubilier & Rice, LLC (private equity investment, 1998-2010), as well as a Director of Sony Corporation (2006-2007). |
David A. Rosow (1942) |
Year of Election or Appointment: 2013 Trustee |
| Mr. Rosow also serves as Trustee of other Fidelity funds. Mr. Rosow is Chairman and Chief Executive Officer of International Golf Group, Inc. (golf course development, 1989-present). Previously, Mr. Rosow served as Chairman and Chief Executive Officer of Rosow & Company, Inc. (private investment company, 1989-2011), a Lead Director of Hudson United Bancorp (2001-2006) and as a Director of TD Banknorth (1996-2006). In addition, Mr. Rosow is a member (2008-present) and President (2009-present) of the Town Council of Palm Beach, Florida. Mr. Rosow served as a Member of the Advisory Board of other Fidelity funds (2012-2013). |
Garnett A. Smith (1947) |
Year of Election or Appointment: 2013 Trustee |
| Mr. Smith also serves as Trustee of other Fidelity funds. Prior to Mr. Smith's retirement, he served as Chairman and Chief Executive Officer of Inbrand Corp. (manufacturer of personal absorbent products, 1990-1997). He also served as President (1986-1990) of Inbrand Corp. Prior to his employment with Inbrand Corp., he was employed by a retail fabric chain and North Carolina National Bank. In addition, Mr. Smith is a board member of the Jackson Hole Land Trust (2009-present). Mr. Smith served as a Member of the Advisory Board of other Fidelity funds (2012-2013). |
William S. Stavropoulos (1939) |
Year of Election or Appointment: 2001 Trustee |
| Mr. Stavropoulos also serves as Trustee of other Fidelity funds. Mr. Stavropoulos serves as President and Founder of the Michigan Baseball Foundation, the Great Lakes Loons (2007-present). Mr. Stavropoulos is Chairman Emeritus of the Board of Directors of The Dow Chemical Company, where he previously served in numerous senior management positions, including President, CEO (1995-2000; 2002-2004), Chairman of the Executive Committee (2000-2006), and as a member of the Board of Directors (1990-2006). Currently, Mr. Stavropoulos is Chairman of the Board of Directors of Univar Inc. (global distributor of commodity and specialty chemicals), a Director of Teradata Corporation (data warehousing and technology solutions), and Maersk Inc. (industrial conglomerate), and a member of the Advisory Board for Metalmark Capital LLC (private equity investment, 2005-present). Mr. Stavropoulos is an operating advisor to Clayton, Dubilier & Rice, LLC (private equity investment). In addition, Mr. Stavropoulos is a member of the University of Notre Dame Advisory Council for the College of Science, a Trustee of the Rollin L. Gerstacker Foundation, and a Director of the Naples Philharmonic Center for the Arts. Previously, Mr. Stavropoulos served as a Director of Chemical Financial Corporation (bank holding company, 1993-2012) and Tyco International, Ltd. (multinational manufacturing and services, 2007-2012). |
Michael E. Wiley (1950) |
Year of Election or Appointment: 2008 Trustee Chairman of the Independent Trustees |
| Mr. Wiley also serves as Trustee of other Fidelity funds. Mr. Wiley serves as a Director of Asia Pacific Exploration Consolidated (international oil and gas exploration and production, 2008-present). Mr. Wiley serves as a Director of Tesoro Corporation (independent oil refiner and marketer, 2005-present), and a Director of Bill Barrett Corporation (exploration and production, 2005-present). In addition, Mr. Wiley also serves as a Director of Post Oak Bank (privately-held bank, 2004-present). Previously, Mr. Wiley served as a Trustee of other Fidelity funds (2008-2013), as a member of the Board of Trustees of the University of Tulsa (2000-2006; 2007-2010), as a Senior Energy Advisor of Katzenbach Partners, LLC (consulting, 2006-2007), as an Advisory Director of Riverstone Holdings (private investment), Chairman, President, and CEO of Baker Hughes, Inc. (oilfield services, 2000-2004), and as Director of Spinnaker Exploration Company (exploration and production, 2001-2005). |
+ The information above includes each Trustee's principal occupation during the last five years and other information relating to the experience, attributes, and skills relevant to each Trustee's qualifications to serve as a Trustee, which led to the conclusion that each Trustee should serve as a Trustee for the fund.
Officers:
Except for Anthony R. Rochte, correspondence intended for each officer may be sent to Fidelity Investments, 245 Summer Street, Boston, Massachusetts 02210. Correspondence intended for Mr. Rochte may be sent to SelectCo, 1225 17th Street, Denver, Colorado 80202-5541. Officers appear below in alphabetical order.
Name, Year of Birth; Principal Occupation |
Christopher S. Bartel (1971) |
Year of Election or Appointment: 2009 Vice President |
| Mr. Bartel also serves as Vice President of other funds. Mr. Bartel serves as a Director, President, and Chief Executive Officer of Fidelity Management & Research (Japan) Inc. (2012-present), a Director of Fidelity Management & Research (Hong Kong) (2012-present), and Senior Vice President of Global Equity Research (2010-present). Previously, Mr. Bartel served as Senior Vice President of Equity Research (2009-2010), Managing Director of Research (2006-2009), and an analyst and portfolio manager (2000-2006). |
Elizabeth Paige Baumann (1968) |
Year of Election or Appointment: 2012 Anti-Money Laundering (AML) Officer |
| Ms. Baumann also serves as AML Officer of other funds. She is Chief AML Officer of FMR LLC (2012-present) and is an employee of Fidelity Investments. Previously, Ms. Baumann served as Vice President and Deputy Anti-Money Laundering Officer (2007-2012). |
Marc Bryant (1966) |
Year of Election or Appointment: 2013 Secretary and Chief Legal Officer (CLO) |
| Mr. Bryant also serves as an officer of other funds. He is Senior Vice President and Deputy General Counsel of FMR LLC. Prior to joining Fidelity Investments, Mr. Bryant served as a Senior Vice President and the Head of Global Retail Legal for AllianceBernstein L.P. (2006-2010), and as the General Counsel for ProFund Advisors LLC (2001-2006). |
William C. Coffey (1969) |
Year of Election or Appointment: 2009 Assistant Secretary |
| Mr. Coffey also serves as Assistant Secretary of other funds. He is Senior Vice President and Deputy General Counsel of FMR LLC (2010-present), and is an employee of Fidelity Investments. Previously, Mr. Coffey served as Vice President and Associate General Counsel of FMR LLC (2005-2009). |
Jonathan Davis (1968) |
Year of Election or Appointment: 2010 Assistant Treasurer |
| Mr. Davis also serves as Assistant Treasurer of other funds. Mr. Davis is an employee of Fidelity Investments. Previously, Mr. Davis served as Vice President and Associate General Counsel of FMR LLC (2003-2010). |
Adrien E. Deberghes (1967) |
Year of Election or Appointment: 2013 President and Treasurer |
| Mr. Deberghes also serves as an officer of other funds. He is an employee of Fidelity Investments (2008-present). Prior to joining Fidelity Investments, Mr. Deberghes was Senior Vice President of Mutual Fund Administration at State Street Corporation (2007-2008), Senior Director of Mutual Fund Administration at Investors Bank & Trust (2005-2007), and Director of Finance for Dunkin' Brands (2000-2005). |
Stephanie J. Dorsey (1969) |
Year of Election or Appointment: 2010 Assistant Treasurer |
| Ms. Dorsey also serves as an officer of other funds. She is an employee of Fidelity Investments (2008-present) and has served in other fund officer roles. Prior to joining Fidelity Investments, Ms. Dorsey served as Treasurer (2004-2008) of the JPMorgan Mutual Funds and Vice President (2004-2008) of JPMorgan Chase Bank. |
Joseph A. Hanlon (1968) |
Year of Election or Appointment: 2012 Chief Compliance Officer |
| Mr. Hanlon also serves as Chief Compliance Officer of other funds. Mr. Hanlon serves as Compliance Officer of FMR, FMR Co., Inc., Fidelity Investments Money Management, Inc. (FIMM), Fidelity Research and Analysis Company (FRAC), and Fidelity Management & Research (Hong Kong) (2009-present), as Senior Vice President of the Fidelity Asset Management Division (2009-present), and is an employee of Fidelity Investments. Previously, Mr. Hanlon served as Compliance Officer of Fidelity Management & Research (Japan) Inc. (2009-2013), Strategic Advisers, Inc. (2009-2013), and Fidelity Management & Research (U.K.) Inc. (2009-2013). |
Brian B. Hogan (1964) |
Year of Election or Appointment: 2009 Vice President |
| Mr. Hogan also serves as Vice President of other funds. Mr. Hogan serves as President of FMR's Equity Division (2009-present). Previously, Mr. Hogan served as Senior Vice President, Equity Research of FMR (2006-2009) and as a portfolio manager. |
Chris Maher (1972) |
Year of Election or Appointment: 2013 Assistant Treasurer |
| Mr. Maher serves as Assistant Treasurer of other funds. Mr. Maher is Vice President of Valuation Oversight and is an employee of Fidelity Investments. Previously, Mr. Maher served as Vice President of Asset Management Compliance (2013), Vice President of FMR's Program Management Group (2010-2013), and Vice President of Valuation Oversight (2008-2010). |
Christine Reynolds (1958) |
Year of Election or Appointment: 2008 Chief Financial Officer |
| Ms. Reynolds also serves as Chief Financial Officer of other funds. Ms. Reynolds became President of Fidelity Pricing and Cash Management Services (FPCMS) in August 2008. Ms. Reynolds served as Chief Operating Officer of FPCMS (2007-2008). Previously, Ms. Reynolds served as President, Treasurer, and Anti-Money Laundering officer of the Fidelity funds (2004-2007). |
Kenneth B. Robins (1969) |
Year of Election or Appointment: 2013 Deputy Treasurer |
| Mr. Robins also serves as an officer of other funds. Mr. Robins serves as Executive Vice President of Fidelity Investments Money Management, Inc. (FIMM) (2013-present) and is an employee of Fidelity Investments (2004-present). Previously, Mr. Robins served in other fund officer roles. |
Anthony R. Rochte (1968) |
Year of Election or Appointment: 2013 Vice President |
| Mr. Rochte also serves as Vice President of other funds. Mr. Rochte serves as President of Fidelity SelectCo, LLC (2012-present) and is an employee of Fidelity Investments (2012-present). Prior to joining Fidelity Investments, Mr. Rochte served as Senior Managing Director and head of State Street Global Advisors' North American Intermediary Business Group (2006-2012). |
Stacie M. Smith (1974) |
Year of Election or Appointment: 2013 Assistant Treasurer |
| Ms. Smith also serves as an officer of other funds. She is an employee of Fidelity Investments (2009-present) and has served in other fund officer roles. Prior to joining Fidelity Investments, Ms. Smith served as Senior Audit Manager of Ernst & Young LLP (1996-2009). |
Renee Stagnone (1975) |
Year of Election or Appointment: 2013 Deputy Treasurer |
| Ms. Stagnone also serves as Deputy Treasurer of other funds. Ms. Stagnone is an employee of Fidelity Investments. |
Joseph F. Zambello (1957) |
Year of Election or Appointment: 2011 Deputy Treasurer |
| Mr. Zambello also serves as Deputy Treasurer of other funds. Mr. Zambello is an employee of Fidelity Investments. Previously, Mr. Zambello served as Vice President of FMR's Program Management Group (2009-2011) and Vice President of the Transfer Agent Oversight Group (2005-2009). |
Annual Report
The Board of Trustees of VIP Materials Portfolio voted to pay to shareholders of record at the opening of business on record date, the following distributions per share derived from capital gains realized from sales of portfolio securities:
| Pay Date | Record Date | Capital Gains |
Initial Class | 02/14/2014 | 02/14/2014 | $0.595 |
Investor Class | 02/14/2014 | 02/14/2014 | $0.595 |
The fund hereby designates as a capital gain dividend with respect to the taxable year ended December 31, 2013, $2,744,378 or, if subsequently determined to be different, the net capital gain of such year.
Initial Class designates 58% and Investor Class designates 60% of the dividends distributed in December 2013, as qualifying for the dividends-received deduction for corporate shareholders.
Annual Report
A special meeting of Materials Portfolio's shareholders was held on May 14, 2013. The results of votes taken among shareholders on the proposals before them are reported below. Each vote reported represents one dollar of net asset value held on the record date for the meeting.
PROPOSAL 1 |
To elect a Board of Trustees.A |
| # of
Votes | % of
Votes |
Ned C. Lautenbach |
Affirmative | 1,555,133,782.46 | 93.955 |
Withheld | 100,063,694.32 | 6.045 |
TOTAL | 1,655,197,476.78 | 100.000 |
Ronald P. O'Hanley |
Affirmative | 1,557,988,095.28 | 94.128 |
Withheld | 97,209,381.50 | 5.872 |
TOTAL | 1,655,197,476.78 | 100.000 |
David A. Rosow |
Affirmative | 1,552,645,347.31 | 93.805 |
Withheld | 102,552,129.47 | 6.195 |
TOTAL | 1,655,197,476.78 | 100.000 |
Garnett A. Smith |
Affirmative | 1,554,582,880.53 | 93.922 |
Withheld | 100,614,596.25 | 6.078 |
TOTAL | 1,655,197,476.78 | 100.000 |
William S. Stavropoulos |
Affirmative | 1,548,352,452.21 | 93.545 |
Withheld | 106,845,024.57 | 6.455 |
TOTAL | 1,655,197,476.78 | 100.000 |
Michael E. Wiley |
Affirmative | 1,556,790,374.70 | 94.055 |
Withheld | 98,407,102.08 | 5.945 |
TOTAL | 1,655,197,476.78 | 100.000 |
PROPOSAL 2 |
To approve a management contract between the fund and Fidelity SelectCo, LLC. |
| # of
Votes | % of
Votes |
Affirmative | 78,893,232.34 | 93.473 |
Against | 2,921,187.66 | 3.461 |
Abstain | 2,587,838.70 | 3.066 |
TOTAL | 84,402,258.70 | 100.000 |
A Denotes trust-wide proposal and voting results. |
[Semiannual/Annual] Report
Annual Report
Investment Adviser
Fidelity SelectCo, LLC
Denver, CO
Investment Sub-Advisers
FMR Co., Inc.
Fidelity Management & Research (U.K.) Inc.
Fidelity Management & Research (Hong Kong) Limited
Fidelity Management & Research (Japan) Inc.
General Distributor
Fidelity Distributors Corporation
Smithfield, RI
Transfer and Service Agents
Fidelity Investments Institutional Operations Company, Inc.
Boston, MA
Fidelity Service Company, Inc.
Boston, MA
Custodian
State Street Bank and Trust Company
Quincy, MA
VMATP-ANN-0214
1.850999.106
Fidelity® Variable Insurance Products:
Real Estate Portfolio
Annual Report
December 31, 2013
(Fidelity Cover Art)
Contents
Performance | (Click Here) | How the fund has done over time. |
Management's Discussion of Fund Performance | (Click Here) | The Portfolio Manager's review of fund performance and strategy. |
Shareholder Expense Example | (Click Here) | An example of shareholder expenses. |
Investment Changes | (Click Here) | A summary of major shifts in the fund's investments over the past six months. |
Investments | (Click Here) | A complete list of the fund's investments with their market values. |
Financial Statements | (Click Here) | Statements of assets and liabilities, operations, and changes in net assets, as well as financial highlights. |
Notes | (Click Here) | Notes to the financial statements. |
Report of Independent Registered Public Accounting Firm | (Click Here) | |
Trustees and Officers | (Click Here) | |
Distributions | (Click Here) | |
Proxy Voting Results | (Click Here) | |
To view a fund's proxy voting guidelines and proxy voting record for the 12-month period ended June 30, visit http://www.fidelity.com/proxyvotingresults or visit the Securities and Exchange Commission's (SEC) web site at http://www.sec.gov. You may also call 1-877-208-0098 to request a free copy of the proxy voting guidelines.
Fidelity® Variable Insurance Products are separate account options which are purchased through a variable insurance contract.
Standard & Poor's, S&P and S&P 500 are registered service marks of The McGraw-Hill Companies, Inc. and have been licensed for use by Fidelity Distributors Corporation.
Other third-party marks appearing herein are the property of their respective owners.
All other marks appearing herein are registered or unregistered trademarks or service marks of FMR LLC or an affiliated company. © 2014 FMR LLC. All rights reserved.
This report and the financial statements contained herein are submitted for the general information of the shareholders of the fund. This report is not authorized for distribution to prospective investors in the fund unless preceded or accompanied by an effective prospectus.
A fund files its complete schedule of portfolio holdings with the SEC for the first and third quarters of each fiscal year on Form N-Q. Forms N-Q are available on the SEC's web site at http://www.sec.gov. A fund's Forms N-Q may be reviewed and copied at the SEC's Public Reference Room in Washington, DC. Information regarding the operation of the SEC's Public Reference Room may be obtained by calling 1-800-SEC-0330. For a complete list of a fund's portfolio holdings, view the most recent holdings listing, semiannual report, or annual report on Fidelity's web site at http://www.fidelity.com, http://www.advisor.fidelity.com, or http://www.401k.com as applicable.
NOT FDIC INSURED • MAY LOSE VALUE • NO BANK GUARANTEE
Neither the fund nor Fidelity Distributors Corporation is a bank.
Annual Report
Average annual total return reflects the change in the value of an investment, assuming reinvestment of the class' distributions from dividend income and capital gains (the profits earned upon the sale of securities that have grown in value, if any) and assuming a constant rate of performance each year. During periods of reimbursement by Fidelity, a fund's total return will be greater than it would be had the reimbursement not occurred. Performance numbers are net of all underlying fund operating expenses, but do not include any insurance charges imposed by your insurance company's separate account. If performance information included the effect of these additional charges, the total returns would have been lower. How a fund did yesterday is no guarantee of how it will do tomorrow.
Average Annual Total Returns
Periods ended December 31, 2013 | Past 1
year | Past 5
years | Past 10
years |
VIP Real Estate Portfolio - Initial Class | 1.82% | 18.57% | 9.37% |
VIP Real Estate Portfolio - Service Class | 1.73% | 18.47% | 9.27% |
VIP Real Estate Portfolio - Service Class 2 | 1.61% | 18.29% | 9.09% |
VIP Real Estate Portfolio - Investor Class A | 1.81% | 18.47% | 9.28% |
A The initial offering of Investor Class shares took place on July 21, 2005. Returns prior to July 21, 2005, are those of Initial Class. Had Investor Class's transfer agent fee been reflected, returns prior to July 21, 2005, would have been lower.
$10,000 Over 10 Years
Let's say hypothetically that $10,000 was invested in VIP Real Estate Portfolio - Initial Class on December 31, 2003. The chart shows how the value of your investment would have changed, and also shows how the S&P 500® Index performed over the same period.
Annual Report
Market Recap: Global equity markets remained upbeat for the 12 months ending December 31, 2013, propelling the MSCI® ACWI® (All Country World Index) Index to a 23.24% return. Midyear turbulence gave way by autumn when policymakers in the U.S. and China had made clear their intentions to maintain accommodative monetary policies. That stance, combined with modest cyclical improvement around the globe and generally low valuations, underpinned the broad rally in equities, although the relative strength of the U.S. dollar generally tempered gains for U.S. investors holding foreign securities based in local currencies. During the period, the broad-market S&P 500® Index set a series of new highs, finishing the year up 32.39%. For the first time since 1995, the S&P® scored a "perfect 10," with all 10 economic sectors gaining at least 10% for the year. A resurgence in growth-oriented stocks lifted the Nasdaq Composite Index® to a 40.12% result for 2013, while the blue-chip Dow Jones Industrial AverageSM notched a relatively more modest 29.65% gain. International developed-markets equities rose in concert with their U.S. counterparts, with the MSCI® EAFE® Index gaining 22.92% for the period. Meanwhile, foreign exchange and commodity weakness curbed results in resource-heavy emerging markets (EM), especially in the year's waning months. More generally, concern over EM's slowing growth, its declining share of global trade and uncertainty surrounding U.S. central bank intentions were all factors hampering performance. The MSCI Emerging Markets Index returned -2.27% for the period. On the bond side, U.S. high-yield securities rallied with equities for much of the period, with The BofA Merrill LynchSM US High Yield Constrained Index returning 7.41% for 2013. The more rate-sensitive U.S. investment-grade bond category faced headwinds though, as reflected in the -2.02% return of the Barclays® U.S. Aggregate Bond Index. Within the Barclays index, investment-grade corporate credit returned -2.01%, while ultra-safe U.S. Treasuries saw a -2.75% result. Major non-U.S. developed markets performed only slightly better, with the Citigroup® Non-USD Group-of-Seven (G7) Equal Weighted Index logging a -1.59% result. After several years of strong advances, EM debt reversed course in 2013, with the J.P. Morgan Emerging Markets Bond Index Global returning -6.58%.
Comments from Samuel Wald, Portfolio Manager of VIP Real Estate Portfolio: For the year, the fund's share classes modestly outpaced the 1.31% gain of the Dow Jones U.S. Select Real Estate Securities IndexSM but substantially trailed the broad equity market, as measured by the S&P 500® Index. (For specific portfolio results, please refer to the performance section of this report.) Relative to the Dow Jones benchmark, the fund benefited from good stock picking in the industrial/office and real-estate related (mostly health care) categories, while the fund's hotel real estate investment trust (REIT) positioning was detrimental. The top individual contribution came from data-center operator Digital Realty Trust, a lagging benchmark component to which the fund had minimal exposure. After conducting thorough research on Digital Realty, we concluded that its leasing rates were likely to lag Wall Street analysts' expectations and, accordingly, chose to sell the stock, which added to the fund's relative performance as this situation we had anticipated came to pass. Meanwhile, the fund was overweighted in SL Green Realty, primarily an owner of Manhattan office properties. Based on our expectations for growth in the company's rental income, we determined the shares were undervalued, and over time the market came to share our assessment. As the stock rose, I trimmed the fund's stake - while remaining overweighted in the stock - and reinvested the proceeds in other office REITs that better met my valuation criteria. In contrast, the biggest individual detractor was diversified REIT Vornado Realty Trust, a strong-performing benchmark component in which the fund was underweighted. As part of our research process, I maintained some skepticism about the company's turnaround efforts and also was concerned about its exposure to the Washington, D.C., region, where declining federal spending threatens to weigh on real estate demand. Another detractor was Camden Property Trust, which, along with other apartment REITs, struggled amid slowing growth rates and rising supply. I reduced the fund's stake in Camden, as I saw better opportunities elsewhere.
The views expressed above reflect those of the portfolio manager(s) only through the end of the period as stated on the cover of this report and do not necessarily represent the views of Fidelity or any other person in the Fidelity organization. Any such views are subject to change at any time based upon market or other conditions and Fidelity disclaims any responsibility to update such views. These views may not be relied on as investment advice and, because investment decisions for a Fidelity fund are based on numerous factors, may not be relied on as an indication of trading intent on behalf of any Fidelity fund.
Annual Report
As a shareholder of the Fund, you incur two types of costs: (1) transaction costs, and (2) ongoing costs, including management fees, distribution and/or service (12b-1) fees and other Fund expenses. This Example is intended to help you understand your ongoing costs (in dollars) of investing in the Fund and to compare these costs with the ongoing costs of investing in other mutual funds.
The Example is based on an investment of $1,000 invested at the beginning of the period and held for the entire period (July 1, 2013 to December 31, 2013).
Actual Expenses
The first line of the accompanying table for each class of the Fund provides information about actual account values and actual expenses. You may use the information in this line, together with the amount you invested, to estimate the expenses that you paid over the period. Simply divide your account value by $1,000.00 (for example, an $8,600 account value divided by $1,000.00 = 8.6), then multiply the result by the number in the first line for a class of the Fund under the heading entitled "Expenses Paid During Period" to estimate the expenses you paid on your account during this period. The estimate of expenses does not include any fees or other expenses of any variable annuity or variable life insurance product. If they were, the estimate of expenses you paid during the period would be higher, and your ending account value would be lower. In addition, the Fund, as a shareholder in the underlying Fidelity Central Funds, will indirectly bear its pro-rata share of the fees and expenses incurred by the underlying Fidelity Central Funds. These fees and expenses are not included in the Fund's annualized expense ratio used to calculate the expense estimate in the table below.
Hypothetical Example for Comparison Purposes
The second line of the accompanying table for each class of the Fund provides information about hypothetical account values and hypothetical expenses based on a Class' actual expense ratio and an assumed rate of return of 5% per year before expenses, which is not the Class' actual return. The hypothetical account values and expenses may not be used to estimate the actual ending account balance or expenses you paid for the period. You may use this information to compare the ongoing costs of investing in the Fund and other funds. To do so, compare this 5% hypothetical example with the 5% hypothetical examples that appear in the shareholder reports of the other funds. The estimate of expenses does not include any fees or other expenses of any variable annuity or variable life insurance product. If they were, the estimate of expenses you paid during the period would be higher, and your ending account value would be lower. In addition, the Fund, as a shareholder in the underlying Fidelity Central Funds, will indirectly bear its pro-rata share of the fees and expenses incurred by the underlying Fidelity Central Funds. These fees and expenses are not included in the Fund's annualized expense ratio used to calculate the expense estimate in the table below.
Please note that the expenses shown in the table are meant to highlight your ongoing costs only and do not reflect any transaction costs. Therefore, the second line of the table is useful in comparing ongoing costs only, and will not help you determine the relative total costs of owning different funds.
| Annualized
Expense RatioB | Beginning
Account Value
July 1, 2013 | Ending
Account Value
December 31, 2013 | Expenses Paid
During Period*
July 1, 2013
to December 31, 2013 |
Initial Class | .68% | | | |
Actual | | $ 1,000.00 | $ 964.20 | $ 3.37 |
HypotheticalA | | $ 1,000.00 | $ 1,021.78 | $ 3.47 |
Service Class | .78% | | | |
Actual | | $ 1,000.00 | $ 963.80 | $ 3.86 |
HypotheticalA | | $ 1,000.00 | $ 1,021.27 | $ 3.97 |
Service Class 2 | .93% | | | |
Actual | | $ 1,000.00 | $ 963.20 | $ 4.60 |
HypotheticalA | | $ 1,000.00 | $ 1,020.52 | $ 4.74 |
Investor Class | .76% | | | |
Actual | | $ 1,000.00 | $ 964.30 | $ 3.76 |
HypotheticalA | | $ 1,000.00 | $ 1,021.37 | $ 3.87 |
A 5% return per year before expenses
B Annualized expense ratio reflects expenses net of applicable fee waivers.
* Expenses are equal to each Class' annualized expense ratio, multiplied by the average account value over the period, multiplied by 184/365 (to reflect the one-half year period).
Annual Report
Investment Changes (Unaudited)
Top Ten Stocks as of December 31, 2013 |
| % of fund's
net assets | % of fund's net assets
6 months ago |
Simon Property Group, Inc. | 13.2 | 12.1 |
Public Storage | 6.5 | 7.0 |
Prologis, Inc. | 6.2 | 6.1 |
Ventas, Inc. | 6.2 | 7.2 |
Boston Properties, Inc. | 5.4 | 4.4 |
SL Green Realty Corp. | 4.4 | 4.5 |
Essex Property Trust, Inc. | 3.9 | 3.5 |
Mid-America Apartment Communities, Inc. | 3.6 | 0.0 |
Alexandria Real Estate Equities, Inc. | 3.5 | 3.0 |
Equity Residential (SBI) | 3.1 | 3.2 |
| 56.0 | |
Top Five REIT Sectors as of December 31, 2013 |
| % of fund's
net assets | % of fund's net assets
6 months ago |
REITs - Office Buildings | 19.0 | 17.7 |
REITs - Apartments | 16.1 | 17.0 |
REITs - Malls | 15.1 | 15.4 |
REITs - Industrial Buildings | 15.0 | 15.6 |
REITs - Health Care Facilities | 10.6 | 12.7 |
Asset Allocation (% of fund's net assets) |
As of December 31, 2013 | As of June 30, 2013 |
 | Stocks 97.5% | | | Stocks 97.7% | |
 | Short-Term
Investments and
Net Other Assets (Liabilities) 2.5% | | | Short-Term
Investments and
Net Other Assets (Liabilities) 2.3% | |

Annual Report
Investments December 31, 2013
Showing Percentage of Net Assets
Common Stocks - 97.5% |
| Shares | | Value |
HEALTH CARE PROVIDERS & SERVICES - 1.3% |
Health Care Facilities - 1.3% |
Emeritus Corp. (a) | 225,632 | | $ 4,880,420 |
REAL ESTATE INVESTMENT TRUSTS - 94.8% |
REITs - Apartments - 16.1% |
AvalonBay Communities, Inc. | 81,442 | | 9,628,888 |
Camden Property Trust (SBI) | 111,856 | | 6,362,369 |
Equity Residential (SBI) | 214,570 | | 11,129,746 |
Essex Property Trust, Inc. (d) | 98,208 | | 14,093,830 |
Mid-America Apartment Communities, Inc. | 216,047 | | 13,122,695 |
UDR, Inc. | 192,100 | | 4,485,535 |
TOTAL REITS - APARTMENTS | | 58,823,063 |
REITs - Health Care Facilities - 10.6% |
HCP, Inc. | 269,025 | | 9,770,988 |
Health Care REIT, Inc. | 119,278 | | 6,389,722 |
Ventas, Inc. | 394,610 | | 22,603,261 |
TOTAL REITS - HEALTH CARE FACILITIES | | 38,763,971 |
REITs - Hotels - 6.4% |
Chesapeake Lodging Trust | 86,293 | | 2,182,350 |
FelCor Lodging Trust, Inc. | 162,000 | | 1,321,920 |
Host Hotels & Resorts, Inc. | 404,278 | | 7,859,164 |
LaSalle Hotel Properties (SBI) | 310,692 | | 9,587,955 |
Sunstone Hotel Investors, Inc. | 184,314 | | 2,469,808 |
TOTAL REITS - HOTELS | | 23,421,197 |
REITs - Industrial Buildings - 15.0% |
DuPont Fabros Technology, Inc. (d) | 112,059 | | 2,768,978 |
First Industrial Realty Trust, Inc. | 300,212 | | 5,238,699 |
Prologis, Inc. | 612,037 | | 22,614,767 |
Public Storage | 156,655 | | 23,579,711 |
Terreno Realty Corp. | 32,901 | | 582,348 |
TOTAL REITS - INDUSTRIAL BUILDINGS | | 54,784,503 |
REITs - Malls - 15.1% |
CBL & Associates Properties, Inc. | 132,117 | | 2,372,821 |
General Growth Properties, Inc. | 185,397 | | 3,720,918 |
Simon Property Group, Inc. | 316,399 | | 48,143,272 |
The Macerich Co. | 11,239 | | 661,865 |
TOTAL REITS - MALLS | | 54,898,876 |
REITs - Management/Investment - 3.7% |
American Tower Corp. | 24,000 | | 1,915,680 |
Coresite Realty Corp. | 97,600 | | 3,141,744 |
|
| Shares | | Value |
Equity Lifestyle Properties, Inc. | 95,794 | | $ 3,470,617 |
Weyerhaeuser Co. | 156,463 | | 4,939,537 |
TOTAL REITS - MANAGEMENT/INVESTMENT | | 13,467,578 |
REITs - Mobile Home Parks - 0.7% |
Sun Communities, Inc. | 60,099 | | 2,562,621 |
REITs - Office Buildings - 19.0% |
Alexandria Real Estate Equities, Inc. | 198,479 | | 12,627,234 |
Boston Properties, Inc. | 197,577 | | 19,830,803 |
Cousins Properties, Inc. | 793,900 | | 8,177,170 |
Kilroy Realty Corp. | 110,800 | | 5,559,944 |
Piedmont Office Realty Trust, Inc.Class A (d) | 433,100 | | 7,154,812 |
SL Green Realty Corp. | 172,559 | | 15,941,000 |
TOTAL REITS - OFFICE BUILDINGS | | 69,290,963 |
REITs - Shopping Centers - 8.2% |
Acadia Realty Trust (SBI) | 170,395 | | 4,230,908 |
Cedar Shopping Centers, Inc. | 332,298 | | 2,080,185 |
Equity One, Inc. | 381,758 | | 8,566,650 |
Excel Trust, Inc. | 46,062 | | 524,646 |
Federal Realty Investment Trust (SBI) | 9,400 | | 953,254 |
Glimcher Realty Trust | 770,887 | | 7,215,502 |
Kite Realty Group Trust | 407,315 | | 2,676,060 |
Vornado Realty Trust | 39,710 | | 3,525,851 |
TOTAL REITS - SHOPPING CENTERS | | 29,773,056 |
TOTAL REAL ESTATE INVESTMENT TRUSTS | | 345,785,828 |
REAL ESTATE MANAGEMENT & DEVELOPMENT - 1.4% |
Real Estate Operating Companies - 1.4% |
Forest City Enterprises, Inc. Class A (a) | 255,720 | | 4,884,252 |
TOTAL COMMON STOCKS (Cost $301,589,680) |
355,550,500
|
Money Market Funds - 4.9% |
| Shares | | Value |
Fidelity Cash Central Fund, 0.11% (b) | 4,147,255 | | $ 4,147,255 |
Fidelity Securities Lending Cash Central Fund, 0.11% (b)(c) | 13,872,575 | | 13,872,575 |
TOTAL MONEY MARKET FUNDS (Cost $18,019,830) |
18,019,830
|
TOTAL INVESTMENT PORTFOLIO - 102.4% (Cost $319,609,510) | | 373,570,330 |
NET OTHER ASSETS (LIABILITIES) - (2.4)% | | (8,930,355) |
NET ASSETS - 100% | $ 364,639,975 |
Legend |
(a) Non-income producing |
(b) Affiliated fund that is generally available only to investment companies and other accounts managed by Fidelity Investments. The rate quoted is the annualized seven-day yield of the fund at period end. A complete unaudited listing of the fund's holdings as of its most recent quarter end is available upon request. In addition, each Fidelity Central Fund's financial statements, which are not covered by the Fund's Report of Independent Registered Public Accounting Firm, are available on the SEC's website or upon request. |
(c) Investment made with cash collateral received from securities on loan. |
(d) Security or a portion of the security is on loan at period end. |
Affiliated Central Funds |
Information regarding fiscal year to date income earned by the Fund from investments in Fidelity Central Funds is as follows: |
Fund | Income earned |
Fidelity Cash Central Fund | $ 12,269 |
Fidelity Securities Lending Cash Central Fund | 11,892 |
Total | $ 24,161 |
Other Information |
All investments are categorized as level 1 under the Fair Value Hierarchy. The inputs or methodology used for valuing securities may not be an indication of the risk associated with investing in those securities. For more information on valuation inputs, please refer to the Investment Valuation section in the accompanying Notes to Financial Statements. |
See accompanying notes which are an integral part of the financial statements.
Annual Report
Statement of Assets and Liabilities
| December 31, 2013 |
| | |
Assets | | |
Investment in securities, at value (including securities loaned of $13,468,595) - See accompanying schedule: Unaffiliated issuers (cost $301,589,680) | $ 355,550,500 | |
Fidelity Central Funds (cost $18,019,830) | 18,019,830 | |
Total Investments (cost $319,609,510) | | $ 373,570,330 |
Receivable for investments sold | | 1,378,057 |
Receivable for fund shares sold | | 7,257,600 |
Dividends receivable | | 1,744,301 |
Distributions receivable from Fidelity Central Funds | | 1,118 |
Prepaid expenses | | 3,114 |
Other receivables | | 50,912 |
Total assets | | 384,005,432 |
| | |
Liabilities | | |
Payable for investments purchased | $ 4,878,553 | |
Payable for fund shares redeemed | 329,320 | |
Accrued management fee | 164,587 | |
Distribution and service plan fees payable | 33,170 | |
Other affiliated payables | 41,115 | |
Other payables and accrued expenses | 46,137 | |
Collateral on securities loaned, at value | 13,872,575 | |
Total liabilities | | 19,365,457 |
| | |
Net Assets | | $ 364,639,975 |
Net Assets consist of: | | |
Paid in capital | | $ 308,975,799 |
Distributions in excess of net investment income | | (321,789) |
Accumulated undistributed net realized gain (loss) on investments | | 2,025,145 |
Net unrealized appreciation (depreciation) on investments | | 53,960,820 |
Net Assets | | $ 364,639,975 |
Statement of Assets and Liabilities - continued
| December 31, 2013 |
| | |
Initial Class:
Net Asset Value, offering price and redemption price per share ($57,396,440 ÷ 3,509,521 shares) | | $ 16.35 |
| | |
Service Class:
Net Asset Value, offering price and redemption price per share ($3,254,844 ÷ 199,441 shares) | | $ 16.32 |
| | |
Service Class 2:
Net Asset Value, offering price and redemption price per share ($165,133,672 ÷ 10,219,679 shares) | | $ 16.16 |
| | |
Investor Class:
Net Asset Value, offering price and redemption price per share ($138,855,019 ÷ 8,525,641 shares) | | $ 16.29 |
See accompanying notes which are an integral part of the financial statements.
Annual Report
Statement of Operations
| Year ended December 31, 2013 |
| | |
Investment Income | | |
Dividends | | $ 9,062,974 |
Income from Fidelity Central Funds | | 24,161 |
Total income | | 9,087,135 |
| | |
Expenses | | |
Management fee | $ 2,190,537 | |
Transfer agent fees | 412,062 | |
Distribution and service plan fees | 402,282 | |
Accounting and security lending fees | 154,539 | |
Custodian fees and expenses | 33,876 | |
Independent trustees' compensation | 6,171 | |
Audit | 45,496 | |
Legal | 6,553 | |
Miscellaneous | 4,170 | |
Total expenses before reductions | 3,255,686 | |
Expense reductions | (30,244) | 3,225,442 |
Net investment income (loss) | | 5,861,693 |
Realized and Unrealized Gain (Loss) Net realized gain (loss) on: | | |
Investment securities: | | |
Unaffiliated issuers | | 19,049,450 |
Change in net unrealized appreciation (depreciation) on investment securities | | (20,971,966) |
Net gain (loss) | | (1,922,516) |
Net increase (decrease) in net assets resulting from operations | | $ 3,939,177 |
Statement of Changes in Net Assets
| Year ended
December 31, 2013 | Year ended
December 31, 2012 |
Increase (Decrease) in Net Assets | | |
Operations | | |
Net investment income (loss) | $ 5,861,693 | $ 4,528,240 |
Net realized gain (loss) | 19,049,450 | 17,698,706 |
Change in net unrealized appreciation (depreciation) | (20,971,966) | 27,481,846 |
Net increase (decrease) in net assets resulting from operations | 3,939,177 | 49,708,792 |
Distributions to shareholders from net investment income | (6,445,747) | (4,523,007) |
Distributions to shareholders from net realized gain | (17,511,569) | (6,338,776) |
Total distributions | (23,957,316) | (10,861,783) |
Share transactions - net increase (decrease) | 35,526,251 | 46,936,777 |
Total increase (decrease) in net assets | 15,508,112 | 85,783,786 |
| | |
Net Assets | | |
Beginning of period | 349,131,863 | 263,348,077 |
End of period (including distributions in excess of net investment income of $321,789 and undistributed net investment income of $311,417, respectively) | $ 364,639,975 | $ 349,131,863 |
See accompanying notes which are an integral part of the financial statements.
Annual Report
Financial Highlights - Initial Class
Years ended December 31, | 2013 | 2012 | 2011 | 2010 | 2009 |
Selected Per-Share Data | | | | | |
Net asset value, beginning of period | $ 17.22 | $ 15.02 | $ 14.06 | $ 10.93 | $ 8.13 |
Income from Investment Operations | | | | | |
Net investment income (loss) C | .29 | .27 | .23 | .15 | .24 |
Net realized and unrealized gain (loss) | - G | 2.50 | .90 | 3.16 | 2.80 |
Total from investment operations | .29 | 2.77 | 1.13 | 3.31 | 3.04 |
Distributions from net investment income | (.33) | (.25) | (.17) | (.18) | (.24) |
Distributions from net realized gain | (.83) | (.32) | - | - | - |
Total distributions | (1.16) | (.57) | (.17) | (.18) | (.24) |
Net asset value, end of period | $ 16.35 | $ 17.22 | $ 15.02 | $ 14.06 | $ 10.93 |
Total Return A, B | 1.82% | 18.57% | 8.09% | 30.42% | 37.69% |
Ratios to Average Net Assets D, F | | | | | |
Expenses before reductions | .69% | .70% | .71% | .73% | .80% |
Expenses net of fee waivers, if any | .68% | .70% | .71% | .73% | .80% |
Expenses net of all reductions | .68% | .69% | .70% | .72% | .80% |
Net investment income (loss) | 1.61% | 1.58% | 1.58% | 1.22% | 3.01% |
Supplemental Data | | | | | |
Net assets, end of period (000 omitted) | $ 57,396 | $ 71,364 | $ 54,874 | $ 56,893 | $ 41,714 |
Portfolio turnover rate E | 59% | 52% | 61% | 64% | 94% |
A Total returns do not reflect charges attributable to your insurance company's separate account. Inclusion of these charges would reduce the total returns shown.
B Total returns would have been lower if certain expenses had not been reduced during the applicable periods shown.
C Calculated based on average shares outstanding during the period.
D Fees and expenses of any underlying Fidelity Central Funds are not included in the Fund's expense ratio. The Fund indirectly bears its proportionate share of the expenses of any underlying Fidelity Central Funds.
E Amount does not include the portfolio activity of any underlying Fidelity Central Funds.
F Expense ratios reflect operating expenses of the class. Expenses before reductions do not reflect amounts reimbursed by the investment adviser or reductions from brokerage service arrangements or reductions from other expense offset arrangements and do not represent the amount paid by the class during periods when reimbursements or reductions occur. Expenses net of fee waivers reflect expenses after reimbursement by the investment adviser but prior to reductions from brokerage service arrangements or other expense offset arrangements. Expenses net of all reductions represent the net expenses paid by the class.
G Amount represents less than $.01 per share.
Financial Highlights - Service Class
Years ended December 31, | 2013 | 2012 | 2011 | 2010 | 2009 |
Selected Per-Share Data | | | | | |
Net asset value, beginning of period | $ 17.20 | $ 15.00 | $ 14.04 | $ 10.91 | $ 8.11 |
Income from Investment Operations | | | | | |
Net investment income (loss) C | .27 | .25 | .22 | .14 | .23 |
Net realized and unrealized gain (loss) | .01 H | 2.51 | .89 | 3.15 | 2.80 |
Total from investment operations | .28 | 2.76 | 1.11 | 3.29 | 3.03 |
Distributions from net investment income | (.32) | (.24) | (.15) | (.16) | (.23) |
Distributions from net realized gain | (.83) | (.32) | - | - | - |
Total distributions | (1.16) G | (.56) | (.15) | (.16) | (.23) |
Net asset value, end of period | $ 16.32 | $ 17.20 | $ 15.00 | $ 14.04 | $ 10.91 |
Total Return A, B | 1.73% | 18.49% | 7.96% | 30.30% | 37.62% |
Ratios to Average Net Assets D, F | | | | | |
Expenses before reductions | .78% | .79% | .81% | .83% | .90% |
Expenses net of fee waivers, if any | .78% | .79% | .81% | .83% | .90% |
Expenses net of all reductions | .78% | .78% | .80% | .82% | .89% |
Net investment income (loss) | 1.52% | 1.49% | 1.48% | 1.12% | 2.91% |
Supplemental Data | | | | | |
Net assets, end of period (000 omitted) | $ 3,255 | $ 1,634 | $ 597 | $ 793 | $ 1,051 |
Portfolio turnover rate E | 59% | 52% | 61% | 64% | 94% |
A Total returns do not reflect charges attributable to your insurance company's separate account. Inclusion of these charges would reduce the total returns shown.
B Total returns would have been lower if certain expenses had not been reduced during the applicable periods shown.
C Calculated based on average shares outstanding during the period.
D Fees and expenses of any underlying Fidelity Central Funds are not included in the Fund's expense ratio. The Fund indirectly bears its proportionate share of the expenses of any underlying Fidelity Central Funds.
E Amount does not include the portfolio activity of any underlying Fidelity Central Funds.
F Expense ratios reflect operating expenses of the class. Expenses before reductions do not reflect amounts reimbursed by the investment adviser or reductions from brokerage service arrangements or reductions from other expense offset arrangements and do not represent the amount paid by the class during periods when reimbursements or reductions occur. Expenses net of fee waivers reflect expenses after reimbursement by the investment adviser but prior to reductions from brokerage service arrangements or other expense offset arrangements. Expenses net of all reductions represent the net expenses paid by the class.
G Total distributions of $1.16 per share is comprised of distributions from net investment income of $.324 and distributions from net realized gain of $.833 per share.
H The amount shown for a share outstanding does not correspond with the aggregate net gain (loss) on investments for the period due to the timing of sales and repurchases of shares in relation to fluctuating market values of the investments of the Fund.
See accompanying notes which are an integral part of the financial statements.
Annual Report
Financial Highlights - Service Class 2
Years ended December 31, | 2013 | 2012 | 2011 | 2010 | 2009 |
Selected Per-Share Data | | | | | |
Net asset value, beginning of period | $ 17.03 | $ 14.86 | $ 13.92 | $ 10.84 | $ 8.07 |
Income from Investment Operations | | | | | |
Net investment income (loss) C | .24 | .22 | .19 | .12 | .23 |
Net realized and unrealized gain (loss) | .01 G | 2.48 | .89 | 3.13 | 2.76 |
Total from investment operations | .25 | 2.70 | 1.08 | 3.25 | 2.99 |
Distributions from net investment income | (.29) | (.21) | (.14) | (.17) | (.22) |
Distributions from net realized gain | (.83) | (.32) | - | - | - |
Total distributions | (1.12) | (.53) | (.14) | (.17) | (.22) |
Net asset value, end of period | $ 16.16 | $ 17.03 | $ 14.86 | $ 13.92 | $ 10.84 |
Total Return A, B | 1.61% | 18.30% | 7.78% | 30.09% | 37.40% |
Ratios to Average Net Assets D, F | | | | | |
Expenses before reductions | .94% | .94% | .95% | .98% | 1.07% |
Expenses net of fee waivers, if any | .93% | .94% | .95% | .97% | 1.07% |
Expenses net of all reductions | .93% | .93% | .95% | .96% | 1.06% |
Net investment income (loss) | 1.37% | 1.33% | 1.34% | .97% | 2.74% |
Supplemental Data | | | | | |
Net assets, end of period (000 omitted) | $ 165,134 | $ 145,738 | $ 127,231 | $ 101,038 | $ 9,878 |
Portfolio turnover rate E | 59% | 52% | 61% | 64% | 94% |
A Total returns do not reflect charges attributable to your insurance company's separate account. Inclusion of these charges would reduce the total returns shown.
B Total returns would have been lower if certain expenses had not been reduced during the applicable periods shown.
C Calculated based on average shares outstanding during the period.
D Fees and expenses of any underlying Fidelity Central Funds are not included in the Fund's expense ratio. The Fund indirectly bears its proportionate share of the expenses of any underlying Fidelity Central Funds.
E Amount does not include the portfolio activity of any underlying Fidelity Central Funds.
F Expense ratios reflect operating expenses of the class. Expenses before reductions do not reflect amounts reimbursed by the investment adviser or reductions from brokerage service arrangements or reductions from other expense offset arrangements and do not represent the amount paid by the class during periods when reimbursements or reductions occur. Expenses net of fee waivers reflect expenses after reimbursement by the investment adviser but prior to reductions from brokerage service arrangements or other expense offset arrangements. Expenses net of all reductions represent the net expenses paid by the class.
G The amount shown for a share outstanding does not correspond with the aggregate net gain (loss) on investments for the period due to the timing of sales and repurchases of shares in relation to fluctuating market values of the investments of the Fund.
Financial Highlights - Investor Class
Years ended December 31, | 2013 | 2012 | 2011 | 2010 | 2009 |
Selected Per-Share Data | | | | | |
Net asset value, beginning of period | $ 17.15 | $ 14.97 | $ 14.01 | $ 10.90 | $ 8.11 |
Income from Investment Operations | | | | | |
Net investment income (loss) C | .28 | .25 | .22 | .14 | .24 |
Net realized and unrealized gain (loss) | .01 G | 2.49 | .90 | 3.14 | 2.78 |
Total from investment operations | .29 | 2.74 | 1.12 | 3.28 | 3.02 |
Distributions from net investment income | (.32) | (.24) | (.16) | (.17) | (.23) |
Distributions from net realized gain | (.83) | (.32) | - | - | - |
Total distributions | (1.15) | (.56) | (.16) | (.17) | (.23) |
Net asset value, end of period | $ 16.29 | $ 17.15 | $ 14.97 | $ 14.01 | $ 10.90 |
Total Return A, B | 1.81% | 18.42% | 8.03% | 30.25% | 37.57% |
Ratios to Average Net Assets D, F | | | | | |
Expenses before reductions | .77% | .78% | .79% | .82% | .90% |
Expenses net of fee waivers, if any | .76% | .78% | .79% | .81% | .90% |
Expenses net of all reductions | .76% | .77% | .78% | .80% | .89% |
Net investment income (loss) | 1.53% | 1.50% | 1.50% | 1.13% | 2.91% |
Supplemental Data | | | | | |
Net assets, end of period (000 omitted) | $ 138,855 | $ 130,397 | $ 80,646 | $ 62,371 | $ 33,926 |
Portfolio turnover rate E | 59% | 52% | 61% | 64% | 94% |
A Total returns do not reflect charges attributable to your insurance company's separate account. Inclusion of these charges would reduce the total returns shown.
B Total returns would have been lower if certain expenses had not been reduced during the applicable periods shown.
C Calculated based on average shares outstanding during the period.
D Fees and expenses of any underlying Fidelity Central Funds are not included in the Fund's expense ratio. The Fund indirectly bears its proportionate share of the expenses of any underlying Fidelity Central Funds.
E Amount does not include the portfolio activity of any underlying Fidelity Central Funds.
F Expense ratios reflect operating expenses of the class. Expenses before reductions do not reflect amounts reimbursed by the investment adviser or reductions from brokerage service arrangements or reductions from other expense offset arrangements and do not represent the amount paid by the class during periods when reimbursements or reductions occur. Expenses net of fee waivers reflect expenses after reimbursement by the investment adviser but prior to reductions from brokerage service arrangements or other expense offset arrangements. Expenses net of all reductions represent the net expenses paid by the class.
G The amount shown for a share outstanding does not correspond with the aggregate net gain (loss) on investments for the period due to the timing of sales and repurchases of shares in relation to fluctuating market values of the investments of the Fund.
See accompanying notes which are an integral part of the financial statements.
Annual Report
Notes to Financial Statements
For the period ended December 31, 2013
1. Organization.
VIP Real Estate Portfolio (the Fund) is a non-diversified fund of Variable Insurance Products Fund IV (the Trust) and is authorized to issue an unlimited number of shares. The Trust is registered under the Investment Company Act of 1940, as amended (the 1940 Act), as an open-end management investment company organized as a Massachusetts business trust. Shares of the Fund may only be purchased by insurance companies for the purpose of funding variable annuity or variable life insurance contracts. The Fund offers the following classes of shares: Initial Class shares, Service Class shares, Service Class 2 shares and Investor Class shares. All classes have equal rights and voting privileges, except for matters affecting a single class.
2. Investments in Fidelity Central Funds.
The Fund invests in Fidelity Central Funds, which are open-end investment companies generally available only to other investment companies and accounts managed by the investment adviser and its affiliates. The Fund's Schedule of Investments lists each of the Fidelity Central Funds held as of period end, if any, as an investment of the Fund, but does not include the underlying holdings of each Fidelity Central Fund. As an Investing Fund, the Fund indirectly bears its proportionate share of the expenses of the underlying Fidelity Central Funds.
The Money Market Central Funds seek preservation of capital and current income and are managed by Fidelity Investments Money Management, Inc. (FIMM), an affiliate of the investment adviser. Annualized expenses of the Money Market Central Funds as of their most recent shareholder report date are less than .01%.
A complete unaudited list of holdings for each Fidelity Central Fund is available upon request or at the Securities and Exchange Commission (the SEC) website at www.sec.gov. In addition, the financial statements of the Fidelity Central Funds, which are not covered by the Fund's Report of Independent Registered Public Accounting Firm, are available on the SEC website or upon request.
3. Significant Accounting Policies.
The financial statements have been prepared in conformity with accounting principles generally accepted in the United States of America (GAAP), which require management to make certain estimates and assumptions at the date of the financial statements. Actual results could differ from those estimates. Subsequent events, if any, through the date that the financial statements were issued have been evaluated in the preparation of the financial statements. The following summarizes the significant accounting policies of the Fund:
Investment Valuation. Investments are valued as of 4:00 p.m. Eastern time on the last calendar day of the period. In accordance with valuation policies and procedures approved by the Board of Trustees (the Board), the Fund attempts to obtain prices from one or more third party pricing vendors or brokers to value its investments. When current market prices, quotations or currency exchange rates are not readily available or reliable, investments will be fair valued in good faith by the Fidelity SelectCo, LLC (SelectCo) Fair Value Committee (the Committee), in accordance with procedures adopted by the Board. Factors used in determining fair value vary by investment type and may include market or investment specific events. The frequency with which these procedures are used cannot be predicted and they may be utilized to a significant extent. The Committee oversees the Fund's valuation policies and procedures and is responsible for approving and reporting to the Board all fair value determinations.
The Fund categorizes the inputs to valuation techniques used to value its investments into a disclosure hierarchy consisting of three levels as shown below:
Level 1 - quoted prices in active markets for identical investments
Level 2 - other significant observable inputs (including quoted prices for similar investments, interest rates, prepayment speeds, etc.)
Level 3 - unobservable inputs (including the Fund's own assumptions based on the best information available)
Valuation techniques used to value the Fund's investments by major category are as follows:
Equity securities, including restricted securities, for which market quotations are readily available, are valued at the last reported sale price or official closing price as reported by a third party pricing vendor on the primary market or exchange on which they are traded and are categorized as Level 1 in the hierarchy. In the event there were no sales during the day or closing prices are not available, securities are valued at the last quoted bid price or may be valued using the last available price and are generally categorized as Level 2 in the hierarchy. For foreign equity securities, when market or security specific events arise, comparisons to the valuation of American Depositary Receipts (ADRs), futures contracts, Exchange-Traded Funds (ETFs) and certain indexes as well as quoted prices for similar securities may be used and would be categorized as Level 2 in the hierarchy. Utilizing these techniques may result in transfers between Level 1 and Level 2. For equity securities, including restricted securities, where observable inputs are limited, assumptions about market activity and risk are used and these securities may be categorized as Level 3 in the hierarchy.
Investments in open-end mutual funds, including the Fidelity Central Funds, are valued at their closing net asset value (NAV) each business day and are categorized as Level 1 in the hierarchy.
Annual Report
3. Significant Accounting Policies - continued
Investment Valuation - continued
Changes in valuation techniques may result in transfers in or out of an assigned level within the disclosure hierarchy. The aggregate value of investments by input level, as of December 31, 2013 is included at the end of the Fund's Schedule of Investments.
Investment Transactions and Income. For financial reporting purposes, the Fund's investment holdings and NAV include trades executed through the end of the last business day of the period. The NAV per share for processing shareholder transactions is calculated as of the close of business of the New York Stock Exchange (NYSE), normally 4:00 p.m. Eastern time and includes trades executed through the end of the prior business day. Gains and losses on securities sold are determined on the basis of identified cost. Dividend income is recorded on the ex-dividend date, except for certain dividends from foreign securities where the ex-dividend date may have passed, which are recorded as soon as the Fund is informed of the ex-dividend date. Non-cash dividends included in dividend income, if any, are recorded at the fair market value of the securities received. Distributions received on securities that represent a return of capital or capital gain are recorded as a reduction of cost of investments and/or as a realized gain. Subsequent to ex-dividend date the Fund determines the components of these distributions, based upon receipt of tax filings or other correspondence relating to the underlying investment. Interest income and distributions from the Fidelity Central Funds are accrued as earned.
Class Allocations and Expenses. Investment income, realized and unrealized capital gains and losses, common expenses of the Fund, and certain fund-level expense reductions, if any, are allocated daily on a pro-rata basis to each class based on the relative net assets of each class to the total net assets of the Fund. Each class differs with respect to transfer agent and distribution and service plan fees incurred. Certain expense reductions may also differ by class. For the reporting period, the allocated portion of income and expenses to each class as a percent of its average net assets may vary due to the timing of recording these transactions in relation to fluctuating net assets of the classes. Expenses directly attributable to a fund are charged to that fund. Expenses attributable to more than one fund are allocated among the respective funds on the basis of relative net assets or other appropriate methods. Expense estimates are accrued in the period to which they relate and adjustments are made when actual amounts are known.
Income Tax Information and Distributions to Shareholders. Each year, the Fund intends to qualify as a regulated investment company under Subchapter M of the Internal Revenue Code, including distributing substantially all of its taxable income and realized gains. As a result, no provision for U.S. Federal income taxes is required. As of December 31, 2013, the Fund did not have any unrecognized tax benefits in the financial statements; nor is the Fund aware of any tax positions for which it is reasonably possible that the total amounts of unrecognized tax benefits will significantly change in the next twelve months. The Fund files a U.S. federal tax return, in addition to state and local tax returns as required. The Fund's federal income tax returns are subject to examination by the Internal Revenue Service (IRS) for a period of three fiscal years after they are filed. State and local tax returns may be subject to examination for an additional fiscal year depending on the jurisdiction.
Distributions are declared and recorded on the ex-dividend date. Income dividends and capital gain distributions are declared separately for each class. Income and capital gain distributions are determined in accordance with income tax regulations, which may differ from GAAP.
Capital accounts within the financial statements are adjusted for permanent book-tax differences. These adjustments have no impact on net assets or the results of operations. Capital accounts are not adjusted for temporary book-tax differences which will reverse in a subsequent period.
Book-tax differences are primarily due to losses deferred due to wash sales and excise tax regulations.
The federal tax cost of investment securities and unrealized appreciation (depreciation) as of period end were as follows:
Gross unrealized appreciation | $ 67,700,504 |
Gross unrealized depreciation | (15,205,711) |
Net unrealized appreciation (depreciation) on securities and other investments | $ 52,494,793 |
| |
Tax Cost | $ 321,075,537 |
The tax-based components of distributable earnings as of period end were as follows:
Undistributed long-term capital gain | $ 3,980,366 |
Net unrealized appreciation (depreciation) | $ 52,494,793 |
The tax character of distributions paid was as follows:
| December 31, 2013 | December 31, 2012 |
Ordinary Income | $ 11,369,159 | $ 4,523,007 |
Long-term Capital Gains | 12,588,157 | 6,338,776 |
Total | $ 23,957,316 | $ 10,861,783 |
Annual Report
Notes to Financial Statements - continued
4. Purchases and Sales of Investments.
Purchases and sales of securities, other than short-term securities, aggregated $245,506,098 and $224,313,206, respectively.
5. Fees and Other Transactions with Affiliates.
Management Fee. Effective August 1, 2013, SelectCo replaced Fidelity Management and Research Company (FMR), an affiliate of SelectCo, as investment adviser to the Fund. The investment adviser and its affiliates provide the Fund with investment management related services for which the Fund pays a monthly management fee. The management fee is the sum of an individual fund fee rate that is based on an annual rate of .30% of the Fund's average net assets and an annualized group fee rate that averaged .25% during the period. The group fee rate is based upon the average net assets of all the mutual funds advised by FMR and the investment adviser. The group fee rate decreases as assets under management increase and increases as assets under management decrease. For the reporting period, the total annual management fee rate was .55% of the Fund's average net assets.
Distribution and Service Plan Fees. In accordance with Rule 12b-1 of the 1940 Act, the Fund has adopted separate 12b-1 Plans for each Service Class of shares. Each Service Class pays Fidelity Distributors Corporation (FDC), an affiliate of the investment adviser, a service fee. For the period, the service fee is based on an annual rate of .10% of Service Class' average net assets and .25% of Service Class 2's average net assets.
For the period, total fees, all of which were re-allowed to insurance companies for the distribution of shares and providing shareholder support services were as follows:
Service Class | $ 2,446 |
Service Class 2 | 399,836 |
| $ 402,282 |
Transfer Agent Fees. Fidelity Investments Institutional Operations Company, Inc. (FIIOC), an affiliate of the investment adviser, is the Fund's transfer, dividend disbursing, and shareholder servicing agent. FIIOC receives an asset-based fee with respect to each class. Each class (with the exception of Investor Class) pays a transfer agent fee, excluding out of pocket expenses, equal to an annual rate of .07% of average net assets. Investor Class pays a monthly asset-based transfer agent fee of .15% of average net assets. In addition, FIIOC receives an asset-based fee of .0035% of average net assets for typesetting, printing and mailing of shareholder reports, except proxy statements. FIIOC voluntarily agreed to reimburse or waive this fee for the period January 1, 2013 through December 31, 2013 (see Expense Reductions note). For the period, transfer agent fees for each class, including printing and out of pocket expenses, were as follows:
Initial Class | $ 51,977 |
Service Class | 1,676 |
Service Class 2 | 111,391 |
Investor Class | 247,018 |
| $ 412,062 |
Effective February 1, 2014, the Board of Trustees approved an amendment to the transfer agent fee agreement whereby each class (with the exception of Investor Class) pays a single fee of .07% of average net assets for transfer agent services, typesetting, printing and mailing of shareholder reports, excluding mailing of proxy statements and out of pocket expenses. Investor Class pays a single fee of .15% of average net assets.
Accounting and Security Lending Fees. Fidelity Service Company, Inc. (FSC), an affiliate of the investment adviser, maintains the Fund's accounting records. The accounting fee is based on the level of average net assets for each month. Under a separate contract, FSC administers the security lending program. The security lending fee is based on the number and duration of lending transactions.
Brokerage Commissions. The Fund placed a portion of its portfolio transactions with brokerage firms which are affiliates of the investment adviser. Brokerage commissions are included in net realized gain (loss) and change in net unrealized appreciation (depreciation) in the Statement of Operations. The commissions paid to these affiliated firms were $5,788 for the period.
6. Committed Line of Credit.
The Fund participates with other funds managed by the investment adviser or an affiliate in a $4.25 billion credit facility (the "line of credit") to be utilized for temporary or emergency purposes to fund shareholder redemptions or for other short-term liquidity purposes. The Fund has agreed to pay commitment fees on its pro-rata portion of the line of credit, which amounted to $834 and is reflected in Miscellaneous expenses on the Statement of Operations. During the period, there were no borrowings on this line of credit.
7. Security Lending.
The Fund lends portfolio securities through a lending agent from time to time in order to earn additional income. For equity securities, a lending agent is used and may loan securities to certain qualified borrowers, which prior to August 1, 2013 included Fidelity Capital Markets (FCM), a broker-dealer
Annual Report
7. Security Lending - continued
affiliated with the Fund. On the settlement date of the loan, the Fund receives collateral (in the form of U.S. Treasury obligations, letters of credit and/or cash) against the loaned securities and maintains collateral in an amount not less than 100% of the market value of the loaned securities during the period of the loan. The market value of the loaned securities is determined at the close of business of the Fund and any additional required collateral is delivered to the Fund on the next business day. If the borrower defaults on its obligation to return the securities loaned because of insolvency or other reasons, the Fund may apply collateral received from the borrower against the obligation. The Fund may experience delays and costs in recovering the securities loaned. Any cash collateral received is invested in the Fidelity Securities Lending Cash Central Fund. The value of loaned securities and cash collateral at period end are disclosed on the Fund's Statement of Assets and Liabilities. Security lending income represents the income earned on investing cash collateral, less rebates paid to borrowers and any lending agent fees associated with the loan, plus any premium payments received for lending certain types of securities. Security lending income is presented in the Statement of Operations as a component of income from Fidelity Central Funds. Total security lending income during the period amounted to $11,892. During the period, there were no securities loaned to FCM.
8. Expense Reductions.
The investment adviser or its affiliates agreed to reimburse or waive certain fees during the period as noted in the table below.
| Reimbursement / Waiver |
| |
Initial Class | $ 2,815 |
Service Class | 96 |
Service Class 2 | 6,297 |
Investor Class | 6,379 |
| $ 15,587 |
Commissions paid to certain brokers with whom the investment adviser, or its affiliates, places trades on behalf of the Fund include an amount in addition to trade execution, which may be rebated back to the Fund to offset certain expenses. This amount totaled $14,637 for the period. In addition through arrangements with the Fund's custodian, credits realized as a result of uninvested cash balances were used to reduce the Fund's expenses. During the period, these credits reduced the Fund's custody expenses by $20.
9. Distributions to Shareholders.
Distributions to shareholders of each class were as follows:
Years ended December 31, | 2013 | 2012 |
From net investment income | | |
Initial Class | $ 1,105,869 | $ 1,011,054 |
Service Class | 60,909 | 9,368 |
Service Class 2 | 2,698,125 | 1,779,301 |
Investor Class | 2,580,844 | 1,723,284 |
Total | $ 6,445,747 | $ 4,523,007 |
From net realized gain | | |
Initial Class | $ 2,837,338 | $ 1,295,689 |
Service Class | 152,694 | 12,758 |
Service Class 2 | 7,697,869 | 2,692,435 |
Investor Class | 6,823,668 | 2,337,894 |
Total | $ 17,511,569 | $ 6,338,776 |
10. Share Transactions.
Transactions for each class of shares were as follows:
| Shares | Dollars |
Years ended December 31, | 2013 | 2012 | 2013 | 2012 |
Initial Class | | | | |
Shares sold | 801,426 | 1,671,182 | $ 14,647,172 | $ 27,953,546 |
Reinvestment of distributions | 243,682 | 138,161 | 3,943,207 | 2,306,743 |
Shares redeemed | (1,679,924) | (1,317,806) | (30,101,288) | (22,322,607) |
Net increase (decrease) | (634,816) | 491,537 | $ (11,510,909) | $ 7,937,682 |
Annual Report
Notes to Financial Statements - continued
10. Share Transactions - continued
| Shares | Dollars |
Years ended December 31, | 2013 | 2012 | 2013 | 2012 |
Service Class | | | | |
Shares sold | 109,042 | 85,805 | $ 1,933,360 | $ 1,469,525 |
Reinvestment of distributions | 13,307 | 1,327 | 213,603 | 22,126 |
Shares redeemed | (17,938) | (31,921) | (310,247) | (542,134) |
Net increase (decrease) | 104,411 | 55,211 | $ 1,836,716 | $ 949,517 |
Service Class 2 | | | | |
Shares sold | 3,353,858 | 2,681,169 | $ 59,259,635 | $ 44,661,439 |
Reinvestment of distributions | 651,875 | 270,790 | 10,395,995 | 4,471,736 |
Shares redeemed | (2,343,989) | (2,953,298) | (41,733,596) | (48,488,301) |
Net increase (decrease) | 1,661,744 | (1,339) | $ 27,922,034 | $ 644,874 |
Investor Class | | | | |
Shares sold | 2,963,427 | 2,820,101 | $ 54,456,079 | $ 47,464,258 |
Reinvestment of distributions | 584,441 | 244,074 | 9,404,511 | 4,061,178 |
Shares redeemed | (2,624,396) | (849,714) | (46,582,180) | (14,120,732) |
Net increase (decrease) | 923,472 | 2,214,461 | $ 17,278,410 | $ 37,404,704 |
11. Other.
The Fund's organizational documents provide former and current trustees and officers with a limited indemnification against liabilities arising in connection with the performance of their duties to the Fund. In the normal course of business, the Fund may also enter into contracts that provide general indemnifications. The Fund's maximum exposure under these arrangements is unknown as this would be dependent on future claims that may be made against the Fund. The risk of material loss from such claims is considered remote.
At the end of the period, the investment adviser or its affiliates were the owners of record of 51% of the total outstanding shares of the Fund and one otherwise unaffiliated shareholder was the owner of record of 40% of the total outstanding shares of the Fund.
Annual Report
Report of Independent Registered Public Accounting Firm
To the Trustees of Variable Insurance Products Fund IV and the Shareholders of VIP Real Estate Portfolio:
In our opinion, the accompanying statement of assets and liabilities, including the schedule of investments, and the related statements of operations and of changes in net assets and the financial highlights present fairly, in all material respects, the financial position of VIP Real Estate Portfolio (a fund of Variable Insurance Products Fund IV) at December 31, 2013, the results of its operations for the year then ended, the changes in its net assets for each of the two years in the period then ended and the financial highlights for each of the five years in the period then ended, in conformity with accounting principles generally accepted in the United States of America. These financial statements and financial highlights (hereafter referred to as "financial statements") are the responsibility of the VIP Real Estate Portfolio's management. Our responsibility is to express an opinion on these financial statements based on our audits. We conducted our audits of these financial statements in accordance with the standards of the Public Company Accounting Oversight Board (United States). Those standards require that we plan and perform the audit to obtain reasonable assurance about whether the financial statements are free of material misstatement. An audit includes examining, on a test basis, evidence supporting the amounts and disclosures in the financial statements, assessing the accounting principles used and significant estimates made by management, and evaluating the overall financial statement presentation. We believe that our audits, which included confirmation of securities at December 31, 2013 by correspondence with the custodian and brokers, provide a reasonable basis for our opinion.
PricewaterhouseCoopers LLP
Boston, Massachusetts
February 18, 2014
Annual Report
The Trustees and officers of the trust and fund, as applicable, are listed below. The Board of Trustees governs the fund and is responsible for protecting the interests of shareholders. The Trustees are experienced executives who meet periodically throughout the year to oversee the fund's activities, review contractual arrangements with companies that provide services to the fund, oversee management of the risks associated with such activities and contractual arrangements, and review the fund's performance. Ned C. Lautenbach, Ronald P. O'Hanley, and William S. Stavropoulos each oversees 247 funds. David A. Rosow, Garnett A. Smith, and Michael E. Wiley each oversees 74 funds.
The Trustees hold office without limit in time except that (a) any Trustee may resign; (b) any Trustee may be removed by written instrument, signed by at least two-thirds of the number of Trustees prior to such removal; (c) any Trustee who requests to be retired or who has become incapacitated by illness or injury may be retired by written instrument signed by a majority of the other Trustees; and (d) any Trustee may be removed at any special meeting of shareholders by a two-thirds vote of the outstanding voting securities of the trust. The officers hold office without limit in time, except that any officer may resign or may be removed by a vote of a majority of the Trustees at any regular meeting or any special meeting of the Trustees. Except as indicated, each individual has held the office shown or other offices in the same company for the past five years.
Experience, Skills, Attributes, and Qualifications of the Fund's Trustees. The Governance and Nominating Committee has adopted a statement of policy that describes the experience, qualifications, attributes, and skills that are necessary and desirable for potential Independent Trustee candidates (Statement of Policy). The Board believes that each Trustee satisfied at the time he or she was initially elected or appointed a Trustee, and continues to satisfy, the standards contemplated by the Statement of Policy. The Governance and Nominating Committee also engages professional search firms to help identify potential Independent Trustee candidates who have the experience, qualifications, attributes, and skills consistent with the Statement of Policy. From time to time, additional criteria based on the composition and skills of the current Independent Trustees, as well as experience or skills that may be appropriate in light of future changes to board composition, business conditions, and regulatory or other developments, have also been considered by the professional search firms and the Governance and Nominating Committee. In addition, the Board takes into account the Trustees' commitment and participation in Board and committee meetings, as well as their leadership of standing and ad hoc committees throughout their tenure.
In determining that a particular Trustee was and continues to be qualified to serve as a Trustee, the Board has considered a variety of criteria, none of which, in isolation, was controlling. The Board believes that, collectively, the Trustees have balanced and diverse experience, qualifications, attributes, and skills, which allow the Board to operate effectively in governing the fund and protecting the interests of shareholders. Information about the specific experience, skills, attributes, and qualifications of each Trustee, which in each case led to the Board's conclusion that the Trustee should serve (or continue to serve) as a trustee of the fund, is provided below.
Board Structure and Oversight Function. Ronald P. O'Hanley is an interested person (as defined in the 1940 Act) and currently serves as Chairman. The Trustees have determined that an interested Chairman is appropriate and benefits shareholders because an interested Chairman has a personal and professional stake in the quality and continuity of services provided to the fund. Independent Trustees exercise their informed business judgment to appoint an individual of their choosing to serve as Chairman, regardless of whether the Trustee happens to be independent or a member of management. The Independent Trustees have determined that they can act independently and effectively without having an Independent Trustee serve as Chairman and that a key structural component for assuring that they are in a position to do so is for the Independent Trustees to constitute a substantial majority for the Board. The Independent Trustees also regularly meet in executive session. Michael E. Wiley serves as Chairman of the Independent Trustees and as such (i) acts as a liaison between the Independent Trustees and management with respect to matters important to the Independent Trustees and (ii) with management prepares agendas for Board meetings.
Fidelity funds are overseen by different Boards of Trustees. The fund's Board oversees Fidelity's sector portfolios. Other Boards oversee Fidelity's equity and high income funds, and Fidelity's investment grade bond, money market, and asset allocation funds. The use of separate Boards, each with its own committee structure, allows the Trustees of each group of Fidelity funds to focus on the unique issues of the funds they oversee, including common research, investment, and operational issues. On occasion, the separate Boards establish joint committees to address issues of overlapping consequences for the Fidelity funds overseen by each Board.
The Trustees operate using a system of committees to facilitate the timely and efficient consideration of all matters of importance to the Trustees, the fund, and fund shareholders and to facilitate compliance with legal and regulatory requirements and oversight of the fund's activities and associated risks. The Board, acting through its committees, has charged SelectCo and its affiliates with (i) identifying events or circumstances the occurrence of which could have demonstrably adverse effects on the fund's business and/or reputation; (ii) implementing processes and controls to lessen the possibility that such events or circumstances occur or to mitigate the effects of such events or circumstances if they do occur; and (iii) creating and maintaining a system designed to evaluate continuously business and market conditions in order to facilitate the identification and implementation processes described in (i) and (ii) above. Because the day-to-day operations and activities of the fund are carried out by or through SelectCo, its affiliates, and other service providers, the fund's exposure to risks is mitigated but not eliminated by the processes overseen by the Trustees. While each of the Board's committees has responsibility for overseeing different aspects of the fund's activities, oversight is exercised primarily through the Operations and Audit Committees. Appropriate personnel, including but not limited to the fund's Chief Compliance Officer (CCO), SelectCo's internal auditor, the independent accountants, the fund's Treasurer and portfolio management personnel, make periodic reports to the Board's committees, as appropriate. The responsibilities of each standing committee, including their oversight responsibilities, are described further under "Standing Committees of the Fund's Trustees."
The fund's Statement of Additional Information (SAI) includes more information about the Trustees. To request a free copy, call Fidelity at 1-877-208-0098.
Annual Report
Trustees and Officers - continued
Interested Trustee*:
Correspondence intended for the Trustee who is an interested person may be sent to Fidelity Investments, 245 Summer Street, Boston, Massachusetts 02210.
Name, Year of Birth; Principal Occupations and Other Relevant Experience+ |
Ronald P. O'Hanley (1957) |
Year of Election or Appointment: 2011 Trustee Chairman of the Board of Trustees |
| Mr. O'Hanley also serves as Trustee of other Fidelity funds. He is Director of Fidelity SelectCo, LLC (2013-present), FMR Co., Inc. (2010-present), Director of Fidelity Investments Money Management, Inc. (2010-present), Director of Fidelity Research & Analysis Company (2010-present), President of Fidelity Asset Management and Corporate Services and a Member of Fidelity's Executive Committee (2010-present). Previously, Mr. O'Hanley served as President and Chief Executive Officer of BNY Mellon Asset Management (2007-2010). Mr. O'Hanley also served as Vice Chairman of Bank New York Mellon Corp. and a member of that firm's Executive Committee. Prior to the 2007 merger of The Bank of New York and Mellon Financial Corporation, he was Vice Chairman of Mellon Financial Corporation and President and Chief Executive Officer of Mellon Asset Management. He joined Mellon in February 1997. Mr. O'Hanley currently serves as Chairman of the Boston Public Library Foundation Board of Directors and sits on the Board of Directors of Beth Israel Deaconess Medical Center, the Board of Trustees of the Marine Biological Laboratory and the Advisory Board of the Maxwell School of Citizenship and Public Administration at Syracuse University. Mr. O'Hanley also chairs the Council on Asset Management for the Financial Services Roundtable and is a member of the Board of Directors of Institutional Investor's U.S. Institute. |
* Trustee has been determined to be an "Interested Trustee" by virtue of, among other things, his affiliation with the trust or various entities under common control with SelectCo.
+ The information above includes the Trustee's principal occupation during the last five years and other information relating to the experience, attributes, and skills relevant to the Trustee's qualifications to serve as a Trustee, which led to the conclusion that the Trustee should serve as a Trustee for the fund.
Independent Trustees:
Correspondence intended for each Independent Trustee (that is, the Trustees other than the Interested Trustee) may be sent to Fidelity Investments, P.O. Box 55235, Boston, Massachusetts 02205-5235.
Name, Year of Birth; Principal Occupations and Other Relevant Experience+ |
Ned C. Lautenbach (1944) |
Year of Election or Appointment: 2000 Trustee |
| Mr. Lautenbach also serves as Trustee of other Fidelity funds. Mr. Lautenbach currently serves as the Lead Director of the Eaton Corporation Board of Directors (diversified industrial, 1997-present). Mr. Lautenbach is Chairman of the Board of Directors of the Philharmonic Center for the Arts in Naples, Florida (2012-present) and a member of the Council on Foreign Relations (1994-present). Previously, Mr. Lautenbach was a Partner/Advisory Partner at Clayton, Dubilier & Rice, LLC (private equity investment, 1998-2010), as well as a Director of Sony Corporation (2006-2007). |
David A. Rosow (1942) |
Year of Election or Appointment: 2013 Trustee |
| Mr. Rosow also serves as Trustee of other Fidelity funds. Mr. Rosow is Chairman and Chief Executive Officer of International Golf Group, Inc. (golf course development, 1989-present). Previously, Mr. Rosow served as Chairman and Chief Executive Officer of Rosow & Company, Inc. (private investment company, 1989-2011), a Lead Director of Hudson United Bancorp (2001-2006) and as a Director of TD Banknorth (1996-2006). In addition, Mr. Rosow is a member (2008-present) and President (2009-present) of the Town Council of Palm Beach, Florida. Mr. Rosow served as a Member of the Advisory Board of other Fidelity funds (2012-2013). |
Garnett A. Smith (1947) |
Year of Election or Appointment: 2013 Trustee |
| Mr. Smith also serves as Trustee of other Fidelity funds. Prior to Mr. Smith's retirement, he served as Chairman and Chief Executive Officer of Inbrand Corp. (manufacturer of personal absorbent products, 1990-1997). He also served as President (1986-1990) of Inbrand Corp. Prior to his employment with Inbrand Corp., he was employed by a retail fabric chain and North Carolina National Bank. In addition, Mr. Smith is a board member of the Jackson Hole Land Trust (2009-present). Mr. Smith served as a Member of the Advisory Board of other Fidelity funds (2012-2013). |
William S. Stavropoulos (1939) |
Year of Election or Appointment: 2001 Trustee |
| Mr. Stavropoulos also serves as Trustee of other Fidelity funds. Mr. Stavropoulos serves as President and Founder of the Michigan Baseball Foundation, the Great Lakes Loons (2007-present). Mr. Stavropoulos is Chairman Emeritus of the Board of Directors of The Dow Chemical Company, where he previously served in numerous senior management positions, including President, CEO (1995-2000; 2002-2004), Chairman of the Executive Committee (2000-2006), and as a member of the Board of Directors (1990-2006). Currently, Mr. Stavropoulos is Chairman of the Board of Directors of Univar Inc. (global distributor of commodity and specialty chemicals), a Director of Teradata Corporation (data warehousing and technology solutions), and Maersk Inc. (industrial conglomerate), and a member of the Advisory Board for Metalmark Capital LLC (private equity investment, 2005-present). Mr. Stavropoulos is an operating advisor to Clayton, Dubilier & Rice, LLC (private equity investment). In addition, Mr. Stavropoulos is a member of the University of Notre Dame Advisory Council for the College of Science, a Trustee of the Rollin L. Gerstacker Foundation, and a Director of the Naples Philharmonic Center for the Arts. Previously, Mr. Stavropoulos served as a Director of Chemical Financial Corporation (bank holding company, 1993-2012) and Tyco International, Ltd. (multinational manufacturing and services, 2007-2012). |
Michael E. Wiley (1950) |
Year of Election or Appointment: 2008 Trustee Chairman of the Independent Trustees |
| Mr. Wiley also serves as Trustee of other Fidelity funds. Mr. Wiley serves as a Director of Asia Pacific Exploration Consolidated (international oil and gas exploration and production, 2008-present). Mr. Wiley serves as a Director of Tesoro Corporation (independent oil refiner and marketer, 2005-present), and a Director of Bill Barrett Corporation (exploration and production, 2005-present). In addition, Mr. Wiley also serves as a Director of Post Oak Bank (privately-held bank, 2004-present). Previously, Mr. Wiley served as a Trustee of other Fidelity funds (2008-2013), as a member of the Board of Trustees of the University of Tulsa (2000-2006; 2007-2010), as a Senior Energy Advisor of Katzenbach Partners, LLC (consulting, 2006-2007), as an Advisory Director of Riverstone Holdings (private investment), Chairman, President, and CEO of Baker Hughes, Inc. (oilfield services, 2000-2004), and as Director of Spinnaker Exploration Company (exploration and production, 2001-2005). |
+ The information above includes each Trustee's principal occupation during the last five years and other information relating to the experience, attributes, and skills relevant to each Trustee's qualifications to serve as a Trustee, which led to the conclusion that each Trustee should serve as a Trustee for the fund.
Officers:
Except for Anthony R. Rochte, correspondence intended for each officer may be sent to Fidelity Investments, 245 Summer Street, Boston, Massachusetts 02210. Correspondence intended for Mr. Rochte may be sent to SelectCo, 1225 17th Street, Denver, Colorado 80202-5541. Officers appear below in alphabetical order.
Name, Year of Birth; Principal Occupation |
Christopher S. Bartel (1971) |
Year of Election or Appointment: 2009 Vice President |
| Mr. Bartel also serves as Vice President of other funds. Mr. Bartel serves as a Director, President, and Chief Executive Officer of Fidelity Management & Research (Japan) Inc. (2012-present), a Director of Fidelity Management & Research (Hong Kong) (2012-present), and Senior Vice President of Global Equity Research (2010-present). Previously, Mr. Bartel served as Senior Vice President of Equity Research (2009-2010), Managing Director of Research (2006-2009), and an analyst and portfolio manager (2000-2006). |
Elizabeth Paige Baumann (1968) |
Year of Election or Appointment: 2012 Anti-Money Laundering (AML) Officer |
| Ms. Baumann also serves as AML Officer of other funds. She is Chief AML Officer of FMR LLC (2012-present) and is an employee of Fidelity Investments. Previously, Ms. Baumann served as Vice President and Deputy Anti-Money Laundering Officer (2007-2012). |
Marc Bryant (1966) |
Year of Election or Appointment: 2013 Secretary and Chief Legal Officer (CLO) |
| Mr. Bryant also serves as an officer of other funds. He is Senior Vice President and Deputy General Counsel of FMR LLC. Prior to joining Fidelity Investments, Mr. Bryant served as a Senior Vice President and the Head of Global Retail Legal for AllianceBernstein L.P. (2006-2010), and as the General Counsel for ProFund Advisors LLC (2001-2006). |
William C. Coffey (1969) |
Year of Election or Appointment: 2009 Assistant Secretary |
| Mr. Coffey also serves as Assistant Secretary of other funds. He is Senior Vice President and Deputy General Counsel of FMR LLC (2010-present), and is an employee of Fidelity Investments. Previously, Mr. Coffey served as Vice President and Associate General Counsel of FMR LLC (2005-2009). |
Jonathan Davis (1968) |
Year of Election or Appointment: 2010 Assistant Treasurer |
| Mr. Davis also serves as Assistant Treasurer of other funds. Mr. Davis is an employee of Fidelity Investments. Previously, Mr. Davis served as Vice President and Associate General Counsel of FMR LLC (2003-2010). |
Adrien E. Deberghes (1967) |
Year of Election or Appointment: 2013 President and Treasurer |
| Mr. Deberghes also serves as an officer of other funds. He is an employee of Fidelity Investments (2008-present). Prior to joining Fidelity Investments, Mr. Deberghes was Senior Vice President of Mutual Fund Administration at State Street Corporation (2007-2008), Senior Director of Mutual Fund Administration at Investors Bank & Trust (2005-2007), and Director of Finance for Dunkin' Brands (2000-2005). |
Stephanie J. Dorsey (1969) |
Year of Election or Appointment: 2010 Assistant Treasurer |
| Ms. Dorsey also serves as an officer of other funds. She is an employee of Fidelity Investments (2008-present) and has served in other fund officer roles. Prior to joining Fidelity Investments, Ms. Dorsey served as Treasurer (2004-2008) of the JPMorgan Mutual Funds and Vice President (2004-2008) of JPMorgan Chase Bank. |
Joseph A. Hanlon (1968) |
Year of Election or Appointment: 2012 Chief Compliance Officer |
| Mr. Hanlon also serves as Chief Compliance Officer of other funds. Mr. Hanlon serves as Compliance Officer of FMR, FMR Co., Inc., Fidelity Investments Money Management, Inc. (FIMM), Fidelity Research and Analysis Company (FRAC), and Fidelity Management & Research (Hong Kong) (2009-present), as Senior Vice President of the Fidelity Asset Management Division (2009-present), and is an employee of Fidelity Investments. Previously, Mr. Hanlon served as Compliance Officer of Fidelity Management & Research (Japan) Inc. (2009-2013), Strategic Advisers, Inc. (2009-2013), and Fidelity Management & Research (U.K.) Inc. (2009-2013). |
Brian B. Hogan (1964) |
Year of Election or Appointment: 2009 Vice President |
| Mr. Hogan also serves as Vice President of other funds. Mr. Hogan serves as President of FMR's Equity Division (2009-present). Previously, Mr. Hogan served as Senior Vice President, Equity Research of FMR (2006-2009) and as a portfolio manager. |
Chris Maher (1972) |
Year of Election or Appointment: 2013 Assistant Treasurer |
| Mr. Maher serves as Assistant Treasurer of other funds. Mr. Maher is Vice President of Valuation Oversight and is an employee of Fidelity Investments. Previously, Mr. Maher served as Vice President of Asset Management Compliance (2013), Vice President of FMR's Program Management Group (2010-2013), and Vice President of Valuation Oversight (2008-2010). |
Christine Reynolds (1958) |
Year of Election or Appointment: 2008 Chief Financial Officer |
| Ms. Reynolds also serves as Chief Financial Officer of other funds. Ms. Reynolds became President of Fidelity Pricing and Cash Management Services (FPCMS) in August 2008. Ms. Reynolds served as Chief Operating Officer of FPCMS (2007-2008). Previously, Ms. Reynolds served as President, Treasurer, and Anti-Money Laundering officer of the Fidelity funds (2004-2007). |
Kenneth B. Robins (1969) |
Year of Election or Appointment: 2013 Deputy Treasurer |
| Mr. Robins also serves as an officer of other funds. Mr. Robins serves as Executive Vice President of Fidelity Investments Money Management, Inc. (FIMM) (2013-present) and is an employee of Fidelity Investments (2004-present). Previously, Mr. Robins served in other fund officer roles. |
Anthony R. Rochte (1968) |
Year of Election or Appointment: 2013 Vice President |
| Mr. Rochte also serves as Vice President of other funds. Mr. Rochte serves as President of Fidelity SelectCo, LLC (2012-present) and is an employee of Fidelity Investments (2012-present). Prior to joining Fidelity Investments, Mr. Rochte served as Senior Managing Director and head of State Street Global Advisors' North American Intermediary Business Group (2006-2012). |
Stacie M. Smith (1974) |
Year of Election or Appointment: 2013 Assistant Treasurer |
| Ms. Smith also serves as an officer of other funds. She is an employee of Fidelity Investments (2009-present) and has served in other fund officer roles. Prior to joining Fidelity Investments, Ms. Smith served as Senior Audit Manager of Ernst & Young LLP (1996-2009). |
Renee Stagnone (1975) |
Year of Election or Appointment: 2013 Deputy Treasurer |
| Ms. Stagnone also serves as Deputy Treasurer of other funds. Ms. Stagnone is an employee of Fidelity Investments. |
Joseph F. Zambello (1957) |
Year of Election or Appointment: 2011 Deputy Treasurer |
| Mr. Zambello also serves as Deputy Treasurer of other funds. Mr. Zambello is an employee of Fidelity Investments. Previously, Mr. Zambello served as Vice President of FMR's Program Management Group (2009-2011) and Vice President of the Transfer Agent Oversight Group (2005-2009). |
Annual Report
The Board of Trustees of VIP Real Estate Portfolio voted to pay to shareholders of record at the opening of business on record date, the following distributions per share derived from capital gains realized from sales of portfolio securities:
Fund | Pay Date | Record Date | Capital Gains |
Initial Class | 02/14/14 | 02/14/14 | $0.179 |
Service Class | 02/14/14 | 02/14/14 | $0.179 |
Service Class 2 | 02/14/14 | 02/14/14 | $0.179 |
Investor Class | 02/14/14 | 02/14/14 | $0.179 |
The fund hereby designates as a capital gain dividend with respect to the taxable year ended December 31, 2013, $14,713,236 or, if subsequently determined to be different, the net capital gain of such year.
Annual Report
A special meeting of Real Estate Portfolio's shareholders was held on May 14, 2013. The results of votes taken among shareholders on the proposals before them are reported below. Each vote reported represents one dollar of net asset value held on the record date for the meeting.
PROPOSAL 1 |
To elect a Board of Trustees.A |
| # of
Votes | % of
Votes |
Ned C. Lautenbach |
Affirmative | 1,555,133,782.46 | 93.955 |
Withheld | 100,063,694.32 | 6.045 |
TOTAL | 1,655,197,476.78 | 100.000 |
Ronald P. O'Hanley |
Affirmative | 1,557,988,095.28 | 94.128 |
Withheld | 97,209,381.50 | 5.872 |
TOTAL | 1,655,197,476.78 | 100.000 |
David A. Rosow |
Affirmative | 1,552,645,347.31 | 93.805 |
Withheld | 102,552,129.47 | 6.195 |
TOTAL | 1,655,197,476.78 | 100.000 |
Garnett A. Smith |
Affirmative | 1,554,582,880.53 | 93.922 |
Withheld | 100,614,596.25 | 6.078 |
TOTAL | 1,655,197,476.78 | 100.000 |
William S. Stavropoulos |
Affirmative | 1,548,352,452.21 | 93.545 |
Withheld | 106,845,024.57 | 6.455 |
TOTAL | 1,655,197,476.78 | 100.000 |
Michael E. Wiley |
Affirmative | 1,556,790,374.70 | 94.055 |
Withheld | 98,407,102.08 | 5.945 |
TOTAL | 1,655,197,476.78 | 100.000 |
PROPOSAL 2 |
To approve a management contract between the fund and Fidelity SelectCo, LLC. |
| # of
Votes | % of
Votes |
Affirmative | 363,487,338.29 | 91.604 |
Against | 11,654,663.76 | 2.937 |
Abstain | 21,663,978.42 | 5.459 |
TOTAL | 396,805,980.47 | 100.000 |
A Denotes trust-wide proposal and voting results. |
Annual Report
Investment Adviser
Fidelity SelectCo, LLC
Denver, CO
Investment Sub-Advisers
FMR Co., Inc.
Fidelity Management & Research (U.K.) Inc.
Fidelity Management & Research (Japan) Inc.
Fidelity Management & Research (Hong Kong) Limited
General Distributor
Fidelity Distributors Corporation
Smithfield, RI
Transfer and Service Agents
Fidelity Investments Institutional Operations Company, Inc.
Boston, MA
Fidelity Service Company, Inc.
Boston, MA
Custodian
The Bank of New York Mellon
New York, NY
VIPRE-ANN-0214
1.781992.111
Fidelity® Variable Insurance Products:
Technology Portfolio
Annual Report
December 31, 2013
(Fidelity Cover Art)
Contents
Performance | (Click Here) | How the fund has done over time. |
Management's Discussion of Fund Performance | (Click Here) | The Portfolio Manager's review of fund performance and strategy. |
Shareholder Expense Example | (Click Here) | An example of shareholder expenses. |
Investment Changes | (Click Here) | A summary of major shifts in the fund's investments over the past six months. |
Investments | (Click Here) | A complete list of the fund's investments with their market values. |
Financial Statements | (Click Here) | Statements of assets and liabilities, operations, and changes in net assets, as well as financial highlights. |
Notes | (Click Here) | Notes to the financial statements. |
Report of Independent Registered Public Accounting Firm | (Click Here) | |
Trustees and Officers | (Click Here) | |
Distributions | (Click Here) | |
Proxy Voting Results | (Click Here) | |
To view a fund's proxy voting guidelines and proxy voting record for the 12-month period ended June 30, visit http://www.fidelity.com/proxyvotingresults or visit the Securities and Exchange Commission's (SEC) web site at http://www.sec.gov. You may also call 1-877-208-0098 to request a free copy of the proxy voting guidelines.
Fidelity® Variable Insurance Products are separate account options which are purchased through a variable insurance contract.
Standard & Poor's, S&P and S&P 500 are registered service marks of The McGraw-Hill Companies, Inc. and have been licensed for use by Fidelity Distributors Corporation.
Other third-party marks appearing herein are the property of their respective owners.
All other marks appearing herein are registered or unregistered trademarks or service marks of FMR LLC or an affiliated company. © 2014 FMR LLC. All rights reserved.
This report and the financial statements contained herein are submitted for the general information of the shareholders of the fund. This report is not authorized for distribution to prospective investors in the fund unless preceded or accompanied by an effective prospectus.
A fund files its complete schedule of portfolio holdings with the SEC for the first and third quarters of each fiscal year on Form N-Q. Forms N-Q are available on the SEC's web site at http://www.sec.gov. A fund's Forms N-Q may be reviewed and copied at the SEC's Public Reference Room in Washington, DC. Information regarding the operation of the SEC's Public Reference Room may be obtained by calling 1-800-SEC-0330. For a complete list of a fund's portfolio holdings, view the most recent holdings listing, semiannual report, or annual report on Fidelity's web site at http://www.fidelity.com, http://www.advisor.fidelity.com, or http://www.401k.com, as applicable.
NOT FDIC INSURED • MAY LOSE VALUE • NO BANK GUARANTEE
Neither the fund nor Fidelity Distributors Corporation is a bank.
Annual Report
Average annual total return reflects the change in the value of an investment, assuming reinvestment of the class' distributions from dividend income and capital gains (the profits earned upon the sale of securities that have grown in value, if any) and assuming a constant rate of performance each year. During periods of reimbursement by Fidelity, a fund's total return will be greater than it would be had the reimbursement not occurred. Performance numbers are net of all underlying fund operating expenses, but do not include any insurance charges imposed by your insurance company's separate account. If performance information included the effect of these additional charges, the total returns would have been lower. How a fund did yesterday is no guarantee of how it will do tomorrow.
Average Annual Total Returns
Periods ended December 31, 2013 | Past 1
year | Past 5
years | Past 10
years |
VIP Technology Portfolio - Initial Class | 27.81% | 27.68% | 8.79% |
VIP Technology Portfolio - Investor Class A | 27.73% | 27.53% | 8.68% |
A The initial offering of Investor Class shares took place on July 21, 2005. Returns prior to July 21, 2005 are those of Initial Class. Had Investor Class's transfer agent fee been reflected, returns prior to July 21, 2005 would have been lower.
$10,000 Over 10 Years
Let's say hypothetically that $10,000 was invested in VIP Technology Portfolio - Initial Class on December 31, 2003. The chart shows how the value of your investment would have changed, and also shows how the S&P 500® Index performed over the same period.
Annual Report
Market Recap: Global equity markets remained upbeat for the 12 months ending December 31, 2013, propelling the MSCI® ACWI® (All Country World Index) Index to a 23.24% return. Midyear turbulence gave way by autumn when policymakers in the U.S. and China had made clear their intentions to maintain accommodative monetary policies. That stance, combined with modest cyclical improvement around the globe and generally low valuations, underpinned the broad rally in equities, although the relative strength of the U.S. dollar generally tempered gains for U.S. investors holding foreign securities based in local currencies. During the period, the broad-market S&P 500® Index set a series of new highs, finishing the year up 32.39%. For the first time since 1995, the S&P® scored a "perfect 10," with all 10 economic sectors gaining at least 10% for the year. A resurgence in growth-oriented stocks lifted the Nasdaq Composite Index® to a 40.12% result for 2013, while the blue-chip Dow Jones Industrial AverageSM notched a relatively more modest 29.65% gain. International developed-markets equities rose in concert with their U.S. counterparts, with the MSCI® EAFE® Index gaining 22.92% for the period. Meanwhile, foreign exchange and commodity weakness curbed results in resource-heavy emerging markets (EM), especially in the year's waning months. More generally, concern over EM's slowing growth, its declining share of global trade and uncertainty surrounding U.S. central bank intentions were all factors hampering performance. The MSCI Emerging Markets Index returned -2.27% for the period. On the bond side, U.S. high-yield securities rallied with equities for much of the period, with the BofA Merrill LynchSM US High Yield Constrained Index returning 7.41% for 2013. The more rate-sensitive U.S. investment-grade bond category faced headwinds though, as reflected in the -2.02% return of the Barclays® U.S. Aggregate Bond Index. Within the Barclays index, investment-grade corporate credit returned -2.01%, while ultra-safe U.S. Treasuries saw a -2.75% result. Major non-U.S. developed markets performed only slightly better, with the Citigroup Non-USD Group-of-Seven (G7) Equal Weighted Index logging a -1.59% result. After several years of strong advances, EM debt reversed course in 2013, with the J.P. Morgan Emerging Markets Bond Index Global returning -6.58%.
Comments from Charlie Chai, Portfolio Manager of VIP Technology Portfolio: For the year, the fund's share classes produced robust gains but trailed the 31.09% advance of the MSCI® U.S. IMI Information Technology 25-50 Index, and also lagged the S&P 500®. Relative strength in Internet software & services and data processing & outsourced services, among other groups, was countered by lagging results in computer hardware and IT consulting & other services. (For specific portfolio results, please refer to the performance section of this report.) Versus the index, social networking website Facebook was the fund's largest relative detractor because I underweighted this strong-performing index stock for most of the period. I was concerned that Facebook's Messenger mobile messaging application might cannibalize users from the company's primary site, but that didn't happen. Realizing my mistake, I brought the fund's Facebook position to an overweighting by the end of the year. Another noteworthy detractor was network equipment maker Cisco Systems, which I reduced from a late-period overweighting to a significant underweighting by year end. Underweighting software provider Microsoft and computer maker Hewlett-Packard - two strong-performing benchmark components and mainstays of the personal computer industry - also hampered the fund. Microsoft's restructuring plan prompted me to add to this position, although it remained a large underweighting at period end. Conversely, maintaining negligible exposure to IT consulting heavyweight IBM was timely, as shares of this slow-growing index component produced a roughly break-even return. Three semiconductor stocks also were noteworthy contributors: Micron Technology, Taiwan's Inotera Memories and China-based Spreadtrum Communications. All three stocks in this highly cyclical group benefited from low expectations at the beginning of the year and higher prices for DRAM, a type of digital memory used in computers and mobile devices. Moreover, Spreadtrum received a lucrative takeover bid in July, which prompted me to liquidate the position to nail down profits. Micron was sold as well. Lastly, relative performance was lifted by mobile messaging application provider Naver, which I built into a major position. Generally speaking, the fund's foreign exposure provided a lift to performance, despite foreign exchange weakness, which mainly cooled super-hot gains out of Japan. Many of the stocks I've mentioned in this report were not in the index.
The views expressed above reflect those of the portfolio manager(s) only through the end of the period as stated on the cover of this report and do not necessarily represent the views of Fidelity or any other person in the Fidelity organization. Any such views are subject to change at any time based upon market or other conditions and Fidelity disclaims any responsibility to update such views. These views may not be relied on as investment advice and, because investment decisions for a Fidelity fund are based on numerous factors, may not be relied on as an indication of trading intent on behalf of any Fidelity fund.
Annual Report
As a shareholder of the Fund, you incur two types of costs: (1) transaction costs, including redemption fees and (2) ongoing costs, including management fees and other Fund expenses. This Example is intended to help you understand your ongoing costs (in dollars) of investing in the Fund and to compare these costs with the ongoing costs of investing in other mutual funds.
The Example is based on an investment of $1,000 invested at the beginning of the period and held for the entire period (July 1, 2013 to December 31, 2013).
Actual Expenses
The first line of the accompanying table for each class of the Fund provides information about actual account values and actual expenses. You may use the information in this line, together with the amount you invested, to estimate the expenses that you paid over the period. Simply divide your account value by $1,000.00 (for example, an $8,600 account value divided by $1,000.00 = 8.6), then multiply the result by the number in the first line for a class of the Fund under the heading entitled "Expenses Paid During Period" to estimate the expenses you paid on your account during this period. The estimate of expenses does not include any fees or other expenses of any variable annuity or variable life insurance product. If they were, the estimate of expenses you paid during the period would be higher, and your ending account value would be lower. In addition, the Fund, as a shareholder in the underlying Fidelity Central Funds, will indirectly bear its pro-rata share of the fees and expenses incurred by the underlying Fidelity Central Funds. These fees and expenses are not included in the Fund's annualized expense ratio used to calculate the expense estimate in the table below.
Hypothetical Example for Comparison Purposes
The second line of the accompanying table for each class of the Fund provides information about hypothetical account values and hypothetical expenses based on a Class' actual expense ratio and an assumed rate of return of 5% per year before expenses, which is not the Class' actual return. The hypothetical account values and expenses may not be used to estimate the actual ending account balance or expenses you paid for the period. You may use this information to compare the ongoing costs of investing in the Fund and other funds. To do so, compare this 5% hypothetical example with the 5% hypothetical examples that appear in the shareholder reports of the other funds. The estimate of expenses does not include any fees or other expenses of any variable annuity or variable life insurance product. If they were, the estimate of expenses you paid during the period would be higher, and your ending account value would be lower. In addition, the Fund, as a shareholder in the underlying Fidelity Central Funds, will indirectly bear its pro-rata share of the fees and expenses incurred by the underlying Fidelity Central Funds. These fees and expenses are not included in the Fund's annualized expense ratio used to calculate the expense estimate in the table below.
Please note that the expenses shown in the table are meant to highlight your ongoing costs only and do not reflect any transaction costs. Therefore, the second line of the table is useful in comparing ongoing costs only, and will not help you determine the relative total costs of owning different funds. In addition, if these transactional costs were included, your costs would have been higher.
| Annualized
Expense Ratio B | Beginning
Account Value
July 1, 2013 | Ending
Account Value
December 31, 2013 | Expenses Paid
During Period*
July 1, 2013
to December 31, 2013 |
Initial Class | .73% | | | |
Actual | | $ 1,000.00 | $ 1,215.30 | $ 4.08 |
HypotheticalA | | $ 1,000.00 | $ 1,021.53 | $ 3.72 |
Investor Class | .81% | | | |
Actual | | $ 1,000.00 | $ 1,214.20 | $ 4.52 |
HypotheticalA | | $ 1,000.00 | $ 1,021.12 | $ 4.13 |
A 5% return per year before expenses
B Annualized expense ratio reflects expenses net of applicable fee waivers.
* Expenses are equal to each Class' annualized expense ratio, multiplied by the average account value over the period, multiplied by 184/365 (to reflect the one-half year period).
Annual Report
Investment Changes (Unaudited)
Top Ten Stocks as of December 31, 2013 |
| % of fund's
net assets | % of fund's net assets
6 months ago |
Google, Inc. Class A | 10.0 | 10.7 |
salesforce.com, Inc. | 5.0 | 3.4 |
Facebook, Inc. Class A | 4.6 | 0.1 |
Yahoo!, Inc. | 4.6 | 0.0 |
Naver Corp. | 3.6 | 0.0 |
Visa, Inc. Class A | 3.5 | 2.8 |
Citrix Systems, Inc. | 2.4 | 0.4 |
Juniper Networks, Inc. | 2.4 | 1.4 |
Tencent Holdings Ltd. | 2.1 | 0.6 |
Fidelity National Information Services, Inc. | 1.9 | 1.4 |
| 40.1 | |
Top Industries (% of fund's net assets) |
As of December 31, 2013 |
 | Internet Software & Services | 32.5% | |
 | Software | 21.1% | |
 | IT Services | 11.5% | |
 | Communications Equipment | 9.9% | |
 | Semiconductors & Semiconductor Equipment | 8.4% | |
 | All Others* | 16.6% | |

As of June 30, 2013 |
| Software | 22.5% | |
| Internet Software & Services | 17.0% | |
| Semiconductors & Semiconductor Equipment | 15.7% | |
| Computers & Peripherals | 11.6% | |
| Communications Equipment | 10.6% | |
| All Others* | 22.6% | |

* Includes short-term investments and net other assets (liabilities). |
Annual Report
Investments December 31, 2013
Showing Percentage of Net Assets
Common Stocks - 99.0% |
| Shares | | Value |
AUTOMOBILES - 0.2% |
Automobile Manufacturers - 0.2% |
Tesla Motors, Inc. (a) | 2,400 | | $ 360,912 |
CHEMICALS - 0.0% |
Diversified Chemicals - 0.0% |
Oci Co. Ltd. | 414 | | 74,900 |
COMMUNICATIONS EQUIPMENT - 9.9% |
Communications Equipment - 9.9% |
ADTRAN, Inc. | 29,200 | | 788,692 |
Alcatel-Lucent SA sponsored ADR | 142,000 | | 624,800 |
Aruba Networks, Inc. (a) | 3,500 | | 62,650 |
BlackBerry Ltd. (a) | 231,900 | | 1,727,654 |
Ciena Corp. (a) | 37,300 | | 892,589 |
Cisco Systems, Inc. | 80,537 | | 1,808,056 |
F5 Networks, Inc. (a) | 28,518 | | 2,591,145 |
Finisar Corp. (a) | 700 | | 16,744 |
Infinera Corp. (a) | 13,800 | | 134,964 |
Juniper Networks, Inc. (a) | 189,400 | | 4,274,758 |
Nokia Corp. (a) | 147,800 | | 1,194,225 |
Polycom, Inc. (a) | 15 | | 168 |
Procera Networks, Inc. (a)(d) | 109,100 | | 1,638,682 |
Riverbed Technology, Inc. (a) | 9,400 | | 169,952 |
Sandvine Corp. (U.K.) (a) | 352,588 | | 982,500 |
ShoreTel, Inc. (a) | 9,900 | | 91,872 |
Sonus Networks, Inc. (a) | 242,100 | | 762,615 |
Spirent Communications PLC | 41,800 | | 71,849 |
UTStarcom Holdings Corp. (a) | 66,666 | | 184,665 |
| | 18,018,580 |
COMPUTERS & PERIPHERALS - 4.2% |
Computer Hardware - 2.7% |
3D Systems Corp. (a)(d) | 2,050 | | 190,507 |
Advantech Co. Ltd. | 43,000 | | 297,655 |
Apple, Inc. | 345 | | 193,583 |
Hewlett-Packard Co. | 817 | | 22,860 |
Lenovo Group Ltd. | 1,226,000 | | 1,490,938 |
MiTAC Holdings Corp. (a) | 926,000 | | 893,981 |
NCR Corp. (a) | 41,700 | | 1,420,302 |
Stratasys Ltd. (a) | 2,710 | | 365,037 |
| | 4,874,863 |
Computer Storage & Peripherals - 1.5% |
EMC Corp. | 106,000 | | 2,665,900 |
Intevac, Inc. (a) | 1,500 | | 11,145 |
Nimble Storage, Inc. | 1,000 | | 45,300 |
Smart Technologies, Inc. Class A (a)(d) | 11,200 | | 24,528 |
| | 2,746,873 |
TOTAL COMPUTERS & PERIPHERALS | | 7,621,736 |
|
| Shares | | Value |
CONSTRUCTION MATERIALS - 1.3% |
Construction Materials - 1.3% |
Universal Cement Corp. | 2,452,000 | | $ 2,322,009 |
ELECTRICAL EQUIPMENT - 0.0% |
Electrical Components & Equipment - 0.0% |
Acuity Brands, Inc. | 316 | | 34,545 |
ELECTRONIC EQUIPMENT & COMPONENTS - 4.3% |
Electronic Components - 1.8% |
Amphenol Corp. Class A | 3,500 | | 312,130 |
AVX Corp. | 1,300 | | 18,109 |
Boardtek Electronics Corp. | 126,000 | | 145,507 |
Corning, Inc. | 1,200 | | 21,384 |
DTS, Inc. (a) | 400 | | 9,592 |
E Ink Holdings, Inc. GDR (a)(e) | 1,000 | | 5,481 |
InvenSense, Inc. (a)(d) | 28,900 | | 600,542 |
Ledlink Optics, Inc. | 187,585 | | 625,671 |
Omron Corp. | 17,900 | | 791,060 |
Polytronics Technology Corp. | 87,000 | | 185,773 |
Sapphire Technology Co. Ltd. (a) | 2,181 | | 76,954 |
Tong Hsing Electronics Industries Ltd. | 107,000 | | 494,980 |
Vishay Intertechnology, Inc. (a) | 1,700 | | 22,542 |
| | 3,309,725 |
Electronic Equipment & Instruments - 1.1% |
Chroma ATE, Inc. | 84,945 | | 177,968 |
Firich Enterprise Co. Ltd. | 421,000 | | 1,757,019 |
Itron, Inc. (a) | 400 | | 16,572 |
RealD, Inc. (a) | 9,800 | | 83,692 |
| | 2,035,251 |
Electronic Manufacturing Services - 0.9% |
KEMET Corp. (a) | 2,800 | | 15,792 |
Multi-Fineline Electronix, Inc. (a) | 411 | | 5,709 |
TE Connectivity Ltd. | 16,300 | | 898,293 |
Trimble Navigation Ltd. (a) | 21,370 | | 741,539 |
| | 1,661,333 |
Technology Distributors - 0.5% |
Anixter International, Inc. | 300 | | 26,952 |
Arrow Electronics, Inc. (a) | 600 | | 32,550 |
Digital China Holdings Ltd. (H Shares) | 696,000 | | 820,376 |
| | 879,878 |
TOTAL ELECTRONIC EQUIPMENT & COMPONENTS | | 7,886,187 |
HEALTH CARE EQUIPMENT & SUPPLIES - 0.0% |
Health Care Equipment - 0.0% |
Biosensors International Group Ltd. | 42,000 | | 27,790 |
China Medical Technologies, Inc. sponsored ADR (a) | 300 | | 0 |
PW Medtech Group Ltd. (a) | 48,000 | | 21,975 |
| | 49,765 |
Common Stocks - continued |
| Shares | | Value |
HEALTH CARE TECHNOLOGY - 1.1% |
Health Care Technology - 1.1% |
athenahealth, Inc. (a)(d) | 7,300 | | $ 981,850 |
M3, Inc. | 409 | | 1,024,286 |
| | 2,006,136 |
HOTELS, RESTAURANTS & LEISURE - 0.0% |
Casinos & Gaming - 0.0% |
500 Com Ltd. sponsored ADR Class A | 200 | | 7,074 |
HOUSEHOLD DURABLES - 1.3% |
Consumer Electronics - 0.9% |
Sony Corp. sponsored ADR | 23,300 | | 402,857 |
Tonly Electronics Holdings Ltd. (a) | 1,660,000 | | 1,230,930 |
| | 1,633,787 |
Homebuilding - 0.2% |
West Holdings Corp. (d) | 19,100 | | 245,395 |
Household Appliances - 0.2% |
Techtronic Industries Co. Ltd. | 146,500 | | 415,640 |
TOTAL HOUSEHOLD DURABLES | | 2,294,822 |
INTERNET & CATALOG RETAIL - 2.1% |
Internet Retail - 2.1% |
Amazon.com, Inc. (a) | 5,100 | | 2,033,829 |
Groupon, Inc. Class A (a) | 65,500 | | 770,935 |
MakeMyTrip Ltd. (a) | 3,400 | | 65,484 |
priceline.com, Inc. (a) | 488 | | 567,251 |
Qunar Cayman Islands Ltd. sponsored ADR | 900 | | 23,877 |
Rakuten, Inc. | 1,100 | | 16,416 |
Start Today Co. Ltd. | 11,500 | | 285,953 |
TripAdvisor, Inc. (a) | 1,900 | | 157,377 |
| | 3,921,122 |
INTERNET SOFTWARE & SERVICES - 32.5% |
Internet Software & Services - 32.5% |
58.com, Inc. ADR | 400 | | 15,336 |
Autohome, Inc. ADR Class A | 300 | | 10,977 |
Bazaarvoice, Inc. (a) | 600 | | 4,752 |
Blinkx PLC (a) | 50,400 | | 171,301 |
China Finance Online Co. Ltd. ADR (a) | 16,800 | | 105,672 |
Constant Contact, Inc. (a) | 900 | | 27,963 |
Cornerstone OnDemand, Inc. (a) | 5,400 | | 288,036 |
DealerTrack Holdings, Inc. (a) | 15,400 | | 740,432 |
eGain Communications Corp. (a) | 113,400 | | 1,161,216 |
Facebook, Inc. Class A (a) | 152,889 | | 8,356,913 |
Google, Inc. Class A (a) | 16,200 | | 18,155,502 |
IAC/InterActiveCorp | 8,700 | | 597,603 |
Kakaku.com, Inc. | 5,000 | | 87,832 |
LinkedIn Corp. (a) | 13,100 | | 2,840,473 |
LivePerson, Inc. (a) | 8,800 | | 130,416 |
Livesense, Inc. (a) | 14,200 | | 348,208 |
|
| Shares | | Value |
LogMeIn, Inc. (a) | 9,391 | | $ 315,068 |
Mail.Ru Group Ltd. GDR (Reg. S) | 10,400 | | 463,840 |
Marketo, Inc. | 200 | | 7,414 |
MercadoLibre, Inc. | 200 | | 21,558 |
Millennial Media, Inc. (a) | 7,500 | | 54,525 |
Naver Corp. | 9,619 | | 6,596,560 |
OpenTable, Inc. (a) | 300 | | 23,811 |
Phoenix New Media Ltd. ADR (a) | 8,800 | | 84,744 |
Qihoo 360 Technology Co. Ltd. ADR (a) | 200 | | 16,410 |
Renren, Inc. ADR (a)(d) | 1,500 | | 4,575 |
Responsys, Inc. (a) | 52,200 | | 1,430,802 |
SciQuest, Inc. (a) | 16,015 | | 456,107 |
Sohu.com, Inc. (a)(d) | 5,100 | | 371,943 |
Tencent Holdings Ltd. | 60,500 | | 3,858,930 |
Textura Corp. (d) | 41,500 | | 1,242,510 |
Twitter, Inc. (d) | 1,300 | | 82,745 |
VistaPrint Ltd. (a) | 600 | | 34,110 |
Vocus, Inc. (a) | 17,900 | | 203,881 |
Wix.com Ltd. (a) | 38,700 | | 1,039,095 |
Yahoo!, Inc. (a) | 205,200 | | 8,298,288 |
Yandex NV (a) | 10,900 | | 470,335 |
Yelp, Inc. (a) | 14,000 | | 965,300 |
Youku Tudou, Inc. ADR (a) | 2,700 | | 81,810 |
| | 59,166,993 |
IT SERVICES - 11.5% |
Data Processing & Outsourced Services - 8.6% |
eClerx | 4,935 | | 85,014 |
EVERTEC, Inc. | 10,100 | | 249,066 |
Fidelity National Information Services, Inc. | 64,100 | | 3,440,888 |
Fiserv, Inc. (a) | 8,000 | | 472,400 |
FleetCor Technologies, Inc. (a) | 7,800 | | 913,926 |
Global Payments, Inc. | 3,200 | | 207,968 |
MasterCard, Inc. Class A | 1,200 | | 1,002,552 |
Syntel, Inc. | 2,000 | | 181,900 |
Teletech Holdings, Inc. (a) | 4,994 | | 119,556 |
The Western Union Co. | 4,100 | | 70,725 |
Total System Services, Inc. | 52,100 | | 1,733,888 |
VeriFone Systems, Inc. (a) | 500 | | 13,410 |
Visa, Inc. Class A | 28,900 | | 6,435,452 |
WEX, Inc. (a) | 8,600 | | 851,658 |
| | 15,778,403 |
IT Consulting & Other Services - 2.9% |
Anite Group PLC | 7,900 | | 12,951 |
Camelot Information Systems, Inc. ADR (a) | 10,500 | | 21,000 |
China Information Technology, Inc. (a) | 42 | | 304 |
Cognizant Technology Solutions Corp. Class A (a) | 26,100 | | 2,635,578 |
IBM Corp. | 100 | | 18,757 |
iGATE Corp. (a) | 1,200 | | 48,192 |
Infosys Ltd. sponsored ADR (d) | 9,500 | | 537,700 |
Lionbridge Technologies, Inc. (a) | 132,300 | | 788,508 |
Common Stocks - continued |
| Shares | | Value |
IT SERVICES - CONTINUED |
IT Consulting & Other Services - continued |
Pactera Technology International Ltd. ADR (a) | 43,805 | | $ 313,206 |
Sapient Corp. (a) | 16,100 | | 279,496 |
ServiceSource International, Inc. (a) | 22,300 | | 186,874 |
Virtusa Corp. (a) | 10,000 | | 380,900 |
| | 5,223,466 |
TOTAL IT SERVICES | | 21,001,869 |
MACHINERY - 0.2% |
Industrial Machinery - 0.2% |
Fanuc Corp. | 1,700 | | 311,509 |
MEDIA - 0.3% |
Advertising - 0.2% |
Cookpad, Inc. (d) | 4,300 | | 134,634 |
Dentsu, Inc. | 100 | | 4,090 |
ReachLocal, Inc. (a) | 14,600 | | 185,566 |
| | 324,290 |
Cable & Satellite - 0.0% |
DISH Network Corp. Class A | 500 | | 28,960 |
Movies & Entertainment - 0.1% |
IMAX Corp. (a) | 5,900 | | 173,932 |
TOTAL MEDIA | | 527,182 |
METALS & MINING - 0.0% |
Diversified Metals & Mining - 0.0% |
Timminco Ltd. (a) | 700 | | 0 |
REAL ESTATE MANAGEMENT & DEVELOPMENT - 0.2% |
Real Estate Operating Companies - 0.1% |
Global Logistic Properties Ltd. | 67,000 | | 153,437 |
Real Estate Services - 0.1% |
E-House China Holdings Ltd. ADR | 13,080 | | 197,246 |
TOTAL REAL ESTATE MANAGEMENT & DEVELOPMENT | | 350,683 |
SEMICONDUCTORS & SEMICONDUCTOR EQUIPMENT - 8.4% |
Semiconductor Equipment - 1.6% |
Aixtron AG sponsored ADR (a)(d) | 13,600 | | 197,472 |
Applied Materials, Inc. | 1,400 | | 24,766 |
ASM International NV (depositary receipt) | 10,800 | | 356,400 |
Entegris, Inc. (a) | 55,800 | | 647,280 |
GCL-Poly Energy Holdings Ltd. (a) | 1,456,000 | | 450,640 |
Lam Research Corp. (a) | 300 | | 16,335 |
STR Holdings, Inc. (a) | 1,300 | | 2,041 |
Ultratech, Inc. (a) | 26,600 | | 771,400 |
Veeco Instruments, Inc. (a) | 13,400 | | 440,994 |
| | 2,907,328 |
|
| Shares | | Value |
Semiconductors - 6.8% |
Altera Corp. | 50,400 | | $ 1,639,512 |
Applied Micro Circuits Corp. (a) | 12,600 | | 168,588 |
ARM Holdings PLC sponsored ADR | 1,400 | | 76,636 |
Atmel Corp. (a) | 4,300 | | 33,669 |
Avago Technologies Ltd. | 4,000 | | 211,560 |
Broadcom Corp. Class A | 14,900 | | 441,785 |
Canadian Solar, Inc. (a) | 3,400 | | 101,388 |
Cavium, Inc. (a) | 21,091 | | 727,850 |
Chipbond Technology Corp. | 215,000 | | 337,655 |
Cree, Inc. (a) | 12,000 | | 750,840 |
Cypress Semiconductor Corp. | 6,000 | | 63,000 |
Diodes, Inc. (a) | 3,600 | | 84,816 |
Edison Opto Corp. | 134,000 | | 159,912 |
Energy Conversion Devices, Inc. (a) | 2,100 | | 0 |
Fairchild Semiconductor International, Inc. (a) | 1,200 | | 16,020 |
Freescale Semiconductor Holdings I Ltd. (a) | 8,700 | | 139,635 |
Genesis Photonics, Inc. (a) | 16,954 | | 9,264 |
Hittite Microwave Corp. (a) | 321 | | 19,815 |
Infineon Technologies AG | 25,800 | | 275,426 |
Inotera Memories, Inc. (a) | 673,000 | | 496,321 |
Inphi Corp. (a) | 16,500 | | 212,850 |
Intel Corp. | 600 | | 15,576 |
International Rectifier Corp. (a) | 11,100 | | 289,377 |
Intersil Corp. Class A | 14,300 | | 164,021 |
MagnaChip Semiconductor Corp. (a) | 8,400 | | 163,800 |
Melexis NV | 8,310 | | 264,995 |
Microsemi Corp. (a) | 900 | | 22,455 |
Monolithic Power Systems, Inc. | 22,100 | | 765,986 |
Novatek Microelectronics Corp. | 72,000 | | 294,454 |
NVIDIA Corp. | 1,300 | | 20,826 |
NXP Semiconductors NV (a) | 22,400 | | 1,028,832 |
PMC-Sierra, Inc. (a) | 73,200 | | 470,676 |
Power Integrations, Inc. | 5,314 | | 296,627 |
RDA Microelectronics, Inc. sponsored ADR | 1,700 | | 30,396 |
Semiconductor Manufacturing International Corp. sponsored ADR (a) | 217,300 | | 847,470 |
Silicon Laboratories, Inc. (a) | 19,500 | | 844,545 |
Silicon Motion Technology Corp. sponsored ADR | 4,500 | | 63,675 |
Skyworks Solutions, Inc. (a) | 300 | | 8,568 |
Spansion, Inc. Class A (a) | 1,800 | | 25,002 |
SunPower Corp. (a)(d) | 364 | | 10,851 |
Xilinx, Inc. | 18,800 | | 863,296 |
YoungTek Electronics Corp. | 173 | | 351 |
| | 12,458,321 |
TOTAL SEMICONDUCTORS & SEMICONDUCTOR EQUIPMENT | | 15,365,649 |
Common Stocks - continued |
| Shares | | Value |
SOFTWARE - 21.1% |
Application Software - 15.2% |
Adobe Systems, Inc. (a) | 36,200 | | $ 2,167,656 |
ANSYS, Inc. (a) | 8,400 | | 732,480 |
Aspen Technology, Inc. (a) | 32,000 | | 1,337,600 |
Autodesk, Inc. (a) | 41,000 | | 2,063,530 |
AutoNavi Holdings Ltd. ADR (a)(d) | 6,700 | | 95,475 |
BroadSoft, Inc. (a) | 22,900 | | 626,086 |
Citrix Systems, Inc. (a) | 70,300 | | 4,446,475 |
Comverse, Inc. | 513 | | 19,904 |
Concur Technologies, Inc. (a) | 4,800 | | 495,264 |
Descartes Systems Group, Inc. (a) | 78,200 | | 1,046,102 |
Intuit, Inc. | 4,900 | | 373,968 |
Jive Software, Inc. (a) | 10,700 | | 120,375 |
Kingdee International Software Group Co. Ltd. (a)(d) | 2,502,400 | | 761,599 |
Manhattan Associates, Inc. (a) | 1,288 | | 151,314 |
Micro Focus International PLC | 16,356 | | 208,011 |
MicroStrategy, Inc. Class A (a) | 6,401 | | 795,260 |
Parametric Technology Corp. (a) | 16,568 | | 586,342 |
Pegasystems, Inc. | 400 | | 19,672 |
QLIK Technologies, Inc. (a) | 16,500 | | 439,395 |
salesforce.com, Inc. (a) | 163,400 | | 9,018,046 |
Splunk, Inc. (a) | 500 | | 34,335 |
Sungy Mobile Ltd. ADR | 1,300 | | 26,559 |
TIBCO Software, Inc. (a) | 27,000 | | 606,960 |
Ultimate Software Group, Inc. (a) | 4,900 | | 750,778 |
Verint Systems, Inc. (a) | 666 | | 28,598 |
Workday, Inc. Class A (a) | 8,500 | | 706,860 |
| | 27,658,644 |
Home Entertainment Software - 1.4% |
Electronic Arts, Inc. (a) | 41,500 | | 952,010 |
Forgame Holdings Ltd. | 1,100 | | 7,660 |
Nintendo Co. Ltd. | 11,600 | | 1,552,703 |
Perfect World Co. Ltd. sponsored ADR Class B | 700 | | 12,446 |
Rosetta Stone, Inc. (a) | 1,100 | | 13,442 |
| | 2,538,261 |
Systems Software - 4.5% |
Allot Communications Ltd. (a) | 62,900 | | 953,564 |
Check Point Software Technologies Ltd. (a) | 1,400 | | 90,328 |
CommVault Systems, Inc. (a) | 11,900 | | 891,072 |
FleetMatics Group PLC (a) | 5,000 | | 216,250 |
Fortinet, Inc. (a) | 7,700 | | 147,301 |
Infoblox, Inc. (a) | 700 | | 23,114 |
Microsoft Corp. | 87,200 | | 3,263,896 |
NetSuite, Inc. (a) | 13,000 | | 1,339,260 |
|
| Shares | | Value |
Red Hat, Inc. (a) | 7,500 | | $ 420,300 |
ServiceNow, Inc. (a) | 7,900 | | 442,479 |
Symantec Corp. | 5,900 | | 139,122 |
Tableau Software, Inc. | 300 | | 20,679 |
Totvs SA | 14,700 | | 232,363 |
| | 8,179,728 |
TOTAL SOFTWARE | | 38,376,633 |
TRADING COMPANIES & DISTRIBUTORS - 0.1% |
Trading Companies & Distributors - 0.1% |
MonotaRO Co. Ltd. | 5,600 | | 114,012 |
WIRELESS TELECOMMUNICATION SERVICES - 0.3% |
Wireless Telecommunication Services - 0.3% |
SoftBank Corp. | 7,300 | | 640,581 |
TOTAL COMMON STOCKS (Cost $144,659,426) |
180,452,899
|
Money Market Funds - 5.0% |
| | | |
Fidelity Cash Central Fund, 0.11% (b) | 3,598,867 | | 3,598,867 |
Fidelity Securities Lending Cash Central Fund, 0.11% (b)(c) | 5,457,081 | | 5,457,081 |
TOTAL MONEY MARKET FUNDS (Cost $9,055,948) |
9,055,948
|
TOTAL INVESTMENT PORTFOLIO - 104.0% (Cost $153,715,374) | | 189,508,847 |
NET OTHER ASSETS (LIABILITIES) - (4.0)% | | (7,308,453) |
NET ASSETS - 100% | $ 182,200,394 |
Legend |
(a) Non-income producing |
(b) Affiliated fund that is generally available only to investment companies and other accounts managed by Fidelity Investments. The rate quoted is the annualized seven-day yield of the fund at period end. A complete unaudited listing of the fund's holdings as of its most recent quarter end is available upon request. In addition, each Fidelity Central Fund's financial statements, which are not covered by the Fund's Report of Independent Registered Public Accounting Firm, are available on the SEC's website or upon request. |
(c) Investment made with cash collateral received from securities on loan. |
(d) Security or a portion of the security is on loan at period end. |
(e) Security exempt from registration under Rule 144A of the Securities Act of 1933. These securities may be resold in transactions exempt from registration, normally to qualified institutional buyers. At the end of the period, the value of these securities amounted to $5,481 or 0.0% of net assets. |
Affiliated Central Funds |
Information regarding fiscal year to date income earned by the Fund from investments in Fidelity Central Funds is as follows: |
Fund | Income earned |
Fidelity Cash Central Fund | $ 4,793 |
Fidelity Securities Lending Cash Central Fund | 56,910 |
Total | $ 61,703 |
Other Information |
The following is a summary of the inputs used, as of December 31, 2013, involving the Fund's assets and liabilities carried at fair value. The inputs or methodology used for valuing securities may not be an indication of the risk associated with investing in those securities. For more information on valuation inputs, and their aggregation into the levels used in the tables below, please refer to the Investment Valuation section in the accompanying Notes to Financial Statements. |
Valuation Inputs at Reporting Date: |
Description | Total | Level 1 | Level 2 | Level 3 |
Investments in Securities: | | | | |
Common Stocks | $ 180,452,899 | $ 173,469,632 | $ 6,983,267 | $ - |
Money Market Funds | 9,055,948 | 9,055,948 | - | - |
Total Investments in Securities: | $ 189,508,847 | $ 182,525,580 | $ 6,983,267 | $ - |
The following is a summary of transfers between Level 1 and Level 2 for the period ended December 31, 2013. Transfers are assumed to have occurred at the beginning of the period, and are primarily attributable to the valuation techniques used for foreign equity securities, as discussed in the accompanying Notes to Financial Statements: |
Transfers | Total |
Level 1 to Level 2 | $ 0 |
Level 2 to Level 1 | $ 3,227,454 |
Distribution of investments by country or territory of incorporation, as a percentage of total net assets, is as follows (Unaudited): |
United States of America | 74.1% |
Taiwan | 4.8% |
Cayman Islands | 4.5% |
Korea (South) | 3.6% |
Japan | 3.4% |
Canada | 2.3% |
Israel | 1.4% |
Hong Kong | 1.1% |
Netherlands | 1.1% |
Others (Individually Less Than 1%) | 3.7% |
| 100.0% |
See accompanying notes which are an integral part of the financial statements.
Annual Report
Statement of Assets and Liabilities
| December 31, 2013 |
| | |
Assets | | |
Investment in securities, at value (including securities loaned of $5,350,110) - See accompanying schedule: Unaffiliated issuers (cost $144,659,426) | $ 180,452,899 | |
Fidelity Central Funds (cost $9,055,948) | 9,055,948 | |
Total Investments (cost $153,715,374) | | $ 189,508,847 |
Receivable for fund shares sold | | 123,193 |
Dividends receivable | | 18,713 |
Distributions receivable from Fidelity Central Funds | | 3,481 |
Prepaid expenses | | 1,054 |
Other receivables | | 1,107 |
Total assets | | 189,656,395 |
| | |
Liabilities | | |
Payable for investments purchased | $ 1,801,655 | |
Payable for fund shares redeemed | 48,751 | |
Accrued management fee | 79,351 | |
Other affiliated payables | 23,078 | |
Other payables and accrued expenses | 46,085 | |
Collateral on securities loaned, at value | 5,457,081 | |
Total liabilities | | 7,456,001 |
| | |
Net Assets | | $ 182,200,394 |
Net Assets consist of: | | |
Paid in capital | | $ 123,232,474 |
Accumulated undistributed net realized gain (loss) on investments and foreign currency transactions | | 23,173,301 |
Net unrealized appreciation (depreciation) on investments and assets and liabilities in foreign currencies | | 35,794,619 |
Net Assets | | $ 182,200,394 |
Statement of Assets and Liabilities - continued
| December 31, 2013 |
Initial Class:
Net Asset Value, offering price and redemption price per share ($61,534,387 ÷ 4,949,674 shares) | | $ 12.43 |
| | |
Investor Class:
Net Asset Value, offering price and redemption price per share ($120,666,007 ÷ 9,778,133 shares) | | $ 12.34 |
See accompanying notes which are an integral part of the financial statements.
Annual Report
Statement of Operations
| Year ended December 31, 2013 |
| | |
Investment Income | | |
Dividends | | $ 1,151,247 |
Interest | | 43,594 |
Income from Fidelity Central Funds | | 61,703 |
Total income | | 1,256,544 |
| | |
Expenses | | |
Management fee | $ 848,705 | |
Transfer agent fees | 191,233 | |
Accounting and security lending fees | 60,620 | |
Custodian fees and expenses | 27,746 | |
Independent trustees' compensation | 2,417 | |
Audit | 53,340 | |
Legal | 2,649 | |
Miscellaneous | 8,953 | |
Total expenses before reductions | 1,195,663 | |
Expense reductions | (13,526) | 1,182,137 |
Net investment income (loss) | | 74,407 |
Realized and Unrealized Gain (Loss) Net realized gain (loss) on: | | |
Investment securities: | | |
Unaffiliated issuers | 29,237,508 | |
Foreign currency transactions | (22,998) | |
Total net realized gain (loss) | | 29,214,510 |
Change in net unrealized appreciation (depreciation) on: Investment securities | 8,751,365 | |
Assets and liabilities in foreign currencies | 1,161 | |
Total change in net unrealized appreciation (depreciation) | | 8,752,526 |
Net gain (loss) | | 37,967,036 |
Net increase (decrease) in net assets resulting from operations | | $ 38,041,443 |
Statement of Changes in Net Assets
| Year ended
December 31,
2013 | Year ended
December 31,
2012 |
Increase (Decrease) in Net Assets | | |
Operations | | |
Net investment income (loss) | $ 74,407 | $ 74,883 |
Net realized gain (loss) | 29,214,510 | 7,263,563 |
Change in net unrealized appreciation (depreciation) | 8,752,526 | 16,771,837 |
Net increase (decrease) in net assets resulting from operations | 38,041,443 | 24,110,283 |
Distributions to shareholders from net investment income | (185,895) | - |
Distributions to shareholders from net realized gain | (9,485,718) | (17,498,594) |
Total distributions | (9,671,613) | (17,498,594) |
Share transactions - net increase (decrease) | 1,356,847 | (1,703,056) |
Redemption fees | 23,250 | 40,318 |
Total increase (decrease) in net assets | 29,749,927 | 4,948,951 |
| | |
Net Assets | | |
Beginning of period | 152,450,467 | 147,501,516 |
End of period (including undistributed net investment income of $0 and undistributed net investment income of $100,827, respectively) | $ 182,200,394 | $ 152,450,467 |
See accompanying notes which are an integral part of the financial statements.
Annual Report
Financial Highlights - Initial Class
Years ended December 31, | 2013 | 2012 | 2011 | 2010 | 2009 |
Selected Per-Share Data | | | | | |
Net asset value, beginning of period | $ 10.33 | $ 9.81 | $ 11.28 | $ 8.83 | $ 4.51 |
Income from Investment Operations | | | | | |
Net investment income (loss) C | .01 | .01 | (.03) | (.03) | .01 F |
Net realized and unrealized gain (loss) | 2.78 | 1.66 | (1.04) | 2.48 | 4.32 |
Total from investment operations | 2.79 | 1.67 | (1.07) | 2.45 | 4.33 |
Distributions from net investment income | (.02) | - | - | - | (.01) |
Distributions from net realized gain | (.67) | (1.15) | (.40) | - | - |
Total distributions | (.69) | (1.15) | (.40) | - | (.01) |
Redemption fees added to paid in capital C, H | - | - | - | - | - |
Net asset value, end of period | $ 12.43 | $ 10.33 | $ 9.81 | $ 11.28 | $ 8.83 |
Total Return A, B | 27.81% | 17.52% | (9.78)% | 27.75% | 96.02% |
Ratios to Average Net Assets D, G | | | | | |
Expenses before reductions | .73% | .71% | .72% | .73% | .78% |
Expenses net of fee waivers, if any | .72% | .71% | .72% | .72% | .78% |
Expenses net of all reductions | .72% | .70% | .70% | .71% | .76% |
Net investment income (loss) | .10% | .09% | (.23)% | (.35)% | .13% F |
Supplemental Data | | | | | |
Net assets, end of period (000 omitted) | $ 61,534 | $ 60,849 | $ 69,912 | $ 100,854 | $ 88,231 |
Portfolio turnover rate E | 113% | 71% | 153% | 114% | 130% |
A Total returns do not reflect charges attributable to your insurance company's separate account. Inclusion of these charges would reduce the total returns shown.
B Total returns would have been lower if certain expenses had not been reduced during the applicable periods shown.
C Calculated based on average shares outstanding during the period.
D Fees and expenses of any underlying Fidelity Central Funds are not included in the Fund's expense ratio. The Fund indirectly bears its proportionate share of the expenses of any underlying Fidelity Central Funds.
E Amount does not include the portfolio activity of any underlying Fidelity Central Funds.
F Investment income per share reflects a large, non-recurring dividend which amounted to $.01 per share. Excluding this non-recurring dividend, the ratio of net investment income (loss) to average net assets would have been (.08)%.
G Expense ratios reflect operating expenses of the class. Expenses before reductions do not reflect amounts reimbursed by the investment adviser or reductions from brokerage service arrangements or reductions from other expense offset arrangements and do not represent the amount paid by the class during periods when reimbursements or reductions occur. Expenses net of fee waivers reflect expenses after reimbursement by the investment adviser but prior to reductions from brokerage service arrangements or other expense offset arrangements. Expenses net of all reductions represent the net expenses paid by the class.
H Amount represents less than $.01 per share.
Financial Highlights - Investor Class
Years ended December 31, | 2013 | 2012 | 2011 | 2010 | 2009 |
Selected Per-Share Data | | | | | |
Net asset value, beginning of period | $ 10.26 | $ 9.75 | $ 11.22 | $ 8.79 | $ 4.50 |
Income from Investment Operations | | | | | |
Net investment income (loss) C | - H | - H | (.03) | (.04) | - F, H |
Net realized and unrealized gain (loss) | 2.76 | 1.66 | (1.05) | 2.47 | 4.30 |
Total from investment operations | 2.76 | 1.66 | (1.08) | 2.43 | 4.30 |
Distributions from net investment income | (.01) | - | - | - | (.01) |
Distributions from net realized gain | (.67) | (1.15) | (.39) | - | - |
Total distributions | (.68) | (1.15) | (.39) | - | (.01) |
Redemption fees added to paid in capital C, H | - | - | - | - | - |
Net asset value, end of period | $ 12.34 | $ 10.26 | $ 9.75 | $ 11.22 | $ 8.79 |
Total Return A, B | 27.73% | 17.51% | (9.92)% | 27.65% | 95.49% |
Ratios to Average Net Assets D, G | | | | | |
Expenses before reductions | .81% | .79% | .80% | .81% | .88% |
Expenses net of fee waivers, if any | .80% | .79% | .80% | .81% | .88% |
Expenses net of all reductions | .80% | .78% | .78% | .80% | .85% |
Net investment income (loss) | .02% | .01% | (.31)% | (.44)% | .03% F |
Supplemental Data | | | | | |
Net assets, end of period (000 omitted) | $ 120,666 | $ 91,601 | $ 77,589 | $ 91,743 | $ 63,980 |
Portfolio turnover rate E | 113% | 71% | 153% | 114% | 130% |
A Total returns do not reflect charges attributable to your insurance company's separate account. Inclusion of these charges would reduce the total returns shown.
B Total returns would have been lower if certain expenses had not been reduced during the applicable periods shown.
C Calculated based on average shares outstanding during the period.
D Fees and expenses of any underlying Fidelity Central Funds are not included in the Fund's expense ratio. The Fund indirectly bears its proportionate share of the expenses of any underlying Fidelity Central Funds.
E Amount does not include the portfolio activity of any underlying Fidelity Central Funds.
F Investment income per share reflects a large, non-recurring dividend which amounted to $.01 per share. Excluding this non-recurring dividend, the ratio of net investment income (loss) to average net assets would have been (.17)%.
G Expense ratios reflect operating expenses of the class. Expenses before reductions do not reflect amounts reimbursed by the investment adviser or reductions from brokerage service arrangements or reductions from other expense offset arrangements and do not represent the amount paid by the class during periods when reimbursements or reductions occur. Expenses net of fee waivers reflect expenses after reimbursement by the investment adviser but prior to reductions from brokerage service arrangements or other expense offset arrangements. Expenses net of all reductions represent the net expenses paid by the class.
H Amount represents less than $.01 per share.
See accompanying notes which are an integral part of the financial statements.
Annual Report
Notes to Financial Statements
For the period ended December 31, 2013
1. Organization.
VIP Technology Portfolio (the Fund) is a non-diversified fund of Variable Insurance Products Fund IV (the Trust) and is authorized to issue an unlimited number of shares. The Trust is registered under the Investment Company Act of 1940, as amended (the 1940 Act), as an open-end management investment company organized as a Massachusetts business trust. Shares of the Fund may only be purchased by insurance companies for the purpose of funding variable annuity or variable life insurance contracts. The Fund offers the following classes of shares: Initial Class shares and Investor Class shares. All classes have equal rights and voting privileges, except for matters affecting a single class.
2. Investments in Fidelity Central Funds.
The Fund invests in Fidelity Central Funds, which are open-end investment companies generally available only to other investment companies and accounts managed by the investment adviser and its affiliates. The Fund's Schedule of Investments lists each of the Fidelity Central Funds held as of period end, if any, as an investment of the Fund, but does not include the underlying holdings of each Fidelity Central Fund. As an Investing Fund, the Fund indirectly bears its proportionate share of the expenses of the underlying Fidelity Central Funds.
The Money Market Central Funds seek preservation of capital and current income and are managed by Fidelity Investments Money Management, Inc. (FIMM), an affiliate of the investment adviser. Annualized expenses of the Money Market Central Funds as of their most recent shareholder report date are less than .01%.
A complete unaudited list of holdings for each Fidelity Central Fund is available upon request or at the Securities and Exchange Commission (the SEC) website at www.sec.gov. In addition, the financial statements of the Fidelity Central Funds, which are not covered by the Fund's Report of Independent Registered Public Accounting Firm, are available on the SEC website or upon request.
3. Significant Accounting Policies.
The financial statements have been prepared in conformity with accounting principles generally accepted in the United States of America (GAAP), which require management to make certain estimates and assumptions at the date of the financial statements. Actual results could differ from those estimates. Subsequent events, if any, through the date that the financial statements were issued have been evaluated in the preparation of the financial statements. The following summarizes the significant accounting policies of the Fund:
Investment Valuation. Investments are valued as of 4:00 p.m. Eastern time on the last calendar day of the period. In accordance with valuation policies and procedures approved by the Board of Trustees (the Board), the Fund attempts to obtain prices from one or more third party pricing vendors or brokers to value its investments. When current market prices, quotations or currency exchange rates are not readily available or reliable, investments will be fair valued in good faith by the Fidelity SelectCo, LLC (SelectCo) Fair Value Committee (the Committee), in accordance with procedures adopted by the Board. Factors used in determining fair value vary by investment type and may include market or investment specific events. The frequency with which these procedures are used cannot be predicted and they may be utilized to a significant extent. The Committee oversees the Fund's valuation policies and procedures and is responsible for approving and reporting to the Board all fair value determinations.
The Fund categorizes the inputs to valuation techniques used to value its investments into a disclosure hierarchy consisting of three levels as shown below:
Level 1 - quoted prices in active markets for identical investments
Level 2 - other significant observable inputs (including quoted prices for similar investments, interest rates, prepayment speeds, etc.)
Level 3 - unobservable inputs (including the Fund's own assumptions based on the best information available)
Valuation techniques used to value the Fund's investments by major category are as follows:
Equity securities, including restricted securities, for which market quotations are readily available, are valued at the last reported sale price or official closing price as reported by a third party pricing vendor on the primary market or exchange on which they are traded and are categorized as Level 1 in the hierarchy. In the event there were no sales during the day or closing prices are not available, securities are valued at the last quoted bid price or may be valued using the last available price and are generally categorized as Level 2 in the hierarchy. For foreign equity securities, when market or security specific events arise, comparisons to the valuation of American Depositary Receipts (ADRs), futures contracts, Exchange-Traded Funds (ETFs) and certain indexes as well as quoted prices for similar securities may be used and would be categorized as Level 2 in the hierarchy. Utilizing these techniques may result in transfers between Level 1 and Level 2. For equity securities, including restricted securities, where observable inputs are limited, assumptions about market activity and risk are used and these securities may be categorized as Level 3 in the hierarchy.
Investments in open-end mutual funds, including the Fidelity Central Funds, are valued at their closing net asset value (NAV) each business day and are categorized as Level 1 in the hierarchy.
Annual Report
Notes to Financial Statements - continued
3. Significant Accounting Policies - continued
Investment Valuation - continued
Changes in valuation techniques may result in transfers in or out of an assigned level within the disclosure hierarchy. The aggregate value of investments by input level, as of December 31, 2013, including information on transfers between Levels 1 and 2 is included at the end of the Fund's Schedule of Investments.
Foreign Currency. The Fund may use foreign currency contracts to facilitate transactions in foreign-denominated securities. Gains and losses from these transactions may arise from changes in the value of the foreign currency or if the counterparties do not perform under the contracts' terms.
Foreign-denominated assets, including investment securities, and liabilities are translated into U.S. dollars at the exchange rates at period end. Purchases and sales of investment securities, income and dividends received and expenses denominated in foreign currencies are translated into U.S. dollars at the exchange rate in effect on the transaction date.
The effects of exchange rate fluctuations on investments are included with the net realized and unrealized gain (loss) on investment securities. Other foreign currency transactions resulting in realized and unrealized gain (loss) are disclosed separately.
Investment Transactions and Income. For financial reporting purposes, the Fund's investment holdings and NAV include trades executed through the end of the last business day of the period. The NAV per share for processing shareholder transactions is calculated as of the close of business of the New York Stock Exchange (NYSE), normally 4:00 p.m. Eastern time and includes trades executed through the end of the prior business day. Gains and losses on securities sold are determined on the basis of identified cost and may include proceeds received from litigation. Dividend income is recorded on the ex-dividend date, except for certain dividends from foreign securities where the ex-dividend date may have passed, which are recorded as soon as the Fund is informed of the ex-dividend date. Non-cash dividends included in dividend income, if any, are recorded at the fair market value of the securities received. Distributions received on securities that represent a return of capital or capital gain are recorded as a reduction of cost of investments and/or as a realized gain. Subsequent to ex-dividend date the Fund determines the components of these distributions, based upon receipt of tax filings or other correspondence relating to the underlying investment. Interest income and distributions from the Fidelity Central Funds are accrued as earned. Interest income includes coupon interest and amortization of premium and accretion of discount on debt securities. Investment income is recorded net of foreign taxes withheld where recovery of such taxes is uncertain.
Class Allocations and Expenses. Investment income, realized and unrealized capital gains and losses, common expenses of the Fund, and certain fund-level expense reductions, if any, are allocated daily on a pro-rata basis to each class based on the relative net assets of each class to the total net assets of the Fund. Each class differs with respect to transfer agent fees incurred. Certain expense reductions may also differ by class. For the reporting period, the allocated portion of income and expenses to each class as a percent of its average net assets may vary due to the timing of recording these transactions in relation to fluctuating net assets of the classes. Expenses directly attributable to a fund are charged to that fund. Expenses attributable to more than one fund are allocated among the respective funds on the basis of relative net assets or other appropriate methods. Expense estimates are accrued in the period to which they relate and adjustments are made when actual amounts are known.
Income Tax Information and Distributions to Shareholders. Each year, the Fund intends to qualify as a regulated investment company under Subchapter M of the Internal Revenue Code, including distributing substantially all of its taxable income and realized gains. As a result, no provision for U.S. Federal income taxes is required. As of December 31, 2013, the Fund did not have any unrecognized tax benefits in the financial statements; nor is the Fund aware of any tax positions for which it is reasonably possible that the total amounts of unrecognized tax benefits will significantly change in the next twelve months. The Fund files a U.S. federal tax return, in addition to state and local tax returns as required. The Fund's federal income tax returns are subject to examination by the Internal Revenue Service (IRS) for a period of three fiscal years after they are filed. State and local tax returns may be subject to examination for an additional fiscal year depending on the jurisdiction. Foreign taxes are provided for based on the Fund's understanding of the tax rules and rates that exist in the foreign markets in which it invests.
Distributions are declared and recorded on the ex-dividend date. Income dividends and capital gain distributions are declared separately for each class. Income and capital gain distributions are determined in accordance with income tax regulations, which may differ from GAAP.
Capital accounts within the financial statements are adjusted for permanent book-tax differences. These adjustments have no impact on net assets or the results of operations. Capital accounts are not adjusted for temporary book-tax differences which will reverse in a subsequent period.
Book-tax differences are primarily due to foreign currency transactions, passive foreign investment companies (PFIC), market discount and losses deferred due to wash sales.
Annual Report
3. Significant Accounting Policies - continued
Income Tax Information and Distributions to Shareholders - continued
The federal tax cost of investment securities and unrealized appreciation (depreciation) as of period end were as follows:
Gross unrealized appreciation | $ 41,973,536 |
Gross unrealized depreciation | (6,653,682) |
Net unrealized appreciation (depreciation) on securities and other investments | $ 35,319,854 |
| |
Tax Cost | $ 154,188,993 |
The tax-based components of distributable earnings as of period end were as follows:
Undistributed ordinary income | $ 956,885 |
Undistributed long-term capital gain | $ 22,690,035 |
Net unrealized appreciation (depreciation) | $ 35,321,000 |
The tax character of distributions paid was as follows:
| December 31, 2013 | December 31, 2012 |
Ordinary Income | $ 5,899,343 | $ 45,569 |
Long-term Capital Gains | 3,772,270 | 17,453,025 |
Total | $ 9,671,613 | $ 17,498,594 |
Trading (Redemption) Fees. Shares held by investors less than 60 days may be subject to a redemption fee equal to 1% of the NAV of shares redeemed. All redemption fees, which reduce the proceeds of the shareholder redemption, are retained by the Fund and accounted for as an addition to paid in capital.
Restricted Securities. The Fund may invest in securities that are subject to legal or contractual restrictions on resale. These securities generally may be resold in transactions exempt from registration or to the public if the securities are registered. Disposal of these securities may involve time-consuming negotiations and expense, and prompt sale at an acceptable price may be difficult. Information regarding restricted securities is included at the end of the Fund's Schedule of Investments.
4. Purchases and Sales of Investments.
Purchases and sales of securities, other than short-term securities, aggregated $169,514,851 and $173,362,180, respectively.
5. Fees and Other Transactions with Affiliates.
Management Fee. Effective August 1, 2013, SelectCo replaced Fidelity Management and Research Company (FMR), an affiliate of SelectCo, as investment adviser to the Fund. The investment adviser and its affiliates provide the Fund with investment management related services for which the Fund pays a monthly management fee. The management fee is the sum of an individual fund fee rate that is based on an annual rate of .30% of the Fund's average net assets and an annualized group fee rate that averaged .25% during the period. The group fee rate is based upon the average net assets of all the mutual funds advised by FMR and the investment adviser. The group fee rate decreases as assets under management increase and increases as assets under management decrease. For the reporting period, the total annual management fee rate was .55% of the Fund's average net assets.
Transfer Agent Fees. Fidelity Investments Institutional Operations Company, Inc. (FIIOC), an affiliate of the investment adviser, is the Fund's transfer, dividend disbursing, and shareholder servicing agent. FIIOC receives an asset-based fee with respect to each class. Each class (with the exception of Investor Class) pays a transfer agent fee, excluding out of pocket expenses, equal to an annual rate of .07% of average net assets. Investor Class pays a monthly asset-based transfer agent fee of .15% of average net assets. In addition, FIIOC receives an asset-based fee of .0035% of average net assets for typesetting, printing and mailing of shareholder reports, except proxy statements. FIIOC voluntarily agreed to reimburse or waive this fee for the period January 1, 2013 through December 31, 2013 (see Expense Reductions note). For the period, transfer agent fees for each class, including printing and out of pocket expenses, were as follows:
Initial Class | $ 40,769 |
Investor Class | 150,464 |
| $ 191,233 |
Annual Report
Notes to Financial Statements - continued
5. Fees and Other Transactions with Affiliates - continued
Transfer Agent Fees - continued
Effective February 1, 2014, the Board of Trustees approved an amendment to the transfer agent fee agreement whereby each class (with the exception of Investor Class) pays a single fee of .07% of average net assets for transfer agent services, typesetting, printing and mailing of shareholder reports, excluding mailing of proxy statements and out of pocket expenses. Investor Class pays a single fee of .15% of average net assets.
Accounting and Security Lending Fees. Fidelity Service Company, Inc. (FSC), an affiliate of the investment adviser, maintains the Fund's accounting records. The accounting fee is based on the level of average net assets for each month. Under a separate contract, FSC administers the security lending program. The security lending fee is based on the number and duration of lending transactions.
Brokerage Commissions. The Fund placed a portion of its portfolio transactions with brokerage firms which are affiliates of the investment adviser. Brokerage commissions are included in net realized gain (loss) and change in net unrealized appreciation (depreciation) in the Statement of Operations. The commissions paid to these affiliated firms were $4,245 for the period.
6. Committed Line of Credit.
The Fund participates with other funds managed by the investment adviser or an affiliate in a $4.25 billion credit facility (the "line of credit") to be utilized for temporary or emergency purposes to fund shareholder redemptions or for other short-term liquidity purposes. The Fund has agreed to pay commitment fees on its pro-rata portion of the line of credit, which amounted to $328 and is reflected in Miscellaneous expenses on the Statement of Operations. During the period, there were no borrowings on this line of credit.
7. Security Lending.
The Fund lends portfolio securities through a lending agent from time to time in order to earn additional income. For equity securities, a lending agent is used and may loan securities to certain qualified borrowers, which prior to August 1, 2013 included Fidelity Capital Markets (FCM), a broker-dealer affiliated with the Fund. On the settlement date of the loan, the Fund receives collateral (in the form of U.S. Treasury obligations, letters of credit and/or cash) against the loaned securities and maintains collateral in an amount not less than 100% of the market value of the loaned securities during the period of the loan. The market value of the loaned securities is determined at the close of business of the Fund and any additional required collateral is delivered to the Fund on the next business day. If the borrower defaults on its obligation to return the securities loaned because of insolvency or other reasons, the Fund may apply collateral received from the borrower against the obligation. The Fund may experience delays and costs in recovering the securities loaned. Any cash collateral received is invested in the Fidelity Securities Lending Cash Central Fund. The value of loaned securities and cash collateral at period end are disclosed on the Fund's Statement of Assets and Liabilities. At period end, there were no security loans outstanding with FCM. Security lending income represents the income earned on investing cash collateral, less rebates paid to borrowers and any lending agent fees associated with the loan, plus any premium payments received for lending certain types of securities. Security lending income is presented in the Statement of Operations as a component of income from Fidelity Central Funds. Total security lending income during the period amounted to $56,910, including $417 from securities loaned to FCM.
8. Expense Reductions.
The investment adviser or its affiliates agreed to reimburse or waive certain fees during the period as noted in the table below.
Initial Class | $ 2,162 |
Investor Class | 3,841 |
| $ 6,003 |
Commissions paid to certain brokers with whom the investment adviser, or its affiliates, places trades on behalf of the Fund include an amount in addition to trade execution, which may be rebated back to the Fund to offset certain expenses. This amount totaled $7,523 for the period.
9. Distributions to Shareholders.
Distributions to shareholders of each class were as follows:
Years ended December 31, | 2013 | 2012 |
From net investment income | | |
Initial Class | $ 84,806 | $ - |
Investor Class | 101,089 | - |
Total | $ 185,895 | $ - |
Annual Report
9. Distributions to Shareholders - continued
Years ended December 31, | 2013 | 2012 |
From net realized gain | | |
Initial Class | $ 3,370,921 | $ 8,184,645 |
Investor Class | 6,114,797 | 9,313,949 |
Total | $ 9,485,718 | $ 17,498,594 |
10. Share Transactions.
Transactions for each class of shares were as follows:
| Shares | Dollars |
Years ended December 31, | 2013 | 2012 | 2013 | 2012 |
Initial Class | | | | |
Shares sold | 562,384 | 1,223,544 | $ 6,489,734 | $ 12,689,627 |
Reinvestment of distributions | 308,709 | 824,234 | 3,455,727 | 8,184,645 |
Shares redeemed | (1,812,476) | (3,286,640) | (19,378,855) | (33,181,613) |
Net increase (decrease) | (941,383) | (1,238,862) | $ (9,433,394) | $ (12,307,341) |
Investor Class | | | | |
Shares sold | 2,284,168 | 2,537,621 | $ 25,689,584 | $ 26,084,557 |
Reinvestment of distributions | 556,681 | 943,662 | 6,215,886 | 9,313,949 |
Shares redeemed | (1,991,012) | (2,507,923) | (21,115,229) | (24,794,221) |
Net increase (decrease) | 849,837 | 973,360 | $ 10,790,241 | $ 10,604,285 |
11. Other.
The Fund's organizational documents provide former and current trustees and officers with a limited indemnification against liabilities arising in connection with the performance of their duties to the Fund. In the normal course of business, the Fund may also enter into contracts that provide general indemnifications. The Fund's maximum exposure under these arrangements is unknown as this would be dependent on future claims that may be made against the Fund. The risk of material loss from such claims is considered remote.
At the end of the period, the investment adviser or its affiliates were the owners of record of 100% of the total outstanding shares of the Fund.
Annual Report
Report of Independent Registered Public Accounting Firm
To the Trustees of Variable Insurance Products Fund IV and the Shareholders of VIP Technology Portfolio:
In our opinion, the accompanying statement of assets and liabilities, including the schedule of investments, and the related statements of operations and of changes in net assets and the financial highlights present fairly, in all material respects, the financial position of VIP Technology Portfolio (a fund of Variable Insurance Products Fund IV) at December 31, 2013, the results of its operations for the year then ended, the changes in its net assets for each of the two years in the period then ended and the financial highlights for each of the five years in the period then ended, in conformity with accounting principles generally accepted in the United States of America. These financial statements and financial highlights (hereafter referred to as "financial statements") are the responsibility of the VIP Technology Portfolio's management. Our responsibility is to express an opinion on these financial statements based on our audits. We conducted our audits of these financial statements in accordance with the standards of the Public Company Accounting Oversight Board (United States). Those standards require that we plan and perform the audit to obtain reasonable assurance about whether the financial statements are free of material misstatement. An audit includes examining, on a test basis, evidence supporting the amounts and disclosures in the financial statements, assessing the accounting principles used and significant estimates made by management, and evaluating the overall financial statement presentation. We believe that our audits, which included confirmation of securities at December 31, 2013 by correspondence with the custodian and brokers, provide a reasonable basis for our opinion.
PricewaterhouseCoopers LLP
Boston, Massachusetts
February 14, 2014
Annual Report
The Trustees, and officers of the trust and fund, as applicable, are listed below. The Board of Trustees governs the fund and is responsible for protecting the interests of shareholders. The Trustees are experienced executives who meet periodically throughout the year to oversee the fund's activities, review contractual arrangements with companies that provide services to the fund, oversee management of the risks associated with such activities and contractual arrangements, and review the fund's performance. Except for Ned C. Lautenbach, Ronald P. O'Hanley, and William S. Stavropoulos, each of the Trustees oversees 74 funds. Mr. Lautenbach, Mr. O'Hanley, and Mr. Stavropoulos each oversees 247 funds.
The Trustees hold office without limit in time except that (a) any Trustee may resign; (b) any Trustee may be removed by written instrument, signed by at least two-thirds of the number of Trustees prior to such removal; (c) any Trustee who requests to be retired or who has become incapacitated by illness or injury may be retired by written instrument signed by a majority of the other Trustees; and (d) any Trustee may be removed at any special meeting of shareholders by a two-thirds vote of the outstanding voting securities of the trust. The officers hold office without limit in time, except that any officer may resign or may be removed by a vote of a majority of the Trustees at any regular meeting or any special meeting of the Trustees. Except as indicated, each individual has held the office shown or other offices in the same company for the past five years.
Experience, Skills, Attributes, and Qualifications of the Fund's Trustees. The Governance and Nominating Committee has adopted a statement of policy that describes the experience, qualifications, attributes, and skills that are necessary and desirable for potential Independent Trustee candidates (Statement of Policy). The Board believes that each Trustee satisfied at the time he or she was initially elected or appointed a Trustee, and continues to satisfy, the standards contemplated by the Statement of Policy. The Governance and Nominating Committee also engages professional search firms to help identify potential Independent Trustee candidates who have the experience, qualifications, attributes, and skills consistent with the Statement of Policy. From time to time, additional criteria based on the composition and skills of the current Independent Trustees, as well as experience or skills that may be appropriate in light of future changes to board composition, business conditions, and regulatory or other developments, have also been considered by the professional search firms and the Governance and Nominating Committee. In addition, the Board takes into account the Trustees' commitment and participation in Board and committee meetings, as well as their leadership of standing and ad hoc committees throughout their tenure.
In determining that a particular Trustee was and continues to be qualified to serve as a Trustee, the Board has considered a variety of criteria, none of which, in isolation, was controlling. The Board believes that, collectively, the Trustees have balanced and diverse experience, qualifications, attributes, and skills, which allow the Board to operate effectively in governing the fund and protecting the interests of shareholders. Information about the specific experience, skills, attributes, and qualifications of each Trustee, which in each case led to the Board's conclusion that the Trustee should serve (or continue to serve) as a trustee of the fund, is provided below.
Board Structure and Oversight Function. Ronald P. O'Hanley is an interested person (as defined in the 1940 Act) and currently serves as Chairman. The Trustees have determined that an interested Chairman is appropriate and benefits shareholders because an interested Chairman has a personal and professional stake in the quality and continuity of services provided to the fund. Independent Trustees exercise their informed business judgment to appoint an individual of their choosing to serve as Chairman, regardless of whether the Trustee happens to be independent or a member of management. The Independent Trustees have determined that they can act independently and effectively without having an Independent Trustee serve as Chairman and that a key structural component for assuring that they are in a position to do so is for the Independent Trustees to constitute a substantial majority for the Board. The Independent Trustees also regularly meet in executive session. Michael E. Wiley serves as Chairman of the Independent Trustees and as such (i) acts as a liaison between the Independent Trustees and management with respect to matters important to the Independent Trustees and (ii) with management prepares agendas for Board meetings.
Fidelity funds are overseen by different Boards of Trustees. The fund's Board oversees Fidelity's sector portfolios. Other Boards oversee Fidelity's equity and high income funds, and Fidelity's investment grade bond, money market, and asset allocation funds. The use of separate Boards, each with its own committee structure, allows the Trustees of each group of Fidelity funds to focus on the unique issues of the funds they oversee, including common research, investment, and operational issues. On occasion, the separate Boards establish joint committees to address issues of overlapping consequences for the Fidelity funds overseen by each Board.
The Trustees operate using a system of committees to facilitate the timely and efficient consideration of all matters of importance to the Trustees, the fund, and fund shareholders and to facilitate compliance with legal and regulatory requirements and oversight of the fund's activities and associated risks. The Board, acting through its committees, has charged SelectCo and its affiliates with (i) identifying events or circumstances the occurrence of which could have demonstrably adverse effects on the fund's business and/or reputation; (ii) implementing processes and controls to lessen the possibility that such events or circumstances occur or to mitigate the effects of such events or circumstances if they do occur; and (iii) creating and maintaining a system designed to evaluate continuously business and market conditions in order to facilitate the identification and implementation processes described in (i) and (ii) above. Because the day-to-day operations and activities of the fund are carried out by or through SelectCo, its affiliates, and other service providers, the fund's exposure to risks is mitigated but not eliminated by the processes overseen by the Trustees. While each of the Board's committees has responsibility for overseeing different aspects of the fund's activities, oversight is exercised primarily through the Operations and Audit Committees. Appropriate personnel, including but not limited to the fund's Chief Compliance Officer (CCO), SelectCo's internal auditor, the independent accountants, the fund's Treasurer and portfolio management personnel, make periodic reports to the Board's committees, as appropriate. The responsibilities of each standing committee, including their oversight responsibilities, are described further under "Standing Committees of the Fund's Trustees."
The Fund's Statement of Additional Information (SAI) includes more information about the Trustees. To request a free copy, call Fidelity at 1-877-208-0098.
Annual Report
Trustees and Officers - continued
Interested Trustees*:
Correspondence intended for each Trustee who is an interested person may be sent to Fidelity Investments, 245 Summer Street, Boston, Massachusetts 02210.
Name, Year of Birth; Principal Occupations and Other Relevant Experience+ |
Ronald P. O'Hanley (1957) |
Year of Election or Appointment: 2011 Trustee Chairman of the Board of Trustees |
| Mr. O'Hanley also serves as Trustee of other Fidelity funds. He is Director of Fidelity SelectCo, LLC (2013-present), FMR Co., Inc. (2010-present), Director of Fidelity Investments Money Management, Inc. (2010-present), Director of Fidelity Research & Analysis Company (2010-present), President of Fidelity Asset Management and Corporate Services and a Member of Fidelity's Executive Committee (2010-present). Previously, Mr. O'Hanley served as President and Chief Executive Officer of BNY Mellon Asset Management (2007-2010). Mr. O'Hanley also served as Vice Chairman of Bank New York Mellon Corp. and a member of that firm's Executive Committee. Prior to the 2007 merger of The Bank of New York and Mellon Financial Corporation, he was Vice Chairman of Mellon Financial Corporation and President and Chief Executive Officer of Mellon Asset Management. He joined Mellon in February 1997. Mr. O'Hanley currently serves as Chairman of the Boston Public Library Foundation Board of Directors and sits on the Board of Directors of Beth Israel Deaconess Medical Center, the Board of Trustees of the Marine Biological Laboratory and the Advisory Board of the Maxwell School of Citizenship and Public Administration at Syracuse University. Mr. O'Hanley also chairs the Council on Asset Management for the Financial Services Roundtable and is a member of the Board of Directors of Institutional Investor's U.S. Institute. |
* Trustees have been determined to be "Interested Trustees" by virtue of, among other things, their affiliation with the trust or various entities under common control with SelectCo.
+ The information above includes the Trustee's principal occupation during the last five years and other information relating to the experience, attributes, and skills relevant to the Trustee's qualifications to serve as a Trustee, which led to the conclusion that each Trustee should serve as a Trustee for the fund.
Independent Trustees:
Correspondence intended for each Independent Trustee (that is, the Trustees other than the Interested Trustees) may be sent to Fidelity Investments, P.O. Box 55235, Boston, Massachusetts 02205-5235.
Name, Year of Birth; Principal Occupations and Other Relevant Experience+ |
Ned C. Lautenbach (1944) |
Year of Election or Appointment: 2000 Trustee |
| Mr. Lautenbach also serves as Trustee of other Fidelity funds. Mr. Lautenbach currently serves as the Lead Director of the Eaton Corporation Board of Directors (diversified industrial, 1997-present). Mr. Lautenbach is Chairman of the Board of Directors of the Philharmonic Center for the Arts in Naples, Florida (2012-present) and a member of the Council on Foreign Relations (1994-present). Previously, Mr. Lautenbach was a Partner/Advisory Partner at Clayton, Dubilier & Rice, LLC (private equity investment, 1998-2010), as well as a Director of Sony Corporation (2006-2007). |
David A. Rosow (1942) |
Year of Election or Appointment: 2013 Trustee |
| Mr. Rosow also serves as Trustee of other Fidelity funds. Mr. Rosow is Chairman and Chief Executive Officer of International Golf Group, Inc. (golf course development, 1989-present). Previously, Mr. Rosow served as Chairman and Chief Executive Officer of Rosow & Company, Inc. (private investment company, 1989-2011), a Lead Director of Hudson United Bancorp (2001-2006) and as a Director of TD Banknorth (1996-2006). In addition, Mr. Rosow is a member (2008-present) and President (2009-present) of the Town Council of Palm Beach, Florida. Mr. Rosow served as a Member of the Advisory Board of other Fidelity funds (2012-2013). |
Garnett A. Smith (1947) |
Year of Election or Appointment: 2013 Trustee |
| Mr. Smith also serves as Trustee of other Fidelity funds. Prior to Mr. Smith's retirement, he served as Chairman and Chief Executive Officer of Inbrand Corp. (manufacturer of personal absorbent products, 1990-1997). He also served as President (1986-1990) of Inbrand Corp. Prior to his employment with Inbrand Corp., he was employed by a retail fabric chain and North Carolina National Bank. In addition, Mr. Smith is a board member of the Jackson Hole Land Trust (2009-present). Mr. Smith served as a Member of the Advisory Board of other Fidelity funds (2012-2013). |
William S. Stavropoulos (1939) |
Year of Election or Appointment: 2001 Trustee |
| Mr. Stavropoulos also serves as Trustee of other Fidelity funds. Mr. Stavropoulos serves as President and Founder of the Michigan Baseball Foundation, the Great Lakes Loons (2007-present). Mr. Stavropoulos is Chairman Emeritus of the Board of Directors of The Dow Chemical Company, where he previously served in numerous senior management positions, including President, CEO (1995-2000; 2002-2004), Chairman of the Executive Committee (2000-2006), and as a member of the Board of Directors (1990-2006). Currently, Mr. Stavropoulos is Chairman of the Board of Directors of Univar Inc. (global distributor of commodity and specialty chemicals), a Director of Teradata Corporation (data warehousing and technology solutions), and Maersk Inc. (industrial conglomerate), and a member of the Advisory Board for Metalmark Capital LLC (private equity investment, 2005-present). Mr. Stavropoulos is an operating advisor to Clayton, Dubilier & Rice, LLC (private equity investment). In addition, Mr. Stavropoulos is a member of the University of Notre Dame Advisory Council for the College of Science, a Trustee of the Rollin L. Gerstacker Foundation, and a Director of the Naples Philharmonic Center for the Arts. Previously, Mr. Stavropoulos served as a Director of Chemical Financial Corporation (bank holding company, 1993-2012) and Tyco International, Ltd. (multinational manufacturing and services, 2007-2012). |
Michael E. Wiley (1950) |
Year of Election or Appointment: 2008 Trustee Chairman of the Independent Trustees |
| Mr. Wiley also serves as Trustee of other Fidelity funds. Mr. Wiley serves as a Director of Asia Pacific Exploration Consolidated (international oil and gas exploration and production, 2008-present). Mr. Wiley serves as a Director of Tesoro Corporation (independent oil refiner and marketer, 2005-present), and a Director of Bill Barrett Corporation (exploration and production, 2005-present). In addition, Mr. Wiley also serves as a Director of Post Oak Bank (privately-held bank, 2004-present). Previously, Mr. Wiley served as a Trustee of other Fidelity funds (2008-2013), as a member of the Board of Trustees of the University of Tulsa (2000-2006; 2007-2010), as a Senior Energy Advisor of Katzenbach Partners, LLC (consulting, 2006-2007), as an Advisory Director of Riverstone Holdings (private investment), Chairman, President, and CEO of Baker Hughes, Inc. (oilfield services, 2000-2004), and as Director of Spinnaker Exploration Company (exploration and production, 2001-2005). |
+ The information above includes each Trustee's principal occupation during the last five years and other information relating to the experience, attributes, and skills relevant to each Trustee's qualifications to serve as a Trustee, which led to the conclusion that each Trustee should serve as a Trustee for the fund.
Officers:
Except for Anthony R. Rochte, correspondence intended for each officer may be sent to Fidelity Investments, 245 Summer Street, Boston, Massachusetts 02210. Correspondence intended for Mr. Rochte may be sent to SelectCo, 1225 17th Street, Denver, Colorado 80202-5541. Officers appear below in alphabetical order.
Name, Year of Birth; Principal Occupation |
Christopher S. Bartel (1971) |
Year of Election or Appointment: 2009 Vice President |
| Mr. Bartel also serves as Vice President of other funds. Mr. Bartel serves as a Director, President, and Chief Executive Officer of Fidelity Management & Research (Japan) Inc. (2012-present), a Director of Fidelity Management & Research (Hong Kong) (2012-present), and Senior Vice President of Global Equity Research (2010-present). Previously, Mr. Bartel served as Senior Vice President of Equity Research (2009-2010), Managing Director of Research (2006-2009), and an analyst and portfolio manager (2000-2006). |
Elizabeth Paige Baumann (1968) |
Year of Election or Appointment: 2012 Anti-Money Laundering (AML) Officer |
| Ms. Baumann also serves as AML Officer of other funds. She is Chief AML Officer of FMR LLC (2012-present) and is an employee of Fidelity Investments. Previously, Ms. Baumann served as Vice President and Deputy Anti-Money Laundering Officer (2007-2012). |
Marc Bryant (1966) |
Year of Election or Appointment: 2013 Secretary and Chief Legal Officer (CLO) |
| Mr. Bryant also serves as an officer of other funds. He is Senior Vice President and Deputy General Counsel of FMR LLC. Prior to joining Fidelity Investments, Mr. Bryant served as a Senior Vice President and the Head of Global Retail Legal for AllianceBernstein L.P. (2006-2010), and as the General Counsel for ProFund Advisors LLC (2001-2006). |
William C. Coffey (1969) |
Year of Election or Appointment: 2009 Assistant Secretary |
| Mr. Coffey also serves as Assistant Secretary of other funds. He is Senior Vice President and Deputy General Counsel of FMR LLC (2010-present), and is an employee of Fidelity Investments. Previously, Mr. Coffey served as Vice President and Associate General Counsel of FMR LLC (2005-2009). |
Jonathan Davis (1968) |
Year of Election or Appointment: 2010 Assistant Treasurer |
| Mr. Davis also serves as Assistant Treasurer of other funds. Mr. Davis is an employee of Fidelity Investments. Previously, Mr. Davis served as Vice President and Associate General Counsel of FMR LLC (2003-2010). |
Adrien E. Deberghes (1967) |
Year of Election or Appointment: 2013 President and Treasurer |
| Mr. Deberghes also serves as an officer of other funds. He is an employee of Fidelity Investments (2008-present). Prior to joining Fidelity Investments, Mr. Deberghes was Senior Vice President of Mutual Fund Administration at State Street Corporation (2007-2008), Senior Director of Mutual Fund Administration at Investors Bank & Trust (2005-2007), and Director of Finance for Dunkin' Brands (2000-2005). |
Stephanie J. Dorsey (1969) |
Year of Election or Appointment: 2010 Assistant Treasurer |
| Ms. Dorsey also serves as an officer of other funds. She is an employee of Fidelity Investments (2008-present) and has served in other fund officer roles. Prior to joining Fidelity Investments, Ms. Dorsey served as Treasurer (2004-2008) of the JPMorgan Mutual Funds and Vice President (2004-2008) of JPMorgan Chase Bank. |
Joseph A. Hanlon (1968) |
Year of Election or Appointment: 2012 Chief Compliance Officer |
| Mr. Hanlon also serves as Chief Compliance Officer of other funds. Mr. Hanlon serves as Compliance Officer of FMR, FMR Co., Inc., Fidelity Investments Money Management, Inc. (FIMM), Fidelity Research and Analysis Company (FRAC), and Fidelity Management & Research (Hong Kong) (2009-present), as Senior Vice President of the Fidelity Asset Management Division (2009-present), and is an employee of Fidelity Investments. Previously, Mr. Hanlon served as Compliance Officer of Fidelity Management & Research (Japan) Inc. (2009-2013), Strategic Advisers, Inc. (2009-2013), and Fidelity Management & Research (U.K.) Inc. (2009-2013). |
Brian B. Hogan (1964) |
Year of Election or Appointment: 2009 Vice President |
| Mr. Hogan also serves as Vice President of other funds. Mr. Hogan serves as President of FMR's Equity Division (2009-present). Previously, Mr. Hogan served as Senior Vice President, Equity Research of FMR (2006-2009) and as a portfolio manager. |
Chris Maher (1972) |
Year of Election or Appointment: 2013 Assistant Treasurer |
| Mr. Maher serves as Assistant Treasurer of other funds. Mr. Maher is Vice President of Valuation Oversight and is an employee of Fidelity Investments. Previously, Mr. Maher served as Vice President of Asset Management Compliance (2013), Vice President of FMR's Program Management Group (2010-2013), and Vice President of Valuation Oversight (2008-2010). |
Christine Reynolds (1958) |
Year of Election or Appointment: 2008 Chief Financial Officer |
| Ms. Reynolds also serves as Chief Financial Officer of other funds. Ms. Reynolds became President of Fidelity Pricing and Cash Management Services (FPCMS) in August 2008. Ms. Reynolds served as Chief Operating Officer of FPCMS (2007-2008). Previously, Ms. Reynolds served as President, Treasurer, and Anti-Money Laundering officer of the Fidelity funds (2004-2007). |
Kenneth B. Robins (1969) |
Year of Election or Appointment: 2013 Deputy Treasurer |
| Mr. Robins also serves as an officer of other funds. Mr. Robins serves as Executive Vice President of Fidelity Investments Money Management, Inc. (FIMM) (2013-present) and is an employee of Fidelity Investments (2004-present). Previously, Mr. Robins served in other fund officer roles. |
Anthony R. Rochte (1968) |
Year of Election or Appointment: 2013 Vice President |
| Mr. Rochte also serves as Vice President of other funds. Mr. Rochte serves as President of Fidelity SelectCo, LLC (2012-present) and is an employee of Fidelity Investments (2012-present). Prior to joining Fidelity Investments, Mr. Rochte served as Senior Managing Director and head of State Street Global Advisors' North American Intermediary Business Group (2006-2012). |
Stacie M. Smith (1974) |
Year of Election or Appointment: 2013 Assistant Treasurer |
| Ms. Smith also serves as an officer of other funds. She is an employee of Fidelity Investments (2009-present) and has served in other fund officer roles. Prior to joining Fidelity Investments, Ms. Smith served as Senior Audit Manager of Ernst & Young LLP (1996-2009). |
Renee Stagnone (1975) |
Year of Election or Appointment: 2013 Deputy Treasurer |
| Ms. Stagnone also serves as Deputy Treasurer of other funds. Ms. Stagnone is an employee of Fidelity Investments. |
Joseph F. Zambello (1957) |
Year of Election or Appointment: 2011 Deputy Treasurer |
| Mr. Zambello also serves as Deputy Treasurer of other funds. Mr. Zambello is an employee of Fidelity Investments. Previously, Mr. Zambello served as Vice President of FMR's Program Management Group (2009-2011) and Vice President of the Transfer Agent Oversight Group (2005-2009). |
Annual Report
The Board of Trustees of VIP Technology Portfolio voted to pay to shareholders of record at the opening of business on record date, the following distributions per share derived from capital gains realized from sales of portfolio securities:
| Pay Date | Record Date | Capital Gains |
Initial Class | 02/14/2014 | 02/14/2014 | $1.498 |
Investor Class | 02/14/2014 | 02/14/2014 | $1.498 |
The fund hereby designates as a capital gain dividend with respect to the taxable year ended December 2013, $22,716,575, or, if subsequently determined to be different, the net capital gain of such year.
Initial Class designates 11% and Investor Class designates 12% of the dividends distributed in December 2013, during the fiscal year as qualifying for the dividends-received deduction for corporate shareholders.
Annual Report
A special meeting of Technology Portfolio's shareholders was held on May 14, 2013. The results of votes taken among shareholders on the proposals before them are reported below. Each vote reported represents one dollar of net asset value held on the record date for the meeting.
PROPOSAL 1 |
To elect a Board of Trustees.A |
| # of
Votes | % of
Votes |
Ned C. Lautenbach |
Affirmative | 1,555,133,782.46 | 93.955 |
Withheld | 100,063,694.32 | 6.045 |
TOTAL | 1,655,197,476.78 | 100.000 |
Ronald P. O'Hanley |
Affirmative | 1,557,988,095.28 | 94.128 |
Withheld | 97,209,381.50 | 5.872 |
TOTAL | 1,655,197,476.78 | 100.000 |
David A. Rosow |
Affirmative | 1,552,645,347.31 | 93.805 |
Withheld | 102,552,129.47 | 6.195 |
TOTAL | 1,655,197,476.78 | 100.000 |
Garnett A. Smith |
Affirmative | 1,554,582,880.53 | 93.922 |
Withheld | 100,614,596.25 | 6.078 |
TOTAL | 1,655,197,476.78 | 100.000 |
William S. Stavropoulos |
Affirmative | 1,548,352,452.21 | 93.545 |
Withheld | 106,845,024.57 | 6.455 |
TOTAL | 1,655,197,476.78 | 100.000 |
Michael E. Wiley |
Affirmative | 1,556,790,374.70 | 94.055 |
Withheld | 98,407,102.08 | 5.945 |
TOTAL | 1,655,197,476.78 | 100.000 |
PROPOSAL 2 |
To approve a management contract between the fund and Fidelity SelectCo, LLC. |
| # of
Votes | % of
Votes |
Affirmative | 139,361,571.22 | 92.774 |
Against | 4,452,691.94 | 2.964 |
Abstain | 6,403,225.88 | 4.262 |
TOTAL | 150,217,489.04 | 100.000 |
A Denotes trust-wide proposal and voting results. |
Annual Report
Investment Adviser
Fidelity SelectCo, LLC
Denver, CO
Investment Sub-Advisers
FMR Co., Inc.
Fidelity Management & Research (U.K.) Inc.
Fidelity Management & Research (Hong Kong) Limited
Fidelity Management & Research (Japan) Inc.
General Distributor
Fidelity Distributors Corporation
Smithfield, RI
Transfer and Service Agents
Fidelity Investments Institutional Operations Company, Inc.
Boston, MA
Fidelity Service Company, Inc.
Boston, MA
Custodian
JPMorgan Chase Bank
New York, NY
VTECIC-ANN-0214
1.817385.108
Fidelity® Variable Insurance Products:
Telecommunications Portfolio
Annual Report
December 31, 2013
(Fidelity Cover Art)
Contents
Performance | (Click Here) | How the fund has done over time. |
Management's Discussion of Fund Performance | (Click Here) | The Portfolio Manager's review of fund performance and strategy. |
Shareholder Expense Example | (Click Here) | An example of shareholder expenses. |
Investment Changes | (Click Here) | A summary of major shifts in the fund's investments over the past six months. |
Investments | (Click Here) | A complete list of the fund's investments with their market values. |
Financial Statements | (Click Here) | Statements of assets and liabilities, operations, and changes in net assets, as well as financial highlights. |
Notes | (Click Here) | Notes to the financial statements. |
Report of Independent Registered Public Accounting Firm | (Click Here) | |
Trustees and Officers | (Click Here) | |
Distributions | (Click Here) | |
Proxy Voting Results | (Click Here) | |
To view a fund's proxy voting guidelines and proxy voting record for the 12-month period ended June 30, visit http://www.fidelity.com/proxyvotingresults or visit the Securities and Exchange Commission's (SEC) web site at http://www.sec.gov. You may also call 1-877-208-0098 to request a free copy of the proxy voting guidelines.
Fidelity® Variable Insurance Products are separate account options which are purchased through a variable insurance contract.
Standard & Poor's, S&P and S&P 500 are registered service marks of The McGraw-Hill Companies, Inc. and have been licensed for use by Fidelity Distributors Corporation.
Other third-party marks appearing herein are the property of their respective owners.
All other marks appearing herein are registered or unregistered trademarks or service marks of FMR LLC or an affiliated company. © 2014 FMR LLC. All rights reserved.
This report and the financial statements contained herein are submitted for the general information of the shareholders of the fund. This report is not authorized for distribution to prospective investors in the fund unless preceded or accompanied by an effective prospectus.
A fund files its complete schedule of portfolio holdings with the SEC for the first and third quarters of each fiscal year on Form N-Q. Forms N-Q are available on the SEC's web site at http://www.sec.gov. A fund's Forms N-Q may be reviewed and copied at the SEC's Public Reference Room in Washington, DC. Information regarding the operation of the SEC's Public Reference Room may be obtained by calling 1-800-SEC-0330. For a complete list of a fund's portfolio holdings, view the most recent holdings listing, semiannual report, or annual report on Fidelity's web site at http://www.fidelity.com, http://www.advisor.fidelity.com, or http://www.401k.com, as applicable.
NOT FDIC INSURED • MAY LOSE VALUE • NO BANK GUARANTEE
Neither the fund nor Fidelity Distributors Corporation is a bank.
Annual Report
Average annual total return reflects the change in the value of an investment, assuming reinvestment of the class' distributions from dividend income and capital gains (the profits earned upon the sale of securities that have grown in value, if any) and assuming a constant rate of performance each year. During periods of reimbursement by Fidelity, a fund's total return will be greater than it would be had the reimbursement not occurred. Performance numbers are net of all underlying fund operating expenses, but do not include any insurance charges imposed by your insurance company's separate account. If performance information included the effect of these additional charges, the total returns would have been lower. How a fund did yesterday is no guarantee of how it will do tomorrow.
Average Annual Total Returns
Periods ended December 31, 2013 | Past 1
year | Past 5
years | Life of
fundA |
VIP Telecommunications Portfolio - Initial Class | 21.28% | 19.98% | 3.90% |
VIP Telecommunications Portfolio - Investor Class | 21.27% | 19.88% | 3.81% |
A From April 24, 2007.
$10,000 Over Life of Fund
Let's say hypothetically that $10,000 was invested in VIP Telecommunications Portfolio - Initial Class on April 24, 2007, when the fund started. The chart shows how the value of your investment would have changed, and also shows how the S&P 500® Index performed over the same period.
Annual Report
Market Recap: Global equity markets remained upbeat for the 12 months ending December 31, 2013, propelling the MSCI® ACWI® (All Country World Index) Index to a 23.24% return. Midyear turbulence gave way by autumn when policymakers in the U.S. and China had made clear their intentions to maintain accommodative monetary policies. That stance, combined with modest cyclical improvement around the globe and generally low valuations, underpinned the broad rally in equities, although the relative strength of the U.S. dollar generally tempered gains for U.S. investors holding foreign securities based in local currencies. During the period, the broad-market S&P 500® Index set a series of new highs, finishing the year up 32.39%. For the first time since 1995, the S&P® scored a "perfect 10," with all 10 economic sectors gaining at least 10% for the year. A resurgence in growth-oriented stocks lifted the Nasdaq Composite Index® to a 40.12% result for 2013, while the blue-chip Dow Jones Industrial AverageSM notched a relatively more modest 29.65% gain. International developed-markets equities rose in concert with their U.S. counterparts, with the MSCI® EAFE® Index gaining 22.92% for the period. Meanwhile, foreign exchange and commodity weakness curbed results in resource-heavy emerging markets (EM), especially in the year's waning months. More generally, concern over EM's slowing growth, its declining share of global trade and uncertainty surrounding U.S. central bank intentions were all factors hampering performance. The MSCI Emerging Markets Index returned -2.27% for the period. On the bond side, U.S. high-yield securities rallied with equities for much of the period, with The BofA Merrill LynchSM US High Yield Constrained Index returning 7.41% for 2013. The more rate-sensitive U.S. investment-grade bond category faced headwinds though, as reflected in the -2.02% return of the Barclays® U.S. Aggregate Bond Index. Within the Barclays index, investment-grade corporate credit returned -2.01%, while ultra-safe U.S. Treasuries saw a -2.75% result. Major non-U.S. developed markets performed only slightly better, with the Citigroup® Non-USD Group-of-Seven (G7) Equal Weighted Index logging a -1.59% result. After several years of strong advances, EM debt reversed course in 2013, with the J.P. Morgan Emerging Markets Bond Index Global returning -6.58%.
Comments from Matthew Drukker, Portfolio Manager of VIP Telecommunications Portfolio: For the year, the fund's share classes underperformed the MSCI® U.S. IMI Telecommunications Services 25-50 Index, which gained 24.12%, and the broad-market S&P 500®. (For specific portfolio results, please refer to the performance section of this report). Underweighting Sprint - which dropped Nextel from its name in July after SoftBank became majority owner of the firm - was the biggest individual detractor. The stock outperformed later in the period amid reports of SoftBank's potential bid for T-Mobile. A smaller-than-index position in Leap Wireless International also was detrimental. The stock surged in June when AT&T agreed to purchase the prepaid wireless carrier in a cash bid worth $1.2 billion. Conversely, underweighting telecom stalwart AT&T was by far the fund's biggest relative contributor. AT&T's shares rode a wave of volatility during the year before finishing the period well below the benchmark. Investors' renewed concern that competitive threats, predominantly from T-Mobile, could hinder future profit margins and growth weighed on the stock for most of the year. Consequently, an overweighting, on average, in T-Mobile also was the right call. Shares took off in December amid reports that Japan-based SoftBank - the parent company of Sprint - was preparing a bid for the firm. The deal, said to be valued at around $30 billion, could make the resulting company the second-largest telecom service provider in the world in terms of wireless revenues.
The views expressed above reflect those of the portfolio manager(s) only through the end of the period as stated on the cover of this report and do not necessarily represent the views of Fidelity or any other person in the Fidelity organization. Any such views are subject to change at any time based upon market or other conditions and Fidelity disclaims any responsibility to update such views. These views may not be relied on as investment advice and, because investment decisions for a Fidelity fund are based on numerous factors, may not be relied on as an indication of trading intent on behalf of any Fidelity fund.
Annual Report
As a shareholder of the Fund, you incur two types of costs: (1) transaction costs, including redemption fees and (2) ongoing costs, including management fees and other Fund expenses. This Example is intended to help you understand your ongoing costs (in dollars) of investing in the Fund and to compare these costs with the ongoing costs of investing in other mutual funds.
The Example is based on an investment of $1,000 invested at the beginning of the period and held for the entire period (July 1, 2013 to December 31, 2013).
Actual Expenses
The first line of the accompanying table for each class of the Fund provides information about actual account values and actual expenses. You may use the information in this line, together with the amount you invested, to estimate the expenses that you paid over the period. Simply divide your account value by $1,000.00 (for example, an $8,600 account value divided by $1,000.00 = 8.6), then multiply the result by the number in the first line for a class of the Fund under the heading entitled "Expenses Paid During Period" to estimate the expenses you paid on your account during this period. The estimate of expenses does not include any fees or other expenses of any variable annuity or variable life insurance product. If they were, the estimate of expenses you paid during the period would be higher, and your ending account value would be lower. In addition, the Fund, as a shareholder in the underlying Fidelity Central Funds, will indirectly bear its pro-rata share of the fees and expenses incurred by the underlying Fidelity Central Funds. These fees and expenses are not included in the Fund's annualized expense ratio used to calculate the expense estimate in the table below.
Hypothetical Example for Comparison Purposes
The second line of the accompanying table for each class of the Fund provides information about hypothetical account values and hypothetical expenses based on a Class' actual expense ratio and an assumed rate of return of 5% per year before expenses, which is not the Class' actual return. The hypothetical account values and expenses may not be used to estimate the actual ending account balance or expenses you paid for the period. You may use this information to compare the ongoing costs of investing in the Fund and other funds. To do so, compare this 5% hypothetical example with the 5% hypothetical examples that appear in the shareholder reports of the other funds. The estimate of expenses does not include any fees or other expenses of any variable annuity or variable life insurance product. If they were, the estimate of expenses you paid during the period would be higher, and your ending account value would be lower. In addition, the Fund, as a shareholder in the underlying Fidelity Central Funds, will indirectly bear its pro-rata share of the fees and expenses incurred by the underlying Fidelity Central Funds. These fees and expenses are not included in the Fund's annualized expense ratio used to calculate the expense estimate in the table below.
Please note that the expenses shown in the table are meant to highlight your ongoing costs only and do not reflect any transaction costs. Therefore, the second line of the table is useful in comparing ongoing costs only, and will not help you determine the relative total costs of owning different funds. In addition, if these transactional costs were included, your costs would have been higher.
| Annualized
Expense Ratio B | Beginning
Account Value
July 1, 2013 | Ending
Account Value
December 31, 2013 | Expenses Paid
During Period*
July 1, 2013
to December 31, 2013 |
Initial Class | 1.00% | | | |
Actual | | $ 1,000.00 | $ 1,097.90 | $ 5.29 |
HypotheticalA | | $ 1,000.00 | $ 1,020.16 | $ 5.09 |
Investor Class | 1.07% | | | |
Actual | | $ 1,000.00 | $ 1,097.30 | $ 5.66 |
HypotheticalA | | $ 1,000.00 | $ 1,019.81 | $ 5.45 |
A 5% return per year before expenses
B Annualized expense ratio reflects expenses net of applicable fee waivers.
* Expenses are equal to each Class' annualized expense ratio, multiplied by the average account value over the period, multiplied by 184/365 (to reflect the one-half year period).
Annual Report
Investment Changes (Unaudited)
Top Ten Stocks as of December 31, 2013 |
| % of fund's
net assets | % of fund's net assets
6 months ago |
Verizon Communications, Inc. | 18.3 | 24.2 |
AT&T, Inc. | 13.5 | 8.5 |
American Tower Corp. | 7.9 | 6.6 |
SBA Communications Corp. Class A | 5.4 | 5.5 |
T-Mobile U.S., Inc. | 4.8 | 2.7 |
CenturyLink, Inc. | 3.9 | 4.9 |
Telephone & Data Systems, Inc. | 3.2 | 2.2 |
Crown Castle International Corp. | 2.7 | 4.2 |
Level 3 Communications, Inc. | 2.7 | 2.8 |
Lumos Networks Corp. | 2.2 | 2.0 |
| 64.6 | |
Top Industries (% of fund's net assets) |
As of December 31, 2013 |
 | Diversified Telecommunication Services | 59.9% | |
 | Wireless Telecommunication Services | 26.3% | |
 | Real Estate Investment Trusts | 8.6% | |
 | Media | 1.9% | |
 | Internet Software & Services | 0.9% | |
 | All Others* | 2.4% | |

As of June 30, 2013 |
| Diversified Telecommunication Services | 57.6% | |
| Wireless Telecommunication Services | 27.3% | |
| Real Estate Investment Trusts | 6.6% | |
| Media | 2.8% | |
| Internet Software & Services | 0.8% | |
| All Others* | 4.9% | |

* Includes short-term investments and net other assets (liabilities). |
Annual Report
Investments December 31, 2013
Showing Percentage of Net Assets
Common Stocks - 98.4% |
| Shares | | Value |
DIVERSIFIED TELECOMMUNICATION SERVICES - 59.4% |
Alternative Carriers - 14.4% |
8x8, Inc. (a) | 28,600 | | $ 290,576 |
Cogent Communications Group, Inc. | 10,690 | | 431,983 |
inContact, Inc. (a) | 20,531 | | 160,347 |
Iridium Communications, Inc. (a) | 32,444 | | 203,099 |
Level 3 Communications, Inc. (a) | 17,464 | | 579,281 |
Lumos Networks Corp. | 22,518 | | 472,878 |
Premiere Global Services, Inc. (a) | 24,012 | | 278,299 |
Towerstream Corp. (a) | 39,720 | | 117,571 |
TW Telecom, Inc. (a) | 13,433 | | 409,304 |
Vonage Holdings Corp. (a) | 55,400 | | 184,482 |
| | 3,127,820 |
Integrated Telecommunication Services - 45.0% |
AT&T, Inc. | 82,838 | | 2,912,584 |
Atlantic Tele-Network, Inc. | 6,600 | | 373,362 |
Bezeq The Israeli Telecommunication Corp. Ltd. | 78,100 | | 132,379 |
BT Group PLC | 19,500 | | 122,966 |
CenturyLink, Inc. | 26,819 | | 854,185 |
Cincinnati Bell, Inc. (a) | 61,539 | | 219,079 |
Consolidated Communications Holdings, Inc. | 2,900 | | 56,927 |
Frontier Communications Corp. | 101,614 | | 472,505 |
General Communications, Inc. Class A (a) | 25,429 | | 283,533 |
Hawaiian Telcom Holdco, Inc. (a) | 5,300 | | 155,661 |
IDT Corp. Class B | 5,654 | | 101,037 |
Telekomunikacja Polska SA | 73 | | 237 |
Verizon Communications, Inc. | 80,744 | | 3,967,760 |
Windstream Holdings, Inc. | 10,000 | | 79,800 |
| | 9,732,015 |
TOTAL DIVERSIFIED TELECOMMUNICATION SERVICES | | 12,859,835 |
INTERNET SOFTWARE & SERVICES - 0.9% |
Internet Software & Services - 0.9% |
Equinix, Inc. (a) | 599 | | 106,293 |
Rackspace Hosting, Inc. (a) | 2,300 | | 89,999 |
| | 196,292 |
IT SERVICES - 0.5% |
IT Consulting & Other Services - 0.5% |
InterXion Holding N.V. (a) | 4,720 | | 111,439 |
|
| Shares | | Value |
MEDIA - 1.9% |
Cable & Satellite - 1.9% |
DISH Network Corp. Class A | 2,500 | | $ 144,800 |
Liberty Global PLC: | | | |
Class A (a) | 50 | | 4,450 |
Class C (a) | 2,200 | | 185,504 |
Shaw Communications, Inc. Class B | 3,200 | | 77,872 |
| | 412,626 |
REAL ESTATE INVESTMENT TRUSTS - 8.6% |
Office REITs - 0.7% |
CyrusOne, Inc. | 7,000 | | 156,310 |
Specialized REITs - 7.9% |
American Tower Corp. | 21,382 | | 1,706,711 |
TOTAL REAL ESTATE INVESTMENT TRUSTS | | 1,863,021 |
SEMICONDUCTORS & SEMICONDUCTOR EQUIPMENT - 0.6% |
Semiconductors - 0.6% |
Broadcom Corp. Class A | 4,600 | | 136,390 |
SOFTWARE - 0.2% |
Application Software - 0.2% |
Synchronoss Technologies, Inc. (a) | 1,201 | | 37,315 |
WIRELESS TELECOMMUNICATION SERVICES - 26.3% |
Wireless Telecommunication Services - 26.3% |
Boingo Wireless, Inc. (a) | 26,942 | | 172,698 |
Crown Castle International Corp. (a) | 8,031 | | 589,716 |
KDDI Corp. | 2,300 | | 141,715 |
Leap Wireless International, Inc. (a) | 18,500 | | 321,900 |
Millicom International Cellular SA (depository receipt) | 1,300 | | 129,457 |
NII Holdings, Inc. (a) | 129,954 | | 357,374 |
NTELOS Holdings Corp. | 5,500 | | 111,265 |
SBA Communications Corp. Class A (a) | 13,068 | | 1,174,029 |
Shenandoah Telecommunications Co. | 5,837 | | 149,836 |
Sprint Corp. (a) | 4,988 | | 53,621 |
T-Mobile U.S., Inc. (a) | 30,878 | | 1,038,736 |
Tele2 AB (B Shares) | 8,300 | | 94,010 |
Telephone & Data Systems, Inc. | 27,125 | | 699,283 |
U.S. Cellular Corp. | 5,300 | | 221,646 |
Vodafone Group PLC sponsored ADR | 10,949 | | 430,405 |
| | 5,685,691 |
TOTAL COMMON STOCKS (Cost $19,100,749) |
21,302,609
|
Nonconvertible Preferred Stocks - 0.5% |
| Shares | | Value |
DIVERSIFIED TELECOMMUNICATION SERVICES - 0.5% |
Integrated Telecommunication Services - 0.5% |
Oi SA sponsored | 32,343 | | $ 51,425 |
Telefonica Brasil SA sponsored | 3,000 | | 57,660 |
TOTAL NONCONVERTIBLE PREFERRED STOCKS (Cost $110,578) |
109,085
|
Money Market Funds - 1.5% |
| | | |
Fidelity Cash Central Fund, 0.11% (b)
(Cost $324,545) | 324,545 | |
324,545
|
TOTAL INVESTMENT PORTFOLIO - 100.4% (Cost $19,535,872) | | 21,736,239 |
NET OTHER ASSETS (LIABILITIES) - (0.4)% | | (89,317) |
NET ASSETS - 100% | $ 21,646,922 |
Legend |
(a) Non-income producing |
(b) Affiliated fund that is generally available only to investment companies and other accounts managed by Fidelity Investments. The rate quoted is the annualized seven-day yield of the fund at period end. A complete unaudited listing of the fund's holdings as of its most recent quarter end is available upon request. In addition, each Fidelity Central Fund's financial statements, which are not covered by the Fund's Report of Independent Registered Public Accounting Firm, are available on the SEC's website or upon request. |
Affiliated Central Funds |
Information regarding fiscal year to date income earned by the Fund from investments in Fidelity Central Funds is as follows: |
Fund | Income earned |
Fidelity Cash Central Fund | $ 556 |
Other Information |
The following is a summary of the inputs used, as of December 31, 2013, involving the Fund's assets and liabilities carried at fair value. The inputs or methodology used for valuing securities may not be an indication of the risk associated with investing in those securities. For more information on valuation inputs, and their aggregation into the levels used in the table below, please refer to the Investment Valuation section in the accompanying Notes to Financial Statements. |
Valuation Inputs at Reporting Date: |
Description | Total | Level 1 | Level 2 | Level 3 |
Investments in Securities: | | | | |
Common Stocks | $ 21,302,609 | $ 21,037,928 | $ 264,681 | $ - |
Nonconvertible Preferred Stocks | 109,085 | 109,085 | - | - |
Money Market Funds | 324,545 | 324,545 | - | - |
Total Investments in Securities: | $ 21,736,239 | $ 21,471,558 | $ 264,681 | $ - |
See accompanying notes which are an integral part of the financial statements.
Annual Report
Statement of Assets and Liabilities
| December 31, 2013 |
| | |
Assets | | |
Investment in securities, at value - See accompanying schedule: Unaffiliated issuers (cost $19,211,327) | $ 21,411,694 | |
Fidelity Central Funds (cost $324,545) | 324,545 | |
Total Investments (cost $19,535,872) | | $ 21,736,239 |
Cash | | 7,846 |
Foreign currency held at value (cost $1) | | 1 |
Receivable for investments sold | | 4,991 |
Receivable for fund shares sold | | 11,098 |
Dividends receivable | | 19,744 |
Distributions receivable from Fidelity Central Funds | | 9 |
Prepaid expenses | | 160 |
Receivable from investment adviser for expense reductions | | 295 |
Other receivables | | 1,286 |
Total assets | | 21,781,669 |
| | |
Liabilities | | |
Payable for fund shares redeemed | $ 87,456 | |
Accrued management fee | 9,927 | |
Audit fees payable | 32,328 | |
Other affiliated payables | 3,079 | |
Other payables and accrued expenses | 1,957 | |
Total liabilities | | 134,747 |
| | |
Net Assets | | $ 21,646,922 |
Net Assets consist of: | | |
Paid in capital | | $ 19,580,406 |
Accumulated undistributed net realized gain (loss) on investments and foreign currency transactions | | (133,469) |
Net unrealized appreciation (depreciation) on investments and assets and liabilities in foreign currencies | | 2,199,985 |
Net Assets | | $ 21,646,922 |
Statement of Assets and Liabilities - continued
| December 31, 2013 |
| | |
Initial Class:
Net Asset Value, offering price and redemption price per share ($4,535,181 ÷ 421,110 shares) | | $ 10.77 |
| | |
Investor Class:
Net Asset Value, offering price and redemption price per share ($17,111,741 ÷ 1,597,537 shares) | | $ 10.71 |
See accompanying notes which are an integral part of the financial statements.
Annual Report
Statement of Operations
| Year ended December 31, 2013 |
| | |
Investment Income | | |
Dividends | | $ 500,106 |
Income from Fidelity Central Funds | | 556 |
Total income | | 500,662 |
| | |
Expenses | | |
Management fee | $ 105,056 | |
Transfer agent fees | 28,999 | |
Accounting fees and expenses | 7,387 | |
Custodian fees and expenses | 15,810 | |
Independent trustees' compensation | 315 | |
Audit | 40,357 | |
Legal | 313 | |
Miscellaneous | 3,636 | |
Total expenses before reductions | 201,873 | |
Expense reductions | (4,321) | 197,552 |
Net investment income (loss) | | 303,110 |
Realized and Unrealized Gain (Loss) Net realized gain (loss) on: | | |
Investment securities: | | |
Unaffiliated issuers | 2,038,472 | |
Foreign currency transactions | 1,259 | |
Total net realized gain (loss) | | 2,039,731 |
Change in net unrealized appreciation (depreciation) on: Investment securities | 1,085,017 | |
Assets and liabilities in foreign currencies | (70) | |
Total change in net unrealized appreciation (depreciation) | | 1,084,947 |
Net gain (loss) | | 3,124,678 |
Net increase (decrease) in net assets resulting from operations | | $ 3,427,788 |
Statement of Changes in Net Assets
| Year ended
December 31,
2013 | Year ended
December 31,
2012 |
Increase (Decrease) in Net Assets | | |
Operations | | |
Net investment income (loss) | $ 303,110 | $ 236,318 |
Net realized gain (loss) | 2,039,731 | 415,404 |
Change in net unrealized appreciation (depreciation) | 1,084,947 | 1,249,666 |
Net increase (decrease) in net assets resulting from operations | 3,427,788 | 1,901,388 |
Distributions to shareholders from net investment income | (301,523) | (232,303) |
Distributions to shareholders from net realized gain | (601,725) | - |
Total distributions | (903,248) | (232,303) |
Share transactions - net increase (decrease) | 779,617 | 7,280,991 |
Redemption fees | 9,945 | 3,306 |
Total increase (decrease) in net assets | 3,314,102 | 8,953,382 |
| | |
Net Assets | | |
Beginning of period | 18,332,820 | 9,379,438 |
End of period (including undistributed net investment income of $0 and distributions in excess of net investment income of $106, respectively) | $ 21,646,922 | $ 18,332,820 |
See accompanying notes which are an integral part of the financial statements.
Annual Report
Financial Highlights - Initial Class
Years ended December 31, | 2013 | 2012 | 2011 | 2010 | 2009 |
Selected Per-Share Data | | | | | |
Net asset value, beginning of period | $ 9.27 | $ 7.81 | $ 8.10 | $ 7.01 | $ 4.81 |
Income from Investment Operations | | | | | |
Net investment income (loss) C | .17 | .17 | .13 | .11 | .09 |
Net realized and unrealized gain (loss) | 1.77 | 1.41 | (.31) | 1.10 | 2.21 |
Total from investment operations | 1.94 | 1.58 | (.18) | 1.21 | 2.30 |
Distributions from net investment income | (.15) | (.12) | (.12) | (.13) | (.11) |
Distributions from net realized gain | (.30) | - | - | - | - |
Total distributions | (.45) | (.12) | (.12) | (.13) | (.11) |
Redemption fees added to paid in capital C | .01 | - G | .01 | .01 | .01 |
Net asset value, end of period | $ 10.77 | $ 9.27 | $ 7.81 | $ 8.10 | $ 7.01 |
Total Return A, B | 21.28% | 20.24% | (2.00)% | 17.54% | 48.00% |
Ratios to Average Net Assets D, F | | | | | |
Expenses before reductions | 1.02% | 1.11% | 1.18% | 1.55% | 1.70% |
Expenses net of fee waivers, if any | 1.00% | 1.00% | 1.00% | 1.00% | 1.00% |
Expenses net of all reductions | .99% | .99% | .98% | .98% | .98% |
Net investment income (loss) | 1.64% | 1.94% | 1.58% | 1.57% | 1.55% |
Supplemental Data | | | | | |
Net assets, end of period (000 omitted) | $ 4,535 | $ 6,823 | $ 3,062 | $ 3,823 | $ 3,626 |
Portfolio turnover rate E | 136% | 55% | 115% | 93% | 167% |
A Total returns do not reflect charges attributable to your insurance company's separate account. Inclusion of these charges would reduce the total returns shown.
B Total returns would have been lower if certain expenses had not been reduced during the applicable periods shown.
C Calculated based on average shares outstanding during the period.
D Fees and expenses of any underlying Fidelity Central Funds are not included in the Fund's expense ratio. The Fund indirectly bears its proportionate share of the expenses of any underlying Fidelity Central Funds.
E Amount does not include the portfolio activity of any underlying Fidelity Central Funds.
F Expense ratios reflect operating expenses of the class. Expenses before reductions do not reflect amounts reimbursed by the investment adviser or reductions from brokerage service arrangements or reductions from other expense offset arrangements and do not represent the amount paid by the class during periods when reimbursements or reductions occur. Expenses net of fee waivers reflect expenses after reimbursement by the investment adviser but prior to reductions from brokerage service arrangements or other expense offset arrangements. Expenses net of all reductions represent the net expenses paid by the class.
G Amount represents less than $.01 per share.
Financial Highlights - Investor Class
Years ended December 31, | 2013 | 2012 | 2011 | 2010 | 2009 |
Selected Per-Share Data | | | | | |
Net asset value, beginning of period | $ 9.22 | $ 7.78 | $ 8.07 | $ 6.99 | $ 4.80 |
Income from Investment Operations | | | | | |
Net investment income (loss) C | .16 | .16 | .12 | .11 | .09 |
Net realized and unrealized gain (loss) | 1.77 | 1.40 | (.30) | 1.09 | 2.20 |
Total from investment operations | 1.93 | 1.56 | (.18) | 1.20 | 2.29 |
Distributions from net investment income | (.15) | (.12) | (.12) | (.13) | (.11) |
Distributions from net realized gain | (.30) | - | - | - | - |
Total distributions | (.45) | (.12) | (.12) | (.13) | (.11) |
Redemption fees added to paid in capital C | .01 | - G | .01 | .01 | .01 |
Net asset value, end of period | $ 10.71 | $ 9.22 | $ 7.78 | $ 8.07 | $ 6.99 |
Total Return A,B | 21.27% | 20.00% | (2.03)% | 17.45% | 47.90% |
Ratios to Average Net Assets D, F | | | | | |
Expenses before reductions | 1.07% | 1.18% | 1.24% | 1.61% | 1.78% |
Expenses net of fee waivers, if any | 1.07% | 1.08% | 1.08% | 1.08% | 1.08% |
Expenses net of all reductions | 1.06% | 1.07% | 1.06% | 1.07% | 1.07% |
Net investment income (loss) | 1.57% | 1.86% | 1.50% | 1.49% | 1.47% |
Supplemental Data | | | | | |
Net assets, end of period (000 omitted) | $ 17,112 | $ 11,510 | $ 6,317 | $ 5,661 | $ 3,629 |
Portfolio turnover rate E | 136% | 55% | 115% | 93% | 167% |
A Total returns do not reflect charges attributable to your insurance company's separate account. Inclusion of these charges would reduce the total returns shown.
B Total returns would have been lower if certain expenses had not been reduced during the applicable periods shown.
C Calculated based on average shares outstanding during the period.
D Fees and expenses of any underlying Fidelity Central Funds are not included in the Fund's expense ratio. The Fund indirectly bears its proportionate share of the expenses of any underlying Fidelity Central Funds.
E Amount does not include the portfolio activity of any underlying Fidelity Central Funds.
F Expense ratios reflect operating expenses of the class. Expenses before reductions do not reflect amounts reimbursed by the investment adviser or reductions from brokerage service arrangements or reductions from other expense offset arrangements and do not represent the amount paid by the class during periods when reimbursements or reductions occur. Expenses net of fee waivers reflect expenses after reimbursement by the investment adviser but prior to reductions from brokerage service arrangements or other expense offset arrangements. Expenses net of all reductions represent the net expenses paid by the class.
G Amount represents less than $.01 per share.
See accompanying notes which are an integral part of the financial statements.
Annual Report
Notes to Financial Statements
For the period ended December 31, 2013
1. Organization.
VIP Telecommunications Portfolio (the Fund) is a non-diversified fund of Variable Insurance Products Fund IV (the Trust) and is authorized to issue an unlimited number of shares. The Trust is registered under the Investment Company Act of 1940, as amended (the 1940 Act), as an open-end management investment company organized as a Massachusetts business trust. Shares of the Fund may only be purchased by insurance companies for the purpose of funding variable annuity or variable life insurance contracts. The Fund offers the following classes of shares: Initial Class shares and Investor Class shares. All classes have equal rights and voting privileges, except for matters affecting a single class.
2. Investments in Fidelity Central Funds.
The Fund invests in Fidelity Central Funds, which are open-end investment companies generally available only to other investment companies and accounts managed by the investment adviser and its affiliates. The Fund's Schedule of Investments lists each of the Fidelity Central Funds held as of period end, if any, as an investment of the Fund, but does not include the underlying holdings of each Fidelity Central Fund. As an Investing Fund, the Fund indirectly bears its proportionate share of the expenses of the underlying Fidelity Central Funds.
The Money Market Central Funds seek preservation of capital and current income and are managed by Fidelity Investments Money Management, Inc. (FIMM), an affiliate of the investment adviser. Annualized expenses of the Money Market Central Funds as of their most recent shareholder report date are less than .01%.
A complete unaudited list of holdings for each Fidelity Central Fund is available upon request or at the Securities and Exchange Commission (the SEC) website at www.sec.gov. In addition, the financial statements of the Fidelity Central Funds, which are not covered by the Fund's Report of Independent Registered Public Accounting Firm, are available on the SEC website or upon request.
3. Significant Accounting Policies.
The financial statements have been prepared in conformity with accounting principles generally accepted in the United States of America (GAAP), which require management to make certain estimates and assumptions at the date of the financial statements. Actual results could differ from those estimates. Subsequent events, if any, through the date that the financial statements were issued have been evaluated in the preparation of the financial statements. The following summarizes the significant accounting policies of the Fund:
Investment Valuation. Investments are valued as of 4:00 p.m. Eastern time on the last calendar day of the period. In accordance with valuation policies and procedures approved by the Board of Trustees (the Board), the Fund attempts to obtain prices from one or more third party pricing vendors or brokers to value its investments. When current market prices, quotations or currency exchange rates are not readily available or reliable, investments will be fair valued in good faith by the Fidelity SelectCo, LLC (SelectCo) Fair Value Committee (the Committee), in accordance with procedures adopted by the Board. Factors used in determining fair value vary by investment type and may include market or investment specific events. The frequency with which these procedures are used cannot be predicted and they may be utilized to a significant extent. The Committee oversees the Fund's valuation policies and procedures and is responsible for approving and reporting to the Board all fair value determinations.
The Fund categorizes the inputs to valuation techniques used to value its investments into a disclosure hierarchy consisting of three levels as shown below:
Level 1 - quoted prices in active markets for identical investments
Level 2 - other significant observable inputs (including quoted prices for similar investments, interest rates, prepayment speeds, etc.)
Level 3 - unobservable inputs (including the Fund's own assumptions based on the best information available)
Valuation techniques used to value the Fund's investments by major category are as follows:
Equity securities, including restricted securities, for which market quotations are readily available, are valued at the last reported sale price or official closing price as reported by a third party pricing vendor on the primary market or exchange on which they are traded and are categorized as Level 1 in the hierarchy. In the event there were no sales during the day or closing prices are not available, securities are valued at the last quoted bid price or may be valued using the last available price and are generally categorized as Level 2 in the hierarchy. For foreign equity securities, when market or security specific events arise, comparisons to the valuation of American Depositary Receipts (ADRs), futures contracts, Exchange-Traded Funds (ETFs) and certain indexes as well as quoted prices for similar securities may be used and would be categorized as Level 2 in the hierarchy. Utilizing these techniques may result in transfers between Level 1 and Level 2. For equity securities, including restricted securities, where observable inputs are limited, assumptions about market activity and risk are used and these securities may be categorized as Level 3 in the hierarchy.
Investments in open-end mutual funds, including the Fidelity Central Funds, are valued at their closing net asset value (NAV) each business day and are categorized as Level 1 in the hierarchy.
Annual Report
Notes to Financial Statements - continued
3. Significant Accounting Policies - continued
Investment Valuation - continued
Changes in valuation techniques may result in transfers in or out of an assigned level within the disclosure hierarchy. The aggregate value of investments by input level, as of December 31, 2013, is included at the end of the Fund's Schedule of Investments.
Foreign Currency. The Fund may use foreign currency contracts to facilitate transactions in foreign-denominated securities. Gains and losses from these transactions may arise from changes in the value of the foreign currency or if the counterparties do not perform under the contracts' terms.
Foreign-denominated assets, including investment securities, and liabilities are translated into U.S. dollars at the exchange rates at period end. Purchases and sales of investment securities, income and dividends received and expenses denominated in foreign currencies are translated into U.S. dollars at the exchange rate in effect on the transaction date.
The effects of exchange rate fluctuations on investments are included with the net realized and unrealized gain (loss) on investment securities. Other foreign currency transactions resulting in realized and unrealized gain (loss) are disclosed separately.
Investment Transactions and Income. For financial reporting purposes, the Fund's investment holdings and NAV include trades executed through the end of the last business day of the period. The NAV per share for processing shareholder transactions is calculated as of the close of business of the New York Stock Exchange (NYSE), normally 4:00 p.m. Eastern time and includes trades executed through the end of the prior business day. Gains and losses on securities sold are determined on the basis of identified cost. Dividend income is recorded on the ex-dividend date, except for certain dividends from foreign securities where the ex-dividend date may have passed, which are recorded as soon as the Fund is informed of the ex-dividend date. Non-cash dividends included in dividend income, if any, are recorded at the fair market value of the securities received. Distributions received on securities that represent a return of capital or capital gain are recorded as a reduction of cost of investments and/or as a realized gain. Subsequent to ex-dividend date the Fund determines the components of these distributions, based upon receipt of tax filings or other correspondence relating to the underlying investment. Interest income and distributions from the Fidelity Central Funds are accrued as earned. Investment income is recorded net of foreign taxes withheld where recovery of such taxes is uncertain.
Class Allocations and Expenses. Investment income, realized and unrealized capital gains and losses, common expenses of the Fund, and certain fund-level expense reductions, if any, are allocated daily on a pro-rata basis to each class based on the relative net assets of each class to the total net assets of the Fund. Each class differs with respect to transfer agent fees incurred. Certain expense reductions may also differ by class. For the reporting period, the allocated portion of income and expenses to each class as a percent of its average net assets may vary due to the timing of recording these transactions in relation to fluctuating net assets of the classes. Expenses directly attributable to a fund are charged to that fund. Expenses attributable to more than one fund are allocated among the respective funds on the basis of relative net assets or other appropriate methods. Expense estimates are accrued in the period to which they relate and adjustments are made when actual amounts are known.
Income Tax Information and Distributions to Shareholders. Each year, the Fund intends to qualify as a regulated investment company under Subchapter M of the Internal Revenue Code, including distributing substantially all of its taxable income and realized gains. As a result, no provision for U.S. Federal income taxes is required. As of December 31, 2013, the Fund did not have any unrecognized tax benefits in the financial statements; nor is the Fund aware of any tax positions for which it is reasonably possible that the total amounts of unrecognized tax benefits will significantly change in the next twelve months. The Fund files a U.S. federal tax return, in addition to state and local tax returns as required. The Fund's federal income tax returns are subject to examination by the Internal Revenue Service (IRS) for a period of three fiscal years after they are filed. State and local tax returns may be subject to examination for an additional fiscal year depending on the jurisdiction. Foreign taxes are provided for based on the Fund's understanding of the tax rules and rates that exist in the foreign markets in which it invests.
Distributions are declared and recorded on the ex-dividend date. Income dividends and capital gain distributions are declared separately for each class. Income and capital gain distributions are determined in accordance with income tax regulations, which may differ from GAAP. These differences resulted in distribution reclassifications.
Capital accounts within the financial statements are adjusted for permanent book-tax differences. These adjustments have no impact on net assets or the results of operations. Capital accounts are not adjusted for temporary book-tax differences which will reverse in a subsequent period.
Book-tax differences are primarily due to foreign currency transactions, capital loss carryforwards and losses deferred due to wash sales and excise tax regulations.
The federal tax cost of investment securities and unrealized appreciation (depreciation) as of period end were as follows:
Gross unrealized appreciation | $ 3,358,925 |
Gross unrealized depreciation | (1,328,169) |
Net unrealized appreciation (depreciation) on securities and other investments | $ 2,030,756 |
| |
Tax Cost | $ 19,705,483 |
Annual Report
3. Significant Accounting Policies - continued
Income Tax Information and Distributions to Shareholders - continued
The tax-based components of distributable earnings as of period end were as follows:
Undistributed long-term capital gain | $ 36,142 |
Net unrealized appreciation (depreciation) | $ 2,030,374 |
The tax character of distributions paid was as follows:
| December 31, 2013 | December 31, 2012 |
Ordinary Income | $ 301,523 | $ 232,303 |
Long-term Capital Gains | 601,725 | - |
Total | $ 903,248 | $ 232,303 |
Trading (Redemption) Fees. Shares held by investors less than 60 days may be subject to a redemption fee equal to 1% of the NAV of shares redeemed. All redemption fees, which reduce the proceeds of the shareholder redemption, are retained by the Fund and accounted for as an addition to paid in capital.
4. Purchases and Sales of Investments.
Purchases and sales of securities, other than short-term securities, aggregated $25,470,017 and $25,019,037, respectively.
5. Fees and Other Transactions with Affiliates.
Management Fee. Effective August 1, 2013, SelectCo replaced Fidelity Management and Research Company (FMR), an affiliate of SelectCo, as investment adviser to the Fund. The investment adviser and its affiliates provide the Fund with investment management related services for which the Fund pays a monthly management fee. The management fee is the sum of an individual fund fee rate that is based on an annual rate of .30% of the Fund's average net assets and an annualized group fee rate that averaged .25% during the period. The group fee rate is based upon the average net assets of all the mutual funds advised by FMR and the investment adviser. The group fee rate decreases as assets under management increase and increases as assets under management decrease. For the reporting period, the total annual management fee rate was .55% of the Fund's average net assets.
Transfer Agent Fees. Fidelity Investments Institutional Operations Company, Inc. (FIIOC), an affiliate of the investment adviser, is the Fund's transfer, dividend disbursing, and shareholder servicing agent. FIIOC receives an asset-based fee with respect to each class. Each class (with the exception of Investor Class) pays a transfer agent fee, excluding out of pocket expenses, equal to an annual rate of .07% of average net assets. Investor Class pays a monthly asset-based transfer agent fee of .15% of average net assets. In addition, FIIOC receives an asset-based fee of .0035% of average net assets for typesetting, printing and mailing of shareholder reports, except proxy statements. FIIOC voluntarily agreed to reimburse or waive this fee for the period January 1, 2013 through December 31, 2013 (see Expense Reductions note). For the period, transfer agent fees for each class, including printing and out of pocket expenses, were as follows:
Initial Class | $ 5,756 |
Investor Class | 23,243 |
| $ 28,999 |
Effective February 1, 2014, the Board of Trustees approved an amendment to the transfer agent fee agreement whereby each class (with the exception of Investor Class) pays a single fee of .07% of average net assets for transfer agent services, typesetting, printing and mailing of shareholder reports, excluding mailing of proxy statements and out of pocket expenses. Investor Class pays a single fee of .15% of average net assets.
Accounting Fees. Fidelity Service Company, Inc. (FSC), an affiliate of the investment adviser, maintains the Fund's accounting records. The fee is based on the level of average net assets for each month.
Brokerage Commissions. The Fund placed a portion of its portfolio transactions with brokerage firms which are affiliates of the investment adviser. Brokerage commissions are included in net realized gain (loss) and change in net unrealized appreciation (depreciation) in the Statement of Operations. The commissions paid to these affiliated firms were $2,016 for the period.
Annual Report
Notes to Financial Statements - continued
6. Committed Line of Credit.
The Fund participates with other funds managed by the investment adviser or an affiliate in a $4.25 billion credit facility (the "line of credit") to be utilized for temporary or emergency purposes to fund shareholder redemptions or for other short-term liquidity purposes. The Fund has agreed to pay commitment fees on its pro-rata portion of the line of credit, which amounted to $39 and is reflected in Miscellaneous expenses on the Statement of Operations. During the period, there were no borrowings on this line of credit.
7. Expense Reductions.
In addition to FIIOC reimbursing or waiving a portion of its transfer agent fees, the investment adviser voluntarily agreed to reimburse each class to the extent annual operating expenses exceeded certain levels of average net assets as noted in the table below. Some expenses, for example interest expense, including commitment fees, are excluded from this reimbursement.
Expenses were reimbursed and/or waived for the following classes during the period:
| Expense
Limitations | Reimbursement/ Waiver |
Initial Class | 1.00% | $ 925 |
Investor Class | 1.08% | 540 |
| | $ 1,465 |
Commissions paid to certain brokers with whom the investment adviser, or its affiliates, places trades on behalf of the Fund include an amount in addition to trade execution, which may be rebated back to the Fund to offset certain expenses. This amount totaled $2,856 for the period.
8. Distributions to Shareholders.
Distributions to shareholders of each class were as follows:
Years ended December 31, | 2013 | 2012 |
From net investment income | | |
Initial Class | $ 64,694 | $ 91,157 |
Investor Class | 236,829 | 141,146 |
Total | $ 301,523 | $ 232,303 |
From net realized gain | | |
Initial Class | $ 128,436 | $ - |
Investor Class | 473,289 | - |
Total | $ 601,725 | $ - |
9. Share Transactions.
Transactions for each class of shares were as follows:
| Shares | Dollars |
Years ended December 31, | 2013 | 2012 | 2013 | 2012 |
Initial Class | | | | |
Shares sold | 372,904 | 708,484 | $ 3,882,567 | $ 6,482,937 |
Reinvestment of distributions | 18,879 | 9,812 | 193,130 | 91,157 |
Shares redeemed | (706,884) | (374,228) | (7,038,963) | (3,317,324) |
Net increase (decrease) | (315,101) | 344,068 | $ (2,963,266) | $ 3,256,770 |
Investor Class | | | | |
Shares sold | 1,042,094 | 849,290 | $ 10,810,184 | $ 7,545,814 |
Reinvestment of distributions | 69,756 | 15,259 | 710,118 | 141,146 |
Shares redeemed | (762,050) | (429,186) | (7,777,419) | (3,662,739) |
Net increase (decrease) | 349,800 | 435,363 | $ 3,742,883 | $ 4,024,221 |
10. Other.
The Fund's organizational documents provide former and current trustees and officers with a limited indemnification against liabilities arising in connection with the performance of their duties to the Fund. In the normal course of business, the Fund may also enter into contracts that provide general indemnifications. The Fund's maximum exposure under these arrangements is unknown as this would be dependent on future claims that may be made against the Fund. The risk of material loss from such claims is considered remote.
At the end of the period, the investment adviser or its affiliates were the owners of record of 100% of the total outstanding shares of the Fund.
Annual Report
Report of Independent Registered Public Accounting Firm
To the Trustees of Variable Insurance Products Fund IV and the Shareholders of VIP Telecommunications Portfolio:
In our opinion, the accompanying statement of assets and liabilities, including the schedule of investments, and the related statements of operations and of changes in net assets and the financial highlights present fairly, in all material respects, the financial position of VIP Telecommunications Portfolio (a fund of Variable Insurance Products Fund IV) at December 31, 2013, the results of its operations for the year then ended, the changes in its net assets for each of the two years in the period then ended and the financial highlights for each of the five years in the period then ended, in conformity with accounting principles generally accepted in the United States of America. These financial statements and financial highlights (hereafter referred to as "financial statements") are the responsibility of the VIP Telecommunications Portfolio's management. Our responsibility is to express an opinion on these financial statements based on our audits. We conducted our audits of these financial statements in accordance with the standards of the Public Company Accounting Oversight Board (United States). Those standards require that we plan and perform the audit to obtain reasonable assurance about whether the financial statements are free of material misstatement. An audit includes examining, on a test basis, evidence supporting the amounts and disclosures in the financial statements, assessing the accounting principles used and significant estimates made by management, and evaluating the overall financial statement presentation. We believe that our audits, which included confirmation of securities at December 31, 2013 by correspondence with the custodian and brokers, provide a reasonable basis for our opinion.
PricewaterhouseCoopers LLP
Boston, Massachusetts
February 19, 2014
Annual Report
The Trustees and officers of the trust and fund, as applicable, are listed below. The Board of Trustees governs the fund and is responsible for protecting the interests of shareholders. The Trustees are experienced executives who meet periodically throughout the year to oversee the fund's activities, review contractual arrangements with companies that provide services to the fund, oversee management of the risks associated with such activities and contractual arrangements, and review the fund's performance. Except for Ned C. Lautenbach, Ronald P. O'Hanley, and William S. Stavropoulos, each of the Trustees oversees 74 funds. Mr. Lautenbach, Mr. O'Hanley, and Mr. Stavropoulos each oversees 247 funds.
The Trustees hold office without limit in time except that (a) any Trustee may resign; (b) any Trustee may be removed by written instrument, signed by at least two-thirds of the number of Trustees prior to such removal; (c) any Trustee who requests to be retired or who has become incapacitated by illness or injury may be retired by written instrument signed by a majority of the other Trustees; and (d) any Trustee may be removed at any special meeting of shareholders by a two-thirds vote of the outstanding voting securities of the trust. The officers hold office without limit in time, except that any officer may resign or may be removed by a vote of a majority of the Trustees at any regular meeting or any special meeting of the Trustees. Except as indicated, each individual has held the office shown or other offices in the same company for the past five years.
Experience, Skills, Attributes, and Qualifications of the Fund's Trustees. The Governance and Nominating Committee has adopted a statement of policy that describes the experience, qualifications, attributes, and skills that are necessary and desirable for potential Independent Trustee candidates (Statement of Policy). The Board believes that each Trustee satisfied at the time he or she was initially elected or appointed a Trustee, and continues to satisfy, the standards contemplated by the Statement of Policy. The Governance and Nominating Committee also engages professional search firms to help identify potential Independent Trustee candidates who have the experience, qualifications, attributes, and skills consistent with the Statement of Policy. From time to time, additional criteria based on the composition and skills of the current Independent Trustees, as well as experience or skills that may be appropriate in light of future changes to board composition, business conditions, and regulatory or other developments, have also been considered by the professional search firms and the Governance and Nominating Committee. In addition, the Board takes into account the Trustees' commitment and participation in Board and committee meetings, as well as their leadership of standing and ad hoc committees throughout their tenure.
In determining that a particular Trustee was and continues to be qualified to serve as a Trustee, the Board has considered a variety of criteria, none of which, in isolation, was controlling. The Board believes that, collectively, the Trustees have balanced and diverse experience, qualifications, attributes, and skills, which allow the Board to operate effectively in governing the fund and protecting the interests of shareholders. Information about the specific experience, skills, attributes, and qualifications of each Trustee, which in each case led to the Board's conclusion that the Trustee should serve (or continue to serve) as a trustee of the fund, is provided below.
Board Structure and Oversight Function. Ronald P. O'Hanley is an interested person (as defined in the 1940 Act) and currently serves as Chairman. The Trustees have determined that an interested Chairman is appropriate and benefits shareholders because an interested Chairman has a personal and professional stake in the quality and continuity of services provided to the fund. Independent Trustees exercise their informed business judgment to appoint an individual of their choosing to serve as Chairman, regardless of whether the Trustee happens to be independent or a member of management. The Independent Trustees have determined that they can act independently and effectively without having an Independent Trustee serve as Chairman and that a key structural component for assuring that they are in a position to do so is for the Independent Trustees to constitute a substantial majority for the Board. The Independent Trustees also regularly meet in executive session. Michael E. Wiley serves as Chairman of the Independent Trustees and as such (i) acts as a liaison between the Independent Trustees and management with respect to matters important to the Independent Trustees and (ii) with management prepares agendas for Board meetings.
Fidelity funds are overseen by different Boards of Trustees. The fund's Board oversees Fidelity's sector portfolios. Other Boards oversee Fidelity's equity and high income funds, and Fidelity's investment grade bond, money market, and asset allocation funds. The use of separate Boards, each with its own committee structure, allows the Trustees of each group of Fidelity funds to focus on the unique issues of the funds they oversee, including common research, investment, and operational issues. On occasion, the separate Boards establish joint committees to address issues of overlapping consequences for the Fidelity funds overseen by each Board.
The Trustees operate using a system of committees to facilitate the timely and efficient consideration of all matters of importance to the Trustees, the fund, and fund shareholders and to facilitate compliance with legal and regulatory requirements and oversight of the fund's activities and associated risks. The Board, acting through its committees, has charged SelectCo and its affiliates with (i) identifying events or circumstances the occurrence of which could have demonstrably adverse effects on the fund's business and/or reputation; (ii) implementing processes and controls to lessen the possibility that such events or circumstances occur or to mitigate the effects of such events or circumstances if they do occur; and (iii) creating and maintaining a system designed to evaluate continuously business and market conditions in order to facilitate the identification and implementation processes described in (i) and (ii) above. Because the day-to-day operations and activities of the fund are carried out by or through SelectCo, its affiliates, and other service providers, the fund's exposure to risks is mitigated but not eliminated by the processes overseen by the Trustees. While each of the Board's committees has responsibility for overseeing different aspects of the fund's activities, oversight is exercised primarily through the Operations and Audit Committees. Appropriate personnel, including but not limited to the fund's Chief Compliance Officer (CCO), SelectCo's internal auditor, the independent accountants, the fund's Treasurer and portfolio management personnel, make periodic reports to the Board's committees, as appropriate. The responsibilities of each standing committee, including their oversight responsibilities, are described further under "Standing Committees of the Fund's Trustees."
The Fund's Statement of Additional Information (SAI) includes more information about the Trustees. To request a free copy, call Fidelity at 1-877-208-0098.
Annual Report
Trustees and Officers - continued
Interested Trustee*:
Correspondence intended for the Trustee who is an interested person may be sent to Fidelity Investments, 245 Summer Street, Boston, Massachusetts 02210.
Name, Year of Birth; Principal Occupations and Other Relevant Experience+ |
Ronald P. O'Hanley (1957) |
Year of Election or Appointment: 2011 Trustee Chairman of the Board of Trustees |
| Mr. O'Hanley also serves as Trustee of other Fidelity funds. He is Director of Fidelity SelectCo, LLC (2013-present), FMR Co., Inc. (2010-present), Director of Fidelity Investments Money Management, Inc. (2010-present), Director of Fidelity Research & Analysis Company (2010-present), President of Fidelity Asset Management and Corporate Services and a Member of Fidelity's Executive Committee (2010-present). Previously, Mr. O'Hanley served as President and Chief Executive Officer of BNY Mellon Asset Management (2007-2010). Mr. O'Hanley also served as Vice Chairman of Bank New York Mellon Corp. and a member of that firm's Executive Committee. Prior to the 2007 merger of The Bank of New York and Mellon Financial Corporation, he was Vice Chairman of Mellon Financial Corporation and President and Chief Executive Officer of Mellon Asset Management. He joined Mellon in February 1997. Mr. O'Hanley currently serves as Chairman of the Boston Public Library Foundation Board of Directors and sits on the Board of Directors of Beth Israel Deaconess Medical Center, the Board of Trustees of the Marine Biological Laboratory and the Advisory Board of the Maxwell School of Citizenship and Public Administration at Syracuse University. Mr. O'Hanley also chairs the Council on Asset Management for the Financial Services Roundtable and is a member of the Board of Directors of Institutional Investor's U.S. Institute. |
* Trustees have been determined to be "Interested Trustees" by virtue of, among other things, their affiliation with the trust or various entities under common control with SelectCo.
+ The information above includes the Trustee's principal occupation during the last five years and other information relating to the experience, attributes, and skills relevant to the Trustee's qualifications to serve as a Trustee, which led to the conclusion that the Trustee should serve as a Trustee for the fund.
Independent Trustees:
Correspondence intended for each Independent Trustee (that is, the Trustees other than the Interested Trustee) may be sent to Fidelity Investments, P.O. Box 55235, Boston, Massachusetts 02205-5235.
Name, Year of Birth; Principal Occupations and Other Relevant Experience+ |
Ned C. Lautenbach (1944) |
Year of Election or Appointment: 2000 Trustee |
| Mr. Lautenbach also serves as Trustee of other Fidelity funds. Mr. Lautenbach currently serves as the Lead Director of the Eaton Corporation Board of Directors (diversified industrial, 1997-present). Mr. Lautenbach is Chairman of the Board of Directors of the Philharmonic Center for the Arts in Naples, Florida (2012-present) and a member of the Council on Foreign Relations (1994-present). Previously, Mr. Lautenbach was a Partner/Advisory Partner at Clayton, Dubilier & Rice, LLC (private equity investment, 1998-2010), as well as a Director of Sony Corporation (2006-2007). |
David A. Rosow (1942) |
Year of Election or Appointment: 2013 Trustee |
| Mr. Rosow also serves as Trustee of other Fidelity funds. Mr. Rosow is Chairman and Chief Executive Officer of International Golf Group, Inc. (golf course development, 1989-present). Previously, Mr. Rosow served as Chairman and Chief Executive Officer of Rosow & Company, Inc. (private investment company, 1989-2011), a Lead Director of Hudson United Bancorp (2001-2006) and as a Director of TD Banknorth (1996-2006). In addition, Mr. Rosow is a member (2008-present) and President (2009-present) of the Town Council of Palm Beach, Florida. Mr. Rosow served as a Member of the Advisory Board of other Fidelity funds (2012-2013). |
Garnett A. Smith (1947) |
Year of Election or Appointment: 2013 Trustee |
| Mr. Smith also serves as Trustee of other Fidelity funds. Prior to Mr. Smith's retirement, he served as Chairman and Chief Executive Officer of Inbrand Corp. (manufacturer of personal absorbent products, 1990-1997). He also served as President (1986-1990) of Inbrand Corp. Prior to his employment with Inbrand Corp., he was employed by a retail fabric chain and North Carolina National Bank. In addition, Mr. Smith is a board member of the Jackson Hole Land Trust (2009-present). Mr. Smith served as a Member of the Advisory Board of other Fidelity funds (2012-2013). |
William S. Stavropoulos (1939) |
Year of Election or Appointment: 2001 Trustee |
| Mr. Stavropoulos also serves as Trustee of other Fidelity funds. Mr. Stavropoulos serves as President and Founder of the Michigan Baseball Foundation, the Great Lakes Loons (2007-present). Mr. Stavropoulos is Chairman Emeritus of the Board of Directors of The Dow Chemical Company, where he previously served in numerous senior management positions, including President, CEO (1995-2000; 2002-2004), Chairman of the Executive Committee (2000-2006), and as a member of the Board of Directors (1990-2006). Currently, Mr. Stavropoulos is Chairman of the Board of Directors of Univar Inc. (global distributor of commodity and specialty chemicals), a Director of Teradata Corporation (data warehousing and technology solutions), and Maersk Inc. (industrial conglomerate), and a member of the Advisory Board for Metalmark Capital LLC (private equity investment, 2005-present). Mr. Stavropoulos is an operating advisor to Clayton, Dubilier & Rice, LLC (private equity investment). In addition, Mr. Stavropoulos is a member of the University of Notre Dame Advisory Council for the College of Science, a Trustee of the Rollin L. Gerstacker Foundation, and a Director of the Naples Philharmonic Center for the Arts. Previously, Mr. Stavropoulos served as a Director of Chemical Financial Corporation (bank holding company, 1993-2012) and Tyco International, Ltd. (multinational manufacturing and services, 2007-2012). |
Michael E. Wiley (1950) |
Year of Election or Appointment: 2008 Trustee Chairman of the Independent Trustees |
| Mr. Wiley also serves as Trustee of other Fidelity funds. Mr. Wiley serves as a Director of Asia Pacific Exploration Consolidated (international oil and gas exploration and production, 2008-present). Mr. Wiley serves as a Director of Tesoro Corporation (independent oil refiner and marketer, 2005-present), and a Director of Bill Barrett Corporation (exploration and production, 2005-present). In addition, Mr. Wiley also serves as a Director of Post Oak Bank (privately-held bank, 2004-present). Previously, Mr. Wiley served as a Trustee of other Fidelity funds (2008-2013), as a member of the Board of Trustees of the University of Tulsa (2000-2006; 2007-2010), as a Senior Energy Advisor of Katzenbach Partners, LLC (consulting, 2006-2007), as an Advisory Director of Riverstone Holdings (private investment), Chairman, President, and CEO of Baker Hughes, Inc. (oilfield services, 2000-2004), and as Director of Spinnaker Exploration Company (exploration and production, 2001-2005). |
+ The information above includes each Trustee's principal occupation during the last five years and other information relating to the experience, attributes, and skills relevant to each Trustee's qualifications to serve as a Trustee, which led to the conclusion that each Trustee should serve as a Trustee for the fund.
Officers:
Except for Anthony R. Rochte, correspondence intended for each officer may be sent to Fidelity Investments, 245 Summer Street, Boston, Massachusetts 02210. Correspondence intended for Mr. Rochte may be sent to SelectCo, 1225 17th Street, Denver, Colorado 80202-5541. Officers appear below in alphabetical order.
Name, Year of Birth; Principal Occupation |
Christopher S. Bartel (1971) |
Year of Election or Appointment: 2009 Vice President |
| Mr. Bartel also serves as Vice President of other funds. Mr. Bartel serves as a Director, President, and Chief Executive Officer of Fidelity Management & Research (Japan) Inc. (2012-present), a Director of Fidelity Management & Research (Hong Kong) (2012-present), and Senior Vice President of Global Equity Research (2010-present). Previously, Mr. Bartel served as Senior Vice President of Equity Research (2009-2010), Managing Director of Research (2006-2009), and an analyst and portfolio manager (2000-2006). |
Elizabeth Paige Baumann (1968) |
Year of Election or Appointment: 2012 Anti-Money Laundering (AML) Officer |
| Ms. Baumann also serves as AML Officer of other funds. She is Chief AML Officer of FMR LLC (2012-present) and is an employee of Fidelity Investments. Previously, Ms. Baumann served as Vice President and Deputy Anti-Money Laundering Officer (2007-2012). |
Marc Bryant (1966) |
Year of Election or Appointment: 2013 Secretary and Chief Legal Officer (CLO) |
| Mr. Bryant also serves as an officer of other funds. He is Senior Vice President and Deputy General Counsel of FMR LLC. Prior to joining Fidelity Investments, Mr. Bryant served as a Senior Vice President and the Head of Global Retail Legal for AllianceBernstein L.P. (2006-2010), and as the General Counsel for ProFund Advisors LLC (2001-2006). |
William C. Coffey (1969) |
Year of Election or Appointment: 2009 Assistant Secretary |
| Mr. Coffey also serves as Assistant Secretary of other funds. He is Senior Vice President and Deputy General Counsel of FMR LLC (2010-present), and is an employee of Fidelity Investments. Previously, Mr. Coffey served as Vice President and Associate General Counsel of FMR LLC (2005-2009). |
Jonathan Davis (1968) |
Year of Election or Appointment: 2010 Assistant Treasurer |
| Mr. Davis also serves as Assistant Treasurer of other funds. Mr. Davis is an employee of Fidelity Investments. Previously, Mr. Davis served as Vice President and Associate General Counsel of FMR LLC (2003-2010). |
Adrien E. Deberghes (1967) |
Year of Election or Appointment: 2013 President and Treasurer |
| Mr. Deberghes also serves as an officer of other funds. He is an employee of Fidelity Investments (2008-present). Prior to joining Fidelity Investments, Mr. Deberghes was Senior Vice President of Mutual Fund Administration at State Street Corporation (2007-2008), Senior Director of Mutual Fund Administration at Investors Bank & Trust (2005-2007), and Director of Finance for Dunkin' Brands (2000-2005). |
Stephanie J. Dorsey (1969) |
Year of Election or Appointment: 2010 Assistant Treasurer |
| Ms. Dorsey also serves as an officer of other funds. She is an employee of Fidelity Investments (2008-present) and has served in other fund officer roles. Prior to joining Fidelity Investments, Ms. Dorsey served as Treasurer (2004-2008) of the JPMorgan Mutual Funds and Vice President (2004-2008) of JPMorgan Chase Bank. |
Joseph A. Hanlon (1968) |
Year of Election or Appointment: 2012 Chief Compliance Officer |
| Mr. Hanlon also serves as Chief Compliance Officer of other funds. Mr. Hanlon serves as Compliance Officer of FMR, FMR Co., Inc., Fidelity Investments Money Management, Inc. (FIMM), Fidelity Research and Analysis Company (FRAC), and Fidelity Management & Research (Hong Kong) (2009-present), as Senior Vice President of the Fidelity Asset Management Division (2009-present), and is an employee of Fidelity Investments. Previously, Mr. Hanlon served as Compliance Officer of Fidelity Management & Research (Japan) Inc. (2009-2013), Strategic Advisers, Inc. (2009-2013), and Fidelity Management & Research (U.K.) Inc. (2009-2013). |
Brian B. Hogan (1964) |
Year of Election or Appointment: 2009 Vice President |
| Mr. Hogan also serves as Vice President of other funds. Mr. Hogan serves as President of FMR's Equity Division (2009-present). Previously, Mr. Hogan served as Senior Vice President, Equity Research of FMR (2006-2009) and as a portfolio manager. |
Chris Maher (1972) |
Year of Election or Appointment: 2013 Assistant Treasurer |
| Mr. Maher serves as Assistant Treasurer of other funds. Mr. Maher is Vice President of Valuation Oversight and is an employee of Fidelity Investments. Previously, Mr. Maher served as Vice President of Asset Management Compliance (2013), Vice President of FMR's Program Management Group (2010-2013), and Vice President of Valuation Oversight (2008-2010). |
Christine Reynolds (1958) |
Year of Election or Appointment: 2008 Chief Financial Officer |
| Ms. Reynolds also serves as Chief Financial Officer of other funds. Ms. Reynolds became President of Fidelity Pricing and Cash Management Services (FPCMS) in August 2008. Ms. Reynolds served as Chief Operating Officer of FPCMS (2007-2008). Previously, Ms. Reynolds served as President, Treasurer, and Anti-Money Laundering officer of the Fidelity funds (2004-2007). |
Kenneth B. Robins (1969) |
Year of Election or Appointment: 2013 Deputy Treasurer |
| Mr. Robins also serves as an officer of other funds. Mr. Robins serves as Executive Vice President of Fidelity Investments Money Management, Inc. (FIMM) (2013-present) and is an employee of Fidelity Investments (2004-present). Previously, Mr. Robins served in other fund officer roles. |
Anthony R. Rochte (1968) |
Year of Election or Appointment: 2013 Vice President |
| Mr. Rochte also serves as Vice President of other funds. Mr. Rochte serves as President of Fidelity SelectCo, LLC (2012-present) and is an employee of Fidelity Investments (2012-present). Prior to joining Fidelity Investments, Mr. Rochte served as Senior Managing Director and head of State Street Global Advisors' North American Intermediary Business Group (2006-2012). |
Stacie M. Smith (1974) |
Year of Election or Appointment: 2013 Assistant Treasurer |
| Ms. Smith also serves as an officer of other funds. She is an employee of Fidelity Investments (2009-present) and has served in other fund officer roles. Prior to joining Fidelity Investments, Ms. Smith served as Senior Audit Manager of Ernst & Young LLP (1996-2009). |
Renee Stagnone (1975) |
Year of Election or Appointment: 2013 Deputy Treasurer |
| Ms. Stagnone also serves as Deputy Treasurer of other funds. Ms. Stagnone is an employee of Fidelity Investments. |
Joseph F. Zambello (1957) |
Year of Election or Appointment: 2011 Deputy Treasurer |
| Mr. Zambello also serves as Deputy Treasurer of other funds. Mr. Zambello is an employee of Fidelity Investments. Previously, Mr. Zambello served as Vice President of FMR's Program Management Group (2009-2011) and Vice President of the Transfer Agent Oversight Group (2005-2009). |
Annual Report
The Board of Trustees of VIP Telecommunications Portfolio voted to pay to shareholders of record at the opening of business on record date, the following distributions per share derived from capital gains realized from sales of portfolio securities:
| Pay Date | Record Date | Capital Gains |
Initial Class | 02/14/14 | 02/14/14 | $0.020 |
Investor Class | 02/14/14 | 02/14/14 | $0.020 |
The fund hereby designates as a capital gain dividend with respect to the taxable year ended December 31, 2013, $637,867, or, if subsequently determined to be different, the net capital gain of such year.
Initial Class and Investor Class designates 100% of the dividend distributed in December 2013 during the fiscal year as qualifying for the dividends-received deduction for corporate shareholders.
Annual Report
A special meeting of Telecommunications Portfolio's shareholders was held on May 14, 2013. The results of votes taken among shareholders on the proposals before them are reported below. Each vote reported represents one dollar of net asset value held on the record date for the meeting.
PROPOSAL 1 |
To elect a Board of Trustees.A |
| # of
Votes | % of
Votes |
Ned C. Lautenbach |
Affirmative | 1,555,133,782.46 | 93.955 |
Withheld | 100,063,694.32 | 6.045 |
TOTAL | 1,655,197,476.78 | 100.000 |
Ronald P. O'Hanley |
Affirmative | 1,557,988,095.28 | 94.128 |
Withheld | 97,209,381.50 | 5.872 |
TOTAL | 1,655,197,476.78 | 100.000 |
David A. Rosow |
Affirmative | 1,552,645,347.31 | 93.805 |
Withheld | 102,552,129.47 | 6.195 |
TOTAL | 1,655,197,476.78 | 100.000 |
Garnett A. Smith |
Affirmative | 1,554,582,880.53 | 93.922 |
Withheld | 100,614,596.25 | 6.078 |
TOTAL | 1,655,197,476.78 | 100.000 |
William S. Stavropoulos |
Affirmative | 1,548,352,452.21 | 93.545 |
Withheld | 106,845,024.57 | 6.455 |
TOTAL | 1,655,197,476.78 | 100.000 |
Michael E. Wiley |
Affirmative | 1,556,790,374.70 | 94.055 |
Withheld | 98,407,102.08 | 5.945 |
TOTAL | 1,655,197,476.78 | 100.000 |
PROPOSAL 2 |
To approve a management contract between the fund and Fidelity SelectCo, LLC. |
| # of
Votes | % of
Votes |
Affirmative | 14,078,352.62 | 94.265 |
Against | 203,026.02 | 1.359 |
Abstain | 653,604.92 | 4.376 |
TOTAL | 14,934,983.56 | 100.000 |
A Denotes trust-wide proposal and voting results. |
Annual Report
Investment Adviser
Fidelity SelectCo, LLC
Denver, CO
Investment Sub-Advisers
FMR Co., Inc.
Fidelity Management & Research (U.K.) Inc.
Fidelity Management & Research (Hong Kong)
Limited
Fidelity Management & Research (Japan) Inc.
General Distributor
Fidelity Distributors Corporation
Smithfield, RI
Transfer and Service Agents
Fidelity Investments Institutional Operations Company, Inc.
Boston, MA
Fidelity Service Company, Inc.
Boston, MA
Custodian
State Street Bank and Trust Company
Quincy, MA
VTELP-ANN-0214
1.851004.106
Fidelity® Variable Insurance Products:
Utilities Portfolio
Annual Report
December 31, 2013
(Fidelity Cover Art)
Contents
Performance | (Click Here) | How the fund has done over time. |
Management's Discussion of Fund Performance | (Click Here) | The Portfolio Manager's review of fund performance and strategy. |
Shareholder Expense Example | (Click Here) | An example of shareholder expenses. |
Investment Changes | (Click Here) | A summary of major shifts in the fund's investments over the past six months. |
Investments | (Click Here) | A complete list of the fund's investments with their market values. |
Financial Statements | (Click Here) | Statements of assets and liabilities, operations, and changes in net assets, as well as financial highlights. |
Notes | (Click Here) | Notes to the financial statements. |
Report of Independent Registered Public Accounting Firm | (Click Here) | |
Trustees and Officers | (Click Here) | |
Distributions | (Click Here) | |
Proxy Voting Results | (Click Here) | |
To view a fund's proxy voting guidelines and proxy voting record for the 12-month period ended June 30, visit http://www.fidelity.com/proxyvotingresults or visit the Securities and Exchange Commission's (SEC) web site at http://www.sec.gov. You may also call 1-877-208-0098 to request a free copy of the proxy voting guidelines.
Fidelity Variable Insurance Products are separate account options which are purchased through a variable insurance contract.
Standard & Poor's, S&P and S&P 500 are registered service marks of The McGraw-Hill Companies, Inc. and have been licensed for use by Fidelity Distributors Corporation.
Other third-party marks appearing herein are the property of their respective owners.
All other marks appearing herein are registered or unregistered trademarks or service marks of FMR LLC or an affiliated company. © 2014 FMR LLC. All rights reserved.
This report and the financial statements contained herein are submitted for the general information of the shareholders of the fund. This report is not authorized for distribution to prospective investors in the fund unless preceded or accompanied by an effective prospectus.
A fund files its complete schedule of portfolio holdings with the SEC for the first and third quarters of each fiscal year on Form N-Q. Forms N-Q are available on the SEC's web site at http://www.sec.gov. A fund's Forms N-Q may be reviewed and copied at the SEC's Public Reference Room in Washington, DC. Information regarding the operation of the SEC's Public Reference Room may be obtained by calling 1-800-SEC-0330. For a complete list of the fund's portfolio holdings, view the most recent holdings listing, semiannual report, or annual report on Fidelity's web site at http://www.fidelity.com, http://www.advisor.fidelity.com, or http://www.401k.com, as applicable.
NOT FDIC INSURED • MAY LOSE VALUE • NO BANK GUARANTEE
Neither the fund nor Fidelity Distributors Corporation is a bank.
Annual Report
Average annual total return reflects the change in the value of an investment, assuming reinvestment of the class' distributions from dividend income and capital gains (the profits earned upon the sale of securities that have grown in value, if any) and assuming a constant rate of performance each year. During periods of reimbursement by Fidelity, a fund's total return will be greater than it would be had the reimbursement not occurred. Performance numbers are net of all underlying fund operating expenses, but do not include any insurance charges imposed by your insurance company's separate account. If performance information included the effect of these additional charges, the total returns would have been lower. How a fund did yesterday is no guarantee of how it will do tomorrow.
Average Annual Total Returns
Periods ended December 31, 2013 | Past 1
year | Past 5
years | Past 10
years |
VIP Utilities Portfolio - Initial Class B | 21.02% | 13.56% | 10.19% |
VIP Utilities Portfolio - Investor ClassA,B | 20.92% | 13.45% | 10.09% |
A The initial offering of Investor Class shares took place on July 21, 2005. Returns prior to July 21, 2005 are those of Initial Class. Had Investor Class's transfer agent fee been reflected, returns prior to July 21, 2005, would have been lower.
B Prior to October 1, 2006, VIP Utilities Portfolio was named VIP Telecommunications & Utilities Growth Portfolio, and the fund operated under certain different investment policies and compared its performance to a different additional index. The fund's historical performance may not represent its current investment policies.
$10,000 Over 10 Years
Let's say hypothetically that $10,000 was invested in VIP Utilities Portfolio - Initial Class on December 31, 2003. The chart shows how the value of your investment would have changed, and also shows how the S&P 500® Index performed over the same period.
Annual Report
Market Recap: Global equity markets remained upbeat for the 12 months ending December 31, 2013, propelling the MSCI® ACWI® (All Country World Index) Index to a 23.24% return. Midyear turbulence gave way by autumn when policymakers in the U.S. and China had made clear their intentions to maintain accommodative monetary policies. That stance, combined with modest cyclical improvement around the globe and generally low valuations, underpinned the broad rally in equities, although the relative strength of the U.S. dollar generally tempered gains for U.S. investors holding foreign securities based in local currencies. During the period, the broad-market S&P 500® Index set a series of new highs, finishing the year up 32.39%. For the first time since 1995, the S&P® scored a "perfect 10," with all 10 economic sectors gaining at least 10% for the year. A resurgence in growth-oriented stocks lifted the Nasdaq Composite Index® to a 40.12% result for 2013, while the blue-chip Dow Jones Industrial AverageSM notched a relatively more modest 29.65% gain. International developed-markets equities rose in concert with their U.S. counterparts, with the MSCI® EAFE® Index gaining 22.92% for the period. Meanwhile, foreign exchange and commodity weakness curbed results in resource-heavy emerging markets (EM), especially in the year's waning months. More generally, concern over EM's slowing growth, its declining share of global trade and uncertainty surrounding U.S. central bank intentions were all factors hampering performance. The MSCI Emerging Markets Index returned -2.27% for the period. On the bond side, U.S. high-yield securities rallied with equities for much of the period, with The BofA Merrill LynchSM US High Yield Constrained Index returning 7.41% for 2013. The more rate-sensitive U.S. investment-grade bond category faced headwinds though, as reflected in the -2.02% return of the Barclays® U.S. Aggregate Bond Index. Within the Barclays index, investment-grade corporate credit returned -2.01%, while ultra-safe U.S. Treasuries saw a -2.75% result. Major non-U.S. developed markets performed only slightly better, with the Citigroup® Non-USD Group-of-Seven (G7) Equal Weighted Index logging a -1.59% result. After several years of strong advances, EM debt reversed course in 2013, with the J.P. Morgan Emerging Markets Bond Index Global returning -6.58%.
Comments from Douglas Simmons, Portfolio Manager of VIP Utilities Portfolio: For the year, the fund's share classes outperformed the 15.13% advance of the MSCI® U.S. IMI 25-50 Utilities Index, but underperformed the S&P 500®. (For specific portfolio results, please refer to the performance section of this shareholder report.) Versus the MSCI index, the fund benefited from strong stock selection in the oil & gas storage & transport and oil & gas exploration & production industries - two groups that were not part of the index - and in multi-utilities. I increased all three groups as a percentage of fund assets because of their exposure to natural gas. The top two relative contributors were out-of-benchmark holdings in companies offering growth opportunities in natural gas infrastructure. Cheniere Energy, constructing the first natural gas export terminals in the U.S., obtained financing for its build-out, and the stock easily outperformed the utilities sector. Energen, a diversified energy company that owns a natural gas distribution utility and natural-gas-producing acreage, rose on the strength of a management restructuring. On the down side, we were hurt by an underweighting in gas utilities - although security selection here was good - and by security selection in water utilities. The largest individual detractor was untimely ownership of Virginia-based electric utility Dominion Resources. I found the stock to be too expensive, but it rose after management announced a reorganization of the company's assets. I increased our exposure to Dominion and ended the period with an overweighting.
The views expressed above reflect those of the portfolio manager(s) only through the end of the period as stated on the cover of this report and do not necessarily represent the views of Fidelity or any other person in the Fidelity organization. Any such views are subject to change at any time based upon market or other conditions and Fidelity disclaims any responsibility to update such views. These views may not be relied on as investment advice and, because investment decisions for a Fidelity fund are based on numerous factors, may not be relied on as an indication of trading intent on behalf of any Fidelity fund.
Annual Report
As a shareholder of the Fund, you incur two types of costs: (1) transaction costs, including redemption fees and (2) ongoing costs, including management fees and other Fund expenses. This Example is intended to help you understand your ongoing costs (in dollars) of investing in the Fund and to compare these costs with the ongoing costs of investing in other mutual funds.
The Example is based on an investment of $1,000 invested at the beginning of the period and held for the entire period (July 1, 2013 to December 31, 2013).
Actual Expenses
The first line of the accompanying table for each class of the Fund provides information about actual account values and actual expenses. You may use the information in this line, together with the amount you invested, to estimate the expenses that you paid over the period. Simply divide your account value by $1,000.00 (for example, an $8,600 account value divided by $1,000.00 = 8.6), then multiply the result by the number in the first line for a class of the Fund under the heading entitled "Expenses Paid During Period" to estimate the expenses you paid on your account during this period. The estimate of expenses does not include any fees or other expenses of any variable annuity or variable life insurance product. If they were, the estimate of expenses you paid during the period would be higher, and your ending account value would be lower. In addition, the Fund, as a shareholder in the underlying Fidelity Central Funds, will indirectly bear its pro-rata share of the fees and expenses incurred by the underlying Fidelity Central Funds. These fees and expenses are not included in the Fund's annualized expense ratio used to calculate the expense estimate in the table below.
Hypothetical Example for Comparison Purposes
The second line of the accompanying table for each class of the Fund provides information about hypothetical account values and hypothetical expenses based on a Class' actual expense ratio and an assumed rate of return of 5% per year before expenses, which is not the Class' actual return. The hypothetical account values and expenses may not be used to estimate the actual ending account balance or expenses you paid for the period. You may use this information to compare the ongoing costs of investing in the Fund and other funds. To do so, compare this 5% hypothetical example with the 5% hypothetical examples that appear in the shareholder reports of the other funds. The estimate of expenses does not include any fees or other expenses of any variable annuity or variable life insurance product. If they were, the estimate of expenses you paid during the period would be higher, and your ending account value would be lower. In addition, the Fund, as a shareholder in the underlying Fidelity Central Funds, will indirectly bear its pro-rata share of the fees and expenses incurred by the underlying Fidelity Central Funds. These fees and expenses are not included in the Fund's annualized expense ratio used to calculate the expense estimate in the table below.
Please note that the expenses shown in the table are meant to highlight your ongoing costs only and do not reflect any transaction costs. Therefore, the second line of the table is useful in comparing ongoing costs only, and will not help you determine the relative total costs of owning different funds. In addition, if these transactional costs were included, your costs would have been higher.
| Annualized
Expense Ratio B | Beginning
Account Value
July 1, 2013 | Ending
Account Value
December 31, 2013 | Expenses Paid
During Period*
July 1, 2013
to December 31, 2013 |
Initial Class | .74% | | | |
Actual | | $ 1,000.00 | $ 1,090.70 | $ 3.90 |
HypotheticalA | | $ 1,000.00 | $ 1,021.48 | $ 3.77 |
Investor Class | .82% | | | |
Actual | | $ 1,000.00 | $ 1,091.10 | $ 4.32 |
HypotheticalA | | $ 1,000.00 | $ 1,021.07 | $ 4.18 |
A 5% return per year before expenses
B Annualized expense ratio reflects expenses net of applicable fee waivers.
* Expenses are equal to each Class' annualized expense ratio, multiplied by the average account value over the period, multiplied by 184/365 (to reflect the one-half year period).
Annual Report
Investment Changes (Unaudited)
Top Ten Stocks as of December 31, 2013 |
| % of fund's
net assets | % of fund's net assets
6 months ago |
NextEra Energy, Inc. | 10.0 | 1.8 |
Dominion Resources, Inc. | 9.6 | 4.0 |
Sempra Energy | 9.4 | 7.3 |
ONEOK, Inc. | 6.7 | 0.0 |
OGE Energy Corp. | 5.5 | 5.0 |
Energy Transfer Equity LP | 5.0 | 0.0 |
NRG Energy, Inc. | 4.8 | 5.4 |
The AES Corp. | 4.6 | 3.3 |
CenterPoint Energy, Inc. | 4.5 | 7.0 |
NiSource, Inc. | 4.2 | 3.9 |
| 64.3 | |
Top Industries (% of fund's net assets) |
As of December 31, 2013 |
| Multi-Utilities | 34.6% | |
| Electric Utilities | 25.3% | |
| Oil, Gas & Consumable Fuels | 17.0% | |
| Independent Power Producers & Energy Traders | 13.4% | |
| Gas Utilities | 6.7% | |
| All Others* | 3.0% | |

As of June 30, 2013 |
| Electric Utilities | 36.1% | |
| Multi-Utilities | 33.9% | |
| Oil, Gas & Consumable Fuels | 13.6% | |
| Independent Power Producers & Energy Traders | 12.5% | |
| Gas Utilities | 3.0% | |
| All Others* | 0.9% | |

* Includes short-term investments and net other assets (liabilities). |
Annual Report
Investments December 31, 2013
Showing Percentage of Net Assets
Common Stocks - 99.0% |
| Shares | | Value |
ELECTRIC UTILITIES - 25.3% |
Electric Utilities - 25.3% |
American Electric Power Co., Inc. | 60,900 | | $ 2,846,466 |
Edison International | 62,877 | | 2,911,205 |
ITC Holdings Corp. | 18,206 | | 1,744,499 |
NextEra Energy, Inc. | 90,551 | | 7,752,974 |
OGE Energy Corp. | 124,921 | | 4,234,822 |
| | 19,489,966 |
GAS UTILITIES - 6.7% |
Gas Utilities - 6.7% |
ONEOK, Inc. | 82,825 | | 5,150,059 |
INDEPENDENT POWER PRODUCERS & ENERGY TRADERS - 13.4% |
Independent Power Producers & Energy Traders - 13.4% |
Calpine Corp. (a) | 157,634 | | 3,075,439 |
NRG Energy, Inc. | 127,722 | | 3,668,176 |
The AES Corp. | 247,440 | | 3,590,354 |
| | 10,333,969 |
MULTI-UTILITIES - 34.6% |
Multi-Utilities - 34.6% |
Ameren Corp. | 67,200 | | 2,429,952 |
CenterPoint Energy, Inc. | 149,103 | | 3,456,208 |
Dominion Resources, Inc. | 114,694 | | 7,419,555 |
NiSource, Inc. | 98,270 | | 3,231,118 |
PG&E Corp. | 73,139 | | 2,946,039 |
Sempra Energy | 80,581 | | 7,232,951 |
| | 26,715,823 |
OIL, GAS & CONSUMABLE FUELS - 17.0% |
Oil & Gas Exploration & Production - 2.0% |
Energen Corp. | 22,197 | | 1,570,438 |
Oil & Gas Refining & Marketing - 0.4% |
Delek U.S. Holdings, Inc. | 7,821 | | 269,121 |
|
| Shares | | Value |
Oil & Gas Storage & Transport - 14.6% |
Cheniere Energy Partners LP Holdings LLC | 81,600 | | $ 1,530,000 |
Cheniere Energy, Inc. (a) | 60,547 | | 2,610,787 |
Enbridge, Inc. | 36,500 | | 1,594,695 |
Energy Transfer Equity LP | 47,605 | | 3,891,233 |
Plains GP Holdings LP Class A | 62,000 | | 1,659,740 |
| | 11,286,455 |
TOTAL OIL, GAS & CONSUMABLE FUELS | | 13,126,014 |
REAL ESTATE INVESTMENT TRUSTS - 2.0% |
Specialized REITs - 2.0% |
American Tower Corp. | 19,400 | | 1,548,508 |
TOTAL COMMON STOCKS (Cost $65,680,450) |
76,364,339
|
Money Market Funds - 0.7% |
| | | |
Fidelity Cash Central Fund, 0.11% (b)
(Cost $555,458) | 555,458 | |
555,458
|
TOTAL INVESTMENT PORTFOLIO - 99.7% (Cost $66,235,908) | | 76,919,797 |
NET OTHER ASSETS (LIABILITIES) - 0.3% | | 212,465 |
NET ASSETS - 100% | $ 77,132,262 |
Legend |
(a) Non-income producing |
(b) Affiliated fund that is generally available only to investment companies and other accounts managed by Fidelity Investments. The rate quoted is the annualized seven-day yield of the fund at period end. A complete unaudited listing of the fund's holdings as of its most recent quarter end is available upon request. In addition, each Fidelity Central Fund's financial statements, which are not covered by the Fund's Report of Independent Registered Public Accounting Firm, are available on the SEC's website or upon request. |
Affiliated Central Funds |
Information regarding fiscal year to date income earned by the Fund from investments in Fidelity Central Funds is as follows: |
Fund | Income earned |
Fidelity Cash Central Fund | $ 1,368 |
Fidelity Securities Lending Cash Central Fund | 8,259 |
Total | $ 9,627 |
Other Information |
All investments are categorized as Level 1 under the Fair Value Hierarchy. The inputs or methodology used for valuing securities may not be an indication of the risk associated with investing in those securities. For more information on valuation inputs, please refer to the Investment Valuation section in the accompanying Notes to Financial Statements. |
See accompanying notes which are an integral part of the financial statements.
Annual Report
Statement of Assets and Liabilities
| December 31, 2013 |
| | |
Assets | | |
Investment in securities, at value - See accompanying schedule: Unaffiliated issuers (cost $65,680,450) | $ 76,364,339 | |
Fidelity Central Funds (cost $555,458) | 555,458 | |
Total Investments (cost $66,235,908) | | $ 76,919,797 |
Receivable for fund shares sold | | 263,521 |
Dividends receivable | | 106,366 |
Distributions receivable from Fidelity Central Funds | | 51 |
Prepaid expenses | | 631 |
Other receivables | | 7,838 |
Total assets | | 77,298,204 |
| | |
Liabilities | | |
Payable for investments purchased | $ 54,254 | |
Payable for fund shares redeemed | 33,151 | |
Accrued management fee | 34,846 | |
Audit fee payable | 31,532 | |
Other affiliated payables | 10,144 | |
Other payables and accrued expenses | 2,015 | |
Total liabilities | | 165,942 |
| | |
Net Assets | | $ 77,132,262 |
Net Assets consist of: | | |
Paid in capital | | $ 66,711,754 |
Accumulated undistributed net realized gain (loss) on investments and foreign currency transactions | | (263,381) |
Net unrealized appreciation (depreciation) on investments | | 10,683,889 |
Net Assets | | $ 77,132,262 |
Statement of Assets and Liabilities - continued
| December 31, 2013 |
| | |
Initial Class:
Net Asset Value, offering price and redemption price per share ($25,823,951 ÷ 1,920,152 shares) | | $ 13.45 |
| | |
Investor Class:
Net Asset Value, offering price and redemption price per share ($51,308,311 ÷ 3,832,361 shares) | | $ 13.39 |
See accompanying notes which are an integral part of the financial statements.
Annual Report
Financial Statements - continued
Statement of Operations
| Year ended December 31, 2013 |
| | |
Investment Income | | |
Dividends | | $ 2,538,063 |
Income from Fidelity Central Funds | | 9,627 |
Total income | | 2,547,690 |
| | |
Expenses | | |
Management fee | $ 445,782 | |
Transfer agent fees | 104,285 | |
Accounting and security lending fees | 31,473 | |
Custodian fees and expenses | 8,834 | |
Independent trustees' compensation | 1,265 | |
Audit | 37,280 | |
Legal | 1,372 | |
Miscellaneous | 6,209 | |
Total expenses before reductions | 636,500 | |
Expense reductions | (17,218) | 619,282 |
Net investment income (loss) | | 1,928,408 |
Realized and Unrealized Gain (Loss) Net realized gain (loss) on: | | |
Investment securities: | | |
Unaffiliated issuers | 5,097,639 | |
Foreign currency transactions | (1,669) | |
Total net realized gain (loss) | | 5,095,970 |
Change in net unrealized appreciation (depreciation) on investment securities | | 6,213,101 |
Net gain (loss) | | 11,309,071 |
Net increase (decrease) in net assets resulting from operations | | $ 13,237,479 |
Statement of Changes in Net Assets
| Year ended
December 31,
2013 | Year ended
December 31,
2012 |
Increase (Decrease) in Net Assets | | |
Operations | | |
Net investment income (loss) | $ 1,928,408 | $ 1,847,315 |
Net realized gain (loss) | 5,095,970 | 3,922,559 |
Change in net unrealized appreciation (depreciation) | 6,213,101 | (1,301,890) |
Net increase (decrease) in net assets resulting from operations | 13,237,479 | 4,467,984 |
Distributions to shareholders from net investment income | (1,911,677) | (1,864,741) |
Distributions to shareholders from net realized gain | - | (47,404) |
Total distributions | (1,911,677) | (1,912,145) |
Share transactions - net increase (decrease) | (2,464,439) | (10,216,246) |
Redemption fees | 52,839 | 59,286 |
Total increase (decrease) in net assets | 8,914,202 | (7,601,121) |
| | |
Net Assets | | |
Beginning of period | 68,218,060 | 75,819,181 |
End of period | $ 77,132,262 | $ 68,218,060 |
See accompanying notes which are an integral part of the financial statements.
Annual Report
Financial Highlights - Initial Class
Years ended December 31, | 2013 | 2012 | 2011 | 2010 | 2009 |
Selected Per-Share Data | | | | | |
Net asset value, beginning of period | $ 11.41 | $ 10.93 | $ 9.84 | $ 9.10 | $ 8.14 |
Income from Investment Operations | | | | | |
Net investment income (loss) C | .32 | .29 | .28 | .26 | .25 |
Net realized and unrealized gain (loss) | 2.06 | .51 | 1.01 | .75 | 1.01 |
Total from investment operations | 2.38 | .80 | 1.29 | 1.01 | 1.26 |
Distributions from net investment income | (.35) | (.32) | (.20) | (.28) | (.30) |
Distributions from net realized gain | - | (.01) | - | - | - |
Total distributions | (.35) | (.33) | (.20) | (.28) | (.30) |
Redemption fees added to paid in capital C | .01 | .01 | - G | .01 | - G |
Net asset value, end of period | $ 13.45 | $ 11.41 | $ 10.93 | $ 9.84 | $ 9.10 |
Total Return A, B | 21.02% | 7.40% | 13.20% | 11.20% | 15.42% |
Ratios to Average Net Assets D, F | | | | | |
Expenses before reductions | .74% | .74% | .80% | .82% | .81% |
Expenses net of fee waivers, if any | .73% | .74% | .79% | .81% | .81% |
Expenses net of all reductions | .71% | .71% | .77% | .78% | .79% |
Net investment income (loss) | 2.44% | 2.59% | 2.72% | 2.75% | 3.13% |
Supplemental Data | | | | | |
Net assets, end of period (000 omitted) | $ 25,824 | $ 25,947 | $ 28,859 | $ 21,142 | $ 24,159 |
Portfolio turnover rate E | 156% | 181% | 174% | 249% | 219% |
A Total returns do not reflect charges attributable to your insurance company's separate account. Inclusion of these charges would reduce the total returns shown.
B Total returns would have been lower if certain expenses had not been reduced during the applicable periods shown.
C Calculated based on average shares outstanding during the period.
D Fees and expenses of any underlying Fidelity Central Funds are not included in the Fund's expense ratio. The Fund indirectly bears its proportionate share of the expenses of any underlying Fidelity Central Funds.
E Amount does not include the portfolio activity of any underlying Fidelity Central Funds.
F Expense ratios reflect operating expenses of the class. Expenses before reductions do not reflect amounts reimbursed by the investment adviser or reductions from brokerage service arrangements or reductions from other expense offset arrangements and do not represent the amount paid by the class during periods when reimbursements or reductions occur. Expenses net of fee waivers reflect expenses after reimbursement by the investment adviser but prior to reductions from brokerage service arrangements or other expense offset arrangements. Expenses net of all reductions represent the net expenses paid by the class.
G Amount represents less than $.01 per share.
Financial Highlights - Investor Class
Years ended December 31, | 2013 | 2012 | 2011 | 2010 | 2009 |
Selected Per-Share Data | | | | | |
Net asset value, beginning of period | $ 11.36 | $ 10.88 | $ 9.80 | $ 9.07 | $ 8.12 |
Income from Investment Operations | | | | | |
Net investment income (loss) C | .30 | .28 | .27 | .25 | .25 |
Net realized and unrealized gain (loss) | 2.06 | .51 | 1.01 | .74 | .99 |
Total from investment operations | 2.36 | .79 | 1.28 | .99 | 1.24 |
Distributions from net investment income | (.34) | (.31) | (.20) | (.27) | (.29) |
Distributions from net realized gain | - | (.01) | - | - | - |
Total distributions | (.34) | (.32) | (.20) | (.27) | (.29) |
Redemption fees added to paid in capital C | .01 | .01 | - G | .01 | - G |
Net asset value, end of period | $ 13.39 | $ 11.36 | $ 10.88 | $ 9.80 | $ 9.07 |
Total Return A, B | 20.92% | 7.36% | 13.11% | 11.04% | 15.24% |
Ratios to Average Net Assets D, F | | | | | |
Expenses before reductions | .82% | .82% | .88% | .91% | .92% |
Expenses net of fee waivers, if any | .81% | .82% | .88% | .90% | .92% |
Expenses net of all reductions | .79% | .79% | .85% | .87% | .90% |
Net investment income (loss) | 2.36% | 2.50% | 2.64% | 2.66% | 3.02% |
Supplemental Data | | | | | |
Net assets, end of period (000 omitted) | $ 51,308 | $ 42,271 | $ 46,960 | $ 19,740 | $ 16,452 |
Portfolio turnover rate E | 156% | 181% | 174% | 249% | 219% |
A Total returns do not reflect charges attributable to your insurance company's separate account. Inclusion of these charges would reduce the total returns shown.
B Total returns would have been lower if certain expenses had not been reduced during the applicable periods shown.
C Calculated based on average shares outstanding during the period.
D Fees and expenses of any underlying Fidelity Central Funds are not included in the Fund's expense ratio. The Fund indirectly bears its proportionate share of the expenses of any underlying Fidelity Central Funds.
E Amount does not include the portfolio activity of any underlying Fidelity Central Funds.
F Expense ratios reflect operating expenses of the class. Expenses before reductions do not reflect amounts reimbursed by the investment adviser or reductions from brokerage service arrangements or reductions from other expense offset arrangements and do not represent the amount paid by the class during periods when reimbursements or reductions occur. Expenses net of fee waivers reflect expenses after reimbursement by the investment adviser but prior to reductions from brokerage service arrangements or other expense offset arrangements. Expenses net of all reductions represent the net expenses paid by the class.
G Amount represents less than $.01 per share.
See accompanying notes which are an integral part of the financial statements.
Annual Report
Notes to Financial Statements
For the period ended December 31, 2013
1. Organization.
VIP Utilities Portfolio (the Fund) is a non-diversified fund of Variable Insurance Products Fund IV (the Trust) and is authorized to issue an unlimited number of shares. The Trust is registered under the Investment Company Act of 1940, as amended (the 1940 Act), as an open-end management investment company organized as a Massachusetts business trust. Shares of the Fund may only be purchased by insurance companies for the purpose of funding variable annuity or variable life insurance contracts. The Fund offers the following classes of shares: Initial Class shares and Investor Class shares. All classes have equal rights and voting privileges, except for matters affecting a single class.
2. Investments in Fidelity Central Funds.
The Fund invests in Fidelity Central Funds, which are open-end investment companies generally available only to other investment companies and accounts managed by the investment adviser and its affiliates. The Fund's Schedule of Investments lists each of the Fidelity Central Funds held as of period end, if any, as an investment of the Fund, but does not include the underlying holdings of each Fidelity Central Fund. As an Investing Fund, the Fund indirectly bears its proportionate share of the expenses of the underlying Fidelity Central Funds.
The Money Market Central Funds seek preservation of capital and current income and are managed by Fidelity Investments Money Management, Inc. (FIMM), an affiliate of the investment adviser. Annualized expenses of the Money Market Central Funds as of their most recent shareholder report date are less than .01%.
A complete unaudited list of holdings for each Fidelity Central Fund is available upon request or at the Securities and Exchange Commission (the SEC) website at www.sec.gov. In addition, the financial statements of the Fidelity Central Funds, which are not covered by the Fund's Report of Independent Registered Public Accounting Firm, are available on the SEC website or upon request.
3. Significant Accounting Policies.
The financial statements have been prepared in conformity with accounting principles generally accepted in the United States of America (GAAP), which require management to make certain estimates and assumptions at the date of the financial statements. Actual results could differ from those estimates. Subsequent events, if any, through the date that the financial statements were issued have been evaluated in the preparation of the financial statements. The following summarizes the significant accounting policies of the Fund:
Investment Valuation. Investments are valued as of 4:00 p.m. Eastern time on the last calendar day of the period. In accordance with valuation policies and procedures approved by the Board of Trustees (the Board), the Fund attempts to obtain prices from one or more third party pricing vendors or brokers to value its investments. When current market prices, quotations or currency exchange rates are not readily available or reliable, investments will be fair valued in good faith by the Fidelity SelectCo, LLC (SelectCo) Fair Value Committee (the Committee), in accordance with procedures adopted by the Board. Factors used in determining fair value vary by investment type and may include market or investment specific events. The frequency with which these procedures are used cannot be predicted and they may be utilized to a significant extent. The Committee oversees the Fund's valuation policies and procedures and is responsible for approving and reporting to the Board all fair value determinations.
The Fund categorizes the inputs to valuation techniques used to value its investments into a disclosure hierarchy consisting of three levels as shown below:
Level 1 - quoted prices in active markets for identical investments
Level 2 - other significant observable inputs (including quoted prices for similar investments, interest rates, prepayment speeds, etc.)
Level 3 - unobservable inputs (including the Fund's own assumptions based on the best information available)
Valuation techniques used to value the Fund's investments by major category are as follows:
Equity securities, including restricted securities, for which market quotations are readily available, are valued at the last reported sale price or official closing price as reported by a third party pricing vendor on the primary market or exchange on which they are traded and are categorized as Level 1 in the hierarchy. In the event there were no sales during the day or closing prices are not available, securities are valued at the last quoted bid price or may be valued using the last available price and are generally categorized as Level 2 in the hierarchy. For foreign equity securities, when market or security specific events arise, comparisons to the valuation of American Depositary Receipts (ADRs), futures contracts, Exchange-Traded Funds (ETFs) and certain indexes as well as quoted prices for similar securities may be used and would be categorized as Level 2 in the hierarchy. Utilizing these techniques may result in transfers between Level 1 and Level 2. For equity securities, including restricted securities, where observable inputs are limited, assumptions about market activity and risk are used and these securities may be categorized as Level 3 in the hierarchy.
Investments in open-end mutual funds, including the Fidelity Central Funds, are valued at their closing net asset value (NAV) each business day and are categorized as Level 1 in the hierarchy.
Annual Report
3. Significant Accounting Policies - continued
Investment Valuation - continued
Changes in valuation techniques may result in transfers in or out of an assigned level within the disclosure hierarchy.
Foreign Currency. The Fund may use foreign currency contracts to facilitate transactions in foreign-denominated securities. Gains and losses from these transactions may arise from changes in the value of the foreign currency or if the counterparties do not perform under the contracts' terms.
Foreign-denominated assets, including investment securities, and liabilities are translated into U.S. dollars at the exchange rates at period end. Purchases and sales of investment securities, income and dividends received and expenses denominated in foreign currencies are translated into U.S. dollars at the exchange rate in effect on the transaction date.
The effects of exchange rate fluctuations on investments are included with the net realized and unrealized gain (loss) on investment securities. Other foreign currency transactions resulting in realized and unrealized gain (loss) are disclosed separately.
Investment Transactions and Income. For financial reporting purposes, the Fund's investment holdings and NAV include trades executed through the end of the last business day of the period. The NAV per share for processing shareholder transactions is calculated as of the close of business of the New York Stock Exchange (NYSE), normally 4:00 p.m. Eastern time and includes trades executed through the end of the prior business day. Gains and losses on securities sold are determined on the basis of identified cost and may include proceeds received from litigation. Dividend income is recorded on the ex-dividend date, except for certain dividends from foreign securities where the ex-dividend date may have passed, which are recorded as soon as the Fund is informed of the ex-dividend date. Non-cash dividends included in dividend income, if any, are recorded at the fair market value of the securities received. Interest income and distributions from the Fidelity Central Funds are accrued as earned. Investment income is recorded net of foreign taxes withheld where recovery of such taxes is uncertain.
Class Allocations and Expenses. Investment income, realized and unrealized capital gains and losses, common expenses of the Fund, and certain fund-level expense reductions, if any, are allocated daily on a pro-rata basis to each class based on the relative net assets of each class to the total net assets of the Fund. Each class differs with respect to transfer agent fees incurred. Certain expense reductions may also differ by class. For the reporting period, the allocated portion of income and expenses to each class as a percent of its average net assets may vary due to the timing of recording these transactions in relation to fluctuating net assets of the classes. Expenses directly attributable to a fund are charged to that fund. Expenses attributable to more than one fund are allocated among the respective funds on the basis of relative net assets or other appropriate methods. Expense estimates are accrued in the period to which they relate and adjustments are made when actual amounts are known.
Income Tax Information and Distributions to Shareholders. Each year, the Fund intends to qualify as a regulated investment company under Subchapter M of the Internal Revenue Code, including distributing substantially all of its taxable income and realized gains. As a result, no provision for U.S. Federal income taxes is required. As of December 31, 2013, the Fund did not have any unrecognized tax benefits in the financial statements; nor is the Fund aware of any tax positions for which it is reasonably possible that the total amounts of unrecognized tax benefits will significantly change in the next twelve months. The Fund files a U.S. federal tax return, in addition to state and local tax returns as required. The Fund's federal income tax returns are subject to examination by the Internal Revenue Service (IRS) for a period of three fiscal years after they are filed. State and local tax returns may be subject to examination for an additional fiscal year depending on the jurisdiction. Foreign taxes are provided for based on the Fund's understanding of the tax rules and rates that exist in the foreign markets in which it invests.
Distributions are declared and recorded on the ex-dividend date. Income dividends and capital gain distributions are declared separately for each class. Income and capital gain distributions are determined in accordance with income tax regulations, which may differ from GAAP.
Capital accounts within the financial statements are adjusted for permanent book-tax differences. These adjustments have no impact on net assets or the results of operations. Capital accounts are not adjusted for temporary book-tax differences which will reverse in a subsequent period.
Book-tax differences are primarily due to foreign currency transactions, capital loss carryforwards, partnerships and losses deferred due to wash sales.
The federal tax cost of investment securities and unrealized appreciation (depreciation) as of period end were as follows:
Gross unrealized appreciation | $ 11,265,131 |
Gross unrealized depreciation | (623,836) |
Net unrealized appreciation (depreciation) on securities and other investments | $ 10,641,295 |
| |
Tax Cost | $ 66,278,502 |
Annual Report
Notes to Financial Statements - continued
3. Significant Accounting Policies - continued
Income Tax Information and Distributions to Shareholders - continued
The tax-based components of distributable earnings as of period end were as follows:
Capital loss carryforward | $ (220,788) |
Net unrealized appreciation (depreciation) | $ 10,641,295 |
Capital loss carryforwards are only available to offset future capital gains of the Fund to the extent provided by regulations and may be limited. Under the Regulated Investment Company Modernization Act of 2010 (the Act), the Fund is permitted to carry forward capital losses incurred in taxable years beginning after December 22, 2010 for an unlimited period and such capital losses are required to be used prior to any losses that expire. The capital loss carryforward information presented below, including any applicable limitation, is estimated as of fiscal period end and is subject to adjustment.
Fiscal year of expiration | |
2017 | $ (220,788) |
The tax character of distributions paid was as follows:
| December 31, 2013 | December 31, 2012 |
Ordinary Income | $ 1,911,677 | $ 1,912,145 |
Trading (Redemption) Fees. Shares held by investors less than 60 days may be subject to a redemption fee equal to 1% of the NAV of shares redeemed. All redemption fees, which reduce the proceeds of the shareholder redemption, are retained by the Fund and accounted for as an addition to paid in capital.
4. Purchases and Sales of Investments.
Purchases and sales of securities, other than short-term securities, aggregated $123,178,455 and $126,252,374, respectively.
5. Fees and Other Transactions with Affiliates.
Management Fee. Effective August 1, 2013, SelectCo replaced Fidelity Management and Research Company (FMR), an affiliate of SelectCo, as investment adviser to the Fund. The investment adviser and its affiliates provide the Fund with investment management related services for which the Fund pays a monthly management fee. The management fee is the sum of an individual fund fee rate that is based on an annual rate of .30% of the Fund's average net assets and an annualized group fee rate that averaged .25% during the period. The group fee rate is based upon the average net assets of all the mutual funds advised by FMR and the investment adviser. The group fee rate decreases as assets under management increase and increases as assets under management decrease. For the reporting period, the total annual management fee rate was .55% of the Fund's average net assets.
Transfer Agent Fees. Fidelity Investments Institutional Operations Company, Inc. (FIIOC), an affiliate of the investment adviser, is the Fund's transfer, dividend disbursing, and shareholder servicing agent. FIIOC receives an asset-based fee with respect to each class. Each class (with the exception of Investor Class) pays a transfer agent fee, excluding out of pocket expenses, equal to an annual rate of .07% of average net assets. Investor Class pays a monthly asset-based transfer agent fee of .15% of average net assets. In addition, FIIOC receives an asset-based fee of .0035% of average net assets for typesetting, printing and mailing of shareholder reports, except proxy statements. FIIOC voluntarily agreed to reimburse or waive this fee for the period January 1, 2013 through December 31, 2013 (see Expense Reductions note). For the period, transfer agent fees for each class, including printing and out of pocket expenses, were as follows:
Initial Class | $ 21,474 |
Investor Class | 82,811 |
| $ 104,285 |
Effective February 1, 2014, the Board of Trustees approved an amendment to the transfer agent fee agreement whereby each class (with the exception of Investor Class) pays a single fee of .07% of average net assets for transfer agent services, typesetting, printing and mailing of shareholder reports, excluding mailing of proxy statements and out of pocket expenses. Investor Class pays a single fee of .15% of average net assets.
Accounting and Security Lending Fees. Fidelity Service Company, Inc. (FSC), an affiliate of the investment adviser, maintains the Fund's accounting records. The accounting fee is based on the level of average net assets for each month. Under a separate contract, FSC administers the security lending program. The security lending fee is based on the number and duration of lending transactions.
Brokerage Commissions. The Fund placed a portion of its portfolio transactions with brokerage firms which are affiliates of the investment adviser. Brokerage commissions are included in net realized gain (loss) and change in net unrealized appreciation (depreciation) in the Statement of Operations. The commissions paid to these affiliated firms were $2,642 for the period.
Annual Report
6. Committed Line of Credit.
The Fund participates with other funds managed by the investment adviser or an affiliate in a $4.25 billion credit facility (the "line of credit") to be utilized for temporary or emergency purposes to fund shareholder redemptions or for other short-term liquidity purposes. The Fund has agreed to pay commitment fees on its pro-rata portion of the line of credit, which amounted to $170 and is reflected in Miscellaneous expenses on the Statement of Operations. During the period, there were no borrowings on this line of credit.
7. Security Lending.
The Fund lends portfolio securities through a lending agent from time to time in order to earn additional income. For equity securities, a lending agent is used and may loan securities to certain qualified borrowers, which prior to August 1, 2013 included Fidelity Capital Markets (FCM), a broker-dealer affiliated with the Fund. On the settlement date of the loan, the Fund receives collateral (in the form of U.S. Treasury obligations, letters of credit and/or cash) against the loaned securities and maintains collateral in an amount not less than 100% of the market value of the loaned securities during the period of the loan. The market value of the loaned securities is determined at the close of business of the Fund and any additional required collateral is delivered to the Fund on the next business day. If the borrower defaults on its obligation to return the securities loaned because of insolvency or other reasons, the Fund may apply collateral received from the borrower against the obligation. The Fund may experience delays and costs in recovering the securities loaned. Any cash collateral received is invested in the Fidelity Securities Lending Cash Central Fund. At period end, there were no security loans outstanding. Security lending income represents the income earned on investing cash collateral, less rebates paid to borrowers and any lending agent fees associated with the loan, plus any premium payments received for lending certain types of securities. Security lending income is presented in the Statement of Operations as a component of income from Fidelity Central Funds. Total security lending income during the period amounted to $8,259. During the period, there were no securities loaned to FCM.
8. Expense Reductions.
The investment adviser or its affiliates agreed to reimburse or waive certain fees during the period as noted in the table below.
Initial Class | $ 1,090 |
Investor Class | 2,076 |
| $ 3,166 |
Commissions paid to certain brokers with whom the investment adviser, or its affiliates, places trades on behalf of the Fund include an amount in addition to trade execution, which may be rebated back to the Fund to offset certain expenses. This amount totaled $14,052 for the period.
9. Distributions to Shareholders.
Distributions to shareholders of each class were as follows:
Years ended December 31, | 2013 | 2012 |
From net investment income | | |
Initial Class | $ 655,465 | $ 720,128 |
Investor Class | 1,256,212 | 1,144,613 |
Total | $ 1,911,677 | $ 1,864,741 |
From net realized gain | | |
Initial Class | $ - | $ 18,001 |
Investor Class | - | 29,403 |
Total | $ - | $ 47,404 |
10. Share Transactions.
Transactions for each class of shares were as follows:
| Shares | Dollars |
Years ended December 31, | 2013 | 2012 | 2013 | 2012 |
Initial Class | | | | |
Shares sold | 567,555 | 1,001,979 | $ 7,410,505 | $ 11,149,887 |
Reinvestment of distributions | 50,498 | 65,088 | 655,465 | 738,129 |
Shares redeemed | (971,222) | (1,434,969) | (12,338,304) | (16,064,789) |
Net increase (decrease) | (353,169) | (367,902) | $ (4,272,334) | $ (4,176,773) |
Annual Report
Notes to Financial Statements - continued
10. Share Transactions - continued
| Shares | Dollars |
Years ended December 31, | 2013 | 2012 | 2013 | 2012 |
Investor Class | | | | |
Shares sold | 1,897,919 | 1,398,394 | $ 24,634,370 | $ 15,873,605 |
Reinvestment of distributions | 97,155 | 103,970 | 1,256,212 | 1,174,016 |
Shares redeemed | (1,882,828) | (2,098,134) | (24,082,687) | (23,087,094) |
Net increase (decrease) | 112,246 | (595,770) | $ 1,807,895 | $ (6,039,473) |
11. Other.
The Fund's organizational documents provide former and current trustees and officers with a limited indemnification against liabilities arising in connection with the performance of their duties to the Fund. In the normal course of business, the Fund may also enter into contracts that provide general indemnifications. The Fund's maximum exposure under these arrangements is unknown as this would be dependent on future claims that may be made against the Fund. The risk of material loss from such claims is considered remote.
At the end of the period, the investment adviser or its affiliates were the owners of record of 100% of the total outstanding shares of the Fund.
Annual Report
Report of Independent Registered Public Accounting Firm
To the Trustees of Variable Insurance Products Fund IV and the Shareholders of VIP Utilities Portfolio:
In our opinion, the accompanying statement of assets and liabilities, including the schedule of investments, and the related statements of operations and of changes in net assets and the financial highlights present fairly, in all material respects, the financial position of VIP Utilities Portfolio (a fund of Variable Insurance Products Fund IV) at December 31, 2013, the results of its operations for the year then ended, the changes in its net assets for each of the two years in the period then ended and the financial highlights for each of the five years in the period then ended, in conformity with accounting principles generally accepted in the United States of America. These financial statements and financial highlights (hereafter referred to as "financial statements") are the responsibility of the VIP Utilities Portfolio's management. Our responsibility is to express an opinion on these financial statements based on our audits. We conducted our audits of these financial statements in accordance with the standards of the Public Company Accounting Oversight Board (United States). Those standards require that we plan and perform the audit to obtain reasonable assurance about whether the financial statements are free of material misstatement. An audit includes examining, on a test basis, evidence supporting the amounts and disclosures in the financial statements, assessing the accounting principles used and significant estimates made by management, and evaluating the overall financial statement presentation. We believe that our audits, which included confirmation of securities at December 31, 2013 by correspondence with the custodian and brokers, provide a reasonable basis for our opinion.
PricewaterhouseCoopers LLP
Boston, Massachusetts
February 13, 2014
Annual Report
The Trustees and officers of the trust and fund, as applicable, are listed below. The Board of Trustees governs the fund and is responsible for protecting the interests of shareholders. The Trustees are experienced executives who meet periodically throughout the year to oversee the fund's activities, review contractual arrangements with companies that provide services to the fund, oversee management of the risks associated with such activities and contractual arrangements, and review the fund's performance. Ned C. Lautenbach, Ronald P. O'Hanley, and William S. Stavropoulos each oversees 247 funds. David A. Rosow, Garnett A. Smith, and Michael E. Wiley each oversees 74 funds.
The Trustees hold office without limit in time except that (a) any Trustee may resign; (b) any Trustee may be removed by written instrument, signed by at least two-thirds of the number of Trustees prior to such removal; (c) any Trustee who requests to be retired or who has become incapacitated by illness or injury may be retired by written instrument signed by a majority of the other Trustees; and (d) any Trustee may be removed at any special meeting of shareholders by a two-thirds vote of the outstanding voting securities of the trust. The officers hold office without limit in time, except that any officer may resign or may be removed by a vote of a majority of the Trustees at any regular meeting or any special meeting of the Trustees. Except as indicated, each individual has held the office shown or other offices in the same company for the past five years.
Experience, Skills, Attributes, and Qualifications of the Fund's Trustees. The Governance and Nominating Committee has adopted a statement of policy that describes the experience, qualifications, attributes, and skills that are necessary and desirable for potential Independent Trustee candidates (Statement of Policy). The Board believes that each Trustee satisfied at the time he or she was initially elected or appointed a Trustee, and continues to satisfy, the standards contemplated by the Statement of Policy. The Governance and Nominating Committee also engages professional search firms to help identify potential Independent Trustee candidates who have the experience, qualifications, attributes, and skills consistent with the Statement of Policy. From time to time, additional criteria based on the composition and skills of the current Independent Trustees, as well as experience or skills that may be appropriate in light of future changes to board composition, business conditions, and regulatory or other developments, have also been considered by the professional search firms and the Governance and Nominating Committee. In addition, the Board takes into account the Trustees' commitment and participation in Board and committee meetings, as well as their leadership of standing and ad hoc committees throughout their tenure.
In determining that a particular Trustee was and continues to be qualified to serve as a Trustee, the Board has considered a variety of criteria, none of which, in isolation, was controlling. The Board believes that, collectively, the Trustees have balanced and diverse experience, qualifications, attributes, and skills, which allow the Board to operate effectively in governing the fund and protecting the interests of shareholders. Information about the specific experience, skills, attributes, and qualifications of each Trustee, which in each case led to the Board's conclusion that the Trustee should serve (or continue to serve) as a trustee of the fund, is provided below.
Board Structure and Oversight Function. Ronald P. O'Hanley is an interested person (as defined in the 1940 Act) and currently serves as Chairman. The Trustees have determined that an interested Chairman is appropriate and benefits shareholders because an interested Chairman has a personal and professional stake in the quality and continuity of services provided to the fund. Independent Trustees exercise their informed business judgment to appoint an individual of their choosing to serve as Chairman, regardless of whether the Trustee happens to be independent or a member of management. The Independent Trustees have determined that they can act independently and effectively without having an Independent Trustee serve as Chairman and that a key structural component for assuring that they are in a position to do so is for the Independent Trustees to constitute a substantial majority for the Board. The Independent Trustees also regularly meet in executive session. Michael E. Wiley serves as Chairman of the Independent Trustees and as such (i) acts as a liaison between the Independent Trustees and management with respect to matters important to the Independent Trustees and (ii) with management prepares agendas for Board meetings.
Fidelity funds are overseen by different Boards of Trustees. The fund's Board oversees Fidelity's sector portfolios. Other Boards oversee Fidelity's equity and high income funds, and Fidelity's investment grade bond, money market, and asset allocation funds. The use of separate Boards, each with its own committee structure, allows the Trustees of each group of Fidelity funds to focus on the unique issues of the funds they oversee, including common research, investment, and operational issues. On occasion, the separate Boards establish joint committees to address issues of overlapping consequences for the Fidelity funds overseen by each Board.
The Trustees operate using a system of committees to facilitate the timely and efficient consideration of all matters of importance to the Trustees, the fund, and fund shareholders and to facilitate compliance with legal and regulatory requirements and oversight of the fund's activities and associated risks. The Board, acting through its committees, has charged SelectCo and its affiliates with (i) identifying events or circumstances the occurrence of which could have demonstrably adverse effects on the fund's business and/or reputation; (ii) implementing processes and controls to lessen the possibility that such events or circumstances occur or to mitigate the effects of such events or circumstances if they do occur; and (iii) creating and maintaining a system designed to evaluate continuously business and market conditions in order to facilitate the identification and implementation processes described in (i) and (ii) above. Because the day-to-day operations and activities of the fund are carried out by or through SelectCo, its affiliates, and other service providers, the fund's exposure to risks is mitigated but not eliminated by the processes overseen by the Trustees. While each of the Board's committees has responsibility for overseeing different aspects of the fund's activities, oversight is exercised primarily through the Operations and Audit Committees. Appropriate personnel, including but not limited to the fund's Chief Compliance Officer (CCO), SelectCo's internal auditor, the independent accountants, the fund's Treasurer and portfolio management personnel, make periodic reports to the Board's committees, as appropriate. The responsibilities of each standing committee, including their oversight responsibilities, are described further under "Standing Committees of the Fund's Trustees."
The fund's Statement of Additional Information (SAI) includes more information about the Trustees. To request a free copy, call Fidelity at 1-877-208-0098.
Annual Report
Trustees and Officers - continued
Interested Trustee*:
Correspondence intended for the Trustee who is an interested person may be sent to Fidelity Investments, 245 Summer Street, Boston, Massachusetts 02210.
Name, Year of Birth; Principal Occupations and Other Relevant Experience+ |
Ronald P. O'Hanley (1957) |
Year of Election or Appointment: 2011 Trustee Chairman of the Board of Trustees |
| Mr. O'Hanley also serves as Trustee of other Fidelity funds. He is Director of Fidelity SelectCo, LLC (2013-present), FMR Co., Inc. (2010-present), Director of Fidelity Investments Money Management, Inc. (2010-present), Director of Fidelity Research & Analysis Company (2010-present), President of Fidelity Asset Management and Corporate Services and a Member of Fidelity's Executive Committee (2010-present). Previously, Mr. O'Hanley served as President and Chief Executive Officer of BNY Mellon Asset Management (2007-2010). Mr. O'Hanley also served as Vice Chairman of Bank New York Mellon Corp. and a member of that firm's Executive Committee. Prior to the 2007 merger of The Bank of New York and Mellon Financial Corporation, he was Vice Chairman of Mellon Financial Corporation and President and Chief Executive Officer of Mellon Asset Management. He joined Mellon in February 1997. Mr. O'Hanley currently serves as Chairman of the Boston Public Library Foundation Board of Directors and sits on the Board of Directors of Beth Israel Deaconess Medical Center, the Board of Trustees of the Marine Biological Laboratory and the Advisory Board of the Maxwell School of Citizenship and Public Administration at Syracuse University. Mr. O'Hanley also chairs the Council on Asset Management for the Financial Services Roundtable and is a member of the Board of Directors of Institutional Investor's U.S. Institute. |
* Trustee has been determined to be an "Interested Trustee" by virtue of, among other things, his affiliation with the trust or various entities under common control with SelectCo.
+ The information above includes the Trustee's principal occupation during the last five years and other information relating to the experience, attributes, and skills relevant to the Trustee's qualifications to serve as a Trustee, which led to the conclusion that the Trustee should serve as a Trustee for the fund.
Independent Trustees:
Correspondence intended for each Independent Trustee (that is, the Trustees other than the Interested Trustee) may be sent to Fidelity Investments, P.O. Box 55235, Boston, Massachusetts 02205-5235.
Name, Year of Birth; Principal Occupations and Other Relevant Experience+ |
Ned C. Lautenbach (1944) |
Year of Election or Appointment: 2000 Trustee |
| Mr. Lautenbach also serves as Trustee of other Fidelity funds. Mr. Lautenbach currently serves as the Lead Director of the Eaton Corporation Board of Directors (diversified industrial, 1997-present). Mr. Lautenbach is Chairman of the Board of Directors of the Philharmonic Center for the Arts in Naples, Florida (2012-present) and a member of the Council on Foreign Relations (1994-present). Previously, Mr. Lautenbach was a Partner/Advisory Partner at Clayton, Dubilier & Rice, LLC (private equity investment, 1998-2010), as well as a Director of Sony Corporation (2006-2007). |
David A. Rosow (1942) |
Year of Election or Appointment: 2013 Trustee |
| Mr. Rosow also serves as Trustee of other Fidelity funds. Mr. Rosow is Chairman and Chief Executive Officer of International Golf Group, Inc. (golf course development, 1989-present). Previously, Mr. Rosow served as Chairman and Chief Executive Officer of Rosow & Company, Inc. (private investment company, 1989-2011), a Lead Director of Hudson United Bancorp (2001-2006) and as a Director of TD Banknorth (1996-2006). In addition, Mr. Rosow is a member (2008-present) and President (2009-present) of the Town Council of Palm Beach, Florida. Mr. Rosow served as a Member of the Advisory Board of other Fidelity funds (2012-2013). |
Garnett A. Smith (1947) |
Year of Election or Appointment: 2013 Trustee |
| Mr. Smith also serves as Trustee of other Fidelity funds. Prior to Mr. Smith's retirement, he served as Chairman and Chief Executive Officer of Inbrand Corp. (manufacturer of personal absorbent products, 1990-1997). He also served as President (1986-1990) of Inbrand Corp. Prior to his employment with Inbrand Corp., he was employed by a retail fabric chain and North Carolina National Bank. In addition, Mr. Smith is a board member of the Jackson Hole Land Trust (2009-present). Mr. Smith served as a Member of the Advisory Board of other Fidelity funds (2012-2013). |
William S. Stavropoulos (1939) |
Year of Election or Appointment: 2001 Trustee |
| Mr. Stavropoulos also serves as Trustee of other Fidelity funds. Mr. Stavropoulos serves as President and Founder of the Michigan Baseball Foundation, the Great Lakes Loons (2007-present). Mr. Stavropoulos is Chairman Emeritus of the Board of Directors of The Dow Chemical Company, where he previously served in numerous senior management positions, including President, CEO (1995-2000; 2002-2004), Chairman of the Executive Committee (2000-2006), and as a member of the Board of Directors (1990-2006). Currently, Mr. Stavropoulos is Chairman of the Board of Directors of Univar Inc. (global distributor of commodity and specialty chemicals), a Director of Teradata Corporation (data warehousing and technology solutions), and Maersk Inc. (industrial conglomerate), and a member of the Advisory Board for Metalmark Capital LLC (private equity investment, 2005-present). Mr. Stavropoulos is an operating advisor to Clayton, Dubilier & Rice, LLC (private equity investment). In addition, Mr. Stavropoulos is a member of the University of Notre Dame Advisory Council for the College of Science, a Trustee of the Rollin L. Gerstacker Foundation, and a Director of the Naples Philharmonic Center for the Arts. Previously, Mr. Stavropoulos served as a Director of Chemical Financial Corporation (bank holding company, 1993-2012) and Tyco International, Ltd. (multinational manufacturing and services, 2007-2012). |
Michael E. Wiley (1950) |
Year of Election or Appointment: 2008 Trustee Chairman of the Independent Trustees |
| Mr. Wiley also serves as Trustee of other Fidelity funds. Mr. Wiley serves as a Director of Asia Pacific Exploration Consolidated (international oil and gas exploration and production, 2008-present). Mr. Wiley serves as a Director of Tesoro Corporation (independent oil refiner and marketer, 2005-present), and a Director of Bill Barrett Corporation (exploration and production, 2005-present). In addition, Mr. Wiley also serves as a Director of Post Oak Bank (privately-held bank, 2004-present). Previously, Mr. Wiley served as a Trustee of other Fidelity funds (2008-2013), as a member of the Board of Trustees of the University of Tulsa (2000-2006; 2007-2010), as a Senior Energy Advisor of Katzenbach Partners, LLC (consulting, 2006-2007), as an Advisory Director of Riverstone Holdings (private investment), Chairman, President, and CEO of Baker Hughes, Inc. (oilfield services, 2000-2004), and as Director of Spinnaker Exploration Company (exploration and production, 2001-2005). |
+ The information above includes each Trustee's principal occupation during the last five years and other information relating to the experience, attributes, and skills relevant to each Trustee's qualifications to serve as a Trustee, which led to the conclusion that each Trustee should serve as a Trustee for the fund.
Officers:
Except for Anthony R. Rochte, correspondence intended for each officer may be sent to Fidelity Investments, 245 Summer Street, Boston, Massachusetts 02210. Correspondence intended for Mr. Rochte may be sent to SelectCo, 1225 17th Street, Denver, Colorado 80202-5541. Officers appear below in alphabetical order.
Name, Year of Birth; Principal Occupation |
Christopher S. Bartel (1971) |
Year of Election or Appointment: 2009 Vice President |
| Mr. Bartel also serves as Vice President of other funds. Mr. Bartel serves as a Director, President, and Chief Executive Officer of Fidelity Management & Research (Japan) Inc. (2012-present), a Director of Fidelity Management & Research (Hong Kong) (2012-present), and Senior Vice President of Global Equity Research (2010-present). Previously, Mr. Bartel served as Senior Vice President of Equity Research (2009-2010), Managing Director of Research (2006-2009), and an analyst and portfolio manager (2000-2006). |
Elizabeth Paige Baumann (1968) |
Year of Election or Appointment: 2012 Anti-Money Laundering (AML) Officer |
| Ms. Baumann also serves as AML Officer of other funds. She is Chief AML Officer of FMR LLC (2012-present) and is an employee of Fidelity Investments. Previously, Ms. Baumann served as Vice President and Deputy Anti-Money Laundering Officer (2007-2012). |
Marc Bryant (1966) |
Year of Election or Appointment: 2013 Secretary and Chief Legal Officer (CLO) |
| Mr. Bryant also serves as an officer of other funds. He is Senior Vice President and Deputy General Counsel of FMR LLC. Prior to joining Fidelity Investments, Mr. Bryant served as a Senior Vice President and the Head of Global Retail Legal for AllianceBernstein L.P. (2006-2010), and as the General Counsel for ProFund Advisors LLC (2001-2006). |
William C. Coffey (1969) |
Year of Election or Appointment: 2009 Assistant Secretary |
| Mr. Coffey also serves as Assistant Secretary of other funds. He is Senior Vice President and Deputy General Counsel of FMR LLC (2010-present), and is an employee of Fidelity Investments. Previously, Mr. Coffey served as Vice President and Associate General Counsel of FMR LLC (2005-2009). |
Jonathan Davis (1968) |
Year of Election or Appointment: 2010 Assistant Treasurer |
| Mr. Davis also serves as Assistant Treasurer of other funds. Mr. Davis is an employee of Fidelity Investments. Previously, Mr. Davis served as Vice President and Associate General Counsel of FMR LLC (2003-2010). |
Adrien E. Deberghes (1967) |
Year of Election or Appointment: 2013 President and Treasurer |
| Mr. Deberghes also serves as an officer of other funds. He is an employee of Fidelity Investments (2008-present). Prior to joining Fidelity Investments, Mr. Deberghes was Senior Vice President of Mutual Fund Administration at State Street Corporation (2007-2008), Senior Director of Mutual Fund Administration at Investors Bank & Trust (2005-2007), and Director of Finance for Dunkin' Brands (2000-2005). |
Stephanie J. Dorsey (1969) |
Year of Election or Appointment: 2010 Assistant Treasurer |
| Ms. Dorsey also serves as an officer of other funds. She is an employee of Fidelity Investments (2008-present) and has served in other fund officer roles. Prior to joining Fidelity Investments, Ms. Dorsey served as Treasurer (2004-2008) of the JPMorgan Mutual Funds and Vice President (2004-2008) of JPMorgan Chase Bank. |
Joseph A. Hanlon (1968) |
Year of Election or Appointment: 2012 Chief Compliance Officer |
| Mr. Hanlon also serves as Chief Compliance Officer of other funds. Mr. Hanlon serves as Compliance Officer of FMR, FMR Co., Inc., Fidelity Investments Money Management, Inc. (FIMM), Fidelity Research and Analysis Company (FRAC), and Fidelity Management & Research (Hong Kong) (2009-present), as Senior Vice President of the Fidelity Asset Management Division (2009-present), and is an employee of Fidelity Investments. Previously, Mr. Hanlon served as Compliance Officer of Fidelity Management & Research (Japan) Inc. (2009-2013), Strategic Advisers, Inc. (2009-2013), and Fidelity Management & Research (U.K.) Inc. (2009-2013). |
Brian B. Hogan (1964) |
Year of Election or Appointment: 2009 Vice President |
| Mr. Hogan also serves as Vice President of other funds. Mr. Hogan serves as President of FMR's Equity Division (2009-present). Previously, Mr. Hogan served as Senior Vice President, Equity Research of FMR (2006-2009) and as a portfolio manager. |
Chris Maher (1972) |
Year of Election or Appointment: 2013 Assistant Treasurer |
| Mr. Maher serves as Assistant Treasurer of other funds. Mr. Maher is Vice President of Valuation Oversight and is an employee of Fidelity Investments. Previously, Mr. Maher served as Vice President of Asset Management Compliance (2013), Vice President of FMR's Program Management Group (2010-2013), and Vice President of Valuation Oversight (2008-2010). |
Christine Reynolds (1958) |
Year of Election or Appointment: 2008 Chief Financial Officer |
| Ms. Reynolds also serves as Chief Financial Officer of other funds. Ms. Reynolds became President of Fidelity Pricing and Cash Management Services (FPCMS) in August 2008. Ms. Reynolds served as Chief Operating Officer of FPCMS (2007-2008). Previously, Ms. Reynolds served as President, Treasurer, and Anti-Money Laundering officer of the Fidelity funds (2004-2007). |
Kenneth B. Robins (1969) |
Year of Election or Appointment: 2013 Deputy Treasurer |
| Mr. Robins also serves as an officer of other funds. Mr. Robins serves as Executive Vice President of Fidelity Investments Money Management, Inc. (FIMM) (2013-present) and is an employee of Fidelity Investments (2004-present). Previously, Mr. Robins served in other fund officer roles. |
Anthony R. Rochte (1968) |
Year of Election or Appointment: 2013 Vice President |
| Mr. Rochte also serves as Vice President of other funds. Mr. Rochte serves as President of Fidelity SelectCo, LLC (2012-present) and is an employee of Fidelity Investments (2012-present). Prior to joining Fidelity Investments, Mr. Rochte served as Senior Managing Director and head of State Street Global Advisors' North American Intermediary Business Group (2006-2012). |
Stacie M. Smith (1974) |
Year of Election or Appointment: 2013 Assistant Treasurer |
| Ms. Smith also serves as an officer of other funds. She is an employee of Fidelity Investments (2009-present) and has served in other fund officer roles. Prior to joining Fidelity Investments, Ms. Smith served as Senior Audit Manager of Ernst & Young LLP (1996-2009). |
Renee Stagnone (1975) |
Year of Election or Appointment: 2013 Deputy Treasurer |
| Ms. Stagnone also serves as Deputy Treasurer of other funds. Ms. Stagnone is an employee of Fidelity Investments. |
Joseph F. Zambello (1957) |
Year of Election or Appointment: 2011 Deputy Treasurer |
| Mr. Zambello also serves as Deputy Treasurer of other funds. Mr. Zambello is an employee of Fidelity Investments. Previously, Mr. Zambello served as Vice President of FMR's Program Management Group (2009-2011) and Vice President of the Transfer Agent Oversight Group (2005-2009). |
Annual Report
Initial Class and Investor Class designate 100% of the dividends distributed in December 2013, as qualifying for the dividends-received deduction for corporate shareholders.
Annual Report
A special meeting of Utilities Portfolio's shareholders was held on May 14, 2013. The results of votes taken among shareholders on the proposals before them are reported below. Each vote reported represents one dollar of net asset value held on the record date for the meeting.
PROPOSAL 1 |
To elect a Board of Trustees.A |
| # of
Votes | % of
Votes |
Ned C. Lautenbach |
Affirmative | 1,555,133,782.46 | 93.955 |
Withheld | 100,063,694.32 | 6.045 |
TOTAL | 1,655,197,476.78 | 100.000 |
Ronald P. O'Hanley |
Affirmative | 1,557,988,095.28 | 94.128 |
Withheld | 97,209,381.50 | 5.872 |
TOTAL | 1,655,197,476.78 | 100.000 |
David A. Rosow |
Affirmative | 1,552,645,347.31 | 93.805 |
Withheld | 102,552,129.47 | 6.195 |
TOTAL | 1,655,197,476.78 | 100.000 |
Garnett A. Smith |
Affirmative | 1,554,582,880.53 | 93.922 |
Withheld | 100,614,596.25 | 6.078 |
TOTAL | 1,655,197,476.78 | 100.000 |
William S. Stavropoulos |
Affirmative | 1,548,352,452.21 | 93.545 |
Withheld | 106,845,024.57 | 6.455 |
TOTAL | 1,655,197,476.78 | 100.000 |
Michael E. Wiley |
Affirmative | 1,556,790,374.70 | 94.055 |
Withheld | 98,407,102.08 | 5.945 |
TOTAL | 1,655,197,476.78 | 100.000 |
PROPOSAL 2 |
To approve a management contract between the fund and Fidelity SelectCo, LLC. |
| # of
Votes | % of
Votes |
Affirmative | 69,444,774.01 | 91.955 |
Against | 2,997,121.25 | 3.969 |
Abstain | 3,078,689.47 | 4.076 |
TOTAL | 75,520,584.73 | 100.000 |
A Denotes trust-wide proposal and voting results. |
Annual Report
Investment Adviser
Fidelity SelectCo, LLC
Denver, CO
Investment Sub-Advisers
FMR Co., Inc.
Fidelity Management & Research (U.K.) Inc.
Fidelity Management & Research (Hong Kong) Limited
Fidelity Management & Research (Japan) Inc.
General Distributor
Fidelity Distributors Corporation
Smithfield, RI
Transfer and Service Agents
Fidelity Investments Institutional Operations Company, Inc.
Boston, MA
Fidelity Service Company, Inc.
Boston, MA
Custodian
JPMorgan Chase Bank
New York, NY
VTELIC-ANN-0214
1.817391.108
Item 2. Code of Ethics
As of the end of the period, December 31, 2013, Variable Insurance Products Fund IV (the trust) has adopted a code of ethics, as defined in Item 2 of Form N-CSR, that applies to its President and Treasurer and its Chief Financial Officer. A copy of the code of ethics is filed as an exhibit to this Form N-CSR.
Item 3. Audit Committee Financial Expert
The Board of Trustees of the trust has determined that David A. Rosow is an audit committee financial expert, as defined in Item 3 of Form N-CSR. Mr. Rosow is independent for purposes of Item 3 of Form N-CSR.
Item 4. Principal Accountant Fees and Services
Fees and Services
The following table presents fees billed by PricewaterhouseCoopers LLP ("PwC") in each of the last two fiscal years for services rendered to Consumer Discretionary Portfolio, Consumer Staples Portfolio, Energy Portfolio, Financial Services Portfolio, Health Care Portfolio, Industrials Portfolio, Materials Portfolio, Real Estate Portfolio, Technology Portfolio, Telecommunications Portfolio, and Utilities Portfolio (the "Funds"):
Services Billed by PwC
December 31, 2013 FeesA
| Audit Fees | Audit-Related Fees | Tax Fees | All Other Fees |
Consumer Discretionary Portfolio | $37,000 | $- | $2,500 | $1,500 |
Consumer Staples Portfolio | $37,000 | $- | $2,500 | $1,500 |
Energy Portfolio | $37,000 | $- | $2,500 | $1,600 |
Financial Services Portfolio | $38,000 | $- | $2,500 | $1,500 |
Health Care Portfolio | $40,000 | $- | $2,500 | $1,600 |
Industrials Portfolio | $37,000 | $- | $2,500 | $1,500 |
Materials Portfolio | $37,000 | $- | $2,500 | $1,500 |
Real Estate Portfolio | $44,000 | $- | $3,500 | $1,600 |
Technology Portfolio | $41,000 | $- | $2,500 | $1,500 |
Telecommunications Portfolio | $37,000 | $- | $2,500 | $1,500 |
Utilities Portfolio | $36,000 | $- | $2,500 | $1,500 |
December 31, 2012 FeesA
| Audit Fees | Audit-Related Fees | Tax Fees | All Other Fees |
Consumer Discretionary Portfolio | $36,000 | $- | $2,500 | $1,500 |
Consumer Staples Portfolio | $36,000 | $- | $2,500 | $1,500 |
Energy Portfolio | $36,000 | $- | $2,500 | $1,600 |
Financial Services Portfolio | $37,000 | $- | $2,500 | $1,500 |
Health Care Portfolio | $39,000 | $- | $2,500 | $1,600 |
Industrials Portfolio | $36,000 | $- | $2,500 | $1,500 |
Materials Portfolio | $36,000 | $- | $2,700 | $1,500 |
Real Estate Portfolio | $44,000 | $- | $3,500 | $1,600 |
Technology Portfolio | $36,000 | $- | $2,500 | $1,600 |
Telecommunications Portfolio | $36,000 | $- | $2,500 | $1,500 |
Utilities Portfolio | $35,000 | $- | $2,500 | $1,500 |
A Amounts may reflect rounding.
The following table presents fees billed by PwC that were required to be approved by the Audit Committee for services that relate directly to the operations and financial reporting of the Funds and that are rendered on behalf of Fidelity Management & Research Company ("FMR") and entities controlling, controlled by, or under common control with FMR (not including any sub-adviser whose role is primarily portfolio management and is subcontracted with or overseen by another investment adviser) that provide ongoing services to the Funds ("Fund Service Providers"):
Services Billed by PwC
| December 31, 2013A | December 31, 2012A |
Audit-Related Fees | $4,920,000 | $4,805,000 |
Tax Fees | $- | $- |
All Other Fees | $50,000 | $- |
A Amounts may reflect rounding.
"Audit-Related Fees" represent fees billed for assurance and related services that are reasonably related to the performance of the fund audit or the review of the fund's financial statements and that are not reported under Audit Fees.
"Tax Fees" represent fees billed for tax compliance, tax advice or tax planning that relate directly to the operations and financial reporting of the fund.
"All Other Fees" represent fees billed for services provided to the fund or Fund Service Provider, a significant portion of which are assurance related, that relate directly to the operations and financial reporting of the fund, excluding those services that are reported under Audit Fees, Audit-Related Fees or Tax Fees.
Assurance services must be performed by an independent public accountant.
* * *
The aggregate non-audit fees billed by PwC for services rendered to the Funds, FMR (not including any sub-adviser whose role is primarily portfolio management and is subcontracted with or overseen by another investment adviser), and any Fund Service Provider for each of the last two fiscal years of the Funds are as follows:
Billed By | December 31, 2013 A | December 31, 2012 A |
PwC | $5,565,000 | $5,655,000 |
A Amounts may reflect rounding.
The trust's Audit Committee has considered non-audit services that were not pre-approved that were provided by PwC to Fund Service Providers to be compatible with maintaining the independence of PwC in its audit of the Funds, taking into account representations from PwC, in accordance with Public Company Accounting Oversight Board rules, regarding its independence from the Funds and their related entities and FMR's review of the appropriateness and permissibility under applicable law of such non-audit services prior to their provision to the Fund Service Providers.
Audit Committee Pre-Approval Policies and Procedures
The trust's Audit Committee must pre-approve all audit and non-audit services provided by a fund's independent registered public accounting firm relating to the operations or financial reporting of the fund. Prior to the commencement of any audit or non-audit services to a fund, the Audit Committee reviews the services to determine whether they are appropriate and permissible under applicable law.
The Audit Committee has adopted policies and procedures to, among other purposes, provide a framework for the Committee's consideration of non-audit services by the audit firms that audit the Fidelity funds. The policies and procedures require that any non-audit service provided by a fund audit firm to a Fidelity fund and any non-audit service provided by a fund auditor to a Fund Service Provider that relates directly to the operations and financial reporting of a Fidelity fund ("Covered Service") are subject to approval by the Audit Committee before such service is provided.
All Covered Services must be approved in advance of provision of the service either: (i) by formal resolution of the Audit Committee, or (ii) by oral or written approval of the service by the Chair of the Audit Committee (or if the Chair is unavailable, such other member of the Audit Committee as may be designated by the Chair to act in the Chair's absence). The approval contemplated by (ii) above is permitted where the Treasurer determines that action on such an engagement is necessary before the next meeting of the Audit Committee.
Non-audit services provided by a fund audit firm to a Fund Service Provider that do not relate directly to the operations and financial reporting of a Fidelity fund are reported to the Audit Committee on a periodic basis.
Non-Audit Services Approved Pursuant to Rule 2-01(c)(7)(i)(C) and (ii) of Regulation S-X ("De Minimis Exception")
There were no non-audit services approved or required to be approved by the Audit Committee pursuant to the De Minimis Exception during the Funds' last two fiscal years relating to services provided to (i) the Funds or (ii) any Fund Service Provider that relate directly to the operations and financial reporting of the Funds.
Item 5. Audit Committee of Listed Registrants
Not applicable.
Item 6. Investments
(a) Not applicable.
(b) Not applicable
Item 7. Disclosure of Proxy Voting Policies and Procedures for Closed-End Management Investment Companies
Not applicable.
Item 8. Portfolio Managers of Closed-End Management Investment Companies
Not applicable.
Item 9. Purchase of Equity Securities by Closed-End Management Investment Company and Affiliated Purchasers
Not applicable.
Item 10. Submission of Matters to a Vote of Security Holders
There were no material changes to the procedures by which shareholders may recommend nominees to the trust's Board of Trustees.
Item 11. Controls and Procedures
(a)(i) The President and Treasurer and the Chief Financial Officer have concluded that the trust's disclosure controls and procedures (as defined in Rule 30a-3(c) under the Investment Company Act) provide reasonable assurances that material information relating to the trust is made known to them by the appropriate persons, based on their evaluation of these controls and procedures as of a date within 90 days of the filing date of this report.
(a)(ii) There was no change in the trust's internal control over financial reporting (as defined in Rule 30a-3(d) under the Investment Company Act) that occurred during the second fiscal quarter of the period covered by this report that has materially affected, or is reasonably likely to materially affect, the trust's internal control over financial reporting.
Item 12. Exhibits
(a) | (1) | Code of Ethics pursuant to Item 2 of Form N-CSR is filed and attached hereto as EX-99.CODE ETH. |
(a) | (2) | Certification pursuant to Rule 30a-2(a) under the Investment Company Act of 1940 (17 CFR 270.30a-2(a)) is filed and attached hereto as Exhibit 99.CERT. |
(a) | (3) | Not applicable. |
(b) | | Certification pursuant to Rule 30a-2(b) under the Investment Company Act of 1940 (17 CFR 270.30a-2(b)) is furnished and attached hereto as Exhibit 99.906CERT. |
SIGNATURES
Pursuant to the requirements of the Securities Exchange Act of 1934 and the Investment Company Act of 1940, the registrant has duly caused this report to be signed on its behalf by the undersigned, thereunto duly authorized.
Variable Insurance Products Fund IV
By: | /s/ Adrien E. Deberghes |
| Adrien E. Deberghes |
| President and Treasurer |
| |
Date: | February 24, 2014 |
Pursuant to the requirements of the Securities Exchange Act of 1934 and the Investment Company Act of 1940, this report has been signed below by the following persons on behalf of the registrant and in the capacities and on the dates indicated.
By: | /s/Adrien E. Deberghes |
| Adrien E. Deberghes |
| President and Treasurer |
| |
Date: | February 24, 2014 |
By: | /s/Christine Reynolds |
| Christine Reynolds |
| Chief Financial Officer |
| |
Date: | February 24, 2014 |